COMMUNITY HEALTHCARE TRUST INC
10-Ks and 10-Qs
|
|
|
|
|
|
|
|
|
|
|
|
|
|
|
|
|
|
|
|
|
|
|
|
|
|
|
|
|
|
|
|
|
|
|
UNITED STATES
SECURITIES AND EXCHANGE COMMISSION
Washington, D.C. 20549
FORM 10-K
|
(Mark One)
|
||
|
x
|
ANNUAL REPORT PURSUANT TO SECTION 13 OR 15(d) OF THE SECURITIES EXCHANGE ACT OF 1934 FOR THE FISCAL YEAR ENDED DECEMBER 31, 2016
|
|
|
OR
|
||
|
¨
|
TRANSITION REPORT PURSUANT TO SECTION 13 OR 15(d) OF THE SECURITIES EXCHANGE ACT OF 1934 FOR THE TRANSITION PERIOD FROM TO
|
|
Commission file number: 001-37401
Community Healthcare Trust Incorporated
(Exact Name of Registrant as Specified in Its Charter)
|
Maryland
(State or Other Jurisdiction of
Incorporation or Organization)
|
46-5212033
(I.R.S. Employer
Identification No.)
|
|
3326 Aspen Grove Drive
Suite 150
Franklin, Tennessee 37067
(Address of Principal Executive Offices) (Zip Code)
(615) 771-3052
(Registrant’s Telephone Number, Including Area Code)
Securities Registered Pursuant to Section 12(b) of the Act:
|
Title of Each Class
|
|
Name of Each Exchange on Which Registered
|
|
Common stock, $0.01 par value per share
|
|
New York Stock Exchange
|
Securities Registered Pursuant to Section 12(g) of the Act:
None
(Title of Class)
__________________________________________________
Indicate by check mark if the registrant is a well-known seasoned issuer, as defined in Rule 405 of the Securities Act. Yes
¨
No
x
Indicate by check mark if the registrant is not required to file reports pursuant to Section 13 or Section 15(d) of the Act. Yes
¨
No
x
Indicate by check mark whether the registrant (1) has filed all reports required to be filed by Section 13 or 15(d) of the Securities Exchange Act of 1934 during the preceding 12 months (or for such shorter period that the registrant was required to file such reports), and (2) has been subject to such filing requirements for the past 90 days. Yes
x
No
¨
Indicate by check mark whether the registrant has submitted electronically and posted on its corporate Web site, if any, every Interactive Data File required to be submitted and posted pursuant to Rule 405 of Regulation S-T (§232.405 of this chapter) during the preceding 12 months (or for such shorter period that the registrant was required to submit and post such files). Yes
x
No
¨
1
Indicate by check mark if disclosure of delinquent filers pursuant to Item 405 of Regulation S-K (§229.405 of this chapter) is not contained herein, and will not be contained, to the best of Registrant’s knowledge, in definitive proxy or information statements incorporated by reference in Part III of this Form 10-K or any amendment to this Form 10-K.
¨
Indicate by check mark whether the registrant is a large accelerated filer, an accelerated filer, a non-accelerated filer, or a smaller reporting company. See the definitions of “large accelerated filer,” “accelerated filer” and “smaller reporting company” in Rule 12b-2 of the Exchange Act.
|
Large accelerated filer
¨
|
Accelerated filer
x
|
Non-accelerated filer
¨
(Do not check if a
smaller reporting company)
|
Smaller reporting company
¨
|
Indicate by check mark whether the registrant is a shell company (as defined in Rule 12b-2 of the Exchange Act).
Yes
¨
No
x
The aggregate market value of the shares of common stock (based upon the closing price of these shares on the New York Stock Exchange, Inc. on June 30, 2016) of the Registrant held by non-affiliates (for purposes of this calculation, all of the Registrant's directors and executive officers are deemed affiliates of the Registrant) on
June 30, 2016
was approximately
$263.3
million.
The Registrant had
13,105,253
shares of Common Stock, $0.01 par value per share, outstanding as of
February 17, 2017
.
________________________________
DOCUMENTS INCORPORATED BY REFERENCE
Portions of the Registrant’s Definitive Proxy Statement relating to the Annual Meeting of Stockholders are incorporated by reference into Part III of this Report. The Registrant expects to file its Definitive Proxy Statement with the Securities and Exchange Commission within 120 days after
December 31, 2016
.
|
|
2
COMMUNITY HEALTHCARE TRUST INCORPORATED
FORM 10-K
December 31, 2016
TABLE OF CONTENTS
|
Page
|
||
|
Item 1.
|
||
|
Item 1A.
|
||
|
Item 1B.
|
||
|
Item 2.
|
||
|
Item 3.
|
||
|
Item 4.
|
||
|
|
||
|
Item 5.
|
||
|
Item 6.
|
||
|
Item 7.
|
||
|
Item 7A.
|
||
|
Item 8.
|
||
|
Item 9.
|
||
|
Item 9A.
|
||
|
Item 9B.
|
||
|
|
|
|
|
|
||
|
Item 10.
|
||
|
Item 11.
|
||
|
Item 12.
|
||
|
Item 13.
|
||
|
Item 14.
|
||
|
Item 15.
|
||
|
|
|
|
|
|
||
3
CAUTIONARY STATEMENT REGARDING FORWARD-LOOKING STATEMENTS
We make statements in this Annual Report on Form 10-K that are forward-looking statements within the meaning of the Private Securities Litigation Reform Act of 1995 (set forth in Section 27A of the Securities Act of 1933, as amended (the “Securities Act”), and Section 21E of the Securities Exchange Act of 1934, as amended (the “Exchange Act”)). All statements other than statements of historical facts may be forward-looking statements. In particular, statements pertaining to our capital resources, property performance and results of operations contain forward-looking statements. Likewise, all of our statements regarding anticipated growth in our funds from operations and anticipated market conditions, demographics and results of operations are forward-looking statements. When we use the words “may,” “should,” “could,” “would,” “predicts,” “potential,” “continue,” “expects,” “anticipates,” “future,” “intends,” “plans,” “believes,” “estimates” or similar expressions or their negatives, as well as statements in future tense, we intend to identify forward-looking statements. You can also identify forward-looking statements by discussions of strategy, plans or intentions.
Forward-looking statements involve numerous risks and uncertainties and you should not rely on them as predictions of future events. Forward-looking statements depend on assumptions, data or methods which may be incorrect or imprecise and we may not be able to realize them. We do not guarantee that the transactions and events described will happen as described (or that they will happen at all). The following factors, among others, could cause actual results and future events to differ materially from those set forth or contemplated in the forward-looking statements:
|
•
|
our limited operating history;
|
|
•
|
defaults on or non-renewal of leases by tenants;
|
|
•
|
adverse economic or real estate developments, either nationally or in the markets in which our properties are located;
|
|
•
|
decreased rental rates or increased vacancy rates;
|
|
•
|
difficulties in identifying healthcare properties to acquire and completing acquisitions;
|
|
•
|
our ability to make distributions on our shares of stock;
|
|
•
|
our dependence upon key personnel whose continued service is not guaranteed;
|
|
•
|
our ability to identify, hire and retain highly qualified personnel in the future;
|
|
•
|
the degree and nature of our competition;
|
|
•
|
general economic conditions;
|
|
•
|
the availability, terms and deployment of debt and equity capital;
|
|
•
|
general volatility of the market price of our common stock;
|
|
•
|
changes in our business or strategy;
|
|
•
|
changes in governmental regulations, tax rates and similar matters;
|
|
•
|
new laws or regulations or changes in existing laws and regulations that may adversely affect the healthcare industry;
|
|
•
|
trends or developments in the healthcare industry that may adversely affect our tenants;
|
4
|
•
|
competition for acquisition opportunities;
|
|
•
|
our failure to successfully develop, integrate and operate acquired properties and operations;
|
|
•
|
our ability to operate as a public company;
|
|
•
|
changes in accounting principles generally accepted in the United States of America (“GAAP”);
|
|
•
|
our failure to generate sufficient cash flows to service our outstanding indebtedness;
|
|
•
|
fluctuations in interest rates and increased operating costs;
|
|
•
|
our increased vulnerability economically due to the concentration of our investments in healthcare properties;
|
|
•
|
a substantial portion of our revenue is derived from our largest tenants and thus, the bankruptcy, insolvency or weakened financial position of any one of them could seriously harm our operating results and financial condition;
|
|
•
|
geographic concentrations in Florida, Illinois, Kansas and Texas causes us to be particularly exposed to downturns in these local economies or other changes in local real estate market conditions;
|
|
•
|
lack of or insufficient amounts of insurance;
|
|
•
|
other factors affecting the real estate industry generally;
|
|
•
|
our failure to maintain our qualification as a real estate investment trust (“REIT”) for U.S. federal income tax purposes;
|
|
•
|
limitations imposed on our business and our ability to satisfy complex rules in order for us to maintain our status as a REIT for U.S. federal income tax purposes; and
|
|
•
|
changes in governmental regulations or interpretations thereof, such as real estate and zoning laws and increases in real property tax rates and taxation of REITs.
|
While forward-looking statements reflect our good faith beliefs, they are not guarantees of future performance. You should not place undue reliance on any forward-looking statements, which speak only as of the date of this report. We disclaim any obligation to publicly update or revise any forward-looking statement to reflect changes in underlying assumptions or factors, of new information, data or methods, future events or other changes after the date of this prospectus, except as required by applicable law. For a further discussion of these and other factors that could impact our future results, performance or transactions, see “Part I, Item 1A. Risk Factors."
Unless the context otherwise requires or indicates, references above or in this report to "we," "us," "our," "the Company," "our Company," and "Community Healthcare Trust" refer to Community Healthcare Trust Incorporated, a Maryland corporation organized to qualify as a REIT for U.S. federal income tax purposes, together with its consolidated subsidiaries, including Community Healthcare OP, LP, a Delaware limited partnership, or our operating partnership, of which we are the sole general partner and own 100% of its interests.
5
We are a fully-integrated healthcare real estate company organized as a corporation in the State of Maryland on March 28, 2014. We own and acquire, or finance, real estate properties that are leased to hospitals, doctors, healthcare systems or other healthcare service providers in Non-Urban markets, which we define as, collectively, suburban areas, exurban areas (areas adjoining metropolitan statistical areas) and micropolitan areas (areas with populations of 10,000 to 50,000 that do not directly border larger urban areas). We conduct our business through a traditional umbrella partnership real estate investment trust, or UPREIT structure in which our properties are owned by our operating partnership (the "OP"), directly or through subsidiaries. We are the sole general partner of our OP, owning
100%
of the OP units.
On May 27, 2015, we completed our initial public offering ("IPO") of 7,187,500 shares of common stock, including 937,500 shares of common stock issued in connection with the exercise in full of the underwriters' option to purchase additional shares, and received net proceeds of approximately $125.2 million from the offering. Concurrently, we issued an aggregate of 123,683 shares of common stock for an aggregate purchase price of approximately $2.3 million in private placements to certain directors and officers of the Company. In April 2016, we completed a follow-on offering of 5,175,000 shares of common stock, including 675,000 shares of common stock issued in connection with the exercise in full of the underwriters' option to purchase additional shares, and received net proceeds of approximately $86.1 million from the follow-on offering.
As of December 31, 2016, we had investments of approximately $
263.5 million
in
57
real estate properties and
one
mortgage note, located in
22
states, totaling over
1.33
million square feet in the aggregate. The real estate properties were approximately
93.1%
leased at December 31, 2016 with a weighted average remaining lease term of approximately
7.2
years.
We operate so as to maintain our status as a real estate investment trust, or REIT, for federal income tax purposes. As a REIT, we are not subject to corporate federal income tax with respect to taxable income distributed to our stockholders. We have also elected one subsidiary to be treated as a taxable REIT subsidiary ("TRS"), which is subject to federal and state income taxes.
Our investments in healthcare real estate, including mortgage and other loans, are considered a single reportable segment as further discussed in Note 1 of Item 8 in this Annual Report on Form 10-K setting forth the required financial information.
Competitive Strengths
We believe our management team's significant healthcare, real estate and public REIT management experience distinguishes us from other REITs and real estate operators, both public and private. Specifically, our Company's competitive strengths include, among others:
|
•
|
Strong, Diversified Portfolio.
Our focus is on investing in properties where we can develop strategic alliances with financially sound healthcare providers that offer need-based healthcare services in our target markets. Our tenant base includes many nationally recognized healthcare providers (or their affiliates), such as HCA, Fresenius and AmSurg. Our property portfolio has significant diversification with respect to healthcare provider, industry segment, and facility type.
|
|
•
|
Attractive and Disciplined Investment Focus.
We focus on Non-Urban healthcare facilities in off-market or lightly marketed transactions at purchase prices generally between $2 million and $25 million. We believe there is significantly less competition from existing REITs and institutional buyers for these Non-Urban assets than for comparable urban assets, thereby increasing the potential for more attractive risk-adjusted
|
6
returns. In addition, we believe that healthcare-related real estate rents and valuations are less susceptible to changes in the general economy than many other types of commercial real estate due to favorable demographic trends and the need-based rise in healthcare expenditures, even during economic downturns.
|
•
|
Extensive Relationships with Healthcare Providers, Intermediaries and Property Owners.
We believe that our management team has a strong reputation among, and a deep understanding of the real estate needs of, healthcare providers in our target markets. For example, AmSurg, a nationally recognized leader in the development, management and operation of outpatient surgery centers, has designated us as one of its two strategic partners to acquire real estate owned by physicians that are partners in surgery centers AmSurg operates. We believe that this strategic relationship is an example of our ability to meet the needs of healthcare providers by structuring transactions that are mutually advantageous to sellers, our tenants and us. We believe this ability has, and will continue to, lead to strategic acquisition opportunities, which will, in turn, produce attractive risk-adjusted returns. None of our properties to date were acquired pursuant to "calls for offers" or other auction style bidding situations. We believe our relationships provide us with additional off-market or lightly marketed acquisition opportunities, thus providing us the opportunity to continue to purchase assets outside a competitive bidding process.
|
|
•
|
Experienced Management Team.
Each of the members of our management team has between 24 and 35 years of healthcare, real estate and/or public REIT management experience. Led by Timothy G. Wallace, our Chairman, Chief Executive Officer and President, W. Page Barnes, our Executive Vice President and Chief Financial Officer, and Leigh Ann Stach, our Vice President-Financial Reporting and Chief Accounting Officer, our management team has significant experience in acquiring, owning, operating and managing healthcare facilities and providing full service real estate solutions for the healthcare industry. Prior to founding our company, Mr. Wallace was a co-founder and Executive Vice President of Healthcare Realty Trust (NYSE: HR). Between the initial public offering of HR in 1993 and his departure from HR in 2002, Mr. Wallace was integral in helping to grow HR to over $2 billion in assets. Mr. Barnes has held executive positions with acute care and behavioral hospital companies and directed healthcare lending for AmSouth Bank. Ms. Stach has experience in public healthcare REIT accounting and financial reporting.
|
|
•
|
Growth Oriented Capital Structure.
At December 31, 2016, we have
$51.0 million
outstanding on our syndicated senior revolving credit facility, or our credit facility, with a
20.8%
debt-to-book capitalization ratio. In the future, in addition to equity and debt issuances, we may also use OP units of our operating partnership as currency to acquire additional properties from owners seeking to defer their potential taxable gain and diversify their holdings. We believe that the borrowing capacity under our credit facility, combined with our ability to use OP units as acquisition currency, provides us with significant financial flexibility to make opportunistic investments and fund future growth.
|
|
•
|
Significant Alignment of Interests.
We have structured the compensation of our management team to closely align their interests with the interests of our stockholders. During the initial terms of their respective employment agreements, original management elected to take 100% of their total compensation in the form of restricted stock that is subject to an eight-year cliff-vesting period, and elected to take 95% of total compensation in 2016 and 2017 in the form of restricted stock. We believe that paying our management team with restricted stock that is subject to long-term cliff-vesting periods effectively aligns the interests of our management team with those of our stockholders, creating significant incentives to maximize returns for our stockholders. In addition, concurrently with the completion of our IPO in May 2015, Mr. Wallace purchased $2,000,000 in shares of our common stock and certain of our officers and directors purchased an aggregate of $350,000 in shares of our common stock in concurrent private placements, in each case at a price per share equal to the price of the shares sold in the IPO, which we believe further aligns management's interests with our stockholders. Finally, we adopted and each have met, at December 31, 2016, stock ownership guidelines that requires our officers and directors to continuously own an amount of our common stock based on a multiple of such officer's annual base salary or such director's annual retainer, as applicable.
|
7
Business Objective
Our principal business objective is to provide attractive risk-adjusted returns to our stockholders through a combination of (i) sustainable and increasing rental income and cash flow that generates reliable, increasing dividends and (ii) potential long-term appreciation in the value of our properties and common stock. Our primary strategies to achieve our business objective are to invest in, own and proactively manage a diversified portfolio of healthcare properties, which we believe will drive reliable, increasing rental revenue and cash flow.
Growth Strategy
We intend to continue to grow our portfolio of healthcare properties primarily through acquisitions of Non-Urban healthcare facilities that provide stable revenue growth and predictable long-term cash flows. We generally focus on individual acquisition opportunities between $2 million and $25 million in off-market or lightly marketed transactions and do not intend to participate in competitive bidding or auctions of properties. We believe that there are abundant opportunities to acquire attractive healthcare properties in our target markets either from third-party owners of existing healthcare facilities or directly with healthcare providers through sale-leaseback transactions. We believe there is significantly less competition for these Non-Urban assets from existing REITs and institutional buyers than for comparable assets in urban areas, thereby increasing the potential for attractive risk-adjusted returns. Furthermore, we may acquire healthcare properties on a non-cash basis in a tax efficient manner through the issuance of OP units as consideration for the transaction.
We intend for our investment portfolio to be diversified among healthcare facility type and segments such as ambulatory surgery centers, behavioral facilities, dialysis clinics, medical office buildings, oncology centers, physician clinics, acute care hospitals, assisted living facilities, post-acute care hospitals, skilled nursing facilities, and specialty hospitals, as well as being diverse both geographically and with respect to our tenant base. We seek to invest in properties where we can develop strategic alliances with financially sound healthcare providers that offer need-based healthcare services in our target markets.
In connection with our review and consideration of healthcare real estate acquisition opportunities, we generally take into account a variety of considerations, including but not limited to:
|
•
|
whether the property will be leased to a financially-sound healthcare tenant;
|
|
•
|
the historical performance of the market and its future prospects;
|
|
•
|
property location, with an emphasis on proximity to a population base;
|
|
•
|
demand for healthcare related services and facilities;
|
|
•
|
current and future supply of competing properties;
|
|
•
|
occupancy and rental rates in the market;
|
|
•
|
population density and growth potential;
|
|
•
|
anticipated capital expenditures;
|
|
•
|
anticipated future acquisition opportunities; and
|
|
•
|
existing and potential competition from other healthcare real estate owners and tenants.
|
We currently have no intention to invest in companies that provide healthcare services structured to comply with the REIT Investment Diversification and Empowerment Act of 2007, or RIDEA.
8
Portfolio Summary
See Note 2 to the Consolidated Financial Statements in Item. 8 "Financial Statements and Supplementary Data" for a table that summarizes our portfolio as of December 31, 2016.
Customer Concentrations
Our real estate portfolio is leased to a diverse tenant base. For the year ended December 31, 2016, none of our tenants individually accounted for 10% or more of our consolidated revenues. We have no control over the success or failure of our tenants' businesses and, at any time, any of our tenants may experience a downturn in its business that may weaken its financial condition.
Geographic Concentrations
The Company's portfolio is currently located in
22
states with approximately
55.2%
of our consolidated revenues for the year ended December 31, 2016 derived from properties located in Florida (
15.5%
), Illinois (
15.3%
), Kansas (
13.5%
) and Texas (
10.9%
). Such geographic concentrations could expose the Company to certain downturns in the economics of those states or other changes in the such states' respective real estate market conditions. Any material change in the current payment programs or regulatory, economic, environmental or competitive conditions in any of these areas could have an effect on our overall business results. In the event of negative economic or other changes in any of these markets, our business, financial condition and results of operations, our ability to make distributions to our shareholders and the trading price of our common shares may be adversely affected. See each of the discussions under Item 1A, "Risk Factors," under the captions "Adverse economic or other conditions in the geographic markets in which we conduct business could negatively affect our occupancy levels and rental rates and have a material adverse effect on our operating results," and "A large percentage of our properties are located in Florida, Illinois, Kansas and Texas, and changes in these markets may materially adversely affect us."
Recent Developments
From January 1, 2017 through
February 23, 2017
, the Company acquired
two
real estate properties totaling approximately
48,800
square feet for a purchase price of approximately
$7.9 million
, including cash consideration of approximately
$7.8 million
. Upon acquisition, the properties were approximately
94%
leased with lease expirations through
2022
. These acquisitions were funded with proceeds from the Credit Facility.
Tax Status
We qualified as a REIT for U.S. federal income tax purposes for the years ended December 31, 2015 and 2016, and we expect that we will remain qualified as a REIT for U.S. federal income tax purposes for the year ending December 31, 2017. Our qualification as a REIT depends upon our ability to meet, on a continuing basis, through actual investment and operating results, various complex requirements under the Internal Revenue Code of 1986, as amended, or the Code, relating to, among other things, the sources of our gross income, the composition and values of our assets, our distribution levels and the diversity of ownership of our capital stock. We believe that we are organized in conformity with the requirements for qualification as a REIT under the Code and that our manner of operations will enable us to continue to meet the requirements for qualification and taxation as a REIT for U.S. federal income tax purposes for the year ending December 31, 2017.
As a REIT, we generally will not be subject to U.S. federal income tax on our taxable income that we distribute currently to our stockholders. Under the Code, REITs are subject to numerous organizational and operational requirements, including a requirement that they distribute on an annual basis at least 90% of their REIT taxable income, determined without regard to the deduction for dividends paid and excluding any net capital gains. If we fail to qualify for taxation as a REIT in any taxable year and do not qualify for certain statutory relief provisions, our income for that year will be subject to tax at regular corporate rates, and we would be disqualified from taxation as a REIT for the four taxable years following the year during which we ceased to qualify as a REIT. Even if we qualify as a REIT for U.S. federal income tax purposes, we may still be subject to state and local taxes on our income and
9
assets and to U.S. federal income and excise taxes on our undistributed income. Additionally, any income earned by Community Healthcare Trust Services, Inc., our taxable REIT subsidiary, and any other “taxable REIT subsidiaries”, or TRS, that we form or acquire in the future will be fully subject to U.S. federal, state and local corporate income tax.
Government Regulation
Our healthcare tenants and their operators are subject to extensive federal, state and local government legislation and regulation, including the Patient Protection and Affordable Care Act and the Health Care and Education Reconciliation Act of 2010 (collectively, the "Affordable Care Act") and laws intended to combat fraud and waste such as the Anti-Kickback Statute, Stark Law, False Claims Act and Health Insurance Portability and Accountability Act of 1996. Many states have analogous laws which may be broader than their federal counterparts. Compliance with these regulatory requirements can increase operating costs and, thereby, adversely affect the financial viability of our tenants’ businesses. Our tenants' failure to comply with these laws and regulations could adversely affect their ability to successfully operate our properties, which could negatively impact their ability to satisfy their contractual obligations to us. As a landlord, we intend for all of our business activities and operations to conform in all material respects with all applicable laws and regulations, including healthcare laws and regulations. Our leases require the tenants and operators to comply with all applicable laws, including healthcare laws.
These laws subject tenant healthcare facilities and practices to requirements related to reimbursement, licensing and certification policies, ownership of facilities, addition or expansion of facilities and services, pricing and billing for services, compliance obligations (including those governing the security, use and disclosure of confidential patient information) and fraud and abuse laws. These laws and regulations are wide-ranging and complex, may vary or overlap from jurisdiction to jurisdiction, and are subject frequently to change. Healthcare facilities may also be affected by changes in accreditation standards or in the procedures of the accrediting agencies that are recognized by governments in the certification process. In addition, expansion (including the addition of new beds or services or the acquisition of medical equipment) and occasionally the discontinuation of services of healthcare facilities may be subject to state regulatory approval through certificate of need programs. This may impact the ability of our tenants to expand their businesses. Different tenants may be more or less subject to certain types of regulation, some of which are specific to the type of facility or provider. We cannot predict the degree to which these changes, or changes to the federal healthcare programs in general, may affect the economic performance of some or all of our tenants, positively or negatively. We expect healthcare providers to continue to adjust to new operating and reimbursement challenges, as they have in the past, by increasing operating efficiency and modifying their strategies to profitably grow operations.
There are various state and federal laws that may apply to investors including U.S. federal and state anti-kickback and fee-splitting statutes, which limit physician referrals to entities in which the physician has a financial relationship. States vary in the types of entities, if any, their laws cover. Investment interests in those facilities may, in certain instances, prohibit referrals to the entity by physician investors. Physician investors may also face disciplinary action from licensure boards for referrals to entities in which the physician has an investment interest. Some states require disclosure of the financial relationship before referral by any physician investors, while others prohibit referrals entirely. These state laws and regulations may be broader than their federal counterparts and are the subject of State enforcement. Many state laws contain exemptions for investments in publicly traded companies provided certain requirements are met. These exemption requirements may include listing on a national stock exchange or maintaining a minimum asset value. Meeting some of these requirements may be dependent on market forces or otherwise outside our control.
Changes in laws and regulations, reimbursement enforcement activity and regulatory non-compliance by our tenants and operators can all have a significant effect on their operations and financial condition, which in turn may adversely impact us, as detailed below and set forth under Item 1A, “Risk Factors,” under the caption “The healthcare industry is heavily regulated and new laws or regulations, changes to existing laws or regulations, changes to reimbursement models or structure, loss of licensure or failure to obtain licensure could adversely impact our company and result in the inability of our tenants to make rent payments to us.” We highlight below several of
10
the more complex laws, however this is an overview, as the complexities of the laws impacting tenants are varied and extensive.
The Affordable Care Act has continued to change how healthcare services are covered, delivered and reimbursed. The Affordable Care Act includes payment reform provisions intended to drive Medicare towards more value-based purchasing which, in turn, increases accountability for healthcare providers for the quality and costs of the healthcare services they provide. While more individuals now carry healthcare coverage as a result of the Affordable Care Act, the full effects of the changes to reimbursement models for both public and commercial coverage continue to evolve. Each kind of healthcare provider tenant has a different and complex set of laws related to reimbursement and reimbursement models, which may affect the tenant's ability to collect revenues and meet the terms of their leases. Such varying reimbursement models and laws impact each kind of provider as well as the healthcare system as a whole. For example, for physicians, the Centers for Medicare and Medicaid Services sets an annual Medicare Sustainable Growth Rate and updates a related physician fee schedule to control spending by Medicare on physician services The implementation of this physician fee schedule can be suspended or adjusted by Congress, as has been done regularly in the past. In addition, for ambulatory service centers, the Affordable Care Act introduced provisions that reduce the annual inflation update for payment rates by a "productivity adjustment," which may result in a decrease in Medicare payment rates for the same procedures in a given year compared to the prior year. Other changes brought about by the Affordable Care Act could negatively impact reimbursement for any one of the kind of provider tenants as outlined below.
The Affordable Care Act also has begun to alter reimbursement from private insurers and managed care organizations. Networks continue to readjust and all providers must ensure adequate market share in their respective areas to remain in the network created by many of the managed care organizations. Under the Affordable Care Act, individuals are required to obtain coverage or pay a penalty resulting in millions of more Americans obtaining coverage, usually through the healthcare exchanges (called the Marketplace) established to provide coverage in each state. It is unclear at this time how the Marketplace coverage will impact each state and locale.The new Presidential Administration has suggested that it plans to seek to repeal all or portions of the Affordable Care Act and replace the current legislation with new legislation. There is uncertainty with respect to the impact this Administration may have, if any, and any changes will likely take time to unfold, and could have an impact on coverage and reimbursement for healthcare items and services covered by plans that were authorized by the Affordable Care Act. However, we cannot predict the ultimate content, timing or effect of any healthcare reform legislation or the impact of potential legislation on us and/or our tenants.
The Bipartisan Budget Act of 2015, Section 603, lowered Medicare rates effective January 1, 2017, for services provided in off-campus, provider-based outpatient departments, to the same level of rates for physician-office settings, for those facilities not grandfathered-in under the current Medicare rates as of the law’s date of enactment, November 2, 2015. This legislation reflects the movement by the Center for Medicare and Medicaid Services toward reimbursement “site-neutrality,” or equalizing Medicare rates across different facility-type settings. While these changes are expected to lower overall Medicare spending, our medical office buildings that are located on hospital campuses could become more valuable as hospital tenants will keep their higher Medicare rates for on-campus outpatient services. However, we cannot predict the amount of benefit from these measures or if other federal budget negotiations will ultimately require cuts to reimbursement rates for services provided in other facility-type settings.
Legislative Developments
Each year, legislative proposals for health policy are introduced in Congress and state legislatures, and regulatory changes are enacted by government agencies. These proposals, individually or in the aggregate, could significantly change the delivery of healthcare services, either nationally or at the state level, if implemented. Examples of significant legislation currently under consideration, recently enacted or in the process of implementation, include:
|
•
|
the Affordable Care Act and proposed amendments and repeal measures and related actions at the federal and state level;
|
11
|
•
|
quality control, cost containment, and payment system reforms for Medicaid, Medicare and other public funding, such as expansion of pay-for-performance criteria and value-based purchasing programs, bundled provider payments, accountable care organizations, increased patient cost-sharing, geographic payment variations, comparative effectiveness research, and lower payments for hospital readmissions;
|
|
•
|
implementation of health insurance exchanges and regulations governing their operation, whether run by the state or by the federal government, whereby individuals and small businesses purchase health insurance, including government-funded plans, many assisted by federal subsidies that are under ongoing legal challenges;
|
|
•
|
equalization of Medicare payment rates across different facility-type settings; the Bipartisan Budget Act of 2015, Section 603, lowered Medicare payment rates, effective January 1, 2017, for services provided in off-campus, provider-based outpatient departments to the same level of rates for physician-office settings for those facilities not grandfathered-in under the current Medicare rates as of the law’s date of enactment, November 2, 2015;
|
|
•
|
the continued adoption by providers of federal standards for the meaningful-use of electronic health records, and the transition to ICD-10 coding;
|
|
•
|
anti-trust scrutiny of recently-announced mergers of large health insurance companies; and
|
|
•
|
tax law changes affecting non-profit providers.
|
Environmental Matters
As an owner of real estate, we are subject to various federal, state and local environmental laws, regulations and ordinances and also could be liable to third parties as a result of environmental contamination or noncompliance at our properties even if we no longer own such properties. See the discussion under Item 1A, “Risk Factors,” under the caption “Environmental compliance costs and liabilities associated with owning and leasing our properties may affect our results of operations.”
Competition
We compete with many other entities engaged in real estate investment activities for acquisitions of healthcare properties, including national, regional and local operators, acquirers and developers of healthcare-related real estate properties. The competition for healthcare-related real estate properties may significantly increase the price that we must pay for healthcare properties or other assets that we seek to acquire, and our competitors may succeed in acquiring those properties or assets themselves. In addition, our potential acquisition targets may find our competitors to be more attractive because they may have greater resources, may be willing to pay more for the properties or may have a more compatible operating philosophy. In particular, larger REITs that target healthcare properties may enjoy significant competitive advantages that result from, among other things, a lower cost of capital, enhanced operating efficiencies, more personnel and market penetration and familiarity with markets. In addition, the number of entities and the amount of funds competing for suitable investment properties may increase. Increased competition would result in increased demand for the same assets and therefore increase prices paid for them. Those higher prices for healthcare properties or other assets may adversely affect our returns from our investments.
Insurance
We carry comprehensive liability insurance and property insurance covering our properties. In addition, tenants under long-term single-tenant net leases are required to carry property insurance covering our interest in the buildings.
12
Employees
At December 31, 2016, we employed 13 people. The employees are not members of any labor union, and we consider our relations with our employees to be excellent.
Seasonality
Our business has not been, and we do not expect it to become subject to, material seasonal fluctuations.
Available Information
The Company makes available to the public free of charge through its internet website the Company’s Definitive Proxy Statement, Annual Report on Form 10-K, Quarterly Reports on Form 10-Q, Current Reports on Form 8-K, and amendments to those reports filed or furnished pursuant to Section 13(a) or 15(d) of the Securities Exchange Act of 1934, as amended, as soon as reasonably practicable after the Company electronically files such reports with, or furnishes such reports to, the Securities and Exchange Commission ("SEC"). The Company’s internet website address is www.chct.reit.
The public may read and copy any materials that the Company files with the SEC at the SEC’s Public Reference Room located at 100 F Street, NE, Washington, DC 20549. The public may obtain information on the operation of the Public Reference Room by calling the SEC at 1-800-SEC-0330. The SEC also maintains electronic versions of the Company’s reports on its website at www.sec.gov.
Corporate Governance Guidelines
The Company has adopted Corporate Governance Guidelines relating to the conduct and operations of the Board of Directors. The Corporate Governance Guidelines are posted on the Company’s website (www.chct.reit) and are available in print to any stockholder who requests a copy.
Committee Charters
The Board of Directors has an Audit Committee, Compensation Committee and Corporate Governance Committee. The Board of Directors has adopted written charters for each committee which are posted on the Company’s website (www.chct.reit) and are available in print to any stockholder who requests a copy.
Executive Officers
Information regarding the executive officers of the Company is set forth in Part III, Item 10 of this report and is incorporated herein by reference.
13
Risks Related to Our Business
We are recently formed and have a very limited operating history; therefore there is no assurance that we will be able to successfully operate our business as a publicly traded company or generate sufficient cash flows to make or sustain distributions to our stockholders.
We commenced operations on May 27, 2015 and have a very limited operating history. We are subject to all of the business risks and uncertainties associated with any new business, including the risk that we will not achieve our investment objectives as described in this report and that the value of your investment could decline substantially. Our financial condition and results of operations will depend on many factors, including the availability of acquisition opportunities, readily accessible short- and long-term financing, conditions in the financial markets and economic conditions generally. There can be no assurance that we will be able to generate sufficient cash flow over time to pay our operating expenses and make distributions to stockholders. If we fail to successfully operate our business, implement our investment strategy or generate sufficient revenue to make or sustain distributions to stockholders, the value of your investment could decline significantly or you could lose all or a portion of your investment.
Our real estate investments are concentrated in healthcare properties, making us more vulnerable economically than if our investments were diversified in other segments of the economy.
We acquire, own, manage, operate and selectively develop properties for lease primarily to physicians and healthcare delivery systems. We are subject to risks inherent in concentrating investments in real estate, and the risks resulting from a lack of diversification is even greater as a result of our business strategy to concentrate our investments in the healthcare sector. Any adverse effects that result from these risks could be more pronounced than if we diversified our investments outside of healthcare properties. Given our concentration in this sector, our tenant base is especially concentrated and dependent upon the healthcare industry generally, and any industry downturn could adversely affect the ability of our tenants to make lease payments and our ability to maintain current rental and occupancy rates. Our tenant mix could become even more concentrated if a significant portion of our tenants practice in a particular medical field or are reliant upon a particular healthcare delivery system. Accordingly, a downturn in the healthcare industry generally, or in the healthcare related facility specifically, could adversely affect our business, financial condition and results of operations, our ability to make distributions to our shareholders and the market price of our common shares.
We may be unable to source off-market or lightly marketed deal flow in the future, which may have a material adverse effect on our growth.
A key component of our investment strategy is to acquire additional Non-Urban healthcare properties in off-market or lightly marketed transactions, relying on our officers’ relationships with healthcare providers and real estate brokers. We seek to acquire properties before they are widely marketed by real estate brokers. As we expect to compete with many national, regional and local acquirers of healthcare properties, properties that are acquired in off-market or lightly marketed transactions are typically more attractive to us as a purchaser because of the absence of a formal sales process, which could lead to higher prices. In the formal sales process, our potential acquisition targets may find our competitors to be more attractive because they may have greater resources, may be willing to pay more for the properties or may have a more compatible operating philosophy. In particular, larger REITs, including publicly traded and privately held REITs, private equity investors or institutions investment funds who are targeting healthcare properties may enjoy significant competitive advantages that result from, among other things, a lower cost of capital, enhanced operating efficiencies, more risk tolerance, more personnel and market penetration and familiarity with markets. As such, if we do not have access to off-market or lightly marketed deal flow in the future, our ability to locate and acquire additional properties in Non-Urban markets at attractive prices could be materially and adversely affected, which could materially impede our growth, and, as a result, adversely affect our operating results.
14
Our business could be harmed if key personnel terminate their employment with us or if we are unsuccessful in integrating new personnel into our operations.
Our success depends, to a significant extent, on the continued services of Mr. Timothy G. Wallace, our Chairman, Chief Executive Officer and President, Mr. W. Page Barnes, our Executive Vice President and Chief Financial Officer, and Ms. Leigh Ann Stach, our Vice President of Financial Reporting and Chief Accounting Officer. Each executive officer has significant experience in the healthcare and/or real estate industry and have all developed significant relationships with various healthcare providers and real estate brokers throughout the United States. Our ability to continue to acquire and develop healthcare properties in off market or lightly marketed transactions depends upon the significant relationships that our senior management team has developed over many years.
Although we have entered into employment agreements with Messrs. Wallace and Barnes and Ms. Stach, we cannot provide any assurance that any of them will remain employed by us. Our ability to retain our executive officers, or to attract suitable replacements should any member of the senior management team leave, is dependent on the competitive nature of the employment market. The loss of services of, or the failure to successfully integrate one or more new members of, our senior management team could adversely affect our business and our prospects.
We may be unable to complete any pending acquisitions, which would adversely affect our ability to make distributions to our stockholders and could have a material adverse impact on our results of operations, earnings and cash flow.
We cannot assure you that we will complete any pending acquisitions on the terms described in this report or other reports the Company may file or furnish in future SEC filings, because these transactions are subject to a variety of conditions, including, in the case of properties under contract, the execution of a mutually agreed-upon lease between us and the proposed tenant, our satisfactory completion of due diligence and the satisfaction of customary closing conditions. These transactions, whether or not successful, require substantial time and attention from management. Furthermore, the pending acquisitions require significant expense, including expenses for due diligence, legal and accounting fees and other costs. If we are unable to complete the acquisitions of any potential acquisitions, we would still incur the costs associated with pursuing those investments, but would not generate the revenues and net operating income that we currently anticipate, which would adversely affect our ability to make distributions to our stockholders and could have a material adverse impact on our financial condition, results of operations and the market price of our common shares.
We may be unable to successfully acquire properties and expand our operations into new or existing Non-Urban markets.
A component of our strategy is to pursue acquisitions of properties in new and existing Non-Urban markets. These acquisitions could divert our officers’ attention from other pending and/or potential acquisitions, and we may be unable to retain key employees or attract highly qualified new employees in those markets. In addition, we may not possess familiarity with the dynamics and prevailing conditions of any new Non-Urban markets, which could adversely affect our ability to successfully expand into or operate within those markets. For example, new Non-Urban markets may have different insurance practices, reimbursement rates and local real estate zoning regulations than those with which we are familiar. We may find ourselves more dependent on third parties in new Non-Urban markets because our physical distance could hinder our ability to directly and efficiently manage and otherwise monitor new properties in new Non-Urban markets. In addition, our expansion into new Non-Urban markets could result in unexpected costs or delays as well as lower occupancy rates and other adverse consequences. We may not be successful in identifying suitable properties or other assets that meet our acquisition criteria or in consummating acquisitions on satisfactory terms or at all for a number of reasons, including, among other things, significant competition from other prospective purchasers in new Non-Urban markets, unsatisfactory results of our due diligence investigations, failure to obtain financing for the acquisition on favorable terms or at all, and our misjudgment of the value of the opportunities. We may also be unable to successfully integrate the operations of acquired properties, maintain consistent standards, controls, policies and procedures, or realize the anticipated benefits of the acquisitions within the anticipated timeframe or at all. If we are unsuccessful in expanding into new or our existing Non-Urban markets, it could materially and adversely affect our business, financial condition and
15
results of operations, our ability to make distributions to our stockholders and the market price of our common stock.
The bankruptcy, insolvency or weakened financial position of our tenants, and particularly our largest tenants, could materially and adversely affect our operating results and financial condition.
We receive substantially all of our revenue from rent payments from tenants under leases of space in our healthcare properties. We have no control over the success or failure of our tenants’ businesses and, at any time, any of our tenants may experience a downturn in its business that may weaken its financial condition. Additionally, private or governmental payers may lower the reimbursement rates paid to our tenants for their healthcare services. For example, the Affordable Care Act provides for significant reductions to Medicare and Medicaid payments. As a result, our tenants may delay lease commencement or renewal, fail to make rent payments when due or declare bankruptcy. Any leasing delays, tenant failures to make rent payments when due or tenant bankruptcies could result in the termination of the tenant’s lease and, particularly in the case of a large tenant, or a significant number of tenants, may have a material adverse effect on our business, financial condition and results of operations, our ability to make distributions to our stockholders and the market price of our common stock. In addition, to the extent a tenant vacates specialized space in one of our properties (such as imaging space, ambulatory surgical space, or inpatient hospital space), re-leasing the vacated space could be more difficult than re-leasing less specialized office space, as there are fewer users for such specialized healthcare space in a typical market than for more traditional office space.
Any bankruptcy filings by or relating to one of our tenants could bar all efforts by us to collect pre-bankruptcy debts from that tenant or seize its property, unless we receive an order permitting us to do so from a bankruptcy court, which we may be unable to obtain. A tenant bankruptcy could also delay our efforts to collect past due balances under the relevant leases and could ultimately preclude full collection of these sums. Furthermore, if a tenant rejects the lease while in bankruptcy, we would have only a general unsecured claim for pre-petition damages. Any unsecured claim that we hold may be paid only to the extent that funds are available and only in the same percentage as is paid to all other holders of unsecured claims. It is possible that we may recover substantially less than the full value of any unsecured claims that we hold, if any, which may have a material adverse effect on our business, financial condition and results of operations, our ability to make distributions to our stockholders and the market price of our common stock. Furthermore, dealing with a tenant bankruptcy or other default may divert management’s attention and cause us to incur substantial legal and other costs, which could adversely affect our ability to execute our business strategies, financial condition, and results of operations, as well as our ability to make distributions to our stockholders and the market price of our common stock.
We may have difficulty finding suitable replacement tenants in the event of a tenant default or non-renewal of our leases, especially for our properties located in smaller markets.
We cannot predict whether our tenants will renew existing leases beyond their current terms. We currently have
27
leases scheduled to expire in 2017 and
30
leases scheduled to expire in 2018, which represent
13.7%
and
13.2%
of our total annualized lease revenue, respectively, as of December 31,
2016
. If any of our leases are not renewed, or are terminated prior to the contractual expiration date, we would attempt to lease those properties to another tenant at then-current market rates. However, following expiration of a lease term or if we exercise our right to replace a tenant in default, rental payments on the related properties could decline or cease altogether while we reposition the properties with a suitable replacement tenant. Because our properties are located in Non-Urban areas, the timetable to replace a departing tenant may be longer than replacing a tenant in an urban area. As such, we may be required to fund certain expenses and obligations (e.g., real estate taxes, debt costs and maintenance expenses) to preserve the value of, and avoid the imposition of liens on, our properties while they are being repositioned. Furthermore, our ability to reposition our properties with a suitable tenant could be significantly delayed or limited by state licensing, receivership, certificate of need, or CON, or other laws, as well as by the Medicare and Medicaid change-of-ownership rules. We could also incur substantial additional expenses in connection with any licensing, receivership or change-of-ownership proceedings. In addition, our ability to locate suitable replacement tenants could be impaired by the specialized healthcare uses or contractual restrictions on use of the properties, and we may be required to spend substantial amounts to adapt the properties to other uses. Any such delays, limitations and
16
expenses could adversely impact our ability to collect rent, obtain possession of leased properties or otherwise exercise remedies for tenant default and could have a material adverse effect on our business, financial condition and results of operations, our ability to make distributions to our stockholders and the market price of our common stock.
All of these risks may be greater in the Non-Urban markets on which we focus, where there may be fewer potential replacement tenants, making it more difficult to replace tenants, especially for specialized space, like hospital or outpatient treatment facilities located in our properties, and could have a material adverse effect on our business, financial condition and results of operations, our ability to make distributions to our stockholders and the market price of our common stock.
Adverse economic or other conditions in the geographic markets in which we conduct business could negatively affect our occupancy levels and rental rates and have a material adverse effect on our operating results.
Our operating results depend upon our ability to maintain and improve the anticipated occupancy levels and rental rates at our properties. Adverse economic or other conditions in the geographic markets in which we operate, including periods of economic slowdown or recession, industry slowdowns, periods of deflation, relocation of businesses, changing demographics, water pollution, earthquakes and other natural disasters, fires, terrorist acts, civil disturbances or acts of war and other man-made disasters which may result in uninsured or underinsured losses, and changes in tax, real estate, zoning and other laws and regulations, may lower our occupancy levels and limit our ability to increase rents or require us to offer rental concessions. The failure of our properties to generate revenues sufficient to meet our cash requirements, including operating and other expenses, debt service and capital expenditures, may have an adverse effect on our business, financial condition and results of operations, our ability to make distributions to our stockholders and the market price of our common stock.
A large percentage of our properties are located in Florida, Illinois, Kansas and Texas, and changes in these markets may materially adversely affect us.
Of our investments in
58
properties, the properties located in Florida, Illinois, Kansas and Texas provide, in the aggregate, approximately $13.9 million, or approximately 55.2%, of our revenue for the year ended December 31, 2016. As a result of this geographic concentration, we are particularly exposed to downturns in the economies of those states or other changes in such states’ respective real estate market conditions. Any material change in the current payment programs or regulatory, economic, environmental or competitive conditions in these states could have a disproportionate effect on our overall business results. In the event of negative economic or other changes in these markets, our business, financial condition and results of operations, our ability to make distributions to our stockholders and the market price of our common stock may be materially and adversely affected.
We will rely upon external sources of capital to fund future capital needs, and, if we encounter difficulty in obtaining such capital, we may not be able to make future acquisitions necessary to grow our business or meet maturing obligations.
In order to maintain our status as a REIT under the Code, we are required, among other things, to distribute each year to our stockholders at least 90% of our REIT taxable income, without regard to the deduction for dividends paid and excluding net capital gains. In addition, we are subject to income tax at regular corporate rates to the extent we distribute less than 100% of our REIT taxable income, including any net capital gains. Because of this distribution requirement, we will not likely be able to fund all of our future capital needs from cash retained from operations, including capital needed to make investments and to satisfy or refinance maturing obligations. As a result, we expect to rely upon external sources of capital, including debt and equity financing, to fund future capital needs. If we are unable to obtain needed capital on satisfactory terms or at all, we may not be able to make the investments needed to expand our business or to meet our obligations and commitments as they mature. Our access to capital will depend upon a number of factors over which we have little or no control, including general market conditions, the market’s perception of our current and potential future earnings and cash distributions and the market price of our common stock. We may not be in a position to take advantage of attractive acquisition opportunities for growth if we are unable to access the capital markets on a timely basis on favorable terms.
17
We may not be able to control our expenses or our expenses may remain constant or increase, even if our revenue does not increase, which could cause our results of operations to be adversely affected.
There are factors beyond our control that may adversely affect our ability to control our expenses. Certain costs associated with real estate investments (e.g., real estate taxes, debt costs and maintenance expenses) required to preserve the value of the property may not be reduced even if a healthcare related facility is not occupied or other circumstances cause our revenues to decrease. If our expenses increase as a result of any of the foregoing factors, our results of operations may be adversely affected.
Our ability to issue equity to expand our business will depend, in part, upon the market price of our common stock, and our failure to meet market expectations with respect to our business could adversely affect the market price of our common stock and thereby limit our ability to raise capital.
The availability of equity capital to us will depend, in part, upon the market price of our common stock, which, in turn, will depend upon various market conditions and other factors that may change from time to time, including:
|
•
|
the extent of investor interest in our company and our assets;
|
|
•
|
our ability to satisfy the distribution requirements applicable to REITs;
|
|
•
|
the general reputation of REITs and the attractiveness of their equity securities in comparison to other equity securities, including securities issued by other real estate-based companies;
|
|
•
|
our financial performance and that of our tenants;
|
|
•
|
analyst reports about us and the REIT industry;
|
|
•
|
macroeconomic conditions generally and conditions affecting the healthcare and real estate industry in particular;
|
|
•
|
general stock and bond market conditions, including changes in interest rates on fixed income securities, which may lead prospective purchasers of our common stock to demand a higher annual yield from future distributions;
|
|
•
|
a failure to maintain or increase our dividend which is dependent, in large part, upon funds from operations, or FFO, which, in turn, depends upon increased revenue from additional acquisitions and rental increases; and
|
|
•
|
other factors such as governmental regulatory action and changes in REIT tax laws.
|
Our failure to meet the market’s expectations with regard to future earnings and cash distributions could materially and adversely affect the market price of our common stock and, as a result, the cost and availability of equity capital to us.
We have now, and may have in the future, exposure to contingent rent escalators, which can hinder our growth and profitability.
We receive a significant portion of our revenues by acquiring and leasing our assets under long-term net leases in which the rental rate is generally fixed with annual fixed rate rental rate escalations or rental rate escalators based upon changes in the Consumer Price Index, or CPI. Properties which we acquire in the future may contain CPI escalators or escalators that are contingent upon our tenant’s achievement of specified revenue parameters. If, as a result of weak economic conditions or other factors, the revenues generated by our net leased properties do not meet the specified parameters or CPI does not increase, our growth and profitability will be hindered by these leases.
18
Our investments in development projects may not yield anticipated returns which could directly affect our operating results and reduce the amount of funds available for distributions.
A component of our growth strategy is exploring development opportunities, some of which may arise through strategic joint ventures. In deciding whether to make an investment in a particular development, we make certain assumptions regarding the expected future performance of that property. To the extent that we consummate development opportunities, our investment in these projects will be subject to the following risks:
|
•
|
we may be unable to obtain financing for development projects on favorable terms or at all;
|
|
•
|
we may not complete development projects on schedule or within budgeted amounts;
|
|
•
|
we may encounter delays in obtaining or fail to obtain all necessary zoning, land use, building, occupancy, environmental and other governmental permits and authorizations, or underestimate the costs necessary to develop the property to market standards;
|
|
•
|
development or construction delays may provide tenants the right to terminate preconstruction leases or cause us to incur additional costs;
|
|
•
|
volatility in the price of construction materials or labor may increase our development costs;
|
|
•
|
hospitals or health systems may maintain significant decision-making authority with respect to the development schedule;
|
|
•
|
we may incorrectly forecast risks associated with development in new geographic regions;
|
|
•
|
tenants may not lease space at the quantity or rental rate levels projected;
|
|
•
|
demand for our development project may decrease prior to completion, including due to competition from other developments; and
|
|
•
|
lease rates and rents at newly developed properties may fluctuate based on factors beyond our control, including market and economic conditions.
|
If our investments in development projects do not yield anticipated returns for any reason, including those set forth above, our business, financial condition and results of operations, our ability to make distributions to our shareholders and the market price of our common shares may be adversely affected.
The mortgage notes in which we may invest may be impacted by unfavorable real estate market conditions, which could decrease their value.
The mortgage notes in which we may invest may be impacted by unfavorable real estate market conditions, which could decrease their value. If we acquire investments in mortgage notes, such investments will involve special risks relating to the particular borrower, and we will be at risk of loss on those investments, including losses as a result of defaults on mortgage notes. These losses may be caused by many conditions beyond our control, including economic conditions affecting real estate values, tenant defaults and lease expirations, interest rate levels and the other economic and liability risks associated with real estate. We do not know whether the values of the property securing any of our real estate-related investments will remain at the levels existing on the dates we initially make the related investment. If the values of the underlying properties drop, our risk will increase and the values of our interests may decrease.
19
Delays in liquidating defaulted mortgage note investments could reduce our investment returns.
Delays in liquidating defaulted mortgage note investments could reduce our investment returns. If there are defaults under our mortgage note investments, we may not be able to foreclose on or obtain a suitable remedy with respect to such investments. Specifically, we may not be able to repossess and sell the underlying properties quickly, which could reduce the value of our investment. For example, an action to foreclose on a property securing a mortgage note is regulated by state statutes and rules and is subject to many of the delays and expenses of lawsuits if the defendant raises defenses or counterclaims. Additionally, in the event of default by a mortgagor, these restrictions, among other things, may impede our ability to foreclose on or sell the mortgaged property or to obtain proceeds sufficient to repay all amounts due to us on the mortgage note.
Risks Related to the Healthcare Industry
The healthcare industry is heavily regulated and new laws or regulations, changes to existing laws or regulations, changes to reimbursement models or structure, loss of licensure or failure to obtain licensure could adversely impact our company and result in the inability of our tenants to make rent payments to us.
The healthcare industry is heavily regulated by U.S. federal, state and local governmental authorities. Our tenants generally will be subject to laws and regulations covering, among other things, licensure, certification for participation in government programs, billing for services, breaches of privacy and security of health information and relationships with physicians and other referral sources. In addition, new laws and regulations, changes in existing laws and regulations or changes in the interpretation of such laws or regulations could negatively affect our financial condition and the financial condition of our tenants. These changes, in some cases, could apply retroactively. The enactment, timing or effect of legislative or regulatory changes cannot be predicted.
The Affordable Care Act has changed how healthcare services are covered, delivered and reimbursed through expanded coverage of uninsured individuals and reduced Medicare program spending. In addition, the law reforms certain aspects of health insurance, expands existing efforts to tie Medicare and Medicaid payments to performance and quality and contains provisions intended to strengthen fraud and abuse enforcement. In addition, the Affordable Care Act required skilled nursing facilities and nursing facilities to implement a compliance and ethics program for all employees and agents. The documentation and training associated with defining the policies and procedures is a significant undertaking and will require healthcare providers to continue to expend significant resources towards ensuring documentation is comprehensive and in line with government expectations. The complexities and ramifications of the Affordable Care Act are significant. At this time, it is difficult to predict the full effects of the Affordable Care Act and its impact on our business, our revenues and financial condition and those of our tenants due to the law’s complexity, lack of implementing regulations or interpretive guidance, gradual implementation and possible amendment. Further, we are unable to foresee how individuals and businesses will respond to the choices afforded them by the Affordable Care Act. The Affordable Care Act could adversely affect the reimbursement rates received by our tenants, the financial success of our tenants and strategic partners and consequently us.
Furthermore, the new Presidential Administration has suggested that it plans to seek to repeal all or portions of the Affordable Care Act and replace the current legislation with new legislation. There is uncertainty with respect to the impact this Administration may have, if any, and any changes will likely take time to unfold, and could have an impact on coverage and reimbursement for healthcare items and services covered by plans that were authorized by the Affordable Care Act. However, we cannot predict the ultimate content, timing or effect of any healthcare reform legislation or the impact of potential legislation on us. We expect that additional state and federal healthcare reform measures will be adopted in the future, any of which could limit the amounts that federal and state governments will pay for healthcare products and services, which could result in reduced demand for medical products once approved or additional pricing pressures, and may adversely affect our operating results.
Many states also regulate the construction of healthcare facilities, the expansion of healthcare facilities, the construction or expansion of certain services, including by way of example specific bed types and medical equipment, as well as certain capital expenditures through CON laws. Under such laws, the applicable state regulatory body must determine a need exists for a project before the project can be undertaken. If one of our tenants
20
seeks to undertake a CON-regulated project, but is not authorized by the applicable regulatory body to proceed with the project, the tenant would be prevented from operating in its intended manner.
Failure to comply with these laws and regulations could adversely affect us directly and our tenants’ ability to make rent payments to us which may have an adverse effect on our business, financial condition and results of operations, our ability to make distributions to our stockholders and the market price of our common stock.
Adverse trends in healthcare provider operations may negatively affect our lease revenues and our ability to make distributions to our stockholders.
The healthcare industry is currently experiencing, among other things:
|
•
|
changes in the demand for and methods of delivering healthcare services;
|
|
•
|
changes in third party reimbursement methods and policies;
|
|
•
|
increased attention to compliance with regulations designed to safeguard protected health information and cyber-attacks on entities;
|
|
•
|
consolidation and pressure to integrate within the healthcare industry through acquisitions and joint ventures; and
|
|
•
|
increased scrutiny of billing, referral and other practices by U.S. federal and state authorities.
|
These factors may adversely affect the economic performance of some or all of our tenants and, in turn, our lease revenues, which may have a material adverse effect on our business, financial condition and results of operations, our ability to make distributions to our stockholders and the market price of our common stock.
Reductions in reimbursement from third-party payers, including Medicare and Medicaid, could adversely affect the profitability of our tenants and hinder their ability to make rent payments to us or renew their lease.
Sources of revenue for our tenants typically include Medicare, Medicaid, private insurance payers and health maintenance organizations. Healthcare providers continue to face increased government and private payer pressure to control or reduce healthcare costs and significant reductions in healthcare reimbursement, including reduced reimbursements and changes to payment methodologies under the Affordable Care Act. In some cases, private insurers rely upon all or portions of the Medicare payment systems to determine payment rates which may result in decreased reimbursement from private insurers. The Affordable Care Act will likely increase enrollment in plans offered by private insurers who choose to participate in state-run exchanges, but the Affordable Care Act also imposes new requirements for the health insurance industry, including prohibitions upon excluding individuals based upon pre-existing conditions which may increase private insurer costs and, thereby, cause private insurers to reduce their payment rates to providers.
Efforts by payers to reduce healthcare costs will likely continue which may result in reductions or slower growth in reimbursement for certain services provided by some of our tenants. A reduction in reimbursements to our tenants from third-party payers for any reason could adversely affect our tenants’ ability to make rent payments to us which may have a material adverse effect on our businesses, financial condition and results of operations, our ability to make distributions to our stockholders and the market price of our common stock.
Our tenants and our Company are subject to fraud and abuse laws, the violation of which by a tenant may jeopardize the tenant’s ability to make rent payments to us.
There are various federal and state laws prohibiting fraudulent and abusive business practices by healthcare providers who participate in, receive payments from or are in a position to make referrals in connection with
21
government-sponsored healthcare programs, including the Medicare and Medicaid programs. Our lease arrangements with certain tenants may also be subject to these fraud and abuse laws.
These laws include without limitation:
|
•
|
the federal Anti-Kickback Statute, which prohibits, among other things, the offer, payment, solicitation or receipt of any form of remuneration in return for, or to induce, the referral of any federal or state healthcare program patients;
|
|
•
|
the Stark Law, which, subject to specific exceptions, restricts physicians who have financial relationships with healthcare providers from making referrals for designated health services for which payment may be made under Medicare or Medicaid programs to an entity with which the physician, or an immediate family member, has a financial relationship;
|
|
•
|
the federal False Claims Act, which prohibits any person from knowingly presenting false or fraudulent claims for payment to the federal government, including under the Medicare and Medicaid programs;
|
|
•
|
the federal Civil Monetary Penalties Law, which authorizes HHS to impose monetary penalties for certain fraudulent acts; and
|
|
•
|
state anti-kickback, anti-inducement, anti-referral and insurance fraud laws which may be generally similar to, and potentially more expansive than, the federal laws set forth above.
|
Other laws that impact how our tenants conduct their operations include: state and local licensure laws; laws protecting consumers against deceptive practices; laws generally affecting our tenants’ management of property and equipment and how our tenants generally conduct their operations, such as fire, health and safety and environmental laws (including medical waste disposal); federal and state laws affecting assisted living facilities mandating quality of services and care, mandatory reporting requirements regarding the quality of care and quality of food service; resident rights (including abuse and neglect laws); and health standards set by the federal Occupational Safety and Health Administration.
Violations of these laws may result in criminal and/or civil penalties that range from punitive sanctions, damage assessments, penalties, imprisonment, denial of Medicare and Medicaid payments and/or exclusion from the Medicare and Medicaid programs. In addition, the Affordable Care Act clarifies that the submission of claims for items or services generated in violation of the Anti-Kickback Statute constitutes a false or fraudulent claim under the False Claims Act. The federal government has taken the position, and some courts have held that violations of other laws, such as the Stark Law, can also be a violation of the False Claims Act. Additionally, certain laws, such as the False Claims Act, allow for individuals to bring whistleblower actions on behalf of the government for violations thereof. Imposition of any of these penalties upon one of our tenants or strategic partners could jeopardize that tenant’s ability to operate or to make rent payments or affect the level of occupancy in our healthcare properties, which may have a material adverse effect on our business, financial condition and results of operations, our ability to make distributions to our stockholders and the market price of our common stock. Further, we enter into leases and other financial relationships with healthcare delivery systems that are subject to or impacted by these laws.
Our tenants may be subject to cyber-attack and compliance issues associated with the protection of personal information.
Breaches of personal information can result from deliberate attacks or unintentional events. More recently, there has been an increased level of attention focused on cyber-attacks focused on healthcare providers because of the vast amount of personally identifiable information they possess. Most healthcare providers, including all who accept Medicare and Medicaid, must comply with the Health Insurance Portability and Accountability Act, or HIPAA, regulations regarding the privacy and security of protected health information. The HIPAA regulations impose extensive administrative requirements on our tenants with regard to how such protected health information may be used and disclosed. Further, the regulations include extensive and complex regulations which require providers to
22
establish reasonable and appropriate administrative, technical and physical safeguards to ensure the confidentiality, integrity and availability of protected health information maintained in electronic format. The HIPAA regulations were amended in 2009 by the Health Information Technology and Clinical Health Act, or HITECH. HITECH changes included more stringent privacy requirements, increased and direct liability for the vendors of healthcare providers who help the providers operate, breach notification requirements and increased enforcement through the use of state attorneys’ general and their offices. Our tenants must safeguard protected health information against reasonably anticipated threats or hazards to the information. HITECH directs the Secretary of HHS to provide for periodic audits to ensure covered entities (and their business associates, as that term is defined under HIPAA) comply with the applicable HIPAA requirements, increasing the likelihood that a HIPAA violation will result in an enforcement action.
Violations of these various privacy and security laws can result in significant civil monetary penalties, as well as the potential for criminal penalties. In addition to state data breach notification requirements, HIPAA authorizes state attorneys general to bring civil actions on behalf of affected state residents against entities that violate HIPAA privacy and security regulations. These penalties could be in addition to any penalties assessed by a state for a breach which would be considered reportable under the state’s data breach notification laws. Further there are significant costs associated with a breach including investigation costs, remediation and mitigation costs, notification costs, attorney fees and the potential for reputational harm and lost revenues due to a loss in confidence in the provider. While there is no private right of action under HIPAA, plaintiff attorneys are increasingly developing class action litigation strategies designed to obtain settlements from healthcare providers. We cannot predict the effect of additional costs on tenants to comply with these laws nor the costs associated with a potential breach of protected health information by a tenant and what effect they might have on the expenses of our tenants and their ability to meet their obligations to us, which in turn could have a material adverse effect on our business, financial condition and results of operations, our ability to pay distributions to our stockholders and the market price of our common stock.
Our healthcare-related tenants may be subject to significant legal actions that could subject them to increased operating costs and substantial uninsured liabilities, which may affect their ability to pay their rent payments to us, and we could be subject to healthcare industry violations.
As is typical in the healthcare industry, our tenants may often become subject to claims that their services have resulted in patient injury or other adverse effects. Many of these tenants may have experienced an increasing trend in the frequency and severity of professional liability and general liability insurance claims and litigation asserted against them. The insurance coverage maintained by these tenants may not cover all claims made against them nor continue to be available at a reasonable cost, if at all. In some states, insurance coverage for the risk of punitive damages arising from professional liability and general liability claims and/or litigation may not, in certain cases, be available to these tenants due to state law prohibitions or limitations of availability. As a result, these types of tenants of our healthcare properties and healthcare-related facilities operating in these states may be liable for punitive damage awards that are either not covered or are in excess of their insurance policy limits.
We also believe that there has been, and will continue to be, an increase in governmental investigations of certain healthcare providers, particularly in the area of Medicare/Medicaid false claims, as well as an increase in enforcement actions resulting from these investigations. Insurance is not available to cover such losses. Any adverse determination in a legal proceeding or governmental investigation, any settlements of such proceedings or investigations in excess of insurance coverage, whether currently asserted or arising in the future, could have a material adverse effect on a tenant’s financial condition. If a tenant is unable to obtain or maintain insurance coverage, if judgments are obtained or settlements reached in excess of the insurance coverage, if a tenant is required to pay uninsured punitive damages, or if a tenant is subject to an uninsurable government enforcement action or investigation, the tenant could be exposed to substantial additional liabilities, which may affect the tenant’s ability to pay rent, which in turn could have a material adverse effect on our business, financial condition and results of operations, our ability to pay distributions to our stockholders and the market price of our common stock.
23
Risks Related to the Real Estate Industry
Illiquidity of real estate investments could significantly impede our ability to respond to adverse changes in the performance of our properties.
Because real estate investments are relatively illiquid, our ability to promptly sell one or more of our properties in response to changing economic, financial and investment conditions is limited. The real estate market is affected by many factors, such as general economic conditions, availability of financing, interest rates and other factors, including supply and demand, that are beyond our control. In the event we decide to sell any of our properties, we cannot predict whether we will be able to sell such properties for the price or on the terms set by us or whether any price or other terms offered by a prospective purchaser would be acceptable to us. We also cannot predict the length of time needed to find a willing purchaser and to close the sale of any of our properties. The fact that we own properties in Non-Urban markets may lengthen the time required to sell our properties. We may be required to expend funds to correct defects or to make improvements before a property can be sold. We cannot assure you that we will have funds available to correct those defects or to make those improvements.
In acquiring a property, we may agree to transfer restrictions that materially restrict us from selling that property for a period of time or impose other restrictions, such as a limitation on the amount of debt that can be placed or repaid on that property. These transfer restrictions would impede our ability to sell a property even if we deem it necessary or appropriate. These facts and any others that would impede our ability to respond to adverse changes in the performance of our properties may have an adverse effect on our business, financial condition, results of operations, or ability to make distributions to our stockholders and the market price of our common stock.
Moreover, the Code imposes restrictions on a REIT’s ability to dispose of properties that are not applicable to other types of real estate companies. In particular, the tax laws applicable to REITs require that we hold our properties for investment, rather than primarily for sale in the ordinary course of business, which may cause us to forego or defer sales of properties that otherwise would be in our best interests. Therefore, we may not be able to vary our portfolio promptly in response to economic or other conditions or on favorable terms, which may adversely affect our cash flows, our ability to make distributions to our stockholders and the market price of our common stock.
Uncertain market conditions could cause us to sell our healthcare properties at a loss in the future.
We intend to hold our various real estate investments until such time as we determine that a sale or other disposition appears to be advantageous to achieve our investment objectives. Our senior management team and our board of directors may exercise their discretion as to whether and when to sell one of our healthcare properties, and we will have no obligation to sell our buildings at any particular time. We generally intend to hold our healthcare properties for an extended period of time, and we cannot predict with any certainty the various market conditions affecting real estate investments that will exist at any particular time in the future. Because of the uncertainty of market conditions that may affect the future disposition of our healthcare properties, we may not be able to sell our buildings at a profit in the future or at all. We may incur prepayment penalties in the event that we sell a property subject to a mortgage earlier than we otherwise had planned. Additionally, we could be forced to sell healthcare properties at inopportune times which could result in us selling the affected building at a substantial loss. Accordingly, the extent to which you will receive cash distributions and realize potential appreciation on our real estate investments will, among other things, be dependent upon fluctuating market conditions. Because of the uncertainty of market conditions that may affect the future disposition of our properties, and the potential payment of prepayment penalties upon such disposition, we cannot assure you that we will be able to sell our properties at a profit in the future, which could materially adversely affect our business, financial condition and results of operations and our ability to make distributions to our stockholders.
Uninsured losses relating to real property may adversely affect your returns.
We evaluate our insurance coverage annually in light of current industry practice through an analysis prepared by outside consultants and attempt to ensure that all of our properties are adequately insured to cover casualty losses. However, there are certain losses, including losses from floods, earthquakes, wildfires, acts of war, acts of terrorism
24
or riots, that are not generally insured against or that are not generally fully insured against because it is not deemed economically feasible or prudent to do so. In addition, changes in the cost or availability of insurance could expose us to uninsured casualty losses. In the event that any of our properties incurs a casualty loss that is not fully covered by insurance, the value of our assets will be reduced by the amount of any such uninsured loss, and we could experience a significant loss of capital invested and potential revenue in these properties and could potentially remain obligated under any recourse debt associated with the property. In addition, we may have no source of funding to repair or reconstruct the damaged property, and we cannot assure you that any such sources of funding will be available to us for such purposes in the future. Furthermore, we, as the general partner of our operating partnership, generally will be liable for all of our operating partnership’s unsatisfied recourse obligations. Any such losses could materially adversely affect our financial condition, results of operations, cash flows and ability to pay distributions, and the market price of our common stock.
Our property taxes could increase due to property tax rate changes or reassessments, which could materially adversely impact our cash flows.
Even if we qualify as a REIT for federal income tax purposes, we will be required to pay some state and local taxes on our properties. The real property taxes on our properties may increase as property tax rates change or as our properties are assessed or reassessed by taxing authorities. The amount of property taxes we pay in the future may increase substantially from what we have paid in the past. If the property taxes we pay increase, our cash flow would be adversely impacted to the extent that we are not reimbursed by tenants for those taxes, and our ability to pay any expected dividends to our stockholders could be materially adversely affected.
Our properties may contain or develop harmful mold or suffer from other air quality issues, which could lead to liability for adverse health effects and costs of remediation.
When excessive moisture accumulates in buildings or on building materials, mold growth may occur, particularly if the moisture problem remains undiscovered or is not addressed over a period of time. Some molds may produce airborne toxins or irritants. Indoor air quality issues can also stem from inadequate ventilation, chemical contamination from indoor or outdoor sources, and other biological contaminants such as pollen, viruses and bacteria. Indoor exposure to airborne toxins or irritants above certain levels can be alleged to cause a variety of adverse health effects and symptoms, including allergic or other reactions. As a result, the presence of significant mold or other airborne contaminants at any of our properties could require us to undertake a costly remediation program to contain or remove the mold or other airborne contaminants from the affected property or increase indoor ventilation. In addition, the presence of significant mold or other airborne contaminants could expose us to liability from our tenants, employees of our tenants or others if property damage or personal injury is alleged to have occurred.
We may incur significant costs complying with various federal, state and local laws, regulations and covenants that are applicable to our properties.
The properties in our portfolio are subject to various covenants and federal, state and local laws and regulatory requirements, including permitting and licensing requirements. Local regulations, including municipal or local ordinances and zoning restrictions may restrict our use of our properties and may require us to obtain approval from local officials or restrict our use of our properties and may require us to obtain approval from local officials of community standards organizations at any time with respect to our properties, including prior to acquiring a property or when undertaking renovations of any of our properties. Among other things, these restrictions may relate to fire and safety, seismic or hazardous material abatement requirements. There can be no assurance that existing laws and regulatory policies will not adversely affect us or the timing or cost of any future acquisitions or renovations, or that additional regulations will not be adopted that increase such delays or result in additional costs. Our growth strategy may be adversely affected by our ability to obtain permits, licenses and zoning relief. Our failure to obtain such permits, licenses and zoning relief or to comply with applicable laws could have an adverse effect on our financial condition, results of operations, cash flows and our ability to pay distributions, and the market price of our common stock.
25
In addition, federal and state laws and regulations, including laws such as the Americans with Disabilities Act, or ADA, and the Fair Housing Amendment Act of 1988, or FHAA, impose further restrictions on our properties and operations. Under the ADA and the FHAA, all public accommodations must meet federal requirements related to access and use by disabled persons. Some of our properties may currently be in non-compliance with the ADA or the FHAA. If one or more of our properties is not in compliance with the ADA, the FHAA or any other regulatory requirements, we may be required to incur additional costs to bring the property into compliance, including the removal of access barriers, and we might incur governmental fines or the award of damages to private litigants. In addition, we do not know whether existing requirements will change or whether future requirements will require us to make significant unanticipated expenditures that will adversely impact our financial condition, results of operations, cash flows and our ability to pay distributions, and the market price of our common stock.
Environmental compliance costs and liabilities associated with owning and leasing our properties may affect our results of operations.
Under various U.S. federal, state and local laws, ordinances and regulations, current and prior owners and tenants of real estate may be jointly and severally liable for the costs of investigating, remediating and monitoring certain hazardous substances or other regulated materials on or in such property. In addition to these costs, the past or present owner or tenant of a property from which a release emanates could be liable for any personal injury or property damage that results from such release, including for the unauthorized release of asbestos-containing materials and other hazardous substances into the air, as well as any damages to natural resources or the environment that arise from such release. These environmental laws often impose such liability without regard to whether the current or prior owner or tenant knew of, or was responsible for, the presence or release of such substances or materials. Moreover, the release of hazardous substances or materials, or the failure to properly remediate such substances or materials, may adversely affect the owner’s or tenant’s ability to lease, sell, develop or rent such property or to borrow by using such property as collateral. Persons who transport or arrange for the disposal or treatment of hazardous substances or other regulated materials may be liable for the costs of removal or remediation of such substances at a disposal or treatment facility, regardless of whether or not such facility is owned or operated by such person.
We perform a Phase I environmental site assessment at any property we are considering acquiring. However, Phase I environmental site assessments are limited in scope and do not involve sampling of soil, soil vapor, or groundwater, and these assessments may not include or identify all potential environmental liabilities or risks associated with the property. Even where subsurface investigation is performed, it can be very difficult to ascertain the full extent of environmental contamination or the costs that are likely to flow from such contamination. We cannot assure you that the Phase I environmental site assessment or other environmental studies identified all potential environmental liabilities, or that we will not face significant remediation costs or other environmental contamination that makes it difficult to sell any affected properties. As a result, we could potentially incur material liability for these issues, which could adversely impact our financial condition, results of operations, cash flows and ability to pay distributions, and the market price of our common stock.
Certain environmental laws impose compliance obligations on owners and tenants of real property with respect to the management of hazardous substances and other regulated materials. For example, environmental laws govern the management and removal of asbestos-containing materials and lead-based paint. Failure to comply with these laws can result in penalties or other sanctions. If we incur substantial costs to comply with these environmental laws or we are held liable under these laws, our business, financial condition and results of operations, our ability to make distributions to our stockholders and the market price of our common stock may be adversely affected.
Some of the properties we acquire in the future may be subject to ground lease or other restrictions on the use of the space. If we are required to undertake significant capital expenditures to procure new tenants, then our business and results of operations may suffer.
Properties we acquire in the future may be subject to ground leases that contain certain restrictions. These restrictions could include limits on our ability to re-let these properties to tenants not affiliated with the healthcare provider or other owner that owns the underlying property, rights of purchase and rights of first offer and refusal
26
with respect to sales of the property and limits on the types of medical procedures that may be performed. If we are unable to promptly re-let our properties, if the rates upon such re-letting are significantly lower than expected or if we are required to undertake significant capital expenditures in connection with re-letting, our business, financial condition and results of operations, our ability to make distributions to our stockholders and the market price of our common stock may be adversely affected.
Our assets may be subject to impairment charges.
We will periodically evaluate our real estate investments and other assets for impairment indicators. The judgment regarding the existence of impairment indicators is based upon factors such as market conditions, tenant performance and legal structure. For example, the termination of a lease by a major tenant may lead to an impairment charge. If we determine that an impairment has occurred, we would be required to make an adjustment to the net carrying value of the asset which could have an adverse effect on our results of operations in the period in which the impairment charge is recorded.
Risks Related to our Corporate Structure and the Acquisition of Properties
Conflicts of interest could arise in the future between the interests of our stockholders and the interests of holders of OP units, which may impede business decisions that could benefit our stockholders.
Conflicts of interest could arise in the future as a result of the relationships between us and our affiliates, on the one hand, and our operating partnership or any limited partner thereof, on the other. Our directors and officers have duties to our company under Maryland law in connection with the management of our company. At the same time, we, as the general partner of our operating partnership, have fiduciary duties and obligations to our operating partnership and its limited partners, if any, under Delaware law and our partnership agreement in connection with the management of our operating partnership. Our fiduciary duties and obligations as the general partner of our operating partnership may come into conflict with the duties of our directors and officers to our company. There are currently no limited partners of our operating partnership other than a wholly-owned subsidiary of the Company.
Under Delaware law, a general partner of a Delaware limited partnership has fiduciary duties of loyalty and care to the partnership and its limited partners and must discharge its duties and exercise its rights as general partner consistent with the obligation of good faith and fair dealing. Our partnership agreement provides that, in the event of a conflict between the interests of our operating partnership or any limited partner, on the one hand, and the company or our stockholders, on the other hand, we, as the general partner of our operating partnership, may give priority to the separate interests of the company or our stockholders (including with respect to tax consequences). Further, any action or failure to act on our part or on the part of our directors that gives priority to the interests of the company or our stockholders and does not result in a violation of our partnership agreement does not violate the duty of loyalty or any other duty that we, in our capacity as the general partner of our operating partnership, owe to our operating partnership and its limited partners or violate the obligation of good faith and fair dealing.
Additionally, our partnership agreement provides that we generally will not be liable to our operating partnership or any limited partner for any action or omission taken in our capacity as general partner, for the debts or liabilities of our operating partnership or for the obligations of our operating partnership under the partnership agreement, except for liability for our fraud, willful misconduct or gross negligence, pursuant to any express indemnity we may give to our operating partnership or in connection with a redemption. Our operating partnership must indemnify us, our directors and officers, officers of our operating partnership and our designees from and against any and all claims that relate to the operations of our operating partnership, unless (1) an act or omission of the person was material to the matter giving rise to the action and either was committed in bad faith or was the result of active and deliberate dishonesty, (2) the person actually received an improper personal benefit in violation or breach of the partnership agreement or (3) in the case of a criminal proceeding, the indemnified person had reasonable cause to believe that the act or omission was unlawful. Our operating partnership must also pay or reimburse the reasonable expenses of any such person in advance of a final disposition of the proceeding upon its receipt of a written affirmation of the person’s good faith belief that the standard of conduct necessary for indemnification has been met and a written
27
undertaking to repay any amounts paid or advanced if it is ultimately determined that the person did not meet the standard of conduct for indemnification.
We qualify as an emerging growth company under the JOBS Act and the reduced disclosure requirements applicable to emerging growth companies could make shares of our common stock less attractive to investors.
We qualify as an emerging growth company as defined in the Jumpstart Our Business Startups Act of 2012, or the JOBS Act. The JOBS Act contains provisions that, among other things, relax certain reporting requirements for emerging growth companies, including certain requirements relating to accounting standards and compensation disclosure. For as long as we are an emerging growth company, which may be up to five full fiscal years, we may take advantage of exemptions from various reporting and other requirements that are applicable to other public companies that are not emerging growth companies, including the requirements to:
|
•
|
provide an auditor’s attestation report on management’s assessment of the effectiveness of our system of internal control over financial reporting pursuant to the Sarbanes-Oxley Act of 2002, or the Sarbanes-Oxley Act;
|
|
•
|
comply with any new or revised financial accounting standards applicable to public companies until such standards are also applicable to private companies (we have irrevocably elected not to avail ourselves of this exemption);
|
|
•
|
comply with any new audit rules or requirements adopted by the Public Company Accounting Oversight Board, or the PCAOB, after April 5, 2012 unless the SEC determines otherwise, including requiring mandatory audit firm rotation or a supplement to the auditor’s report in which the auditor would be required to provide additional information about the audit and our financial statements;
|
|
•
|
provide certain disclosure regarding executive compensation required of larger public companies; or
|
|
•
|
hold stockholder advisory votes on executive compensation.
|
We cannot predict if investors will find our common stock less attractive because we will not be subject to the same reporting and other requirements as other public companies. If some investors find our common stock less attractive as a result, there may be a less active trading market for our common stock and the per share market price of our common stock could decline and may be more volatile.
As a result of becoming a public company, after we are no longer an emerging growth company, we will be subject to the requirements of the Sarbanes-Oxley Act and will be obligated to obtain an audit opinion on the effectiveness of internal controls over financial reporting. These internal controls may not be determined to be effective, which may harm investor confidence and, as a result, the trading price of our common stock.
The Sarbanes-Oxley Act will require our auditors to deliver an attestation report on the effectiveness of our internal controls over financial reporting in conjunction with their opinion on our audited financial statements after we are no longer an emerging growth company. Substantial work on our part is required to implement appropriate processes, document the system of internal control over key processes, assess their design, remediate any deficiencies identified and test their operation. This process is expected to be both costly and challenging. We cannot give any assurances that material weaknesses will not be identified in the future in connection with our compliance with the provisions of the Sarbanes-Oxley Act. The existence of any material weakness would preclude a conclusion by management and our independent auditors that we maintained effective internal control over financial reporting. Our management may be required to devote significant time and expense to remediate any material weaknesses that may be discovered and may not be able to remediate any material weakness in a timely manner. The existence of any material weakness in our internal control over financial reporting could also result in errors in our financial statements that could require us to restate our financial statements, cause us to fail to meet our reporting obligations and cause investors to lose confidence in our reported financial information, all of which could lead to a decline in the market price of our common stock.
28
We have incurred additional new costs as a result of recently becoming a public company, and such costs may increase if and when we cease to be an emerging growth company.
As a public company, we now incur significant legal, accounting, insurance and other expenses, including costs associated with public company reporting requirements. The expenses incurred by public companies for reporting and corporate governance purposes have generally been increasing. We expect compliance with these public reporting requirements and associated rules and regulations to increase expenses, particularly after we are no longer an emerging growth company, although we are currently unable to estimate these costs with any degree of certainty. We could be an emerging growth company for up to five years, although circumstances could cause us to lose that status earlier, which could result in our incurring additional costs applicable to public companies that are not emerging growth companies.
We may have assumed unknown liabilities in connection with our acquisitions which could result in unexpected liabilities and expenses.
As part of our acquisitions, we (through our operating partnership) received certain assets or interests in certain assets subject to existing liabilities, some of which may be unknown to us. Unknown liabilities might include liabilities for cleanup or remediation of undisclosed environmental conditions, claims of tenants, vendors or other persons dealing with the entities prior to this report (including those that had not been asserted or threatened prior to this report), tax liabilities, and accrued but unpaid liabilities incurred in the ordinary course of business. Our recourse with respect to such liabilities may be limited. Depending upon the amount or nature of such liabilities, our business, financial condition and results of operations, our ability to make distributions to our shareholders and the market price of our shares may be adversely affected.
Required payments of principal and interest on our credit facility may leave us with insufficient cash to operate our properties or to pay the distributions currently contemplated or necessary to qualify as a REIT and may expose us to the risk of default under our debt obligations.
As of December 31, 2016, we had
$51.0 million
in debt outstanding under our credit facility. We do not anticipate that our internally generated cash flow will be adequate to repay our anticipated indebtedness upon maturity and, therefore, we expect to repay indebtedness through refinancings and future offerings of equity and debt securities, either of which we may be unable to secure on favorable terms or at all. Our level of debt and any limitations imposed upon us by our debt agreements could have adverse consequences, including the following:
|
•
|
our cash flow may be insufficient to meet required principal and interest payments;
|
|
•
|
we may be unable to borrow additional funds as needed or on favorable terms, including to make acquisitions;
|
|
•
|
we may be unable to refinance indebtedness at maturity or the refinancing terms may be less favorable than the terms of the original indebtedness;
|
|
•
|
because a portion of our debt bears interest at variable rates, an increase in interest rates could materially increase our interest expense;
|
|
•
|
we may fail to effectively hedge against interest rate volatility;
|
|
•
|
we may be forced to dispose of properties, possibly on disadvantageous terms if we are able to do so at all, in order to repay indebtedness;
|
|
•
|
after debt service, the amount available for distributions to our stockholders may be reduced;
|
29
|
•
|
we may default on our debt obligations, which could restrict our ability to make any distributions to our stockholders;
|
|
•
|
our ability to make distributions to our stockholders could be restricted by our debt agreements;
|
|
•
|
our leverage could place us at a competitive disadvantage compared to our competitors who have less debt;
|
|
•
|
we may experience increased vulnerability to economic and industry downturns, reducing our ability to respond to changing business and economic conditions;
|
|
•
|
we may default on our obligations and the lenders may foreclose on properties that secure their loans and receive an assignment of rents and leases;
|
|
•
|
we may violate financial covenants, which would cause a default on our obligations and result in the acceleration of our payment obligations;
|
|
•
|
we may inadvertently violate non-financial restrictive covenants in our loan documents, such as covenants that require us to maintain the existence of entities, maintain insurance policies and provide financial statements, which would entitle the lenders to accelerate our debt obligations; and
|
|
•
|
our default under any loan with cross-default or cross-collateralization provisions could result in default on other indebtedness or result in the foreclosures of other properties.
|
The realization of any or all of these risks may have an adverse effect on our business, financial condition and results of operations, our ability to make distributions to our stockholders and the market price of our common stock.
We could become highly leveraged in the future because our organizational documents contain no limitations on the amount of debt that we may incur.
As of December 31, 2016, our indebtedness represented approximately
20.3%
of our total assets. Our current financing policy prohibits incurring debt (secured or unsecured) in excess of 40% of our total book capitalization. However, this debt limitation policy can be changed by our board of directors without stockholder approval and there are no provisions in our bylaws that limit our ability to incur indebtedness. We could alter the balance between our total outstanding indebtedness and the value of our properties at any time. If we become more highly leveraged, the resulting increase in outstanding debt could adversely affect our ability to make debt service payments, to pay our anticipated distributions and to make the distributions required to qualify as a REIT. The occurrence of any of the foregoing risks could adversely affect our business, financial condition and results of operations, our ability to make distributions to our stockholders and the market price of our common stock.
Increases in interest rates may increase our interest expense and adversely affect our cash flows and our ability to service our indebtedness and to make distributions to our shareholders.
As of December 31, 2016, we had
$51.0 million
of variable-rate indebtedness outstanding that has not been swapped for a fixed interest rate and we expect that more of our indebtedness in the future, including borrowings under our credit facility since December 31, 2016 and thereafter, will be subject to variable interest rates. Increases in interest rates on any variable rate indebtedness will increase our interest expense, which could adversely affect our cash flow and our ability to pay distributions.
Failure to hedge effectively against interest rate changes may adversely affect our results of operations.
In certain cases, we may seek to manage our exposure to interest rate volatility by using interest rate hedging arrangements. Hedging involves risks, such as the risk that the counterparty may fail to honor its obligations under
30
an arrangement, that the arrangements may not be effective in reducing our exposure to interest rate changes and that a court could rule that such an agreement is not legally enforceable. In addition, we may be limited in the type and amount of hedging transactions that we may use in the future by our need to satisfy the REIT income tests under the Code. Failure to hedge effectively against interest rate changes may have an adverse effect on our business, financial condition, results of operations, our ability to make distributions to our shareholders and the market price of our common shares.
Our use of OP units in our operating partnership as currency to acquire properties could result in stockholder dilution and/or limit our ability to sell such properties, which could have a material adverse effect on us.
In the future, we may acquire properties or portfolios of properties through tax deferred contribution transactions in exchange for OP units in our operating partnership, which may result in stockholder dilution. This acquisition structure may have the effect of, among other things, reducing the amount of tax depreciation we could deduct over the tax life of the acquired properties, and may require that we agree to protect the contributors’ ability to defer recognition of taxable gain through restrictions on our ability to dispose of the acquired properties or the allocation of partnership debt to the contributors to maintain their tax bases. These restrictions could limit our ability to sell properties at a time, or on terms, that would be favorable absent such restrictions.
Our charter restricts the ownership and transfer of our outstanding shares which may have the effect of delaying, deferring or preventing a transaction or change of control of our Company.
In order for us to maintain our status as a REIT, no more than 50% of the value of our outstanding shares may be owned, beneficially or constructively, by five or fewer individuals at any time during the last half of each taxable year other than our initial REIT taxable year. Subject to certain exceptions, our charter prohibits any stockholder from beneficially or constructively owning more than 9.8% of the outstanding shares of our capital stock, in value or number of shares, whichever is more restrictive. The constructive ownership rules under the Code are complex and may cause the outstanding shares owned by a group of related individuals or entities to be deemed to be constructively owned by one individual or entity. As a result, the acquisition of less than 9.8% of our outstanding shares or of our common stock by an individual or entity could cause that individual or entity to own constructively more than 9.8% of the outstanding shares of such stock and to be subject to our charter’s ownership limit. Our charter also prohibits, among other prohibitions, any person from owning our shares that would result in our being “closely held” under Section 856(h) of the Code or otherwise cause us to fail to qualify as a REIT. Any attempt to own or transfer shares in violation of these restrictions may result in the shares being automatically transferred to a charitable trust or may be void.
Certain provisions of Maryland law could inhibit changes of control, which may discourage third parties from conducting a tender offer or seeking other change of control transactions that could involve a premium price for our common stock or that our stockholders otherwise believe to be in their best interests.
Certain provisions of the Maryland General Corporation Law, or MGCL, applicable to Maryland corporations may have the effect of inhibiting a third party from making a proposal to acquire us or of impeding a change of control under circumstances that otherwise could provide our common stockholders with the opportunity to realize a premium over the then-prevailing market price of our shares, including:
|
•
|
“business combination” provisions that, subject to limitations, prohibit certain business combinations between us and an “interested stockholder” (defined generally as any person who beneficially owns 10% or more of the voting power of our shares or an affiliate or associate of ours who was the beneficial owner, directly or indirectly, of 10% or more of the voting power of our shares at any time within the two-year period immediately prior to the date in question) or an affiliate thereof for five years after the most recent date on which the stockholder becomes an interested stockholder, and thereafter imposes certain minimum price and/or supermajority stockholder voting requirements on these combinations; and
|
31
|
•
|
“control share” provisions that provide that holders of “control shares” of our company (defined as shares that, when aggregated with all other shares controlled by the stockholder, entitle the stockholder to exercise one of three increasing ranges of voting power in electing directors) acquired in a “control share acquisition” (defined as the direct or indirect acquisition of ownership or control of issued and outstanding “control shares,” subject to certain exceptions) have no voting rights with respect to their control shares, except to the extent approved by our stockholders by the affirmative vote of at least two-thirds of all the votes entitled to be cast on the matter, excluding all interested shares.
|
Our bylaws, however, contain provisions exempting us from the business combination and control share acquisition provisions of the MGCL and we will not be permitted to opt into either of these provisions in the future without the affirmative vote of a majority of the votes cast on the matter by stockholders entitled to vote. Our board of directors may not amend or eliminate either of these provisions at any time in the future without the affirmative vote of a majority of the votes cast on the matter by stockholders entitled to vote.
Certain provisions of the MGCL permit our board of directors, without stockholder approval and regardless of what is currently provided in our charter or bylaws, to implement certain corporate governance provisions, some of which are not currently applicable to us. If implemented, these provisions may have the effect of limiting or precluding a third party from making an unsolicited acquisition proposal for us or of delaying, deferring or preventing a change in control of us under circumstances that otherwise could provide our common stockholders with the opportunity to realize a premium over the then current market price. Our charter contains a provision whereby the Company has elected to not be subject to the provisions of Title 3, Subtitle 8 of the MGCL without the affirmative consent of the shares cast on the matter by stockholders entitled to vote.
We could increase the number of authorized shares, classify and reclassify unissued shares and issue shares without stockholder approval.
Our board of directors, without stockholder approval, has the power under our charter to amend our charter to increase or decrease the aggregate number of shares or the number of shares of any class or series that we are authorized to issue, and to authorize us to issue authorized but unissued common stock or preferred stock. In addition, under our charter, our board of directors has the power to classify or reclassify any unissued common or preferred shares into one or more classes or series of shares and set or change the preference, conversion or other rights, voting powers, restrictions, limitations as to dividends and other distributions, qualifications or terms or conditions of redemption for such newly classified or reclassified shares. As a result, we may issue series or classes of common stock or preferred stock with preferences, dividends, powers and rights, voting or otherwise, that are senior to, or otherwise conflict with, the rights of holders of our common stock. Although our board of directors has no such intention at the present time, it could establish a class or series of preferred shares that could, depending on the terms of such class or series, delay, defer or prevent a transaction or a change of control that might involve a premium price for our common stock or that our stockholders otherwise believe to be in their best interests.
Certain provisions in the partnership agreement of our operating partnership may delay or prevent unsolicited acquisitions of us.
Provisions of the partnership agreement of our operating partnership may delay or make more difficult unsolicited acquisitions of us or changes of our control. These provisions could discourage third parties from making proposals involving an unsolicited acquisition of us or change of our control, although some stockholders or limited partners might consider such proposals, if made, desirable. These provisions include, among others:
|
•
|
redemption rights of qualifying parties;
|
|
•
|
a requirement that we may not be removed as the general partner of our operating partnership without our consent;
|
|
•
|
transfer restrictions on OP units; and
|
32
|
•
|
our ability, as general partner, in some cases, to amend the partnership agreement and to cause our operating partnership to issue additional partnership interests with terms that could delay, defer or prevent a merger or other change of control of us or our operating partnership without the consent of our stockholders or the limited partners.
|
Our charter and bylaws, the partnership agreement of our operating partnership and Maryland law also contain other provisions that may delay, defer or prevent a transaction or a change of control that might involve a premium price for our common stock or that our stockholders otherwise believe to be in their best interest.
We may change our business, investment and financing strategies without stockholder approval.
We may change our business, investment and financing strategies without a vote of, or notice to, our stockholders, which could result in our making investments and engaging in business activities that are different from, and possibly riskier than, the investments and businesses described in this report. In particular, a change in our investment strategy, including the manner in which we allocate our resources across our portfolio or the types of assets in which we seek to invest, may increase our exposure to real estate market fluctuations. In addition, we may in the future increase the use of leverage at times and in amounts that we, in our discretion, deem prudent and such decision would not be subject to stockholder approval. Furthermore, our board of directors may determine that healthcare properties do not offer the potential for attractive risk-adjusted returns for an investment strategy. Changes to our strategies with regards to the foregoing could adversely affect our financial condition, results of operations and our ability to make distributions to our stockholders.
Our rights and the rights of our stockholders to take action against our directors and officers are limited, which could limit your recourse in the event that we take certain actions which are not in your best interests.
Our charter eliminates the liability of our directors and officers to us and our stockholders for money damages, except for liability resulting from:
|
•
|
actual receipt of an improper benefit or profit in money, property or services; or
|
|
•
|
active and deliberate dishonesty by the director or officer that was established by a final judgment as being material to the cause of action adjudicated.
|
Our charter authorizes us to indemnify our present and former directors and officers for actions taken by them in those and other capacities to the maximum extent permitted by Maryland present and former law. Our bylaws obligate us to indemnify each present and former director or officer, to the maximum extent permitted by Maryland law, in the defense of any proceeding to which he or she is made, or threatened to be made, a party by reason of his or her service to us. In addition, we may be obligated to advance the defense costs incurred by our director and officers. We have entered into indemnification agreements with our officers and intend to enter into indemnification agreements with our directors, granting them express indemnification rights. As a result, we and our stockholders may have more limited rights against our directors and officers than might otherwise exist absent the current provisions in our charter, bylaws and indemnification agreements or that might exist with other companies.
Our charter contains provisions that make removal of our directors difficult, which could make it difficult for our stockholders to effect changes to our management and may prevent a change in control of our company that is in the best interests of our stockholders. Our charter provides that a director may only be removed for cause upon the affirmative vote of holders of two-thirds of all the votes entitled to be cast generally in the election of directors. Vacancies may be filled only by a majority of the remaining directors in office, even if less than a quorum. These requirements make it more difficult to change our management by removing and replacing directors and may prevent a change in control of our company that is in the best interests of our stockholders.
33
We are a holding company with no direct operations and, as such, we will rely on funds received from our operating partnership to pay liabilities, and the interests of our stockholders will be structurally subordinated to all liabilities and obligations of our operating partnership and its subsidiaries.
We are a holding company and conduct substantially all of our operations through our operating partnership. We do not have, apart from an interest in our operating partnership, any independent operations. As a result, we will rely on distributions from our operating partnership to pay any dividends we might declare on shares of our common stock. We will also rely on distributions from our operating partnership to meet any of our obligations, including any tax liability on taxable income allocated to us from our operating partnership. In addition, because we are a holding company, your claims as stockholders will be structurally subordinated to all existing and future liabilities and obligations (whether or not for borrowed money) of our operating partnership and its subsidiaries. Therefore, in the event of our bankruptcy, liquidation or reorganization, our assets and those of our operating partnership and its subsidiaries will be available to satisfy the claims of our stockholders only after all of our and our operating partnership’s and its subsidiaries’ liabilities and obligations have been paid in full.
Our operating partnership may issue additional OP units to third parties without the consent of our stockholders, which would reduce our ownership percentage in our operating partnership and would have a dilutive effect on the amount of distributions made to us by our operating partnership and, therefore, the amount of distributions we can make to our stockholders.
We own 100% of the outstanding OP units and we may, in connection with our acquisition of properties or otherwise, cause our operating partnership to issue additional OP units to third parties. Such issuances would reduce our ownership percentage in our operating partnership and affect the amount of distributions made to us by our operating partnership and, therefore, the amount of distributions we can make to our stockholders. Because you will not directly own OP units, you will not have any voting rights with respect to any such issuances or other partnership level activities of our operating partnership.
Risks Related to Our Qualification and Operation as a REIT
Failure to remain qualified as a REIT, would cause us to be taxed as a regular corporation, which would adversely affect the value of our shares and substantially reduce funds available for distributions to our stockholders.
Our organization and proposed method of operation have enabled us to meet the requirements for qualification and taxation as a REIT commencing with our taxable year ended December 31, 2015. However, we cannot assure you that we will remain qualified as a REIT. Qualification as a REIT involves the application of highly technical and complex Code provisions for which there are only limited judicial and administrative interpretations. The complexity of these provisions and of the applicable Treasury regulations that have been promulgated under the Code, or the Treasury Regulations, is greater in the case of a REIT that, like us, holds its assets through a partnership. The determination of various factual matters and circumstances not entirely within our control may affect our ability to qualify as a REIT. In order to qualify as a REIT, we must satisfy a number of requirements, including requirements regarding the ownership of our stock, the composition of our assets and the composition of our income. In addition, we must distribute to stockholders annually at least 90% of our REIT taxable income, determined without regard to the dividends paid deduction and excluding net capital gains. Legislation, new Treasury Regulations, administrative interpretations or court decisions may materially and adversely affect our ability to qualify as a REIT for U.S. federal income tax purposes.
If we fail to qualify as a REIT in any taxable year, we will face serious tax consequences that will substantially reduce the funds available for distribution to our stockholders because:
|
•
|
we would not be allowed a deduction for dividends paid to stockholders in computing our taxable income and would be subject to U.S. federal income tax at regular corporate rates;
|
34
|
•
|
we could be subject to the federal alternative minimum tax and possibly increased state and local taxes; and
|
|
•
|
unless we are entitled to relief under certain U.S. federal income tax laws, we could not re-elect REIT status until the fifth calendar year after the year in which we failed to qualify as a REIT.
|
In addition, if we fail to qualify as a REIT, we will no longer be required to make distributions. As a result of all these factors, our failure to qualify as a REIT could impair our ability to expand our business and raise capital, and it would adversely affect the market price of our common shares.
If our operating partnership failed to qualify as a “partnership” for U.S. federal income tax purposes, we would cease to qualify as a REIT and suffer other adverse consequences.
We believe that our operating partnership should be treated either as an entity disregarded from us or, after the admission of additional partners, if any, as a “partnership” for U.S. federal income tax purposes. As a disregarded entity or a partnership, our operating partnership will not be subject to U.S. federal income tax on its income. Instead, each of its partners will be allocated, and may be required to pay tax with respect to, its share of our operating partnership’s income. We cannot assure you that the IRS will not challenge the status of our operating partnership, or that a court would not sustain such a challenge. If the Internal Revenue Service, or IRS, were successful in treating our operating partnership as an entity taxable as a corporation, it would be liable for U.S. federal and state corporate income taxes on its taxable income and we would fail to meet the gross income tests and certain of the asset tests applicable to REITs under the Code and cease to qualify as a REIT.
We may face other tax liabilities that reduce our cash flows.
We may be subject to certain federal, state and local taxes on our income and assets, including taxes on any undistributed income, tax on income from some activities conducted as a result of a foreclosure, taxes on income from certain “prohibited transactions” and state or local income, property and transfer taxes. In addition, any TRS that we may form or in which we may invest will be subject to regular corporate federal, state and local taxes. Any of these taxes would decrease cash available for distributions to our stockholders.
To maintain our status as a REIT and avoid the payment of U.S. federal income and excise taxes, we may be forced to borrow funds, use proceeds from the issuance of securities, pay taxable dividends of our stock or debt securities or sell assets to make distributions, in each case during unfavorable market conditions and which may result in our distributing amounts that would otherwise be used for our operations.
To maintain our status as a REIT, we generally must distribute to our stockholders at least 90% of our REIT taxable income each year, determined without regard to the dividends paid deduction and excluding net capital gains, and we will be subject to regular corporate income taxes to the extent that we distribute less than 100% of our REIT taxable income (determined without regard to the deduction for dividends paid) each year. In addition, we will be subject to a 4% nondeductible excise tax on the amount, if any, by which distributions paid by us in any calendar year are less than the sum of 85% of our ordinary income, 95% of our capital gain net income and 100% of our undistributed income from prior years. These requirements could cause us to distribute amounts that otherwise would be spent on operations, the acquisitions of properties and the service of our debt. It is possible that we could be required to borrow funds, use proceeds from the issuance of securities, pay taxable dividends of our stock or debt securities or sell assets in order to distribute enough of our taxable income to qualify or maintain our qualification as a REIT and to avoid the payment of U.S. federal income and excise taxes. We cannot assure you that a sufficient amount of capital will be available to us on favorable terms, or at all, when needed for the foregoing purposes, which would materially and adversely affect our financial condition, results of operations, cash flows and ability to pay distributions, and the market price of our common stock.
35
Complying with the REIT requirements may cause us to forego otherwise attractive opportunities or liquidate otherwise attractive investments.
To maintain our status as a REIT for U.S. federal income tax purposes, we must continually satisfy tests concerning, among other things, the sources of our income, the nature and diversification of our assets, the amounts we distribute to our stockholders and the ownership of our shares. In order to meet these tests, we may be required to forego investments we might otherwise make or liquidate otherwise attractive investments. Thus, compliance with the REIT requirements may reduce our income and amounts available for distribution to our stockholders and otherwise hinder our performance.
The “prohibited transactions” tax may limit our ability to dispose of our properties.
A REIT’s net gain or income from “prohibited transactions” is subject to a 100% penalty tax. In general, prohibited transactions are sales or other dispositions of property, other than foreclosure property, held primarily for sale to customers in the ordinary course of business. Although a safe harbor regarding the characterization of the sale of real property by a REIT as a prohibited transaction is available, we cannot assure you that we will be able to comply with the safe harbor with respect to any sale of our properties or that we will avoid owning property that may be characterized as held primarily for sale to customers in the ordinary course of business. Consequently, we may choose not to engage in an otherwise attractive sale of property or may conduct such a sale through a TRS, which would subject such sale to federal and state income taxation.
Any ownership of a TRS will be subject to limitations, and our transactions with a TRS cause us to be subject to a 100% penalty tax on certain income or deductions if those transactions are not conducted on arm’s-length terms.
We have formed one TRS, and in the future, may form other TRSs for various reasons, including for the purpose of leasing “qualified healthcare properties” from us pursuant to the provisions of REIT Investment Diversification and Empowerment Act of 2007, or RIDEA. Overall, no more than 25% of the value of a REIT’s assets may consist of stock or securities of one or more TRSs. In addition, the Code limits the deductibility of interest paid or accrued by a TRS to its parent REIT to assure that the TRS is subject to an appropriate level of corporate taxation. The Code also imposes a 100% excise tax on certain transactions between a TRS and its parent REIT that are not conducted on an arm’s-length basis. We will monitor the value of our respective investments in our TRSs for the purpose of ensuring compliance with the TRS ownership limitation and will structure any future transactions with any TRS on terms that we believe are arm’s length to avoid incurring the 100% excise tax described above. However, there can be no assurance that we will be able to comply with such TRS ownership limitation or to avoid application of the 100% excise tax.
TRSs will increase our overall tax liability.
Our one TRS, and any TRSs that we may form in the future, including a TRS formed to lease “qualified healthcare properties” from us under the provisions of RIDEA, will be subject to federal and state income tax on its taxable income. Accordingly, although our ownership of a TRS may allow us to participate in income we otherwise could not receive directly as a REIT, such income would be fully subject to federal and state income tax.
If a TRS tenant failed to qualify as a TRS, or the operator of a facility engaged by a TRS tenant did not qualify as an “eligible independent contractor,” we could fail to qualify as a REIT and could be subject to higher taxes and have less cash available for distribution to our stockholders.
We may, in the future, lease certain of our properties that qualify as “qualified healthcare properties” to a TRS tenant, although we have no present intention to do so. Rent paid by a tenant that is a “related party tenant” of ours will not be qualifying income for purposes of the two gross income tests applicable to REITs. However, so long as any TRS tenant of ours qualifies as a TRS, it will not be treated as a “related party tenant” with respect to our healthcare properties that are managed by “eligible independent contractors.” We would seek to structure any future arrangements with a TRS tenant such that the TRS tenant would qualify to be treated as a TRS for U.S. federal income tax purposes, but there can be no assurance that the IRS would not challenge the status of a TRS or that a
36
court would not sustain such a challenge. If the IRS were successful in disqualifying a TRS tenant from treatment as a TRS, it is possible that we would fail to meet the asset tests applicable to REITs and a significant portion of our income would fail to qualify for the gross income tests. If we failed to meet either the asset or gross income tests, we would likely lose our REIT qualification for federal income tax purposes.
Additionally, if the operator of a facility engaged by a TRS tenant does not qualify as an “eligible independent contractor,” we could fail to qualify as a REIT. Any operator of a healthcare facility leased to a TRS tenant must qualify as an “eligible independent contractor” under the REIT rules in order for the rent paid to us by such TRS tenant to be qualifying income for purposes of the REIT gross income tests. Among other requirements, in order to qualify as an eligible independent contractor a facility operator must not own, directly or indirectly, more than 35% of our outstanding shares and no person or group of persons can own more than 35% of our outstanding shares and the ownership interests of the facility operator, taking into account certain ownership attribution rules. The ownership attribution rules that apply for purposes of these 35% thresholds are complex. Although we would monitor ownership of our shares by any facility operators and their owners, there can be no assurance that these ownership levels will not be exceeded.
If leases of our properties are not respected as true leases for U.S. federal income tax purposes, we would fail to qualify as a REIT and would be subject to higher taxes and have less cash available for distribution to our stockholders.
Rents paid to us by third-party tenants and any TRS tenant that we may form in the future pursuant to the leases of our properties will constitute substantially all of our gross income. In order for such rent to qualify as “rents from real property” for purposes of the gross income tests applicable to REITs, the leases must be respected as true leases for U.S. federal income tax purposes and not be treated as service contracts, joint ventures or some other type of arrangement. If our leases are not respected as true leases for U.S. federal income tax purposes, we would fail to qualify as a REIT.
You may be restricted from acquiring or transferring certain amounts of our common stock.
The share ownership restrictions of the Code for REITs and the 9.8% share ownership limit and other restrictions on ownership and transfer of our shares contained in our charter may inhibit market activity in our shares and restrict our business combination opportunities.
In order to maintain our status as a REIT each taxable year, five or fewer individuals, as defined in the Code, may not own, beneficially or constructively, more than 50% in value of our issued and outstanding shares at any time during the last half of each taxable year. Attribution rules in the Code determine if any individual or entity beneficially or constructively owns our shares under this requirement. Additionally, at least 100 persons must beneficially own our shares during at least 335 days of a taxable year for each taxable year. To help insure that we meet these tests, our charter restricts the acquisition and ownership of shares.
Our charter, with certain exceptions, authorizes our directors to take such actions as are necessary and desirable to preserve our qualification as a REIT. Unless exempted by our board of directors, our charter prohibits any person from beneficially or constructively owning more than 9.8% in value of the outstanding shares of our capital stock or 9.8%, in value or number of shares, whichever is more restrictive, of the outstanding shares of our common stock. Our board of directors may not grant an exemption from these restrictions to any proposed transferee whose ownership in excess of such limits would result in our failing to qualify as a REIT. This, as well as other restrictions on transferability and ownership, will not apply if our board of directors determines that it is no longer in our best interests to continue to qualify as a REIT.
Dividends payable by REITs do not qualify for the reduced tax rates available for some dividends.
The maximum tax rate applicable to “qualified dividend income” payable to U.S. stockholders that are taxed at individual rates is 20%. Dividends payable by REITs, however, generally are not eligible for the reduced rates on qualified dividend income. The more favorable rates applicable to regular corporate qualified dividends could cause
37
investors who are taxed at individual rates to perceive investments in REITs to be relatively less attractive than investments in the stocks of non-REIT corporations that pay dividends, which could adversely affect the value of the shares of REITs, including our common stock.
Distributions to tax-exempt stockholders may be classified as unrelated business tax income.
In general, neither ordinary nor capital gain distributions with respect to our common stock, nor gain from the sale of our common stock, should constitute unrelated business tax income, or UBTI, to a tax-exempt stockholder. However, under certain limited circumstances, income and gain recognized by certain tax-exempt stockholders could be treated, in whole or in part, as UBTI.
Non-U.S. stockholders may be subject to FIRPTA taxation upon the sale of their shares of our common stock.
Subject to the exceptions described herein, a non-U.S. person generally is subject to U.S. federal income tax on gain recognized on a disposition of our stock under the Foreign Investment in Real Property Tax Act, or FIRPTA. However, such FIRPTA tax will not apply if we are “domestically controlled,” meaning less than 50% of our stock, by value, has been owned directly or indirectly by non-U.S. persons during a specified look-back period. In addition, even if we were not domestically controlled, such tax would not apply to such non-U.S. stockholder if our common stock was traded on an established securities market and such stockholder did not, at any time during the five-year period prior to a sale of our common stock, directly or indirectly own more than 5% of the value of our outstanding common stock. We cannot assure you that we will qualify as a “domestically controlled” REIT, although we expect our stock will be regularly traded on an established securities market.
Our capital gain distributions to non-U.S. stockholders attributable to our sales of U.S. real property interests may be subject to tax under FIRPTA.
A non-U.S. stockholder generally is subject to U.S. income tax on our capital gain distributions attributable to our sales of U.S. real property interests under FIRPTA. However, if our common stock is regularly traded on an established securities market, such distributions will not be subject to such tax if such stockholder did not, at any time during the one-year period preceding the distribution, directly or indirectly own more than 5% of the value of our outstanding common stock. While we expect our stock will be regularly traded on an established securities market, if it is not so traded, or if we are unable to determine the level of ownership of a particular non-U.S. stockholder, we may be required to withhold 35% of any distribution to such stockholder that we designate as a capital gain dividend.
We may be subject to adverse legislative or regulatory tax changes that could reduce the market price of our common stock.
At any time, the U.S. federal income tax laws governing REITs or the administrative interpretations of those laws may be amended. We cannot predict when or if any new U.S. federal income tax law, regulation or administrative interpretation, or any amendment to any existing U.S. federal income tax law, regulation or administrative interpretation, will be adopted, promulgated or become effective and any such law, regulation, or interpretation may take effect retroactively. We and our stockholders could be adversely affected by any such change in the U.S. federal income tax laws, regulations or administrative interpretations.
Risks Related to our Common Stock
The market price and trading volume of our common stock may be volatile.
Our common stock is listed on the New York Stock Exchange. As an active trading market continues to develop for our common stock, the market price of our common stock may be volatile. In addition, the trading volume in our common stock may fluctuate and cause significant price variations to occur, and investors in our common stock may from time to time experience a decrease in the value of their shares, including decreases unrelated to our operating performance or prospects. If the market price of our common stock declines significantly, you may be unable to
38
resell your shares at or above the price at which you purchased such shares. We cannot assure you that the market price of our common stock will not fluctuate or decline significantly in the future.
Some of the factors that could negatively affect our share price or result in fluctuations in the price or trading volume of our common stock include:
|
•
|
actual or anticipated variations in our quarterly operating results or dividends;
|
|
•
|
changes in our FFO or earnings estimates;
|
|
•
|
publication of research reports about us or the real estate industry;
|
|
•
|
increases in market interest rates that lead purchasers of our shares to demand a higher yield;
|
|
•
|
changes in market valuations of similar companies;
|
|
•
|
adverse market reaction to any additional debt we incur in the future;
|
|
•
|
additions or departures of key management personnel;
|
|
•
|
actions by institutional stockholders;
|
|
•
|
speculation in the press or investment community;
|
|
•
|
the realization of any of the other risk factors presented in this report;
|
|
•
|
the extent of investor interest in our securities;
|
|
•
|
the general reputation of REITs and the attractiveness of our equity securities in comparison to other equity securities, including securities issued by other real estate-based companies;
|
|
•
|
our underlying asset value;
|
|
•
|
investor confidence in the stock and bond markets generally;
|
|
•
|
changes in tax laws;
|
|
•
|
future equity issuances;
|
|
•
|
failure to meet earnings estimates;
|
|
•
|
failure to meet and maintain REIT qualification;
|
|
•
|
changes in our credit ratings; and
|
|
•
|
general market and economic conditions.
|
In the past, securities class-action litigation has often been instituted against companies following periods of volatility in the price of their common stock. This type of litigation could result in substantial costs and divert our management’s attention and resources, which could have a material adverse effect on us, including our financial condition, results of operations, cash flow and the market price of our common stock.
39
Increases in market interest rates may have an adverse effect on the market price of our common stock as prospective purchasers of our common stock may expect a higher dividend yield and as an increased cost of borrowing may decrease our funds available for distribution.
One of the factors that will influence the market price of our common stock will be the dividend yield on the common stock (as a percentage of the price of our common stock) relative to market interest rates. An increase in market interest rates, which are currently at low levels relative to historical rates, may lead prospective purchasers of our common stock to expect a higher dividend yield (with a resulting decline in the trading prices of our common stock) and higher interest rates would likely increase our borrowing costs and potentially decrease funds available for distribution. Thus, higher market interest rates could cause the market price of our common stock to decrease.
Our issuance of equity securities or the perception that such issuances might occur could materially adversely affect us, including the per share trading price of our common stock.
The vesting of any restricted shares granted to certain directors, executive officers and other employees under our 2014 Incentive Plan, the issuance of our common stock or OP Units in connection with future property, portfolio or business acquisitions and other issuances of our common stock could have an adverse effect on the market price of our common stock, and the existence of our common stock issuable under our 2014 Incentive Plan may adversely affect the terms upon which we may be able to obtain additional capital through the sale of equity securities. In addition, future issuances of our common stock may be dilutive to existing stockholders.
If securities analysts do not publish research or reports about our industry or if they downgrade our common stock or the healthcare-related real estate sector, the price of our common stock could decline.
The trading market for our common stock relies in part upon the research and reports that industry or financial analysts publish about us or our industry. We have no control over these analysts. Furthermore, if one or more of the analysts who do cover us downgrades our shares or our industry, or the stock of any of our competitors, the market price of our common stock could decline. If one or more of these analysts ceases coverage of our company, we could lose attention in the market which in turn could cause the market price of our common stock to decline.
Future sales of shares of our common stock, particularly by our executive officers or directors, may cause the per share trading price of our common stock to decline.
Any sales of a substantial number of shares of our common stock, or the perception that those sales might occur, may cause the market price of the common stock to decline. After the expiration of any applicable transfer restrictions imposed by our 2014 Incentive Plan, stock purchase agreements or lockup agreements with us, our executive officers and directors will have the ability to sell all of any portion of the applicable common stock which could cause the market price of our common stock to decline.
None.
40
See Note 2 to the Consolidated Financial Statements in Item 8 "Financial Statements and Supplementary Data" for a table that summarizes our portfolio as of
December 31, 2016
.
Scheduled Lease Expirations
As of
December 31, 2016
, the weighted average remaining years to maturity pursuant to the leases with our tenants was approximately
7.2
years, with expirations through
2031
. The table below details scheduled lease expirations, as of
December 31, 2016
, for our properties for the periods indicated.
Lease Expiration Schedule
|
Total Leased Square Footage
|
Annualized Lease Revenue
|
||||||||||
|
Year
|
Number of Leases Expiring
|
Amount
|
Percent (%)
|
Amount
(in thousands)
|
Percent (%)
|
||||||
|
2017
|
27
|
|
132,432
|
|
11.0
|
%
|
$
|
3,447
|
|
13.7
|
%
|
|
2018
|
30
|
|
158,770
|
|
13.2
|
%
|
3,308
|
|
13.2
|
%
|
|
|
2019
|
29
|
|
131,802
|
|
11.0
|
%
|
3,120
|
|
12.4
|
%
|
|
|
2020
|
20
|
|
157,488
|
|
13.1
|
%
|
2,679
|
|
10.7
|
%
|
|
|
2021
|
9
|
|
75,973
|
|
6.3
|
%
|
1,706
|
|
6.8
|
%
|
|
|
2022
|
13
|
|
88,439
|
|
7.4
|
%
|
1,650
|
|
6.6
|
%
|
|
|
2023
|
12
|
|
68,055
|
|
5.7
|
%
|
1,393
|
|
5.6
|
%
|
|
|
2024
|
2
|
|
12,513
|
|
1.1
|
%
|
370
|
|
1.5
|
%
|
|
|
2025
|
6
|
|
29,234
|
|
2.4
|
%
|
689
|
|
2.7
|
%
|
|
|
2026
|
2
|
|
33,966
|
|
2.8
|
%
|
579
|
|
2.3
|
%
|
|
|
Thereafter
|
16
|
|
301,186
|
|
25.1
|
%
|
5,911
|
|
23.6
|
%
|
|
|
Month-to-Month
|
4
|
|
10,175
|
|
0.9
|
%
|
229
|
|
0.9
|
%
|
|
|
Totals
|
170
|
|
1,200,033
|
|
100.0
|
%
|
$
|
25,081
|
|
100.0
|
%
|
The Company may, from time to time, be involved in litigation arising in the ordinary course of business or which may be expected to be covered by insurance. The Company is not aware of any pending or threatened litigation that, if resolved against the Company, would have a material adverse effect on the Company’s consolidated financial position, results of operations or cash flows.
None.
41
Shares of the Company's common stock are traded on the New York Stock Exchange under the symbol "CHCT." At
February 17, 2017
, there were
18
stockholders of record. The following table sets forth the high and low sales prices per share of common stock and the dividends declared and paid per share of common stock related to the year ended
December 31, 2016
and for the period May 21, 2015 (first day of trading) through December 31, 2015.
|
High
|
Low
|
Dividends Declared and Paid per Share
|
|||||||
|
2016
|
|||||||||
|
First quarter
|
$
|
19.39
|
|
$
|
15.87
|
|
$
|
0.3800
|
|
|
Second quarter
|
$
|
21.39
|
|
$
|
17.70
|
|
$
|
0.3825
|
|
|
Third quarter
|
$
|
23.71
|
|
$
|
20.55
|
|
$
|
0.3850
|
|
|
Fourth quarter (1)
|
$
|
23.69
|
|
$
|
19.61
|
|
$
|
0.3875
|
|
|
2015
|
|||||||||
|
Second quarter (2)
|
$
|
20.49
|
|
$
|
18.31
|
|
$
|
0.1420
|
|
|
Third quarter
|
$
|
19.30
|
|
$
|
15.61
|
|
$
|
0.3750
|
|
|
Fourth quarter
|
$
|
19.30
|
|
$
|
15.83
|
|
$
|
0.3775
|
|
|
_________
|
|||||||||
|
(1) Our fourth quarter dividend is payable on March 3, 2017 to shareholders of record on February 17, 2017.
|
|||||||||
|
(2) Our shares began trading on May 21, 2015, and we completed our initial public offering of shares of our common stock on May 27, 2015.
|
|||||||||
Future dividends will be declared and paid at the discretion of the Board of Directors. The Company’s ability to pay dividends is dependent upon its ability to generate funds from operations and cash flows, and to make accretive new investments.
42
Stock Performance Graph
The following graph compares, over a measurement period beginning May 21, 2015 and ending on
December 31, 2016
, the cumulative total return on our common stock with (i) the cumulative total return on the stocks included in the Russell 3000 Index, (ii) the cumulative total return on the stocks included in the NAREIT All Equity REIT Index and (iii) the cumulative total return on the stocks included in the SNL US REIT Healthcare Index. The performance graph assumes that the value of the investment in our common stock, the Russell 3000 Index, the NAREIT All Equity REIT Index and the SNL US REIT Healthcare Index was $100 at May 21, 2015, the date our common stock began publicly trading on the New York Stock Exchange, and that all dividends were reinvested.
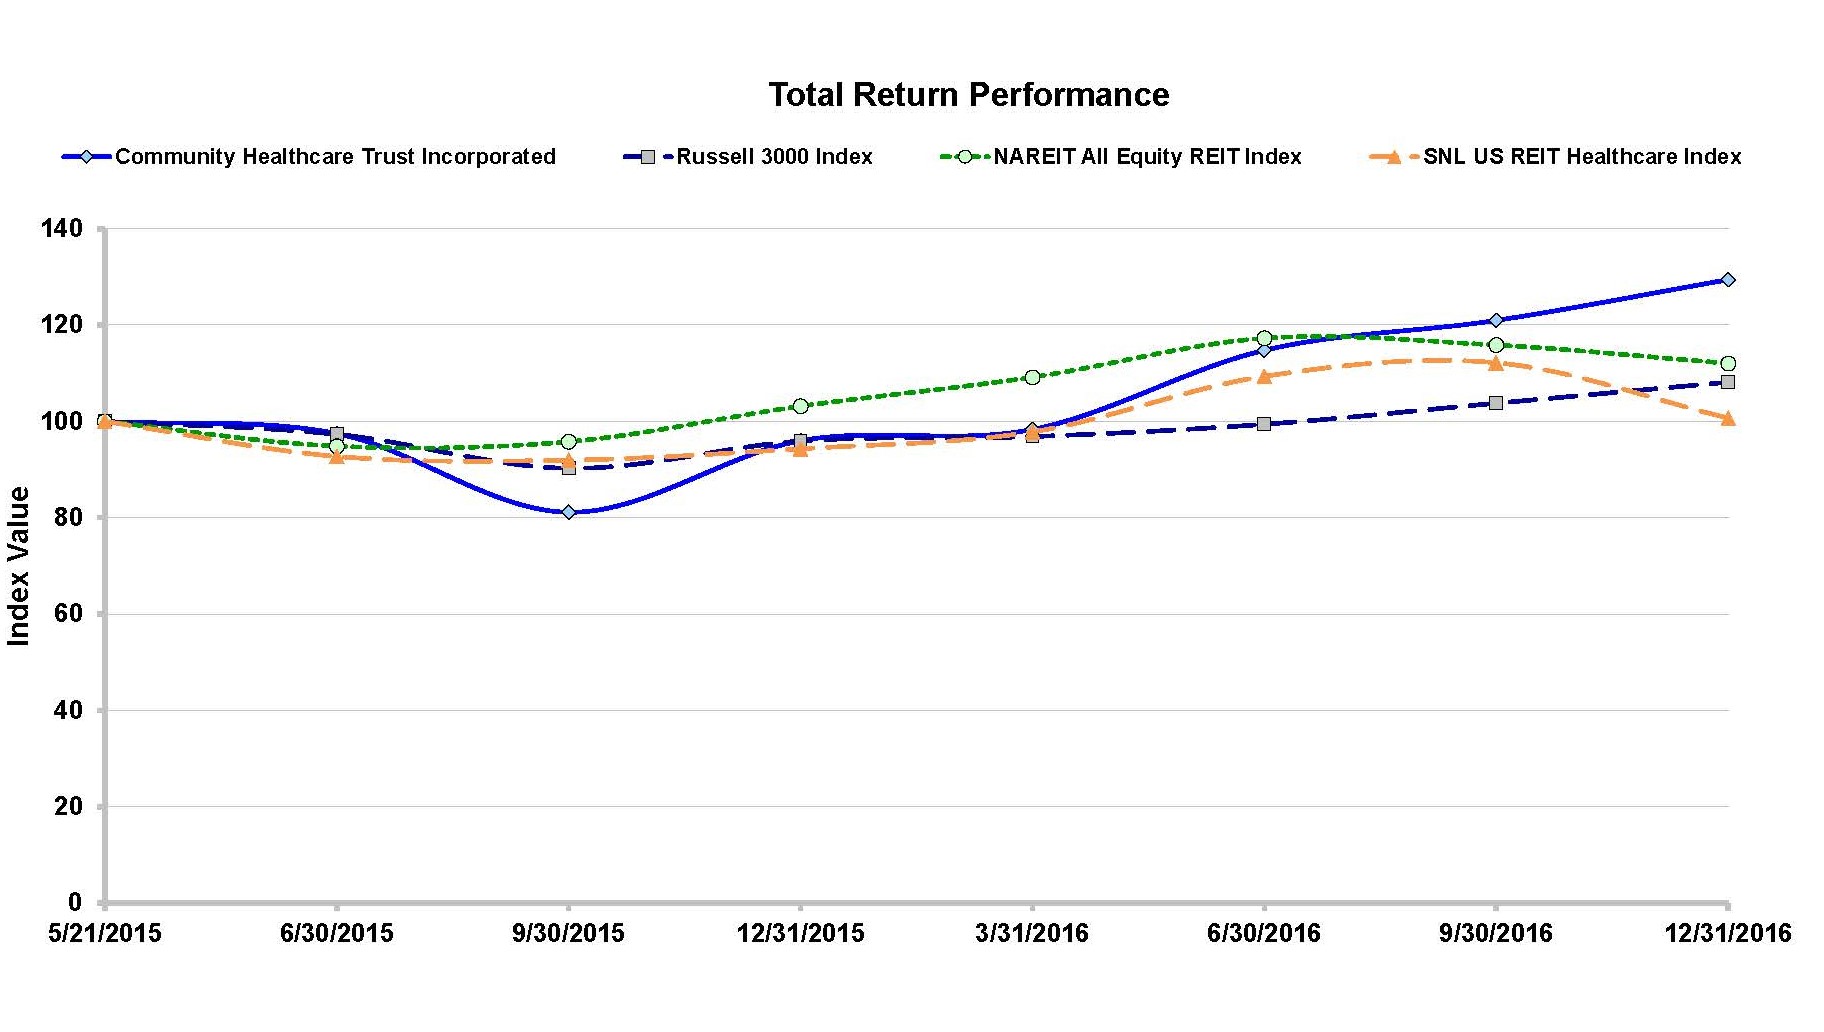
|
Period Ending
|
||||||||||||||||||||||||
|
Index
|
5/21/2015
|
|
6/30/2015
|
|
9/30/2015
|
|
12/31/2015
|
|
3/31/2016
|
|
6/30/2016
|
|
9/30/2016
|
|
12/31/2016
|
|
||||||||
|
Community Healthcare Trust Incorporated
|
$
|
100.00
|
|
$
|
97.47
|
|
$
|
81.13
|
|
$
|
95.98
|
|
$
|
98.33
|
|
$
|
114.76
|
|
$
|
120.97
|
|
$
|
129.42
|
|
|
Russell 3000 Index
|
$
|
100.00
|
|
$
|
97.32
|
|
$
|
90.26
|
|
$
|
95.92
|
|
$
|
96.85
|
|
$
|
99.40
|
|
$
|
103.77
|
|
$
|
108.14
|
|
|
NAREIT All Equity REIT Index
|
$
|
100.00
|
|
$
|
94.85
|
|
$
|
95.79
|
|
$
|
103.15
|
|
$
|
109.17
|
|
$
|
117.26
|
|
$
|
115.84
|
|
$
|
112.05
|
|
|
SNL US REIT Healthcare Index
|
$
|
100.00
|
|
$
|
92.72
|
|
$
|
91.95
|
|
$
|
94.31
|
|
$
|
97.82
|
|
$
|
109.35
|
|
$
|
112.17
|
|
$
|
100.71
|
|
There can be no assurance that our common stock performance will continue in the future with the same or similar trends depicted in the stock performance graph above. We will not make or endorse any predictions as to future stock performance.
The information provided under the heading “Stock Performance Graph” shall not be deemed to be “soliciting material” or to be “filed” with the SEC or subject to its proxy regulations or to the liabilities of Section 18 of the Securities Exchange Act of 1934, as amended, other than as provided in Item 201 of Regulation S-K. The information provided in this section shall not be deemed to be incorporated by reference into any filing under the Securities Act of 1933, as amended, or the Securities Exchange Act of 1934, as amended.
43
The following table sets forth financial information for the Company, which is derived from the Consolidated Financial Statements of the Company. The Company was formed on March 28, 2014, therefore, no financial data is available prior to that date.
|
Year Ended
December 31, 2016
|
Year Ended
December 31,
2015
|
For the Period
from March 28,
2014 (inception) to
December 31, 2014
|
||||||||
|
(Dollars in thousands except per share data)
|
||||||||||
|
Statement of Operations Data:
|
||||||||||
|
Total revenues
|
$
|
25,197
|
|
$
|
8,632
|
|
$
|
—
|
|
|
|
Total expenses
|
21,328
|
|
9,759
|
|
—
|
|
||||
|
Other income (expense), net
|
(1,148
|
)
|
(329
|
)
|
—
|
|
||||
|
Net income (loss)
|
$
|
2,721
|
|
$
|
(1,456
|
)
|
$
|
—
|
|
|
|
Diluted Income (loss) per share:
|
||||||||||
|
Income (loss) per diluted common share
|
$
|
0.24
|
|
$
|
(0.31
|
)
|
$
|
—
|
|
|
|
Weighted average common shares outstanding - Diluted
|
11,319,505
|
|
4,726,925
|
|
200,000
|
|
||||
|
Balance Sheet Data (as of the end of the period):
|
||||||||||
|
Real estate properties, gross
|
$
|
252,736
|
|
$
|
132,967
|
|
$
|
—
|
|
|
|
Real estate properties, net
|
$
|
234,332
|
|
$
|
127,764
|
|
$
|
—
|
|
|
|
Mortgage notes receivable, net
|
$
|
10,786
|
|
$
|
10,897
|
|
$
|
—
|
|
|
|
Total assets
|
$
|
251,529
|
|
$
|
142,803
|
|
$
|
2
|
|
|
|
Revolving credit facility
|
$
|
51,000
|
|
$
|
17,000
|
|
$
|
—
|
|
|
|
Total stockholders' equity
|
$
|
194,007
|
|
$
|
122,270
|
|
$
|
2
|
|
|
|
Other Data:
|
||||||||||
|
Funds from operations
(1)
|
$
|
15,912
|
|
$
|
3,747
|
|
$
|
—
|
|
|
|
Funds from operations per common share - Diluted
(1)
|
$
|
1.41
|
|
$
|
0.79
|
|
$
|
—
|
|
|
|
Dividends paid
|
$
|
17,783
|
|
$
|
3,928
|
|
$
|
—
|
|
|
|
Dividends declared and paid per common share
|
$
|
1.525
|
|
$
|
0.517
|
|
$
|
—
|
|
|
|
(1)
See "Management's Discussion and Analysis of Financial Condition and Results of Operations" for a discussion of Funds from operations ("FFO"), including why the Company presents FFO and a reconciliation of net income to FFO.
|
||||||||||
44
The purpose of this Management's Discussion and Analysis ("MD&A") is to provide an understanding of the Company's consolidated financial condition, results of operations and cash. MD&A is provided as a supplement to, and should be read in conjunction with, the Company's Consolidated Financial Statements and accompanying notes.
Overview
We were organized in the State of Maryland on March 28, 2014. We are a self-administered, self-managed healthcare REIT that acquires and owns properties that are leased to hospitals, doctors, healthcare systems or other healthcare service providers in Non-Urban markets. The Company conducts its business through an UPREIT structure in which its properties are owned by its operating partnership, either directly or through subsidiaries. The Company is the sole general partner, owning 100% of the OP units.
Initial Public Offering and Concurrent Private Placements
On May 27, 2015, the Company completed its initial public offering of 7,187,500 shares of its common stock, par value $0.01 per share, at a public offering price of $19.00 per share, which includes 937,500 shares of common stock issued in connection with the exercise in full of the underwriters’ option to purchase additional shares. The Company received net proceeds of approximately $125.2 million from the offering. In addition, on May 27, 2015, 123,683 shares of common stock, par value $0.01 per share, were issued in concurrent private placements to certain directors and officers of the Company. The Company received approximately $2.3 million in net proceeds from the concurrent private placements.
Emerging Growth Company
We have elected to be an emerging growth company, as defined in the JOBS Act. An emerging growth company may take advantage of specified reduced reporting requirements and is relieved of certain other significant requirements that are otherwise generally applicable to public companies. As an emerging growth company, among other things:
|
•
|
we are exempt from the requirement to obtain an attestation and report from our auditors on the assessment of our internal control over financial reporting pursuant to the Sarbanes-Oxley Act;
|
|
•
|
we are permitted to provide less extensive disclosure about our executive compensation arrangements; and
|
|
•
|
we are not required to give our stockholders non-binding advisory votes on executive compensation or golden parachute arrangements.
|
The JOBS Act also permits us, as an emerging growth company, to take advantage of an extended transition period to comply with new or revised accounting standards applicable to public companies and thereby allows us to delay the adoption of those standards until those standards would apply to private companies. We have irrevocably elected not to avail ourselves of this exemption from new or revised accounting standards, and, therefore, will be subject to the same new or revised accounting standards as other public companies that are not emerging growth companies.
We may take advantage of these provisions for up to five years or such earlier time that we are no longer an emerging growth company. We will cease to be an emerging growth company upon the earliest to occur of: (i) the last day of the first fiscal year in which we have more than $1 billion in annual revenues; (ii) the date we qualify as a "large accelerated filer," with at least $700 million in market value of our common stock held by non-affiliates; (iii) the issuance, in any three-year period, of more than $1 billion of non-convertible debt securities; and (iv) the last day of the fiscal year ending after the fifth anniversary of our IPO in May 2015.
45
Trends and Matters Impacting Operating Results
Management monitors factors and trends that it believes are important to the Company and the REIT industry in order to gauge their potential impact on the operations of the Company. Certain of the factors and trends that management believes may impact the operations of the Company are discussed below.
Real estate and mortgage investments
During 2016, the Company invested in 17 real estate properties for cash consideration of approximately
$104.0 million
and funded 1 mortgage note for approximately
$12.4 million
. Upon acquisition, the real estate properties were approximately 96.4% leased in the aggregate with lease expirations through 2031.
Subsequent acquisitions
From January 1, 2017 through
February 23, 2017
, the Company acquired
two
real estate properties totaling approximately
48,800
square feet for a purchase price of approximately
$7.9 million
, including cash consideration of approximately
$7.8 million
. Upon acquisition, the properties were approximately
94%
leased with lease expirations through
2022
. These acquisitions were funded with proceeds from the Credit Facility.
Acquisition Pipeline
The Company has nine properties under definitive purchase agreements for an aggregate expected purchase price of approximately $25.7 million as of
February 23, 2017
. The Company's expected return on these investments range from approximately 9.0% to 9.6%.
The Company also has a property, adjacent to its corporate office, under a definitive purchase agreement for an expected purchase price of approximately $0.9 million. The Company will initially lease the property to the current tenant but intends to use the property for future expansion of its corporate office.
The Company is currently performing due diligence procedures customary for these types of transactions and cannot provide any assurance as to the timing or when or whether these transactions will actually close. The Company anticipates funding these additional investments with cash from operations, through proceeds from its Credit Facility, or from net proceeds from debt or equity offerings.
Lease Expirations
We expect that approximately 10% to 20% of our leases will expire in each year, given that our leases are generally five to seven year leases with physicians or other healthcare providers. Based on annualized rent, approximately
13.7%
expire in 2017,
13.2%
expire in 2018 and
12.4%
expire in 2019. Management expects that many of the tenants will renew their leases, but in cases where they do not renew, the Company believes it will generally be able to re-lease the space to existing or new tenants without significant loss of rental income.
46
Contractual Obligations
The Company’s material contractual obligations at
December 31, 2016
are included in the table below. At
December 31, 2016
, the Company had no long-term capital lease or purchase obligations.
|
(Dollars in thousands)
|
Total
|
Less Than
1 Year
|
1-3 Years
|
3-5 Years
|
More Than
5 Years
|
||||||||||||||
|
Revolving credit facility
(1)
|
$
|
55,622
|
|
$
|
1,772
|
|
$
|
53,850
|
|
$
|
—
|
|
$
|
—
|
|
||||
|
Contingent obligations
(2)
|
398
|
|
398
|
|
—
|
|
—
|
|
—
|
|
|||||||||
|
Tenant improvements
(3)
|
9
|
|
9
|
|
—
|
|
—
|
|
—
|
|
|||||||||
|
Capital improvements
|
96
|
|
96
|
|
—
|
|
—
|
|
—
|
|
|||||||||
|
$
|
56,125
|
|
$
|
2,275
|
|
$
|
53,850
|
|
$
|
—
|
|
$
|
—
|
|
|||||
____________
(1)
The amounts shown include interest at the current rates at December 31, 2016 and the unused fee interest assuming the credit facility remains at $51.0 million through its maturity.
(2)
See Note 4 to the Consolidated Financial Statements.
(3)
The Company assumed tenant improvement obligations totaling approximately $0.3 million relating to two tenants in its 2015 acquisitions whose leases expire in 2018 and 2020. Since the timing of when the Company will be required to fund its obligations is not known at December 31, 2016, the Company has not included those amounts in its contractual obligations table.
Off-Balance Sheet Arrangements
We have no off-balance sheet arrangements that are reasonably like to have a material effect on the Company's consolidated financial condition, results of operations or liquidity.
Inflation
We believe inflation will have a minimal impact on the operating performance of our properties. Many of our lease agreements contain provisions designed to mitigate the adverse impact of inflation. These provisions include clauses that enable us to receive payment of increased rent pursuant to escalation clauses which generally increase rental rates during the terms of the leases. These escalation clauses often provide for fixed rent increases or indexed escalations (based upon CPI or other measures). However, some of these contractual rent increases may be less than the actual rate of inflation. Generally, our lease agreements require the tenant to pay property operating expenses, including maintenance costs, real estate taxes and insurance. This requirement reduces our exposure to increases in these costs and property operating expenses resulting from inflation.
Seasonality
We do not expect our business to be subject to material seasonal fluctuations.
New Accounting Pronouncements
See Note 1 to the Company’s Consolidated Financial Statements accompanying this report for information on new accounting standards not yet adopted.
47
Results of Operations
Our results of operations have been significantly impacted by acquisitions of real estate and investments in mortgage notes since the completion of our initial public offering on May 27, 2015. There were no operations prior to our initial public offering in 2015.
As of
December 31, 2016
, we had invested approximately
$263.5 million
in
58
real estate properties, including a mortgage note, which are located in
22
states and total over
1.33
million square feet. Also, since our initial public offering, we completed a follow-on offering and entered into a $150.0 million revolving credit facility.
Year Ended December 31, 2016 Compared to December 31, 2015
The table below shows our results of operations for the year ended December 31, 2016 compared to the same period in 2015 and the effect of changes in those results from period to period on our net income (loss).
|
For the Year Ended December 31,
|
Increase (Decrease) to Net Income
|
||||||||||
|
2016
|
2015
|
$
|
|||||||||
|
REVENUES
|
|||||||||||
|
Rental income
|
$
|
18,999
|
|
$
|
6,364
|
|
$
|
12,635
|
|
||
|
Tenant reimbursements
|
4,564
|
|
1,964
|
|
2,600
|
|
|||||
|
Mortgage interest
|
1,634
|
|
304
|
|
1,330
|
|
|||||
|
25,197
|
|
8,632
|
|
16,565
|
|
||||||
|
EXPENSES
|
|||||||||||
|
Property operating
|
4,744
|
|
2,012
|
|
2,732
|
|
|||||
|
General and administrative
|
3,228
|
|
2,472
|
|
756
|
|
|||||
|
Depreciation and amortization
|
13,201
|
|
5,204
|
|
7,997
|
|
|||||
|
Bad debts
|
155
|
|
71
|
|
84
|
|
|||||
|
21,328
|
|
9,759
|
|
11,569
|
|
||||||
|
OTHER INCOME (EXPENSE)
|
|||||||||||
|
Interest expense
|
(1,178
|
)
|
(364
|
)
|
(814
|
)
|
|||||
|
Interest and other income, net
|
30
|
|
35
|
|
(5
|
)
|
|||||
|
(1,148
|
)
|
(329
|
)
|
(819
|
)
|
||||||
|
NET INCOME (LOSS) AND COMPREHENSIVE INCOME (LOSS)
|
$
|
2,721
|
|
$
|
(1,456
|
)
|
$
|
4,177
|
|
||
Revenues
Revenues
for the year ended December 31, 2016
compared to the same period in 2015 increased approximately $16.6 million due to the acquisition during 2016 of 17 real estate properties and 1 mortgage note, which was subsequently converted upon the acquisition of the real estate securing the note, resulting in approximately $6.8 million in revenues in 2016, as well as the increase in revenue from 2015 to 2016 resulting from the acquisition of 40 real estate properties and 1 mortgage note from our initial public offering in late May 2015 through December 31, 2015, resulting in approximately $9.8 million in increased revenues.
48
Property operating expenses
Property operating expenses
for the year ended December 31, 2016
compared to the same period in 2015 increased approximately $2.7 million due to the acquisition during 2016 of 17 real estate properties, resulting in approximately $1.2 million in property operating expenses in 2016, as well as the increase in property operating expenses from 2015 to 2016 resulting from the acquisition of 40 real estate properties from our initial public offering in late May 2015 through December 31, 2015, resulting in approximately $2.8 million in increased property operating expenses. Also, we recorded contingent consideration related to three of our acquisitions. Adjustments to the fair value of the contingent consideration during 2016 resulted in a reduction to property operating expense of approximately $1.3 million.
General and administrative expenses
General and administrative expenses
for the year ended December 31, 2016
compared to the same period in 2015 increased approximately $0.8 million. Compensation-related expenses and occupancy costs related to our employees and corporate office increased approximately $1.4 million due mainly to the partial year reflected in the results for 2015 since our initial public offering, as well as the addition of employees during 2016. Transaction costs, related to acquisitions in 2016 and 2015 and our public offering in 2015, decreased by approximately $0.8 million in 2016 compared to 2015.
Depreciation and amortization expense
Depreciation and amortization expense
for the year ended December 31, 2016
compared to the same period in 2015 increased approximately $8.0 million. The 17 real estate acquisitions during 2016 resulted in approximately $2.8 million in depreciation and amortization in 2016; the 40 real estate acquisitions during 2015 resulted in an increase of approximately $5.1 million from 2015 to 2016 due mainly to the partial year reflected in the results for 2015 since our initial public offering; and capital improvements resulted in an increase of approximately $0.1 million.
Interest expense
Interest expense
for the year ended December 31, 2016
compared to the same period in 2015 increased approximately $0.8 million due mainly to an increase in our weighted average outstanding balance on our revolving credit facility throughout 2016.
Liquidity and Capital Resources
The Company monitors its liquidity and capital resources and relies on several key indicators in its assessment of capital markets for financing acquisitions and other operating activities as needed, including the following:
|
•
|
Leverage ratios and financial covenants included in our credit facility;
|
|
•
|
Dividend payout percentage; and
|
|
•
|
Interest rates, underlying treasury rates, debt market spreads and equity markets.
|
The Company uses these indicators and others to compare its operations to its peers and to help identify areas in which the Company may need to focus its attention.
Sources and Uses of Cash
The Company derives most of its revenues from its real estate property and mortgage notes portfolio, collecting rental income, operating expense reimbursements and mortgage interest based on contractual arrangements with its tenants and borrowers. These sources of revenue represent our primary source of liquidity to fund our dividends, general and administrative expenses, property operating expenses, interest expense on our credit facility and other
49
expenses incurred related to managing our existing portfolio and investing in additional properties. To the extent additional resources are needed, the Company will fund its investment activity generally through equity or debt issuances either in the public or private markets or through proceeds from our credit facility.
The Company expects to meet its liquidity needs through cash on hand, cash flows from operations and cash flows from sources discussed above. The Company believes that its liquidity and sources of capital are adequate to satisfy its cash requirements. The Company cannot, however, be certain that these sources of funds will be available at a time and upon terms acceptable to the Company in sufficient amounts to meet its liquidity needs.
Operating Activities
Cash flows provided by operating activities for the years ended December 31,
2016
and
2015
and for the period from March 28, 2014 (inception) through December 31, 2014 were approximately
$14.9 million
,
$3.0 million
, and
$0
, respectively. Cash flows provided by operating activities for the years ended December 31,
2016
and
2015
were generally provided by contractual rents and mortgage interest, net of property operating expenses not reimbursed by the tenants and general and administrative expenses. There were no operating activities in 2014.
Investing Activities
Cash flows used in investing activities for the years ended December 31,
2016
and
2015
and for the period from March 28, 2014 (inception) through December 31, 2014 were approximately
$117.1 million
,
$140.6 million
, and
$0
, respectively. During 2016, the Company invested in 17 real estate properties for cash consideration of approximately
$103.2 million
, excluding closing costs, and funded 1 mortgage note for approximately
$12.4 million
. During 2015, the Company invested in 40 real estate properties for cash consideration of approximately
$129.0 million
and funded 1 mortgage note for approximately
$10.9 million
. There were no investing activities in 2014.
Financing Activities
Cash flows provided by financing activities for the years ended December 31,
2016
and
2015
and for the period from March 28, 2014 (inception) through December 31, 2014 were approximately
$101.7 million
,
$139.7 million
, and
$2,000
, respectively. During 2016 and 2015, the Company paid dividends totaling
$17.8 million
and
$3.9 million
, respectively. During 2016, the Company completed a follow-on equity offering, and during 2015, the Company completed its initial public equity offering and concurrent private placements resulting in net proceeds, net of underwriters' discount and offering costs, of approximately
$86.1 million
and
$127.5 million
, respectively, and borrowed under its revolving credit facility approximately
$34.0 million
and
$17.0 million
, respectively. The net proceeds from these equity offerings and borrowings under its revolving credit facility were used to acquire the Company's real estate and mortgage note portfolio. During the first quarter of 2014, the Company issued 200,000 shares of common stock to its officers in connection with the formation of the Company for net proceeds of $2,000.
On May 27, 2015, the Company completed its initial public offering of 7,187,500 shares of its common stock at a public offering price of $19.00 per share, which includes 937,500 shares of common stock issued in connection with the exercise in full of the underwriters’ option to purchase additional shares. The Company received net proceeds of approximately $125.2 million from the offering. In addition, 123,683 shares of common stock were issued in concurrent private placements to certain directors and officers of the Company. The Company received approximately $2.3 million in net proceeds from the concurrent private placements.
In April 2016, we completed a follow-on offering of 5,175,000 shares of common stock, including 675,000 shares of common stock issued in connection with the exercise in full of the underwriters' option to purchase additional shares, and received net proceeds of approximately $86.1 million from the follow-on offering.
On
August 10, 2016
, we entered into an amended and restated Credit Facility (as amended, the "Credit Facility"). The Credit Facility is by and among Community Healthcare OP, LP, the Company, the Lenders from time to time party thereto, and SunTrust Bank, as Administrative Agent, matures on
August 9, 2019
and includes
two
options to extend the maturity date of the facility, subject to the satisfaction of certain conditions. The Credit Facility increased
50
the maximum borrowing capacity from
$75.0 million
to
$150.0 million
, lowered our interest rates by
25
basis points and adjusted or replaced certain financial covenants. Amounts outstanding under the Credit Facility bear annual interest at a floating rate that is based, at the Company’s option, on either: (i) LIBOR plus
2.25%
to
2.75%
or (ii) a base rate plus
1.25%
to
1.75%
, in each case, depending upon the Company’s leverage ratio. In addition, the Company is obligated to pay an annual fee equal to
0.25%
of the amount of the unused portion of the Credit Facility if amounts borrowed are greater than
33.3%
of the borrowing capacity under the Credit Facility and
0.35%
of the unused portion of the Credit Facility if amounts borrowed are less than or equal to
33.3%
of the borrowing capacity under the Credit Facility. The Credit Facility also includes an accordion feature that provides the Company with additional capacity, subject to the satisfaction of customary terms and conditions, including obtaining additional commitments from lenders, of up to
$125 million
, for a total facility size of up to
$275.0 million
. The Company incurred
$0.6 million
in fees and other costs to amend and extend its Credit Facility which will be amortized to expense over the life of the Credit Facility. The Company’s material subsidiaries are guarantors of the obligations under the Credit Facility. At
December 31, 2016
, the Company had
$51.0 million
outstanding under the Credit Facility with a weighted average interest rate of approximately
2.99%
, a remaining borrowing capacity of
$99.0 million
, and our debt to total book capitalization ratio was approximately
20.8%
.
The Company’s ability to borrow under the Credit Facility is subject to its ongoing compliance with a number of customary affirmative and negative covenants, including limitations with respect to liens, indebtedness, distributions, mergers, consolidations, investments, restricted payments and asset sales, as well as financial maintenance covenants. Also, the Company’s present financing policy prohibits incurring debt (secured or unsecured) in excess of 40% of its total book capitalization. The Company was in compliance with its financial covenants under its Credit Facility at
December 31, 2016
.
Universal Shelf S-3 Registration Statement
On September 13, 2016, the Company filed a registration statement on Form S-3 that will allow us to offer debt or equity securities (or a combination thereof) of up to $750.0 million, from time to time. The S-3 registration statement was declared effective as of September 26, 2016.
Subsequent Acquisitions
From January 1, 2017 through
February 23, 2017
, the Company acquired
two
real estate properties totaling approximately
48,800
square feet for a purchase price of approximately
$7.9 million
, including cash consideration of approximately
$7.8 million
. Upon acquisition, the properties were approximately
94%
leased with lease expirations through
2022
. These acquisitions were funded with proceeds from the Credit Facility.
Acquisition Pipeline
The Company has nine properties under definitive purchase agreements for an aggregate expected purchase price of approximately $25.7 million as of
February 23, 2017
. The Company's expected return on these investments range from approximately 9.0% to 9.6%.
The Company also has a property, adjacent to its corporate office, under a definitive purchase agreement for an expected purchase price of approximately $0.9 million. The Company will initially lease the property to the current tenant but intends to use the property for future expansion of its corporate office.
The Company is currently performing due diligence procedures customary for these types of transactions and cannot provide any assurance as to the timing or when or whether these transactions will actually close. The Company anticipates funding these additional investments with cash from operations, through proceeds from its Credit Facility, or from net proceeds from debt or equity offerings.
Security Deposits
As of
December 31, 2016
, the Company held approximately
$0.4 million
in security deposits for the benefit of the Company in the event the obligated tenant fails to perform under the terms of its respective lease. Generally, the
51
Company may, at its discretion and upon notification to the tenant, draw upon the security deposits if there are any defaults under the leases.
Dividends
The Company is required to pay dividends to its stockholders at least equal to 90% of its taxable income in order to maintain its qualification as a REIT.
During 2016 and 2015, the Company paid cash dividends in the amounts of
$1.525
per share and
$0.517
per share, respectively.
On
February 2, 2017
, the Company’s Board of Directors declared a quarterly common stock dividend in the amount of $
0.3875
per share. The dividend is payable on
March 3, 2017
to stockholders of record on
February 17, 2017
. This quarterly dividend equates to an annualized dividend of $1.55 per share.
The ability of the Company to pay dividends is dependent upon its ability to generate cash flows and to make accretive new investments.
Funds from Operations
Funds from operations (“FFO”) and FFO per share are operating performance measures adopted by the National Association of Real Estate Investment Trusts, Inc. (“NAREIT”). NAREIT defines FFO as the most commonly accepted and reported measure of a REIT’s operating performance equal to net income (computed in accordance with GAAP), excluding gains (or losses) from sales of property and impairments of real estate, plus depreciation and amortization related to real estate properties, and after adjustments for unconsolidated partnerships and joint ventures.
Management believes that net income (loss), as defined by GAAP, is the most appropriate earnings measurement. However, management believes FFO and FFO per share to be supplemental measures of a REIT’s performance because they provide an understanding of the operating performance of the Company’s properties without giving effect to certain significant non-cash items, primarily depreciation and amortization expense. Historical cost accounting for real estate assets in accordance with GAAP assumes that the value of real estate assets diminishes predictably over time. However, real estate values instead have historically risen or fallen with market conditions. The Company believes that by excluding the effect of depreciation, amortization, gains or losses from sales of real estate, and impairment of real estate, all of which are based on historical costs and which may be of limited relevance in evaluating current performance, FFO and FFO per share can facilitate comparisons of operating performance between periods. The Company reports FFO and FFO per share because these measures are observed by management to also be the predominant measures used by the REIT industry and by industry analysts to evaluate REITs and because FFO per share is consistently reported, discussed, and compared by research analysts in their notes and publications about REITs. For these reasons, management has deemed it appropriate to disclose and discuss FFO and FFO per share. However, FFO does not represent cash generated from operating activities determined in accordance with GAAP and is not necessarily indicative of cash available to fund cash needs. FFO should not be considered as an alternative to net income attributable to common stockholders as an indicator of the Company’s operating performance or as an alternative to cash flow from operating activities as a measure of liquidity.
The table below reconciles FFO to net income (loss). Net income for the twelve months ended December 31, 2016, included approximately
$0.8 million
, or
$0.07
per diluted common share, of transaction costs related to the Company's acquisitions during 2016; and net loss for the twelve months ended December 31, 2015 included approximately
$1.6 million
, or
$0.33
per diluted common share, of transaction costs related to the Company's acquisitions and initial public offering during 2015.
52
|
Twelve Months Ended
December 31,
|
For the Period
March 28, 2014
(inception)
through
December 31,
|
|||||||||
|
(Dollars in thousands, except per share amounts)
|
2016
|
2015
|
2014
|
|||||||
|
Net income (loss)
|
$
|
2,721
|
|
$
|
(1,456
|
)
|
$
|
—
|
|
|
|
Real estate depreciation and amortization
|
13,191
|
|
5,203
|
|
—
|
|
||||
|
Total adjustments
|
13,191
|
|
5,203
|
|
—
|
|
||||
|
Funds from Operations
|
$
|
15,912
|
|
$
|
3,747
|
|
$
|
—
|
|
|
|
Funds from Operations per Common Share-Basic
|
$
|
1.42
|
|
$
|
0.79
|
|
$
|
—
|
|
|
|
Funds from Operations per Common Share-Diluted
|
$
|
1.41
|
|
$
|
0.79
|
|
$
|
—
|
|
|
|
Weighted Average Common Shares Outstanding-Basic
|
11,238,437
|
|
4,726,925
|
|
200,000
|
|
||||
|
Weighted Average Common Shares Outstanding-Diluted
|
11,319,505
|
|
4,736,852
|
|
200,000
|
|
||||
Critical Accounting Policies
Our Consolidated Financial Statements are prepared in conformity with GAAP, which require us to make estimates and assumptions that affect the reported amounts of assets and liabilities and disclosure of contingent assets and liabilities at the date of the Consolidated Financial Statements and the reported amounts of revenues and expenses during the reporting periods. Actual results could differ from those estimates. Set forth below is a summary of our accounting policies that we believe are critical to the preparation of our Consolidated Financial Statements. Our accounting policies are more fully discussed in Note 1 to the Consolidated Financial Statements.
Principles of Consolidation
Our Consolidated Financial Statements include the accounts of the Company, its wholly owned subsidiaries, joint ventures, partnerships and variable interest entities, or VIEs, where the Company controls the operating activities. All material intercompany accounts, transactions, and balances have been eliminated.
Management must make judgments regarding the Company's level of influence or control over an entity and whether or not the Company is the primary beneficiary of a variable interest entity. Consideration of various factors include, but is not limited to, the Company's ability to direct the activities that most significantly impact the entity's governing body, the size and seniority of the Company's investment, the Company's ability and the rights of other investors to participate in policy making decisions, the Company's ability to replace the manager and/or liquidate the entity. Management's ability to correctly assess its influence or control over an entity when determining the primary beneficiary of a VIE affects the presentation of these entities in the Company's Consolidated Financial Statements. If it is determined that the Company is the primary beneficiary of a VIE, the Company's Consolidated Financial Statements would include the operating results of the VIE rather than the results of the variable interest in the VIE. The Company would depend on the VIE to provide timely financial information and would rely on the interest control of the VIE to provide accurate financial information. Untimely or inaccurate financial information provided to the Company or deficiencies in the VIEs internal controls over financial reporting could impact the Company's Consolidated Financial Statements and its internal control over financial reporting.
Accounting for Acquisitions of Real Estate Properties
Real estate properties are recorded at cost or, if acquired through business combination, at fair value. The allocation of real estate property acquisitions may include land, building and improvements, personal property, and identified intangible assets and liabilities (consisting of above- and below-market leases, in-place leases, and tenant relationships) based on the evaluation of information and estimates available at that date in accordance with the provisions of the Financial Accounting Standards Board's ("FASB") Accounting Standards Codification ("ASC")
53
ASC 805,
Business Combinations
("ASC 805"
)
and we allocate the purchase price based on these assessments. We make estimates of the fair value of the tangible and intangible assets and acquired liabilities using information obtained from multiple sources as a result of pre-acquisition due diligence, tax records, and other sources. Based on these estimates, we recognize the acquired assets and liabilities at their estimated fair values. Initial valuations are subject to change until the information is finalized, no later than 12 months from the acquisition date. We expense transaction costs associated with business combinations in the period incurred. In accordance with ASC 805, the fair value of tangible property assets acquired considers the value of the property as if vacant determined by comparable sales and other relevant data. The determination of fair value involves the use of significant judgment and estimation. We value land based on various inputs, which may include internal analysis of recently acquired properties, existing comparable properties within our portfolio, or third party appraisals or valuations based on comparable sales.
In recognizing identified intangible assets and liabilities of an acquired property, the value of above-or-below market leases is estimated based on the present value (using a discount rate which reflects the risks associated with the leases acquired) of the difference between contractual amounts to be received pursuant to the leases and management’s estimate of market lease rates measured over a period equal to the estimated remaining term of the lease. In the case of a below-market lease, the Company would also evaluate any renewal options associated with that lease to determine if the intangible should include those periods. The capitalized above-market or below-market lease intangibles are amortized as a reduction or addition to rental income over the estimated remaining term of the respective leases.
In determining the value of in-place leases and tenant relationships, management considers current market conditions and costs to execute similar leases in arriving at an estimate of the carrying costs during the expected lease-up period from vacant to existing occupancy. In estimating carrying costs, management includes real estate taxes, insurance, other property operating expenses, estimates of lost rental revenue during the expected lease-up periods, and costs to execute similar leases, including leasing commissions. The values assigned to in-place leases and tenant relationships are amortized over the estimated remaining term of the lease. If a lease terminates prior to its scheduled expiration, all unamortized costs related to that lease are written off.
Property acquisitions not meeting the accounting criteria to be accounted for as a business combination are accounted for as an asset acquisition. An asset acquisition is recorded at its purchase price, inclusive of acquisition costs, which is allocated among the acquired assets and assumed liabilities based upon their relative fair values at the date of acquisition.
Asset Impairments
The Company may need to assess the potential for impairment of identifiable, definite-lived, intangible assets and long-lived assets, including real estate properties, whenever events occur or a change in circumstances indicates that the carrying value might not be fully recoverable. Indicators of impairment may include significant under-performance of an asset relative to historical or expected operating results; significant changes in the Company’s use of assets or the strategy for its overall business; plans to sell an asset before its depreciable life has ended; the expiration of a significant portion of leases in a property; or significant negative economic trends or negative industry trends for the Company or its operators. In addition, the Company’s review for possible impairment may include those assets subject to purchase options and those impacted by casualties, such as tornadoes and hurricanes. If management determines that the carrying value of the Company’s assets may not be fully recoverable based on the existence of any of the factors above, or others, management would measure and record an impairment charge based on the estimated fair value of the property or the estimated fair value less costs to sell the property.
Revenue Recognition
The Company derives most of its revenues from its real estate property and mortgage notes portfolio. The Company's rental and mortgage interest income is recognized based on contractual arrangements with its tenants and borrowers.
54
The Company recognizes rental revenue when it is realized or realizable and earned, in accordance with ASC 840,
Leases,
or ASC 840. There are four criteria that must all be met before a Company may recognize revenue, including persuasive evidence of an arrangement exists, delivery has occurred or services have been rendered (i.e., the tenant has taken possession of and controls the physical use of the leased asset), the price has been fixed or is determinable, and collectability is reasonably assured. ASC 840 also requires that rental revenue, less lease inducements, be recognized on a straight-line basis over the term of the lease. Recognizing rental revenue on a straight-line basis for leases may result in recognizing revenue in amounts more or less than amounts currently due from tenants. If management determines that the collectability of straight-line rents is not reasonably assured, the amount of future revenue recognized may be limited to amounts contractually owed and, where appropriate, establish an allowance for estimated losses.
Mortgage interest income is recognized based on the interest rates, maturity dates and amortization periods in accordance with each note agreement. Fees received related to its mortgage notes are amortized to mortgage interest income on a straight-line basis which approximates amortization under the effective interest method.
The Company also accrues operating expense recoveries based on the contractual terms of its leases and late fees based on the contractual terms of its leases or notes, which are included in rental income or mortgage interest income, as applicable.
Allowance for Doubtful Accounts and Credit Losses
Accounts Receivable
Management monitors the aging and collectability of its accounts receivable balances on an ongoing basis. Whenever deterioration in the timeliness of payment from a tenant is noted, management investigates and determines the reason or reasons for the delay. Considering all information gathered, management’s judgment is exercised in determining whether a receivable is potentially uncollectible and, if so, how much or what percentage may be uncollectible. Among the factors management considers in determining collectability are: the type of contractual arrangement under which the receivable was recorded (e.g., triple net lease, gross lease, or other type of agreement); the tenant’s reason for slow payment; industry influences under which the tenant operates; evidence of willingness and ability of the tenant to pay the receivable; credit-worthiness of the tenant; collateral, security deposit, letters of credit or other monies held as security; tenant’s historical payment pattern; other contractual agreements between the tenant and the Company; relationship between the tenant and the Company; the state in which the tenant operates; and the existence of a guarantor and the willingness and ability of the guarantor to pay the receivable. Considering these factors and others, management concludes whether all or some of the aged receivable balance is likely uncollectible. Upon determining that some portion of the receivable is likely uncollectible, the Company will record a provision for bad debts for the amount it expects will be uncollectible. When efforts to collect a receivable are exhausted, the receivable amount is charged off against the allowance.
Mortgage Note Receivable
The Company evaluates collectability of its mortgage notes and records allowances on the notes as necessary. A loan is impaired when it is probable that a creditor will be unable to collect all amounts due according to the contractual terms of the loan as scheduled, including both contractual interest and principal payments. This assessment also includes an evaluation of the loan collateral. If a mortgage loan becomes past due, the Company will review the specific circumstances and may discontinue the accrual of interest on the loan. The loan is not returned to accrual status until the debtor has demonstrated the ability to continue debt service in accordance with the contractual terms. Loans placed on non-accrual status will be accounted for on a cash basis, in which income is recognized only upon the receipt of cash, or on a cost-recovery basis, in which all cash receipts reduce the carrying value of the loan, based on the Company's expectation of future collectability.
55
Jumpstart Our Business Startups Act of 2012
The JOBS Act permits the Company, as an ‘‘emerging growth company,’’ to take advantage of an extended transition period to comply with new or revised accounting standards applicable to public companies. Management has elected to ‘‘opt out’’ of this provision and, as a result, will be required to comply with new or revised accounting standards as required when they are adopted. The decision to opt out of the extended transition period under the JOBS Act is irrevocable.
Use of Estimates in the Consolidated Financial Statements
Preparation of the Consolidated Financial Statements in accordance with GAAP requires management to make estimates and assumptions that affect amounts reported in the Consolidated Financial Statements and accompanying notes. Actual results may materially differ from those estimates.
The Company is exposed to market risk in the form of changing interest rates on its debt and mortgage note receivable. Market risk refers to the risk of loss from adverse changes in market prices and interest rates. Management uses regular monitoring of market conditions and analysis techniques to manage this risk.
As of
December 31, 2016
, the Company's credit facility was based on variable interest rates while its mortgage note receivable bore interest at a fixed rate.
The following table provides information regarding the sensitivity of certain of the Company’s financial instruments, as described above, to market conditions and changes resulting from changes in interest rates. For purposes of this analysis, sensitivity is demonstrated based on hypothetical 10% changes in the underlying market interest rates.
|
Impact on Earnings and Cash
Flows
|
|||||||||||||||
|
(Dollars in thousands)
|
Outstanding
Principal Balance
at
December 31, 2016
|
Calculated Annual
Interest Expense
|
Assuming 10%
Increase in
Market Interest
Rates
|
Assuming 10%
Decrease in
Market Interest
Rates
|
|||||||||||
|
Variable Rate Debt:
|
|||||||||||||||
|
Credit Facility
|
$
|
51,000
|
|
$
|
1,525
|
|
$
|
(153
|
)
|
$
|
153
|
|
|||
|
Fair Value
|
|||||||||||||||
|
(Dollars in thousands)
|
Principal Balance at
December 31, 2016
|
December 31, 2016
|
Assuming 10%
Increase in
Market Interest
Rates
|
Assuming 10%
Decrease in
Market Interest
Rates
|
December 31, 2015
|
||||||||||
|
Fixed Rate Receivable:
|
|||||||||||||||
|
Mortgage Note Receivable
(1)
|
$
|
10,908
|
|
$
|
10,908
|
|
$
|
9,817
|
|
$
|
11,999
|
|
$
|
11,000
|
|
|
___________
|
|||||||||||||||
|
(1) Level 2 - Fair value based on quoted prices for similar instruments in active markets; quoted prices for identical or similar instruments in markets that are not active; and model-derived valuations in which significant inputs and significant value drivers are observable in active markets.
|
|||||||||||||||
56
Report of
INDEPENDENT REGISTERED PUBLIC ACCOUNTING FIRM
Board of Directors and Stockholders
Community Healthcare Trust Incorporated
Franklin, Tennessee
We have audited the accompanying consolidated balance sheets of Community Healthcare Trust Incorporated (the "Company") as of December 31, 2016 and 2015 and the related consolidated statements of comprehensive income (loss), stockholders' equity, and cash flows for the years ended December 31, 2016 and 2015 and for the period from March 28, 2014 (inception) through December 31, 2014. In connection with our audits of the consolidated financial statements, we have also audited the financial statement schedules listed in the accompanying index. These financial statements and schedules are the responsibility of the Company’s management. Our responsibility is to express an opinion on these financial statements and schedules based on our audits.
We conducted our audits in accordance with the standards of the Public Company Accounting Oversight Board (United States). Those standards require that we plan and perform the audits to obtain reasonable assurance about whether the consolidated financial statements are free of material misstatement. The Company is not required to have, nor were we engaged to perform, an audit of its internal control over financial reporting. Our audits included consideration of internal control over financial reporting as a basis for designing audit procedures that are appropriate in the circumstances, but not for the purpose of expressing an opinion on the effectiveness of the Company's internal control over financial reporting. Accordingly, we express no such opinion. An audit also includes examining, on a test basis, evidence supporting the amounts and disclosures in the consolidated financial statements, assessing the accounting principles used and significant estimates made by management, as well as evaluating the overall presentation of the consolidated financial statements and schedules. We believe that our audits provide a reasonable basis for our opinion.
In our opinion, the consolidated financial statements referred to above present fairly, in all material respects, the financial position of Community Healthcare Trust Incorporated at December 31, 2016 and 2015, and the results of its operations and its cash flows for the years ended December 31, 2016 and 2015 and for the period from March 28, 2014 (inception) through December 31, 2014, in conformity with accounting principles generally accepted in the United States of America.
Also, in our opinion, the financial statement schedules, when considered in relation to the basic consolidated financial statements taken as a whole, present fairly, in all material respects, the information set forth therein.
/s/ BDO USA, LLP
Nashville, Tennessee
February 23, 2017
57
COMMUNITY HEALTHCARE TRUST INCORPORATED
(Dollars in thousands, except per share amounts)
|
December 31,
|
|||||||
|
2016
|
2015
|
||||||
|
ASSETS
|
|||||||
|
Real estate properties
|
|||||||
|
Land and land improvements
|
$
|
29,884
|
|
$
|
13,216
|
|
|
|
Buildings, improvements, and lease intangibles
|
222,755
|
|
119,716
|
|
|||
|
Personal property
|
97
|
|
35
|
|
|||
|
Total real estate properties
|
252,736
|
|
132,967
|
|
|||
|
Less accumulated depreciation
|
(18,404
|
)
|
(5,203
|
)
|
|||
|
Total real estate properties, net
|
234,332
|
|
127,764
|
|
|||
|
Cash and cash equivalents
|
1,568
|
|
2,018
|
|
|||
|
Mortgage note receivable, net
|
10,786
|
|
10,897
|
|
|||
|
Other assets, net
|
4,843
|
|
2,124
|
|
|||
|
Total assets
|
$
|
251,529
|
|
$
|
142,803
|
|
|
|
LIABILITIES AND STOCKHOLDERS' EQUITY
|
|||||||
|
Liabilities
|
|||||||
|
Revolving credit facility
|
$
|
51,000
|
|
$
|
17,000
|
|
|
|
Accounts payable and accrued liabilities
|
3,541
|
|
812
|
|
|||
|
Other liabilities
|
2,981
|
|
2,721
|
|
|||
|
Total liabilities
|
57,522
|
|
20,533
|
|
|||
|
Commitments and contingencies
|
|
|
|
|
|||
|
Stockholders' Equity
|
|||||||
|
Preferred stock, $0.01 par value; 50,000,000 shares authorized; none issued and outstanding
|
—
|
|
—
|
|
|||
|
Common stock, $0.01 par value; 450,000,000 shares authorized; 12,988,482 and 7,596,940 shares issued and outstanding at December 31, 2016 and 2015, respectively
|
130
|
|
76
|
|
|||
|
Additional paid-in capital
|
214,323
|
|
127,578
|
|
|||
|
Cumulative net income (loss)
|
1,265
|
|
(1,456
|
)
|
|||
|
Cumulative dividends
|
(21,711
|
)
|
(3,928
|
)
|
|||
|
Total stockholders’ equity
|
194,007
|
|
122,270
|
|
|||
|
Total liabilities and stockholders' equity
|
$
|
251,529
|
|
$
|
142,803
|
|
|
See accompanying notes to the consolidated financial statements.
58
COMMUNITY HEALTHCARE TRUST INCORPORATED
(Dollars in thousands, except per share amounts)
|
Year Ended December 31,
|
For the Period
March 28, 2014
(inception)
through December 31,
|
||||||||||
|
2016
|
2015
|
2014
|
|||||||||
|
REVENUES
|
|||||||||||
|
Rental income
|
$
|
18,999
|
|
$
|
6,364
|
|
$
|
—
|
|
||
|
Tenant reimbursements
|
4,564
|
|
1,964
|
|
—
|
|
|||||
|
Mortgage interest
|
1,634
|
|
304
|
|
—
|
|
|||||
|
25,197
|
|
8,632
|
|
—
|
|
||||||
|
EXPENSES
|
|||||||||||
|
Property operating
|
4,744
|
|
2,012
|
|
—
|
|
|||||
|
General and administrative
|
3,228
|
|
2,472
|
|
—
|
|
|||||
|
Depreciation and amortization
|
13,201
|
|
5,204
|
|
—
|
|
|||||
|
Bad debts
|
155
|
|
71
|
|
—
|
|
|||||
|
21,328
|
|
9,759
|
|
—
|
|
||||||
|
OTHER INCOME (EXPENSE)
|
|||||||||||
|
Interest expense
|
(1,178
|
)
|
(364
|
)
|
—
|
|
|||||
|
Interest and other income, net
|
30
|
|
35
|
|
—
|
|
|||||
|
(1,148
|
)
|
(329
|
)
|
—
|
|
||||||
|
NET INCOME (LOSS) AND COMPREHENSIVE INCOME (LOSS)
|
$
|
2,721
|
|
$
|
(1,456
|
)
|
$
|
—
|
|
||
|
INCOME (LOSS) PER COMMON SHARE:
|
|||||||||||
|
Net income (loss) per common share – Basic
|
$
|
0.24
|
|
$
|
(0.31
|
)
|
$
|
—
|
|
||
|
Net income (loss) per common share – Diluted
|
$
|
0.24
|
|
$
|
(0.31
|
)
|
$
|
—
|
|
||
|
WEIGHTED AVERAGE COMMON SHARE OUTSTANDING-BASIC
|
11,238,437
|
|
4,726,925
|
|
200,000
|
|
|||||
|
WEIGHTED AVERAGE COMMON SHARE OUTSTANDING-DILUTED
|
11,319,505
|
|
4,726,925
|
|
200,000
|
|
|||||
See accompanying notes to the consolidated financial statements.
59
COMMUNITY HEALTHCARE TRUST INCORPORATED
CONSOLIDATED STATEMENTS OF STOCKHOLDERS’ EQUITY
(Dollars in thousands, except per share amounts)
|
Preferred Stock
|
Common Stock
|
||||||||||||||||||||||||||||
|
Shares
|
Amount
|
Shares
|
Amount
|
Additional
Paid in
Capital
|
Cumulative
Net Income
(Loss)
|
Cumulative
Dividends
|
Total
Stockholders'
Equity
|
||||||||||||||||||||||
|
Balance at March 28, 2014 (date of inception)
|
—
|
|
$
|
—
|
|
—
|
|
$
|
—
|
|
$
|
—
|
|
$
|
—
|
|
$
|
—
|
|
$
|
—
|
|
|||||||
|
Issuance of common stock
|
—
|
|
—
|
|
200,000
|
|
2
|
|
—
|
|
—
|
|
—
|
|
2
|
|
|||||||||||||
|
Balance at December 31, 2014
|
—
|
|
—
|
|
200,000
|
|
2
|
|
—
|
|
—
|
|
—
|
|
2
|
|
|||||||||||||
|
Issuance of common stock, net of offering costs
|
—
|
|
—
|
|
7,311,183
|
|
73
|
|
127,413
|
|
—
|
|
—
|
|
127,486
|
|
|||||||||||||
|
Stock-based compensation
|
—
|
|
—
|
|
85,757
|
|
1
|
|
165
|
|
—
|
|
—
|
|
166
|
|
|||||||||||||
|
Net loss
|
—
|
|
—
|
|
—
|
|
—
|
|
—
|
|
(1,456
|
)
|
—
|
|
(1,456
|
)
|
|||||||||||||
|
Dividends to common stockholders ($0.517 per share)
|
—
|
|
—
|
|
—
|
|
—
|
|
—
|
|
—
|
|
(3,928
|
)
|
(3,928
|
)
|
|||||||||||||
|
Balance at December 31, 2015
|
—
|
|
$
|
—
|
|
7,596,940
|
|
$
|
76
|
|
$
|
127,578
|
|
$
|
(1,456
|
)
|
$
|
(3,928
|
)
|
$
|
122,270
|
|
|||||||
|
Issuance of common stock, net of offering costs
|
—
|
|
—
|
|
5,175,000
|
|
52
|
|
86,073
|
|
—
|
|
—
|
|
86,125
|
|
|||||||||||||
|
Stock-based compensation
|
—
|
|
—
|
|
216,542
|
|
2
|
|
672
|
|
—
|
|
—
|
|
674
|
|
|||||||||||||
|
Net income
|
—
|
|
—
|
|
—
|
|
—
|
|
—
|
|
2,721
|
|
—
|
|
2,721
|
|
|||||||||||||
|
Dividends to common stockholders ($1.525 per share)
|
—
|
|
—
|
|
—
|
|
—
|
|
—
|
|
—
|
|
(17,783
|
)
|
(17,783
|
)
|
|||||||||||||
|
Balance at December 31, 2016
|
—
|
|
$
|
—
|
|
12,988,482
|
|
$
|
130
|
|
$
|
214,323
|
|
$
|
1,265
|
|
$
|
(21,711
|
)
|
$
|
194,007
|
|
|||||||
See accompanying notes to the consolidated financial statements.
60
COMMUNITY HEALTHCARE TRUST INCORPORATED
(In thousands)
|
For the Year Ended
December 31,
|
For the Period
March 28, 2014 (inception)
through December 31,
|
||||||||||
|
2016
|
2015
|
2014
|
|||||||||
|
OPERATING ACTIVITIES
|
|||||||||||
|
Net income (loss)
|
$
|
2,721
|
|
$
|
(1,456
|
)
|
$
|
—
|
|
||
|
Adjustments to reconcile net income (loss) to net cash provided by operating activities:
|
|||||||||||
|
Depreciation and amortization
|
13,383
|
|
5,320
|
|
—
|
|
|||||
|
Stock-based compensation
|
674
|
|
166
|
|
—
|
|
|||||
|
Straight-line rent receivable
|
(611
|
)
|
(133
|
)
|
—
|
|
|||||
|
Straight-line rent liability
|
5
|
|
—
|
|
—
|
|
|||||
|
Provision for bad debts, net of recoveries
|
155
|
|
71
|
|
—
|
|
|||||
|
Reduction in contingent purchase price
|
(1,279
|
)
|
—
|
|
—
|
|
|||||
|
Changes in operating assets and liabilities:
|
|||||||||||
|
Other assets
|
(1,956
|
)
|
(1,811
|
)
|
—
|
|
|||||
|
Accounts payable and accrued liabilities
|
2,127
|
|
326
|
|
—
|
|
|||||
|
Other liabilities
|
(290
|
)
|
488
|
|
—
|
|
|||||
|
Net cash provided by operating activities
|
14,929
|
|
2,971
|
|
—
|
|
|||||
|
INVESTING ACTIVITIES
|
|||||||||||
|
Acquisitions of real estate
|
(103,206
|
)
|
(128,950
|
)
|
—
|
|
|||||
|
Funding of mortgage note receivable
|
(12,406
|
)
|
(10,863
|
)
|
—
|
|
|||||
|
Proceeds from repayments on notes receivable
|
104
|
|
—
|
|
—
|
|
|||||
|
Capital expenditures on existing real estate properties
|
(1,579
|
)
|
(827
|
)
|
—
|
|
|||||
|
Net cash used in investing activities
|
(117,087
|
)
|
(140,640
|
)
|
—
|
|
|||||
|
FINANCING ACTIVITIES
|
|||||||||||
|
Net borrowings on revolving credit facility
|
34,000
|
|
17,000
|
|
—
|
|
|||||
|
Dividends paid
|
(17,783
|
)
|
(3,928
|
)
|
—
|
|
|||||
|
Net proceeds from issuance of common stock
|
86,805
|
|
129,353
|
|
2
|
|
|||||
|
Equity issuance costs
|
(680
|
)
|
(1,867
|
)
|
—
|
|
|||||
|
Debt issuance costs
|
(634
|
)
|
(873
|
)
|
—
|
|
|||||
|
Net cash provided by financing activities
|
101,708
|
|
139,685
|
|
2
|
|
|||||
|
(Decrease) increase in cash and cash equivalents
|
$
|
(450
|
)
|
$
|
2,016
|
|
$
|
2
|
|
||
|
Cash and cash equivalents, beginning of period
|
2,018
|
|
2
|
|
—
|
|
|||||
|
Cash and cash equivalents, end of period
|
$
|
1,568
|
|
$
|
2,018
|
|
$
|
2
|
|
||
|
Supplemental Cash Flow Information:
|
|||||||||||
|
Interest paid
|
$
|
564
|
|
$
|
178
|
|
$
|
—
|
|
||
|
Invoices accrued for construction, tenant improvement and other capitalized costs
|
$
|
28
|
|
$
|
52
|
|
$
|
—
|
|
||
|
Conversion of mortgage note upon acquisition of real estate property
|
$
|
12,500
|
|
$
|
—
|
|
$
|
—
|
|
||
See accompanying notes to the consolidated financial statements.
61
COMMUNITY HEALTHCARE TRUST INCORPORATED
NOTES TO CONSOLIDATED FINANCIAL STATEMENTS
December 31, 2016
Business Overview
Community Healthcare Trust Incorporated (the ‘‘Company’’, ‘‘we’’, ‘‘our’’) was organized in the State of Maryland on March 28, 2014. The Company is a fully-integrated healthcare real estate company that owns and acquires real estate properties that are leased to hospitals, doctors, healthcare systems or other healthcare service providers in non-urban markets. The Company conducts its business through an UPREIT structure in which its properties are owned by its operating partnership (the "OP"), either directly or through subsidiaries. The Company is the sole general partner of the OP, owning
100%
of the OP units. On May 27, 2015, the Company completed its initial public offering, issuing
7,187,500
shares of common stock for approximately
$125.2 million
in net proceeds and concurrent private placements to certain officers and directors of
123,683
shares of common stock for approximately
$2.3 million
in net proceeds. In April 2016, the Company completed a follow-on offering of
5,175,000
shares of its common stock for approximately
$86.1 million
in net proceeds. As of
December 31, 2016
, the Company had invested approximately
$263.5 million
in
58
real estate properties, including a mortgage note, which are located in
22
states and total over
1.33
million square feet. Square footage disclosures included in our Notes to Consolidated Financial Statements are Unaudited.
Principles of Consolidation
Our Consolidated Financial Statements include the accounts of the Company, its wholly owned subsidiaries, and may also include joint ventures, partnerships and variable interest entities, or VIEs, where the Company controls the operating activities.
Management must make judgments regarding the Company's level of influence or control over an entity and whether or not the Company is the primary beneficiary of a VIE. Consideration of various factors include, but is not limited to, the Company's ability to direct the activities that most significantly impact the entity's governing body, the size and seniority of the Company's investment, the Company's ability and the rights of other investors to participate in policy making decisions, the Company's ability to replace the manager and/or liquidate the entity. Management's ability to correctly assess its influence or control over an entity when determining the primary beneficiary of a VIE affects the presentation of these entities in the Company's Consolidated Financial Statements. If it is determined that the Company is the primary beneficiary of a VIE, the Company's Consolidated Financial
Statements would include the operating results of the VIE rather than the results of the variable interest in the VIE. Untimely or inaccurate financial information provided to the Company or deficiencies in the VIEs internal control over financial reporting could impact the Company's Consolidated Financial Statements and its internal control over financial reporting.
There were no VIEs at December 31, 2016. The Company identified
one
borrower as a VIE relating to
one
mortgage note receivable of approximately
$11.0 million
at December 31, 2015, but management concluded that the Company was not the primary beneficiary as we did not have the ability to make decisions or direct the activities of the VIE that would impact its economic performance. See Note 4 for more details on these mortgage notes.
All material intercompany accounts, transactions, and balances have been eliminated in the presentation of the Company's Consolidated Financial Statements.
62
Notes to Consolidated Financial Statements - Continued
Jumpstart Our Business Startups Act of 2012
The Company has elected the "emerging growth company,’’ status as permitted under the Jumpstart Our Business Startups Act of 2012, or the JOBS Act. Management has elected to ‘‘opt out’’ of the provision allowed under the JOBS Act to take advantage of an extended transition period to comply with new or revised accounting standards applicable to public companies. As a result, we will be required to comply with new or revised accounting standards as required when they are adopted. The decision to opt out of the extended transition period under the JOBS Act is irrevocable.
Use of Estimates in the Consolidated Financial Statements
Preparation of the Consolidated Financial Statements in accordance with GAAP requires management to make estimates and assumptions that affect amounts reported in the Consolidated Financial Statements and accompanying notes. Actual results may materially differ from those estimates.
Segment Reporting
The Company acquires and owns, or finances, healthcare-related real estate properties that are leased to hospitals, doctors, healthcare systems or other healthcare service providers in non-urban markets. The Company is managed as
one
reporting unit, rather than multiple reporting units, for internal reporting purposes and for internal decision-making. Therefore, the Company discloses its operating results in a single segment.
Cash and Cash Equivalents
Cash and cash equivalents includes short-term investments with original maturities of three months or less when purchased.
Real Estate Properties
Real estate properties are recorded at cost or at fair value if acquired in a transaction that is a business combination under ASC 805. Cost or fair value at the time of acquisition is allocated between land, buildings, tenant improvements, lease and other intangibles, and personal property, as applicable. The Company's gross real estate assets, on a financial reporting basis, totaled approximately
$252.7 million
and $
133.0 million
, respectively, at December 31, 2016 and 2015.
Depreciation and amortization of real estate assets and liabilities in place as of
December 31, 2016
, is recognized on a straight-line basis over the estimated useful lives of the assets. The estimated useful lives at
December 31, 2016
are as follows:
|
Land improvements
|
3 - 15 years
|
|
Buildings
|
20 - 40 years
|
|
Building improvements
|
3.0 - 39.8 years
|
|
Tenant improvements
|
2.3 - 6.9 years
|
|
Lease intangibles
|
1.2 - 13.7 years
|
|
Personal property
|
3 -10 years
|
Accounting for Acquisitions of Real Estate Properties
Real estate properties are recorded at cost or, if acquired through business combination, at fair value. The allocation of real estate property acquisitions may include land, building and improvements, personal property, and identified intangible assets and liabilities (consisting of above- and below-market leases, in-place leases, and tenant relationships) based on the evaluation of information and estimates available at that date in accordance with the provisions of ASC 805, and we allocate the purchase price based on these assessments. We make estimates of the
63
Notes to Consolidated Financial Statements - Continued
acquisition date fair value of the tangible and intangible assets and acquired liabilities using information obtained from multiple sources as a result of pre-acquisition due diligence, tax records, and other sources. Based on these estimates, we recognize the acquired assets and liabilities at their estimated fair values. Initial valuations are subject to change until the information is finalized, no later than 12 months from the acquisition date. We expense transaction costs associated with business combinations in the period incurred. In accordance with ASC 805, the fair value of tangible property assets acquired considers the value of the property as if vacant determined by comparable sales and other relevant data. The determination of fair value involves the use of significant judgment and estimation. We value land based on various inputs, which may include internal analysis of recently acquired properties, existing comparable properties within our portfolio, or third party appraisals or valuations based on comparable sales.
In recognizing identified intangible assets and liabilities of an acquired property, the value of above-or-below market leases is estimated based on the present value (using a discount rate which reflects the risks associated with the leases acquired) of the difference between contractual amounts to be received pursuant to the leases and management’s estimate of market lease rates measured over a period equal to the estimated remaining term of the lease. In the case of a below-market lease, the Company would also evaluate any renewal options associated with that lease to determine if the intangible should include those periods. The capitalized above-market or below-market lease intangibles are amortized as a reduction or addition to rental income over the estimated remaining term of the respective leases.
In determining the value of in-place leases and tenant relationships, management considers current market conditions and costs to execute similar leases in arriving at an estimate of the carrying costs during the expected lease-up period from vacant to existing occupancy. In estimating carrying costs, management includes real estate taxes, insurance, other property operating expenses, estimates of lost rental revenue during the expected lease-up periods, and costs to execute similar leases, including leasing commissions. The values assigned to in-place leases and tenant relationships are amortized over the estimated remaining term of the lease. If a lease terminates prior to its scheduled expiration, all unamortized costs related to that lease are written off.
Property acquisitions not meeting the accounting criteria to be accounted for as a business combination are accounted for as an asset acquisition. An asset acquisition is recorded at its purchase price, inclusive of acquisition costs, which is allocated among the acquired assets and assumed liabilities based upon their relative fair values at the date of acquisition.
Asset Impairments
The Company assesses the potential for impairment of identifiable, definite-lived, intangible assets and long-lived assets, including real estate properties, whenever events occur or a change in circumstances indicates that the carrying value might not be fully recoverable. Indicators of impairment may include significant under-performance of an asset relative to historical or expected operating results; significant changes in the Company’s use of assets or the strategy for its overall business; plans to sell an asset before its depreciable life has ended; the expiration of a significant portion of leases in a property; or significant negative economic trends or negative industry trends for the Company or its operators. In addition, the Company’s review for possible impairment may include those assets subject to purchase options and those impacted by casualties, such as tornadoes and hurricanes. If management determines that the carrying value of the Company’s assets may not be fully recoverable based on the existence of any of the factors above, or others, management would measure and record an impairment charge based on the estimated fair value of the property or the estimated fair value less costs to sell the property. No indicators of impairment occurred during 2016 or 2015 to warrant management to test any of its assets for impairment. Therefore,
no
impairments were recorded in either of the years ended December 31, 2016 or 2015.
Fair Value Measurements
Fair value is defined as the price that would be received to sell an asset, or paid to transfer a liability, in an orderly transaction between market participants. In calculating fair value, a company must maximize the use of observable
64
Notes to Consolidated Financial Statements - Continued
market inputs, minimize the use of unobservable market inputs and disclose in the form of an outlined hierarchy the details of such fair value measurements.
A hierarchy of valuation techniques is defined to determine whether the inputs to a fair value measurement are considered to be observable or unobservable in a marketplace. Observable inputs reflect market data obtained from independent sources, while unobservable inputs reflect the Company’s market assumptions. This hierarchy requires the use of observable market data when available. These inputs have created the following fair value hierarchy:
|
•
|
Level 1
– quoted prices for identical instruments in active markets.
|
|
•
|
Level 2
– quoted prices for similar instruments in active markets; quoted prices for identical or similar instruments in markets that are not active; and model-derived valuations in which significant inputs and significant value drivers are observable in active markets; and
|
|
•
|
Level 3
– fair value measurements derived from valuation techniques in which one or more significant inputs or significant value drivers are unobservable.
|
Executed purchase and sale agreements, that are binding agreements, are categorized as Level 1 inputs. Brokerage estimates, letters of intent, or unexecuted purchase and sale agreements are considered to be Level 3 as they are non-binding in nature.
Lease Accounting
We, as lessor, make a determination with respect to each of our leases whether they should be accounted for as operating leases or capital leases. The classification criteria is based on estimates regarding the fair value of the leased facilities, minimum lease payments, effective cost of funds, the economic useful life of the facilities, the existence of a bargain purchase option, and certain other terms in the lease agreements. We believe all of our leases should be accounted for as operating leases. Payments received under operating leases are accounted for in the Consolidated Statements of Comprehensive Income (Loss) as rental income for actual cash rent collected plus or minus straight-line adjustments, such as lease escalators. Assets subject to operating leases are reported as real estate investments in the Consolidated Balance Sheets.
Many of our leases contain fixed or formula-based rent escalators. To the extent that the escalator increases are tied to a fixed index or rate, lease payments are accounted for on a straight-line basis over the life of the lease.
Revenue Recognition
The Company recognizes rental revenue when it is realized or realizable and earned. There are four criteria that must all be met before a Company may recognize revenue, including persuasive evidence of an arrangement exists, delivery has occurred or services have been rendered (i.e., the tenant has taken possession of and controls the physical use of the leased asset), the price has been fixed or is determinable, and collectability is reasonably assured.
The Company derives most of its revenues from its real estate property and mortgage note portfolio. The Company's rental and mortgage interest income is recognized based on contractual arrangements with its tenants and borrowers.
Rental income is recognized as earned over the life of the lease agreement on a straight-line basis. Recognizing rental revenue on a straight-line basis for leases may result in recognizing revenue in amounts more or less than amounts currently due from tenants. If management determines that the collectability of straight-line rents is not reasonably assured, the amount of future revenue recognized may be limited to amounts contractually owed and, where appropriate, establish an allowance for estimated losses. Straight-line rent included in rental income was approximately
$0.6 million
and
$0.1
million, respectively, for the years ended
December 31, 2016
and
2015
.
No
straight-line rent was recognized in 2014.
65
Notes to Consolidated Financial Statements - Continued
Mortgage interest income is recognized based on the interest rates, maturity dates and amortization periods set forth within each note agreement. Fees received related to its mortgage notes are amortized to mortgage interest income on a straight-line basis which approximates amortization under the effective interest method.
The Company also accrues operating expense recoveries based on the contractual terms of its leases and late fees based on the contractual terms of its leases or notes, which are included in rental income or mortgage interest income, as applicable. Operating expense recoveries included in rental income were approximately
$4.6 million
and
$2.0 million
, respectively, and late fees were approximately
$228,000
and
$40,000
, respectively, for the years ended
December 31, 2016
and
2015
.
No
operating expense recoveries or late fees were recognized in 2014.
Income received but not yet earned is deferred until such time it is earned. Deferred revenue, included in other liabilities on the Consolidated Balance Sheets, was approximately
$0.8 million
and $
0.5
million, respectively, at
December 31, 2016
and
2015
.
No
deferred revenue was recognized in 2014.
Allowance for Doubtful Accounts and Credit Losses
Accounts Receivable
Management monitors the aging and collectability of its accounts receivable balances on an ongoing basis. Whenever deterioration in the timeliness of payment from a tenant is noted, management investigates and determines the reason or reasons for the delay. Considering all information gathered, management’s judgment is exercised in determining whether a receivable is potentially uncollectible and, if so, how much or what percentage may be uncollectible. Among the factors management considers in determining collectability are: the type of contractual arrangement under which the receivable was recorded (e.g., triple net lease, gross lease, or other type of agreement); the tenant’s reason for slow payment; industry influences under which the tenant operates; evidence of willingness and ability of the tenant to pay the receivable; credit-worthiness of the tenant; collateral, security deposit, letters of credit or other monies held as security; tenant’s historical payment pattern; other contractual agreements between the tenant and the Company; relationship between the tenant and the Company; the state in which the tenant operates; and the existence of a guarantor and the willingness and ability of the guarantor to pay the receivable. Considering these factors and others, management concludes whether all or some of the aged receivable balance is likely uncollectible. Upon determining that some portion of the receivable is likely uncollectible, the Company will record a provision for bad debts for the amount it expects will be uncollectible. When efforts to collect a receivable are exhausted, the receivable amount is charged off against the allowance. The Company does not hold any accounts receivable for sale.
Mortgage Note Receivable
At
December 31, 2016
and
2015
, the Company had
one
mortgage note receivable outstanding with a principal balance of approximately
$10.9 million
and
$11.0
million, respectively, maturing on
September 30, 2026
, which bears interest at
9.5%
. The mortgage note was interest only through September 30, 2016.
The Company evaluates collectability of its mortgage notes and records allowances on the notes as necessary. A loan is impaired when it is probable that a creditor will be unable to collect all amounts due according to the contractual terms of the loan as scheduled, including both contractual interest and principal payments. This assessment also includes an evaluation of the loan collateral. If a mortgage loan becomes past due, the Company will review the specific circumstances and may discontinue the accrual of interest on the loan. The loan is not returned to accrual status until the debtor has demonstrated the ability to continue debt service in accordance with the contractual terms. Loans placed on non-accrual status will be accounted for on a cash basis, in which income is recognized only upon the receipt of cash, or on a cost-recovery basis, in which all cash receipts reduce the carrying value of the loan, based on the Company's expectation of future collectability. There were no mortgage notes that were either on non-accrual status or were past due more than ninety days and continued to accrue interest at
December 31, 2016
and
2015
. Also, as of
December 31, 2016
and
2015
, the Company did not hold any of its mortgage notes available for sale and had not recorded any allowances on its mortgage note receivable.
66
Notes to Consolidated Financial Statements - Continued
Also, the Company may receive loan or commitment fees upon funding of a mortgage note. The Company will amortize those fees into income over the life of the mortgage note on a straight-line basis and will reflect the mortgage notes, net of the unamortized, on the consolidated balance sheets.
Stock-Based Compensation
The Company's 2014 Incentive Plan is intended to attract and retain qualified persons upon whom, in large measure, our sustained progress, growth and profitability depend, to motivate the participants to achieve long-term company goals and to more closely align the participants’ interests with those of our other stockholders by providing them with a proprietary interest in our growth and performance. The
three
distinct programs under the 2014 Incentive Plan are the Amended and Restated Alignment of Interest Program, the Amended and Restated Executive Officer Incentive Program and the Non-Executive Officer Incentive Program. Our executive officers, officers, employees, consultants and non-employee directors are eligible to participate in the 2014 Incentive Plan. The 2014 Incentive Plan currently reserves
7%
of the Company’s common stock outstanding after the IPO, including any shares of common stock sold by the Company pursuant to the exercise of any over-allotment options, for issuance as awards. The 2014 Incentive Plan is administered by the Company’s compensation committee, which interprets the 2014 Incentive Plan and has broad discretion to select the eligible persons to whom awards will be granted, as well as the type, size and terms and conditions of each award, including the number of shares subject to awards and the expiration date of, and the vesting schedule or other restrictions (including, without limitation, restrictive covenants) applicable to, awards. The Company recognizes share-based payments to its directors and employees in its Consolidated Statements of Comprehensive Income (Loss) on a straight-line basis over the requisite service period based on the fair value of the award on the measurement date.
Organization and Offering Costs
Some of the costs related to the Company’s organization, its initial public offering and due diligence related to the initial properties acquired by the Company in 2015 were incurred by Athena Funding Partners (“AFP”), which is substantially owned and controlled by Timothy G. Wallace, the Company’s Chairman, Chief Executive Officer and President. The Company entered into a formation services agreement with AFP on April 1, 2014, pursuant to which the Company agreed to reimburse the actual costs incurred by AFP only upon the successful completion of the initial public offering. The costs related to the activities prior to the offering were undertaken by AFP on the Company’s behalf, including the Company’s organization, negotiating the property acquisitions, performing due diligence related to the initial properties, performing corporate work in contemplation of the offering and preparing the Prospectus. Costs incurred include expenses such as legal and accounting fees, certain costs related to performing property due diligence, certain property related costs, travel, overhead, office supplies and office rent. The Company reimbursed AFP approximately
$0.4
million during 2015. AFP has received no further compensation.
Organization costs incurred by the Company in 2015 were expensed. Offering costs incurred are recorded in stockholders’ equity as a reduction to additional paid-in capital.
Intangible Assets
Intangible assets with indefinite lives are not amortized, but are tested at least annually for impairment. Intangible assets with finite lives are amortized over their respective lives to their estimated residual values and are reviewed for impairment only when impairment indicators are present. The Company did not have any indefinite lived intangible assets as of
December 31, 2016
and
2015
.
Identifiable intangible assets of the Company are generally comprised of in-place and above-market lease intangible assets and below-market lease intangible liabilities, as well as deferred financing costs. In-place lease intangible assets are amortized to depreciation expense on a straight-line basis over the applicable lives of the leases. Above- and below-market lease intangibles are amortized to rental income on a straight-line basis over the applicable lives of the leases. Deferred financing costs are amortized to interest expense over the term of the related credit facility or other debt instrument using the straight-line method, which approximates amortization under the effective interest method.
67
Notes to Consolidated Financial Statements - Continued
Contingent Liabilities
From time to time, the Company may be subject to loss contingencies arising from legal proceedings and similar matters. Additionally, while the Company maintains comprehensive liability and property insurance with respect to each of its properties, the Company may be exposed to unforeseen losses related to uninsured or under-insured damages.
Management will monitor any matter that may present a contingent liability, and, on a quarterly basis, will review any reserves and accruals relating to the liabilities, adjusting provisions as necessary in view of changes in available information. Liabilities for contingencies are first recorded when a loss is determined to be both probable and can be reasonably estimated. Changes in estimates regarding the exposure to a contingent loss will be reflected as adjustments to the related liability in the periods when they occur and will be disclosed in the notes to the Consolidated Financial Statements.
On occasion, the Company may also have acquisitions which include contingent consideration. Accounting for business combinations require the Company to estimate the fair value of any contingent purchase consideration at acquisition. Management will monitor these contingencies on a quarterly basis. Changes in estimates regarding contingent purchase consideration will be reflected as adjustments to the related liability in the periods when they occur and will be disclosed in the notes to the Consolidated Financial Statements. See Note 4 for more details.
Income Taxes
The Company has elected to be taxed as a REIT, as defined under the Internal Revenue Code of 1986, as amended (the "Code"). We have also elected for one subsidiary to be treated as a taxable REIT subsidiary ("TRS"), which is subject to federal and state income taxes. No provision has been made for federal income taxes for the REIT; however, the Company has provided federal and state income taxes for the TRS. The Company intends at all times to qualify as a REIT under Sections 856 and 860 of the Code. The Company must distribute at least 90% per annum of its REIT taxable income to its stockholders (which is computed without regard to the dividends paid deduction or net capital gain and which does not necessarily equal net income as calculated in accordance with generally accepted accounting principles) and meet other requirements to continue to qualify as a real estate investment trust. See further discussion in Note 13.
The Company classifies interest and penalties related to uncertain tax positions, if any, in the Consolidated Statements of Comprehensive Income (Loss) as a component of general and administrative expenses.
No
such amounts were recognized during 2016, 2015 or 2014.
The Company is subject to audit by the Internal Revenue Service and by state taxing authorities for the year ended December 31, 2015 and for the period from March 28, 2014 (date of inception) through December 31, 2014.
Sales and Use Taxes
The Company must pay sales and use taxes to certain state tax authorities based on rent collected from tenants in properties located in those states. The Company is generally reimbursed for those taxes by those tenants. The Company accounts for the payments to the taxing authority and subsequent reimbursement from the tenant on a net basis, included in tenant reimbursement revenue on the Company’s Consolidated Statements of Comprehensive Income (Loss).
Concentration of Credit Risks
Our credit risks primarily relate to cash and cash equivalents and our
one
mortgage note receivable. Cash and cash equivalents are primarily held in bank accounts and overnight investments. We maintain our bank deposit accounts with large financial institutions in amounts that often exceed federally-insured limits. We have not experienced any losses in such accounts.
68
Notes to Consolidated Financial Statements - Continued
Earnings per Share
Basic earnings per common share is calculated using weighted average shares outstanding less issued and outstanding non-vested shares of common stock. Diluted earnings per common share is calculated using weighted average shares outstanding plus the dilutive effect of the non-vested shares of common stock using the treasury stock method and the average stock price during the period.
New Accounting Pronouncements
In January 2017, the Financial Accounting Standards Board ("FASB") issued Accounting Standards Update ("ASU") No. 2017-01
, Business Combinations (Topic 805): Clarifying the Definition of a Business.
The new guidance requires an entity to first evaluate whether substantially all of the fair value of the assets acquired is concentrated in a single identifiable asset or group of similar identifiable assets, and if that threshold is met, then it is not a business. Secondly, the new guidance requires a business to include at least one substantive process and narrows the definition of outputs by more closely aligning it with how outputs are described in the new revenue recognition guidance. Under this new guidance, acquiring tangible assets (land, building) with in-place leases may be considered a single identifiable asset. This change in the definition of a business should result in more real estate acquisitions being accounted for as asset acquisitions, rather than business combinations, which would allow companies to capitalize more acquisition costs into the real estate assets acquired. We adopted this new standard on January 1, 2017 and expect that most of our real estate property acquisitions will be accounted for as asset acquisitions.
In February 2016, the FASB issued ASU No. 2016-02,
Leases
. This standard requires a lessor to classify leases as either sales-type, finance or operating. A lease will be treated as a sale if it transfers all of the risks and rewards, as well as control of the underlying asset, to the lessee. If risks and rewards are conveyed without the transfer of control, the lease is treated as a financing. If the lessor doesn’t convey risks and rewards or control, an operating lease results. The standard is effective for fiscal years beginning after December 15, 2018, including interim periods within those fiscal years. A modified retrospective transition approach is required for lessors for sales-type, direct financing, and operating leases existing at, or entered into after, the beginning of the earliest comparative period presented in the financial statements, with certain practical expedients available. We are not currently a lessee in any material lease arrangements and the amendments in ASU 2016-02 do not significantly change the current lessor accounting model; therefore, we do not currently believe that the adoption of this standard will have a material impact on our Consolidated Financial Statements.
In March 2016, the FASB issued ASU No. 2016-09,
Compensation - Stock Compensation; Improvements to
Employee Share-Based Payment Accounting.
This standard is intended to simplify accounting for share-based
payment transactions. The areas for simplification in this update that could be relevant to the Company in the future are: (i) forfeitures-an entity can make an entity-wide accounting policy election to either estimate the number of awards that are expected to vest or account for forfeitures when they occur; (ii) minimum statutory tax withholding requirements-the threshold to qualify for equity classification permits withholding up to the maximum statutory tax rates in the applicable jurisdiction; and (iii) classification of employee taxes paid on the statement of cash flows when an employer withholds shares for tax-withholding purposes-cash paid by an employer when directly withholding shares for tax-withholding purposes should be classified as a financing activity. The Company adopted this standard effective January 1, 2017. There was no impact to the Company's Condensed Consolidated Financial Statements resulting from the adoption of this standard.
In May 2014, the FASB issued ASU No. 2014-09, as amended by ASU No. 2015-14,
Revenue from Contracts with Customers
, a comprehensive new revenue recognition standard that supersedes most existing revenue recognition guidance, including sales of real estate. This standard's core principle is that a company will recognize revenue when it transfers goods or services to customers in amounts that reflect the consideration to which the company expects to be entitled in exchange for those goods and services. However, leasing contracts, representing the major source of the Company's revenues, are not within the scope of the new standard and will continue to be accounted for under other standards. This new standard is effective for the Company for annual and interim periods beginning on January 1, 2018 with early adoption permitted in 2017. The Company is currently evaluating the impact that ASU 2014-09 will have on revenues generated from activities other than leasing.
69
Notes to Consolidated Financial Statements - Continued
In June 2016, the FASB issued ASU No. 2016-13,
Financial Instruments-Credit Losses
, which changes the
impairment model for most financial assets and certain other instruments. For trade and other receivables, held-to-maturity debt securities, loans and other instruments, companies will be required to use a new forward-looking
“expected loss” model that generally will result in the earlier recognition of allowances for losses. For available-for-sale debt securities with unrealized losses, companies will measure credit losses in a manner similar to what they do
today, except that the losses will be recognized as allowances rather than as reductions in the amortized cost of the
securities. Companies will have to disclose significantly more information, including information they use to track
credit quality by year of origination for most financing receivables. Companies will apply the standard’s provisions
as a cumulative-effect adjustment to retained earnings as of the beginning of the first reporting period in which the
guidance is adopted. This standard is effective for the Company on January 1, 2020 with early adoption permitted. The Company is in the initial stage of evaluating the impact of this new standard on its notes and trade receivables.
In August 2016, the FASB issued ASU No. 2016-15,
Statement of Cash Flows (Topic 230) Classification of Certain
Cash Receipts and Cash Payments,
which clarifies or provides guidance relating to eight specific cash flow
classification issues. The standard should be applied retrospectively for each period presented, as appropriate. This
new standard is effective for the Company on January 1, 2018 with early adoption permitted. Of the eight areas addressed, the Company expects that its presentation on its statements of cash flows could be impacted relating to cash payments of contingent consideration or settlement of insurance claims, based on historical transactions. In the future, however, the impact of this new guidance will depend on future transactions, though the impact will only be related to the classification of those items on the statement of cash flows and will not impact the Company's cash flows or its results of operations.
70
Notes to Consolidated Financial Statements - Continued
As of
December 31, 2016
, the Company had investments of approximately
$263.5 million
in
58
real estate properties, including
one
mortgage note receivable. The following table summarizes the Company's investments.
|
(Dollars in thousands)
|
Number of
Facilities
|
Land and
Land
Improvements
|
Buildings,
Improvements, and
Lease Intangibles
|
Personal
Property
|
Total
|
Accumulated
Depreciation
|
||||||||||||||||
|
Medical office buildings:
|
||||||||||||||||||||||
|
Florida
|
4
|
|
$
|
4,138
|
|
$
|
23,777
|
|
$
|
—
|
|
$
|
27,915
|
|
$
|
1,206
|
|
|||||
|
Ohio
|
3
|
|
1,999
|
|
15,972
|
|
—
|
|
17,971
|
|
1,435
|
|
||||||||||
|
Texas
|
3
|
|
3,096
|
|
12,172
|
|
—
|
|
15,268
|
|
1,948
|
|
||||||||||
|
Iowa
|
1
|
|
2,241
|
|
8,989
|
|
—
|
|
11,230
|
|
87
|
|
||||||||||
|
Illinois
|
1
|
|
821
|
|
8,760
|
|
—
|
|
9,581
|
|
904
|
|
||||||||||
|
Kentucky
|
1
|
|
669
|
|
4,212
|
|
—
|
|
4,881
|
|
392
|
|
||||||||||
|
New York
|
1
|
|
645
|
|
3,954
|
|
—
|
|
4,599
|
|
61
|
|
||||||||||
|
Georgia
|
1
|
|
366
|
|
3,084
|
|
—
|
|
3,450
|
|
578
|
|
||||||||||
|
Other states
|
4
|
|
1,739
|
|
12,673
|
|
—
|
|
14,412
|
|
2,074
|
|
||||||||||
|
19
|
|
15,714
|
|
93,593
|
|
—
|
|
109,307
|
|
8,685
|
|
|||||||||||
|
Physician clinics:
|
||||||||||||||||||||||
|
Kansas
|
3
|
|
1,558
|
|
10,899
|
|
—
|
|
12,457
|
|
1,179
|
|
||||||||||
|
Florida
|
3
|
|
—
|
|
5,950
|
|
—
|
|
5,950
|
|
314
|
|
||||||||||
|
Ohio
|
1
|
|
677
|
|
2,590
|
|
—
|
|
3,267
|
|
33
|
|
||||||||||
|
Alabama
|
1
|
|
533
|
|
2,663
|
|
—
|
|
3,196
|
|
133
|
|
||||||||||
|
Pennsylvania
|
1
|
|
330
|
|
2,770
|
|
—
|
|
3,100
|
|
639
|
|
||||||||||
|
Wisconsin
|
1
|
|
412
|
|
2,588
|
|
—
|
|
3,000
|
|
386
|
|
||||||||||
|
Other states
|
4
|
|
638
|
|
6,416
|
|
—
|
|
7,054
|
|
575
|
|
||||||||||
|
14
|
|
4,148
|
|
33,876
|
|
—
|
|
38,024
|
|
3,259
|
|
|||||||||||
|
Surgical centers and hospitals
|
||||||||||||||||||||||
|
Louisiana
|
1
|
|
1,683
|
|
21,353
|
|
—
|
|
23,036
|
|
44
|
|
||||||||||
|
Michigan
|
2
|
|
628
|
|
8,266
|
|
—
|
|
8,894
|
|
956
|
|
||||||||||
|
Illinois
|
1
|
|
2,100
|
|
5,402
|
|
—
|
|
7,502
|
|
316
|
|
||||||||||
|
Arizona
|
2
|
|
576
|
|
5,389
|
|
—
|
|
5,965
|
|
494
|
|
||||||||||
|
Other states
|
5
|
|
1,555
|
|
10,993
|
|
—
|
|
12,548
|
|
1,922
|
|
||||||||||
|
11
|
|
6,542
|
|
51,403
|
|
—
|
|
57,945
|
|
3,732
|
|
|||||||||||
|
Specialty centers
|
||||||||||||||||||||||
|
Alabama
|
3
|
|
415
|
|
4,417
|
|
—
|
|
4,832
|
|
790
|
|
||||||||||
|
Kentucky
|
1
|
|
193
|
|
3,423
|
|
—
|
|
3,616
|
|
486
|
|
||||||||||
|
Texas
|
1
|
|
181
|
|
2,992
|
|
—
|
|
3,173
|
|
266
|
|
||||||||||
|
Colorado
|
1
|
|
259
|
|
2,791
|
|
—
|
|
3,050
|
|
336
|
|
||||||||||
|
North Carolina
|
1
|
|
681
|
|
2,340
|
|
—
|
|
3,021
|
|
22
|
|
||||||||||
|
Other states
|
4
|
|
181
|
|
5,334
|
|
—
|
|
5,515
|
|
441
|
|
||||||||||
|
11
|
|
1,910
|
|
21,297
|
|
—
|
|
23,207
|
|
2,341
|
|
|||||||||||
|
Behavioral facilities:
|
||||||||||||||||||||||
|
Illinois
|
1
|
|
1,300
|
|
18,803
|
|
—
|
|
20,103
|
|
274
|
|
||||||||||
|
Indiana
|
1
|
|
270
|
|
2,651
|
|
—
|
|
2,921
|
|
78
|
|
||||||||||
|
2
|
|
1,570
|
|
21,454
|
|
—
|
|
23,024
|
|
352
|
|
|||||||||||
|
Corporate property
|
—
|
|
—
|
|
1,132
|
|
97
|
|
1,229
|
|
35
|
|
||||||||||
|
Total owned properties
|
57
|
|
$
|
29,884
|
|
$
|
222,755
|
|
$
|
97
|
|
$
|
252,736
|
|
$
|
18,404
|
|
|||||
|
Mortgage note receivable, net
|
1
|
|
—
|
|
—
|
|
—
|
|
10,786
|
|
—
|
|
||||||||||
|
Total real estate investments
|
58
|
|
$
|
29,884
|
|
$
|
222,755
|
|
$
|
97
|
|
$
|
263,522
|
|
$
|
18,404
|
|
|||||
71
Notes to Consolidated Financial Statements - Continued
The Company’s properties are generally leased pursuant to non-cancelable, fixed-term operating leases with expiration dates through
2031
. The Company’s leases generally require the lessee to pay minimum rent, with fixed rent renewal terms or increases based on a Consumer Price Index and additional rent, which may include taxes (including property taxes), insurance, maintenance and other operating costs associated with the leased property. Certain of the Company's leases provide the lessee with a purchase option or a right of first refusal to purchase the leased property. The purchase option provisions generally allow the lessee to purchase the leased property at fair market value or at an amount greater than the Company's gross investment in the leased property at the time of the purchase. No purchase options were exercised during
December 31, 2016
.
Future Minimum Lease Payments
Future minimum lease payments under the non-cancelable operating leases due the Company for the years ending December 31, as of
December 31, 2016
, are as follows (in thousands):
|
2017
|
$
|
23,779
|
|
|
2018
|
20,155
|
|
|
|
2019
|
17,073
|
|
|
|
2020
|
14,740
|
|
|
|
2021
|
12,754
|
|
|
|
2022 and thereafter
|
75,458
|
|
|
|
$
|
163,959
|
|
|
Revenue Concentrations
The Company's real estate portfolio is leased to a diverse tenant base. At
December 31, 2016
and
2015
, the Company had
no
customers that accounted for more than 10% of its consolidated revenues.
The Company's portfolio is currently located in
22
states with approximately
55.2%
of our consolidated revenues for the year ended December 31, 2016 derived from properties located in Florida (
15.5%
), Illinois (
15.3%
), Kansas (
13.5%
) and Texas (
10.9%
).
2016 Real Estate Acquisitions
During the fourth quarter of 2016, the Company acquired
six
real estate properties totaling approximately
187,098
square feet for an aggregate purchase price of approximately
$45.6 million
, including cash consideration of approximately
$45.2 million
. Upon acquisition, the properties were
98.1%
leased with lease expirations ranging from
2017 through 2031
. Amounts reflected in revenues and net income for the year ended
December 31, 2016
for these properties was approximately
$0.5 million
and
$0.2 million
, respectively. The Company incurred transaction costs of approximately
$0.2 million
during the fourth quarter of 2016 related to its acquisitions accounted for as business combinations which are included in general and administrative expenses in the accompanying Consolidated Statements of Comprehensive Income (Loss). Transaction costs related to its acquisition accounted for as an asset purchase were capitalized in the period as part of the real estate asset.
During the third quarter of 2016, the Company acquired
four
real estate properties totaling approximately
57,983
square feet for an aggregate purchase price of approximately
$12.1 million
, including cash consideration of approximately
$12.1 million
. Upon acquisition, the properties were
100.0%
leased with lease expirations ranging from
2018 through 2031
. Amounts reflected in revenues and net income for the year ended
December 31, 2016
for these properties was approximately
$0.4 million
and
$0.2 million
, respectively. The Company incurred transaction costs of approximately
$0.1 million
during the third quarter of 2016 related to its acquisitions accounted for as
72
Notes to Consolidated Financial Statements - Continued
business combinations which are included in general and administrative expenses in the accompanying Consolidated Statements of Comprehensive Income (Loss). Transaction costs related to its acquisition accounted for as an asset purchase were capitalized in the period as part of the real estate asset.
During the second quarter of 2016, the Company acquired
three
real estate properties totaling approximately
153,446
square feet for an aggregate purchase price of approximately
$33.5 million
, including cash consideration of approximately
$21.1 million
and the conversion of a
$12.5 million
mortgage note receivable. Upon acquisition, the properties were approximately
93.7%
leased in the aggregate with lease expirations ranging from
2016 through 2031
. In addition,
one
of the properties includes contingent consideration which could result in additional purchase price of up to
$500,000
. At December 31, 2016, the Company had adjusted the fair value of this contingency to approximately
$398,000
. The Company will monitor this contingency throughout the contingency period that ends in April 2017 and will record any adjustments as needed on a quarterly basis until the contingency is resolved. Amounts reflected in revenues and net income for the year ended
December 31, 2016
for these properties was approximately
$3.1 million
and
$1.6 million
, respectively, which included approximately
$0.6 million
of interest income relating to the mortgage note. The Company incurred transaction costs of approximately
$0.2 million
during the second quarter of 2016 which are included in general and administrative expenses in the accompanying Consolidated Statements of Comprehensive Income (Loss).
During the first quarter of 2016, the Company acquired
four
real estate properties totaling approximately
146,443
square feet for an aggregate purchase price of approximately
$25.4 million
, including cash consideration of approximately
$25.6 million
. Upon acquisition, the properties were approximately
95.6%
leased in the aggregate with lease expirations ranging from
2017 through 2026
. Amounts reflected in revenues and net income for the year ended
December 31, 2016
for these properties was approximately
$2.8 million
and
$0.8 million
, respectively. The Company incurred transaction costs of approximately
$0.3 million
during the first quarter of 2016 which are included in general and administration expenses in the accompanying Consolidated Statements of Comprehensive Income (Loss).
For the properties acquired during 2016 that we accounted for as business combinations, the unaudited pro forma revenue and net income for the years ended
December 31, 2016
and
2015
are provided below as if the properties had been acquired on January 1, 2015.
|
Year Ended
December 31,
|
||||||
|
(unaudited; in thousands)
|
2016
|
2015
|
||||
|
Revenues
|
$
|
29,503
|
|
$
|
17,625
|
|
|
Net income
|
$
|
3,975
|
|
$
|
802
|
|
73
Notes to Consolidated Financial Statements - Continued
The following table summarizes the estimated fair values of the assets acquired and liabilities assumed in the property acquisitions during 2016.
|
Estimated Fair Value
|
Estimated Useful Life
|
||||
|
(In thousands)
|
(In years)
|
||||
|
Land
|
$
|
16,476
|
|
||
|
Buildings
|
87,753
|
|
20 - 40
|
||
|
Intangibles:
|
|||||
|
At-market lease intangibles
|
13,961
|
|
2.3 - 13.7
|
||
|
Above-market lease intangibles
|
26
|
|
0.7
|
||
|
Below-market lease intangibles
|
(923
|
)
|
8.8
|
||
|
Total intangibles
|
13,064
|
|
|||
|
Accounts receivable and other assets assumed
|
51
|
|
|||
|
Accounts payable, accrued liabilities and other liabilities assumed
(1)
|
(661
|
)
|
|||
|
Contingent liabilities
|
(487
|
)
|
|||
|
Mortgage note conversion
|
(12,500
|
)
|
|||
|
Prorated rent, interest and operating expense reimbursement amounts collected
|
(490
|
)
|
|||
|
Expenses paid, including closing costs
|
773
|
|
|||
|
Total cash consideration
|
$
|
103,979
|
|
||
|
(1)
Includes security deposits received and property taxes payable prior to the acquisition.
|
|||||
Mortgage Notes Receivable
During the first quarter of 2016, the Company funded a
$12.5 million
mortgage note secured by an
85,000
square
foot behavioral facility in Illinois which was scheduled to mature on
January 31, 2027
. The Company received a loan fee from the transaction totaling
$93,750
which was deferred and was being recognized into income on a straight-line basis, which approximated the effective interest method, through the maturity of the mortgage note. The mortgage loan required interest only payments to us through January 2017 and had a stated fixed interest rate of
11%
. In April 2016, the Company exercised its option to acquire the behavioral facility secured by this mortgage and completed the acquisition in May 2016 as discussed in more detail above in "2016 Real Estate Acquisitions." Upon acquisition, the Company recognized into income the unamortized portion of the loan fee totaling approximately
$90,000
.
2015 Real Estate Acquisitions
During the fourth quarter of 2015, the Company acquired
eight
real estate properties totaling approximately
214,192
square feet and acquired its new corporate office for an aggregate purchase price of approximately
$29.9 million
, including cash consideration of approximately
$29.6 million
. Upon acquisition, the
eight
properties were approximately
97.7%
leased in the aggregate with lease expirations ranging from
2017 through 2030
.
During the third quarter of 2015, the Company acquired
three
real estate properties totaling approximately
71,153
square feet for an aggregate purchase price of approximately
$13.1 million
, including cash consideration of approximately
$13.0 million
. Upon acquisition, the properties were approximately
93.6%
leased in the aggregate with lease expirations ranging from
2016 through 2024
.
During the second quarter of 2015, the Company acquired
29
real estate properties totaling approximately
474,303
square feet for an aggregate purchase price of approximately
$87.4 million
, including cash consideration of approximately
$87.2 million
. Upon acquisition, the properties were approximately
92.9%
leased in the aggregate with lease expirations ranging from
2015 through 2030
. In addition,
two
of the properties include contingent consideration which could result in additional purchase price of up to
$1.5 million
. At December 31, 2015, the Company had estimated the fair value of these contingencies and had recorded an aggregate liability of
74
Notes to Consolidated Financial Statements - Continued
approximately
$1.2 million
. As of December 31, 2016, the end of the measurement period for both of these contingencies, the liabilities for these contingencies had been reduced to
$0
as no contingent amounts were due.
The following table summarizes the estimated fair values of the assets acquired and liabilities assumed in the property acquisitions during 2015.
|
Estimated Fair
Value
|
Estimated Useful
Life
|
||||
|
(In thousands)
|
(In years)
|
||||
|
Land
|
$
|
13,216
|
|
||
|
Buildings
|
97,518
|
|
20 - 40
|
||
|
Intangibles:
|
|||||
|
At-market lease intangibles
|
21,406
|
|
1.2 - 9.3
|
||
|
Above-market lease intangibles
|
65
|
|
2.6
|
||
|
Below-market lease intangibles
|
(357
|
)
|
6.1 - 7.8
|
||
|
Total intangibles
|
21,114
|
|
|||
|
Accounts receivable and other assets assumed
|
18
|
|
|||
|
Accounts payable, accrued liabilities and other liabilities assumed
(1)
|
(1,040
|
)
|
|||
|
Contingent liabilities
|
(1,190
|
)
|
|||
|
Prorated rent and operating expense reimbursement amounts collected
|
(686
|
)
|
|||
|
Expenses paid, including closing costs
|
832
|
|
|||
|
Total cash consideration
|
$
|
129,782
|
|
||
|
(1)
Includes security deposits received, property taxes payable prior to the acquisition, and a tenant improvement allowance.
|
|||||
Mortgage Notes Receivable
During the third quarter of 2015, the Company funded an
$11.0 million
mortgage secured by a
29,890
square foot long-term acute care facility in Louisiana which matures on
September 30, 2026
. The Company received loan and commitment fees from the transaction totaling
$137,500
which were deferred and are being recognized into income on a straight-line basis. The mortgage loan required interest only payments to us through September 2016 with a stated fixed interest rate of
9.5%
. Thereafter, monthly principal and interest payments are due through maturity. The Company had a purchase option to purchase the property secured by the mortgage note for a fixed amount but let the purchase option expire without exercising it on September 30, 2016. The mortgage note receivable is classified as held-for-investment based on management's intent and ability to hold the loans until maturity.
On
August 10, 2016
, we entered into an amended and restated Credit Facility (as amended, the "Credit Facility"). The Credit Facility is by and among Community Healthcare OP, LP, the Company, the Lenders from time to time party thereto, and SunTrust Bank, as Administrative Agent, matures on
August 9, 2019
and includes
two
options to extend the maturity date of the facility, subject to the satisfaction of certain conditions. The Credit Facility increased the maximum borrowing capacity from
$75.0 million
to
$150.0 million
, lowered our interest rates by
25
basis points and adjusted or replaced certain financial covenants. Amounts outstanding under the Credit Facility bear annual interest at a floating rate that is based, at the Company’s option, on either: (i) LIBOR plus
2.25%
to
2.75%
or (ii) a base rate plus
1.25%
to
1.75%
, in each case, depending upon the Company’s leverage ratio. In addition, the Company is obligated to pay an annual fee equal to
0.25%
of the amount of the unused portion of the Credit Facility if amounts borrowed are greater than
33.3%
of the borrowing capacity under the Credit Facility and
0.35%
of the unused portion of the Credit Facility if amounts borrowed are less than or equal to
33.3%
of the borrowing capacity under the Credit Facility. The Credit Facility also includes an accordion feature that provides the Company with additional capacity, subject to the satisfaction of customary terms and conditions, including obtaining additional commitments from lenders, of up to $
125.0
million, for a total facility size of up to
$275.0 million
. The Company incurred
$0.6 million
in fees and other costs to amend and extend its Credit Facility which will be amortized to
75
Notes to Consolidated Financial Statements - Continued
expense over the life of the Credit Facility. The Company’s material subsidiaries are guarantors of the obligations under the Credit Facility. At
December 31, 2016
, the Company had
$51.0 million
outstanding under the Credit Facility with a weighted average interest rate of approximately
2.99%
and remaining borrowing capacity of
$99.0 million
. The Company was in compliance with its financial covenants under its Credit Facility at
December 31, 2016
.
Common Stock
The following table provides a reconciliation of the beginning and ending common stock balances for the years ended
December 31, 2016
and
2015
and for the period March 28, 2014 (inception) through December 31, 2014:
|
For the Year Ended December 31,
|
For the Period
March 28, 2014
(inception)
through
December 31,
|
|||||
|
2016
|
2015
|
2014
|
||||
|
Balance, beginning of period
|
7,596,940
|
|
200,000
|
|
—
|
|
|
Issuance of common stock
|
5,175,000
|
|
7,311,183
|
|
200,000
|
|
|
Restricted stock issued
|
216,542
|
|
85,757
|
|
—
|
|
|
Balance, end of period
|
12,988,482
|
|
7,596,940
|
|
200,000
|
|
Equity Offerings
In April 2016, the Company completed a follow-on public offering of
5,175,000
shares of its common stock, including
675,000
shares of common stock issued in connection with the exercise in full of the underwriters' option to purchase additional shares, and received net proceeds of approximately
$86.1 million
.
On May 27, 2015, the Company completed its initial public offering of
7,187,500
shares of its common stock, including
937,500
shares of common stock issued in connection with the exercise in full of the underwriters’ option to purchase additional shares, and received net proceeds, after underwriters' discount and other expenses of approximately $
125.2
million. Concurrently, the Company issued
123,683
shares of common stock in concurrent private placements to certain directors and officers of the Company and received approximately $
2.3
million in net proceeds.
On March 31, 2014, the Company issued
200,000
shares of common stock to its officers as founder's shares in connection with the formation of the Company.
Universal Shelf S-3 Registration Statement
On September 13, 2016, the Company filed a registration statement on Form S-3 that will allow us to offer debt or equity securities (or a combination thereof) of up to
$750.0 million
from time to time. The S-3 registration statement was declared effective as of September 26, 2016.
76
Notes to Consolidated Financial Statements - Continued
Dividends Declared
During
2016
, the Company declared and paid dividends totaling
$1.525
per common share as shown in the table below.
|
Declaration Date
|
Record Date
|
Date Paid
|
Amount Per Share
|
|
February 8, 2016
|
February 19, 2016
|
March 4, 2016
|
$0.3775
|
|
May 2, 2016
|
May 20, 2016
|
June 3, 2016
|
$0.3800
|
|
August 4, 2016
|
August 19, 2016
|
September 2, 2016
|
$0.3825
|
|
November 1, 2016
|
November 18, 2016
|
December 2, 2016
|
$0.3850
|
During 2015, the Company declared and paid dividends totaling
$0.517
per common share.
The following table sets forth the computation of basic and diluted income (loss) per common share.
|
|
Year Ended December 31,
|
For the Period
March 28, 2014
(inception)
through
December 31,
|
||||||||||
|
2016
|
2015
|
2014
|
||||||||||
|
(Dollars in thousands, except per share data)
|
||||||||||||
|
Net income (loss)
|
$
|
2,721
|
|
$
|
(1,456
|
)
|
$
|
—
|
|
|||
|
Weighted Average Common Shares Outstanding
|
||||||||||||
|
Weighted average Common Shares outstanding
|
11,478,883
|
|
4,778,144
|
|
200,000
|
|
||||||
|
Unvested restricted stock
|
(240,446
|
)
|
(51,219
|
)
|
—
|
|
||||||
|
Weighted average Common Shares outstanding–Basic
|
11,238,437
|
|
4,726,925
|
|
200,000
|
|
||||||
|
Weighted average Common Shares–Basic
|
11,238,437
|
|
4,726,925
|
|
200,000
|
|
||||||
|
Dilutive effect of restricted stock
|
81,068
|
|
—
|
|
—
|
|
||||||
|
Weighted average Common Shares outstanding –Diluted
|
11,319,505
|
|
4,726,925
|
|
200,000
|
|
||||||
|
Basic Income (Loss) per Common Share
|
$
|
0.24
|
|
$
|
(0.31
|
)
|
$
|
—
|
|
|||
|
Diluted Income (Loss) per Common Share
|
$
|
0.24
|
|
$
|
(0.31
|
)
|
$
|
—
|
|
|||
The dilutive effect of
9,927
shares of restricted common stock were excluded from the calculation of diluted loss per common share for the year ended December 31, 2015, because the effect was anti-dilutive due to the net loss incurred during the period.
77
Notes to Consolidated Financial Statements - Continued
2014 Incentive Plan
The 2014 Incentive Plan (the "Incentive Plan") authorizes the Company to issue
525,782
shares of common stock (the "Plan Pool") to its employees and directors, as well as grant awards in the form of cash. The Incentive Plan will continue until terminated by the Company's Board of Directors. As of
December 31, 2016
and
2015
, the Company had issued a total of
302,299
and
85,757
restricted shares, respectively, under the Incentive Plan for compensation-related awards to its employees and directors, with
223,483
and
440,025
authorized shares, respectively, remaining which had not been issued. Shares issued under the Incentive Plan are generally subject to long-term, fixed vesting periods of
three
to
eight
years. If an employee or director voluntarily terminates his or her relationship with the Company or is terminated for cause before the end of the vesting period, the shares are forfeited, at no cost to the Company. Once the shares have been granted, the recipient of the shares has the right to receive dividends and the right to vote the shares.
Restated Alignment Program
On November 1, 2016, the Company's Board of Directors approved and adopted the Amended and Restated Alignment of Interest Program (the “Restated Alignment Program”). The principal change in the Restated Alignment Program was to reserve
500,000
shares of the Company’s common stock to be issued under this program (the “Program Pool”) as Acquisition Shares (as defined below). Previously, shares of restricted common stock of the Company issued to employees under the Restated Alignment Program in exchange for such employee’s cash compensation (“Acquisition Shares”) were issued from the Plan Pool created and reserved for issuance under the 2014 Incentive Plan. The Restated Alignment Program now requires that Acquisition Shares be issued from the Program Pool rather than from the Plan Pool. As of December 31, 2016, no Program Pool shares had been issued.
The Company's Restated Alignment Program is designed to provide the Company's employees and directors with an incentive to remain with the Company and to incentivize long-term growth and profitability. Under the Restated Alignment Program, employees may elect to defer up to
100%
of their base salary and directors may elect to defer up to
100%
of their director fees, subject to the Incentive Plan's long-term, fixed vesting periods. The number of shares granted will be increased through a Company match depending on the length of the vesting period selected by the employee or director. Employees may select vesting periods of
3
years,
5
years, or
8
years, with a
30%
,
50%
, and
100%
Company match, respectively. Directors may select vesting periods of
1
year,
2
years, or
3
years, with a
20%
,
40%
, or
60%
Company match, respectively.
During 2016 and 2015, the Company granted a total of
117,714
shares and
69,125
shares of restricted common stock, respectively, to its employees, in lieu of salary and including the Company match, that will cliff vest in
eight
years. During 2016, the Company granted a total of
77,404
shares of restricted stock to its employees, in lieu of a cash bonus and including the Company match, that will cliff vest in
eight
years. During 2016 and 2015, the Company also granted its directors
10,940
shares and
5,264
shares of restricted common stock, respectively, following its annual shareholder meeting in 2016 and upon completion of the initial public offering in 2015 and granted a total of
10,484
shares and
11,368
shares of restricted common stock, respectively, to its directors, in lieu of director fees and including the Company match which will cliff vest in
three
years. Compensation expense recognized during the years ended
December 31, 2016
and 2015 from the amortization of the value of shares over the vesting period was approximately
$0.7 million
and $
0.2 million
, respectively.
Officer Incentive Programs
The Company has an Amended and Restated Executive Officer Incentive Program and a Non-Executive Officer Incentive Program (the "Officer Incentive Programs") under the Incentive Plan which are designed to provide incentives to the Company's officers that are designed to reward its officers for individual, as well as Company performance in the form of cash or restricted stock. Company performance will be based on performance targets, which may include targets such as funds from operations ("FFO"), dividend payout percentages, as well as the Company's relative total stockholder return performance over
one
-year and
three
-year periods, measured against the
78
Notes to Consolidated Financial Statements - Continued
Company's peer group, as determined by the Company's Board of Directors each year. The officers may elect, in the year prior to an award, to receive awards under the Officer Incentive Programs in cash or restricted stock, as allowed within the applicable Officer Incentive Programs, as well as a vesting period as discussed under the Restated Alignment Program. As of
December 31, 2016
,
no
awards had been issued under the Officer Incentive Programs.
Summary
A summary of the activity under the Incentive Plan and related information for the year ended
December 31, 2016
and
2015
is included in the table below.
No
shares were issued under the Incentive Plan during 2014.
|
Year Ended December 31,
|
|||||||
|
2016
|
2015
|
||||||
|
Stock-based awards, beginning of year
|
85,757
|
|
—
|
|
|||
|
Stock in lieu of compensation
|
104,112
|
|
41,669
|
|
|||
|
Stock awards
|
112,430
|
|
44,088
|
|
|||
|
Total Granted
|
216,542
|
|
85,757
|
|
|||
|
Stock-based awards, end of year
|
302,299
|
|
85,757
|
|
|||
|
Weighted average grant date fair value of:
|
|||||||
|
Stock-based awards, beginning of year
|
$
|
19.65
|
|
$
|
—
|
|
|
|
Stock-based awards granted during the year
|
$
|
19.25
|
|
$
|
19.65
|
|
|
|
Stock-based awards, end of year
|
$
|
19.36
|
|
$
|
19.65
|
|
|
|
Grant date fair value of shares granted during the year
|
$
|
4,167,631
|
|
$
|
1,685,125
|
|
|
The vesting periods for the non-vested shares granted during 2016 ranged from
three
to
eight
years with a weighted-average amortization period remaining as of December 31, 2016 of approximately
6.8
years.
Other assets consists primarily of accounts receivable, straight-line rent receivables, prepaid assets, deferred financing costs, and above-market intangible assets. Items included in "Other assets, net" on the Company's Consolidated Balance Sheets as of
December 31, 2016
and
2015
are detailed in the table below.
|
December 31,
|
||||||
|
(Dollars in thousands)
|
2016
|
2015
|
||||
|
Accounts receivable
|
$
|
2,472
|
|
$
|
995
|
|
|
Straight-line rent receivables
|
744
|
|
133
|
|
||
|
Allowance for doubtful accounts
|
(154
|
)
|
(71
|
)
|
||
|
Prepaid assets
|
260
|
|
227
|
|
||
|
Deferred financing costs, net
|
1,010
|
|
706
|
|
||
|
Above-market intangible assets, net
|
25
|
|
50
|
|
||
|
Other
|
486
|
|
84
|
|
||
|
$
|
4,843
|
|
$
|
2,124
|
|
|
79
Notes to Consolidated Financial Statements - Continued
The Company has deferred financings costs and various real estate acquisition lease intangibles included in its Consolidated Balance Sheets as of
December 31, 2016
and
2015
as detailed in the table below.
|
Gross Balance at
December 31,
|
Accumulated Amortization at
December 31,
|
Weighted
Average
|
||||||||||||
|
(Dollars in thousands)
|
2016
|
2015
|
2016
|
2015
|
Remaining
Life (Years)
|
Balance Sheet Classification
|
||||||||
|
Deferred financing costs
|
$
|
1,508
|
|
$
|
873
|
|
$
|
498
|
|
$
|
167
|
|
2.6
|
Other assets
|
|
Above-market lease intangibles
|
91
|
|
65
|
|
66
|
|
15
|
|
1.0
|
Other assets
|
||||
|
Below-market lease intangibles
|
(1,280
|
)
|
(357
|
)
|
(167
|
)
|
(32
|
)
|
7.2
|
Other liabilities
|
||||
|
At-market lease intangibles
|
35,368
|
|
21,406
|
|
12,394
|
|
3,724
|
|
3.9
|
Real estate properties
|
||||
|
35,687
|
|
21,987
|
|
12,791
|
|
3,874
|
|
4.0
|
||||||
Expected future amortization, net, for the next five years of the Company's intangible assets and liabilities, in place as of
December 31, 2016
are included in the table below.
|
(in thousands)
|
Amortization, net
|
||
|
2017
|
$
|
8,928
|
|
|
2018
|
6,198
|
|
|
|
2019
|
3,926
|
|
|
|
2020
|
2,308
|
|
|
|
2021
|
1,458
|
|
|
Tenant Improvements
The Company may provide tenant improvement allowances in new or renewal leases for the purpose of refurbishing or renovating tenant space. The Company may also assume tenant improvement obligations included in leases acquired in its real estate acquisitions. During 2015, the Company assumed
$0.3
million in tenant improvement allowances relating to two tenants whose leases expire in 2018 and 2020. Also, at December 31, 2016, the Company had commitments of approximately
$9,000
for other tenant improvements.
Capital Improvements
The Company has entered into contracts with various vendors for various capital improvement projects related to its portfolio. Some of these expenditures will be subsequently billed and reimbursed by tenants as provided for in their leases with the Company. As of
December 31, 2016
, the Company had commitments of approximately
$96,000
that are expected to be spent on these capital improvement projects.
Legal Proceedings
The Company is not aware of any pending or threatened litigation that, if resolved against the Company, would have a material adverse effect on the Company's Consolidated Financial Statements.
80
Notes to Consolidated Financial Statements - Continued
The carrying amounts of cash and cash equivalents, receivables and payables are a reasonable estimate of their fair value as of
December 31, 2016
and
2015
due to their short-term nature. The carrying amount of the Company's revolving credit facility estimates its fair value as of
December 31, 2016
and
2015
as its interest rate varies with the market.
The Company had
one
mortgage note receivable outstanding at
December 31, 2016
and
2015
with a fixed interest rate of
9.5%
per annum. The Company calculated the estimated fair value of its mortgage note based on an assumed market rate of interest or at a rate consistent with the rates on mortgage notes acquired by the Company recently. The principal value of the Company's mortgage note receivable at
December 31, 2016
and
2015
was approximately
$10.9 million
and
$11.0 million
, respectively, and its estimated fair value was approximately
$10.9 million
and
$11.0 million
, respectively, using level 2 inputs.
Taxable Income (unaudited)
The Company has elected to be taxed as a REIT, as defined under the Code. To qualify as a REIT, the Company must meet a number of organizational and operational requirements, including a requirement that it currently distribute at least 90% of its taxable income to its stockholders. We have also elected for one subsidiary to be treated as a TRS, which is subject to federal and state income taxes. All entities other than the TRS are collectively referred to as "the REIT" within this Note 13.
The REIT generally will not be subject to federal income tax on taxable income it distributes currently to its stockholders. Accordingly, no provision for federal income taxes for the REIT has been made in the accompanying Consolidated Financial Statements. If the REIT fails to qualify as a REIT for any taxable year, then it will be subject to federal income taxes at regular corporate rates, including any applicable alternative minimum tax, and may not be able to qualify as a REIT for four subsequent taxable years. Even if the REIT continues to qualify as a REIT, it may be subject to certain state and local taxes on its income and property and to federal income and excise tax on its undistributed taxable income.
The Company's provision for income taxes is as follows for the years ended
December 31, 2016
and
2015
. There were no operations, and therefore, no income taxes prior to 2015:
|
Year Ended December 31,
|
||||||
|
(Dollars in thousands)
|
2016
|
2015
|
||||
|
Current
|
$
|
21
|
|
$
|
—
|
|
|
Deferred
|
(10
|
)
|
10
|
|
||
|
Total
|
$
|
11
|
|
$
|
10
|
|
The provisions for income taxes for the years ended
December 31, 2016
and
2015
primarily relate to temporary differences between the bases of assets of the Company's TRS for financial reporting purposes and the bases of those assets for income tax purposes. The expense provided is included in general and administrative expense on the Company's Consolidated Statements of Comprehensive Income (Loss).
On a tax-basis, the Company’s gross real estate assets totaled approximately
$252.7 million
and
$133.0 million
, respectively, as of
December 31, 2016
and
2015
(unaudited).
81
Notes to Consolidated Financial Statements - Continued
The following table reconciles the Company’s net income (loss) to taxable income for the years ended
December 31, 2016
and
2015
. There were no operations in 2014.
|
Year Ended December 31,
|
||||||||
|
(Dollars in thousands)
|
2016
|
2015
|
||||||
|
Net income (loss)
|
$
|
2,721
|
|
$
|
(1,456
|
)
|
||
|
Reconciling items to taxable income:
|
||||||||
|
Depreciation and amortization
|
8,863
|
|
3,806
|
|
||||
|
Straight-line rent
|
(606
|
)
|
(133
|
)
|
||||
|
Receivable allowance
|
83
|
|
71
|
|
||||
|
Stock-based compensation
|
285
|
|
121
|
|
||||
|
Deferred rent
|
249
|
|
529
|
|
||||
|
Contingent liability fair value adjustments
|
(1,278
|
)
|
—
|
|
||||
|
Other
|
94
|
|
(86
|
)
|
||||
|
7,690
|
|
4,308
|
|
|||||
|
Taxable income
(1)
|
$
|
10,411
|
|
$
|
2,852
|
|
||
|
Dividends paid
(2)
|
$
|
17,393
|
|
$
|
3,883
|
|
||
|
__________
|
||||||||
|
(1)
Before REIT dividends paid deduction.
|
||||||||
|
(2)
Net of dividends paid on restricted stock included as a reconciling item.
|
||||||||
Characterization of Distributions (unaudited)
Earnings and profits (as defined under the Internal Revenue Code), the current and accumulated amounts of which determine the taxability of distributions to stockholders, vary from net income attributable to common stockholders and taxable income because of different depreciation recovery periods, depreciation methods, and other items.
Distributions in excess of earnings and profits generally constitute a return of capital. The following table shows the characterization of the distributions on the Company's common stock for the years ended
December 31, 2016
and
2015
. The Company did not have any operations prior to its initial public offering completed on May 27, 2015 and did not pay dividends for any period beginning prior to its initial public offering. Also,
no
preferred shares have been issued by the Company. As such,
no
dividends have been paid to date relating to preferred shares.
|
2016
|
2015
|
|||||||||||
|
Per Share
|
%
|
Per Share
|
%
|
|||||||||
|
Common stock:
|
||||||||||||
|
Ordinary income
|
$
|
1.036
|
|
68.0
|
%
|
$
|
0.396
|
|
76.6
|
%
|
||
|
Return of capital
|
0.489
|
|
32.0
|
%
|
0.121
|
|
23.4
|
%
|
||||
|
Common stock distributions
|
$
|
1.525
|
|
100.0
|
%
|
$
|
0.517
|
|
100.0
|
%
|
||
2015 Concurrent Private Placements
Concurrently with the completion of the Company’s initial public offering in May 2015, Timothy G. Wallace, our Chairman, Chief Executive Officer and President, and certain of our officers and directors acquired common stock through concurrent private placements at a price per share equal to the initial public offering price. See Note 6 for further details.
82
Notes to Consolidated Financial Statements - Continued
2015 Reimbursement of Costs to Athena Funding Partners
AFP, which is substantially owned and controlled by Timothy G. Wallace, the Company’s Chairman, Chief Executive Officer and President, advanced or incurred on the Company’s behalf costs related to the activities prior to the Company's initial public offering in 2015, including the Company’s organization, negotiating the property acquisitions, performing due diligence related to the initial properties, performing corporate work in contemplation of the offering and preparing the prospectus. Costs incurred included expenses such as legal and accounting fees, certain costs related to performing property due diligence, certain property related costs, travel, overhead, office supplies and office rent.
On April 1, 2014, the Company entered into a formation services agreement with AFP pursuant to which the Company agreed to reimburse the actual costs incurred by AFP only upon the successful completion of the initial public offering. The Company reimbursed AFP approximately $
0.4
million during 2015. AFP will receive no further compensation for providing such services and funding such costs.
Real Estate Investments
From January 1, 2017 through
February 23, 2017
, the Company acquired
two
real estate properties totaling approximately
48,800
square feet for a purchase price of approximately
$7.9 million
, including cash consideration of approximately
$7.8 million
. Upon acquisition, the properties were approximately
94%
leased with lease expirations through
2022
. These acquisitions were funded with proceeds from the Credit Facility.
Dividend Declared
On
February 2, 2017
, the Company’s Board of Directors declared a quarterly common stock dividend in the amount of $
0.3875
per share. The dividend is payable on
March 3, 2017
to stockholders of record on
February 17, 2017
.
Restricted Stock Issuances
On January 13, 2017, pursuant to the 2014 Incentive Plan and the Restated Alignment Program, the Company granted
116,771
shares of restricted common stock to its employees, in lieu of salary, that will cliff vest in
five
to
eight
years. Of the shares granted,
59,285
shares of restricted stock were granted in lieu of compensation from the Program Pool and
57,486
shares of restricted stock were awards granted from the Plan Pool.
83
Notes to Consolidated Financial Statements - Continued
Quarterly financial information for the years ended
December 31, 2016
and
2015
is summarized below. The Company completed its initial public offering on May 27, 2015. There were no operations for the Company prior to its initial public offering.
|
Quarter Ended
|
||||||||||||
|
(Dollars in thousands, except per share data)
|
March 31
|
June 30
|
September 30
|
December 31
|
||||||||
|
2016
|
||||||||||||
|
Revenues
|
$
|
5,166
|
|
$
|
6,196
|
|
$
|
6,443
|
|
$
|
7,392
|
|
|
Expenses
(1)
|
4,670
|
|
5,485
|
|
5,203
|
|
5,970
|
|
||||
|
Other income (expense)
|
(380
|
)
|
(203
|
)
|
(176
|
)
|
(389
|
)
|
||||
|
Net income
|
$
|
116
|
|
$
|
508
|
|
$
|
1,064
|
|
$
|
1,033
|
|
|
Net income per basic common share
|
$
|
0.02
|
|
$
|
0.04
|
|
$
|
0.08
|
|
$
|
0.08
|
|
|
Net income per diluted common share
|
$
|
0.02
|
|
$
|
0.04
|
|
$
|
0.08
|
|
$
|
0.08
|
|
|
__________
|
||||||||||||
|
(1)
Expenses include approximately $0.8 million related to the acquisition of 14 properties accounted for as business combinations.
|
||||||||||||
|
Quarter Ended
|
||||||||||||
|
(Dollars in thousands, except per share data)
|
March 31
|
June 30
|
September 30
|
December 31
|
||||||||
|
2015
|
||||||||||||
|
Revenues
|
$
|
—
|
|
$
|
836
|
|
$
|
3,240
|
|
$
|
4,556
|
|
|
Expenses
(1)
|
—
|
|
2,318
|
|
3,185
|
|
4,256
|
|
||||
|
Other income (expense)
|
—
|
|
(27
|
)
|
(122
|
)
|
(179
|
)
|
||||
|
Net income (loss)
|
$
|
—
|
|
$
|
(1,509
|
)
|
$
|
(67
|
)
|
$
|
121
|
|
|
Net income (loss) per basic common share
|
$
|
—
|
|
$
|
(0.42
|
)
|
$
|
(0.01
|
)
|
$
|
0.02
|
|
|
Net income (loss) per diluted common share
|
$
|
—
|
|
$
|
(0.42
|
)
|
$
|
(0.01
|
)
|
$
|
0.02
|
|
|
__________
|
||||||||||||
|
(1)
Expenses include approximately $1.6 million related to the Company's initial public offering and acquisition of 32 properties accounted for as business combinations.
|
||||||||||||
84
None.
Disclosure Controls and Procedures
The Company maintains disclosure controls and procedures designed to ensure that information required to be disclosed in the Company’s reports under the Securities Exchange Act of 1934, as amended (the “Securities Exchange Act”), is recorded, processed, summarized and reported within the time periods specified in the Securities and Exchange Commission’s rules and forms. These disclosure controls and procedures include, without limitation, controls and procedures designed to ensure that the information required to be disclosed is accumulated and communicated to management, including the Chief Executive Officer and Chief Financial Officer, to allow for timely decisions regarding required disclosure.
The Company’s management, with the participation of the Company’s Chief Executive Officer and Chief Financial Officer, has evaluated the effectiveness of the Company’s disclosure controls and procedures (as such term is defined in Rules 13a-15(e) and 15d-15(e) under the Securities Exchange Act) as of the end of the period covered by this Annual Report on Form 10-K. Based on such evaluation, the Company’s Chief Executive Officer and Chief Financial Officer have concluded that, as of the end of such period, the Company’s disclosure controls and procedures are effective in recording, processing, summarizing and reporting, on a timely basis, information required to be disclosed by the Company in the reports that it files or submits under the Securities Exchange Act.
Limitations on the Effectiveness of Controls and Procedures
In designing and evaluating the disclosure controls and procedures, management recognizes that any controls and procedures, no matter how well designed and operated, can provide only reasonable assurance of achieving the desired control objectives. In addition, the design of disclosure controls and procedures must reflect the fact that there are resource constraints and that management is required to apply judgment in evaluating the benefits of possible controls and procedures relative to their costs.
Changes in Internal Control over Financial Reporting
There have been no changes in our system of internal control over financial reporting (as such term is defined in Rules 13a-15(f) and 15d-15(f) under the Exchange Act) during the quarter ended December 31, 2016 that have materially affected, or are reasonably likely to materially affect, our internal control over financial reporting.
Management's Annual Report on Internal Control Over Financial Reporting
The management of Community Healthcare Trust Incorporated is responsible for establishing and maintaining adequate internal control over financial reporting as defined in Rules 13a-15 (f) and 15d-15(f) under the Securities Exchange Act. The Company’s internal control over financial reporting is designed to provide reasonable assurance regarding the reliability of financial reporting and the preparation of financial statements for external purposes in accordance with accounting principles generally accepted in the United States of America. The Company’s internal control over financial reporting includes those policies and procedures that: (i) pertain to the maintenance of records that, in reasonable detail, accurately and fairly reflect the transactions and dispositions of the assets of the Company; (ii) provide reasonable assurance that transactions are recorded as necessary to permit preparation of financial statements in accordance with accounting principles generally accepted in the United States of America, and that receipts and expenditures of the Company are being made only in accordance with authorizations of management and directors of the Company; and (iii) provide reasonable assurance regarding prevention or timely detection of unauthorized acquisition, use or disposition of the Company’s assets that could have a material effect on the
85
financial statements. Because of its inherent limitations, internal control over financial reporting may not prevent or detect misstatements. Also, projections of any evaluation of effectiveness to future periods are subject to the risk that controls may become inadequate because of changes in conditions, or that the degree of compliance with the policies or procedures may deteriorate. Management assessed the effectiveness of the Company’s internal control over financial reporting as of December 31, 2016 using the principles and other criteria set forth by the Committee of Sponsoring Organizations of the Treadway Commission (COSO) in Internal Control-Integrated Framework (2013). Based on that assessment, management concluded that the Company’s internal control over financial reporting was effective as of December 31, 2016.
Attestation Report of Independent Registered Public Accounting Firm
Not applicable.
None.
86
The information required by this item will be contained in the Company's Definitive Proxy Statement for its
2017
Annual Stockholders Meeting, to be filed with the SEC within 120 days after
December 31, 2016
, and is incorporated herein by reference.
The information required by this item will be contained in the Company's Definitive Proxy Statement for its
2017
Annual Stockholders Meeting, to be filed with the SEC within 120 days after
December 31, 2016
, and is incorporated herein by reference.
The information required by this item will be contained in the Company's Definitive Proxy Statement for its
2017
Annual Stockholders Meeting, to be filed with the SEC within 120 days after
December 31, 2016
, and is incorporated herein by reference.
The information required by this items will be contained in the Company's Definitive Proxy Statement for its
2017
Annual Stockholders Meeting, to be filed with the SEC within 120 days after
December 31, 2016
, and is incorporated herein by reference.
The information required by this items will be contained in the Company's Definitive Proxy Statement for its
2017
Annual Stockholders Meeting, to be filed with the SEC within 120 days after
December 31, 2016
, and is incorporated herein by reference.
87
The following documents of Community Healthcare Trust Incorporated are included in this Annual Report on Form 10-K.
|
(a) Financial Statements:
|
|
|
Report of Independent Registered Public Accounting Firm
|
|
|
Consolidated Balance Sheets at December 31, 2016 and 2015
|
|
|
Consolidated Statements of Comprehensive Income (Loss) for the years ended December 31, 2016 and 2015 and for the period from March 28, 2014 (inception) through December 31, 2014
|
|
|
Consolidated Statements of Stockholders' Equity for the years ended December 31, 2016 and 2015 and for the period from March 28, 2014 (inception) through December 31, 2014
|
|
|
Consolidated Statements of Cash Flows for the years ended December 31, 2016 and 2015 and for the period from March 28, 2014 (inception) through December 31, 2014
|
|
|
Notes to the Consolidated Financial Statements
|
|
|
(b) Financial Statement Schedules:
|
|
|
Schedule II - Valuation and Qualifying Accounts for the years ended December 31, 2016 and 2015 and for the period from March 28, 2014 (inception) through December 31, 2014
|
|
|
Schedule III - Real Estate and Accumulated Depreciation as of December 31, 2016
|
|
|
Schedule IV - Mortgage Loans on Real Estate as of December 31, 2016
|
|
All other schedules are omitted because they are either not applicable, not required or because the information is included in the Consolidated Financial Statements or notes included in this Annual Report on Form 10-K.
88
c) Exhibits
|
Exhibit
Number
|
Description
|
||
|
1.1
|
Underwriting Agreement, dated as of April 6, 2016, among the Company, Community Healthcare OP, LP, Sandler O'Neill & Partners, L.P., Evercore Group L.L.C., SunTrust Robinson Humphrey, Inc., and each of the Underwriters party thereto.
(1)
|
||
|
3.1
|
Corporate Charter of Community Healthcare Trust Incorporated, as amended
(2)
|
||
|
3.2
|
Bylaws of Community Healthcare Trust Incorporated, as amended
(3)
|
||
|
4.1
|
Form of Certificate of Common Stock of Community Healthcare Trust Incorporated
(4)
|
||
|
10.1
|
Agreement of Limited Partnership of Community Healthcare OP, LP
(5)
|
||
|
10.2
|
Form of Indemnification Agreement
(6)
|
||
|
10.3 †
|
Community Healthcare Trust Incorporated 2014 Incentive Plan, as amended
(7)
|
||
|
10.4 †
|
Amended and Restated Community Healthcare Trust Incorporated Alignment of Interest Program
(8)
|
||
|
10.5 †
|
Amended and Restated Community Healthcare Trust Incorporated Executive Officer Incentive Program
(9)
|
||
|
10.6 †
|
Employment Agreement between Community Healthcare Trust Incorporated and Timothy G. Wallace
(10)
|
||
|
10.7 †
|
First Amendment to Employment Agreement between Community Healthcare Trust Incorporated and Timothy G. Wallace
(11)
|
||
|
10.8 †
|
Employment Agreement between Community Healthcare Trust Incorporated and W. Page Barnes
(12)
|
||
|
10.9 †
|
First Amendment to Employment Agreement between Community Healthcare Trust Incorporated and W. Page Barnes
(13)
|
||
|
10.10 †
|
Employment Agreement between Community Healthcare Trust Incorporated and Leigh Ann Stach
(14)
|
||
|
10.11 †
|
First Amendment to Employment Agreement between Community Healthcare Trust Incorporated and Leigh Ann Stach
(15)
|
||
|
10.12
|
Form of Restricted Stock Agreement
(16)
|
||
|
10.13
|
Form of Officer Compensation Reduction Election Form
(17)
|
||
|
10.14
|
Form of Director Compensation Reduction Election Form
(18)
|
||
|
10.15
|
Amended and Restated Credit agreement dated as of August 10, 2016, by and among Community Healthcare OP, LP, the Company, the Lenders from time to time party hereto, and SunTrust Bank, as Administrative Agent.
(19)
|
||
|
21 *
|
Subsidiaries of the Registrant
|
||
|
23 *
|
Consent of BDO USA, LLP, independent registered public accounting firm
|
||
|
31.1 *
|
Certification of the Chief Executive Officer of Community Healthcare Trust Incorporated pursuant to Rule 13a-14 of the Securities Exchange Act of 1934, as amended, as adopted pursuant to Rule 302 of the Sarbanes-Oxley Act of 2002
|
||
|
31.2 *
|
Certification of the Chief Financial Officer of Community Healthcare Trust Incorporated pursuant to Rule 13a-14 of the Securities Exchange Act of 1934, as amended, as adopted pursuant to Rule 302 of the Sarbanes-Oxley Act of 2002
|
||
|
32.1 **
|
Certifications pursuant to 18 U.S.C. Section 1350, as adopted pursuant to Section 906 of the Sarbanes-Oxley Act of 2002
|
||
|
101.INS *
|
XBRL Instance Document
|
||
|
101.SCH *
|
XBRL Taxonomy Extension Schema Document
|
||
|
101.CAL *
|
XBRL Taxonomy Extension Calculation Linkbase Document
|
||
|
101.LAB *
|
XBRL Taxonomy Extension Labels Linkbase Document
|
||
|
101.DEF *
|
XBRL Taxonomy Extension Definition Linkbase Document
|
||
|
101.PRE *
|
XBRL Taxonomy Extension Presentation Linkbase Document
|
||
|
(1)
|
Filed as Exhibit 1.1 to the Form 8-K of the Company filed with the Securities and Exchange Commission on April 12, 2016 (File No. 001-37401) and incorporated herein by reference.
|
|
(2)
|
Filed as Exhibit 3.1 to Amendment No. 2 to the Registration Statement on Form S-11 of the Company filed with the Securities and Exchange Commission on May 6, 2015 (Registration No. 333-203210)
and incorporated herein by reference.
|
89
|
(3)
|
Filed as Exhibit 3.2 to the Registration Statement on Form S-11 of the Company filed with the Securities and Exchange Commission on April 2, 2015 (Registration No. 333-203210)
and incorporated herein by reference.
|
|
(4)
|
Filed as Exhibit 4.1 to the Registration Statement on Form S-11 of the Company filed with the Securities and Exchange Commission on April 2, 2015 (Registration No. 333-203210)
and incorporated herein by reference.
|
|
(5)
|
Filed as Exhibit 10.1 to Amendment No. 1 to the Registration Statement on Form S-11 of the Company filed with the Securities and Exchange Commission on April 28, 2015 (Registration No. 333-203210)
and incorporated herein by reference.
|
|
(6)
|
Filed as Exhibit 10.2 to the Registration Statement on Form S-11 of the Company filed with the Securities and Exchange Commission on April 2, 2015 (Registration No. 333-203210)
and incorporated herein by reference.
|
|
(7)
|
Filed as Exhibit 10.3 to the Registration Statement on Form S-11 of the Company filed with the Securities and Exchange Commission on April 2, 2015 (Registration No. 333-203210), and, as to Amendment No. 1 to the plan, as Exhibit 10.12 to Amendment No. 2 to the Registration Statement on Form S-11 of the Company filed with the Securities and Exchange Commission on May 6, 2015 (Registration No. 333-203210),
each of which is incorporated herein by reference.
|
|
(8)
|
Filed as Exhibit 4.5 to the Registration Statement on Form S-8 of the Company filed with the Securities and Exchange Commission on December 7, 2016 (Registration Statement No. 333-214951) and incorporated herein by reference.
|
|
(9)
|
Filed as Exhibit 10.2 to the Form 8-K of the Company filed with the Securities and Exchange Commission on November 4, 2016 (File No. 001-37401) and incorporated herein by reference.
|
|
(10)
|
Filed as Exhibit 10.6 to the Registration Statement on Form S-11 of the Company filed with the Securities and Exchange Commission on April 2, 2015 (Registration No. 333-203210)
and incorporated herein by reference.
|
|
(11)
|
Filed as Exhibit 10.1 to the Form 8-K of the Company filed with the Securities and Exchange Commission on January 18, 2017 (File No. 001-37401) and incorporated herein by reference.
|
|
(12)
|
Filed as Exhibit 10.7 to the Registration Statement on Form S-11 of the Company filed with the Securities and Exchange Commission on April 2, 2015 (Registration No. 333-203210)
and incorporated herein by reference.
|
|
(13)
|
Filed as Exhibit 10.2 to the Form 8-K of the Company filed with the Securities and Exchange Commission on January 18, 2017 (File No. 001-37401) and incorporated herein by reference.
|
|
(14)
|
Filed as Exhibit 10.8 to the Registration Statement on Form S-11 of the Company filed with the Securities and Exchange Commission on April 2, 2015 (Registration No. 333-203210)
and incorporated herein by reference.
|
|
(15)
|
Filed as Exhibit 10.3 to the Form 8-K of the Company filed with the Securities and Exchange Commission on January 18, 2017 (File No. 001-37401) and incorporated herein by reference.
|
|
(16)
|
Filed as Exhibit 10.9 to Amendment No. 1 to the Registration Statement on Form S-11 of the Company filed with the Securities and Exchange Commission on April 28, 2015 (Registration No. 333-203210)
and incorporated herein by reference.
|
|
(17)
|
Filed as Exhibit 10.10 to Amendment No. 1 to the Registration Statement on Form S-11 of the Company filed with the Securities and Exchange Commission on April 28, 2015 (Registration No. 333-203210)
and incorporated herein by reference.
|
|
(18)
|
Filed as Exhibit 10.11 to Amendment No. 1 to the Registration Statement on Form S-11 of the Company filed with the Securities and Exchange Commission on April 28, 2015 (Registration No. 333-203210)
and incorporated herein by reference.
|
|
(19)
|
Filed as Exhibit 10.1 to the Form 10-Q of the Company filed with the Securities and Exchange Commission on November 10, 2016 (File No. 001-37401) and incorporated herein by reference.
|
_________
|
*
|
Filed herewith.
|
|
**
|
Furnished herewith.
|
|
†
|
Denotes executive compensation plan or arrangement.
|
90
SIGNATURES
Pursuant to the requirements of Section 13 or 15(d) of the Securities Exchange Act of 1934, the Company has duly caused this report to be signed on its behalf by the undersigned, thereunto duly authorized, in the City of Franklin, State of Tennessee, on
February 23, 2017
.
Date:
February 23, 2017
|
COMMUNITY HEALTHCARE TRUST INCORPORATED
|
||
|
By:
|
/s/ Timothy G. Wallace
|
|
|
Timothy G. Wallace
|
||
|
Chairman of the Board and Chief Executive Officer and President
|
||
Pursuant to the requirements of the Securities Exchange Act of 1934, this Report has been signed by the following persons on behalf of the Company and in the capacities and on the date indicated.
|
Signature
|
Title
|
Date
|
|
/s/ Timothy G. Wallace
|
Chairman of the Board and Chief Executive
|
February 23, 2017
|
|
Timothy G. Wallace
|
Officer and President (Principal Executive Officer)
|
|
|
/s/ W. Page Barnes
|
Executive Vice President and Chief Financial
|
February 23, 2017
|
|
W. Page Barnes
|
Officer (Principal Financial Officer)
|
|
|
/s/ Leigh Ann Stach
|
Vice President of Financial Reporting and Chief Accounting
|
February 23, 2017
|
|
Leigh Ann Stach
|
Officer (Principal Accounting Officer)
|
|
|
/s/ Alan Gardner
|
Director
|
February 23, 2017
|
|
Alan Gardner
|
||
|
/s/ Robert Hensley
|
Director
|
February 23, 2017
|
|
Robert Hensley
|
||
|
/s/ Alfred Lumsdaine
|
Director
|
February 23, 2017
|
|
Alfred Lumsdaine
|
||
|
/s/ R. Lawrence Van Horn
|
Director
|
February 23, 2017
|
|
Lawrence Van Horn
|
||
91
Schedule II - Valuation and Qualifying Accounts for the years ended December 31, 2016 and 2015 and
for the period from March 28, 2014 (inception) through December 31, 2014
(Dollars in thousands)
|
Additions
|
||||||||||||||||
|
Description
|
Balance at
Beginning of
Period
|
Charged to
Costs and
Expenses
|
Charged to
Other
Accounts
|
Uncollectible
Accounts
Written-off
|
Balance at
End of
Period
|
|||||||||||
|
2016
|
Accounts receivable allowance
|
$
|
71
|
|
$
|
155
|
|
$
|
—
|
|
$
|
(72
|
)
|
$
|
154
|
|
|
2015
|
Accounts receivable allowance
|
$
|
—
|
|
$
|
71
|
|
$
|
—
|
|
$
|
—
|
|
$
|
71
|
|
|
2014
|
Accounts receivable allowance
|
$
|
—
|
|
$
|
—
|
|
$
|
—
|
|
$
|
—
|
|
$
|
—
|
|
92
Schedule III - Real Estate and Accumulated Depreciation at December 31, 2016
(Dollars in thousands)
|
Land and Land Improvements
|
Buildings, Improvements, and Lease Intangibles
|
||||||||||||||||||||||||||||||||||
|
Property Type
|
Number
of
Properties
|
State
|
Initial
Investment
|
Costs
Capitalized
Subsequent to
Acquisition
|
Total
|
Initial
Investment
|
Costs
Capitalized
Subsequent
to
Acquisition
|
Total
|
Personal
Property
|
Total
Property
(1)
|
Accumulated
Depreciation
(2)
|
Encumbrances
|
Date
Acquired
|
Original
Date
Constructed
|
|||||||||||||||||||||
|
Medical office buildings
|
19
|
|
AL, FL, GA, IL, IA, KS, KY, NY, OH, TX
|
$
|
15,529
|
|
$
|
185
|
|
$
|
15,714
|
|
$
|
92,505
|
|
$
|
1,088
|
|
$
|
93,593
|
|
$
|
—
|
|
$
|
109,307
|
|
$
|
8,685
|
|
$
|
—
|
|
2015, 2016
|
1975-2009
|
|
Physician clinics
|
14
|
|
AL, AZ, FL, KS, OH, PA, TN, TX, VA, WI
|
4,148
|
|
—
|
|
4,148
|
|
33,546
|
|
330
|
|
33,876
|
|
—
|
|
38,024
|
|
3,259
|
|
—
|
|
2015, 2016
|
1945-2009
|
||||||||||
|
Surgical centers and hospitals (3)
|
11
|
|
AZ, CO, IL, LA, MI, OH, PA, SC, TX
|
6,535
|
|
7
|
|
6,542
|
|
51,272
|
|
131
|
|
51,403
|
|
—
|
|
57,945
|
|
3,732
|
|
—
|
|
2015, 2016
|
1979-2004
|
||||||||||
|
Specialty centers (4)
|
11
|
|
AL, CO, GA, KY, NC, OH, OK, TN, TX
|
1,910
|
|
—
|
|
1,910
|
|
21,164
|
|
133
|
|
21,297
|
|
—
|
|
23,207
|
|
2,341
|
|
—
|
|
2015, 2016
|
1956-2013
|
||||||||||
|
Behavioral facilities
|
2
|
|
IL, IN
|
1,570
|
|
—
|
|
1,570
|
|
21,451
|
|
3
|
|
21,454
|
|
—
|
|
23,024
|
|
352
|
|
—
|
|
2015, 2016
|
1920-2001
|
||||||||||
|
Total Real Estate
|
57
|
|
29,692
|
|
192
|
|
29,884
|
|
219,938
|
|
1,685
|
|
221,623
|
|
—
|
|
251,507
|
|
18,369
|
|
—
|
|
|||||||||||||
|
Corporate property
|
—
|
|
—
|
|
—
|
|
—
|
|
700
|
|
432
|
|
1,132
|
|
97
|
|
1,229
|
|
35
|
|
—
|
|
|||||||||||||
|
Total Properties
|
57
|
|
$
|
29,692
|
|
$
|
192
|
|
$
|
29,884
|
|
$
|
220,638
|
|
$
|
2,117
|
|
$
|
222,755
|
|
$
|
97
|
|
$
|
252,736
|
|
$
|
18,404
|
|
$
|
—
|
|
|||
(1) Total properties as of December 31, 2016 have an estimated aggregate total cost of $
252.7 million
(unaudited) for federal income tax purposes.
(2) Depreciation is provided for on a straight-line basis on land improvements over
3 years
to
15 years
, buildings and improvements over
2.3 years
to
40.0 years
, lease intangibles over
1.2 years
to
13.7 years
, and personal property over
3.0 years
to
10.0 years
.
(3) Previously called "Ambulatory surgery centers." Renamed and now includes surgical hospitals.
(4) Combined Dialysis clinics and Oncology centers and renamed as "Specialty centers." Also, includes plasma collection centers.
93
5) A reconciliation of Total Property and Accumulated Depreciation for the years ended December 31, 2016 and 2015 and for the period from March 28, 2014 (inception) through December 31, 2014 is provided below.
|
Year Ended
December 31, 2016
|
Year Ended
December 31, 2015
|
Period from
March 28, 2014 (inception)
through December 31, 2014
|
|||||||||||||||||
|
(Dollars in thousands)
|
Total Property
|
Accumulated
Depreciation
|
Total Property
|
Accumulated
Depreciation
|
Total Property
|
Accumulated
Depreciation
|
|||||||||||||
|
Beginning Balance
|
$
|
132,967
|
|
$
|
5,203
|
|
$
|
—
|
|
$
|
—
|
|
$
|
—
|
|
$
|
—
|
|
|
|
Additions during the period:
|
|||||||||||||||||||
|
Acquisitions
|
118,190
|
|
13,091
|
|
132,140
|
|
5,203
|
|
—
|
|
—
|
|
|||||||
|
Other improvements
|
1,579
|
|
110
|
|
827
|
|
—
|
|
—
|
|
—
|
|
|||||||
|
Retirements/dispositions:
|
|||||||||||||||||||
|
Real estate
|
—
|
|
—
|
|
—
|
|
—
|
|
—
|
|
—
|
|
|||||||
|
Ending Balance
|
$
|
252,736
|
|
$
|
18,404
|
|
$
|
132,967
|
|
$
|
5,203
|
|
$
|
—
|
|
$
|
—
|
|
|
94
Schedule IV - Mortgage Loans on Real Estate as of December 31, 2016
(Dollars in thousands)
|
Description of Collateral
|
Interest
Rate
|
Maturity
Date
|
Periodic
Payment
Terms
|
Original
Face
Amount
|
Carrying
Amount
(2) (3)
|
Balloon
|
|||||||
|
Long-term care acute care facility in Louisiana
|
9.5
|
%
|
9/30/2026
|
(1)
|
$
|
11,000
|
|
$
|
10,786
|
|
$
|
5,500
|
|
|
Total Mortgage Loans
|
$
|
10,786
|
|
||||||||||
(1) Was interest only until September 30, 2016. Thereafter, principal and interest payments are due monthly through the maturity date with a balloon payment due at maturity.
(2) Includes deferred loan and commitment fees of approximately
$0.1
million.
(3) A rollforward of Mortgage loans on real estate for the years ended
December 31, 2016
and
2015
and for the period from March 28, 2014 (inception) through December 31, 2014 is provided below.
|
Year Ended December 31, 2016
|
Year Ended
December 31, 2015
|
For the period
March 28, 2014
(inception) through
December 31, 2014
|
||||||||
|
Balance at beginning of period
|
$
|
10,897
|
|
$
|
—
|
|
$
|
—
|
|
|
|
Additions during the period:
|
||||||||||
|
New or acquired mortgages, net
|
12,406
|
|
10,863
|
|
—
|
|
||||
|
Amortization of loan and commitment fees
|
75
|
|
34
|
|
—
|
|
||||
|
12,481
|
|
10,897
|
|
—
|
|
|||||
|
Deductions during the period:
|
||||||||||
|
Conversion upon acquisition
(a)
|
(12,500
|
)
|
—
|
|
—
|
|
||||
|
Scheduled principal payments
|
(92
|
)
|
—
|
|
—
|
|
||||
|
(12,592
|
)
|
—
|
|
—
|
|
|||||
|
Balance at end of period
(b)
|
$
|
10,786
|
|
$
|
10,897
|
|
$
|
—
|
|
|
(a) Conversion of a
$12.5 million
mortgage note upon the acquisition of the property that secured the note on May 23, 2016.
(b) Total mortgage loans as of December 31, 2016 had an aggregate total cost of
$10.9 million
(unaudited) for federal income tax purposes.
95
TABLE OF CONTENTS
Part IItem 1. BusinessItem 1A. Risk FactorsItem 1B. Unresolved Staff CommentsItem 2. PropertiesItem 3. Legal ProceedingsItem 4. Mine Safety DisclosuresPart IIItem 5. Market For Registrant's Common Equity, Related Stockholder Matters and Issuer Purchases Of Equity SecuritiesItem 6. Selected Financial DataItem 7. Management S Discussion and Analysis Of Financial Condition and Results Of OperationsItem 7A. Quantitative and Qualitative Disclosures About Market RiskItem 8. Financial Statements and Supplementary DataNote 1 Summary Of Significant Accounting PoliciesNote 2 Real Estate InvestmentsNote 3 Real Estate LeasesNote 4 Real Estate AcquisitionsNote 5 Revolving Credit FacilityNote 6 Stockholders EquityNote 7 Income (loss) Per Common ShareNote 8 Incentive PlanNote 9 Other AssetsNote 10 Intangible Assets and LiabilitiesNote 11 Commitments and ContingenciesNote 12 Fair Value Of Financial InstrumentsNote 13 Other DataNote 14 Related Party TransactionsNote 15 Subsequent EventsNote 16 Selected Quarterly Financial Data (unaudited)Item 9. Changes in and Disagreements with Accountants on Accounting and Financial DisclosureItem 9A. Controls and ProceduresItem 9B. Other InformationPart IIIItem 10. Directors, Executive Officers and Corporate GovernanceItem 11. Executive CompensationItem 12. Security Ownership Of Certain Beneficial Owners and Management and Related Stockholder MattersItem 13. Certain Relationships and Related Transactions, and Director IndependenceItem 14. Principal Accountant Fees and ServicesPart IVItem 15. Exhibits and Financial Statement Schedules