CHURCHILL DOWNS INC
10-Ks and 10-Qs
|
|
|
|
|
|
|
|
|
|
|
|
|
|
|
|
|
|
|
|
|
|
|
|
|
|
|
|
|
|
|
|
|
|
|
|
|
|
|
|
|
|
|
|
|
|
|
|
|
|
|
|
|
|
|
|
UNITED STATES
SECURITIES AND EXCHANGE COMMISSION
WASHINGTON, D.C. 20549
FORM 10-K
|
x
|
ANNUAL REPORT PURSUANT TO SECTION 13 OR 15(d) OF THE SECURITIES EXCHANGE
ACT OF 1934
|
For the fiscal year ended
December 31, 2013
OR
|
o
|
TRANSITION REPORT PURSUANT TO SECTION 13 OR 15(d) OF THE SECURITIES EXCHANGE ACT OF 1934
|
For the transition period from
to
Commission file number 001-33998

(Exact name of registrant as specified in its charter)
|
Kentucky
|
|
61-0156015
|
|
(State or other jurisdiction of incorporation or organization)
|
|
(IRS Employer Identification No.)
|
|
600 North Hurstbourne Parkway, Suite 400
Louisville, Kentucky 40222
|
|
(502) 636-4400
|
|
(Address of principal executive offices) (zip code)
|
|
(Registrant’s telephone number, including area code)
|
Securities registered pursuant to Section 12(b) of the Act:
|
Common Stock, No Par Value
|
|
The NASDAQ Stock Market LLC
|
|
(Title of each class registered)
|
|
(Name of each exchange on which registered)
|
Securities registered pursuant to Section 12(g) of the Act:
None
(Title of class)
Indicate by check mark if the Registrant is a well-known seasoned issuer, as defined in Rule 405 of the Securities Act. Yes
x
No
o
Indicate by check mark if the Registrant is not required to file reports pursuant to Section 13 or Section 15(d) of the Exchange Act. Yes
o
No
x
Indicate by check mark whether the Registrant (1) has filed all reports required to be filed by Section 13 or 15(d) of the Exchange Act during the preceding 12 months and (2) has been subject to such filing requirements for the past 90 days. Yes
x
No
o
Indicate by check mark whether the Registrant has submitted electronically and posted on its corporate Web site, if any, every Interactive Data File required to be submitted and posted pursuant to Rule 405 of Regulation S-T (§232.405) during the preceding 12 months (or for such shorter period that the Registrant was required to submit and post such files). Yes
x
No
o
Indicate by check mark if disclosure of delinquent filers pursuant to Item 405 of Regulation S-K is not contained herein, and will not be contained, to the best of Registrant’s knowledge, in definitive proxy or information statements incorporated by reference in Part III of this Form 10-K or any amendment to this Form 10-K.
o
Indicate by check mark whether the Registrant is a large accelerated filer, an accelerated filer, a non-accelerated filer or a smaller reporting company. See definitions of “large accelerated filer,” “accelerated filer” and “smaller reporting company” in Rule 12b-2 of the Exchange Act.
|
Large accelerated filer
x
|
Accelerated filer
o
|
Non-accelerated filer
o
|
Smaller reporting company
o
|
Indicate by check mark whether the Registrant is a shell company (as defined in Rule 12b-2 of the Exchange Act). Yes
o
No
x
As of
February 21, 2014
,
17,944,490
shares of the Registrant’s Common Stock were outstanding. As of
June 30, 2013
(based upon the closing sale price for such date on the NASDAQ Global Market), the aggregate market value of the shares held by non-affiliates of the Registrant was
$1,095,622,642
.
Portions of the Registrant’s Proxy Statement for its Annual Meeting of Shareholders to be held on April 22, 2014 are incorporated by reference herein in response to Items 10, 11, 12, 13 and 14 of Part III of Form 10-K. The exhibit index is located on pages 111-114.
CHURCHILL DOWNS INCORPORATED
INDEX TO ANNUAL REPORT ON FORM 10-K
For the Year Ended
December 31, 2013
2
|
ITEM 1.
|
BUSINESS
|
|
A.
|
Introduction
|
Churchill Downs Incorporated (the “Company”) is a diversified provider of pari-mutuel horseracing, casino gaming, entertainment, and is the country’s premier source of online account wagering on horseracing events. We offer gaming products through our casinos in Mississippi, our slot and video poker operations in Louisiana, our slot and poker operations in Florida, our slot and table games operations in Maine and our video lottery terminal joint venture facility in Ohio. We were organized as a Kentucky corporation in 1928. Our principal executive offices are located at 600 North Hurstbourne Parkway, Suite 400, Louisville, Kentucky, 40222.
We manage our operations through four operating segments as follows:
|
1.
|
Racing Operations, which includes:
|
|
•
|
Churchill Downs Racetrack (“Churchill Downs”) in Louisville, Kentucky, an internationally known thoroughbred racing operation and home of the Kentucky Derby since 1875;
|
|
•
|
Arlington International Race Course (“Arlington”), a thoroughbred racing operation in Arlington Heights along with
eleven
off-track betting facilities (“OTBs”) in Illinois;
|
|
•
|
Calder Race Course (“Calder”), a thoroughbred racing operation in Miami Gardens, Florida; and
|
|
•
|
Fair Grounds Race Course (“Fair Grounds”), a thoroughbred racing operation in New Orleans along with
twelve
OTBs in Louisiana.
|
|
2.
|
Gaming, which includes:
|
|
•
|
Oxford Casino ("Oxford") in Oxford, Maine, which we acquired on July 17, 2013. Oxford operates approximately
850
slot machines,
26
table games and various dining facilities;
|
|
•
|
Riverwalk Casino Hotel ("Riverwalk") in Vicksburg, Mississippi, which we acquired on October 23, 2012. Riverwalk operates approximately
710
slot machines,
22
table games, a five story, 80-room attached hotel, multi-functional event center and dining facilities;
|
|
•
|
Harlow’s Casino Resort & Spa (“Harlow’s”) in Greenville, Mississippi, which operates approximately
750
slot machines,
13
table games, a five-story, 105-room attached hotel, multi-functional event center, pool, spa and dining facilities;
|
|
•
|
Calder Casino, a slot facility in Florida adjacent to Calder, which operates approximately
1,140
slot machines and includes a poker room operation branded “Studz Poker Club”;
|
|
•
|
Fair Grounds Slots, a slot facility in Louisiana adjacent to Fair Grounds, which operates approximately
620
slot machines; and
|
|
•
|
Video Services, LLC (“VSI”), the owner and operator of approximately
780
video poker machines in Louisiana.
|
|
3.
|
Online Business, which includes:
|
|
•
|
TwinSpires, an Advance Deposit Wagering (“ADW”) business that is licensed as a multi-jurisdictional simulcasting and interactive wagering hub in the state of Oregon;
|
|
•
|
Fair Grounds Account Wagering (“FAW”), an ADW business that is licensed in the state of Louisiana;
|
|
•
|
Velocity, a business that is licensed in the British Dependency Isle of Man focusing on high wagering-volume international customers;
|
|
•
|
Luckity, an ADW business launched during October 2012 that offers real-money bingo with outcomes based on and determined by pari-mutuel wagers on live horseraces;
|
|
•
|
Bloodstock Research Information Services (“BRIS”), a data service provider for the equine industry; and
|
|
•
|
Our equity investment in HRTV, LLC (“HRTV”), a horseracing television channel.
|
|
4.
|
Other Investments, which includes:
|
|
•
|
United Tote Company and United Tote Canada (collectively “United Tote”), which manufactures and operates pari-mutuel wagering systems for racetracks, OTBs and other pari-mutuel wagering businesses;
|
3
|
•
|
Bluff Media ("Bluff"), a multimedia poker content brand and publishing company, acquired by the Company on February 10, 2012;
|
|
•
|
Our equity investment in Miami Valley Gaming & Racing, LLC ("MVG"), a 50% joint venture harness racetrack and video lottery terminal facility in Lebanon, Ohio, which opened December 12, 2013. MVG has
1,600
video lottery machines; and
|
|
•
|
Our other minor investments.
|
|
B.
|
Acquisition, Development & Disposal Activity
|
Oxford
On July 17, 2013, the Company completed its acquisition of Oxford in Oxford, Maine for cash consideration of approximately $168.6 million. The transaction included the acquisition of a 25,000-square-foot casino with various dining facilities on approximately 130 acres of land. The acquisition continued the Company's diversification and growth strategies to invest in assets with rates of returns attractive to the Company's shareholders. The Company financed the acquisition with borrowings under its senior secured credit facility. During December 2013, Oxford continued an expansion of its facilities, adding an additional 46 slot machines and four table games. An additional twelve slot machines will be added to the facilities during 2014.
Riverwalk
On October 23, 2012, we completed our acquisition of Riverwalk in Vicksburg, Mississippi for cash consideration of approximately $145.6 million. The transaction includes the acquisition of a 25,000-square-foot casino, an 80-room hotel, a 5,600-square-foot event center and dining facilities on approximately 22 acres of land.
Miami Valley Gaming & Racing Joint Venture
During March 2012, the Company entered into a 50% joint venture with Delaware North Companies Gaming & Entertainment Inc. (“DNC”) to develop a new harness racetrack and video lottery terminal (“VLT”) gaming facility in Lebanon, Ohio.
Through the joint venture agreement, the Company and DNC formed a new company, MVG, which will manage both the Company’s and DNC’s interests in the development and operation of the racetrack and VLT gaming facility. During the years ended December 31, 2013 and 2012, the Company funded $70.5 million and $19.9 million in initial capital contributions to the joint venture, respectively. The Company anticipates providing funding of $24.0 million to MVG during 2014. On December 21, 2012, MVG completed the purchase of the harness racing licenses and certain assets held by Lebanon Trotting Club Inc. and Miami Valley Trotting Inc. for total consideration of $60.0 million, of which $10.0 million was funded at closing with the remainder funded through a $50.0 million note payable with a six year term effective upon the commencement of gaming operations. In addition, there is a potential contingent consideration payment of $10.0 million based on the financial performance of the facility during the seven year period after gaming operations commence.
Construction began in December 2012 on the new gaming and racing facility in Lebanon, Ohio on a 120-acre site. On December 12, 2013, MVG commenced operations at the new facility. The new facility features 1,600 video lottery terminals, a racing simulcast center, and a 5/8-mile harness racetrack which can accommodate more than 1,000 harness-racing fans in an indoor grandstand. MVG has invested approximately $212.0 million in the new facility, which includes a $50.0 million license fee payable to the Ohio Lottery Commission.
Bluff
Bluff, which was acquired in February 2012, operates a poker periodical,
BLUFF Magazine
and
BluffMagazine.com
; ThePokerDB, a comprehensive online database and resource that tracks and ranks the performance of poker players and tournaments; and various other news and content forums. On December 18, 2013, we completed the sale of 100% of the assets of Fight! Magazine ("Fight"), a division of Bluff.
Kentucky Off-Track Betting, LLC
Kentucky Off-Track Betting, LLC ("KOTB") owned and operated facilities for the simulcasting of races and the acceptance of wagers on such races at Kentucky locations other than a racetrack. OTBs developed by KOTB provided additional markets for the intrastate simulcasting of and wagering on Churchill Downs’ live races and interstate simulcasting of and wagering on out-of-state signals. We held a 25% ownership stake in KOTB, which ceased operations during June 2013. KOTB did not contribute significantly to our operations and its closure did not have a material impact on our results of operation.
|
C.
|
Live Racing
|
We conduct live horseracing at Churchill Downs, Calder, Fair Grounds and Arlington. The following is a summary of our significant live racing events, a description of our properties and our annual racing calendar.
4
The Kentucky Derby and the Kentucky Oaks, both held at Churchill Downs, continue to be our premier racing events offering minimum purses of $2.0 million and $1.0 million, respectively. The Kentucky Derby is the first race of the annual series of races for 3-year old thoroughbreds, known as the Triple Crown. Our other significant stakes races include the Summit of Speed at Calder, the Arlington Million at Arlington, and the Louisiana Derby at Fair Grounds, each of which offers purses of approximately $1.0 million.
Churchill Downs
The Churchill Downs racetrack site and improvements (the “Churchill facility”) are located in Louisville, Kentucky. Churchill Downs has conducted thoroughbred racing continuously since 1875 and is internationally known as the home of the Kentucky Derby. The Churchill facility consists of approximately 147 acres of land with a one-mile dirt track, a seven-eighths (7/8) mile turf track, permanent grandstands, luxury suites and a stabling area. The Churchill facility accommodates approximately 55,600 persons in our clubhouse, grandstand, Jockey Club Suites, Finish Line Suites, and Mansion. The facility also includes a simulcast wagering facility designed to accommodate 1,500 persons, a general admissions area, and food and beverage facilities ranging from concessions to full-service restaurants. The Churchill facility also has a saddling paddock, accommodations for groups and special events, parking areas for the public, our racetrack office facilities, and includes permanent lighting in order to accommodate night races. The stable area has barns sufficient to accommodate approximately 1,400 horses, a 114-room dormitory and other facilities for backstretch personnel. During January 2013, the facility opened a new simulcast wagering facility, "The Parlay", designed to accommodate 600 persons, which is Churchill Downs' simulcast wagering facility during the months outside of its live racing meets and houses the track's media operations in the weeks leading up to the Kentucky Derby. The facility also opened a new hospitality venue, "The Mansion", during the second quarter of 2013. The Mansion, located on the sixth floor of the Clubhouse, is used primarily during the Kentucky Derby and Kentucky Oaks. The Mansion has accommodations for 296 guests and offers settings in its Dining Room, Living Room, Library, Parlor and Veranda. During the second quarter of 2014, the Churchill facility is expected to open the Grandstand Terrace and Rooftop Garden. This new area will offer nearly 2,400 new seats, and it will expand and update the restrooms, wagering windows and food and beverage offerings. Additionally, during the second quarter of 2014, the Churchill facility expects to complete the installation of a 15,224 square foot, state of the art high-definition video board, which will provide an enhanced viewing experience for patrons.
To supplement the facilities at Churchill Downs, we provide additional stabling facilities sufficient to accommodate 500 horses and a three-quarter (3/4) mile dirt track, which is used for training thoroughbreds, at a training facility also located in Louisville. Referred to as Trackside Louisville, this facility provides a base of operation for many horsemen between the Spring and Fall meets and enables us to attract new horsemen to race at Churchill Downs. Trackside Louisville is not open to stabling during the winter months.
As part of financing improvements to the Churchill facility, during 2002, we transferred title of the Churchill facility to the City of Louisville, Kentucky and leased back the facility. Subject to the terms of the lease, we can re-acquire the facility at any time for $1.00.
Calder
The Calder racetrack and improvements (the “Calder facility”) are located in Miami-Dade County, Florida. The Calder facility is adjacent to Sun Life Stadium, home of the Miami Dolphins, and consists of approximately 231 acres of land with a one-mile dirt track, a seven-eighths (7/8) mile turf track, a training area with a five-eighths (5/8) mile training track, permanent grandstands and a stabling area. The Calder facility includes clubhouse and grandstand seating for approximately 15,000 persons, a general admissions area and food and beverage facilities ranging from concessions to a buffet dining area. The stable area consists of a receiving barn, feed rooms, tack rooms, detention barns and living quarters and can accommodate approximately 1,800 horses. The Calder facility also features a saddling paddock, parking areas for the public and office facilities.
Fair Grounds
The Fair Grounds racetrack facility, located in New Orleans, Louisiana, consists of approximately 145 acres of land, a one-mile dirt track, a seven-eighths (7/8) mile turf track, permanent grandstands and a stabling area. The facility includes clubhouse and grandstand seating for approximately 5,000 persons, a general admissions area and food and beverage facilities ranging from concessions to clubhouse dining. The stable area consists of a receiving barn, feed rooms, tack rooms, detention barns and living quarters that can accommodate 132 persons and approximately 2,000 horses. The Fair Grounds facility also features a saddling paddock, parking areas and office facilities.
5
Arlington
The Arlington racetrack, located in Arlington Heights, Illinois, was constructed in 1927 and reopened its doors in 1989 after a devastating fire four years earlier. The racetrack sits on 336 acres, has a one and one-eighth (1 1/8) mile synthetic track, a one-mile turf track and a five-eighths (5/8) mile training track. The facility includes a permanent clubhouse, grandstand and suite seating for 6,045 persons and food and beverage facilities ranging from fast food to full-service restaurants. The stable area has 34 barns able to accommodate approximately 2,200 horses and a temporary housing unit that accommodates 288 persons. The Arlington facility also features a saddling paddock, parking areas and office facilities.
Racing Calendar
The following table is a summary of our expected 2014 and actual 2013 live thoroughbred racing dates and the number of live racing days for each of our four racetracks. Racing dates are generally approved annually by the respective state racing authorities:
|
|
2014
|
2013
|
||||||||
|
Racetrack
|
Racing Dates
|
# of Days
|
Racing Dates
|
# of Days
|
||||||
|
Churchill Downs
|
||||||||||
|
Spring Meet
|
April 26 - June 29
|
38
|
|
April 27 - June 30
|
38
|
|
||||
|
September Meet
|
Sept. 4 - Sept 28
|
12
|
|
Sept. 5 - 29
|
12
|
|
||||
|
Fall Meet
|
Oct. 26 - Nov. 30
|
26
|
|
Oct. 27 - Nov. 30
|
25
|
|
||||
|
76
|
|
75
|
|
|||||||
|
Calder Race Course
|
||||||||||
|
Calder Meet
|
Jan. 1 - Aug. 31
|
119
|
|
April 6- Aug. 31
|
76
|
|
||||
|
Tropical Meet
|
Sept. 1 - Dec. 31
|
40
|
|
Sept. 1 - Dec. 31
|
53
|
|
||||
|
159
|
|
129
|
|
|||||||
|
Arlington
|
May 2 - Sept. 28
|
89
|
|
May 1 - Sept. 30
|
89
|
|
||||
|
Fair Grounds
|
||||||||||
|
Winter Meet 12/13
|
Jan. 1 - Mar. 31
|
56
|
|
|||||||
|
Winter Meet 13/14
|
Jan. 1 - Mar. 30
|
59
|
|
Nov. 22 - Dec. 31
|
25
|
|
||||
|
Winter Meet 14/15
|
Nov. 20 - Dec. 31
|
26
|
|
|||||||
|
85
|
|
81
|
|
|||||||
|
Total thoroughbred race dates
|
409
|
|
374
|
|
||||||
During 2014, MVG expects to conduct
66
days of live harness racing during the months of February through May.
|
D.
|
Simulcast Operations
|
We generate a significant portion of our pari-mutuel wagering revenues by sending signals of races from our racetracks to other facilities and businesses (“export”) and receiving signals from other racetracks (“import”). Revenues are earned through pari-mutuel wagering on signals that we both import and export.
Arlington conducts on-site simulcast wagering only during live racing meets, while Churchill Downs, Calder and Fair Grounds offer year-round simulcast wagering at the racetracks. The OTBs located in Illinois and Louisiana conduct simulcast wagering year-round.
Off-Track Betting Facilities
Eleven of our OTBs are collectively branded “Trackside” to create a common identity for our OTB operations. Trackside Louisville ceased operating as a simulcast wagering facility during 2013. Historically, Trackside Louisville opened as a simulcasting wagering facility on big event days such as the Kentucky Derby and the Kentucky Oaks and during days the Churchill facility was being prepared for special events. It is an extension of Churchill Downs and is located approximately five miles from the Churchill facility. This 100,000 square-foot property, on approximately 88 acres of land, is a thoroughbred training and stabling annex and will operate only as such going forward. It previously also had audio visual capabilities for pari-mutuel wagering, seating for
6
approximately 3,000 persons, parking, and related facilities for simulcasting races. The Company is currently assessing other opportunities for use of this property and during 2012, we reviewed the useful lives of assets at this facility and commenced accelerated depreciation on certain long-term assets. We have determined that no impairment has occurred for these assets as of December 31, 2013.
Arlington operates
eleven
Trackside OTBs that accept wagers on races at Arlington as well as on races simulcast from other locations. One OTB is located on the Arlington property and another is located in East Moline, Illinois on approximately 122 acres. Arlington also leases an OTB located in Waukegan, Illinois consisting of approximately 25,000 square feet. Arlington operates eight OTBs within existing non-owned Illinois restaurants under license agreements. These OTBs are located in Chicago, which was relocated from its previous location in June 2012, Orland Hills, Villa Park, Rockford, South Elgin, McHenry, Hodgkins and Aurora and opened in April 2012, July 2011, December 2009, December 2002, June 2003, December 2007 and April 2013, respectively.
Fair Grounds operates
twelve
OTBs that accept wagers on races at Fair Grounds as well as on races simulcast from other locations. The Gentilly OTB is located on the Fair Grounds property. Another is located in Kenner, Louisiana and consists of approximately 4.3 acres. Fair Grounds also leases ten OTBs located in these southeast Louisiana communities: Chalmette, consisting of approximately 8,000 square feet of space; Covington, which consists of approximately 7,000 square feet of space; Elmwood, which consists of approximately 15,000 square feet of space; Gretna, which consists of approximately 20,000 square feet of space; Houma, which consists of approximately 10,000 square feet of space; LaPlace, which consists of approximately 7,000 square feet of space; Metairie, which consists of approximately 9,000 square feet of space; Boutte, which consists of approximately 10,000 square feet of space; Thibodaux, which consists of approximately 5,000 square feet of space; and Westwego, which consists of approximately 5,000 square feet of space. Video poker is offered at Chalmette, Kenner, Elmwood, Gretna, Houma, LaPlace, Boutte, Metairie, Thibodaux and Westwego.
|
E.
|
Advance Deposit Wagering
|
We accept pari-mutuel wagers through Churchill Downs Technology Initiatives Company, which is doing business as TwinSpires.com. TwinSpires.com’s headquarters is located in Mountain View, California and operates our ADW business, which accepts pari-mutuel wagering from customers residing in certain states who establish and fund an account from which they may place wagers via telephone, mobile device or through the Internet at www.twinspires.com. TwinSpires offers its customers streaming video of live horse races along with race replays and an assortment of racing and handicapping information. TwinSpires also offers all of its customers the ability to automatically qualify for its rewards program, TSC Elite. We believe that TwinSpires is a key component to the growth of the Company.
In addition, TwinSpires provides to other entities and earns commissions from white label advance deposit wagering products and services. Under these arrangements, TwinSpires typically provides an advance deposit wagering platform and related operational activities while the other entities typically provide a brand name, marketing and limited customer functions. Fair Grounds also operates its own ADW business for Louisiana residents through a contractual agreement with TwinSpires. Velocity operates an ADW business that is licensed in the British Dependency Isle of Man focused on high wagering-volume international customers and Luckity operates an ADW business that offers real-money bingo with outcomes based on and determined by pari-mutuel wagers on live horseraces.
|
F.
|
Gaming Operations
|
On July 17, 2013, we completed the acquisition of Oxford in Oxford, Maine for cash consideration of approximately $168.6 million. The transaction included the acquisition of a 25,000-square-foot casino with approximately 800 slot machines and 22 table games and dining facilities on approximately 130 acres of land.
On October 23, 2012, we completed the acquisition of Riverwalk in Vicksburg, Mississippi for cash consideration of approximately $145.6 million. The transaction included the acquisition of a 25,000-square-foot casino with approximately 725 slots machines and 18 table games, an 80-room hotel, a 5,600-square-foot event center and dining facilities on approximately 22 acres of land.
On December 16, 2010, we completed the acquisition of Harlow’s in Greenville, Mississippi for cash consideration of approximately $140.4 million. The transaction included the acquisition of a 33,000-square foot casino with approximately 900 slot machines and 21 tables games, a 105-room attached hotel, a 2,600-seat entertainment center and three dining facilities. Harlow’s is located on approximately 78 acres of leased land adjacent to U.S. Highway 82 in Greenville, Mississippi. The property is visible from the highway and is the first gaming facility encountered when crossing the Greenville Bridge into Mississippi from Arkansas. On May 12, 2011, the property sustained flood damage to its 2,600-seat entertainment center and a portion of its dining facilities. On June 1, 2011, we resumed casino operations with temporary dining facilities. During December 2012 and January 2013, we completed the renovation and improvement projects, which included a new buffet area, steakhouse, business center, spa facility, fitness center, pool and a multi-purpose event center.
7
On January 22, 2010, we opened a slot facility, Calder Casino, which is adjacent to Calder and offers approximately
1,140
slot machines in a single-level, 104,000 square foot facility and a poker room operation branded “Studz Poker Club”. Calder is the sole thoroughbred racetrack in Miami-Dade County, Florida to offer both live and import simulcast pari-mutuel wagering in addition to a casino facility. The facility offers three dining options, including a buffet dining area, a centrally located bar with a separate casual dining area and a “grab and go” dining option.
During October 2008, we opened our permanent 33,000-square-foot slot operations facility, Fair Grounds Slots, adjacent to Fair Grounds, which operates approximately
620
slot machines. The facility includes two concession areas, a bar adjacent to the gaming floor, a renovated simulcast facility and other amenities for gaming and pari-mutuel wagering patrons.
VSI is the operator of approximately
780
video poker machines at
ten
OTBs operated by Fair Grounds.
We intend to continue to pursue expanded gaming opportunities with the goal of broadening our market, and thereby increasing gaming revenues.
|
G.
|
Information and Totalisator Services
|
We maintain one of the world’s largest computerized databases of pedigree and racing information for the thoroughbred horse industry. We provide special reports, statistical information, handicapping information, pedigrees, and other data to organizations, publications and individuals within the thoroughbred industry. This service is accessible through the Internet at www.brisnet.com. In addition, many of the handicapping products are available at our ADW site,
www.twinspires.com
.
We manufacture and operate pari-mutuel wagering systems for racetracks, OTBs and other pari-mutuel wagering businesses through our subsidiary, United Tote. United Tote provides totalisator services, which accumulate wagers, record sales, calculate payoffs and display wagering data to patrons who wager on horseraces. United Tote has contracts to provide totalisator services to a significant number of third-party racetracks, OTBs and other pari-mutuel wagering businesses, in addition to providing these services at many of our facilities.
|
H.
|
Sources of Revenue
|
Our racing revenues include commissions on pari-mutuel wagering at our racetracks and OTBs, plus simulcast host fees earned from other wagering sites. In addition, amounts include ancillary revenues generated by the pari-mutuel facilities including admissions, sponsorships and licensing rights and food and beverage sales. Our gaming revenues are primarily generated from slot machines, video poker, poker card room and table games and ancillary revenues such as hotel and food and beverage sales. Our online revenues are generated by our ADW business from wagering through the Internet, telephone or other mobile devices on pari-mutuel events. Finally, our other revenues are primarily generated by United Tote and our other minor subsidiaries.
Financial information about our segments required by this Item is incorporated by reference from the information contained in the Notes to Consolidated Financial Statements included in Item 8. “Financial Statements and Supplementary Data” of this Annual Report on Form 10-K.
|
I.
|
Governmental Regulations
|
The ownership, operation, and management of our gaming and racing facilities are subject to pervasive regulation under the laws and regulations of each of the jurisdictions in which we operate. Gaming laws are generally based upon declarations of public policy designed to protect gaming consumers and the viability and integrity of the gaming industry. Gaming laws also may be designed to protect and maximize state and local revenues derived through taxes and licensing fees imposed on gaming industry participants as well as to enhance economic development and tourism. To accomplish these public policy goals, gaming laws establish procedures to ensure that participants in the gaming industry meet certain standards of character and fitness. In addition, gaming laws require gaming industry participants to:
|
•
|
Ensure that unsuitable individuals and organizations have no role in gaming operations;
|
|
•
|
Establish procedures designed to prevent cheating and fraudulent practices;
|
|
•
|
Establish and maintain responsible accounting practices and procedures;
|
|
•
|
Maintain effective controls over their financial practices, including establishment of minimum procedures for internal fiscal affairs and the safeguarding of assets and revenues;
|
|
•
|
Maintain systems for reliable record keeping;
|
|
•
|
File periodic reports with gaming regulators;
|
|
•
|
Ensure that contracts and financial transactions are commercially reasonable, reflect fair market value and are arms-length transactions; and
|
8
|
•
|
Establish programs to promote responsible gaming and inform patrons of the availability of help for problem gaming.
|
Typically, a state regulatory environment is established by statute and is administered by a regulatory agency with broad discretion to regulate the affairs of owners, managers, and persons with financial interests in gaming operations. Among other things, gaming authorities in the various jurisdictions in which we operate:
|
•
|
Adopt rules and regulations under the implementing statutes;
|
|
•
|
Interpret and enforce gaming laws;
|
|
•
|
Impose disciplinary sanctions for violations, including fines and penalties;
|
|
•
|
Review the character and fitness of participants in gaming operations and make determinations regarding their suitability or qualification for licensure;
|
|
•
|
Grant licenses for participation in gaming operations;
|
|
•
|
Collect and review reports and information submitted by participants in gaming operations;
|
|
•
|
Review and approve transactions, such as acquisitions or change-of-control transactions of gaming industry participants, securities offerings and debt transactions engaged in by such participants; and
|
|
•
|
Establish and collect fees and taxes.
|
Any change in the laws or regulations of a gaming jurisdiction could have a material adverse effect on our gaming operations.
Licensing and Suitability Determinations
Gaming laws require us, each of our subsidiaries engaged in gaming operations, certain of our directors, officers and employees, and in some cases, certain of our shareholders, to obtain licenses from gaming authorities. Licenses typically require a determination that the applicant qualifies or is suitable to hold the license. Gaming authorities have very broad discretion in determining whether an applicant qualifies for licensing or should be deemed suitable. Criteria used in determining whether to grant a license to conduct gaming operations, while varying between jurisdictions, generally include consideration of factors such as the good character, honesty and integrity of the applicant; the financial stability, integrity and responsibility of the applicant, including whether the operation is adequately capitalized in the state and exhibits the ability to maintain adequate insurance levels; the quality of the applicant’s casino facilities; the amount of revenue to be derived by the applicable state from the operation of the applicant’s casino; the applicant’s practices with respect to minority hiring and training; and the effect on competition and general impact on the community.
In evaluating individual applicants, gaming authorities consider the individual’s business experience and reputation for good character, the individual’s criminal history and the character of those with whom the individual associates.
Many gaming jurisdictions limit the number of licenses granted to operate casinos within the state, and some states limit the number of licenses granted to any one gaming operator. Licenses under gaming laws are generally not transferable without approval. Licenses in most of the jurisdictions in which we conduct gaming operations are granted for limited durations and require renewal from time to time. There can be no assurance that any of our licenses will be renewed. The failure to renew any of our licenses could have a material adverse effect on our gaming operations.
In addition to our subsidiaries engaged in gaming operations, gaming authorities may investigate any individual who has a material relationship to or material involvement with, any of these entities to determine whether such individual is suitable or should be licensed as a business associate of a gaming licensee. Our officers, directors and certain key employees must file applications with the gaming authorities and may be required to be licensed, qualify or be found suitable in many jurisdictions. Gaming authorities may deny an application for licensing for any cause which they deem reasonable. Qualification and suitability determinations require submission of detailed personal and financial information followed by a thorough investigation. The applicant must pay all the costs of the investigation. Changes in licensed positions must be reported to gaming authorities and in addition to their authority to deny an application for licensure, qualification or a finding of suitability, gaming authorities have jurisdiction to disapprove a change in a corporate position.
If one or more gaming authorities were to find that an officer, director or key employee fails to qualify or is unsuitable for licensing or unsuitable to continue having a relationship with us, we would be required to sever all relationships with such person. In addition, gaming authorities may require us to terminate the employment of any person who refuses to file appropriate applications.
Moreover, in many jurisdictions, certain of our shareholders may be required to undergo a suitability investigation similar to that described above. Many jurisdictions require any person who acquires beneficial ownership of more than a certain percentage of our voting securities, typically 5%, to report the acquisition to gaming authorities, and gaming authorities may require such holders to apply for qualification or a finding of suitability. Most gaming authorities, however, allow an “institutional investor” to apply
9
for a waiver. An “institutional investor” is generally defined as an investor acquiring and holding voting securities in the ordinary course of business as an institutional investor, and not for the purpose of causing, directly or indirectly, the election of a member of our board of directors, any change in our corporate charter, bylaws, management, policies or operations, or those of any of our gaming affiliates, or the taking of any other action which gaming authorities find to be inconsistent with holding our voting securities for investment purposes only. Even if a waiver is granted, an institutional investor generally may not take any action inconsistent with its status when the waiver was granted without once again becoming subject to the foregoing reporting and application obligations.
Generally, any person who fails or refuses to apply for a finding of suitability or a license within the prescribed period after being advised it is required by gaming authorities may be denied a license or found unsuitable, as applicable. Any shareholder found unsuitable or denied a license and who holds, directly or indirectly, any beneficial ownership of our voting securities beyond such period of time as may be prescribed by the applicable gaming authorities may be guilty of a criminal offense. Furthermore, we may be subject to disciplinary action if, after we receive notice that a person is unsuitable to be a shareholder or to have any other relationship with us or any of our subsidiaries, we: (i) pay that person any dividend or interest upon our voting securities; (ii) allow that person to exercise, directly or indirectly, any voting right conferred through securities held by that person; (iii) pay remuneration in any form to that person for services rendered or otherwise; or (iv) fail to pursue all lawful efforts to require such unsuitable person to relinquish his voting securities including, if necessary, the immediate purchase of said voting securities for cash at fair market value.
Violations of Gaming Laws
If we or our subsidiaries violate applicable gaming laws, our gaming licenses could be limited, conditioned, suspended or revoked by gaming authorities, and we and any other persons involved could be subject to substantial fines. Further, a supervisor or conservator can be appointed by gaming authorities to operate our gaming properties, or in some jurisdictions, take title to our gaming assets in the jurisdiction, and under certain circumstances, earnings generated during such appointment could be forfeited to the applicable state or states. Furthermore, violations of laws in one jurisdiction could result in disciplinary action in other jurisdictions. As a result, violations by us of applicable gaming laws could have a material adverse effect on our gaming operations.
Some gaming jurisdictions prohibit certain types of political activity by a gaming licensee, its officers, directors and key employees. A violation of such a prohibition may subject the offender to criminal and/or disciplinary action.
Reporting and Record-keeping Requirements
We are required periodically to submit detailed financial and operating reports and furnish any other information about us and our subsidiaries which gaming authorities may require. Under federal law, we are required to record and submit detailed reports of currency transactions involving greater than $10,000 at our casinos and racetracks, as well as any suspicious activity that may occur at such facilities. Failure to comply with these requirements could result in fines or cessation of operations. We are required to maintain a current stock ledger which may be examined by gaming authorities at any time. If any securities are held in trust by an agent or by a nominee, the record holder may be required to disclose the identity of the beneficial owner to gaming authorities. A failure to make such disclosure may be grounds for finding the record holder unsuitable. Gaming authorities may require certificates for our securities to bear a legend indicating that the securities are subject to specified gaming laws.
Review and Approval of Transactions
Substantially all material loans, leases, sales of securities and similar financing transactions by us and our subsidiaries must be reported to and in some cases approved by gaming authorities. Neither we nor any of our subsidiaries may make a public offering of securities without the prior approval of certain gaming authorities. Changes in control through merger, consolidation, stock or asset acquisitions, management or consulting agreements, or otherwise are subject to receipt of prior approval of gaming authorities. Entities seeking to acquire control of us or one of our subsidiaries must satisfy gaming authorities with respect to a variety of stringent standards prior to assuming control. Gaming authorities may also require controlling stockholders, officers, directors and other persons having a material relationship or involvement with the entity proposing to acquire control, to be investigated and licensed as part of the approval process relating to the transaction.
License Fees and Gaming Taxes
We pay substantial license fees and taxes in many jurisdictions, including some of the counties and cities in which our operations are conducted, in connection with our casino gaming operations, computed in various ways depending on the type of gaming or activity involved. Depending upon the particular fee or tax involved, these fees and taxes are payable with varying frequency. License fees and taxes are based upon such factors as a percentage of the gross gaming revenues received; the number of gaming devices and table games operated; or a one-time fee payable upon the initial receipt of license and fees in connection with the renewal of license. In some jurisdictions, gaming tax rates are graduated such that they increase as gross gaming revenues increase.
10
Furthermore, tax rates are subject to change, sometimes with little notice, and such changes could have a material adverse effect on our gaming operations. In addition to taxes specifically unique to gaming, we are required to pay all other applicable taxes.
Operational Requirements
In most jurisdictions, we are subject to certain requirements and restrictions on how we must conduct our gaming operations. In certain states, we are required to give preference to local suppliers and include minority and women-owned businesses as well as organized labor in construction projects to the maximum extent practicable as well as in general vendor business activity. Similarly, we may be required to give employment preference to minorities, women and in-state residents in certain jurisdictions. In addition, our ability to conduct certain types of games, introduce new games or move existing games within our facilities may be restricted or subject to regulatory review and approval. Some of our operations are subject to restrictions on the number of gaming positions we may have and the maximum wagers allowed to be placed by our customers.
Horseracing and Pari-Mutuel Wagering Regulations
Horseracing is a highly regulated industry. In the U.S., individual states control the operations of racetracks located within their respective jurisdictions with the intent of, among other things, protecting the public from unfair and illegal gambling practices, generating tax revenue, licensing racetracks and operators and preventing organized crime from being involved in the industry. Although the specific form may vary, states that regulate horseracing generally do so through a horseracing commission or other gambling regulatory authority. In general, regulatory authorities perform background checks on all racetrack owners prior to granting them the necessary operating licenses. Horse owners, trainers, jockeys, drivers, stewards, judges and backstretch personnel are also subject to licensing by governmental authorities. State regulation of horse races extends to virtually every aspect of racing and usually extends to details such as the presence and placement of specific race officials, including timers, placing judges, starters and patrol judges. We currently satisfy the applicable licensing requirements of the racing and gambling regulatory authorities in each state where we maintain racetracks and/or carry on business, including, but not limited to, the Florida Department of Business and Professional Regulation, Division of Pari-Mutuel Wagering (“DPW”), the Illinois Racing Board (“IRB”), the Kentucky Horse Racing Commission (“KHRC”), the Louisiana State Racing Commission (“LSRC”), the Ohio State Racing Commission (“OSRC”) and the Oregon Racing Commission (“ORC”).
In the United States, interstate pari-mutuel wagering on horseracing is subject to the Interstate Horseracing Act (“IHA”) and its amendment in 2000. As a result of this statute, racetracks can commingle wagers from different racetracks and wagering facilities and broadcast horseracing events to other licensed establishments.
Kentucky
Kentucky’s racetracks, including Churchill Downs, are subject to the licensing and regulation of the KHRC. The KHRC is responsible for overseeing horseracing and regulating the state equine industry. Licenses to conduct live thoroughbred racing meets, to participate in simulcasting and to accept ADW wagers from Kentucky residents are approved annually by the KHRC based upon applications submitted by the racetracks in Kentucky. To some extent, Churchill Downs competes with other racetracks in Kentucky for the award of racing dates, however, the KHRC is required by state law to consider and seek to preserve each racetrack’s usual and customary live racing dates. During October 2013, Churchill Downs received re-approval to conduct its twelve-day September meet again during 2014, in addition to its traditional spring and fall racing meets.
Illinois
In Illinois, licenses to conduct live thoroughbred racing and to participate in simulcast wagering are approved by the IRB. Generally, there is no substantial change from year to year in the number of racing dates awarded to each racetrack. In January 2014, the IRB appointed Arlington the host track in Illinois for 23 simulcast host days, which is a decrease of three simulcast host days compared to the same period of 2013, but awarded Arlington three additional live host days during 2014, as compared to the prior year. The total host day allocation awarded to Arlington during 2014 did not change from the prior year.
During November 2013, Illinois racetracks and horsemen’s groups reached an agreement to extend Illinois’s account wagering law, which was scheduled to expire on January 31, 2014
. On January 29, 2014, the Illinois legislature approved regulations to reauthorize ADW wagering though January 2017 and will impose an incremental surcharge on winning wagers of 0.2%, in addition to the current surcharge of 0.18%. The legislation was approved by the Illinois legislature and signed by the Governor of Illinois during January 2014.
Florida
In Florida, licenses to conduct live thoroughbred racing and to participate in simulcast wagering are approved by the DPW. The DPW is responsible for overseeing the network of state offices located at every pari-mutuel wagering facility, as well as issuing the permits necessary to operate a pari-mutuel wagering facility. The DPW also issues annual licenses for thoroughbred, standardbred and quarter horse races but does not approve the specific live race days. Calder may face direct competition from other Florida racetracks, including Miami-area racetracks, and host more or fewer live racing dates in the future. In recent years,
11
Calder has elected to conduct fewer days of live racing in order to increase purses and maximize the quality of the racing product. Race date requests to the DPW for the 2014-2015 racing season are due on February 28, 2014, and Calder has not yet finalized its submission.
On February 28, 2013, Calder and Gulfstream Park submitted amended applications to the Florida Department of Business and Professional Regulation, Division of Pari-Mutuel Wagering (the “Division”) for the twelve month racing season beginning July 1, 2013. The Division approved Calder’s live race meet to run three days a week (Friday through Sunday) from July 1, 2013 to June 30, 2014, and Gulfstream Park’s live race meet to run from July 1, 2013, to June 30, 2014. Pursuant to the licenses granted, Calder and Gulfstream Park will simultaneously conduct live thoroughbred racing, in certain months, during 2013 and 2014. On July 6, 2013, Calder and Gulfstream Park conducted their first simultaneous live racing performances, and both racetracks are scheduled to continue to overlap live racing on certain dates through June 2014. This overlapping of live racing has resulted in direct competition for on-track horseracing, in the intrastate and interstate simulcast markets and for horses in South Florida, which negatively affected Calder’s ability to achieve full field horse races and to generate handle on live racing.
Previously in Florida, a thoroughbred racetrack conducting a live racing meet had control over hosting out-of-state signals, and received commissions on wagers placed at other racetracks throughout the state. There were instances where one or more thoroughbred racetracks operated live meets concurrently, and in that instance each racetrack had the opportunity to be a “host” track for out-of state interstate horseracing signals. When two or more thoroughbred racetracks operate live meets concurrently, other wagering sites must choose a live racetrack to host their pari-mutuel wagering. Three Florida thoroughbred racetracks, including Calder, have historically served as the host track based on their live racing calendar. On May 7, 2013, all of Florida’s three thoroughbred racetracks began claiming that they were all host tracks on a year round basis.
On May 24, 2013, Calder filed a petition with the Florida Division of Administrative Hearings (the “DOAH”) challenging the other racetracks' interpretation that they may conduct interstate simulcasting, and whether it is a valid interpretation of state law and the Interstate Horseracing Act of 1978. Calder believes that Florida statutes require at least three days of live racing per week to be considered a host track. Three days prior to the hearing, the Division moved to abate the case and go to rulemaking, which was granted. On June 28, 2013, a rule workshop was held, comments were submitted, and the Division had until July 26, 2013, to notify the Administrative Law Judge at the DOAH of the progress of the rulemaking of the Division. On July 23, 2013, the Division proposed a modification to state law which would permit multiple hosts, if the racetracks conducted at least two days of live racing per week.
On October 14, 2013, the Florida Legislature Joint Administrative Procedures Committee (the “Committee”) issued a letter to the Division challenging the Division’s authority to interpret Florida statutes and to permit thoroughbred racetracks to operate fewer than three live racing days per week to be considered host tracks. A public hearing on November 7, 2013 was held by the Division to address the Division’s proposed rules and, after taking comments from thoroughbred permit holders and other interested parties, the Division issued a Notice of Change on November 27, 2013, that thoroughbred permit holders must conduct three days of live racing per week in order to qualify as a host track. The Division has scheduled a rule hearing on March 6, 2014 to promulgate a rule which will further define thoroughbred hosting eligibility in Florida. Until Florida legal and regulatory matters related to this issue are resolved, we do not fully know the long-term implications of overlapping race dates on our business, financial condition and results of operations.
Louisiana
In Louisiana, licenses to conduct live thoroughbred racing and to participate in simulcast wagering are approved by the LSRC. The LSRC is responsible for overseeing the awarding of licenses for the conduct of live racing meets, the conduct of thoroughbred horseracing, the types of wagering which may be offered by pari-mutuel facilities and the disposition of revenue generated from wagering. Off-track wagering is also regulated by the LSRC. Louisiana law requires live racing at a licensed racetrack for at least 80 days over a 20 week period each year to maintain the license and to conduct gaming.
Additionally, with the addition of slot machines at Fair Grounds, Louisiana law requires live quarter horseracing to be conducted at the racetrack. We conducted fourteen days of quarter horseracing in 2013 and eight days of quarter horseracing in 2012.
Other States
TwinSpires is licensed in Oregon under a multi-jurisdictional simulcasting and interactive wagering totalisator hub license issued by the ORC and in accordance with Oregon law. TwinSpires also holds ADW licenses in certain other states such as California, Illinois, Idaho, Kentucky, Maryland, Virginia and Washington. Changes in the form of new legislation or regulatory activity at the state or federal level could adversely impact the operations, success or growth of our ADW business.
The total number of days on which each racetrack conducts live thoroughbred racing fluctuates annually according to each calendar year and the determination of applicable regulatory activities. A substantial change in the allocation of live racing days at any of our four racetracks could significantly impact our operations and earnings in future years.
12
Gaming Regulations
The manufacture, distribution, servicing and operation of video draw poker devices in Louisiana are subject to the Louisiana Video Draw Poker Devices Control Law and the rules and regulations promulgated thereunder. The manufacture, distribution, servicing and operation of video poker devices and slot machines are maintained by a single gaming control board for the regulation of gaming in Louisiana. This board, created on May 1, 1996, is called the Louisiana Gaming Control Board (the “Louisiana Board”) and oversees all licensing for all forms of legalized gaming in Louisiana (including all regulatory enforcement and supervisory authority that exist in the state as to gaming on Native American lands). The Video Gaming Division and the Slots Gaming Division of the Gaming Enforcement Section of the Office of the State Police within the Department of Public Safety and Corrections (the “Division”) performs the investigative functions for the Louisiana Board for video poker and slot gaming. The laws and regulations of Louisiana are based on policies of maintaining the health, welfare and safety of the general public and protecting the video gaming industry from elements of organized crime, illegal gambling activities and other harmful elements, as well as protecting the public from illegal and unscrupulous gaming to ensure the fair play of devices. The Louisiana Board also regulates slot machine gaming at racetrack facilities pursuant to the Louisiana Pari-Mutuel Live Racing Facility Economic Redevelopment and Gaming Control Act. In addition, the LSRC also issues licenses required for Fair Grounds to operate slot machines at the racetrack and video poker devices at its OTBs. The failure to comply with the rules and regulations of the Louisiana Board could have a material, adverse impact on our business, financial condition and results of operations.
The ownership and operation of casino gaming facilities in the State of Mississippi is subject to extensive state and local regulation, but primarily the licensing and regulatory control of the Mississippi Gaming Commission (the “Mississippi Commission”). The laws, regulations and supervisory procedures of the Mississippi Commission are based upon declarations of public policy that are concerned with, among other things: (1) the prevention of unsavory or unsuitable persons from having direct or indirect involvement with gaming at any time or in any capacity; (2) the establishment and maintenance of responsible accounting practices and procedures; (3) the maintenance of effective controls over the financial practices of licensees, including the establishment of minimum procedures for internal fiscal affairs and the safeguarding of assets and revenues, providing for reliable record keeping and requiring the filing of periodic reports with the Mississippi Commission; (4) the prevention of cheating and fraudulent practices; (5) providing a source of state and local revenues through taxation and licensing fees; and (6) ensuring that gaming licensees, to the extent practicable, employ Mississippi residents. The regulations are subject to amendment and interpretation by the Mississippi Commission. Changes in Mississippi laws or regulations may limit or otherwise materially affect the types of gaming that may be conducted and such changes, if enacted, could have an adverse effect on us and our Mississippi gaming operations. The failure to comply with the rules and regulations of the Mississippi Commission could have a material, adverse impact on our business, financial condition and results of operations.
The ownership and operation of casino gaming facilities in the State of Maine is subject to extensive state and local regulation, but primarily the licensing and regulatory control of the Maine Gambling Control Board (the “MGCB”). The laws, regulations and supervisory procedures of the MGCB are based upon declarations of public policy that are concerned with, among other things: (1) the regulation, supervision and general control over casinos and the ownership and operation of slot machines and table games; (2) the investigation of complaints made regarding casinos; (3) the establishment and maintenance of responsible accounting practices and procedures; (4) the maintenance of effective controls over the financial practices of licensees, including the establishment of minimum procedures for internal fiscal affairs and the safeguarding of assets and revenues, providing for reliable record keeping; and (5) the prevention of cheating and fraudulent practices. The regulations are subject to amendment and interpretation by the MGCB. Changes in Maine laws or regulations may limit or otherwise materially affect the types of gaming that may be conducted and such changes, if enacted, could have an adverse effect on us and our Maine gaming operations. The failure to comply with the rules and regulations of the MGCB could have a material, adverse impact on our business, financial condition and results of operations.
The ownership and operation of casino gaming facilities in the State of Florida is subject to extensive state and local regulation, primarily by the Florida Department of Business and Professional Regulation (the “DBPR”), within the executive branch of Florida’s state government. The DBPR is charged with the regulation of Florida’s pari-mutuel, cardroom and slot gaming industries, as well as collecting and safeguarding associated revenues due to the state. The DBPR has been designated by the Florida legislature as the state compliance agency with the authority to carry out the state’s oversight responsibilities in accordance with the provisions outlined in the compact between the Seminole Tribe of Florida and the State of Florida. The laws and regulations of Florida are based on policies of maintaining the health, welfare and safety of the general public and protecting the video gaming industry from elements of organized crime, illegal gambling activities and other harmful elements, as well as protecting the public from illegal and unscrupulous gaming to ensure the fair play of devices. The failure to comply with the rules and regulations of the DPBR could have a material, adverse impact on our business, financial condition and results of operations.
Video Lottery was introduced in the State of Ohio in 2012 when the Governor of Ohio signed Executive Order 2011-22K, which authorized the Ohio Lottery Commission ("the OLC") to amend and adopt rules necessary to implement a video lottery program at Ohio’s seven horse racing facilities. The ownership and operation of VLT facilities in the State of Ohio is subject to extensive state and local regulation, but primarily the licensing and regulatory control of the OLC. The laws, regulations and supervisory
13
procedures of the OLC include 1) regulating the licensing of video lottery sales agents (VLSA), key gaming employees and VLT manufacturers, 2) collecting and disbursing VLT revenue and 3)maintaining compliance in regulatory matters. The failure to comply with the rules and regulations of the OLC could have a material adverse impact on our business, financial condition and results of operations.
|
J.
|
Competition
|
We operate in a highly competitive industry with a large number of participants, some of which have financial and other resources that are greater than ours. The industry faces competition from a variety of sources for discretionary consumer spending including spectator sports and other entertainment and gaming options. Competitive gaming activities include traditional and Native American casinos, video lottery terminals, state-sponsored lotteries and other forms of legalized gaming in the U.S. and other jurisdictions. Additionally, Internet-based interactive gaming and wagering, both legal and, we believe, illegal, is growing rapidly and affecting competition in our industry. We anticipate competition in this area will become more intense as new Internet-based ventures enter the industry and as state and federal regulations on Internet-based activities are clarified.
Legalized gaming is currently permitted in various forms in many states and Canada. Other jurisdictions could legalize gaming in the future, and established gaming jurisdictions could award additional gaming licenses or permit the expansion of existing gaming operations. If additional gaming opportunities become available near our racing or gaming operations, such gaming opportunities could have a material, adverse impact on our business, financial condition and results of operations.
All of our racetracks face competition in the simulcast market. Approximately
43,830
thoroughbred horse races are conducted annually in the U.S. Of these races, we host approximately
3,560
races each year, or about
8.1%
of the total. As a content provider, we compete for wagering dollars in the simulcast market with other racetracks conducting races at or near the same times as our races. As a racetrack operator, we also compete for horses with other racetracks running live racing meets at or near the same time as our races. Our ability to compete is substantially dependent on purse size. In recent years, this competition has increased as more states legalize gaming, allowing slot machines at racetracks with mandatory purse contributions. Over 88 percent of pari-mutuel handle is bet at off-track locations, either at other racetracks, OTBs, casinos, or through ADW channels. As a content distributor, we compete for these dollars to be wagered at our racetracks, OTBs, casinos and via our ADW business.
Louisville, Kentucky
Churchill Downs faces competition from free-standing casinos and racetracks which are combined with casinos (“racinos”) in neighboring states. Currently, three Indiana casinos compete for customers in the Louisville market. These casinos include Horseshoe Indiana, located in Elizabeth, Indiana, Belterra, a Pinnacle Entertainment casino located between Louisville and Cincinnati and the resort casino at French Lick, located about 60 miles northwest of Louisville. Additionally, Hoosier Park operates 2,000 slot machines, and Indiana Grand Racing & Casino operates 1,900 slot machines. This has resulted in increased purses at those Indiana racetracks. During 2009, the Ohio voters passed a referendum to allow four casinos in Ohio, and, during 2011, the state legislature passed legislation allowing Ohio’s seven racetracks to apply for video lottery licenses.
Separate casino projects in Columbus, Toledo, Cleveland and Cincinnati opened during 2012 and 2013. We believe that the potential expansion of gaming at Ohio racetracks could provide a competitive advantage to those racetracks and may enable Ohio racetracks to increase their purses.
On October 28, 2011, Aqueduct Racetrack opened a gaming facility with more than 2,400 video lottery terminals and electronic table games. An additional 2,500 gaming machines were added in December 2011 as part of a further expansion of the facility. As a result of the addition of gaming activities, we expect that New York purse payments will be enhanced as compared to their historical levels. These enhanced purses could affect our ability to attract horses and trainers and could have a material, adverse impact on our business, financial condition and results of operations.
These developments may result in Ohio and New York racetracks attracting horses that would otherwise race at Kentucky racetracks, including Churchill Downs, thus negatively affecting the number of starters and purse size which, in turn, may have a negative effect on handle. In addition, we believe the opening of four land-based, free-standing casinos in Ohio may likewise have a material, adverse impact on our business, financial condition and results of operations.
Miami, Florida
Calder is surrounded by competitors for consumers’ discretionary income. Calder competes with Gulfstream Park for thoroughbred race fans in the Miami area. This direct competition may adversely and materially impact our business, financial condition and results of operations.
On January 22, 2010, Calder Casino commenced operations and features approximately 1,140 slot machines. Calder Casino competes with three established casinos in Broward County just to the north of Miami-Dade County, and an additional casino which opened during February 2014. We also face competition from Native American casinos, such as the Seminole Hard Rock
14
facility, and popular gambling cruises-to-nowhere. Due to the high tax rates in Florida for pari-mutuel gaming facilities, Native American casinos, which are not taxed at the same rates, are generally able to spend more money marketing their facilities to consumers.
On November 9, 2011, we petitioned the Florida Supreme Court to grant discretionary review of Calder Race Course, Inc., vs. Florida Department of Business and Professional Regulation and South Florida Racing Association, LLC, and reverse the Florida First Appellate Court’s decision which allows for the opening of a slot machine facility at Hialeah Race Course, located approximately twelve miles from Calder. On April 27, 2012, the Florida Supreme Court declined to consider a review of our petition, upholding the decision of the lower court. Hialeah Race Course subsequently commenced construction of a casino with approximately 900 slot machines which opened during the summer of 2013. The operation of a slot machine facility at Hialeah Race Course could have a material, adverse impact on our business, financial condition and results of operations.
Florida legislators continue to debate the expansion of Florida gaming to include Las Vegas-style destination resort casinos. Such casinos may be subject to taxation rates lower than the current pari-mutuel taxation structure. Should such legislation be enacted, it could increase competition and have a material, adverse impact on our business, financial condition and results of operations.
Chicago, Illinois
Arlington competes in the Chicago market against a variety of entertainment options. In addition to other racetracks in the area such as Hawthorne Park and Maywood Park, there are ten riverboat casino operations that draw from the Chicago market including Rivers Casino, which opened in July 2011, in Des Plaines, Illinois. Additionally, Native American gaming operations in Wisconsin may adversely affect Arlington.
New Orleans, Louisiana
Fair Grounds competes in the New Orleans area with two riverboat casinos and one land-based casino. With approximately 620 slot machines, Fair Grounds competes with Harrah’s land-based casino, which is the largest and closest competitor to Fair Grounds. Additionally, Fair Grounds faces significant gambling competition along the Mississippi Gulf Coast. Fair Grounds also competes with video poker operations located at various OTBs, truck stops and restaurants in the area.
Oxford, Maine
Oxford, which opened during June 2012, competes in the State of Maine with one other casino in Bangor, Maine known as Hollywood Slots, which opened in November 2005. Oxford is located approximately 120 miles south of Hollywood Slots. Oxford also anticipates it will compete with the Massachusetts gaming market which legalized gaming in November 2011, through legislation authorizing three resort style casinos and one slot machine parlor in the state. Massachusetts has not yet commenced any gaming operations.
Greenville, Mississippi
Harlow’s competes in Mississippi with a variety of riverboat and land-based casinos. Our principal local competitor in Greenville is Trop Casino, which is currently renovating its facilities. Harlow’s also faces regional competition from a casino in Lula, Mississippi and from two locations in Arkansas. Both Arkansas locations offer pari-mutuel wagering on live and simulcast racing and other electronic games of skill such as blackjack, video poker, and electronic roulette. In addition, historical racing machines are offered at one of the Arkansas locations.
Vicksburg, Mississippi
Riverwalk competes in the Vicksburg area and is the newest and the only land-based casino in the local market. Our principal local competitors are Ameristar Casino, which is the largest local competitor, and Rainbow Hotel Casino, which is the closest competitor, in Vicksburg. In addition, Riverwalk faces regional competition from two locations in Natchez Mississippi, including Magnolia Bluff Casino which opened during December 2012 and from Pearl River Resort in Philadelphia, Mississippi.
From time to time, potential competitors have proposed the development of additional casinos. The Mississippi Gaming Control Act does not limit the number of licenses that may be granted, and there are a number of additional sites located in the Gulf Coast region that are in various stages of development. Any significant licensure could have a material, adverse impact on our business, financial condition and results of operations.
Advance Deposit Wagering
TwinSpires competes with other ADW businesses for both customers and racing content, and TwinSpires also competes with online gaming sites. Our competitors include, but are not limited to, Betfair Limited (d/b/a TVG), the Stronach Group (d/b/a XpressBet), Premier Turf Club, Lien Games, AmWest Entertainment, The New York Racing Association (d/b/a NYRA), Connecticut OTB, Penn National Gaming Inc. and Racing2Day LLC. We also own an information services data business that sells handicapping and pedigree information to wagering customers and horsemen in the industry. This data may give us a competitive advantage as
15
we are able to provide promotional products to our ADW customers that other ADW businesses cannot provide. As a data provider, we compete with companies such as Equibase and the Daily Racing Form by selling handicapping data to wagering customers.
In response to increased competition from other gaming options, we continue to seek new sources of revenue. We are focused on product innovation, marketing initiatives and customer relationships. We also seek to offer the widest array of racing content from throughout the world, and where available, we will take advantage of geographical expansion. All of our activities are highly dependent on the regulatory environment and legal developments within federal and individual state jurisdictions.
Totalisator Business
We acquired United Tote through our acquisition of Youbet on June 2, 2010. United Tote provides totalisator services, which accumulate wagers, record sales, calculate payoffs and display wagering data in a secure manner to patrons who wager on horseraces. Our competitors are primarily Sportech and AmTote International, Inc. Our competition outside of North America is more fragmented, with competition also being provided by several international and regional companies. United Tote competes primarily on the basis of the design, performance, reliability and pricing of its products and contract services.
United Tote has contracts to provide totalisator services to a significant number of racetracks, OTBs and other pari-mutuel wagering businesses. Errors by United Tote technology or personnel may subject us to liabilities, including financial penalties under our totalisator service contracts, which could have a material, adverse impact on our business, financial condition and results of operations.
|
K.
|
Legislative Changes
|
Federal
Federal Internet Gaming
On November 14, 2013, Washington Representative Jim McDermott introduced the Internet Gambling Regulation and Tax Enforcement Act of 2013 (“HR 3491”) to tax federally-sanctioned Internet wagering potentially made legal by the Internet Gambling Regulation, Enforcement, and Consumer Protection Act of 2013 ("HR 2282") or similar legislation. HR 3491 would create up to a 12% deposit tax on amounts deposited by players for Internet wagering, an amount to be paid by licensed operators, not by players. The federal government would collect 4% of the tax, with up to 8% going to the state or Indian tribe where the wager is placed.
On July 16, 2013, a subcommittee of the U.S. Senate Commerce Committee held a hearing which focused on the ramifications of the December 23, 2011 Department of Justice opinion that reversed a long-held interpretation of the Wire Act of 1961 (the “Wire Act”), which had historically narrowed the scope of the Wire Act to sports wagering. The Department of Justices’ opinion permitted individual states to offer online games of chance and skill on an intrastate basis.
On July 11, 2013, Texas Representative Joe Barton introduced the Internet Poker Freedom Act of 2013. The proposed legislation would create a federal regulatory and licensing structure that would allow established commercial and tribal casinos as well as gaming suppliers to obtain a license to offer interstate online poker. The U.S. Department of Commerce and National Indian Gaming Commission, as well as qualified state and tribal regulators, would be given oversight authority under the terms of the legislation. States would be allowed to “opt-out” of the federal system.
On June 6, 2013, New York Representative Peter King introduced HR 2282 to legalize all forms of Internet wagering, with the exception of sports betting. HR 2282 would establish a federal structure to license and regulate providers of Internet gaming. Under the proposed legislation, Internet gaming operators would be able to obtain licenses from the Department of Treasury or state or tribal authorities authorizing them to accept wagers over the Internet from individuals in the U.S. or outside the U.S. Individual states would be able to “opt-out” and prohibit or limit Internet gambling within their borders by notifying the Secretary of Treasury.
At this point, it is difficult to assess the probability of passage of proposed legislation at the federal level, the form of any final legislation, or its impact on our business, financial condition and results of operations.
Wire Act of 1961 - Federal Clarification
On December 23, 2011, the U.S. Department of Justice clarified its position on the Wire Act, which had historically been interpreted to outlaw all forms of gambling across states lines. The department’s Office of Legal Counsel determined, in a written memorandum, that the Wire Act applied only to a sporting event or contest but did not apply to other forms of Internet gambling, including online betting unrelated to sporting events. The Justice Department opinion could be interpreted to allow Internet gaming on an intrastate basis. Since the issuance of this opinion, there have been actions taken by various state legislatures to either further enable or further limit Internet gaming opportunities for their residents and businesses, and we anticipate that other states may follow. At this point, we do not know to what extent intrastate Internet gaming could affect our business, financial condition and results of operations.
16
House Hearing on Medication and Performance-Enhancing Drugs in Horses
In November 2013, the Subcommittee on Commerce, Manufacturing and Trade of the House Committee on Energy and Commerce held a hearing on the use of anti-bleeding medications, painkillers and performance enhancing drugs in racehorses. Testimony focused on the Horseracing Integrity and Safety Act of 2013, which has been introduced in the House and Senate. This legislation would empower an independent agency to regulate and standardize medication usage within the industry. It is unclear to what extent such federal legislation could impact our business, financial condition and results of operations.
Nevada
Pursuant to the framework established by Assembly Bill 114, which was signed into law by Governor Brian Sandoval on February 21, 2013, intrastate Internet gambling was legalized in Nevada. Nevada gaming companies began offering online poker on April 30, 2013. It is unclear to what extent such regulations could impact our business, financial condition and results of operations.
Kentucky
Expanded Gaming Legislation
On January 7, 2014, two bills related to the authorization of expanded gaming in Kentucky were filed for consideration during the 2014 legislative session. House Bill 67 is a proposed constitutional amendment authorizing casino gaming in the state. If approved by the legislature, the constitutional amendment will appear on the November 2014 ballot. House Bill 68 outlines the licensing and regulatory structure should expanded gaming be approved. The legislation creates the Kentucky Gaming Commission to issue licenses and serve as the regulatory body for casino gaming; stipulates casino gaming may be conducted at the state’s five existing racetracks as well as at three standalone locations; establishes a minimum $50 million licensing fee; provides for the distribution of gambling revenues received by the state as well as requires racetracks with a casino license to set aside 14.5 percent of gambling revenues for purses and breeders incentives and requires these tracks to increase the number of live racing days by ten percent for the first five years of casino gaming licensure. Should this legislation or similar future legislation be enacted into law, it could have a material impact on our business, financial condition and results of operations.
In addition, Senate Bill 33 was filed during January 2014. Senate Bill 33 would amend the Kentucky Constitution to provide up to seven casino locations in the state and would create an Equine Excellence Fund, into which ten percent of gross gaming revenues would be directed. Senate Bill 33 requires a three-fifths majority in both chambers of the Kentucky General Assembly and, if passed, would be submitted to voters for ratification no earlier than November 2014. Should this legislation or similar future legislation be enacted into law, it could have a material impact on our business, financial condition and results of operations.
Race-day Medication Ban
On June 13, 2012, the KHRC approved a change in state regulations that bans the use of anti-bleeding medication on race-days for graded and listed stakes horse races. The revised regulation must survive a legislative review process, in addition to potential legal challenges before being enacted into law. Should the regulation be enacted, it would be phased in over a three-year period, beginning in 2014. If approved, Kentucky would be the only U.S. state to have enacted such restrictions. At this point, we do not know the effect this legislation could have on our business, financial condition and results of operations.
Historical Racing Machines
During 2010, the KHRC approved a change in state regulations that would allow racetracks to offer pari-mutuel Historical Racing Machines (“HRMs”), which base their payouts on the results of previously-run races at racetracks across North America. During 2012, Kentucky Downs Racetrack operated an HRM facility with approximately 275 HRMs and Ellis Park Racetrack opened a HRM facility with 177 HRMs. On April 4, 2013, the KHRC approved 40 additional HRMs for use at Kentucky Downs Racetrack.
Despite the approval by the KHRC, challenges remain as to the legality of the enacted regulations. A declaratory judgment action was filed in Franklin Circuit Court on behalf of the Commonwealth of Kentucky and all Kentucky racetracks to ensure proper legal authority. The Franklin Circuit Court entered a declaratory judgment upholding the regulations in their entirety. The intervening adverse party filed a notice of appeal, and the KHRC and the racetracks filed a motion to transfer that appeal directly to the Supreme Court of Kentucky. On April 21, 2011, the Supreme Court of Kentucky denied the request to hear the case before the appeal was heard by the Kentucky Court of Appeals. On September 1, 2011, the intervening adverse party filed an injunction action with the Kentucky Court of Appeals to grant emergency relief that would prevent Kentucky Downs Racetrack from operating its HRMs. The intervening adverse party’s motions were denied by the Kentucky Court of Appeals. On June 15, 2012, the Kentucky Court of Appeals vacated the lower court’s decision and remanded the declaratory judgment action back to the Franklin County Circuit Court. On July 16, 2012, the Kentucky racetracks, the KHRC and the Kentucky Department of Revenue filed motions for discretionary review with the Supreme Court of Kentucky asking the court to overturn the Kentucky Court of Appeals’ decision and address the merits of the case. On August 21, 2013, the Supreme Court of Kentucky heard oral arguments on the legality of HRMs. On February 20, 2014, the Supreme Court of Kentucky issued its ruling on the motions for discretionary review affirming, in part, and reversing, in part, the Kentucky Court of Appeals. In issuing its opinion, the Supreme Court of Kentucky held that the KHRC has the statutory authority to license and regulate the operation of pari-mutuel wagering on historic horse racing. The
17
Supreme Court of Kentucky further held that the Kentucky Department of Revenue does not have the authority to collect excise tax on the wagering handle generated by historic horse racing. On the issue of whether the operation of wagering on historic horse racing violates the gambling provisions of the Kentucky Penal Code, the Supreme Court of Kentucky remanded the case back to the Franklin County Circuit Court for further proceedings. At this time it is unclear the extent to which this case or future legislation related to this issue will materially impact our business, financial conditions and results of operations.
ADW Regulations
On January 16, 2014, House Bill 220 was introduced which includes an excise tax of 0.5% of wagering proceeds on advanced deposit wagering placed by Kentucky residents. Should this bill, or similar legislation be enacted into law, it is not expected to have a material negative impact on our Online Business operations.
Internet Lottery
During April 2013, the Kentucky Lottery Board authorized the Kentucky Lottery to offer keno and Internet lottery sales. On November 4, 2013 the Kentucky Lottery began offering keno at 400 locations across the state including bars, restaurants, fraternal organizations and existing lottery retailers. At this time we do not know the impact the availability of such games will have on our business, financial condition and results of operation.
Illinois
Expanded Gaming Legislation
During the 2013 legislative session, Senate Bill 1739 was introduced in the Illinois General Assembly to expand casino gaming to Illinois racetracks and to add five additional casinos within the state, including one in Chicago with 4,000 gaming positions. Senate Bill 1739 won approval in the Illinois Senate but was not considered by the House of Representatives. It is unknown if Senate Bill 1739, or similar legislation, will be considered during the 2014 legislative session. If enacted, this proposed legislation could have a material effect on our business, financial condition and results of operations.
ADW Legislation
House Bill 11, which permits advance deposit wagering by Illinois residents through January 31, 2017 was approved by the Illinois legislature and signed by the Governor on January 29, 2014. House Bill 11 provides funding for the Illinois Racing Board, provides for quarter horse purses through a new temporary surcharge of 0.2% on winning pari-mutuel wagers, creates a temporary optional 0.5% surcharge on winning wagers by individual tracks to support their track operation and purses as well as reactivates six OTB licenses. We expect approval of the legislation to result in a favorable impact to our business, financial condition and results of operation.
Online Gaming
During the 2012 legislative session, the Illinois Senate amended House Bill 4148 with language that, if enacted, would create a new division of the state lottery to oversee and operate online games, including poker, for registered players within Illinois. The division would also be given authority to enter into interstate and multinational online gaming compacts. As currently written, the lottery would create a single platform on which Internet Gaming would be conducted in Illinois. At a later date, the state could allow private companies licensed to conduct gaming in Illinois to essentially serve as affiliates. It is not clear under what terms the state would allow the private companies to participate. The legislative session adjourned without action on House Bill 4148. Similar legislation was not introduced during the 2013 session. At this point, we do not know how future legislation would impact our business, financial condition and results of operation.
Horse Racing Equity Trust Fund
During 2006, the Illinois General Assembly enacted Public Act 94-804, which created the HRE Trust Fund. During November 2008, the Illinois General Assembly passed Public Act 95-1008 to extend Public Act 94-804 for a period of three years beginning December 12, 2008. The HRE Trust Fund was funded by a 3% “surcharge” on revenues of Illinois riverboat casinos that met a certain revenue threshold. The riverboats paid all monies required under Public Acts 94-804 and 95-1008 into a special protest fund account which prevented the monies from being transferred to the HRE Trust Fund. The funds were moved to the HRE Trust Fund and distributed to the racetracks, including Arlington, in December 2009.
Beginning in 2009, we received payments from the HRE Trust Fund related to subsidies paid by the original nine Illinois riverboat casinos in accordance with Illinois Public Acts 94-804 and 95-1008. The HRE Trust Fund was established to fund operating and capital improvements at Illinois racetracks. The funds were to be distributed with approximately 58% of the total to be used for horsemen’s purses and the remaining monies to be distributed to Illinois racetracks. The monies received from the Public Acts were placed into an Arlington Park escrow account due to a temporary restraining order (“TRO”) pending the resolution of a lawsuit brought by certain Illinois casinos that were required to pay funds to the HRE Trust Fund. In August 2011, the stay of dissolution expired and the TRO was dissolved, which terminated the restrictions on our ability to access the funds from the HRE Trust Fund held in the escrow account.
18
As of December 31, 2013, we had received $46.1 million in proceeds, of which $26.5 million was designated for Arlington purses. We used the remaining $19.6 million of the proceeds to improve, market, and maintain or otherwise operate the Arlington racing facility in order to conduct live racing.
Horse Racing Equity Trust Fund – Tenth Riverboat License
Under legislation enacted in 1999, the HRE Trust Fund was scheduled to receive amounts equal to 15% of the adjusted gross receipts generated by a tenth riverboat casino license to be granted in Illinois. The funds were to be distributed to racetracks in Illinois for purses as well as racetrack discretionary spending. During December 2008, the Illinois Gaming Board awarded the tenth riverboat license to a casino in Des Plaines, Illinois. This casino opened during July 2011, entitling the Illinois racing industry to receive an amount equal to 15% of the adjusted gross receipts of this casino from the gaming taxes generated by that casino, once the accumulated funds were appropriated by the state.
On July 10, 2013, the Governor of Illinois signed Illinois House Bill 214 into law, providing for the release of $23.0 million of funds collected from the tenth riverboat licensee since its opening during 2011. During July 2013, Arlington received $7.9 million as its share of the proceeds, of which $3.6 million was designated for Arlington purses. The remaining $4.2 million was recognized as miscellaneous other income in our Consolidated Statements of Comprehensive Income during the year ended December 31, 2013. No additional proceeds related to future funds of the tenth riverboat are expected to be distributed to Illinois racetracks under the provisions of House Bill 214.
Purse Recapture
Pursuant to the Illinois Horse Racing Act, Arlington and all other Illinois racetracks are permitted to receive a payment commonly known as purse recapture. Generally, in any year that wagering on Illinois horse races at Arlington is less than 75% of wagering both in Illinois and at Arlington on Illinois horse races in 1994, Arlington is permitted to receive 2% of the difference in wagering in the subsequent year. The payment is funded from the Arlington purse account. Under the Illinois Horse Racing Act, the Arlington purse account is to be repaid via an appropriation by the Illinois General Assembly from the Illinois General Revenue Fund. However, this appropriation has not been made since 2001. Subsequently, Illinois horsemen unsuccessfully petitioned the IRB to prevent Illinois racetracks from receiving this payment in any year that the Illinois General Assembly did not appropriate the repayment to the racetrack’s purse accounts from the General Revenue Fund. Further, the Illinois horsemen filed lawsuits seeking, among other things, to block payment to Illinois racetracks, as well as to recover the 2002 and 2003 amounts already paid to the Illinois racetracks. These lawsuits filed by the Illinois horsemen challenging the 2002 and 2003 reimbursements have been resolved in favor of Arlington and the other Illinois racetracks. Several bills were filed in the 2003, 2004, 2005 and 2009 sessions of the Illinois legislature that, in part, would eliminate the statutory right of Arlington and the other Illinois racetracks to continue to receive this payment. None of these bills passed. Since the statute remains in effect, Arlington continues to receive the recapture payment from the purse account. If Arlington loses the statutory right to receive this payment, there could be a material, adverse impact on our business, financial condition and results of operations.
Host Days
During January, February and a portion of March each year, when there is no live racing in Illinois, the IRB designates a thoroughbred racetrack as the host track in Illinois, for which the host track receives a higher percentage of earnings from pari-mutuel wagering activity throughout Illinois. In January 2014, the IRB appointed Arlington the host track in Illinois for 23 simulcast host days, which is a decrease of three simulcast host days compared to the same period of 2013, but awarded Arlington three additional live host days during 2014, as compared to the prior year. The total host day allocation awarded to Arlington during 2014 did not change from the prior year. Arlington’s future designation as the host track is subject to the annual designation by the IRB. A change in the number of days that Arlington is designated host track could have a material, adverse impact on our business, financial condition and results of operations.
Ohio
Gaming Legislation
In November 2009, Ohio voters passed a referendum to allow four casinos in Ohio, with opening dates from 2012 through 2013. On June 28, 2011, both houses of the Ohio General Assembly passed House Bill 277 (“HB 277”) allowing all seven state racetracks to apply for video lottery licenses. The Governor of Ohio signed HB 277 into law on July 15, 2011. In addition, on June 23, 2011, the Ohio legislature passed legislation allowing the relocation of Ohio racetracks with video lottery terminal licenses. In October 2011, the Ohio Roundtable filed a lawsuit seeking to prevent racetracks from relocating and prohibiting video lottery terminals. In May 2012, the Common Pleas Court ruled against the Ohio Roundtable, indicating it did not have legal standing to sue the State over the 2011 ruling. On June 28, 2012, the Ohio Roundtable filed an appeal against this ruling. Oral arguments on the appeal were heard by the Franklin County Court of Appeals on January 17, 2013. In March 2013, the Ohio Tenth Circuit Court of Appeals upheld the lower court’s ruling, at which time the Ohio Roundtable appealed the appellate court ruling to the Ohio Supreme Court. On July 24, 2013, the Ohio Supreme Court agreed to hear the matter. At this point, we do not know how this legislation or the related litigation could affect our business, financial condition and results of operations.
19
Internet Cafes
On June 4, 2013, House Bill 7, legislation designed to negatively impact the business model of Internet cafes by banning cash payouts and limiting prizes or vouchers redeemable for merchandise to not more than a $10 value, was signed into law by the Governor of Ohio. Implementation of the legislation was delayed until October 4, 2013. Opponents of House Bill 7 sought to repeal the law through a ballot referendum, but failed to collect the more than 231,000 signatures required for the referendum language to appear on the November 2014 statewide ballot. We believe the implementation of this legislation will have a positive impact on our business, financial condition and results of operations.
Florida
Internet Cafes
On April 4, 2013, the Governor of Florida signed House Bill 155 into law. This measure effectively bans the operation of Internet cafes in Florida. The legislation clarifies existing laws related to slot machines, charitable drawings, game promotions and amusement machines. Specifically, the law updates the definition of a slot machine to include systems or networks of devices and provides that machines used to simulate casino-style games are prohibited. The legislation further clarifies that charity organizations, adult arcades and for profit sweepstakes operators may not operate permanent gambling centers. We believe the implementation of this legislation will have a positive impact on our business, financial condition and results of operations.
Maine
Expanded Gaming
On September 27, 2013, the Maine Gaming Study Commission, whose statutorily defined mission is to examine the state’s existing gaming market as well as assess expansion opportunities, voted to recommend gaming be expanded beyond the current market. Subsequent to the vote, the Commission was disbanded by the Chairman. During January 2014, the Veterans and Legal Affairs Committee, the legislative committee of jurisdiction for gaming related issues, considered legislation that would allow for further gaming expansion to occur in Maine. The Committee voted to negatively recommend to the House and Senate each of the proposed expanded gaming bills with the exception of a bill that, if approved, will allow up to three slot machines in an estimated 40 veterans halls throughout the state. At this time it is unclear to what extent this could impact our business, financial condition and results of operations.
New York
Gaming Legislation
In March 2012, the Governor of New York and legislative leaders agreed to legalize casino gaming and seek an amendment to the state constitution that would authorize such gaming in New York. On November 5, 2013 New York voters approved a constitutional amendment authorizing up to seven casinos in the state. An expansion of gaming in New York could include expanded incentives for the horse racing industry. This could affect our ability to attract horses and trainers and could have a material adverse impact on our business, financial condition and results of operations.
Significant Agreement
In November 2012, a resolution to award United Tote’s existing tote contract with the New York Racing Association (“NYRA”) to another totalisator company was postponed when the NYRA Board voted to study the issue. United Tote’s existing contract with NYRA expired on September 2, 2013. On April 11, 2013, NYRA announced its intention to enter into a contract for totalisator services with another company. The loss of this agreement is not anticipated to materially affect our business, financial condition and results of operations.
ADW Wagering
In June 2013, legislation that creates a regulatory and taxation framework for ADW wagering passed the New York legislature as part of a broader expanded gaming bill. This legislation imposes a $20,000 license fee and a 5% of handle source market fee on ADW wagers placed by New York residents through multi-jurisdictional ADW providers. It is unclear to what extent such regulations could impact our business, financial condition and results of operations.
California
Exchange Wagering
During 2010, California became the first state to approve exchange wagering on horseracing at California racetracks. Exchange wagering differs from pari-mutuel wagering in that it allows customers to propose their own odds on certain types of wagers on horseracing, including betting that a horse may lose, which may be accepted by a second customer.
During 2012, the California Horse Racing Board (the “CHRB”) heard testimony on exchange wagering and approved draft proposed exchange wagering regulations which were submitted for public comment. In November 2012, the CHRB granted approval for
20
rules governing exchange wagering. The regulations were submitted to the Office of Administrative Law (“OAL”) during February 2013 for review and final approval. On March 20, 2013, the OAL disapproved the proposed regulations. In June 2013, the CHRB approved and resubmitted the proposed regulations to the OAL, which approved the regulations during August 2013. However, the CHRB has not set a time frame for accepting applications or for the implementation of exchange wagering in California. Exchange wagering may have a negative impact on our current pari-mutuel operations, including our ADW business. Furthermore, California’s approval of exchange wagering may set a precedent for other states to approve exchange wagering, creating additional risk of a negative impact on our pari-mutuel wagering business.
Internet Poker
On February 21, 2014, Senate Bill 1366 (“SB 1366”) was introduced, which would allow Indian tribes and cardrooms to apply for a ten year license to operate Internet poker in the state. Under the terms of the legislation, the state would be allowed to opt-into or out of a federal Internet poker framework or enter into agreements to offer Internet poker across state boarders. Also introduced in February 21, 2014 was Assembly Bill 2291 ("AB 2291") which would allow qualified Indian tribes and cardrooms to apply for a ten year license. The proposed legislation would require the state to opt-out of any federally created Internet poker framework and would be precluded from entering into Internet poker agreements with other states or foreign jurisdictions. The potential effects of SB 1366 and AB 2291 on our business, financial condition and results of operations cannot be determined at this time.
In December 2012, Senate Bill 51 (“SB 51”) was introduced in the California Senate. The legislation would allow qualified gaming companies to apply for a five-year gaming license to operate an intrastate Internet gaming website to registered players within California. The legislation limits online gaming to poker only. On February 22, 2013, Senate Bill 678 (“SB 678”) was introduced which would also permit Internet poker within the state. The 2013 legislative session concluded without any significant movement on the issue. The potential effects of SB 51 and SB 678 on our business, financial condition and results of operations cannot be determined at this time.
Sports Betting
In February 2012, Senate Bill 1390 was introduced in the California Legislature. The legislation would have allowed all entities currently licensed to conduct gambling activities to apply to their regulatory agency and request that sports betting be added to their list of authorized gambling options. Indian tribes with existing casinos as well as tribes that did not currently have gaming compacts with the state would have been allowed to offer sports betting on their reservations. The bill was not considered prior to the adjournment of the 2012 legislative session. On February 7, 2013, Senate Bill 190 was introduced which would allow the operator of a gaming establishment, racetrack or satellite wagering facility to conduct wagering on professional and collegiate sports or athletic events upon licensing by the California Gaming Control Commission or California Horse Racing Board. Under the terms of the proposed bill, each licensed entity would remit 7.5% of its gross revenues to the state. The bill also authorizes a federally recognized Indian tribe that is not a gaming establishment or a racetrack to conduct sports wagering consistent with the requirements of the federal Indian Gaming Regulatory Act of 1988, under terms no more stringent than those applicable to any other operator in the state. The 2013 legislative session concluded without any significant action on the proposed bill. The potential effects of Senate Bill 190 on our business, financial condition and results of operations cannot be determined at this time.
Delaware
Gaming Legislation
During June 2012, the Delaware Gaming Competitiveness Act of 2012 (“HB 333”) was passed by the Delaware Legislation and signed into law by the Governor of Delaware. HB 333 enables Delaware casinos to offer a full range of legal online gambling options including Internet blackjack, poker and slots which are accessible through each casino’s website and controlled centrally by the state lottery. Under the terms of HB 333, Delaware’s existing racetracks will be able to offer online games via their websites. The legislation expands locations for National Football League wagering and keno. Individuals must be present in Delaware to play online games. The potential impact of HB 333 on our business, financial condition and results of operations cannot be determined at this time.
New Jersey
Atlantic City Wagering
During February 2012, Assembly Bill 2578 (“AB 2578”) was introduced into the New Jersey legislature. AB 2578 allows Atlantic City casinos to offer Internet wagering on all casino-style games to persons present in New Jersey. The New Jersey horseracing industry was excluded from the bill’s language and is ineligible to participate as Internet providers, subcontractors, or beneficiaries of the anticipated revenue. AB 2578 passed both legislative chambers during 2012. On February 26, 2013, Governor Christie signed AB 2578 into law. During October 2013, the New Jersey Division of Gaming Enforcement announced casino licensed Internet gaming permit holders may offer full Internet gaming beginning on November 26, 2013. On November 26, 2013, six
21
online gaming operators began offering real-money Internet wagering in New Jersey. The potential impact of this authorization on our business, financial condition and results of operation cannot be determined at this time.
Sports Betting
During 2011, New Jersey voters passed a non-binding referendum permitting sports betting in New Jersey. During 2012, legislation authorizing sports betting in Atlantic City casinos and at racetracks passed the House and Senate legislatures and was signed by Governor Christie. The National Football League, National Basketball Association, National Hockey League and National Collegiate Athletic Association have filed suit against the state to prohibit them from moving forward with the legislation, citing a federal ban against sports betting. On December 21, 2012, a federal judge denied New Jersey’s request to have the lawsuit dismissed. The judge agreed that expanding legal sports betting into New Jersey would negatively impact the perception of sporting games. The New Jersey Division of Gaming Enforcement issued final sports betting regulations, but the Division noted that no license would be issued prior to January 2013. The potential impact of sports betting in New Jersey on our business, financial condition and results of operation cannot be determined at this time.
Pennsylvania
On November 22, 2013, Senate Bill 1188 was introduced for consideration during the 2014 legislative session. The bill contains provisions specifically related to racing oversight as well as provides authority to the Pennsylvania Gaming Board to grant licensure allowing Pennsylvania racetracks to operate their own ADW business. The potential impact of this bill on our business, financial condition and results of operation cannot be determined at this time.
On July 3, 2013, House Bill 465 was passed by the Pennsylvania legislation and signed by the Governor of Pennsylvania. This legislation establishes a 10% tax on all wagers placed through nonlicensed Pennsylvania based advance deposit wagering providers. It is unclear to what extent such regulations could impact our business, financial condition and results of operations.
|
L.
|
Environmental Matters
|
We are subject to various federal, state and local environmental laws and regulations that govern activities that may have adverse environmental effects, such as discharges to air and water, as well as the management and disposal of solid, animal and hazardous wastes and exposure to hazardous materials. These laws and regulations, which are complex and subject to change, include United States Environmental Protection Agency and state laws and regulations that address the impacts of manure and wastewater generated by Concentrated Animal Feeding Operations (“CAFO”) on water quality, including, but not limited to, storm water discharges. CAFO regulations include permit requirements and water quality discharge standards. Enforcement of CAFO regulations has been receiving increased governmental attention. Compliance with these and other environmental laws can, in some circumstances, require significant capital expenditures. For example, we may incur future costs under existing and new laws and regulations pertaining to storm water and wastewater management at our racetracks. Moreover, violations can result in significant penalties and, in some instances, interruption or cessation of operations.
In the ordinary course of our business, we at times receive notices from regulatory agencies regarding our compliance with CAFO regulations that may require remediation at our facilities. On December 6, 2013, we received a notice from the United States Environmental Protection Agency regarding alleged CAFO non-compliance at Fair Grounds. While our analysis is still preliminary at this time, we do not expect that remediating these items will cause a disruption in our operations at Fair Grounds, although it may require us to incur certain capital expenditures costs which we do not expect to be material.
We also are subject to laws and regulations that create liability and cleanup responsibility for releases of hazardous substances into the environment. Under certain of these laws and regulations, a current or previous owner or operator of property may be liable for the costs of remediating hazardous substances or petroleum products on its property, without regard to whether the owner or operator knew of, or caused, the presence of the contaminants, and regardless of whether the practices that resulted in the contamination were legal at the time they occurred. The presence of, or failure to remediate properly, such substances may materially adversely affect the ability to sell or rent such property or to borrow funds using such property as collateral. Additionally, the owner of a property may be subject to claims by third parties based on damages and costs resulting from environmental contamination emanating from the property.
Compliance with environmental laws has not materially affected our ability to develop and operate our properties, and we are not otherwise subject to any material compliance costs in connection with federal or state environmental laws.
|
M.
|
Service Marks and Internet Properties
|
We hold numerous state and federal service mark registrations on specific names and designs in various categories including the entertainment business, apparel, paper goods, printed matter, housewares and glass. We license the use of these service marks and derive revenue from such license agreements.
22
|
N.
|
Employees
|
As of
December 31, 2013
, we employed approximately 2,600 full-time employees Company-wide. Due to the seasonal nature of our live racing business, the number of seasonal and part-time persons employed will vary throughout the year. During
2013
, average full-time and seasonal employment per pay period was approximately 4,350 individuals Company-wide.
|
O.
|
Available Information
|
Our Annual Reports on Form 10-K, Quarterly Reports on Form 10-Q, Current Reports on Form 8-K, proxy statements and other Securities and Exchange Commission (“SEC”) filings, and any amendments to those reports and any other filings that we file with or furnish to the SEC under the Securities Exchange Act of 1934 are made available free of charge on our website (
www.churchilldownsincorporated.com
) as soon as reasonably practicable after we electronically file the materials with the SEC and are also available at the SEC’s website at
www.sec.gov
. These reports may also be obtained from the SEC's Public Reference Room at 100 F Street, NE, Washington, DC 20549 or by calling the SEC at (800) SEC-0330.
|
ITEM 1A.
|
RISK FACTORS
|
Risks Related to the Company
In addition to risks and uncertainties in the ordinary course of business that are common to all businesses, important factors that are specific to our industry and Company could materially impact our future performance and results. The factors described below are the most significant risks that could materially impact our business, financial condition and results of operations.
General economic trends are unfavorable
The recent, economic downturn and adverse conditions in local, regional, national and global markets, including the current sovereign debt crises, have negatively impacted our operations and may continue to do so for an indeterminate period of time. Although economic conditions improved somewhat in 2012 and 2013, there remains risk that the recovery will be short-lived, that the recovery may not include the industries or markets in which we operate, or the downturn may resume. Our access to, or cost of, credit may be impacted to the extent global and U.S. credit markets are affected by downward trends. Additionally, our ability to respond to periods of economic contraction may be limited, as certain of our costs remain fixed or even increase, when revenues decline. Accordingly, any persistence of poor economic conditions, or further deterioration, could have a material, adverse impact on our business, financial condition and results of operations.
Our business is sensitive to consumer confidence and reductions in consumers’ discretionary spending, which may result from the recent economic conditions, unemployment levels and other changes we cannot accurately predict
Demand for entertainment and leisure activities is sensitive to consumers’ disposable incomes, which have been adversely affected by recent economic conditions and the persistence of elevated levels of unemployment. Further declines in the residential real estate market, higher energy and transportation costs, changes in consumer confidence, increases in individual tax rates, and other factors that we cannot accurately predict may reduce the disposable income of our customers. This could result in fewer patrons visiting our racetracks, gaming and wagering facilities and online wagering sites, and may impact our customers’ ability to wager with the same frequency and maintain their wagering level profiles. Decreases in consumer discretionary spending could affect us even if it occurs in other markets. For example, reduced wagering levels and profitability at racetracks from which we carry racing content could cause certain racetracks to cancel races or cease operations and therefore reduce the content we could provide to our customers. Accordingly, any significant loss of customers or decline in wagering could have a material adverse impact on our business, financial condition and results of operations.
We are vulnerable to additional or increased taxes and fees
We believe that the prospect of raising significant additional revenue through taxes and fees is one of the primary reasons that certain jurisdictions permit legalized gaming. As a result, gaming companies are typically subject to significant taxes and fees in addition to the normal federal, state, provincial and local income taxes, and such taxes and fees may be increased at any time. From time to time, legislators and officials have proposed changes in tax laws, or in the administration of such laws, affecting the gaming industry. Moreover, many states and municipalities, including ones in which we operate, are currently experiencing budgetary pressures that may make it more likely they would seek to impose additional taxes and fees on our operations. It is not possible to determine with certainty the likelihood of any such changes in tax laws or fee increases, or their administration; however, if enacted, such changes could have a material adverse effect on our business, financial condition and results of operations.
23
Our debt facilities contain restrictions that limit our flexibility in operating our business
Our debt facilities contain, and any future indebtedness of ours would likely contain, a number of covenants that impose significant operating and financial restrictions on us, including restrictions on our and our subsidiaries’ ability to, among other things:
|
•
|
incur additional debt or issue certain preferred shares;
|
|
•
|
pay dividends on or make distributions in respect of our capital stock, repurchase common shares or make other restricted payments;
|
|
•
|
make certain investments;
|
|
•
|
sell certain assets or consolidate, merge, sell or otherwise dispose of all or substantially all of our assets;
|
|
•
|
create liens on certain assets;
|
|
•
|
enter into certain transactions with our affiliates; and
|
|
•
|
designate our subsidiaries as unrestricted subsidiaries.
|
As a result of these covenants, we are limited in the manner in which we conduct our business, and we may be unable to engage in favorable business activities or finance future operations or capital needs.
We have pledged and will pledge a significant portion of our assets as collateral under our debt facilities. If any of these lenders accelerate the repayment of borrowings, there can be no assurance that we will have sufficient assets to repay our indebtedness and our lenders could proceed against the collateral we have granted them.
Under our debt facilities, we are required to satisfy and maintain specified financial ratios. Our ability to meet those financial ratios can be affected by events beyond our control, and there can be no assurance that we will meet those ratios. A failure to comply with the covenants contained in our debt facilities or our other indebtedness could result in an event of default under the facilities or the existing agreements, which, if not cured or waived, could have a material adverse impact on our business, financial condition and results of operations. In the event of any default under our debt facilities or our other indebtedness, the lenders thereunder:
|
•
|
will not be required to lend any additional amounts to us;
|
|
•
|
could elect to declare all borrowings outstanding, together with accrued and unpaid interest and fees, to be due and payable and terminate all commitments to extend further credit; or
|
|
•
|
require us to apply all of our available cash to repay these borrowings.
|
If the indebtedness under our debt facilities or our other indebtedness were to be accelerated, there can be no assurance that our assets would be sufficient to repay such indebtedness in full.
We may not be able to identify and complete acquisition, expansion or divestiture projects on time, on budget or as planned
We expect to pursue expansion, acquisition and divestiture opportunities, and we regularly evaluate opportunities for development, including acquisitions or other strategic corporate transactions which may expand our business operations.
We could face challenges in identifying development projects that fit our strategic objectives, identifying potential acquisition or divestiture candidates and/or development partners, finding buyers, negotiating projects on acceptable terms, and managing and integrating the acquisition or development projects. The integration of new operations and any other properties we may acquire or develop will require the dedication of management resources that may temporarily divert attention from our day-to-day business. The process of integrating new properties or projects may also interrupt the activities of those businesses, which could have a material, adverse impact on our business, financial condition and results of operations. The divestiture of existing businesses may be affected by our ability to identify potential buyers. Furthermore, current or future regulation may postpone a divestiture pending certain resolutions to federal, state or local legislative issues. We cannot assure that any new properties or developments will be completed or integrated successfully.
Management of new properties or business operations, especially those in new lines of business or different geographic areas, may require that we increase our managerial resources. We cannot assure that we will be able to manage the combined operations effectively or realize any of the anticipated benefits of our acquisitions or developments.
We may experience difficulty in integrating recent or future acquisitions into our operations
We have completed acquisition transactions in the past and we may pursue acquisitions from time to time in the future. The successful integration of newly acquired businesses, including our recent acquisitions of Oxford and Riverwalk, into our operations has required and will continue to require the expenditure of substantial managerial, operating, financial and other
24
resources and may also lead to a diversion of our attention from our ongoing business concerns. We may not be able to successfully integrate new businesses or realize projected revenue gains, cost savings and synergies in connection with those acquisitions on the timetable contemplated, if at all. Furthermore, the costs of integrating businesses we acquire could significantly impact our short-term operating results. These costs could include:
|
•
|
restructuring charges associated with the acquisitions;
|
|
•
|
non-recurring acquisition costs, including accounting and legal fees, investment banking fees and recognition of transaction-related costs or liabilities; and
|
|
•
|
costs of imposing financial and management controls (such as compliance with Section 404 of the Sarbanes-Oxley Act of 2002) and operating, administrative and information systems.
|
Although we perform financial, operational and legal diligence on the businesses we purchase, in light of the circumstances of each transaction, an unavoidable level of risk remains regarding the actual condition of these businesses and our ability to continue to operate them successfully and integrate them into our existing operations. In any acquisition we make, we face risks which include:
|
•
|
the risk that the acquired business may not further our business strategy or that we paid more than the business was worth;
|
|
•
|
the potential adverse impact on our relationships with partner companies or third-party providers of technology or products;
|
|
•
|
the possibility that we have acquired substantial undisclosed liabilities for which we may have no recourse against the sellers or third party insurers;
|
|
•
|
costs and complications in maintaining required regulatory approvals or obtaining further regulatory approvals necessary to implement the acquisition in accordance with our strategy;
|
|
•
|
the risks of acquiring businesses and/or entering markets in which we have limited or no prior experience;
|
|
•
|
the potential loss of key employees or customers;
|
|
•
|
the possibility that we may be unable to retain or recruit managers with the necessary skills to manage the acquired businesses; and
|
|
•
|
changes to legal and regulatory guidelines, which may negatively affect acquisitions.
|
If we are unsuccessful in overcoming these risks, it could have a material adverse impact on our business, financial condition and results of operations.
We may adversely infringe on the intellectual property rights of others
In the course of our business, we may become aware of potentially relevant patents or other intellectual property rights held by other parties. Many of our competitors as well as other companies and individuals have obtained, and may obtain in the future, patents or other intellectual property rights that concern products or services related to the types of products and services we currently offer or may plan to offer in the future. We evaluate the validity and applicability of these intellectual property rights and determine in each case whether we must negotiate licenses to incorporate or use the proprietary technologies in our products. Claims of intellectual property infringement may also require us to enter into costly royalty or license agreements. However, we may not be able to obtain royalty or license agreements on terms acceptable to us or at all. We also may be subject to significant damages or injunctions against the development and sale of our products and services if we become subject to litigation relating to intellectual property infringement.
Our results may be affected by the outcome of litigation within our industry and the protection and validity of our intellectual property rights. Any litigation regarding patents or other intellectual property could be costly and time consuming and could divert our management and key personnel from our business operations. The complexity of the technology involved and the uncertainty of litigation surrounding it has the effect of increasing the risks associated with certain of our product offerings, particularly in the area of advance deposit wagering, or ADW. There can be no assurance that we would not become a party to litigation surrounding our ADW business or that such litigation would not cause us to suffer losses or disruption in our business strategy.
We are susceptible to unauthorized disclosure of our source code
We may not be able to protect our computer source code from being copied if there is an unauthorized disclosure of source code. We take significant measures to protect the secrecy of large portions of our source code. If unauthorized disclosure of a significant
25
portion of our source code occurs, we could potentially lose future trade secret protection for that source code. This could make it easier for third parties to compete with our products by copying functionality; which could adversely affect our revenue and operating margins. Unauthorized disclosure of source code also could increase security risks.
We depend on key personnel
Our continued success and our ability to maintain our competitive position is largely dependent upon, among other things, the skills and efforts of our senior executives and management team including Robert L. Evans, our Chairman of the Board and Chief Executive Officer. Although we have entered into employment agreements with certain of our senior executives and key personnel, we cannot guarantee that these individuals will remain with us, and their retention is affected by the competitiveness of our terms of employment and our ability to compete effectively against other gaming companies. In addition, certain of our key employees are required to file applications with the gaming authorities in each of the jurisdictions in which we operate and are required to be licensed or found suitable by these gaming authorities. If the gaming authorities were to find a key employee unsuitable for licensing, we may be required to sever the employee relationship. Furthermore, the gaming authorities may require us to terminate the employment of any person who refuses to file appropriate applications. Either result could significantly impair our operations. Our inability to retain key personnel could have a material, adverse impact on our business, financial condition and results of operations.
Catastrophic events could cause a significant and continued disruption to our operations
A disruption or failure in our systems or operations in the event of a major earthquake, weather event, cyber-attack, terrorist attack or other catastrophic event could interrupt our operations, damage our properties and reduce the number of customers who visit our facilities in the affected areas. For example, Churchill Downs, Harlow’s, Riverwalk, Fair Grounds and its related OTBs and Calder could all be adversely affected by flooding or hurricanes. While we maintain insurance coverage that may cover certain of the costs that we incur as a result of some natural disasters, our coverage is subject to deductibles, exclusions and limits on maximum benefits. There can be no assurance that we will be able to fully collect, if at all, on any claims resulting from extreme weather conditions or other disasters. If any of our properties are damaged or if their operations are disrupted or face prolonged closure as a result of natural disasters in the future, or if natural disasters adversely impact general economic or other conditions in the areas in which our properties are located or from which they draw their patrons, the disruption could have a material, adverse impact on our business, financial condition and results of operations.
Although we have “all risk” property insurance coverage for our operating properties, which covers damage caused by a casualty loss (such as fire, natural disasters, acts of war, or terrorism), each policy has certain exclusions. Our level of property insurance coverage, which is subject to policy maximum limits, may not be adequate to cover all losses in the event of a major casualty. In addition, certain casualty events may not be covered at all under our policies. Therefore, certain acts could expose us to substantial uninsured losses.
We renew our insurance policies on an annual basis. The cost of coverage may become so high that we may need to further reduce our policy limits or agree to certain exclusions from our coverage.
Our debt instruments and other material agreements require us to meet certain standards related to insurance coverage. Failure to satisfy these requirements could result in an event of default under these debt instruments or material agreements.
Work stoppages and other labor problems could negatively impact our future plans
Some of our employees are represented by labor unions. A strike or other work stoppage at one of our properties could have an adverse effect on our business and results of operations. From time to time, we have also experienced attempts to unionize certain of our non-union employees. We cannot provide any assurance that we will not experience additional and more successful union activity in the future.
We process, store and use personal information and other data, which subjects us to governmental regulation and other legal obligations related to privacy, and our actual or perceived failure to comply with such obligations could harm our business
We receive, store and process personal information and other customer data. There are numerous federal, state and local laws regarding privacy and the storing, sharing, use, processing, disclosure and protection of personal information and other data. Any failure or perceived failure by us to comply with our privacy policies, our privacy-related obligations to customers or other third parties, or our privacy-related legal obligations, or any compromise of security that results in the unauthorized release or transfer of personally identifiable information or other player data, may result in governmental enforcement actions, litigation or public statements against us by consumer advocacy groups or others and could cause our customers to lose trust in us, which could have an adverse effect on our business. While the Company maintains insurance coverage specific to cyber-insurance matters, any failure on our part to maintain adequate safeguards may subject us to significant liabilities. Additionally, if third parties we work with, such as vendors, violate applicable laws or our policies, such violations may also put our customers’
26
information at risk and could in turn have an adverse effect on our business. The Company is also subject to payment card association rules and obligations under its contracts with payment card processors. Under these rules and obligations, if information is compromised, the Company could be liable to payment card issuers for the associated expense and penalties. In addition, if the Company fails to follow payment card industry security standards, even if no customer information is compromised, the Company could incur significant fines or experience a significant increase in payment card transaction costs.
In the area of information security and data protection, many states have passed laws requiring notification to customers when there is a security breach for personal data, such as the 2002 amendment to California’s Information Practices Act, or requiring the adoption of minimum information security standards that are often vaguely defined and difficult to practically implement. The costs of compliance with these laws may increase in the future as a result of changes in interpretation. Furthermore, any failure on our part to comply with these laws may subject us to significant liabilities.
Improper disclosure of personal data could result in liability and harm to our reputation
We store and process increasingly large amounts of personally identifiable information of our customers, which may include names, addresses, phone numbers, social security numbers, email addresses, contact preferences and payment account information. For example, we store personal information from TwinSpires.com account holders, from our gaming customers’ rewards accounts and from ticket sales at our racetracks. It is possible our security controls over personal data, our training of employees and vendors on data security, and other practices we follow may not prevent the improper disclosure of personally identifiable information. Improper disclosure of this information could harm our reputation, lead to legal exposure to customers or subject us to liability under laws that protect personal data, resulting in increased costs or loss of revenue.
Our business is subject to online security risk, including security breaches
We store and transmit users' proprietary information, and security breaches could expose us to a risk of loss or misuse of this information, litigation and potential liability. Because the techniques used to obtain unauthorized access, disable or degrade service, or sabotage systems, change frequently and often are not recognized until launched against a target, we may be unable to anticipate these techniques or to implement adequate preventative measures. If an actual or perceived breach of our security occurs, public perception of the effectiveness of our security measures could be harmed and we could lose users and be exposed to litigation or potential liability for us. Although we have developed systems and processes that are designed to protect customer information and prevent data loss and other security breaches, including systems and processes designed to reduce the impact of a security breach at a third party vendor, such measures cannot provide absolute security.
We are subject to payment-related risks, such as risk associated with the fraudulent use of credit or debit cards, which could have adverse effects on our business or results of operations due to chargebacks from customers
We allow funding and payments to accounts using a variety of methods, including electronic funds transfer (“EFT”), and credit and debit cards. As we continue to introduce new funding or payment options to our players, we may be subject to additional regulatory and compliance requirements. We also may be subject to the risk of fraudulent use of credit or debit cards, or other funding and/or payment options. For certain funding or payment options, including credit and debit cards, we may pay interchange and other fees, which may increase over time and, therefore, raise operating costs and reduce profitability. We rely on third parties to provide payment processing services and it could disrupt our business if these companies become unwilling or unable to provide these services to us. We are also subject to rules and requirements governing EFT, which could change or be reinterpreted to make it difficult or impossible for us to comply. If we fail to comply with these rules or requirements, we may be subject to fines and higher transaction fees or possibly lose our ability to accept credit, debit cards, or other forms of payment from customers, which could have a material adverse effect on our business, financial condition and results of operations.
Chargebacks occur when customers seek to void credit card or other payment transactions. Cardholders are intended to be able to reverse card transactions only if there has been unauthorized use of the card or the services contracted for have not been provided. In our business, customers occasionally seek to reverse their online gaming losses through chargebacks. Although we place great emphasis on control procedures to protect from chargebacks, these control procedures may not be sufficient to protect us from adverse effects on our business or results of operations.
Any violation of the Foreign Corrupt Practices Act or applicable anti-money laundering regulations could have a negative impact on us
We are subject to regulations imposed by the Foreign Corrupt Practices Act (the “FCPA”), which generally prohibits U.S. companies and their intermediaries from making improper payments to foreign officials for the purpose of obtaining or retaining business. Any violation of FCPA regulations could have a material, adverse impact on our business, financial condition and results of operations.
27
We also deal with significant amounts of cash in our operations and are subject to various reporting and anti-money laundering regulations. Any violation of anti-money laundering laws or regulations by any of our properties could have a material, adverse impact on our business, financial condition and results of operations.
A lack of confidence in the integrity of our core businesses could affect our ability to retain our customers and engage with new customers
The integrity of the horseracing, gaming and pari-mutuel wagering industries must be perceived as fair to patrons and the public at large. To prevent cheating or erroneous payouts, the necessary oversight processes must be in place to ensure that such activities cannot be manipulated. A loss of confidence in the fairness of our industries could significantly lower attendance, amounts wagered and reduce revenues.
Risks Related to Our Racing Operations
Our racing operations are highly regulated, and changes in the regulatory environment could adversely affect our business
Our racing business is subject to extensive state and local regulation, and we depend on continued state approval of legalized gaming in states where we operate. Our wagering and racing facilities must meet the licensing requirements of various regulatory authorities, including authorities in Kentucky, Illinois, Louisiana and Florida. To date, we have obtained all governmental licenses, registrations, permits and approvals necessary for the operation of our racetracks. However, we may be unable to maintain our existing licenses. The failure to attain, loss of or material change in our racing business licenses, registrations, permits or approvals may materially limit the number of races we conduct, and could have a material adverse impact on our business, financial condition and results of operations.
In addition to licensing requirements, state regulatory authorities can have a significant impact on the operation of our business. For example, in Florida, a thoroughbred racetrack conducting a live meet has control over hosting out-of-state racing signals and receives commissions on wagers placed at other racetracks throughout the state. When two thoroughbred racetracks operate live meets concurrently, both have the opportunity to be the “host track” for out-of-state signals, and other Florida racetracks must choose a single live racetrack to host their pari-mutuel wagering. Historically, Calder was the only live racetrack in Florida for the majority of its racing season. However, during 2013 Calder and Gulfstream Park began simultaneously conducting live thoroughbred racing, in certain months, and this overlapping of live racing resulted in direct competition for on-track horseracing, in the intrastate and interstate simulcast markets and for horses in South Florida, which negatively affected Calder’s ability to achieve full field horse races and to generate handle on live racing, as further described in Item 7. "Management's Discussion and Analysis of Financial Condition and Results of Operations - Recent Developments" of this Annual Report on Form 10-K. Likewise, in Illinois the IRB has the authority to designate racetracks as “host track” for the purpose of receiving host track revenues generated during periods when no racetrack is conducting live races. Racetracks that are designated as “host track” obtain and distribute out of state simulcast signals for the State of Illinois. Under Illinois law, the “host track” is entitled to a larger portion of commissions on the related pari-mutuel wagering. Should Arlington or Calder cease to be as “host tracks” during these periods, the loss of hosting revenues could have an adverse impact on our business, financial condition and results of operations. In addition, Arlington is statutorily entitled to recapture as revenues monies that are otherwise payable to Arlington’s purse account. These statutorily or regulatory established revenue sources are subject to change every legislative session, and their reduction or elimination could have an adverse impact on our business, financial condition and results of operations.
We are also subject to a variety of other rules and regulations, including zoning, environmental, construction and land-use laws and regulations governing the serving of alcoholic beverages. If we are not in compliance with these laws, it could have a material, adverse effect on our business, financial condition and results of operations.
Economic trends specific to the horse racing industry are unfavorable
Horseracing and related activities, as well as the gaming services we provide, are similar to other leisure activities in that they represent discretionary expenditures likely to decline during economic downturns. In some cases, even the perception of an impending economic downturn or the continuation of a recessionary climate can be enough to discourage consumers from spending on leisure activities. These economic trends can impact the financial viability of other industry constituents, making collection of amounts owed to us uncertain. For example, during the year ended December 31, 2010, we recognized $1.1 million of bad debt expense, net of purses, resulting from the bankruptcy filing of New York City Off-Track Betting Corporation (“NYCOTB”). During 2009, NYCOTB filed for Chapter 9 bankruptcy and on January 25, 2011, its Chapter 9 bankruptcy case was dismissed by the United States Bankruptcy Court for the Southern District of New York, and NYCOTB ceased operations. We will continue to closely monitor participants’ operational viability within the industry and any related collection issues which could potentially have a material, adverse impact on our business, financial condition or results of operations.
Our racing business faces significant competition, and we expect competition levels to increase
28
All of our racetracks face competition from a variety of sources, including spectator sports and other entertainment and gaming options. Competitive gaming activities include traditional and Native American casinos, video lottery terminals, state-sponsored lotteries and other forms of legalized and non-legalized gaming in the U.S. and other jurisdictions, and we expect the number of competitors to increase. See subheading “J. Competition” in Item 1. “Business” of this Annual Report on Form 10-K for further discussion of racing industry competition.
All of our racetracks face competition in the simulcast market. Approximately
43,830
thoroughbred horse races are conducted annually in the United States. Of these races, we host approximately
3,560
races each year, or about
8.1%
of the total. As a content provider, we compete for wagering dollars in the simulcast market with other racetracks conducting races at or near the same times as our races. As a racetrack operator, we also compete with other racetracks running live meets at or near the same time as our horse races. In recent years, this competition has increased as more states have allowed additional, automated gaming activities, such as slot machines, at racetracks with mandatory purse contributions.
Calder Race Course faces direct competition from another thoroughbred racetrack in Miami, Florida. The two racetracks are located approximately 6.5 miles apart. Under Florida law, racetracks are permitted to race throughout the year, subject to an annual notification filed with the State of Florida on February 28th of each year. As a result, Calder and the other racetrack, respectively, may independently elect to host live races on the same days. Historically, hosting live races on the same day as the other track has had a material, adverse impact on our business, financial condition and results of operations. On July 6, 2013, Calder and a competing racetrack conducted their first simultaneous live racing performances, and both racetracks are scheduled to continue to overlap live racing on certain dates through, at least, June 2014. Hosting live races on the same day as the other track has had a material, adverse impact on our business, financial condition and results of operations at Calder.
Competition from web-based businesses presents additional challenges for our racing business. Unlike most online and web-based gaming companies, our racetracks require significant and ongoing capital expenditures for both their continued operations and expansion. Our racing business also faces significantly greater costs in operating our racing business compared to costs borne by these gaming companies. Our racing business cannot offer the same number of gaming options as online and Internet-based gaming companies. Many online and web-based gaming companies are based off-shore and avoid regulation under U.S. state and federal laws. These companies may divert wagering dollars from pari-mutuel wagering venues, such as our racetracks. Our inability to compete successfully with these competitors could have a material, adverse impact on our business, financial condition and results of operations.
The popularity of horse racing is declining
There has been a general decline in the number of people attending and wagering on live horse races at North American racetracks due to a number of factors, including increased competition from other wagering and entertainment alternatives as discussed above. According to industry sources, pari-mutuel handle declined 27% from 2007 to 2011 and generated annual increases of 1% during each of 2012 and 2013. We believe lower interest in racing may have a negative impact on revenues and profitability in our racing business, as well as our ADW business, which is dependent on racing content provided by our racing business and other track operators. Our business plan anticipates that we will attract new customers to our racetracks, OTBs and ADW operations. A continued decrease in attendance at live events and in on-track wagering, or a continued generalized decline in interest in racing, could have a material, adverse impact on our business, financial condition and results of operations.
Our racing business is geographically concentrated and experiences significant seasonal fluctuations in operating results
We conduct our racing business at four racetracks: Churchill Downs, Calder, Fair Grounds and Arlington. A significant portion of our racing revenues are generated by two events, the Kentucky Derby and the Kentucky Oaks. If a business interruption were to occur and continue for a significant length of time at any of our four racetracks, particularly one occurring at Churchill Downs at a time that would affect the Kentucky Derby or Kentucky Oaks, it could have a material, adverse impact on our business, financial condition and results of operations.
In addition, we experience significant fluctuations in quarterly and annual operating results due to seasonality and other factors. We have a limited number of live racing days at our racetracks, and the number of live racing days varies from year to year. The number of live racing days we are able to offer directly affects our results of operations. A significant decrease in the number of live racing days and/or live races, including the Kentucky Derby and Kentucky Oaks, could have a material, adverse impact on our business, financial condition and results of operations.
We may not be able to attract a sufficient number of horses and trainers to achieve full field horseraces
We believe that patrons prefer to wager on races with a large number of horses, commonly referred to as full fields. A failure to offer races with full fields results in less wagering on our horseraces. Our ability to attract full fields depends on several factors. It depends on our ability to offer and fund competitive purses and it also depends on the overall horse population available for racing. Various factors have led to declines in the horse population in certain areas of the country, including competition
29
from racetracks in other areas, increased costs and changing economic returns for owners and breeders, and the spread of various debilitating and contagious equine diseases such as the neurologic form of Equine Herpes Virus-I and Strangles. If any of our racetracks is faced with a sustained outbreak of a contagious equine disease, it would have a material impact on our profitability. Finally, if we are unable to attract horse owners to stable and race their horses at our racetracks by offering a competitive environment, including improved facilities, well-maintained racetracks, better conditions for backstretch personnel involved in the care and training of horses stabled at our racetracks and a competitive purse structure, our profitability could also decrease.
We also face increased competition for horses and trainers from racetracks that are licensed to operate slot machines and other electronic gaming machines that provide these racetracks an advantage in generating new additional revenues for race purses and capital improvements. For example, Churchill Downs and Arlington are experiencing heightened competition from racinos in Indiana, Pennsylvania, Delaware and West Virginia whose purses are supplemented by gaming revenues. The opening of the Genting New York Resort at Aqueduct racetrack has enhanced the purse structure at New York racetracks as compared to historical levels. Ohio has authorized four land-based casinos by voter referendum and video lottery terminals at seven Ohio racetracks through executive order. Our failure to attract full fields could have a material, adverse impact on our business, financial condition and results of operations.
Inclement weather and other conditions may affect our ability to conduct live racing
Since horseracing is conducted outdoors, unfavorable weather conditions, including extremely high and low temperatures, high winds, storms, tornadoes and hurricanes, could cause events to be canceled and/or attendance to be lower, resulting in reduced wagering. Our operations are subject to reduced patronage, disruptions or complete cessation of operations due to weather conditions, natural disasters and other casualties. If a business interruption were to occur due to inclement weather and continue for a significant length of time at any of our racetracks, it could have a material, adverse impact on our business, financial condition and results of operations.
We depend on agreements with industry constituents including horsemen and other racetracks
The IHA, as well as various state racing laws, require that we have written agreements with the horsemen at our racetracks in order to simulcast races, and, in some cases, conduct live racing. Certain industry groups negotiate these agreements on behalf of the horsemen (the “Horsemen’s Groups”). These agreements provide that we must receive the consent of the Horsemen’s Groups at the racetrack conducting live races before we may allow third parties to accept wagers on those races. In addition, the agreements between other racetracks and their Horsemen’s Groups typically provide that those racetracks must receive consent from the Horsemen’s Groups before we can accept wagers on their races. For example, from time to time, the Thoroughbred Owners of California, the Horsemen’s Group representing horsemen in California, the Florida Horsemen’s Benevolent and Protective Association, Inc. (the “FHBPA”) which represents horsemen in Florida and the Kentucky Horsemen’s Benevolent and Protective Association (“KHBPA”) have withheld their consent to send or receive racing signals among racetracks. Further, the IHA and various state laws require that we have written agreements with Horsemen’s Groups at our racetracks in order to simulcast races on an export basis. In addition, our simulcasting agreements are generally subject to the consent of these Horsemen’s Groups. Failure to receive the consent of these Horsemen’s Groups for new and renewing simulcast agreements could have a material, adverse impact on our business, financial condition and results of operations.
We also have written agreements with the Horsemen’s Groups with regards to the proceeds of gaming machines in Louisiana and Florida. Florida law requires Calder to have an agreement with the FHBPA governing the contribution of a portion of revenues from slot machine gaming to purses on live thoroughbred races conducted at Calder and an agreement with the Florida Thoroughbred Breeders and Owners Association (the “FTBOA”) governing the contribution of a portion of revenues from slot machines gaming to breeders’, stallion, and special racing awards on live thoroughbred races conducted at Calder before Calder can receive a license to conduct slot machine gaming.
It is not certain that we will be able to maintain agreements with, or to obtain required consent from, Horsemen’s Groups. We currently negotiate formal agreements with the applicable Horsemen’s Groups at our racetracks on an annual basis. The failure to maintain agreements with, or obtain consents from, our horsemen on satisfactory terms or the refusal by a Horsemen’s Group to consent to third parties accepting wagers on our races or our accepting wagers on third parties’ races could have a material, adverse impact on our business, financial condition and results of operations.
In addition, we have agreements with other racetracks for the distribution of racing content through both the import of other racetracks’ signals for wagering at our properties and the export of our racing signal for wagering at other racetracks’ facilities. From time to time, we are unable to reach agreements on terms acceptable to us. As a result, we may be unable to distribute our racing content to other locations or to receive other racetracks’ racing content for wagering at our racetracks. The inability to distribute our racing content could have a material, adverse impact on our business, financial condition and results of operations.
30
Horse racing is an inherently dangerous sport and our racetracks are subject to personal injury litigation
Although we carry jockey accident insurance at each of our racetracks to cover personal jockey injuries which may occur during races or daily workouts, there are certain exclusions to our insurance coverage, and we are still subject to litigation from injured participants. We renew our insurance policies on an annual basis. The cost of coverage may become so high that we may need to further reduce our policy limits or agree to certain exclusions from our coverage. Our results may be affected by the outcome of litigation, as this litigation could be costly and time consuming and could divert our management and key personnel from our business operations.
Ownership and development of real estate requires significant expenditures and is subject to risk
Our racing operations require us to own extensive real estate holdings. All real estate investments are subject to risks including: general economic conditions, such as the availability and cost of financing; local and national real estate conditions, such as an oversupply of residential, office, retail or warehousing space, or a reduction in demand for real estate in the area; governmental regulation, including taxation of property and environmental legislation; and the attractiveness of properties to potential purchasers or tenants. The real estate industry is also capital intensive and sensitive to interest rates. Further, significant expenditures, including property taxes, mortgage payments, maintenance costs, insurance costs and related charges, must be made throughout the period of ownership of real property, which expenditures negatively impact our operating results.
In addition, we are subject to a variety of federal, state and local governmental laws and regulations relating to the use, storage, discharge, emission and disposal of hazardous materials. Environmental laws and regulations could hold us responsible for the cost of cleaning up hazardous materials contaminating real property that we own or operate (or previously owned or operated) or properties at which we have disposed of hazardous materials, even if we did not cause the contamination. If we fail to comply with environmental laws or if contamination is discovered, a court or government agency could impose severe penalties or restrictions on our operations or assess us with the costs of taking remedial actions.
Our business depends on utilizing and providing totalisator services
Our customers utilize information provided by United Tote and other totalisator companies that accumulates wagers, records sales, calculates payoffs and displays wagering data in a secure manner to patrons who wager on our horseraces. The failure to keep technology current could limit our ability to serve patrons effectively or develop new forms of wagering and/or affect the security of the wagering process, thus affecting patron confidence in our product. A perceived lack of integrity in the wagering systems could result in a decline in bettor confidence and could lead to a decline in the amount wagered on horseracing. In addition, a totalisator system failure could cause a considerable loss of revenue if betting machines are unavailable for a significant period of time or during an event with high betting volume.
United Tote also has contracts to provide totalisator services to a significant number of racetracks, OTBs and other pari-mutuel wagering businesses. Its totalisator systems provide wagering data to the industry in a secure manner. Errors by United Tote technology or personnel may subject us to liabilities, including financial penalties under our totalisator service contracts, which could have a material, adverse impact on our business, financial condition and results of operations.
Risks Related to Our Gaming Business
Our gaming business is highly regulated and changes in the regulatory environment could adversely affect our business
Our gaming operations exist at the discretion of the states where we conduct business, and are subject to extensive state and local regulation. Like all gaming operators in the jurisdictions in which we operate, we must periodically apply to renew our gaming licenses or registrations and have the suitability of certain of our directors, officers and employees approved. While we have obtained all governmental licenses, registrations, permits and approvals necessary for the operation of our gaming facilities, we cannot assure you that we will be able to obtain such renewals or approvals, or that we will be able to obtain future approvals that would allow us to continue to operate or to expand our gaming operations.
Regulatory authorities also have input into important aspects of our operations, including hours of operation, location or relocation of a facility, numbers and types of machines and loss limits. Regulators may also levy substantial fines against or seize our assets or the assets of our subsidiaries or the people involved in violating gaming laws or regulations. Any of these events could have an adverse effect on our business, financial condition and results of operations. The high degree of regulation in the gaming industry is a significant obstacle to our growth strategy.
Our gaming business faces significant competition, and we expect competition levels to increase
Our gaming operations operate in a highly competitive industry with a large number of participants, some of which have financial and other resources that are greater than our resources. The gaming industry faces competition from a variety of sources for discretionary consumer spending including spectator sports and other entertainment and gaming options. Our gaming operations
31
also face competition from Native American casinos, video lottery terminals, state-sponsored lotteries and other forms of legalized gaming in the U.S. and other jurisdictions. We do not enjoy the same access to the gaming public or possess the advertising resources that are available to state-sponsored lotteries or other competitors, which may adversely affect our ability to compete effectively with them. Additionally, web-based interactive gaming and wagering is growing rapidly and affecting competition in our industry as federal regulations on web-based activities are clarified. We anticipate that competition will continue to grow in the web-based interactive gaming and wagering channels because of ease of entry. In addition, Florida legislators continue to debate the expansion of Florida gaming to include Las Vegas-style destination resort casinos. Such casinos may be subject to taxation rates lower than the current gaming taxation structure. Should such legislation be enacted, it could have a material, adverse impact on our business, financial condition and results of operations. See subheading “J. Competition” in Item 1. “Business” of this Annual Report on Form 10-K for further discussion of gaming industry competition.
Our gaming business is geographically concentrated
We conduct our gaming business at five principal locations: Oxford in Oxford, Maine, Riverwalk in Vicksburg, Mississippi, Harlow’s in Greenville, Mississippi, Calder Casino in Miami Gardens, Florida, and Fair Grounds Slots in New Orleans, Louisiana. We also operate video poker machines throughout Louisiana through our subsidiary, VSI. If a business interruption were to occur and continue for a significant length of time at any of our principal gaming operations, or if economic or regulatory conditions were to become unfavorable in one or more of the regions in which they operate, it could have a material, adverse impact on our business, financial condition and results of operations.
The development of new gaming venues and the expansion of existing facilities is costly and susceptible to delays, cost overruns and other uncertainties
The Company may decide to develop, construct and open hotels, casinos or other gaming venues in response to opportunities that may arise. Future development projects and acquisitions may require significant capital commitments, the incurrence of additional debt, the incurrence of contingent liabilities and an increase in amortization expense related to intangible assets, which could have a material, adverse impact on our business, financial condition and results of operations.
The concentration and evolution of the slot machine manufacturing industry or other technological conditions could impose additional costs on us
The majority of our gaming revenues are attributable to slot and video poker machines operated by us at our casinos and wagering facilities. It is important for competitive reasons that we offer the most popular and up-to-date machine games with the latest technology to our guests. In recent years, the prices of new machines have escalated faster than the rate of inflation. In recent years, for example, slot machine manufacturers have frequently refused to sell slot machines featuring the most popular games, instead requiring participating lease arrangements in order to acquire the machines. Participation slot machine leasing arrangements typically require the payment of a fixed daily rental. Such agreements may also include a percentage payment of coin-in or net win. Generally, a participating lease is substantially more expensive over the long term than the cost to purchase a new machine. For competitive reasons, we may be forced to purchase new slot machines or enter into participating lease arrangements that are more expensive than the costs associated with the continued operation of our existing slot machines.
We materially rely on a variety of hardware and software products to maximize revenue and efficiency in our operations. Technology in the gaming industry is developing rapidly, and we may need to invest substantial amounts to acquire the most current gaming and hotel technology and equipment in order to remain competitive in the markets in which we operate. We rely on a limited number of vendors to provide video poker and slot machines and any loss of our equipment suppliers could impact our operations. Ensuring the successful implementation and maintenance of any new technology acquired is an additional risk.
Risks Related to Our Online Business
Our business strategy is premised, in part, on the legalization of online real money gaming in the United States and our ability to predict and capitalize on any such legalization
In the last few years, Delaware, Nevada, California, Florida, Mississippi, Hawaii, Massachusetts, New Jersey, Iowa, Illinois, Washington D.C. and the Federal government have considered legislation that would legalize online real money gaming. To date, only Nevada, Delaware and New Jersey have enacted such legislation. If a large number of additional states or the Federal government fail to enact online real money gaming legislation or we are unable to obtain the necessary licenses to operate online real money gaming websites in United States jurisdictions where such games are legalized, our future growth could be materially impaired. In addition, states or the Federal government may legalize online real money gaming in a manner that is unfavorable to us. For example, several states and the Federal government are considering draft laws that require online casinos to also have a license to operate a brick-and mortar casino, either directly or indirectly through an affiliate. If, like Nevada and New Jersey,
32
state jurisdictions enact legislation legalizing online real money casino gaming subject to this brick-and-mortar requirement, we may be unable to offer online real money gaming in such jurisdictions if we are unable to establish an affiliation with a brick-and-mortar casino in such jurisdiction. There also exists in the online real money gaming industry a significant “first mover” advantage. Our ability to compete effectively in respect of a particular style of online real money gaming in the United States may be premised on introducing a style of gaming before our competitors. Failing to do so (“move first”) could materially impair our ability to grow in the online real money gaming space. In addition to the risk that online real money gaming will be legalized in a manner unfavorable to us, we may fail to accurately predict when online real money gaming will be legalized in significant jurisdictions. The legislative process in each state and at the Federal level is unique and capable of rapid, often unpredictable change. If we fail to accurately forecast when and how, if at all, online real money gaming will be legalized in additional state jurisdictions, such failure could impair our readiness to introduce online real money gaming offerings in such jurisdictions, which could have a material adverse effect on our business, financial condition and results of operations.
Our ADW business is highly regulated and changes in the regulatory environment could adversely affect our business
TwinSpires, our ADW business, accepts advance deposit wagers from customers of certain states who set up and fund an account from which they may place wagers via telephone, mobile device or through the Internet at TwinSpires.com. The ADW business is heavily regulated, and laws governing advance deposit wagering vary from state to state. Some states have expressly authorized advance deposit wagering by their own residents, some states have expressly prohibited pari-mutuel wagering and/or advance deposit wagering and other states have expressly authorized pari-mutuel wagering but have neither expressly authorized nor expressly prohibited their residents from placing wagers through advance deposit wagering hubs located in different states. We believe that an ADW business may open accounts on behalf of and accept wagering instructions from residents of states where pari-mutuel wagering is legal and where providing wagering instructions to ADW businesses in other states is not expressly prohibited by statute, regulations, or other governmental restrictions. However, state attorneys general, regulators, and other law enforcement officials may interpret state gaming laws, federal statutes, constitutional principles, and doctrines, and the related regulations in a different manner than we do. In the past, certain state attorneys general and other law enforcement officials have expressed concern over the legality of interstate advance deposit wagering.
Our expansion opportunities with respect to advance deposit wagering may be limited unless more states amend their laws or regulations to permit advance deposit wagering. Conversely, if states take affirmative action to make advance deposit wagering expressly unlawful, this could have a material, adverse impact on our business, financial condition and results of operations. For example, previously existing ADW regulations in Illinois expired on December 31, 2012, and we ceased accepting wagers from Illinois residents in January 2013 until June 2013, when Illinois ADW regulations were extended. Furthermore, we ceased accepting wagers from Texas residents in September 2013, due to the enforcement of an existing Texas law prohibiting ADW wagering. In addition, the regulatory and legislative processes can be lengthy, costly and uncertain. We may not be successful in lobbying state legislatures or regulatory bodies to obtain or renew required legislation, licenses, registrations, permits and approvals necessary to facilitate the operation or expansion of our ADW business. From time to time, the United States Congress has considered legislation that would either inhibit or restrict Internet gambling in general or inhibit or restrict the use of certain financial instruments, including credit cards, to provide funds for advance deposit wagering.
Furthermore, many states have considered and are considering interactive and Internet gaming legislation and regulations, which may inhibit our ability to do business in such states. Anti-gaming conclusions and recommendations of other governmental or quasi-governmental bodies could form the basis for new laws, regulations, and enforcement policies that could have a material, adverse impact on our business, financial condition and results of operations. The extensive regulation by both state and federal authorities of gaming activities also can be significantly affected by changes in the political climate and changes in economic and regulatory policies. Such effects could have a material, adverse impact to the success of our advance deposit wagering operations.
Our ADW business is subject to a variety of U.S. and foreign laws, many of which are unsettled and still developing and which could subject us to claims or otherwise harm our business
We are subject to a variety of laws in the United States and abroad, including laws regarding gaming, consumer protection and intellectual property that are continuously evolving and developing. The scope and interpretation of the laws that are or may be applicable to us are often uncertain and may be conflicting. For example, laws relating to the liability of providers of online services for activities of their users and other third parties are currently being tested by a number of claims, including actions based on invasion of privacy and other torts, unfair competition, copyright and trademark infringement, and other theories. It is also likely that as our business grows and evolves we will become subject to laws and regulations in additional jurisdictions.
If we are not able to comply with these laws or regulations or if we become liable under these laws or regulations, we could be directly harmed, and we may be forced to implement new measures to reduce our exposure to this liability. This may require us to expend substantial resources or to modify our online services, which could harm our business, financial condition and
33
results of operations. In addition, the increased attention focused upon liability issues as a result of lawsuits and legislative proposals could harm our reputation or otherwise impact the growth of our business.
It is possible that a number of laws and regulations may be adopted or construed to apply to us in the United States and elsewhere that could restrict the online and mobile industries, including player privacy, advertising, taxation, content suitability, copyright, distribution and antitrust. Furthermore, the growth and development of electronic commerce and virtual goods may prompt calls for more stringent consumer protection laws that may impose additional burdens on companies such as ours conducting business through the Internet and mobile devices. We anticipate that scrutiny and regulation of our industry will increase and we will be required to devote legal and other resources to addressing such regulation. If that were to occur, we may be required to seek licenses, authorizations or approvals from relevant regulators, the granting of which may be dependent on us meeting certain capital and other requirements and we may be subject to additional regulation and oversight, all of which could significantly increase our operating costs. Changes in current laws or regulations or the imposition of new laws and regulations in the United States or elsewhere regarding these activities may lessen the growth of online gaming and impair our business.
Our ADW business faces strong competition, and we expect competition levels to increase
Our ADW business is sensitive to changes and improvements to technology and new products and faces strong competition from other web-based interactive gaming and wagering businesses. Our ability to develop, implement and react to new technology and products for our ADW business is a key factor in our ability to compete with other ADW businesses. In addition, we face competition from a new wagering product called exchange wagering, a variation of pari-mutuel wagering in which bettors wager directly against one another, establishing their own odds on a horserace. Both California and New Jersey legislatures have approved exchange wagering. Some of our competitors may have greater resources than we do. In addition, we believe that new competitors may enter the ADW business with relative ease because of the low cost of entry. As a result, we anticipate increased competition in our ADW business. It is difficult to predict the impact of increased competition on our ADW business. See subheading “J. Competition” in Item 1. “Business” of this Annual Report on Form 10-K for further discussion of ADW industry competition.
A recent clarification on the impact of the Federal Wire Act of 1961 on Internet gaming could increase competition
During 2011, the U.S. Department of Justice clarified its position on the Wire Act of 1961 (the “Wire Act”), which had historically been interpreted to outlaw all forms of gambling across states lines. The department’s Office of Legal Counsel determined that the Wire Act applied only to a sporting event or contest, but did not apply to other forms of Internet gambling, including online betting unrelated to sporting events. The Justice Department indicated that many forms of online gambling could become legal under federal law, which could include legalized poker and generalized gaming including state lottery wagering. As a result, we anticipate increased competition to our ADW business from various other forms of online gaming. It is difficult to predict the level of increased competition and the impact of increased competition on our ADW business.
Our inability to retain our core customer base or our failure to attract new customers could harm our business
We utilize technology and marketing relationships to retain current customers and attract new customers. If we are unable to retain our core customer base through robust content offerings and other popular features, if we lose customers to our competitors, or if we fail to attract new customers, our businesses would fail to grow or would be adversely affected.
System failures or damage from earthquakes, fires, floods, power loss, telecommunications failures, cyber-attack or other unforeseen events could harm our business
Our ADW business depends upon our communications hardware and our computer hardware. We have built certain redundancies into our systems to avoid downtime in the event of outages, system failures or damage; however, certain risks still exist. Thus, our systems remain vulnerable to damage or interruption from floods, fires, power loss, telecommunication failures, terrorist cyber-attacks, hardware or software error, computer viruses, computer denial-of-service attacks and similar events. Despite any precautions we may take, the occurrence of a natural disaster or other unanticipated problems could result in lengthy interruptions in our services. Any unscheduled interruption in the availability of our website and our services results in an immediate, and possibly substantial, loss of revenue. Interruptions in our services or a breach of customers’ secure data could cause current or potential users to believe that our systems are unreliable, leading them to switch to our competitors or to avoid our site, and could permanently harm our reputation and brand. These interruptions also increase the burden on our engineering staff, which, in turn, could delay our introduction of new features and services on our website. We have property and business interruption insurance covering damage or interruption of our systems. However, this insurance might not be sufficient to compensate us for all losses that may occur.
Security breaches, computer viruses and computer hacking attacks could harm our business and results of operations
34
Security breaches, computer malware and computer hacking attacks have become more prevalent in our industry. Many companies, including ours, have been the target of such attacks. Any security breach caused by hacking, which involves efforts to gain unauthorized access to information or systems, or to cause intentional malfunctions or loss or corruption of data, software, hardware or other computer equipment, and the inadvertent transmission of computer viruses could harm our business, financial condition and results of operations. Though it is difficult to determine what harm may directly result from any specific interruption or breach, any failure to maintain performance, reliability, security and availability of our network infrastructure to the satisfaction of our players may harm our reputation and our ability to retain existing players and attract new players.
We carry insurance covering many of these risks, including network security, first party extortion threats and business interruptions, but there are certain exclusions to this coverage and the insurance limits may not be sufficient to fully mitigate all financial damage to the Company. We renew our insurance policies on an annual basis. The cost of coverage may become so high that we may need to further reduce our policy limits or agree to certain exclusions from our coverage.
We may not be able to respond to rapid technological changes in a timely manner, which may cause customer dissatisfaction
The gaming sector is characterized by the rapid development of new technologies and continuous introduction of new products. Our main technological advantage versus potential competitors is our software lead-time in the market and our experience in operating an Internet-based wagering network. However, we may not be able to maintain our competitive technological position against current and potential competitors, especially those with greater financial resources. Our success depends upon new product development and technological advancements, including the development of new wagering platforms and features. While we expend resources on research and development and product enhancement, we may not be able to continue to improve and market our existing products or technologies or develop and market new products in a timely manner. Further technological developments may cause our products or technologies to become obsolete or noncompetitive.
Failure to comply with laws requiring us to block access to certain individuals, based upon their geographic location, may result in legal penalties or an impairment to our ability to offer online real money gaming, in general
Individuals in jurisdictions in which online real money gaming is illegal may nonetheless seek to engage our online real money gaming products. While we take steps to block access by individuals in such jurisdictions, those steps may be unsuccessful. In the event that individuals in jurisdictions in which online real money gaming is illegal engage our online real money gaming systems, we may be subject to criminal sanctions, regulatory penalties, the loss of existing or future licenses necessary to offer online real money gaming or other legal liabilities, any one of which could have a material adverse effect on us, and therefore our businesses, financial condition and results of operations. For example, gambling laws and regulations in many jurisdictions require gaming industry participants to maintain strict compliance with various laws and regulations. If we are unsuccessful in blocking access to our online real money gaming products by individuals in a jurisdiction where such products are illegal, we could lose or be prevented from obtaining a license necessary to offer online real money gaming in a jurisdiction in which such products are legal. Furthermore, our inability to restrict illegal access could materially impact our other gaming licenses as well.
|
ITEM 1B.
|
UNRESOLVED STAFF COMMENTS
|
None.
|
ITEM 2.
|
PROPERTIES
|
On October 19, 2011, the Company entered into a ten-year lease agreement for approximately 37,000 square feet of office space in Louisville, Kentucky. The space serves as the Company’s new corporate headquarters, which was occupied during the second quarter of 2012.
Additional information concerning property owned by us required by this Item is incorporated by reference to the information contained in the subheadings “C. Live Racing,” “D. Simulcast Operations” and “F. Gaming Operations” in Item 1. “Business” of this Annual Report on Form 10-K.
Our real and personal property (but not including the property of UT Canada, Bluff, Velocity, MVG, HRTV, NASRIN or Kentucky Downs) is encumbered by liens securing our $500 million senior secured credit facility. The shares of stock of and ownership interests in certain of our subsidiaries are also pledged to secure this debt facility.
The Kentucky Derby Museum is located on property that is adjacent to, but not owned by, Churchill Downs. The Museum is owned and operated by the Kentucky Derby Museum Corporation, a tax-exempt organization under Section 501(c)(3) of the Internal Revenue Code of 1986.
|
ITEM 3.
|
LEGAL PROCEEDINGS
|
35
The Company records an accrual for legal contingencies to the extent that it concludes that it is probable that a liability has been incurred and the amount of the loss can be reasonably estimated. Except as disclosed below, no estimate of the possible loss or range of loss in excess of amounts accrued, if any, can be made at this time regarding the matters specifically described below. We do not believe that the final outcome of these matters will have a material adverse impact on our business, financial condition and results of operations.
ILLINOIS DEPARTMENT OF REVENUE
In October of 2012, the Company filed a verified complaint for preliminary and permanent injunctive relief and for declaratory judgment (the “Complaint”) against the Illinois Department of Revenue (the “Department”). The Company's complaint was filed in response to Notices of Deficiency issued by the Department on March 18, 2010 and September 6, 2012. In response to said Notices of Deficiency, the Company, on October 4, 2012, issued a payment in protest in the amount of $2.9 million (the “Protest Payment”) under the State Officers and Employees Money Disposition Act and recorded this amount as an other asset. The Company subsequently filed its complaint in November alleging that the Department erroneously included handle, instead of the Company's commissions from handle, in the computation of the Company's sales factor (a computation of the Company's gross receipts from wagering within the State of Illinois) for determining the applicable tax owed. On October 30, 2012, the Company's Motion for Preliminary Injunctive Relief was granted, which prevents the Department from depositing any monies from the Protest Payment into the State of Illinois General Fund and from taking any further action against the Company until the Circuit Court takes final action on the Company's Complaint. If successful with its Complaint, the Company will be entitled to a full or partial refund of the Protest Payment from the Department. This matter remains pending before the Tax and Miscellaneous Remedies Section of the Circuit Court of Cook County.
KENTUCKY DOWNS
On September 5, 2012, Kentucky Downs Management, Inc. (“KDMI”) filed a petition for declaration of rights in Kentucky Circuit
Court
located in Simpson County, Kentucky styled Kentucky Downs Management Inc. v. Churchill Downs Incorporated (Civil Action No. 12-CI-330) (the “Simpson County Case”) requesting a declaration that the Company does not have the right to exercise its put right and require Kentucky Downs, LLC (“Kentucky Downs”) and/or Kentucky Downs Partners, LLC (“KDP”) to purchase the Company’s ownership interest in Kentucky Downs. On September 18, 2012, the Company filed a complaint in Kentucky Circuit Court located in Jefferson County, Kentucky, styled Churchill Downs Incorporated v. Kentucky Downs, LLC; Kentucky Downs Partners, LLC; and Kentucky Downs Management Inc. (Civil Action No. 12-CI-04989) (the “Jefferson County Case”) claiming that Kentucky Downs and KDP had breached the operating agreement for Kentucky Downs and requesting a declaration that the Company had validly exercised its put right and a judgment compelling Kentucky Downs and/or KDP to purchase the Company’s ownership interest in Kentucky Downs pursuant to the terms of the applicable operating agreement. On October 9, 2012, the Company filed a motion to dismiss the Simpson County Case and Kentucky Downs, KDP and KDMI filed a motion to dismiss the Jefferson County Case. A hearing for the motion to dismiss in the Simpson County Case occurred November 30, 2012. At that hearing the Company’s motion to dismiss the Simpson County Case was denied. Subsequently, Kentucky Downs, KDMI and KDP’s motion to dismiss the Jefferson County Case was granted on January 23, 2013, due to the Simpson County Circuit Court’s assertion of jurisdiction over the dispute. On May 16, 2013, Kentucky Downs, KDP and KDMI filed a Motion for Summary Judgment against the Company and Turfway Park, LLC. On September 19, 2013, the Company filed its response to the Motion for Summary Judgment. A hearing occurred before the Simpson County Circuit Court on September 23, 2013 on the Kentucky Downs, KDP and KDMI Motion for Summary Judgment. All parties appeared before the Simpson County Court and oral arguments were heard. On October 31, 2013, the Simpson County Court entered an Order Denying Petitioners’ (Kentucky Downs Management Inc. et al.) Motion for Summary Judgment. The case will now move forward through discovery and to trial. No trial date has been set.
TEXAS PARI-MUTUEL WAGERING
On September 21, 2012, the Company filed a lawsuit in the United States District Court for the Western District of Texas styled
Churchill Downs Incorporated; Churchill Downs Technology Initiatives Company d/b/a TwinSpires.com v. Chuck Trout, in his official capacity as Executive Director of the Texas Racing Commission; Gary P. Aber, Susan Combs, Ronald F. Ederer, Gloria Hicks, Michael F. Martin, Allan Polunsky, Robert Schmidt, John T. Steen III, Vicki Smith Weinberg, in their official capacity as members of the Texas Racing Commission
(Case No. 1:12-cv-00880-LY) challenging the constitutionality of a Texas law requiring residents of Texas that desire to wager on horseraces to wager in person at a Texas race track. In addition to its complaint, on September 21, 2012, the Company filed a motion for preliminary injunction seeking to enjoin the state from taking any action to enforce the law in question. In response, on October 9, 2012, counsel for the state assured both the Company and the court that the state would not enforce the law in question against the Company without prior notice, at which time the court could then consider the motion for preliminary injunction. On April 15, 2013, both parties filed their opening briefs, and a trial was held on May 2, 2013. On September 23, 2013, the United States District Court for the Western District of Texas ruled against the Company and upheld the Texas law at issue. Subsequently, on September 25, 2013, the Company ceased taking wagers from
36
Texas residents via TwinSpires.com and returned deposited funds to Texas residents. The Company filed a motion for an expedited hearing in the United States Court of Appeals, which was granted on October 17, 2013. The Texas Racing Commission, et. al., filed an appellate brief on December 13, 2013. The Company filed its brief in reply on December 30, 2013. Oral arguments were heard before the United States Court of Appeals for the Fifth Circuit on February 4, 2014, and the Company is awaiting a ruling from the Court.
HORSERACING EQUITY TRUST FUND
During 2006, the Illinois General Assembly enacted Public Act 94-804, which created the Horse Racing Equity Trust Fund (“HRE Trust Fund”). During November 2008, the Illinois General Assembly passed Public Act 95-1008 to extend Public Act 94-804 for a period of three years beginning December 12, 2008. The HRE Trust Fund was funded by a 3% “surcharge” on revenues of Illinois riverboat casinos that met a certain revenue threshold. The riverboats paid all monies required under Public Acts 94-804 and 95-1008 into a special protest fund account which prevented the monies from being transferred to the HRE Trust Fund. The funds were moved to the HRE Trust Fund and distributed to the racetracks, including Arlington, in December 2009.
On June 12, 2009, the riverboat casinos filed a lawsuit in the United States District Court for the Northern District of Illinois, Eastern Division, against former Governor Rod Blagojevich, Friends of Blagojevich and others, including Arlington (
Empress Casino Joliet Corp. v. Blagojevich
, 2009 CV 03585). While the riverboat casinos alleged violations of the Racketeer Influenced and Corrupt Organizations Act (“RICO”) against certain of the defendants, Arlington was not named in the RICO count, but rather was named solely in a count requesting that the monies paid by the riverboat casinos pursuant to Public Acts 94-804 and 95-1008 be held in a constructive trust for the riverboat casinos’ benefit and ultimately returned to the casinos. Following several lower court motions, on March 2, 2011, a three member panel of the Seventh Circuit Court of Appeals reversed the trial court’s dismissal. We requested the Seventh Circuit Court of Appeals to rehear the matter
en banc
and, on April 11, 2011, the Appellate Court issued an order to rehear the matter
en banc
. That hearing was held on May 10, 2011. On July 8, 2011, the Seventh Circuit Court of Appeals issued a thirty-day stay of dissolution of the temporary restraining order ('TRO") to allow the Casinos to request a further stay of dissolution of the TRO pending their petition for certiorari to the United States Supreme Court. On August 5, 2011, the United States Supreme Court denied an application by the casinos to further stay the dissolution of the TRO. On August 9, 2011, the stay of dissolution expired and the TRO dissolved, which terminated the restrictions on the Company’s ability to access funds from the HRE Trust Fund held in the escrow account. Public Act 94-804 expired in May 2008 and Public Act 95-1008 expired on July 18, 2011, the date the tenth Illinois riverboat license became operational.
Arlington filed an administrative appeal in the Circuit Court of Cook County on August 18, 2009 (
Arlington Park Racecourse LLC v. Illinois Racing Board, 09 CH 28774
), challenging the IRB’s allocation of funds out of the HRE Trust Fund based upon handle generated by certain ineligible licensees, as contrary to the language of the statute. The Circuit Court affirmed the IRB’s decision on November 10, 2010, and Arlington appealed this ruling to the Illinois First District Court of Appeals. On April 23, 2012 the Court of Appeals ultimately affirmed the IRB’s decision and Arlington filed a petition for leave to appeal to the Illinois Supreme Court on May 25, 2012. On October 1, 2012, the Illinois Supreme Court denied Arlington's petition for leave to appeal. Hawthorne Racecourse filed a separate administrative appeal on June 11, 2010 (Hawthorne Racecourse, Inc. v. Illinois Racing Board et. al., Case No. 10 CH 24439) challenging the IRB’s decision not to credit Hawthorne with handle previously generated by an ineligible licensee for the purpose of calculating the allocation of the HRE Trust Fund monies and the IRB’s unwillingness to hold another meeting in 2010 to reconstrue the statutory language in Public Act 95-1008 with respect to distributions. On May 25, 2011, the Circuit Court rejected Hawthorne’s arguments and affirmed the IRB’s decisions, and Hawthorne appealed the Circuit Court’s decision. Arlington filed its response brief on May 30, 2012, and the IRB filed its response brief on June 30, 2012. Hawthorne filed its reply brief on July 27, 2012. Oral arguments on Hawthorne's appeal before the Illinois First District Court of Appeals were heard on November 1, 2012 and during November 2012, the First District Court of Appeals ruled against Hawthorne.
We received $46.1 million from the HRE Trust Fund, of which $26.5 million was designated for Arlington purses. We used the remaining $19.6 million of the proceeds to improve, market, and maintain or otherwise operate the Arlington racing facility in order to conduct live racing.
BALMORAL, MAYWOOD AND ILLINOIS HARNESS HORSEMEN’S ASSOCIATION
On February 14, 2011, Balmoral Racing Club, Inc., Maywood Park Trotting Association, Inc. and the Illinois Harness Horsemen's Association, Inc. filed a lawsuit styled
Balmoral Racing Club, Inc., Maywood Park Trotting Association, Inc. and the Illinois Harness Horsemen's Association Inc. vs. Churchill Downs Incorporated, Churchill Downs Technology Initiatives Company d/b/a TwinSpires.com and Youbet.com, LLC
(Case No. 11-CV-D1028) in the United States District Court for the Northern District of Illinois, Eastern Division. The plaintiffs allege that Youbet.com breached a co-branding agreement dated December 2007, as amended on December 21, 2007, and September 26, 2008 (the “Agreement”), which was entered into between certain Illinois racetracks and a predecessor of Youbet.com. The plaintiffs allege that the defendants breached the agreement by virtue of an unauthorized assignment of the Agreement to TwinSpires.com and further allege that Youbet.com and TwinSpires have
37
misappropriated trade secrets in violation of the Illinois Trade Secrets Act. Finally, the plaintiffs allege that the Company and TwinSpires.com tortiously interfered with the Agreement by causing Youbet.com to breach the Agreement. The plaintiffs have alleged damages of at least $3.6 million, or alternatively, of at least $0.8 million. On April 1, 2011, the plaintiffs filed a motion for a preliminary injunction, seeking an order compelling the defendants to turn over all Illinois customer accounts and prohibiting TwinSpires.com from using that list of Illinois customer accounts. On April 18, 2011, the defendants filed an answer and a motion to dismiss certain counts of the plaintiffs' complaint, and Youbet.com asserted a counterclaim seeking certain declaratory relief relating to allegations that plaintiffs Maywood and Balmoral breached the Agreement in 2010, leading to its proper termination by Youbet.com on December 1, 2010. The preliminary injunction hearing took place on July 6, 2011, and, on July 21, 2011, the court denied the preliminary injunction. On March 9, 2012, the parties mediated the case without resolution. The parties filed motions for summary judgment in November and December 2012, respectively, and replies were filed in January 2013. During June 2013, the Court denied both parties’ motions for summary judgment. On November 1, 2013, the Company reached a final settlement in the matter and paid the plaintiffs $2.3 million, of which $2.0 million was reimbursed to the Company by its insurance carrier.
OTHER MATTERS
There are no other material pending legal proceedings.
|
ITEM 4.
|
MINE SAFETY DISCLOSURES
|
Not applicable.
38
|
ITEM 5.
|
MARKET FOR REGISTRANT’S COMMON EQUITY, RELATED STOCKHOLDER MATTERS AND ISSUER PURCHASES OF EQUITY SECURITIES
|
Shareholders, Market Information and Dividends
Our common stock is traded on the NASDAQ Global Market under the symbol CHDN. As of February 21, 2014, there were approximately 3,449 shareholders of record.
The following table sets forth the high and low sale prices, as reported by the NASDAQ Global Market, and dividend declaration information for our common stock during the last two years:
|
|
2013 - By Quarter
|
2012 - By Quarter
|
|||||||||||||||||||||||||||||
|
|
1st
|
2nd
|
3rd
|
4th
|
1st
|
2nd
|
3rd
|
4th
|
|||||||||||||||||||||||
|
High Sale
|
$
|
70.73
|
|
$
|
86.38
|
|
$
|
89.81
|
|
$
|
90.77
|
|
$
|
60.00
|
|
$
|
63.18
|
|
$
|
63.49
|
|
$
|
67.20
|
|
|||||||
|
Low Sale
|
$
|
63.61
|
|
$
|
68.26
|
|
$
|
78.95
|
|
$
|
82.42
|
|
$
|
49.82
|
|
$
|
54.93
|
|
$
|
54.17
|
|
$
|
56.66
|
|
|||||||
|
Dividends per share:
|
$
|
0.87
|
|
$
|
0.72
|
|
|||||||||||||||||||||||||
Purchases of Company Common Stock
The following table provides information with respect to shares of common stock repurchased by the Company during the quarter ended
December 31, 2013
:
|
Total Number of Shares Purchased
|
Average Price Paid Per Share
|
Total Number of Shares Purchased as Part of Publicly Announced Plans or Programs
|
Approximate Dollar Value of Shares That May Yet Be Purchased under the Plans or Programs
|
|||||||||||||
|
Period 1
|
10/1/-
10/31/2013
|
1,253
|
|
(1)
|
$
|
88.02
|
|
—
|
|
$
|
100,000,000
|
|
(2
|
)
|
||
|
Period 2
|
11/1/-
11/30/2013
|
—
|
|
$
|
—
|
|
—
|
|
—
|
|
||||||
|
Period 3
|
12/1/-
12/31/2013
|
27,090
|
|
(1)
|
$
|
89.65
|
|
—
|
|
—
|
|
|||||
|
28,343
|
|
|
$
|
89.58
|
|
—
|
|
$
|
100,000,000
|
|
||||||
|
(1)
|
Shares of common stock were repurchased from grants of restricted stock in payment of income taxes on the related compensation.
|
|
(2)
|
Maximum dollar amount of shares of common stock that may yet be repurchased under the Company's stock repurchase program.
|
Shareholder Return Performance Graph
Set forth below is a line graph comparing the cumulative total return of our common stock, including reinvested dividends, against the cumulative total return of peer group indices, the S&P 500 Index and the Russell 2000 Index for the period of five fiscal years commencing December 31, 2008, and ending December 31, 2013. The peer group indices used by the Company include the Dow Jones US Gambling Index, which is a published industry peer index of companies engaged in the leisure and gaming industries, and an index of certain companies in our peer group ("Peer Group"), which is comprised of Penn National Gaming Inc., Boyd Gaming Corporation, Pinnacle Entertainment Inc., Isle of Capri Casinos Inc. and MTR Gaming Group Inc. The broad equity market indices used by the Company are the Russell 2000 Index, which measures the performance of small and middle capitalization companies and the S&P 500 Index, which measures the performance of large capitalization companies. The graph and table depict the result of an investment on December 31, 2008, of $100 in the Company, the Russell 2000 Index, the S&P 500 Index, the Dow Jones US Gambling Index and our Peer Group. Because we have historically paid dividends on an annual basis, the performance graph assumes that dividends were reinvested annually.
39
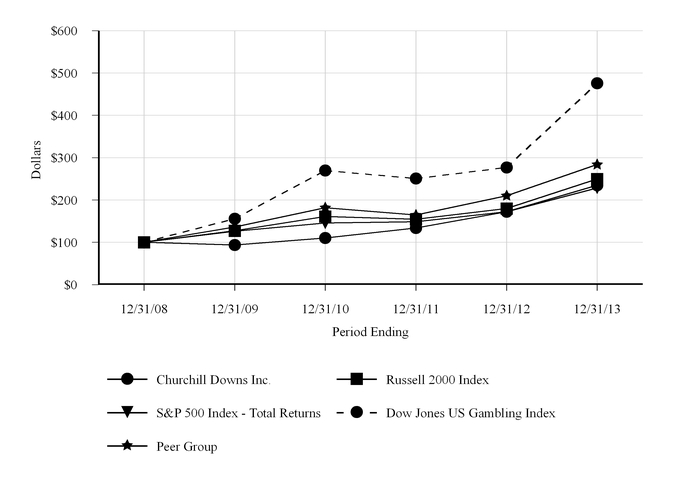
|
12/31/2008
|
12/31/2009
|
12/31/2010
|
12/31/2011
|
12/31/2012
|
12/31/2013
|
||||||||||||||||||
|
Churchill Downs Inc.
|
$
|
100.00
|
|
$
|
93.63
|
|
$
|
110.02
|
|
$
|
133.73
|
|
$
|
172.47
|
|
$
|
235.01
|
|
|||||
|
Russell 2000 Index
|
$
|
100.00
|
|
$
|
127.09
|
|
$
|
161.17
|
|
$
|
154.44
|
|
$
|
179.75
|
|
$
|
249.53
|
|
|||||
|
S&P 500 Index - Total Returns
|
$
|
100.00
|
|
$
|
126.46
|
|
$
|
145.51
|
|
$
|
148.59
|
|
$
|
172.37
|
|
$
|
228.19
|
|
|||||
|
Dow Jones US Gambling Index
|
$
|
100.00
|
|
$
|
155.72
|
|
$
|
269.58
|
|
$
|
250.58
|
|
$
|
276.93
|
|
$
|
475.61
|
|
|||||
|
Peer Group
|
$
|
100.00
|
|
$
|
136.17
|
|
$
|
181.68
|
|
$
|
164.40
|
|
$
|
210.02
|
|
$
|
283.64
|
|
|||||
40
|
ITEM 6.
|
SELECTED FINANCIAL DATA
|
|
Years Ended December 31,
|
|||||||||||||||||||
|
(In thousands, except per common share data)
|
2013
(1) (7)
|
2012
(2) (8)
|
2011
(3)
|
2010
(4) (9)
|
2009
(5)
|
||||||||||||||
|
Operations:
|
|||||||||||||||||||
|
Net revenues
|
$
|
779,325
|
|
$
|
731,296
|
|
$
|
696,854
|
|
$
|
585,345
|
|
$
|
470,503
|
|
||||
|
Operating income
|
$
|
90,100
|
|
$
|
96,550
|
|
$
|
81,010
|
|
$
|
31,566
|
|
$
|
34,733
|
|
||||
|
Earnings from continuing operations
|
$
|
55,033
|
|
$
|
58,152
|
|
$
|
60,795
|
|
$
|
19,557
|
|
$
|
17,681
|
|
||||
|
Discontinued operations, net of income taxes:
|
|||||||||||||||||||
|
(Loss) gain from operations
|
$
|
(50
|
)
|
$
|
124
|
|
$
|
(1
|
)
|
$
|
(5,827
|
)
|
$
|
(853
|
)
|
||||
|
(Loss) gain on sale of assets
|
$
|
(83
|
)
|
$
|
—
|
|
$
|
3,561
|
|
$
|
2,623
|
|
$
|
—
|
|
||||
|
Net earnings
|
$
|
54,900
|
|
$
|
58,276
|
|
$
|
64,355
|
|
$
|
16,353
|
|
$
|
16,828
|
|
||||
|
Basic net earnings from continuing operations per common share
|
$
|
3.13
|
|
$
|
3.38
|
|
$
|
3.59
|
|
$
|
1.27
|
|
$
|
1.28
|
|
||||
|
Basic net earnings per common share
|
$
|
3.12
|
|
$
|
3.39
|
|
$
|
3.80
|
|
$
|
1.06
|
|
$
|
1.22
|
|
||||
|
Diluted net earnings from continuing operations per common share
|
$
|
3.07
|
|
$
|
3.33
|
|
$
|
3.55
|
|
$
|
1.26
|
|
$
|
1.27
|
|
||||
|
Diluted net earnings per common share
|
$
|
3.06
|
|
$
|
3.34
|
|
$
|
3.76
|
|
$
|
1.05
|
|
$
|
1.21
|
|
||||
|
Dividends paid per common share
|
$
|
0.87
|
|
$
|
0.72
|
|
$
|
0.60
|
|
$
|
0.50
|
|
$
|
0.50
|
|
||||
|
Balance sheet data at period end:
|
|||||||||||||||||||
|
Total assets
|
$
|
1,352,261
|
|
$
|
1,114,337
|
|
$
|
948,022
|
|
$
|
1,017,719
|
|
$
|
725,402
|
|
||||
|
Working capital deficiency
|
$
|
(52,491
|
)
|
$
|
(259,506
|
)
|
$
|
(28,989
|
)
|
$
|
(18,556
|
)
|
$
|
(80,361
|
)
|
||||
|
Current maturities of long-term debt
|
$
|
—
|
|
$
|
209,728
|
|
$
|
—
|
|
$
|
—
|
|
$
|
—
|
|
||||
|
Long-term debt
|
$
|
369,191
|
|
$
|
—
|
|
$
|
127,563
|
|
$
|
265,117
|
|
$
|
71,132
|
|
||||
|
Convertible note payable, related party
|
$
|
—
|
|
$
|
—
|
|
$
|
—
|
|
$
|
15,075
|
|
$
|
14,655
|
|
||||
|
Other Data:
|
|||||||||||||||||||
|
Shareholders’ equity
|
$
|
704,789
|
|
$
|
644,295
|
|
$
|
584,030
|
|
$
|
506,214
|
|
$
|
407,022
|
|
||||
|
Shareholders’ equity per common share
|
$
|
39.27
|
|
$
|
36.93
|
|
$
|
34.00
|
|
$
|
30.55
|
|
$
|
29.74
|
|
||||
|
Additions to property and equipment, exclusive of business acquisitions, net
|
$
|
48,771
|
|
$
|
41,298
|
|
$
|
22,667
|
|
$
|
61,952
|
|
$
|
81,940
|
|
||||
|
Cash flow data at period end:
|
|||||||||||||||||||
|
Net cash provided by operating activities
|
$
|
144,915
|
|
$
|
144,407
|
|
$
|
172,995
|
|
$
|
59,857
|
|
$
|
71,047
|
|
||||
|
Maintenance-related capital expenditures
|
$
|
16,879
|
|
$
|
17,158
|
|
$
|
14,845
|
|
$
|
14,709
|
|
$
|
12,276
|
|
||||
|
Free cash flow
(6)
|
$
|
128,036
|
|
$
|
127,249
|
|
$
|
158,150
|
|
$
|
45,148
|
|
$
|
58,771
|
|
||||
The selected financial data presented above is subject to the following information:
|
(1)
|
During 2013, we recognized $4.5 million as miscellaneous other income for our final share of proceeds from the Horse Racing Equity Trust Fund ("HRE Trust Fund"). Furthermore, we recognized a gain of $0.4 million from insurance recoveries, net of losses, related to losses sustained at Churchill Downs during 2012 from hail damage. Partially offsetting these items, we recognized an expense of $2.5 million as the collectibility of a third-party deposit associated with an Internet gaming license was not deemed probable.
|
|
(2)
|
During 2012, we recognized a gain of $7.0 million from insurance recoveries, net of losses, related to losses sustained at Harlow's during 2011 from wind and flood damage and at Churchill Downs during 2012 from hail damage.
|
|
(3)
|
During 2011, we recognized $19.3 million as miscellaneous other income for our share of proceeds from the HRE Trust Fund. In addition, during 2011, we recognized $2.7 million of miscellaneous other income and $1.4 million of interest expense as a result of the conversion and the elimination of a short forward contract liability and long put option asset through the issuance of 452,603 shares of common stock associated with a convertible note payable. Finally, during 2011, we recognized a gain in discontinued operations of $3.4 million, net of income taxes, as the final settlement of the contingent consideration provision associated with the sale of our ownership interest in Hoosier Park L.P. during 2007. In addition, we recognized an additional gain in discontinued operations of $0.2 million, net of income taxes, on the sale of Hollywood Park related to the final expiration of an indemnity of certain contractual obligations related to the sale.
|
41
|
(4)
|
During 2010, Churchill Downs Entertainment Group ("CDE") ceased operations and recognized a loss from operations before income tax benefit of $9.1 million ($5.8 million, net of income taxes) in discontinued operations. In addition, during 2010, we recognized a gain of $2.6 million, net of income taxes, on the sale of Hollywood Park, upon the partial expiration of an indemnity of certain contractual obligations related to the sale.
|
|
(5)
|
During 2009, we recognized incremental income tax expense from continuing operations of $2.3 million as well as income tax expense from discontinued operations of $1.1 million related to proposed adjustments resulting from an audit of prior year income tax returns by the Internal Revenue Service ("IRS"). In addition, during 2009, we acquired land from a related party for $27.5 million, which was financed partially with a short-term note payable of $24.0 million. Finally, during 2009, we received $24.0 million related to Illinois riverboat subsidies, which was recorded in restricted cash and deferred revenues pending the outcome of a challenge of these subsidies by Illinois riverboats.
|
|
(6)
|
Free cash flow, a non-GAAP financial measure, is defined as net cash provided by operating activities less maintenance-related (replacement) capital expenditures. Please refer to the subheading “Liquidity and Capital Resources” in Item 7. “Management’s Discussion and Analysis of Financial Condition and Results of Operations” in this Annual Report on Form 10-K for a further description of free cash flow and a reconciliation to the most closely related GAAP measure.
|
|
(7)
|
On July 17, 2013, we completed the acquisition of Oxford, whose results are presented in 2013 from the date of acquisition through December 31, 2013.
|
|
(8)
|
On October 23, 2012, we completed the acquisition of Riverwalk, whose results are presented in 2012 from the date of acquisition through December 31, 2012.
|
|
(9)
|
On December 16, 2010, we completed the acquisition of Harlow's, whose results are presented in 2010 from the date of acquisition through December 31, 2010.
|
42
|
ITEM 7.
|
MANAGEMENT’S DISCUSSION AND ANALYSIS OF FINANCIAL CONDITION AND RESULTS OF OPERATIONS
|
Information set forth in this discussion and analysis contains various “forward-looking statements” within the meaning of Section 27A of the Securities Act of 1933 and Section 21E of the Securities Exchange Act of 1934. The Private Securities Litigation Reform Act of 1995 (the “Reform Act”) provides certain “safe harbor” provisions for forward-looking statements. All forward-looking statements made in this Annual Report on Form 10-K are made pursuant to the Reform Act. The reader is cautioned that such forward-looking statements are based on information available at the time and/or management’s good faith belief with respect to future events, and are subject to risks and uncertainties that could cause actual performance or results to differ materially from those expressed in the statements. Forward-looking statements speak only as of the date the statement was made. We assume no obligation to update forward-looking information to reflect actual results, changes in assumptions or changes in other factors affecting forward-looking information. Forward-looking statements are typically identified by the use of terms such as “anticipate,” “believe,” “could,” “estimate,” “expect,” “intend,” “may,” “might,” “plan,” “predict,” “project,” “should,” “will,” and similar words, although some forward-looking statements are expressed differently. Although we believe that the expectations reflected in such forward-looking statements are reasonable, we can give no assurance that such expectations will prove to be correct. Important factors that could cause actual results to differ materially from expectations include those factors described in Item 1A. “Risk Factors” of this Annual Report on Form 10-K.
You should read this discussion with the financial statements and other financial information included in this report. Our significant accounting policies are described in Note 1 to the Consolidated Financial Statements included in Item 8 of this Annual Report on Form 10-K.
Overview
We are a diversified provider of pari-mutuel horseracing, casino gaming, entertainment, and the country’s premier source of online account wagering on horseracing events.
We operate in four operating segments as follows:
|
1.
|
Racing Operations, which includes:
|
|
•
|
Churchill Downs Racetrack (“Churchill Downs”) in Louisville, Kentucky, an internationally known thoroughbred racing operation and home of the Kentucky Derby since 1875;
|
|
•
|
Arlington International Race Course (“Arlington”), a thoroughbred racing operation in Arlington Heights along with
eleven
off-track betting facilities (“OTBs”) in Illinois;
|
|
•
|
Calder Race Course (“Calder”), a thoroughbred racing operation in Miami Gardens, Florida; and
|
|
•
|
Fair Grounds Race Course (“Fair Grounds”), a thoroughbred racing operation in New Orleans along with
twelve
OTBs in Louisiana.
|
|
2.
|
Gaming, which includes:
|
|
•
|
Oxford Casino ("Oxford") in Oxford, Maine, which we acquired on July 17, 2013. Oxford operates approximately
850
slot machines,
26
table games and various dining facilities;
|
|
•
|
Riverwalk Casino Hotel ("Riverwalk") in Vicksburg, Mississippi, which we acquired on October 23, 2012. Riverwalk operates approximately
710
slot machines,
22
table games, a five story, 80-room attached hotel, multi-functional event center and dining facilities;
|
|
•
|
Harlow’s Casino Resort & Spa (“Harlow’s”) in Greenville, Mississippi, which operates approximately
750
slot machines,
13
table games, a five-story, 105-room attached hotel, multi-functional event center, pool, spa and dining facilities;
|
|
•
|
Calder Casino, a slot facility in Florida adjacent to Calder, which operates approximately
1,140
slot machines and includes a poker room operation branded “Studz Poker Club”;
|
|
•
|
Fair Grounds Slots, a slot facility in Louisiana adjacent to Fair Grounds, which operates approximately
620
slot machines; and
|
|
•
|
Video Services, LLC (“VSI”), the owner and operator of approximately
780
video poker machines in Louisiana.
|
|
3.
|
Online Business, which includes:
|
43
|
•
|
TwinSpires, an Advance Deposit Wagering (“ADW”) business that is licensed as a multi-jurisdictional simulcasting and interactive wagering hub in the state of Oregon;
|
|
•
|
Fair Grounds Account Wagering (“FAW”), an ADW business that is licensed in the state of Louisiana;
|
|
•
|
Velocity, a business that is licensed in the British Dependency Isle of Man focusing on high wagering-volume international customers;
|
|
•
|
Luckity, an ADW business launched during October 2012 that offers real-money bingo with outcomes based on and determined by pari-mutuel wagers on live horseraces;
|
|
•
|
Bloodstock Research Information Services (“BRIS”), a data service provider for the equine industry; and
|
|
•
|
Our equity investment in HRTV, LLC (“HRTV”), a horseracing television channel.
|
|
4.
|
Other Investments, which includes:
|
|
•
|
United Tote Company and United Tote Canada (collectively “United Tote”), which manufactures and operates pari-mutuel wagering systems for racetracks, OTBs and other pari-mutuel wagering businesses;
|
|
•
|
Bluff Media ("Bluff"), a multimedia poker content brand and publishing company, acquired by the Company on February 10, 2012;
|
|
•
|
Our equity investment in Miami Valley Gaming & Racing, LLC ("MVG"), a 50% joint venture harness racetrack and video lottery terminal facility in Lebanon, Ohio, which opened December 12, 2013. MVG has
1,600
video lottery terminals, a racing simulcast center and a harness racetrack; and
|
|
•
|
Our other minor investments.
|
In order to evaluate the performance of these operating segments internally, we use Adjusted EBITDA (defined as earnings before interest, taxes, depreciation, amortization, insurance recoveries net of losses, Horse Racing Equity Trust Fund ("HRE Trust Fund") proceeds, share-based compensation expenses, pre-opening expenses, the impairment of assets and other charges or recoveries). Adjusted EBITDA also includes 50% of the operating income or loss of our joint venture, MVG. We believe that the use of Adjusted EBITDA as a key performance measure of the results of operations enables management and investors to evaluate and compare from period to period our operating performance in a meaningful and consistent manner.
During the year ended December 31, 2013, total handle for the pari-mutuel industry, according to figures published by Equibase, increased 0.1 % compared to the same period of 2012. TwinSpires handle increased $8.9 million, or 1%, during the year ended December 31, 2013, as compared to the same period of 2012. Excluding the impact from Illinois and Texas, handle increased 6% primarily due to an 18% increase in new players.
During 2012, legislation providing for an extension of ADW operations in Illinois subsequent to the December 31, 2012, sunset date failed to pass the legislature prior to adjournment of the 2012 legislative session. TwinSpires ceased accepting wagers from Illinois residents on January 18, 2013, based upon the request of the Illinois Racing Board ("IRB"). On June 7, 2013, TwinSpires resumed accepting wagers from Illinois residents. During 2013, handle wagered by Illinois residents decreased $25.0 million or 2.9% of total Online Business handle, as compared to the same period of 2012. As further discussed in Part I Item 3. Legal Proceedings, on September 25, 2013, we suspended wagering from all Texas accounts and returned deposited funds to Texas residents. This resulted in a decrease of $11.7 million, or 1.4%, of total Online Business handle, as compared to the same period of 2012.
Pari-mutuel handle from our Racing Operations decreased $220.0 million, or 11%, during the year ended December 31, 2013, compared to the same period of 2012, primarily due to the loss of Florida hosting revenues, the IRB appointing eighteen fewer host days to Arlington and unfavorable weather conditions at Fair Grounds that resulted in fifty-four fewer turf races carded as compared to the same period of 2012.
We believe that, despite uncertain economic conditions as well as regulatory and legislative challenges, we are in a strong financial position. As of December 31, 2013, there was $425 million of borrowing capacity available under our senior secured credit facility. To date, we have not experienced any limitations in our ability to access this source of liquidity.
Recent Developments
Senior Unsecured Note Offering
On December 16, 2013, the Company completed the private placement of $300 million 5.375% senior unsecured notes ("Senior Unsecured Notes"). The Senior Unsecured Notes are senior unsecured obligations which are guaranteed by each of our domestic subsidiaries that guarantee our senior secured credit facility. We used the net proceeds from the offering to repay a portion of
44
our outstanding borrowings under our senior secured credit facility, including fees incurred with the Senior Unsecured Notes offering.
Miami Valley Gaming & Racing Joint Venture
On December 12, 2013, MVG, our 50% joint venture with Delaware North Companies Gaming & Entertainment Inc. ("DNC"), opened a new gaming facility located in Lebanon, Ohio. MVG features 1,600 video lottery terminals, a racing simulcast center, and a 5/8-mile harness racetrack which can accommodate more than 1,000 harness-racing fans in an indoor grandstand. Our investment in the joint venture was financed with borrowings under our senior secured credit facility.
Oxford Casino Acquisition
On July 17, 2013, we completed our acquisition of Oxford Casino (“Oxford”) in Oxford, Maine for cash consideration of approximately $168.6 million. The transaction included the acquisition of a 25,000-square-foot casino with approximately 800 slot machines, 22 table games and various dining facilities on approximately 130 acres of land. The acquisition continued our diversification and growth strategies to invest in assets with rates of returns attractive to our shareholders. We financed the acquisition with borrowings under our senior secured credit facility. During December 2013, we expanded the Oxford facility to include an additional 46 slot machines and four table games. An additional twelve slot machines will be added to the facilities during 2014.
Horse Racing Equity Trust Fund
Beginning in 2009, we received payments from the HRE Trust Fund related to subsidies paid by the original nine Illinois riverboat casinos in accordance with Illinois Public Acts 94-804 and 95-1008. The HRE Trust Fund was established to fund operating and capital improvements at Illinois racetracks via a 3% “surcharge” on revenues of Illinois riverboat casinos that meet a predetermined revenue threshold. The funds were to be distributed with approximately 58% of the total to be used for horsemen’s purses and the remaining monies to be distributed to Illinois racetracks. The monies received from the Public Acts were placed into an Arlington Park escrow account due to a temporary restraining order (“TRO”) pending the resolution of a lawsuit brought by certain Illinois casinos that were required to pay funds to the HRE Trust Fund. In August 2011, the stay of dissolution expired and the TRO was dissolved, which terminated the restrictions on our ability to access the funds from the HRE Trust Fund held in the escrow account. As of December 31, 2012, we had received $45.4 million in proceeds, of which $26.1 million was designated for Arlington purses. We used the remaining $19.3 million of the proceeds to improve, market, and maintain or otherwise operate the Arlington racing facility in order to conduct live racing.
On June 3, 2013, Arlington received the final disbursement related to the original nine riverboat licensees under the HRE Trust Fund. Arlington received $0.7 million in proceeds, of which $0.4 million was designated for Arlington purses and the remaining $0.3 million was recognized as miscellaneous other income in our Consolidated Statements of Comprehensive Income during the year ended December 31, 2013.
Horse Racing Equity Trust Fund—Tenth Riverboat License
Under legislation enacted in 1999, the HRE Trust Fund was scheduled to receive amounts equal to 15% of the adjusted gross receipts generated by a tenth riverboat casino license to be granted in Illinois. The funds were to be distributed to racetracks in Illinois for purses as well as racetrack discretionary spending. During December 2008, the Illinois Gaming Board awarded the tenth riverboat license to a casino in Des Plaines, Illinois. This casino opened during July 2011, entitling the Illinois racing industry to receive an amount equal to 15% of the adjusted gross receipts of this casino from the gaming taxes generated by that casino, once the accumulated funds were appropriated by the state.
On July 10, 2013, the Governor of Illinois signed Illinois House Bill 214 into law, providing for the release of $23.0 million of funds collected from the tenth riverboat licensee since its opening during 2011. During the year ended December 31, 2013, Arlington received $7.9 million as its share of the proceeds, of which $3.6 million was designated for Arlington purses. The remaining $4.2 million was recognized as miscellaneous other income in our Consolidated Statements of Comprehensive Income during the year ended December 31, 2013. No additional proceeds related to future funds of the tenth riverboat are expected to be distributed to Illinois racetracks under the provisions of House Bill 214.
Florida Race Dates and Host Tracks
On February 28, 2013, Calder and Gulfstream Park submitted amended applications to the Florida Department of Business and Professional Regulation, Division of Pari-Mutuel Wagering (the “Division”) for the twelve month racing season beginning July 1, 2013. The Division approved Calder’s live race meet to run three days a week (Friday through Sunday) from July 1, 2013, to June 30, 2014, and Gulfstream Park’s live race meet to run from July 1, 2013 to June 30, 2014. Pursuant to the licenses granted, Calder and Gulfstream Park will simultaneously conduct live thoroughbred racing, in certain months, during 2013 and 2014. During 2013, this overlapping of live racing has resulted in direct competition for on-track horseracing, in the intrastate and interstate simulcast markets and for horses in South Florida, which negatively affected Calder’s ability to achieve full field horse
45
races and to generate handle on live racing. On July 6, 2013, Calder and Gulfstream Park conducted their first simultaneous live racing performances, and both racetracks are scheduled to continue to overlap live racing on certain dates through June 2014.
Previously in Florida, a thoroughbred racetrack conducting a live racing meet had control over hosting out-of-state signals, and received commissions on wagers placed at other racetracks throughout the state. There were instances where one or more thoroughbred racetracks operated live meets concurrently, and in that instance each racetrack had the opportunity to be a “host” track for out-of-state interstate horseracing signals. When two or more thoroughbred racetracks operate live meets concurrently, other wagering sites must choose a live racetrack to host their pari-mutuel wagering. Three Florida thoroughbred racetracks, including Calder, have historically served as the host track based on their live racing calendar. On May 7, 2013, all of Florida’s three thoroughbred racetracks began claiming that they were host tracks on a year round basis.
On May 24, 2013, Calder filed a petition with the Florida Division of Administrative Hearings (the “DOAH”) challenging the other racetracks' interpretation that they may conduct interstate simulcasting, and whether it is a valid interpretation of state law and the IHA. Calder believes that Florida statutes require at least three days of live racing per week to be considered a host track. Three days prior to the hearing, the Division moved to abate the case and go to rulemaking, which was granted. On June 28, 2013, a rule workshop was held, comments were submitted, and the Division had until July 26, 2013, to notify the Administrative Law Judge at the DOAH of the progress of the rulemaking of the Division. On July 23, 2013, the Division proposed a modification to state law which would permit multiple hosts, if the racetracks conducted at least two days of live racing per week.
On October 14, 2013, the Florida Legislature Joint Administrative Procedures Committee (the “Committee”) issued a letter to the Division challenging the Division’s authority to interpret Florida statutes and to permit thoroughbred racetracks to operate fewer than three live racing days per week to be considered host tracks. A public hearing on November 7, 2013 was held by the Division to address the Division’s proposed rules and after taking comments from thoroughbred permit holders and other interested parties, the Division issued a Notice of Change on November 27, 2013 that thoroughbred permit holders must conduct three days of live racing per week in order to qualify as a host track. The Division has scheduled a rule hearing on March 6, 2014 to promulgate a rule which will further define thoroughbred hosting eligibility in Florida. Until Florida legal and regulatory matters related to this issue are resolved, we do not fully know the long-term implications of overlapping race dates on our business, financial condition and results of operations.
For the year ended December 31, 2013, Calder revenues declined approximately $28.6 million due to the impact of multiple host tracks and fewer live race days. For the year ended December 31, 2013, Calder Adjusted EBITDA declined $9.0 million, of which approximately $6.3 million was associated with the loss of hosting revenues, net of purses, $1.8 million was associated with fewer live race days and $0.9 million with other ancillary items.
Amendment of Senior Secured Credit Facility
On May 17, 2013, we entered into an amendment to our Senior Secured Credit Facility which amended certain provisions of the credit agreement including increasing the maximum aggregate commitment from $375 million to $500 million. The Senior Secured Credit Facility also provides for an accordion feature which, if exercised, could increase the maximum aggregate commitment by up to an additional $225 million and reduce the pricing schedule for outstanding borrowings and commitment fees across all leverage pricing levels. The guarantors under the Senior Secured Credit Facility continue to be a majority of the Company’s wholly-owned subsidiaries. We incurred loan origination costs of $2.3 million in connection with this amendment, which were capitalized and are being amortized as interest expense over the remaining term of the Senior Secured Credit Facility. The Senior Secured Credit Facility matures on May 17, 2018.
Generally, borrowings made pursuant to the Senior Secured Credit Facility bear interest at a LIBOR-based rate per annum plus an applicable percentage ranging from 1.125% to 3.0% depending on our total leverage ratio. In addition, under the Senior Secured Credit Facility, we agreed to pay a commitment fee at rates that range from 0.175% to 0.45% of the available aggregate commitment, depending on our leverage ratio.
The Senior Secured Credit Facility contains customary affirmative and negative covenants for credit facilities of this type, including limitations on the Company and its subsidiaries with respect to indebtedness, restricted payments, liens, investments, mergers and acquisitions, disposition of assets, sale-leaseback transactions and transactions with affiliates. The covenants permit us to use proceeds of the credit extended under the agreement for general corporate purposes, restricted payments and acquisition needs. The Senior Secured Credit Facility also contains financial covenants that require us (i) to maintain an interest coverage ratio (i.e., consolidated adjusted EBITDA to consolidated interest expense) that is greater than 3.0 to 1.0; (ii) not to permit the total leverage ratio (i.e., total consolidated funded indebtedness to consolidated adjusted EBITDA) to be greater than 4.5 to 1.0, provided that if a certain minimum consolidated adjusted EBITDA is reached then the total leverage ratio will be increased to 5.0 to 1.0 for such periods that the minimum is maintained; and (iii) not to permit the senior secured leverage ratio (i.e. senior secured consolidated funded indebtedness to consolidated adjusted EBITDA) to be greater than 3.5 to 1.0. As of December 31, 2013, we were in compliance with all covenants under the Senior Secured Credit Facility, and substantially all of our assets continue to be pledged as collateral under the facility.
46
Stock Repurchase Program
On April 23, 2013, the Company’s Board of Directors authorized the repurchase of up to $100 million of our stock in a stock repurchase program. We may repurchase stock in open market purchases or through privately negotiated transactions in compliance with Securities and Exchange Commission Rule 10b-18, subject to market conditions, applicable legal requirements and other relevant factors. We expect to fund repurchases using available cash and borrowings under our Senior Secured Credit Facility. We are not obligated to purchase any stock under the stock repurchase program, and purchases may be discontinued, or the stock repurchase program may be modified or suspended at any time prior to the termination of the repurchase program on December 31, 2015. During the year ended December 31, 2013, the Company did not repurchase any shares of stock under this program.
Long-Term Incentive Plan
During February 2013, the Board of Directors approved the terms and conditions of performance share awards issued pursuant to the Churchill Downs Incorporated 2007 Omnibus stock incentive plan (the “New Company LTIP”). As a way to continue to encourage innovation, an entrepreneurial approach, and careful risk assessment, and in order to retain key executives, the New Company LTIP offers long-term incentive compensation to our named executive officers and other key executives (“Grantees”) as reported in our Schedule 14A Proxy Statement filing, with the exception of our Chairman of the Board and Chief Executive Officer.
Illinois Income Taxes
During October 2012, we funded a $2.9 million income tax payment to the State of Illinois related to a dispute over state income tax apportionment methodology which was recorded as an other asset since we believe this amount will be recoverable in a future period. We filed our state income tax returns related to the years 2002 through 2005 following the methodology prescribed by Illinois statute, however the State of Illinois has taken a contrary tax position. We filed a formal protest with the State of Illinois during the fourth quarter of 2012, and on October 11, 2013, depositions were taken from the plaintiffs. We do not expect this issue to have a material, adverse effect on our business, financial condition and results of operations.
Kentucky Hailstorm
On April 28, 2012, a hailstorm caused damage to portions of Louisville, Kentucky including Churchill Downs Racetrack and its separate training facility known as Trackside Louisville. Both locations sustained damage to their stable areas as well as damages to administrative offices and several other structures. We carry property and casualty insurance, subject to a $0.5 million deductible. During the year ended December 31, 2012, we recorded a reduction of property and equipment of $0.6 million and received $1.1 million from our insurance carriers in partial settlement of our claim. We are currently working with our insurance carriers to finalize our claim and received an additional $0.4 million during the year ended December 31, 2013, which we recognized as a component of operating income during the year ended December 31, 2013.
Legislative and Regulatory Changes
Please refer to subheading “K. Legislative Changes” in Item 1. “Business” of this Annual Report on Form 10-K for information regarding legislative and regulatory changes.
Critical Accounting Policies and Estimates
Our Consolidated Financial Statements have been prepared in conformity with accounting principles generally accepted in the United States. Accordingly, we are required to make estimates, judgments and assumptions that we believe are reasonable based on our historical experience, contract terms, observance of known trends in our Company and the industry as a whole and information available from other outside sources. Our estimates affect the reported amounts of assets and liabilities and related disclosures of contingent assets and liabilities at the date of the financial statements and the reported amounts of revenues and expenses during the reporting period. Actual results may differ from those initial estimates.
Our most significant estimates relate to the valuation of property and equipment, goodwill and other intangible assets, which may be significantly affected by changes in the regulatory environment in which we operate, and to the aggregate costs for self-insured liability and workers’ compensation claims. Additionally, estimates are used for determining income tax liabilities.
We review the carrying values of goodwill at least annually during the first quarter of each year or whenever events or changes in circumstances indicate that the carrying value of these assets may not be recoverable. In 2012, in connection with our annual impairment test, we adopted ASU No. 2011-08,
Intangibles-Goodwill and Other: Testing Goodwill for Impairment
which allows an entity the option to first assess qualitative factors to determine whether the existence of events or circumstances leads to a determination that it is more likely than not that the fair value of a reporting unit is less than its carrying amount. If, after assessing the totality of events or circumstances, an entity determines it is more likely than not that the fair value of a reporting
47
unit is less than the carrying amount, then the Company would perform a two step goodwill impairment test. The first step, used to identify potential impairment, is a comparison of the reporting unit's estimated fair value to its carrying value, including goodwill. If the fair value of the reporting unit exceeds its carrying value, applicable goodwill is considered not to be impaired. If the carrying value exceeds fair value, there is an indication of impairment and the second step is performed to measure the amount of the impairment, if any. The second step requires the Company to calculate an implied fair value of goodwill at the reporting unit level. If the goodwill assigned to a reporting unit exceeds the implied fair value of the goodwill, an impairment charge is recorded for the excess.
Our 2013 annual goodwill impairment analysis included an assessment of certain qualitative factors including but not limited to macroeconomic, industry and market conditions; cost factors that have a negative effect on earnings; overall financial performance; the movement of the Company's share price; and other relevant entity and reporting unit specific events. We considered the qualitative factors and weighted the evidence obtained and determined that it is not more likely than not that the fair value of any reporting unit is less than its carrying amount. None of our reporting units were considered to be "at risk" of failing step one of the 2013 annual goodwill impairment test. Although we believe the factors considered in the impairment analysis are reasonable, significant changes in any one of our assumptions could produce a significantly different result. In prior years, our assessment of goodwill impairment was largely dependent on estimates of future cash flows at the aggregated reporting unit level, and a weighted-average cost of capital. The estimates of these future cash flows were based on assumptions and projections with respect to future revenues and expenses believed to be reasonable and supportable at the time the annual impairment analysis was performed. Further they required management's judgments and took into account assumptions about overall growth rates and increases in expenses.
We consider our slots gaming rights and trademark intangible assets as indefinite-lived intangible assets that do not require amortization based on our future expectations to operate our gaming facilities indefinitely, as well as our historical experience in renewing these intangible assets at minimal cost with various state gaming commissions. Rather, these intangible assets are tested annually, or more frequently, if indicators of impairment exist, for impairment by comparing the fair value of the recorded assets to their carrying amount. If the carrying amount of the slots gaming rights and trademark intangible assets exceed their fair value, an impairment loss is recognized.
In March 2013, we adopted ASU No. 2012-02, Intangibles-Goodwill and Other: Testing Indefinite-Lived Intangible Assets for Impairment. ASU 2012-02 simplifies indefinite-lived intangible asset impairment testing by adding a qualitative review step to assess whether a quantitative impairment analysis is necessary. Under the amended rule, a testing methodology similar to that which is performed for goodwill impairment testing is acceptable for assessing a company's indefinite-lived intangible assets. We completed the required annual impairment tests of indefinite-lived intangible assets as of March 31, 2013, and no adjustment to the carrying value of indefinite-lived intangible assets was required. We assessed our indefinite-lived intangible assets by qualitatively evaluating events and circumstances that have both positive and negative factors, including macroeconomic conditions, industry events, financial performance and other changes and concluded that it was more likely than not that the fair value of our indefinite-lived intangible assets was greater than their carrying value.
We assign estimated useful lives to our definite-lived intangible assets based on the period of time the asset is expected to contribute directly or indirectly to future cash flows. We consider certain factors when assigning useful lives such as legal, regulatory, competition and other economic factors. Intangible assets with definite lives are amortized using the straight-line method.
While we believe that our estimates of future revenues and cash flows are reasonable, different assumptions could materially affect our assessment of useful lives and fair values. Changes in assumptions may cause modifications to our estimates for amortization or impairment, thereby impacting our results of operations. If the estimated lives of our definite-lived intangible assets were to decrease based on the factors mentioned above, amortization expense could increase significantly.
Our business can be impacted positively and negatively by legislative and regulatory changes, by economic conditions and by gaming competition. A significant negative impact from these activities could result in a significant impairment of our property and equipment and/or our goodwill and indefinite-lived intangible assets. We perform reviews for the impairment of long-lived assets whenever events or changes in circumstances indicate that the carrying amount of an asset, or asset group, may not be recoverable. If the estimated undiscounted future cash flows expected to result from the use of the assets and their eventual disposition are insufficient to recover the carrying value of the assets, than an impairment loss is recognized based upon the excess of the carrying value of the assets over the fair value of the assets. An impairment review incorporates estimates of forecasted revenue and costs that may be associated with an asset as well as the expected periods that the asset, or asset group, may be utilized. Fair value is determined based on the highest and best use of the assets considered from the perspective of market participants, which may be different than our actual intended use of the asset, or asset group.
Additional information regarding how our business can be impacted by competition and legislative changes is included in subheading “J. Competition” and subheading “K. Legislative Changes”, respectively, in Item 1. “Business” of this Annual Report on Form 10-K.
48
In connection with losses incurred from natural disasters, insurance proceeds are collected on existing business interruption and property and casualty insurance policies. When losses are sustained in one period and the amounts to be recovered are collected in a subsequent period, management uses estimates and judgment to determine the amounts that are probable of recovery under such policies. Estimated losses, net of anticipated insurance recoveries, are recognized in the period the natural disaster occurs and the amount of the loss is determinable. Insurance recoveries in excess of estimated losses are recognized when realizable.
We also use estimates and judgments for financial reporting to determine our current tax liability, as well as those taxes deferred until future periods. Net deferred and accrued income taxes represent significant assets and liabilities of the Company. In accordance with the liability method of accounting for income taxes, we recognize the amount of taxes payable or refundable for the current year and deferred tax assets and liabilities for the future tax consequences of events that have been recognized in our consolidated financial statements or tax returns.
Adjustments to deferred taxes are determined based upon changes in differences between the book basis and tax basis of our assets and liabilities, measured by enacted tax rates we estimate will be applicable when these differences are expected to reverse. Changes in current tax laws, enacted tax rates or the estimated level of taxable income or non-deductible expenses could change the valuation of deferred tax assets and liabilities and affect the overall effective tax rate and tax provision.
During the year ended December 31, 2013, our business insurance renewals included substantially the same coverage and retentions as in previous years. We estimate insurance liabilities for workers’ compensation and general liability losses based on our historical loss experience, certain actuarial assumptions of loss development factors and current industry trends. Any changes in our assumptions, actuarial assumptions or loss experience could impact our total insurance cost and overall results of operations.
Our significant accounting policies and recently adopted accounting policies are more fully described in Note 1 to the Consolidated Financial Statements included in Item 8. “Financial Statements and Supplementary Data” of this Annual Report on Form 10-K.
Consolidated Net Revenues
Our net revenues and earnings are influenced by our racing calendar. Therefore, revenues and operating results for any interim quarter are not generally indicative of the revenues and operating results for the year, and may not be comparable with results for the corresponding period of the previous year. We historically have had fewer live racing days during the first quarter of each year, and the majority of our live racing revenue occurs during the second quarter, with the running of the Kentucky Derby and Kentucky Oaks. Information regarding racing dates at our facilities for 2014 and 2013 is included in Subheading “C. Live Racing” in Item 1. “Business” of this Annual Report on Form 10-K.
Our Consolidated Statements of Comprehensive Income include net revenues and operating expenses associated with our Racing Operations, Gaming, Online Business and Other Investments operating segments and are defined as follows:
Racing:
net revenues and corresponding operating expenses associated with commissions earned on wagering at the Company’s racetracks, OTBs and simulcast fees earned from other wagering sites. In addition, amounts include ancillary revenues and expenses generated by the pari-mutuel facilities including admissions, sponsorships and licensing rights, food and beverage sales and fees for the alternative uses of its facilities.
Gaming:
net revenues and corresponding operating expenses generated from slot machines, table games and video poker. In addition, it includes ancillary revenues and expenses generated by food and beverage sales, hotel operations revenue and miscellaneous other revenue.
Online:
net revenues and corresponding operating expenses generated by the Company’s ADW business from wagering through the Internet, telephone or other mobile devices on pari-mutuel events. In addition, it includes the Company's information business that provides data information and processing services to the equine industry.
Other:
net revenues and corresponding operating expenses generated by United Tote, the Company’s provider of pari-mutuel wagering systems and Bluff.
During the year ended December 31, 2013, we sold Fight! Magazine, a division of Bluff and reported the loss on sale and results of operations for the year ended December 31, 2013, as discontinued operations. Net revenues, operating expenses and income tax benefit of Fight! Magazine for the year ended December 31, 2012 have been reclassified to discontinued operations to conform to the current year presentation.
During the year ended December 31, 2012, the Company merged the operations of Churchill Downs Simulcast Productions ("CDSP"), the Company's provider of television production services, which was previously included in our Other Investments operating segment, with its Racing Operations operating segment. Net revenues and operating expenses of CDSP for the year ended December 31, 2011 have been reclassified to conform to the current year presentation. There was no impact from these reclassifications on consolidated net revenues, operating income, results of continuing operations, or cash flows.
49
Pari-mutuel revenues are recognized upon occurrence of the live race that is presented for wagering and after that live race is made official by the respective state’s racing regulatory body. Gaming revenues represent net gaming wins, which is the difference between gaming wins and losses. Other operating revenues such as admissions, programs and concession revenues are recognized once delivery of the product or service has occurred.
Our customer loyalty programs offer incentives to customers who wager at the Company’s racetracks, through our advance deposit wagering platform, TwinSpires.com, or at our gaming facilities. The TSC Elite program, which was introduced during the year ended December 31, 2012, to replace the previous program, TwinSpires Club, is offered for pari-mutuel wagering at the Company’s racetracks or through TwinSpires.com. The Player’s Club is offered at the Company’s gaming facilities in Louisiana, Florida, Mississippi and Maine. Under the programs, customers are able to accumulate points over time that they may redeem for cash, free play, merchandise or food and beverage items at their discretion under the terms of the programs. As a result of the ability of the customer to accumulate points, we accrue the cost of points, after consideration of estimated forfeitures, as they are earned. Under the TSC Elite program, the estimated value of the cost to redeem points is recorded as the points are earned. To arrive at the estimated cost associated with points, estimates and assumptions are made regarding incremental costs of the benefits, rates and the mix of goods and services for which points will be redeemed. Under the Player’s Club program, the retail value of the points-based cash awards or complimentary goods and services is netted against revenue as a promotional allowance. The reward point liabilities were
$2.1 million
for each of the years ended December 31, 2013 and 2012.
Approximately
42%
of our annual revenues are generated by pari-mutuel wagering on live and simulcast racing content through OTBs and ADW providers. Live racing handle includes patron wagers made on live races at our racetracks and also wagers made on imported simulcast signals by patrons at our racetracks during live meets. Import simulcasting handle includes wagers on imported signals at our racetracks when the respective tracks are not conducting live racing meets, at our OTBs and through our ADW providers throughout the year. Export handle includes all patron wagers made on live racing signals sent to other tracks, OTBs and ADW providers. Advance deposit wagering consists of patron wagers through an advance deposit account.
We retain as revenue a pre-determined percentage or commission on the total amount wagered, and the balance is distributed to the winning patrons. The gross percentages earned approximated 10% of handle for our Racing Operations and 20% of handle for our Online Business.
Certain key operating statistics specific to the gaming industry are included in our discussion of performance of the gaming segment. Our slot facilities report slot handle as a volume measurement, defined as the gross amount wagered or coins placed into slot machines in aggregate for the period cited. In addition, our slot facilities and video poker operations report net win per unit, which is calculated as gross gaming revenues, less customer payouts and free play, per machine and per day of operations.
50
RESULTS OF CONTINUING OPERATIONS
Pari-mutuel Handle
The following table sets forth, for the periods indicated, pari-mutuel financial handle information (in thousands):
|
|
Year Ended December 31,
|
‘13 vs. ‘12 Change
|
‘12 vs. ‘11 Change
|
||||||||||||||||||||||
|
|
2013
|
2012
|
2011
|
$
|
%
|
$
|
%
|
||||||||||||||||||
|
Racing and Online Operations:
|
|||||||||||||||||||||||||
|
Churchill Downs
|
|||||||||||||||||||||||||
|
Total handle
|
$
|
663,689
|
|
$
|
596,613
|
|
$
|
603,328
|
|
$
|
67,076
|
|
11
|
%
|
$
|
(6,715
|
)
|
(1
|
)%
|
||||||
|
Net pari-mutuel revenues
|
$
|
57,002
|
|
$
|
53,538
|
|
$
|
52,851
|
|
$
|
3,464
|
|
6
|
%
|
$
|
687
|
|
1
|
%
|
||||||
|
Commission %
|
8.6
|
%
|
9.0
|
%
|
8.8
|
%
|
|||||||||||||||||||
|
Arlington
|
|||||||||||||||||||||||||
|
Total handle
|
$
|
527,339
|
|
$
|
563,220
|
|
$
|
547,600
|
|
$
|
(35,881
|
)
|
(6
|
)%
|
$
|
15,620
|
|
3
|
%
|
||||||
|
Net pari-mutuel revenues
|
$
|
55,509
|
|
$
|
60,825
|
|
$
|
60,343
|
|
$
|
(5,316
|
)
|
(9
|
)%
|
$
|
482
|
|
1
|
%
|
||||||
|
Commission %
|
10.5
|
%
|
10.8
|
%
|
11.0
|
%
|
|||||||||||||||||||
|
Calder
|
|||||||||||||||||||||||||
|
Total handle
|
$
|
320,036
|
|
$
|
533,168
|
|
$
|
534,940
|
|
$
|
(213,132
|
)
|
(40
|
)%
|
$
|
(1,772
|
)
|
—
|
%
|
||||||
|
Net pari-mutuel revenues
|
$
|
32,737
|
|
$
|
61,042
|
|
$
|
59,151
|
|
$
|
(28,305
|
)
|
(46
|
)%
|
$
|
1,891
|
|
3
|
%
|
||||||
|
Commission %
|
10.2
|
%
|
11.4
|
%
|
11.1
|
%
|
|||||||||||||||||||
|
Fair Grounds
|
|||||||||||||||||||||||||
|
Total handle
|
$
|
294,991
|
|
$
|
333,033
|
|
$
|
340,784
|
|
$
|
(38,042
|
)
|
(11
|
)%
|
$
|
(7,751
|
)
|
(2
|
)%
|
||||||
|
Net pari-mutuel revenues
|
$
|
31,123
|
|
$
|
34,018
|
|
$
|
35,689
|
|
$
|
(2,895
|
)
|
(9
|
)%
|
$
|
(1,671
|
)
|
(5
|
)%
|
||||||
|
Commission %
|
10.6
|
%
|
10.2
|
%
|
10.5
|
%
|
|||||||||||||||||||
|
Total Racing Operations
|
|||||||||||||||||||||||||
|
Total handle
|
$
|
1,806,055
|
|
$
|
2,026,034
|
|
$
|
2,026,652
|
|
$
|
(219,979
|
)
|
(11
|
)%
|
$
|
(618
|
)
|
—
|
%
|
||||||
|
Net pari-mutuel revenues
|
$
|
176,371
|
|
$
|
209,423
|
|
$
|
208,034
|
|
$
|
(33,052
|
)
|
(16
|
)%
|
$
|
1,389
|
|
1
|
%
|
||||||
|
Commission %
|
9.8
|
%
|
10.3
|
%
|
10.3
|
%
|
|||||||||||||||||||
|
Online Business
(1) (2)
|
|||||||||||||||||||||||||
|
Total handle
|
$
|
868,735
|
|
$
|
859,841
|
|
$
|
775,288
|
|
$
|
8,894
|
|
1
|
%
|
$
|
84,553
|
|
11
|
%
|
||||||
|
Net pari-mutuel revenues
|
$
|
166,933
|
|
$
|
168,795
|
|
$
|
155,006
|
|
$
|
(1,862
|
)
|
(1
|
)%
|
$
|
13,789
|
|
9
|
%
|
||||||
|
Commission %
|
19.2
|
%
|
19.6
|
%
|
20.0
|
%
|
|||||||||||||||||||
|
Eliminations
(1)
|
|||||||||||||||||||||||||
|
Total handle
|
$
|
(133,746
|
)
|
$
|
(137,683
|
)
|
$
|
(125,571
|
)
|
$
|
3,937
|
|
(3
|
)%
|
$
|
(12,112
|
)
|
10
|
%
|
||||||
|
Net pari-mutuel revenues
|
$
|
(12,495
|
)
|
$
|
(13,157
|
)
|
$
|
(11,542
|
)
|
$
|
662
|
|
(5
|
)%
|
$
|
(1,615
|
)
|
14
|
%
|
||||||
|
Total
|
|||||||||||||||||||||||||
|
Handle
|
$
|
2,541,044
|
|
$
|
2,748,192
|
|
$
|
2,676,369
|
|
$
|
(207,148
|
)
|
(8
|
)%
|
$
|
71,823
|
|
3
|
%
|
||||||
|
Net pari-mutuel revenues
|
$
|
330,809
|
|
$
|
365,061
|
|
$
|
351,498
|
|
$
|
(34,252
|
)
|
(9
|
)%
|
$
|
13,563
|
|
4
|
%
|
||||||
|
Commission %
|
13.0
|
%
|
13.3
|
%
|
13.1
|
%
|
|||||||||||||||||||
The pari-mutuel activity above is subject to the following information:
|
(1)
|
Total handle and net pari-mutuel revenues generated by Velocity are not included in total handle and net pari-mutuel revenues from the Online Business. Eliminations include the elimination of intersegment transactions.
|
|
(2)
|
Online Business handle from Illinois and Texas, to reflect the impact of recent regulatory developments, as previously described (in thousands):
|
|
Year Ended December 31,
|
‘13 vs. ‘12 Change
|
‘12 vs. ‘11 Change
|
|||||||||||||||||||||||
|
2013
|
2012
|
2011
|
$
|
%
|
$
|
%
|
|||||||||||||||||||
|
Online Business Handle:
|
|||||||||||||||||||||||||
|
Illinois
|
$
|
40,607
|
|
$
|
65,619
|
|
$
|
63,447
|
|
$
|
(25,012
|
)
|
(38
|
)%
|
$
|
2,172
|
|
3
|
%
|
||||||
|
Texas
|
42,210
|
|
53,932
|
|
46,681
|
|
(11,722
|
)
|
(22
|
)%
|
$
|
7,251
|
|
16
|
%
|
||||||||||
|
All other
|
785,918
|
|
740,290
|
|
665,160
|
|
45,628
|
|
6
|
%
|
$
|
75,130
|
|
11
|
%
|
||||||||||
|
Total
|
$
|
868,735
|
|
$
|
859,841
|
|
$
|
775,288
|
|
$
|
8,894
|
|
1
|
%
|
$
|
84,553
|
|
11
|
%
|
||||||
51
Gaming Activity
The following table sets forth, for the periods indicated, statistical gaming information (in thousands, except for average daily information):
|
|
Year Ended December 31,
|
'13 vs. '12
|
'12 vs. '11
|
||||||||||||||||||||||
|
|
2013 (1)
|
2012 (2)
|
2011 (3)
|
$
|
%
|
$
|
%
|
||||||||||||||||||
|
Calder Casino
|
|||||||||||||||||||||||||
|
Net gaming revenues
|
$
|
76,554
|
|
$
|
75,686
|
|
$
|
80,511
|
|
$
|
868
|
|
1
|
%
|
$
|
(4,825
|
)
|
(6
|
)%
|
||||||
|
Slot handle
|
$
|
1,010,840
|
|
$
|
1,008,946
|
|
$
|
1,040,655
|
|
$
|
1,894
|
|
—
|
%
|
$
|
(31,709
|
)
|
(3
|
)%
|
||||||
|
Net slot revenues
|
$
|
74,008
|
|
$
|
72,372
|
|
$
|
76,162
|
|
$
|
1,636
|
|
2
|
%
|
$
|
(3,790
|
)
|
(5
|
)%
|
||||||
|
Average daily net win per slot machine
|
$
|
169
|
|
$
|
164
|
|
$
|
173
|
|
$
|
5
|
|
3
|
%
|
$
|
(9
|
)
|
(5
|
)%
|
||||||
|
Average daily number of slot machines
|
1,201
|
|
1,207
|
|
1,209
|
|
(6
|
)
|
—
|
%
|
(2
|
)
|
—
|
%
|
|||||||||||
|
Average daily poker revenue
|
$
|
7,233
|
|
$
|
9,303
|
|
$
|
13,476
|
|
$
|
(2,070
|
)
|
(22
|
)%
|
$
|
(4,173
|
)
|
(31
|
)%
|
||||||
|
Fair Grounds Slots and Video Poker
|
|
||||||||||||||||||||||||
|
Net gaming revenues
|
$
|
76,665
|
|
$
|
76,893
|
|
$
|
75,320
|
|
$
|
(228
|
)
|
—
|
%
|
$
|
1,573
|
|
2
|
%
|
||||||
|
Slot handle
|
$
|
436,188
|
|
$
|
438,095
|
|
$
|
427,207
|
|
$
|
(1,907
|
)
|
—
|
%
|
$
|
10,888
|
|
3
|
%
|
||||||
|
Net slot revenues (4)
|
$
|
40,880
|
|
$
|
41,875
|
|
$
|
40,976
|
|
$
|
(995
|
)
|
(2
|
)%
|
$
|
899
|
|
2
|
%
|
||||||
|
Average daily net win per slot machine
|
$
|
181
|
|
$
|
185
|
|
$
|
180
|
|
$
|
(4
|
)
|
(2
|
)%
|
$
|
5
|
|
3
|
%
|
||||||
|
Average daily number of slot machines
|
620
|
|
625
|
|
625
|
|
(5
|
)
|
(1
|
)%
|
—
|
|
—
|
%
|
|||||||||||
|
Average daily video poker revenue
|
$
|
98,441
|
|
$
|
97,613
|
|
$
|
96,033
|
|
$
|
828
|
|
1
|
%
|
$
|
1,580
|
|
2
|
%
|
||||||
|
Average daily net win per video poker machine
|
$
|
130
|
|
$
|
137
|
|
$
|
129
|
|
$
|
(7
|
)
|
(5
|
)%
|
$
|
8
|
|
6
|
%
|
||||||
|
Average daily number of video poker machines
|
756
|
|
714
|
|
742
|
|
42
|
|
6
|
%
|
(28
|
)
|
(4
|
)%
|
|||||||||||
|
Oxford Casino
|
|||||||||||||||||||||||||
|
Net gaming revenues
|
$
|
32,649
|
|
$
|
—
|
|
$
|
—
|
|
$
|
32,649
|
|
F
|
|
$
|
—
|
|
NM
|
|
||||||
|
Slot handle
|
$
|
262,699
|
|
$
|
—
|
|
$
|
—
|
|
$
|
262,699
|
|
F
|
|
$
|
—
|
|
NM
|
|
||||||
|
Net slot revenues
|
$
|
26,689
|
|
$
|
—
|
|
$
|
—
|
|
$
|
26,689
|
|
F
|
|
$
|
—
|
|
NM
|
|
||||||
|
Average daily net win per slot machine
|
$
|
197
|
|
$
|
—
|
|
$
|
—
|
|
$
|
197
|
|
F
|
|
$
|
—
|
|
NM
|
|
||||||
|
Average daily number of slot machines
|
808
|
|
—
|
|
—
|
|
808
|
|
F
|
|
—
|
|
NM
|
|
|||||||||||
|
Average daily net win per table
|
$
|
1,588
|
|
$
|
—
|
|
$
|
—
|
|
$
|
1,588
|
|
F
|
|
$
|
—
|
|
NM
|
|
||||||
|
Average daily number of tables
|
23
|
|
—
|
|
—
|
|
23
|
|
F
|
|
—
|
|
NM
|
|
|||||||||||
52
|
|
Year Ended December 31,
|
'13 vs. '12
|
'12 vs. '11
|
||||||||||||||||||||||
|
|
2013 (1)
|
2012 (2)
|
2011 (3)
|
$
|
%
|
$
|
%
|
||||||||||||||||||
|
Harlow’s Casino
|
|||||||||||||||||||||||||
|
Net gaming revenues
|
$
|
49,577
|
|
$
|
54,087
|
|
$
|
51,009
|
|
$
|
(4,510
|
)
|
(8
|
)%
|
$
|
3,078
|
|
6
|
%
|
||||||
|
Slot handle
|
$
|
604,433
|
|
$
|
653,406
|
|
$
|
610,255
|
|
$
|
(48,973
|
)
|
(7
|
)%
|
$
|
43,151
|
|
7
|
%
|
||||||
|
Net slot revenues
|
$
|
45,349
|
|
$
|
49,021
|
|
$
|
46,289
|
|
$
|
(3,672
|
)
|
(7
|
)%
|
$
|
2,732
|
|
6
|
%
|
||||||
|
Average daily net win per slot machine
|
$
|
155
|
|
$
|
163
|
|
$
|
157
|
|
$
|
(8
|
)
|
(5
|
)%
|
$
|
6
|
|
4
|
%
|
||||||
|
Average daily number of slot machines
|
799
|
|
821
|
|
868
|
|
(22
|
)
|
(3
|
)%
|
(47
|
)
|
(5
|
)%
|
|||||||||||
|
Average daily poker revenue (5)
|
$
|
754
|
|
$
|
701
|
|
$
|
880
|
|
$
|
53
|
|
8
|
%
|
$
|
(179
|
)
|
(20
|
)%
|
||||||
|
Average daily net win per table
|
$
|
750
|
|
$
|
875
|
|
$
|
894
|
|
$
|
(125
|
)
|
(14
|
)%
|
$
|
(19
|
)
|
(2
|
)%
|
||||||
|
Average daily number of tables
|
15
|
|
15
|
|
15
|
|
—
|
|
—
|
%
|
—
|
|
—
|
%
|
|||||||||||
|
Riverwalk Casino
|
|||||||||||||||||||||||||
|
Net gaming revenues
|
$
|
50,513
|
|
$
|
9,914
|
|
$
|
—
|
|
$
|
40,599
|
|
F
|
|
$
|
9,914
|
|
F
|
|
||||||
|
Slot handle
|
$
|
591,975
|
|
$
|
109,787
|
|
$
|
—
|
|
$
|
482,188
|
|
F
|
|
$
|
109,787
|
|
F
|
|
||||||
|
Net slot revenues
|
$
|
47,405
|
|
$
|
9,328
|
|
$
|
—
|
|
$
|
38,077
|
|
F
|
|
$
|
9,328
|
|
F
|
|
||||||
|
Average daily net win per slot machine
|
$
|
181
|
|
$
|
181
|
|
$
|
—
|
|
$
|
—
|
|
—
|
%
|
$
|
181
|
|
F
|
|
||||||
|
Average daily number of slot machines
|
716
|
|
736
|
|
—
|
|
(20
|
)
|
(3
|
)%
|
736
|
|
F
|
|
|||||||||||
|
Average daily net win per table
|
$
|
596
|
|
$
|
616
|
|
$
|
—
|
|
$
|
(20
|
)
|
(3
|
)%
|
$
|
616
|
|
F
|
|
||||||
|
Average daily number of tables
|
18
|
|
18
|
|
—
|
|
—
|
|
—
|
%
|
$
|
18
|
|
F
|
|
||||||||||
|
Total
|
|||||||||||||||||||||||||
|
Net gaming revenues
|
$
|
285,958
|
|
$
|
216,580
|
|
|
$
|
206,840
|
|
$
|
69,378
|
|
32
|
%
|
$
|
9,740
|
|
5
|
%
|
|||||
|
NM: Not meaningful
|
U: > 100% unfavorable
|
F: >100% favorable
|
||
The gaming activity presented above is subject to the following information:
|
(1)
|
On July 17, 2013, we completed the acquisition of Oxford, whose results are presented in 2013 from the date of acquisition through December 31, 2013.
|
|
(2)
|
On October 23, 2012, we completed the acquisition of Riverwalk, whose results are presented in 2012 from the date of acquisition through December 31, 2012.
|
|
(3)
|
Certain gaming activity amounts including hotel revenue and certain promotional allowances have been excluded from prior year amounts to conform to current year presentation. There was no impact from these reclassifications on total consolidated net revenues, operating expenses or cash flows.
|
|
(4)
|
Certain slot revenue amounts including promotional allowances have been excluded from prior year amounts to conform to current year presentation. There was no impact from these reclassifications on total consolidated net revenues, operating expenses or cash flows.
|
|
(5)
|
Harlow's poker room closed during July 2013.
|
53
Executive Summary
The following table sets forth, for the periods indicated, total consolidated revenues, including food and beverage, admissions and ancillary revenues, and certain other financial information and operating data (in thousands, except per common share data and live race days):
|
|
Year Ended December 31,
|
‘13 vs. ‘12 Change
|
‘12 vs. ‘11 Change
|
||||||||||||||||||||||
|
|
2013
|
2012
|
2011
|
$
|
%
|
$
|
%
|
||||||||||||||||||
|
No. of live race days
|
374
|
|
381
|
|
368
|
|
(7
|
)
|
(2
|
)%
|
13
|
|
4
|
%
|
|||||||||||
|
Net revenues:
|
|||||||||||||||||||||||||
|
Racing Operations
|
$
|
274,269
|
|
$
|
302,088
|
|
$
|
298,920
|
|
$
|
(27,819
|
)
|
(9
|
)%
|
$
|
3,168
|
|
1
|
%
|
||||||
|
Gaming
|
297,473
|
|
223,112
|
|
212,629
|
|
74,361
|
|
33
|
%
|
10,483
|
|
5
|
%
|
|||||||||||
|
Online Business
|
184,541
|
|
183,279
|
|
165,416
|
|
1,262
|
|
1
|
%
|
17,863
|
|
11
|
%
|
|||||||||||
|
Other
|
23,042
|
|
22,817
|
|
19,889
|
|
225
|
|
1
|
%
|
2,928
|
|
15
|
%
|
|||||||||||
|
Total net revenues
|
$
|
779,325
|
|
$
|
731,296
|
|
$
|
696,854
|
|
$
|
48,029
|
|
7
|
%
|
$
|
34,442
|
|
5
|
%
|
||||||
|
Operating income
|
$
|
90,100
|
|
$
|
96,550
|
|
$
|
81,010
|
|
$
|
(6,450
|
)
|
(7
|
)%
|
$
|
15,540
|
|
19
|
%
|
||||||
|
Operating income
margin
|
12
|
%
|
13
|
%
|
12
|
%
|
|||||||||||||||||||
|
Earnings from
continuing operations
|
$
|
55,033
|
|
$
|
58,152
|
|
$
|
60,795
|
|
$
|
(3,119
|
)
|
(5
|
)%
|
$
|
(2,643
|
)
|
(4
|
)%
|
||||||
|
Diluted net earnings from continuing operations per common share
|
$
|
3.07
|
|
$
|
3.33
|
|
$
|
3.55
|
|
||||||||||||||||
Year Ended December 31, 2013, Compared to the Year Ended December 31, 2012
Our total net revenues increased $48.0 million during the year ended December 31, 2013, compared to the same period of 2012, primarily from the continuing expansion of our Gaming segment through the acquisitions of Riverwalk and Oxford. Gaming revenues increased $74.4 million, reflecting $53.6 million in revenues at Riverwalk, which was acquired on October 23, 2012 and $34.4 million in revenues at Oxford, which was acquired on July 17, 2013. Revenues generated by Racing Operations decreased $27.8 million as strong Kentucky Oaks and Kentucky Derby week revenues were more than offset by the loss of Florida hosting revenues at Calder and the loss of eighteen host days at Arlington during the year ended December 31, 2013. Online Business revenues increased $1.3 million during the year ended December 31, 2013, as increased revenue from organic customer growth at TwinSpires and Velocity was partially offset by the effect of the temporary expiration of Illinois legislation permitting Illinois residents to wager online. Furthermore, on September 25, 2013, we ceased accepting wagers from Texas residents due to the loss of a lawsuit challenging a state law requiring residents to wager in person at a Texas racetrack, further impacting revenues from the Online Business.
For the year ended December 31, 2013, our operating income decreased by $6.5 million, primarily due to a $6.6 million decrease in insurance recoveries, a $7.5 million increase in share-based compensation expense associated with the performance of the Company and the loss of Florida hosting revenues. Partially offsetting these declines was the effect of incremental operating income from the Riverwalk and Oxford acquisitions and strong Kentucky Oaks and Kentucky Derby week results. Further discussion of results by our reported segments is detailed below.
Year Ended December 31, 2012, Compared to the Year Ended December 31, 2011
Our total net revenues increased $34.4 million, primarily from the continuing organic growth of our Online Business segment and from the acquisition of Riverwalk. Online Business revenues increased $17.9 million during the year ended December 31, 2012, compared to the same period of 2011, primarily reflecting an increase in Online Business handle of 10.9%. Gaming revenues increased $10.5 million, primarily reflecting $10.3 million in revenue generated at Riverwalk, which was acquired on October 23, 2012. In addition, gaming revenues increased $3.4 million at Harlow's during the year ended December 31, 2012, which was closed for twenty-five days during the same period of 2011, as a result of damage sustained from the Mississippi River flooding. These increases were partially offset by a $5.0 million decline at Calder Casino during the year ended December 31, 2012 due to increased regional competitive pressure from the opening of a new casino in Miami during January 2012, along with what we believed to be a weak South Florida economy. Revenues generated by Racing Operations increased $3.2 million, primarily reflecting an increase in revenues at Churchill Downs due to a strong performance from Kentucky Oaks and Kentucky Derby week and a 4% increase in live race days during the year ended December 31, 2012 as compared to the prior year.
54
Furthermore, other operating revenues increased $2.9 million predominantly due to an increase in handle-based revenue from United Tote.
For the year ended December 31, 2012, our operating income increased $15.5 million due to incremental operating income from Kentucky Oaks and Kentucky Derby week results. In addition, our Online Business operating income improved from organic handle growth. Finally, insurance recoveries increased $6.0 million as compared to the year ended December 31, 2011. Partially offsetting these improvements was a $4.3 million increase in share-based compensation. Further discussion of results by our reported segments is detailed below.
Consolidated Operating Expenses
The following table is a summary of our consolidated operating expenses (in thousands):
|
|
Year Ended December 31,
|
‘13 vs. ‘12 Change
|
‘12 vs. ‘11 Change
|
||||||||||||||||||||||
|
|
2013
|
2012
|
2011
|
$
|
%
|
$
|
%
|
||||||||||||||||||
|
Purses & pari-mutuel taxes
|
$
|
111,198
|
|
$
|
125,490
|
|
$
|
125,635
|
|
$
|
(14,292
|
)
|
(11
|
)%
|
$
|
(145
|
)
|
—
|
%
|
||||||
|
Gaming taxes
|
70,481
|
|
52,306
|
|
52,026
|
|
18,175
|
|
35
|
%
|
280
|
|
1
|
%
|
|||||||||||
|
Depreciation/amortization
|
61,750
|
|
55,600
|
|
55,170
|
|
6,150
|
|
11
|
%
|
430
|
|
1
|
%
|
|||||||||||
|
Other operating
expenses
|
362,725
|
|
334,527
|
|
318,484
|
|
28,198
|
|
8
|
%
|
16,043
|
|
5
|
%
|
|||||||||||
|
SG&A expenses
|
83,446
|
|
73,829
|
|
65,501
|
|
9,617
|
|
13
|
%
|
8,328
|
|
13
|
%
|
|||||||||||
|
Insurance recoveries, net of losses
|
(375
|
)
|
(7,006
|
)
|
(972
|
)
|
6,631
|
|
(95
|
)%
|
(6,034
|
)
|
F
|
|
|||||||||||
|
Total expenses
|
$
|
689,225
|
|
$
|
634,746
|
|
$
|
615,844
|
|
$
|
54,479
|
|
9
|
%
|
$
|
18,902
|
|
3
|
%
|
||||||
|
Percent of revenue
|
88
|
%
|
87
|
%
|
88
|
%
|
|||||||||||||||||||
Year Ended December 31, 2013, Compared to the Year Ended December 31, 2012
Significant items affecting comparability of consolidated operating expenses include:
|
•
|
Other operating expenses increased $28.2 million, primarily reflecting an increase of $31.8 million in operating expenses generated by Riverwalk and Oxford during the year ended December 31, 2013. In addition, salary expenditures increased
$1.7 million
, primarily associated with the continued development of the Online Business segment. Furthermore, we incurred operating expenses of
$1.1 million associated with a new video poker location in Louisiana which opened during January 2013. Finally, we incurred $3.1 million in operating expenses related to the development of Internet gaming technology, including $2.5 million of bad debt expense associated with a third-party deposit for which collectibility is not probable. Partially offsetting these increases were decreases in other racing expenses of $5.6
million associated with Calder’s loss of Florida host revenues during the year ended December 31, 2013. Finally, Online Business content expenses declined due to the favorable settlement of litigation and the cessation of operations in Texas and Illinois during portions of 2013.
|
|
•
|
Gaming taxes increased $18.2 million, primarily due to our acquisitions of Riverwalk and Oxford, which incurred gaming taxes of $19.4 million during the year ended December 31, 2013.
|
|
•
|
Purses and pari-mutuel taxes decreased $14.3 million, primarily as the result of the decline in pari-mutuel revenues within our Racing Operations, which corresponds with a 10.9% decrease in pari-mutuel handle compared to the same period of 2012. Calder generated a decline in purses and pari-mutuel taxes of $13.2 million, primarily due to the loss of Florida hosting revenues. Partially offsetting this decline was an increase in pari-mutuel taxes within the Online Business, due to an increase in the number of states which assess pari-mutuel taxes on ADW wagering.
|
|
•
|
SG&A expenses increased $9.6 million due to our acquisitions of Riverwalk and Oxford, which incurred an increase of $3.6 million in selling and general expenses during the year ended December 31, 2013. In addition, we incurred an increase of $7.5 million in share-based compensation expense during the period, which includes expenditures related to grants made under the New Company LTIP. We recognized a recovery of $0.8 million in selling and general expenses at Calder Casino during the year ended December 31, 2012, related to a reimbursement of certain administrative expenditures associated with a slot machine referendum held during 2005. Partially offsetting these increases were reductions in nonrecurring executive compensation expenditures of $1.6 million and reductions in professional and consulting fees of $0.7 million.
|
55
|
•
|
Insurance recoveries, net of losses decreased $6.6 million during the year ended December 31, 2013, primarily due to the prior year recognition of insurance recoveries associated with 2011 flood and wind damage at Harlow’s. Partially offsetting this decline was the recognition of recoveries of $0.4 million during the year ended December 31, 2013 associated with 2012 hail damage at Churchill Downs.
|
|
•
|
Depreciation and amortization expense increased $6.2 million during the year ended December 31, 2013, primarily due to the acquisitions of Riverwalk and Oxford which incurred expenses of $7.6 million during the year.
|
Year Ended December 31, 2012, Compared to the Year Ended December 31, 2011
Significant items affecting comparability of consolidated operating expenses include:
|
•
|
Other operating expenses increased $16.0 million, primarily as a result of increased content costs within the Online Business of $8.0 million, which corresponds to the 10.9% increase in pari-mutuel handle during the year ended December 31, 2012. In addition, we incurred $1.7 million in expenses associated with the October 2012 launch of Luckity, our newest ADW venture. We also recognized a non-recurring expense of $0.4 million to credit the wagering accounts of our Online Business customers impacted by incorrect wagering payoffs from a New York Racing Association error that occurred during 2010 and 2011. Furthermore, we recognized a $2.5 million reduction in sales tax expense at Churchill Downs involving a Tax Increment Financing ("TIF") agreement with the Commonwealth of Kentucky during the year ended December 31, 2011. Finally, operating expenses increased $6.6 million due to our acquisitions of Riverwalk and Bluff during the year ended December 31, 2012. Partially offsetting these increases were decreases in labor costs, lower utility expenses and other cost control measures implemented by our Racing Operations during the year ended December 31, 2012.
|
|
•
|
SG&A expenses increased $8.3 million, due, in part, to an increase in equity and long-term incentive compensation expense of $4.0 million during the year ended December 31, 2012, which primarily reflects the amortization of restricted stock awards granted under the Company's long-term incentive plan ("LTIP") for the 2008, 2009 and 2010 LTIP Plan years and an estimate for the 2011 and 2012 LTIP Plan years. In addition, selling and general expenses increased $2.0 million due to our acquisitions of Riverwalk and Bluff during the year ended December 31, 2012. In addition, we incurred non-recurring employee costs of $1.5 million during the year ended December 31, 2012, compared to the same period of 2011. Furthermore, selling, general and administrative expenses increased $0.8 million for the October 2012 launch of Luckity during the year ended December 31, 2012. Finally, TwinSpires incurred expenses of $0.3 million related to a data security incident during the year ended December 31, 2012. Partially offsetting these increases was a recovery of $0.8 million recognized by Calder Casino as a reduction to selling, general and administrative expenses during the year ended December 31, 2012 relating to a reimbursement of certain administrative expenditures associated with a slot machine referendum held in Miami-Dade County during 2005.
|
|
•
|
Insurance recoveries, net of losses, increased $6.0 million, reflecting the final settlement of our property insurance claims related to wind and flood damage sustained at Harlow's during February 2011 and May 2011, respectively.
|
|
•
|
Gaming taxes increased $0.3 million, primarily due to our acquisition of Riverwalk, partially offset by the decline in revenue at Calder Casino resulting from increased competitive pressures from the opening of a new casino in Miami during the year ended December 31, 2012.
|
56
Other Income (Expense) and Provision for Income Taxes
The following table is a summary of our other income (expense) and income tax provision (in thousands):
|
|
Year Ended December 31,
|
‘13 vs. ‘12 Change
|
‘12 vs. ‘11 Change
|
||||||||||||||||||||||
|
|
2013
|
2012
|
2011
|
$
|
%
|
$
|
%
|
||||||||||||||||||
|
Interest income
|
$
|
112
|
|
$
|
90
|
|
$
|
468
|
|
$
|
22
|
|
24
|
%
|
$
|
(378
|
)
|
(81
|
)%
|
||||||
|
Interest expense
|
(6,231
|
)
|
(4,531
|
)
|
(8,924
|
)
|
(1,700
|
)
|
(38
|
)%
|
4,393
|
|
49
|
%
|
|||||||||||
|
Equity in loss of unconsolidated investments
|
(4,142
|
)
|
(1,701
|
)
|
(1,113
|
)
|
(2,441
|
)
|
U
|
|
(588
|
)
|
(53
|
)%
|
|||||||||||
|
Miscellaneous, net
|
5,667
|
|
819
|
|
23,643
|
|
4,848
|
|
F
|
|
(22,824
|
)
|
(97
|
)%
|
|||||||||||
|
Other income (expense)
|
$
|
(4,594
|
)
|
$
|
(5,323
|
)
|
$
|
14,074
|
|
$
|
729
|
|
14
|
%
|
$
|
(19,397
|
)
|
U
|
|
||||||
|
Income tax provision
|
$
|
(30,473
|
)
|
$
|
(33,075
|
)
|
$
|
(34,289
|
)
|
$
|
2,602
|
|
8
|
%
|
$
|
1,214
|
|
4
|
%
|
||||||
|
Effective tax rate
|
36
|
%
|
36
|
%
|
36
|
%
|
|||||||||||||||||||
Year Ended December 31, 2013, Compared to the Year Ended December 31, 2012
Significant items affecting the comparability of other income and expense and the income tax provision include:
|
•
|
Miscellaneous other income increased $4.8 million, primarily due to the recognition of the final HRE Trust Fund proceeds of $4.5 million related to the Illinois riverboat casino surcharge during the year ended December 31, 2013.
|
|
•
|
Equity in loss of unconsolidated investments increased $2.4 million during the year ended December 31, 2013, primarily due to preopening expenses of $3.6 million related to our investment in MVG. Partially offsetting this increase were favorable gaming results from MVG of $0.5 million subsequent to its opening on December 12, 2013, and the performance of our investment in HRTV, which improved $0.6 million.
|
|
•
|
Interest expense increased $1.7 million during the year ended December 31, 2013, primarily as a result of higher average outstanding debt balance under our Senior Secured Credit Facility required for financing the acquisitions of Riverwalk, Oxford and MVG development. In addition, amortization of loan origination and debt issuance costs were $0.7 million during the year ended December 31, 2013.
|
|
•
|
The effective tax rate for the year ended December 31, 2013 was affected by the recognition of income tax benefits of
$0.9 million
related to 2012 and 2013 research and development tax credits.
|
Year Ended December 31, 2012, Compared to the Year Ended December 31, 2011
Significant items affecting the comparability of other income and expense and the income tax provision include:
|
•
|
Miscellaneous other income decreased $22.8 million, primarily reflecting the impact of recognizing income of $19.3 million related to the HRE Trust Fund during the year ended December 31, 2011. In addition, during 2011, we recorded a gain of $2.7 million and the elimination of other income related to the long put option and short call option associated with a related party convertible note payable that was converted into common stock during the year ended December 31, 2011.
|
|
•
|
Interest expense decreased $4.4 million during the year ended December 31, 2012, due in part to lower interest expense of $2.8 million under our senior secured credit facility associated with lower average outstanding debt balances during the year ended December 31, 2012, compared to the same period of 2011. In addition, during 2012, we did not incur interest expense related to the convertible note payable which was converted during the prior year. During the year ended December 31, 2011, interest expense, including conversion charges, of $1.6 million was incurred, associated with the convertible note payable.
|
|
•
|
Equity in loss of unconsolidated investments increased $0.6 million during the year ended December 31, 2012, related to our investment in MVG.
|
Net Revenues By Segment
The following table presents net revenues, including intercompany revenues, by our reported segments (in thousands):
57
|
|
Year Ended December 31,
|
‘13 vs. ‘12 Change
|
‘12 vs. ‘11 Change
|
||||||||||||||||||||||
|
2013
|
2012
|
2011
|
$
|
%
|
$
|
%
|
|||||||||||||||||||
|
Churchill Downs
|
$
|
139,531
|
|
$
|
129,847
|
|
$
|
126,974
|
|
$
|
9,684
|
|
7
|
%
|
$
|
2,873
|
|
2
|
%
|
||||||
|
Arlington
|
67,878
|
|
73,789
|
|
73,419
|
|
(5,911
|
)
|
(8
|
)%
|
370
|
|
1
|
%
|
|||||||||||
|
Calder
|
37,527
|
|
66,149
|
|
65,022
|
|
(28,622
|
)
|
(43
|
)%
|
1,127
|
|
2
|
%
|
|||||||||||
|
Fair Grounds
|
41,828
|
|
45,460
|
|
45,789
|
|
(3,632
|
)
|
(8
|
)%
|
(329
|
)
|
(1
|
)%
|
|||||||||||
|
Total Racing Operations
|
286,764
|
|
315,245
|
|
311,204
|
|
(28,481
|
)
|
(9
|
)%
|
4,041
|
|
1
|
%
|
|||||||||||
|
Calder Casino
|
78,951
|
|
77,864
|
|
82,819
|
|
1,087
|
|
1
|
%
|
(4,955
|
)
|
(6
|
)%
|
|||||||||||
|
Fair Grounds Slots
|
42,156
|
|
42,881
|
|
41,553
|
|
(725
|
)
|
(2
|
)%
|
1,328
|
|
3
|
%
|
|||||||||||
|
VSI
|
35,931
|
|
35,433
|
|
35,052
|
|
498
|
|
1
|
%
|
381
|
|
1
|
%
|
|||||||||||
|
Harlow’s Casino
|
52,440
|
|
56,604
|
|
53,205
|
|
(4,164
|
)
|
(7
|
)%
|
3,399
|
|
6
|
%
|
|||||||||||
|
Oxford Casino
|
34,350
|
|
—
|
|
—
|
|
34,350
|
|
F
|
|
—
|
|
—
|
|
|||||||||||
|
Riverwalk Casino
|
53,645
|
|
10,330
|
|
—
|
|
43,315
|
|
F
|
|
10,330
|
|
F
|
|
|||||||||||
|
Total Gaming
|
297,473
|
|
223,112
|
|
212,629
|
|
74,361
|
|
33
|
%
|
10,483
|
|
5
|
%
|
|||||||||||
|
Online Business
|
185,394
|
|
184,115
|
|
166,202
|
|
1,279
|
|
1
|
%
|
17,913
|
|
11
|
%
|
|||||||||||
|
Other Investments
|
26,308
|
|
25,251
|
|
21,578
|
|
1,057
|
|
4
|
%
|
3,673
|
|
17
|
%
|
|||||||||||
|
Corporate
|
1,143
|
|
1,032
|
|
326
|
|
111
|
|
11
|
%
|
706
|
|
F
|
|
|||||||||||
|
Eliminations
|
(17,757
|
)
|
(17,459
|
)
|
(15,085
|
)
|
(298
|
)
|
(2
|
)%
|
(2,374
|
)
|
(16
|
)%
|
|||||||||||
|
$
|
779,325
|
|
$
|
731,296
|
|
$
|
696,854
|
|
$
|
48,029
|
|
7
|
%
|
$
|
34,442
|
|
5
|
%
|
|||||||
Year Ended December 31, 2013, Compared to the Year Ended December 31, 2012
Significant items affecting comparability of our revenues by segment include:
|
•
|
Gaming revenues increased $74.4 million, primarily reflecting revenue from the acquisitions of Riverwalk, which was acquired on October 23, 2012, and Oxford, which was acquired on July 17, 2013. Calder Casino revenues increased during the period as directed marketing efforts implemented during 2013 and the closure of Florida Internet cafes offset continued regional competitive pressures from the opening of additional Miami casinos during January 2012 and August 2013. Partially offsetting these increases was a decrease in net revenues of $4.2 million at Harlow’s during 2013 due to continued weakness in the region and disruptions from casino floor modifications to address competitive pressures. Fair Grounds Slots and VSI revenues decreased $0.2 million compared to the same period of 2012, as local market weakness more than offset additional video poker revenues from the opening of a new video poker facility during January 2013.
|
|
•
|
Racing Operations revenues decreased $28.5 million, as strong Kentucky Oaks and Derby week results and the revenues from the new twelve-day September live racing meet at Churchill Downs were more than offset by weaknesses at the Company’s other racetracks. Kentucky Oaks and Derby week revenues improved from the same period of 2012 due to revenues from a newly opened luxury facility, the Mansion, in addition to increased ticket sales and sponsorships and other new Kentucky Oaks and Derby week offerings. However, Calder revenues declined $28.6 million during 2013, primarily due to the loss of Florida hosting revenues of approximately $21.2 million and fewer live racing days revenue of $7.4 million, as more fully discussed in “
|
|
•
|
Online Business revenues increased $1.3 million, as organic customer growth at TwinSpires and Velocity was primarily offset by the temporary expiration of legislation allowing Illinois residents to wager online. On June 7, 2013, TwinSpires resumed accepting wagers from Illinois residents, which had previously ceased on January 18, 2013. Furthermore, on September 25, 2013, TwinSpires ceased accepting wagers from Texas residents due
|
58
to the enforcement of an existing state law which permits Texas residents to wager on pari-mutuel events only at Texas racetracks. The impact of the Illinois and Texas disruptions represented a 4.3% decline in total handle during 2013 as compared to the same period of 2012.
|
•
|
Other Investments revenues increased $1.1 million, due primarily to an increase in equipment sales at United Tote.
|
Year Ended December 31, 2012, Compared to the Year Ended December 31, 2011
Significant items affecting comparability of our revenues by segment include:
|
•
|
Online Business revenues increased $17.9 million, reflecting a 10.9% increase in our pari-mutuel handle, from both continuing organic growth in customers and an increase in average daily wagering from existing customers.
|
|
•
|
Gaming revenues increased $10.5 million, primarily reflecting revenue generated at Riverwalk, which was acquired on October 23, 2012. In addition, gaming revenues increased $3.4 million at Harlow's during the year ended December 31, 2012, which was closed for twenty-five days during the same period of 2011 as a result of Mississippi River flood damage. Partially offsetting these increases was a decrease in net revenues of $5.0 million at Calder Casino during the year ended December 31, 2012. Calder Casino slot revenues declined 5.0% as a result of increased regional competitive pressures from a new casino in Miami, which opened during January 2012, and what we believed to be a weak South Florida economy.
|
|
•
|
Other Investments revenues increased $3.7 million, due, in part, to an increase in handle-based revenues at United Tote during the year ended December 31, 2012. In addition, we benefitted from our acquisition of Bluff during the year ended December 31, 2012.
|
|
•
|
Racing Operations revenues increased $4.0 million, primarily reflecting an increase in revenues at Churchill Downs due to a strong performance from Kentucky Oaks and Derby week and thirteen additional live race days during the year ended December 31, 2012, as compared to the same period during 2011. These increases were partially offset by the impact of not hosting the Breeders' Cup during 2012, which was held at Churchill Downs during the year ended December 31, 2011.
|
Adjusted Segment EBITDA
In order to evaluate the performance of these operating segments internally, we use Adjusted EBITDA (defined as earnings before interest, taxes, depreciation, amortization, insurance recoveries net of losses, HRE Trust Fund proceeds, share-based compensation expenses, pre-opening expenses, the impairment of assets and other charges or recoveries). Adjusted EBITDA also includes 50% of the operating income or loss of our joint venture, MVG. We believe that the use of Adjusted EBITDA as a key performance measure of the results of operations enables management and investors to evaluate and compare from period to period our operating performance in a meaningful and consistent manner. Adjusted EBITDA is a supplemental measure of the Company’s performance that is not required by, or presented in accordance with, generally accepted accounting principles (“GAAP”). However, Adjusted EBITDA should not be considered as an alternative to, or more meaningful than, net earnings (as determined in accordance with GAAP) as a measure of our operating results. The following table presents Adjusted EBITDA by our operating segments and a reconciliation of EBITDA to net earnings (in thousands):
59
|
|
Year Ended December 31,
|
‘13 vs. ‘12 Change
|
‘12 vs. ‘11 Change
|
||||||||||||||||||||||
|
|
2013
|
2012
|
2011
|
$
|
%
|
$
|
%
|
||||||||||||||||||
|
Racing Operations
|
$
|
50,275
|
|
$
|
54,357
|
|
$
|
47,236
|
|
$
|
(4,082
|
)
|
(8
|
)%
|
$
|
7,121
|
|
15
|
%
|
||||||
|
Gaming
|
80,429
|
|
64,231
|
|
58,590
|
|
16,198
|
|
25
|
%
|
5,641
|
|
10
|
%
|
|||||||||||
|
Online Business
|
49,122
|
|
44,618
|
|
40,918
|
|
4,504
|
|
10
|
%
|
3,700
|
|
9
|
%
|
|||||||||||
|
Other Investments
|
1,011
|
|
(117
|
)
|
1,269
|
|
1,128
|
|
F
|
|
(1,386
|
)
|
U
|
|
|||||||||||
|
Corporate
|
(4,606
|
)
|
(4,834
|
)
|
(2,523
|
)
|
228
|
|
(5
|
)%
|
(2,311
|
)
|
92
|
%
|
|||||||||||
|
Total Adjusted EBITDA
|
$
|
176,231
|
|
$
|
158,255
|
|
$
|
145,490
|
|
$
|
17,976
|
|
11
|
%
|
$
|
12,765
|
|
9
|
%
|
||||||
|
Insurance recoveries, net of losses
|
375
|
|
7,006
|
|
972
|
|
(6,631
|
)
|
(95
|
)%
|
6,034
|
|
F
|
|
|||||||||||
|
HRE Trust Fund proceeds
|
4,541
|
|
—
|
|
19,258
|
|
4,541
|
|
F
|
|
(19,258
|
)
|
U
|
|
|||||||||||
|
Share-based compensation
|
(21,482
|
)
|
(13,993
|
)
|
(9,730
|
)
|
(7,489
|
)
|
54
|
%
|
(4,263
|
)
|
44
|
%
|
|||||||||||
|
Pre-opening costs
|
(3,620
|
)
|
—
|
|
—
|
|
(3,620
|
)
|
U
|
|
—
|
|
—
|
%
|
|||||||||||
|
MVG interest expense, net
|
(170
|
)
|
—
|
|
—
|
|
(170
|
)
|
U
|
|
—
|
|
—
|
%
|
|||||||||||
|
Other charges and recoveries, net
|
(2,500
|
)
|
—
|
|
2,720
|
|
(2,500
|
)
|
U
|
|
(2,720
|
)
|
U
|
|
|||||||||||
|
Depreciation and amortization
|
(61,750
|
)
|
(55,600
|
)
|
(55,170
|
)
|
(6,150
|
)
|
11
|
%
|
(430
|
)
|
1
|
%
|
|||||||||||
|
Interest income (expense), net
|
(6,119
|
)
|
(4,441
|
)
|
(8,456
|
)
|
(1,678
|
)
|
38
|
%
|
4,015
|
|
(47
|
)%
|
|||||||||||
|
Income tax provision
|
(30,473
|
)
|
(33,075
|
)
|
(34,289
|
)
|
2,602
|
|
(8
|
)%
|
1,214
|
|
(4
|
)%
|
|||||||||||
|
Earnings from continuing operations
|
55,033
|
|
58,152
|
|
60,795
|
|
(3,119
|
)
|
(5
|
)%
|
(2,643
|
)
|
(4
|
)%
|
|||||||||||
|
Discontinued operations, net of income taxes
|
(133
|
)
|
124
|
|
3,560
|
|
(257
|
)
|
U
|
|
(3,436
|
)
|
U
|
|
|||||||||||
|
Net earnings and comprehensive income
|
$
|
54,900
|
|
$
|
58,276
|
|
$
|
64,355
|
|
$
|
(3,376
|
)
|
(6
|
)%
|
$
|
(6,079
|
)
|
(9
|
)%
|
||||||
Excluding corporate share-based compensation, the table below presents intercompany management fees (expense) income included in the Adjusted EBITDA of each of the operating segments for the years ended
December 31, 2013
,
2012
and
2011
, respectively (in thousands).
|
|
Year Ended December 31,
|
‘13 vs. ‘12 Change
|
‘12 vs. ‘11 Change
|
||||||||||||||||||||||
|
|
2013
|
2012
|
2011
|
$
|
%
|
$
|
%
|
||||||||||||||||||
|
Racing Operations
|
$
|
(6,978
|
)
|
$
|
(8,063
|
)
|
$
|
(8,476
|
)
|
1,085
|
|
13
|
%
|
$
|
413
|
|
5
|
%
|
|||||||
|
Gaming
|
(7,238
|
)
|
(5,705
|
)
|
(5,813
|
)
|
(1,533
|
)
|
(27
|
)%
|
108
|
|
2
|
%
|
|||||||||||
|
Online Business
|
(4,428
|
)
|
(4,679
|
)
|
(4,544
|
)
|
251
|
|
5
|
%
|
(135
|
)
|
(3
|
)%
|
|||||||||||
|
Other Investments
|
(603
|
)
|
(627
|
)
|
(652
|
)
|
24
|
|
4
|
%
|
25
|
|
4
|
%
|
|||||||||||
|
Corporate Income
|
19,247
|
|
19,074
|
|
19,485
|
|
173
|
|
1
|
%
|
(411
|
)
|
(2
|
)%
|
|||||||||||
|
Total management fees
|
$
|
—
|
|
$
|
—
|
|
$
|
—
|
|
$
|
—
|
|
$
|
—
|
|
||||||||||
Year Ended December 31,
2013
, Compared to the Year Ended December 31,
2012
Significant items affecting comparability of our Adjusted EBITDA by segment include:
|
•
|
Gaming Adjusted EBITDA increased $16.2 million, driven by an increase in Riverwalk Adjusted EBITDA of $13.0 million and Oxford Adjusted EBITDA of $9.2 million. Partially offsetting this increase was a decline in Harlow’s Adjusted EBITDA of $3.6 million as compared to the same period of 2012 driven by general economic weakness and lower customer discretionary spending in the region. In addition, during 2013, Harlow’s experienced disruptions from modifying its casino floor to combat competitive pressures in the market and from expanding its high-stakes slot positions. Calder Casino recognized proceeds during the prior year of $0.8 million as a reduction to SG&A expense relating to a reimbursement of certain administrative expenditures for a prior year slot referendum. Excluding the prior year recovery, Calder Casino Adjusted EBITDA improved $0.3 million compared to the same period of 2012. Calder Casino was favorably impacted by its strategic player marketing
|
60
efforts, the closure of Internet cafes in the State of Florida, and a successful advertising campaign, which mitigated the impact of new, competing casinos which opened during August 2013 and January 2012 in the South Florida region. Finally, Fair Grounds Slots and VSI Adjusted EBITDA decreased $1.9 million as weakness in the New Orleans market more than offset the opening of a new video poker facility.
|
•
|
Online Business Adjusted EBITDA increased $4.5 million during the year ended December 31, 2013, reflecting a 1.0% increase in our pari-mutuel handle, which was partially offset by an increase in pari-mutuel taxes associated with additional state legislative requirements. Velocity Adjusted EBITDA increased from both the addition of a new high volume wagering customer and increased wagering by existing customers. Online Business content expenses declined due to the favorable settlement of litigation. In addition, our investment in HRTV improved $0.6 million during the year ended December 31, 2013. Finally, the Online Business incurred $2.2 million in expenses associated with the continuing development of Luckity, a decrease of $0.4 million as compared to the same period of 2012. Partially offsetting these improvements was the unfavorable impact from the temporary loss of Illinois ADW wagering and the exit from Texas ADW wagering, which generated a combined handle decline of 4.3% and a reduction in Adjusted EBITDA of $2.7 million during the year ended December 31, 2013.
|
|
•
|
Racing Operations Adjusted EBITDA decreased $4.1 million during the year ended December 31, 2013. Churchill Downs Adjusted EBITDA improved $5.8 million from increased profitability from Kentucky Oaks and Derby week and $2.8 million from its new September live racing meet. In addition, Racing Operations benefited from lower labor costs and other cost control measures related to renovations at Churchill Downs Racetrack, including a new simulcasting facility. Offsetting these improvements was a $9.0 million decline in Adjusted EBITDA at Calder of which approximately $6.3 million was associated with the loss of Florida hosting revenues, approximately $1.8 million was associated with fewer live racing days and approximately $0.9 million with other ancillary items during the year ended December 31, 2013. Furthermore, Arlington Adjusted EBITDA declined $2.3 million due to eighteen fewer host days and a decline in pari-mutuel handle of 6.4%. Finally, Fair Grounds Adjusted EBITDA decreased $1.4 million due to inclement weather conditions unfavorably impacting both the 2013 racing meets and Jazz Fest.
|
|
•
|
Other Investments Adjusted EBITDA increased $1.1 million, primarily due to incremental equipment sales at United Tote and 50% of the operating results of our joint venture, MVG, which improved $0.8 million during the year. Partially offsetting this improvement were operating costs of $1.1 million associated with our Internet gaming initiatives.
|
The following other items affected earnings from continuing operations during the year ended December 31, 2013:
|
•
|
Insurance recoveries, net of losses, decreased $6.6 million during the year ended December 31, 2013, primarily due to the prior year recognition of insurance recoveries associated with 2011 flood and wind damage at Harlow’s.
|
|
•
|
HRE Trust Fund proceeds of $4.5 million were recognized as miscellaneous other income during the year ended December 31, 2013, reflecting Arlington’s final share of the disbursement of funds related to the riverboat casino license surcharge.
|
|
•
|
Share-based compensation expense increased $7.5 million compared to the same period of 2012 primarily due to expenses associated with grants made under the New Company LTIP.
|
|
•
|
Pre-opening costs of $3.6 million were incurred during the year ended December 31, 2013 associated with our investment in MVG, which opened a video lottery facility and a new harness racing facility on December 12, 2013.
|
|
•
|
MVG interest expense, net increased $0.2 million due to our share of financing costs incurred by the joint venture.
|
|
•
|
Other charges and recoveries, net increased $2.5 million as the collectibility of a third-party deposit associated with an Internet gaming license was not deemed probable.
|
|
•
|
Depreciation and amortization expense increased $6.2 million during the year ended December 31, 2013 driven primarily by the Riverwalk and Oxford acquisitions. Depreciation expense at United Tote decreased $2.0 million as certain assets acquired in the 2009 acquisition were fully depreciated during 2012.
|
Year Ended December 31,
2012
, Compared to the Year Ended December 31,
2011
Significant items affecting comparability of our Adjusted EBITDA by segment include:
|
•
|
Racing Operations Adjusted EBITDA increased $7.1 million due to improvements in Adjusted EBITDA at each of our racing properties. Churchill Downs Adjusted EBITDA increased as increased profitability of $5.4 million from Kentucky Oaks and Derby week was partially offset by the unfavorable impact of items recognized during
|
61
2011 which did not recur during 2012. During the year ended December 31, 2011, Churchill Downs recognized a $3.1 million reduction in operating expenses from a TIF agreement with the Commonwealth of Kentucky as compared to $0.7 million reduction in operating expenses during the year ended December 31, 2012. Furthermore, Churchill Downs benefitted from hosting the Breeders’ Cup during the year ended December 31, 2011. Finally, Racing Operations Adjusted EBITDA benefitted from lower labor costs, utility expenses and other cost control measures as compared to the same period of 2011.
|
•
|
Gaming Adjusted EBITDA increased $5.6 million, primarily due to a full year of operations at Harlow’s and the acquisition of Riverwalk. Harlow’s generated Adjusted EBITDA of $20.7 million during the year ended December 31, 2012 compared to Adjusted EBITDA of $17.6 million during the prior year. The improvement in Harlow’s profitability during 2012 is due to the closure of the facility for twenty-five days during 2011 due to Mississippi River flooding. In addition, our acquisition of Riverwalk generated Adjusted EBITDA of $3.0 million during the year ended December 31, 2012. Partially offsetting these increases was a decline in Adjusted EBITDA at Calder Casino, which generated Adjusted EBITDA of $13.6 million during the year ended December 31, 2012, compared to Adjusted EBITDA of $14.5 million during the prior year. Results at Calder Casino were negatively impacted by a 5.0% decrease in slot revenues, primarily due to increased regional competitive pressures from a new casino in Miami which opened during January 2012, and what we believed to be a weak South Florida economy. Partially offsetting the decline in gaming revenues at Calder Casino was the recognition of proceeds of $0.8 million as a reduction to SG&A expenses during the year ended December 31, 2012, relating to a reimbursement of certain administrative expenditures for a prior year slot machine referendum. Our Louisiana operations generated Adjusted EBITDA of $26.9 million and $26.6 million during each of the years ended December 31, 2012 and 2011, respectively.
|
|
•
|
Online Business Adjusted EBITDA increased $3.7 million, primarily reflecting a 10.9% increase in our pari-mutuel handle from continuing organic growth in customers during the year ended December 31, 2012. Partially offsetting this increase were nonrecurring employee costs of $1.1 million in addition to expenditures of $2.5 million related to the October 2012 launch of Luckity, our newest ADW venture. In addition, we incurred increased losses of $0.7 million related to our equity investment in HRTV and $0.4 million in expenditures to credit the wagering accounts of our Online Business customers impacted by incorrect wagering payoffs from a New York Racing Association error that occurred during 2010 and 2011.
|
|
•
|
Other Investments Adjusted EBITDA decreased $1.4 million primarily due to expenditures related to our equity investment in MVG and our acquisition of Bluff during the year ended December 31, 2012.
|
|
•
|
Corporate Adjusted EBITDA decreased $2.3 million due to increases of $1.0 million in professional and legal fees and $0.4 million in facility expenses associated with our corporate office relocation. In addition, there was a decrease of $0.4 million in corporate management fee income.
|
The following other items affected net earnings from continuing operations:
|
•
|
HRE Trust Fund proceeds of $19.3 million were recognized as miscellaneous other income during the year ended December 31, 2011, reflecting the release of restrictions on the HRE Trust Fund.
|
|
•
|
Insurance recoveries, net of losses, increased $6.0 million during the year ended December 31, 2012 primarily due to recognition of insurance recoveries associated with both 2011 flood and wind damage at Harlow’s and 2012 hail damage at Churchill Downs.
|
|
•
|
Share-based compensation expense increased $4.3 million compared to the same period of 2011 as we recognized higher long-term incentive compensation expenses related to the financial performance of the Company.
|
|
•
|
Other charges and recoveries, net decreased $2.7 million due to the recognition of a gain of $2.7 million associated with a related party convertible note payable that was converted into common stock during the year ended December 31, 2011.
|
62
Discontinued Operations
Fight! Magazine, Hoosier Park and Hollywood Park Racetrack have been accounted for as discontinued operations. Accordingly, the results of operations of the sold businesses for all periods presented and the (losses) gains on sold businesses have been classified as discontinued operations, net of income taxes, in the Consolidated Statements of Comprehensive Income. Set forth below is a summary of the results of operations of discontinued businesses for the years ended December 31, 2013, 2012 and 2011 (in thousands):
|
|
Year Ended December 31,
|
‘13 vs. ‘12 Change
|
‘12 vs. ‘11 Change
|
||||||||||||||||||||||
|
|
2013
|
2012
|
2011
|
$
|
%
|
$
|
%
|
||||||||||||||||||
|
Net revenues
|
$
|
632
|
|
$
|
1,087
|
|
$
|
—
|
|
$
|
(455
|
)
|
(42
|
)%
|
$
|
1,087
|
|
F
|
|
||||||
|
Operating expenses
|
857
|
|
885
|
|
12
|
|
(28
|
)
|
(3
|
)%
|
873
|
|
U
|
|
|||||||||||
|
Selling, general and administrative expenses
|
—
|
|
—
|
|
(11
|
)
|
—
|
|
—
|
11
|
|
U
|
|
||||||||||||
|
Operating (loss) gain
|
(225
|
)
|
202
|
|
(1
|
)
|
(427
|
)
|
U
|
|
203
|
|
F
|
|
|||||||||||
|
Other income (expense)
|
145
|
|
(2
|
)
|
—
|
|
147
|
|
F
|
|
(2
|
)
|
U
|
|
|||||||||||
|
(Loss) earnings from operations before income taxes
|
(80
|
)
|
200
|
|
(1
|
)
|
(280
|
)
|
U
|
|
201
|
|
F
|
|
|||||||||||
|
Income tax benefit (provision)
|
30
|
|
(76
|
)
|
—
|
|
106
|
|
F
|
|
(76
|
)
|
U
|
|
|||||||||||
|
(Loss) gain from operations
|
(50
|
)
|
124
|
|
(1
|
)
|
(174
|
)
|
U
|
|
125
|
|
F
|
|
|||||||||||
|
(Loss) gain on sale of assets, net of income taxes
|
(83
|
)
|
—
|
|
3,561
|
|
(83
|
)
|
U
|
|
(3,561
|
)
|
U
|
|
|||||||||||
|
Net (loss) gain
|
$
|
(133
|
)
|
$
|
124
|
|
$
|
3,560
|
|
$
|
(257
|
)
|
U
|
|
$
|
(3,436
|
)
|
(97
|
)%
|
||||||
Sale of Fight! Magazine
On December 16, 2013, the Company completed the sale of 100% of the assets of Fight! Magazine ("Fight"), a division of Bluff which was acquired by the Company in February 2012. Net revenues, operating expenses and the loss on sale of Fight for the years ended December 31, 2013 and 2012, have been reclassified to discontinued operations. There was no impact from these reclassifications on net earnings or cash flows.
Hoosier Park Consideration
In accordance with the Company’s sale of its ownership interest in Hoosier Park to Centaur Racing, LLC (“Centaur”) during 2007, the Company received a promissory note (the “Note”) in the amount of
$4.0 million
plus interest. The Partnership Interest Purchase Agreement documenting such sale to Centaur also included a contingent consideration provision whereby the Company was entitled to payments of up to
$15 million
on the date which is
18
months after the date that slot machines are operational at Hoosier Park. During June 2008, Hoosier Park commenced its slot operations, fulfilling the terms of the contingency provision. However, due to uncertainties regarding collectability, the Company did not recognize the contingent consideration at the date of sale.
On October 1, 2011, the Company received
$5.1 million
in repayment of the amount owed to the Company pursuant to the Note. In addition, the Company also received
$3.4 million
as the final settlement of the contingent consideration provision of the Partnership Interest Purchase Agreement, which was recognized as a gain in discontinued operations during the year ended December 31, 2011.
Hollywood Park Racetrack
In addition, we recognized operating expenses of $0.1 million during the year ended December 31, 2013, from adjustments related to workers' compensation reserves retained by the Company subsequent to our sale of Hollywood Park Racetrack during 2005.
The following table is a summary of our overall financial position as of
December 31, 2013
and
2012
(in thousands):
63
|
|
Year Ended December 31,
|
‘13 vs. ‘12 Change
|
||||||||||||
|
|
2013
|
2012
|
$
|
%
|
||||||||||
|
Total assets
|
$
|
1,352,261
|
|
$
|
1,114,337
|
|
$
|
237,924
|
|
21
|
%
|
|||
|
Total liabilities
|
$
|
647,472
|
|
$
|
470,042
|
|
$
|
177,430
|
|
38
|
%
|
|||
|
Total shareholders’ equity
|
$
|
704,789
|
|
$
|
644,295
|
|
$
|
60,494
|
|
9
|
%
|
|||
Significant items affecting comparability of our consolidated balance sheet include:
|
•
|
Total assets increased primarily due to assets assumed and intangibles recorded of $161.1 million, net of cash, associated with the Oxford acquisition. Excluding Oxford, significant other changes within total assets include an increase in investment in and advances to unconsolidated affiliate of $66.9 million during the year ended December 31, 2013, due to funding of $70.5 million to our investment in MVG, partially offset by our equity losses from MVG. In addition, other assets increased $9.5 million primarily due to the capitalization of $6.3 million in debt issuance costs associated with our Senior Unsecured Notes offering and $2.3 million in loan origination fees associated with the senior secured Credit Facility.
|
Partially offsetting these increases were decreases in net other intangible assets of $9.7 million during the year ended December 31, 2013. The decrease in net other intangible assets primarily reflects the amortization of definite lived assets acquired in our acquisitions of Harlow’s, Riverwalk and Oxford.
|
•
|
Significant changes within total liabilities include an increase in long-term debt of $159.5 million, reflecting the issuance of $300 million in long-term debt from our Senior Unsecured Notes offering, partially offset by repayments under our Senior Secured Credit Facility. In addition, dividends payable increased $15.2 million reflecting a change in the timing of our 2013 shareholder dividend payment.
|
Liquidity and Capital Resources
The following table is a summary of our liquidity and cash flows (in thousands):
|
|
Year Ended December 31,
|
‘13 vs. ‘12 Change
|
‘12 vs. ‘11 Change
|
||||||||||||||||||||||
|
Cash Flows from:
|
2013
|
2012
|
2011
|
$
|
%
|
$
|
%
|
||||||||||||||||||
|
Operating activities
|
$
|
144,915
|
|
$
|
144,407
|
|
$
|
172,995
|
|
$
|
508
|
|
—
|
%
|
$
|
(28,588
|
)
|
(17
|
)%
|
||||||
|
Investing activities
|
$
|
(281,872
|
)
|
$
|
(199,988
|
)
|
$
|
(26,878
|
)
|
$
|
(81,884
|
)
|
41
|
%
|
$
|
(173,110
|
)
|
U
|
|
||||||
|
Financing activities
|
$
|
144,488
|
|
$
|
65,433
|
|
$
|
(145,693
|
)
|
$
|
79,055
|
|
F
|
|
$
|
211,126
|
|
F
|
|
||||||
|
•
|
The increase in cash provided by operating activities is due, in part, to the acquisitions of Riverwalk and Oxford, the increased profitability of Kentucky Oaks and Kentucky Derby week and the receipt of HRE Trust Fund proceeds during the year ended December 31, 2013. Partially offsetting these improvements was the loss of Florida hosting revenues at Calder and an overpayment of estimated 2013 federal income taxes. We anticipate that cash flows from operations over the next twelve months will be adequate to fund our business operations and capital expenditures.
|
|
•
|
The increase in cash used in investing activities is primarily due to the net increase in acquisition activity of $12.0 million related to the 2013 Oxford acquisition as compared to the 2012 acquisitions of Riverwalk and Bluff. In addition, capital contributions to our joint venture, MVG, increased $50.7 million during the year ended December 31, 2013 as compared to the same period of 2012. Finally, other increases in investing activities include the receipt of $10.4 million in insurance proceeds during the year ended December 31, 2012, related to the Harlow’s flood and wind claims and the Churchill Downs hail claim.
|
|
•
|
The increase in cash provided by financing activities is primarily due to the issuance of our $300 million Senior Unsecured Notes during the year ended December 31, 2013. In addition, net repayments under our Senior Secured Credit Facility increased $222.7 million during the year ended December 31, 2013, through the repayment of a portion of the senior secured credit facility from the proceeds of the Senior Unsecured Notes.
|
During 2013, the Company funded
$70.5 million
in capital contributions to MVG. Since the joint venture commenced during 2012, the Company has funded $90.4 million in capital contributions. The Company anticipates providing funding of $24.0 million to MVG during 2014.
There were no material changes in our commitments to make future payments or in our contractual obligations. As of
December 31, 2013
, we were in compliance with the debt covenants of our senior secured credit facility and had $425 million of borrowing capacity under our senior secured credit facility.
64
Free cash flow, which we reconcile to “Net cash provided by operating activities,” is cash flows from operations reduced by maintenance-related (replacement) capital expenditures. Maintenance-related capital expenditures are expenditures to replace existing fixed assets with a useful life greater than one year that are obsolete, worn-out or no longer cost effective to repair. We use free cash flow to evaluate our business because, although it is similar to cash flow from operations, we believe it will typically present a more conservative measure of cash flows as maintenance-related capital expenditures are a necessary component of our ongoing operations. Free cash flow is a non-GAAP measure, and our definition may differ from other companies’ definitions of this measure.
Free cash flow does not represent the residual cash flow available for discretionary expenditures and does not incorporate the funding of business acquisitions or capital projects that expand existing facilities or create a new facility. This non-GAAP measure should not be considered a substitute for, or superior to, cash flows from operating activities under GAAP.
The following is a summary of additions to property and equipment and a reconciliation of free cash flow to the most comparable GAAP measure, “Net cash provided by operating activities,” for
2013
,
2012
and
2011
(in thousands):
|
|
Year Ended December 31,
|
‘13 vs. ‘12 Change
|
‘12 vs. ‘11 Change
|
||||||||||||||||||||||
|
|
2013
|
2012
|
2011
|
$
|
%
|
$
|
%
|
||||||||||||||||||
|
Maintenance-related capital expenditures
|
$
|
16,879
|
|
$
|
17,158
|
|
$
|
14,845
|
|
$
|
(279
|
)
|
(2
|
)%
|
$
|
2,313
|
|
16
|
%
|
||||||
|
Capital project expenditures
|
31,892
|
|
24,140
|
|
7,822
|
|
7,752
|
|
32
|
%
|
16,318
|
|
U
|
|
|||||||||||
|
Additions to property and equipment
|
$
|
48,771
|
|
$
|
41,298
|
|
$
|
22,667
|
|
$
|
7,473
|
|
18
|
%
|
$
|
18,631
|
|
82
|
%
|
||||||
|
Net cash provided by operating activities
|
$
|
144,915
|
|
$
|
144,407
|
|
$
|
172,995
|
|
$
|
508
|
|
—
|
%
|
$
|
(28,588
|
)
|
(17
|
)%
|
||||||
|
Maintenance-related capital expenditures
|
(16,879
|
)
|
(17,158
|
)
|
(14,845
|
)
|
279
|
|
(2
|
)%
|
(2,313
|
)
|
16
|
%
|
|||||||||||
|
Free cash flow
|
$
|
128,036
|
|
$
|
127,249
|
|
$
|
158,150
|
|
$
|
787
|
|
1
|
%
|
$
|
(30,901
|
)
|
(20
|
)%
|
||||||
During the year ended December 31, 2013, the increase in capital project expenditures as compared to the same period of 2012 primarily reflects capital expenditures related to the Mansion, Rooftop Garden and Grandstand Terrace projects at Churchill Downs.
During the year ended December 31, 2012, the increase in capital project expenditures as compared to the same period of 2011 primarily reflects capital expenditures related to renovations underway at Harlow’s, our corporate office relocation and the launch of Luckity, our newest ADW business. During 2012, we funded capital expenditures of approximately $11.0 million related to Harlow’s renovations, which were offset by the receipt of insurance recoveries. The decrease in cash provided by operating activities is primarily due to the prior year recognition of proceeds from the HRE Trust Fund and the receipt of refunds of $10.4 million from filing prior years' amended federal income tax returns during the year ended December 31, 2011.
5.375% Senior Unsecured Notes
On December 16, 2013, the Company completed an offering of $300 million in aggregate principal amount of 5.375% Senior Unsecured Notes that mature on December 15, 2021 (the “Senior Unsecured Notes”). The Senior Unsecured Notes were issued at par, with interest payable on June 15
th
and December 15
th
of each year. The Company received net proceeds of $295 million, after deducting underwriting fees, and used the net proceeds from the offering to repay a portion of its outstanding borrowings, and accrued and unpaid interest outstanding under its Third Amended and Restated Credit Agreement ("Senior Secured Credit Facility"). As a result of the issuance, the Company capitalized $6.3 million of debt issuance costs, which is being amortized as interest expense over the remaining term of the Senior Unsecured Note.
The Senior Unsecured Notes were issued in a private offering that was exempt from registration under the Securities Act of 1933, as amended, and are senior unsecured obligations of the Company. The Senior Unsecured Notes are guaranteed by each of the Company’s domestic subsidiaries that guarantee its Senior Secured Credit Facility and will rank equally with the Company’s existing and future senior obligations. At any time prior to December 15, 2016, the Company may redeem all or part of the Senior Unsecured Notes at par plus the present value (discounted at the treasury rate plus 50 basis points) of scheduled interest payments through December 15, 2016, along with accrued and unpaid interest, if any, at the date of redemption. On or after December 15, 2016, the Company may redeem all or part of the Senior Unsecured Notes at a redemption price of 104.031% which gradually reduces to par by 2019.
65
Senior Secured Credit Facility
On May 17, 2013, the Company entered into the Third Amended and Restated Credit Agreement (the “Senior Secured Credit Facility”) which amended certain provisions of the credit agreement including increasing the maximum aggregate commitment from $375 million to $500 million. The Senior Secured Credit Facility also provides for an accordion feature which, if exercised, could increase the maximum aggregate commitment by up to an additional $225 million and reduce the pricing schedule for outstanding borrowings and commitment fees across all leverage pricing levels. The guarantors under the Senior Secured Credit Facility continue to be a majority of the Company's wholly-owned subsidiaries. The Company incurred loan origination costs of $2.3 million in connection with this amendment, which were capitalized and are being amortized as interest expense over the remaining term of the Senior Secured Credit Facility. The Senior Secured Credit Facility matures on May 17, 2018.
Generally, borrowings made pursuant to the Senior Secured Credit Facility bear interest at a LIBOR-based rate per annum plus an applicable percentage ranging from 1.125% to 3.0% depending on the Company's total leverage ratio. In addition, under the Senior Secured Credit Facility, the Company agreed to pay a commitment fee at rates that range from 0.175% to 0.45% of the available aggregate commitment, depending on the Company's leverage ratio. The weighted average interest rate on outstanding borrowings at December 31, 2013 and 2012 was 1.71% and 1.87%, respectively.
The Senior Secured Credit Facility contains customary affirmative and negative covenants for credit facilities of this type, including limitations on the Company and its subsidiaries with respect to indebtedness, restricted payments, liens, investments, mergers and acquisitions, disposition of assets, sale-leaseback transactions and transactions with affiliates. The covenants permit the Company to use proceeds of the credit extended under the agreement for general corporate purposes, restricted payments and acquisition needs. The Senior Secured Credit Facility also contains financial covenants that require the Company (i) to maintain an interest coverage ratio (i.e., consolidated adjusted EBITDA to consolidated interest expense) that is greater than 3.0 to 1.0; (ii) not to permit the total leverage ratio (i.e., total consolidated funded indebtedness to consolidated adjusted EBITDA) to be greater than 4.5 to 1.0, provided that if a certain minimum consolidated adjusted EBITDA is reached then the total leverage ratio will be increased to 5.0 to 1.0 for such periods that the minimum is maintained; and (iii) not to permit the senior secured leverage ratio (i.e. senior secured consolidated funded indebtedness to consolidated adjusted EBITDA) to be greater than 3.5 to 1.0. As of December 31, 2013, the Company was in compliance with all covenants under the Senior Secured Credit Facility, and substantially all of the Company's assets continue to be pledged as collateral under the Senior Secured Credit Facility. At December 31, 2013, the financial ratios under our Senior Secured Credit Facility were as follows:
|
Actual
|
Requirement
|
||
|
Interest Coverage Ratio
|
30.8 to 1
|
> 3.0 to 1.0
|
|
|
Total Leverage Ratio
|
2.0 to 1
|
< 4.5 to 1.0
|
|
|
Senior Secured Leverage Ratio
|
0.4 to 1
|
< 3.5 to 1.0
|
|
Contractual Obligations
Our commitments to make future payments as of December 31, 2013, are summarized as follows (in thousands):
|
|
2014
|
2015-2016
|
2017-2018
|
Thereafter
|
Total
|
||||||||||||||
|
Senior Secured Credit Facility
|
$
|
—
|
|
$
|
—
|
|
$
|
69,191
|
|
$
|
—
|
|
$
|
69,191
|
|
||||
|
Interest on Senior Secured Credit Facility
|
1,183
|
|
—
|
|
—
|
|
—
|
|
1,183
|
|
|||||||||
|
Senior Unsecured Notes
|
—
|
|
—
|
|
—
|
|
300,000
|
|
300,000
|
|
|||||||||
|
Interest on Senior Unsecured Notes
|
16,125
|
|
32,250
|
|
32,250
|
|
47,712
|
|
128,337
|
|
|||||||||
|
Capital contributions to MVG
|
24,000
|
|
—
|
|
—
|
|
—
|
|
24,000
|
|
|||||||||
|
Operating leases
|
8,024
|
|
11,069
|
|
5,873
|
|
5,130
|
|
30,096
|
|
|||||||||
|
Total
|
$
|
49,332
|
|
|
$
|
43,319
|
|
|
$
|
107,314
|
|
|
$
|
352,842
|
|
|
$
|
552,807
|
|
|
(1)
|
Interest includes the estimated contractual payments under our senior secured credit facility assuming no change in the borrowing rate of 1.7%, which was the rate in place as of December 31, 2013.
|
As of December 31, 2013, we had approximately
$0.6 million
of unrecognized tax benefits. We anticipate a decrease in our unrecognized tax benefits of approximately $0.1 million during the next twelve months due to the expiration of statutes of limitations.
66
|
ITEM 7A.
|
QUANTITATIVE AND QUALITATIVE DISCLOSURES ABOUT MARKET RISK
|
Our primary exposure to market risk relates to changes in interest rates. At December 31,
2013
, we had $69.2 million outstanding under our senior secured credit facility, which bears interest at LIBOR based variable rates. We are exposed to market risk on variable rate debt due to potential adverse changes in these rates. Assuming the outstanding balance of the debt facilities remain constant, a one-percentage point increase in the LIBOR rate would reduce annual earnings and cash flows from operating activities by $0.4 million.
67
|
ITEM 8.
|
FINANCIAL STATEMENTS AND SUPPLEMENTARY DATA
|
Report of Independent Registered Public Accounting Firm
To the Board of Directors and Shareholders
of Churchill Downs Incorporated
In our opinion, the consolidated financial statements listed in the index appearing under item 15(a)(1) present fairly, in all material respects, the financial position of Churchill Downs Incorporated and its subsidiaries at December 31, 2013 and 2012, and the results of their operations and their cash flows for each of the three years in the period ended December 31, 2013 in conformity with accounting principles generally accepted in the United States of America. In addition, in our opinion, the financial statement schedule listed in the index appearing under item 15(a)(2) presents fairly, in all material respects, the information set forth therein when read in conjunction with the related consolidated financial statements. Also in our opinion, the Company maintained, in all material respects, effective internal control over financial reporting as of December 31, 2013, based on criteria established in
Internal Control—Integrated Framework (1992)
issued by the Committee of Sponsoring Organizations of the Treadway Commission (COSO). The Company’s management is responsible for these financial statements and financial statement schedule, for maintaining effective internal control over financial reporting and for its assessment of the effectiveness of internal control over financial reporting, included in Management’s Report on Internal Control over Financial Reporting appearing under Item 9A. Our responsibility is to express opinions on these financial statements, on the financial statement schedule and on the Company’s internal control over financial reporting based on our integrated audits. We conducted our audits in accordance with the standards of the Public Company Accounting Oversight Board (United States). Those standards require that we plan and perform the audits to obtain reasonable assurance about whether the financial statements are free of material misstatement and whether effective internal control over financial reporting was maintained in all material respects. Our audits of the financial statements included examining, on a test basis, evidence supporting the amounts and disclosures in the financial statements, assessing the accounting principles used and significant estimates made by management, and evaluating the overall financial statement presentation. Our audit of internal control over financial reporting included obtaining an understanding of internal control over financial reporting, assessing the risk that a material weakness exists, and testing and evaluating the design and operating effectiveness of internal control based on the assessed risk. Our audits also included performing such other procedures as we considered necessary in the circumstances. We believe that our audits provide a reasonable basis for our opinions.
A company’s internal control over financial reporting is a process designed to provide reasonable assurance regarding the reliability of financial reporting and the preparation of financial statements for external purposes in accordance with generally accepted accounting principles. A company’s internal control over financial reporting includes those policies and procedures that (i) pertain to the maintenance of records that, in reasonable detail, accurately and fairly reflect the transactions and dispositions of the assets of the company; (ii) provide reasonable assurance that transactions are recorded as necessary to permit preparation of financial statements in accordance with generally accepted accounting principles, and that receipts and expenditures of the company are being made only in accordance with authorizations of management and directors of the company; and (iii) provide reasonable assurance regarding prevention or timely detection of unauthorized acquisition, use, or disposition of the company’s assets that could have a material effect on the financial statements.
Because of its inherent limitations, internal control over financial reporting may not prevent or detect misstatements. Also, projections of any evaluation of effectiveness to future periods are subject to the risk that controls may become inadequate because of changes in conditions, or that the degree of compliance with the policies or procedures may deteriorate.
As described in Management's Report on Internal Control over Financial Reporting appearing under Item 9A, management has excluded Oxford Casino from its assessment of internal control over financial reporting as of December 31, 2013 because it was acquired by the Company in a purchase business combination during 2013. We have also excluded Oxford Casino from our audit of internal control over financial reporting. Oxford Casino is a wholly-owned subsidiary whose total assets and total revenues represent 12.5% and 4.4% respectively, of the related consolidated financial statement amounts as of and for the year ended December 31, 2013.
/s/ PricewaterhouseCoopers LLP
Louisville, Kentucky
February 26, 2014
68
CHURCHILL DOWNS INCORPORATED
CONSOLIDATED BALANCE SHEETS
December 31,
(in thousands)
|
2013
|
2012
|
||||||
|
ASSETS
|
|||||||
|
Current assets:
|
|||||||
|
Cash and cash equivalents
|
$
|
44,708
|
|
$
|
37,177
|
|
|
|
Restricted cash
|
36,074
|
|
38,241
|
|
|||
|
Accounts receivable, net of allowance for doubtful accounts of $4,338 in 2013 and $1,885 in 2012
|
46,572
|
|
47,152
|
|
|||
|
Deferred income taxes
|
8,927
|
|
8,227
|
|
|||
|
Income taxes receivable
|
12,398
|
|
2,915
|
|
|||
|
Other current assets
|
12,036
|
|
13,352
|
|
|||
|
Total current assets
|
160,715
|
|
147,064
|
|
|||
|
Property and equipment, net
|
585,498
|
|
542,882
|
|
|||
|
Investment in and advances to unconsolidated affiliate
|
86,151
|
|
19,240
|
|
|||
|
Goodwill
|
300,616
|
|
250,414
|
|
|||
|
Other intangible assets, net
|
198,149
|
|
143,141
|
|
|||
|
Other assets
|
21,132
|
|
11,596
|
|
|||
|
Total assets
|
$
|
1,352,261
|
|
$
|
1,114,337
|
|
|
|
LIABILITIES AND SHAREHOLDERS’ EQUITY
|
|||||||
|
Current liabilities:
|
|||||||
|
Accounts payable
|
$
|
43,123
|
|
$
|
47,791
|
|
|
|
Bank overdraft
|
973
|
|
6,027
|
|
|||
|
Account wagering deposit liabilities
|
18,679
|
|
14,487
|
|
|||
|
Purses payable
|
18,839
|
|
19,084
|
|
|||
|
Accrued expenses
|
67,328
|
|
65,537
|
|
|||
|
Dividends payable
|
15,186
|
|
—
|
|
|||
|
Current maturities of long-term debt
|
—
|
|
209,728
|
|
|||
|
Deferred revenue
|
49,078
|
|
43,916
|
|
|||
|
Total current liabilities
|
213,206
|
|
406,570
|
|
|||
|
Long-term debt, net of current maturities
|
369,191
|
|
—
|
|
|||
|
Other liabilities
|
17,753
|
|
21,030
|
|
|||
|
Deferred revenue
|
16,706
|
|
17,794
|
|
|||
|
Deferred income taxes
|
30,616
|
|
24,648
|
|
|||
|
Total liabilities
|
647,472
|
|
470,042
|
|
|||
|
Commitments and contingencies
|
|
|
|
|
|||
|
Shareholders’ equity:
|
|||||||
|
Preferred stock, no par value; 250 shares authorized; no shares issued
|
—
|
|
—
|
|
|||
|
Common stock, no par value; 50,000 shares authorized; 17,948 shares issued at December 31, 2013 and17,448 shares issued at December 31, 2012
|
295,955
|
|
274,709
|
|
|||
|
Retained earnings
|
408,834
|
|
369,586
|
|
|||
|
Total shareholders’ equity
|
704,789
|
|
644,295
|
|
|||
|
Total liabilities and shareholders’ equity
|
$
|
1,352,261
|
|
$
|
1,114,337
|
|
|
The accompanying notes are an integral part of the consolidated financial statements.
69
CHURCHILL DOWNS INCORPORATED
for the years ended December 31,
(in thousands, except per common share data)
|
2013
|
2012
|
2011
|
|||||||||
|
Net revenues:
|
|||||||||||
|
Racing
|
$
|
274,269
|
|
$
|
302,088
|
|
$
|
298,920
|
|
||
|
Gaming
|
297,473
|
|
223,112
|
|
212,629
|
|
|||||
|
Online
|
184,541
|
|
183,279
|
|
165,416
|
|
|||||
|
Other
|
23,042
|
|
22,817
|
|
19,889
|
|
|||||
|
779,325
|
|
731,296
|
|
696,854
|
|
||||||
|
Operating expenses:
|
|||||||||||
|
Racing
|
233,286
|
|
255,405
|
|
259,369
|
|
|||||
|
Gaming
|
222,879
|
|
163,686
|
|
157,875
|
|
|||||
|
Online
|
123,449
|
|
123,476
|
|
113,243
|
|
|||||
|
Other
|
26,540
|
|
25,356
|
|
20,828
|
|
|||||
|
Selling, general and administrative expenses
|
83,446
|
|
73,829
|
|
65,501
|
|
|||||
|
Insurance recoveries, net of losses
|
(375
|
)
|
(7,006
|
)
|
(972
|
)
|
|||||
|
Operating income
|
90,100
|
|
96,550
|
|
81,010
|
|
|||||
|
Other income (expense):
|
|||||||||||
|
Interest income
|
112
|
|
90
|
|
468
|
|
|||||
|
Interest expense
|
(6,231
|
)
|
(4,531
|
)
|
(8,924
|
)
|
|||||
|
Equity in losses of unconsolidated investments
|
(4,142
|
)
|
(1,701
|
)
|
(1,113
|
)
|
|||||
|
Miscellaneous, net
|
5,667
|
|
819
|
|
23,643
|
|
|||||
|
(4,594
|
)
|
(5,323
|
)
|
14,074
|
|
||||||
|
Earnings from continuing operations before provision for income taxes
|
85,506
|
|
91,227
|
|
95,084
|
|
|||||
|
Income tax provision
|
(30,473
|
)
|
(33,075
|
)
|
(34,289
|
)
|
|||||
|
Earnings from continuing operations
|
55,033
|
|
58,152
|
|
60,795
|
|
|||||
|
Discontinued operations, net of income taxes:
|
|||||||||||
|
(Loss) gain from operations
|
(50
|
)
|
124
|
|
(1
|
)
|
|||||
|
(Loss) gain on sale of assets
|
(83
|
)
|
—
|
|
3,561
|
|
|||||
|
Net earnings and comprehensive income
|
$
|
54,900
|
|
$
|
58,276
|
|
$
|
64,355
|
|
||
|
Net earnings (loss) per common share data:
|
|||||||||||
|
Basic
|
|||||||||||
|
Earnings from continuing operations
|
$
|
3.13
|
|
$
|
3.38
|
|
$
|
3.59
|
|
||
|
Discontinued operations
|
(0.01
|
)
|
0.01
|
|
0.21
|
|
|||||
|
Net earnings
|
$
|
3.12
|
|
$
|
3.39
|
|
$
|
3.80
|
|
||
|
Diluted
|
|||||||||||
|
Earnings from continuing operations
|
$
|
3.07
|
|
$
|
3.33
|
|
$
|
3.55
|
|
||
|
Discontinued operations
|
(0.01
|
)
|
0.01
|
|
0.21
|
|
|||||
|
Net earnings
|
$
|
3.06
|
|
$
|
3.34
|
|
$
|
3.76
|
|
||
|
Weighted average shares outstanding:
|
|||||||||||
|
Basic
|
17,294
|
|
17,047
|
|
16,638
|
|
|||||
|
Diluted
|
17,938
|
|
17,475
|
|
17,125
|
|
|||||
The accompanying notes are an integral part of the consolidated financial statements.
70
CHURCHILL DOWNS INCORPORATED
CONSOLIDATED STATEMENTS OF SHAREHOLDERS’ EQUITY
for the years ended December 31,
2013
,
2012
and
2011
(in thousands, except per common share data)
|
|
Common Stock
|
Retained
Earnings
|
|
|||||||||||
|
|
Shares
|
Amount
|
Total
|
|||||||||||
|
Balance, December 31, 2010
|
16,571
|
|
$
|
236,503
|
|
$
|
269,711
|
|
$
|
506,214
|
|
|||
|
Net earnings and comprehensive income
|
64,355
|
|
64,355
|
|
||||||||||
|
Issuance of common stock for convertible note payable
|
453
|
|
16,669
|
|
16,669
|
|
||||||||
|
Issuance of common stock for employee benefit plans
|
24
|
|
725
|
|
725
|
|
||||||||
|
Issuance of common stock for long-term incentive plan
|
103
|
|
1,929
|
|
1,929
|
|
||||||||
|
Tax windfall from share-based compensation
|
151
|
|
151
|
|
||||||||||
|
Repurchase of common stock
|
(25
|
)
|
(1,308
|
)
|
(1,308
|
)
|
||||||||
|
Restricted stock forfeitures
|
(1
|
)
|
—
|
|
||||||||||
|
Grant of restricted stock
|
53
|
|
—
|
|
||||||||||
|
Amortization of restricted stock
|
4,377
|
|
4,377
|
|
||||||||||
|
Cash dividends, $0.60 per share
|
(10,110
|
)
|
(10,110
|
)
|
||||||||||
|
Restricted dividends, $0.60 per share
|
(125
|
)
|
(125
|
)
|
||||||||||
|
Stock option plan expense
|
1,153
|
|
1,153
|
|
||||||||||
|
Balance, December 31, 2011
|
17,178
|
|
260,199
|
|
323,831
|
|
584,030
|
|
||||||
|
Net earnings and comprehensive income
|
58,276
|
|
58,276
|
|
||||||||||
|
Issuance of common stock for stock option exercises
|
155
|
|
5,663
|
|
5,663
|
|
||||||||
|
Issuance of common stock for employee benefit plans
|
19
|
|
714
|
|
714
|
|
||||||||
|
Issuance of common stock for long-term incentive plan
|
158
|
|
4,207
|
|
4,207
|
|
||||||||
|
Tax windfall from share-based compensation
|
1,407
|
|
1,407
|
|
||||||||||
|
Repurchase of common stock
|
(84
|
)
|
(5,094
|
)
|
(5,094
|
)
|
||||||||
|
Restricted stock forfeitures
|
(1
|
)
|
—
|
|
||||||||||
|
Grant of restricted stock
|
23
|
|
—
|
|
||||||||||
|
Amortization of restricted stock
|
6,377
|
|
6,377
|
|
||||||||||
|
Cash dividends, $0.72 per share
|
(12,351
|
)
|
(12,351
|
)
|
||||||||||
|
Restricted dividends, $0.72 per share
|
(170
|
)
|
(170
|
)
|
||||||||||
|
Stock option plan expense
|
1,236
|
|
1,236
|
|
||||||||||
|
Balance, December 31, 2012
|
17,448
|
|
274,709
|
|
369,586
|
|
644,295
|
|
||||||
|
Net earnings and comprehensive income
|
|
|
|
|
54,900
|
|
54,900
|
|
||||||
|
Issuance of common stock for stock option exercises
|
7
|
|
330
|
|
|
330
|
|
|||||||
|
Issuance of common stock for employee benefit plans
|
17
|
|
805
|
|
|
805
|
|
|||||||
|
Issuance of common stock for long-term incentive plan
|
174
|
|
6,371
|
|
|
6,371
|
|
|||||||
|
Tax windfall from share-based compensation
|
|
|
2,981
|
|
|
2,981
|
|
|||||||
|
Repurchase of common stock
|
(133
|
)
|
(10,723
|
)
|
|
(10,723
|
)
|
|||||||
|
Restricted stock forfeitures
|
(1
|
)
|
|
|
|
—
|
|
|||||||
|
Grant of restricted stock
|
436
|
|
|
|
|
—
|
|
|||||||
|
Amortization of restricted stock
|
|
|
20,525
|
|
|
20,525
|
|
|||||||
|
Cash dividends, $0.87 per share
|
|
|
|
|
(15,186
|
)
|
(15,186
|
)
|
||||||
|
Restricted dividends, $0.87 per share
|
|
|
|
|
(466
|
)
|
(466
|
)
|
||||||
|
Stock option plan expense
|
|
|
957
|
|
|
957
|
|
|||||||
|
Balance, December 31, 2013
|
17,948
|
|
$
|
295,955
|
|
$
|
408,834
|
|
$
|
704,789
|
|
|||
The accompanying notes are an integral part of the consolidated financial statements.
71
|
CHURCHILL DOWNS INCORPORATED
for the years ended December 31,
(in thousands)
|
|||||||||||
|
2013
|
2012
|
2011
|
|||||||||
|
Cash flows from operating activities:
|
|||||||||||
|
Net earnings and comprehensive income
|
$
|
54,900
|
|
$
|
58,276
|
|
$
|
64,355
|
|
||
|
Adjustments to reconcile net earnings to net cash provided by operating activities:
|
|||||||||||
|
Depreciation and amortization
|
61,750
|
|
55,600
|
|
55,170
|
|
|||||
|
Asset impairment loss
|
—
|
|
25
|
|
511
|
|
|||||
|
Loss (gain) on sale of business
|
131
|
|
—
|
|
(271
|
)
|
|||||
|
(Gain) loss on asset disposition
|
(497
|
)
|
(128
|
)
|
52
|
|
|||||
|
Equity in losses of unconsolidated investments
|
4,142
|
|
1,701
|
|
1,113
|
|
|||||
|
Unrealized gain on derivative instruments
|
—
|
|
—
|
|
(3,096
|
)
|
|||||
|
Share-based compensation
|
21,482
|
|
7,613
|
|
5,531
|
|
|||||
|
Deferred tax provision
|
5,284
|
|
9,659
|
|
14,097
|
|
|||||
|
Other
|
689
|
|
910
|
|
2,489
|
|
|||||
|
Increase (decrease) in cash resulting from changes in operating assets and liabilities, net of business acquisitions and dispositions:
|
|||||||||||
|
Restricted cash
|
6,359
|
|
9,178
|
|
18,342
|
|
|||||
|
Accounts receivable
|
(495
|
)
|
(5,396
|
)
|
(407
|
)
|
|||||
|
Other current assets
|
1,372
|
|
(3,075
|
)
|
3,235
|
|
|||||
|
Income taxes
|
(11,023
|
)
|
764
|
|
7,995
|
|
|||||
|
Accounts payable
|
(5,879
|
)
|
3,459
|
|
14,447
|
|
|||||
|
Purses payable
|
(6,594
|
)
|
(10,148
|
)
|
7,301
|
|
|||||
|
Accrued expenses
|
4,866
|
|
9,923
|
|
2,441
|
|
|||||
|
Deferred revenue
|
6,029
|
|
8,804
|
|
3,633
|
|
|||||
|
Deferred riverboat subsidy
|
—
|
|
—
|
|
(40,492
|
)
|
|||||
|
Other assets and liabilities
|
2,399
|
|
(2,758
|
)
|
16,549
|
|
|||||
|
Net cash provided by operating activities
|
144,915
|
|
144,407
|
|
172,995
|
|
|||||
|
Cash flows from investing activities:
|
|||||||||||
|
Additions to property and equipment
|
(48,771
|
)
|
(41,298
|
)
|
(22,667
|
)
|
|||||
|
Acquisition of businesses, net of cash acquired
|
(154,872
|
)
|
(142,915
|
)
|
—
|
|
|||||
|
Acquisition of gaming licenses
|
(2,650
|
)
|
(2,250
|
)
|
(2,250
|
)
|
|||||
|
Investment in joint venture
|
(70,500
|
)
|
(19,850
|
)
|
—
|
|
|||||
|
Purchases of minority investments
|
(902
|
)
|
(2,153
|
)
|
(1,189
|
)
|
|||||
|
Proceeds from sale of assets
|
15
|
|
833
|
|
55
|
|
|||||
|
Proceeds from insurance recoveries
|
—
|
|
10,505
|
|
183
|
|
|||||
|
Change in deposit wagering asset
|
(4,192
|
)
|
(2,860
|
)
|
(1,010
|
)
|
|||||
|
Net cash used in investing activities
|
(281,872
|
)
|
(199,988
|
)
|
(26,878
|
)
|
|||||
|
Cash flows from financing activities:
|
|||||||||||
|
Borrowings on bank line of credit
|
740,131
|
|
554,248
|
|
320,181
|
|
|||||
|
Repayments of bank line of credit
|
(880,667
|
)
|
(472,083
|
)
|
(457,736
|
)
|
|||||
|
Proceeds from bond issuance
|
300,000
|
|
—
|
|
—
|
|
|||||
|
Change in bank overdraft
|
(5,053
|
)
|
555
|
|
(188
|
)
|
|||||
|
Payment of dividends
|
—
|
|
(22,461
|
)
|
(8,165
|
)
|
|||||
|
Repurchase of common stock
|
(10,723
|
)
|
(5,094
|
)
|
(1,308
|
)
|
|||||
|
Common stock issued
|
1,135
|
|
6,377
|
|
725
|
|
|||||
|
Windfall tax provision from share-based compensation
|
2,981
|
|
1,407
|
|
151
|
|
|||||
|
Loan origination fees
|
(2,258
|
)
|
(67
|
)
|
(155
|
)
|
|||||
|
Debt issuance costs
|
(5,250
|
)
|
—
|
|
—
|
|
|||||
|
Change in deposit wagering liability
|
4,192
|
|
2,551
|
|
802
|
|
|||||
|
Net cash provided by (used in) financing activities
|
144,488
|
|
65,433
|
|
(145,693
|
)
|
|||||
|
Net increase in cash and cash equivalents
|
7,531
|
|
9,852
|
|
424
|
|
|||||
|
Cash and cash equivalents, beginning of year
|
37,177
|
|
27,325
|
|
26,901
|
|
|||||
|
Cash and cash equivalents, end of year
|
$
|
44,708
|
|
$
|
37,177
|
|
$
|
27,325
|
|
||
The accompanying notes are an integral part of the consolidated financial statements.
72
CHURCHILL DOWNS INCORPORATED
CONSOLIDATED STATEMENTS OF CASH FLOWS (continued)
Years ended December 31,
(in thousands)
|
2013
|
2012
|
2011
|
|||||||||
|
Supplemental disclosures of cash flow information:
|
|||||||||||
|
Cash paid during the period for:
|
|||||||||||
|
Interest
|
$
|
4,032
|
|
$
|
2,856
|
|
$
|
5,521
|
|
||
|
State tax credits
|
1,298
|
|
—
|
|
—
|
|
|||||
|
Income taxes
|
31,324
|
|
24,462
|
|
24,785
|
|
|||||
|
Schedule of non-cash investing and financing activities:
|
|||||||||||
|
Issuance of common stock for conversion of convertible note payable
|
$
|
—
|
|
$
|
—
|
|
$
|
19,399
|
|
||
|
Issuance of common stock in connection with the Company LTIP, the New Company LTIP and other restricted stock plans
|
30,678
|
|
5,459
|
|
5,058
|
|
|||||
|
Dividends payable
|
15,186
|
|
—
|
|
—
|
|
|||||
|
Dividends accrued on restricted stock plans
|
466
|
|
170
|
|
125
|
|
|||||
|
Accrued debt issuance costs
|
1,000
|
|
—
|
|
—
|
|
|||||
|
Property and equipment additions included in accounts payable and accrued expenses
|
3,769
|
|
5,254
|
|
787
|
|
|||||
|
Property and equipment reductions included in accounts receivable
|
—
|
|
—
|
|
9,870
|
|
|||||
|
Assets acquired and liabilities assumed from acquisition of businesses:
|
|||||||||||
|
Accounts receivable, net
|
$
|
252
|
|
$
|
486
|
|
$
|
—
|
|
||
|
Other current assets
|
799
|
|
688
|
|
—
|
|
|||||
|
Other non-current assets
|
—
|
|
282
|
|
—
|
|
|||||
|
Property and equipment, net
|
45,105
|
|
64,935
|
|
—
|
|
|||||
|
Goodwill
|
50,202
|
|
36,702
|
|
—
|
|
|||||
|
Other intangible assets
|
64,693
|
|
46,004
|
|
—
|
|
|||||
|
Accounts payable
|
(1,063
|
)
|
(780
|
)
|
—
|
|
|||||
|
Accrued expenses
|
(5,111
|
)
|
(5,234
|
)
|
—
|
|
|||||
|
Deferred revenue
|
(5
|
)
|
(168
|
)
|
—
|
|
|||||
The accompanying notes are an integral part of the consolidated financial statements.
73
Churchill Downs Incorporated
Notes to Consolidated Financial Statements
Basis of Presentation
Churchill Downs Incorporated (the “Company”) is a diversified provider of pari-mutuel horseracing, casino gaming, entertainment, and is the country’s premier source of online account wagering on horseracing events. The Company offers gaming products through its casinos in Mississippi, its slot and video poker operations in Louisiana, its slot and poker operations in Florida, and its casino in Maine.
The accompanying consolidated financial statements include the accounts of the Company and its wholly-owned subsidiaries, Calder Race Course, Inc. and Tropical Park, Inc. which hold licenses to conduct pari-mutuel wagering and horseracing at Calder Race Course (“Calder”), Arlington International Race Course, LLC (“Arlington”), Churchill Downs Louisiana Horseracing Company, LLC (“CDI Louisiana”), Churchill Downs Louisiana Video Poker Company, LLC (“CD Louisiana Video”) and its wholly-owned subsidiary, Video Services, LLC (“VSI”), SW Gaming, LLC (“Harlow’s”), Oxford Casino (“Oxford”), Magnolia Hill, LLC ("Riverwalk"), Churchill Downs Technology Initiatives Company (“CDTIC”), the owner and operator of TwinSpires and United Tote Company, Inc. (“United Tote”), Churchill Downs Investment Company (“CDIC”), Bluff Media ("Bluff"), as well as the Company's equity investment in HRTV, LLC (“HRTV”) and a
50%
joint venture in Miami Valley Gaming & Racing LLC ("MVG"). All significant intercompany balances and transactions have been eliminated in consolidation.
The Consolidated Statements of Comprehensive Income include net revenues and operating expenses associated with the Company's Racing Operations, Gaming, Online Business and Other Investments operating segments and are defined as follows:
Racing:
net revenues and corresponding operating expenses associated with commissions earned on wagering at the Company’s racetracks, off-track betting facilities (“OTBs”) and simulcast fees earned from other wagering sites. In addition, amounts include ancillary revenues and expenses generated by the pari-mutuel facilities including admissions, sponsorships and licensing rights, food and beverage sales and fees for the alternative uses of its facilities.
Gaming:
net revenues and corresponding operating expenses generated from slot machines, table games and video poker. In addition, it includes ancillary revenues and expenses generated by food and beverage sales, hotel operations revenue and miscellaneous other revenue.
Online:
net revenues and corresponding operating expenses generated by the Company’s Advance Deposit Wagering (“ADW”) business from wagering through the Internet, telephone or other mobile devices on pari-mutuel events. In addition, it includes the Company’s information business that provides data information and processing services to the equine industry.
Other:
net revenues and corresponding operating expenses generated by United Tote Company, the Company’s provider of pari-mutuel wagering systems and Bluff.
Current Year Reclassifications
During the year ended December 31, 2013, the Company completed the sale of
100%
of the assets of Fight! Magazine ("Fight"), a division of Bluff which was acquired by the Company in February 2012. Net revenues, operating expenses and the loss on the sale of Fight for the years ended December 31, 2013 and 2012, have been reclassified to discontinued operations. There was no impact from these reclassifications on net earnings or cash flows.
Summary of Significant Accounting Policies
Cash Equivalents
The Company considers investments with original maturities of three months or less to be cash equivalents. The Company has, from time to time, cash in the bank in excess of federally insured limits. Checks issued but not presented to banks frequently result in overdraft balances for accounting purposes and are classified as a current liability in the Consolidated Balance Sheets.
Restricted Cash
Restricted cash represents amounts due to horsemen for purses, stakes and awards as well as customer deposits collected for advance deposit wagering. In addition, as of December 31, 2013 and 2012, restricted cash included $
8.8 million
and
$12.9 million
, respectively, of funds related to the Horse Racing Equity Trust Fund ("HRE Trust Fund") proceeds in Illinois, as further described in Note 22.
74
Churchill Downs Incorporated
Notes to Consolidated Financial Statements
Allowance for Doubtful Accounts Receivable
The Company maintains an allowance for doubtful accounts for estimated losses resulting from the inability of its customers to make required payments. The allowance is maintained at a level considered appropriate based on historical and other factors that affect collectability. Uncollectible accounts receivable are written off against the allowance for doubtful accounts receivable when management determines that the probability of payment is remote and collection efforts have ceased.
Property and Equipment
Property and equipment are recorded at cost. Depreciation is calculated using the straight-line method over the estimated useful lives of the related assets as follows:
10
to
40
years for grandstands and buildings,
2
to
10
years for equipment,
2
to
10
years for furniture and fixtures and
10
to
20
years for tracks and other improvements.
Intangible Assets
The Company determines the initial carrying value of its intangible assets in accordance with purchase accounting based on the anticipated future cash flows relating to the intangible asset. Definite-lived intangible assets are being amortized over their estimated useful lives ranging from
one
to
thirty
years using the straight-line method. Definite-lived intangible assets are reviewed for impairment in accordance with the Company's policy for long-lived assets below.
Goodwill is tested for impairment annually as of March 31 or between annual tests if events occur or circumstances indicate there may be impairment. Guidance related to goodwill impairment testing allows an entity the option to first assess qualitative factors to determine whether the existence of events or circumstances leads to a determination that it is more likely than not that the fair value of a reporting unit is less than its carrying amount. If, after assessing the totality of events or circumstances, an entity determines it is more likely than not that the fair value of a reporting unit is less than the carrying amount, then the Company would perform the two step goodwill impairment test. The first step, used to identify potential impairment, is a comparison of the reporting unit's estimated fair value to its carrying value, including goodwill. If the fair value of the reporting unit exceeds its carrying value, applicable goodwill is considered not to be impaired. If the carrying value exceeds fair value, there is an indication of impairment and the second step is performed to measure the amount of the impairment, if any. The second step of the goodwill impairment test consists of comparing the implied fair value of reporting unit goodwill with the carrying amount of that goodwill. If the carrying amount of reporting unit goodwill exceeds the implied fair value of that goodwill, an impairment loss is recognized equal to such excess. The implied fair value of goodwill is determined in the same manner, as when determining the amount of goodwill recognized in a business combination.
The Company considers its slots gaming rights and trademarks as indefinite-lived intangible assets that do not require amortization based on its future expectations to operate its gaming facilities indefinitely, as well as its historical experience in renewing these intangible assets at minimal cost with various state gaming commissions. Rather, these intangible assets are tested annually as of March 31, or more frequently if indicators of impairment exist. In 2013, in connection with its annual impairment testing, the Company adopted Financial Accounting Standards Board ("FASB") ASU No. 2012-02,
Intangibles-Goodwill and Other: Testing Indefinite-Lived Assets for Impairment
which allows an entity the option to first assess qualitative factors to determine whether it is more likely than not that the fair value of the indefinite-lived intangible asset is less than its carrying amount. If the carrying amount of the slots gaming rights and trademark intangible assets exceed their fair value, an impairment loss is recognized. The Company completed the required annual impairment tests of goodwill and indefinite-lived intangible assets, and no adjustment to the carrying values of goodwill or indefinite-lived intangible assets was required.
Long-lived Assets-Impairments
In the event that facts and circumstances indicate that the carrying amount of tangible assets and other long-lived assets or groups of assets may be impaired, an evaluation of recoverability is performed. If an evaluation is required, the estimated future undiscounted cash flows associated with the assets is compared to the assets’ carrying amount to determine if an impairment loss should be recorded. The impairment loss is based on the excess, if any, of the carrying value over the fair value of the assets.
Fair Value of Assets and Liabilities
The Company adheres to a hierarchy for ranking the quality and reliability of the information used to determine fair values. Assets and liabilities that are carried at fair value are classified and disclosed in one of the following three categories: Level 1: Unadjusted quoted market prices in active markets for identical assets or liabilities; Level 2: Unadjusted quoted prices in active markets for similar assets or liabilities, unadjusted quoted prices for identical or similar assets or liabilities in markets that are not active, or inputs other than quoted prices that are observable for the asset or liability; and Level 3: Unobservable inputs for the asset or liability. The Company endeavors to utilize the best available information in measuring fair value. Financial assets and liabilities are classified based on the lowest level of input that is significant to the fair value measurement.
75
Churchill Downs Incorporated
Notes to Consolidated Financial Statements
Internal Use Software
The Company capitalized internal use software primarily related to its Online Business of approximately
$7.4 million
,
$5.2 million
and
$3.2 million
during the years ended December 31, 2013, 2012 and 2011, respectively. The estimated useful life of costs capitalized is generally
three
years. During the years ended December 31, 2013, 2012 and 2011, the amortization of capitalized costs totaled approximately
$5.1 million
,
$4.2 million
and
$3.5 million
, respectively. Capitalized internal use software is included in property and equipment, net. The Company records internal use software in accordance with current accounting guidance governing computer software developed or obtained for internal use.
Loan Origination Costs
During the years ended December 31, 2013, 2012 and 2011, the Company incurred
$2.3 million
,
$0.1 million
and
$0.2 million
, respectively, in loan origination costs associated with the second and third amended and restated credit facility, which were capitalized and are being amortized as interest expense over the remaining term of the credit facility.
Debt Issuance Costs
Debt issuance costs are deferred and amortized to interest expense using the effective interest method over the contractual term of the underlying indebtedness. During the year ended December 31, 2013, the Company incurred
$6.3 million
in debt issuance costs associated with the issuance of the Senior Unsecured Notes.
Investment in and Advances to Unconsolidated Affiliates
The Company has investments in unconsolidated affiliates accounted for under the equity method. Under the equity method, carrying value is adjusted for the Company's share of the investees' earnings and losses, as well as capital contributions to and distributions from these companies. Distributions in excess of equity method earnings are recognized as a return of investment and recorded as investing cash inflows in the consolidated statements of cash flows. The Company classified operating income and losses as well as gains and impairments related to its investments in unconsolidated affiliates as a component of operating income or loss, as the Company's investment in such unconsolidated affiliates are an extension of the Company's core business operations.
The Company evaluates its investment in unconsolidated affiliates for impairment whenever events or changes in circumstances indicate that the carrying value of its investment may have experienced an "other-than-temporary" decline in value. If such conditions exist, the Company compares the estimated fair value of the investment to its carrying value to determine if an impairment is indicated and determines whether the impairment is "other-than-temporary" based on its assessment of all relevant factors, including consideration of the Company's intent and ability to retain its investment. The Company estimates fair value using a discounted cash flow analysis based on estimated future results of the investee.
Revenue Recognition
Pari-mutuel revenues are recognized upon occurrence of the live race that is presented for wagering and after that live race is made official by the respective state’s racing regulatory body. Gaming revenues represent net gaming wins, which is the difference between gaming wins and losses. Other operating revenues such as admissions, programs and concession revenues are recognized once delivery of the product or services has occurred.
Approximately
42%
of the Company’s revenues for the year ended
December 31, 2013
, are generated by pari-mutuel wagering on live and simulcast racing content through OTBs and ADW providers. Live racing handle includes patron wagers made on live races at the Company’s racetracks and also wagers made on imported simulcast signals by patrons at the Company’s racetracks during live meets. Import simulcasting handle includes wagers on imported signals at the Company’s racetracks when the respective tracks are not conducting live racing meets, at the Company’s OTBs and through the Company’s ADW providers throughout the year. Export handle includes all patron wagers made on live racing signals sent to other tracks, OTBs and ADW providers. Advance deposit wagering consists of patron wagers through an advance deposit account.
The Company retains as revenue a predetermined percentage or commission on the total amount wagered, and the balance is distributed to the winning patrons. The gross percentages earned approximated
10%
of handle for our Racing Operations segment and
19%
of handle for our Online Business segment. The Company is subject to pari-mutuel and gaming taxes based on pari-mutuel and gaming revenues in the jurisdictions in which it operates. These taxes are recorded as an operating expense in the Consolidated Statements of Comprehensive Income.
Customer Loyalty Programs
The Company's customer loyalty programs offer incentives to customers who wager at the Company’s racetracks, through its advance deposit wagering platform, TwinSpires.com, or at its gaming facilities. The TSC Elite program, which was introduced
76
Churchill Downs Incorporated
Notes to Consolidated Financial Statements
during the year ended December 31, 2012, to replace the previous program, TwinSpires Club, is for pari-mutuel wagering at the Company’s racetracks or through TwinSpires.com. The Player’s Club is offered at the Company’s gaming facilities in Louisiana, Florida, Maine and Mississippi. Under the programs, customers are able to accumulate points over time that they may redeem for cash, free play, merchandise or food and beverage items at their discretion under the terms of the programs. As a result of the ability of the customer to accumulate points, the Company accrues the cost of points, after consideration of estimated forfeitures, as they are earned. For the TSC Elite program, the estimated value of the cost to redeem points is recorded as the points are earned. To arrive at the estimated cost associated with points, estimates and assumptions are made regarding incremental costs of the benefits, rates and the mix of goods and services for which points will be redeemed. For the Player’s Cub program, the retail value of the points-based cash awards or complimentary goods and services is netted against revenue as a promotional allowance. As of December 31, 2013 and 2012, the outstanding reward point liability was
$2.1 million
, for each respective period.
Account Wagering Deposit Liabilities
Account wagering deposit liabilities consist of deposits received from TwinSpires.com and Velocity customers, to be used to fund wagering through the Online Business players' accounts. Account wagering deposit liability balances are also classified as restricted cash within the Company's Consolidated Balance Sheets.
Promotional Allowances
Promotional allowances, which include the Company’s customer loyalty programs, primarily consist of the retail value of complimentary goods and services provided to guests at no charge. The retail value of these promotional allowances is included in gross revenue and then deducted to arrive at net revenue.
During the years ended December 31,
2013
,
2012
and
2011
, promotional allowances of
$33.0 million
,
$21.5 million
and
$17.1 million
, respectively, were included as a reduction to net revenues. During those periods, Online promotional allowances were
$12.3 million
,
$9.3 million
and
$6.5 million
, Gaming promotional allowances were
$19.8 million
,
$11.2 million
and
$8.7 million
, and Racing promotional allowances were
$0.9 million
,
$1.0 million
and
$2.0 million
, respectively. The estimated cost of providing promotional allowances is included in operating expenses for the years ended December 31,
2013
,
2012
and
2011
and totaled
$9.5 million
,
$5.7 million
and
$4.6 million
, respectively.
Deferred Revenue
Deferred revenue includes advance sales related to the Kentucky Derby and Kentucky Oaks races in Kentucky and other advance billings on racing events. Revenues from these advance billings are recognized when the related event occurs. Deferred revenue also includes advance sales of Personal Seat Licenses (“PSLs”) and luxury suites. PSLs represent the ownership of a specific seat for the Kentucky Derby, Kentucky Oaks and Breeders’ Cup races at Churchill Downs and have a contractual life of either
one
,
two
,
three
,
five
or
thirty
years.
Revenue from PSLs is recognized when the Kentucky Derby, Kentucky Oaks and Breeders’ Cup races occur on a ratable basis over the term of the contract. Luxury suites are sold for specific racing events as well as for a predetermined contractual term. Revenue related to the sale of luxury suites is recognized as they are utilized when the related event occurs.
Pari-mutuel and Gaming Taxes
The Company recognizes pari-mutuel and gaming tax expense based on the statutorily required percentage of revenue that is required to be paid to state and local jurisdictions in the states in which wagering occurs. Individual states and local jurisdictions set pari-mutuel tax rates which range from
0.5%
to
10.0%
of the total handle wagered by patrons. Gaming tax rates range from
1.5%
to
46%
of net gaming revenue.
Purse Expense
The Company recognizes purse expense based on the statutorily required percentage of revenue that is required to be paid out in the form of purses to the qualifying finishers of horseraces run at the Company’s racetracks in the period in which wagering occurs. The Company incurs a liability for all unpaid purses to be paid out. The Company may pay out purses in excess of statutorily required amounts resulting in purse overpayments, which are expensed as incurred. Recoveries of purse overpayments are recognized in the period they are realized.
Income Taxes
77
Churchill Downs Incorporated
Notes to Consolidated Financial Statements
In accordance with the liability method of accounting for income taxes, the Company recognizes the amount of taxes payable or refundable for the current year and deferred tax assets and liabilities for the future tax consequences of events that have been recognized in the consolidated financial statements or tax returns.
Adjustments to deferred taxes are determined based upon the changes in differences between the book basis and tax basis of assets and liabilities, measured by enacted tax rates the Company estimates will be applicable when these differences are expected to reverse. Changes in current tax laws, enacted tax rates or the estimated level of taxable income or non-deductible expenses could change the valuation of deferred tax assets and liabilities and affect the overall effective tax rate and tax provision.
When tax returns are filed, it is highly certain that some positions taken will be sustained upon examination by the taxing authorities, while others are subject to uncertainty about the merits of the position taken or the amount of the position that will be ultimately sustained. The benefit of a tax position is recognized in the financial statements in the period during which, based on all available evidence, management believes it is more likely than not that the position will be sustained upon examination, including the resolution of appeals or litigation processes, if any. Tax positions taken are not offset or aggregated with other positions. Tax positions that meet the more-likely-than-not recognition threshold are measured as the largest amount of tax benefit that is more than
50 percent
likely of being realized upon settlement with the applicable taxing authority. The portion of the benefits associated with the tax positions taken that exceeds the amount measured as described above is reflected as a liability for unrecognized tax benefits in the accompanying balance sheet along with any associated interest and penalties that would be payable to the taxing authorities upon examination.
Uncashed Winning Tickets
The Company’s policy for uncashed winning pari-mutuel tickets follows the requirements as set forth by each state’s pari-mutuel wagering laws. The Company will either remit uncashed pari-mutuel ticket winnings to the state according to the state’s escheat or pari-mutuel laws or will maintain the liability during the required holding period according to state law at which time the Company will recognize it as income.
Insurance Recoveries
In connection with losses incurred from natural disasters, insurance proceeds are collected on existing business interruption and property and casualty insurance policies. When losses are sustained in one accounting period and the amounts to be recovered are collected in a subsequent accounting period, management uses estimates and judgment to determine the amounts that are probable of recovery. Estimated losses, net of anticipated insurance recoveries, are recognized in the period the natural disaster occurs and the amount of the loss is determinable. To the extent that insurance proceeds received are less than the carrying value of the assets impaired, the proceeds are reported in the statement of cash flows as an investing activity. Insurance recoveries in excess of estimated losses are recognized when realizable and are reported in net earnings in the statement of cash flows as an operating activity.
Workers’ Compensation and General Liability Self-Insurance
The Company is substantially self-insured for losses related to workers’ compensation and general liability claims with stop-loss insurance for both coverages. Losses are accrued based upon the Company’s undiscounted estimates of the aggregate liability for claims incurred based on historical experience and certain actuarial assumptions. Expected recoveries from third party insurance companies are also estimated and accrued.
Advertising
The Company expenses the costs of general advertising and associated promotional expenditures at the time the costs are incurred. During the years ended December 31, 2013, 2012 and 2011, the Company incurred advertising expenses of approximately
$9.5 million
,
$6.9 million
and
$6.8 million
, respectively.
Share-Based Compensation
All share-based payments to employees, including grants of employee stock options and restricted stock, are recognized as compensation expense over the service period based on the fair value on the date of grant.
78
Churchill Downs Incorporated
Notes to Consolidated Financial Statements
Computation of Net Earnings per Common Share
Net earnings per common share is presented for both basic earnings per common share (“Basic EPS”) and diluted earnings per common share (“Diluted EPS”). Earnings attributable to securities that are deemed to be participating securities are excluded from the calculation of Basic EPS using the two-class method. The Company has determined that employee restricted stock grants, including awards granted under its long-term incentive plans, are participating securities. Basic EPS is based upon the weighted average number of common shares outstanding during the period, excluding unvested restricted stock and stock options held by employees. Diluted EPS is based upon the weighted average number of common and potential common shares outstanding during the period. Potential common shares result from the assumed exercise of outstanding stock options as well as unvested restricted stock, the proceeds of which are then assumed to have been used to repurchase outstanding common stock using the treasury stock method. For periods that the Company reports a net loss, all potential common shares are considered anti-dilutive and are excluded from calculations of Diluted EPS. For periods when the Company reports net earnings, potential common shares with exercise prices in excess of the Company’s average common stock fair value for the related period are considered anti-dilutive and are excluded from calculations of Diluted EPS. See Note 19 for further details.
Use of Estimates and Critical Accounting Policies
The preparation of financial statements in conformity with generally accepted accounting principles requires management to make estimates and assumptions that affect the reported amounts of assets and liabilities and disclosure of contingent assets and liabilities at the date of the financial statements and the reported amounts of revenues and expenses during the reporting period. Actual results could differ from those estimates. The Company’s most significant estimates relate to the valuation of property and equipment, income tax liabilities, goodwill and other intangible assets, which may be significantly affected by changes in the regulatory environment in which the Company operates, and to the aggregate costs for self-insured liability claims.
Comprehensive Income
The Company has no other components of comprehensive income and, as such, comprehensive income is the same as net earnings as presented in the Consolidated Statements of Comprehensive Income.
Reclassifications
Certain financial statement accounts have been reclassified in prior years to conform to current year presentation. There was no impact from these reclassifications on total assets, total liabilities, total net revenues, operating income or cash flows.
Recent Accounting Pronouncements
As noted in Intangible Assets above, the Company adopted ASU No. 2012-02, Intangibles-Goodwill and Other: Testing Indefinite-Lived Intangible Assets for Impairment. ASU 2012-02 simplifies indefinite-lived intangible asset impairment testing by adding a qualitative review step to assess whether a quantitative impairment analysis is necessary. Under the amended rule, a testing methodology similar to that which is performed for goodwill impairment testing is acceptable for assessing a company's indefinite-lived intangible assets. The new standard became effective for indefinite-lived intangible asset impairment tests performed for fiscal years beginning after September 15, 2012.
Oxford Casino Acquisition
On July 17, 2013, the Company completed its acquisition of Oxford Casino (“Oxford”) in Oxford, Maine for cash consideration of approximately
$168.6 million
. The transaction included the acquisition of a
25,000
-square-foot casino and various dining facilities. The acquisition continued the Company's diversification and growth strategies to invest in assets with rates of returns attractive to the Company's shareholders. The Company financed the acquisition with borrowings under its Senior Secured Credit Facility.
During the period from July 17, 2013, through
December 31, 2013
, Oxford contributed revenues of
$34.4 million
and earnings from continuing operations before provision for income taxes of
$6.1 million
. In accordance with accounting standards, the Company completed the purchase price allocation during the year ended December 31, 2013. The following table summarizes (in thousands) the preliminary fair values of the assets acquired and liabilities assumed, net of cash acquired of
$13.7 million
, at the date of the acquisition.
79
Churchill Downs Incorporated
Notes to Consolidated Financial Statements
|
|
Total
|
||
|
Accounts receivable
|
$
|
252
|
|
|
Prepaid expenses
|
675
|
|
|
|
Inventory
|
124
|
|
|
|
Property and equipment
|
45,105
|
|
|
|
Goodwill
|
50,202
|
|
|
|
Other intangible assets
|
64,693
|
|
|
|
Total assets acquired
|
161,051
|
|
|
|
Accounts payable
|
1,063
|
|
|
|
Accrued expenses
|
5,111
|
|
|
|
Other liabilities
|
5
|
|
|
|
Total liabilities acquired
|
6,179
|
|
|
|
Purchase price, net of cash acquired
|
$
|
154,872
|
|
The preliminary fair value of other intangible assets consists of the following (in thousands):
|
Total
|
|||
|
Slot gaming rights
|
$
|
58,500
|
|
|
Customer relationships
|
1,700
|
|
|
|
Tradename
|
2,400
|
|
|
|
Other intangibles
|
2,093
|
|
|
|
Total intangible assets
|
$
|
64,693
|
|
Depreciation of property and equipment acquired is calculated using the straight-line method over the estimated remaining useful lives of the related assets as follows: 2 to 5 years for computer hardware and software, 2 to 9 years for equipment, 6 years for furniture and fixtures, 40 years for buildings and 14 years for building improvements. Amortization of definite-lived intangible assets acquired is calculated using the straight-line method over the estimated useful life of the related intangible asset. Intangible assets include customer relationships valued at
$1.7 million
with a life of 6 years. Other intangibles include table game fees paid to the State of Maine which is amortized over the 20-year contract period. Slot gaming rights and tradename are determined to have indefinite lives and are not being amortized.
Goodwill of
$50.2 million
was recognized given the expected contribution of the Oxford acquisition to the Company's overall business strategy. The entire balance of goodwill has been allocated to the Gaming business segment. The Company expects to deduct goodwill for tax purposes.
Riverwalk Casino Hotel Acquisition
On October 23, 2012, the Company completed its acquisition of Riverwalk Casino Hotel ("Riverwalk") in Vicksburg, Mississippi for cash consideration of approximately
$145.6 million
. The transaction includes the acquisition of a
25,000
-square-foot casino, an
80
-room hotel, a
5,600
-square-foot event center and dining facilities on approximately
22
acres of land. The acquisition continues the Company's diversification and growth strategies to invest in assets with an expected yield on investment to enhance shareholder value. The Company financed the acquisition with borrowings under its Senior Secured Credit Facility.
During the years ended December 31, 2013 and 2012, Riverwalk recognized revenues of
$53.6 million
and
$10.3 million
, respectively, and earnings from continuing operations of
$9.8 million
and
$2.0 million
, respectively, subsequent to its acquisition by the Company. In accordance with accounting standards, the company completed the purchase price allocation during the year ended December 31, 2013. The following table summarizes the fair values of the assets acquired and liabilities assumed, net of cash acquired of
$9.4 million
, at the date of the acquisition.
80
Churchill Downs Incorporated
Notes to Consolidated Financial Statements
|
|
Total
|
||
|
Accounts receivable
|
$
|
228
|
|
|
Prepaid expenses
|
589
|
|
|
|
Inventory
|
99
|
|
|
|
Other assets
|
282
|
|
|
|
Property and equipment
|
64,908
|
|
|
|
Goodwill
|
32,768
|
|
|
|
Other intangible assets
|
43,100
|
|
|
|
Total assets acquired
|
141,974
|
|
|
|
Accounts payable
|
552
|
|
|
|
Accrued expenses
|
5,234
|
|
|
|
Other liabilities
|
1
|
|
|
|
Total liabilities acquired
|
5,787
|
|
|
|
Purchase price, net of cash acquired
|
$
|
136,187
|
|
The fair value of other intangible assets consists of the following (in thousands):
|
Total
|
|||
|
Slot gaming rights
|
$
|
25,300
|
|
|
Customer relationships
|
10,300
|
|
|
|
Tradename
|
7,500
|
|
|
|
Total intangible assets
|
$
|
43,100
|
|
Depreciation of property and equipment acquired is calculated using the straight-line method over the estimated remaining useful lives of the related assets as follows:
3
to
5
years for computer hardware and software,
4
to
6
years for equipment,
4
to
6
years for furniture and fixtures,
40 years
for buildings and
8
to
22
years for building improvements. Amortization of definite-lived intangible assets acquired is calculated using the straight-line method over the estimated useful life of the related intangible asset. Intangible assets include customer relationships valued at
$10.3 million
with a life of
6
years. Slot gaming rights and tradename are determined to have indefinite lives and are not being amortized.
Goodwill of
$32.8 million
was recognized given the expected contribution of the Riverwalk acquisition to the Company's overall business strategy. The entire balance of goodwill has been allocated to the Gaming business segment. The Company expects to deduct goodwill for tax purposes.
Miami Valley Gaming & Racing Joint Venture
During March 2012, the Company entered into a
50%
joint venture with Delaware North Companies Gaming & Entertainment Inc. (“DNC”) to develop a new harness racetrack and video lottery terminal (“VLT”) gaming facility in Lebanon, Ohio.
Through the joint venture agreement, the Company and DNC formed a new company, MVG, which will manage both the Company’s and DNC’s interests in the development and operation of the racetrack and VLT gaming facility. On December 21, 2012, MVG completed the purchase of the harness racing licenses and certain assets held by Lebanon Trotting Club Inc. and Miami Valley Trotting Inc. (the "MVG Sellers") for total consideration of
$60.0 million
, of which
$10.0 million
was funded at closing with the remainder to be funded through a
$50.0 million
note payable over a
six
year term effective upon the commencement of gaming operations. In addition, there is a potential contingent consideration payment of
$10.0 million
based on the financial performance of the facility during the seven year period after gaming operations commence.
Construction began in December 2012 on the new gaming and racing facility in Lebanon, Ohio on a 120-acre site. The new facility opened December 12, 2013, and includes a
5/8
-mile harness racing track and a
186,000
-square-foot gaming facility, featuring
1,600
VLTs, which the joint venture may increase to 1,800 VLTs, dependent on customer demand. MVG will invest approximately
$212.0 million
in the new facility, including the
$50.0 million
license fee payable to the Ohio Lottery Commission. During the years ended December 31, 2013 and 2012, the Company funded
$70.5 million
and
$19.9 million
in initial capital contributions to the joint venture, respectively. The Company anticipates providing funding of
$24.0 million
to MVG during 2014.
81
Churchill Downs Incorporated
Notes to Consolidated Financial Statements
Bluff Media Acquisition
During February 2012, the Company completed the acquisition of the assets of Bluff, a multimedia poker content brand and publishing company. Bluff’s assets include the poker periodical, BLUFF Magazine; BLUFF Magazine’s online counterpart, BluffMagazine.com; ThePokerDB, a comprehensive online database and resource that tracks and ranks the performance of poker players and tournaments; and various other news and content forums. In addition to the Company’s intention to further expand and build upon Bluff’s current content and business model, the Company believes this acquisition potentially provides it with new business avenues to pursue in the event there is a liberalization of state or federal laws with respect to Internet poker in the United States.
The Company completed its acquisition of Bluff for cash consideration of
$6.7 million
and contingent consideration of
$2.5 million
based on the probability of the enactment of federal or state enabling legislation which permits Internet poker gaming during the
five
year period after acquisition. The contingent consideration was estimated at
$2.3 million
. Any changes in the fair value of contingent consideration subsequent to the acquisition date will be recognized in earnings in the period the estimated fair value changes. Since the transaction did not have a material impact on the Company’s consolidated financial statements, additional disclosure was not deemed necessary. See Note 17 for further discussion of the fair value measurement of the contingent consideration.
Pro Forma (unaudited)
The following table illustrates the effect on net revenues, earnings from continuing operations and earnings from continuing operations per common share as if the Company had acquired Riverwalk and Oxford as of the beginning of
2011
and
2012
, respectively. The pro forma results have been prepared for comparative purposes only and do not purport to be indicative of the results of operations that would have occurred had the acquisitions of Riverwalk and Oxford been consummated at the beginning of
2011
and
2012
, respectively.
|
|
Year Ended December 31,
|
||||||
|
|
2013
|
2012
|
|||||
|
Net revenues
|
$
|
820,297
|
|
$
|
815,605
|
|
|
|
Earnings from continuing operations
|
$
|
59,002
|
|
$
|
62,626
|
|
|
|
Earnings from continuing operations per common share
|
|||||||
|
Basic:
|
|||||||
|
Earnings from continuing operations
|
$
|
3.36
|
|
$
|
3.64
|
|
|
|
Diluted:
|
|||||||
|
Earnings from continuing operations
|
$
|
3.29
|
|
$
|
3.58
|
|
|
|
Shares used in computing earnings from continuing operations per common share:
|
|||||||
|
Basic
|
17,294
|
|
17,047
|
|
|||
|
Diluted
|
17,938
|
|
17,475
|
|
|||
Pro forma results exclude the effect of the acquisition of Bluff, which did not have a material impact on the Company's consolidated financial statements.
82
Churchill Downs Incorporated
Notes to Consolidated Financial Statements
Sale of Fight! Magazine
On December 16, 2013, the Company completed the sale of 100% of the assets of Fight! Magazine ("Fight") for an immaterial cash consideration. Fight is a division of Bluff which was acquired by the Company in February 2012. Net revenues, operating expenses and the loss on sale of Fight for the years ended December 31, 2013 and 2012, have been reclassified to discontinued operations.
Hoosier Park Consideration
In accordance with the Company’s sale of its ownership interest in Hoosier Park to Centaur Racing, LLC (“Centaur”) during 2007, the Company received a promissory note (the “Note”) in the amount of
$4.0 million
plus interest. The Partnership Interest Purchase Agreement documenting such sale to Centaur also included a contingent consideration provision whereby the Company was entitled to payments of up to
$15 million
on the date which is
18
months after the date that slot machines are operational at Hoosier Park. During June 2008, Hoosier Park commenced its slot operations, fulfilling the terms of the contingency provision. However, due to uncertainties regarding collectability, the Company did not recognize the contingent consideration at the date of sale.
On October 1, 2011, the Company received
$5.1 million
in repayment of the amount owed to the Company pursuant to the Note. In addition, the Company also received
$3.4 million
as the final settlement of the contingent consideration provision of the Partnership Interest Purchase Agreement, which was recognized as a gain in discontinued operations during the year ended December 31, 2011.
Hollywood Park Racetrack
The Company recognized operating expenses of
$0.1 million
during the year ended December 31, 2013, from adjustments related to workers' compensation reserves retained by the Company subsequent to its sale of Hollywood Park Racetrack during 2005 which have been reclassified to discontinued operations.
Financial Information
Fight, Hoosier Park and Hollywood Park have been accounted for as discontinued operations. Accordingly, the results of operations of the sold businesses for all periods presented and the (losses) gains on sold businesses have been classified as discontinued operations, net of income taxes, in the Consolidated Statements of Comprehensive Income. Set forth below is a summary of the results of operations of discontinued businesses for the years ended December 31, 2013, 2012 and 2011 (in thousands):
|
|
Year ended December 31,
|
||||||||||
|
|
2013
|
2012
|
2011
|
||||||||
|
Net revenues
|
$
|
632
|
|
$
|
1,087
|
|
$
|
—
|
|
||
|
Operating expenses
|
857
|
|
885
|
|
12
|
|
|||||
|
Selling, general and administrative expenses
|
—
|
|
—
|
|
(11
|
)
|
|||||
|
Operating (loss) gain
|
(225
|
)
|
202
|
|
(1
|
)
|
|||||
|
Other income (expense)
|
145
|
|
(2
|
)
|
—
|
|
|||||
|
(Loss) earnings from operations before income taxes
|
(80
|
)
|
200
|
|
(1
|
)
|
|||||
|
Income tax benefit (provision)
|
30
|
|
(76
|
)
|
—
|
|
|||||
|
(Loss) gain from operations
|
(50
|
)
|
124
|
|
(1
|
)
|
|||||
|
(Loss) gain on sale of assets, net of income taxes
|
(83
|
)
|
—
|
|
3,561
|
|
|||||
|
Net (loss) gain
|
$
|
(133
|
)
|
$
|
124
|
|
$
|
3,560
|
|
||
83
Churchill Downs Incorporated
Notes to Consolidated Financial Statements
Kentucky Hailstorm
On April 28, 2012, a hailstorm caused damage to portions of Louisville, Kentucky including Churchill Downs Racetrack ("Churchill Downs") and its separate training facility known as Trackside Louisville. Both locations sustained damage to their stable areas as well as damages to administrative offices and several other structures. The Company carries property and casualty insurance, subject to a
$0.5 million
deductible. During the year ended December 31, 2012, the Company recorded a reduction of property and equipment of
$0.6 million
and received
$1.1 million
from its insurance carriers in partial settlement of its claim. The Company recognized insurance recoveries, net of losses of
$0.5 million
during the year ended December 31, 2012. The Company is currently working with its insurance carriers to finalize its claim and during the year ended December 31, 2013, the Company received an additional
$0.4 million
and recognized insurances recoveries, net of losses of
$0.4 million
as a component of operating income during 2013.
Mississippi River Flooding
As a result of the Mississippi River flooding during 2011, the Company temporarily ceased operations at Harlow’s Casino Resort & Spa (“Harlow’s”) on May 6, 2011, and the Board of Mississippi Levee Commissioners ordered the closure of the Mainline Mississippi River Levee on May 7, 2011. On May 12, 2011, the property sustained damage to its
2,600
-seat entertainment center and a portion of its dining facilities. On June 1, 2011, Harlow’s resumed casino operations with temporary dining facilities. During December 2012 and January 2013, the Company completed the renovation and improvement projects, which included a new buffet area, steakhouse, business center, spa facility, fitness center, pool and a multi-purpose event center.
The Company carries flood, property and casualty insurance as well as business interruption insurance subject to a
$1.3 million
deductible for damages. As of December 31, 2012, the Company recorded a reduction of property and equipment of
$8.5 million
and incurred
$2.0 million
in repair expenditures. During the year ended December 31, 2011, the Company received
$3.5 million
from its insurance carriers in partial settlement of its claim. This amount has been included as insurance recoveries, summarized below, for the year ended December 31, 2012. In addition, the Company finalized its claim with its insurance carriers and received
$12.0 million
during the year ended December 31, 2012. The Company recognized insurance recoveries, net of losses, of
$5.0 million
during the year ended December 31, 2012. The insurance claims for this event have been finalized with the Company's insurance carriers, and it does not expect to receive additional funds or recognize additional income from the claim.
Mississippi Wind Damage
On February 24, 2011, severe storms caused damage to portions of Mississippi, including Greenville, Mississippi, the location of Harlow’s. The Harlow’s property sustained damage to a portion of the hotel, including its roof, furniture and fixtures in approximately
61
hotel rooms and fixtures in other areas of the hotel. The hotel was closed to customers for renovations following the storm damage and reopened during June 2011. The Company carries property and casualty insurance as well as business interruption insurance subject to a
$0.1 million
deductible for damages. As of December 31, 2012, the Company recorded a reduction of property and equipment of
$1.4 million
and incurred
$0.4 million
in repair expenditures. The Company filed a preliminary claim with its insurance carriers for
$1.0 million
in damages, which it received during the second quarter of 2011. The Company received an additional
$3.4 million
from its insurance carriers during the year ended December 31, 2012. The Company recognized insurance recoveries, net of losses, of
$1.5 million
during the year ended December 31, 2012. The insurance claims for this event have been finalized with the Company's insurance carriers, and it does not expect to receive additional funds or recognize additional income from the claim.
Financial Information
The casualty losses and related insurance proceeds have been included as components of operating income in the Company’s Consolidated Statements of Comprehensive Income. Set forth below is a summary of the impact of the natural disasters on the results of operations of the Company for the years ended December 31,
2013
,
2012
and
2011
, respectively, (in thousands):
|
Year Ended December 31, 2013
|
|||||||||||
|
Casualty Losses
|
Insurance Recoveries
|
Insurance Recoveries, Net of Losses
|
|||||||||
|
Racing
|
$
|
—
|
|
$
|
(375
|
)
|
$
|
(375
|
)
|
||
|
Total
|
$
|
—
|
|
$
|
(375
|
)
|
$
|
(375
|
)
|
||
84
Churchill Downs Incorporated
Notes to Consolidated Financial Statements
|
Year Ended December 31, 2012
|
|||||||||||
|
Casualty Losses
|
Insurance Recoveries
|
Insurance Recoveries, Net of Losses
|
|||||||||
|
Gaming
|
$
|
12,331
|
|
$
|
(18,856
|
)
|
$
|
(6,525
|
)
|
||
|
Racing
|
$
|
644
|
|
$
|
(1,125
|
)
|
$
|
(481
|
)
|
||
|
Total
|
$
|
12,975
|
|
$
|
(19,981
|
)
|
$
|
(7,006
|
)
|
||
|
Year Ended December 31, 2011
|
|||||||||||
|
Casualty Losses
|
Insurance Recoveries
|
Insurance Recoveries, Net of Losses
|
|||||||||
|
Gaming
|
$
|
603
|
|
$
|
(1,000
|
)
|
$
|
(397
|
)
|
||
|
Racing
|
$
|
425
|
|
$
|
(1,000
|
)
|
$
|
(575
|
)
|
||
|
Total
|
$
|
1,028
|
|
$
|
(2,000
|
)
|
$
|
(972
|
)
|
||
The Company's accounts receivable at December 31,
2013
and
2012
is comprised of the following (in thousands):
|
2013
|
2012
|
||||||
|
Simulcast and ADW receivables
|
$
|
19,768
|
|
$
|
18,210
|
|
|
|
Trade receivables
|
16,129
|
|
19,294
|
|
|||
|
PSL and hospitality receivables
|
9,410
|
|
8,335
|
|
|||
|
Other receivables
|
5,603
|
|
3,198
|
|
|||
|
50,910
|
|
49,037
|
|
||||
|
Allowance for doubtful accounts
|
(4,338
|
)
|
(1,885
|
)
|
|||
|
Total
|
$
|
46,572
|
|
$
|
47,152
|
|
|
During the years ended December 31,
2013
,
2012
and
2011
, the Company recognized
$0.5 million
,
$0.9 million
and
$0.9 million
, respectively, of bad debt expense in its Online Business segment associated with customer wagering on TwinSpires.com. In addition, during the year ended December 31, 2013, the Company recognized
$2.5 million
of bad debt expense associated with the collectibility of a third-party deposit related to an Internet gaming license.
Property and equipment is comprised of the following (in thousands):
|
2013
|
2012
|
||||||
|
Land
|
$
|
118,165
|
|
$
|
115,887
|
|
|
|
Grandstands and buildings
|
435,125
|
|
413,896
|
|
|||
|
Equipment
|
208,966
|
|
180,452
|
|
|||
|
Furniture and fixtures
|
47,718
|
|
45,810
|
|
|||
|
Tracks and other improvements
|
121,085
|
|
92,197
|
|
|||
|
Construction in progress
|
15,214
|
|
7,793
|
|
|||
|
946,273
|
|
856,035
|
|
||||
|
Accumulated depreciation
|
(360,775
|
)
|
(313,153
|
)
|
|||
|
Total
|
$
|
585,498
|
|
$
|
542,882
|
|
|
Depreciation expense was approximately $
49.6 million
, $
44.4 million
and $
43.3 million
for the years ended December 31,
2013
,
2012
and
2011
, respectively, and is classified in operating expenses in the Consolidated Statements of Comprehensive Income.
85
Churchill Downs Incorporated
Notes to Consolidated Financial Statements
During the year ended December 31, 2012, the Company began an assessment of potential alternative uses to its Trackside training facility at Churchill Downs. As such, the Company reviewed the useful lives of assets at this facility and commenced accelerated depreciation on certain of its long-term assets, resulting in additional depreciation expense of
$1.5 million
and
$0.9 million
during the years ended December 31, 2013 and 2012, respectively, related to this facility. The Trackside assets were fully depreciated as of December 31, 2013.
Investment in and advances to unconsolidated affiliate includes the Company's
50%
joint venture with DNC to develop MVG, a new harness race track and VLT gaming facility in Lebanon, Ohio, as more fully described in Note 2-Acquisitions and New Ventures.
Since both DNC and the Company have participating rights over MVG, and both must consent to MVG's operating, investing and financing decisions, the Company accounts for MVG using the equity method.
Summarized financial information for MVG at December 31, 2013 and 2012 and for the two years ended December, 31, 2013 and 2012 is comprised of the following (in thousands):
|
2013
|
2012
|
||||||
|
Assets
|
|||||||
|
Current assets
|
$
|
18,002
|
|
$
|
1,982
|
|
|
|
Property and equipment, net
|
151,434
|
|
3,662
|
|
|||
|
Other assets, net
|
80,665
|
|
74,823
|
|
|||
|
Total assets
|
$
|
250,101
|
|
$
|
80,467
|
|
|
|
Liabilities and Members' Equity
|
|||||||
|
Current liabilities
|
$
|
46,966
|
|
$
|
1,986
|
|
|
|
Long-term debt
|
40,758
|
|
50,000
|
|
|||
|
Other liabilities
|
75
|
|
—
|
|
|||
|
Members' equity
|
162,302
|
|
28,481
|
|
|||
|
Total liabilities and members' equity
|
$
|
250,101
|
|
$
|
80,467
|
|
|
The joint venture's long-term debt consists of a
$50 million
secured note payable from MVG to the MVG Sellers. At December 31, 2013, the decrease in long-term debt from the balance at December 31, 2012 reflects an adjustment made to reflect the fair value of the long-term debt.
|
Years Ended December 31,
|
|||||||
|
2013
|
2012
|
||||||
|
Gaming revenue
|
$
|
6,033
|
|
$
|
—
|
|
|
|
Non-gaming revenue
|
5,919
|
|
109
|
|
|||
|
Net revenues
|
11,952
|
|
109
|
|
|||
|
Operating and SG&A expenses
|
10,605
|
|
242
|
|
|||
|
Depreciation & amortization expenses
|
945
|
|
7
|
|
|||
|
Pre-opening expenses
|
7,240
|
|
1,079
|
|
|||
|
Operating loss
|
(6,838
|
)
|
(1,219
|
)
|
|||
|
Interest and other expenses, net
|
(340
|
)
|
—
|
|
|||
|
Net loss
|
$
|
(7,178
|
)
|
$
|
(1,219
|
)
|
|
The Company's share of MVG's results have been included in our accompanying condensed consolidated financial statements for the years ended December 31, 2013 and 2012 as follows (in thousands):
86
Churchill Downs Incorporated
Notes to Consolidated Financial Statements
|
Years Ended December 31,
|
|||||||
|
2013
|
2012
|
||||||
|
Equity in losses of unconsolidated investments
|
$
|
(3,589
|
)
|
$
|
(610
|
)
|
|
Goodwill of the Company at December 31,
2013
and
2012
is comprised of the following (in thousands):
|
Racing
Operations
|
Gaming
|
Online
Business
|
Other
Investments
|
Total
|
|||||||||||||||
|
Balance as of December 31, 2011
|
$
|
50,400
|
|
$
|
34,689
|
|
$
|
127,364
|
|
$
|
1,259
|
|
$
|
213,712
|
|
||||
|
Reclassifications
|
1,259
|
|
—
|
|
—
|
|
(1,259
|
)
|
—
|
|
|||||||||
|
Additions
|
—
|
|
32,768
|
|
—
|
|
3,934
|
|
36,702
|
|
|||||||||
|
Balance as of December 31, 2012
|
51,659
|
|
|
67,457
|
|
|
127,364
|
|
|
3,934
|
|
250,414
|
|
||||||
|
Additions
|
—
|
|
50,202
|
|
—
|
|
—
|
|
50,202
|
|
|||||||||
|
Balance as of December 31, 2013
|
$
|
51,659
|
|
$
|
117,659
|
|
$
|
127,364
|
|
$
|
3,934
|
|
$
|
300,616
|
|
||||
During the year ended December 31, 2013, the Company established goodwill of
$50.2 million
related to the acquisition of Oxford on July 17, 2013.
During the year ended December 31, 2012, the Company reclassified goodwill between Other Investments and Racing Operations related to CDSP, one of its other investments, which was merged into Racing Operations during 2012. In addition, the Company established goodwill of
$32.8 million
and
$3.9 million
related to the Riverwalk and Bluff acquisitions, respectively.
The Company performed its annual goodwill impairment analysis for the year ended December 31, 2013 in accordance with ASU No. 2011-08,
Intangibles-Goodwill and Other: Testing Goodwill for Impairment.
This analysis included an assessment of qualitative factors to determine whether it is more likely than not that the fair value of the reporting units is less than their carrying amounts. The impairment analysis included an assessment of certain qualitative factors including but not limited to macroeconomic, industry and market conditions; cost factors that have a negative effect on earnings; overall financial performance; the movement of the Company's share price; and other relevant entity and reporting unit specific events. This assessment included the determination of the likely effect of each factor on the fair value of each reporting unit. Although the Company believes the factors considered in the impairment analysis are reasonable, significant changes in any of the assumptions could produce a significantly different result. Based on the annual goodwill impairment analysis for the years ended December 31, 2013 and 2012, the Company concluded that goodwill had not been impaired.
87
Churchill Downs Incorporated
Notes to Consolidated Financial Statements
The Company’s other intangible assets are comprised of the following (in thousands):
|
|
December 31, 2013
|
December 31, 2012
|
|||||||||||||||||||||
|
|
Gross
Carrying
Amount
|
Accumulated
Amortization
|
Net
Carrying
Amount
|
Gross
Carrying
Amount
|
Accumulated
Amortization
|
Net
Carrying
Amount
|
|||||||||||||||||
|
Definite-lived intangible assets:
|
|||||||||||||||||||||||
|
Favorable contracts
|
$
|
11,000
|
|
$
|
(4,260
|
)
|
$
|
6,740
|
|
$
|
11,000
|
|
$
|
(3,613
|
)
|
$
|
7,387
|
|
|||||
|
Customer relationships
|
56,540
|
|
(30,464
|
)
|
26,076
|
|
57,900
|
|
(24,594
|
)
|
33,306
|
|
|||||||||||
|
Slots gaming license
|
2,250
|
|
(1,125
|
)
|
1,125
|
|
2,250
|
|
(1,125
|
)
|
1,125
|
|
|||||||||||
|
Table games license
|
2,493
|
|
(50
|
)
|
2,443
|
|
—
|
|
—
|
|
—
|
|
|||||||||||
|
Other
|
3,719
|
|
(297
|
)
|
3,422
|
|
4,079
|
|
(267
|
)
|
3,812
|
|
|||||||||||
|
$
|
76,002
|
|
$
|
(36,196
|
)
|
39,806
|
|
$
|
75,229
|
|
$
|
(29,599
|
)
|
45,630
|
|
||||||||
|
Indefinite-lived intangible assets:
|
|||||||||||||||||||||||
|
Slots gaming rights
|
128,890
|
|
70,390
|
|
|||||||||||||||||||
|
Trademarks
|
25,729
|
|
23,397
|
|
|||||||||||||||||||
|
Illinois Horseracing Equity Trust
|
3,307
|
|
3,307
|
|
|||||||||||||||||||
|
Other
|
417
|
|
417
|
|
|||||||||||||||||||
|
Total
|
$
|
198,149
|
|
$
|
143,141
|
|
|||||||||||||||||
Amortization expense for definite-lived intangible assets was approximately
$12.2 million
,
$11.2 million
and
$11.9 million
for the years ended December 31,
2013
,
2012
and
2011
, respectively, and is classified in operating expenses. The Company submitted payments of $2.3 million for each of the years ended December 31, 2013 and 2012, respectively, for annual license fees for Calder Casino. Payments are being amortized to expense over the annual license period.
Indefinite-lived intangible assets consist primarily of state gaming licenses in Maine, Mississippi and Florida, rights to participate in the Horse Racing Equity Fund and trademarks.
During the year ended December 31, 2013, the Company established definite-lived intangible assets of
$3.8 million
and indefinite-lived intangible assets of
$60.9 million
related to the Oxford acquisition. During November 2013, the Company paid
$0.4 million
to the State of Maine for table game fees that are being amortized over a 20-year contract period. During the year ended December 31, 2013, the Company reduced customer relationships and accumulated amortization by
$2.8 million
and other definite-lived intangibles and accumulated amortization by
$0.4 million
, related to the Harlow's acquisition, as these amounts were fully amortized. Finally, the Company expensed
$0.2 million
of definite-lived and indefinite lived assets related to the disposal of Fight! Magazine.
During the year ended December 31, 2012, the Company established other definite-lived intangible assets of
$10.3 million
and indefinite-lived intangible assets of
$32.8 million
related to the Riverwalk acquisition. In addition, the Company established other definite-lived intangible assets of
$0.3 million
and indefinite-lived intangible assets of
$4.8 million
related to the Bluff acquisition.
Indefinite-lived intangible assets are tested for impairment on an annual basis as of March 31. In March 2013, the Company adopted ASU No. 2012-02, Intangibles-Goodwill and Other: Testing Indefinite-Lived Intangible Assets for Impairment. ASU 2012-02 simplifies indefinite-lived intangible asset impairment testing by adding a qualitative review step to assess whether a quantitative impairment analysis is necessary. Under the amended guidance, a testing methodology similar to that which is performed for goodwill impairment testing is acceptable for assessing a company's indefinite-lived intangible assets. The Company completed the required annual impairment tests of indefinite-lived intangible assets as of March 31, 2013, and no adjustment to the carrying value of indefinite-lived intangible assets was required. The Company assessed its indefinite-lived intangible assets by qualitatively evaluating events and circumstances that have both positive and negative factors, including macroeconomic conditions, industry events, financial performance and other changes and concluded that it was more likely than not that fair value of its indefinite-lived intangible assets exceeds their carrying value.
Future estimated amortization expense does not include additional payments of
$2.3 million
in 2013 and in each year thereafter for the ongoing amortization of future expected annual Florida slots gaming license fees not yet incurred or paid. Future estimated
88
Churchill Downs Incorporated
Notes to Consolidated Financial Statements
aggregate amortization expense on existing definite-lived intangible assets for each of the next five fiscal years is as follows (in thousands):
|
Year Ended
December 31,
|
Estimated
Amortization
Expense
|
|||
|
2014
|
$
|
9,127
|
|
|
|
2015
|
$
|
8,234
|
|
|
|
2016
|
$
|
7,633
|
|
|
|
2017
|
$
|
7,110
|
|
|
|
2018
|
$
|
7,110
|
|
|
Components of the provision for income taxes are as follows (in thousands):
|
2013
|
2012
|
2011
|
|||||||||
|
Current provision:
|
|||||||||||
|
Federal
|
$
|
22,727
|
|
$
|
21,103
|
|
$
|
16,918
|
|
||
|
State and local
|
2,462
|
|
2,351
|
|
3,423
|
|
|||||
|
Foreign
|
—
|
|
(38
|
)
|
(149
|
)
|
|||||
|
25,189
|
|
23,416
|
|
20,192
|
|
||||||
|
Deferred:
|
|||||||||||
|
Federal
|
5,788
|
|
8,292
|
|
12,798
|
|
|||||
|
State and local
|
(504
|
)
|
1,367
|
|
1,299
|
|
|||||
|
5,284
|
|
9,659
|
|
14,097
|
|
||||||
|
$
|
30,473
|
|
$
|
33,075
|
|
$
|
34,289
|
|
|||
The Company’s income tax expense is different from the amount computed by applying the federal statutory income tax rate to income before taxes as follows (in thousands):
|
2013
|
2012
|
2011
|
|||||||||
|
Federal statutory tax on earnings before income taxes
|
$
|
29,928
|
|
$
|
31,929
|
|
$
|
33,280
|
|
||
|
State income taxes, net of federal income tax benefit
|
1,514
|
|
2,185
|
|
3,283
|
|
|||||
|
Non-deductible lobbying and contributions
|
723
|
|
946
|
|
517
|
|
|||||
|
Tax credits and incentives
|
(663
|
)
|
(494
|
)
|
(775
|
)
|
|||||
|
Tax adjustments
|
(174
|
)
|
(1,093
|
)
|
(434
|
)
|
|||||
|
Accruals and settlements related to tax audits
|
(395
|
)
|
(686
|
)
|
(426
|
)
|
|||||
|
Valuation allowance
|
(220
|
)
|
—
|
|
105
|
|
|||||
|
Change in effective state tax rates
|
(383
|
)
|
197
|
|
(714
|
)
|
|||||
|
Other permanent differences
|
143
|
|
91
|
|
(547
|
)
|
|||||
|
$
|
30,473
|
|
$
|
33,075
|
|
$
|
34,289
|
|
|||
During 2003, the Company entered into a Tax Increment Financing (“TIF”) Agreement with the Commonwealth of Kentucky. Pursuant to this agreement, the Company is entitled to receive reimbursement for
80%
of the increase in Kentucky income and sales tax resulting from its 2005 renovation of the Churchill facility. During 2011, the Company resolved uncertainties with the Commonwealth of Kentucky related to the computation of the tax increase and the Company recognized a
$3.1 million
reduction of its operating expenses related to the years 2005 through 2011. In addition, the Company recognized a
$0.8 million
reduction in its income tax expense, net of federal taxes, related to the years 2005 through 2011. During 2012, the Company recognized an additional
$0.7 million
reduction to its operating expenses and
$0.5 million
reduction to its income tax expense, net of federal taxes, from the Commonwealth of Kentucky. During 2013, the Company recognized an additional
$0.7 million
reduction to its operating expenses and
$0.2 million
reduction to its income tax expense, net of federal taxes, from the Commonwealth of Kentucky.
89
Churchill Downs Incorporated
Notes to Consolidated Financial Statements
As of December 31, 2013, the Company has received
$4.4 million
of combined benefits and established a sales tax receivable of
$1.2 million
and an income tax receivable of
$1.0 million
related to the reimbursement.
For the year ended December 31, 2011, the Company received a refund of
$8.5 million
related to the overpayment of its 2010 federal income taxes and a refund of
$1.9 million
related to an amended prior year federal income tax return that served to adjust state lobbying expense deductions.
Components of the Company’s deferred tax assets and liabilities are as follows (in thousands):
|
2013
|
2012
|
||||||
|
Deferred tax assets:
|
|||||||
|
Deferred compensation plans
|
$
|
14,271
|
|
$
|
12,022
|
|
|
|
Deferred income
|
6,328
|
|
8,396
|
|
|||
|
Allowance for uncollectible receivables
|
1,295
|
|
281
|
|
|||
|
Deferred liabilities
|
3,574
|
|
4,239
|
|
|||
|
Net operating losses and credit carryforward
|
19,186
|
|
20,749
|
|
|||
|
Deferred tax assets
|
44,654
|
|
45,687
|
|
|||
|
Valuation allowance
|
(1,213
|
)
|
(1,334
|
)
|
|||
|
Net deferred tax asset
|
43,441
|
|
44,353
|
|
|||
|
Deferred tax liabilities:
|
|||||||
|
Intangible assets in excess of tax basis
|
22,749
|
|
18,725
|
|
|||
|
Property and equipment in excess of tax basis
|
40,135
|
|
40,175
|
|
|||
|
Other
|
2,246
|
|
1,874
|
|
|||
|
Deferred tax liabilities
|
65,130
|
|
60,774
|
|
|||
|
Net deferred tax liability
|
$
|
(21,689
|
)
|
$
|
(16,421
|
)
|
|
|
Income taxes are classified in the balance sheet as follows:
|
|||||||
|
Net current deferred tax asset
|
$
|
8,927
|
|
$
|
8,227
|
|
|
|
Net non-current deferred tax liability
|
(30,616
|
)
|
(24,648
|
)
|
|||
|
$
|
(21,689
|
)
|
$
|
(16,421
|
)
|
||
As of December 31, 2013, the Company had federal net operating losses of
$13.8 million
, which were acquired in conjunction with the acquisition of Youbet.com. The utilization of these losses, which expire between 2019 and 2030, is limited on an annual basis pursuant to IRC § 382. The Company believes that it will be able to fully utilize all of these losses. In addition, the Company has
$4.3 million
of state net operating losses;
$1.9 million
of this loss carryforward was acquired in conjunction with the acquisition of Youbet.com. These losses, which expire between 2015 and 2030, may be subject to annual limitations similar to IRC § 382. The Company has recorded a valuation allowance of
$0.9 million
against the state net operating losses due to the fact that it is unlikely that it will generate income in certain states, which is necessary to utilize the assets.
The changes in the valuation allowance for deferred tax assets for the years ended December 31, 2013 and 2012 are as follows (in thousands):
|
2013
|
2012
|
||||||
|
Balance at beginning of the year
|
$
|
1,334
|
|
$
|
1,487
|
|
|
|
Charged to costs and expenses
|
168
|
|
—
|
|
|||
|
Charged to other accounts
|
—
|
|
33
|
|
|||
|
Deductions
|
(289
|
)
|
(186
|
)
|
|||
|
Balance at end of the year
|
$
|
1,213
|
|
$
|
1,334
|
|
|
The IRS has audited the Company through 2011. Subsequent years are open to examination. State and local tax years open for examination vary by jurisdiction. As of December 31, 2013, the Company had approximately
$0.6 million
of total gross unrecognized tax benefits, excluding interest. If these benefits were recognized, there would be a
$0.5 million
effect to the annual effective tax rate. The company anticipates a decrease in its unrecognized tax positions of approximately
$0.1 million
during the next twelve months. This anticipated decrease is primarily due to the expiration of statutes of limitations.
90
Churchill Downs Incorporated
Notes to Consolidated Financial Statements
During October 2012, the Company funded a
$2.9 million
income tax payment to the State of Illinois related to a dispute over state income tax apportionment methodology which has been recorded as an other asset as of December 31, 2012. The Company filed its state income tax returns related to the years 2002 through 2005 following the methodology prescribed by Illinois statute, however the State of Illinois has taken a contrary tax position. The Company filed a formal protest with the State of Illinois during the fourth quarter of 2012. The Company does not expect this issue to have a material adverse effect on its business, financial condition or results of operations. See Note 18 for further discussion of this matter.
A reconciliation of the beginning and ending amount of unrecognized tax benefits is as follows (in thousands):
|
2013
|
2012
|
2011
|
|||||||||
|
Balance as of January 1
|
$
|
8,565
|
|
$
|
2,109
|
|
$
|
2,926
|
|
||
|
Additions for tax positions related to the current year
|
190
|
|
—
|
|
—
|
|
|||||
|
Additions for tax positions of prior years
|
207
|
|
7,390
|
|
—
|
|
|||||
|
Reductions for tax positions of prior years
|
(8,380
|
)
|
(934
|
)
|
(817
|
)
|
|||||
|
Balance as of December 31
|
$
|
582
|
|
$
|
8,565
|
|
$
|
2,109
|
|
||
The decrease in the uncertain tax position in 2013 was due to an IRS settlement related to the timing of the taxation of receipts from the HRE Trust Fund and the expiration of statute of limitations related to various tax positions. The Company recognizes interest accrued related to unrecognized tax benefits in income tax expense and penalties in selling, general and administrative expenses in the Consolidated Statements of Comprehensive Income. The Company accrued less than
$0.2 million
of interest for each of the years ended December 31, 2013 and 2012.
Stock Repurchase Program
On April 23, 2013, the Company’s Board of Directors authorized the repurchase of up to
$100 million
of the Company's stock in a stock repurchase program. The Company may repurchase stock in open market purchases or through privately negotiated transactions in compliance with Securities and Exchange Commission Rule 10b-18, subject to market conditions, applicable legal requirements and other relevant factors. The Company expects to fund repurchases using available cash and borrowings under our Senior Secured Credit Facility. The Company is not obligated to purchase any stock under the stock repurchase program, and purchases may be discontinued, or the stock repurchase program may be modified or suspended at any time prior to the termination of the repurchase program on December 31, 2015. During the year ended December 31, 2013, the Company did not repurchase any shares of stock under this program.
Shareholder Rights Plan
On March 13, 2008, the Company’s Board of Directors approved a shareholder rights plan, which granted each shareholder the right, in certain circumstances, to purchase a fraction of a share of Series A Junior Participating Preferred Stock at the rate of
one
right for each share of the Company’s common stock. If a person or group, together with its affiliates and associates, become an acquiring person, defined as the beneficial owner of
15%
or more of the Company’s common stock, each holder of a right (other than the person or group who has become an acquiring person) will have the right to receive, upon exercise, shares of the Company’s common stock having a value equal to
two
times the exercise price of the right. Certain persons and transactions are exempted from the definition of acquiring person. In the event that, at any time following the date such person or group becomes an acquiring person, (i) the Company engages in a merger or other business combination transaction in which the Company is not the surviving corporation (other than with an entity that acquired the shares pursuant to an offer for all outstanding shares of common stock that a majority of the independent directors determines to be fair and not inadequate and to otherwise be in the best interests of the Company and its shareholders, after receiving advice from
one
or more investment banking firms (a “Qualifying Offer”) ), (ii) the Company engages in a merger or other business combination transaction (other than with an entity that acquired the shares pursuant to a Qualifying Offer) in which the Company is the surviving corporation and the common stock of the Company is changed or exchanged, or (iii)
50%
or more of the Company’s assets, cash flow or earnings power is sold or transferred, each holder of a right (other than the person or group who has become an acquiring person) shall thereafter have the right to receive, upon exercise, common stock of the surviving entity having a value equal to
two
times the exercise price of the right. At any time after a person or group becomes an acquiring person, and prior to the acquisition by such person or group of fifty percent
(50)%
or more of the outstanding common stock, the Board may exchange the rights (other than rights owned by such acquiring person), in whole or in part, for common stock at an exchange ratio of
one
share of common stock, or one one-thousandth of a share of Preferred Stock (or of a share of a class or series of the Company’s preferred stock having equivalent rights, preferences and privileges), per right (subject to adjustment).
91
Churchill Downs Incorporated
Notes to Consolidated Financial Statements
The Company has a profit-sharing plan that covers all employees, not otherwise participating in an associated profit-sharing plan, with three months or more of service. The Company will match contributions made by the employee up to
3%
of the employee’s annual compensation and will also match, at
50%
, contributions made by the employee up to an additional
2%
of compensation with certain limits. The Company may also contribute a discretionary amount determined annually by the Board of Directors as well as a year-end discretionary match not to exceed
4%
of compensation. The Company’s cash contribution to the plan for the years ended December 31,
2013
,
2012
and
2011
was approximately
$2.3 million
,
$1.8 million
and
$1.7 million
, respectively.
The Company is a member of a noncontributory defined benefit multi-employer retirement plan for all members of the Pari-mutuel Clerk’s Union of Kentucky and several other collectively bargained retirement plans, which are administered by unions. Cash contributions are made in accordance with negotiated labor contracts. Retirement plan expense for each of the years ended December 31,
2013
,
2012
and
2011
was approximately
$0.7 million
,
$0.6 million
and
$0.6 million
, respectively. The Company’s policy is to fund this expense as accrued. The Company currently estimates that future contributions to these plans will not increase significantly from prior years.
The Company provides eligible executives and directors of the Company an opportunity to defer to a future date the receipt of base and bonus compensation for services as well as director’s fees through a deferred compensation plan. The Company’s matching contribution on base compensation deferrals equals the matching contribution of the Company’s profit-sharing plan with certain limits. The Company’s cash contribution to the plan amounts to
$0.1 million
for each of the years ended December 31, 2013, 2012 and 2011, respectively.
The following table presents our total debt outstanding at December 31, 2013 and 2012 (in thousands):
|
|
As of December 31,
|
||||||
|
|
2013
|
2012
|
|||||
|
Total long-term debt:
|
|||||||
|
$300 million senior unsecured notes
|
$
|
300,000
|
|
$
|
—
|
|
|
|
$500 million senior secured credit facility
|
58,000
|
|
—
|
|
|||
|
Swing line of credit
|
11,191
|
|
—
|
|
|||
|
Total long-term debt
|
369,191
|
|
—
|
|
|||
|
Current maturities of long-term debt:
|
|
|
|||||
|
$375 million senior secured credit facility
|
—
|
|
205,000
|
|
|||
|
Swing line of credit
|
—
|
|
4,728
|
|
|||
|
Current maturities of long-term debt
|
—
|
|
209,728
|
|
|||
|
Total debt
|
$
|
369,191
|
|
$
|
209,728
|
|
|
5.375% Senior Unsecured Notes
On December 16, 2013, the Company completed an offering of
$300 million
in aggregate principal amount of
5.375%
Senior Unsecured Notes that mature on December 15, 2021 (the “Senior Unsecured Notes”). The Senior Unsecured Notes were issued at par, with interest payable on June 15
th
and December 15
th
of each year. The Company received net proceeds of
$295 million
, after deducting underwriting fees, and used the net proceeds from the offering to repay a portion of its outstanding borrowings, and accrued and unpaid interest outstanding under its Senior Secured Credit Facility. In connection with the issuance, the Company capitalized
$6.3 million
of debt issuance costs which are being amortized as interest expense over the remaining term of the Senior Unsecured Notes.
The Senior Unsecured Notes were issued in a private offering that was exempt from registration under the Securities Act of 1933, as amended, and are senior unsecured obligations of the Company. The Senior Unsecured Notes are guaranteed by each of the Company’s domestic subsidiaries that guarantee its Senior Secured Credit Facility and will rank equally with the Company’s existing and future senior obligations. At any time prior to December 15, 2016, the Company may redeem all or part of the Senior Unsecured Notes at par plus the present value (discounted at the treasury rate plus 50 basis points) of scheduled interest payments through December 15, 2016, along with accrued and unpaid interest, if any, at the date of redemption. On or after December 15, 2016, the Company may redeem all or part of the Senior Unsecured Notes at a redemption price of
104.031%
which gradually reduces to par by 2019.
92
Churchill Downs Incorporated
Notes to Consolidated Financial Statements
Senior Secured Credit Facility
On May 17, 2013, the Company entered into the Third Amended and Restated Credit Agreement (the “Senior Secured Credit Facility”) which amended certain provisions of the credit agreement including increasing the maximum aggregate commitment from
$375 million
to
$500 million
. The Senior Secured Credit Facility also provides for an accordion feature which, if exercised, could increase the maximum aggregate commitment by up to an additional
$225 million
and reduce the pricing schedule for outstanding borrowings and commitment fees across all leverage pricing levels. The guarantors under the Senior Secured Credit Facility continue to be a majority of the Company's wholly-owned subsidiaries. The Company incurred loan origination costs of
$2.3 million
in connection with this amendment, which were capitalized and are being amortized as interest expense over the remaining term of the Senior Secured Credit Facility. The Senior Secured Credit Facility matures on May 17, 2018.
Generally, borrowings made pursuant to the Senior Secured Credit Facility bear interest at a
LIBOR
-based rate per annum plus an applicable percentage ranging from
1.125%
to
3.0%
depending on the Company's total leverage ratio. In addition, under the Senior Secured Credit Facility, the Company agreed to pay a commitment fee at rates that range from
0.175%
to
0.45%
of the available aggregate commitment, depending on the Company's leverage ratio. The weighted average interest rate on outstanding borrowings at December 31, 2013 and 2012 was
1.71%
and
1.87%
, respectively.
The Senior Secured Credit Facility contains customary affirmative and negative covenants for credit facilities of this type, including limitations on the Company and its subsidiaries with respect to indebtedness, restricted payments, liens, investments, mergers and acquisitions, disposition of assets, sale-leaseback transactions and transactions with affiliates. The covenants permit the Company to use proceeds of the credit extended under the agreement for general corporate purposes, restricted payments and acquisition needs. The Senior Secured Credit Facility also contains financial covenants that require the Company (i) to maintain an interest coverage ratio (i.e., consolidated adjusted EBITDA to consolidated interest expense) that is greater than
3.0
to 1.0; (ii) not to permit the total leverage ratio (i.e., total consolidated funded indebtedness to consolidated adjusted EBITDA) to be greater than
4.5
to 1.0, provided that if a certain minimum consolidated adjusted EBITDA is reached then the total leverage ratio will be increased to
5.0
to 1.0 for such periods that the minimum is maintained; and (iii) not to permit the senior secured leverage ratio (i.e. senior secured consolidated funded indebtedness to consolidated adjusted EBITDA) to be greater than
3.5
to 1.0. As of December 31, 2013, the Company was in compliance with all covenants under the Senior Secured Credit Facility, and substantially all of the Company's assets continue to be pledged as collateral under the Senior Secured Credit Facility.
As of December 31, 2013, we had
$425 million
of borrowing capacity under the Senior Secured Credit Facility.
Future aggregate maturities of total debt are as follows (in thousands):
|
Year Ended
December 31,
|
||||
|
2014
|
$
|
—
|
|
|
|
2015
|
—
|
|
||
|
2016
|
—
|
|
||
|
2017
|
—
|
|
||
|
Thereafter
|
369,191
|
|
||
|
Total
|
$
|
369,191
|
|
|
The Company leases facilities for
nine
of its
eleven
OTB operations at Arlington.
eight
of Arlington's OTB operations are conducted at non-owned Illinois restaurants under licensing agreements with varying payment terms, including payment contingent on handle. These OTB operations are generally multi-year agreements, renewable with 90 days notice by either party. Arlington's ninth leased facility, Waukegan, operates as a traditional OTB under a lease which will expire in 2015. The Company has
ten
operating lease agreements for Fair Grounds OTBs, which expire in various years from 2014 through 2021. Finally, the Company has an operating lease agreement for its corporate offices which expires in 2023.
Future minimum operating lease payments are as follows, not including the variable portion of contingent leases and Arlington’s contingent licensing agreements (in thousands):
93
Churchill Downs Incorporated
Notes to Consolidated Financial Statements
|
Year Ended December 31,
|
||||
|
2014
|
$
|
8,024
|
|
|
|
2015
|
6,264
|
|
||
|
2016
|
4,805
|
|
||
|
2017
|
3,390
|
|
||
|
2018
|
2,483
|
|
||
|
Thereafter
|
5,130
|
|
||
|
Total
|
$
|
30,096
|
|
|
The Company also leases totalisator equipment, gaming equipment, audio/visual equipment and operates certain facilities that are partially contingent on handle, bandwidth usage or race days. Total annual rent expense for contingent lease payments, including totalisator equipment, audio/visual equipment, gaming equipment, land and facilities, was approximately
$3.7 million
,
$3.6 million
and
$2.5 million
for the years ended December 31,
2013
,
2012
and
2011
, respectively. The Company’s total rent expense for all operating leases, including the contingent lease payments, was approximately
$20.2 million
,
$18.4 million
and
$19.9 million
for the years ended December 31,
2013
,
2012
and
2011
, respectively. During 2013, the increase in total rent expense primarily reflects an increase in slot machine expense, which is attributable to the acquisitions of Riverwalk and Oxford. During 2012, the reduction in total rent expense reflects a migration in the Company's Racing Operations from totalisator services performed by a third-party to services provided by United Tote.
During 2008, the Board of Directors approved the Terms and Conditions of Performance Share Awards Issued Pursuant to the Churchill Downs Incorporated 2007 Omnibus Stock Incentive Plan (the “Company LTIP”) as well as the Terms and Conditions of Performance Share Awards Issued Pursuant to the Churchill Downs Incorporated 2007 Omnibus Stock Incentive Plan for Employees of TwinSpires (the “TwinSpires LTIP”). The objective of the Company LTIP and the TwinSpires LTIP was to support the entrepreneurial mindset desired by management by providing an opportunity to earn significant equity in the Company for achieving significant performance targets.
In accordance with the Company LTIP, participants earned performance share awards over a
five
year period (2008 through 2012) payable in either cash or stock of the Company, at the discretion of the Company, based on performance targets achieved by the Company as well as the participant. During the first quarter subsequent to each plan year during the term of the Company LTIP, performance share awards denominated in either cash or stock were awarded to participants based on assessment of the achievement of performance targets. Such awards had varying service conditions and vested on a quarterly basis.
During the year ended December 31, 2013, the Company awarded the final performance share awards under the Company LTIP related to the 2011 and 2012 LTIP years and recognized compensation expense of
$5.3 million
for the Company LTIP awards. During the year ended December 31, 2012, the performance targets of the Company LTIP were achieved for the 2011 and 2012 plan years. Compensation expense of
$6.4 million
was recognized for the Company LTIP awards. During the year ended December 31, 2011, the performance targets of the Company LTIP were achieved for the 2010 plan year. Compensation expense of $
4.2 million
was recognized for the Company LTIP awards.
See Note 16, Shared Based Compensation Plans for discussion of the 2013 long-term incentive award program.
As of December 31, 2013, the Company has share-based employee compensation plans as described below. The total compensation expense, which includes compensation expense related to restricted share awards, restricted stock unit awards, stock option awards, granted LTIP awards and stock options associated with an employee stock purchase plan, was
$21.5 million
,
$7.6 million
, and
$5.5 million
for the years ended December 31, 2013, 2012 and 2011, respectively.
Employee Stock Options
The Company sponsors the Churchill Downs Incorporated 1997 Stock Option Plan (the “97 Plan”) and the Churchill Downs Incorporated 2007 Omnibus Stock Incentive Plan (the “07 Incentive Plan”). In addition, the Company may, from time to time, grant stock option awards to individuals outside of its share-based compensation plans. These share-based incentive compensation plans are described below.
On March 13, 2003, the Board of Directors suspended the 97 Plan. Awards issued under the 97 Plan prior to its suspension were unaffected by such suspension.
94
Churchill Downs Incorporated
Notes to Consolidated Financial Statements
The 97 Plan and the 07 Incentive Plan provide that the exercise price of any incentive stock option may not be less than the fair market value of the common stock on the date of grant. Outstanding stock options under the 97 Plan have contractual terms of
ten
years and generally vest
three
years from the date of grant. Outstanding stock options under the 07 Incentive Plan have contractual terms of
ten
years and generally vest ratably on each anniversary of the grant date over a
three
year period.
Activity for stock options granted by the Company during the years ended December 31, 2013, 2012 and 2011 is presented below (in thousands, except per common share data):
|
Number of Shares Under Option
|
Weighted Average Exercise Price
|
|||||
|
Balance as of December 31, 2010
|
360
|
|
$
|
36.36
|
|
|
|
Granted
|
—
|
|
$
|
—
|
|
|
|
Exercises
|
(6
|
)
|
$
|
27.23
|
|
|
|
Canceled/forfeited
|
—
|
|
$
|
—
|
|
|
|
Balance as of December 31, 2011
|
354
|
|
$
|
36.52
|
|
|
|
Granted
|
—
|
|
$
|
—
|
|
|
|
Exercises
|
(153
|
)
|
$
|
36.80
|
|
|
|
Canceled/forfeited
|
—
|
|
$
|
—
|
|
|
|
Balance as of December 31, 2012
|
201
|
|
$
|
36.30
|
|
|
|
Granted
|
—
|
|
$
|
—
|
|
|
|
Exercises
|
(7
|
)
|
$
|
42.94
|
|
|
|
Canceled/forfeited
|
(1
|
)
|
$
|
36.12
|
|
|
|
Balance as of December 31, 2013
|
193
|
|
$
|
36.04
|
|
|
During the year ended December 31, 2010, the Company entered into an amended and restated employment agreement with Robert L. Evans, the Company’s Chairman of the Board and Chief Executive Officer. Mr. Evans received a stock option, vesting quarterly over approximately
three
years to purchase an aggregate of
180,000
shares of the Company’s common stock, with an exercise price equal to the fair market value of a share of the Company’s common stock on September, 27, 2010, the date on which the award was granted. This stock option has a contractual term of
six
years expiring on November 14, 2016.
Under Mr. Evans’ previous employment agreement, Mr. Evans received a stock option, vesting quarterly over
three
years, to purchase an aggregate of
130,000
shares of the Company’s common stock, with an exercise price equal to the fair market value of a share of the Company’s common stock on July 18, 2006. During 2012, Mr. Evans exercised options for
130,000
shares of the Company's common stock which were granted at
$36.16
, for common stock at stock prices ranging from
$57.36
to
$60.05
.
During the years ended December 31, 2013, 2012 and 2011, no stock options were granted. Whenever the Company issues stock options, it estimates the fair value of the stock options as of the date of grant, using the Black-Scholes option pricing model. The Black-Scholes option pricing model was developed for use in estimating the fair value of traded options which have no vesting restrictions and are fully transferable. In addition, option valuation models require the input of highly subjective assumptions, including the expected stock price volatility. Because the Company’s employee stock options have characteristics significantly different from those of traded options and because changes in the subjective input assumptions can materially affect the fair value estimate, in the Company’s opinion, the existing models do not necessarily provide a reliable single measure of the fair value of the Company’s employee stock options. The Company calculates the expected term for its stock options based on historical exercise behavior and bases the risk-free interest rate on a traded zero-coupon U.S. Treasury bond with a term substantially equal to the stock option’s expected term. The volatility used to value stock options is based on historical volatility. The Company calculates historical volatility using a simple average calculation methodology based on daily price intervals as measured over the expected term of the stock option.
At December 31, 2013, all outstanding options were vested and exercisable. The following table summarizes information about stock options outstanding as of December 31, 2013 (in thousands, except contractual life and per share data):
95
Churchill Downs Incorporated
Notes to Consolidated Financial Statements
|
Shares Under
Option
|
Remaining
Contractual
Life
|
Average
Exercise Price
Per Share
|
Intrinsic
Value per
Share
(1)
|
Aggregate
Intrinsic
Value
|
||||||||||||
|
Options exercisable and vested at December 31, 2013
|
193
|
|
3.0
|
$
|
36.04
|
|
$
|
53.61
|
|
$
|
10,358
|
|
||||
|
(1)
|
Computed based upon the amount by which the fair market value of the Company’s common stock at December 31, 2013, of
$89.65
per share exceeded the weighted average exercise price.
|
The total intrinsic value of stock options exercised during the years ended December 31,
2013
,
2012
and
2011
was
$0.3 million
,
$5.7 million
, and
$0.1 million
, respectively. Cash received from stock option exercises totaled
$0.3 million
,
$3.4 million
, and
$0.2 million
for the years ended December 31,
2013
,
2012
and
2011
, respectively.
At December 31, 2012, there were
161 thousand
options exercisable with a weighted average exercise price of
$36.57
.
Restricted Shares and Restricted Stock Units
2013 New Company LTIP
During 2013, the Board of Directors approved the terms and conditions of performance share awards issued pursuant to the Churchill Downs Incorporated 2007 Omnibus stock incentive plan (the "New Company LTIP"). As a way to continue to encourage innovation, an entrepreneurial approach, and careful risk assessment, and in order to retain key executives, the New Company LTIP offers long-term incentive compensation to the Company's named executive officers and other key executives ("Grantees") as reported in the Company's Schedule 14A Proxy Statement filing, with the exception of our Chairman of the Board and Chief Executive Officer.
During 2013, the Grantees received
92,000
restricted shares of the Company's common stock vesting over approximately four years and
324,000
restricted shares of the Company's common stock with vesting contingent upon the Company's common stock reaching certain closing prices on NASDAQ for
20
consecutive trading days. During the year ended December 31, 2013, the Company's closing stock price achieved the twenty consecutive trading day closing stock price requirement for
155,000
restricted shares. Per the terms of the New Company LTIP, Grantees will vest in these shares during March, August and September 2014.
During the year ended December 31, 2013, the Company recognized
$12.8 million
of compensation expense related to the New Company LTIP. As of December 31, 2013, unrecognized compensation expense attributable to unvested market condition awards and service period awards was
$6.2 million
and
$4.9 million
, respectively. The weighted average period over which the Company expects to recognize the remaining compensation expense under the market condition awards and service period awards approximates
5 months
and
29 months
, respectively.
Other Restricted Share Awards
The Company sponsored the Churchill Downs Incorporated 2004 Restricted Stock Plan (the “04 Plan”). In addition, the Company, may, from time to time, grant restricted shares or restricted stock units to individuals outside of its share-based compensation plans.
On March 15, 2007, the Board of Directors replaced the 04 Plan with the 07 Incentive Plan. Awards issued under the 04 Plan prior to its termination were unaffected by such termination. The 07 Incentive Plan permits the award of restricted shares or restricted stock units to directors and key employees, including officers, of the Company and its subsidiaries who are from time to time responsible for the management, growth and protection of the business of the Company and its subsidiaries.
Restricted shares granted under the 04 Plan generally vest in full
five
years from the date of grant or upon retirement at or after age
60
. Restricted shares granted under the 07 Incentive Plan generally vest in full
three
years from the date of grant or upon retirement at or after age
60
. The fair value of restricted shares under both the 04 Plan and the 07 Incentive Plan is determined by the product of the number of shares granted and the grant date market price of the Company’s common stock, discounted to consider the fact that dividends are not paid on these shares.
During the year ended December 31, 2010, the Company entered into an amended and restated employment agreement with Robert L. Evans. Mr. Evans received (i)
45,000
restricted shares of the Company’s common stock, with vesting contingent upon the Company’s common stock reaching certain closing prices on NASDAQ for
twenty
consecutive trading days, and (ii)
81,250
restricted stock shares, vesting quarterly over
6.0
years. During the years ended December 31, 2013 and 2012,
15,000
shares and
30,000
shares, respectively, with vesting contingent upon the Company's stock price, reached the required closing stock prices and vested.
Under a previous employment agreement with Robert L. Evans, Mr. Evans received (i)
90,000
restricted shares of the Company’s common stock, with vesting contingent upon the Company’s common stock reaching certain closing prices on NASDAQ for
96
Churchill Downs Incorporated
Notes to Consolidated Financial Statements
twenty
consecutive trading days, (ii)
65,000
restricted shares of the Company’s common stock, vesting quarterly over
five
years, and contingent upon the Company’s common stock reaching certain closing prices on NASDAQ for
ten
consecutive trading days and (iii)
65,000
restricted stock units representing shares of the Company’s common stock, vesting quarterly over
five
years, with Mr. Evans entitled to receive the shares underlying the units (along with a cash payment equal to accumulated dividend equivalents beginning with the lapse of forfeiture, plus interest at a
3%
annual rate)
six
months after termination of employment. The restricted share awards were approved by the Company’s shareholders at its Annual Meeting of Shareholders held on June 28, 2007, the grant date of these awards. During the years ended December 31, 2013 and 2012,
60,000
shares and
52,500
shares, respectively, with vesting contingent upon the Company's stock price, reached the required closing stock prices and vested.
Activity for the 04 Plan, the 07 Incentive Plan and awards made outside of share-based compensation plans for the years ended December 31, 2013, 2012 and 2011, is presented below (in thousands, except per common share data):
|
Market Condition (Performance-Based) Awards
|
Service Period Awards
|
Total
|
||||||||||||||||||
|
Number of
Shares
|
Weighted
Average
Grant Date
Fair Value
|
Number of
Shares
|
Weighted
Average
Grant Date
Fair Value
|
Number of
Shares
|
Weighted
Average
Grant Date
Fair Value
|
|||||||||||||||
|
Balance as of December 31, 2010
|
112
|
|
$
|
43.40
|
|
222
|
|
$
|
36.72
|
|
334
|
|
$
|
38.96
|
|
|||||
|
Granted
|
—
|
|
$
|
—
|
|
156
|
|
$
|
42.95
|
|
156
|
|
$
|
42.95
|
|
|||||
|
Vested
|
—
|
|
$
|
—
|
|
(70
|
)
|
$
|
42.41
|
|
(70
|
)
|
$
|
42.21
|
|
|||||
|
Canceled/forfeited
|
—
|
|
$
|
—
|
|
(1
|
)
|
$
|
35.81
|
|
(1
|
)
|
$
|
35.81
|
|
|||||
|
Balance as of December 31, 2011
|
112
|
|
$
|
43.76
|
|
307
|
|
$
|
38.63
|
|
419
|
|
$
|
40.01
|
|
|||||
|
Granted
|
—
|
|
$
|
—
|
|
182
|
|
$
|
51.99
|
|
182
|
|
$
|
51.99
|
|
|||||
|
Vested
|
(52
|
)
|
$
|
41.31
|
|
(169
|
)
|
$
|
45.85
|
|
(221
|
)
|
$
|
44.77
|
|
|||||
|
Canceled/forfeited
|
—
|
|
$
|
—
|
|
(1
|
)
|
$
|
39.12
|
|
(1
|
)
|
$
|
39.12
|
|
|||||
|
Balance as of December 31, 2012
|
60
|
|
$
|
45.90
|
|
319
|
|
$
|
42.42
|
|
379
|
|
$
|
42.97
|
|
|||||
|
Granted
|
324
|
|
$
|
53.71
|
|
287
|
|
$
|
67.55
|
|
611
|
|
$
|
60.21
|
|
|||||
|
Vested
|
(60
|
)
|
$
|
45.90
|
|
(256
|
)
|
$
|
59.54
|
|
(316
|
)
|
$
|
53.90
|
|
|||||
|
Canceled/forfeited
|
—
|
|
$
|
—
|
|
(1
|
)
|
$
|
38.75
|
|
(1
|
)
|
$
|
38.75
|
|
|||||
|
Balance as of December 31, 2013
|
324
|
|
$
|
53.71
|
|
349
|
|
$
|
53.58
|
|
673
|
|
$
|
53.64
|
|
|||||
As of December 31, 2013, there was
$14.9 million
of unrecognized share-based compensation expense related to nonvested restricted share and restricted stock unit awards that the Company expects to recognize over a weighted average period of
1.9
years.
As of December 31, 2013, employees of the Company held
324,000
restricted shares subject to performance-based vesting criteria (all of which are considered market-based restricted shares), which were issued during the year ended December 31, 2013. The number of these shares that vest is based upon established market-based performance targets that will be assessed on an ongoing basis.
Employee Stock Purchase Plan
Under the Employee Stock Purchase Plan, the Company is authorized to sell, pursuant to short-term stock options, shares of its common stock to its full-time (or part-time for at least
20
hours per week and at least
five
months per year) employees at a discount from the common stock’s fair market value. The Employee Stock Purchase Plan operates on the basis of recurring, consecutive one-year periods. Each period commences on August 1 and ends on the following July 31.
Each August 1, the Company offers eligible employees the opportunity to purchase common stock. Employees who elect to participate for each period have a designated percentage of their compensation withheld (after-tax) and applied to the purchase of shares of common stock on the last day of the period, July 31. The Employee Stock Purchase Plan allows withdrawals, terminations and reductions on the amounts being deducted. The purchase price for the common stock is
85%
of the lesser of the fair market value of the common stock on (i) the first day of the period, or (ii) the last day of the period. No employee may purchase common stock under the Employee Stock Purchase Plan valued at more than
$25 thousand
for each calendar year.
97
Churchill Downs Incorporated
Notes to Consolidated Financial Statements
Under the Employee Stock Purchase Plan, the Company sold approximately
seventeen thousand
shares of common stock to employees pursuant to options granted on August 1, 2012, and exercised on July 31, 2013. Because the plan year overlaps the Company’s fiscal year, the number of shares to be sold pursuant to options granted on August 1, 2013, can only be estimated because the 2013 plan year is not yet complete. The Company’s estimate of options granted in 2013 under the Plan is based on the number of shares sold to employees under the Employee Stock Purchase Plan for the 2012 plan year, adjusted to reflect the change in the number of employees participating in the Employee Stock Purchase Plan in 2013. The Company recognized compensation expense related to the Employee Stock Purchase Plan of
$0.4 million
,
$0.4 million
, and
$0.3 million
for the years ended December 31, 2013, 2012 and 2011, respectively.
The Company endeavors to utilize the best available information in measuring fair value. Financial assets and liabilities are classified based on the lowest level of input that is significant to the fair value measurement. The following table presents the Company's assets and liabilities measured at fair value at December 31, 2013 and 2012 (in thousands):
|
Fair Value
|
|||||||||
|
Hierarchy
|
December 31, 2013
|
December 31, 2012
|
|||||||
|
Cash equivalents and restricted cash
|
Level 1
|
$
|
36,940
|
|
$
|
39,033
|
|
||
|
Contingent consideration liability
|
Level 3
|
$
|
(2,331
|
)
|
$
|
(2,331
|
)
|
||
|
Senior Unsecured Notes
|
Level 2
|
$
|
305,250
|
|
$
|
—
|
|
||
The Company's cash equivalents and restricted cash, which are held in interest-bearing accounts, qualify for Level 1 in the fair value hierarchy which includes unadjusted quoted market prices in active markets for identical assets.
The Company's accrued liability for a contingent consideration recorded in conjunction with the Bluff acquisition was based on significant inputs not observed in the market and represents a Level 3 fair value measurement. The estimate of the contingent consideration liability uses an income approach and is based on the probability of achieving enabling legislation which permits Internet poker gaming and the probability-weighted discounted cash flows. Any change in the fair value of the contingent consideration subsequent to the acquisition date will be recognized in the Company's Consolidated Statements of Comprehensive Income.
The Company's
$300 million
par value Senior Unsecured Notes, which were issued on December 16, 2013, via a private offering, represent a Level 2 fair value measurement. The fair value of the Senior Unsecured Notes is estimated based on unadjusted quoted prices for similar liabilities in markets that are not active.
The Company currently has no other assets or liabilities subject to fair value measurement on a recurring basis. The following methods and assumptions were used by the Company in estimating its fair value disclosures for financial instruments:
Cash Equivalents—The carrying amount reported in the balance sheet for cash equivalents approximates its fair value due to the short-term maturity of these instruments.
Long-Term Debt: Senior Secured Credit Facility—The carrying amounts of the Company’s borrowings under its Senior Secured Credit Facility approximates fair value, based upon current interest rates and represents a Level 2 fair value measurement.
During the years ended December 31, 2013 and 2012, the Company did not measure any assets at fair value on a non-recurring basis.
Legal Proceedings
The Company records an accrual for legal contingencies to the extent that it concludes that it is probable that a liability has been incurred and the amount of the loss can be reasonably estimated. Except as disclosed below, no estimate of the possible loss or range of loss in excess of amounts accrued, if any, can be made at this time regarding the matters specifically described below. We do not believe that the final outcome of these matters will have a material adverse impact on our business, financial condition and results of operations.
Illinois Department of Revenue
In October 2012, the Company filed a verified complaint for preliminary and permanent injunctive relief and for declaratory judgment (the “Complaint”) against the Illinois Department of Revenue (the “Department”). The Company's complaint was filed
98
Churchill Downs Incorporated
Notes to Consolidated Financial Statements
in response to Notices of Deficiency issued by the Department on March 18, 2010, and September 6, 2012. In response to said Notices of Deficiency, the Company, on October 4, 2012, issued a payment in protest in the amount of
$2.9 million
(the “Protest Payment”) under the State Officers and Employees Money Disposition Act and recorded this amount as an other asset. The Company subsequently filed its complaint in November alleging that the Department erroneously included handle, instead of the Company's commissions from handle, in the computation of the Company's sales factor (a computation of the Company's gross receipts from wagering within the State of Illinois) for determining the applicable tax owed. On October 30, 2012, the Company's Motion for Preliminary Injunctive Relief was granted, which prevents the Department from depositing any monies from the Protest Payment into the State of Illinois General Fund and from taking any further action against the Company until the Circuit Court takes final action on the Company's Complaint. If successful with its Complaint, the Company will be entitled to a full or partial refund of the Protest Payment from the Department. On October 11, 2013, depositions were taken from the plaintiffs. This matter remains pending before the Tax and Miscellaneous Remedies Section of the Circuit Court of Cook County.
Kentucky Downs
On September 5, 2012, Kentucky Downs Management, Inc. (“KDMI”) filed a petition for declaration of rights in Kentucky Circuit Court located in Simpson County, Kentucky styled Kentucky Downs Management Inc. v. Churchill Downs Incorporated (Civil Action No. 12-CI-330) (the “Simpson County Case”) requesting a declaration that the Company does not have the right to exercise its put right and require Kentucky Downs, LLC (“Kentucky Downs”) and/or Kentucky Downs Partners, LLC (“KDP”) to purchase the Company’s ownership interest in Kentucky Downs. On September 18, 2012, the Company filed a complaint in Kentucky Circuit Court located in Jefferson County, Kentucky, styled Churchill Downs Incorporated v. Kentucky Downs, LLC; Kentucky Downs Partners, LLC; and Kentucky Downs Management Inc. (Civil Action No. 12-CI-04989) (the “Jefferson County Case”) claiming that Kentucky Downs and KDP had breached the operating agreement for Kentucky Downs and requesting a declaration that the Company had validly exercised its put right and a judgment compelling Kentucky Downs and/or KDP to purchase the Company’s ownership interest in Kentucky Downs pursuant to the terms of the applicable operating agreement. On October 9, 2012, the Company filed a motion to dismiss the Simpson County Case and Kentucky Downs, KDP and KDMI filed a motion to dismiss the Jefferson County Case. A hearing for the motion to dismiss in the Simpson County Case occurred November 30, 2012. At that hearing the Company’s motion to dismiss the Simpson County Case was denied. Subsequently, Kentucky Downs, KDMI and KDP’s motion to dismiss the Jefferson County Case was granted on January 23, 2013, due to the Simpson County Circuit Court’s assertion of jurisdiction over the dispute. On May 16, 2013, Kentucky Downs, KDP and KDMI filed a Motion for Summary Judgment against the Company and Turfway Park, LLC. On September 19, 2013, the Company filed its response to the Motion for Summary Judgment. A hearing occurred before the Simpson County Circuit Court on September 23, 2013 on the Kentucky Downs, KDP and KDMI Motion for Summary Judgment. All parties appeared before the Simpson County Court and oral arguments were heard. On October 31, 2013, the Simpson County Court entered an Order Denying Petitioners’ (Kentucky Downs Management Inc. et al.) Motion for Summary Judgment. The case will now move forward through discovery and to trial. No trial date has been set.
Texas Pari-Mutuel Wagering
On September 21, 2012, the Company filed a lawsuit in the United States District Court for the Western District of Texas styled C
hurchill Downs Incorporated; Churchill Downs Technology Initiatives Company d/b/a TwinSpires.com v. Chuck Trout, in his official capacity as Executive Director of the Texas Racing Commission; Gary P. Aber, Susan Combs, Ronald F. Ederer, Gloria Hicks, Michael F. Martin, Allan Polunsky, Robert Schmidt, John T. Steen III, Vicki Smith Weinberg, in their official capacity as members of the Texas Racing Commission
(Case No. 1:12-cv-00880-LY) challenging the constitutionality of a Texas law requiring residents of Texas that desire to wager on horseraces to wager in person at a Texas race track. In addition to its complaint, on September 21, 2012, the Company filed a motion for preliminary injunction seeking to enjoin the state from taking any action to enforce the law in question. In response, on October 9, 2012, counsel for the state assured both the Company and the court that the state would not enforce the law in question against the Company without prior notice, at which time the court could then consider the motion for preliminary injunction. On April 15, 2013, both parties filed their opening briefs, and a trial was held on May 2, 2013. On September 23, 2013, the United States District Court for the Western District of Texas ruled against the Company and upheld the Texas law at issue. Subsequently, on September 25, 2013, the Company ceased taking wagers from Texas residents via TwinSpires.com and returned deposited funds to Texas residents. The Company filed a motion for an expedited hearing in the United States Court of Appeals, which was granted on October 17, 2013. The Texas Racing Commission, et. al., filed an appellate brief on December 13, 2013. The Company filed its brief in reply on December 30, 2013. Oral arguments were heard before the United States Court of Appeals for the Fifth Circuit on February 4, 2014, and the Company is awaiting a ruling from the Court.
Balmoral, Maywood and Illinois Harness Horsemen’s Association
On February 14, 2011, Balmoral Racing Club, Inc., Maywood Park Trotting Association, Inc. and the Illinois Harness Horsemen's Association, Inc. filed a lawsuit styled
Balmoral Racing Club, Inc., Maywood Park Trotting Association, Inc. and the Illinois Harness Horsemen's Association Inc. vs. Churchill Downs Incorporated, Churchill Downs Technology Initiatives Company d/b/a TwinSpires.com and Youbet.com, LLC
(Case No. 11-CV-D1028) in the United States District Court for the Northern District of
99
Churchill Downs Incorporated
Notes to Consolidated Financial Statements
Illinois, Eastern Division. The plaintiffs allege that Youbet.com breached a co-branding agreement dated December 2007, as amended on December 21, 2007, and September 26, 2008 (the “Agreement”), which was entered into between certain Illinois racetracks and a predecessor of Youbet.com. The plaintiffs allege that the defendants breached the agreement by virtue of an unauthorized assignment of the Agreement to TwinSpires.com and further allege that Youbet.com and TwinSpires have misappropriated trade secrets in violation of the Illinois Trade Secrets Act. Finally, the plaintiffs allege that the Company and TwinSpires.com tortiously interfered with the Agreement by causing Youbet.com to breach the Agreement. The plaintiffs have alleged damages of at least
$3.6 million
, or alternatively, of at least
$0.8 million
. On April 1, 2011, the plaintiffs filed a motion for a preliminary injunction, seeking an order compelling the defendants to turn over all Illinois customer accounts and prohibiting TwinSpires.com from using that list of Illinois customer accounts. On April 18, 2011, the defendants filed an answer and a motion to dismiss certain counts of the plaintiffs’ complaint, and Youbet.com asserted a counterclaim seeking certain declaratory relief relating to allegations that plaintiffs Maywood and Balmoral breached the Agreement in 2010, leading to its proper termination by Youbet.com on December 1, 2010. The preliminary injunction hearing took place on July 6, 2011, and, on July 21, 2011, the court denied the preliminary injunction. On March 9, 2012, the parties mediated the case without resolution. The parties filed motions for summary judgment in November and December 2012, respectively, and replies were filed in January 2013. During June 2013, the Court denied both parties’ motions for summary judgment. On November 1, 2013, the Company reached a final settlement in the matter and paid the plaintiffs
$2.3 million
, of which
$2.0 million
was reimbursed to the Company by its insurance carrier.
There are no other material pending legal proceedings.
100
Churchill Downs Incorporated
Notes to Consolidated Financial Statements
The following is a reconciliation of the numerator and denominator of the earnings per common share computations (in thousands, except per share data):
|
|
Year Ended December 31,
|
||||||||||
|
|
2013
|
2012
|
2011
|
||||||||
|
Numerator for basic earnings from continuing operations per
common share:
|
|||||||||||
|
Earnings from continuing operations
|
$
|
55,033
|
|
$
|
58,152
|
|
$
|
60,795
|
|
||
|
Earnings from continuing operations allocated to participating securities
|
(873
|
)
|
(518
|
)
|
(1,103
|
)
|
|||||
|
Numerator for basic earnings from continuing operations per
common share
|
$
|
54,160
|
|
$
|
57,634
|
|
$
|
59,692
|
|
||
|
Numerator for basic earnings per common share:
|
|||||||||||
|
Net earnings
|
$
|
54,900
|
|
$
|
58,276
|
|
$
|
64,355
|
|
||
|
Net earnings allocated to participating securities
|
(870
|
)
|
(519
|
)
|
(1,180
|
)
|
|||||
|
Numerator for basic net earnings per common share
|
$
|
54,030
|
|
$
|
57,757
|
|
$
|
63,175
|
|
||
|
Numerator for diluted earnings from continuing operations per common share:
|
$
|
55,033
|
|
$
|
58,152
|
|
$
|
60,795
|
|
||
|
Numerator for diluted earnings per common share
|
$
|
54,900
|
|
$
|
58,276
|
|
$
|
64,355
|
|
||
|
Denominator for net earnings per common share:
|
|||||||||||
|
Basic
|
17,294
|
|
17,047
|
|
16,638
|
|
|||||
|
Plus dilutive effect of stock options and restricted stock
|
248
|
|
233
|
|
118
|
|
|||||
|
Plus dilutive effect of participating securities
|
396
|
|
195
|
|
369
|
|
|||||
|
Diluted
|
17,938
|
|
17,475
|
|
17,125
|
|
|||||
|
Earnings (loss) per common share:
|
|||||||||||
|
Basic
|
|||||||||||
|
Earnings from continuing operations
|
$
|
3.13
|
|
$
|
3.38
|
|
$
|
3.59
|
|
||
|
Discontinued operations
|
(0.01
|
)
|
0.01
|
|
0.21
|
|
|||||
|
Net earnings
|
$
|
3.12
|
|
$
|
3.39
|
|
$
|
3.80
|
|
||
|
Diluted
|
|||||||||||
|
Earnings from continuing operations
|
$
|
3.07
|
|
$
|
3.33
|
|
$
|
3.55
|
|
||
|
Discontinued operations
|
(0.01
|
)
|
0.01
|
|
0.21
|
|
|||||
|
Net earnings
|
$
|
3.06
|
|
$
|
3.34
|
|
$
|
3.76
|
|
||
Options to purchase approximately
18 thousand
shares for the year ended December 31, 2011, were not included in the computation of earnings per common share assuming dilution because the options’ exercise prices were greater than the average market price of the common shares.
The Company operates in the following
four
segments: (1) Racing Operations, which includes Churchill Downs, Arlington and its
eleven
OTBs, Calder and Fair Grounds and the pari-mutuel activity generated at its
twelve
OTBs; (2) Gaming, which includes video poker and gaming operations at Calder Casino, Fair Grounds Slots, Harlow’s, Riverwalk, Oxford and VSI; (3) Online Business, which includes TwinSpires, our ADW business, Fair Grounds Account Wagering, Bloodstock Research Information Services, Velocity and Luckity, as well as the Company's equity investment in HRTV, LLC; and (4) Other Investments, which includes United Tote, MVG, Bluff and the Company's other minor investments. Eliminations include the elimination of intersegment transactions.
Certain financial statement accounts have been reclassified in prior years to conform to current year presentation. There was no impact from these reclassifications on total assets, total liabilities, total net revenues, operating income, Adjusted EBITDA or cash flows.
101
Churchill Downs Incorporated
Notes to Consolidated Financial Statements
In order to evaluate the performance of these operating segments internally, the Company uses Adjusted EBITDA (defined as earnings before interest, taxes, depreciation, amortization, insurance recoveries net of losses, HRE Trust Fund proceeds, share-based compensation expenses, pre-opening expenses, the impairment of assets and other charges or recoveries). Adjusted EBITDA also includes
50%
of the operating income or loss of our joint venture, MVG. During the year ended December 31, 2013, the Company implemented the Adjusted EBITDA metric because it believes the inclusion or exclusion of certain recurring and non-recurring items is necessary to provide a more accurate measure of its core operating results and enables management and investors to evaluate and compare from period to period our operating performance in a meaningful and consistent manner. The 2012 and 2011 financial information has been retrospectively revised to reflect the change in the segment profitability reporting measure. Adjusted EBITDA should not be considered as an alternative to operating income as an indicator of performance, as an alternative to cash flows from operating activities as a measure of liquidity, or as an alternative to any other measure provided in accordance with GAAP. The Company's calculation of Adjusted EBITDA may be different from the calculation used by other companies and, therefore, comparability may be limited.
The accounting policies of the segments are the same as those described in the “Summary of Significant Accounting Policies” in Note 1. The table below presents information about reported segments for the years ended December 31,
2013
,
2012
and
2011
(in thousands):
|
|
Year Ended December 31,
|
||||||||||
|
|
2013
|
2012
|
2011
|
||||||||
|
Net revenues from external customers:
|
|||||||||||
|
Churchill Downs
|
$
|
132,845
|
|
$
|
124,255
|
|
$
|
121,886
|
|
||
|
Arlington
|
64,483
|
|
69,077
|
|
69,694
|
|
|||||
|
Calder
|
36,264
|
|
64,566
|
|
62,715
|
|
|||||
|
Fair Grounds
|
40,677
|
|
44,190
|
|
44,625
|
|
|||||
|
Total Racing Operations
|
274,269
|
|
302,088
|
|
298,920
|
|
|||||
|
Calder Casino
|
78,951
|
|
77,864
|
|
82,819
|
|
|||||
|
Fair Grounds Slots
|
42,156
|
|
42,881
|
|
41,553
|
|
|||||
|
VSI
|
35,931
|
|
35,433
|
|
35,052
|
|
|||||
|
Harlow’s Casino
|
52,440
|
|
56,604
|
|
53,205
|
|
|||||
|
Oxford Casino
|
34,350
|
|
—
|
|
—
|
|
|||||
|
Riverwalk Casino
|
53,645
|
|
10,330
|
|
—
|
|
|||||
|
Total Gaming
|
297,473
|
|
223,112
|
|
212,629
|
|
|||||
|
Online Business
|
184,541
|
|
183,279
|
|
165,416
|
|
|||||
|
Other Investments
|
21,899
|
|
21,785
|
|
19,563
|
|
|||||
|
Corporate
|
1,143
|
|
1,032
|
|
326
|
|
|||||
|
Net revenues from external customers
|
$
|
779,325
|
|
$
|
731,296
|
|
$
|
696,854
|
|
||
|
Intercompany net revenues:
|
|||||||||||
|
Churchill Downs
|
$
|
6,686
|
|
$
|
5,592
|
|
$
|
5,088
|
|
||
|
Arlington
|
3,395
|
|
4,712
|
|
3,725
|
|
|||||
|
Calder
|
1,263
|
|
1,583
|
|
2,307
|
|
|||||
|
Fair Grounds
|
1,151
|
|
1,270
|
|
1,164
|
|
|||||
|
Total Racing Operations
|
12,495
|
|
13,157
|
|
12,284
|
|
|||||
|
Online Business
|
853
|
|
836
|
|
786
|
|
|||||
|
Other Investments
|
4,409
|
|
3,466
|
|
2,015
|
|
|||||
|
Eliminations
|
(17,757
|
)
|
(17,459
|
)
|
(15,085
|
)
|
|||||
|
Net revenues
|
$
|
—
|
|
$
|
—
|
|
$
|
—
|
|
||
102
Churchill Downs Incorporated
Notes to Consolidated Financial Statements
|
|
Year Ended December 31,
|
||||||||||
|
|
2013
|
2012
|
2011
|
||||||||
|
Reconciliation of segment Adjusted EBITDA to net earnings:
|
|||||||||||
|
Racing Operations
|
$
|
50,275
|
|
$
|
54,357
|
|
$
|
47,236
|
|
||
|
Gaming
|
80,429
|
|
64,231
|
|
58,590
|
|
|||||
|
Online Business
|
49,122
|
|
44,618
|
|
40,918
|
|
|||||
|
Other Investments
|
1,011
|
|
(117
|
)
|
1,269
|
|
|||||
|
Total segment Adjusted EBITDA
|
180,837
|
|
163,089
|
|
148,013
|
|
|||||
|
Corporate Adjusted EBITDA
|
(4,606
|
)
|
(4,834
|
)
|
(2,523
|
)
|
|||||
|
Insurance recoveries, net of losses
|
375
|
|
7,006
|
|
972
|
|
|||||
|
HRE Trust Fund proceeds
|
4,541
|
|
—
|
|
19,258
|
|
|||||
|
Share-based compensation expense
|
(21,482
|
)
|
(13,993
|
)
|
(9,730
|
)
|
|||||
|
Pre-opening expenses
|
(3,620
|
)
|
—
|
|
—
|
|
|||||
|
MVG interest expense, net
|
(170
|
)
|
—
|
|
—
|
|
|||||
|
Other charges and recoveries, net
|
(2,500
|
)
|
—
|
|
2,720
|
|
|||||
|
Depreciation and amortization
|
(61,750
|
)
|
(55,600
|
)
|
(55,170
|
)
|
|||||
|
Interest income (expense), net
|
(6,119
|
)
|
(4,441
|
)
|
(8,456
|
)
|
|||||
|
Income tax provision
|
(30,473
|
)
|
(33,075
|
)
|
(34,289
|
)
|
|||||
|
Earnings from continuing operations
|
55,033
|
|
58,152
|
|
60,795
|
|
|||||
|
Discontinued operations, net of income taxes
|
(133
|
)
|
124
|
|
3,560
|
|
|||||
|
Net earnings and comprehensive income
|
$
|
54,900
|
|
$
|
58,276
|
|
$
|
64,355
|
|
||
The table below presents information about equity in (losses) earnings of unconsolidated investments included in the Company's reported segments for the years ended December 31,
2013
,
2012
and
2011
(in thousands):
|
Year Ended December 31,
|
|||||||||||
|
2013
|
2012
|
2011
|
|||||||||
|
Online Business
|
$
|
(848
|
)
|
$
|
(1,413
|
)
|
$
|
(1,198
|
)
|
||
|
Other Investments
|
(3,294
|
)
|
(288
|
)
|
85
|
|
|||||
|
$
|
(4,142
|
)
|
$
|
(1,701
|
)
|
$
|
(1,113
|
)
|
|||
The tables below present total asset information about reported segments as of December 31,
2013
and
2012
and capital expenditures for the years ended December 31,
2013
,
2012
and
2011
(in thousands):
|
|
As of December 31,
|
||||||
|
|
2013
|
2012
|
|||||
|
Total assets:
|
|||||||
|
Racing Operations
|
$
|
513,345
|
|
$
|
502,993
|
|
|
|
Gaming
|
535,887
|
|
382,054
|
|
|||
|
Online Business
|
186,621
|
|
184,638
|
|
|||
|
Other Investments
|
116,408
|
|
44,652
|
|
|||
|
$
|
1,352,261
|
|
$
|
1,114,337
|
|
||
103
Churchill Downs Incorporated
Notes to Consolidated Financial Statements
|
|
Year Ended December 31,
|
||||||||||
|
|
2013
|
2012
|
2011
|
||||||||
|
Capital expenditures, net:
|
|||||||||||
|
Racing Operations
|
$
|
20,184
|
|
$
|
14,027
|
|
$
|
7,484
|
|
||
|
Gaming
|
13,643
|
|
14,524
|
|
7,490
|
|
|||||
|
Online Business
|
5,908
|
|
4,427
|
|
2,774
|
|
|||||
|
Other Investments
|
9,036
|
|
8,320
|
|
4,919
|
|
|||||
|
$
|
48,771
|
|
$
|
41,298
|
|
$
|
22,667
|
|
|||
Directors
and employees of the Company may from time to time own or have interests in horses racing at the Company’s racetracks. All such races are conducted, as applicable, under the regulations of each state’s respective regulatory agency, and no director receives any extra or special benefit with regard to having his or her horses selected to run in races or in connection with the actual running of races. There is no material financial statement impact attributable to directors who may have interests in horses racing at our racetracks.
In its ordinary course of
business
, the Company may enter into transactions with certain of its officers and directors for the sale of personal seat licenses and suite accommodations at its racetracks, and tickets for its live racing events. The Company believes that each such transaction has been on terms no less favorable for the Company than could have been obtained in a transaction with a third party and no such person received any extra or special benefit in connection with such transactions.
Under legislation enacted in 1999, the HRE Trust Fund was scheduled to receive amounts equal to
15%
of the adjusted gross receipts generated by a tenth riverboat casino license to be granted in Illinois. The funds were to be distributed to racetracks in Illinois for purses as well as racetrack discretionary spending. During December 2008, the Illinois Gaming Board awarded the tenth riverboat license to a casino in Des Plaines, Illinois. This casino opened during July 2011, entitling the Illinois racing industry to receive an amount equal to
15%
of the adjusted gross receipts of this casino from the gaming taxes generated by that casino, once the accumulated funds were appropriated by the state.
On July 10, 2013, the Governor of Illinois signed Illinois House Bill 214 into law, providing for the release of
$23.0 million
of funds collected from the tenth riverboat licensee since its opening during 2011. During the year ended December 31, 2013, Arlington received
$7.9 million
as its share of the proceeds, of which
$3.6 million
was designated for Arlington purses. The remaining
$4.2 million
was recognized as miscellaneous other income in the Company's Consolidated Statements of Comprehensive Income during the year ended December 31, 2013. No additional proceeds related to future funds of the tenth riverboat are expected to be distributed to Illinois racetracks under the provisions of House Bill 214.
104
Churchill Downs Incorporated
Notes to Consolidated Financial Statements
Supplementary Financial Information — Results of Operations (Unaudited)
The results from operation for all periods presented have been revised to reflect the results of Fight as discontinued operations. Summarized unaudited consolidated quarterly information for the years ended December 31,
2013
and
2012
is provided below (in thousands, except per common share data):
|
|
For the Year Ended December 31, 2013
|
||||||||||||||
|
|
First Quarter
|
Second Quarter
|
Third Quarter
|
Fourth Quarter
|
|||||||||||
|
Net revenues
|
$
|
147,876
|
|
$
|
283,593
|
|
$
|
185,496
|
|
$
|
162,360
|
|
|||
|
Earnings (loss) from continuing operations
|
$
|
1,089
|
|
$
|
50,308
|
|
$
|
9,208
|
|
$
|
(5,573
|
)
|
|||
|
Discontinued operations, net of income taxes:
|
|||||||||||||||
|
(Loss) earnings from operations
|
$
|
(31
|
)
|
$
|
(10
|
)
|
$
|
41
|
|
$
|
(49
|
)
|
|||
|
Loss on sale of assets
|
—
|
|
—
|
|
—
|
|
$
|
(83
|
)
|
||||||
|
Net earnings and comprehensive income (loss)
|
$
|
1,058
|
|
$
|
50,298
|
|
$
|
9,249
|
|
$
|
(5,705
|
)
|
|||
|
Net earnings per common share:
|
|||||||||||||||
|
Basic:
|
|||||||||||||||
|
Earnings (loss) from continuing operations
|
$
|
0.06
|
|
$
|
2.85
|
|
$
|
0.52
|
|
$
|
(0.32
|
)
|
|||
|
Discontinued operations
|
—
|
|
—
|
|
—
|
|
(0.01
|
)
|
|||||||
|
Net earnings (loss)
|
$
|
0.06
|
|
$
|
2.85
|
|
$
|
0.52
|
|
$
|
(0.33
|
)
|
|||
|
Diluted:
|
|||||||||||||||
|
Earnings (loss) from continuing operations
|
$
|
0.06
|
|
$
|
2.81
|
|
$
|
0.51
|
|
$
|
(0.32
|
)
|
|||
|
Discontinued operations
|
—
|
|
—
|
|
0.01
|
|
(0.01
|
)
|
|||||||
|
Net earnings (loss)
|
$
|
0.06
|
|
$
|
2.81
|
|
$
|
0.52
|
|
$
|
(0.33
|
)
|
|||
|
|
For the Year Ended December 31, 2012
|
||||||||||||||
|
|
First Quarter
|
Second Quarter
|
Third Quarter
|
Fourth Quarter
|
|||||||||||
|
Net revenues
|
$
|
137,973
|
|
$
|
270,467
|
|
$
|
164,607
|
|
$
|
158,250
|
|
|||
|
Earnings from continuing operations
|
$
|
1,301
|
|
$
|
48,509
|
|
$
|
5,964
|
|
$
|
2,378
|
|
|||
|
Discontinued operations, net of income taxes:
|
|||||||||||||||
|
Earnings (loss) from operations
|
$
|
52
|
|
$
|
67
|
|
$
|
9
|
|
$
|
(4
|
)
|
|||
|
Net earnings and comprehensive income
|
$
|
1,353
|
|
$
|
48,576
|
|
$
|
5,973
|
|
$
|
2,374
|
|
|||
|
Net earnings per common share:
|
|||||||||||||||
|
Basic:
|
|||||||||||||||
|
Earnings from continuing operations
|
$
|
0.08
|
|
$
|
2.81
|
|
$
|
0.34
|
|
$
|
0.14
|
|
|||
|
Discontinued operations
|
—
|
|
0.01
|
|
—
|
|
—
|
|
|||||||
|
Net earnings
|
$
|
0.08
|
|
$
|
2.82
|
|
$
|
0.34
|
|
$
|
0.14
|
|
|||
|
Diluted:
|
|||||||||||||||
|
Earnings from continuing operations
|
$
|
0.07
|
|
$
|
2.77
|
|
$
|
0.34
|
|
$
|
0.14
|
|
|||
|
Discontinued operations
|
0.01
|
|
—
|
|
—
|
|
—
|
|
|||||||
|
Net earnings
|
$
|
0.08
|
|
$
|
2.77
|
|
$
|
0.34
|
|
$
|
0.14
|
|
|||
|
ITEM 9.
|
CHANGES IN AND DISAGREEMENTS WITH ACCOUNTANTS ON ACCOUNTING AND FINANCIAL DISCLOSURE
|
None.
|
ITEM 9A.
|
CONTROLS AND PROCEDURES
|
105
Included in this Annual Report on Form 10-K are certifications of our Chief Executive Officer and Chief Financial Officer, which are required in accordance with Rule 13a-14 of the Securities and Exchange Act of 1934, as amended (the “Exchange Act”). This section includes information concerning the controls and controls evaluation referred to in the certifications.
|
(a)
|
Evaluation of Disclosure Controls and Procedures
|
The Company maintains disclosure controls and procedures that are designed to ensure that information required to be disclosed in the reports that the Company files or submits to the Securities and Exchange Commission is recorded, processed, summarized, and reported within the time periods specified in the SEC’s rules and forms, and that such information is accumulated and communicated to the Company’s management, including its Chief Executive Officer and Chief Financial Officer, as appropriate, to allow timely decisions regarding required financial disclosure.
As of the end of the period covered by this report, the Company carried out an evaluation, under the supervision and with the participation of the Company’s Disclosure Committee and management, including the Chief Executive Officer and the Chief Financial Officer, of the effectiveness of the design and operation of our disclosure controls and procedures pursuant to Exchange Act Rule 13a-15(b). Based upon this evaluation, the Chief Executive Officer and the Chief Financial Officer concluded that our disclosure controls and procedures were effective as of
December 31, 2013
.
|
(b)
|
Management’s Report on Internal Control Over Financial Reporting
|
Our management is responsible for establishing and maintaining adequate internal control over financial reporting as defined in Rules 13a-15(f) and 15d-15(f) under the Exchange Act. Our internal control over financial reporting is a process designed to provide reasonable assurance regarding the reliability of financial reporting and the preparation of financial statements for external purposes in accordance with generally accepted accounting principles. Our internal control over financial reporting includes those policies and procedures that:
|
(i)
|
Pertain to the maintenance of records that, in reasonable detail, accurately and fairly reflect the transactions and dispositions of the assets of the Company;
|
|
(ii)
|
Provide reasonable assurance that transactions are recorded as necessary to permit preparation of financial statements in accordance with generally accepted accounting principles, and that receipts and expenditures of the Company are being made only in accordance with authorizations of management and directors of the Company; and
|
|
(iii)
|
Provide reasonable assurance regarding prevention or timely detection of unauthorized acquisition, use or disposition of the Company’s assets that could have a material effect on the financial statements.
|
Because of its inherent limitations, internal control over financial reporting may not prevent or detect misstatements. Also, projections of any evaluation of effectiveness to future periods are subject to the risk that controls may become inadequate because of changes in conditions, or that the degree of compliance with the policies or procedures may deteriorate.
Our management assessed the effectiveness of the Company’s internal control over financial reporting as of
December 31, 2013
. In making this assessment, management used the criteria set forth by the Committee of Sponsoring Organizations of the Treadway Commission (COSO) in
Internal Control-Integrated Framework (1992).
We have excluded Oxford Casino ("Oxford") from our assessment of internal controls over financial reporting as of December 31, 2013, because it was acquired by us in a business acquisition during 2013. Oxford is a wholly-owned subsidiary whose total assets were 12.5% and total revenues were 4.4% of the related consolidated financial statement amounts as of and for the year ended December 31, 2013.
Based on our assessment using those criteria, management has concluded that the Company maintained effective internal control over financial reporting as of
December 31, 2013
.
The effectiveness of the Company’s internal control over financial reporting as of
December 31, 2013
, has been audited by PricewaterhouseCoopers LLP, an independent registered public accounting firm, as stated in their report, which appears under Item 8.
|
(c)
|
Changes in Internal Control Over Financial Reporting
|
Management of the Company has evaluated, with the participation of the Company’s Chief Executive Officer and Chief Financial Officer, changes in the Company’s internal control over financial reporting (as defined in Rule 13a-15(f) of the Exchange Act) during the fourth quarter of
2013
. There have not been any changes in the Company’s internal control over financial reporting (as defined in Rule 13a-15(f) of the Exchange Act) that occurred during the quarter ended
December 31, 2013
that have materially affected, or are reasonably likely to materially affect, the Company’s internal control over financial reporting.
|
ITEM 9B.
|
OTHER INFORMATION
|
106
None.
|
ITEM 10.
|
DIRECTORS, EXECUTIVE OFFICERS AND CORPORATE GOVERNANCE
|
The information required herein is incorporated by reference from sections of the Company’s Proxy Statement titled “Section 16(a) Beneficial Ownership Reporting Compliance,” “Election of Directors,” “Executive Officers of the Company,” “Corporate Governance” and “Audit Committee,” to be filed with the Securities and Exchange Commission in connections with the Company's 2014 Annual Meeting of Shareholders ("the Proxy Statement") pursuant to instruction G(3) of the General Instructions to Form 10-K.
The Company has adopted a Code of Ethics that applies to its Chief Executive Officer, Chief Financial Officer and employees performing similar functions. This Code of Ethics is available on the Company’s corporate website, www.churchilldownsincorporated.com, under the “Investors” heading. A copy of this Code of Ethics is also available and will be sent to shareholders free of charge upon request to the Company’s Secretary.
|
ITEM 11.
|
EXECUTIVE COMPENSATION
|
The information required herein is incorporated by reference from sections of the Company’s Proxy Statement titled “Election of Directors — Director Compensation for the year ended
December 31, 2013
,” “Compensation Committee Interlocks and Insider Participation,” “Corporate Governance,” “Certain Relationships and Related Transactions,” “Executive Compensation,” “Compensation Committee Report” and “Compensation Discussion and Analysis,” pursuant to instruction G(3) of the General Instructions to Form 10-K.
|
ITEM 12.
|
SECURITY OWNERSHIP OF CERTAIN BENEFICIAL OWNERS AND MANAGEMENT AND RELATED STOCKHOLDER MATTERS
|
The information required herein is incorporated by reference from the sections of the Company’s Proxy Statement titled “Security Ownership of Certain Beneficial Owners and Management,” “Election of Directors,” “Executive Officers of the Company” and “Equity Compensation Plan Information,” pursuant to instruction G(3) of the General Instructions to Form 10-K.
|
ITEM 13.
|
CERTAIN RELATIONSHIPS AND RELATED TRANSACTIONS, AND DIRECTOR INDEPENDENCE
|
The information required herein is incorporated by reference from the section of the Company’s Proxy Statement titled “Certain Relationships and Related Transactions” and “Corporate Governance,” pursuant to instruction G(3) of the General Instructions to Form 10-K.
|
ITEM 14.
|
PRINCIPAL ACCOUNTING FEES AND SERVICES
|
The information required herein is incorporated by reference from the section of the Company’s Proxy Statement titled “Independent Public Accountants,” pursuant to instruction G(3) of the General Instructions to Form 10-K.
107
|
ITEM 15.
|
EXHIBITS AND FINANCIAL STATEMENT SCHEDULE
|
|
Pages
|
|||
|
(a)
|
(1)
|
Consolidated Financial Statements
|
|
|
The following financial statements of Churchill Downs Incorporated for the years ended December 31, 2013, 2012 and 2011 are included in Part II, Item 8:
|
|||
|
(2)
|
|||
|
All other schedules are omitted because they are not applicable, not significant or not required, or because the required information is included in the consolidated financial statements or notes thereto.
|
|||
|
(3)
|
For the list of required exhibits, see exhibit index.
|
||
|
(b)
|
Exhibits
|
||
|
(c)
|
All financial statements and schedules except those items listed under Items 15(a)(1) and (2) above are omitted because they are not applicable or not required, or because the required information is included in the consolidated financial statements or notes thereto.
|
||
108
SIGNATURES
Pursuant to the requirements of Section 13 or 15(d) of the Securities Exchange Act of 1934, the registrant has duly caused this report to be signed on its behalf by the undersigned, thereunto duly authorized.
|
CHURCHILL DOWNS INCORPORATED
|
|
|
/s/ Robert L. Evans
|
|
|
Robert L. Evans
Chairman of the Board and
Chief Executive Officer
|
|
|
February 26, 2014
|
|
Pursuant to the requirements of the Securities Exchange Act of 1934, this report has been signed below by the following persons on behalf of the registrant and in the capacities and on the dates indicated.
|
/s/ Robert L. Evans
|
/s/ William E. Mudd
|
/s/ Ulysses L. Bridgeman
|
||
|
Robert L. Evans
|
William E. Mudd
|
Ulysses L. Bridgeman
|
||
|
Chairman of the Board and
|
Executive Vice President and
|
February 26, 2014
|
||
|
Chief Executive Officer
|
Chief Financial Officer
|
(Director)
|
||
|
February 26, 2014
|
February 26, 2014
|
|||
|
(Chairman of the Board and
|
(Principal Financial and
|
|||
|
Principal Executive Officer)
|
Accounting Officer)
|
|||
|
|
||||
|
/s/ Leonard S. Coleman, Jr.
|
/s/ Craig J. Duchossois
|
/s/ Richard L. Duchossois
|
||
|
Leonard S. Coleman, Jr.
|
Craig J. Duchossois
|
Richard L. Duchossois
|
||
|
February 26, 2014
|
February 26, 2014
|
February 26, 2014
|
||
|
(Director)
|
(Director)
|
(Director)
|
||
|
/s/ Robert L. Fealy
|
/s/ Daniel P. Harrington
|
/s/ G. Watts Humphrey, Jr.
|
||
|
Robert L. Fealy
|
Daniel P. Harrington
|
G. Watts Humphrey, Jr.
|
||
|
February 26, 2014
|
February 26, 2014
|
February 26, 2014
|
||
|
(Director)
|
(Director)
|
(Director)
|
||
|
/s/ James F. McDonald
|
/s/ R. Alex Rankin
|
/s/ Darrell R. Wells
|
||
|
James F. McDonald
|
R. Alex Rankin
|
Darrell R. Wells
|
||
|
February 26, 2014
|
|
February 26, 2014
|
|
February 26, 2014
|
|
(Director)
|
(Director)
|
(Director)
|
||
109
CHURCHILL DOWNS INCORPORATED
SCHEDULE II—VALUATION AND QUALIFYING ACCOUNTS
|
Description
|
Balance
Beginning
of Year
|
Acquired
Balances
|
Charged
to
Expenses
|
Deductions
|
Balance
End of
Year
|
||||||||||||||
|
Allowance for doubtful accounts:
|
|||||||||||||||||||
|
2013
|
$
|
1,885
|
|
$
|
—
|
|
$
|
3,785
|
|
$
|
(1,332
|
)
|
$
|
4,338
|
|
||||
|
2012
|
$
|
2,408
|
|
$
|
—
|
|
$
|
1,937
|
|
$
|
(2,460
|
)
|
$
|
1,885
|
|
||||
|
2011
|
$
|
4,098
|
|
$
|
—
|
|
$
|
1,386
|
|
$
|
(3,076
|
)
|
$
|
2,408
|
|
||||
|
Description
|
Balance
Beginning
of Year
|
Additions
|
Deductions
|
Balance
End of
Year
|
|||||||||||
|
Deferred income tax asset valuation allowance:
|
|||||||||||||||
|
2013
|
$
|
1,334
|
|
$
|
168
|
|
$
|
(289
|
)
|
$
|
1,213
|
|
|||
|
2012
|
$
|
1,487
|
|
$
|
33
|
|
$
|
(186
|
)
|
$
|
1,334
|
|
|||
|
2011
|
$
|
1,381
|
|
$
|
106
|
|
$
|
—
|
|
$
|
1,487
|
|
|||
110
EXHIBIT INDEX
|
Numbers
|
Description
|
By Reference To
|
|||
|
2
|
(a)
|
Purchase Agreement dated as of September 10, 2010 among Churchill Downs Incorporated, SWG Holdings, LLC and HCRH, LLC
|
Exhibit 10.1 to Current Report on Form 8-K filed September 13, 2010
|
||
|
3
|
(a)
|
Amended and Restated Articles of Incorporation of Churchill Downs Incorporated, as amended July 3, 2012
|
Exhibit 3.1 to Current Report on Form 8-K filed July 10, 2012
|
||
|
(b)
|
Amended and Restated Bylaws of Churchill Downs Incorporated, as amended July 3, 2012
|
Exhibit 3.1 to Current Report on Form 8-K filed July 10, 2012
|
|||
|
4
|
(a)
|
Rights Agreement, dated as of March 19, 2008 by and between Churchill Downs Incorporated and National City Bank
|
Exhibit 4.1 to Current Report on Form 8-K filed March 17, 2008
|
||
|
(b)
|
Second Amended and Restated Credit Agreement dated December 22, 2009, among Churchill Downs Incorporated, the guarantors party thereto, the Lenders party thereto and JPMorgan Chase Bank, N.A., as agent and collateral agent, with PNC Bank, National Association, as Syndication Agent, and Fifth Third Bank, U.S. Bank, National Association and Wells Fargo Bank, National Association, as Documentation Agents
|
Exhibit 10.1 to Current Report on Form 8-K filed December 29, 2009
|
|||
|
(c)
|
Amendment No. 1 to the Second Amended and Restated Credit Agreement, dated November 1, 2010 among Churchill Downs Incorporated, the guarantors party thereto, the Lenders party thereto and JPMorgan Chase Bank, N.A., as agent and collateral agent, with PNC Bank, National Association, as Syndication Agent, and Fifth Third Bank, U.S. Bank, National Association and Wells Fargo Bank, National Association, Documentation Agents
|
Exhibit 10.1 to Current Report on Form 8-K filed November 1, 2010
|
|||
|
(d)
|
Third Amendment and Restated Credit Agreement, dated May 17, 2013 among Churchill Downs Incorporated, the guarantors party thereto, the Lenders party thereto and JP Morgan Chase Bank, N.A., as agent and collateral agent, with PNC Bank, National Association, as Syndication Agent, and Fifth Third Bank, U.S. Bank, National Association and Wells Fargo Bank, National Association, Documentation Agents
|
Exhibit 10(a) to Quarterly Report on Form 10-Q for the fiscal quarter ended June 30, 2013.
|
|||
|
10
|
(a)
|
Churchill Downs Incorporated Amended and Restated Supplemental Benefit Plan dated December 1, 1998*
|
Exhibit 10(a) to Annual Report on Form 10-K for the fiscal year ended December 31, 1998
|
||
|
(b)
|
Churchill Downs Incorporated 2003 Stock Option Plan*
|
Exhibit 4(e) to the Registration Statement on Form S-8 dated June 20, 2003 (No. 333-106310)
|
|||
|
(c)
|
Churchill Downs Incorporated Amended and Restated Incentive Compensation Plan (1997)*
|
Exhibit 10(g) to Annual Report on Form 10-K for the fiscal year ended December 31, 2003
|
|||
|
(d)
|
Fourth Amended and Restated Churchill Downs Incorporated 1997 Stock Option Plan*
|
Exhibit 10(a) to Quarterly Report on Form 10-Q for the fiscal quarter ended June 30, 2002
|
|||
|
(e)
|
Amended and Restated Lease Agreement dated January 31, 1996
|
Exhibit 10(i) to Annual Report on Form 10-K for the fiscal year ended December 31, 1995
|
|||
|
(f)
|
Churchill Downs Incorporated Amended and Restated Deferred Compensation Plan for Employees and Directors*
|
Exhibit 10(a) to Quarterly Report on Form 10-Q for the fiscal quarter ended March 31, 2001
|
|||
|
(g)
|
Form of Stockholder’s Agreement, dated September 8, 2000 among Churchill Downs Incorporated and Duchossois Industries, Inc.
|
Annex C of the Proxy Statement for a Special Meeting of Shareholders of Churchill Downs Incorporated held September 8, 2000
|
|||
111
|
Numbers
|
Description
|
By Reference To
|
|||
|
(h)
|
Lease Agreement between the City of Louisville, Kentucky and Churchill Downs Incorporated dated January 1, 2003
|
Exhibit 2.1 to Current Report on Form 8-K filed January 6, 2003
|
|||
|
(i)
|
Form of Restricted Stock Agreement*
|
Exhibit 10.1 to Current Report on Form 8-K filed November 30, 2004
|
|||
|
(j)
|
Stock Redemption Agreement dated as of October 19, 2004, between Churchill Downs Incorporated and Brad M. Kelley
|
Exhibit 10.2 to Current Report on Form 8-K filed October 25, 2004
|
|||
|
(k)
|
Churchill Downs Incorporated Amended and Restated Convertible Promissory Note dated March 7, 2005
|
Exhibit 10.1 to Current Report on Form 8-K filed March 11, 2005
|
|||
|
(l)
|
2005 Churchill Downs Incorporated Deferred Compensation Plan, as amended*
|
Exhibit 10.1 to Current Report on Form 8-K filed June 21, 2005
|
|||
|
(m)
|
Reinvestment Agreement dated as of September 23, 2005, among Bay Meadows Land Company, LLC, Stockbridge HP Holdings Company, LLC, Stockbridge Real Estate Fund II-A, LP, Stockbridge Real Estate Fund II-B, LP, Stockbridge Real Estate Fund II-T, LP, Stockbridge Hollywood Park Co-Investors, LP and Churchill Downs Investment Company
|
Exhibit 10.3 to Current Report on Form 8-K filed September 29, 2005
|
|||
|
(n)
|
2006 Amendment to 2005 Churchill Downs Incorporated Deferred Compensation Plan*
|
Exhibit 10.1 to Current Report on Form 8-K filed June 8, 2006
|
|||
|
(o)
|
Churchill Downs Incorporated 2004 Restricted Stock Plan, as amended*
|
Exhibit 10.1 to Current Report on Form 8-K filed June 21, 2006
|
|||
|
(p)
|
Churchill Downs Incorporated Restricted Stock Agreement for 90,000 Shares made as of July 18, 2006 by and between Robert L. Evans and Churchill Downs Incorporated*
|
Exhibit 10(d) to Quarterly Report on Form 10-Q for the fiscal quarter ended September 30, 2006
|
|||
|
(q)
|
Churchill Downs Incorporated 2007 Omnibus Stock Incentive Plan*
|
Exhibit A to Schedule 14A filed April 30, 2007
|
|||
|
(r)
|
Amendment to Churchill Downs Incorporated 2005 Deferred Compensation Plan Adopted June 28, 2007*
|
Exhibit 10(b) to Quarterly Report on Form 10-Q for the fiscal quarter ended June 30, 2007
|
|||
|
(s)
|
Amended and Restated Terms and Conditions of Performance Share Awards Issued Pursuant to the Churchill Downs Incorporated 2007 Omnibus Stock Incentive Plan
|
Exhibit 10.1 to Current Report on Form 8-K filed December 19, 2008
|
|||
|
(t)
|
Amended and Restated Terms and Conditions of Performance Share Awards Issued Pursuant to the Churchill Downs Incorporated 2007 Omnibus Stock Incentive Plan for Employees of TwinSpires
|
Exhibit 10.1 to Current Report on Form 8-K filed December 19, 2008
|
|||
|
(u)
|
First Amendment to the Churchill Downs Incorporated Amended and Restated Incentive Compensation Plan (1997), effective November 14, 2008*
|
Exhibit 10 (vv) to Annual Report on Form 10-K for the fiscal year ended December 31, 2008
|
|||
|
(v)
|
2005 Churchill Downs Incorporated Deferred Compensation Plan (As Amended as of December 1, 2008)*
|
Exhibit 10 (ww) to Annual Report on Form 10-K for the fiscal year ended December 31, 2008
|
|||
|
(w)
|
Churchill Downs Incorporated Executive Severance Policy (Amended Effective as of November 12, 2008)*
|
Exhibit 10 (xx) to Annual Report on Form 10-K for the fiscal year ended December 31, 2008
|
|||
|
(x)
|
Agreement and Sale of Purchase, dated as of November 30, 2009, between The Duchossois Group, Inc. and Arlington Park Racecourse, LLC
|
Exhibit 10.1 to Current Report on Form 8-K filed December 4, 2009
|
|||
|
(y)
|
Promissory Note, dated as of December 3, 2009, made by Arlington Park Racecourse, LLC to The Duchossois Group, Inc.
|
Exhibit 10.2 to Current Report on Form 8-K filed December 4, 2009
|
|||
|
(z)
|
Offer letter to Rohit Thurkal effective May 19, 2009
|
Exhibit 10.1 to Quarterly Report on Form 10-Q for the fiscal quarter ended March 31, 2010
|
|||
112
|
Numbers
|
Description
|
By Reference To
|
|||
|
(aa)
|
Dissolution Agreement for TrackNet Media Group, LLC by and between Churchill Downs Incorporated and MI Developments, Inc, entered May 14, 2010
|
Exhibit 99.1 to Current Report on Form 8-K dated May 19, 2010
|
|||
|
(bb)
|
Amended and Restated Employment Agreement dated as of September 27, 2010, by and between Churchill Downs Incorporated and Robert L. Evans
|
Exhibit 10(a) to Quarterly Report on Form 10-Q for the fiscal quarter ended September 30, 2010
|
|||
|
(cc)
|
Churchill Downs Incorporated Stock Option Agreement for 180,000 Options made as of September 27, 2010 by and between Churchill Downs Incorporated and Robert L. Evans*
|
Exhibit 10(hh) to Annual Report on Form 10-K for the fiscal year ended December 31, 2011
|
|||
|
(dd)
|
Employment Agreement dated as of March 21, 2011 by and between Churchill Downs Incorporated and William C. Carstanjen*
|
Exhibit 10(a) to Amendment No. 1 to Quarterly Report on Form 10-Q for the fiscal quarter ended March 31, 2011
|
|||
|
(ee)
|
Employment Agreement dated as of October 10, 2011 by and between Churchill Downs Incorporated and William E. Mudd*
|
Exhibit 10(a) to Quarterly Report on Form 10-Q for the fiscal quarter ended September 30, 2011
|
|||
|
(ff)
|
Employment Agreement dated as of February 28, 2011 by and between Churchill Downs Incorporated and Alan K. Tse*
|
Exhibit 10(kk) to Annual Report on Form 10-K for the fiscal year ended December 31, 2011
|
|||
|
(gg)
|
Form of Churchill Downs Incorporated Restricted Stock Agreement*
|
Exhibit 10(ll) to Annual Report on Form 10-K for the fiscal year ended December 31, 2011
|
|||
|
(hh)
|
Limited Liability Company Agreement of Miami Valley Gaming & Racing, LLC, dated as of March 1, 2012, among Miami Valley Gaming & Racing, LLC, Churchill Downs Incorporated, MVGR, LLC (a wholly-owned subsidiary of Churchill Downs Incorporated), Delaware North Companies Gaming & Entertainment, Inc. and DNC Ohio Gaming, Inc. (a wholly-owned subsidiary of Delaware North Companies Gaming & Entertainment, Inc.)
|
Exhibit 10.1 to Current Report on Form 8-K filed March 5, 2012
|
|||
|
(ii)
|
Asset Purchase Agreement, dated as of March 1, 2012, between Miami Valley Gaming & Racing LLC; Lebanon Trotting Club, Inc.; Miami Valley Trotting, Inc.; Keith Nixon Jr. and John Carlo
|
Exhibit 10.2 to Current Report on Form 8-K filed March 5, 2012
|
|||
|
(jj)
|
Consulting Agreement dated as of June 26, 2012 by and between Churchill Downs Incorporated and Michael B. Brodsky
|
Exhibit 10(a) to Quarterly Report on Form 10-Q for the fiscal quarter ended June 30, 2012
|
|||
|
(kk)
|
Transition and Separation Agreements dated as of April 10, 2012 by and between Churchill Downs Incorporated and Rohit Thurkal
|
Exhibit 10(a) to Quarterly Report on Form 10-Q for the fiscal quarter ended March 31, 2012
|
|||
|
(ll)
|
Indenture dated as of December 16, 2013 by and among Churchill Downs Incorporated, the Guarantors, and US Bank National Association.
|
Exhibit (4.1) to Current Report on Form 8-K dated December 16, 2013.
|
|||
|
(mm)
|
Registration Rights Agreement dated December 16, 2013 by and among Churchill Downs Incorporated, the Guarantors and the representatives of the initial purchasers.
|
Exhibit (4.2) to Current Report on Form 8-K dated December 16, 2013.
|
|||
|
(nn)
|
Churchill Downs Incorporated Executive Annual Incentive Plan
|
Exhibit A of the Proxy Statement for a Meeting of Shareholders of Churchill Downs Incorporated held June 14, 2012.
|
|||
|
(oo)
|
Amendment to the Churchill Downs Incorporated 2007 Omnibus Stock Incentive Plan
|
Exhibit B of the Proxy Statement for a Meeting of Shareholders of Churchill Downs Incorporated held June 14, 2012.
|
|||
|
14
|
Churchill Downs Incorporated Code of Ethics as of December 31, 2003
|
Exhibit 14 to Annual Report on Form 10-K for the fiscal year ended December 31, 2003
|
|||
113
|
Numbers
|
Description
|
By Reference To
|
|||
|
21
|
Subsidiaries of the Registrant
|
Exhibit 21 to Annual Report on Form 10-K for the fiscal year ended December 31, 2013
|
|||
|
23
|
Consent of PricewaterhouseCoopers LLP, Independent Registered Public Accounting Firm
|
Exhibit 23 to Annual Report on Form 10-K for the fiscal year ended December 31, 2013
|
|||
|
31
|
(a)
|
Certification of Chief Executive Officer Pursuant to Section 302 of the Sarbanes-Oxley Act of 2002
|
Exhibit 31(a) to Annual Report on Form 10-K for the fiscal year ended December 31, 2013
|
||
|
(b)
|
Certification of Principal Financial Officer Pursuant to Section 302 of the Sarbanes-Oxley Act of 2002
|
Exhibit 31(b) to Annual Report on Form 10-K for the fiscal year ended December 31, 2013
|
|||
|
32
|
Certification of Chief Executive Officer and Principal Financial Officer Pursuant to 18 U.S.C. Section 1350, As Adopted Pursuant to Section 906 of the Sarbanes-Oxley Act of 2002 (furnished pursuant to Rule 13a-14(b))
|
Exhibit 32 to Annual Report on Form 10-K for the fiscal year ended December 31, 2013
|
|||
|
101
|
INS
|
XBRL Instance Document
|
|||
|
101
|
SCH
|
XBRL Taxonomy Extension Schema Document
|
|||
|
101
|
CAL
|
XBRL Taxonomy Extension Calculation Linkbase Document
|
|||
|
101
|
DEF
|
XBRL Taxonomy Extension Definition Linkbase Document
|
|||
|
101
|
LAB
|
XBRL Taxonomy Extension Label Linkbase Document
|
|||
|
101
|
PRE
|
XBRL Taxonomy Extension Presentation Linkbase Document
|
|||
* Management contract or compensatory plan or arrangement.
114
TABLE OF CONTENTS
Part IItem 1. BusinessItem 1A. Risk FactorsItem 1B. Unresolved Staff CommentsItem 2. PropertiesItem 3. Legal ProceedingsItem 4. Mine Safety DisclosuresPart IIItem 5. Market For Registrant S Common Equity, Related Stockholder Matters and Issuer Purchases Of Equity SecuritiesItem 6. Selected Financial DataItem 7. Management S Discussion and Analysis Of Financial Condition and Results Of OperationsItem 7. Management's Discussion and Analysis: Recent DevelopmentsItem 7A. Quantitative and Qualitative Disclosures About Market RiskItem 8. Financial Statements and Supplementary DataNote 1 Basis Of Presentation and Summary Of Significant Accounting PoliciesNote 2 Acquisitions and New VenturesNote 3 Discontinued OperationsNote 4 Natural DisastersNote 5 Accounts ReceivableNote 6 Property and EquipmentNote 7 Investment in and Advances To Unconsolidated AffiliateNote 8 GoodwillNote 9 Other Intangible AssetsNote 10 Income TaxesNote 11 Shareholders EquityNote 12 Employee Benefit PlansNote 13 Total DebtNote 14 Operating LeasesNote 15 Long-term Incentive PlanNote 16 Share-based Compensation PlansNote 17 Fair Value Of Assets and LiabilitiesNote 18 Commitments and ContingenciesNote 19 Earnings Per Common Share ComputationsNote 20 Segment InformationNote 21 Related Party TransactionsNote 22 Hre Trust Fund ProceedsItem 9. Changes in and Disagreements with Accountants on Accounting and Financial DisclosureItem 9A. Controls and ProceduresItem 9B. Other InformationPart IIIItem 10. Directors, Executive Officers and Corporate GovernanceItem 11. Executive CompensationItem 12. Security Ownership Of Certain Beneficial Owners and Management and Related Stockholder MattersItem 13. Certain Relationships and Related Transactions, and Director IndependenceItem 14. Principal Accounting Fees and ServicesPart IVItem 15. Exhibits and Financial Statement Schedule