CHURCHILL DOWNS INC
10-Ks and 10-Qs
|
|
|
|
|
|
|
|
|
|
|
|
|
|
|
|
|
|
|
|
|
|
|
|
|
|
|
|
|
|
|
|
|
|
|
|
|
|
|
|
|
|
|
|
|
|
|
|
|
|
|
|
|
|
|
|
UNITED STATES
SECURITIES AND EXCHANGE COMMISSION
WASHINGTON, D.C. 20549
FORM 10-K
|
x
|
ANNUAL REPORT PURSUANT TO SECTION 13 OR 15(d) OF THE SECURITIES EXCHANGE
ACT OF 1934
|
For the fiscal year ended
December 31, 2016
OR
|
o
|
TRANSITION REPORT PURSUANT TO SECTION 13 OR 15(d) OF THE SECURITIES EXCHANGE ACT OF 1934
|
For the transition period from
to
Commission file number 001-33998
(Exact name of registrant as specified in its charter)
|
Kentucky
|
|
61-0156015
|
|
(State or other jurisdiction of incorporation or organization)
|
|
(IRS Employer Identification No.)
|
|
600 North Hurstbourne Parkway, Suite 400
Louisville, Kentucky 40222
|
|
(502) 636-4400
|
|
(Address of principal executive offices) (zip code)
|
|
(Registrant’s telephone number, including area code)
|
Securities registered pursuant to Section 12(b) of the Act:
|
Common Stock, No Par Value
|
|
The NASDAQ Stock Market LLC
|
|
(Title of each class registered)
|
|
(Name of each exchange on which registered)
|
Securities registered pursuant to Section 12(g) of the Act:
None
(Title of class)
Indicate by check mark if the Registrant is a well-known seasoned issuer, as defined in Rule 405 of the Securities Act. Yes
x
No
o
Indicate by check mark if the Registrant is not required to file reports pursuant to Section 13 or Section 15(d) of the Exchange Act. Yes
o
No
x
Indicate by check mark whether the Registrant (1) has filed all reports required to be filed by Section 13 or 15(d) of the Exchange Act during the preceding 12 months and (2) has been subject to such filing requirements for the past 90 days. Yes
x
No
o
Indicate by check mark whether the Registrant has submitted electronically and posted on its corporate Web site, if any, every Interactive Data File required to be submitted and posted pursuant to Rule 405 of Regulation S-T (§232.405) during the preceding 12 months (or for such shorter period that the Registrant was required to submit and post such files). Yes
x
No
o
Indicate by check mark if disclosure of delinquent filers pursuant to Item 405 of Regulation S-K is not contained herein, and will not be contained, to the best of Registrant’s knowledge, in definitive proxy or information statements incorporated by reference in Part III of this Form 10-K or any amendment to this Form 10-K.
o
Indicate by check mark whether the Registrant is a large accelerated filer, an accelerated filer, a non-accelerated filer or a smaller reporting company. See definitions of "large accelerated filer," "accelerated filer" and "smaller reporting company" in Rule 12b-2 of the Exchange Act.
|
Large accelerated filer
x
|
Accelerated filer
o
|
Non-accelerated filer
o
|
Smaller reporting company
o
|
Indicate by check mark whether the Registrant is a shell company (as defined in Rule 12b-2 of the Exchange Act). Yes
o
No
x
As of
February 23, 2016
,
16,430,884
shares of the Registrant’s Common Stock were outstanding. As of
June 30, 2016
(based upon the closing sale price for such date on the NASDAQ Global Market), the aggregate market value of the shares held by non-affiliates of the Registrant was
$1,696,748,433
.
Portions of the Registrant’s Proxy Statement for its Annual Meeting of Shareholders to be held on April 25, 2017 are incorporated by reference herein in response to Items 10, 11, 12, 13 and 14 of Part III of Form 10-K. This Form 10-K filing includes 106 pages, which includes an exhibit index on pages 103-106.
CHURCHILL DOWNS INCORPORATED
INDEX TO ANNUAL REPORT ON FORM 10-K
For the Year Ended
December 31, 2016
|
Financial Statements
and Supplemental Data
|
||
2
Cautionary Statement Regarding Forward-Looking Information
This Annual Report on Form 10-K (“Report”) including the information incorporated by reference herein, contains various "forward-looking statements" within the meaning of Section 27A of the Securities Act of 1933 and Section 21E of the Securities Exchange Act of 1934. The Private Securities Litigation Reform Act of 1995 (the “Act”) provides certain "safe harbor" provisions for forward-looking statements. All forward-looking statements made in this Report are made pursuant to the Act. The reader is cautioned that such forward-looking statements are based on information available at the time and/or management’s good faith belief with respect to future events, and are subject to risks and uncertainties that could cause actual performance or results to differ materially from those expressed in the statements. Forward-looking statements speak only as of the date the statement was made. We assume no obligation to update forward-looking information to reflect actual results, changes in assumptions or changes in other factors affecting forward-looking information. Forward-looking statements are typically identified by the use of terms such as “anticipate,” “believe,” “could,” “estimate,” “expect,” “intend,” “may,” “might,” “plan,” “predict,” “project,” “seek,” “should,” “will,” and similar words, although some forward-looking statements are expressed differently. Although we believe that the expectations reflected in such forward-looking statements are reasonable, we can give no assurance that such expectations will prove to be correct. Important factors that could cause actual results to differ materially from expectations include the factors described in Item 1A. Risk Factors of this Report.
3
|
ITEM 1.
|
BUSINESS
|
A. Introduction
Churchill Downs Incorporated (the "Company", "we", "us", "our") is an industry-leading racing, gaming and online entertainment company anchored by our iconic flagship event -
The Kentucky Derby
. We are a leader in brick-and-mortar casino gaming with approximately
9,030
gaming positions in seven states, and we are the largest, legal mobile and online platform for betting on horseracing in the United States. We are also one of the world's largest producers and distributors of mobile games. We were organized as a Kentucky corporation in 1928, and our principal executive offices are located in Louisville, Kentucky.
B. Business Segments
We manage our operations through six operating segments: Racing, Casinos, TwinSpires, Big Fish Games, Other Investments and Corporate. Financial information about these segments is set forth in Item 8. Financial Statements and Supplementary Data, Note 19 of Notes to Consolidated Financial Statements contained within this report. Further discussion of financial results by operating segment is provided in Item 7. Management’s Discussion and Analysis of Financial Condition and Results of Operations contained within this report.
Racing Segment
Our Racing segment includes our four racetracks: Churchill Downs Racetrack ("Churchill Downs"), Arlington International Race Course ("Arlington"), Fair Grounds Race Course ("Fair Grounds") and Calder Race Course ("Calder"). We conduct live horseracing at Churchill Downs, Arlington and Fair Grounds. On July 1, 2014, we entered into a racing services agreement with The Stronach Group ("TSG") to allow Gulfstream Park to manage and operate Calder through December 31, 2020.
Our racing revenue includes commissions on pari-mutuel wagering at our racetracks and off-track betting facilities ("OTBs") plus simulcast host fees earned from other wagering sites. In addition, ancillary revenue generated by the pari-mutuel facilities includes admissions, sponsorships and licensing rights, and food and beverage sales. Racing revenue and income are influenced by our racing calendar. Racing dates are generally approved annually by the respective state racing authorities. Therefore, racing revenue and operating results for any interim quarter are not generally indicative of the revenue and operating results for the year. The majority of our live racing revenue occurs during the second quarter with the running of the Kentucky Oaks and Kentucky Derby at Churchill Downs.
Churchill Downs, Arlington, Fair Grounds, our
ten
OTBs in Illinois and
twelve
OTBs in Louisiana offer year-round simulcast wagering. Gulfstream Park took over operations of Calder’s simulcast wagering beginning July 1, 2014. The OTBs accept wagers on races at the respective racetrack or on races simulcast from other locations.
We generate a significant portion of our pari-mutuel wagering revenue by sending signals of races from our racetracks to other facilities and businesses ("export") and receiving signals from other racetracks ("import"). Revenue is earned through pari-mutuel wagering on signals that we both import and export.
Churchill Downs
Churchill Downs is located in Louisville, Kentucky and is an internationally known thoroughbred racing operation best known as the home of the iconic Kentucky Derby. We have conducted thoroughbred racing continuously at Churchill Downs since 1875. The Kentucky Derby is the longest continuously held annual sporting event in the United States and is the first race of the annual series of races for 3-year old thoroughbreds known as the Triple Crown. Our history of record attendance, increasing wagering and television viewership is attractive to presenting sponsors and contributed to the seventh consecutive year of earnings growth in 2016. We conducted
74
live race days in
2014
,
70
in
2015
and
70
in
2016
. We anticipate having
70
live race days in
2017
.
In 2002, as part of the financing of improvements to the Churchill Downs facility, we transferred title of the Churchill Downs facility to the City of Louisville, Kentucky and leased back the facility. Subject to the terms of the lease, we can re-acquire the facility at any time for $1.00.
The facility consists of approximately 147 acres of land with a one-mile dirt track, a seven-eighths (7/8) mile turf track, a grandstand, luxury suites and a stabling area. The facility accommodates approximately 59,000 patrons in our clubhouse, grandstand, Jockey Club Suites, Finish Line Suites, Turf Club, Grandstand Terrace, Rooftop Garden and Mansion. We have a saddling paddock, accommodations for groups and special events and parking areas for the public. Our racetrack also has permanent lighting in order to accommodate night races. The stable area has barns sufficient to accommodate approximately 1,400 horses and a 114-room dormitory for backstretch personnel. The Churchill Downs facility also includes a simulcast wagering facility.
We have continued to invest in the facility to enhance the experience of our customers. During 2014, we completed the installation of a 15,224 square-foot, state of the art, high-definition video board that provides an enhanced viewing experience for patrons.
4
We also created The Mansion, which provides premium accommodations for 298 guests. We also opened the Grandstand Terrace and Rooftop Garden, which together added 2,400 new seats, wagering windows, and food and beverage offerings.
During the second quarter of 2015, we opened our new winner’s circle suites and a courtyard. The winner’s circle suites include 20 private, open-air suites reserved specifically for Kentucky Oaks and Kentucky Derby horsemen. The courtyard is a spacious lawn area in front of the winner’s circle suites.
During the second quarter of 2016, we finalized our $19.0 million renovation of the Turf Club and other premium areas. The Turf Club is an exclusive, members-only lounge and dining room located in the clubhouse section of Churchill Downs, directly overlooking the racetrack's finish line.
In October 2016, we announced a $16.0 million renovation to modernize 95,000 square feet of the second floor clubhouse. The capital project is designed to improve the venue circulation and service as well as to enhance food and beverage offerings. The project is expected to be completed prior to the 2017 Kentucky Derby.
In November 2016, we announced a $37.0 million capital project that will deliver more than 1,800 new seats for the 2018 Kentucky Derby through the addition of 36 new luxury starting gate suites and interior dining tables.
We also provide additional stabling and training facilities sufficient to accommodate 500 horses and a three-quarter (3/4) mile dirt track at a facility known as Trackside Louisville, which is located approximately five miles from the racetrack facility.
Arlington
The Arlington racetrack is located in Arlington Heights, Illinois and is a thoroughbred racing operation with
ten
OTBs. The Arlington racetrack hosts a significant stakes race, the Arlington Million. We conducted
89
live race days in
2014
,
77
in
2015
and
74
in
2016
. We anticipate having
71
live race days in
2017
.
The racetrack sits on 336 acres, has a one and one-eighth (1 1/8) mile synthetic track, a one-mile turf track and a five-eighths (5/8) mile training track. The facility includes a clubhouse, grandstand and suite seating for approximately 7,500 persons, and food and beverage facilities. The stable area can accommodate 2,200 horses and has 546 rooms of temporary housing.
Fair Grounds
The Fair Grounds racetrack is located in New Orleans, Louisiana and is a racing operation with
twelve
OTBs in Louisiana. The Fair Grounds racetrack hosts a significant stakes race, the Louisiana Derby. We conducted
82
thoroughbred live race days in
2014
,
83
in
2015
and
78
in
2016
. We anticipate having
81
thoroughbred live race days in
2017
. We conducted 12 quarter horse live race days in
2014
, 10 in
2015
and 10 in
2016
. We anticipate having 10 quarter horse live race days in
2017
.
The Fair Grounds facility consists of approximately 145 acres of land, a one-mile dirt track, a seven-eighths (7/8) mile turf track, a grandstand and a stabling area. The facility includes clubhouse and grandstand seating for approximately 5,000 persons, a general admissions area and food and beverage facilities. The stable area consists of barns that can accommodate 1,897 horses and living quarters for 132 people.
Calder
Calder is located in Miami Gardens, Florida and is adjacent to Hard Rock Stadium, home of the Miami Dolphins. Calder is a thoroughbred racing facility that consists of approximately 170 acres of land with a one-mile dirt track, 7/8-mile turf track, barns and stabling facilities.
On July 1, 2014, we finalized an agreement with TSG that expires on December 31, 2020 under which we permit TSG to operate and manage Calder’s racetrack and certain other racing and training facilities and to provide live horseracing under Calder’s racing permits. During the term of the agreement, TSG pays Calder a racing services fee and is responsible for the direct and indirect costs of maintaining the racing premises, including the training facilities and applicable barns, and TSG receives the associated revenue from the operation.
In late 2014 and into 2015, we assessed potential alternative uses of the Calder property that are not associated with the TSG lease agreement. Based on our analysis, we razed the barns that were not associated with the TSG agreement and commenced the demolition of the grandstand and certain ancillary facilities. The Company recognized Calder exit costs of $2.5 million in 2016, $13.9 million in 2015 and $2.3 million in 2014 related to demolition costs for the removal of the grandstand. The Calder exit costs recognized in 2015 included a non-cash impairment charge of $12.7 million to reduce the net book value of the grandstand assets to zero.
On November 8, 2016, we completed the sale of 61 acres of excess, undeveloped land at Calder for which we received total proceeds of $25.6 million.
5
Casinos Segment
We are also a provider of brick-and-mortar real-money casino gaming with approximately
9,030
gaming positions located in seven states. We own five casinos (Oxford Casino, Riverwalk Casino, Harlow’s Casino, Calder Casino and Fair Grounds Slots and Video Services, LLC) and two hotels (Riverwalk and Harlow’s). In addition, we have a 50% equity investment in Miami Valley Gaming, LLC ("MVG") and a 25% equity investment in Saratoga Casino Holdings LLC ("SCH"). Our casino revenue is primarily generated from slot machines, video poker and table games while ancillary revenue includes hotel and food and beverage sales.
Oxford
Our Oxford Casino ("Oxford") is located in Oxford, Maine. Oxford is a 27,000 square-foot casino with approximately
870
slot machines,
28
table games and two dining facilities on approximately 97 acres of land.
On April 28, 2016, we announced plans to construct a new attached $25.0 million hotel at the Oxford property. The capital project includes expansion of the existing Oxford gaming floor and the hotel will feature over 100 new guest rooms including standard rooms and suites, as well as additional dining options. We anticipate the hotel opening in the second half of 2017.
Riverwalk
Our Riverwalk Casino ("Riverwalk") is located in Vicksburg, Mississippi. Riverwalk is a 25,000 square-foot casino with approximately
640
slot machines,
15
table games, a five-story 80-room attached hotel and two dining facilities on approximately 22 acres of land.
Harlow’s
Our Harlow’s Casino ("Harlow’s") is located in Greenville, Mississippi. Harlow’s is a 33,000 square-foot casino with approximately
740
slot machines,
15
table games, a 105-room attached hotel, a 5,600 square-foot multi-functional event center and four dining facilities. Harlow’s is located on approximately 84 acres of leased land adjacent to U.S. Highway 82 in Greenville, Mississippi.
Calder
Our Calder Casino ("Calder Casino") is located in Miami Gardens, Florida near Hard Rock Stadium and is adjacent to Calder Race Course. Calder Casino is a 106,000 square-foot facility with approximately
1,090
slot machines and two dining facilities on a single-level.
Fair Grounds Slots and Video Services, LLC
Fair Grounds Slots is located in New Orleans, Louisiana adjacent to Fair Grounds Race Course. Fair Grounds Slots is a 33,000 square-foot slot facility that operates approximately
620
slot machines with two concession areas, a bar, a simulcast facility and other amenities for slots and pari-mutuel wagering patrons. Video Services, LLC ("VSI") is the owner and operator of approximately
790
video poker machines in
ten
OTBs in Louisiana.
Miami Valley Gaming Equity Investment
We have a 50% equity investment in MVG that owns a video lottery terminal ("VLT") facility and harness racetrack on 120 acres in Lebanon, Ohio, which opened on December 12, 2013. MVG is an 186,000 square-foot facility with approximately
1,710
VLTs, a racing simulcast center, a 5/8- mile harness racetrack and four dining facilities. MVG conducted
64
days of live harness racing in
2014
,
89
days of live harness racing in
2015
and
86
days of live harness racing in
2016
. MVG expects to conduct
87
days of live harness racing in
2017
.
Saratoga Casino Holdings LLC Equity Investment
On October 2, 2015, we completed the acquisition of a 25% equity investment in SCH which owns Saratoga Casino and Raceway ("Saratoga's New York facility") in Saratoga Springs, New York, for $24.5 million from Saratoga Harness Racing, Inc. ("SHRI"). Saratoga's New York facility has a casino with approximately 1,700 VLT machines, a 1/2-mile harness racetrack with a racing simulcast center and three dining facilities. Saratoga's New York facility has a 50% interest in a joint venture with Delaware North Companies Gaming & Entertainment Inc. ("DNC") to manage the Gideon Putnam Hotel and Resort. We also signed a five-year management agreement with SCH to manage Saratoga's New York facility for which we receive management fee revenue.
On July 6, 2016, Saratoga's New York facility completed a $40.0 million expansion including a 117-room hotel, additional dining facilities and a 3,000 square-foot multi-functional event space. Saratoga's New York facility conducted
160
days in
2014
,
170
days in
2015
and
169
days of live harness racing in
2016
. Saratoga's New York facility expects to conduct
170
days of live harness racing in
2017
.
On November 21, 2016, we completed the acquisition of a 25% equity investment in Saratoga Casino Black Hawk in Black Hawk, Colorado ("Saratoga's Colorado facility") for $6.5 million from SHRI. Saratoga's Colorado facility has a casino with approximately
450
slot machines,
nine
table games, three lounges and two dining facilities.
6
Our equity gain or loss from Saratoga's New York facility and Saratoga's Colorado facility are reported as Saratoga (collectively, "Saratoga").
Ocean Downs Equity Investment
In August 2016, we signed a limited liability company operating agreement with SCH, with each entity having a 50% interest, and formed Old Bay Gaming and Racing LLC (“Old Bay”). The Old Bay agreement provides both the Company and SCH equal participating rights, and both entities must consent to Old Bay’s operating, investing and financing decisions.
On January 3, 2017, Old Bay acquired all of the equity interests of Ocean Enterprise 589 LLC, Ocean Downs LLC and Racing Services LLC (collectively, “Ocean Downs”). Ocean Downs, located near Ocean City, Maryland, owns and operates VLTs at the Casino at Ocean Downs and conducts harness racing at Ocean Downs Racetrack. The Company’s 25% interest in SCH provides an additional 12.5% interest, resulting in an effective 62.5% interest in Ocean Downs. Since both the Company and SCH have participating rights and both must consent to Old Bay’s operating, investing and financing decisions, the Company will account for Ocean Downs using the equity method of accounting.
The casino at Ocean Downs has approximately
800
VLTs and two dining facilities. The racetrack at Ocean Downs conducted
48
days in
2014
,
48
days in
2015
and
47
days of live harness racing in
2016
. The racetrack at Ocean Downs expects to conduct
48
days of live harness racing in
2017
.
TwinSpires Segment
Our TwinSpires segment includes TwinSpires.com, Fair Grounds Account Wagering ("FAW"), Velocity, Churchill Downs Interactive Gaming ("I-Gaming"), Bluff Media ("Bluff") and Bloodstock Research Information Services ("BRIS").
TwinSpires.com is headquartered in Louisville, Kentucky and operates our mobile and online wagering business, which is our platform for betting on horseracing. We are the country’s largest legal online gaming platform in the U.S. TwinSpires accepts pari-mutuel wagers from customers residing in certain states who establish and fund an account from which they may place wagers via telephone, mobile device (through a browser or the TwinSpires mobile app) or through the Internet at
www.twinspires.com
. Our business is licensed as a multi-jurisdictional simulcasting and interactive wagering hub in the state of Oregon. We offer our customers streaming video of live horse races, as well as replays, and an assortment of racing and handicapping information. In addition, we provide technology services to third parties, and we earn commissions from white label advance deposit wagering products and services. Under these arrangements, we typically provide an advance deposit wagering platform and related operational services while the third party typically provides a brand name, marketing and limited customer functions. We believe that TwinSpires.com is a key component to our growth, and our gaming platform positions us to be a continued market leader in online gaming.
Our FAW business is a mobile and online wagering business licensed in the state of Louisiana that is operated by Fair Grounds Race Course for Louisiana residents through a contractual agreement with TwinSpires.com.
Velocity is a mobile and online wagering business licensed under TwinSpires.com, which focuses on high dollar wagering international customers. During December 2016, we completed the transition of Velocity customers to the TwinSpires.com Oregon license.
I-Gaming is our Internet real-money gaming operation. During May 2015, I-Gaming entered into an agreement with a licensed card room operator to provide Internet-based interactive gaming services within California, should enabling legislation be enacted that would permit such activities. The term of the agreement commences after enabling legislation and upon the acceptance of the first customer wager and will then continue for a ten-year period. Under the agreement, I-Gaming and the licensed operator will jointly provide a platform for operations, obtain and maintain required licenses and regulatory approvals, and operate Internet-based interactive gaming services that will be marketed to California residents. These Internet-based interactive gaming services may include poker and other real-money gaming activities. At this time, it is difficult to assess whether this legislation will be enacted into law and the effect it would have on our business.
Bluff operated a multimedia poker periodical (
BLUFF Magazine
and
BluffMagazine.com),
maintained a comprehensive online database (ThePokerDB) that tracked and ranked the performance of poker players and tournaments, and provided various other news and content forums. We acquired Bluff in February 2012, and we ceased operations of
BLUFF
Magazine
in July 2015.
BRIS is a data service provider with one of the world’s largest computerized databases of handicapping and pedigree information for the thoroughbred horse industry. We provide special reports, statistical information, handicapping information, pedigrees and other data through our websites Brisnet.com and TwinSpires.com.
HRTV, LLC ("HRTV") was an equity investment in a horseracing television channel. We divested HRTV on January 2, 2015.
7
Big Fish Games Segment
On December 16, 2014, we completed the acquisition of Big Fish Games, Inc. ("Big Fish Games"), a global producer and distributor of social casino, casual and mid-core free-to-play and premium paid games for PC, Mac and mobile devices. Big Fish Games is headquartered in Seattle, Washington and has locations in Oakland, California and Luxembourg, with approximately 700 employees.
We utilize a portfolio approach to game development and have six internal studios with distinct production strategies as well as a large network of third-party developers to supplement our internal game production capabilities. We are a major producer of content and a direct-to-consumer, analytics-focused marketer and distributor of content across multiple platforms, including PC, Mac and mobile (including iOS and Android devices). We focus on delivering high quality game play and scaling these games to large audiences. When we release new games, we have an advanced marketing and analytic platform that allows us to quickly reach a broad game audience while leveraging a positive spread between the cost to acquire users and the expected net revenue from those users.
We have distributed more than 2.8 billion games to customers in 150 countries and are currently ranked as the seventh largest mobile publisher by combined iOS and Android sales in the U.S. based on 2016 gross revenue. The business operates in three business lines: 1) social casino, 2) casual and mid-core free-to-play and 3) premium paid games.
Social Casino Games
Social casino games are free to download through PC, Mac and mobile devices with a free-to-play business model. Monetization occurs through the consumer purchase of in-app virtual currency to enhance the game-playing experience. We view
Big Fish Casino
as a social game platform within a single app that includes multiple casino-style games such as blackjack, poker, slots, craps and roulette.
Big Fish Casino
is consistently a top-five social casino title on iOS and Google Play app stores based on gross revenue.
Jackpot City Slots
and
Vegas Party Slots
are other examples of our social casino games.
Casual and Mid-core Free-to-play Games
Casual and mid-core free-to-play games are also free to download through PC, Mac and mobile devices. Casual games consist of non-casino game genres such as match three, puzzle, hidden object and solitaire. Mid-core free-to-play games include non-casino game genres such as simulation, role-playing, adventure, collectible card and strategy. These games are monetized through the consumer purchase of in-app virtual currency which players can use to buy virtual items to enhance the game-playing experience. Over time, we have experienced a significant increase in our monthly average users largely due to the continued growth of our mobile free-to-play offerings.
Gummy Drop!
and
Fairway Solitaire
are examples of our casual free-to-play games and
Dungeon Boss
is an example of our mid-core free-to-play games.
Premium Paid Games
Premium paid games are those where customers pay a single price upfront to download a game on their PC, Mac and mobile devices. There is no further monetization through in-game purchases. The games tend to be linear in nature and have a distinct beginning, middle and end.
Other Investments Segment
Our Other Investments Segment includes United Tote, Capital View Casino & Resort Joint Venture ("Capital View") and our other minor investments.
United Tote
Our subsidiaries, United Tote Company and United Tote Canada (collectively "United Tote"), manufacture and operate pari-mutuel wagering systems for racetracks, OTBs and other pari-mutuel wagering businesses. United Tote provides totalisator services which accumulate wagers, record sales, calculate payoffs and display wagering data to patrons who wager on horse races. United Tote has contracts to provide totalisator services to a significant number of third-party racetracks, OTBs and other pari-mutuel wagering businesses and also provides these services at many of our facilities.
Capital View Casino & Resort Joint Venture
Capital View is a 50% joint venture with SHRI that unsuccessfully bid on the development of a destination casino and resort in the Capital Region of New York.
Corporate Segment
Our Corporate segment includes miscellaneous and other revenue, compensation expense, professional fees and other general and administrative expense not allocated to our other operating segments.
8
C. Competition
Overview
We operate in a highly competitive industry with a large number of participants, some of which have financial and other resources that are greater than ours. The industry faces competition from a variety of sources for discretionary consumer spending, including spectator sports, fantasy sports and other entertainment and gaming options. Internet-based interactive gaming and wagering, both legal and illegal, is growing rapidly and we anticipate competition in this area will become more intense as new Internet-based ventures enter the industry and as state and federal regulations on Internet-based activities are clarified. Additionally, our brick-and-mortar casinos compete with traditional and Native American casinos, video lottery terminals, state-sponsored lotteries and other forms of legalized gaming in the U.S. and other jurisdictions.
Legalized gambling is currently permitted in various forms in many states and Canada. Other jurisdictions could legalize gambling in the future, and established gaming jurisdictions could award additional gaming licenses or permit the expansion of existing gaming operations. If additional gaming opportunities become available near our racing or gaming operations, such gaming operations could have a material adverse impact on our business.
Racing
In
2016
, approximately
42,000
thoroughbred horse races were conducted in the United States. Of these races, we hosted
2,073
races, or
4.9%
of the total. As a content provider, we compete for wagering dollars in the simulcast market with other racetracks conducting races at or near the same times as our races. As a racetrack operator, we also compete for horses with other racetracks running live racing meets at or near the same time as our races. Our ability to compete is substantially dependent on the racing calendar, number of horses racing and purse sizes. In recent years, competition has increased as more states legalize gaming and allow slot machines at racetracks with mandatory purse contributions. Over 89 percent of pari-mutuel handle is bet at off-track locations, either at other racetracks, OTBs, casinos, or through mobile and online wagering channels. As a content distributor, we compete for these dollars to be wagered at our racetracks, OTBs, casinos and via our mobile and online wagering business.
Churchill Downs
Churchill Downs faces competition from freestanding casinos and racetracks that are combined with casinos ("racinos") in Indiana, West Virginia and Ohio. In Indiana, these casinos include Horseshoe Indiana, in Elizabeth, Indiana; Belterra Casino in Florence, Indiana and French Lick Resort in French Lick, Indiana. In Indiana, there are two racinos: Hoosier Park which operates 2,000 slot machines, and Indiana Grand Racing & Casino, which operates 2,200 slot machines. In West Virginia, there is one racino, Mountaineer Casino Racetrack and Resort. In Ohio, seven racetracks offer VLT facilities.
In New York, Aqueduct Racetrack has a gaming facility with more than 5,400 VLTs and electronic table games. As a result of the addition of gaming activities, New York purse payments at each of the three New York racetracks were greatly enhanced compared to historical levels.
These developments may result in Indiana, Ohio and New York racetracks attracting horses that would otherwise race at Kentucky racetracks, including Churchill Downs, thus negatively affecting the number of starters that, in turn, may have a negative effect on handle.
Arlington
Arlington competes in the Chicago market against a variety of entertainment options. In addition to other racetracks in the area such as Hawthorne Race Course, there are ten riverboat casino operations that draw from the Chicago market including Rivers Casino, in Des Plaines, Illinois. Additionally, Native American gaming operations in Wisconsin may also adversely affect Arlington.
The Video Gaming Act was enacted in July 2009, authorizing the placement of up to five Video Gaming Terminals ("VGTs") in licensed retail establishments, truck stops, and veteran and fraternal establishments. There are currently over 22,000 VGTs distributed among more than 5,000 establishments throughout Illinois.
Fair Grounds
Fair Grounds competes in Louisiana in both thoroughbred and quarter horse racing with Louisiana Downs, Evangeline Downs, Harrah's Louisiana Downs and Delta Downs as well as with other southern state racetracks, including Gulfstream Park in Florida and Oaklawn Park in Arkansas.
Casinos
Oxford
Oxford competes with Hollywood Casino in Bangor, Maine. Oxford also competes with Plainridge Park Casino in Plainville, Massachusetts, which opened in June 2015. Two other casinos are expected to open in Massachusetts in the future.
9
Riverwalk
Riverwalk competes in the Vicksburg, Mississippi area and is one of four casinos in the local market. Our principal local competitors are Ameristar Casino, Lady Luck Casino and WaterView Casino & Hotel. In addition, Riverwalk faces regional competition from Magnolia Bluff Casino and the Pearl River Resort in Mississippi.
Harlow’s
Harlow’s competes in Greenville, Mississippi with a variety of regional riverboat and land-based casinos. Our primary local competitor is Trop Casino, which reopened its renovated property during October 2014. Harlow’s also faces regional competition from a casino in Lula, Mississippi, eight casinos in Tunica, Mississippi and two casinos in Arkansas.
The Mississippi Gaming Control Act does not limit the number of licenses that may be granted.
Calder Casino
Calder Casino competes with seven pari-mutuel casinos as well as four Indian-owned casinos, all of which are located in Miami-Dade or Broward County, Florida. We also face competition from a large number of cruise ship operators in Miami and Ft. Lauderdale. Native American casinos offer a variety of table games and are taxed at lower rates and therefore, are generally able to spend more money marketing their facilities to consumers.
Fair Grounds Slots and Video Services, LLC
Fair Grounds Slots competes in the New Orleans, Louisiana area with two riverboat casinos and Harrah’s, which is the largest, closest and only land-based casino competitor to Fair Grounds. Fair Grounds Slots faces significant gambling competition along the Mississippi Gulf Coast. Fair Grounds Slots and VSI also compete with video poker operations located at various OTBs, truck stops and restaurants in the area. In 2015, Fair Grounds Slots was adversely impacted by a smoking ban in Orleans Parish which enhanced competition with properties outside of Orleans Parish.
MVG
MVG competes with Hollywood Gaming at Dayton Raceway, a VLT facility in Dayton, Ohio and JACK Cincinnati, a slot machine and table games casino in Cincinnati, Ohio. MVG also faces regional competition from three casinos in Indiana and two other gaming properties in Columbus, Ohio.
Saratoga
Saratoga's New York facility competes with Rivers Casino, a new casino in Schenectady, New York, which opened in February 2017. Saratoga's Colorado facility competes in Black Hawk, Colorado with a variety of casinos including Ameristar Casino, Isle of Capri Hotel & Casino and The Lodge & Hotel at Black Hawk, all of which offer hotel accommodations, slot machines and poker and other table games.
Ocean Downs
Ocean Downs competes with Harrington Raceway & Casino, in Harrington Delaware, which has slot machines, table games, simulcasting and live racing. Ocean Downs also faces competition from Dover Downs Hotel and Casino, in Dover, Delaware, which offers slot machines, table games, hotel accommodations and a spa facility.
TwinSpires
TwinSpires.com competes with other mobile and online wagering businesses for both customers and racing content, and it also competes with online gaming sites. Our competitors include Betfair Limited (d/b/a TVG), The Stronach Group (d/b/a XpressBet), Premier Turf Club, Lien Games (d/b/a BetAmerica), AmWest Entertainment, The New York Racing Association (d/b/a NYRA Rewards), Connecticut OTB, Penn National Gaming Inc. and Racing2Day LLC.
Our BRIS business competes with companies such as Equibase and the Daily Racing Form.
Big Fish Games
Big Fish Games faces significant competition in all aspects of our business. Specifically, we compete for the leisure time, attention and discretionary spending of our players with other game developers on the basis of a number of factors, including quality of player experience, brand awareness and access to distribution channels.
We believe we compete favorably on these factors; however, our industry is evolving rapidly and is becoming increasingly competitive. Other developers and distributors of social casino, casual and mid-core free-to-play and premium paid games could develop more compelling content that competes with our games and adversely affects our ability to attract and retain players and their entertainment time. These competitors, including companies of which we may not be currently aware, may take advantage of social networks or access to a larger user base to grow their networks rapidly and virally.
10
Our social casino games compete in a rapidly evolving market against an increasing number of competitors, including Caesars Interactive, Zynga and IGT. Our casual and mid-core free-to-play game customers may also play other games on PCs, Macs, mobile devices and console devices, and some of these games may include unique features that our games do not have. Given the open nature of the development and distribution of games for mobile devices, we compete with a vast number of developers and distributors who are able to create and launch games and other content for these devices using relatively limited resources and with relatively limited start-up time or expertise. It has been estimated that more than 2.2 million applications, including more than 488,000 active games, were available on Apple’s U.S. App Store as of December 31, 2016. The proliferation of titles potentially makes it difficult for us to differentiate ourselves from other developers and to compete for customers who download and purchase content for their devices without substantially increasing our marketing and other development and distribution costs.
Other Investments
In North America, United Tote competes primarily with Sportech and AmTote International, Inc. Our competition outside of North America is very fragmented.
D. Governmental Regulations and Potential Legislative Changes
We are subject to various federal, state and international laws and regulations that affect our businesses. The ownership, operation and management of our racing operations, our casino operations, TwinSpires and Big Fish Games are subject to regulation under the laws and regulations of each of the jurisdictions in which we operate. The ownership, operation and management of our segments are also subject to legislative actions at both the federal and state level.
Racing Regulations
Horseracing is a highly regulated industry. In the U.S., individual states control the operations of racetracks located within their respective jurisdictions with the intent of, among other things, protecting the public from unfair and illegal gambling practices, generating tax revenue, licensing racetracks and operators and preventing organized crime from being involved in the industry. Although the specific form may vary, states that regulate horseracing generally do so through a horseracing commission or other gambling regulatory authority. In general, regulatory authorities perform background checks on all racetrack owners prior to granting them the necessary operating licenses. Horse owners, trainers, jockeys, drivers, stewards, judges and backstretch personnel are also subject to licensing by governmental authorities. State regulation of horse races extends to virtually every aspect of racing and usually extends to details such as the presence and placement of specific race officials, including timers, placing judges, starters and patrol judges. We currently satisfy the applicable licensing requirements of the racing and gambling regulatory authorities in each state where we maintain racetracks or pari-mutuel operations and/or businesses.
The total number of days on which each racetrack conducts live thoroughbred racing fluctuates annually according to each calendar year and the determination of applicable regulatory authorities.
In the United States, interstate pari-mutuel wagering on horseracing is subject to the Interstate Horseracing Act of 1978 ("IHA"), as amended in 2000. Through the IHA, racetracks can commingle wagers from different racetracks and wagering facilities and broadcast horseracing events to other licensed establishments.
Kentucky
Horseracing tracks in Kentucky are subject to the licensing and regulation of the Kentucky Horse Racing Commission ("KHRC"). The KHRC is responsible for overseeing horseracing and regulating the state equine industry. Licenses to conduct live thoroughbred racing meets, to participate in simulcasting and to accept advance deposit wagers from Kentucky residents are approved annually by the KHRC based upon applications submitted by the racetracks in Kentucky. To some extent, Churchill Downs competes with other racetracks in Kentucky for the award of racing dates; however, the KHRC is required by state law to consider and seek to preserve each racetrack’s usual and customary live racing dates.
Illinois
In Illinois, licenses to conduct live thoroughbred racing and to participate in simulcast wagering are approved by the Illinois Racing Board ("IRB"). In September 2016, the IRB appointed Arlington the dark host track in Illinois for 61 simulcast host days during 2017, a decrease of 3 days compared to 2016. In addition, Arlington was awarded 154 live host days for 2017, an increase of 2 days as compared to 2016. In total, Arlington was awarded 215 live and dark host days in 2017, a decrease of 1 day as compared to 2016.
On May 26, 2016, the Illinois legislature passed a bill to reauthorize advance deposit wagering though December 21, 2018 and continued incremental surcharges on winning wagers. The bill was signed by the Governor of Illinois in August 2016.
Florida
In Florida, licenses to conduct live thoroughbred racing and to participate in simulcast wagering are approved by the Department of Business and Professional Regulation's Division of Pari-mutuel Wagering ("DPW"). The DPW is responsible for overseeing
11
the network of state offices located at every pari-mutuel wagering facility, as well as issuing the permits necessary to operate a pari-mutuel wagering facility. The DPW also issues annual licenses for thoroughbred, standardbred and quarter horse races but does not approve the specific live race days.
Louisiana
In Louisiana, licenses to conduct live thoroughbred racing and to participate in simulcast wagering are approved by the Louisiana State Racing Commission ("LSRC"). The LSRC is responsible for overseeing the awarding of licenses for the conduct of live racing meets, the conduct of thoroughbred horseracing, the types of wagering that may be offered by pari-mutuel facilities and the disposition of revenue generated from wagering. Off-track wagering is also regulated by the LSRC. Louisiana law requires live racing at a licensed racetrack for at least 80 days over a 20 week period each year to maintain the license and to conduct slot operations.
With the addition of slot machines at Fair Grounds, Louisiana law requires live quarter horseracing to be conducted at the racetrack. We conducted quarter horseracing at Fair Grounds for 12 days in 2014, 10 days in 2015 and 10 days in 2016. We expect to conduct quarter horseracing for 10 days in 2017.
In March 2016, during a special session held to address Louisiana’s budget deficit, legislation was passed which temporarily removed the sales tax exemption Fair Grounds qualified for as a pari-mutuel. From April 1, 2016 through June 30, 2016, Fair Grounds paid the statutory state tax of 4% on all purchases related to racing operations. Effective July 1, 2016 through June 30, 2018, Fair Grounds is required to pay a 2% state tax on purchases related to racing operations. During the same special session, the Legislature also added another one percent to the state tax base until July 1, 2018. The sales tax exemption is scheduled to be reinstated July 1, 2018. The legislation is expected to have an adverse impact on our business.
Casino Regulations and Potential Legislative Changes
Casino laws are generally designed to protect casino consumers and the viability and integrity of the casino industry. Casino laws may also be designed to protect and maximize state and local revenue derived through taxes and licensing fees imposed on casino industry participants as well as to enhance economic development and tourism. To accomplish these public policy goals, casino laws establish procedures to ensure that participants in the casino industry meet certain standards of character and fitness. In addition, casino laws require casino industry participants to:
|
•
|
Ensure that unsuitable individuals and organizations have no role in casino operations;
|
|
•
|
Establish procedures designed to prevent cheating and fraudulent practices;
|
|
•
|
Establish and maintain responsible accounting practices and procedures;
|
|
•
|
Maintain effective controls over financial practices, including establishment of minimum procedures for internal fiscal affairs and the safeguarding of assets and revenue;
|
|
•
|
Maintain systems for reliable record keeping;
|
|
•
|
File periodic reports with casino regulators;
|
|
•
|
Ensure that contracts and financial transactions are commercially reasonable, reflect fair market value and are arms-length transactions;
|
|
•
|
Establish programs to promote responsible gambling and inform patrons of the availability of help for problem gambling; and
|
|
•
|
Enforce minimum age requirements.
|
Typically, a state regulatory environment is established by statute and administered by a regulatory agency with broad discretion to regulate the affairs of owners, managers and persons with financial interests in casino operations. Among other things, casino authorities in the various jurisdictions in which we operate:
|
•
|
Adopt rules and regulations under the implementing statutes;
|
|
•
|
Interpret and enforce casino laws;
|
|
•
|
Impose disciplinary sanctions for violations, including fines and penalties;
|
|
•
|
Review the character and fitness of participants in casino operations and make determinations regarding suitability or qualification for licensure;
|
|
•
|
Grant licenses for participation in casino operations;
|
|
•
|
Collect and review reports and information submitted by participants in casino operations;
|
12
|
•
|
Review and approve transactions, such as acquisitions or change-of-control transactions of casino industry participants, securities offerings and debt transactions engaged in by such participants; and
|
|
•
|
Establish and collect fees and taxes.
|
Any change in the laws or regulations of a casino jurisdiction could have a material adverse impact on our casino operations.
Licensing and Suitability Determinations
Gaming laws require us, each of our subsidiaries engaged in casino operations, certain of our directors, officers and employees, and in some cases, certain of our shareholders, to obtain licenses from casino authorities. Licenses typically require a determination that the applicant qualifies or is suitable to hold the license. Gaming authorities have very broad discretion in determining whether an applicant qualifies for licensing or should be deemed suitable. Criteria used in determining whether to grant a license to conduct casino operations, while varying between jurisdictions, generally include consideration of factors such as the good character, honesty and integrity of the applicant; the financial stability, integrity and responsibility of the applicant, including whether the operation is adequately capitalized in the state and exhibits the ability to maintain adequate insurance levels; the quality of the applicant’s casino facilities; the amount of revenue to be derived by the applicable state from the operation of the applicant’s casino; the applicant’s practices with respect to minority hiring and training; and the effect on competition and general impact on the community.
In evaluating individual applicants, casino authorities consider the individual’s business experience and reputation for good character, the individual’s criminal history and the character of those with whom the individual associates.
Many casino jurisdictions limit the number of licenses granted to operate casinos within the state and some states limit the number of licenses granted to any one casino operator. Licenses under casino laws are generally not transferable without approval. Licenses in most of the jurisdictions in which we conduct casino operations are granted for limited durations and require renewal from time to time. There can be no assurance that any of our licenses will be renewed. The failure to renew any of our licenses could have a material adverse impact on our casino operations.
In addition to our subsidiaries engaged in casino operations, casino authorities may investigate any individual who has a material relationship to or material involvement with, any of these entities to determine whether such individual is suitable or should be licensed as a business associate of a casino licensee. Our officers, directors and certain key employees must file applications with the casino authorities and may be required to be licensed, qualify or be found suitable in many jurisdictions. Gaming authorities may deny an application for licensing for any cause that they deem reasonable. Qualification and suitability determinations require submission of detailed personal and financial information followed by a thorough investigation. The applicant must pay all the costs of the investigation. Changes in licensed positions must be reported to casino authorities. In addition to casino authorities' ability to deny a license, qualification or finding of suitability, casino authorities have jurisdiction to disapprove a change in a corporate position.
If one or more casino authorities were to find that an officer, director or key employee fails to qualify or is unsuitable for licensing or unsuitable to continue having a relationship with us, we would be required to sever all relationships with such person. In addition, casino authorities may require us to terminate the employment of any person who refuses to file appropriate applications.
Moreover, in many jurisdictions, certain of our shareholders may be required to undergo a suitability investigation similar to that described above. Many jurisdictions require any person who acquires beneficial ownership of more than a certain percentage of our voting securities, typically 5%, to report the acquisition to casino authorities, and casino authorities may require such holders to apply for qualification or a finding of suitability. Most casino authorities, however, allow an "institutional investor" to apply for a waiver. An "institutional investor" is generally defined as an investor acquiring and holding voting securities in the ordinary course of business as an institutional investor, and not for the purpose of causing, directly or indirectly, the election of a member of our board of directors, any change in our corporate charter, bylaws, management, policies or operations, or those of any of our casino affiliates, or the taking of any other action which casino authorities find to be inconsistent with holding our voting securities for investment purposes only. Even if a waiver is granted, an institutional investor generally may not take any action inconsistent with its status when the waiver was granted without once again becoming subject to the foregoing reporting and application obligations.
Generally, any person who fails or refuses to apply for a finding of suitability or a license within the prescribed period after being advised it is required by casino authorities may be denied a license or found unsuitable, as applicable. Any shareholder found unsuitable or denied a license and who holds, directly or indirectly, any beneficial ownership of our voting securities beyond such period of time as may be prescribed by the applicable casino authorities may be guilty of a criminal offense. Furthermore, we may be subject to disciplinary action if, after we receive notice that a person is unsuitable to be a shareholder or to have any other relationship with us or any of our subsidiaries, we: (i) pay that person any dividend or interest upon our voting securities; (ii) allow that person to exercise, directly or indirectly, any voting right conferred through securities held by that person; (iii) pay remuneration in any form to that person for services rendered or otherwise; or (iv) fail to pursue all lawful efforts to require such unsuitable
13
person to relinquish voting securities including, if necessary, the immediate purchase of said voting securities for cash at fair market value.
Violations of Gaming Laws
If we violate applicable casino laws, our casino licenses could be limited, conditioned, suspended or revoked by casino authorities, and we and any other persons involved could be subject to substantial fines. A supervisor or conservator can be appointed by casino authorities to operate our casino properties, or in some jurisdictions, take title to our casino assets in the jurisdiction, and under certain circumstances, income generated during such appointment could be forfeited to the applicable state or states. Violations of laws in one jurisdiction could result in disciplinary action in other jurisdictions. As a result, violations by us of applicable casino laws could have a material adverse impact on our casino operations.
Some casino jurisdictions prohibit certain types of political activity by a casino licensee, its officers, directors and key employees. A violation of such a prohibition may subject the offender to criminal and/or disciplinary action.
Reporting and Record-keeping Requirements
We are required periodically to submit detailed financial and operating reports and furnish any other information that casino authorities may require. Under federal law, we are required to record and submit detailed reports of currency transactions involving greater than $10,000 at our casinos and racetracks as well as any suspicious activity that may occur at such facilities. Failure to comply with these requirements could result in fines or cessation of operations. We are required to maintain a current stock ledger that may be examined by casino authorities at any time. If any securities are held in trust by an agent or by a nominee, the record holder may be required to disclose the identity of the beneficial owner to casino authorities. A failure to make such disclosure may be grounds for finding the record holder unsuitable. Gaming authorities may require certificates for our securities to bear a legend indicating that the securities are subject to specified casino laws.
Review and Approval of Transactions
Substantially all material loans, leases, sales of securities and similar financing transactions must be reported to and in some cases approved by casino authorities. We may not make a public offering of securities without the prior approval of certain casino authorities. Changes in control through merger, consolidation, stock or asset acquisitions, management or consulting agreements, or otherwise are subject to receipt of prior approval of casino authorities. Entities seeking to acquire control of us or one of our subsidiaries must satisfy casino authorities with respect to a variety of stringent standards prior to assuming control. Gaming authorities may also require controlling shareholders, officers, directors and other persons having a material relationship or involvement with the entity proposing to acquire control, to be investigated and licensed as part of the approval process relating to the transaction.
License Fees and Gaming Taxes
We pay substantial license fees and taxes in many jurisdictions in connection with our casino operations which are computed in various ways depending on the type of gambling or activity involved. Depending upon the particular fee or tax involved, these fees and taxes are payable with varying frequency. License fees and taxes are based upon such factors as a percentage of the gross casino revenue received; the number of gambling devices and table games operated; or a one-time fee payable upon the initial receipt of license and fees in connection with the renewal of license. In some jurisdictions, casino tax rates are graduated such that the tax rates increase as gross casino revenue increases. Tax rates are subject to change, sometimes with little notice, and such changes could have a material adverse impact on our casino operations.
Operational Requirements
In most jurisdictions, we are subject to certain requirements and restrictions on how we must conduct our casino operations. In certain states, we are required to give preference to local suppliers and include minority and women-owned businesses and organized labor in construction projects to the maximum extent practicable. We may be required to give employment preference to minorities, women and in-state residents in certain jurisdictions. Our ability to conduct certain types of games, introduce new games or move existing games within our facilities may be restricted or subject to regulatory review and approval. Some of our operations are subject to restrictions on the number of gaming positions we may have and the maximum wagers allowed to be placed by our customers.
Specific State Casino Regulations and Potential Legislative Changes
Maine
The ownership and operation of casino gaming facilities in the State of Maine is subject to extensive state and local regulation and is subject to licensing and regulatory control by the Maine Gambling Control Board (the "MGCB"). The laws, regulations and supervisory procedures of the MGCB are based upon declarations of public policy that are concerned with, among other things: (1) the regulation, supervision and general control over casinos and the ownership and operation of slot machines and table games; (2) the investigation of complaints made regarding casinos; (3) the establishment and maintenance of responsible accounting
14
practices and procedures; (4) the maintenance of effective controls over the financial practices of licensees, including the establishment of minimum procedures for internal fiscal affairs and the safeguarding of assets and revenue and providing for reliable record keeping; and (5) the prevention of cheating and fraudulent practices. The regulations are subject to amendment and interpretation by the MGCB. Changes in Maine laws or regulations may limit or otherwise materially affect the types of gaming that may be conducted and such changes, if enacted, could have an adverse impact on our Maine gaming operations. The failure to comply with the rules and regulations of the MGCB could have a material adverse impact on our business.
Potential Expanded Gaming in Maine
In 2016, legislation was filed that would expand gaming locations in the state and allow for entities such as Native American tribes in northern Maine and a harness track in southern Maine to operate casino facilities. The legislative proposals were defeated during the 2016 session. In January 2017, legislation was again filed that will allow Native American tribes to qualify for a casino license. A citizen’s initiative to allow for a York county casino has been certified by the Secretary of State’s office to appear on the November 2017 ballot. If the initiative receives more than 50% of voter approval in November, the measure will become law. Should gaming expansion occur in Maine, it could have an adverse impact on our business.
Mississippi
The ownership and operation of casino gaming facilities in the State of Mississippi is subject to extensive state and local regulation, including the Mississippi Gaming Commission (the "Mississippi Commission"). The laws, regulations and supervisory procedures of the Mississippi Commission are based upon declarations of public policy that are concerned with, among other things: (1) the prevention of unsavory or unsuitable persons from having direct or indirect involvement with gaming at any time or in any capacity; (2) the establishment and maintenance of responsible accounting practices and procedures; (3) the maintenance of effective controls over the financial practices of licensees, including the establishment of minimum procedures for internal fiscal affairs and the safeguarding of assets and revenue, providing for reliable record keeping and requiring the filing of periodic reports with the Mississippi Commission; (4) the prevention of cheating and fraudulent practices; (5) providing a source of state and local revenue through taxation and licensing fees; and (6) ensuring that gaming licensees, to the extent practicable, employ Mississippi residents. The regulations are subject to amendment and interpretation by the Mississippi Commission. Changes in Mississippi laws or regulations may limit or otherwise materially affect the types of gaming that may be conducted and such changes, if enacted, could have an adverse impact on our Mississippi gaming operations. The failure to comply with the rules and regulations of the Mississippi Commission could have a material adverse impact on our business.
Florida
The ownership and operation of casino gaming facilities in the State of Florida is subject to extensive state and local regulation, primarily by the Florida Department of Business and Professional Regulation (the "DBPR"), within the executive branch of Florida’s state government. The DBPR is charged with the regulation of Florida’s pari-mutuel, card room and slot gaming industries, as well as collecting and safeguarding associated revenue due to the state. The DBPR has been designated by the Florida legislature as the state compliance agency with the authority to carry out the state’s oversight responsibilities in accordance with the provisions outlined in the compact between the Seminole Tribe of Florida and the State of Florida. Changes in Florida laws or regulations may limit or otherwise materially affect the types of gaming that may be conducted and such changes, if enacted, could have an adverse impact on our Florida gaming operation. The laws and regulations of Florida are based on policies of maintaining the health, welfare and safety of the general public and protecting the video gaming industry from elements of organized crime, illegal gambling activities and other harmful elements, as well as protecting the public from illegal and unscrupulous gaming to ensure the fair play of devices. The failure to comply with the rules and regulations of the DBPR could have a material adverse impact on our business.
Potential Seminole Compact and Potential Decoupling in Florida
In December 2015, Florida’s Governor signed a twenty-year Seminole Compact with the Seminole Tribe preserving the Tribe's geographic exclusivity and right to exclusively operate blackjack, craps and roulette games and providing the state with an expected $3.0 billion in additional state revenue over a seven-year period beginning in 2017. The Seminole Compact addresses other issues such as the potential for pari-mutuel operations to add blackjack in a limited fashion as well as the potential for expanded licenses in Palm Beach and Miami-Dade counties. The Seminole Compact must be approved by the Florida Legislature. In February 2016, legislation authorizing the Seminole Compact was introduced for consideration, but it has not been ratified.
In January 2017, legislation was filed in the Florida Senate that would allow pari-mutuel racetracks in Miami-Dade and Broward counties to decouple their pari-mutuel and gaming operations. The bill authorizes up to eight additional casino licenses in counties that have approved slot machine gaming through a local referendum and also provides for two additional gaming licenses in Miami-Dade and Broward. The legislation provides for a 10% reduced tax rate on slot machine revenues and permits 24 hour operation for casinos. Under the terms of the proposed bill, the Compact negotiated in 2015 between the Governor and the Seminole Tribe would be ratified.
15
At this time it is not possible to determine what impact legislation with respect to authorizing the Seminole Compact or decoupling would have on our business.
Louisiana
The manufacture, distribution, servicing and operation of video draw poker devices in Louisiana are subject to the Louisiana Video Draw Poker Devices Control Law and the rules and regulations promulgated thereunder. The manufacture, distribution, servicing and operation of video poker devices and slot machines are governed by the Louisiana Gaming Control Board (the "Louisiana Board") which oversees all licensing for all forms of legalized gaming in Louisiana. The Video Gaming Division and the Slots Gaming Division of the Gaming Enforcement Section of the Office of the State Police within the Department of Public Safety and Corrections (the "Division") performs the video poker and slots gaming investigative functions for the Louisiana Board. The laws and regulations of Louisiana are based on policies of maintaining the health, welfare and safety of the general public and protecting the video gaming industry from elements of organized crime, illegal gambling activities and other harmful elements, as well as protecting the public from illegal and unscrupulous gaming to ensure the fair play of devices. The Louisiana Board also regulates slot machine gaming at racetrack facilities pursuant to the Louisiana Pari-Mutuel Live Racing Facility Economic Redevelopment and Gaming Control Act. Changes in Louisiana laws or regulations may limit or otherwise materially affect the types of gaming that may be conducted and such changes, if enacted, could have an adverse impact on our Louisiana gaming operations. In addition, the LSRC also issues licenses required for Fair Grounds to operate slot machines at the racetrack and video poker devices at its OTBs. The failure to comply with the rules and regulations of the Louisiana Board or the LSRC could have a material adverse impact on our business.
On January 22, 2015, the New Orleans City Council approved a smoking ban in bars and other public places, including casinos, in Orleans Parish which took effect on April 22, 2015. The smoking ban had a negative impact on Fair Grounds Slots which was partially offset by VSI, whose OTB locations are located outside of Orleans Parish.
Ohio
Video Lottery was introduced in the State of Ohio in 2012 when the Governor of Ohio signed Executive Order 2011-22K which authorized the Ohio Lottery Commission ("the OLC") to amend and adopt rules necessary to implement a video lottery program at Ohio’s seven horse racing facilities. The ownership and operation of VLT facilities in the State of Ohio is subject to extensive state and local regulation. The laws, regulations and supervisory procedures of the OLC include 1) regulating the licensing of video lottery sales agents, key gaming employees and VLT manufacturers; 2) collecting and disbursing VLT revenue; and 3) maintaining compliance in regulatory matters. Changes in Ohio laws or regulations may limit or otherwise materially affect the types of gaming that may be conducted and such changes, if enacted, could have an adverse impact on our Ohio gaming operations. The failure to comply with the rules and regulations of the OLC could have a material adverse impact on our business.
New York
The ownership and operation of VLT facilities in New York are governed by the New York State Gaming Commission ("NYSGC") under the New York State Lottery for Education Law. The laws, regulations and supervisory procedures of the NYSGC include: 1) regulating the licensing of video lottery gaming agents, principal key gaming employees and VLT manufacturers; 2) collecting and disbursing VLT revenue; and 3) maintaining compliance in regulatory matters. Changes in New York laws or regulations may limit or otherwise materially affect the types of gaming that may be conducted and such changes, if enacted, could have an adverse impact on our New York gaming operations. The failure to comply with the rules and regulations of the NYSGC could have a material impact on our business.
During 2012, the Governor of New York and legislative leaders agreed to legalize casino gaming and seek an amendment to the state constitution that would authorize such gaming and, during 2013, New York voters approved a constitutional amendment authorizing up to seven casinos in the state. As of December 31, 2016, New York has awarded four of the seven casino licenses. After a 7-year exclusivity period, the state may award additional licenses. An expansion of gaming in New York includes incentives for the horse racing industry. At this time, it is not possible to determine the impact casino gaming could have on our business.
Potential New York Interactive Gaming Legislation
In January 2017, legislation was filed that would authorize VLT operators and casino licensees to be eligible for an interactive gaming license. The bill provides that an interactive gaming licensee would be authorized to offer online poker games under a ten-year license. The proposed legislation limits the number of licenses to ten, establishes an initial $10.0 million license fee and establishes a tax rate of 15% of interactive gross gaming revenue. If passed, the legislation could result in a favorable impact to our business.
16
Maryland
In January 2017, legislation was filed that would allow casinos to qualify for a 10% gaming tax reduction on slot machine revenue. In order to qualify for the gaming tax reduction, casinos must purchase or acquire the right to lease all of their VLTs prior to January 1, 2018. If casinos do not purchase or assume the right to lease prior to January 1, 2018, then they will be required to assume ownership or lease the terminals by March 31, 2020 without receiving the full tax reduction.
TwinSpires Regulations and Potential Legislative Changes
TwinSpires is licensed in Oregon under a multi-jurisdictional simulcasting and interactive wagering totalisator hub license issued by the Oregon Racing Commission ("ORC") and in accordance with Oregon law. TwinSpires also holds advance deposit wagering licenses in certain other states where required such as California, Illinois, Idaho, Kentucky, Maryland, Virginia, Colorado, Arizona, Wyoming, Arkansas, New York and Washington. Changes in the form of new legislation or regulatory activity at the state or federal level could adversely impact our mobile and online business.
Pennsylvania
In February 2016, legislation was signed by the Governor which is intended to provide regulatory reform to Pennsylvania’s racing industry. The legislation includes provisions related to the operation of advance deposit wagering in the state. Under the terms of the legislation, an initial license fee of $0.5 million and annual renewal fee of $0.1 million would be established. The previous ten percent tax on wagers would be removed and replaced with a one and one-half percent tax on win, place and show wagers, and a two and one-half percent tax on exotic wagers. Neither an ADW operator nor a racetrack may accept wagers within thirty-five miles of a racetrack operating a live meet. On September 3, 2016, the Company filed a lawsuit in the Commonwealth Court of Pennsylvania challenging the constitutionality of a Pennsylvania law granting each Pennsylvania race track a local monopoly over all wagers placed by telephone or through the Internet by Pennsylvania residents located within a 35-mile radius of the track, as well as requiring out-of-state advance deposit wagering companies to pay initial and annual license fees.
Big Fish Games Regulations and Potential Legislative Changes
We are subject to various federal, state and international laws and regulations that affect our business, including those relating to the privacy and security of customer and employee personal information and those relating to the Internet, behavioral tracking, mobile applications, advertising and marketing activities, sweepstakes and contests. Additional laws in all of these areas are likely to be passed in the future which could result in significant limitations on or changes to the ways in which we can collect, use, host, store or transmit the personal information and data of our customers or employees, communicate with our customers, and deliver products and services, or may significantly increase our compliance costs. As our business expands to include new uses or collection of data that is subject to privacy or security regulations, our compliance requirements and costs will increase and we may be subject to increased regulatory scrutiny.
Some of our games and features are based upon traditional casino games such as slots and table games. We structure and operate these games and features, including
Big Fish Casino
,
Jackpot City Slots
and
Vegas Party Slots
, with the gambling laws in mind and believe that these games and features do not constitute gambling.
E. Environmental Matters
We are subject to various federal, state and local environmental laws and regulations that govern activities that may have adverse environmental effects, such as discharges to air and water, as well as the management and disposal of solid, animal and hazardous wastes and exposure to hazardous materials. These laws and regulations which are complex and subject to change, include United States Environmental Protection Agency ("EPA") and state laws and regulations that address the impacts of manure and wastewater generated by Concentrated Animal Feeding Operations ("CAFO") on water quality, including, but not limited to, storm and sanitary water discharges. CAFO and other water discharge regulations include permit requirements and water quality discharge standards. Enforcement of these regulations has been receiving increased governmental attention. Compliance with these and other environmental laws can, in some circumstances, require significant capital expenditures. We may incur future costs under existing and new laws and regulations pertaining to storm water and wastewater management at our racetracks. Moreover, violations can result in significant penalties and, in some instances, interruption or cessation of operations.
In the ordinary course of our business, we may receive notices from regulatory agencies regarding our compliance with CAFO regulations that may require remediation at our facilities. On December 6, 2013, we received a notice from the EPA regarding alleged CAFO non-compliance at Fair Grounds. We are currently in discussions with the EPA and United States Department of Justice, and we expect to incur certain capital expenditures to remediate the alleged CAFO non-compliance. These capital expenditures are expected to extend the life of the related Fair Grounds assets.
We also are subject to laws and regulations that create liability and cleanup responsibility for releases of hazardous substances into the environment. Under certain of these laws and regulations, a current or previous owner or operator of property may be liable for the costs of remediating hazardous substances or petroleum products on its property, without regard to whether the owner or operator knew of, or caused, the presence of the contaminants, and regardless of whether the practices that resulted in the
17
contamination were legal at the time they occurred. The presence of, or failure to remediate properly, such substances may materially adversely affect the ability to sell or rent such property or to borrow funds using such property as collateral. Additionally, the owner of a property may be subject to claims by third parties based on damages and costs resulting from environmental contamination emanating from the property.
F. Marks and Internet Properties
We hold numerous state and federal service mark registrations on specific names and designs in various categories including the entertainment business, apparel, paper goods, printed matter, housewares and glass. We license the use of these service marks and derive revenue from such license agreements.
G. Employees
As of December 31, 2016, we employed approximately 4,000 full-time and part-time employees Company-wide. Due to the seasonal nature of our live racing business, the number of seasonal and part-time persons employed will vary throughout the year.
H. Available Information
Our Annual Reports on Form 10-K, Quarterly Reports on Form 10-Q, Current Reports on Form 8-K, proxy statements and other Securities and Exchange Commission ("SEC") filings, and any amendments to those reports and any other filings that we file with or furnish to the SEC under the Securities Exchange Act of 1934 are made available free of charge on our website (
www.churchilldownsincorporated.com
) as soon as reasonably practicable after we electronically file the materials with the SEC and are also available at the SEC’s website at
www.sec.gov
. These reports may also be obtained from the SEC's Public Reference Room at 100 F Street, NE, Washington, DC 20549 or by calling the SEC at (800) SEC-0330.
18
|
ITEM 1A.
|
RISK FACTORS
|
Risks Related to the Company
In addition to risks and uncertainties in the ordinary course of business that are common to all businesses, important factors that are specific to our industry and us could materially impact our future performance and results. The factors described below are the most significant risks that could have a material impact our business.
Our business is sensitive to economic conditions which may affect consumer confidence, consumers’ discretionary spending, or our access to credit in a manner that adversely impacts our operations
Economic trends can impact consumer confidence and consumers’ discretionary spending.
|
•
|
Negative economic conditions and the persistence of elevated levels of unemployment can impact consumers’ disposable incomes and, therefore, impact the demand for entertainment and leisure activities.
|
|
•
|
Declines in the residential real estate market, increases in individual tax rates and other factors that we cannot accurately predict may reduce the disposable income of our customers.
|
|
•
|
Decreases in consumer discretionary spending could affect us even if such decreases occur in other markets. For example, reduced wagering levels and profitability at racetracks from which we carry racing content could cause certain racetracks to cancel races or cease operations and therefore reduce the content we could provide to our customers.
|
Lower consumer confidence or reductions in consumers’ discretionary spending could result in fewer patrons spending money at our racetracks, gaming and wagering facilities and our online wagering sites and could reduce consumer spending within Big Fish Games.
Our access to and cost of credit may be impacted to the extent global and U.S. credit markets are affected by downward economic trends. Economic trends can also impact the financial viability of other industry constituents, making collection of amounts owed to us uncertain. Our ability to respond to periods of economic contraction may be limited, as certain of our costs remain fixed or even increase when revenue declines.
We are vulnerable to additional or increased taxes and fees
We believe that the prospect of raising significant additional revenue through taxes and fees is one of the primary reasons that certain jurisdictions permit legalized gaming. As a result, gaming companies are typically subject to significant taxes and fees in addition to the normal federal, state, provincial and local income taxes and such taxes and fees may be increased at any time. From time to time, legislators and officials have proposed changes in tax laws or in the administration of laws affecting the gaming industry. Many states and municipalities, including ones in which we operate, are currently experiencing budgetary pressures that may make it more likely they would seek to impose additional taxes and fees on our operations. It is not possible to determine the likelihood or extent of any such future changes in tax laws or fees, or changes in the administration of such laws; however, if enacted, such changes could have a material adverse impact on our business.
A lack of confidence in the integrity of our core businesses could affect our ability to retain our customers and engage with new customers
The integrity of the casual gaming, horseracing, casino gaming and pari-mutuel wagering industries must be perceived as fair to patrons and the public at large. To prevent cheating or erroneous payouts, the necessary oversight processes must be in place to ensure that such activities cannot be manipulated. A loss of confidence in the fairness of our industries could have a material adverse impact on our business.
We depend on key and highly skilled personnel to operate our business, and if we are unable to retain our current personnel or hire additional personnel, our ability to develop and successfully grow our business could be harmed
We believe that our success depends in part on our highly-skilled employee base, and our ability to hire, develop, motivate and retain highly qualified and skilled employees throughout our organization. If we do not successfully hire, develop, motivate and retain highly qualified and skilled employees, it is likely that we could experience significant disruptions in our operations and our ability to develop and successfully grow our business could be impaired which could harm our business.
Competition for the type of talent we seek to hire is increasingly intense in the geographic areas in which we operate. This is particularly the case with regard to software developers and engineers, IT staff, and game designers and producers involved in our Big Fish Games line of business. As a result, we may incur significant costs to attract and retain highly-skilled employees. We may be unable to attract and retain the personnel necessary to sustain our business or support future growth.
All of our officers and other employees in the United States are at-will employees, which means they may terminate their employment relationship with us at any time and their knowledge of our business and industry would be difficult to replace. In our Big Fish Games line of business, the loss of any key employees or the inability to attract or retain qualified personnel could
19
delay the development and distribution of games and may impair our ability to sell our games and other products and services, harm our reputation and impair our ability to execute our business plans.
Our continued success and our ability to maintain our competitive position is largely dependent upon, among other things, the skills and efforts of our senior executives and management team. We cannot guarantee that these individuals will remain with us, and their retention is affected by the competitiveness of our terms of employment and our ability to compete effectively against other companies. Certain of our key employees are required to file applications with the gaming authorities in each of the jurisdictions in which we operate and are required to be licensed or found suitable by these gaming authorities. If the gaming authorities were to find a key employee unsuitable for licensing, we may be required to sever the employee relationship, or the gaming authorities may require us to terminate the employment of any person who refuses to file appropriate applications. Either result could significantly impair our operations. Our inability to retain key personnel could have a material adverse impact on our business.
Our debt facilities contain restrictions that limit our flexibility in operating our business
Our debt facilities contain a number of covenants that impose significant operating and financial restrictions, including restrictions on our ability to, among other things, take the following actions:
|
•
|
incur additional debt or issue certain preferred shares;
|
|
•
|
pay dividends on or make distributions in respect of our capital stock, repurchase common shares or make other restricted payments;
|
|
•
|
make certain investments;
|
|
•
|
sell certain assets or consolidate, merge, sell or otherwise dispose of all or substantially all of our assets;
|
|
•
|
create liens on certain assets;
|
|
•
|
enter into certain transactions with our affiliates; and
|
|
•
|
designate our subsidiaries as unrestricted subsidiaries.
|
As a result of these covenants, we are limited in the manner in which we conduct our business and we may be unable to engage in favorable business activities or finance future operations or capital needs.
We have pledged a significant portion of our assets as collateral under our debt facilities. If any of these lenders accelerate the repayment of borrowings, we may not have sufficient assets to repay our indebtedness and our lenders could exercise their rights against the collateral we have granted them.
Under our debt facilities, we are required to satisfy and maintain specified financial ratios. Our ability to meet those financial ratios can be affected by events beyond our control, and as a result, we may be unable to meet those ratios. A failure to comply with the covenants contained in our debt facilities or our other indebtedness could result in an event of default under our debt facilities or our other indebtedness which, if not cured or waived, could have a material adverse impact on our business. In the event of any default under our debt facilities or our other indebtedness, the lenders thereunder:
|
•
|
will not be required to lend any additional amounts to us;
|
|
•
|
could elect to declare all borrowings outstanding, together with accrued and unpaid interest and fees, to be due and payable and terminate all commitments to extend further credit; or
|
|
•
|
require us to apply all of our available cash to repay these borrowings.
|
If the indebtedness under our debt facilities or our other indebtedness were to be accelerated, our assets may not be sufficient to repay such indebtedness in full.
Ownership and development of real estate requires significant expenditures and is subject to risk
Our operations require us to own extensive real estate holdings. All real estate investments are subject to risks including the following: general economic conditions, such as the availability and cost of financing; local and national real estate conditions, such as an oversupply of residential, office, retail or warehousing space, or a reduction in demand for real estate in the area; governmental regulation, including taxation of property and environmental legislation; and the attractiveness of properties to potential purchasers or tenants. Significant expenditures, including property taxes, mortgage payments, maintenance costs, insurance costs and related charges, must be made throughout the period of ownership of real property. Such expenditures may negatively impact our operating results.
We are subject to a variety of federal, state and local governmental laws and regulations relating to the use, storage, discharge, emission and disposal of hazardous materials. Environmental laws and regulations could hold us responsible for the cost of
20
cleaning up hazardous materials contaminating real property that we own or operate (or previously owned or operated) or properties at which we have disposed of hazardous materials, even if we did not cause the contamination. If we fail to comply with environmental laws or if contamination is discovered, a court or government agency could impose severe penalties or restrictions on our operations or assess us with the costs of taking remedial actions.
Catastrophic events and system failures could cause a significant and continued disruption to our operations
A disruption or failure in our systems or operations in the event of a major earthquake, weather event, cyber-attack, terrorist attack or other catastrophic event could interrupt our operations, damage our properties and reduce the number of customers who visit our facilities in the affected areas. Flooding, blizzards, windstorms, earthquakes or hurricanes could adversely affect our locations. While we maintain insurance coverage that may cover certain of the costs that we incur as a result of some natural disasters, our coverage is subject to deductibles, exclusions and limits on maximum benefits. We may not be able to fully collect, if at all, on any claims resulting from extreme weather conditions or other disasters. If any of our properties are damaged or if our operations are disrupted or face prolonged closure as a result of natural disasters in the future, or if natural disasters adversely impact general economic or other conditions in the areas in which our properties are located or from which we draw our patrons, the disruption could have a material adverse impact on our business.
Our mobile and online wagering, Big Fish Games and brick-and-mortar casino businesses depend upon our communications hardware and our computer hardware. We have built certain redundancies into our systems to avoid downtime in the event of outages, system failures or damage; however, certain risks still exist. Our systems also remain vulnerable to damage or interruption from floods, fires, power loss, telecommunication failures, terrorist cyber-attacks, hardware or software error, computer viruses, computer denial-of-service attacks and similar events. Despite any precautions we may take, the occurrence of a natural disaster or other unanticipated problems could result in lengthy interruptions in our services. Any unscheduled interruption in the availability of our website and our services results in an immediate, and possibly substantial, loss of revenue. Interruptions in our services or a breach of customers’ secure data could cause current or potential users to believe that our systems are unreliable, leading them to switch to our competitors or to avoid our site, and could permanently harm our reputation and brand. These interruptions also increase the burden on our engineering staff which, in turn, could delay our introduction of new features and services on our websites and in our games. We have property and business interruption insurance covering damage or interruption of our systems; however, this insurance might not be sufficient to compensate us for all losses that may occur.
Although we have "all risk" property insurance coverage for our operating properties which covers damage caused by a casualty loss (such as fire, natural disasters, acts of war, or terrorism), each policy has certain exclusions. Our level of property insurance coverage, which is subject to policy maximum limits, may not be adequate to cover all losses in the event of a major casualty. In addition, certain casualty events may not be covered at all under our policies. Therefore, certain acts could expose us to substantial uninsured losses.
We renew our insurance policies on an annual basis. The cost of coverage may become so high that we may need to further reduce our policy limits or agree to certain exclusions from our coverage.
Our debt instruments and other material agreements require us to meet certain standards related to insurance coverage. Failure to satisfy these requirements could result in an event of default under these debt instruments or material agreements.
We may not be able to identify and complete expansion, acquisition or divestiture projects on time, on budget or as planned
We expect to pursue expansion, acquisition and divestiture opportunities, and we regularly evaluate opportunities for development, including acquisitions or other strategic corporate transactions which may expand our business operations.
We could face challenges in identifying development projects that fit our strategic objectives, identifying potential acquisition or divestiture candidates and/or development partners, finding buyers, negotiating projects on acceptable terms, and managing and integrating the acquisition or development projects. New developments or acquisitions may not be completed or integrated successfully. The divestiture of existing businesses may be affected by our ability to identify potential buyers. Current or future regulation may postpone a divestiture pending certain resolutions to federal, state or local legislative issues. New properties or developments may not be completed or integrated successfully.
We may experience difficulty in integrating recent or future acquisitions into our operations
We have completed acquisition transactions in the past, and we may pursue acquisitions from time to time in the future. The successful integration of newly acquired businesses into our operations has required and will continue to require the expenditure of substantial managerial, operating, financial and other resources and may also lead to a diversion of our attention from our ongoing business concerns. We may not be able to successfully integrate new businesses, manage the combined operations or realize projected revenue gains, cost savings and synergies in connection with those acquisitions on the timetable contemplated, if at all. Management of the new business operations, especially those in new lines of business or different geographic areas, may require that we increase our managerial resources. The process of integrating new operations may also interrupt the activities
21
of those businesses which could have a material adverse impact on our business. The costs of integrating businesses we acquire could significantly impact our short-term operating results. These costs could include the following:
|
•
|
restructuring charges associated with the acquisitions;
|
|
•
|
non-recurring acquisition costs, including accounting and legal fees, investment banking fees and recognition of transaction-related costs or liabilities; and
|
|
•
|
costs of imposing financial and management controls (such as compliance with Section 404 of the Sarbanes-Oxley Act of 2002) and operating, administrative and information systems.
|
Although we perform financial, operational and legal diligence on the businesses we purchase an unavoidable level of risk remains regarding the actual condition of these businesses and our ability to continue to operate them successfully and integrate them into our existing operations. In any acquisition we make, we face risks that include the following:
|
•
|
the risk that the acquired business may not further our business strategy or that we paid more than the business was worth;
|
|
•
|
the risk that the financial performance of the acquired business declines or fails to meet our expectations from and after the date of acquisition;
|
|
•
|
the potential adverse impact on our relationships with partner companies or third-party providers of technology or products;
|
|
•
|
the possibility that we have acquired substantial undisclosed liabilities for which we may have no recourse against the sellers or third party insurers;
|
|
•
|
costs and complications in maintaining required regulatory approvals or obtaining further regulatory approvals necessary to implement the acquisition in accordance with our strategy;
|
|
•
|
the risks of acquiring businesses and/or entering markets in which we have limited or no prior experience;
|
|
•
|
the potential loss of key employees or customers;
|
|
•
|
the possibility that we may be unable to retain or recruit managers with the necessary skills to manage the acquired businesses; and
|
|
•
|
changes to legal and regulatory guidelines which may negatively affect acquisitions.
|
If we are unsuccessful in overcoming these risks, it could have a material adverse impact on our business.
The legalization of online real money gaming in the United States and our ability to predict and capitalize on any such legalization may impact our business
Nevada, Delaware and New Jersey have enacted legislation to legalize online real money gaming. In recent years, California, Florida, Mississippi, Hawaii, Massachusetts, Iowa, Illinois, New York, Pennsylvania, Washington D.C. and the Federal government have considered such legislation. If a large number of additional states or the Federal government enact online real money gaming legislation and we are unable to obtain the necessary licenses to operate online real money gaming websites in United States jurisdictions where such games are legalized, our future growth in real money gaming could be materially impaired.
States or the Federal government may legalize online real money gaming in a manner that is unfavorable to us. Several states and the Federal government are considering draft laws that require online casinos to also have a license to operate a brick-and mortar casino, either directly or indirectly through an affiliate. If, like Nevada and New Jersey, state jurisdictions enact legislation legalizing online real money casino gaming subject to this brick-and-mortar requirement, we may be unable to offer online real money gaming in such jurisdictions if we are unable to establish an affiliation with a brick-and-mortar casino in such jurisdiction on acceptable terms.
In the online real money gaming industry, a significant "first mover" advantage exists. Our ability to compete effectively in respect of a particular style of online real money gaming in the United States may be premised on introducing a style of gaming before our competitors. Failing to do so ("move first") could materially impair our ability to grow in the online real money gaming space. We may fail to accurately predict when online real money gaming will be legalized in significant jurisdictions. The legislative process in each state and at the Federal level is unique and capable of rapid, often unpredictable change. If we fail to accurately forecast when and how, if at all, online real money gaming will be legalized in additional state jurisdictions, such failure could impair our readiness to introduce online real money gaming offerings in such jurisdictions which could have a material adverse impact on our business.
22
We may not be able to respond to rapid technological changes in a timely manner which may cause customer dissatisfaction
Casinos, TwinSpires, and the Big Fish Games segments are characterized by the rapid development of new technologies and continuous introduction of new products. Our main technological advantage versus potential competitors is our software lead-time in the market and our experience in operating an Internet-based wagering network; however, we may not be able to maintain our competitive technological position against current and potential competitors, especially those with greater financial resources. Our success depends upon new product development and technological advancements including the development of new wagering platforms and features. While we expend resources on research and development and product enhancement, we may not be able to continue to improve and market our existing products or technologies or develop and market new products in a timely manner. Further technological developments may cause our products or technologies to become obsolete or noncompetitive.
We may inadvertently infringe on the intellectual property rights of others
In the course of our business, we may become aware of potentially relevant patents or other intellectual property rights held by other parties. Many of our competitors as well as other companies and individuals have obtained, and may obtain in the future, patents or other intellectual property rights that concern products or services related to the types of products and services we currently offer or may plan to offer in the future. We evaluate the validity and applicability of these intellectual property rights and determine in each case whether we must negotiate licenses to incorporate or use the proprietary technologies in our products.
Claims of intellectual property infringement may also require us to enter into costly royalty or license agreements. However, we may not be able to obtain royalty or license agreements on terms acceptable to us. We also may be subject to significant damages or injunctions against the development and sale of our products and services if we become subject to litigation relating to intellectual property infringement.
We may be unable to adequately protect our own intellectual property rights
Our results may be affected by the outcome of litigation within our industry and the protection and validity of our intellectual property rights. Any litigation regarding patents or other intellectual property used in our products, including in the areas of advance deposit wagering could be costly and time consuming and could divert our management and key personnel from our business operations.
Some of our businesses, including our Big Fish Games line of business, are based upon the creation, acquisition, use and protection of intellectual property. Some of this intellectual property is in the form of software code, patented and other technologies and trade secrets that we use to develop and market our games. Other intellectual property that we create includes audio-visual elements, such as graphics, music and storylines. We rely on trademark, copyright and patent law, trade secret protection and contracts to protect our intellectual property rights. If we are not successful in protecting these rights, the value of our brands and our business could be adversely impacted.
Competitors may devise new methods of competing with us which may not be covered by our patents or patent applications. Our patent applications may not be approved, the patents we have may not adequately protect our intellectual property or ongoing business strategies and our patents may be challenged by third parties or found to be invalid or unenforceable.
Effective trademark, service mark, copyright and trade secret protection may not be available in every country in which our games and other products and services may be provided. The laws of certain countries do not protect proprietary rights to the same extent as the laws of the United States and, therefore in certain jurisdictions, we may be unable to protect our intellectual property and proprietary technologies adequately against unauthorized copying or use which could harm our competitive position. We have licensed in the past, and expect to license in the future, certain of our proprietary rights, such as trademarks or copyrighted material to third parties. These licensees may take actions that could diminish the value of our proprietary rights or harm our reputation, even if we have agreements prohibiting such activity. To the extent third parties are obligated to indemnify us for breaches of our intellectual property rights, these third parties may be unable to meet these obligations. Any of these events could harm our business.
Our business is subject to online security risk, including security breaches, and loss or misuse of our stored information as a result of such a breach, including customers’ personal information, could lead to government enforcement action or other litigation, potential liability, or otherwise harm our business
We receive, process, store and use personal information and other customer data. There are numerous federal, state and local laws regarding privacy and the storing, sharing, use, processing, disclosure and protection of personal information and other data. Any failure or perceived failure by us to comply with our privacy policies, our privacy-related obligations to customers or other third parties, or our privacy-related legal obligations, or any compromise of security that results in the unauthorized release or transfer of personally identifiable information or other player data, may result in governmental enforcement actions, litigation or public statements against us by consumer advocacy groups or others and could cause our customers to lose trust in us which could have an adverse impact on our business.
23
In the area of information security and data protection, many states have passed laws requiring notification to customers when there is a security breach for personal data, such as the 2002 amendment to California’s Information Practices Act, or requiring the adoption of minimum information security standards that are often vaguely defined and difficult to practically implement. The costs of compliance with these types of laws may increase in the future as a result of changes in interpretation or changes in law. Any failure on our part to comply with these types of laws may subject us to significant liabilities.
Third parties we work with, such as vendors, may violate applicable laws or our policies, and such violations may also put our customers’ information at risk and could in turn have an adverse impact on our business. We are also subject to payment card association rules and obligations under each association’s contracts with payment card processors. Under these rules and obligations, if information is compromised, we could be liable to payment card issuers for the associated expense and penalties. If we fail to follow payment card industry security standards, even if no customer information is compromised, we could incur significant fines or experience a significant increase in payment card transaction costs.
Security breaches, computer malware and computer hacking attacks have become more prevalent in our industry. Many companies, including ours, have been the targets of such attacks. Any security breach caused by hacking which involves efforts to gain unauthorized access to information or systems, or to cause intentional malfunctions or loss or corruption of data, software, hardware or other computer equipment, and the inadvertent transmission of computer viruses could harm our business. Though it is difficult to determine what harm may directly result from any specific interruption or breach, any failure to maintain performance, reliability, security and availability of our network infrastructure to the satisfaction of our players may harm our reputation and our ability to retain existing players and attract new players.
We take significant measures to protect the secrecy of large portions of our source code. If unauthorized disclosure of our source code occurs, we could potentially lose future trade secret protection for that source code. This could make it easier for third parties to compete with our products by copying functionality which could adversely affect our revenue and operating margins. Unauthorized disclosure of source code also could increase security risks.
Because the techniques used to obtain unauthorized access, disable or degrade service, or sabotage systems, change frequently and often are not recognized until launched against a target, we may be unable to anticipate these techniques or to implement adequate preventative measures. Although we have developed systems and processes that are designed to protect customer information and prevent data loss and other security breaches, including systems and processes designed to reduce the impact of a security breach at a third party vendor, such measures cannot provide absolute security.
We are subject to payment-related risks, such as risk associated with the fraudulent use of credit or debit cards which could have adverse effects on our business due to chargebacks from customers
We allow funding and payments to accounts using a variety of methods, including electronic funds transfer ("EFT"), and credit and debit cards. As we continue to introduce new funding or payment options to our players, we may be subject to additional regulatory and compliance requirements. We also may be subject to the risk of fraudulent use of credit or debit cards, or other funding and/or payment options. For certain funding or payment options, including credit and debit cards, we may pay interchange and other fees which may increase over time and, therefore, raise operating costs and reduce profitability. We rely on third parties to provide payment-processing services and it could disrupt our business if these companies become unwilling or unable to provide these services to us. We are also subject to rules and requirements governing EFT which could change or be reinterpreted to make it difficult or impossible for us to comply. If we fail to comply with these rules or requirements, we may be subject to fines and higher transaction fees or possibly lose our ability to accept credit or debit cards, or other forms of payment from customers which could have a material adverse impact on our business.
Chargebacks occur when customers seek to void credit card or other payment transactions. Cardholders are intended to be able to reverse card transactions only if there has been unauthorized use of the card or the services contracted for have not been provided. In our business, customers occasionally seek to reverse online gaming losses through chargebacks. Although we place great emphasis on control procedures to protect from chargebacks, these control procedures may not be sufficient to protect us from adverse effects on our business or results of operations.
Any violation of the Foreign Corrupt Practices Act, other similar laws and regulations, or applicable anti-money laundering regulations could have a negative impact on us
We are subject to risks associated with doing business outside of the United States, including exposure to complex foreign and U.S. regulations such as the Foreign Corrupt Practices Act (the "FCPA") and other anti-corruption laws which generally prohibit U.S. companies and their intermediaries from making improper payments to foreign officials for the purpose of obtaining or retaining business. Violations of the FCPA and other anti-corruption laws may result in severe criminal and civil sanctions and other penalties. It may be difficult to oversee the conduct of any contractors, third-party partners, representatives or agents who are not our employees, potentially exposing us to greater risk from their actions. If our employees or agents fail to comply with applicable laws or company policies governing our international operations, we may face legal proceedings and actions which
24
could result in civil penalties, administration actions and criminal sanctions. Any determination that we have violated any anti-corruption laws could have a material adverse impact on our business.
We also deal with significant amounts of cash in our operations and are subject to various reporting and anti-money laundering regulations. Any violation of anti-money laundering laws or regulations by any of our properties could have a material adverse impact on our business.
Work stoppages and other labor problems could negatively impact our future plans
Some of our employees are represented by labor unions. A strike or other work stoppage at one of our properties could have an adverse impact on our business and results of operations. From time to time, we have also experienced attempts to unionize certain of our non-union employees. We may experience additional and more successful union activity in the future.
Risks Related to Our Racing Business
We may not be able to attract a sufficient number of horses and trainers to achieve full field horseraces
We believe that patrons prefer to wager on races with a large number of horses, commonly referred to as full fields. A failure to offer races with full fields results in less wagering on our horseraces. Our ability to attract full fields depends on several factors, including our ability to offer and fund competitive purses and the overall horse population available for racing. Various factors have led to declines in the horse population in certain areas of the country, including competition from racetracks in other areas, increased costs and changing economic returns for owners and breeders, and the spread of various debilitating and contagious equine diseases. If any of our racetracks is faced with a sustained outbreak of a contagious equine disease, it could have a material impact on our profitability. If we are unable to attract horse owners to stable and race their horses at our racetracks by offering a competitive environment, including improved facilities, well-maintained racetracks, better conditions for backstretch personnel involved in the care and training of horses stabled at our racetracks and a competitive purse structure, our profitability could also decrease.
We also face increased competition for horses and trainers from racetracks that are licensed to operate slot machines and other electronic gaming machines that provide these racetracks an advantage in generating new additional revenue for race purses and capital improvements. Churchill Downs and Arlington have experienced heightened competition from racinos in Indiana, Pennsylvania, Delaware and West Virginia whose purses are supplemented by gaming revenue. The opening of the Genting New York Resort at Aqueduct racetrack has enhanced the purse structure at New York racetracks as compared to historical levels. In Ohio, seven video lottery terminal facilities have opened and in New York, the Rivers Casino & Resort Schenectady opened in February 2017. Competition from these facilities could harm our ability to attract full fields, which could have a material adverse impact on our business.
We depend on agreements with industry constituents including horsemen and other racetracks
The Interstate Horseracing Act, or IHA, as well as various state racing laws, require that we have written agreements with the horsemen at our racetracks in order to simulcast races, and, in some cases, conduct live racing. Certain industry groups negotiate these agreements on behalf of the horsemen (the "Horsemen’s Groups"). These agreements provide that we must receive the consent of the Horsemen’s Groups at the racetrack conducting live races before we may allow third parties to accept wagers on those races. The agreements between other racetracks and their Horsemen’s Groups typically provide that those racetracks must receive consent from the Horsemen’s Groups before we can accept wagers on their races. We may not be able to maintain agreements with, or to obtain required consent from, Horsemen’s Groups. We currently negotiate formal agreements with the applicable Horsemen’s Groups at our racetracks on an annual basis. The failure to maintain agreements with, or obtain consents from, our horsemen on satisfactory terms or the refusal by a Horsemen’s Group to consent to third parties accepting wagers on our races or our accepting wagers on third parties’ races could have a material adverse impact on our business.
From time to time, the Thoroughbred Owners of California, the Horsemen’s Group representing horsemen in California, the Florida Horsemen’s Benevolent and Protective Association, Inc. (the "FHBPA") which represents horsemen in Florida and the Kentucky Horsemen’s Benevolent and Protective Association ("KHBPA") have withheld their consent to send or receive racing signals among racetracks. Failure to receive the consent of these Horsemen’s Groups for new and renewing simulcast agreements could have a material adverse impact on our business.
We also have written agreements with the Horsemen’s Groups with regards to the proceeds of gaming machines in Louisiana and Florida. Florida law requires Calder Casino to have an agreement with the FHBPA governing the contribution of a portion of revenue from slot machine gaming to purses on live thoroughbred races conducted by TSG at Calder and an agreement with the Florida Thoroughbred Breeders and Owners Association (the "FTBOA") governing the contribution of a portion of revenue from slot machine gaming to breeders’ stallion and special racing awards on live thoroughbred races conducted by TSG at Calder before Calder can receive a license to conduct slot machine gaming.
25
We have agreements with other racetracks for the distribution of racing content through both the import of other racetracks’ signals for wagering at our properties and the export of our racing signal for wagering at other racetracks’ facilities. From time to time, we are unable to reach agreements on terms acceptable to us. As a result, we may be unable to distribute our racing content to other locations or to receive other racetracks’ racing content for wagering at our racetracks. The inability to distribute our racing content could have a material adverse impact on our business.
Horseracing is an inherently dangerous sport and our racetracks are subject to personal injury litigation
Personal injuries to jockeys may occur during races or daily workouts. Although we carry jockey accident insurance at each of our racetracks to cover such injuries, there are certain exclusions to our insurance coverage, and we are still subject to litigation from injured participants. We renew our insurance policies on an annual basis. The cost of coverage may become so high that we may need to further reduce our policy limits or agree to certain exclusions from our coverage. Our results may be affected by the outcome of litigation, as this litigation could be costly and time consuming and could divert our management and key personnel from our business operations.
Our business depends on utilizing and providing totalisator services
Our customers utilize information provided by United Tote and other totalisator companies that accumulates wagers, records sales, calculates payoffs and displays wagering data in a secure manner to patrons who wager on our horseraces. The failure to keep technology current could limit our ability to serve patrons effectively, limit our ability to develop new forms of wagering and/or affect the security of the wagering process, thus affecting patron confidence in our product. A perceived lack of integrity in the wagering systems could result in a decline in bettor confidence and could lead to a decline in the amount wagered on horseracing. A totalisator system failure could cause a considerable loss of revenue if betting machines are unavailable for a significant period of time or during an event with high betting volume.
United Tote also has licenses and contracts to provide totalisator services to a significant number of racetracks, OTBs and other pari-mutuel wagering businesses. Its totalisator systems provide wagering data to the industry in a secure manner. Errors by United Tote technology or personnel may subject us to liabilities, including financial penalties under our totalisator service contracts which could have a material adverse impact on our business.
Inclement weather and other conditions may affect our ability to conduct live racing
We conduct our racing business at three thoroughbred racetracks: Churchill Downs, Fair Grounds and Arlington; and, through separate joint ventures and equity investments, at three harness racetracks: Miami Valley, Ocean Downs, and Saratoga Harness. A significant portion of our racing revenue is generated during the Kentucky Oaks and Kentucky Derby week. If a business interruption were to occur and continue for a significant length of time at any of our racetracks, particularly one occurring at Churchill Downs at a time that would affect the Kentucky Oaks or Kentucky Derby, it could have a material adverse impact on our business.
Since horseracing is conducted outdoors, unfavorable weather conditions, including extremely high and low temperatures, heavy rains, high winds, storms, tornadoes and hurricanes, could cause events to be canceled and/or attendance to be lower, resulting in reduced wagering. Our operations are subject to reduced patronage, disruptions or complete cessation of operations due to weather conditions, natural disasters and other casualties. If a business interruption were to occur due to inclement weather and continue for a significant length of time at any of our racetracks, it could have a material adverse impact on our business.
Our racing business faces significant competition, and we expect competition levels to increase
All of our racetracks face competition from a variety of sources, including spectator sports and other entertainment and gaming options. Competitive gaming activities include traditional and Native American casinos, video lottery terminals, state-sponsored lotteries and other forms of legalized and non-legalized gaming in the U.S. and other jurisdictions.
All of our racetracks face competition in the simulcast market. In 2016, approximately
42,000
thoroughbred horse races were conducted in the United States. We hosted approximately 2,070 races, or about 4.9% of the total. As a content provider, we compete for wagering dollars in the simulcast market with other racetracks conducting races at or near the same times as our races. As a racetrack operator, we also compete with other racetracks running live meets at or near the same time as our horse races. In recent years, this competition has increased as more states have allowed additional, automated gaming activities, such as slot machines at racetracks with mandatory purse contributions.
Competition from web-based businesses presents additional challenges for our racing business. Unlike most online and web-based gaming companies, our racetracks require significant and ongoing capital expenditures for both continued operations and expansion. Our racing business also faces significantly greater operating costs compared to costs borne by online and web-based gaming companies. Our racing business cannot offer the same number of gaming options as online and Internet-based gaming companies. These companies may divert wagering dollars from pari-mutuel wagering venues, such as our racetracks. Our inability to compete successfully with these competitors could have a material adverse impact on our business.
26
Our racing operations are highly regulated, and changes in the regulatory environment could adversely affect our business
Our racing business is subject to extensive state and local regulation, and we depend on continued state approval of legalized gaming in states where we operate. Our wagering and racing facilities must meet the licensing requirements of various regulatory authorities, including authorities in Kentucky, Illinois, Louisiana, Florida, Ohio, Maryland and New York. To date, we have obtained all governmental licenses, registrations, permits and approvals necessary for the operation of our racetracks. However, we may be unable to maintain our existing licenses. The failure to attain, loss of or material change in our racing business licenses, registrations, permits or approvals may materially limit the number of races we conduct, and could have a material adverse impact on our business.
In addition to licensing requirements, state regulatory authorities can have a significant impact on the operation of our business. In Illinois, the IRB has the authority to designate racetracks as "host track" for the purpose of receiving host track revenue generated during periods when no racetrack is conducting live races. Racetracks that are designated as "host track" obtain and distribute out of state simulcast signals for the State of Illinois. Under Illinois law, the "host track" is entitled to a larger portion of commissions on the related pari-mutuel wagering. Should Arlington cease to be a "host track" during this period, the loss of hosting revenue could have an adverse impact on our business. Arlington is statutorily entitled to recapture as revenue monies that are otherwise payable to Arlington’s purse account. These statutorily or regulatory established revenue sources are subject to change every legislative session, and a reduction or elimination of any of these revenue sources could have an adverse impact on our business.
We are also subject to a variety of other rules and regulations, including zoning, environmental, construction and land-use laws and regulations governing the serving of alcoholic beverages. If we are not in compliance with these laws, it could have a material adverse impact on our business.
The popularity of horseracing is declining
There has been a general decline in the number of people attending and wagering on live horse races at North American racetracks due to a number of factors, including increased competition from other wagering and entertainment alternatives as discussed above. According to industry sources, pari-mutuel handle declined 27% from 2007 to 2011 and has been relatively stable since 2011, experiencing less than a 1% decline in growth between 2011 and 2016. We believe lower interest in racing may have a negative impact on revenue and profitability in our racing business, as well as our mobile and online wagering business which is dependent on racing content provided by our racing business and other track operators. A continued decrease in attendance at live events and in on-track wagering, or a continued generalized decline in interest in racing, could have a material adverse impact on our business.
Our racing business experiences significant seasonal fluctuations in operating results and a decrease in live racing days may adversely impact our business
We experience significant fluctuations in quarterly and annual operating results due to seasonality and other factors. We have a limited number of live racing days at our racetracks, and the number of live racing days varies from year to year. The number of live racing days may be adversely impacted by factors including inclement weather, our ability to negotiate certain agreements with industry groups (in particular groups working on behalf of horsemen), jockey walkouts and other negotiation issues with independent contractors, and contagious equine disease. The number of live racing days we are able to offer directly affects our results of operations. A significant decrease in the number of live racing days and/or live races offered during our Kentucky Oaks and Kentucky Derby week could have a material adverse impact on our business.
Risks Related to Our Casino Business
Our casino business faces significant competition from brick-and-mortar casinos and other gaming and entertainment alternatives, and we expect competition levels to increase
Our casinos operate in a highly competitive industry with a large number of participants, some of which have financial and other resources that are greater than our resources. Our casino operations face competition from Native American casinos, video lottery terminals, state-sponsored lotteries and other forms of legalized gaming in the U.S. and other jurisdictions. Proposed additional casino licenses in Maine and the opening of the Rivers Casino & Resort Schenectady could provide additional competition. We do not enjoy the same access to the gaming public or possess the advertising resources that are available to state-sponsored lotteries or other competitors which may adversely affect our ability to compete effectively with them. Legislators in Florida continue to debate the expansion of Florida gaming to include Las Vegas-style destination resort casinos. Such casinos may be subject to taxation rates lower than the current gaming taxation structure. Should such legislation be enacted, it could have a material adverse impact on our business.
The gaming industry also faces competition from a variety of sources for discretionary consumer spending including spectator sports and other entertainment and gaming options. Web-based interactive gaming and wagering is growing rapidly and affecting competition in our industry as federal regulations on web-based activities are clarified. We anticipate that competition will
27
continue to grow in the web-based interactive gaming and wagering channels because of ease of entry and such increased competition may have an adverse impact on our business.
Our casino business is highly regulated and changes in the regulatory environment could adversely affect our business
Our casino operations exist at the discretion of the states where we conduct business, and are subject to extensive state and local regulation. Like all gaming operators in the jurisdictions in which we operate, we must periodically apply to renew our gaming licenses or registrations and have the suitability of certain of our directors, officers and employees approved. While we have obtained all governmental licenses, registrations, permits and approvals currently necessary for the operation of our gaming facilities, we cannot be certain that we will be able to obtain such renewals or approvals in the future, or that we will be able to obtain future approvals that would allow us to expand our gaming operations.
Regulatory authorities also have input into important aspects of our operations, including hours of operation, location or relocation of a facility, numbers and types of machines and loss limits. Regulators may also levy substantial fines against or seize our assets or the assets of our subsidiaries or the people involved in violating gaming laws or regulations. Any of these events could have an adverse impact on our business. The high degree of regulation in the gaming industry is a significant obstacle to our growth strategy.
The development of new casino venues and the expansion of existing facilities is costly and susceptible to delays, cost overruns and other uncertainties
We may decide to develop, construct and open hotels, casinos or other gaming venues in response to opportunities that may arise. Future development projects and acquisitions may require significant capital commitments, the incurrence of additional debt, the incurrence of contingent liabilities and an increase in amortization expense related to intangible assets which could have a material adverse impact on our business.
The concentration and evolution of the slot machine manufacturing industry or other technological conditions could impose additional costs on us
The majority of our gaming revenue is attributable to slot and video poker machines operated by us at our casinos and wagering facilities. It is important for competitive reasons that we offer the most popular and up-to-date machine games with the latest technology to our guests. In recent years, the prices of new machines have escalated faster than the rate of inflation. In recent years, slot machine manufacturers have frequently refused to sell slot machines featuring the most popular games, instead requiring participating lease arrangements in order to acquire the machines. Participation slot machine leasing arrangements typically require the payment of a fixed daily rental. Such agreements may also include a percentage payment of coin-in or net win. Generally, a participating lease is substantially more expensive over the long term than the cost to purchase a new machine. For competitive reasons, we may be forced to purchase new slot machines or enter into participating lease arrangements that are more expensive than the costs associated with the continued operation of our existing slot machines.
We materially rely on a variety of hardware and software products to maximize revenue and efficiency in our operations. Technology in the gaming industry is developing rapidly, and we may need to invest substantial amounts to acquire the most current gaming and hotel technology and equipment in order to remain competitive in the markets in which we operate. We rely on a limited number of vendors to provide video poker and slot machines and any loss of our equipment suppliers could impact our operations. Ensuring the successful implementation and maintenance of any new technology acquired is an additional risk.
Our business may be adversely affected by legislation prohibiting tobacco smoking.
Legislation in various forms to ban indoor tobacco smoking in public places has been enacted or introduced in many states and local jurisdictions, including in or near jurisdictions in which we operate. The smoking bans and restrictions have negatively impacted our business in New Orleans, where the New Orleans City Council unanimously approved an ordinance prohibiting smoking in casinos, bars and restaurants beginning in 2015. The enactment of similar legislation in other areas where we operate may adversely affect our business.
Our casino business is geographically concentrated
We conduct our casino business at nine principal locations: Oxford, Maine; Vicksburg, Mississippi; Greenville, Mississippi; Miami Gardens, Florida; New Orleans, Louisiana; Lebanon, Ohio; Berlin, Maryland; Black Hawk, Colorado and Saratoga Springs, New York. We also operate video poker machines throughout Louisiana. If a business interruption were to occur and continue for a significant length of time at any of our principal gaming operations, or if economic or regulatory conditions were to become unfavorable in one or more of the regions in which our casino business operates, including a regional decrease in discretionary consumer spending, it could have a material adverse impact on our business.
28
Risks Related to Our TwinSpires Business
Our mobile and online wagering business is highly regulated and changes in the regulatory environment could adversely affect our business
TwinSpires.com, our mobile and online wagering business, accepts advance deposit wagers from customers of certain states who set up and fund an account from which they may place wagers via telephone, mobile device or through the Internet at www.TwinSpires.com. The mobile and online wagering business is heavily regulated, and laws governing advance deposit wagering vary from state to state. Some states have expressly authorized advance deposit wagering by residents, some states have expressly prohibited pari-mutuel wagering and/or advance deposit wagering and other states have expressly authorized pari-mutuel wagering but have neither expressly authorized nor expressly prohibited residents of the state from placing wagers through advance deposit wagering hubs located in different states. We believe that a mobile and online wagering business may open accounts on behalf of and accept wagering instructions from residents of states where pari-mutuel wagering is legal and where providing wagering instructions to advance deposit wagering businesses in other states is not expressly prohibited by statute, regulations, or other governmental restrictions. However, state attorneys general, regulators, and other law enforcement officials may interpret state gaming laws, federal statutes, constitutional principles, and doctrines, and the related regulations in a different manner than we do. In the past, certain state attorneys general and other law enforcement officials have expressed concern over the legality of interstate advance deposit wagering.
Our expansion opportunities with respect to advance deposit wagering may be limited unless more states amend their laws or regulations to permit advance deposit wagering. Conversely, if states take affirmative action to make advance deposit wagering expressly unlawful, this could have a material adverse impact on our business. Previously existing advance deposit wagering regulations in Illinois expired on December 31, 2012, and we ceased accepting wagers from Illinois residents in January 2013 until Illinois advance deposit wagering regulations were extended in June 2013. We ceased accepting wagers from Texas residents in September 2013 due to the enforcement of an existing Texas law prohibiting advance deposit wagering. Regulatory and legislative processes can be lengthy, costly and uncertain. We may not be successful in lobbying state legislatures or regulatory bodies to obtain or renew required legislation, licenses, registrations, permits and approvals necessary to facilitate the operation or expansion of our mobile and online wagering business. From time to time, the United States Congress has considered legislation that would either inhibit or restrict Internet gambling in general or inhibit or restrict the use of certain financial instruments, including credit cards, to provide funds for advance deposit wagering.
Many states have considered and are considering interactive and Internet gaming legislation and regulations which may inhibit our ability to do business in such states. Anti-gaming conclusions and recommendations of other governmental or quasi-governmental bodies could form the basis for new laws, regulations, and enforcement policies that could have a material adverse impact on our business. The extensive regulation by both state and federal authorities of gaming activities also can be significantly affected by changes in the political climate and changes in economic and regulatory policies. Such effects could have a material adverse impact to the success of our advance deposit wagering operations.
Our mobile and online wagering business faces strong competition and we expect competition levels to increase
Our mobile and online wagering business is sensitive to changes and improvements to technology and new products and faces strong competition from other web-based interactive gaming and wagering businesses. Our ability to develop, implement and react to new technology and products for our mobile and online wagering business is a key factor in our ability to compete with other advance deposit wagering businesses. Some of our competitors may have greater resources than we do. We anticipate increased competition in our mobile and online business from various other forms of online gaming.
During 2011, the United States Department of Justice clarified its position on the Wire Act of 1961 (the "Wire Act") which had historically been interpreted to outlaw all forms of gambling across states lines. The department’s Office of Legal Counsel determined that the Wire Act applied only to a sporting event or contest, but did not apply to other forms of Internet gambling, including online betting unrelated to sporting events. The United States Department of Justice indicated that many forms of online gambling could become legal under federal law which could include legalized poker and generalized gaming including state lottery wagering. We anticipate increased competition to our mobile and online wagering business from various other forms of online gaming. It is difficult to predict the level of increased competition and the impact of increased competition on our mobile and online wagering business.
Our inability to retain our core customer base or our failure to attract new customers could harm our business
We utilize technology and marketing relationships to retain current customers and attract new customers. If we are unable to retain our core customer base through robust content offerings and other popular features, if we lose customers to our competitors, or if we fail to attract new customers, our businesses would fail to grow or would be adversely affected.
29
Our mobile and online wagering business is subject to a variety of U.S. and foreign laws, many of which are unsettled and still developing and which could subject us to claims or otherwise harm our business
We are subject to a variety of laws in the United States and abroad, including laws regarding gaming, consumer protection and intellectual property that are continuously evolving and developing. The scope and interpretation of the laws that are or may be applicable to us are often uncertain and may be conflicting. Laws relating to the liability of providers of online services for activities of users and other third parties are currently being tested by a number of claims, including actions based on invasion of privacy and other torts, unfair competition, copyright and trademark infringement, and other theories. It is also likely that as our business grows and evolves we will become subject to laws and regulations in additional jurisdictions.
If we are not able to comply with these laws or regulations or if we become liable under these or new laws or regulations, we could be directly harmed, and we may be forced to implement new measures to reduce our exposure to this liability. This may require us to expend substantial resources or to modify our online services which could harm our business. The increased attention focused upon liability issues as a result of lawsuits and legislative proposals could harm our reputation or otherwise impact the growth of our business.
Failure to comply with laws requiring us to block access to certain individuals, based upon geographic location, may result in legal penalties or impairment to our ability to offer our mobile and online wagering products, in general
Individuals in jurisdictions in which online real money gaming is illegal may nonetheless seek to engage our online real money gaming products. While we take steps to block access by individuals in such jurisdictions, those steps may be unsuccessful. In the event that individuals in jurisdictions in which online real money gaming is illegal engage our online real money gaming systems, we may be subject to criminal sanctions, regulatory penalties, the loss of existing or future licenses necessary to offer online real money gaming or other legal liabilities, any one of which could have a material adverse impact on our businesses. Gambling laws and regulations in many jurisdictions require gaming industry participants to maintain strict compliance with various laws and regulations. If we are unsuccessful in blocking access to our online real money gaming products by individuals in a jurisdiction where such products are illegal, we could lose or be prevented from obtaining a license necessary to offer online real money gaming in a jurisdiction in which such products are legal.
Risks Related to Big Fish Games
We operate in an evolving and highly competitive market segment
The market segments in which we operate are highly competitive. The business of developing, distributing and marketing games for PC, Mac and mobile devices is characterized by frequent product introductions and rapidly emerging platforms and technologies. We compete with other game developers and content providers for the leisure time, attention, and discretionary spending of our players based on a number of factors, including game design, brand and consumer reviews, quality of gameplay experience and access to distribution channels. We also compete with other content providers to acquire rights to game properties developed or licensed by third parties, including with respect to royalty and other economic terms, porting and localization abilities, speed of execution and distribution capabilities and breadth.
Many of our primary competitors have greater financial, marketing and other resources dedicated to the development, distribution and promotion of their games. We are also faced with competition from a vast number of small, independent developers that have access to the same third party platforms as we do to market and distribute titles.
The competitive landscape is further complicated by frequent shifts and advancements in free-to-play games for smartphones, tablets and other next-generation platforms. Free-to-play games are games that players can download and play for free, but that allow players to access a variety of additional content and features for a fee and to engage with various advertisements and in-game offers that generate revenue for us. Our efforts to develop free-to-play games may prove unsuccessful or may take more time than we anticipate to achieve significant revenue because:
|
•
|
free-to-play games have a relatively limited history, and it is unclear how popular this style of game will remain, or its future revenue potential;
|
|
•
|
free-to-play strategy assumes that a large number of players will download our games because the games are free and that we will then be able to effectively monetize the games; and
|
|
•
|
even if our free-to-play games are widely downloaded, a significant portion of the revenue generated from these titles are derived from a relatively small concentration of players and we may fail to retain these or other users, or optimize the monetization of these games.
|
30
We derive material revenue from distribution of our titles through third party mobile platforms, and if we are unable to maintain relationships with the owners of these platforms or if our access to these platforms is limited or unavailable for any prolonged period of time, our business could be adversely affected
If we are unable to maintain good relationships with third party mobile platform providers, such as Apple and Google, our business could be impacted. Our business could be harmed if access to these platforms is limited or suspended based on any change in terms or policies that made the continued distribution of our titles on these platforms unfeasible or less profitable, or that required us to spend significantly more on marketing campaigns or other means to enhance the discoverability of our titles on these platforms.
Our ability to transact business through these platforms is subject to our compliance with the standard terms and conditions which may be unilaterally amended at any time. The owners of these platforms set the revenue share the platform is entitled to receive and may change the revenue share without input from or advance notice to us. The standard terms and conditions of these platforms may impose restrictions on the types of content the platform will allow to be sold, the ways in which the content is offered and promoted, and the process and timing of accepting content for distribution. Such restrictions could impair our ability to successfully market and sell our mobile games. If any of the providers of these platforms determines that we are in violation of their standard terms and conditions, we may be prohibited from distributing our titles through these platforms which could harm our business.
We also rely on the ongoing availability of these platforms. If these platforms experience prolonged periods of unavailability, it could have a material impact on our ability to generate revenue through these platforms and our business could be harmed. If these platforms fail to provide adequate levels of service, our customers' ability to access our games may be impacted or customers may not receive any virtual items for which they have paid which may adversely affect our brand and consumer goodwill.
If we fail to develop and publish mobile games that achieve market acceptance, or continue to enhance our existing games, our revenue may suffer
Our business depends on developing and publishing social casino, casual and mid-core free-to-play and premium paid games that consumers will download and spend time and money on consistently. We continue to invest significant resources in research and development, analytics and marketing to introduce new games and update our existing titles, taking a "portfolio approach" this is not dependent on a limited number of "hit" titles. Our success depends, in part, on unpredictable factors beyond our control, including consumer preferences, competing games and other forms of entertainment, and the emergence of new platforms. If our games do not meet consumer expectations or our games are not brought to market in a timely and effective manner, our business could be adversely impacted. If we fail to update our games with compelling content or if there is a shift in the entertainment preferences of consumers, our business could be adversely impacted.
If we are unable to secure new or ongoing content from third party development partners, our business could be adversely affected
In addition to the games we develop internally, we acquire or license games, including some of our most successful games, from third party development partners located around the world. Our success depends in part on our ability to attract and retain talented and reliable development partners to source new content and update existing content. Our agreements with these development partners are in some instances not exclusive to us and will expire at various times. If we are unable to renew these agreements or if our development partners enter into similar agreements with our competitors or choose to publish their own titles, our business could be harmed.
Certain of our development partners are located in geographic regions of the world that continue to experience military and insurgency conflicts, and political turmoil and unrest. Any of these factors could impact the ability of these development partners to create and deliver content to us in a timely fashion or at all, and could restrict or prohibit our ability to remit payments to these development partners. If we are unable to deliver compelling content to our customers or update existing content, our ongoing business, operating results and financial condition could be harmed.
Our financial results could vary significantly from quarter to quarter and are difficult to predict
Our net revenue, net income, Adjusted EBITDA and other operating results could vary significantly from quarter to quarter due to a variety of factors, some of which are outside of our control. As a result, comparing our operating results on a period-to-period basis may not be meaningful. Factors that may contribute to the variability of our quarterly results include:
|
•
|
Changes in the amount of money we spend marketing our games in a particular quarter, including the average amount we pay to acquire new users, as well as changes in the timing of other marketing and advertising expenses within the quarter;
|
31
|
•
|
The popularity and monetization rates of our new mobile games released during the quarter and the ability of games released in prior periods to sustain their popularity and monetization rates;
|
|
•
|
The number and timing of new mobile games and game updates released by us and our competitors, in particular with respect to those games that may represent a significant portion of revenues in a quarter, which timing can be impacted by internal development delays, shifts in product strategy and how quickly app stores review and approve our games for commercial release;
|
|
•
|
The seasonality of our industry; and
|
|
•
|
Changes in accounting rules; such as those governing recognition of revenue, including the period of time over which we recognize revenue for in-app purchases of virtual goods and currency within certain of our mobile games.
|
If our games contain programming errors or flaws, if a significant number of customers experience technical difficulties downloading or launching our games, or if we fail to continue to provide our customers with a high-quality customer experience, it could harm our business and impair our ability to successfully execute our business strategy
A critical component of our strategy is providing a high-quality customer experience to our customers. Our games may contain errors, bugs, flaws or corrupted data, and these defects may only become apparent after launch, particularly as we launch new games under tight time constraints. Porting games to new devices or languages may also result in the creation of errors that did not exist in the game as originally released. Our customers may experience technical difficulties downloading and launching our games due to the effects of third-party software on their computers that we do not control. Our customer service team may be unable to resolve these types of technical difficulties, and if a significant number of our customers cannot download or launch our games, it would harm our business. We believe that if our customers have a negative experience with our games, they may be less inclined to continue or resume playing our games, recommend our games to other potential customers or they may post negative reviews that may dissuade other users from downloading or playing our games. Undetected programming errors, game defects, data corruption and issues with third-party software can disrupt our operations, adversely affect the game experience of our customers, harm our reputation, cause our customers to stop playing our games and divert our resources, any of which could result in legal liability to us, harm our reputation or adversely impact our business.
"Cheating" programs, scam offers, black-markets and other actions by third parties that seek to exploit our games and our players may affect our reputation and harm our operating results
Third parties have developed, and may continue to develop, "cheating" programs, scam offers, black-markets and other offerings that could decrease the revenue we generate from our virtual economies, divert our players from our games or otherwise harm us. Cheating programs enable players to exploit vulnerabilities in our games to obtain virtual currency or other items that would otherwise generate in-app purchases for us, play the games in automated ways or obtain unfair advantages over other players. Third parties may attempt to scam our players with fake offers for virtual goods or other game benefits. We devote significant resources to discover and disable these programs and activities, but if we are unable to do so quickly or effectively, it could damage our reputation and impact our business and results of operations.
If the use of smartphones and tablet devices to facilitate game platforms generally does not increase, our business could be adversely affected
While the number of people using mobile devices has increased dramatically in the past few years, the mobile gaming market is still emerging and it may not grow as rapidly or robustly as we anticipate. Our future success is partially dependent upon the continued growth and application of mobile devices for games. New and emerging technologies could make the mobile devices on which some of our games are currently released obsolete, requiring us to transition our business model to develop games for other next-generation platforms.
|
ITEM 1B.
|
UNRESOLVED STAFF COMMENTS
|
None.
|
ITEM 2.
|
PROPERTIES
|
We own the following real property:
|
•
|
Arlington International Race Course in Arlington Heights, IL
|
|
•
|
Oxford Casino in Oxford, ME
|
|
•
|
Riverwalk Casino in Vicksburg, MS
|
|
•
|
Calder Casino in Miami Gardens, FL
|
32
|
•
|
Fair Grounds Slots and Video Services, LLC and Fair Grounds Race Course in New Orleans, LA
|
We lease the following facilities:
|
•
|
Churchill Downs Racetrack in Louisville, KY
|
|
•
|
Arlington - We lease seven OTBs in Illinois.
|
|
•
|
Fair Grounds - We lease ten OTBs in Louisiana.
|
|
•
|
Harlow's Casino in Greenville, MS - We lease the land on which the casino is located.
|
|
•
|
TwinSpires.com and Bloodstock Research Information Services in Lexington, KY
|
|
•
|
Big Fish Games in Seattle, WA; Oakland, CA and Luxembourg
|
|
•
|
United Tote in Louisville, KY; San Diego, CA and Portland, OR
|
|
•
|
Corporate and TwinSpires headquarters in Louisville, KY
|
In 2002, as part of financing improvements to the Churchill facility, we transferred title of the Churchill Downs facility to the City of Louisville, Kentucky and leased back the facility. Subject to the terms of the lease, we can re-acquire the facility at any time for $1.00.
|
ITEM 3.
|
LEGAL PROCEEDINGS
|
In addition to the matters described below, we are also involved in ordinary routine litigation matters which are incidental to our business.
Louisiana Environmental Protection Agency Non-Compliance Issue
On December 6, 2013, we received a notice from the United States Environmental Protection Agency regarding alleged concentrated animal feeding operation ("CAFO") non-compliance at Fair Grounds. We are currently in discussions with the EPA and United States Department of Justice and we expect to incur certain capital expenditures to remediate the alleged CAFO non-compliance. These capital expenditures are expected to extend the life of the related Fair Grounds assets.
Louisiana Horsemens' Purses Class Action Suit
On April 21, 2014, John L. Soileau and other individuals filed a Petition for Declaratory Judgment, Permanent Injunction, and Damages-Class Action styled
John L. Soileau, et. al. versus Churchill Downs Louisiana Horseracing, LLC, Churchill Downs Louisiana Video Poker Company, LLC
(Suit No. 14-3873) in the Parish of Orleans, State of Louisiana. The petition defined the "alleged plaintiff class" as quarter-horse owners, trainers and jockeys that have won purses at the "Fair Grounds Race Course & Slots" facility in New Orleans, Louisiana since the first effective date of La. R.S. 27:438 and specifically since 2008. The petition alleged that Churchill Downs Louisiana Horseracing, L.L.C. and Churchill Downs Louisiana Video Poker Company, L.L.C. ("Fair Grounds") have collected certain monies through video draw poker devices that constitute monies earned for purse supplements and all of those supplemental purse monies have been paid to thoroughbred horsemen during Fair Grounds’ live thoroughbred horse meets; while La. R.S. 27:438 requires a portion of those supplemental purse monies to be paid to quarter-horse horsemen during Fair Grounds’ live quarter-horse meets. The petition requested that the Court declare that Fair Grounds violated La. R.S. 27:438, issue a permanent and mandatory injunction ordering Fair Grounds to pay all future supplements due to the plaintiff class pursuant to La. R.S. 27:438, and to pay the plaintiff class such sums as it finds to reasonably represent the value of the sums due to the plaintiff class. On August 14, 2014, the plaintiffs filed an amendment to their petition naming the Horsemen’s Benevolent and Protective Association 1993, Inc. ("HBPA") as an additional defendant and alleging that HBPA is also liable to plaintiffs for the disputed purse funds. On October 9, 2014, HBPA and Fair Grounds filed exceptions to the suit, including an exception of primary jurisdiction seeking referral to the Louisiana Racing Commission. By Judgment dated November 21, 2014, the District Court granted the exception of primary jurisdiction and referred the matter to the Louisiana Racing Commission. On January 26, 2015, the Louisiana Fourth Circuit Court of Appeals denied the plaintiffs’ request for supervisory review of the Judgment. The Louisiana Racing
Commission requested and received memoranda from the parties in the case on the issue of whether plaintiffs have standing to pursue the claims against Fair Grounds. On August 24, 2015, the Louisiana Racing Commission ruled that the plaintiffs did not have standing or a right of action to pursue the case. On September 18, 2015, the plaintiffs filed a Petition for Appeal of Administrative Order Dismissing Case for No Right of Action in the District Court seeking a reversal of the Louisiana Racing Commission’s ruling. On July 13, 2016, the plaintiff’s filed their brief with the District Court and Fair Grounds filed its brief on August 12, 2016. A hearing was held at the District Court on September 15, 2016 and the District Court affirmed the Louisiana Racing Commission’s ruling. The plaintiff filed an appeal with the Louisiana Fourth Circuit Court of Appeals on December 7, 2016.
33
Pennsylvania Advance Deposit Wagering Suit
On September 3, 2016, the Company filed a lawsuit in the Commonwealth Court of Pennsylvania styled
Churchill Downs Incorporated and Churchill Downs Technology Initiatives Company v. The Commonwealth of Pennsylvania, acting by and through the Department of Revenue; Eileen H. McNulty, Secretary of Revenue of the Commonwealth of Pennsylvania, and her successors in office; Bruce Beemer, Attorney General of the Commonwealth of Pennsylvania, and his successors in office; The Pennsylvania State Horse Racing Commission; Corinne Sweeney; Thomas J. Ellis; C. Edward Rogers, Jr.; Russell B. Jones Jr.; Michele C. Ruddy, Salvatore M. De Bunda, and Russell C. Redding, in their Official Capacity as Commissioners of the Pennsylvania State Horse Racing Commission, and their successors in office
(Docket No. 476 MD 2016) challenging the constitutionality of a Pennsylvania law granting each Pennsylvania race track a local monopoly over all wagers placed by telephone or through the Internet by Pennsylvania residents located within a 35-mile radius of the track, as well as requiring out-of-state advance deposit wagering companies to pay initial and annual license fees.
|
ITEM 4.
|
MINE SAFETY DISCLOSURES
|
Not applicable.
34
|
ITEM 5.
|
MARKET FOR REGISTRANT’S COMMON EQUITY, RELATED SHAREHOLDER MATTERS AND ISSUER PURCHASES OF EQUITY SECURITIES
|
Market for Common Stock
Our common stock is traded on the NASDAQ Global Market under the symbol CHDN. As of February 17, 2017, there were approximately 2,980 shareholders of record.
The following table sets forth the high and low closing sale prices, as reported by the NASDAQ Global Market, and dividend declaration information for our common stock during the last two years:
|
2016
|
2015
|
|||||||||||||||
|
Quarter Ended
|
High
|
Low
|
High
|
Low
|
||||||||||||
|
First Quarter
|
$
|
148.18
|
|
$
|
121.56
|
|
$
|
115.27
|
|
$
|
90.52
|
|
||||
|
Second Quarter
|
$
|
149.05
|
|
$
|
118.76
|
|
$
|
129.01
|
|
$
|
111.93
|
|
||||
|
Third Quarter
|
$
|
151.48
|
|
$
|
121.75
|
|
$
|
143.32
|
|
$
|
118.33
|
|
||||
|
Fourth Quarter
|
$
|
157.15
|
|
$
|
131.70
|
|
$
|
152.98
|
|
$
|
130.74
|
|
||||
Dividends
Since joining the NASDAQ exchange in 1993, we have declared and paid cash dividends on an annual basis at the discretion of our Board of Directors. The payment and amount of future dividends will be determined by the Board of Directors and will depend upon, among other things, our operating results, financial condition, cash requirements and general business conditions at the time such payment is considered. We declared a dividend of $1.32 in December 2016 which was paid in January 2017, and we declared a dividend of $1.15 in December of 2015 which was paid in January 2016.
Issuer Purchases of Common Stock
The following table provides information with respect to shares of common stock that we repurchased during the quarter ended
December 31, 2016
:
|
Period
|
Total Number of Shares Purchased
|
Average Price Paid Per Share
|
Total Number of Shares Purchased as Part of Publicly Announced Plans or Programs
|
Approximate Dollar Value of Shares That May Yet Be Purchased under the Plans or Programs
(in millions)
|
|||||||||||
|
10/1/16-10/31/2016
|
638
|
|
$
|
143.63
|
|
—
|
|
$
|
135.0
|
|
|||||
|
11/1/16-11/30/2016
|
91,446
|
|
$
|
140.59
|
|
88,075
|
|
122.7
|
|
||||||
|
12/1/16-12/31/2016
|
40,615
|
|
$
|
150.42
|
|
1,857
|
|
122.4
|
|
||||||
|
Total
|
132,699
|
|
$
|
143.61
|
|
89,932
|
|
$
|
122.4
|
|
(1)
|
||||
|
(1)
|
Maximum dollar amount of shares of common stock that may yet be repurchased under our stock repurchase program.
|
35
Shareholder Return Performance Graph
The following performance graph and related information shall not be deemed "soliciting material" nor to be "filed" with the SEC, nor shall such information be incorporated by reference into any future filings under the Securities Act of 1933 or the Securities Exchange Act of 1934, each as amended, except to the extent we specifically incorporate it by reference into such filing.
The following graph depicts the cumulative total shareholder return, assuming reinvestment of dividends, for the periods indicated for our Common Stock compared to the S&P 500 Index and the Russell 2000 Index. We consider the Russell 2000 Index to be our most comparable industry peer group index due to our entry into social gaming technology as a result of our Big Fish Games acquisition and our other operations.
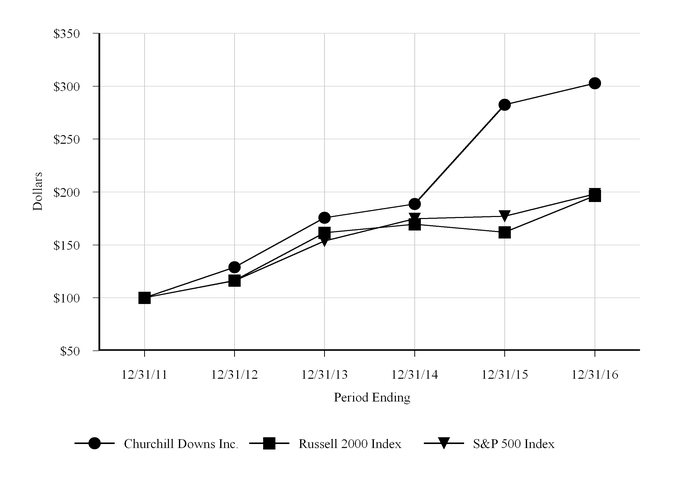
|
12/31/2011
|
12/31/2012
|
12/31/2013
|
12/31/2014
|
12/31/2015
|
12/31/2016
|
||||||||||||||||||
|
Churchill Downs Inc.
|
$
|
100.00
|
|
$
|
128.97
|
|
$
|
175.74
|
|
$
|
188.75
|
|
$
|
282.45
|
|
$
|
302.92
|
|
|||||
|
Russell 2000 Index
|
$
|
100.00
|
|
$
|
116.35
|
|
$
|
161.52
|
|
$
|
169.42
|
|
$
|
161.95
|
|
$
|
196.45
|
|
|||||
|
S&P 500 Index
|
$
|
100.00
|
|
$
|
116.00
|
|
$
|
153.57
|
|
$
|
174.60
|
|
$
|
177.01
|
|
$
|
198.18
|
|
|||||
36
|
ITEM 6.
|
SELECTED FINANCIAL DATA
|
|
Years Ended December 31,
|
|||||||||||||||||||
|
(In millions, except per common share data)
|
2016
|
2015
|
2014
(1)
|
2013
(2)
|
2012
(3)
|
||||||||||||||
|
Operations:
|
|||||||||||||||||||
|
Net revenue
|
$
|
1,308.6
|
|
$
|
1,212.3
|
|
$
|
812.2
|
|
$
|
779.0
|
|
$
|
731.3
|
|
||||
|
Operating income
|
194.2
|
|
123.6
|
|
90.4
|
|
90.1
|
|
96.6
|
|
|||||||||
|
Income from continuing operations
|
108.1
|
|
65.2
|
|
46.4
|
|
55.0
|
|
58.2
|
|
|||||||||
|
Net income
|
108.1
|
|
65.2
|
|
46.4
|
|
54.9
|
|
58.3
|
|
|||||||||
|
Basic net income per common share
|
$
|
6.52
|
|
$
|
3.75
|
|
$
|
2.67
|
|
$
|
3.12
|
|
$
|
3.39
|
|
||||
|
Diluted net income per common share
|
$
|
6.42
|
|
$
|
3.71
|
|
$
|
2.64
|
|
$
|
3.06
|
|
$
|
3.34
|
|
||||
|
Balance sheet data at period end:
|
|||||||||||||||||||
|
Total assets
|
$
|
2,254.4
|
|
$
|
2,277.4
|
|
$
|
2,356.3
|
|
$
|
1,352.3
|
|
$
|
1,114.3
|
|
||||
|
Total debt
|
921.6
|
|
781.8
|
|
764.1
|
|
384.4
|
|
209.7
|
|
|||||||||
|
Total liabilities
|
1,569.4
|
|
1,660.2
|
|
1,656.3
|
|
647.5
|
|
470.0
|
|
|||||||||
|
Shareholders’ equity
|
685.0
|
|
617.2
|
|
700.0
|
|
704.8
|
|
644.3
|
|
|||||||||
|
Shareholders’ equity per common share
|
$
|
41.56
|
|
$
|
37.18
|
|
$
|
40.06
|
|
$
|
39.27
|
|
$
|
36.93
|
|
||||
|
Other Data:
|
|||||||||||||||||||
|
Cash flows from operating activities
|
$
|
226.8
|
|
$
|
264.5
|
|
$
|
141.6
|
|
$
|
144.9
|
|
$
|
144.1
|
|
||||
|
Capital maintenance expenditures
|
30.9
|
|
31.1
|
|
22.7
|
|
16.9
|
|
17.2
|
|
|||||||||
|
Capital project expenditures
|
23.8
|
|
12.4
|
|
31.8
|
|
31.8
|
|
24.1
|
|
|||||||||
|
Dividends declared per common share
|
$
|
1.32
|
|
$
|
1.15
|
|
$
|
1.00
|
|
$
|
0.87
|
|
$
|
0.72
|
|
||||
|
Common stock repurchases
|
$
|
27.6
|
|
$
|
138.1
|
|
$
|
61.6
|
|
$
|
—
|
|
$
|
—
|
|
||||
The selected financial data presented above is subject to the following information:
|
(1)
|
The results from Big Fish Games are included from the date of acquisition on December 16, 2014 through December 31, 2014.
|
|
(2)
|
The results from Oxford are included from the date of acquisition on July 17, 2013 through December 31, 2013.
|
|
(3)
|
The results from Riverwalk are included from the date of acquisition on October 23, 2012 through December 31, 2012.
|
37
|
ITEM 7.
|
MANAGEMENT’S DISCUSSION AND ANALYSIS OF FINANCIAL CONDITION AND RESULTS OF OPERATIONS
|
The following discussion and analysis of our consolidated financial condition and results of operations should be read in conjunction with our audited consolidated financial statements and related notes included in "Item 8-Financial Statements and Supplementary Data".
Our Business
Executive Overview
We are an industry-leading racing, gaming and online entertainment company anchored by our iconic flagship event -
The Kentucky Derby
. We are a leader in brick-and-mortar casino gaming with approximately
9,030
gaming positions in seven states, and we are the largest, legal online account wagering platform for horseracing in the U.S. We are also one of the world's largest producers and distributors of mobile games. We were organized as a Kentucky corporation in 1928, and our principal executive offices are located in Louisville, Kentucky.
Our management monitors a variety of key indicators to evaluate our business results and financial condition. These indicators include changes in net revenue, operating expense, operating income, earnings per share, outstanding debt balance, operating cash flow and capital spend.
Our consolidated financial statements have been prepared in conformity with U.S. generally accepted accounting principles ("U.S. GAAP"). We also use non-GAAP measures, including EBITDA (earnings before interest, taxes, depreciation and amortization) and Adjusted EBITDA. We believe that the use of Adjusted EBITDA as a key performance measure of results of operations enables management and investors to evaluate and compare from period to period our operating performance in a meaningful and consistent manner. Our chief operating decision maker utilizes Adjusted EBITDA to evaluate segment performance, develop strategy and allocate resources. Adjusted EBITDA is a supplemental measure of our performance that is not required by, or presented in accordance with U.S GAAP. Adjusted EBITDA should not be considered as an alternative to, or more meaningful than, net income (as determined in accordance with U.S. GAAP) as a measure of our operating results.
During 2016, we updated our definition of Adjusted EBITDA to exclude changes in Big Fish Games deferred revenue and to exclude depreciation and amortization from our equity investments. The prior year amounts were reclassified to conform to this presentation. We also prospectively implemented a change in accounting estimate for corporate expense allocated to other operating segments to use an activity based allocation rather than a revenue based allocation.
Adjusted EBITDA is defined as earnings before interest, taxes, depreciation and amortization, adjusted for the following:
Adjusted EBITDA includes our portion of the EBITDA from our equity investments.
Adjusted EBITDA excludes:
|
•
|
Acquisition expense, net which includes:
|
|
◦
|
Acquisition-related charges, including fair value adjustments related to earnouts and deferred payments; and
|
|
◦
|
Transaction expense, including legal, accounting and other deal-related expense;
|
|
•
|
Stock-based compensation expense;
|
|
•
|
Gain on Calder land sale;
|
|
•
|
Calder exit costs; and
|
|
•
|
Other charges and recoveries
|
For segment reporting, Adjusted EBITDA includes intercompany revenue and expense totals that are eliminated in the Consolidated Statements of Comprehensive Income. See the Reconciliation of Comprehensive Income to Adjusted EBITDA included in this section for additional information.
Business Highlights
In 2016, we continued to take steps to position ourselves for sustainable value creation over the long term.
|
•
|
We delivered record revenue, net income, diluted EPS, and Adjusted EBITDA.
|
|
•
|
Revenue grew 7.9% to $1.3 billion;
|
|
•
|
Net income grew 65.8% to $108.1 million;
|
38
|
•
|
Diluted net income per share grew 73.0% to $6.42; and
|
|
•
|
Adjusted EBITDA grew 10.6% to $334.5 million.
|
|
•
|
Our Kentucky Derby and Oaks week of events set all time-records for attendance and all sources handle. Our ongoing investment to expand the Derby capacity, pricing, and customer experiences reflects our commitment to growing this iconic event.
|
|
•
|
Our Calder, Miami Valley Gaming and Oxford casino properties delivered strong organic growth. We benefited from a full year of equity income and management fee revenue from our equity investment in Saratoga. In November, we acquired a 25.0% interest in Saratoga’s Black Hawk Casino in Colorado. And, in January 2017, we partnered with Saratoga to acquire the casino and racetrack at Ocean Downs in Maryland.
|
|
•
|
Our TwinSpires.com handle grew to $1.1 billion, up 13.7% compared to 2015 as we outpaced the industry growth by 13.1 percentage points. Our TwinSpires.com handle represented 10.2% of all pari-mutuel industry handle in 2016, up 1.2 percentage points from 2015.
|
|
•
|
Our Big Fish Games segment delivered $486.2 million in bookings, up 7.3% compared to 2015.
Big Fish Casino
maintained its position as the #2 top grossing social casino iOS mobile app in the U.S. and #3 worldwide. We continued to refine our strategic growth plans for Big Fish Games with a renewed focus on disciplined user acquisition spending based on the long term return of investable games, increasing the number of new games in our development pipeline and refining our game development to better enable the ability to scale the audience for our games.
|
|
•
|
We maintained our focus on cost reductions across all properties and continued to be disciplined in our maintenance and project capital expenditures.
|
We accomplished these initiatives while returning approximately $58.0 million to shareholders through dividends and share repurchases.
As we look to 2017 and beyond, we remain committed to delivering long-term sustainable growth and strong financial results for our shareholders. We have strong cash flow and a solid balance sheet that supports organic growth as well as other strategic acquisitions and investment opportunities that will create additional long-term value for our shareholders in the coming years.
Our Operations
We manage our operations through six operating segments: Racing, Casinos, TwinSpires, Big Fish Games, Other Investments and Corporate.
Refer to Item 1. Business for more information on our operating segments and a description of our competition and government regulations and potential legislative changes that affect our business.
Consolidated Financial Results
The following table reflects our net revenue, operating income, net income, Adjusted EBITDA, and certain other financial information:
|
Years Ended December 31,
|
'16 vs. '15 Change
|
'15 vs. '14 Change
|
|||||||||||||||||
|
(in millions)
|
2016
|
2015
|
2014
|
||||||||||||||||
|
Net revenue
|
$
|
1,308.6
|
|
$
|
1,212.3
|
|
$
|
812.2
|
|
$
|
96.3
|
|
$
|
400.1
|
|
||||
|
Operating income
|
194.2
|
|
123.6
|
|
90.4
|
|
70.6
|
|
33.2
|
|
|||||||||
|
Operating income margin
|
14.8%
|
|
10.2%
|
|
11.1%
|
|
|
|
|
||||||||||
|
Net income
|
$
|
108.1
|
|
$
|
65.2
|
|
$
|
46.4
|
|
$
|
42.9
|
|
$
|
18.8
|
|
||||
|
Adjusted EBITDA
|
334.5
|
|
302.5
|
|
204.1
|
|
32.0
|
|
98.4
|
|
|||||||||
Year Ended December 31, 2016, Compared to the Year Ended December 31, 2015
|
•
|
Our net revenue increased $96.3 million driven primarily by a $72.5 million increase from Big Fish Games primarily from casual and mid-core free-to-play game growth, a $20.4 million increase from TwinSpires due to a 13.7% increase in handle, a $3.1 million increase in Racing due to a strong Kentucky Derby and Oaks week performance and a $0.3 million net increase in other revenue.
|
|
•
|
Our operating income increased $70.6 million driven by a $26.6 million increase in our segment operating income primarily from TwinSpires handle growth, growth in our casual and mid-core free-to-play Big Fish Games, a strong Kentucky Derby and Oaks week and from Casinos revenue growth and operational efficiencies, a $23.7 million gain
|
39
on sale of Calder excess land, an $18.3 million reduction of acquisition expenses primarily related to the Big Fish Games acquisition and an $11.4 million decrease in Calder exit costs. Partially offsetting these improvements was a $9.4 million increase in selling, general and administrative expense.
|
•
|
Our net income increased $42.9 million driven by a $70.6 million increase in operating income and a $6.2 million increase in income from our equity investments and $0.1 million of other income. Partially offsetting these increases were a $15.1 million increase in net interest expense associated with higher outstanding debt balances, a $13.1 million increase in our income tax provision primarily from higher operating income from our segments and $5.8 million gain in 2015 from the sale of our remaining HRTV investment.
|
|
•
|
Our Adjusted EBITDA increased $32.0 million driven by a $10.9 million increase in Casinos as a result of our MVG and SCH investments, as well as organic growth and operational efficiencies within certain owned properties, a $10.6 million increase from Big Fish Games driven by the growth in our casual and mid-core free-to-play games, a $7.9 million increase from Racing primarily associated with Churchill Downs, and a $6.6 million increase from TwinSpires as a result of handle growth. Partially offsetting these increases were a $3.8 million increase in Corporate expenses driven primarily by a non-recurring 2015 benefit associated with our deferred compensation program and a $0.2 million decline from our Other Investments.
|
Year Ended December 31, 2015, Compared to the Year Ended December 31, 2014
|
•
|
Our net revenue increased $400.1 million in 2015 driven by $399.8 million from the full year impact of the Big Fish Games acquisition, $9.2 million from our TwinSpires segment due to a 7.5% increase in handle and $4.6 million from our Casinos segment as improvements at our Maine, Louisiana and Florida properties were partially offset by regional weakness in Mississippi. Partially offsetting these increases was a $13.4 million decline in Racing revenue as the cessation of Calder's pari-mutuel operations and declines at Arlington due to reductions of state purse subsidies more than offset higher revenue from a strong Kentucky Oaks and Kentucky Derby week, as well as a $0.1 million decrease in other revenue.
|
|
•
|
Our operating income increased $33.2 million in 2015 driven by a $18.9 million increase from the full year impact of the Big Fish Games acquisition, a $18.5 million increase from our Racing segment and a $4.5 million increase from TwinSpires as a result of a successful Kentucky Oaks and Kentucky Derby week and the effect of a strong Triple Crown season, a $9.5 million increase from Casinos as a result of revenue growth and operational cost savings at most of our casino properties, a $6.4 million decrease in acquisition-related expenses from Big Fish Games that did not recur in 2015 and a $5.5 million decrease from Luckity and Capital View Casino & Resort ("Capital View") non-cash impairment charges in 2014 that did not recur in 2015. Partially offsetting these improvements were an $11.6 million increase in incremental Calder exit costs, a $17.9 million increase in non-cash Big Fish Games acquisition expenses associated with fair value adjustments to the liabilities for the earnout and deferred payments to the founders and a $0.6 million increase in other expense.
|
|
•
|
Our net income increased $18.8 million in 2015 driven by a $33.2 million increase in operating income as discussed above, a $4.9 million increase in income from our equity investments and a $5.8 million gain from the sale of our remaining HRTV investment. Partially offsetting these increases were $7.8 million of additional interest expense associated with higher outstanding debt balances, $11.5 million of additional income tax expense associated with the increase in income from operations, $5.3 million of additional income tax expense as a result of certain non-deductible Big Fish Games acquisition expense and $0.5 million of other expense.
|
|
•
|
Our Adjusted EBITDA increased $98.4 million in 2015 driven by a $69.2 million increase from the full year impact of the Big Fish Games acquisition, a $10.6 million increase from Racing as strong Kentucky Oaks and Kentucky Derby week revenue growth and cost reductions to offset lower revenue at Calder and Arlington, an $8.8 million increase from TwinSpires as a result of increased handle and lower expense, a $7.7 million increase from Casinos as a result of organic growth and cost reductions, a $1.3 million increase in Other Investments primarily due to United Tote operations and a $0.8 million decrease in Corporate expense.
|
40
Financial Results by Segment
Net Revenue by Segment
The following table presents net revenue for our operating segments, including intercompany revenue:
|
Years Ended December 31,
|
'16 vs. '15 Change
|
'15 vs. '14 Change
|
|||||||||||||||||
|
(in millions)
|
2016
|
2015
|
2014
|
||||||||||||||||
|
Racing:
|
|
|
|
|
|||||||||||||||
|
Churchill Downs
|
$
|
165.2
|
|
$
|
158.9
|
|
$
|
150.2
|
|
$
|
6.3
|
|
$
|
8.7
|
|
||||
|
Arlington
|
60.8
|
|
59.5
|
|
66.1
|
|
1.3
|
|
(6.6
|
)
|
|||||||||
|
Fair Grounds
|
39.5
|
|
41.1
|
|
39.7
|
|
(1.6
|
)
|
1.4
|
|
|||||||||
|
Calder
|
2.6
|
|
2.7
|
|
20.0
|
|
(0.1
|
)
|
(17.3
|
)
|
|||||||||
|
Total Racing
|
268.1
|
|
262.2
|
|
276.0
|
|
5.9
|
|
(13.8
|
)
|
|||||||||
|
Casinos:
|
|
|
|
|
|||||||||||||||
|
Oxford Casino
|
84.6
|
|
80.4
|
|
76.5
|
|
4.2
|
|
3.9
|
|
|||||||||
|
Riverwalk Casino
|
46.1
|
|
49.8
|
|
50.1
|
|
(3.7
|
)
|
(0.3
|
)
|
|||||||||
|
Harlow's Casino
|
48.4
|
|
49.0
|
|
50.2
|
|
(0.6
|
)
|
(1.2
|
)
|
|||||||||
|
Calder Casino
|
79.1
|
|
77.4
|
|
77.0
|
|
1.7
|
|
0.4
|
|
|||||||||
|
Fair Grounds Slots
|
36.9
|
|
39.0
|
|
40.8
|
|
(2.1
|
)
|
(1.8
|
)
|
|||||||||
|
VSI
|
36.9
|
|
36.9
|
|
33.7
|
|
—
|
|
3.2
|
|
|||||||||
|
Saratoga
|
0.8
|
|
0.4
|
|
—
|
|
0.4
|
|
0.4
|
|
|||||||||
|
Total Casino
|
332.8
|
|
332.9
|
|
328.3
|
|
(0.1
|
)
|
4.6
|
|
|||||||||
|
TwinSpires
|
221.9
|
|
201.3
|
|
192.0
|
|
20.6
|
|
9.3
|
|
|||||||||
|
Big Fish Games:
|
|||||||||||||||||||
|
Social casino
|
182.5
|
|
193.4
|
|
7.6
|
|
(10.9
|
)
|
185.8
|
|
|||||||||
|
Casual and mid-core free-to-play
|
212.7
|
|
125.3
|
|
2.1
|
|
87.4
|
|
123.2
|
|
|||||||||
|
Premium
|
91.0
|
|
95.0
|
|
4.2
|
|
(4.0
|
)
|
90.8
|
|
|||||||||
|
Total Big Fish Games
|
486.2
|
|
413.7
|
|
13.9
|
|
72.5
|
|
399.8
|
|
|||||||||
|
Other Investments
|
20.8
|
|
20.1
|
|
20.6
|
|
0.7
|
|
(0.5
|
)
|
|||||||||
|
Corporate
|
1.0
|
|
0.9
|
|
1.1
|
|
0.1
|
|
(0.2
|
)
|
|||||||||
|
Eliminations
|
(22.2
|
)
|
(18.8
|
)
|
(19.7
|
)
|
(3.4
|
)
|
0.9
|
|
|||||||||
|
Net Revenue
|
$
|
1,308.6
|
|
$
|
1,212.3
|
|
$
|
812.2
|
|
$
|
96.3
|
|
$
|
400.1
|
|
||||
Year Ended December 31, 2016, Compared to the Year Ended December 31, 2015
|
•
|
Racing revenue increased $5.9 million due to a $6.3 million increase at Churchill Downs primarily due to a successful Kentucky Derby and Oaks week and a $1.3 million increase at Arlington due to an additional 37 host days during 2016 as compared to 2015. Partially offsetting these increases was a decrease of $1.7 million primarily at Fair Grounds driven by five fewer race days.
|
|
•
|
Casino revenue decreased $0.1 million due to a $3.7 million decrease at Riverwalk resulting from a loss of market share within an overall declining market, a $2.1 million decrease at Fair Grounds Slots as it maintained market share despite a decline in the overall New Orleans gaming market associated with stronger competition from the Mississippi Gulf Coast gaming market and a $0.6 million decrease at Harlow's due to a declining market which was negatively impacted by adverse weather conditions during 2016. Partially offsetting these decreases were a $4.2 million increase in Oxford due to successful promotional activities, favorable weather conditions and strong local economy, a $1.7 million increase at Calder Casino due to growth in the overall market as well as successful marketing and promotional activities and a $0.4 million increase at Saratoga from a full year of management fee revenue in 2016.
|
|
•
|
TwinSpires revenue increased $20.6 million primarily due to a 23.3% increase in active players who were acquired from marketing efforts primarily during big horse racing events. Handle growth of $131.8 million, or 13.7%, outpaced the U.S. thoroughbred industry performance by 13.1 percentage points.
|
41
|
•
|
Big Fish Games revenue increased $72.5 million primarily driven by an $87.4 million increase in casual and mid-core free-to-play revenue from multiple games as compared to the prior year. Partially offsetting this increase were a $4.0 million decrease in premium revenue from a reduction in game club redemptions and expirations and a $10.9 million decrease in social casino revenue associated with a reduction in bookings.
|
|
•
|
Other Investments revenue increased $0.7 million at United Tote due to incremental international equipment sales and higher totalisator fees from new customers.
|
|
•
|
Eliminations increased $3.4 million driven primarily by higher Churchill Downs intercompany revenue from increased wagering by TwinSpires customers on Kentucky Derby and Oaks week.
|
Year Ended December 31, 2015, Compared to the Year Ended December 31, 2014
|
•
|
Racing revenue decreased $13.8 million in 2015 driven by a $17.3 million decline in Calder revenue as a result of the July 1, 2014 cessation of pari-mutuel operations that was partially offset by rental income for the use of Calder's racetrack facilities. Arlington decreased $6.6 million due to twelve fewer live race days, smaller field sizes, fewer races per day and inclement weather for the Arlington Million which led to a decline in attendance, pari-mutuel wagering and other operational-based revenue. Partially offsetting these declines were an $8.7 million increase in Churchill Downs revenue primarily related to a successful Kentucky Oaks and Kentucky Derby week and a $1.4 million increase in Fair Grounds revenue from a 7.5% increase in handle.
|
|
•
|
Casinos revenue increased $4.6 million in 2015 driven by $3.9 million from Oxford due to successful promotional activities, a strengthening market and improvements in market share; $3.2 million from VSI due to the installation of upgraded video poker machines and the improved performance of OTB facilities that are not included within the Orleans Parish smoking ban limits; and a $0.8 million increase from Saratoga and Calder revenue. Partially offsetting these increases was a $1.8 million decline in Fair Grounds Slots revenue which was negatively impacted by a smoking ban in Orleans Parish which commenced on April 22, 2015 and a $1.5 million decline in our Mississippi properties as a result of aggressive competitors' offerings.
|
|
•
|
TwinSpires revenue increased $9.3 million in 2015, primarily driven by a $12.3 million increase in pari-mutuel and other revenue due to a 7.5% increase in TwinSpires.com handle compared to the industry increase of 1.2% for the period. The increase was partially offset by a $2.4 million decline as the result of the cancellation of a low-margin, third-party administrative call center services agreement during the fourth quarter of 2014 as well as a decline of $0.6 million due to the cessation of the print edition of
BLUFF
Magazine during January 2015.
|
|
•
|
Big Fish Games revenue increased $399.8 million in 2015 driven by the full year impact of the Big Fish Games acquisition. Big Fish Games net revenue includes amounts recognized from its social casino games, casual and mid-core free-to-play games and premium paid games.
|
|
•
|
Other Investments revenue decreased $0.5 million in 2015 due to lower revenue at United Tote.
|
|
•
|
Eliminations decreased $0.9 million in 2015 driven by lower intercompany transactions between Racing and United Tote.
|
42
Additional Statistical Data by Segment
The following tables provide additional statistical data for our segments:
Racing and TwinSpires
(1)
|
Years Ended December 31,
|
|||||||||||
|
(in millions)
|
2016
|
2015
|
2014
|
||||||||
|
Racing
|
|||||||||||
|
Churchill Downs
|
|||||||||||
|
Race days
|
70
|
|
70
|
|
74
|
|
|||||
|
Total handle
|
$
|
593.7
|
|
$
|
585.2
|
|
$
|
580.1
|
|
||
|
Net pari-mutuel revenue
|
$
|
61.5
|
|
$
|
60.9
|
|
$
|
60.1
|
|
||
|
Commission %
|
10.4
|
%
|
10.4
|
%
|
10.4
|
%
|
|||||
|
Arlington
|
|||||||||||
|
Race days
|
74
|
|
77
|
|
89
|
|
|||||
|
Total handle
|
$
|
375.2
|
|
$
|
373.8
|
|
$
|
458.8
|
|
||
|
Net pari-mutuel revenue
|
$
|
48.2
|
|
$
|
46.0
|
|
$
|
53.1
|
|
||
|
Commission %
|
12.8
|
%
|
12.3
|
%
|
11.6
|
%
|
|||||
|
Calder
(2)
|
|||||||||||
|
Race days
|
—
|
|
—
|
|
79
|
|
|||||
|
Total handle
|
$
|
—
|
|
$
|
—
|
|
$
|
155.8
|
|
||
|
Net pari-mutuel revenue
|
$
|
—
|
|
$
|
—
|
|
$
|
16.9
|
|
||
|
Commission %
|
NM
|
|
NM
|
|
10.9
|
%
|
|||||
|
Fair Grounds
|
|||||||||||
|
Race days
|
78
|
|
83
|
|
82
|
|
|||||
|
Total handle
|
$
|
289.5
|
|
$
|
296.9
|
|
$
|
276.1
|
|
||
|
Net pari-mutuel revenue
|
$
|
29.3
|
|
$
|
30.4
|
|
$
|
29.1
|
|
||
|
Commission %
|
10.1
|
%
|
10.2
|
%
|
10.5
|
%
|
|||||
|
Total Racing
|
|||||||||||
|
Race days
|
222
|
|
230
|
|
324
|
|
|||||
|
Total handle
|
$
|
1,258.4
|
|
$
|
1,255.9
|
|
$
|
1,470.8
|
|
||
|
Net pari-mutuel revenue
|
$
|
139.0
|
|
$
|
137.3
|
|
$
|
159.2
|
|
||
|
Commission %
|
11.0
|
%
|
10.9
|
%
|
10.8
|
%
|
|||||
|
TwinSpires.com
|
|||||||||||
|
Total handle
|
$
|
1,096.9
|
|
$
|
965.1
|
|
$
|
897.7
|
|
||
|
Net pari-mutuel revenue
|
$
|
201.8
|
|
$
|
183.6
|
|
$
|
172.2
|
|
||
|
Commission %
|
18.4
|
%
|
19.0
|
%
|
19.2
|
%
|
|||||
|
Eliminations
(3)
|
|||||||||||
|
Total handle
|
$
|
(128.4
|
)
|
$
|
(106.0
|
)
|
$
|
(112.7
|
)
|
||
|
Net pari-mutuel revenue
|
$
|
(16.6
|
)
|
$
|
(14.0
|
)
|
$
|
(14.5
|
)
|
||
|
Total
|
|||||||||||
|
Handle
|
$
|
2,226.9
|
|
$
|
2,115.0
|
|
$
|
2,255.8
|
|
||
|
Net pari-mutuel revenue
|
$
|
324.2
|
|
$
|
306.9
|
|
$
|
316.9
|
|
||
|
Commission %
|
14.6
|
%
|
14.5
|
%
|
14.0
|
%
|
|||||
|
(1)
|
Total handle and net pari-mutuel revenue generated by Velocity are not included in total handle and net pari-mutuel revenue from TwinSpires.com.
|
|
(2)
|
Calder ceased pari-mutuel operations on July 1, 2014.
|
|
(3)
|
Eliminations include the elimination of intersegment transactions.
|
43
Casinos Activity
Certain key operating statistics specific to the gaming industry are included in our statistical data for our Casinos segment. Our slot facilities report slot handle as a volume measurement, defined as the gross amount wagered or cash and tickets placed into slot machines in the aggregate for the period cited. Net gaming revenue includes slot and table games revenue and is net of customer freeplay; however, it excludes other ancillary property revenue such as food and beverage, ATM, hotel and other miscellaneous revenue.
|
Years Ended December 31,
|
|||||||||||
|
(in millions)
|
2016
|
2015
|
2014
|
||||||||
|
Oxford Casino
|
|||||||||||
|
Slot handle
|
$
|
774.0
|
|
$
|
722.6
|
|
$
|
675.4
|
|
||
|
Net slot revenue
|
64.9
|
|
62.1
|
|
58.4
|
|
|||||
|
Net gaming revenue
|
80.4
|
|
76.5
|
|
72.7
|
|
|||||
|
Riverwalk Casino
|
|||||||||||
|
Slot handle
|
$
|
485.6
|
|
$
|
522.2
|
|
$
|
508.7
|
|
||
|
Net slot revenue
|
38.7
|
|
42.5
|
|
43.6
|
|
|||||
|
Net gaming revenue
|
43.7
|
|
47.2
|
|
47.4
|
|
|||||
|
Harlow’s Casino
|
|||||||||||
|
Slot handle
|
$
|
535.1
|
|
$
|
538.6
|
|
$
|
554.9
|
|
||
|
Net slot revenue
|
42.0
|
|
42.6
|
|
43.3
|
|
|||||
|
Net gaming revenue
|
45.7
|
|
46.4
|
|
47.6
|
|
|||||
|
Calder Casino
|
|||||||||||
|
Slot handle
|
$
|
1,044.7
|
|
$
|
986.2
|
|
$
|
961.1
|
|
||
|
Net slot revenue
|
75.8
|
|
74.4
|
|
73.2
|
|
|||||
|
Net gaming revenue
|
75.7
|
|
74.3
|
|
74.0
|
|
|||||
|
Fair Grounds Slots and Video Poker
|
|||||||||||
|
Slot handle
|
$
|
405.5
|
|
$
|
417.1
|
|
$
|
428.0
|
|
||
|
Net slot revenue
|
35.8
|
|
38.0
|
|
39.6
|
|
|||||
|
Net gaming revenue
|
72.5
|
|
74.7
|
|
73.1
|
|
|||||
|
Total net gaming revenue
|
$
|
318.0
|
|
$
|
319.1
|
|
$
|
314.8
|
|
||
Big Fish Games
Our key operating statistic specific to Big Fish Games is bookings. Bookings represent the amount of virtual currency, virtual goods or premium games that consumers have purchased through third party app stores or the Big Fish Games website.
|
Years Ended December 31,
|
|||||||||||
|
(in millions)
|
2016
|
2015
|
2014
(1)
|
||||||||
|
Bookings
|
|||||||||||
|
Social casino
|
$
|
182.3
|
|
$
|
193.0
|
|
$
|
9.0
|
|
||
|
Casual and mid-core free-to-play
|
211.0
|
|
151.2
|
|
3.8
|
|
|||||
|
Premium
|
92.9
|
|
109.0
|
|
5.6
|
|
|||||
|
Total bookings
|
$
|
486.2
|
|
$
|
453.2
|
|
$
|
18.4
|
|
||
|
(1)
|
We completed the acquisition of Big Fish Games on December 16, 2014.
|
44
Consolidated Operating Expense
The following table is a summary of our consolidated operating expense:
|
Years Ended December 31,
|
'16 vs. '15 Change
|
'15 vs. '14 Change
|
|||||||||||||||||
|
(in millions)
|
2016
|
2015
|
2014
|
||||||||||||||||
|
Taxes & purses
|
$
|
186.8
|
|
$
|
184.1
|
|
$
|
189.9
|
|
$
|
2.7
|
|
$
|
(5.8
|
)
|
||||
|
Platform & development fees
|
179.9
|
|
143.6
|
|
5.1
|
|
36.3
|
|
138.5
|
|
|||||||||
|
Marketing & advertising
|
151.0
|
|
130.7
|
|
28.8
|
|
20.3
|
|
101.9
|
|
|||||||||
|
Salaries & benefits
|
137.0
|
|
132.2
|
|
120.3
|
|
4.8
|
|
11.9
|
|
|||||||||
|
Depreciation and amortization
|
108.6
|
|
109.7
|
|
68.3
|
|
(1.1
|
)
|
41.4
|
|
|||||||||
|
Content expense
|
103.0
|
|
95.3
|
|
93.7
|
|
7.7
|
|
1.6
|
|
|||||||||
|
Selling, general and administrative expense
|
100.2
|
|
90.8
|
|
76.0
|
|
9.4
|
|
14.8
|
|
|||||||||
|
Research & development
|
39.0
|
|
39.4
|
|
—
|
|
(0.4
|
)
|
39.4
|
|
|||||||||
|
Acquisition expense, net
|
3.4
|
|
21.7
|
|
10.2
|
|
(18.3
|
)
|
11.5
|
|
|||||||||
|
Calder exit costs
|
2.5
|
|
13.9
|
|
2.3
|
|
(11.4
|
)
|
11.6
|
|
|||||||||
|
Gain on Calder land sale
|
(23.7
|
)
|
—
|
|
—
|
|
(23.7
|
)
|
—
|
|
|||||||||
|
Other operating expense
|
126.7
|
|
127.3
|
|
127.2
|
|
(0.6
|
)
|
0.1
|
|
|||||||||
|
Total expense
|
$
|
1,114.4
|
|
$
|
1,088.7
|
|
$
|
721.8
|
|
$
|
25.7
|
|
$
|
366.9
|
|
||||
|
Percent of revenue
|
85
|
%
|
90
|
%
|
89
|
%
|
|||||||||||||
Year Ended December 31, 2016, Compared to the Year Ended December 31, 2015
Significant items affecting comparability of consolidated operating expense include:
|
•
|
Taxes and purses increased $2.7 million due to a $1.1 million increase in casino gaming taxes as a result of casino revenue growth at Oxford, a $0.9 million increase in purses primarily associated with 37 additional host days at Arlington and a $0.7 million increase in pari-mutuel taxes primarily related to TwinSpires.
|
|
•
|
Platform and development fees at Big Fish Games increased $36.3 million driven by the $72.5 million increase in Big Fish Games revenues.
|
|
•
|
Marketing and advertising expense increased $20.3 million relating to an increase in Big Fish Games user acquisition expense primarily associated with casual and mid-core free-to-play games.
|
|
•
|
Salaries and benefits expense increased $4.8 million primarily driven by a $2.7 million increase in additional personnel costs added at Big Fish Games to support the growth in the business, a $1.6 million increase in contract services related to Churchill Downs and a $0.5 million increase in other expense.
|
|
•
|
Depreciation and amortization expense decreased $1.1 million driven primarily by a $1.9 million decrease at Calder associated with fully depreciated assets, which was partially offset by a $0.8 million increase in expense in our other segments.
|
|
•
|
Content expense increased $7.7 million driven by a $7.1 million increase in third-party pari-mutuel content fees at TwinSpires associated with an increase in handle and a $0.6 million increase in other expense.
|
|
•
|
Selling, general and administrative expense increased $9.4 million driven primarily by a $5.1 million increase in stock-based compensation expense, a $1.5 million expense within our Casino segment arising from potential tax penalties associated with the untimely submission of certain informational tax returns, a $1.1 million increase in professional fees, an increase of $0.9 million in employee benefits for severance and relocation expenses and a $0.8 million increase in other expenses.
|
|
•
|
Research and development expense decreased $0.4 million resulting from higher capitalized payroll related to Big Fish Games software development expense.
|
|
•
|
Acquisition expense, net decreased $18.3 million driven by a decrease of $16.0 million as a result of the non-cash fair value adjustments related to the liabilities for the Big Fish Games earnout and deferred payments to the founders in 2016 compared to 2015 and a $2.3 million benefit recognized in 2016 related to the elimination of a contingent liability established in 2012 for the acquisition of Bluff.
|
45
|
•
|
Calder exit costs decreased $11.4 million due to the 2015 non-cash impairment of $12.7 million to reduce the net book value of Calder’s grandstand and ancillary facilities to zero, partially offset by an increase in ongoing grandstand demolition costs of $1.3 million during 2016 compared to 2015.
|
|
•
|
Gain on Calder land sale increased $23.7 million from the sale of 61 acres of excess land at Calder, which represents proceeds of $25.6 million less the book value $1.9 million.
|
|
•
|
Other operating expense decreased $0.6 million in 2016. Other operating expense includes utilities, maintenance, food and beverage costs, property taxes and insurance and other operating expense. Insurance and property taxes decreased $4.0 million primarily from the cessation of pari-mutuel racing and demolition of property at Calder. Partially offsetting the decrease was a $1.7 million increase in TwinSpires third party processing expense related to handle growth and a $1.7 million increase in corporate deferred compensation expense.
|
Year Ended December 31, 2015, Compared to the Year Ended December 31, 2014
Significant items affecting comparability of consolidated operating expense include:
|
•
|
Taxes and purses decreased $5.8 million in 2015 primarily as a result of an $8.2 million decline in Calder expense related to the cessation of racing operations. Partially offsetting this decline was a $2.4 million increase in casino gaming taxes as a result of 1.4% casino revenue growth.
|
|
•
|
Platform and development fees increased $138.5 million in 2015 related to digital storefronts and third-party game developers' expenditures based on Big Fish Games revenue.
|
|
•
|
Marketing and advertising expense increased $101.9 million in 2015 driven primarily by additional user acquisition and advertising expense from the full year impact of Big Fish Games.
|
|
•
|
Salaries and benefit expense increased $11.9 million in 2015 driven by $19.7 million of additional expense from the full year impact of Big Fish Games. Partially offsetting this increase was a $3.4 million decline in Calder salaries and benefit expense due to the cessation of pari-mutuel racing and the closure of its poker room and a $4.4 million reduction in salaries across our other segments in response to moderating revenue growth.
|
|
•
|
Depreciation and amortization expense increased $41.4 million in 2015 driven by $49.5 million of additional expense associated with the Big Fish Games acquisition. Partially offsetting this increase was a $3.4 million reduction in depreciation expense at Calder as certain gaming assets were fully depreciated during 2014, $4.2 million in depreciation expense at Calder from the cessation of pari-mutuel operation and $0.5 million of other expense reductions.
|
|
•
|
Content expense increased $1.6 million in 2015 driven by a $5.0 million increase in fees incurred to import third-party pari-mutuel content for our Racing and TwinSpires segments. Partially offsetting this increase was a $3.4 million decline in Calder content expense due to the cessation of pari-mutuel racing and favorable terms obtained under the Calder agreement with TSG.
|
|
•
|
Selling, general and administrative expense increased $14.8 million in 2015 driven by $14.4 million of additional expense from the full year impact of Big Fish Games, $2.0 million of increased annual bonus compensation expense due to our financial performance and $1.0 million of other expense. Partially offsetting these increases were $1.4 million decline in Calder expense due to the cessation of pari-mutuel racing and a $1.2 million decline in corporate contributions and legal expense related to prior year matters which did not recur.
|
|
•
|
Research and development expense increased $39.4 million in 2015 driven by studio and engineering functions salary and benefit related expense from the full year impact of Big Fish Games.
|
|
•
|
Acquisition expense, net increased $11.5 million in 2015 as a result of the non-cash fair value adjustments related to the liabilities for the Big Fish Games earnout and deferred payments to the founders.
|
|
•
|
Calder exit costs increased $11.6 million in 2015 due to $12.7 million of non-cash impairment charges to reduce the net book value of Calder's grandstand and ancillary facilities to zero, partially offset by a decrease in demolition and exit costs at Calder of $1.1 million.
|
|
•
|
Other operating expense increased $0.1 million in 2015. Other operating expense includes utilities, maintenance, food and beverage costs, property taxes and insurance and other operating expense. The increase was driven by $14.4 million of additional expense from the full year impact of Big Fish Games and $0.2 million of other expense. Partially offsetting these increases were declines of $3.4 million at Calder due to the cessation of pari-mutuel racing, $3.2 million related to 2014 Luckity asset impairment charges that did not recur in 2015, $3.1 million in casino operational efficiencies, $2.3 million in TwinSpires contract service expense, $1.7 million in corporate deferred compensation expense related to prior periods and $0.8 million in Racing and United Tote bad debt recoveries.
|
46
Corporate Allocated Expense
On January 1, 2016, we prospectively implemented a change in accounting estimate for corporate expense allocated to other operating segments to use an activity based allocation rather than a revenue based allocation. Excluding corporate stock-based compensation, the table below presents Corporate allocated expense included in the Adjusted EBITDA of each of the operating segments:
|
Years Ended December 31,
|
'16 vs. '15 Change
|
'15 vs. '14 Change
|
|||||||||||||||||
|
(in millions)
|
2016
|
2015
|
2014
|
||||||||||||||||
|
Racing
|
$
|
(6.0
|
)
|
$
|
(6.6
|
)
|
$
|
(6.8
|
)
|
$
|
0.6
|
|
$
|
0.2
|
|
||||
|
Casinos
|
(6.9
|
)
|
(8.4
|
)
|
(8.1
|
)
|
1.5
|
|
(0.3
|
)
|
|||||||||
|
TwinSpires
|
(5.4
|
)
|
(5.0
|
)
|
(4.8
|
)
|
(0.4
|
)
|
(0.2
|
)
|
|||||||||
|
Big Fish Games
|
(2.8
|
)
|
(3.0
|
)
|
—
|
|
0.2
|
|
(3.0
|
)
|
|||||||||
|
Other Investments
|
(1.6
|
)
|
(0.5
|
)
|
(0.5
|
)
|
(1.1
|
)
|
—
|
|
|||||||||
|
Corporate allocated expense
|
22.7
|
|
23.5
|
|
20.2
|
|
(0.8
|
)
|
3.3
|
|
|||||||||
|
Total Corporate allocated expense
|
$
|
—
|
|
$
|
—
|
|
$
|
—
|
|
$
|
—
|
|
$
|
—
|
|
||||
Adjusted EBITDA
We believe that the use of Adjusted EBITDA as a key performance measure of the results of operations enables management and investors to evaluate and compare from period to period our operating performance in a meaningful and consistent manner. Adjusted EBITDA is a supplemental measure of our performance that is not required by or presented in accordance with U.S. GAAP. Adjusted EBITDA should not be considered as an alternative to, or more meaningful than, net income (as determined in accordance with U.S. GAAP) as a measure of our operating results.
During 2016, we updated our definition of Adjusted EBITDA to exclude changes in Big Fish Games deferred revenue and to exclude depreciation and amortization from our equity investments. We also reclassified expense from our I-Gaming and Bluff Media operations from Other Investments to TwinSpires. The prior year amounts were reclassified to conform to this presentation. We also prospectively implemented a change in accounting estimate for corporate expense allocated to other operating segments to use an activity based allocation rather than a revenue based allocation.
|
Year Ended December 31,
|
'16 vs. '15 Change
|
'15 vs. '14 Change
|
|||||||||||||||||
|
(in millions)
|
2016
|
2015
|
2014
|
||||||||||||||||
|
Racing
|
$
|
79.7
|
|
$
|
71.8
|
|
$
|
61.2
|
|
$
|
7.9
|
|
$
|
10.6
|
|
||||
|
Casinos
|
125.8
|
|
114.9
|
|
107.2
|
|
10.9
|
|
7.7
|
|
|||||||||
|
TwinSpires
|
55.2
|
|
48.6
|
|
39.8
|
|
6.6
|
|
8.8
|
|
|||||||||
|
Big Fish Games
|
79.1
|
|
68.5
|
|
(0.7
|
)
|
10.6
|
|
69.2
|
|
|||||||||
|
Other Investments
|
2.7
|
|
2.9
|
|
1.6
|
|
(0.2
|
)
|
1.3
|
|
|||||||||
|
Corporate
|
(8.0
|
)
|
(4.2
|
)
|
(5.0
|
)
|
(3.8
|
)
|
0.8
|
|
|||||||||
|
Adjusted EBITDA
|
$
|
334.5
|
|
$
|
302.5
|
|
$
|
204.1
|
|
$
|
32.0
|
|
$
|
98.4
|
|
||||
Year Ended December 31, 2016, Compared to the Year Ended December 31, 2015
|
•
|
Racing Adjusted EBITDA increased $7.9 million due to a $5.2 million increase at Churchill Downs in profitability from the Kentucky Derby and Oaks week driven by increased ticket sales revenue, increased media revenue and record attendance, a $1.8 million increase at Calder from reduced property taxes and insurance savings from the cessation of pari-mutuel operations, a $0.8 million increase at Arlington on higher pari-mutuel revenue associated with 37 additional host days during 2016, a $0.8 million increase at Churchill Downs from non-Kentucky Derby and Oaks week handle increases during the racing meets and a $0.6 million increase from a decrease in corporate allocated expense. Partially offsetting these improvements was a $1.3 million decrease at Fair Grounds from a decline in revenue associated with five fewer live race days in 2016 and unfavorable development of general liability insurance claims.
|
|
•
|
Casinos Adjusted EBITDA increased $10.9 million driven by a $5.1 million increase at Saratoga from a full year of management fee revenue and equity income, a $3.3 million increase at MVG from higher equity income driven primarily by market share growth and higher net revenue from successful promotional activities, a $2.7 million increase at Oxford from a strong regional gaming market and higher market share combined with operational expense efficiencies, a $1.7
|
47
million increase at Calder from the implementation of successful marketing and promotional campaigns and a $1.4 million decrease in corporate expense allocated to the Casinos segment. Partially offsetting these improvements was a $2.0 million decrease at our Mississippi properties due to overall market revenue declines and aggressive local promotional activity and a $1.3 million decrease at Fair Grounds Slots and VSI as strong competition from the Mississippi Gulf Coast gaming market negatively impacted the New Orleans gaming market.
|
•
|
TwinSpires Adjusted EBITDA increased $6.6 million driven by a $7.3 million favorable impact of increased wagering, net of content costs, associated with handle growth of 13.7% and a 23.3% increase in active players, a $1.0 million increase at Velocity driven by handle growth of 7.2% and a $0.4 million increase in other TwinSpires income. These increases were partially offset by a $0.6 million increase in net taxes and purses, which includes the benefit of a $1.7 million Pennsylvania tax refund, and a $1.5 million increase in marketing and advertising primarily associated with the addition and retention of customers acquired during Kentucky Derby and Oaks week.
|
|
•
|
Big Fish Games Adjusted EBITDA increased $10.6 million driven by a $72.5 million increase in revenue primarily from our casual and mid-core free-to-play growth, partially offset by a $36.3 million increase in platform and developer fees, a $20.2 million increase in user acquisition fees and a $5.4 million increase in other expenses.
|
|
•
|
Corporate Adjusted EBITDA decreased $3.8 million driven by a $1.3 million benefit in 2015 related to deferred compensation expense which did not recur in 2016, a $0.9 million increase in salary expense, a $0.8 million decrease in corporate allocated expense, and a $0.8 million increase in professional expense.
|
Year Ended December 31, 2015, Compared to the Year Ended December 31, 2014
|
•
|
Racing Adjusted EBITDA increased $10.6 million in 2015 due to $6.0 million of increased profitability from the Kentucky Oaks and Kentucky Derby week, $3.8 million primarily due to the cessation of Calder pari-mutuel operations, $1.4 million at Churchill Downs outside of Kentucky Oaks and Kentucky Derby week results and $0.3 million at Fair Grounds. Partially offsetting these increases was a $0.9 million decrease at Arlington resulting from lower live and simulcast racing revenue as a result of lower purse sized due to the depletion of the Horse Racing Equity Trust Fund ("HRE Trust Fund") monies in 2014.
|
|
•
|
Casinos Adjusted EBITDA increased $7.7 million in 2015 driven by a $2.7 million increase at Oxford as a result of strong revenue trends, a $2.5 million increase at Riverwalk as a result of disciplined labor and other variable expense reductions, a $1.7 million increase at MVG from growth that was partially offset by new competition, a $1.2 million increase from VSI market share growth, a $0.6 million increase from Calder primarily from freeplay reductions and a $0.7 million increase from Saratoga from management fee income and equity income. Partially offsetting these increases was a $1.7 million decrease at Fair Grounds Slots primarily driven by the impact from the introduction of a parish-wide smoking ban on April 22, 2015.
|
|
•
|
TwinSpires Adjusted EBITDA increased $6.3 million in 2015 driven by $6.0 million primarily from handle growth of 7.5% which outpaced industry performance by 6.3 percentage points as customers continue to migrate to online wagering and $1.3 million from the discontinuation of Luckity, our online real-money bingo operations. These increases were partially offset by $1.0 million in higher marketing expense related to the 2015 Triple Crown Season and Breeders’ Cup, as well as higher New York taxes due to the cancellation of a service agreement.
|
|
•
|
Big Fish Games Adjusted EBITDA increased $69.2 million in 2015 due to the full year impact of the Big Fish Games acquisition which was completed on December 16, 2014. Operating expense reflects a full year of user acquisition costs, advertising and marketing, salaries and benefits and developer and platform fees.
|
|
•
|
Other Investments Adjusted EBITDA increased $3.8 million in 2015 due to a $1.9 million reduction of Internet gaming development expense, $1.3 million from United Tote cost control efforts and bad debt expense recoveries and $0.6 million from the elimination of losses from the cessation of the print edition of
BLUFF
Magazine during January 2015.
|
|
•
|
Corporate Adjusted EBITDA increased $0.8 million in 2015 due to a $1.3 million decrease in deferred compensation expense related to prior periods and $3.3 million in corporate expense allocated to the other operating segments. Partially offsetting these increases were $3.4 million in salaries, benefits and bonus compensation and $0.4 million in increased recruiting and professional fees.
|
48
Reconciliation of Comprehensive Income to Adjusted EBITDA
|
Years Ended December 31,
|
'16 vs. '15 Change
|
'15 vs. '14 Change
|
|||||||||||||||||
|
(in millions)
|
2016
|
2015
|
2014
|
||||||||||||||||
|
Comprehensive income
|
$
|
107.5
|
|
$
|
64.7
|
|
$
|
46.3
|
|
$
|
42.8
|
|
$
|
18.4
|
|
||||
|
Foreign currency translation, net of tax
|
(0.2
|
)
|
0.5
|
|
0.1
|
|
(0.7
|
)
|
0.4
|
|
|||||||||
|
Net change in pension benefits, net of tax
|
0.8
|
|
—
|
|
—
|
|
0.8
|
|
—
|
|
|||||||||
|
Net income
|
108.1
|
|
65.2
|
|
46.4
|
|
42.9
|
|
18.8
|
|
|||||||||
|
Additions:
|
|
|
|
|
|||||||||||||||
|
Depreciation and amortization
|
108.6
|
|
109.7
|
|
68.3
|
|
(1.1
|
)
|
41.4
|
|
|||||||||
|
Interest expense
|
43.7
|
|
28.6
|
|
20.8
|
|
15.1
|
|
7.8
|
|
|||||||||
|
Income tax provision
|
60.0
|
|
46.9
|
|
30.1
|
|
13.1
|
|
16.8
|
|
|||||||||
|
EBITDA
|
320.4
|
|
250.4
|
|
165.6
|
|
70.0
|
|
84.8
|
|
|||||||||
|
|
|
|
|
||||||||||||||||
|
Adjustments to EBITDA:
|
|
|
|
|
|||||||||||||||
|
Selling, general and administrative:
|
|
|
|
|
|||||||||||||||
|
Stock-based compensation expense
|
18.9
|
|
13.8
|
|
11.9
|
|
5.1
|
|
1.9
|
|
|||||||||
|
Other charges
|
2.5
|
|
—
|
|
(0.4
|
)
|
2.5
|
|
0.4
|
|
|||||||||
|
TwinSpires operating expense
|
—
|
|
—
|
|
3.2
|
|
—
|
|
(3.2
|
)
|
|||||||||
|
Other income (expense):
|
|
|
|
|
|||||||||||||||
|
Interest, depreciation and amortization expense related to equity investments
|
10.0
|
|
8.5
|
|
8.7
|
|
1.5
|
|
(0.2
|
)
|
|||||||||
|
Other charges and recoveries, net
|
0.5
|
|
(5.8
|
)
|
2.6
|
|
6.3
|
|
(8.4
|
)
|
|||||||||
|
Acquisition expenses, net
|
3.4
|
|
21.7
|
|
10.2
|
|
(18.3
|
)
|
11.5
|
|
|||||||||
|
Gain on Calder land sale
|
(23.7
|
)
|
—
|
|
—
|
|
(23.7
|
)
|
—
|
|
|||||||||
|
Calder exit costs
|
2.5
|
|
13.9
|
|
2.3
|
|
(11.4
|
)
|
11.6
|
|
|||||||||
|
Total adjustments to EBITDA
|
14.1
|
|
52.1
|
|
38.5
|
|
(38.0
|
)
|
13.6
|
|
|||||||||
|
Adjusted EBITDA
|
$
|
334.5
|
|
$
|
302.5
|
|
$
|
204.1
|
|
$
|
32.0
|
|
$
|
98.4
|
|
||||
Year Ended December 31, 2016, Compared to the Year Ended December 31, 2015
|
•
|
Foreign currency translation, net of tax was favorable by $0.7 million driven by the effect of a stronger U.S. dollar on Big Fish Games international operations.
|
|
•
|
Net change in pension benefits, net of tax increased $0.8 million from a change in estimate associated with our executive pension plan obligation.
|
|
•
|
Depreciation and amortization expense decreased $1.1 million primarily driven by a $1.9 million decrease at Calder associated with fully depreciated racing assets, which was partially offset by a $0.8 million increases in our other segments.
|
|
•
|
Interest expense net increased $15.1 million primarily as a result of higher long-term debt balances outstanding and borrowings under our Senior Secured Credit Facility for payment of the Big Fish Games earnout liability.
|
|
•
|
Income tax provision increased $13.1 million driven by the increase in pretax income partially offset by a benefit from a decrease in our effective tax rate from lower non-deductible acquisition-related charges and the early adoption of a stock-based compensation accounting standard.
|
|
•
|
Stock-based compensation expense increased $5.1 million driven by an increase in retention awards for Big Fish employees and other key resources.
|
|
•
|
Other selling, general and administrative expense increased $2.5 million driven by $1.5 million in potential federal tax penalties from the untimely submission of informational gaming tax returns and a $1.0 million increase in severance and relocation expense at TwinSpires.
|
|
•
|
Interest, depreciation and amortization expense related to equity investments increased $1.5 million driven by amortization expense related to the basis difference between the fair value of property, equipment and definite-lived intangibles from our Saratoga investment.
|
49
|
•
|
Other charges and recoveries, net decreased $6.3 million driven by a 2015 gain of $5.8 million from the sale of our remaining ownership interest in HRTV and $0.5 million in 2016 expenses related to development costs in our Other Investments segment.
|
|
•
|
Acquisition expenses, net decreased $18.3 million driven by a $16.0 million reduction in non-cash fair value adjustments related to the liabilities for Big Fish Games earnout and deferred payments to the founders which were partially paid during 2016 and a $2.3 million reduction in contingent consideration associated with the Bluff acquisition which was deemed unlikely to be paid.
|
|
•
|
Gain on Calder land sale increased $23.7 million from the sale of 61 acres of excess land at Calder.
|
|
•
|
Calder exit costs decreased $11.4 million driven by a $12.7 million decrease in 2015 grandstand non-cash impairment expense which did not recur in 2016, partially offset by a $1.3 million in 2016 expenses, compared to 2015, to prepare the Calder facility for alternative use.
|
Year Ended December 31, 2015, Compared to the Year Ended December 31, 2014
|
•
|
Foreign currency translation, net of tax was unfavorable by $0.3 million driven by the effect of a weaker U.S. dollar on Big Fish Games international operations.
|
|
•
|
Depreciation and amortization expense increased $41.4 million in 2015 driven by $49.5 million of additional expense associated with the Big Fish Games acquisition. Partially offsetting this increase was a $3.4 million reduction in depreciation expense at Calder as certain gaming assets were fully depreciated during 2014, $3.9 million in depreciation expense at Calder from the cessation of pari-mutuel operation and $0.8 million of other expense reductions.
|
|
•
|
Interest expense increased $7.7 million in 2015 primarily as a result of higher long-term debt balances outstanding due to the acquisition of Big Fish Games.
|
|
•
|
Income tax provision increased $16.8 million in 2015 driven by $11.5 million of additional income tax expense associated with the increase in income from operations and $5.3 million of additional income tax expense as a result of certain non-deductible Big Fish Games acquisition expense.
|
|
•
|
Stock-based compensation expense increased $1.9 million in 2015 driven by $6.9 million in incremental restricted stock award expense and $1.3 million in accelerated restricted stock expense upon the September 30, 2015 retirement of our previous Chief Executive Officer. Partially offsetting these increases was a decline of $6.3 million in stock-based compensation expense associated with grants under the 2013 New Company Long Term Incentive Plan that were substantially recognized during 2014.
|
|
•
|
Interest, depreciation and amortization expense related to equity investments decreased $0.2 million in 2015 driven by reduced interest expense associated with lower outstanding MVG debt balances.
|
|
•
|
Other charges and recoveries, net increased $11.6 million in 2015 driven by a $5.8 million gain in 2015 from the sale of our remaining ownership interest in HRTV, $3.2 million in prior year Luckity impairment expense and $2.6 million in prior year impairment expense and equity losses from our unsuccessful attempt to bid on the development of a destination casino and resort in the Capital Region of New York.
|
|
•
|
Acquisition expense, net increased $11.5 million as a result of the non-cash fair value adjustments related to the liabilities for the Big Fish Games earnout and deferred payments to the founders.
|
|
•
|
Calder exit costs increased $11.6 million in 2015 driven by $12.7 million in non-cash impairment charges to reduce the net book value of Calder's grandstand and ancillary facilities to zero, partially offset by a reduction of $1.1 million in 2015, compared to 2014, of barn and grandstand demolition costs in preparation for future use and to achieve operational cost savings.
|
The following table is a summary of our overall financial position:
|
Years Ended December 31,
|
'16 vs. '15 Change
|
||||||||||
|
(in millions)
|
2016
|
2015
|
|||||||||
|
Total assets
|
$
|
2,254.4
|
|
$
|
2,277.4
|
|
$
|
(23.0
|
)
|
||
|
Total liabilities
|
1,569.4
|
|
1,660.2
|
|
(90.8
|
)
|
|||||
|
Total shareholders’ equity
|
685.0
|
|
617.2
|
|
67.8
|
|
|||||
50
|
•
|
Total assets decreased $23.0 million in 2016 driven by a $50.5 million decrease in intangible assets due to 2016 amortization expense, a $25.9 million decrease in unrestricted cash due to the utilization of excess cash to fund share repurchases, term loan payments and a portion of the Big Fish Games earnout payment and a $9.5 million decrease in Big Fish Games goodwill associated with an out-of-period adjustment to correct errors that originated in the purchase price allocation for Big Fish Games. Partially offsetting these decreases was a $16.9 million increase related to prepaids and developer costs, a $13.6 million increase related to timing of accounts receivable receipts, a $13.6 million increase related to the Calder land sale receivable from escrow, a $6.6 million increase related to income tax receivable and a $12.2 million increase in all other assets.
|
|
•
|
Total liabilities decreased $90.8 million driven by a $304.0 million decrease in the Big Fish Games earnout liability and deferred payment to the founders. Partially offsetting this decrease were a $139.9 million increase in our total debt balance as we borrowed under our Senior Secured Credit Facility to fund the Big Fish Games earnout payment, a $26.6 million increase in deferred revenue due to advance billings for the 2017 Kentucky Derby and Oaks events, a $25.2 million increase in deferred taxes, a $14.0 million increase in accounts payable and a $7.5 million increase in all other liabilities.
|
|
•
|
Total shareholders’ equity increased $67.8 million driven by a $108.1 million increase in current year net income, a $19.7 million increase in stock-based compensation which was earned during 2016 and a $1.5 million increase in common shares issued, net of forfeitures. Partially offsetting these increases were a $27.6 million decrease from open-market repurchases of common stock, a $22.1 million decrease from our annual dividend declared, a $11.4 million decrease from repurchases of common stock for payment of taxes owed on vested shares and a $0.4 million decrease in other equity components.
|
Liquidity and Capital Resources
The following table is a summary of our liquidity and cash flows:
|
Year Ended December 31,
|
'16 vs. '15 Change
|
'15 vs. '14 Change
|
|||||||||||||||||
|
(in millions)
|
2016
|
2015
|
2014
|
||||||||||||||||
|
Cash Flows from:
|
|||||||||||||||||||
|
Operating activities
|
$
|
226.8
|
|
$
|
264.5
|
|
$
|
141.6
|
|
$
|
(37.7
|
)
|
$
|
122.9
|
|
||||
|
Investing activities
|
(50.7
|
)
|
(65.5
|
)
|
(440.3
|
)
|
14.8
|
|
374.8
|
|
|||||||||
|
Financing activities
|
(201.9
|
)
|
(190.6
|
)
|
322.0
|
|
(11.3
|
)
|
(512.6
|
)
|
|||||||||
Included in cash flows from investing activities are capital maintenance expenditures and capital project expenditures. Capital maintenance expenditures relate to the replacement of existing fixed assets with a useful life greater than one year that are obsolete, exhausted, or no longer cost effective to repair. Capital project expenditures represent fixed asset additions related to land or building improvements to new or existing assets or purchases of new (non-replacement) equipment or software related to specific projects deemed necessary expenditures.
Year Ended December 31, 2016, Compared to the Year Ended December 31, 2015
|
•
|
Cash provided by operating activities decreased $37.7 million driven by a $39.6 million decrease in the change in deferred revenue associated with Big Fish Games which benefited 2015, and a $19.7 million decrease in the Big Fish Games fair value of the earnout payment in March 2016 related to 2015 earnout milestones. Partially offsetting these decreases were a $19.2 million increase in Kentucky Derby and Oaks deferred revenue related primarily to the timing of advanced ticket sales for the 2017 events and $2.4 million increase in other cash flows. We anticipate that cash flows from operations over the next twelve months will be adequate to fund our business operations and capital expenditures.
|
|
•
|
Cash used in investing activities decreased $14.8 million driven by the $12.0 million in net proceeds from the Calder land sale and the $24.5 million prior year SCH payment for the 25% equity investment for Saratoga's New York facility. Partially offsetting these decreases were an $11.4 million increase in capital project expenditures primarily related to Churchill Downs, $6.0 million of prior year proceeds related to the sale of our remaining investment in HRTV and a $4.3 million increase in all other investing activities.
|
|
•
|
Cash used in financing activities increased $11.3 million driven by $300.0 million associated with our 2015 tack-on unsecured notes offering and a $261.9 outflow in 2016 related to the payment of the Big Fish Games earnout liability. Partially offsetting these increases were $420.4 million change in net repayments under our Senior Secured Credit Facility, $108.5 million less common stock repurchase activity in the current year and $21.7 million in other financing activities.
|
51
Year Ended December 31, 2015, Compared to the Year Ended December 31, 2014
|
•
|
Cash provided by operating activities increased $122.9 million in 2015 due to $106.6 million from Big Fish Games cash flows, $15.3 million of dividends from our equity investments and $1.0 million of other cash flows.
|
|
•
|
Cash used in investing activities decreased $374.8 million in 2015 due to the $366.0 million purchase of Big Fish Games in 2014, $17.4 million in lower funding requirements for our MVG and Capital View joint ventures, $19.4 million in lower capital project expenditures driven by 2014 Churchill Downs projects and $6.0 million of proceeds from the sale of our remaining investment in HRTV. Partially offsetting these increases were the $24.5 million payment for the 25% equity investment in SCH, $8.4 million of increased capital maintenance expenditures driven by the replacement of slot machines at several Casino projects and $1.1 million of other cash flows.
|
|
•
|
Cash used in financing activities increased $512.6 million in 2015 primarily due to $682.8 million change in net repayments under our Senior Secured Credit Facility, $71.0 million in stock repurchases, $17.7 million of payments made to Big Fish Games' equity holders for the receipt of income tax refunds related to the acquisition, $28.5 million in deferred payments related to the Big Fish Games acquisition and $12.6 million in other activities. Partially offsetting these amounts were $300.0 million associated with our tack-on unsecured notes offering.
|
The following table presents our debt outstanding, bond premium and issuance costs:
|
Years Ended December 31,
|
'16 vs. '15 Change
|
||||||||||
|
(in millions)
|
2016
|
2015
|
|||||||||
|
Senior Secured Credit Facility:
|
|||||||||||
|
Senior Secured Credit Facility due 2021
|
$
|
135.0
|
|
$
|
—
|
|
$
|
135.0
|
|
||
|
Term Loan due 2021
|
179.3
|
|
188.7
|
|
(9.4
|
)
|
|||||
|
Swing line of credit
|
13.2
|
|
—
|
|
13.2
|
|
|||||
|
Total Senior Secured Credit Facility
|
327.5
|
|
188.7
|
|
138.8
|
|
|||||
|
5.375% Senior Unsecured Notes due 2021
|
600.0
|
|
600.0
|
|
—
|
|
|||||
|
Total debt
|
927.5
|
|
788.7
|
|
138.8
|
|
|||||
|
Current maturities of long-term debt
|
14.2
|
|
16.2
|
|
(2.0
|
)
|
|||||
|
Total debt, net of current maturities
|
913.3
|
|
772.5
|
|
140.8
|
|
|||||
|
Bond premium and issuance costs, net
|
(5.8
|
)
|
(6.9
|
)
|
1.1
|
|
|||||
|
Net debt
|
$
|
907.5
|
|
$
|
765.6
|
|
$
|
141.9
|
|
||
Senior Secured Credit Facility
On February 17, 2016, we entered into an amendment to our Fourth Amended and Restated Credit Agreement (the "New Agreement") which amends certain provisions of the credit agreement including extending the maturity of both the Senior Secured Credit Facility and the Term Loan (collectively the "Facilities") through February 2021, coterminous with one another. The maximum aggregate commitment for the Senior Secured Credit Facility remains at $500.0 million and the unamortized Term Loan of $188.7 million was refinanced as part of this amendment.
On December 1, 2014, we executed the Fourth Amended and Restated Credit Agreement (the "Senior Secured Credit Facility") whereby it added a $200.0 million Term Loan Facility ("Term Loan") to the existing Senior Secured Credit Facility and amended certain definitions and provisions of the credit agreement including consolidated funded indebtedness, EBITDA and calculation of the total leverage ratio.
Following the execution of the New Agreement, the new maturity date for both the Senior Secured Credit Facility and the Term Loan is February 17, 2021.
Regarding the Term Loan, we were required to make quarterly principal payments that commenced on March 31, 2015, per the amortization schedule laid out in the Fourth Amended and Restated Credit Agreement. Upon the execution of the New Agreement, the amortization schedule was modified based on $188.7 million outstanding Term Loan balance. Payments are set to occur on the last day of each quarter through the new maturity date with annual paydown requirements of 5%, 7.5%, 10%, 12.5%, 15% and a bullet payment due at maturity. The new amortization schedule called for quarterly principal payments of $2.4 million that commenced on March 31, 2016 and increases in increments of $1.2 million on March 31 of each year to reach final year
52
quarterly payment amounts of $7.1 million. If no additional payments are made, the balance due at termination will be $94.4 million.
Generally, borrowings made pursuant to the Senior Secured Credit Facility bear interest at a LIBOR-based rate per annum plus an applicable percentage ranging from 1.125% to 2.5% depending on our total leverage ratio. In addition, under the Senior Secured Credit Facility, we agreed to pay a commitment fee at rates that range from 0.15% to 0.35% of the available aggregate commitment, depending on our total leverage ratio. The Term Loan is not subject to, nor included in the calculation of, the commitment fee. The weighted average interest rate on outstanding borrowings was 2.7% at December 31, 2016 and 1.7% at December 31, 2015.
The Senior Secured Credit Facility contains customary affirmative and negative covenants for credit facilities of this type, including limitations on us and our subsidiaries with respect to indebtedness, restricted payments, liens, investments, mergers and acquisitions, disposition of assets, sale-leaseback transactions and transactions with affiliates. The covenants permit us to use proceeds of the credit extended under the agreement for general corporate purposes, restricted payments and acquisition needs. The Senior Secured Credit Facility also contains financial covenants that require us (i) to maintain an interest coverage ratio (i.e., consolidated adjusted EBITDA to consolidated interest expense) that is greater than 3.0 to 1.0; (ii) not to permit the total leverage ratio (i.e., total consolidated funded indebtedness to consolidated adjusted EBITDA) to be greater than 4.5 to 1.0, provided that if a certain minimum consolidated adjusted EBITDA is reached then the total leverage ratio will be increased to 5.0 to 1.0 for such periods that the minimum is maintained; and (iii) not to permit the senior secured leverage ratio (i.e. senior secured consolidated funded indebtedness to consolidated adjusted EBITDA) to be greater than 3.5 to 1.0. As of December 31, 2016, we were in compliance with all covenants under the Senior Secured Credit Facility, and substantially all of our assets continue to be pledged as collateral under the Senior Secured Credit Facility. At December 31, 2016, the financial ratios under our Senior Secured Credit Facility were as follows:
|
Actual
|
Requirement
|
||
|
Interest coverage ratio
|
7.8 to 1
|
> 3.0 to 1.0
|
|
|
Total leverage ratio
|
2.8 to 1
|
< 4.5 to 1.0
|
|
|
Senior secured leverage ratio
|
1.1 to 1
|
< 3.5 to 1.0
|
|
As of December 31,
2016
, we had $7.1 million in letter of credit commitments which reduced the total available capacity under the Senior Secured Credit Facility to $344.7 million.
5.375% Senior Unsecured Notes
On December 16, 2013, we completed an offering of $300.0 million in aggregate principal amount of 5.375% Senior Unsecured Notes that mature on December 15, 2021 (the "Initial Senior Unsecured Notes" or the "Existing Notes"). The Initial Senior Unsecured Notes were issued at par, with interest payable on June 15
th
and December 15
th
of each year. We received net proceeds of $295.0 million, after deducting underwriting fees, and used the net proceeds from the offering to repay a portion of our outstanding revolver borrowings, and accrued and unpaid interest outstanding under our (then) Third Amended and Restated Credit Agreement. In connection with the issuance, we capitalized $6.3 million of debt issuance costs which are being amortized as interest expense over the remaining term of the Initial Senior Unsecured Notes.
On December 16, 2015, we completed an additional offering of $300.0 million in aggregate principal amount of 5.375% Senior Unsecured Notes that mature on December 15, 2021 (the "Tack-on Notes"). The Tack-on Notes were issued under the December 16, 2013 Indenture governing the $300.0 million Existing Notes and form a part of the same series as the Existing Notes for purposes of the Indenture. The Tack-on Notes were issued at 101% with interest payable on June 15
th
and December 15
th
of each year. We received net proceeds of $299.0 million, after deducting underwriting fees and used the net proceeds from the offering to repay outstanding revolver borrowings along with accrued and unpaid interest outstanding under the Senior Secured Credit Facility. In connection with the issuance, we capitalized $4.7 million of debt issuance costs which are being amortized as interest expense over the remaining term of the Tack-on Notes.
Upon completion of this Tack-on Notes offering, the aggregate principal amount of the outstanding notes under this series is $600.0 million (collectively the "Senior Unsecured Notes"). The Tack-on Notes were offered with different CUSIP and ISIN numbers from the Existing Notes, and as a result thereof, did not trade fungibly until they were assigned the same CUSIP and ISIN numbers. On December 15, 2016 the Tack-on Notes were exchanged into the unrestricted CUSIP and ISIN numbers assigned to the Existing Notes.
Both series of the Senior Unsecured Notes were issued in private offerings that were exempt from registration under the Securities Act of 1933, as amended, and are senior unsecured obligations. The total Senior Unsecured Notes are guaranteed by each of our domestic subsidiaries that guarantee our Senior Secured Credit Facility and will rank equally with our existing and future senior obligations. At any time prior to December 15, 2016, we could have redeemed all or part of the total Senior Unsecured
53
Notes at a price equal to 100% of the principal amount of the notes redeemed plus a "make-whole" premium, together with accrued and unpaid interest and additional interest, if any, to the redemption date. On or after December 15, 2016, we may redeem all or part of the Senior Unsecured Notes at a redemption price of 104.0% which gradually reduces to par by 2019.
Contractual Obligations
Our commitments to make future payments as of December 31,
2016
, are estimated as follows:
|
(in millions)
|
2017
|
2018-2019
|
2020-2021
|
Thereafter
|
Total
|
||||||||||||||
|
Dividends
|
$
|
21.8
|
|
$
|
—
|
|
$
|
—
|
|
$
|
—
|
|
$
|
21.8
|
|
||||
|
Big Fish Games earnout
|
68.4
|
|
—
|
|
—
|
|
—
|
|
68.4
|
|
|||||||||
|
Big Fish Games deferred payment
|
28.4
|
|
—
|
|
—
|
|
—
|
|
28.4
|
|
|||||||||
|
Senior Secured Credit Facility
|
—
|
|
—
|
|
148.1
|
|
—
|
|
148.1
|
|
|||||||||
|
Interest on Senior Secured Credit Facility
(1)
|
3.9
|
|
7.9
|
|
4.5
|
|
—
|
|
16.3
|
|
|||||||||
|
Term Loan
|
14.2
|
|
42.5
|
|
122.7
|
|
—
|
|
179.4
|
|
|||||||||
|
Interest on Term Loan
(1)
|
4.7
|
|
8.0
|
|
3.4
|
|
—
|
|
16.1
|
|
|||||||||
|
Senior Unsecured Notes
|
—
|
|
—
|
|
600.0
|
|
—
|
|
600.0
|
|
|||||||||
|
Interest on Senior Unsecured Notes
|
32.3
|
|
64.5
|
|
63.2
|
|
—
|
|
160.0
|
|
|||||||||
|
Operating leases
|
11.9
|
|
17.6
|
|
19.1
|
|
85.0
|
|
133.6
|
|
|||||||||
|
Total
|
$
|
185.6
|
|
|
$
|
140.5
|
|
|
$
|
961.0
|
|
|
$
|
85.0
|
|
|
$
|
1,372.1
|
|
|
(1)
|
Interest includes the estimated contractual payments under our Senior Secured Credit Facility assuming no change in the weighted average borrowing rate of 2.7% which was the rate in place as of December 31, 2016.
|
As of
December 31, 2016
, we had approximately
$3.1 million
of unrecognized tax benefits. As of
December 31, 2016
, the fair value of the Big Fish Games earnout liability is $67.9 million and the fair value of the Big Fish Games deferred payment to the founders is $27.8 million, both of which will be paid in 2017.
Our Critical Accounting Policies
Our financial statements have been prepared in conformity with U.S. GAAP and are based upon certain critical accounting policies. These policies may require management to make estimates, judgments and assumptions that we believe are reasonable based on our historical experience, contract terms, observance of known trends in our Company and the industry as a whole and information available from other outside sources. Our estimates affect the reported amounts of assets and liabilities and related disclosures of contingent assets and liabilities at the date of the financial statements and the reported amounts of revenue and expense during the reporting period. Actual results may differ from those initial estimates.
Our critical accounting policies are:
|
•
|
revenue recognition;
|
|
•
|
goodwill and indefinite intangible assets;
|
|
•
|
property and equipment; and
|
|
•
|
income tax expense.
|
Our significant accounting policies and recently adopted accounting policies are more fully described in Note 2 to the Notes to Consolidated Financial Statements included in Item 8. Financial Statements and Supplementary Data of this Annual Report on Form 10-K.
Revenue recognition
Racing and TwinSpires
Racing and TwinSpires revenue is generated by pari-mutuel wagering on live and simulcast racing content. Additionally, we also generate revenue through sponsorships, admissions, television rights, concessions, programs and parking.
Our Racing and TwinSpires revenue and income are influenced by our racing calendar. Therefore, revenue and operating results for any interim quarter are not generally indicative of the revenue and operating results for the year and may not be comparable with results for the corresponding period of the previous year. We historically have had fewer live racing days during the first
54
quarter of each year, and the majority of our live racing revenue occurs during the second quarter with the running of the Kentucky Oaks and Kentucky Derby.
Pari-mutuel revenue is recognized upon occurrence of the live race that is presented for wagering and after that live race is made official by the respective state’s racing regulatory body. Other operating revenue such as sponsorships, admissions, television rights, concessions, programs and parking revenue are recognized once delivery of the product or service has occurred.
Live racing handle includes patron wagers made on live races at our racetracks and also wagers made on imported simulcast signals by patrons at our racetracks during live meets. Import simulcasting handle includes wagers on imported signals at our racetracks when the respective tracks are not conducting live racing meets, at our OTBs and through our advance deposit wagering providers throughout the year. Export handle includes all patron wagers made on live racing signals sent to other tracks, OTBs and advance deposit wagering providers. Advance deposit wagering consists of patron wagers through an advance deposit account. We retain as revenue a pre-determined percentage or commission on the total amount wagered, and the balance is distributed to the winning patrons. The gross percentages earned in
2016
approximated
19.0%
of handle for TwinSpires and
10.9%
of handle for Racing.
Casinos
Casinos revenue represents net casino wins which is the difference between casino wins and losses. Other operating revenue, such as concession revenue, is recognized once delivery of the product or service has occurred.
Big Fish Games
Our Big Fish Games segment derives its revenue from the sale of in-app purchases within our free-to-play games and sales of our premium paid games. We offer social casino and casual and mid-core free-to-play games that customers can play at no cost. Customers can purchase virtual currency that can be used to buy virtual items to enhance the game playing experience. These games are distributed primarily through third party mobile platform providers, including but not limited to, Apple and Google.
The proceeds from the sale of virtual goods are initially recorded as deferred revenue and recognized as revenue when persuasive evidence of an arrangement exists, the service has been provided to the user, the price paid by the user is fixed or determinable and collectability is reasonably assured. Determining whether and when some of these criteria have been satisfied requires judgments that may have a significant impact on the timing and amount of revenue we report in each period. For the purpose of determining when the service has been provided to the player, we have determined that an implied obligation exists to the paying user to continue to make available the purchased virtual goods within the game over the estimated life of the virtual goods. For casino games, the life of the virtual goods is estimated to be the time period over which virtual goods are consumed, approximating three days. For all other casual games, the average playing period of paying players of approximately four months represents our best estimate of the average life of virtual goods. The proceeds from the sale of virtual goods are recorded as deferred revenue and recognized as revenue over the estimated life of the virtual goods.
Premium game revenue is derived from our PC subscription business, the Big Fish Game Club, and from the sale of individual games on PC, Mac and mobile devices. Subscribers receive a game credit each month with subscription. The value of the game credit is recognized when a customer redeems the game credit.
We record breakage revenue related to outstanding premium game credits. For credits that are subject to expiration, breakage revenue is recorded when the credits have legally expired. Breakage revenue is recorded for game credits with no legal expiration when we have determined the likelihood of redemption is remote based on historical game credit redemption patterns.
We estimate revenue from digital storefronts, such as Apple and Google, in the current period when reasonable estimates of these amounts can be made. The digital storefronts provide reliable interim preliminary sale reporting data within a reasonable time frame following the end of each month which, when validated against our internal data, allows us to make reasonable estimates of revenue and therefore to recognize revenue during the reporting period. Determination of the appropriate amount of revenue recognized involves judgments and estimates that we believe are reasonable, but it is possible that actual results may differ from our estimates. When we receive the final reports, to the extent not received within a reasonable time frame following the end of each month, we record any differences between estimated revenue and actual revenue in the reporting period when we determine the actual amounts. Historically, the revenue on the final revenue report has not differed significantly from the reported revenue for the period.
We evaluate our digital storefront agreements in order to determine whether or not we are acting as the principal or as an agent when selling our games which we consider in determining if revenue should be reported gross or net. We primarily use digital storefronts for distributing our social casino and casual free-to-play games. Key indicators that we evaluate in order to reach this determination include:
|
•
|
the terms and conditions of our contracts with the digital storefronts;
|
|
•
|
the party responsible for billing and collecting fees from the end-users, including the resolution of billing disputes;
|
55
|
•
|
whether we are paid a fixed percentage of the arrangement’s consideration or a fixed fee for each game;
|
|
•
|
the party which sets the pricing with the end-user, has the credit risk and provides customer support; and
|
|
•
|
the party responsible for the fulfillment of the game and that determines the specifications of the game.
|
Based on the evaluation of the above indicators, we have determined that we are generally acting as a principal and are the primary obligor to end-users for games distributed through digital storefronts; therefore, we recognize revenue related to these arrangements on a gross basis.
Goodwill and indefinite intangible assets
We perform an annual review for impairment of goodwill and indefinite-lived intangible assets as of March 31 of each fiscal year, or more frequently if events or changes in circumstances indicate that the carrying value may not be recoverable. Adverse industry or economic trends, lower projections of profitability, or a sustained decline in our market capitalization, among other items, may be indications of potential impairment issues which are triggering events requiring the testing of an asset’s carrying value for recoverability. Goodwill is allocated among and evaluated for impairment at the reporting unit level which is defined as an operating segment or one level below an operating segment.
Goodwill and intangible assets can or may be required to be tested using a two-step impairment test. We assess qualitative factors to determine whether it is necessary to complete the two-step impairment test using a more likely than not criteria. If an entity believes it is more likely than not that the fair value of a reporting unit is greater than its carrying value, including goodwill, the two-step test can be bypassed. Qualitative factors include macroeconomic conditions, industry and market conditions, cost factors, overall financial performance, among others. These factors require significant judgment and estimates, and application of alternative assumptions could produce significantly different results. Evaluations of possible impairment utilizing the two-step approach require us to estimate, among other factors, forecasts of future operating results, revenue growth, EBITDA margin, tax rates, capital expenditures, depreciation, working capital, weighted average cost of capital, long-term growth rates, risk premiums, terminal values and fair market values of our reporting units and assets.
We completed step one of the two-step test during the first quarter of 2016, and there were no impairments to our goodwill. The goodwill impairment test, particularly as it relates to our Big Fish reporting unit, is subject to uncertainties arising from such events as changes in competitive conditions, the current general economic environment, material changes in growth rate assumptions that could positively or negatively impact anticipated future operating conditions and cash flows; changes in the discount rate; and the impact of strategic decisions. If any of these factors were to materially change it may require a reevaluation of our goodwill. Changes in estimates or the application of alternative assumptions could produce significantly different results.
Our slots gaming rights and casinos' trade names are considered indefinite-lived intangible assets that do not require amortization based on our future expectations to operate our gaming facilities and use the trade names indefinitely, and our historical experience in renewing these intangible assets at minimal cost with various state gaming commissions. Our Big Fish Games trade name is also considered an indefinite intangible asset. These indefinite intangible assets are tested annually, or more frequently, if indicators of impairment exist, by comparing the fair value of the recorded assets to the carrying amount. If the carrying amount of the slots gaming rights and trade name intangible assets exceed fair value, an impairment loss is recognized. There were no impairments to our indefinite-lived intangible assets in 2016.
Property and equipment
We have a significant investment in long-lived property and equipment. Property and equipment are recorded at cost. Judgments are made in determining the estimated useful lives of assets, the salvage values to be assigned to assets and if or when an asset has been impaired. The accuracy of these estimates affects the amount of depreciation expense recognized in the financial results and whether to record a gain or loss on disposition of an asset.
We review the carrying value of our property and equipment used in our operations whenever events or circumstances indicate that the carrying value of an asset may not be recoverable from estimated future undiscounted cash flows expected to result from its use and eventual disposition. Adverse industry or economic trends, lower projections of profitability, or a significant adverse change in legal factors or in the business climate, among other items, may be indications of potential impairment issues. If the undiscounted cash flows exceed the carrying value, no impairment is indicated. If the undiscounted cash flows do not exceed the carrying value, an impairment is recorded based on the fair value of the asset.
There are three generally accepted approaches available in developing an opinion of value: 1) the cost approach which is the price a prudent investor would pay to produce or construct a similar new item; 2) the market approach which is typically used for land valuations by analyzing recent sales transactions of similar sites; and 3) the income approach which is based on a discounted cash flow model using the estimated future results of the relevant reporting unit discounted using our weighted-average cost of capital and market indicators of terminal year free cash flow multiples. If necessary, we solicit third-party valuation expertise to assist in the valuation of our assets. We apply the most indicative approach to the overall valuation, or in some cases, a weighted analysis of any or all of these methods. The determination of fair value uses accounting judgments and
56
estimates, including market conditions, and the reliability is dependent upon the availability and comparability of the market data uncovered, as well as the decision making criteria used by marketing participants when evaluating a property. Changes in estimates or application of alternative assumptions could produce significantly different results.
In 2016, there were no impairments to our property and equipment. In 2015, we recorded a $12.7 million non-cash impairment charge related to the Calder grandstand.
Income Taxes
We use estimates and judgments for financial reporting to determine our current tax liability and deferred taxes. In accordance with the liability method of accounting for income taxes, we recognize the amount of taxes payable or refundable for the current year and deferred tax assets and liabilities for the future tax consequences of events that have been recognized in our consolidated financial statements or tax returns.
Adjustments to deferred taxes are determined based upon changes in differences between the book basis and tax basis of our assets and liabilities and measured by enacted tax rates we estimate will be applicable when these differences are expected to reverse. Changes in current tax laws, enacted tax rates or the estimated level of taxable income or non-deductible expense could change the valuation of deferred tax assets and liabilities and affect the overall effective tax rate and tax provision.
57
|
ITEM 7A.
|
QUANTITATIVE AND QUALITATIVE DISCLOSURES ABOUT MARKET RISK
|
We are exposed to market risks arising from adverse changes in:
|
•
|
general economic trends;
|
|
•
|
interest rate and credit risk; and
|
|
•
|
foreign currency exchange risk.
|
General economic trends
Our business is sensitive to consumer confidence and reductions in consumer’s discretionary spending, which may result from challenging economic conditions, unemployment levels and other changes in the economy. Demand for entertainment and leisure activities is sensitive to consumers’ disposable incomes, which can be adversely affected by economic conditions and unemployment levels. This could result in fewer patrons visiting our racetracks, gaming and wagering facilities, online wagering sites and our casual gaming site, downloading our online games and/or may impact our customers’ ability to wager with the same frequency and to maintain wagering levels.
Interest rate and credit risk
Our primary exposure to market risk relates to changes in interest rates. At December 31,
2016
, we had
$327.5 million
outstanding under our Senior Secured Credit Facility, which bears interest at LIBOR based variable rates. We are exposed to market risk on variable rate debt due to potential adverse changes in these rates. Assuming the outstanding balance of the debt facility remains constant, a one-percentage point increase in the LIBOR rate would reduce net income and cash flows from operating activities by
$2.1 million
.
Foreign currency exchange risk
We operate internationally and are exposed to foreign currency exchange risk. While the substantial majority of our revenue has been and is expected to continue to be denominated in U.S. dollars, our results of operations and cash flows are subject to fluctuations due to changes in foreign currency exchange rates, particularly changes in the Euro. Due to the relative size of our international operations to date, our foreign currency exposure is not material and thus we have not instituted a hedging program.
58
|
ITEM 8.
|
FINANCIAL STATEMENTS AND SUPPLEMENTARY DATA
|
CHURCHILL DOWNS INCORPORATED
CONSOLIDATED BALANCE SHEETS
December 31,
|
(in millions)
|
2016
|
2015
|
|||||
|
ASSETS
|
|||||||
|
Current assets:
|
|||||||
|
Cash and cash equivalents
|
$
|
48.7
|
|
$
|
74.5
|
|
|
|
Restricted cash
|
34.3
|
|
29.7
|
|
|||
|
Accounts receivable, net of allowance for doubtful accounts of $3.5 in 2016 and $3.8 in 2015
|
81.4
|
|
67.8
|
|
|||
|
Receivable from escrow
|
13.6
|
|
—
|
|
|||
|
Income taxes receivable
|
7.6
|
|
1.0
|
|
|||
|
Game software development, net
|
9.6
|
|
7.1
|
|
|||
|
Other current assets
|
50.8
|
|
39.5
|
|
|||
|
Total current assets
|
246.0
|
|
219.6
|
|
|||
|
Property and equipment, net
|
574.4
|
|
573.2
|
|
|||
|
Game software development, net
|
6.3
|
|
3.2
|
|
|||
|
Investment in and advances to unconsolidated affiliates
|
139.1
|
|
129.7
|
|
|||
|
Goodwill
|
832.2
|
|
841.7
|
|
|||
|
Other intangible assets, net
|
445.7
|
|
496.2
|
|
|||
|
Other assets
|
10.7
|
|
13.8
|
|
|||
|
Total assets
|
$
|
2,254.4
|
|
$
|
2,277.4
|
|
|
|
LIABILITIES AND SHAREHOLDERS' EQUITY
|
|||||||
|
Current liabilities:
|
|||||||
|
Accounts payable
|
$
|
53.2
|
|
$
|
39.1
|
|
|
|
Purses payable
|
12.5
|
|
12.1
|
|
|||
|
Account wagering deposit liabilities
|
25.0
|
|
20.4
|
|
|||
|
Accrued expense
|
100.1
|
|
97.9
|
|
|||
|
Tax refund due to Big Fish Games former equity holders
|
—
|
|
0.4
|
|
|||
|
Deferred revenue - Big Fish Games
|
81.3
|
|
81.3
|
|
|||
|
Deferred revenue - all other
|
64.3
|
|
46.0
|
|
|||
|
Big Fish Games deferred payment, current
|
27.8
|
|
28.1
|
|
|||
|
Big Fish Games earnout liability, current
|
67.9
|
|
279.5
|
|
|||
|
Current maturities of long-term debt
|
14.2
|
|
16.2
|
|
|||
|
Dividends payable
|
21.8
|
|
19.1
|
|
|||
|
Total current liabilities
|
468.1
|
|
640.1
|
|
|||
|
Long-term debt (net of current maturities and loan origination fees of $0.5 in 2016 and $0.6 in 2015
|
312.8
|
|
171.9
|
|
|||
|
Notes payable (including premium of $2.5 in 2016 and $3.0 in 2015 and net of debt issuance costs of $7.8 in 2016 and $9.3 in 2015)
|
594.7
|
|
593.7
|
|
|||
|
Big Fish Games deferred payment, net of current amount due
|
—
|
|
26.7
|
|
|||
|
Big Fish Games earnout liability, net of current amount due
|
—
|
|
65.7
|
|
|||
|
Deferred revenue - all other
|
24.4
|
|
16.1
|
|
|||
|
Deferred income taxes
|
153.1
|
|
127.9
|
|
|||
|
Other liabilities
|
16.3
|
|
18.1
|
|
|||
|
Total liabilities
|
1,569.4
|
|
1,660.2
|
|
|||
|
Commitments and contingencies
|
|
|
|
|
|||
|
Shareholders' equity:
|
|||||||
|
Preferred stock, no par value; 0.3 shares authorized; no shares issued
|
—
|
|
—
|
|
|||
|
Common stock, no par value; 50.0 shares authorized; 16.5 shares issued in 2016 and 16.6 shares issued in 2015
|
116.5
|
|
134.0
|
|
|||
|
Retained earnings
|
569.7
|
|
483.8
|
|
|||
|
Accumulated other comprehensive loss
|
(1.2
|
)
|
(0.6
|
)
|
|||
|
Total shareholders' equity
|
685.0
|
|
617.2
|
|
|||
|
Total liabilities and shareholders' equity
|
$
|
2,254.4
|
|
$
|
2,277.4
|
|
|
The accompanying notes are an integral part of the consolidated financial statements.
59
CHURCHILL DOWNS INCORPORATED
for the years ended December 31,
|
(in millions, except per common share data)
|
2016
|
2015
|
2014
|
||||||||
|
Net revenue:
|
|||||||||||
|
Racing
|
$
|
251.1
|
|
$
|
248.0
|
|
$
|
261.4
|
|
||
|
Casinos
|
332.8
|
|
332.9
|
|
328.3
|
|
|||||
|
TwinSpires
|
220.6
|
|
200.2
|
|
191.0
|
|
|||||
|
Big Fish Games
|
486.2
|
|
413.7
|
|
13.9
|
|
|||||
|
Other Investments
|
16.9
|
|
16.6
|
|
16.5
|
|
|||||
|
Corporate
|
1.0
|
|
0.9
|
|
1.1
|
|
|||||
|
Total net revenue
|
1,308.6
|
|
1,212.3
|
|
812.2
|
|
|||||
|
Operating expense:
|
|||||||||||
|
Racing
|
187.7
|
|
189.9
|
|
216.3
|
|
|||||
|
Casinos
|
241.3
|
|
241.1
|
|
243.3
|
|
|||||
|
TwinSpires
|
146.7
|
|
135.4
|
|
138.2
|
|
|||||
|
Big Fish Games
|
398.9
|
|
340.1
|
|
16.0
|
|
|||||
|
Other Investments
|
16.5
|
|
16.3
|
|
17.6
|
|
|||||
|
Corporate
|
1.9
|
|
0.1
|
|
1.9
|
|
|||||
|
Selling, general and administrative expense
|
100.2
|
|
90.8
|
|
76.0
|
|
|||||
|
Research and development
|
39.0
|
|
39.4
|
|
—
|
|
|||||
|
Gain on Calder land sale
|
(23.7
|
)
|
—
|
|
—
|
|
|||||
|
Calder exit costs
|
2.5
|
|
13.9
|
|
2.3
|
|
|||||
|
Acquisition expenses, net
|
3.4
|
|
21.7
|
|
10.2
|
|
|||||
|
Total operating expense
|
1,114.4
|
|
1,088.7
|
|
721.8
|
|
|||||
|
Operating income
|
194.2
|
|
123.6
|
|
90.4
|
|
|||||
|
Other income (expense):
|
|||||||||||
|
Interest expense
|
(43.7
|
)
|
(28.6
|
)
|
(20.8
|
)
|
|||||
|
Equity in income of unconsolidated investments
|
17.4
|
|
11.2
|
|
6.3
|
|
|||||
|
Miscellaneous, net
|
0.2
|
|
5.9
|
|
0.6
|
|
|||||
|
Total other expense
|
(26.1
|
)
|
(11.5
|
)
|
(13.9
|
)
|
|||||
|
Income from operations before provision for income taxes
|
168.1
|
|
112.1
|
|
76.5
|
|
|||||
|
Income tax provision
|
(60.0
|
)
|
(46.9
|
)
|
(30.1
|
)
|
|||||
|
Net income
|
$
|
108.1
|
|
$
|
65.2
|
|
$
|
46.4
|
|
||
|
Net income per common share data:
|
|||||||||||
|
Basic net income
|
$
|
6.52
|
|
$
|
3.75
|
|
$
|
2.67
|
|
||
|
Diluted net income
|
$
|
6.42
|
|
$
|
3.71
|
|
$
|
2.64
|
|
||
|
Weighted average shares outstanding:
|
|||||||||||
|
Basic
|
16.4
|
|
17.2
|
|
17.3
|
|
|||||
|
Diluted
|
16.8
|
|
17.6
|
|
17.6
|
|
|||||
|
Other comprehensive loss:
|
|||||||||||
|
Foreign currency translation, net of tax
|
0.2
|
|
(0.5
|
)
|
(0.1
|
)
|
|||||
|
Change in pension benefits, net of tax
|
(0.8
|
)
|
—
|
|
—
|
|
|||||
|
Other comprehensive loss
|
(0.6
|
)
|
(0.5
|
)
|
(0.1
|
)
|
|||||
|
Comprehensive income
|
$
|
107.5
|
|
$
|
64.7
|
|
$
|
46.3
|
|
||
The accompanying notes are an integral part of the consolidated financial statements.
60
CHURCHILL DOWNS INCORPORATED
CONSOLIDATED STATEMENTS OF SHAREHOLDERS’ EQUITY
for the years ended December 31,
2016
,
2015
and
2014
|
Common Stock
|
Retained
Earnings
|
Accumulated Other Comprehensive Loss
|
Total Shareholders' Equity
|
|||||||||||||||
|
(in millions, except per common share data)
|
Shares
|
Amount
|
||||||||||||||||
|
Balance, December 31, 2013
|
17.9
|
|
$
|
296.0
|
|
$
|
408.8
|
|
$
|
—
|
|
$
|
704.8
|
|
||||
|
Net income
|
46.4
|
|
46.4
|
|
||||||||||||||
|
Issuance of common stock
|
0.4
|
|
23.3
|
|
23.3
|
|
||||||||||||
|
Tax windfall from stock-based compensation
|
7.7
|
|
7.7
|
|
||||||||||||||
|
Repurchase of common stock
|
(0.8
|
)
|
(76.6
|
)
|
(76.6
|
)
|
||||||||||||
|
Stock-based compensation
|
11.9
|
|
11.9
|
|
||||||||||||||
|
Cash & restricted stock dividends, $1.00 per share
|
(17.3
|
)
|
(17.3
|
)
|
||||||||||||||
|
Foreign currency translation adjustment, net of ($0.1) tax
|
(0.1
|
)
|
(0.1
|
)
|
||||||||||||||
|
Balance, December 31, 2014
|
17.5
|
|
262.3
|
|
437.9
|
|
(0.1
|
)
|
700.1
|
|
||||||||
|
Net income
|
65.2
|
|
65.2
|
|
||||||||||||||
|
Issuance of common stock
|
—
|
|
3.5
|
|
3.5
|
|
||||||||||||
|
Tax windfall from stock-based compensation
|
5.5
|
|
5.5
|
|
||||||||||||||
|
Repurchase of common stock
|
(1.1
|
)
|
(151.1
|
)
|
(151.1
|
)
|
||||||||||||
|
Grants of restricted stock, net of forfeitures
|
0.2
|
|
—
|
|
—
|
|
||||||||||||
|
Stock-based compensation
|
13.8
|
|
13.8
|
|
||||||||||||||
|
Cash & restricted stock dividends, $1.15 per share
|
(19.3
|
)
|
(19.3
|
)
|
||||||||||||||
|
Foreign currency translation adjustment, net of ($0.2) tax
|
(0.5
|
)
|
(0.5
|
)
|
||||||||||||||
|
Balance, December 31, 2015
|
16.6
|
|
134.0
|
|
483.8
|
|
(0.6
|
)
|
617.2
|
|
||||||||
|
Net income
|
|
|
|
|
108.1
|
|
108.1
|
|
||||||||||
|
Issuance of common stock
|
0.1
|
|
2.6
|
|
2.6
|
|
||||||||||||
|
Repurchase of common stock
|
(0.3
|
)
|
(39.0
|
)
|
|
(39.0
|
)
|
|||||||||||
|
Grants of restricted stock, net of forfeitures
|
0.1
|
|
—
|
|
|
—
|
|
|||||||||||
|
Stock-based compensation
|
|
|
18.9
|
|
|
18.9
|
|
|||||||||||
|
Cash & restricted stock dividends, $1.32 per share
|
|
|
|
|
(22.2
|
)
|
(22.2
|
)
|
||||||||||
|
Foreign currency translation, net of ($0.1) tax
|
0.2
|
|
0.2
|
|
||||||||||||||
|
Change in pension benefits, net of ($0.5) tax
|
|
|
|
|
|
(0.8
|
)
|
(0.8
|
)
|
|||||||||
|
Balance, December 31, 2016
|
16.5
|
|
$
|
116.5
|
|
$
|
569.7
|
|
$
|
(1.2
|
)
|
$
|
685.0
|
|
||||
The accompanying notes are an integral part of the consolidated financial statements.
61
|
CHURCHILL DOWNS INCORPORATED
for the years ended December 31,
|
|||||||||||
|
(in millions)
|
2016
|
2015
|
2014
|
||||||||
|
Cash flows from operating activities:
|
|||||||||||
|
Net income
|
$
|
108.1
|
|
$
|
65.2
|
|
$
|
46.4
|
|
||
|
Adjustments to reconcile net income to net cash provided by operating activities:
|
|||||||||||
|
Depreciation and amortization
|
108.6
|
|
109.7
|
|
68.3
|
|
|||||
|
Game software development amortization
|
17.2
|
|
9.7
|
|
—
|
|
|||||
|
Acquisition expenses, net
|
3.4
|
|
34.7
|
|
7.1
|
|
|||||
|
Gain on sale of equity investments
|
—
|
|
(5.8
|
)
|
—
|
|
|||||
|
Distributed earnings from equity investments
|
15.6
|
|
15.2
|
|
—
|
|
|||||
|
Earnings from equity investments, net
|
(17.4
|
)
|
(11.2
|
)
|
(6.3
|
)
|
|||||
|
Stock-based compensation
|
18.9
|
|
13.8
|
|
11.9
|
|
|||||
|
Deferred tax provision (benefit)
|
35.4
|
|
(3.4
|
)
|
14.8
|
|
|||||
|
(Gain) loss on sale of assets
|
(23.6
|
)
|
0.3
|
|
(0.4
|
)
|
|||||
|
Big Fish Games earnout payment
|
(19.7
|
)
|
—
|
|
—
|
|
|||||
|
Big Fish Games deferred payment
|
(2.0
|
)
|
—
|
|
—
|
|
|||||
|
Other
|
2.0
|
|
4.6
|
|
0.6
|
|
|||||
|
Increase (decrease) in cash resulting from changes in operating assets and liabilities, net of business acquisitions:
|
|||||||||||
|
Other current assets and liabilities
|
(10.2
|
)
|
(15.3
|
)
|
(3.3
|
)
|
|||||
|
Game software development
|
(22.1
|
)
|
(19.8
|
)
|
—
|
|
|||||
|
Income taxes
|
(6.6
|
)
|
28.5
|
|
0.2
|
|
|||||
|
Deferred revenue
|
17.9
|
|
38.3
|
|
0.6
|
|
|||||
|
Other assets and liabilities
|
1.3
|
|
—
|
|
1.7
|
|
|||||
|
Net cash provided by operating activities
|
226.8
|
|
264.5
|
|
|
141.6
|
|
||||
|
Cash flows from investing activities:
|
|||||||||||
|
Capital maintenance expenditures
|
(30.9
|
)
|
(31.1
|
)
|
(22.7
|
)
|
|||||
|
Capital project expenditures
|
(23.8
|
)
|
(12.4
|
)
|
(31.8
|
)
|
|||||
|
Receivable from escrow
|
(13.6
|
)
|
—
|
|
—
|
|
|||||
|
Acquisition of businesses, net of cash acquired
|
—
|
|
(0.9
|
)
|
(366.0
|
)
|
|||||
|
Acquisition of gaming licenses
|
(2.5
|
)
|
(2.3
|
)
|
(2.3
|
)
|
|||||
|
Distributions of capital from equity investments
|
0.7
|
|
—
|
|
—
|
|
|||||
|
Investment in joint ventures
|
(8.0
|
)
|
(25.0
|
)
|
(18.5
|
)
|
|||||
|
Proceeds from sale of equity investment
|
1.8
|
|
6.0
|
|
—
|
|
|||||
|
Proceeds from sale of assets
|
25.6
|
|
0.2
|
|
1.0
|
|
|||||
|
Net cash used in investing activities
|
(50.7
|
)
|
(65.5
|
)
|
(440.3
|
)
|
|||||
|
Cash flows from financing activities:
|
|||||||||||
|
Borrowings on bank line of credit
|
727.1
|
|
704.2
|
|
805.0
|
|
|||||
|
Repayments of bank line of credit
|
(588.4
|
)
|
(985.8
|
)
|
(403.8
|
)
|
|||||
|
Big Fish Games earnout payment
|
(261.9
|
)
|
—
|
|
—
|
|
|||||
|
Big Fish Games deferred payment
|
(26.4
|
)
|
(28.5
|
)
|
—
|
|
|||||
|
Tax refund payments to Big Fish Games equity holders
|
(0.4
|
)
|
(17.7
|
)
|
—
|
|
|||||
|
Proceeds from note issuance
|
—
|
|
300.0
|
|
—
|
|
|||||
|
Payment of dividends
|
(19.1
|
)
|
(17.4
|
)
|
(15.2
|
)
|
|||||
|
Repurchase of common stock
|
(39.0
|
)
|
(147.6
|
)
|
(76.6
|
)
|
|||||
|
Common stock issued
|
2.2
|
|
1.2
|
|
7.4
|
|
|||||
|
Windfall tax provision from stock-based compensation
|
—
|
|
5.6
|
|
7.7
|
|
|||||
|
Loan origination fees and debt issuance costs
|
(1.4
|
)
|
(4.6
|
)
|
(2.1
|
)
|
|||||
|
Other
|
5.4
|
|
—
|
|
(0.4
|
)
|
|||||
|
Net cash (used in) provided by financing activities
|
(201.9
|
)
|
(190.6
|
)
|
322.0
|
|
|||||
|
Net (decrease) increase in cash and cash equivalents
|
(25.8
|
)
|
8.4
|
|
23.3
|
|
|||||
|
Effect of exchange rate changes on cash
|
—
|
|
(1.8
|
)
|
(0.1
|
)
|
|||||
|
Cash and cash equivalents, beginning of year
|
74.5
|
|
67.9
|
|
44.7
|
|
|||||
|
Cash and cash equivalents, end of year
|
$
|
48.7
|
|
$
|
74.5
|
|
$
|
67.9
|
|
||
The accompanying notes are an integral part of the consolidated financial statements.
62
CHURCHILL DOWNS INCORPORATED
CONSOLIDATED STATEMENTS OF CASH FLOWS (continued)
for the years ended December 31,
|
(in millions)
|
2016
|
2015
|
2014
|
||||||||
|
Supplemental disclosures of cash flow information:
|
|||||||||||
|
Cash paid during the period for:
|
|||||||||||
|
Interest
|
$
|
40.0
|
|
$
|
25.2
|
|
$
|
17.5
|
|
||
|
Income taxes
|
32.4
|
|
41.5
|
|
17.0
|
|
|||||
|
Schedule of non-cash investing and financing activities:
|
|||||||||||
|
Issuance of common stock for acquisition of Big Fish Games
|
—
|
|
—
|
|
15.8
|
|
|||||
|
Earnout liability for acquisition of Big Fish Games
|
—
|
|
—
|
|
324.7
|
|
|||||
|
Deferred payment for acquisition of Big Fish Games
|
—
|
|
—
|
|
97.1
|
|
|||||
|
Issuance of common stock in connection with the Company LTIP, the New Company LTIP and other restricted stock plans
|
19.0
|
|
27.7
|
|
3.0
|
|
|||||
|
Dividends payable
|
21.8
|
|
19.1
|
|
17.4
|
|
|||||
|
Repurchase of common stock in payment of income taxes on stock-based compensation
|
6.4
|
|
3.6
|
|
—
|
|
|||||
|
Property and equipment additions included in accounts payable and accrued expense
|
4.2
|
|
1.5
|
|
1.3
|
|
|||||
The accompanying notes are an integral part of the consolidated financial statements.
63
Churchill Downs Incorporated
Notes to Consolidated Financial Statements
1. DESCRIPTION OF BUSINESS
Churchill Downs Incorporated (the "Company", "we", "us", "our") is an industry-leading racing, gaming and online entertainment company anchored by our iconic flagship event -
The Kentucky Derby
. We are a leader in brick-and-mortar casino gaming with approximately
9,030
gaming positions in
seven
states, and we are the largest, legal online account wagering platform for horseracing in the U.S. We are also one of the world's largest producers and distributors of mobile games. We were organized as a Kentucky corporation in 1928, and our principal executive offices are located in Louisville, Kentucky.
We conduct our business through our operating segments and report our net revenue and operating expense associated with our operating segments in our accompanying Consolidated Statements of Comprehensive Income. Our operating segments are defined as follows:
Racing
: primarily commissions earned on wagering at our racetracks, off-track betting facilities ("OTBs"), simulcast fees earned from other wagering sites, and the operations include admissions, sponsorships and licensing rights, food and beverage services and alternative uses of our pari-mutuel facilities.
Casinos
: slot machines, table games, video poker ancillary food and beverage services and hotel and other miscellaneous operations. In addition, we include our
50%
joint venture in Miami Valley Gaming ("MVG") and our
25%
equity investment in Saratoga Casino Holdings LLC ("SCH").
TwinSpires
: mobile and online pari-mutuel wagering business on TwinSpires.com; high dollar wagering by international customers ("Velocity"); and horseracing statistical data generated by our information business that provides data information and processing services to the equine industry.
Big Fish Games
: social casino, casual and mid-core free to play, and premium paid games for PC, Mac, and mobile devices.
Other Investments
: pari-mutuel wagering systems for racetracks and an Internet real-money gaming operation.
Corporate
: other revenue and general and administrative expense not allocated to our other operating segments.
2. SIGNIFICANT ACCOUNTING POLICIES
Principles of Consolidation
The accompanying consolidated financial statements include the accounts of the Company and its subsidiaries. All intercompany balances and transactions have been eliminated in consolidation.
Use of Estimates
Our financial statements have been prepared in conformity with U.S. generally accepted accounting principles ("U.S. GAAP") and are based upon certain critical accounting policies. These policies may require management to make estimates, judgments and assumptions that we believe are reasonable based on our historical experience, contract terms, observance of known trends in our Company and the industry as a whole and information available from other outside sources. Our estimates affect the reported amounts of assets and liabilities and related disclosures of contingent assets and liabilities at the date of the financial statements and the reported amounts of revenue and expense during the reporting period. Actual results may differ from those initial estimates. Our most critical estimates relate to revenue recognition, goodwill and other intangible assets, property and equipment and income taxes.
Reclassifications
We have reclassified certain items in the accompanying Consolidated Financial Statements for prior years to be comparable with 2016 classifications. On January 1, 2016, we realigned our Churchill Downs Interactive Gaming ("I-Gaming") and Bluff Media ("Bluff") operations from our Other Investments segment to our TwinSpires segment to correspond with internal management reporting changes.
There was no impact from these reclassifications on net income or cash flows.
Revenue Recognition
Racing and TwinSpires
Racing and TwinSpires revenue is generated by pari-mutuel wagering on live and simulcast racing content. Additionally, we also generate revenue through sponsorships, admissions, television rights, concessions, programs and parking.
64
Churchill Downs Incorporated
Notes to Consolidated Financial Statements
Our Racing and TwinSpires revenue and income are influenced by our racing calendar. Therefore, revenue and operating results for any interim quarter are not generally indicative of the revenue and operating results for the year and may not be comparable with results for the corresponding period of the previous year. We historically have had fewer live racing days during the first quarter of each year, and the majority of our live racing revenue occurs during the second quarter with the running of the Kentucky Oaks and Kentucky Derby.
Pari-mutuel revenue is recognized upon occurrence of the live race that is presented for wagering and after that live race is made official by the respective state’s racing regulatory body. Other operating revenue from sponsorships, admissions, television rights, concessions, programs and parking are recognized once delivery of the product or service has occurred.
Live racing handle includes patron wagers made on live races at our racetracks and also wagers made on imported simulcast signals by patrons at our racetracks during live meets. Import simulcasting handle includes wagers on imported signals at our racetracks when the respective tracks are not conducting live racing meets, at our OTBs and through our advance deposit wagering providers throughout the year. Export handle includes all patron wagers made on live racing signals sent to other tracks, OTBs and advance deposit wagering providers. Advance deposit wagering consists of patron wagers through an advance deposit account. The pari-mutuel revenue earned in 2016 approximated
18.4%
of handle for the TwinSpires segment and
11.0%
of handle for the Racing segment.
Deferred revenue includes advance sales related to the Kentucky Oaks and Kentucky Derby races and other advance billings on racing events. Revenue from these advance billings are recognized when the related event occurs. Deferred revenue also includes advance sales of Personal Seat Licenses ("PSLs") and luxury suites. PSLs represent the ownership of a specific seat for the Kentucky Oaks, Kentucky Derby and, in certain cases, Breeders’ Cup races at Churchill Downs Racetrack ("Churchill Downs") and have a contractual life between
one
and
thirty
years.
Revenue from PSLs is recognized when the Kentucky Oaks, Kentucky Derby and Breeders’ Cup races occur on a ratable basis over the term of the contract. Luxury suites are sold for specific racing events as well as for a predetermined contractual term. Revenue related to the sale of luxury suites is recognized as they are utilized when the related event occurs.
Casinos
Casino revenue represents net casino wins which is the difference between casino wins and losses. Other operating revenue, such as concession revenue, is recognized once delivery of the product or service has occurred.
Big Fish Games
Big Fish Games revenue is primarily derived from the sale of in-app purchases within our free-to-play games and sales of our premium paid games. We offer social casino and casual and mid-core free-to-play games that customers can play at no cost. Customers can purchase virtual currency that can be used to buy virtual items to enhance the game playing experience. These games are distributed primarily through third party mobile platform providers, including but not limited to, Apple and Google.
The proceeds from the sale of virtual goods are initially recorded as deferred revenue and recognized as revenue when persuasive evidence of an arrangement exists, the service has been provided to the user, the price paid by the user is fixed or determinable, and collectability is reasonably assured. Determining whether and when some of these criteria have been satisfied requires judgments that may have a significant impact on the timing and amount of revenue we report in each period. For the purpose of determining when the service has been provided to the player, we have determined that an implied obligation exists to the paying user to continue to make available the purchased virtual goods within the game over the estimated life of the virtual goods. For social casino games, the life of the virtual goods is estimated to be the time period over which virtual goods are consumed, approximating
three
days. For all other casual games, the average playing period of paying players of approximately
four
months represents our best estimate of the average life of virtual goods. The proceeds from the sale of virtual goods are recorded as deferred revenue and recognized as revenue over the estimated life of the virtual goods.
Premium game revenue is derived from our PC subscription business, the Big Fish Game Club and from the sale of individual games on PC, Mac and mobile devices. Subscribers receive a game credit each month with their subscription. The value of the game credit is recognized when a customer redeems the game credit.
We record breakage revenue related to outstanding premium game credits. For credits that are subject to expiration, breakage revenue is recorded when the credits have legally expired. Breakage revenue is recorded for game credits with no legal expiration when we have determined the likelihood of redemption is remote based on historical game credit redemption patterns.
Other Estimates and Judgments
We estimate revenue from digital storefronts, such as Apple and Google, in the current period when reasonable estimates of these amounts can be made. The digital storefronts provide reliable interim preliminary sales reporting data within a reasonable time frame following the end of each month, which, when validated against our internal data, allows us to make reasonable estimates
65
Churchill Downs Incorporated
Notes to Consolidated Financial Statements
of revenue and therefore to recognize revenue during the reporting period. Determination of the appropriate amount of revenue recognized involves judgments and estimates that we believe are reasonable, but it is possible that actual results may differ from our estimates. When we receive the final reports, to the extent not received within a reasonable time frame following the end of each month, we record any differences between estimated revenue and actual revenue in the reporting period when we determine the actual amounts. Historically, the revenue on the final revenue report has not differed significantly from the reported revenue for the period.
Principal Agent Considerations
We evaluate our digital storefront agreements in order to determine whether or not we are acting as the principal or as an agent when selling our games, which we consider in determining if revenue should be reported gross or net. We primarily use digital storefronts for distributing our social casino and casual free-to-play games. Key indicators that we evaluate in order to reach this determination include:
|
•
|
the terms and conditions of our contracts with the digital storefronts;
|
|
•
|
the party responsible for billing and collecting fees from the end-users, including the resolution of billing disputes;
|
|
•
|
whether we are paid a fixed percentage of the arrangement’s consideration or a fixed fee for each game;
|
|
•
|
the party which sets the pricing with the end-user, has the credit risk and provides customer support; and
|
|
•
|
the party responsible for the fulfillment of the game and that determines the specifications of the game.
|
Based on the evaluation of the above indicators, we have determined that we are generally acting as a principal and are the primary obligor to end-users for games distributed through digital storefronts; and therefore, we recognize revenue related to these arrangements on a gross basis.
Goodwill and Indefinite Intangible Assets
We perform an annual review for impairment of goodwill and indefinite-lived intangible assets as of March 31 of each fiscal year, or more frequently if events or changes in circumstances indicate that the carrying value may not be recoverable. Adverse industry or economic trends, lower projections of profitability, or a sustained decline in our market capitalization, among other items, may be indications of potential impairment issues, which are triggering events requiring the testing of an asset’s carrying value for recoverability. Goodwill is allocated and evaluated for impairment at the reporting unit level, which is defined as an operating segment or one level below an operating segment.
Goodwill and intangible assets can or may be required to be tested using a two-step impairment test. We assess qualitative factors to determine whether it is necessary to complete the two-step impairment test using a more likely than not criteria. If an entity believes it is more likely than not that the fair value of a reporting unit is greater than its carrying value, including goodwill, the two-step process can be bypassed. Qualitative factors include macroeconomic conditions, industry and market conditions, cost factors, overall financial performance, among others. These factors require significant judgments and estimates, and application of alternative assumptions could produce significantly different results. Evaluations of possible impairment utilizing the two-step approach require us to estimate, among other factors, forecasts of future operating results, revenue growth, EBITDA margin, tax rates, capital expenditures, depreciation, working capital, weighted average cost of capital, long-term growth rates, risk premiums, terminal values and fair market values of our reporting units and assets. Changes in estimates or the application of alternative assumptions could produce significantly different results. There were
no
impairments to our goodwill in 2016.
Our slots gaming rights and casinos' trade names are considered indefinite-lived intangible assets that do not require amortization based on our future expectations to operate our gaming facilities and use the trade names indefinitely and our historical experience in renewing these intangible assets at minimal cost with various state gaming commissions. Our Big Fish Games trade name is also considered an indefinite-lived intangible asset. These indefinite intangible assets are tested annually, or more frequently, if indicators of impairment exist, by comparing the fair value of the recorded assets to their carrying amount. If the carrying amount of the slots gaming rights and trade name intangible assets exceed fair value, an impairment loss is recognized. There were
no
impairments to our indefinite-lived intangible assets in 2016.
Property and Equipment
We have a significant investment in long-lived property and equipment. Property and equipment are recorded at cost. Judgments are made in determining the estimated useful lives of assets, the salvage values to be assigned to assets and if or when an asset has been impaired. The accuracy of these estimates affects the amount of depreciation expense recognized in the financial results and whether to record a gain or loss on disposition of an asset.
We review the carrying value of our property and equipment used in our operations whenever events or changes in circumstances indicate that the carrying value of an asset may not be recoverable from estimated future undiscounted cash flows expected to
66
Churchill Downs Incorporated
Notes to Consolidated Financial Statements
result from its use and eventual disposition. Adverse industry or economic trends, lower projections of profitability, or a significant adverse change in legal factors or in the business climate, among other items, may be indications of potential impairment issues. If the undiscounted cash flows exceed the carrying value, no impairment is indicated. If the undiscounted cash flows do not exceed the carrying value, an impairment is recorded based on the fair value of the asset.
There are three generally accepted approaches available in developing an opinion of value: 1) the cost approach which is the price a prudent investor would pay to produce or construct a similar new item; 2) the market approach which is typically used for land valuations by analyzing recent sales transactions of similar sites; and 3) the income approach which is based on a discounted cash flow model using the estimated future results of the relevant reporting unit discounted using our weighted-average cost of capital and market indicators of terminal year free cash flow multiples. If necessary, we solicit third-party valuation expertise to assist in the valuation of our assets. We apply the most indicative approach to the overall valuation, or in some cases, a weighted analysis of any or all of these methods. The determination of fair value uses accounting judgments and estimates, including market conditions and the reliability is dependent upon the availability and comparability of the market data uncovered, as well as the decision making criteria used by market participants when evaluating a property. Changes in estimates or application of alternative assumptions could produce significantly different results.
Depreciation is calculated using the straight-line method over the estimated useful lives of the related assets as follows: 10 to 40 years for grandstands and buildings, 2 to 10 years for equipment, 2 to 10 years for furniture and fixtures and 10 to 20 years for tracks and other improvements.
Income Taxes
We use estimates and judgments for financial reporting to determine our current tax liability and deferred taxes. In accordance with the liability method of accounting for income taxes, we recognize the amount of taxes payable or refundable for the current year and deferred tax assets and liabilities for the future tax consequences of events that have been recognized in the consolidated financial statements or tax returns.
Adjustments to deferred taxes are determined based upon the changes in differences between the book basis and tax basis of our assets and liabilities and measured using enacted tax rates we estimate will be applicable when these differences are expected to reverse. Changes in current tax laws, enacted tax rates or the estimated level of taxable income or non-deductible expense could change the valuation of deferred tax assets and liabilities and affect the overall effective tax rate and tax provision.
When tax returns are filed, it is highly certain that some positions taken will be sustained upon examination by the taxing authorities, while others are subject to uncertainty about the merits of the position taken or the amount of the position that will be ultimately sustained. The benefit of a tax position is recognized in the financial statements in the period during which, based on all available evidence, management believes it is more likely than not that the position will be sustained upon examination, including the resolution of appeals or litigation processes, if any. Tax positions taken are not offset or aggregated with other positions. Tax positions that meet the more-likely-than-not recognition threshold are measured as the largest amount of tax benefit that is more than 50 percent likely of being realized upon settlement with the applicable taxing authority. The portion of the benefits associated with the tax positions taken that exceeds the amount measured as described above is reflected as a liability for unrecognized tax benefits in the accompanying balance sheet, along with any associated interest and penalties that would be payable to the taxing authorities upon examination.
Cash and Cash Equivalents
We consider investments with original maturities of three months or less to be cash equivalents. We have, from time to time, cash in the bank in excess of federally insured limits. Checks issued but not presented to banks frequently result in overdraft balances for accounting purposes and are classified as a current liability in the accompanying Consolidated Balance Sheets.
Restricted Cash and Account Wagering Deposit Liabilities
Restricted cash represents amounts due to horsemen for purses, stakes and awards as well as customer deposits collected for advance deposit wagering. Account wagering deposit liabilities consist of deposits received from TwinSpires.com and Velocity customers to be used to fund wagering through the TwinSpires players' accounts.
Foreign Currency Transactions
The functional currency of our international subsidiaries is the U.S. dollar, with the exception of the Big Fish Games Luxembourg subsidiary, whose functional currency is the Euro. For subsidiaries with a functional currency of the U.S. dollar, foreign currency denominated monetary assets and liabilities are remeasured into U.S. dollars at current exchange rates and foreign currency denominated nonmonetary assets and liabilities are remeasured into U.S. dollars at historical exchange rates. Foreign currency denominated revenue and expense are remeasured at historical exchange rates. Gains or losses from foreign currency remeasurement are included in other income and expense. For the Luxembourg subsidiary, assets and liabilities are translated into U.S. dollars using exchange rates in effect at the end of a reporting period. Income and expense accounts are translated into U.S. dollars using
67
Churchill Downs Incorporated
Notes to Consolidated Financial Statements
average rates of exchange. The net gain or loss resulting from translation is recorded as foreign currency translation adjustment and included in accumulated other comprehensive income in shareholders' equity.
Allowance for Doubtful Accounts Receivable
We maintain an allowance for doubtful accounts for estimated losses resulting from the inability of our customers to make required payments. The allowance is maintained at a level considered appropriate based on historical and other factors that affect collectability. Uncollectible accounts receivable are written off against the allowance for doubtful accounts receivable when management determines that the probability of payment is remote and collection efforts have ceased.
Game Software Development
Game software development costs for Big Fish Games includes costs for internally developed and purchased third party software for free-to-play games and premium game software purchased from third parties.
Costs associated with internally developed online only free-to-play game software are capitalized according to the accounting guidance governing computer software developed or obtained for internal use. Costs associated with internally developed free-to-play game software that allows the user to access content in both an online and offline mode are capitalized as game software development once technological feasibility of the software has been established.
Any costs incurred during the preliminary project stage are expensed; costs incurred during the application development stage are capitalized as game software development and costs incurred during the post-implementation/operation stage are expensed. Any costs incurred prior to the establishment of technological feasibility are expensed when incurred as research and development costs.
Once the software is placed in operation, we amortize the capitalized software cost as an operating expense over its estimated economic useful life, which is typically
18
months to
three
years. In addition, enhancements to existing games that increase the functionality of the game are capitalized as game software development and amortized as an operating expense over the game’s estimated economic useful life which is typically
18
months.
Purchased third party free-to-play game software is capitalized as game software development and amortized, once placed into service, over the game’s estimated economic useful life, which is typically
18
months.
Purchased third party software for premium games is capitalized as game software development, and amortized, once placed into service, over the game’s estimated economic useful life, which is typically
12
months.
Internal Use Software and Research & Development
Internal use software costs for TwinSpires, I-Gaming and Big Fish Games software are capitalized in property and equipment, in accordance with accounting guidance governing computer software developed or obtained for internal use. Once the software is placed in operation, we amortize the capitalized software over its estimated economic useful life, which is generally
three
years.
We capitalized internal use software in accordance with accounting guidance governing computer software developed or obtained for internal use primarily related to TwinSpires and I-Gaming of approximately
$12.2 million
in 2016,
$8.9 million
in 2015 and
$7.4 million
in 2014. The estimated useful life of capitalized software is generally
three
years, once a project has commenced. We incurred amortization expense of approximately
$8.9 million
in 2016,
$7.0 million
in 2015 and
$6.0 million
in 2014 for projects which had been placed in service. Capitalized internal use software is included in property and equipment, net.
Research and development expenditures are expensed as incurred. We incurred research and development expense of
$39.0 million
in 2016 and
$39.4 million
in 2015.
Fair Value of Assets and Liabilities
We adhere to a hierarchy for ranking the quality and reliability of the information used to determine fair values. Assets and liabilities that are carried at fair value are classified and disclosed in one of the following three categories: Level 1: Unadjusted quoted market prices in active markets for identical assets or liabilities; Level 2: Unadjusted quoted prices in active markets for similar assets or liabilities, unadjusted quoted prices for identical or similar assets or liabilities in markets that are not active, or inputs other than quoted prices that are observable for the asset or liability; and Level 3: Unobservable inputs for the asset or liability. We endeavor to utilize the best available information in measuring fair value. Financial assets and liabilities are classified based on the lowest level of input that is significant to the fair value measurement.
Investments in and Advances to Unconsolidated Affiliates
We have investments in unconsolidated affiliates accounted for under the equity method. Under the equity method, carrying value is adjusted for our share of the investees' income and losses, amortization of certain basis differences as well as capital contributions to and distributions from these companies. Distributions in excess of equity method income are recognized as a return of investment
68
Churchill Downs Incorporated
Notes to Consolidated Financial Statements
and recorded as investing cash inflows in the accompanying Consolidated Statements of Cash Flows. We classify income and losses as well as gains and impairments related to our investments in unconsolidated affiliates as a component of other income (expense) in the accompanying Consolidated Statements of Comprehensive Income.
We evaluate our investments in unconsolidated affiliates for impairment whenever events or changes in circumstances indicate that the carrying value of the investment may have experienced an "other-than-temporary" decline in value. If such conditions exist, we compare the estimated fair value of the investment to its carrying value to determine if an impairment is indicated and determine whether the impairment is "other-than-temporary" based on an assessment of all relevant factors, including consideration of our intent and ability to retain our investment until the recovery of the unrealized loss. We estimate fair value using a discounted cash flow analysis based on estimated future results of the investee.
Debt Issuance Costs and Loan Origination Fees
We incurred debt issuance costs and loan origination fees associated with our long-term debt and notes payable, which are being amortized as interest expense over the remaining term of the credit facility. These amounts are presented as a direct deduction from the carrying amount of the associated liability.
Casino and Pari-mutuel Taxes
We recognize casino and pari-mutuel tax expense based on the statutorily determined percentage of revenue that is required to be paid to state and local jurisdictions in the states in which wagering occurs. Individual states and local jurisdictions set tax rates which range from
1.5%
to
46%
of net casino revenue and from
0.5%
to
10%
of the total pari-mutuel handle wagered by patrons.
Purse Expense
We recognize purse expense based on the statutorily determined percentage of revenue that is required to be paid out in the form of purses to the qualifying finishers of horseraces run at our racetracks in the period in which wagering occurs. We incur a liability for all unpaid purses to be paid out. We may pay out purses in excess of statutorily determined amounts resulting in purse overpayments, which are expensed as incurred. Recoveries of purse overpayments are recognized in the period they are realized.
Self-insurance Accruals
We are self-insured up to certain limits for costs associated with general liability, workers’ compensation and employee health coverage, and we purchase insurance for claims that exceed our self-insurance retention or deductible levels. We record self-insurance reserves that include accruals of estimated settlements for known claims ("Case Reserves"), as well as accruals of third-party actuarial estimates for claims incurred but not yet reported ("IBNR"). Case Reserves represent estimated liabilities for unpaid losses, based on a claims administrator's estimates of future payments on individual reported claims, including allocated loss adjustment expense, which generally include claims settlement costs such as legal fees. IBNR includes the provision for unreported claims, changes in case reserves and future payments on reopened claims.
Key variables and assumptions include, but are not limited to, loss development factors and trend factors such as changes in workers' compensation laws, medical care costs and wages. These loss development factors and trend factors are developed using our actual historical losses. It is possible that reasonable alternative selections would produce materially different reserve estimates. We believe the estimates of future liability are reasonable based upon this methodology; however, changes in key variables and assumptions, or generally in health care costs, accident frequency and severity could materially affect the estimate for these reserves.
Advertising and Marketing
We expense the costs of general advertising, marketing and associated promotional expenditures at the time the costs are incurred. We incurred advertising and marketing expense of approximately
$151.0 million
in 2016,
$130.7 million
in 2015 and
$28.8 million
in 2014.
Stock-Based Compensation
All stock-based payments to employees, including grants of employee stock options and restricted stock, are recognized as compensation expense over the service period based on the fair value on the date of grant.
Computation of Net Income per Common Share
Net income per common share is presented for both basic earnings per common share ("Basic EPS") and diluted earnings per common share ("Diluted EPS"). Earnings attributable to securities that are deemed to be participating securities are excluded from the calculation of Basic EPS using the two-class method. We have determined that employee restricted stock grants, including awards granted under our long-term incentive plans, are participating securities. Basic EPS is based upon the weighted average number of common shares outstanding during the period, excluding unvested restricted stock and stock options held by employees. Diluted EPS is based upon the weighted average number of common and potential common shares outstanding during the period. Potential common shares result from the assumed exercise of outstanding stock options as well as unvested restricted stock, the
69
Churchill Downs Incorporated
Notes to Consolidated Financial Statements
proceeds of which are then assumed to have been used to repurchase outstanding common stock using the treasury stock method. For periods in which we report a net loss, all potential common shares are considered anti-dilutive and are excluded from calculations of Diluted EPS. For periods in which we report net income, potential common shares with exercise prices in excess of our average common stock fair value for the related period are considered anti-dilutive and are excluded from calculations of Diluted EPS.
Recent Accounting Pronouncements
Recently Adopted Accounting Pronouncements
In March 2016, the Financial Accounting Standards Board ("FASB") issued Accounting Standards Update ("ASU") No. 2016-09, Improvements to Employee Share-Based Payment Accounting, which simplifies various aspects related to share-based payments. Previously, tax benefits in excess of compensation cost ("windfalls") were recorded as an increase to shareholders' equity. Under the new ASU, windfalls are recorded as a component of income tax expense. ASU 2016-09 also requires that tax-related cash flows resulting from share-based payments be reported as a part of cash flows from operating activities. We early adopted this guidance, prospectively, as of January 1, 2016 and during the year ended December 31, 2016 recognized an income tax benefit of
$4.9 million
which was recorded as a component of income taxes in cash flows provided by operating activities in the accompanying Consolidated Statements of Cash Flows. Prior to adoption of this ASU, windfalls were presented as a component of cash flows from financing activities. Upon the adoption of this ASU, we elected to account for forfeitures when incurred under a modified retrospective approach which did not impact our financial statements. The adoption of this ASU did not have a material impact on diluted earnings per share.
In August 2014, the FASB issued ASU No. 2014-15, Disclosure of Uncertainties about an Entity's Ability to Continue as a Going Concern, which explicitly requires management to assess our ability to continue as a going concern, and to provide related footnote disclosures in certain circumstances. Management is required to assess, in each interim and annual period, if there is substantial doubt of an entity's ability to continue as a going concern as evidenced by relevant known or knowable conditions including an entity's ability to meet its future obligations. Management is required to provide disclosures regardless of whether substantial doubt is alleviated by management's plans. We adopted this new standard as of December 31, 2016. The adoption of this guidance did not have a material impact on our Consolidated Financial Statements.
Recent Accounting Pronouncements Not Yet Adopted
In August 2016, the FASB issued ASU No. 2016-15, Statement of Cash Flows, a consensus of the FASB’s Emerging Issues Task Force. The new guidance is intended to reduce diversity in practice in how certain transactions are classified in the statement of cash flows. The guidance will become effective for us in 2017. The adoption of the new accounting guidance is not expected to have a material impact on our Consolidated Financial Statements.
In May 2014, the FASB issued ASU No. 2014-09, Revenue from Contracts with Customers, which provides a five-step analysis of transactions to determine when and how revenue is recognized. The core principle is that a company should recognize revenue in a manner that depicts the transfer of promised goods or services to customers in an amount that reflects the consideration to which the entity expects to be entitled in exchange for those goods or services. The revised guidance will become effective for us in 2018 and will be applied retrospectively to each period presented or as a cumulative-effect adjustment as of the date of adoption. We anticipate this standard may have a material impact on our Consolidated Financial Statements. While we are continuing to assess all potential impacts of the standard, we believe the most significant impact primarily relates to our accounting for breakage revenue for our outstanding premium game credits for Big Fish Games.
In February 2016, the FASB issued ASU No. 2016-02, Leases, which requires companies to generally recognize on the balance sheet operating and financing lease liabilities and corresponding right-of-use assets. ASU 2016-02 is effective for us in 2019 on a modified retrospective basis with earlier adoption permitted. We are currently evaluating the impact of our pending adoption of ASU 2016-02 on our Consolidated Financial Statements, and we expect that most of our operating lease commitments will be subject to the new standard and recognized as operating lease liabilities and right-of-use assets upon our adoption of ASU 2016-02.
In June 2016, the FASB issued ASU No. 2016-13, Financial Instruments - Credit Losses, which introduces a new model for recognizing credit losses on financial instruments based on an estimate of current expected credit losses. The new model will apply to: (1) loans, accounts receivable, trade receivables and other financial assets measured at amortized cost, (2) loan commitments and certain other off-balance sheet credit exposures, (3) debt securities and other financial assets measured at fair value through other comprehensive income, and (4) beneficial interests in securitized financial assets. The guidance will become effective for us in 2020. We are assessing the impact of the new accounting guidance and currently cannot estimate the financial statement impact of adoption.
70
Churchill Downs Incorporated
Notes to Consolidated Financial Statements
3. ACQUISITIONS AND NEW VENTURES
California Internet Gaming
During May 2015, our Internet real-money gaming operation, I-Gaming, entered into an agreement with a licensed card room operator to provide Internet-based interactive gaming services within California, should enabling legislation be enacted in California which would permit such activities. The term of the agreement commences after enabling legislation and upon the acceptance of the first customer wager and will then continue for a
ten
-year period. Under the agreement, I-Gaming and the licensed operator will jointly provide a platform for operations, obtain and maintain required licenses and regulatory approvals and operate Internet-based interactive gaming services that will be marketed to California residents and may include poker and other real-money gaming activities. At this time, it is difficult to assess whether this legislation will be enacted into law and the effect it would have on our business.
Big Fish Games
On December 16, 2014, we completed the acquisition of Big Fish Games, a global producer and distributor of social casino, casual and mid-core free-to-play and premium paid games for PC, Mac and mobile devices. Big Fish Games is headquartered in Seattle, Washington and has locations in Oakland, California and Luxembourg. We acquired Big Fish Games to leverage its social casino and casual game experience, assembled workforce and to position ourselves in the mobile and online game industry. We financed the acquisition with borrowings under our Fourth Amended and Restated Credit Agreement (the "Senior Secured Credit Facility") and the addition of a
$200.0 million
Term Loan Facility ("Term Loan") to the existing Senior Secured Credit Facility.
The purchase price consideration was
$838.4 million
, composed of
$401.7 million
in cash, a deferred payment to the founder of Big Fish Games of
$85.3 million
, payable over
three
years and recorded at fair value of
$78.0 million
as of the acquisition date, an estimated payable to the Big Fish Games equity holders related to an income tax refund of
$18.1 million
and
$15.8 million
payable in
157,115
shares of our common stock. In addition, we are required to pay additional variable cash consideration based upon the achievement of certain performance milestones of Big Fish Games through December 31, 2015, limited to a maximum of
$350.0 million
based on achievement of certain non-GAAP earnings targets before interest and tax. In 2015, Big Fish Games achieved its earnout milestones, and in March 2016, we made our first earnout payment of
$281.6 million
. The remaining deferred earnout payment of
$68.4 million
will be made in 2017.
The estimated fair value of the earnout liability at the acquisition date was
$324.7 million
. We estimated the fair value of the deferred payment and the earnout liability using a discounted cash flows analysis over the period in which the obligation is expected to be settled, and applied a discount rate based on our cost of debt. The cost of debt as of the closing date was based on the observed market yields of our Senior Unsecured Notes issued in December of 2013 and was adjusted for the difference in seniority and term of the deferred payment and the earnout liability. Refer to Note 16, Fair Value of Assets and Liabilities, for further discussion of the fair value measurement of the deferred payment and the earnout liability.
Goodwill of
$540.3 million
arising from the acquisition consisted largely of projected future revenue and profit growth, including benefits from Big Fish Games’ expertise in the mobile and online games industry, particularly social casinos. All of the goodwill was assigned to Big Fish Games, which remains a stand-alone business for purposes of segment reporting. None of the goodwill recognized will be deducted for tax purposes.
The acquisition of Big Fish Games is included in acquisition of businesses, net of cash acquired, in the investing section of the accompanying Consolidated Statements of Cash Flows in the amount of
$366.0 million
, net of cash acquired of
$34.7 million
. Included in non-cash investing activities for the year ended December 31, 2014 is common stock issued in connection with the acquisition of
$15.8 million
, earnout liability of
$324.7 million
and deferred payments of
$97.1 million
.
Acquisition-related costs in the amount of
$6.4 million
were charged directly to operations and were included in selling, general and administrative expense in the accompanying Consolidated Statements of Comprehensive Income. Acquisition-related costs included legal, advisory, valuation, accounting and other fees incurred.
During 2015, we obtained additional information to assist us in determining the values of the liabilities assumed at the acquisition date and changes which occurred during the measurement period. A measurement period adjustment was recorded related to estimated payroll taxes associated with the earnout liability. We retroactively adjusted the December 31, 2014 Consolidated Balance Sheet and increased deferred tax assets by
$0.8 million
, increased goodwill by
$1.4 million
and increased accrued expense by
$2.2 million
. We completed our valuation during the fourth quarter of 2015. During 2015, we made payments of
$18.7 million
to Big Fish Games former equity holders for the receipt of federal and state income tax refunds and working capital adjustments related to the acquisition and we made a scheduled deferred founder payment of
$28.4 million
.
The following table summarizes the final fair value of the assets acquired and liabilities assumed, net of cash acquired of
$34.7 million
, at the date of acquisition:
71
Churchill Downs Incorporated
Notes to Consolidated Financial Statements
|
(in millions)
|
Total
|
||
|
Accounts receivable
|
$
|
19.4
|
|
|
Income taxes receivable
|
18.1
|
|
|
|
Prepaid expense
|
9.7
|
|
|
|
Deferred income taxes
|
1.7
|
|
|
|
Other assets
|
1.8
|
|
|
|
Property and equipment
|
14.6
|
|
|
|
Goodwill
|
540.3
|
|
|
|
Other intangible assets
|
362.9
|
|
|
|
Total assets acquired
|
968.5
|
|
|
|
Accounts payable
|
9.1
|
|
|
|
Accrued expense
|
19.2
|
|
|
|
Income taxes payable
|
0.2
|
|
|
|
Deferred revenue
|
37.3
|
|
|
|
Deferred income taxes
|
96.2
|
|
|
|
Other liabilities
|
2.8
|
|
|
|
Total liabilities assumed
|
164.8
|
|
|
|
Purchase price, net of cash acquired
|
$
|
803.7
|
|
The final fair value of other intangible assets consists of the following:
|
(in millions)
|
Fair Value Recognized
|
Weighted-Average Useful Life
|
|||
|
Tradename
|
$
|
200.0
|
|
N/A
|
|
|
Customer relationships
|
32.7
|
|
2.3 years
|
||
|
Developed Technology
|
87.0
|
|
3.9 years
|
||
|
In-Process Research & Development
|
12.7
|
|
5.0 years
|
||
|
Strategic Developer Relationships
|
30.5
|
|
4.8 years
|
||
|
Total intangible assets
|
$
|
362.9
|
|
||
We engaged a third-party valuation firm to assist in our analysis of the fair value of tangible and intangible assets acquired. All estimates, key assumptions and forecasts were either provided by or reviewed by us. While we chose to utilize a third-party valuation firm, the fair value analysis and related valuation represents the conclusions of management and not the conclusions of any third party.
Depreciation of property and equipment is calculated using the straight-line method over the estimated useful lives of the related assets as follows: 1 to 5 years for computer hardware and software and 2 to 10 years for office furniture, fixtures and equipment. The estimated useful lives for leasehold improvements is 3 to 10 years based on the shorter of the estimated useful life of the improvement or the lease term.
The tradename was valued using the relief-from-royalty valuation technique, which estimates the fair value of the intangible asset by discounting the fair value of the hypothetical royalty payments a market participant would be willing to pay to enjoy the benefits of the asset. A royalty rate of
5.0%
was used based on a review of third-party licensing agreements given Big Fish Games’ brand recognition and competitive position in the market. The tradename was assigned an indefinite life based on our intention to keep the Big Fish Games name for an indefinite period of time.
In valuing the customer relationships, the replacement cost valuation technique was used. The value was determined based on the number of paying customers and average cost per customer. Developed technology was valued using the relief-from-royalty valuation technique based upon revenue derived from games within the premium paid, social casino and casual and mid-core free-to-play categories. Big Fish Games pays royalties of
10.0%
to
25.0%
to its developers and these rates were used in the valuation.
As of the valuation date, Big Fish Games had a portfolio of free-to-play games expected to launch in 2015 and
one
game expected to launch in 2016. We estimated that the majority of the revenue associated with games launched in 2015 would be
five
years and
72
Churchill Downs Incorporated
Notes to Consolidated Financial Statements
the game launched in 2016 would be
six
years. The fair value was calculated using the relief-from-royalty valuation technique and a royalty rate of
10.0%
was used in the valuation.
Strategic developers are third-party alliance partners that develop content exclusively for Big Fish Games. In the valuation of strategic developer relationships, the comparative valuation technique was used to calculate the fair value. In estimating the fair value, the analysis considered the differences in the present value of the cash flows associated with the strategic developers and without the strategic developers.
As of the valuation date, the fair value of Big Fish Games’ deferred revenue was
$37.3 million
, which reflects the costs including network and delivery, royalties, third party platform fees, game operations and corporate expense, plus a market participant margin.
During the period from December 16, 2014 through December 31, 2014, Big Fish Games contributed revenue of
$13.9 million
and loss from operations before provision for income taxes of
$2.9 million
.
Pro Forma Information (unaudited)
The following table illustrates the impact on net revenue and earnings from operations as if we had acquired Big Fish Games as of the beginning of 2014. The pro forma results have been prepared for comparative purposes only and do not purport to be indicative of the results of operations that would have occurred had the acquisition of Big Fish Games been consummated at the beginning of 2014.
|
Year ended December 31,
|
|||
|
(in millions)
|
2014
|
||
|
Net revenue
|
$
|
1,126.6
|
|
|
Income from operations before provision from income taxes
|
$
|
64.1
|
|
4. ACCOUNTS RECEIVABLE
Accounts receivable is comprised of the following:
|
As of December 31,
|
|||||||
|
(in millions)
|
2016
|
2015
|
|||||
|
Trade receivables
|
$
|
31.6
|
|
$
|
33.0
|
|
|
|
Derby-related receivables
|
27.2
|
|
17.6
|
|
|||
|
Simulcast and mobile and online wagering receivables
|
21.1
|
|
14.8
|
|
|||
|
Other receivables
|
5.0
|
|
6.2
|
|
|||
|
84.9
|
|
71.6
|
|
||||
|
Allowance for doubtful accounts
|
(3.5
|
)
|
(3.8
|
)
|
|||
|
Total
|
$
|
81.4
|
|
$
|
67.8
|
|
|
Big Fish Games' accounts receivable was
$24.7 million
in 2016 and
$25.7 million
in 2015. These amounts were included within trade receivables and primarily represent amounts due from mobile, retail and publishing partners.
We recognized bad debt expense of
$1.1 million
in 2016,
$0.9 million
in 2015 and
$0.7 million
in 2014 in our TwinSpires segment associated with customer wagering on TwinSpires.com.
73
Churchill Downs Incorporated
Notes to Consolidated Financial Statements
5. PROPERTY AND EQUIPMENT
Property and equipment is comprised of the following:
|
As of December 31,
|
|||||||
|
(in millions)
|
2016
|
2015
|
|||||
|
Grandstands and buildings
|
$
|
414.3
|
|
$
|
412.4
|
|
|
|
Equipment
|
275.5
|
|
252.1
|
|
|||
|
Tracks and other improvements
|
157.3
|
|
142.8
|
|
|||
|
Land
|
117.5
|
|
118.7
|
|
|||
|
Furniture and fixtures
|
57.4
|
|
52.1
|
|
|||
|
Construction in progress
|
27.4
|
|
22.8
|
|
|||
|
Artwork
|
2.1
|
|
2.1
|
|
|||
|
1,051.5
|
|
1,003.0
|
|
||||
|
Accumulated depreciation
|
(477.1
|
)
|
(429.8
|
)
|
|||
|
Total
|
$
|
574.4
|
|
$
|
573.2
|
|
|
Depreciation expense was $
55.7 million
in
2016
, $
53.6 million
in
2015
and $
55.0 million
in
2014
and is classified in operating expense in the accompanying Consolidated Statements of Comprehensive Income.
In 2014, we recognized accelerated depreciation expense of
$2.4 million
, primarily related to Calder's barns which were not utilized subsequent to December 31, 2014.
On November 4, 2014, we ceased operations of Luckity and recorded an impairment charge of
$3.2 million
in our TwinSpires segment for property and equipment specifically associated with Luckity.
On November 8, 2016, we completed the sale of
61
acres of excess, undeveloped land at Calder for which we received total proceeds of
$25.6 million
. We recognized a gain of
$23.7 million
on the sale of the Calder land, which is included in operating expenses in the accompanying Consolidated Statement of Comprehensive Income.
The Company received proceeds from the Calder land sale of
$25.6 million
, of which
$14.0 million
was placed in a qualified intermediary trust, which will purchase previously identified real property during the first half of 2017. As of December 31, 2016, we had a receivable from escrow of
$13.6 million
from the qualified intermediary trust, which is included in our accompanying Consolidated Balance Sheets.
6. CALDER EXIT COSTS
On July 1, 2014, we finalized an agreement with The Stronach Group ("TSG") that expires on December 31, 2020 under which we permit TSG to operate and manage Calder's racetrack and certain other racing and training facilities and to provide live horseracing under Calder’s racing permits. During the term of the agreement, TSG pays Calder a racing services fee and is responsible for the direct and indirect costs of maintaining the racing premises, including the training facilities and applicable barns, and TSG receives the associated revenue from the operation.
In late 2014 and into 2015, we assessed potential alternative uses of the Calder property that are not associated with the TSG lease agreement. Based on our analysis, we razed the barns that were not associated with the TSG agreement and commenced the demolition of the grandstand and certain ancillary facilities. The Company recognized Calder exit costs of
$2.5 million
in 2016,
$13.9 million
in 2015, and
$2.3 million
in 2014 in our accompanying Consolidated Statements of Comprehensive Income related to demolition costs for the removal of the grandstand. The Calder exit costs recognized in 2015 included a non-cash impairment charge of
$12.7 million
to reduce the net book value of the grandstand assets to zero.
Refer to Note 5, Property and Equipment, for the description of the gain on the Calder land sale of
$23.7 million
.
74
Churchill Downs Incorporated
Notes to Consolidated Financial Statements
7. INVESTMENTS IN AND ADVANCES TO UNCONSOLIDATED AFFILIATES
Summarized below is financial information for our equity investments:
|
December 31,
|
|||||||
|
(in millions)
|
2016
|
2015
|
|||||
|
Assets
|
|||||||
|
Current assets
|
$
|
38.8
|
|
$
|
34.2
|
|
|
|
Noncurrent assets
|
363.0
|
|
339.5
|
|
|||
|
Total assets
|
$
|
401.8
|
|
$
|
373.7
|
|
|
|
Liabilities and Members' Equity
|
|||||||
|
Current liabilities
|
$
|
77.5
|
|
$
|
44.4
|
|
|
|
Noncurrent liabilities
|
69.3
|
|
79.7
|
|
|||
|
Members' equity
|
255.0
|
|
249.6
|
|
|||
|
Total liabilities and members' equity
|
$
|
401.8
|
|
$
|
373.7
|
|
|
|
Years Ended December 31,
|
|||||||||||
|
(in millions)
|
2016
|
2015
|
2014
|
||||||||
|
Net revenue:
|
|||||||||||
|
Net revenue
|
$
|
216.1
|
|
$
|
195.2
|
|
$
|
147.3
|
|
||
|
Operating expense
|
161.3
|
|
152.4
|
|
124.0
|
|
|||||
|
Operating income
|
54.8
|
|
42.8
|
|
23.3
|
|
|||||
|
Interest and other expense, net
|
(6.9
|
)
|
(6.2
|
)
|
(5.0
|
)
|
|||||
|
Net income
|
$
|
47.9
|
|
$
|
36.6
|
|
$
|
18.3
|
|
||
Miami Valley Gaming Joint Venture
We acquired a
50%
joint venture in MVG, which has a harness racetrack and video lottery terminal ("VLT") gaming facility in Lebanon, Ohio, with Delaware North Companies Gaming & Entertainment Inc. ("DNC") in 2012. Total consideration was
$60.0 million
, of which
$10.0 million
was funded at closing with the remainder funded through a
$50.0 million
note payable with a
six
year term effective upon the commencement of gaming operations.
Since both we and DNC have participating rights over MVG, and both must consent to MVG's operating, investing and financing decisions, we account for MVG using the equity method.
The joint venture's long-term debt consists of a
$50.0 million
secured note payable from MVG payable quarterly over
6
years through August 2019 at a
5.0%
interest rate for which it has funded
$25.0 million
in principal repayments. We received distributions from MVG of
$15.0 million
in 2015 and in 2016.
Our accompanying Consolidated Statements of Comprehensive Income include our
50%
share of MVG's results as follows:
|
Years Ended December 31,
|
|||||||||||
|
(in millions)
|
2016
|
2015
|
2014
|
||||||||
|
Equity in income of unconsolidated investments
|
$
|
14.2
|
|
$
|
10.6
|
|
$
|
8.9
|
|
||
SHRI Equity Investment
On October 2, 2015, we completed the acquisition of a
25%
equity investment in Saratoga Casino Holdings LLC ("SCH") which owns Saratoga Casino and Raceway ("Saratoga's New York facility") in Saratoga Springs, New York, for
$24.5 million
from Saratoga Harness Racing, Inc. ("SHRI"). Saratoga's New York facility has a casino with approximately
1,700
VLTs, a
1/2
-mile harness racetrack with a racing simulcast center, and
three
dining facilities. Saratoga's New York facility has a
50%
interest in a joint venture with DNC to manage the Gideon Putnam Hotel and Resort. We signed a
five
-year management agreement with SCH to manage Saratoga's New York facility for which we receive management fee revenue.
75
Churchill Downs Incorporated
Notes to Consolidated Financial Statements
On July 6, 2016, Saratoga's New York facility completed a significant expansion which included a
117
-room hotel, additional dining facilities and a
3,000
square-foot multi-functional event space.
On November 21, 2016, we completed the acquisition of a
25%
equity investment in Saratoga Casino Black Hawk in Black Hawk, Colorado ("Saratoga's Colorado facility") for
$6.5 million
from SHRI. Saratoga's Colorado facility has a casino with approximately
600
slot machines,
seven
table games,
three
lounges and
two
dining facilities.
Our investment in SCH recorded under the equity method includes our share of the basis difference between the fair value of property and equipment and definite-lived intangible assets of
$3.7 million
and
$2.7 million
, respectively. These basis differences are charged to expense over the remaining estimated useful lives of the property and equipment and intangible assets and are recorded as a component of equity in income of unconsolidated investments. Basis differences related to non-depreciable assets, such as land and indefinite lived-intangible assets, are not being amortized. In 2016, we received distributions from SCH of
$1.2 million
.
Saratoga Harness Racing Inc.
In 2014, we entered into a
50%
joint venture with SHRI which unsuccessfully bid on the development of a destination casino and resort in the Capital Region of New York. As part of the bidding process, we incurred
$1.0 million
in equity losses in our Other Investments segment associated with the license application process and funded
$3.3 million
to the joint venture. As a result of the bid decision, we recorded an impairment loss of
$1.6 million
to reduce our investment in the joint venture to its fair value. In 2016, the joint venture disposed of its remaining asset reducing our investment to
zero
.
8. GOODWILL
Goodwill is comprised of the following:
|
(in millions)
|
Racing
|
Casinos
|
TwinSpires
|
Big Fish Games
|
Total
|
||||||||||||||
|
Balance as of December 31, 2014
|
$
|
51.7
|
|
$
|
117.6
|
|
$
|
131.3
|
|
$
|
540.3
|
|
$
|
840.9
|
|
||||
|
Additions
|
—
|
|
—
|
|
0.8
|
|
—
|
|
0.8
|
|
|||||||||
|
Balance as of December 31, 2015
|
51.7
|
|
|
117.6
|
|
|
132.1
|
|
540.3
|
|
841.7
|
|
|||||||
|
Adjustments
|
—
|
|
—
|
|
—
|
|
(9.5
|
)
|
(9.5
|
)
|
|||||||||
|
Balance as of December 31, 2016
|
$
|
51.7
|
|
$
|
117.6
|
|
$
|
132.1
|
|
$
|
530.8
|
|
$
|
832.2
|
|
||||
We performed our annual goodwill impairment analysis for 2016 in accordance with ASU No. 2011-08, Intangibles-Goodwill and Other: Testing Goodwill for Impairment.
This analysis included an assessment of quantitative factors to determine whether it is more likely than not that the fair values of the reporting units are less than the carrying amounts. We assessed our goodwill by performing step one fair value calculations on a quantitative basis for each of our reporting units. We concluded that the fair values of our reporting units exceeded the carrying values and therefore step two of the assessment was not required. We concluded that goodwill had
no
t been impaired based on the annual goodwill impairment analysis.
In the fourth quarter of 2016, the Company recorded an out-of-period adjustment to increase deferred tax assets and decrease goodwill by
$9.5 million
to correct errors that originated in the purchase price allocation for Big Fish Games. The Company determined that the error was not material to any of the Company's prior annual and interim period financial statements.
The carrying amount of our reporting segments has been retrospectively adjusted to conform to the 2016 presentation as discussed in Note 2, Significant Accounting Policies.
76
Churchill Downs Incorporated
Notes to Consolidated Financial Statements
9. OTHER INTANGIBLE ASSETS
Other intangible assets are comprised of the following:
|
December 31, 2016
|
December 31, 2015
|
||||||||||||||||||||||
|
(in millions)
|
Gross
Carrying
Amount
|
Accumulated
Amortization
|
Net
Carrying
Amount
|
Gross
Carrying
Amount
|
Accumulated
Amortization
|
Net
Carrying
Amount
|
|||||||||||||||||
|
Definite-lived intangible assets:
|
|||||||||||||||||||||||
|
Developed technology
|
$
|
87.0
|
|
$
|
(45.6
|
)
|
$
|
41.4
|
|
$
|
87.0
|
|
$
|
(23.3
|
)
|
$
|
63.7
|
|
|||||
|
Customer relationships
|
43.0
|
|
(33.3
|
)
|
9.7
|
|
75.1
|
|
(46.6
|
)
|
28.5
|
|
|||||||||||
|
Strategic development
|
25.0
|
|
(7.3
|
)
|
17.7
|
|
30.5
|
|
(6.6
|
)
|
23.9
|
|
|||||||||||
|
In-process research & development
|
12.7
|
|
(5.1
|
)
|
7.6
|
|
12.7
|
|
(2.6
|
)
|
10.1
|
|
|||||||||||
|
Favorable contracts
|
11.0
|
|
(6.2
|
)
|
4.8
|
|
11.0
|
|
(5.5
|
)
|
5.5
|
|
|||||||||||
|
Other
|
3.7
|
|
(1.0
|
)
|
2.7
|
|
3.7
|
|
(0.9
|
)
|
2.8
|
|
|||||||||||
|
Table games license
|
2.7
|
|
(0.4
|
)
|
2.3
|
|
2.5
|
|
(0.3
|
)
|
2.2
|
|
|||||||||||
|
Slots gaming license
|
2.3
|
|
(1.1
|
)
|
1.2
|
|
2.3
|
|
(1.1
|
)
|
1.2
|
|
|||||||||||
|
$
|
187.4
|
|
$
|
(100.0
|
)
|
$
|
87.4
|
|
$
|
224.8
|
|
$
|
(86.9
|
)
|
$
|
137.9
|
|
||||||
|
Indefinite-lived intangible assets:
|
|||||||||||||||||||||||
|
Trademarks
|
225.7
|
|
225.7
|
|
|||||||||||||||||||
|
Slots gaming rights
|
128.9
|
|
128.9
|
|
|||||||||||||||||||
|
Illinois Horseracing Equity Trust
|
3.3
|
|
3.3
|
|
|||||||||||||||||||
|
Other
|
0.4
|
|
0.4
|
|
|||||||||||||||||||
|
Total
|
$
|
445.7
|
|
$
|
496.2
|
|
|||||||||||||||||
Amortization expense for definite-lived intangible assets was approximately
$52.9 million
in 2016,
$56.1 million
in 2015 and
$13.3 million
in 2014 and is classified in operating expense. We submitted payments of
$2.3 million
for 2016 and 2015 for annual license fees for Calder Casino, which are being amortized to expense over the annual license period.
Indefinite-lived intangible assets consist primarily of state gaming licenses in Maine, Mississippi and Florida, rights to participate in the Horse Racing Equity Fund and trademarks.
In 2016, we reduced our customer relationships intangible assets and accumulated amortization for TwinSpires by
$4.6 million
,
$10.8 million
for Harlow's and Big Fish Games by
$16.7 million
as these amounts were fully amortized, and we reduced our strategic development intangible assets and accumulated amortization by
$5.5 million
as these amounts were fully amortized. In addition, we submitted a payment of
$0.2 million
to the State of Maine for table game fees that are being amortized over a
20
-year license period.
In 2015, we reduced our customer relationships intangible asset and accumulated amortization for TwinSpires by
$14.0 million
as this amount was fully amortized.
We performed our annual indefinite-lived intangible asset impairment analysis for 2016 in accordance with ASU No. 2012-02, Intangibles-Goodwill and Other: Testing Indefinite-Lived Intangible Assets for Impairment. This analysis included an assessment of quantitative factors to determine whether it is more likely than not that the fair values of the indefinite-lived intangible assets are less than the carrying amounts. We assessed our indefinite-lived intangible assets by performing fair value calculations for each of our indefinite-lived intangible assets. We concluded that the fair values of our indefinite-lived intangible assets exceeded the carrying values. Based on the annual indefinite-lived intangible asset impairment analysis, we concluded that indefinite-lived intangible assets were
no
t impaired.
77
Churchill Downs Incorporated
Notes to Consolidated Financial Statements
Future estimated aggregate amortization expense on existing definite-lived intangible assets for each of the next five fiscal years is as follows (in millions):
|
Years Ended December 31,
|
Estimated Amortization Expense
|
|||
|
2017
|
$
|
36.8
|
|
|
|
2018
|
$
|
18.7
|
|
|
|
2019
|
$
|
16.6
|
|
|
|
2020
|
$
|
4.6
|
|
|
|
2021
|
$
|
4.3
|
|
|
Future estimated amortization expense does not include additional payments of
$2.3 million
in
2017
and in each year thereafter for the ongoing amortization of future expected annual Florida slots gaming license fees not yet incurred or paid.
10. INCOME AND OTHER TAXES
Income Taxes
Components of the provision for income taxes are as follows:
|
Years Ended December 31,
|
|||||||||||
|
(in millions)
|
2016
|
2015
|
2014
|
||||||||
|
Current provision:
|
|||||||||||
|
Federal
|
$
|
22.0
|
|
$
|
46.1
|
|
$
|
13.2
|
|
||
|
State and local
|
2.6
|
|
3.8
|
|
2.0
|
|
|||||
|
Foreign
|
—
|
|
0.4
|
|
0.1
|
|
|||||
|
24.6
|
|
50.3
|
|
15.3
|
|
||||||
|
Deferred:
|
|||||||||||
|
Federal
|
34.4
|
|
(1.8
|
)
|
19.7
|
|
|||||
|
State and local
|
1.6
|
|
—
|
|
—
|
|
|||||
|
Foreign
|
(0.6
|
)
|
(1.6
|
)
|
(4.9
|
)
|
|||||
|
35.4
|
|
(3.4
|
)
|
14.8
|
|
||||||
|
$
|
60.0
|
|
$
|
46.9
|
|
$
|
30.1
|
|
|||
Income from operations before provision for income taxes were as follows:
|
Years Ended December 31,
|
|||||||||||
|
(in millions)
|
2016
|
2015
|
2014
|
||||||||
|
Domestic
|
$
|
168.7
|
|
$
|
114.4
|
|
$
|
76.0
|
|
||
|
Foreign
|
(0.6
|
)
|
(2.3
|
)
|
0.5
|
|
|||||
|
$
|
168.1
|
|
$
|
112.1
|
|
$
|
76.5
|
|
|||
78
Churchill Downs Incorporated
Notes to Consolidated Financial Statements
Our income tax expense is different from the amount computed by applying the federal statutory income tax rate to income before taxes as follows:
|
Years Ended December 31,
|
|||||||||||
|
(in millions)
|
2016
|
2015
|
2014
|
||||||||
|
Federal statutory tax on earnings before income taxes
|
$
|
58.8
|
|
$
|
39.2
|
|
$
|
26.8
|
|
||
|
State income taxes, net of federal income tax benefit
|
3.5
|
|
1.8
|
|
1.4
|
|
|||||
|
Non-deductible expense
|
3.3
|
|
2.6
|
|
1.0
|
|
|||||
|
Non-deductible acquisition-related charges
|
1.7
|
|
6.6
|
|
1.3
|
|
|||||
|
Manufacturing deduction
|
—
|
|
(2.0
|
)
|
—
|
|
|||||
|
Valuation allowance
|
(0.2
|
)
|
—
|
|
—
|
|
|||||
|
Windfall deduction from equity compensation
|
(4.9
|
)
|
—
|
|
—
|
|
|||||
|
Other
|
(2.2
|
)
|
(1.3
|
)
|
(0.4
|
)
|
|||||
|
$
|
60.0
|
|
$
|
46.9
|
|
$
|
30.1
|
|
|||
Components of our deferred tax assets and liabilities are as follows:
|
As of December 31,
|
|||||||
|
(in millions)
|
2016
|
2015
|
|||||
|
Deferred tax assets:
|
|||||||
|
Deferred compensation plans
|
$
|
13.3
|
|
$
|
34.1
|
|
|
|
Deferred income
|
6.3
|
|
14.3
|
|
|||
|
Allowance for uncollectible receivables
|
1.2
|
|
1.3
|
|
|||
|
Deferred liabilities
|
3.7
|
|
1.9
|
|
|||
|
Net operating losses and credit carryforward
|
9.4
|
|
11.7
|
|
|||
|
Deferred tax assets
|
33.9
|
|
63.3
|
|
|||
|
Valuation allowance
|
(0.5
|
)
|
(1.1
|
)
|
|||
|
Net deferred tax asset
|
33.4
|
|
62.2
|
|
|||
|
Deferred tax liabilities:
|
|||||||
|
Intangible assets in excess of tax basis
|
135.0
|
|
143.0
|
|
|||
|
Property and equipment in excess of tax basis
|
35.3
|
|
31.2
|
|
|||
|
Other
|
16.2
|
|
15.9
|
|
|||
|
Deferred tax liabilities
|
186.5
|
|
190.1
|
|
|||
|
Net deferred tax liability
|
$
|
(153.1
|
)
|
$
|
(127.9
|
)
|
|
As of December 31, 2016, we have federal net operating losses of
$5.1 million
which were acquired in conjunction with the acquisitions of Youbet.com. The utilization of these losses, which expire between 2023 and 2030, is limited on an annual basis pursuant to Internal Revenue Code ("IRC") § 382. We believe that we will be able to fully utilize all of these losses. In addition, we have
$1.6 million
of state net operating losses,
$0.8 million
of which was acquired in conjunction with the acquisitions of Youbet.com. These losses, which expire between 2017 and 2034, may be subject to annual limitations similar to IRC § 382. We have recorded a valuation allowance of
$0.2 million
against the state net operating losses due to the fact that it is unlikely that we will generate income in certain states which is necessary to utilize the assets.
The Internal Revenue Service ("IRS") has audited us through 2012. Subsequent years are open to examination. Big Fish Games was audited by the IRS for the tax year ended December 16, 2014 which is the last tax year prior to our acquisition of Big Fish Games. State and local tax years open for examination vary by jurisdiction.
As of December 31, 2016, we have approximately
$3.1 million
of total gross unrecognized tax benefits, excluding interest of less than
$0.1 million
. Of this amount,
$1.0 million
was related to tax positions acquired in the Big Fish Games acquisition. If the total gross unrecognized tax benefits were recognized, there would be a
$2.6 million
effect to the annual effective tax rate. We anticipate a decrease in our unrecognized tax positions of approximately
$0.8 million
during the next twelve months primarily due to the expiration of statutes of limitation.
79
Churchill Downs Incorporated
Notes to Consolidated Financial Statements
A reconciliation of the beginning and ending amount of unrecognized tax benefits is as follows:
|
(in millions)
|
2016
|
2015
|
2014
|
||||||||
|
Balance as of January 1
|
$
|
2.5
|
|
$
|
2.9
|
|
$
|
0.6
|
|
||
|
Additions for tax positions related to the current year
|
0.7
|
|
0.3
|
|
0.5
|
|
|||||
|
Additions for tax positions of prior years
|
0.1
|
|
0.3
|
|
2.1
|
|
|||||
|
Reductions for tax positions of prior years
|
(0.2
|
)
|
(1.0
|
)
|
(0.3
|
)
|
|||||
|
Balance as of December 31
|
$
|
3.1
|
|
$
|
2.5
|
|
$
|
2.9
|
|
||
Other Taxes
For the year ended December 31, 2016, we accrued a liability and recognized a
$1.5 million
selling, general and administrative expense in our accompanying Consolidated Statements of Comprehensive Income related to potential liability for the untimely submission of informational tax returns related to the years 2012 to 2015 for certain casino customers. We have not received any notification of a potential penalty nor remitted any payment, but believe an expense is probable.
On July 18, 2016, we were notified of an IRS matter under review in which we are potentially liable for non-filing of federal withholding tax information for certain TwinSpires customers, subsequent to the acquisition of YouBet in 2010. The potential civil penalty plus interest approximates
$1.6 million
. We believe that we have a strong case for the abatement of the potential penalty, and since it is not deemed probable that this amount will be paid, an accrual was not recorded at December 31, 2016.
11. SHAREHOLDERS’ EQUITY
Stock Repurchase Program
On April 23, 2013, our Board of Directors authorized the repurchase of up to
$100.0 million
of our stock in a stock repurchase program. In 2014, we repurchased
691,000
shares for
$61.6 million
in a privately negotiated transaction. The shares were retired, and the cost of the shares acquired was treated as a deduction from shareholders' equity. We funded this repurchase using available cash and borrowings under our Senior Secured Credit Facility.
On October 28, 2015, our Board of Directors authorized the repurchase of up to
$150.0 million
of our stock in a stock repurchase program. This amount included and was not in addition to any unspent amounts remaining under the prior authorization which would have expired at the end of 2015. Repurchases may be made at management’s discretion from time to time on the open market (either with or without a 10b5-1 plan) or through privately negotiated transactions. The repurchase program had no time limit and may be suspended for periods or discontinued at any time.
On November 19, 2015, we repurchased approximately
945,000
common shares for
$138.1 million
in a privately negotiated transaction with a related party, The Duchossois Group, our largest shareholder. The aggregate purchase price for the transaction was based on a share price of
$146.13
which was the average of the
twenty
-day trailing closing price for our common stock through November 18, 2015. The shares were retired, and the cost of the shares acquired was treated as a deduction from shareholders' equity. We funded this repurchase using available cash and borrowings under our Senior Secured Credit Facility.
On February 24, 2016, our Board of Directors authorized the repurchase of up to
$150.0 million
of our common stock in a stock repurchase program. The new program replaced the prior
$150.0 million
plan which was in effect at December 31, 2015 and had unused authorization of
$11.9 million
. Repurchases may be made at management’s discretion from time to time on the open market (either with or without a 10b5-1 plan) or through privately negotiated transactions. The repurchase program has no time limit and may be suspended for periods or discontinued at any time. During 2016, we repurchased
211,790
shares of our common stock in conjunction with our stock repurchase program at a total cost of
$27.6 million
based on settlement date. We have approximately
$122.4 million
of repurchase authority remaining under this program at December 31, 2016 based on settlement date.
Shareholder Rights Plan
On March 13, 2008, our Board of Directors approved a shareholder rights plan which granted each shareholder the right, in certain circumstances, to purchase a fraction of a share of Series A Junior Participating Preferred Stock at the rate of
one
right for each share of our common stock. If a person or group, together with its affiliates and associates, become an acquiring person, defined as the beneficial owner of
15%
or more of our common stock, each holder of a right (other than the person or group who has become an acquiring person) will have the right to receive, upon exercise, shares of our common stock having a value equal to
two
times the exercise price of the right. Certain persons and transactions are exempted from the definition of acquiring person. In the event that, at any time following the date such person or group becomes an acquiring person, (i) we engage in a merger or other business combination transaction in which we are not the surviving corporation (other than with an entity that acquired the shares pursuant to an offer for all outstanding shares of common stock that a majority of the independent directors determines to
80
Churchill Downs Incorporated
Notes to Consolidated Financial Statements
be fair and not inadequate and to otherwise be in the best interests of us and our shareholders, after receiving advice from
one
or more investment banking firms (a "Qualifying Offer") ), (ii) we engage in a merger or other business combination transaction (other than with an entity that acquired the shares pursuant to a Qualifying Offer) in which we are the surviving corporation and our common stock is changed or exchanged, or (iii)
50%
or more of our assets, cash flow or earnings power is sold or transferred, each holder of a right (other than the person or group who has become an acquiring person) shall thereafter have the right to receive, upon exercise, common stock of the surviving entity having a value equal to
two
times the exercise price of the right. At any time after a person or group becomes an acquiring person, and prior to the acquisition by such person or group of fifty percent
(50)%
or more of the outstanding common stock, the Board of Directors may exchange the rights (other than rights owned by such acquiring person), in whole or in part, for common stock at an exchange ratio of
one
share of common stock, or one one-thousandth of a share of preferred stock (or of a share of a class or series of our preferred stock having equivalent rights, preferences and privileges), per right (subject to adjustment).
12. DIRECTOR AND EMPLOYEE BENEFIT PLANS
Directors and Officers Retirement Plan
We provide eligible executives and directors an opportunity to defer to a future date the receipt of base and bonus compensation for services as well as director’s fees through the 2005 Deferred Compensation Plan (the "Deferred Plan"). Our matching contribution on base compensation deferral of executives equals the matching contribution of our profit-sharing plan with certain limits.
Our directors may elect to invest the deferred director fee compensation into our common stock within the Deferred Plan. Investments in our common stock are credited as hypothetical shares of common stock based on the market price of the stock at the time the compensation was earned. Upon the end of the director's service, common stock shares are issued to the director.
Other Retirement Plans
We have a profit-sharing plan that covers all employees not otherwise participating in an associated profit-sharing plan, with three months or more of service. We will match contributions made by employees up to
3%
of the employee’s annual compensation and match at
50%
contributions made by the employee up to an additional
2%
of compensation with certain limits. We may also contribute a discretionary amount determined annually by the Board of Directors as well as a year-end discretionary match not to exceed
4%
of compensation. Our cash contribution to the plan was approximately
$4.0 million
in 2016,
$3.4 million
in 2015, and
$2.5 million
in 2014.
We are a member of a noncontributory defined benefit multi-employer retirement plan for all members of the Pari-mutuel Clerk’s Union of Kentucky and several other collectively bargained retirement plans, which are administered by unions. Cash contributions are made in accordance with negotiated labor contracts. Retirement plan expense was
$0.6 million
in 2016,
$0.6 million
in 2015 and
$0.7 million
in 2014. Our policy is to fund this expense as accrued, and we currently estimate that future contributions to these plans will not increase significantly from prior years.
81
Churchill Downs Incorporated
Notes to Consolidated Financial Statements
13. TOTAL DEBT
The following table presents our total debt outstanding:
|
As of December 31, 2016
|
|||||||||||||||
|
Unamortized Premium, Debt Issuance Costs and Loan Origination Fees
|
|||||||||||||||
|
(in millions)
|
Outstanding Principal
|
Premium
|
Issuance Costs and Fees
|
Long-Term Debt, Net
|
|||||||||||
|
Senior Secured Credit Facility:
|
|||||||||||||||
|
Senior Secured Credit Facility due 2021
|
$
|
135.0
|
|
$
|
—
|
|
$
|
—
|
|
$
|
135.0
|
|
|||
|
Term Loan due 2021
|
179.3
|
|
—
|
|
0.5
|
|
178.8
|
|
|||||||
|
Swing line of credit
|
13.2
|
|
—
|
|
—
|
|
13.2
|
|
|||||||
|
Total Senior Secured Credit Facility
|
327.5
|
|
—
|
|
0.5
|
|
327.0
|
|
|||||||
|
5.375% Senior Unsecured Notes due 2021
|
600.0
|
|
2.5
|
|
7.8
|
|
594.7
|
|
|||||||
|
Total debt
|
927.5
|
|
2.5
|
|
8.3
|
|
921.7
|
|
|||||||
|
Current maturities of long-term debt
|
14.2
|
|
—
|
|
—
|
|
14.2
|
|
|||||||
|
Total debt, net of current maturities
|
$
|
913.3
|
|
$
|
2.5
|
|
$
|
8.3
|
|
$
|
907.5
|
|
|||
|
As of December 31, 2015
|
|||||||||||||||
|
Unamortized Premium, Debt Issuance Costs and Loan Origination Fees
|
|||||||||||||||
|
(in millions)
|
Outstanding Principal
|
Premium
|
Issuance Costs and Fees
|
Long-Term Debt, Net
|
|||||||||||
|
Senior Secured Credit Facility:
|
|||||||||||||||
|
Senior Secured Credit Facility due 2021
|
$
|
—
|
|
$
|
—
|
|
$
|
—
|
|
$
|
—
|
|
|||
|
Term Loan due 2021
|
188.7
|
|
—
|
|
0.6
|
|
188.1
|
|
|||||||
|
Swing line of credit
|
—
|
|
—
|
|
—
|
|
—
|
|
|||||||
|
Total Senior Secured Credit Facility
|
188.7
|
|
—
|
|
0.6
|
|
188.1
|
|
|||||||
|
5.375% Senior Unsecured Notes due 2021
|
600.0
|
|
3.0
|
|
9.3
|
|
593.7
|
|
|||||||
|
Total debt
|
788.7
|
|
|
3.0
|
|
|
9.9
|
|
|
781.8
|
|
||||
|
Current maturities of long-term debt
|
16.2
|
|
—
|
|
—
|
|
16.2
|
|
|||||||
|
Total debt, net of current maturities
|
$
|
772.5
|
|
$
|
3.0
|
|
$
|
9.9
|
|
$
|
765.6
|
|
|||
Senior Secured Credit Facility
On February 17, 2016, we entered into an amendment to our Fourth Amended and Restated Credit Agreement (the "New Agreement") which amends certain provisions of the credit agreement including extending the maturity of both the Senior Secured Credit Facility and the Term Loan (collectively the "Facilities") through February 2021, coterminous with one another. The maximum aggregate commitment for the Senior Secured Credit Facility remains at
$500.0 million
, and the unamortized Term Loan of
$188.7 million
was refinanced as part of this amendment.
On December 1, 2014, we executed the Fourth Amended and Restated Credit Agreement (the "Senior Secured Credit Facility") whereby it added a
$200.0 million
Term Loan Facility ("Term Loan") to the existing Senior Secured Credit Facility and amended certain definitions and provisions of the credit agreement including consolidated funded indebtedness, EBITDA and calculation of the total leverage ratio.
Following the execution of the New Agreement, the new maturity date for both the Senior Secured Credit Facility and the Term Loan is February 17, 2021.
Regarding the Term Loan, we were required to make quarterly principal payments that commenced on March 31, 2015, per the amortization schedule laid out in the Fourth Amended and Restated Credit Agreement. Upon the execution of the New Agreement, the amortization schedule was modified based on
$188.7 million
outstanding on the Term Loan balance. Payments are set to occur
82
Churchill Downs Incorporated
Notes to Consolidated Financial Statements
on the last day of each quarter through the new maturity date with annual paydown requirements of
5%
,
7.5%
,
10%
,
12.5%
,
15%
and a bullet payment due at maturity. The new amortization schedule calls for quarterly principal payments of
$2.4 million
that commenced on March 31, 2016 and increases in increments of
$1.2 million
on March 31 of each year to reach final year quarterly payment amounts of
$7.1 million
. If no additional payments are made, the balance due at termination will be
$94.4 million
.
Generally, borrowings made pursuant to the Senior Secured Credit Facility bear interest at a
LIBOR
-based rate per annum plus an applicable percentage ranging from
1.125%
to
2.5%
depending on our total leverage ratio. In addition, under the Senior Secured Credit Facility, we agreed to pay a commitment fee at rates that range from
0.15%
to
0.35%
of the available aggregate commitment, depending on our total leverage ratio. The Term Loan is not subject to, nor included in the calculation of, the commitment fee. The weighted average interest rate on outstanding borrowings was
2.70%
at December 31, 2016 and
1.70%
at December 31, 2015.
The Senior Secured Credit Facility contains customary affirmative and negative covenants for credit facilities of this type, including limitations on us and our subsidiaries with respect to indebtedness, restricted payments, liens, investments, mergers and acquisitions, disposition of assets, sale-leaseback transactions and transactions with affiliates. The covenants permit us to use proceeds of the credit extended under the agreement for general corporate purposes, restricted payments and acquisition needs. The Senior Secured Credit Facility also contains financial covenants that require us (i) to maintain an interest coverage ratio (i.e., consolidated adjusted EBITDA to consolidated interest expense) that is greater than
3.0
to 1.0; (ii) not to permit the total leverage ratio (i.e., total consolidated funded indebtedness to consolidated adjusted EBITDA) to be greater than
4.5
to 1.0, provided that if a certain minimum consolidated adjusted EBITDA is reached then the total leverage ratio will be increased to
5.0
to 1.0 for such periods that the minimum is maintained; and (iii) not to permit the senior secured leverage ratio (i.e. senior secured consolidated funded indebtedness to consolidated adjusted EBITDA) to be greater than
3.5
to 1.0. As of December 31, 2016, we were in compliance with all covenants under the Senior Secured Credit Facility, and substantially all of our assets continue to be pledged as collateral under the Senior Secured Credit Facility.
On December 31, 2016, we had
$344.7 million
of borrowing capacity under the Senior Secured Credit Facility.
5.375% Senior Unsecured Notes
On December 16, 2013, we completed an offering of
$300.0 million
in aggregate principal amount of
5.375%
Senior Unsecured Notes that mature on December 15, 2021 (the "Initial Senior Unsecured Notes" or the "Existing Notes"). The Initial Senior Unsecured Notes were issued at par, with interest payable on June 15
th
and December 15
th
of each year. We received net proceeds of
$295.0 million
, after deducting underwriting fees, and used the net proceeds from the offering to repay a portion of our outstanding borrowings, and accrued and unpaid interest outstanding under our (then) Third Amended and Restated Credit Agreement ("Senior Secured Credit Facility"). In connection with the issuance, we capitalized
$6.3 million
of debt issuance costs which are being amortized as interest expense over the remaining term of the Initial Senior Unsecured Notes.
On December 16, 2015, we completed an additional offering of
$300.0 million
in aggregate principal amount of
5.375%
Senior Unsecured Notes that mature on December 15, 2021 (the "Tack-on Notes"). The Tack-on Notes were issued under the December 16, 2013 Indenture governing the
$300.0 million
Existing Notes, and form a part of the same series as the Existing Notes for purposes of the Indenture. The Tack-on Notes were issued at
101%
with interest payable on June 15
th
and December 15
th
of each year. We received net proceeds of
$299.0 million
, after deducting underwriting fees, and used the net proceeds from the offering to repay our outstanding revolver borrowings along with accrued and unpaid interest outstanding under the Senior Secured Credit Facility. In connection with the issuance, we capitalized
$4.7 million
of debt issuance costs which are being amortized as interest expense over the remaining term of the Tack-on Notes.
Upon completion of this Tack-on Notes offering, the aggregate principal amount of the outstanding notes under this series is
$600.0 million
(collectively the "Senior Unsecured Notes.") The Tack-on Notes were offered with different CUSIP and ISIN numbers from the Existing Notes and as a result thereof, will not trade fungibly until they have been assigned the same CUSIP and ISIN numbers. It is expected that the Tack-on Notes will be exchanged into the unrestricted CUSIP and ISIN numbers currently assigned to the Existing Notes one year from the date of issuance.
Both series of the Senior Unsecured Notes were issued in private offerings that were exempt from registration under the Securities Act of 1933, as amended, and are senior unsecured obligations. The total Senior Unsecured Notes are guaranteed by each of our domestic subsidiaries that guarantee our Senior Secured Credit Facility and will rank equally with our existing and future senior obligations. At any time prior to December 15, 2016, we could have redeemed all or part of the total Senior Unsecured Notes at a price equal to
100%
of the principal amount of the notes redeemed plus a "make-whole" premium, together with accrued and unpaid interest and additional interest, if any, to the redemption date. On or after December 15, 2016, we may redeem all or part of the Senior Unsecured Notes at a redemption price of
104.0%
which gradually reduces to par by 2019.
83
Churchill Downs Incorporated
Notes to Consolidated Financial Statements
Future aggregate maturities of total debt are as follows:
|
Years Ended December 31,
|
||||
|
(in millions)
|
||||
|
2017
|
$
|
14.2
|
|
|
|
2018
|
18.9
|
|
||
|
2019
|
23.6
|
|
||
|
2020
|
28.3
|
|
||
|
2021
|
842.5
|
|
||
|
Thereafter
|
—
|
|
||
|
Total
|
$
|
927.5
|
|
|
14. OPERATING LEASES
Future minimum operating lease payments on non-cancelable leases are as follows, not including the variable portion of contingent leases:
|
Years Ended December 31,
|
||||
|
(in millions)
|
||||
|
2017
|
$
|
11.9
|
|
|
|
2018
|
7.8
|
|
||
|
2019
|
9.8
|
|
||
|
2020
|
9.1
|
|
||
|
2021
|
10.0
|
|
||
|
Thereafter
|
85.0
|
|
||
|
Total
|
$
|
133.6
|
|
|
We also lease totalisator equipment, audio/visual equipment and operate certain facilities that are partially contingent on handle revenue, bandwidth usage or race days. Total annual rent expense for contingent lease payments, including totalisator equipment, audio/visual equipment, land and facilities, was approximately
$3.4 million
in 2016,
$3.5 million
in 2015 and
$3.6 million
in
2014
. Our total rent expense for all operating leases, including the contingent lease payments, was
$24.7 million
in 2016,
$25.4 million
in 2015 and
$20.2 million
in
2014
. During 2015, the increase in total rent expense primarily reflects a full year of Big Fish Games lease expense.
In 2002, as part of financing improvements to the Churchill Downs facility, we transferred title of the Churchill Downs facility to the City of Louisville, Kentucky and leased back the facility. Subject to the terms of the lease, we can re-acquire the facility at any time for
$1.00
.
15. STOCK-BASED COMPENSATION PLANS
On December 31, 2016, we have stock-based employee compensation plans as described below. Our total compensation expense, which includes expense related to restricted stock awards, restricted stock unit awards, restricted performance units awards, stock option awards, and stock options associated with our employee stock purchase plan was
$18.9 million
in 2016,
$13.8 million
in 2015 and
$11.9 million
in 2014.
Retirement of Executive Chairman of the Board of Directors
Our former Executive Chairman of the Board of Directors and Chief Executive Officer, Robert L. Evans, retired effective September 30, 2015. Mr. Evans continues as a member of the Board of Directors. In conjunction with Mr. Evans' retirement, we amended his previous Change in Control, Severance, and Indemnity Agreement and upon his retirement, we accelerated vesting on
29,218
shares of restricted stock which were previously awarded and recognized compensation expense of
$1.3 million
in 2015 for the acceleration of the restricted stock awards.
2016 Omnibus Stock Incentive Plan
On February 24, 2016, we replaced our previous stock compensation program, the Churchill Downs Incorporated 2007 Omnibus Stock Incentive Plan (the "2007 Incentive Plan") with a new program, the Churchill Downs Incorporated 2016 Omnibus Stock
84
Churchill Downs Incorporated
Notes to Consolidated Financial Statements
Incentive Plan ("the 2016 Incentive Plan"). The 2016 Incentive Plan is intended to advance our long-term success by encouraging stock ownership among key employees and the Board of Directors. Awards may be in the form of stock options, stock appreciation rights, restricted stock, restricted stock units, performance shares, performance units or performance cash. The 2016 Incentive Plan has a minimum vesting period of
one
year for awards granted. During 2016, we awarded stock compensation under both the 2007 Incentive Plan and the 2016 Incentive Plan.
Employee Stock Options
We have stock options outstanding under the 2007 Incentive Plan. The 2007 Incentive Plan provides that the exercise price of any incentive stock option may not be less than the fair market value of the common stock on the date of grant. Outstanding stock options under the 2007 Incentive Plan have contractual terms of
ten
years and generally vest ratably on each anniversary of the grant date over a
three
year period.
No
stock options have been awarded under the 2016 Incentive Plan.
Activity for our stock options outstanding is presented below:
|
(in thousands, except per average exercise price)
|
Number of Shares Under Option
|
Weighted Average Exercise Price
|
||||
|
Balance as of December 31, 2013
|
193
|
|
$
|
36.04
|
|
|
|
Granted
|
—
|
|
$
|
—
|
|
|
|
Exercises
|
(182
|
)
|
$
|
35.26
|
|
|
|
Canceled/forfeited
|
(1
|
)
|
$
|
49.95
|
|
|
|
Balance as of December 31, 2014
|
10
|
|
$
|
48.63
|
|
|
|
Granted
|
—
|
|
$
|
—
|
|
|
|
Exercises
|
(1
|
)
|
$
|
49.95
|
|
|
|
Canceled/forfeited
|
—
|
|
$
|
—
|
|
|
|
Balance as of December 31, 2015
|
9
|
|
$
|
48.37
|
|
|
|
Granted
|
—
|
|
|
|
||
|
Exercises
|
(5
|
)
|
$
|
52.58
|
|
|
|
Canceled/forfeited
|
—
|
|
|
|
||
|
Balance as of December 31, 2016
|
4
|
|
$
|
43.74
|
|
|
During 2014, Mr. Evans, our non-executive Chairman of the Board of Directors, exercised options for
180,000
shares of our common stock which were granted at
$35.19
per share, for common stock prices ranging from
$85.00
to
$91.33
per share.
On December 31, 2016, all outstanding options were vested and exercisable. The following table summarizes information about stock options outstanding on December 31, 2016:
|
(in thousands, except contractual life and per share data)
|
Shares Under
Option
|
Remaining
Contractual
Life (Years)
|
Average
Exercise Price
Per Share
|
Intrinsic
Value per
Share
(1)
|
Aggregate
Intrinsic
Value
|
|||||||||||
|
Options exercisable and vested at December 31, 2016
|
4
|
|
1.8
|
$
|
43.74
|
|
$
|
106.71
|
|
$
|
437
|
|
||||
|
(1)
|
Computed based upon the amount by which the fair market value of our common stock on December 31, 2016 of
$150.45
per share exceeded the weighted average exercise price.
|
The total intrinsic value of stock options exercised was
$0.4 million
in 2016,
$0.1 million
in 2015 and
$9.6 million
in 2014. Cash received from stock option exercises totaled
$0.2 million
in 2016,
$0.1 million
in 2015 and
$6.4 million
in 2014.
Restricted Shares and Restricted Stock Units
The 2016 Incentive Plan and the 2007 Incentive Plan (collectively "the 2016 and 2007 Plans") permit the award of restricted shares or restricted stock units to directors and key employees, including our officers who are from time to time responsible for the management, growth and protection of our business. Restricted shares granted under the 2016 and 2007 Plans generally vest either in full upon
three
years from the date of grant, on a pro-rata basis over a
three
year term or upon retirement at or after age 60. The fair value of restricted shares that vest solely based on continued service under the 2016 and 2007 Plans is determined by the product of the number of shares granted and the grant date market price of our common stock.
85
Churchill Downs Incorporated
Notes to Consolidated Financial Statements
On September 22, 2015, the Board of Directors approved the adoption of the Executive Long-Term Incentive Compensation Plan (the "ELTI Plan"), pursuant to which certain named executive officers ("NEOs") and other key executives ("Grantees") may earn variable equity payouts based upon us achieving certain key performance metrics over a specified period. The ELTI Plan was adopted pursuant to 2016 and 2007 Plans, which were previously approved by our shareholders.
2016 Awards
On February 23, 2016, certain NEOs received the following:
|
•
|
24,677
restricted stock units ("RSU") vesting equally over
three
service periods ending December 31, 2016, December 31, 2017 and December 31, 2018; and
|
|
•
|
29,633
performance share units ("PSU") with vesting contingent on financial performance measures at the end of a
34
-month performance period ending December 31, 2018.
|
The performance criteria for the 2016 PSU awards are a cumulative Adjusted EBITDA target that was set at the beginning of the plan performance period for the entire
three
year period, and a cash flow metric that is the aggregate of the cash flow targets for the
three
individual years that is set annually at the beginning of each year. The cash flow metric is defined as cash flow from operating activities plus distributions of capital from equity investments less capital maintenance expenditures. The Compensation Committee can make adjustments as it may deem appropriate to these metrics. Measurement against these criteria will be determined against a payout curve which provides up to
200%
of performance share units based on the original award.
The performance criteria also includes a relative total shareholder return ("TSR") component. Our TSR will be ranked versus the companies in the Russell 2000 index and will be calculated based on our relative placement within the Russell 2000 index. The PSU awards may be adjusted based on the Company’s TSR, by increasing the PSU awards by
25%
if the Company’s TSR is in the top quartile, decreasing the PSU awards by
25%
if the Company’s TSR is in the bottom quartile, and providing no change to the PSU awards if the Company’s TSR is in the middle two quartiles.
The total compensation cost we will recognize under the PSUs will be determined using the Monte Carlo valuation methodology and will be based upon an equal performance weighting for the two financial measures and then adjusted based on the Company’s TSR performance within the Russell 2000 index. The maximum number of PSUs that can be earned for a performance period is
250%
of the original award.
In 2016, we recognized compensation expense of
$7.7 million
related to the 2016 grants for RSUs, PSUs and other employee grants made during 2016. At December 31, 2016, compensation expense that has not been amortized attributable to unvested 2016 RSU and PSU awards was
$4.3 million
and
$4.9 million
for 2016 other awards.
2015 Awards
On September 22, 2015, certain NEOs received the following:
|
•
|
22,142
RSUs vesting equally over
two
service periods ending December 31, 2016 and December 31, 2017; and
|
|
•
|
27,282
PSUs with vesting contingent on financial performance measures at the end of a
30
-month performance period ending December 31, 2017.
|
The performance criteria for the 2015 PSUs are consistent with the 2016 Awards described above.
In 2016, we recognized compensation expense of $
3.8 million
related to the 2015 RSU and PSU grants and at December 31, 2016, unrecognized compensation expense related to these awards was
$2.6 million
. In 2015, we recognized compensation expense of
$0.9 million
related to the 2015 grants for RSUs and PSUs.
Other Awards
In 2016, we awarded
72,529
of restricted stock shares to other employees, the majority of which vest equally over
three
service periods ending in the first quarter of 2019. In 2016, we recognized
$4.4 million
of compensation expense related to these awards. On December 31, 2016, unrecognized compensation expense attributable to all unvested service period awards was
$7.7 million
. The weighted average period over which we expect to recognize the remaining compensation expense under the service period awards approximates
1.3
years.
In 2015, we awarded NEOs, Grantees and certain other employees
167,800
restricted shares of our common stock vesting over service periods ranging from
seven
months to
three
years. In 2016, we recognized
$4.7 million
of compensation expense and in 2015, we recognized
$6.2 million
of compensation expense related to these awards. On December 31, 2016, unrecognized compensation expense attributable to all unvested service period awards was
$3.0 million
. The weighted average period over which we expect to recognize the remaining compensation expense under the service period awards approximates
13
months.
86
Churchill Downs Incorporated
Notes to Consolidated Financial Statements
Activity for the ELTI Plan, the 2013 New Company LTIP, the 2016 and 2007 Plans and awards made outside of stock-based compensation plans is presented below:
|
Market Condition & Performance-Based Awards
|
Service Period Awards
|
Total
|
||||||||||||||||||
|
(in thousands, except grant date values)
|
Number of
Shares
|
Weighted
Average
Grant Date
Fair Value
|
Number of
Shares
|
Weighted
Average
Grant Date
Fair Value
|
Number of
Shares
|
Weighted
Average
Grant Date
Fair Value
|
||||||||||||||
|
Balance as of December 31, 2013
|
324
|
|
$
|
53.71
|
|
349
|
|
$
|
53.58
|
|
673
|
|
$
|
53.64
|
|
|||||
|
Granted
|
—
|
|
$
|
—
|
|
26
|
|
$
|
88.58
|
|
26
|
|
$
|
88.58
|
|
|||||
|
Vested
|
(239
|
)
|
$
|
53.49
|
|
(107
|
)
|
$
|
54.15
|
|
(346
|
)
|
$
|
53.70
|
|
|||||
|
Canceled/forfeited
|
—
|
|
$
|
—
|
|
(12
|
)
|
$
|
60.41
|
|
(12
|
)
|
$
|
60.41
|
|
|||||
|
Balance as of December 31, 2014
|
85
|
|
$
|
54.32
|
|
256
|
|
$
|
56.24
|
|
341
|
|
$
|
55.77
|
|
|||||
|
Granted
|
27
|
|
$
|
154.90
|
|
190
|
|
$
|
102.09
|
|
217
|
|
$
|
108.73
|
|
|||||
|
Vested
|
(85
|
)
|
$
|
48.31
|
|
(150
|
)
|
$
|
64.87
|
|
(235
|
)
|
$
|
58.91
|
|
|||||
|
Canceled/forfeited
|
—
|
|
$
|
—
|
|
(9
|
)
|
$
|
93.04
|
|
(9
|
)
|
$
|
93.04
|
|
|||||
|
Balance as of December 31, 2015
|
27
|
|
$
|
154.90
|
|
287
|
|
$
|
80.90
|
|
314
|
|
$
|
87.31
|
|
|||||
|
Granted
|
30
|
|
$
|
141.02
|
|
97
|
|
$
|
132.64
|
|
127
|
|
$
|
134.60
|
|
|||||
|
Vested
|
—
|
|
$
|
—
|
|
(186
|
)
|
$
|
70.81
|
|
(186
|
)
|
$
|
70.81
|
|
|||||
|
Canceled/forfeited
|
—
|
|
$
|
—
|
|
(6
|
)
|
$
|
100.31
|
|
(6
|
)
|
$
|
100.31
|
|
|||||
|
Balance as of December 31, 2016
|
57
|
|
$
|
147.67
|
|
192
|
|
$
|
114.33
|
|
249
|
|
$
|
121.95
|
|
|||||
On December 31, 2016, there was
$15.6 million
of unrecognized stock-based compensation expense related to nonvested restricted share awards, RSU and PSU awards that we expect to recognize over a weighted average period of
1.3
years.
On December 31, 2016, NEOs held
56,915
restricted shares subject to performance-based vesting criteria (all of which are considered performance based restricted shares), which were issued during 2016 and 2015. The number of these shares that vest is based upon established performance-based targets that will be assessed on an ongoing basis.
Employee Stock Purchase Plan
Under the Employee Stock Purchase Plan (the "ESP Plan"), we are authorized to sell, pursuant to short-term stock options, shares of our common stock to our full-time and qualifying part-time employees at a discount from our common stock’s fair market value. The ESP Plan operates on the basis of recurring, consecutive
one
-year periods. Each period commences on August 1 and ends on the following July 31.
Each August 1, we offer eligible employees the opportunity to purchase common stock. Employees who elect to participate for each period have a designated percentage of their after-tax compensation withheld and applied to the purchase of shares of common stock on the last day of the period, July 31. The ESP Plan allows withdrawals, terminations and reductions on the amounts being deducted. The purchase price for the common stock is
85%
of the lesser of the fair market value of the common stock on (i) the first day of the period, or (ii) the last day of the period. No employee may purchase common stock under the ESP Plan valued at more than
$25 thousand
for each calendar year.
On July 31, 2016, employees purchased approximately
18 thousand
shares of common stock pursuant to options granted on August 1, 2015. Because the plan year overlaps our fiscal year, the number of shares to be sold pursuant to options granted on August 1, 2016, can only be estimated because the 2016 plan year is not yet complete. Our estimate of options granted in 2016 under the ESP Plan is based on the number of shares sold to employees under the ESP Plan for the 2015 plan year, adjusted to reflect the change in the number of employees participating in the ESP Plan in 2016. We recognized compensation expense related to the ESP Plan of
$0.7 million
in 2016,
$0.6 million
in 2015 and
$0.4 million
in 2014.
87
Churchill Downs Incorporated
Notes to Consolidated Financial Statements
16. FAIR VALUE OF ASSETS AND LIABILITIES
We endeavor to utilize the best available information in measuring fair value. Financial assets and liabilities are classified based on the lowest level of input that is significant to the fair value measurement. The following tables present our assets and liabilities measured at fair value on a recurring basis:
|
December 31, 2016
|
|||||||
|
(in millions)
|
Level 1
|
Level 3
|
|||||
|
Cash equivalents and restricted cash
|
$
|
34.1
|
|
$
|
—
|
|
|
|
Big Fish Games deferred payments
|
—
|
|
27.8
|
|
|||
|
Big Fish Games earnout liability
|
—
|
|
67.9
|
|
|||
|
Total
|
$
|
34.1
|
|
$
|
95.7
|
|
|
|
December 31, 2015
|
|||||||
|
(in millions)
|
Level 1
|
Level 3
|
|||||
|
Cash equivalents and restricted cash
|
$
|
30.1
|
|
$
|
—
|
|
|
|
Big Fish Games deferred payments
|
—
|
|
54.8
|
|
|||
|
Big Fish Games earnout liability
|
—
|
|
345.2
|
|
|||
|
Bluff contingent consideration liability
|
—
|
|
2.3
|
|
|||
|
Total
|
$
|
30.1
|
|
402.3
|
|
||
The following table presents the change in fair value of our instruments classified within Level 3:
|
Fair Value Measurements Using Significant Unobservable Inputs (Level 3)
|
|||||||||||||||
|
(in millions)
|
Big Fish Games Deferred Payments
|
Big Fish Games Earnout Liability
|
Bluff Contingent Consideration
|
Total
|
|||||||||||
|
Balance as of December 31, 2015
|
$
|
54.8
|
|
$
|
345.2
|
|
$
|
2.3
|
|
$
|
402.3
|
|
|||
|
Payments
|
(28.4
|
)
|
(281.6
|
)
|
—
|
|
(310.0
|
)
|
|||||||
|
Change in fair value
|
1.4
|
|
4.3
|
|
(2.3
|
)
|
3.4
|
|
|||||||
|
Balance as of December 31, 2016
|
$
|
27.8
|
|
$
|
67.9
|
|
$
|
—
|
|
$
|
95.7
|
|
|||
Our cash equivalents and restricted cash, which are held in interest-bearing accounts, qualify for Level 1 in the fair value hierarchy which includes unadjusted quoted market prices in active markets for identical assets.
We estimated the fair values of the Big Fish Games deferred payment and earnout liability as of December 31, 2016 using a discounted cash flows analysis over the period in which the obligations are expected to be settled, and applied a discount rate of
2.3%
based on our cost of debt. The cost of debt was based on the observed market yields of our Senior Unsecured Notes, a Level 3 fair value measurement, and was adjusted for the difference in seniority and term of the deferred payments and earnout liability. The increase in fair values of the Big Fish Games deferred payment and earnout liability of
$5.7 million
in 2016 and
$21.7 million
in 2015 was recorded as acquisition expense in the accompanying Consolidated Statements of Comprehensive Income. In December 2016 and 2015, we paid our deferred founder’s payment totaling
$28.4 million
each year. Changes to our cost of debt could lead to different fair value estimates for the deferred payments and earnout liability. A one-percentage point change in the discount rate would increase or decrease the fair values of the Big Fish Games deferred payment and earnout liability by
$1.0 million
.
Our accrued liability for a contingent consideration recorded in conjunction with the Bluff acquisition was based on significant inputs not observed in the market and represent a Level 3 fair value measurement. The estimate of the contingent consideration liability used an income approach and was based on the probability of achieving enabling legislation which permits Internet poker gaming and the probability-weighted discounted cash flows. During the fourth quarter of 2016, the Company eliminated the contingent liability as the legislation did not pass and thus the contingency period expired in February 2017. Therefore, the Company recorded a
$2.3 million
reduction of acquisition expenses, net, in the accompanying Consolidated Statements of Comprehensive Income in 2016.
We currently have no other assets or liabilities subject to fair value measurement on a recurring basis. Our
$600.0 million
par value Senior Unsecured Notes are disclosed at fair value which is based on unadjusted quoted prices for similar liabilities in
88
Churchill Downs Incorporated
Notes to Consolidated Financial Statements
markets that are not active. The fair value of the Senior Unsecured Notes was
$622.5 million
at December 31, 2016 and
$604.1 million
at December 31, 2015.
The following methods and assumptions were used in estimating our fair value disclosures for financial instruments:
Cash equivalents—The carrying amount reported in the balance sheet for cash equivalents approximates our fair value due to the short-term maturity of these instruments.
Long-term debt: Senior Secured Credit Facility—The carrying amounts of the borrowings under the Senior Secured Credit Facility approximate fair value, based upon current interest rates, representing a Level 2 fair value measurement.
We did not measure any assets at fair value on a non-recurring basis for 2015 and 2016.
17. CONTINGENCIES
We are involved in litigation arising in the ordinary course of conducting business. We carry insurance for workers' compensation claims from our employees and general liability for claims from independent contractors, customers and guests. We are self-insured up to an aggregate stop loss for our general liability and workers' compensation coverages.
We review all litigation on an ongoing basis when making accrual and disclosure decisions. For certain legal proceedings, we cannot reasonably estimate losses or a range of loss, if any, particularly for proceedings that are in the early stages of development or where the plaintiffs seek indeterminate damages. Various factors, including, but not limited to, the outcome of potentially lengthy discovery and the resolution of important factual questions, may need to be determined before probability can be established or before a loss or range of loss can be reasonably estimated. In accordance with current accounting standards for loss contingencies and based upon information currently known to us, we establish reserves for litigation when it is probable that a loss associated with a claim or proceeding has been incurred and the amount of the loss or range of loss can be reasonably estimated. When no amount within the range of loss is a better estimate than any other amount, we accrue the minimum amount of the estimable loss. To the extent that such litigation against us may have an exposure to a loss in excess of the amount we have accrued, we believe that such excess would not be material to our consolidated financial condition, results of operations, or cash flows. Legal fees are expensed as incurred.
If the loss contingency in question is not both probable and reasonably estimable, we do not establish an accrual and the matter will continue to be monitored for any developments that would make the loss contingency both probable and reasonably estimable. In the event that a legal proceeding results in a substantial judgment against, or settlement by us, there can be no assurance that any resulting liability or financial commitment would not have a material adverse impact on our business.
89
Churchill Downs Incorporated
Notes to Consolidated Financial Statements
18. NET INCOME PER COMMON SHARE COMPUTATIONS
The following is a reconciliation of the numerator and denominator of the net income per common share computations:
|
Years Ended December 31,
|
|||||||||||
|
(in millions, except per share data)
|
2016
|
2015
|
2014
|
||||||||
|
Numerator for basic income per common share:
|
|||||||||||
|
Net income
|
$
|
108.1
|
|
$
|
65.2
|
|
$
|
46.4
|
|
||
|
Net income allocated to participating securities
|
(1.0
|
)
|
(0.6
|
)
|
(0.3
|
)
|
|||||
|
Numerator for basic net income per common share
|
$
|
107.1
|
|
$
|
64.6
|
|
$
|
46.1
|
|
||
|
Numerator for diluted income per common share
|
$
|
108.1
|
|
$
|
65.2
|
|
$
|
46.4
|
|
||
|
Denominator for net income per common share:
|
|||||||||||
|
Basic
|
16.4
|
|
17.2
|
|
17.3
|
|
|||||
|
Plus dilutive effect of stock options and restricted stock
|
0.2
|
|
0.1
|
|
0.1
|
|
|||||
|
Plus dilutive effect of participating securities
|
0.2
|
|
0.3
|
|
0.2
|
|
|||||
|
Diluted
|
16.8
|
|
17.6
|
|
17.6
|
|
|||||
|
Income per common share:
|
|||||||||||
|
Basic
|
$
|
6.52
|
|
$
|
3.75
|
|
$
|
2.67
|
|
||
|
Diluted
|
$
|
6.42
|
|
$
|
3.71
|
|
$
|
2.64
|
|
||
19. SEGMENT INFORMATION
We manage our operations through
six
operating segments:
|
•
|
Racing, which includes Churchill Downs, Arlington International Race Course ("Arlington"), Fair Grounds Race Course ("Fair Grounds") and Calder;
|
|
•
|
Casinos, which includes Oxford Casino ("Oxford"), Riverwalk Casino ("Riverwalk"), Harlow's Casino ("Harlow’s"), Calder Casino, Fair Grounds Slots, Video Services, LLC ("VSI"),
50%
of EBITDA from our joint venture, MVG, and
25%
of EBITDA from our equity investment, SCH, which includes investments in Saratoga's New York facility and Saratoga's Colorado facility;
|
|
•
|
TwinSpires, which includes TwinSpires.com, Fair Grounds Account Wagering ("FAW"), Velocity, Bloodstock Research Information Services ("BRIS"), Bluff and I-Gaming;
|
|
•
|
Big Fish Games, which is a global producer and distributor of social casino, casual and mid-core free-to-play, and premium paid games for PC, Mac and mobile devices;
|
|
•
|
Other Investments, which includes United Tote and Capital View Casino & Resort Joint Venture ("Capital View"); and
|
|
•
|
Corporate, which includes miscellaneous and other revenue, compensation expense, professional fees and other general and administrative expense not allocated to our other operating segments.
|
Eliminations include the elimination of intersegment transactions. Our chief operating decision maker utilizes Adjusted EBITDA to evaluate segment performance, develop strategy and allocate resources. Adjusted EBITDA is defined as earnings before interest, taxes, depreciation and amortization, adjusted for the following:
Adjusted EBITDA includes our portion of the EBITDA from our equity investments.
Adjusted EBITDA excludes:
|
•
|
Acquisition expense, net which includes:
|
|
•
|
Acquisition-related charges, including fair value adjustments related to earnouts and deferred payments; and
|
|
•
|
Transaction expense, including legal, accounting, and other deal-related expense;
|
90
Churchill Downs Incorporated
Notes to Consolidated Financial Statements
|
•
|
Stock-based compensation expense;
|
|
•
|
Calder land sale;
|
|
•
|
Calder exit costs; and
|
|
•
|
Other charges and recoveries.
|
During 2016, we updated our definition of Adjusted EBITDA to exclude changes in Big Fish Games deferred revenue and to exclude depreciation and amortization from our equity investments. The prior year amounts were reclassified to conform to this presentation. We also prospectively implemented a change in accounting estimate for corporate expense allocated to other operating segments to use an activity based allocation rather than a revenue based allocation.
We utilize the Adjusted EBITDA metric because we believe the inclusion or exclusion of certain non-recurring items is necessary to provide a more accurate measure of our core operating results and enables management and investors to evaluate and compare from period to period our operating performance in a meaningful and consistent manner. Adjusted EBITDA should not be considered as an alternative to operating income as an indicator of performance, as an alternative to cash flows from operating activities as a measure of liquidity, or as an alternative to any other measure provided in accordance with U.S. generally accepted accounting principles. Our calculation of Adjusted EBITDA may be different from the calculation used by other companies and, therefore, comparability may be limited. For segment reporting, Adjusted EBITDA includes intercompany revenue and expense totals that are eliminated in the accompanying Consolidated Statements of Comprehensive Income.
91
Churchill Downs Incorporated
Notes to Consolidated Financial Statements
The tables below present net revenue from external customers and intercompany revenue from each of our operating segments, Adjusted EBITDA by segment and reconciles Comprehensive Income to Adjusted EBITDA:
|
|
Years Ended December 31,
|
||||||||||
|
(in millions)
|
2016
|
2015
|
2014
|
||||||||
|
Net revenue from external customers:
|
|||||||||||
|
Racing:
|
|||||||||||
|
Churchill Downs
|
$
|
155.2
|
|
$
|
151.1
|
|
$
|
143.2
|
|
||
|
Arlington
|
55.3
|
|
54.4
|
|
60.3
|
|
|||||
|
Fair Grounds
|
38.0
|
|
39.8
|
|
38.6
|
|
|||||
|
Calder
|
2.6
|
|
2.7
|
|
19.3
|
|
|||||
|
Total Racing
|
251.1
|
|
248.0
|
|
261.4
|
|
|||||
|
Casinos:
|
|||||||||||
|
Oxford Casino
|
84.6
|
|
80.4
|
|
76.5
|
|
|||||
|
Riverwalk Casino
|
46.1
|
|
49.8
|
|
50.1
|
|
|||||
|
Harlow’s Casino
|
48.4
|
|
49.0
|
|
50.2
|
|
|||||
|
Calder Casino
|
79.1
|
|
77.4
|
|
77.0
|
|
|||||
|
Fair Grounds Slots
|
36.9
|
|
39.0
|
|
40.8
|
|
|||||
|
VSI
|
36.9
|
|
36.9
|
|
33.7
|
|
|||||
|
Saratoga
|
0.8
|
|
0.4
|
|
—
|
|
|||||
|
Total Casinos
|
332.8
|
|
332.9
|
|
328.3
|
|
|||||
|
TwinSpires
|
220.6
|
|
200.2
|
|
191.0
|
|
|||||
|
Big Fish Games:
|
|||||||||||
|
Social casino
|
182.5
|
|
193.4
|
|
7.6
|
|
|||||
|
Casual and mid-core free-to-play
|
212.7
|
|
125.3
|
|
2.1
|
|
|||||
|
Premium
|
91.0
|
|
95.0
|
|
4.2
|
|
|||||
|
Total Big Fish Games
|
486.2
|
|
413.7
|
|
13.9
|
|
|||||
|
Other Investments
|
16.9
|
|
16.6
|
|
16.5
|
|
|||||
|
Corporate
|
1.0
|
|
0.9
|
|
1.1
|
|
|||||
|
Net revenue from external customers
|
$
|
1,308.6
|
|
$
|
1,212.3
|
|
$
|
812.2
|
|
||
|
Intercompany net revenue:
|
|||||||||||
|
Racing:
|
|||||||||||
|
Churchill Downs
|
$
|
10.0
|
|
$
|
7.8
|
|
$
|
7.0
|
|
||
|
Arlington
|
5.5
|
|
5.1
|
|
5.8
|
|
|||||
|
Fair Grounds
|
1.5
|
|
1.3
|
|
1.1
|
|
|||||
|
Calder
|
—
|
|
—
|
|
0.7
|
|
|||||
|
Total Racing
|
17.0
|
|
14.2
|
|
14.6
|
|
|||||
|
TwinSpires
|
1.3
|
|
1.1
|
|
1.0
|
|
|||||
|
Other Investments
|
3.9
|
|
3.5
|
|
4.1
|
|
|||||
|
Eliminations
|
(22.2
|
)
|
(18.8
|
)
|
(19.7
|
)
|
|||||
|
Intercompany net revenue
|
$
|
—
|
|
$
|
—
|
|
$
|
—
|
|
||
92
Churchill Downs Incorporated
Notes to Consolidated Financial Statements
Adjusted EBITDA by segment is comprised of the following:
|
Year Ended December 31, 2016
|
|||||||||||||||||||||||
|
(in millions)
|
Racing
|
Casinos
|
TwinSpires
|
Big Fish
Games |
Other Investments
|
Corporate
|
|||||||||||||||||
|
Net revenue
|
$
|
268.1
|
|
$
|
332.8
|
|
$
|
221.9
|
|
$
|
486.2
|
|
$
|
20.8
|
|
$
|
1.0
|
|
|||||
|
Taxes & purses
|
(64.2
|
)
|
(110.9
|
)
|
(11.7
|
)
|
—
|
|
—
|
|
—
|
|
|||||||||||
|
Platform & development fees
|
—
|
|
—
|
|
—
|
|
(179.9
|
)
|
—
|
|
—
|
|
|||||||||||
|
Marketing & advertising
|
(4.6
|
)
|
(12.7
|
)
|
(6.3
|
)
|
(127.9
|
)
|
—
|
|
—
|
|
|||||||||||
|
Salaries & benefits
|
(40.9
|
)
|
(50.8
|
)
|
(9.4
|
)
|
(25.0
|
)
|
(10.9
|
)
|
—
|
|
|||||||||||
|
Content expense
|
(15.6
|
)
|
—
|
|
(107.6
|
)
|
—
|
|
—
|
|
—
|
|
|||||||||||
|
SG&A expense
|
(16.2
|
)
|
(21.2
|
)
|
(11.9
|
)
|
(18.5
|
)
|
(3.4
|
)
|
(8.6
|
)
|
|||||||||||
|
Research & development
|
—
|
|
—
|
|
—
|
|
(39.0
|
)
|
—
|
|
—
|
|
|||||||||||
|
Other operating expense
|
(47.4
|
)
|
(39.1
|
)
|
(19.8
|
)
|
(15.9
|
)
|
(4.1
|
)
|
(0.6
|
)
|
|||||||||||
|
Other income (expense)
|
0.5
|
|
27.7
|
|
—
|
|
(0.9
|
)
|
0.3
|
|
0.2
|
|
|||||||||||
|
Adjusted EBITDA
|
$
|
79.7
|
|
$
|
125.8
|
|
$
|
55.2
|
|
$
|
79.1
|
|
$
|
2.7
|
|
$
|
(8.0
|
)
|
|||||
|
Year Ended December 31, 2015
|
|||||||||||||||||||||||
|
(in millions)
|
Racing
|
Casinos
|
TwinSpires
|
Big Fish
Games |
Other Investments
|
Corporate
|
|||||||||||||||||
|
Net revenue
|
$
|
262.2
|
|
$
|
332.9
|
|
$
|
201.3
|
|
$
|
413.7
|
|
$
|
20.1
|
|
$
|
0.9
|
|
|||||
|
Taxes & purses
|
(63.6
|
)
|
(109.9
|
)
|
(10.6
|
)
|
—
|
|
—
|
|
—
|
|
|||||||||||
|
Platform & development fees
|
—
|
|
—
|
|
—
|
|
(143.6
|
)
|
—
|
|
—
|
|
|||||||||||
|
Marketing & advertising
|
(6.1
|
)
|
(12.4
|
)
|
(4.8
|
)
|
(107.7
|
)
|
—
|
|
—
|
|
|||||||||||
|
Salaries & benefits
|
(39.2
|
)
|
(49.7
|
)
|
(9.9
|
)
|
(22.3
|
)
|
(11.1
|
)
|
—
|
|
|||||||||||
|
Content expense
|
(14.6
|
)
|
—
|
|
(97.9
|
)
|
—
|
|
—
|
|
—
|
|
|||||||||||
|
SG&A expense
|
(16.6
|
)
|
(24.1
|
)
|
(11.5
|
)
|
(16.8
|
)
|
(2.5
|
)
|
(6.3
|
)
|
|||||||||||
|
Research & development
|
—
|
|
—
|
|
—
|
|
(39.4
|
)
|
—
|
|
—
|
|
|||||||||||
|
Other operating expense
|
(50.9
|
)
|
(41.3
|
)
|
(18.0
|
)
|
(14.8
|
)
|
(3.8
|
)
|
1.1
|
|
|||||||||||
|
Other income (expense)
|
0.6
|
|
19.4
|
|
—
|
|
(0.6
|
)
|
0.2
|
|
0.1
|
|
|||||||||||
|
Adjusted EBITDA
|
$
|
71.8
|
|
$
|
114.9
|
|
$
|
48.6
|
|
$
|
68.5
|
|
$
|
2.9
|
|
$
|
(4.2
|
)
|
|||||
|
Year Ended December 31, 2014
|
|||||||||||||||||||||||
|
(in millions)
|
Racing
|
Casinos
|
TwinSpires
|
Big Fish
Games |
Other Investments
|
Corporate
|
|||||||||||||||||
|
Net revenue
|
$
|
276.0
|
|
$
|
328.3
|
|
$
|
192.0
|
|
$
|
13.9
|
|
$
|
20.6
|
|
$
|
1.1
|
|
|||||
|
Taxes & purses
|
(72.7
|
)
|
(108.0
|
)
|
(9.2
|
)
|
—
|
|
—
|
|
—
|
|
|||||||||||
|
Platform & development fees
|
—
|
|
—
|
|
—
|
|
(5.1
|
)
|
—
|
|
—
|
|
|||||||||||
|
Marketing & advertising
|
(6.1
|
)
|
(12.5
|
)
|
(4.7
|
)
|
(5.7
|
)
|
—
|
|
—
|
|
|||||||||||
|
Salaries & benefits
|
(45.1
|
)
|
(49.1
|
)
|
(11.5
|
)
|
(2.6
|
)
|
(11.8
|
)
|
(0.2
|
)
|
|||||||||||
|
Content expense
|
(19.0
|
)
|
—
|
|
(92.6
|
)
|
—
|
|
—
|
|
—
|
|
|||||||||||
|
SG&A expense
|
(18.4
|
)
|
(25.5
|
)
|
(13.0
|
)
|
(0.8
|
)
|
(2.8
|
)
|
(5.3
|
)
|
|||||||||||
|
Research & development
|
—
|
|
—
|
|
—
|
|
—
|
|
—
|
|
—
|
|
|||||||||||
|
Other operating expense
|
(54.1
|
)
|
(43.5
|
)
|
(21.2
|
)
|
(0.4
|
)
|
(4.5
|
)
|
(0.7
|
)
|
|||||||||||
|
Other income (expense)
|
0.6
|
|
17.5
|
|
—
|
|
—
|
|
0.1
|
|
0.1
|
|
|||||||||||
|
Adjusted EBITDA
|
$
|
61.2
|
|
$
|
107.2
|
|
$
|
39.8
|
|
$
|
(0.7
|
)
|
$
|
1.6
|
|
$
|
(5.0
|
)
|
|||||
93
Churchill Downs Incorporated
Notes to Consolidated Financial Statements
|
|
Years Ended December 31,
|
||||||||||
|
(in millions)
|
2016
|
2015
|
2014
|
||||||||
|
Reconciliation of Comprehensive Income to Adjusted EBITDA:
|
|||||||||||
|
Comprehensive income
|
$
|
107.5
|
|
$
|
64.7
|
|
$
|
46.3
|
|
||
|
Foreign currency translation, net of tax
|
(0.2
|
)
|
0.5
|
|
0.1
|
|
|||||
|
Net change in pension benefits, net of tax
|
0.8
|
|
—
|
|
—
|
|
|||||
|
Net income
|
108.1
|
|
65.2
|
|
46.4
|
|
|||||
|
Additions:
|
|||||||||||
|
Depreciation and amortization
|
108.6
|
|
109.7
|
|
68.3
|
|
|||||
|
Interest expense
|
43.7
|
|
28.6
|
|
20.8
|
|
|||||
|
Income tax provision
|
60.0
|
|
46.9
|
|
30.1
|
|
|||||
|
EBITDA
|
$
|
320.4
|
|
$
|
250.4
|
|
$
|
165.6
|
|
||
|
Adjustments to EBITDA:
|
|||||||||||
|
Selling, general and administrative:
|
|||||||||||
|
Stock-based compensation expense
|
18.9
|
|
13.8
|
|
11.9
|
|
|||||
|
Other charges
|
2.5
|
|
—
|
|
(0.4
|
)
|
|||||
|
TwinSpires operating expense
|
—
|
|
—
|
|
3.2
|
|
|||||
|
Other income, expense:
|
|||||||||||
|
Interest, depreciation and amortization expense related to equity investments
|
10.0
|
|
8.5
|
|
8.7
|
|
|||||
|
Other charges and recoveries, net
|
0.5
|
|
(5.8
|
)
|
2.6
|
|
|||||
|
Acquisition expense, net
|
3.4
|
|
21.7
|
|
10.2
|
|
|||||
|
Gain on Calder land sale
|
(23.7
|
)
|
—
|
|
—
|
|
|||||
|
Calder exit costs
|
2.5
|
|
13.9
|
|
2.3
|
|
|||||
|
Total adjustments to EBITDA
|
14.1
|
|
52.1
|
|
38.5
|
|
|||||
|
Adjusted EBITDA
|
$
|
334.5
|
|
$
|
302.5
|
|
$
|
204.1
|
|
||
|
Adjusted EBITDA by segment:
|
|||||||||||
|
Racing
|
$
|
79.7
|
|
$
|
71.8
|
|
$
|
61.2
|
|
||
|
Casinos
|
125.8
|
|
114.9
|
|
107.2
|
|
|||||
|
TwinSpires
|
55.2
|
|
48.6
|
|
39.8
|
|
|||||
|
Big Fish Games
|
79.1
|
|
68.5
|
|
(0.7
|
)
|
|||||
|
Other Investments
|
2.7
|
|
2.9
|
|
1.6
|
|
|||||
|
Corporate
|
(8.0
|
)
|
(4.2
|
)
|
(5.0
|
)
|
|||||
|
Adjusted EBITDA
|
$
|
334.5
|
|
$
|
302.5
|
|
$
|
204.1
|
|
||
The table below presents information about earnings (losses) from equity investments, net included in our reported segments:
|
Years Ended December 31,
|
|||||||||||
|
(in millions)
|
2016
|
2015
|
2014
|
||||||||
|
Casinos
|
$
|
17.4
|
|
$
|
10.9
|
|
$
|
8.9
|
|
||
|
TwinSpires
|
—
|
|
—
|
|
(0.1
|
)
|
|||||
|
Other Investments
|
—
|
|
0.3
|
|
(2.5
|
)
|
|||||
|
$
|
17.4
|
|
$
|
11.2
|
|
$
|
6.3
|
|
|||
94
Churchill Downs Incorporated
Notes to Consolidated Financial Statements
The table below presents total asset information for each of our operating segments:
|
|
As of December 31,
|
||||||
|
(in millions)
|
2016
|
2015
|
|||||
|
Total assets:
|
|||||||
|
Racing
|
$
|
454.6
|
|
$
|
437.1
|
|
|
|
Casinos
|
628.7
|
|
631.3
|
|
|||
|
TwinSpires
|
209.9
|
|
202.4
|
|
|||
|
Big Fish Games
|
893.8
|
|
947.1
|
|
|||
|
Other Investments
|
11.1
|
|
12.2
|
|
|||
|
Corporate
|
56.3
|
|
47.3
|
|
|||
|
$
|
2,254.4
|
|
$
|
2,277.4
|
|
||
The table below presents total capital expenditures for each of our operating segments:
|
|
Years Ended December 31,
|
||||||||||
|
(in millions)
|
2016
|
2015
|
2014
|
||||||||
|
Capital expenditures:
|
|||||||||||
|
Racing
|
$
|
26.1
|
|
$
|
12.3
|
|
$
|
33.9
|
|
||
|
Casinos
|
13.9
|
|
18.8
|
|
7.7
|
|
|||||
|
TwinSpires
|
7.0
|
|
4.3
|
|
5.8
|
|
|||||
|
Big Fish Games
|
5.5
|
|
6.4
|
|
0.1
|
|
|||||
|
Other Investments
|
1.0
|
|
0.8
|
|
5.3
|
|
|||||
|
Corporate
|
1.2
|
|
0.9
|
|
1.7
|
|
|||||
|
$
|
54.7
|
|
$
|
43.5
|
|
$
|
54.5
|
|
|||
20. HRTV EQUITY INVESTMENT DIVESTITURE
As part of the TSG agreement related to the cessation of Calder pari-mutuel operations in 2014, we modified our HRTV, LLC ("HRTV") operating and ownership agreement with TSG resulting in the divestiture of our interest in HRTV effective January 2, 2015. In January 2015, we received
$6.0 million
in proceeds from the sale of the ownership interest and we recorded a gain of
$5.8 million
in our Other Investments segment, which has been excluded from Adjusted EBITDA and is included in other charges and recoveries in the reconciliation of Comprehensive Income to Adjusted EBITDA.
21. RELATED PARTY TRANSACTIONS
Directors and employees may from time to time own or have interests in horses racing at our racetracks. All such races are conducted, as applicable, under the regulations of each state’s respective regulatory agency, and no director receives any extra or special benefit with regard to having his or her horses selected to run in races or in connection with the actual running of races. There is no material financial statement impact attributable to directors who may have interests in horses racing at our racetracks.
In the ordinary course of business, we may enter into transactions with certain of our officers and directors for the sale of personal seat licenses and suite accommodations at its racetracks, and tickets for its live racing events. We believe that each such transaction has been on terms no less favorable for us than could have been obtained in a transaction with a third party, and no such person received any extra or special benefit in connection with such transactions.
On November 19, 2015, we repurchased approximately
945,000
common shares for
$138.1 million
in a privately negotiated transaction with a related party, The Duchossois Group, our largest shareholder. The aggregate purchase price for the transaction was based on a share price of
$146.13
, which was the average of the
twenty
-day trailing closing price for our common stock through November 18, 2015. The shares were retired, and the cost of the shares acquired was treated as a deduction from shareholders' equity. We funded this repurchase using available cash and borrowings under our Senior Secured Credit Facility.
95
Churchill Downs Incorporated
Notes to Consolidated Financial Statements
22. SUBSEQUENT EVENTS
Ocean Downs
In August 2016, we signed a limited liability company operating agreement with SCH, with each entity having a
50%
interest, and formed Old Bay Gaming and Racing LLC (“Old Bay”). The Old Bay agreement provides both the Company and SCH equal participating rights, and both entities must consent to Old Bay’s operating, investing and financing decisions.
On January 3, 2017, Old Bay acquired all of the equity interests of Ocean Enterprise 589 LLC, Ocean Downs LLC and Racing Services LLC (collectively, “Ocean Downs”). Ocean Downs, located near Ocean City, Maryland, owns and operates video lottery terminals ("VLT") at the Casino at Ocean Downs and conducts harness racing at Ocean Downs Racetrack. The Company’s
25%
interest in SCH provides an additional
12.5%
interest, resulting in an effective
62.5%
interest in Ocean Downs. Since both the Company and SCH have participating rights and both must consent to Old Bay’s operating, investing and financing decisions, the Company will account for Ocean Downs using the equity method of accounting.
23. QUARTERLY RESULTS OF OPERATIONS (UNAUDITED)
|
(in millions, except per common share data)
|
For the Year Ended December 31, 2016
|
||||||||||||||
|
|
First Quarter
|
Second Quarter
|
Third Quarter
|
Fourth Quarter
|
|||||||||||
|
Net revenue
|
$
|
288.4
|
|
$
|
438.5
|
|
$
|
303.4
|
|
$
|
278.3
|
|
|||
|
Income from operations
|
2.8
|
|
69.8
|
|
8.7
|
|
26.8
|
|
|||||||
|
Basic net income per common share
|
$
|
0.17
|
|
$
|
4.16
|
|
$
|
0.52
|
|
$
|
1.62
|
|
|||
|
Diluted net income per common share
|
$
|
0.16
|
|
$
|
4.11
|
|
$
|
0.52
|
|
$
|
1.60
|
|
|||
|
(in millions, except per common share data)
|
For the Year Ended December 31, 2015
|
||||||||||||||
|
|
First Quarter
|
Second Quarter
|
Third Quarter
|
Fourth Quarter
|
|||||||||||
|
Net revenue
|
$
|
250.9
|
|
$
|
409.2
|
|
$
|
279.8
|
|
$
|
272.4
|
|
|||
|
(Loss) income from operations
|
(1.6
|
)
|
55.1
|
|
4.2
|
|
7.5
|
|
|||||||
|
Basic net (loss) income per common share
|
$
|
(0.09
|
)
|
$
|
3.12
|
|
$
|
0.24
|
|
$
|
0.44
|
|
|||
|
Diluted net (loss) income per common share
|
$
|
(0.09
|
)
|
$
|
3.10
|
|
$
|
0.24
|
|
$
|
0.43
|
|
|||
96
Report of Independent Registered Public Accounting Firm
To the Board of Directors and Shareholders of Churchill Downs Incorporated:
In our opinion, the consolidated financial statements listed in the index appearing under Item 15(a)(1) present fairly, in all material respects, the financial position of Churchill Downs Incorporated and its subsidiaries
at December 31, 2016
and 2015, and the results of their operations and their cash flows for each of the three years in the period ended December 31, 2016
in conformity with accounting principles generally accepted in the United States of America. In addition, in our opinion, the financial statement schedule listed in the index appearing under Item 15(a)(2)
presents fairly, in all material respects, the information set forth therein when read in conjunction with the related consolidated financial statements. Also in our opinion, the Company maintained, in all material respects, effective internal control over financial reporting as of December 31, 2016, based on criteria established in
Internal Control - Integrated Framework
(2013)
issued by the Committee of Sponsoring Organizations of the Treadway Commission (COSO). The Company's management is responsible for these financial statements and financial statement schedule, for maintaining effective internal control over financial reporting and for its assessment of the effectiveness of internal control over financial reporting, included in Management's Report on Internal Control over Financial Reporting appearing under Item 9A. Our responsibility is to express opinions on these financial statements, on the financial statement schedule, and on the Company's internal control over financial reporting based on our integrated audits. We conducted our audits in accordance with the standards of the Public Company Accounting Oversight Board (United States). Those standards require that we plan and perform the audits to obtain reasonable assurance about whether the financial statements are free of material misstatement and whether effective internal control over financial reporting was maintained in all material respects. Our audits of the financial statements included examining, on a test basis, evidence supporting the amounts and disclosures in the financial statements, assessing the accounting principles used and significant estimates made by management, and evaluating the overall financial statement presentation. Our audit of internal control over financial reporting included obtaining an understanding of internal control over financial reporting, assessing the risk that a material weakness exists, and testing and evaluating the design and operating effectiveness of internal control based on the assessed risk. Our audits also included performing such other procedures as we considered necessary in the circumstances. We believe that our audits provide a reasonable basis for our opinions.
A company’s internal control over financial reporting is a process designed to provide reasonable assurance regarding the reliability of financial reporting and the preparation of financial statements for external purposes in accordance with generally accepted accounting principles. A company’s internal control over financial reporting includes those policies and procedures that (i) pertain to the maintenance of records that, in reasonable detail, accurately and fairly reflect the transactions and dispositions of the assets of the company; (ii) provide reasonable assurance that transactions are recorded as necessary to permit preparation of financial statements in accordance with generally accepted accounting principles, and that receipts and expenditures of the company are being made only in accordance with authorizations of management and directors of the company; and (iii) provide reasonable assurance regarding prevention or timely detection of unauthorized acquisition, use, or disposition of the company’s assets that could have a material effect on the financial statements.
Because of its inherent limitations, internal control over financial reporting may not prevent or detect misstatements. Also, projections of any evaluation of effectiveness to future periods are subject to the risk that controls may become inadequate because of changes in conditions, or that the degree of compliance with the policies or procedures may deteriorate.
/s/ PricewaterhouseCoopers LLP
Louisville, Kentucky
February 28, 2017
97
|
ITEM 9.
|
CHANGES IN AND DISAGREEMENTS WITH ACCOUNTANTS ON ACCOUNTING AND FINANCIAL DISCLOSURE
|
None.
|
ITEM 9A.
|
CONTROLS AND PROCEDURES
|
Evaluation of Disclosure Controls and Procedures
We maintain disclosure controls and procedures designed to ensure that information required to be disclosed in our reports that we filed under the Securities Exchange Act of 1934, as amended, is recorded, processed, summarized, and reported within the time periods specified in the Securities and Exchange Commission rules and forms, and that such information is accumulated and communicated to our management, including our Chief Executive Officer and Chief Financial Officer, as appropriate, to allow timely decisions regarding required disclosures.
As required by the Securities and Exchange Commission Rule 13a-15(e), we carried out an evaluation, under the supervision and with the participation of management, including our Chief Executive Officer and Chief Financial Officer, of the effectiveness of the design and operation of our disclosure controls and procedures as of December 31, 2016. Based upon the foregoing, our Chief Executive Officer and Chief Financial Officer concluded that our disclosure controls and procedures were effective.
Changes in Internal Control over Financial Reporting
There has been no change in our internal controls over financial reporting during our most recent fiscal quarter that has materially affected, or is reasonably likely to materially affect our internal control over financial reporting. Our process for evaluating controls and procedures is continuous and encompasses constant improvement of the design and effectiveness of established controls and procedures
Management’s Report on Internal Control over Financial Reporting
Management is responsible for establishing and maintaining adequate internal control over financial reporting of Churchill Downs, Incorporated, as defined in Rules 13a-15(f) or 15d-15(f) under the Exchange Act. Under the supervision and with the participation of our management, including our Chief Executive Officer and Chief Financial Officer, we conducted an evaluation of the effectiveness of Churchill Downs, Incorporated internal control over financial reporting based upon the framework in the
Integrated Control-Integrated Framework (2013)
issued by the Committee of Sponsoring Organizations of the Treadway Commission. Based upon our evaluation under the framework in the
Internal Control-Integrated Framework (2013)
management has concluded that Churchill Downs, Incorporated internal control over financial reporting was effective as of December 31, 2016.
|
/s/ William C. Carstanjen
|
/s/ Marcia A. Dall
|
/s/ Chad E. Dobson
|
||
|
William C. Carstanjen
|
Marcia A. Dall
|
Chad E. Dobson
|
||
|
Chief Executive Officer
|
Executive Vice President and
|
Vice President and
|
||
|
February 28, 2017
|
Chief Financial Officer
|
Chief Accounting Officer
|
||
|
February 28, 2017
|
February 28, 2017
|
|||
The effectiveness of the Company's internal control over financial reporting as of December 31, 2016 has been audited by PricewaterhouseCoopers LLP, an independent registered public accounting firm, as stated in their report which appears herein.
|
ITEM 9B.
|
OTHER INFORMATION
|
None.
|
ITEM 10.
|
DIRECTORS, EXECUTIVE OFFICERS AND CORPORATE GOVERNANCE
|
The information with respect to our outside directors, audit committee and Section 16(a) beneficial ownership reporting compliance is incorporated by reference to the definitive proxy statement Form 14(a) to be filed with the Securities and Exchange Commission no later than 120 days after
December 31, 2016
.
We have adopted a Code of Ethics that applies to our Chief Executive Officer, Chief Financial Officer and principal financial officers. This Code of Ethics is available on our corporate website,
www.churchilldownsincorporated.com
, under the "Investors" heading and is also available to shareholders upon request.
98
Executive Officers of the Registrant
|
Name
|
Age as of 2/23/2017
|
Principal Occupation for the Past Five Years
and Position with Churchill Downs Incorporated
|
||
|
William C. Carstanjen
|
49
|
Chief Executive Officer since August 2014; President and Chief Operating Officer from March 2011 to August 2014; Chief Operating Officer from January 2009 to March 2011.
|
||
|
William E. Mudd
|
45
|
President and Chief Operating Officer since October 2015; President and Chief Financial Officer from August 2014 to October 2015; Executive Vice President and Chief Financial Officer from October 2007 to August 2014.
|
||
|
Marcia A. Dall
|
53
|
Executive Vice President and Chief Financial Officer since October 2015; Executive Vice President and Chief Financial Officer of Erie Indemnity Company from March 2009 through October 2015.
|
||
|
Paul J. Thelen
|
49
|
President, Big Fish Games since the acquisition in December 2014; Founder and CEO, Big Fish Games 2012 through 2014; Chief Strategy Officer at Big Fish Games, 2008 through 2012.
|
||
|
ITEM 11.
|
EXECUTIVE COMPENSATION
|
The information required by this item with respect to executive compensation is incorporated by reference to the information statement on Form 14(a) to be filed with the Securities and Exchange Commission no later than 120 days after
December 31, 2016
.
|
ITEM 12.
|
SECURITY OWNERSHIP OF CERTAIN BENEFICIAL OWNERS AND MANAGEMENT AND RELATED SHAREHOLDER MATTERS
|
The information required by this item with respect to security ownership of certain beneficial owners and management and related shareholder matters is incorporated by reference to the definitive proxy statement on Form 14(a) to be filed with the Securities and Exchange Commission no later than 120 days after
December 31, 2016
.
|
ITEM 13.
|
CERTAIN RELATIONSHIPS AND RELATED TRANSACTIONS, AND DIRECTOR INDEPENDENCE
|
The information required by this item with respect to certain relationships with our outside directors is incorporated by reference to the definitive proxy statement on Form 14(a) to be filed with the Securities and Exchange Commission no later than 120 days after
December 31, 2016
.
|
ITEM 14.
|
PRINCIPAL ACCOUNTING FEES AND SERVICES
|
The information required herein is incorporated by reference from the section of our Proxy Statement titled "Independent Public Accountants," pursuant to instruction G(3) of the General Instructions to Form 10-K.
99
|
ITEM 15.
|
EXHIBITS AND FINANCIAL STATEMENT SCHEDULE
|
|
Pages
|
|||
|
(a)
|
(1)
|
Consolidated Financial Statements
|
|
|
The following financial statements of Churchill Downs Incorporated for the years ended 2016, 2015 and 2014 are included in Part II, Item 8:
|
|||
|
(2)
|
|||
|
All other schedules are omitted because they are not applicable, not significant or not required, or because the required information is included in the consolidated financial statements or notes thereto.
|
|||
|
(3)
|
For the list of required exhibits, see exhibit index.
|
||
|
(b)
|
Exhibits
|
||
|
(c)
|
All financial statements and schedules except those items listed under Items 15(a)(1) and (2) above are omitted because they are not applicable or not required, or because the required information is included in the consolidated financial statements or notes thereto.
|
||
100
|
ITEM 16.
|
FORM 10-K SUMMARY
|
None.
SIGNATURES
Pursuant to the requirements of Section 13 or 15(d) of the Securities Exchange Act of 1934, the registrant has duly caused this report to be signed on its behalf by the undersigned, thereunto duly authorized.
|
CHURCHILL DOWNS INCORPORATED
|
|
|
/s/ William C. Carstanjen
|
|
|
William C. Carstanjen
|
|
|
Chief Executive Officer
|
|
|
(Principal Executive Officer)
|
|
|
February 28, 2017
|
|
Pursuant to the requirements of the Securities Exchange Act of 1934, this report has been signed below by the following persons on behalf of the registrant and in the capacities and on the dates indicated.
|
/s/ William C. Carstanjen
|
/s/ William E. Mudd
|
/s/ Marcia A. Dall
|
||
|
William C. Carstanjen
|
William E. Mudd
|
Marcia A. Dall
|
||
|
Chief Executive Officer
|
President and
|
Executive Vice President and
|
||
|
February 28, 2017
|
Chief Operating Officer
|
Chief Financial Officer
|
||
|
(Principal Executive Officer)
|
February 28, 2017
|
February 28, 2017
|
||
|
(Principal Financial and
Accounting Officer)
|
||||
|
/s/ G. Watts Humphrey, Jr.
|
/s/ Ulysses L. Bridgeman
|
/s/ Craig J. Duchossois
|
||
|
G. Watts Humphrey, Jr.
|
Ulysses L. Bridgeman
|
Craig J. Duchossois
|
||
|
February 28, 2017
|
February 28, 2017
|
February 28, 2017
|
||
|
(Chairman of the Board)
|
(Director)
|
(Director)
|
||
|
/s/ Richard L. Duchossois
|
/s/ Robert L. Evans
|
/s/ Robert L. Fealy
|
||
|
Richard L. Duchossois
|
Robert L. Evans
|
Robert L. Fealy
|
||
|
February 28, 2017
|
February 28, 2017
|
February 28, 2017
|
||
|
(Director)
|
(Director)
|
(Director)
|
||
|
/s/ Aditi J. Gokhale
|
/s/ Daniel P. Harrington
|
/s/ R. Alex Rankin
|
||
|
Aditi J. Gokhale
|
Daniel P. Harrington
|
R. Alex Rankin
|
||
|
February 28, 2017
|
February 28, 2017
|
February 28, 2017
|
||
|
(Director)
|
(Director)
|
(Director)
|
||
101
CHURCHILL DOWNS INCORPORATED
SCHEDULE II—VALUATION AND QUALIFYING ACCOUNTS
|
(in millions)
|
Balance
Beginning
of Year
|
Charged
to
Expense
|
Deductions
|
Balance
End of
Year
|
|||||||||||
|
Allowance for doubtful accounts:
|
|||||||||||||||
|
2016
|
$
|
3.8
|
|
$
|
2.0
|
|
$
|
(2.3
|
)
|
$
|
3.5
|
|
|||
|
2015
|
4.2
|
|
1.3
|
|
(1.7
|
)
|
3.8
|
|
|||||||
|
2014
|
4.3
|
|
1.7
|
|
(1.8
|
)
|
4.2
|
|
|||||||
|
(in millions)
|
Balance
Beginning
of Year
|
Additions
|
Deductions
|
Balance
End of
Year
|
|||||||||||
|
Deferred income tax asset valuation allowance:
|
|||||||||||||||
|
2016
|
$
|
1.1
|
|
$
|
—
|
|
$
|
(0.6
|
)
|
$
|
0.5
|
|
|||
|
2015
|
1.3
|
|
0.1
|
|
(0.3
|
)
|
1.1
|
|
|||||||
|
2014
|
1.2
|
|
0.1
|
|
—
|
|
1.3
|
|
|||||||
102
EXHIBIT INDEX
|
Numbers
|
Description
|
By Reference To
|
||||
|
2
|
(a)
|
Agreement and Plan of Merger, dated as of November 12, 2014, by and among Churchill Downs Incorporated, Ocean Acquisition Corp., Big Fish Games, Inc., and the security holders’ agent party thereto
|
Exhibit 10.1 to Current Report on Form 8-K (Commission file number 001-33998) filed September 13, 2010
|
|||
|
(b)
|
Shareholder Agreement, dated as of November 12, 2014, by and between Churchill Downs Incorporated and Paul J. Thelen
|
Exhibit 2.2 to Current Report on Form 8-K (Commission file number 001-33998) filed November 13, 2014
|
||||
|
(c)
|
First Amendment to Shareholder Agreement, dated as of October 23, 2015, by and between Churchill Downs Incorporated and Paul J. Thelen
|
Exhibit 10.1 to Current Report on Form 8-K (Commission file number 001-33998) filed November 5, 2015
|
||||
|
3
|
(a)
|
Amended and Restated Articles of Incorporation of Churchill Downs Incorporated, as amended July 3, 2012
|
Exhibit 3.1 to Current Report on Form 8-K (Commission file number 001-33998) filed July 10, 2012
|
|||
|
(b)
|
Amended and Restated Bylaws of Churchill Downs Incorporated, as amended July 3, 2012
|
Exhibit 3.1 to Current Report on Form 8-K (Commission file number 001-33998) filed July 10, 2012
|
||||
|
4
|
(a)
|
Rights Agreement, dated as of March 19, 2008 by and between Churchill Downs Incorporated and National City Bank
|
Exhibit 4.1 to Current Report on Form 8-K (Commission file number 000-01469) filed March 17, 2008
|
|||
|
(b)
|
Indenture dated as of December 16, 2013 by and among Churchill Downs Incorporated, the Guarantors, and US Bank National Association
|
Exhibit (4.1) to Current Report on Form 8-K (Commission file number 001-33998) dated December 16, 2013.
|
||||
|
(c)
|
Registration Rights Agreement dated December 16, 2013 by and among Churchill Downs Incorporated, the Guarantors and the representatives of the initial purchasers
|
Exhibit (4.2) to Current Report on Form 8-K (Commission file number 001-33998) dated December 16, 2013.
|
||||
|
(d)
|
First Supplemental Indenture dated as of December 15, 2015, among Churchill Downs Incorporated, the Guarantors party thereto, U.S. Bank National Association, as trustee.
|
Exhibit 4.1 Current Report on Form 8-K (Commission file number 001-33998) filed December 15, 2015
|
||||
|
(e)
|
Registration Rights Agreement dated as of December 15, 2015 by and among Churchill Downs Incorporated, The Guarantors party thereto and the representatives of the initial purchasers.
|
Exhibit 4.2 Current Report on Form 8-K (Commission file number 001-33998) filed December 15, 2015
|
||||
|
10
|
(a)
|
Churchill Downs Incorporated Amended and Restated Supplemental Benefit Plan dated December 1, 1998*
|
Exhibit 10(a) to Annual Report on Form 10-K (Commission file number 000-01469) for the fiscal year ended December 31, 1998
|
|||
|
(b)
|
Churchill Downs Incorporated 2003 Stock Option Plan*
|
Exhibit 4(e) to the Registration Statement on Form S-8 (Commission file number 333-106310) dated June 20, 2003
|
||||
|
(c)
|
Fourth Amended and Restated Churchill Downs Incorporated 1997 Stock Option Plan*
|
Exhibit 10(a) to Quarterly Report on Form 10-Q (Commission file number 000-01469) for the fiscal quarter ended June 30, 2002
|
||||
|
(d)
|
Churchill Downs Incorporated Amended and Restated Deferred Compensation Plan for Employees and Directors*
|
Exhibit 10(a) to Quarterly Report on Form 10-Q (Commission file number 000-01469) for the fiscal quarter ended March 31, 2001
|
||||
|
(e)
|
Form of Stockholder’s Agreement, dated September 8, 2000 among Churchill Downs Incorporated and Duchossois Industries, Inc.
|
Annex C of the Proxy Statement for a Special Meeting of Shareholders of Churchill Downs Incorporated held September 8, 2000 (Commission file number 000-01469)
|
||||
103
|
Numbers
|
Description
|
By Reference To
|
||||
|
(f)
|
Lease Agreement between the City of Louisville, Kentucky and Churchill Downs Incorporated dated January 1, 2003
|
Exhibit 2.1 to Current Report on Form 8-K (Commission file number 000-01469) filed January 6, 2003
|
||||
|
(g)
|
Form of Restricted Stock Agreement*
|
Exhibit 10.1 to Current Report on Form 8-K (Commission file number 000-01469) filed November 30, 2004
|
||||
|
(h)
|
2005 Churchill Downs Incorporated Deferred Compensation Plan, as amended*
|
Exhibit 10.1 to Current Report on Form 8-K (Commission file number 000-01469) filed June 21, 2005
|
||||
|
(i)
|
2006 Amendment to 2005 Churchill Downs Incorporated Deferred Compensation Plan*
|
Exhibit 10.1 to Current Report on Form 8-K (Commission file number 000-01469) filed June 8, 2006
|
||||
|
(j)
|
Churchill Downs Incorporated 2007 Omnibus Stock Incentive Plan*
|
Exhibit A to Schedule 14A filed April 30, 2007 (Commission file number 000-01469)
|
||||
|
(k)
|
Amendment to Churchill Downs Incorporated 2005 Deferred Compensation Plan Adopted June 28, 2007*
|
Exhibit 10(b) to Quarterly Report on Form 10-Q (Commission file number 000-01469) for the fiscal quarter ended June 30, 2007
|
||||
|
(l)
|
Amended and Restated Terms and Conditions of Performance Stock Awards Issued Pursuant to the Churchill Downs Incorporated 2007 Omnibus Stock Incentive Plan*
|
Exhibit 10.1 to Current Report on Form 8-K (Commission file number 001-33998) filed December 19, 2008
|
||||
|
(m)
|
First Amendment to the Churchill Downs Incorporated Amended and Restated Incentive Compensation Plan (1997), effective November 14, 2008*
|
Exhibit 10 (vv) to Annual Report on Form 10-K (Commission file number 001-33998) for the fiscal year ended December 31, 2008
|
||||
|
(n)
|
2005 Churchill Downs Incorporated Deferred Compensation Plan (As Amended as of December 1, 2008)*
|
Exhibit 10 (ww) to Annual Report on Form 10-K (Commission file number 001-33998) for the fiscal year ended December 31, 2008
|
||||
|
(o)
|
Churchill Downs Incorporated Executive Severance Policy (Amended Effective as of November 12, 2008)*
|
Exhibit 10 (xx) to Annual Report on Form 10-K (Commission file number 001-33998) for the fiscal year ended December 31, 2008
|
||||
|
(p)
|
Form of Churchill Downs Incorporated Restricted Stock Agreement*
|
Exhibit 10(ll) to Annual Report on Form 10-K (Commission file number 001-33998) for the fiscal year ended December 31, 2011
|
||||
|
(q)
|
Limited Liability Company Agreement of Miami Valley Gaming & Racing, LLC, dated as of March 1, 2012, among Miami Valley Gaming & Racing, LLC, Churchill Downs Incorporated, MVGR, LLC (a wholly-owned subsidiary of Churchill Downs Incorporated), Delaware North Companies Gaming & Entertainment, Inc. and DNC Ohio Gaming, Inc. (a wholly-owned subsidiary of Delaware North Companies Gaming & Entertainment, Inc.)
|
Exhibit 10.1 to Current Report on Form 8-K (Commission file number 001-33998) filed March 5, 2012
|
||||
|
(r)
|
Asset Purchase Agreement, dated as of March 1, 2012, between Miami Valley Gaming & Racing LLC; Lebanon Trotting Club, Inc.; Miami Valley Trotting, Inc.; Keith Nixon Jr. and John Carlo
|
Exhibit 10.2 to Current Report on Form 8-K (Commission file number 001-33998) filed March 5, 2012
|
||||
|
(s)
|
Churchill Downs Incorporated Executive Annual Incentive Plan*
|
Exhibit A of the Proxy Statement for a Meeting of Shareholders of Churchill Downs Incorporated held June 14, 2012 (Commission file number 001-33998)
|
||||
104
|
Numbers
|
Description
|
By Reference To
|
||||
|
(t)
|
Amendment to the Churchill Downs Incorporated 2007 Omnibus Stock Incentive Plan*
|
Exhibit B of the Proxy Statement for a Meeting of Shareholders of Churchill Downs Incorporated held June 14, 2012 (Commission file number 001-33998)
|
||||
|
(u)
|
Form of Executive Change in Control, Severance and Indemnity Agreement dated as of August 27, 2014 executed between Churchill Downs Incorporated and Robert L. Evans, William C. Carstanjen, William E. Mudd, and Alan K. Tse*
|
Exhibit 10.1 to Current Report on Form 8-K (Commission file number 001-33998) filed August 28, 2014
|
||||
|
(v)
|
Form of Executive Change in Control, Severance and Indemnity Agreement dated as of February 9, 2015 executed between Churchill Downs Incorporated and Robert L. Evans, William C. Carstanjen, William E. Mudd, and Alan K. Tse*
|
Exhibit 10.1 to Current Report on Form 8-K (Commission file number 001-33998) filed February 12, 2015
|
||||
|
(w)
|
Form of Executive Change in Control, Severance and Indemnity Agreement dated as of October 12, 2015 executed between Churchill Downs Incorporated and Marcia A. Dall*
|
Exhibit 10.1 to Current Report on Form 8-K (Commission file number 001-33998) filed February 12, 2015
|
||||
|
(x)
|
First Amendment to the Executive Change in Control, Severance and Indemnity Agreement By and Between Churchill Downs Incorporated and Robert L. Evans*
|
Exhibit 10.1 to Current Report on Form 8-K (Commission file number 001-33998) filed July 14, 2015
|
||||
|
(y)
|
Form of Churchill Downs Incorporated Restricted Stock Unit Agreement*
|
Exhibit 10.1A to Current Report on Form 8-K (Commission file number 001-33998) filed September 28, 2015
|
||||
|
(z)
|
Form of Churchill Downs Incorporated Performance Share Unit Agreement*
|
Exhibit 10.1B to Current Report on Form 8-K (Commission file number 001-33998) filed September 28, 2015
|
||||
|
(aa)
|
Stock Repurchase Agreement, dated November 19, 2015, between Churchill Downs Incorporated and the Duchossois Group, Inc.
|
Exhibit 10.1 to Current Report on Form 8-K (Commission file number 001-33998) filed November 19, 2015
|
||||
|
(bb)
|
First Amendment to Stockholder’s Agreement, dated November 19, 2015 between Churchill Downs Incorporated and The Duchossois Group, Inc.
|
Exhibit 10.2 to Current Report on Form 8-K (Commission file number 001-33998) filed November 19, 2015
|
||||
|
(cc)
|
Amendment and Restatement Agreement dated December 1, 2014 with Fourth Amended and Restated Credit Agreement
|
Exhibit 4(e) to Annual Report on Form 10-K (Commission file number 001-33998) for the fiscal year ended December 31, 2014
|
||||
|
(dd)
|
Amendment No. 1 to the Fourth Amended and Restated Credit Agreement, dated February 17, 2016
|
Exhibit 10.1 to Current Report on Form 8-K (Commission file number 001-33998) filed February 18, 2016
|
||||
|
(ee)
|
Form of Churchill Downs Incorporated Non-Employee Director Restricted Share Units Agreement*
|
Exhibit 10(a) to Quarterly Report on Form 10-Q (Commission file number 001-33998) for the fiscal quarter ended June 30, 2016
|
||||
|
(ff)
|
Churchill Downs Incorporated 2016 Omnibus Stock Incentive Plan*
|
Exhibit 10.1 to Current Report on Form 8-K (Commission file number 001-33998) filed April 29, 2016
|
||||
|
(gg)
|
First Amended and Restated Churchill Downs Incorporated 2000 Employee Stock Purchase Plan*
|
Exhibit B to 2016 Proxy Statement on Schedule 14A (Commission file number 001-33998) filed March 29, 2016
|
||||
|
14
|
Churchill Downs Incorporated Code of Ethics as of December 31, 2003
|
Exhibit 14 to Annual Report on Form 10-K (Commission file number 000-01469) for the fiscal year ended December 31, 2003
|
||||
|
21
|
Subsidiaries of the Registrant
|
|||||
105
|
Numbers
|
Description
|
By Reference To
|
||||
|
23
|
Consent of PricewaterhouseCoopers LLP, Independent Registered Public Accounting Firm
|
|||||
|
31
|
(a)
|
Certification of Chief Executive Officer Pursuant to Section 302 of the Sarbanes-Oxley Act of 2002
|
||||
|
(b)
|
Certification of Principal Financial Officer Pursuant to Section 302 of the Sarbanes-Oxley Act of 2002
|
|||||
|
32
|
Certification of Chief Executive Officer and Principal Financial Officer Pursuant to 18 U.S.C. Section 1350, As Adopted Pursuant to Section 906 of the Sarbanes-Oxley Act of 2002 (furnished pursuant to Rule 13a-14(b))
|
|||||
|
101
|
|
INS
|
XBRL Instance Document
|
|||
|
101
|
|
SCH
|
XBRL Taxonomy Extension Schema Document
|
|||
|
101
|
|
CAL
|
XBRL Taxonomy Extension Calculation Linkbase Document
|
|||
|
101
|
|
DEF
|
XBRL Taxonomy Extension Definition Linkbase Document
|
|||
|
101
|
|
LAB
|
XBRL Taxonomy Extension Label Linkbase Document
|
|||
|
101
|
|
PRE
|
XBRL Taxonomy Extension Presentation Linkbase Document
|
|||
* Management contract or compensatory plan or arrangement.
106
TABLE OF CONTENTS
Part IItem 1. BusinessItem 1A. Risk FactorsItem 1B. Unresolved Staff CommentsItem 2. PropertiesItem 3. Legal ProceedingsItem 4. Mine Safety DisclosuresPart IIItem 5. Market For Registrant S Common Equity, Related Shareholder Matters and Issuer Purchases Of Equity SecuritiesItem 6. Selected Financial DataItem 7. Management S Discussion and Analysis Of Financial Condition and Results Of OperationsItem 7A. Quantitative and Qualitative Disclosures About Market RiskItem 8. Financial Statements and Supplementary DataItem 9. Changes in and Disagreements with Accountants on Accounting and Financial DisclosureItem 9A. Controls and ProceduresItem 9B. Other InformationPart IIIItem 10. Directors, Executive Officers and Corporate GovernanceItem 11. Executive CompensationItem 12. Security Ownership Of Certain Beneficial Owners and Management and Related Shareholder MattersItem 13. Certain Relationships and Related Transactions, and Director IndependenceItem 14. Principal Accounting Fees and ServicesPart IVItem 15. Exhibits and Financial Statement ScheduleItem 16. Form 10-k Summary