CHEGG, INC
10-Ks and 10-Qs
|
|
|
|
|
|
|
|
|
|
|
|
|
|
|
|
|
|
|
|
|
|
|
|
|
|
|
|
|
|
|
|
|
|
|
|
|
|
|
|
|
|
|
|
UNITED STATES
SECURITIES AND EXCHANGE COMMISSION
Washington, D.C. 20549
FORM
10-K
|
x
ANNUAL REPORT PURSUANT TO SECTION 13 OR 15(d) OF THE SECURITIES EXCHANGE ACT OF 1934
|
For the fiscal year ended
December 31, 2017
or
|
¨
TRANSITION REPORT PURSUANT TO SECTION 13 OR 15(d) OF THE SECURITIES EXCHANGE ACT OF 1934
|
For the transition period from to
Commission file number 001-36180
CHEGG, INC.
(Exact name of registrant as specified in its charter)
|
Delaware
|
|
20-3237489
|
|
(State or other jurisdiction of incorporation or organization)
|
|
(I.R.S. employer identification no.)
|
3990 Freedom Circle
Santa Clara, CA, 95054
(Address of principal executive offices)
(408) 855-5700
(Registrant’s telephone number, including area code)
Securities registered pursuant to Section 12(b) of the Act:
|
Title of each class
|
|
Name of each exchange on which registered
|
|
Common Stock, $0.001 par value per share
|
|
The New York Stock Exchange
|
Securities registered pursuant to Section 12(g) of the Act:
None
(Title of class)
|
•
|
Indicate by check mark if the registrant is a well-known seasoned issuer, as defined in Rule 405 of the Securities Act. Yes
¨
No
x
|
|
•
|
Indicate by check mark if the registrant is not required to file reports pursuant to Section 13 or Section 15(d) of the Act. Yes
¨
No
x
|
|
•
|
Indicate by check mark whether the registrant (1) has filed all reports required to be filed by Section 13 or 15(d) of the Securities Exchange Act of 1934 (Exchange Act) during the preceding 12 months (or for such shorter period that the registrant was required to file such reports), and (2) has been subject to such filing requirements for the past 90 days. Yes
x
No
¨
|
|
•
|
Indicate by check mark whether the registrant has submitted electronically and posted on its corporate Website, if any, every Interactive Data File required to be submitted and posted pursuant to Rule 405 of Regulation S-T (§ 232.405 of this chapter) during the preceding 12 months (or for such shorter period that the registrant was required to submit and post such files). Yes
x
No
¨
|
|
•
|
Indicate by check mark if disclosure of delinquent filers pursuant to Item 405 of Regulation S-K (§ 229.405 of this chapter) is not contained herein, and will not be contained, to the best of registrant’s knowledge, in definitive proxy or information statements incorporated by reference in Part III of this Form 10-K or any amendment to this Form 10-K.
¨
|
|
•
|
Indicate by check mark whether the registrant is a large accelerated filer, an accelerated filer, a non-accelerated filer, or a smaller reporting company. See definitions of “large accelerated filer,” “accelerated filer,” “smaller reporting company,” and “emerging growth company” in Rule 12b-2 of the Exchange Act. (Check one)
|
|
Large accelerated filer
x
|
Accelerated filer
¨
|
|
Non-accelerated filer
¨
(Do not check if a smaller reporting company)
|
Smaller reporting company
¨
|
|
Emerging growth company
¨
|
|
|
•
|
If an emerging growth company, indicate by check mark if the registrant has elected not to use the extended period for complying with any new or revised financial accounting standards provided pursuant to Section 13(a) of the Exchange Act.
¨
|
|
•
|
Indicate by check mark whether the registrant is a shell company (as defined in Rule 12b-2 of the Exchange Act). Yes
¨
No
x
|
|
•
|
The aggregate market value of the voting stock held by non-affiliates of the registrant as of
June 30, 2017
, the last business day of the registrant’s most recently completed second fiscal quarter, based upon the closing price of such stock on such date as reported by the New York Stock Exchange on such date, was approximately
$1,009,536,032
. Shares of Common Stock held by each executive officer and director have been excluded in that such persons may be deemed to be affiliates. This determination of affiliate status is not necessarily a conclusive determination for other purposes.
|
|
•
|
As of
January 31, 2018
, the Registrant had
109,962,798
outstanding shares of Common Stock.
|
DOCUMENTS INCORPORATED BY REFERENCE
Portions of the Registrant's definitive proxy statement for the Registrant's
2018
Annual Meeting of Stockholders are incorporated by reference in Part III of this Annual Report on Form 10-K to the extent stated herein. The Proxy Statement will be filed within 120 days of the Registrant's fiscal year ended
December 31, 2017
.
TABLE OF CONTENTS
|
|
|
|
|
Page
|
|
|
|
|||
|
|
|
|||
|
|
|
|||
|
|
|
|||
|
|
|
|
||
|
|
|
|||
|
|
|
|||
|
|
|
|||
|
|
|
|||
|
|
||||
Unless the context requires otherwise, the words “we,” “us,” “our,” “Company” and “Chegg” refer to Chegg, Inc. and its subsidiaries taken as a whole.
“Chegg,” “Chegg.com,” “Chegg Study,” “Chegg for Good,” “Student Hub,” “internships.com,” “Research Ready,” “EasyBib” and “#1 In Textbook Rentals,”
are some of our trademarks used in this
Annual
Report on Form
10-K
. Solely for convenience, our trademarks, trade names and service marks referred to in this
Annual
Report on Form
10-K
appear without the
®
, ™ and
SM
symbols, but those references are not intended to indicate, in any way, that we will not assert, to the fullest extent under applicable law, our rights to these trademarks and trade names. Other trademarks appearing in this
Annual
Report on Form
10-K
are the property of their respective holders.
2
NOTE ABOUT FORWARD-LOOKING STATEMENTS
This
Annual
Report on Form
10-K
contains forward-looking statements within the meaning of the Private Securities Litigation Reform Act of 1995. All statements contained in this
Annual
Report on Form
10-K
other than statements of historical fact, including statements regarding our future results of operations and financial position, our business strategy and plans, and our objectives for future operations, are forward-looking statements. The words “believe,” “may,” “will,” “would,” “could,” “estimate,” “continue,” “anticipate,” “intend,” “project,” “endeavor,” “expect,” “plans to,” “if,” “future,” and similar expressions are intended to identify forward-looking statements. We have based these forward-looking statements largely on our current expectations and projections about future events and trends that we believe may affect our financial condition, results of operations, business strategy, short-term and long-term business operations and objectives, and financial needs. These forward-looking statements are subject to a number of risks, uncertainties and assumptions, including those described in Part I, Item 1A, “Risk Factors” in this
Annual
Report on Form
10-K
. Moreover, we operate in a very competitive and rapidly changing environment. New risks emerge from time to time. It is not possible for our management to predict all risks, nor can we assess the impact of all factors on our business or the extent to which any factor, or combination of factors, may cause actual results to differ materially from those contained in any forward-looking statements we may make. In light of these risks, uncertainties and assumptions, the future events and trends discussed in this
Annual
Report on Form
10-K
may not occur and actual results could differ materially and adversely from those anticipated or implied in the forward-looking statements. You should read this Annual Report on Form 10-K completely and with the understanding that our actual future results may be materially different from what we expect.
We undertake no obligation to revise or publicly release the results of any revision to these forward-looking statements, except as required by law. Given these risks and uncertainties, readers are cautioned not to place undue reliance on such forward-looking statements.
3
Overview
Chegg is the smarter way to student. As the leading direct-to-student learning platform, we strive to improve educational outcomes by putting the student first in all our decisions. We support students on their journey from high school to college and into their career with tools designed to help them pass their test, pass their class, and save money on required materials. Our services are available online, anytime and anywhere, so we can reach students when they need us most.
Our Chegg Services include
Chegg Study, Chegg Writing, Chegg Tutors, Brand Partnership, Test Prep and Internships
. Our Chegg Study service combines both step-by-step Textbook Solutions and Expert Answers, which help students understand and master their course work. Chegg Writing is comprised of our writing tools properties, including EasyBib, Citation Machine, BibMe, CiteThisForMe, RefMe and NormasAPA, which help students create citations for their papers.
Additionally, in October 2017, we launched a service, on our BibMe writing tools property, that helps students prevent unintentional plagiarism and find grammar and spelling mistakes in their writing.
For students who need additional human help, Chegg Tutors provides live online help for a wide variety of topics online, anywhere and anytime. In October 2017, we acquired Cogeon GmbH (Cogeon),
a provider of adaptive math technology and developer of the math application, Math 42
, which will become Chegg Math, and which leverages artificial intelligence to provide additional homework help for students specifically struggling with math. We offer unique and compelling ways for student-relevant brands to reach and engage high school and college students through our Brand Partnerships. Chegg and Kaplan Test Prep (Kaplan) have launched co-branded test prep programs, in December 2017, starting as low as $99 to provide students with an online adaptive test preparation service. Our platform also provides access to internships to help students gain skills and experiences that are critical to securing their first job. In
2017
, over
2.2 million
students subscribed to our Chegg Services, an increase of
45%
year over year from
1.5 million
in
2016
.
Through our strategic partnership with Ingram Content Group (Ingram) and agreements with other partners, we offer Required Materials, which includes an extensive print textbook and eTextbook library for rent and sale, helping students save money compared to the cost of buying new. In
2017
, students rented or bought over
5.4 million
textbooks and eTextbooks from Chegg.
To deliver these services, we partner with several third parties. We have a large network of students and professionals who leverage our platform to earn money by tutoring in their spare time. In
2017
, we sourced print textbooks through our strategic partnership with Ingram and agreements with other partners as well as eTextbooks and supplemental materials directly or indirectly from thousands of publishers in the United States, including Pearson, Cengage Learning, McGraw Hill, Wiley and MacMillan. Further, thousands of employers leverage our platform to post their internships and jobs. In addition, because we have a large student audience, local and national brands partner with us to reach the college and high school demographic through our Brand Partnership service.
Our Offering
We offer products and services that help students improve their outcomes throughout their educational journey. Our offerings fall into two categories: Chegg Services, which encompasses all of our digital products and services, and Required Materials, which primarily includes our print textbook and eTextbook offering.
Chegg Services
Chegg Study.
Our Chegg Study service helps students master challenging concepts on their own. For high demand print textbooks and eTextbooks, primarily in the subjects of sciences, technology, engineering, mathematics, statistics, business and economics, we offer “Textbook Solutions,” which are step-by-step explanations that help students understand how to solve the questions at the end of each chapter in their textbooks. For non-textbook questions, we offer our “Expert Answers” service, which allows students to ask questions on our website and receive similarly detailed explanations from subject matter experts. As of
December 31, 2017
, Chegg had an archive of
7 million
Textbook Solutions and
13 million
Expert Answers, which students can immediately access through their paid subscription. These services are available on our website and on mobile devices through our native application and our mobile website.
Chegg Writing.
In May 2016 we acquired Imagine Easy Solutions (Imagine Easy), the provider of the popular EasyBib, Citation Machine, BibMe, CiteThisForMe, NormasAPA and other tools with capabilities such as citation,
4
bibliography and anti-plagiarism. When students need to cite their sources in written work, they can use our writing tools to automatically generate sources in the required formats. These tools offer a variety of advertising-supported and paid subscription products. In
2017
, students logged more than
304 million
individual online sessions, lasting on average more than
8
minutes per session. Since the launch of EasyBib, students worldwide have created more than
2.1 billion
citations using Imagine Easy's writing productivity tools.
Additionally, in October 2017, we launched a service, on our BibMe writing tools property, that helps students prevent unintentional plagiarism and find grammar and spelling mistakes in their writing.
Chegg Tutors
. Complementing our other study tools, students can find human help on our learning platform through our network of live tutors. Students can access help online, anywhere, anytime, either synchronously or asynchronously. Instead of paying for expensive, offline tutors that require scheduling and travel time, students can come to Chegg to find tutors whenever they need additional help on a subject and pay as little as
$0.40
per minute. Our tutors are qualified to help students with a wide range of topics, including science, technology, engineering, mathematics, business, history, foreign languages, and English literature, along with test prep and a variety of other highly-requested subjects. Students can subscribe to weekly or monthly packages, or choose to use the service on a pay-as-you-go basis.
Chegg Math.
In October 2017, we acquired Cogeon, a provider of adaptive math technology and developer of the math application, Math 42. With this acquisition, students in both high school and college will be able to get math help through self-guided and individualized math solutions. We expect to leverage Cogeon's unique A.I.-driven math technology to enhance current capabilities inside Chegg Study and expect to launch an integrated new product, Chegg Math, in the second half of 2018.
Brand Partnership.
We offer unique and compelling ways for student-relevant brands to reach and engage high school and college students. Our Brand Partnership service includes digital advertising on our platform, product samples, white label integrations, discounts, and other promotions shipped directly to students in our distinctive orange Chegg boxes and experiential offerings that may include, for example, on-campus events, sponsorships and other brand ambassador work.
Test Prep
. We entered into a partnership with Kaplan in August 2017 to provide students with an online adaptive test preparation service. Chegg and Kaplan have launched co-branded test preparation programs, in December 2017, starting as low as $99. Additionally, we provide students access to Kaplan's test prep courses, practice products, and books through our website.
Internships.
For students who are seeking job-ready skills through work experience before graduation, we offer our internships service. Students can search for internships, upload their resume, and apply for open positions and employers can post their internships and connect with students who are actively seeking positions. As of
December 31, 2017
, we provide students access to approximately
250,000
internships across the country. We currently offer internships as a free service to both students and employers.
Required Materials
Print Textbooks and eTextbooks.
For students looking to save on the cost of required materials, we rent and sell print textbooks and eTextbooks. Most of the print textbook transactions are rentals, although we also offer both new and used books for sale at a slight markup to our acquisition cost. In 2014, we implemented a partnership with Ingram, which we expanded in May 2015, so that Ingram fulfills all of our print textbook rentals and sales. We have also entered into agreements with other partners to provide their textbooks for rental or sale. In participation with certain publishers, we also offer “Instant Access” to eTextbooks that is a one-week free trial of our eTextbook service, and allows the student to access the eTextbook while the print copy is in transit. All eTextbooks obtained from Chegg are accessed through the VitalSource Bookshelf which provides students with access to eTextbooks on PCs, tablets and smart phones, providing access anytime, anywhere that students are connected to the Internet and students can save a portion of the book for offline access. The eTextbook reader enables fast and easy navigation, keyword search, text highlighting, note taking and further preserves those notes in an online notepad with persistence of highlighting and notes across platforms.
Supplemental Materials.
In addition to textbooks, we offer students access to other materials from publishers, professors, students and subject matter experts. These include related materials like study guides, lab manuals or digital services provided by publishers, commonly known as “Whole Course Solutions” or “Integrated Learning Systems.” We tailor our merchandising of these materials based on the student’s core textbook.
Textbook Buyback.
We offer students, on behalf of our fulfillment partner Ingram, the ability to sell us their textbooks, even if they were not originally purchased from us, and in turn those textbooks are offered to other students for purchase or
5
rent, or sold to wholesalers. If our buy-back offer to the student is accepted, we provide a pre-printed label and shipping instructions. Ingram reimburses us the amounts we pay to students for these purchases.
Technology and Platform Integration
Our technology is designed to create a direct-to-student learning platform that will continue to enable our growth at scale. We employ technological innovations whenever possible to increase efficiency and scale in our business. Our products rely upon and leverage the information underlying our Student Graph discussed in more detail below. We will continue to invest in building technologies around our data, search and solutions. The key elements of our technology platform are:
Personalization and Merchandising Technology
.
We create a personalized experience for each student throughout our learning platform, building awareness of our multiple services and also connecting them with opportunities through third-party partners and brands. We are able to accomplish this personalization and customization as a result of our Student Graph and our search technology.
Student Graph
. Our Student Graph is the accumulation of the collective activity of students in our learning platform. Students generate valuable information each time they engage with our learning platform. Our Student Graph also includes information we access from public and private sources such as textbook information, information about colleges and scholarship data. We are able to collect, organize and process this information to algorithmically create a personalized experience for each student on our network.
Search
. Search is an easy on-ramp for students to discover all of our services. Students can search by book, ISBN, author’s name or course. Many students come to us for textbook rentals, and in our search results we not only provide the relevant textbook, but also begin to build awareness of our other services. For instance, when a student searches for a textbook, we can also expose that student to relevant Chegg Study solutions and available Chegg Tutors that are knowledgeable about the searched textbook.
Data Sourcing and Graph Technology
.
Not all information relevant to students on our platform is made available by service, product, list or user-input. Therefore, we have developed proprietary technologies to collect disparate, distributed sets of data. For example, we access data from public and private sources to integrate into our platform to inform our decisions about our textbook catalog and pricing.
Mobile Solutions
.
We have mobile applications on Apple iOS and Google Android. Our mobile apps are built as hybrid applications leveraging the Chegg application programming interface (API) and server-side HTML5. We also maintain a mobile version of our website: m.chegg.com. Taking advantage of capabilities unique to the mobile platform, we offer some functionality on mobile that is not available on our website, such as textbook barcode scanning for price comparisons and Chegg Flashcards.
Content Conversion Platform
. We have developed a proprietary set of technologies that ingests each publisher’s unique source files and creates HTML5-based documents. The web-based eTextbook Reader we utilize, which is embedded with digital rights management, allows us to provide our content across technology platforms, have a deep understanding of how content is consumed and deliver content securely.
Real-time Sourcing and Pricing Technologies
. We have internally developed proprietary pricing and sourcing systems which consider market price, content selection and availability, and other factors, in determining price and origin of content and services we offer to students.
Programmatic Advertising.
With our acquisition of Imagine Easy, we acquired programmatic advertising technology under the brand StudyBreak Media (SBM). Through SBM, we combine a deep understanding of programmatic technology trends with data science, engineering and machine learning. The result is a mediation platform that blends with our direct sales force to maximize the value of the digital impressions we serve.
Infrastructure
. Our technology resides at a major cloud-hosting provider divided between the U.S. West Coast and U.S. East Coast. We use one region for our test/development/stage/failover environment and the other for our production environment. The architecture is also designed to allow for expansion into new international markets.
Network Security
. Our platform includes encryption, antivirus, firewall and patch-management technologies to help protect our systems distributed across cloud-hosting providers and our business offices.
6
Internal Management Systems
. We rely on third-party technology solutions and products as well as internally developed and proprietary systems, in which we have made substantial investment, to provide rapid, high-quality customer service, internal communication, software development, deployment, and maintenance.
Our technology and development expenses were
$81.9 million
,
$66.3 million
and
$59.4 million
for the
years ended December 31, 2017
,
2016
and
2015
, respectively. For more information about our technology and development expenses, see Part II, Item 7, “Management’s Discussion and Analysis of Financial Condition and Results of Operations -
Years Ended December 31, 2017
,
2016
and
2015
- Technology and Development.”
Customers
In
2017
,
4.2 million
individuals paid for our products and services, up from approximately
3.5 million
and
3.1 million
in
2016
and
2015
, respectively.
Sales and Marketing
Students
We use several major direct marketing channels to reach students. We deploy search engine optimization (SEO) techniques designed to increase the visibility of Chegg.com content in organic, unpaid search engine result listings. We supplement our SEO efforts through search engine marketing using keyword simulation and bid management tools to analyze and categorize search keywords, optimize bidding, increase impressions and drive conversion. We also drive brand awareness through the use of streaming radio and display advertising on major online and mobile advertising networks, such as Google Display Network. We integrate our textbook services on affiliates’ websites and work with a large advertising network that recruits individual online affiliates in exchange for pre-determined revenue share or commissions. We utilize three types of email marketing campaigns: onboarding programs to drive activation and retention, personalized cross-sell campaigns to deepen engagement, and promotional campaigns to drive sales and interests. We use social media to manage organic and paid programs across top websites, including Facebook, Instagram, Twitter and YouTube. We also acquire and engage students through content generated by student bloggers, syndicated through partners, around key student concerns and interests such as admissions, transition to college, picking a major, and resume preparation. Through our campus activation programs, we partner with brands and influencers to bring entertainment events, such as concerts, trial promotions, and product giveaways to students.
Colleges and Brands
We secure contracts with brands through direct sales by our field sales organization, which sells brand advertising services to large brand advertisers and advertising agencies seeking to reach and engage college and high school students. This team has field sales people and inside client success managers as well as operations and marketing support. In January 2017, we signed a strategic alliance agreement with NRCCUA. Under this agreement, we provide fulfillment services for digital targeting products which NRCCUA sells to colleges and universities.
Student Advocacy
We are committed to providing a high level of customer service to our students. We trust our students, understand the critical role our products and services have in their education, and strive to resolve all problems quickly and thoroughly. Our student advocacy team can be reached directly through phone, email, and online chat during business hours. We also proactively monitor social media to identify and solve problems before we are otherwise informed of their existence. We endeavor to respond to students’ concerns within five minutes.
Competition
While we do not have any competitors that compete with us across our business in its entirety, we face significant competition in each aspect of our business. The actual and potential competition in each of our primary areas of operations is described below.
Products and Services for Students.
Our Chegg Services face competition from different businesses depending on the offering. For Chegg Study, our competitors primarily include publishers that provide study materials and
7
online instructional systems. Additionally, we face competition from free services such as Yahoo! Answers and Brain.ly for our Expert Answers service. For our Chegg Writing service, we primarily face competition from other citation generating services such as Noodle Tools. For our Chegg Tutors services, we face competition from other online tutoring services such as Wyzant, Tutors.com and Varsity Tutors. The market for textbooks and supplemental materials is intensely competitive and subject to rapid change. We face competition from college bookstores, some of which are operated by Follett and Barnes & Noble Education, online marketplaces such as Amazon.com and providers of eTextbooks such as Apple iTunes and Blackboard, as well as various private textbook rental websites. Many students purchase from multiple textbook providers, are highly price sensitive and can easily shift spending from one provider or format to another. As a consequence, our Required Materials product line, which includes eTextbooks, competes primarily on price and further on selection and functionality and compatibility of the eTextbook Reader we utilize across a wide variety of desktop and mobile devices.
Brands Advertising.
With respect to brands, we compete with online and offline outlets that generate revenues from advertisers and marketers, especially those that target high school and college students. In this area, we seek to partner with brands that have offerings that will interest or delight students and have received very positive comments and feedback from students on these offerings. We provide these brands with preferential access to our audience, which we believe represents a highly engaged portion of the target demographic of our brand partners.
We believe that we have competitive strengths, some of which are discussed above, that position us favorably in each aspect of our business. However, the education industry is evolving rapidly and is increasingly competitive. A variety of business models are being pursued or may be considered for the provision of digital learning tools, print textbooks and eTextbooks, some of which may be more profitable or successful than our business model.
Intellectual Property
We use proprietary technology to operate our business and our success depends, in part, on our ability to protect our technology and intellectual property. We rely on a combination of patent, copyright, trademark and trade secret laws, as well as contractual restrictions, to establish and protect our intellectual property. We maintain a policy requiring our employees, contractors, consultants and other third parties to enter into confidentiality and proprietary rights agreements to control access to our proprietary information. These laws, procedures and restrictions provide only limited protection and any of our intellectual property rights may be challenged, invalidated, circumvented, infringed or misappropriated. Further, the laws of certain countries do not protect proprietary rights to the same extent as the laws of the United States and, therefore, in certain jurisdictions, we may be unable to protect our proprietary technology.
As of
December 31, 2017
, we had
20
patents which will expire between
2032
and
2037
and
18
patent applications pending in the United States. We own
three
U.S. copyrights registrations and have unregistered copyrights in our software documentation, marketing materials and website content that we develop. We own the registered U.S. trademarks
“Chegg,” “Chegg.com,” “Chegg Study,” “Chegg for Good,” “Student Hub,” “internships.com,” “Research Ready,” “EasyBib” and “#1 In Textbook Rentals,”
among others as well as a variety of service marks. As of
December 31, 2017
, we owned over
600
registered domain names. We also have a number of pending trademark applications in the United States and foreign jurisdictions and unregistered marks that we use to promote our brand. From time to time we expect to file additional patent, copyright and trademark applications in the United States and abroad.
Government Regulation
We are subject to a number of laws and regulations that affect companies conducting business on the Internet and in the education industry, many of which are still evolving and could be interpreted in ways that could harm our business. The manner in which existing laws and regulations will be applied to the Internet and students in general and how they will relate to our business in particular, are often unclear. For example, we often cannot be certain how existing laws will apply in the e-commerce and online context, including with respect to such topics as privacy, defamation, pricing, credit card fraud, advertising, taxation, sweepstakes, promotions, content regulation, financial aid, scholarships, student matriculation and recruitment, quality of products and services and intellectual property ownership and infringement.
Numerous laws and regulatory schemes have been adopted at the national and state level in the United States, and in some cases internationally, that have a direct impact on our business and operations. For example:
The CAN-SPAM Act of 2003 and similar laws adopted by a number of states, regulate unsolicited commercial emails, create criminal penalties for emails containing fraudulent headers and control other abusive online
8
marketing practices. Similarly, the U.S. Federal Trade Commission (FTC) has guidelines that impose responsibilities on us with respect to communications with consumers and impose fines and liability for failure to comply with rules with respect to advertising or marketing practices they may deem misleading or deceptive.
The Telephone Consumer Protection Act of 1991 (TCPA) restricts telemarketing and the use of automated telephone equipment. The TCPA limits the use of automatic dialing systems, artificial or prerecorded voice messages, SMS text messages and fax machines. It also applies to unsolicited text messages advertising the commercial availability of goods or services. Additionally, a number of states have enacted statutes that address telemarketing. For example, some states, such as California, Illinois and New York, have created do-not-call lists. Other states, such as Oregon and Washington, have enacted “no rebuttal statutes” that require the telemarketer to end the call when the consumer indicates that he or she is not interested in the product being sold. Restrictions on telephone marketing, including calls and text messages, are enforced by the FTC, the Federal Communications Commission, states and through the availability of statutory damages and class action lawsuits for violations of the TCPA.
The Credit Card Accountability Responsibility and Disclosure Act of 2009, or CARD Act, and similar laws and regulations adopted by a number of states regulate credit card and gift certificate use fairness, including expiration dates and fees. Our business also requires that we comply with payment card industry data security and other standards. In particular, we are subject to payment card association operating rules, certification requirements and rules governing electronic funds transfers, which could change or be reinterpreted to make it difficult or impossible for us to comply. If we fail to comply with these rules or requirements, or if our data security systems are breached or compromised, we may be liable for card issuing banks’ costs, subject to fines and higher transaction fees and lose our ability to accept credit and debit card payments from our customers, process electronic funds transfers or facilitate other types of online payments, and our business and operating results could be adversely affected.
|
|
Regulations related to the Program Participation Agreement of the U.S. Department of Education and other similar laws and regulate the recruitment of students to colleges and other institutions of higher learning.
|
The Children’s Online Privacy Protection Act imposes additional restrictions on the ability of online services to collect information from minors. In addition, certain states, including Utah and Massachusetts, have laws that impose criminal penalties on the production and distribution of content that is “harmful to a minor.”
The Digital Millennium Copyright Act (DMCA) provides relief for claims of circumvention of copyright protected technologies and includes a safe harbor intended to reduce the liability of online service providers for hosting, listing or linking to third-party content that infringes copyrights of others.
The Communications Decency Act provides that online service providers will not be considered the publisher or speaker of content provided by others, such as individuals who post content on an online service provider’s website.
Employees
As of
December 31, 2017
, we had
893
full-time employees. We also engage temporary, seasonal employees and consultants. None of our employees are represented by labor unions or covered by a collective bargaining agreement. We have not experienced any work stoppages and we consider our relations with our employees to be good.
Seasonality
Information about seasonality is set forth in the section “Seasonality of Our Business” in Part II, Item 7 of this Annual Report on Form 10-K.
Information about Segment and Geographic Revenues
Information about segment and geographic revenues is set forth in Note 18 of the Notes to Consolidated Financial Statements included in Part II, Item 8, “Consolidated Financial Statements and Supplementary Data” of this Annual Report on Form 10-K.
9
Corporate History
We were incorporated in Delaware in July 2005. We launched our online print textbook rental business in 2007. We hired our current Chief Executive Officer in 2010, who implemented our current business strategy to create the leading direct-to-student learning platform for students to help them improve their outcomes. Beginning in 2010, we made a series of strategic acquisitions to expand our Chegg Services, including Cramster in 2010 to add Chegg Study, InstaEDU in 2014 to add Chegg Tutors, internships.com in 2014 to add to our Internship service, Imagine Easy Solutions in 2016 to add our Chegg Writing service and programmatic advertising, and Cogeon GmbH in 2017 to add what will become Chegg Math. We completed our initial public offering (IPO) in November 2013 and follow-on offering in August 2017. Our common stock is listed on the New York Stock Exchange under the symbol “CHGG.” Our principal executive offices are located at 3990 Freedom Circle, Santa Clara, California 95054 and our telephone number is (408) 855-5700.
Available Information
Our website address is www.chegg.com and our Investor Relations website address is investor.chegg.com. Our Annual Report on Form 10-K, Quarterly Reports on Form 10-Q, Current Reports on Form 8-K, and amendments to reports filed pursuant to Sections 13(a) and 15(d) of the Securities Exchange Act of 1934, as amended (Exchange Act), are filed with the U.S. Securities and Exchange Commission (SEC). We are subject to the informational requirements of the Exchange Act and file or furnish reports, proxy statements, and other information with the SEC. Such reports and other information filed by the Company with the SEC are available free of charge on our website at investor.chegg.com when such reports are available on the SEC’s website. We use our www.chegg.com/mediacenter website as a means of disclosing material non-public information and for complying with our disclosure obligations under Regulation FD. Accordingly, investors should monitor www.chegg.com/mediacenter, in addition to following our press releases, SEC filings and public conference calls and webcasts.
The public may read and copy any materials filed by Chegg with the SEC at the SEC’s Public Reference Room at 100 F Street, NE, Room 1580, Washington, D.C. 20549. The public may obtain information on the operation of the Public Reference Room by calling the SEC at 1-800-SEC-0330. The SEC maintains an Internet site that contains reports, proxy and information statements and other information regarding issuers that file electronically with the SEC at www.sec.gov.
The contents of the websites referred to above are not incorporated into this filing. Further, our references to the URLs for these websites are intended to be inactive textual references only.
The risks and uncertainties set forth below, as well as other risks and uncertainties described elsewhere in this
Annual
Report on Form
10-K
including in our consolidated financial statements and related notes and “Management’s Discussion and Analysis of Financial Condition and Results of Operations” or in other filings by Chegg with the SEC, could adversely affect our business, financial condition, results of operations and the trading price of our common stock. Additional risks and uncertainties that are not currently known to us or that are not currently believed by us to be material may also harm our business operations and financial results. Because of the following risks and uncertainties, as well as other factors affecting our financial condition and operating results, past financial performance should not be considered to be a reliable indicator of future performance, and investors should not use historical trends to anticipate results or trends in future periods.
Risks Related to Our Business and Industry
Our limited operating history, recent business model transition and evolving digital offerings make it difficult to evaluate our current business and future prospects.
Although we began our operations in July 2005, we did not launch our online print textbook rental business until 2007 or begin generating revenues at scale from print textbook rentals until 2010. We began transitioning to a new model for our Required Materials product line in August 2014 through our strategic partnership with Ingram to accelerate our transition away from the more capital intensive aspects of the print textbook rental business. We completed our transition to a fully digital company as of November 2016 as Ingram now fulfills all print textbook rental orders. We continue to market, use our branding and maintain the customer experience around print textbook rentals, while Ingram or other partners fund all rental textbook inventory and have title and risk of loss related to textbook rentals for the textbooks they own.
Since July 2010, we also have been focused on expanding our other offerings, in many instances through the acquisition of other companies, to include supplemental materials, Chegg Study, Chegg Writing, Chegg Tutors, Chegg Test
10
Prep, College Admissions and Scholarship Services, internships, careers, college counseling and brand advertising. For example, in August 2017, we entered into a partnership with Kaplan to provide their test preparation courses, practice products, and books through our website. Our newer products and services, or any other products and services we may introduce or acquire, may not be integrated effectively into our business, achieve or sustain profitability or achieve market acceptance at levels sufficient to justify our investment.
Our ability to fully integrate new products and services into our learning platform or achieve satisfactory financial results from them is unproven. Because we have a limited operating history, in particular operating a fully digital platform, and the market for our products and services, including newly acquired or developed products and services, is rapidly evolving, it is difficult for us to predict our operating results, particularly with respect to our newer offerings, and the ultimate size of the market for our products and services. If the market for a learning platform does not develop as we expect, or if we fail to address the needs of this market, our business will be harmed.
We face the risks, expenses and difficulties typically encountered by companies in their early stage of development, including, but not limited to our ability to successfully:
|
•
|
execute on our relatively new and evolving business model;
|
|
•
|
develop new products and services, both independently and with developers or other third parties;
|
|
•
|
attract and retain students and increase their engagement with our learning platform and our mobile applications;
|
|
•
|
attract and retain brands, colleges, universities and other academic institutions to our marketing services;
|
|
•
|
manage the growth of our business, including increasing or unforeseen expenses;
|
|
•
|
develop and scale a high performance technology infrastructure to efficiently handle increased usage by students, especially during peak periods prior to each academic term;
|
|
•
|
maintain and manage relationships with strategic partners, including Ingram, NRCCUA, and other distributors, publishers, wholesalers, colleges and brands;
|
|
•
|
develop a profitable business model and pricing strategy;
|
|
•
|
compete with companies that offer similar services or products;
|
|
•
|
expand into adjacent markets;
|
|
•
|
navigate the ongoing evolution and uncertain application of regulatory requirements, such as privacy laws, to our business, including our new products and services;
|
|
•
|
integrate and realize synergies from businesses that we acquire; and
|
|
•
|
expand into foreign markets.
|
We have encountered and will continue to encounter these risks and if we do not manage them successfully, our business, financial condition, results of operations and prospects may be materially and adversely affected.
Our operating results are expected to be difficult to predict based on a number of factors.
We expect our operating results to fluctuate in the future based on a variety of factors, many of which are outside our control and are difficult to predict. As a result, period-to-period comparisons of our operating results may not be a good indicator of our future or long-term performance. The following factors may affect us from period-to-period and may affect our long-term performance:
|
•
|
our ability to attract and retain students and increase their engagement with our learning platform and mobile applications, particularly related to our Chegg Services subscribers;
|
|
•
|
the rate of adoption of our offerings;
|
|
•
|
our ability to successfully utilize the information gathered from our learning platform to enhance our Student Graph and target sales of complementary products and services to our students;
|
|
•
|
changes in demand and pricing for print textbooks and eTextbooks; Ingram's ability to manage fulfillment processes to handle significant volumes during peak periods and as a result of the potential growth in volume of transactions over time; changes by our competitors to their product and service offerings;
|
|
•
|
price competition and our ability to react appropriately to such competition;
|
|
•
|
our ability and Ingram's ability to manage their textbook library;
|
|
•
|
our ability to execute on our strategic partnership with Ingram;
|
|
•
|
disruptions to our internal computer systems and our fulfillment information technology infrastructure, particularly during peak periods; the amount and timing of operating costs and capital expenditures relating to expansion of our business, operations and infrastructure;
|
11
|
•
|
our ability to successfully manage the integration of operations, technology and personnel resulting from our acquisitions;
|
|
•
|
governmental regulation in particular regarding privacy and advertising and taxation policies; and
|
|
•
|
general macroeconomic conditions and economic conditions specific to higher education.
|
We have a history of losses and we may not achieve or sustain profitability in the future.
We have experienced significant net losses since our incorporation in July 2005, and we may continue to experience net losses in the future. Our net losses for the
years ended December 31, 2017
,
2016
and
2015
were
$20.3 million
,
$42.2 million
and
$59.2 million
, respectively. As of
December 31, 2017
, we had an accumulated deficit of
$391.6 million
. We expect to make significant investments in the development and expansion of our business and our cost of revenues and operating expenses may increase. We may not succeed in increasing our revenues sufficiently to offset these higher expenses, and our efforts to grow the business may prove more expensive than we currently anticipate. We may incur significant losses in the future for a number of reasons, including slowing demand for print textbook rentals or our other products and services; increasing competition, particularly for the price of textbooks; decreased spending on education; and other risks described in this
Annual
Report on Form
10-K
. We may encounter unforeseen expenses, challenges, complications and delays and other unknown factors as we pursue our business plan and our business model continues to evolve. While Chegg Services revenues have grown in recent periods, this growth may not be sustainable and we may not be able to achieve profitability. To achieve profitability, we may need to change our operating infrastructure and scale our operations more efficiently. We also may need to reduce our costs or implement changes in our product offerings to improve the predictability of our revenues. For example, we recently transitioned substantially all of our print textbook rental revenues to commissions-based revenues. If we fail to implement these changes on a timely basis or are unable to implement them due to factors beyond our control, our business may suffer. If we do achieve profitability, we may not be able to sustain or increase such profitability.
We intend to offer new products and services to students to grow our business. If our efforts are not successful, our business and financial results would be adversely affected.
Our ability to attract and retain students and increase their engagement with our learning platform depends on our ability to connect them with the product, person or service they need to save time, save money, and get smarter. Part of our strategy is to offer students new products and services in an increasingly relevant and personalized way. We may develop such products and services independently, by acquisition or in conjunction with developers and other third parties. For example, in 2016, we acquired our Writing Tools service in the acquisition of Imagine Easy Solutions and in October 2017 we acquired Math 42, in the acquisition of Cogeon, and we developed Chegg Test Prep internally, which we offer as a free service to students. We recently partnered with Kaplan in August 2017, to provide their test preparation courses, practice products, and books through our website. The markets for these new products and services may be unproven, and these products may include technologies and business models with which we have little or no prior development or operating experience or may significantly change our existing products and services. In addition, we may be unable to obtain long-term licenses from third-party content providers necessary to allow a product or service, including a new or planned product or service, to function. If our new or enhanced products and services fail to engage our students or attract new students, or if we are unable to obtain content from third parties that students want, we may fail to grow our student base or generate sufficient revenues, operating margin or other value to justify our investments, and our business would be adversely affected.
In the future, we may invest in new products and services and other initiatives to generate revenues, but there is no guarantee these approaches will be successful. Acquisitions of new companies, products and services create integration risk, while development of new products and services and enhancements to existing products and services involve significant time, labor and expense and are subject to risks and challenges including managing the length of the development cycle, entry into new markets, integration into our existing business, regulatory compliance, evolution in sales and marketing methods and maintenance and protection of intellectual property and proprietary rights. If we are not successful with our new products and services, we may not be able to maintain or increase our revenues as anticipated or recover any associated acquisition or development costs, and our financial results could be adversely affected.
12
We may not realize the anticipated benefits of acquisitions, which could disrupt our business and harm our financial condition and results of operations.
As part of our business strategy, we have made and intend to make acquisitions to add specialized employees, complementary businesses, products, services, operations or technologies. Realizing the benefits of acquisitions depends, in part, on our successful integration of acquired companies including their technologies, products, services, operations and personnel in a timely and efficient manner. We may incur significant costs integrating acquired companies and if our integration efforts are not successful we may not be able to offset our acquisition costs. Acquisitions involve many risks that may negatively impact our financial condition and results of operations, including the risks that the acquisitions may:
|
•
|
require us to incur charges and substantial debt or liabilities;
|
|
•
|
cause adverse tax consequences, substantial depreciation or deferred compensation charges;
|
|
•
|
result in acquired in-process research and development expenses or in the future may require the amortization, write-down or impairment of amounts related to deferred compensation, goodwill and other intangible assets; and
|
|
•
|
give rise to various litigation risks, including the increased likelihood of litigation.
|
In addition:
|
•
|
we may not generate sufficient financial return to offset acquisition costs;
|
|
•
|
we may encounter difficulties or unforeseen expenditures in integrating the business, technologies, products, services, operations and personnel of any company that we acquire, particularly if key personnel of the acquired company decide not to work for us;
|
|
•
|
an acquisition may disrupt our ongoing business, divert resources, increase our expenses and distract our management;
|
|
•
|
an acquisition may delay adoption rates or reduce engagement rates for our products and services and those of the company acquired by us due to student uncertainty about continuity and effectiveness of service from either company;
|
|
•
|
we may encounter difficulties in, or may be unable to, successfully sell or otherwise monetize any acquired products and services;
|
|
•
|
an acquisition may not ultimately be complementary to our evolving business model; and
|
|
•
|
an acquisition may involve the entry into geographic or business markets in which we have little or no prior experience.
|
Acquired companies, businesses and assets can be complex and time consuming to integrate. For example, we recently expanded into internships with the acquisition of internships.com in October 2014, into writing tools with the acquisition of Imagine Easy Solutions in 2016, and math technology with the acquisition of Cogeon in 2017. We are currently in the process of transitioning these users to the Chegg platform and integrating these brands into the Chegg platform. We may not successfully transition these users to the Chegg platform.
Our ability to acquire and integrate larger or more complex businesses, products, services, operations or technologies in a successful manner is unproven. We may not be able to find suitable acquisition candidates, and we may not be able to complete acquisitions on favorable terms, if at all. To finance any future acquisitions we may issue equity, which could be dilutive, or debt, which could be costly, potentially dilutive, and require substantial restrictions on the conduct of our business. If we fail to successfully complete any acquisitions, integrate the services, products, personnel, operations or technologies associated with such acquisitions into our company, or identify and address liabilities associated with the acquired business or assets, our business, revenues and operating results could be adversely affected. Any future acquisitions we complete may not achieve our goals.
We operate in a rapidly changing market and we have recently transitioned our business model to a fully digital business. If we do not successfully adapt to known or unforeseen market developments, our business may be harmed.
The market for our learning platform is still unproven and rapidly changing. Historically, we generated the majority of our revenues from print textbook rental, which is highly capital intensive and presents both business planning and logistical challenges that are complex. To reduce our investment in the highly capital intensive nature of print textbook rentals, we entered into a partnership with Ingram wherein Ingram makes all new investments in the rental library of print textbooks, taking title and risk of loss for the books, and provides logistical and fulfillment services for the print textbooks that we rent and sell. The partnership allows us to market, use our branding and maintain the customer experience around print textbook rentals, while reducing our investments in print textbook inventory, fulfillment and logistics operations. As a result of this change, we
13
stopped making additional investments in our print textbook library beginning in May 2015 and we liquidated our remaining inventory of print textbooks during the first quarter of 2017 and have now fully transitioned these aspects of our print textbook offerings to Ingram. Our partnership with Ingram is non-exclusive and subject to significant risks, including Ingram's ability to acquire textbooks and manage logistical and fulfillment activities for us, our ability to create a successful and profitable partnership, and that we or Ingram may elect to terminate the partnership sooner than anticipated.
We have added and plan to continue to add new offerings to our learning platform, including, for example, writing and math tools, to diversify our sources of revenues, which will require us to make substantial investments in the products and services we develop or acquire. New offerings may not achieve market success at levels that recover our investment or contribute to profitability. Because these offerings are not as capital intensive as our print textbook rental service, the barriers to entry for existing and future competitors may be lower and allow for even more rapid changes to the market. Furthermore, the market for these other products and services is relatively new and may not develop as we expect. If the market for our offerings does not develop as we expect, or if we fail to address the needs of this market, our business may be harmed. We may not be successful in executing on our evolving business model, and if we cannot provide an increasing number of products and services that students, colleges and brands find compelling, we will not be able to continue our recent growth and increase our revenues, margins and profitability. For all of these reasons, the evolution of our business model is ongoing and the future revenues and income potential of our offerings is uncertain.
If our efforts to attract new students to use our products and services and increase student engagement with our learning platform are not successful, our business will be adversely affected.
The growth of our business depends on our ability to attract new students to use our products and services and to increase the level of engagement by existing students with our learning platform. The substantial majority of our revenues depends on small transactions made by a widely dispersed student population with an inherently high rate of turnover primarily as a result of graduation. Many of the students we desire to attract are accustomed to obtaining textbooks through bookstores or used booksellers. The rate at which we expand our student user base and increase student engagement with our learning platform may decline or fluctuate because of several factors, including:
|
•
|
our ability to engage high school students with our
Chegg Writing, Chegg Tutors, Chegg Test Prep and College Admissions and Scholarship Services
;
|
|
•
|
our ability to produce compelling supplemental materials and services for students to improve their outcomes throughout their educational journey;
|
|
•
|
our ability to produce engaging mobile applications and websites for students to engage with our learning platform;
|
|
•
|
our ability and Ingram's ability to consistently provide students with a convenient, high quality experience for selecting, receiving and returning print textbooks;
|
|
•
|
our ability and Ingram's ability to accurately forecast and respond to student demand for print textbooks;
|
|
•
|
the pricing of our physical textbooks and eTextbooks for rental or sale in relation to other alternatives, including the prices offered by publishers or by other competing textbook rental providers;
|
|
•
|
the quality and prices of our offerings compared to those of our competitors;
|
|
•
|
the rate of adoption of eTextbooks and our ability to capture a significant share of that market;
|
|
•
|
changes in student spending levels;
|
|
•
|
changes in the number of students attending college;
|
|
•
|
the effectiveness of our sales and marketing efforts; and
|
|
•
|
our ability to introduce new products and services that are favorably received by students.
|
If we do not attract more students to our learning platform and the products and services that we offer or if students do not increase their level of engagement with our platform, our revenues may grow more slowly than expected or decline. Many students use our print textbook service as a result of word-of-mouth advertising and referrals from students who have used this service in the past. If our efforts to satisfy our existing student user base are not successful, we may not be able to attract new students and, as a result, our business will be adversely affected.
Our future revenues depend on our ability to continue to attract new students from a high school and college student population that has an inherently high rate of turnover primarily due to graduation, requiring us to invest continuously in marketing to the student population to build brand awareness and loyalty, which we may not be able to accomplish on a cost-effective basis or at all.
We are dependent on the acquisition of new students from a high school and college student population that has an inherently high rate of turnover primarily due to graduation. Most incoming college students will not have previously used
14
products and services like the ones we provide which are geared towards the college market. We rely heavily on word-of-mouth and other marketing channels, including online advertising, search engine marketing and social media. The student demographic is characterized by rapidly changing tastes, preferences, behavior, and brand loyalty. Developing an enduring business model to serve this population is particularly challenging. Our ability to attract new students depends not only on investment in our brand and our marketing efforts, but also on the perceived value of our products and services versus competing alternatives among our extremely price conscious student user base. If our marketing initiatives are not successful or become less effective, or if the cost of such initiatives were to significantly increase, we may not be able to attract new students as successfully or efficiently and, as a result, our revenues and results of operations would be adversely affected. Even if our marketing initiatives succeed in establishing brand awareness and loyalty, we may be unable to maintain and grow our student user base if our competitors, some of whom are substantially larger and have greater financial resources, adopt aggressive pricing strategies to compete against us. If we are unable to offer competitive prices for our products and services fewer students may use our learning platform, products or services.
If we are not able to manage the growth of our business both in terms of scale and complexity, our operating results and financial condition could be adversely affected.
We have expanded rapidly since we launched our online print textbook rental service in 2007. We anticipate further expanding our operations to offer additional products, services and content to help grow our student user base and to take advantage of favorable market opportunities. As we grow, our operations and the technology infrastructure we use to manage and account for our operations will become more complex, and managing these aspects of our business will become more challenging. Any future expansion will likely place significant demands on our resources, capabilities and systems, and we may need to develop new processes and procedures and expand the size of our infrastructure to respond to these demands. If we are not able to respond effectively to new and increasingly complex demands that arise because of the growth of our business, or, if in responding to such demands, our management is materially distracted from our current operations, our operating results and financial condition may be adversely affected.
If our efforts to build a strong brand are not successful, we may not be able to grow our student user base, which could adversely affect our operating results.
We believe our brand is a key asset of our business. Developing, protecting and enhancing the “Chegg” brand is critical to our ability to expand our student user base and increase student engagement with our learning platform. A strong brand also helps to counteract the significant student turnover we experience from year to year as students graduate and differentiates us from our competitors.
To succeed in our efforts to strengthen our brand identity, we must, among other activities:
|
•
|
maintain our reputation as a trusted source of content, services and textbooks for students;
|
|
•
|
maintain the quality of and improve our existing products, services and technologies;
|
|
•
|
maintain and control the quality of our brand while Ingram handles our textbook fulfillment logistics;
|
|
•
|
introduce products and services that are favorably received;
|
|
•
|
adapt to changing technologies, including developing and enhancing compelling mobile offerings for our learning platform;
|
|
•
|
adapt to students’ rapidly changing tastes, preferences, behavior and brand loyalties;
|
|
•
|
protect our students’ data, such as passwords and personally identifiable information;
|
|
•
|
protect our trademark and other intellectual property rights;
|
|
•
|
continue to expand our reach to students in high school, graduate school and internationally;
|
|
•
|
ensure that the content posted to our website by students is reliable and does not infringe on third-party copyrights or violate other applicable laws, our terms of use or the ethical codes of those students’ colleges;
|
|
•
|
adequately address students’ concerns with our products and services; and
|
|
•
|
convert and fully integrate the brands and students that we acquire, including Math 42, Imagine Easy Solutions and internships.com, into the Chegg brand and Chegg.com.
|
Our ability to successfully achieve these goals is not entirely within our control and we may not be able to maintain the strength of our brand or do so in a cost-effective manner. Factors that could negatively affect our brand include:
|
•
|
changes in student sentiment about the quality or usefulness of our learning platform and our products and services;
|
|
•
|
problems that prevent Ingram from delivering textbooks reliably or timely;
|
15
|
•
|
technical or other problems that prevent us from providing our products and services reliably or otherwise negatively affect the student experience on our website or our mobile application;
|
|
•
|
concern from colleges about the ways students use our content offerings, such as our Expert Answers service;
|
|
•
|
brand conflict between acquired brands and the Chegg brand;
|
|
•
|
student concerns related to privacy and the way in which we use student data as part of our products and services;
|
|
•
|
the reputation or products and services of competitive companies; and
|
|
•
|
students’ misuse of our products and services in ways that violate our terms of services, applicable laws or the code of conduct at their colleges.
|
If Internet search engines’ methodologies are modified or our search result page rankings decline for other reasons, student engagement with our website could decline.
We depend in part on various Internet search engines, such as Google, Bing and Yahoo!, to direct a significant amount of traffic to our website. Similarly, we depend on mobile app stores such as iTunes and Google Play to allow students to locate and download Chegg mobile applications that enable our service. Our ability to maintain the number of students directed to our website is not entirely within our control. Our competitors’ search engine optimization (SEO) efforts may result in their websites receiving a higher search result page ranking than ours, or Internet search engines could revise their methodologies in an attempt to improve their search results, which could adversely affect the placement of our search result page ranking. If search engine companies modify their search algorithms in ways that are detrimental to our search result page ranking or in ways that make it harder for students to find our website, or if our competitors’ SEO efforts are more successful than ours, overall growth could slow, student engagement could decrease, and fewer students may use our platform. These modifications may be prompted by search engine companies entering the online networking market or aligning with competitors. Our website has experienced fluctuations in search result rankings in the past, and we anticipate similar fluctuations in the future. Any reduction in the number of students directed to our website could harm our business and operating results.
Any significant disruption, including those related to cybersecurity or arising from cyber-attacks, to our computer systems, especially during peak periods, could result in a loss of students, colleges and/or brands which could harm our business, results of operations and financial condition.
We rely on computer systems housed in six facilities, three located on the East Coast and three located on the West Coast, to manage our operations. We have experienced and expect to continue to experience periodic service interruptions and delays involving our systems. While we maintain a fail-over capability that would allow us to switch our operations from one facility to another in the event of a service outage, that process would still result in service interruptions that could be significant in duration. These service interruptions could have a disproportionate effect on our operations if they were to occur during one of our peak periods. Our facilities are vulnerable to damage or interruption from earthquakes, floods, fires, power loss, telecommunications failures and similar events.
Our facilities and information systems also are subject to break-ins, sabotage, intentional acts of vandalism, cybersecurity risks including cyber-attacks such as computer viruses and denial of service attacks, the failure of physical, administrative and technical security measures, terrorist acts, natural disasters, human error, the financial insolvency of our third-party vendors, and other unanticipated problems or events. These information systems periodically experience directed attacks intended to lead to interruptions and delays in our operations as well as loss, misuse or theft of data. We have implemented physical, technical and administrative safeguards to protect our systems. To date, unauthorized users have not had a material effect on our systems; however, there can be no assurance that attacks will not be successful in the future. In addition, our information systems must be constantly updated, patched, and upgraded to protect against known vulnerabilities and optimize performance. Material disruptions or slowdown of our systems, including a disruption or slowdown could occur if we are unable to successfully update, patch and upgrade our systems. For instance, in December 2017, researchers identified significant CPU architecture vulnerabilities commonly known as “Spectre” and “Meltdown” that have affected both private and public cloud services, including AWS, that have required software updates and patches to mitigate such vulnerabilities and such updates and patches have required servers to be offline and potentially slow their performance.
We also rely on Internet systems and infrastructure to operate our business and provide our services. The information systems used by our third-party service providers and the Internet generally are vulnerable to these risks as well. In particular, we are heavily reliant on SaaS enterprise resource planning systems to conduct our e-commerce and financial transactions and reporting. In addition, we utilize third-party cloud computing services in connection with our business operations. Problems faced by us or our third-party hosting/cloud computing providers, or interruptions in our own systems or in the infrastructure of the Internet, including technological or business-related disruptions, as well as cybersecurity threats, could hinder our ability to operate our business, damage our reputation or brand and result in a loss of students, colleges or brands which could harm our business, results of operations and financial condition.
16
Difficulties that could arise from our partnership with Ingram and other partners may have an adverse effect on our business and results of operations.
We rely on Ingram to make new investments in the print textbook library and fulfill print textbook rental and sales orders. We purchase used print textbooks on Ingram’s behalf, including books through our buyback program, and invoice Ingram at cost. As we no longer own print textbooks, we have become increasingly committed to this strategic partnership. If our continuing partnership with Ingram is interrupted or if Ingram experiences disruptions in its business or is not able to perform as anticipated, Ingram may not be able to reimburse us for the books we have procured on its behalf or we may experience operational difficulties, an inability to fulfill print textbook orders, increased costs and a loss of business, as well as a greater than expected deployment of capital for textbook acquisition, that may have a material adverse effect on our business, results of operations and financial condition. Furthermore, if we are unable to achieve the financial return targets set forth in our agreement with Ingram, we could be required to make additional payments to Ingram which could adversely affect our results of operations. Our strategic partnership with Ingram expires on May 20, 2020, subject to the early termination rights of the parties.
In addition to our strategic partnership with Ingram, we have entered into agreements with other partners to provide their textbooks for rental or sale through our website for which Ingram provides logistics and fulfillment for all print textbook rental or sale orders. We have also entered into partnerships with NRCCUA to become the exclusive reseller of our digital enrollment marketing services and with Kaplan to provide students with an online adaptive test preparation service. If we are unable to enter into or renew our agreements with our partners or if any of our partners perform significantly below our expectations, we may experience a material adverse effect on our business, results of operations and financial condition.
Ingram purchases, and we price, textbooks based on anticipated levels of demand and other factors that we estimate based on historical experience and various other assumptions. If actual results differ materially from our estimates, our gross margins may decline.
The print textbook rental distribution model requires our fulfillment partner, Ingram, to make substantial investments in its print textbook library based on our expectations regarding numerous factors, including ongoing demand for these titles in print form. To realize a return on its investments, we must rent each purchased textbook multiple times, and as such, we are exposed to the risk of not achieving financial return targets set forth in our agreement with Ingram, which could result in additional payments to Ingram and adversely affect our results of operations. We typically plan the textbook purchases based on factors such as pricing, our demand forecast for the most popular titles, estimated timing of edition changes, estimated utilization levels and planned liquidations of stale, old or excess titles in the print textbook library. These factors are highly unpredictable and can fluctuate substantially, especially if pricing pressure becomes more intense, as we have seen in recent rush cycles, or demand is reduced due to seasonality or other factors, including increased use of eTextbooks. We rely on a proprietary model to analyze and optimize the purchasing decisions and rely on inputs from third parties including publishers, distributors, wholesalers and colleges to make our decisions. We also rely on students to return print textbooks to Ingram in a timely manner and in good condition so that the print textbooks can be re-rented or sold. If the information we receive from third parties is not accurate or reliable, if students fail to return books or return damaged books, or if we for any other reason forecast demand inaccurately and cause Ingram to acquire insufficient copies of specific textbooks, we may be unable to satisfy student demand or we may have to incur significantly increased costs in order to do so, in which event our student satisfaction and results of operations could be affected adversely. Conversely, if we attempt to mitigate this risk and cause Ingram to acquire more copies than needed to satisfy student demand, then our textbook utilization rates would decline and we may be required to make additional payments to Ingram and our gross margins would be affected adversely.
When deciding whether to offer a textbook for rent and the price we charge for that rental, we also must weigh a variety of factors and assumptions and if our judgments or assumptions are incorrect, our gross margins may be adversely affected. Certain textbooks cost more to acquire depending on the source from which they are acquired and the terms on which they are acquired. We must factor in some projection of the number of rentals we will be able to achieve with such textbooks and at what rental price, among other factors, to determine whether we believe it will be profitable to cause Ingram to acquire such textbooks and for us to offer them for rent. If the textbooks Ingram acquires are lost, determined to be unauthorized copies, or damaged prematurely, Ingram may not be able to recover its costs or generate revenues on those textbooks. If we are unable to effectively make decisions about whether to cause Ingram to acquire textbooks and the price we charge to rent those textbooks, including if the assumptions upon which our decisions are made prove to be inaccurate, our gross margins may decline significantly and if, as a result, we are unable to achieve the financial return targets set forth in our agreement with Ingram, we could be required to make additional payments to Ingram which could adversely affect our results of operations.
17
If Ingram's relationships with the shipping providers that deliver textbooks directly to our students are terminated or impaired, if shipping costs increase or if these vendors are unable to timely deliver textbooks to our students, our business and results of operations could be substantially harmed.
Ingram predominantly relies on UPS to deliver textbooks from its textbook warehouse and to return textbooks to Ingram from our students. To a lesser extent Ingram relies on FedEx for delivery of print textbook rentals and on publishers, distributors and wholesalers to fulfill a certain portion of textbook sales orders and liquidations. As a result, our business could be subject to carrier disruptions and increased costs due to factors that are beyond our control, including labor difficulties, inclement weather, increased fuel costs and other rising costs of transportation and terrorist activity. If UPS were to limit its services or delivery areas, such as by the discontinuation of Saturday delivery service, Ingram's ability to timely deliver textbooks could diminish, and our student satisfaction could be adversely affected. If Ingram's relationships with its shipping vendors are terminated or impaired or if Ingram's shipping vendors are unable to deliver merchandise for us, Ingram would be required to rely on alternative carriers for delivery and return shipments of textbooks to and from students. Ingram may be unable to sufficiently engage alternative carriers on a timely basis or on terms favorable to them, if at all. If textbooks are not delivered on time to students, they could become dissatisfied and discontinue their use of our service, which could adversely affect our operating results.
We rely on third-party software and service providers, including Amazon Web Services (AWS), to provide systems, storage and services for our website. Any failure or interruption experienced by such third parties could result in the inability of students to use our products and services, result in a loss of revenues and harm our reputation.
We rely on third-party software and service providers, including AWS, to provide systems, storage and services, including user log in authentication, for our website. Any technical problem with, cyber-attack on, or loss of access to such third parties’ systems, servers or technologies could result in the inability of our students to rent or purchase print textbooks, interfere with access to our digital content and other online products and services or result in the theft of end-user personal information.
Our reliance on AWS makes us vulnerable to any errors, interruptions, or delays in their operations. Any disruption in the services provided by AWS could harm our reputation or brand or cause us to lose students or revenues or incur substantial recovery costs and distract management from operating our business. For instance, in February 2017, AWS experienced a widespread outage for half a business day, when during such time our learning platform was unavailable. Additionally, in December 2017, researchers identified significant CPU architecture vulnerabilities commonly known as “Spectre” and “Meltdown” that have affected both private and public cloud services, including AWS, that have required software updates and patches to mitigate such vulnerabilities and such updates and patches have required servers to be offline and potentially slow their performance.
AWS may terminate its agreement with us upon 30 days' notice. Upon expiration or termination of our agreement with AWS, we may not be able to replace the services provided to us in a timely manner or on terms and conditions, including service levels and cost, that are favorable to us, and a transition from one vendor to another vendor could subject us to operational delays and inefficiencies until the transition is complete.
Increased activity during peak periods places substantially increased strain on our operations and any failure to deliver our products and services during these periods will have an adverse effect on student satisfaction and our revenues.
We historically experience a disproportionate amount of activity on our website at the beginning of each academic term as students search our textbook catalog and place orders for course materials. If too many students access our website within a short period of time due to increased demand, we may experience system interruptions that make our website unavailable, slowed or prevent Ingram from efficiently fulfilling rental orders, which may reduce the volume of textbooks we are able to rent or sell and may also impact our ability to sell marketing services to colleges and brands. In addition, during peak periods, we utilize, and Ingram utilizes, independent contractors and temporary personnel to supplement the workforce primarily in our student advocacy organizations and in Ingram's warehouses. Competition for qualified personnel has historically been intense, and we or Ingram may be unable to adequately staff our student advocacy organizations or Ingram's warehouses during these peak periods. Any understaffing could lead to an increase in both the amount of time required to ship textbooks, which could lead to student dissatisfaction, and increase the amount of time required to process a rental return, which could result in an inability to achieve the financial return targets set forth in our agreement with Ingram. Moreover, UPS and FedEx, the third-party carriers that Ingram primarily relies on to deliver textbooks to students, and publishers, wholesalers and distributors that ship directly to our students may be unable to meet our shipping and delivery requirements during peak periods, especially during inclement weather. Any such disruptions to our business could cause our customers to be dissatisfied with our products and services and have an adverse effect on our revenues.
18
Computer malware, viruses, hacking, phishing attacks and spamming could harm our business and results of operations.
Computer malware, viruses, physical or electronic break-ins and similar disruptions could lead to interruptions and delays in our services and operations and loss, misuse or theft of data. For instance, in December 2017, researchers identified significant CPU architecture vulnerabilities commonly known as “Spectre” and “Meltdown” that allow malicious programs to gain access to data. While chip makers and companies that provide widely used operating systems have released patches and updates, this process is still ongoing. Computer malware, viruses, computer hacking and phishing attacks against online networking platforms have become more prevalent and may occur on our systems in the future. We believe that we could be a target for such attacks because of the incidence of hacking among students.
Any attempts by hackers to disrupt our website service or our internal systems, if successful, could harm our business, be expensive to remedy and damage our reputation or brand. Our network security business disruption insurance may not be sufficient to cover significant expenses and losses related to direct attacks on our website or internal systems. Efforts to prevent hackers from entering our computer systems are expensive to implement and may limit the functionality of our services. Though it is difficult to determine what, if any, harm may directly result from any specific interruption or attack, any failure to maintain performance, reliability, security and availability of our products and services and technical infrastructure may harm our reputation, brand and our ability to attract students to our website. Any significant disruption to our website or internal computer systems could result in a loss of students, colleges or brands and, particularly if disruptions occur during the peak periods at the beginning of each academic term, could adversely affect our business and results of operations.
We rely heavily on our proprietary technology to process deliveries and returns of the textbooks and to manage other aspects of our operations. The failure of this technology to operate effectively, particularly during peak periods, could adversely affect our ability to retain and attract student users.
We use complex proprietary software to process deliveries and returns of the textbooks and to manage other aspects of our operations, including systems to consider the market price for textbooks, general availability of textbook titles and other factors to determine how to buy textbooks and set prices for textbooks and other content in real time. We rely on the expertise of our engineering and software development teams to maintain and enhance the software used for our distribution operations. We cannot be sure that the maintenance and enhancements we make to our distribution operations will achieve the intended results or otherwise be of value to students. If we are unable to maintain and enhance our technology to manage the shipping and return of textbooks in a timely and efficient manner, particularly during peak periods, our ability to retain existing students and to add new students may be impaired.
We may not timely and effectively scale and adapt our existing technology and network infrastructure to ensure that our learning platform is accessible and delivers a satisfactory user experience to students.
It is important to our success that students be able to access our learning platform at all times. We have previously experienced, and may in the future experience, service disruptions, outages and other performance problems due to a variety of factors, including infrastructure changes, third-party service providers, human or software errors and capacity constraints due to an overwhelming number of students accessing our platform simultaneously. If our learning platform is unavailable when students attempt to access it or it does not load as quickly as they expect, students may seek other services to obtain the information for which they are looking and may not return to our platform as often in the future, or at all. This would negatively impact our ability to attract students and brands and the frequency with which they use our website and mobile applications.
Our platform functions on software that is highly technical and complex and may now or in the future contain undetected errors, bugs, or vulnerabilities. Some errors in our software code may only be discovered after the code has been deployed. Any errors, bugs, or vulnerabilities discovered in our code after deployment, inability to identify the cause or causes of performance problems within an acceptable period of time or difficultly maintaining and improving the performance of our platform, particularly during peak usage times, could result in damage to our reputation or brand, loss of students, colleges and brands, loss of revenues, or liability for damages, any of which could adversely affect our business and financial results.
We expect to continue to make significant investments to maintain and improve the availability of our platform and to enable rapid releases of new features and products. To the extent that we do not effectively address capacity constraints, upgrade our systems as needed and continually develop our technology and network architecture to accommodate actual and anticipated changes in technology, our business and operating results may be harmed.
We have a disaster recovery program to transition our operating platform and data to a failover location in the event of a catastrophe and have tested this capability under controlled circumstances, however, there are several factors ranging from human error to data corruption that could materially lengthen the time our platform is partially or fully unavailable to our
19
student user base as a result of the transition. If our platform is unavailable for a significant period of time as a result of such a transition, especially during peak periods, we could suffer damage to our reputation or brand, loss of students, colleges and brands or loss of revenues any of which could adversely affect our business and financial results.
Our reputation and relationships with students and tutors would be harmed if our users’ data, particularly billing data, were to be accessed by unauthorized persons.
We maintain personal data regarding students and tutors who use our platform, including names and, in many cases, mailing addresses, and, in the case of tutors, information necessary for payment and tax filings. We take measures to protect against unauthorized intrusion into our users’ and tutors’ data. However, despite these measures, if we or our payment processing services experience any unauthorized intrusion into our users’ and tutors’ data, current and potential users and tutors may become unwilling to provide the information to us necessary for them to engage with our platform, we could face legal claims and our business and reputation could be adversely affected. The breach of a third-party’s website, resulting in theft of user names and passwords, could result in the fraudulent use of that user login information on our platform. In addition, we do not obtain signatures from students in connection with the use of credit cards by them. Under current credit card practices, to the extent we do not obtain cardholders’ signatures, we are liable for fraudulent credit card transactions, even when the associated financial institution approves payment of the orders. From time to time, fraudulent credit cards may be used. We may experience some loss from these fraudulent transactions. As an example, we discovered in 2014 that certain individuals fraudulently obtained several thousand textbooks from us. While we do have safeguards in place, we cannot be certain that other fraudulent schemes will not be successful. A failure to adequately control fraudulent transactions would harm our business and results of operations.
Our wide variety of accepted payment methods subjects us to third-party payment processing-related risks.
We accept payments from students using a variety of methods, including credit cards, debit cards and PayPal. As we offer new payment options to students, we may be subject to additional regulations, compliance requirements and incidents of fraud. For certain payment methods, including credit and debit cards, we pay interchange and other fees, which may increase over time and raise our operating costs and lower our profit margins. For example, we have in the past experienced higher transaction fees from our third-party processors as a result of chargebacks on credit card transactions.
We rely on third parties to provide payment processing services, including the processing and information storage of credit cards and debit cards. If these companies become unwilling or unable to provide these services to us, our business could be disrupted. We are also subject to payment card association operating rules, certification requirements and rules governing electronic funds transfers, which could change or be reinterpreted to make it difficult or impossible for us to comply. If we fail to comply with these rules or requirements, we may be subject to additional fines and higher transaction fees and lose our ability to accept credit and debit card payments from our students, process electronic funds transfers or facilitate other types of online payments, and our business and operating results could be adversely affected.
We face significant competition in each aspect of our business, and we expect such competition to increase, particularly in the market for textbooks.
Our products and services compete for students, colleges and advertisers and we expect such competition to increase, as described below.
|
•
|
Products and Services for Students.
Our Chegg Services face competition from different businesses depending on the offering. For Chegg Study, our competitors primarily include publishers that provide study materials and online instructional systems. Additionally, we face competition from free services such as Yahoo! Answers and Brain.ly for our Expert Answers service. For our Chegg Writing service, we primarily face competition from other citation generating services such as Noodle Tools. For our Chegg Tutors services, we face competition from other online tutoring services such as Wyzant, Tutors.com and Varsity Tutors. The market for textbooks and supplemental materials is intensely competitive and subject to rapid change. We face competition from college bookstores, some of which are operated by Follett and Barnes & Noble Education, online marketplaces such as Amazon.com and providers of eTextbooks such as Apple iTunes and Blackboard, as well as various private textbook rental websites. Many students purchase from multiple textbook providers, are highly price sensitive and can easily shift spending from one provider or format to another. As a consequence, our Required Materials product line, which includes eTextbooks, competes primarily on price and further on selection and functionality and compatibility of the eTextbook Reader we utilize across a wide variety of desktop and mobile devices.
|
20
|
•
|
Brand Advertising
.
With respect to brands, we compete with online and offline outlets that generate revenues from advertisers and marketers, especially those that target high school and college students. In this area, we seek to partner with brands that have offerings that will interest or delight students and have received very positive comments and feedback from students on these offerings. We provide these brands with preferential access to our audience, which we believe represents a highly engaged portion of the target demographic of our brand partners.
|
Our industry is evolving rapidly and is becoming increasingly competitive. Many of our competitors have longer operating histories, larger customer bases, greater brand recognition and significantly greater financial, marketing and other resources than we do. Some of our competitors have adopted, and may continue to adopt, aggressive pricing policies and devote substantially more resources to marketing, website and systems development than we do. In addition, a variety of business models are being pursued for the provision of print textbooks, some of which may be more profitable or successful than our business model. For example, a recent U.S. Supreme Court decision may make it easier for third parties to import low-cost “gray market” textbooks for resale in the United States, and these textbooks may compete with our offerings. In addition, Follett has partnered with some colleges through its includED program, which allows schools to deliver required course materials directly to students by including them in the cost of college as part of tuition and fees. Such strategic alliances may eliminate our ability to compete favorably with our Required Materials product line because of the added convenience they offer to students, which may result in reduced textbook rentals, loss of market share and reduced revenues. In addition, our competitors also may form or extend strategic alliances with publishers that could adversely affect Ingram's ability to obtain textbooks on favorable terms. We face similar risks from strategic alliances by other participants in the education ecosystem with respect to our newer offerings. We may, in the future, establish alliances or relationships with other competitors or potential competitors. To the extent such alliances are terminated or new alliances and relationships are established, our business could be harmed.
Our business is seasonal and we have increased risk from disruption during peak periods which makes our operating results difficult to predict.
We derive a significant portion of our net revenues from print textbook rental and, to a lesser extent, sale transactions, which occur in large part during short periods of time around the commencement of the fall, winter and spring academic terms. In particular, we and Ingram experience the largest increase in rental and sales volumes during the last two weeks of August and first two weeks of September and to a lesser degree in December and in January. The increased volume of orders that we and Ingram have to process during these limited periods of time means that any shortfalls or disruptions in our operations during these peak periods will have a disproportionately large impact on our annual operating results and the potential future growth of our business.
As a result of this seasonality, which corresponds to the academic calendar, our revenues fluctuate significantly quarter to quarter depending upon the timing of where we are in our “rush” cycle and sequential quarter-over-quarter comparisons of our revenues and operating results are not likely to be meaningful. In addition, our operating results for any given quarter cannot be used as an accurate indicator of our results for the year. In particular, we anticipate that our ability to accurately forecast financial results for future periods will be most limited at the time we present our second quarter financial results, which will generally occur midsummer and precede the “fall rush.” In addition, our other offerings, in particular services unrelated to textbooks, are relatively new and, as a result, we have limited experience with forecasting revenues from them.
The fourth quarter has typically been our highest performing quarter as we were recognizing a full quarter of revenues on print textbooks that we owned from peak volumes in August and September and partial revenues from peak volumes in December, while the second quarter has typically been our lowest performing quarter as students start their summer vacations and the volume of our textbook rentals and sales and purchases of supplemental materials and Chegg Study decreases. With Ingram fulfilling our print textbook rental orders, we now expect our first and third quarters print textbook revenue to be higher as we now recognize a commission immediately on the transaction of an Ingram-owned print textbook rather than recognizing the revenues ratably over the term the student rents one of our print textbooks.
We base our operating expense budgets on expected net revenue trends. Operating expenses, similar to revenues and cost of revenues, fluctuate significantly quarter to quarter due to the seasonality of our business and are generally higher during the first and third quarters as we incur marketing expense in connection with our peak periods at the beginning of each academic term. Because our revenues were historically concentrated in the fourth quarter and expenses are concentrated in the first and third quarters, we have experienced operating losses in the first and third quarters and operating income in the fourth quarter. As a result, sequential quarterly comparison of our financial results has not been meaningful. We expect our seasonality to shift as a result of our strategic partnership with Ingram and our highest quarters for revenues and operating expense to coincide. Further, a portion of our expenses, such as office space lease obligations and personnel costs, are largely fixed and are based on our expectations of our peak levels of operations. The Ingram partnership has resulted in our operating
21
expenses related to textbook acquisition, shipping and fulfillment and warehouse facility lease obligations either decreasing or being eliminated and we expect that our overall operating expenses to be more evenly distributed throughout the year. Nonetheless, we expect to continue to incur significant marketing expenses during peak periods and to have fixed expenses for office space and personnel and as such, we may be unable to adjust spending quickly enough to offset any unexpected revenues shortfall. Accordingly, any shortfall in net revenues may cause significant variation in operating results in any quarter.
Growing our student user base and their engagement with our learning platform through mobile devices depends upon the effective operation of our mobile applications with mobile operating systems, networks and standards that we do not control.
There is no guarantee that students will use our mobile applications, such as the mobile version of our website, m.chegg.com, Chegg Flashcards and Chegg Textbook Solutions, rather than competing products. We are dependent on the interoperability of our mobile applications with popular mobile operating systems that we do not control, such as Google's Android and Apple's iOS, and any changes in such systems that degrade our products’ functionality or give preferential treatment to competitive products could adversely affect the usage of our applications on mobile devices. Additionally, in order to deliver high quality mobile products, it is important that our products work well with a range of mobile technologies, systems, networks and standards that we do not control. We may not be successful in developing relationships with key participants in the mobile industry or in developing products that operate effectively with these technologies, systems, networks or standards. In the event that it is more difficult for students to access and use our applications on their mobile devices, or if students choose not to access or use our applications on their mobile devices or use mobile products that do not offer access to our applications, our student growth and student engagement levels could be harmed.
If the third party eTextbook Reader that we utilize does not remain compatible with third-party operating systems, demand for our eTextbooks may decline and could have an adverse effect on our revenues.
The third-party eTextbook Reader that we utilize is designed to provide students with access to eTextbooks from any device with an Internet connection and an Internet browser, including PCs, iPads, Android tablets, Kindles, Nooks and mobile phones. The third-party eTextbook Reader can be used across a variety of third-party operating systems. If this compatibility is not maintained, demand for our eTextbooks could decline and revenues could be adversely affected.
If the transition from print textbooks to eTextbooks does not proceed as we expect, our business and financial condition will be adversely affected.
The textbook distribution market has begun shifting toward digital distribution. If demand for eTextbooks accelerates more rapidly than we expect, we could be required to make additional payments to Ingram under our inventory purchase and consignment agreement. Conversely, if the transition to digital distribution of textbooks does not gain market acceptance as we expect, capital requirements over the long term may be greater than we expect and our opportunities for growth may be diminished. In that case, we may need to raise additional capital, which may not be available on reasonable terms, or at all, and we may not realize the potential long-term benefits of a shift to digital distribution, including greater pricing flexibility and the ability to distribute a larger library of eTextbooks compared to print textbooks.
If publishers refuse to grant us distribution rights to digital content on acceptable terms or terminate their agreements with us, or if we are unable to adequately protect their digital content rights, our business could be adversely affected.
We rely on licenses from publishers to distribute eTextbooks to our customers and to provide some of our other products and services. We do not have long-term contracts or arrangements with most publishers that guarantee the availability of such digital content. If we are unable to secure and maintain rights to distribute, or otherwise use, the digital content upon terms that are acceptable to us, or if publishers terminate their agreements with us, we would not be able to acquire such digital content from other sources and our ability to attract new students and retain existing students could be adversely impacted. Some of our licenses give the publisher the right to withdraw our rights to distribute or use the digital content without cause and/or give the publisher the right to terminate the entire license agreement without cause. If a publisher exercises such a right, this could adversely affect our business and financial results. Moreover, to the extent we are able to secure and maintain rights to distribute eTextbooks, our competitors may be able to obtain the same rights on more favorable terms.
In addition, our ability to distribute eTextbooks depends on publishers’ belief that we include effective digital rights management technology to control access to digital content. If the digital rights management technology that we use is compromised or otherwise malfunctions, we could be subject to claims, and publishers may be unwilling to include their content in our service. If users are able to circumvent the digital rights management technology that we use, they may acquire unauthorized copies of the textbooks that they would otherwise rent from us, which could decrease our textbook rental volume and adversely affect our results of operations.
22
If we fail to convince brands of the benefits of advertising on our platform or to use our marketing services, our business could be harmed.
Our business strategy includes increasing our revenues from brand advertising. Brands may view our learning platform as experimental and unproven. They may not do business with us, or may reduce the amounts they are willing to spend to advertise with us, if we do not deliver ads, sponsorships and other commercial content and marketing programs in an effective manner, or if they do not believe that their investment in advertising with us will generate a competitive return relative to other alternatives. Our ability to grow the number of brands that use our brand advertising, and ultimately to generate advertising and marketing services revenues, depends on a number of factors, including our ability to successfully:
|
•
|
compete for advertising and marketing dollars from colleges, brands, online marketing and media companies and advertisers;
|
|
•
|
penetrate the market for student-focused advertising;
|
|
•
|
develop a platform that can deliver advertising and marketing services across multiple channels, including print, email, Internet, mobile applications and other connected devices;
|
|
•
|
improve our analytics and measurement solutions to demonstrate the value of our advertising and marketing services;
|
|
•
|
maintain the retention, growth and engagement of our student user base;
|
|
•
|
strengthen our brand and increase our presence in media reports and with publicity companies that utilize online platforms for advertising and marketing purposes;
|
|
•
|
create new products that sustain or increase the value of our advertising and marketing services and other commercial content;
|
|
•
|
manage changes in the way online advertising and marketing services are priced;
|
|
•
|
weather the impact of macroeconomic conditions and conditions in the advertising industry and higher education in general; and
|
|
•
|
manage legal developments relating to data privacy, advertising or marketing services, legislation and regulation and litigation.
|
Our core value of putting students first may conflict with the short-term interests of our business.
We believe that adhering to our core value of putting students first is essential to our success and in the best interests of our company and the long-term interests of our stockholders. In the past, we have forgone, and in the future we may forgo, short-term revenue opportunities that we do not believe are in the best interests of students, even if our decision negatively impacts our operating results in the short term. For example, we offer free services to students that require investment by us, such as our Internships service, in order to promote a more comprehensive solution. We also developed the Chegg for Good program to connect students and employees with partners to engage them in causes related to education and the environment. We formed the Chegg Foundation, a California nonprofit public benefit corporation, to engage in charitable and education-related activities, which we funded with one percent of the net proceeds from our IPO in November 2013. Our philosophy of putting students first may cause us to make decisions that could negatively impact our relationships with publishers, colleges and brands, whose interests may not always be aligned with ours or those of our students. Our decisions may not result in the long-term benefits that we expect, in which case our level of student satisfaction and engagement, business and operating results could be harmed.
If we are required to discontinue certain of our current marketing activities, our ability to attract new students may be adversely affected.
Laws or regulations may be enacted which restrict or prohibit use of emails or similar marketing activities that we currently rely on. For example:
|
•
|
the CAN-SPAM Act of 2003 and similar laws adopted by a number of states regulate unsolicited commercial emails, create criminal penalties for emails containing fraudulent headers and control other abusive online marketing practices;
|
|
•
|
the U.S. Federal Trade Commission (FTC) has guidelines that impose responsibilities on companies with respect to communications with consumers and impose fines and liability for failure to comply with rules with respect to advertising or marketing practices they may deem misleading or deceptive; and
|
|
•
|
the TCPA restricts telemarketing and the use of automated telephone equipment. The TCPA limits the use of automatic dialing systems, artificial or prerecorded voice messages and SMS text messages. It also applies to unsolicited text messages advertising the commercial availability of goods or services. Additionally, a number of
|
23
states have enacted statutes that address telemarketing. For example, some states, such as California, Illinois and New York, have created do-not-call lists. Other states, such as Oregon and Washington, have enacted “no rebuttal statutes” that require the telemarketer to end the call when the consumer indicates that he or she is not interested in the product being sold. Restrictions on telephone marketing, including calls and text messages, are enforced by the FTC, the Federal Communications Commission, states and through the availability of statutory damages and class action lawsuits for violations of the TCPA.
Even if no relevant law or regulation is enacted, we may discontinue use or support of these activities if we become concerned that students or potential students deem them intrusive or they otherwise adversely affect our goodwill and brand. If our marketing activities are curtailed, our ability to attract new students may be adversely affected.
Our business and growth may suffer if we are unable to hire and retain key personnel.
We depend on the continued contributions of our senior management and other key personnel. In particular, we rely on the contributions of our Chief Executive Officer, Dan Rosensweig. All of our executive officers and key employees are at-will employees, meaning they may terminate their employment relationship at any time. We compensate our employees through a combination of salary, benefits and equity compensation. Volatility or a decline in our stock price may affect our ability to retain and motivate key employees, each of whom has been granted stock options, RSUs or both. Competition for qualified personnel can be intense, and we may not be successful in retaining and motivating such personnel, particularly to the extent our stock price is volatile or at a depressed level, as equity compensation plays an important role in how we compensate our employees. Such individuals may elect to seek employment with other companies that they believe have better long-term prospects. If we lose the services of one or more members of our senior management team or other key personnel, or if one or more of them decides to join a competitor or otherwise compete directly or indirectly with us, we may not be able to successfully manage our business or achieve our business objectives. Our future success also depends on our ability to identify, attract and retain highly skilled technical, managerial, finance and media procurement personnel. Qualified individuals are in high demand, particularly in the San Francisco Bay Area where our executive offices are located, and we may incur significant costs to attract them. If we are unable to attract or retain the personnel we need to succeed, our business may suffer.
We may need additional capital, and we cannot be sure that additional financing will be available or on favorable terms.
Historically, investments in our business have substantially exceeded the cash we have generated from our operations. We have funded our operating losses and capital expenditures through proceeds from equity and debt financings, equipment leases and cash flow from operations. Although we currently anticipate that our available funds and cash flow from operations will be sufficient to meet our cash needs for the foreseeable future, we may require additional financing, particularly if the investment required to fund our operations is greater than we anticipate or we choose to invest in new technologies or complementary businesses or change our business model. Our ability to obtain financing will depend, among other things, on our development efforts, business plans, operating performance and condition of the capital markets at the time we seek financing. Additional financing may not be available to us on favorable terms when required, or at all especially considering that we no longer own a print textbook library, which we previously used as collateral for our debt financings. If we raise additional funds through the issuance of equity, equity-linked or debt securities, those securities may have rights, preferences or privileges senior to the rights of our common stock, and our stockholders may experience substantial dilution.
Government regulation of education and student information is evolving, and unfavorable developments could have an adverse effect on our operating results.
We are subject to regulations and laws specific to the education sector because we offer our products and services to students and collect data from students. Data privacy and security with respect to the collection of personally identifiable information from students continues to be a focus of worldwide legislation and regulation. This includes significant regulation in the European Union and legislation and compliance requirements in various jurisdictions around the world. Within the United States, several states have enacted legislation that goes beyond any federal requirements relating to the collection and use of personally identifiable information and other data from students. Examples include statutes adopted by the State of California and most other States that require online services to report certain breaches of the security of personal data and a California statute that requires companies to provide choice to California customers about whether their personal data is disclosed to direct marketers or to report to California customers when their personal data has been disclosed to direct marketers. In this regard, there are a large number of legislative proposals before the U.S. Congress and various state legislative bodies regarding privacy issues related to our business. It is not possible to predict whether or when such legislation may be adopted, and certain proposals, if adopted, could harm our business through a decrease in student registrations and revenues. These decreases could be caused by, among other possible provisions, the required use of disclaimers or other requirements before students can utilize our services. We post our privacy policies and practices concerning the use and disclosure of student
24
data on our website. However, any failure by us to comply with our posted privacy policies, FTC requirements or other privacy-related laws and regulations could result in proceedings by governmental or regulatory bodies or by private litigants that could potentially harm our business, results of operations and financial condition.
Our business may also be subject to laws specific to students, such as the Family Educational Rights and Privacy Act, the Delaware Higher Education Privacy Act and a California statute which restricts the access by postsecondary educational institutions of prospective students’ social media account information. Compliance levels include disclosures, consents, transfer restrictions, notice and access provisions for which we may in the future need to build further infrastructure to further support. We cannot guarantee that we have been or will be fully compliant in every jurisdiction, as it is not entirely clear how existing laws and regulations governing educational institutions affect our business. Moreover, as the education industry continues to evolve, increasing regulation by federal, state and foreign agencies becomes more likely. Recently, California adopted the Student Online Personal Information Protection Act which prohibits operators of online services used for K-12 school purposes from using or sharing student personal information and Colorado adopted House Bill 16-1423 designed to protect the use of student personal data in elementary and secondary school. These acts do not apply to general audience Internet websites but it is not clear how these acts will be interpreted and the breadth of services that will be restricted by it. Other states may adopt similar statutes. The adoption of any laws or regulations that adversely affect the popularity or growth in the use of the Internet particularly for educational services, including laws limiting the content that we can offer, and the audiences that we can offer that content to, may decrease demand for our service offerings and increase our cost of doing business. Future regulations, or changes in laws and regulations or their existing interpretations or applications, could also hinder our operational flexibility, raise compliance costs and result in additional historical or future liabilities for us, resulting in adverse impacts on our business and our operating results.
While we expect and plan for new laws, regulations and standards to be adopted over time that will be directly applicable to the Internet and to our student-focused activities, any existing or new legislation applicable to our business could expose us to substantial liability, including significant expenses necessary to comply with such laws and regulations and potential penalties or fees for non-compliance, and could negatively impact the growth in the use of the Internet for educational purposes and for our services in particular. We may also run the risk of retroactive application of new laws to our business practices that could result in liability or losses. Due to the global nature of the Internet, it is possible that the governments of other states and foreign countries might attempt to change previous regulatory schemes or choose to regulate transmissions or prosecute us for violations of their laws. We might unintentionally violate such laws, such laws may be modified and new laws may be enacted in the future. Any such developments could harm our business, operating results and financial condition. We may be subject to legal liability for our offerings.
We collect, process, store and use personal information and data, which subjects us to governmental regulation and other legal obligations related to privacy and our actual or perceived failure to comply with such obligations could harm our business.
In the ordinary course of business, and in particular in connection with merchandising our service to students, we collect, process, store and use personal information and data supplied by students and tutors. We may enable students to share their personal information with each other and with third parties and to communicate and share information into and across our platform. Other businesses have been criticized by privacy groups and governmental bodies for attempts to link personal identities and other information to data collected on the Internet regarding users’ browsing and other habits. There are numerous federal, state and local laws regarding privacy and the collection, storing, sharing, using, processing, disclosing and protecting of personal information and other user data, the scope of which are changing, subject to differing interpretations, and which may be costly to comply with and may be inconsistent between countries and jurisdictions or conflict with other rules.
We currently face certain legal obligations regarding the manner in which we treat such information. Increased regulation of data utilization practices, including self-regulation or findings under existing laws, or new regulations restricting the collection, use and sharing of information from minors under the age of 18, that limit our ability to use collected data could have an adverse effect on our business. In addition, if unauthorized access to our students’ data were to occur or if we were to disclose data about our student users in a manner that was objectionable to them, our business reputation and brand could be adversely affected, and we could face legal claims that could impact our operating results. Our reputation and brand and relationships with students would be harmed if our billing data were accessed by unauthorized persons.
We strive to comply with all applicable laws, policies, legal obligations and industry codes of conduct relating to privacy and data protection. However, U.S. federal, U.S. state and international laws and regulations regarding privacy and data protection are rapidly evolving and may be inconsistent and we could be deemed out of compliance as such laws and their interpretation change. In addition, foreign privacy, data protection, and other laws and regulations, particularly in Europe and including the DPD and the GDPR, are often more restrictive than those in the United States. The costs of compliance with, and
25
other burdens imposed by, such laws and regulations that are applicable to our business operations may limit the use and adoption of our services and reduce overall demand for them. Furthermore, foreign court judgments or regulatory actions could impact our ability to transfer, process and/or receive transnational data, including data relating to students or partners outside the United States. Such judgments or actions could affect the manner in which we provide our services or adversely affect our financial results if foreign students and partners are not able to lawfully transfer data to us. For example, the European Court of Justice recently invalidated the U.S.-EU Safe Harbor framework that had been in place since 2000, which allowed companies to meet certain European legal requirements for the transfer of personal data from the European Economic Area to the United States. While other adequate legal mechanisms to lawfully transfer such data remain, the invalidation of the U.S.-EU Safe Harbor framework may result in different European data protection regulators applying differing standards for the transfer of personal data, which could result in increased regulation, cost of compliance and limitations on data transfer for us and our customers. In addition, some countries are considering or have passed legislation implementing data protection requirements or requiring local storage and processing of data or similar requirements that could increase the cost and complexity of delivering our services.
Any failure or perceived failure by us to comply with our privacy policies, our privacy or data-protection obligations to students or other third parties, our privacy or data-protection legal obligations or any compromise of security that results in the unauthorized release or transfer of sensitive information, which may include personally identifiable information or other data, may result in governmental enforcement actions, litigation or public statements against us by consumer advocacy groups or others and could cause students to lose trust in us, which could have an adverse effect on our business. Additionally, if third parties we work with, such as colleges and brands, violate applicable laws or our policies, such violations may also put our student users’ information at risk and could in turn have an adverse effect on our business.
Public scrutiny of Internet privacy issues may result in increased regulation and different industry standards, which could deter or prevent us from providing our current products and services to students, thereby harming our business.
The regulatory framework for privacy issues worldwide is currently in flux and is likely to remain so for the foreseeable future. Practices regarding the collection, use, storage, display, processing, transmission and security of personal information by companies offering online services have recently come under increased public scrutiny. The U.S. government, including the White House, the FTC and the U.S. Department of Commerce, are reviewing the need for greater regulation of the collection and use of information concerning consumer behavior with respect to online services, including regulation aimed at restricting certain targeted advertising practices. The FTC in particular has approved consent decrees resolving complaints and their resulting investigations into the privacy and security practices of a number of online, social media companies. Similar actions may also impact us directly, particularly because high school students who use our
Chegg Writing, Chegg Tutors, Chegg Test Prep and College Admissions and Scholarship Services
are typically under the age of 18, which subjects our business to laws covering the protection of minors. For example, various U.S. and international laws restrict the distribution of materials considered harmful to children and impose additional restrictions on the ability of online services to collect information from minors. The FTC has also revised the rules under the Children’s Online Privacy Protection Act effective July 1, 2013. Although our services are not primarily directed to children under 13, our Chegg Writing service, in particular, could be used by students as early as in middle school, and the FTC could decide that our site now or in the future has taken inadequate precautions to prevent children under 13 from accessing our site and providing us information.
In 2012, the White House published a report calling for a consumer privacy Bill of Rights that could impact the collection of data, and the Department of Commerce seeks to establish a consensus-driven Do-Not-Track standard that could impact on-line and mobile advertising. The State of California and several other states have adopted privacy guidelines with respect to mobile applications. Our business, including our ability to operate internationally, could be adversely affected if legislation or regulations are adopted, interpreted or implemented in a manner that is inconsistent with our current business practices and that require changes to these practices, the design of our websites, mobile applications, products, features or our privacy policy. In particular, the success of our business has been, and we expect will continue to be, driven by our ability to responsibly use the data that students share with us. Therefore, our business could be harmed by any significant change to applicable laws, regulations or industry standards or practices regarding the use or disclosure of data that students choose to share with us or regarding the manner in which the express or implied consent of consumers for such use and disclosure is obtained. Such changes may require us to modify our products and services, possibly in a material manner, and may limit our ability to develop new products and services that make use of the data that we collect about our student users.
If we become subject to liability for the Internet content that we publish or that is uploaded to our websites by students, our results of operations could be adversely affected.
As a publisher and distributor of online content, we face potential liability for negligence, copyright or trademark infringement or other claims based on the nature and content of materials that we publish or distribute. We also may face
26
potential liability for content uploaded by students in connection with our community-related content. If we become liable, then our business may suffer. Third parties may initiate litigation against us without warning. For example, in June 2017, the Examinations Institute of the American Chemical Society filed a complaint against us in the U.S. District Court for the Northern District of California claiming, among other things, that we infringed their copyrights by answering and displaying questions uploaded by our users to our Q&A service. Others may send us letters or other communications that make allegations without initiating litigation. We have in the past and may in the future receive such communications, which we assess on a case-by-case basis. We may elect not to respond to the communication if we believe it is without merit or we may attempt to resolve disputes out-of-court by removing content or services we offer or paying licensing or other fees. If we are unable to resolve such disputes, litigation may result. Litigation to defend these claims could be costly and harm our results of operations. We may not be adequately insured to cover claims of these types or indemnified for all liability that may be imposed on us. Any adverse publicity resulting from actual or potential litigation may also materially and adversely affect our reputation, which in turn could adversely affect our results of operations.
In addition, the Digital Millennium Copyright Act (DMCA) has provisions that limit, but do not necessarily eliminate, our liability for caching or hosting or for listing or linking to, content or third-party websites that include materials or other content that infringe copyrights or other intellectual property or proprietary rights, provided we comply with the strict statutory requirements of the DMCA. The interpretations of the statutory requirements of the DMCA are constantly being modified by court rulings and industry practice. Accordingly, if we fail to comply with such statutory requirements or if the interpretations of the DMCA change, we may be subject to potential liability for caching or hosting, or for listing or linking to, content or third-party websites that include materials or other content that infringe copyrights or other intellectual property or proprietary rights.
We maintain content usage review systems that, through a combination of manual and automated blocks, monitors for and makes us aware of potentially infringing content on our platform. Nevertheless, claims may continue to be brought and threatened against us for negligence, intellectual property infringement, or other theories based on the nature and content of information, its origin and its distribution and there is no guarantee that we will be able to resolve any such claims quickly and without damage to us, our business model, our reputation or our operations. From time to time, we have been subject to copyright infringement claims, some of which we have settled. While these settlements have not had a material impact on our financial condition, we may be subject to similar lawsuits in the future, including in connection with our other services. The outcome of any such lawsuits may not be favorable to us and could have a material adverse effect on our financial condition.
Failure to protect or enforce our intellectual property and other proprietary rights could adversely affect our business and financial condition and results of operations.
We rely and expect to continue to rely on a combination of trademark, copyright, patent and trade secret protection laws, as well as confidentiality and license agreements with our employees, consultants and third parties with whom we have relationships to protect our intellectual property and proprietary rights. As of
December 31, 2017
, we had
20
issued patents and
18
patent applications pending in the United States. We own three U.S. copyright registrations and have unregistered copyrights in our software documentation, marketing materials and website content that we develop. We own 40 U.S. trademark registrations and 26 foreign registrations. As of
December 31, 2017
, we owned over
600
registered domain names. We also have a number of pending trademark applications in the United States and foreign jurisdictions and unregistered marks that we use to promote our brand. From time to time we expect to file additional patent, copyright and trademark applications in the United States and abroad. Nevertheless, these applications may not be approved or otherwise provide the full protection we seek. Third parties may challenge any patents, copyrights, trademarks and other intellectual property and proprietary rights owned or held by us. Third parties may knowingly or unknowingly infringe, misappropriate or otherwise violate our patents, copyrights, trademarks and other proprietary rights and we may not be able to prevent infringement, misappropriation or other violation without substantial expense to us.
Furthermore, we cannot guarantee that:
|
•
|
our intellectual property and proprietary rights will provide competitive advantages to us;
|
|
•
|
our competitors or others will not design around our intellectual property or proprietary rights;
|
|
•
|
our ability to assert our intellectual property or proprietary rights against potential competitors or to settle current or future disputes will not be limited by our agreements with third parties;
|
|
•
|
our intellectual property and proprietary rights will be enforced in jurisdictions where competition may be intense or where legal protection may be weak;
|
|
•
|
any of the patents, trademarks, copyrights, trade secrets or other intellectual property or proprietary rights that we presently employ in our business will not lapse or be invalidated, circumvented, challenged or abandoned; or
|
27
|
•
|
we will not lose the ability to assert our intellectual property or proprietary rights against or to license our intellectual property or proprietary rights to others and collect royalties or other payments.
|
If we pursue litigation to assert our intellectual property or proprietary rights, an adverse decision in any of these legal actions could limit our ability to assert our intellectual property or proprietary rights, limit the value of our intellectual property or proprietary rights or otherwise negatively impact our business, financial condition and results of operations. If the protection of our intellectual property and proprietary rights is inadequate to prevent use or misappropriation by third parties, the value of our brand and other intangible assets may be diminished, competitors may be able to more effectively mimic our service and methods of operations, the perception of our business and service to customers and potential customers may become confused in the marketplace and our ability to attract customers may be adversely affected.
We are a party to a number of third-party intellectual property license agreements. For example, we have entered into agreements with textbook publishers that provide access to textbook solutions content or questions for our Chegg Study service, for which we often pay an upfront license fee. In addition, we have agreements with certain eTextbook publishers under which we incur non-refundable fees at the time we provide students access to an eTextbook. We cannot guarantee that the third-party intellectual property we license will not be licensed to our competitors or others in our industry. In the future, we may need to obtain additional licenses or renew existing license agreements. We are unable to predict whether these license agreements can be obtained or renewed on acceptable terms, or at all. Any failure to obtain or renew such third-party intellectual property license agreements on commercially competitive terms could adversely affect our business and financial results.
We are, and may in the future be, subject to intellectual property claims, which are costly to defend and could harm our business, financial condition and operating results.
From time to time, third parties have alleged and are likely to allege in the future that we or our business infringes, misappropriates or otherwise violates their intellectual property or proprietary rights. Many companies, including various “non-practicing entities” or “patent trolls,” are devoting significant resources to developing or acquiring patents that could potentially affect many aspects of our business. There are numerous patents that broadly claim means and methods of conducting business on the Internet. We have not exhaustively searched patents related to our technology. In addition, the publishing industry has been, and we expect in the future will continue to be, the target of counterfeiting and piracy. We have in the past and may continue to receive communications alleging that physical textbooks sold or rented by us are counterfeit. For example, we recently cooperated, and continue to cooperate, with a group of publishers in a series of audits which have identified several thousand potentially fraudulent textbooks which we have removed from our inventory. While our fulfillment partner, Ingram, has a system for inspecting the physical textbooks in our catalog of books, many of the books sold or rented to students are shipped directly from our suppliers, and, despite this inspection, unauthorized or counterfeit textbooks may inadvertently be included in the catalog of books we offer and may be subsequently sold or rented by us to students, or purchased by us through our buyback program, including on behalf of other buyers participating in our buyback program, and we may be subject to allegations of civil or criminal liability. We may implement measures in an effort to protect against these potential liabilities that could require us to spend substantial resources. Any costs incurred as a result of liability or asserted liability relating to sales of unauthorized or counterfeit textbooks could harm our business, reputation and financial condition.
Third parties may initiate litigation against us without warning. Others may send us letters or other communications that make allegations without initiating litigation. We have in the past and may in the future receive such communications, which we assess on a case-by-case basis. We may elect not to respond to the communication if we believe it is without merit or we may attempt to resolve disputes out-of-court by electing to pay royalties or other fees for licenses. If we are forced to defend ourselves against intellectual property claims, whether they are with or without merit or are determined in our favor, we may face costly litigation, diversion of technical and management personnel, inability to use our current website or inability to market our service or merchandise our products. As a result of a dispute, we may have to develop non-infringing technology, enter into licensing agreements, adjust our merchandising or marketing activities or take other action to resolve the claims. These actions, if required, may be unavailable on terms acceptable to us or may be costly or unavailable. If we are unable to obtain sufficient rights or develop non-infringing intellectual property or otherwise alter our business practices, as appropriate, on a timely basis, our reputation or brand, our business and our competitive position may be affected adversely and we may be subject to an injunction or be required to pay or incur substantial damages and/or fees.
In addition, we use open source software in connection with certain of our products and services. Companies that incorporate open source software into their products have, from time to time, faced claims challenging the ownership of open source software and/or compliance with open source license terms. As a result, we could be subject to suits by parties claiming ownership of what we believe to be open source software or noncompliance with open source licensing terms. Some open source software licenses require users who distribute or use open source software as part of their software to publicly disclose all or part of the source code to such software and/or make available any derivative works of the open source code on
28
unfavorable terms or at no cost. Any requirement to disclose our proprietary source code or pay damages for breach of contract could have a material adverse effect on our business, financial condition and results of operations.
Confidentiality agreements with employees and others may not adequately prevent disclosure of trade secrets and proprietary information.
We have devoted substantial resources to the development of our intellectual property and proprietary rights. In order to protect our intellectual property and proprietary rights, we rely in part on confidentiality agreements with our employees, book vendors, licensees, independent contractors and other advisors. These agreements may not effectively prevent disclosure of confidential information and may not provide an adequate remedy in the event of unauthorized disclosure of confidential information. In addition, others may independently discover trade secrets and proprietary information and in such cases we could not assert any trade secret rights against such parties. Costly and time-consuming litigation could be necessary to enforce and determine the scope of our proprietary rights and failure to obtain or maintain trade secret protection could adversely affect our competitive business position.
If we are unable to protect our domain names, our reputation and brand could be adversely affected.
As of
December 31, 2017
, we owned over
600
registered domain names relating to our brand, including Chegg.com. Failure to protect our domain names could affect adversely our reputation and brand and make it more difficult for students to find our website, our content and our services. The acquisition and maintenance of domain names generally are regulated by governmental agencies and their designees. The regulation of domain names in the United States may change in the near future. Governing bodies may establish additional top-level domains, appoint additional domain name registrars or modify the requirements for holding domain names. As a result, we may be unable to acquire or maintain relevant domain names. Furthermore, the relationship between regulations governing domain names and laws protecting trademarks and similar intellectual property and proprietary rights is unclear. We may be unable to prevent third parties from acquiring and using domain names that are similar to, infringe upon or otherwise decrease the value of our brand name, trademarks or other intellectual property or proprietary rights.
Our business depends on general economic conditions and their effect on funding levels of colleges, spending behavior by students and advertising budgets.
Our business is dependent on, among other factors, general economic conditions, which affect college funding, student spending and brand advertising. While the U.S. economy has recovered since the "Great Recession," state and federal funding levels at colleges across the United States remain below historic levels, which has led to increased tuition and decreased amounts of financial aid offered to students. To the extent that these trends continue or the economy stagnates or worsens, students may reduce the amount they spend on textbooks and other educational content, which could have a serious adverse impact on our business. In addition to decreased spending by students, the colleges and brands that use our marketing services have advertising budgets that are often constrained during periods of stagnant or deteriorating economic conditions. In a difficult economic environment, customer spending in each of our products and services is likely to decrease, which could adversely affect our operating results and financial condition. A deterioration of the current economic environment may also have a material adverse effect on our ability to fund our growth and strategic business initiatives.
Our international operations are subject to increased challenges and risks.
We have employees in Germany, Israel, and India, we indirectly contract with individuals in the Ukraine and we own a minority stake in a learning platform for high school and college students in Brazil. Although today our international operations represent approximately
5%
of our total consolidated operating expenses and we currently do not expect our international operations to materially increase in the near future, we expect to continue to expand our international operations and such operations may expand more quickly than we currently anticipate. However, we have limited operating history as a company outside the United States and our ability to manage our business and conduct our operations internationally requires considerable management attention and resources and is subject to the particular challenges of supporting a rapidly growing business in an environment of multiple languages, cultures, customs, tax systems, legal systems, alternative dispute systems, regulatory systems and commercial infrastructures. Operating internationally has required and will continue to require us to invest significant funds and other resources, subjects us to new risks and may increase the risks that we currently face, including risks associated with:
|
•
|
recruiting and retaining talented and capable employees in foreign countries and maintaining our company culture across all of our offices;
|
|
•
|
compliance with applicable foreign laws and regulations;
|
29
|
•
|
compliance with anti-bribery laws including, without limitation, compliance with the Foreign Corrupt Practices Act;
|
|
•
|
currency exchange rate fluctuations;
|
|
•
|
additional taxation of international costs and intercompany payments to our international subsidiaries associated with the Tax Cuts and Jobs Act of 2017;
|
|
•
|
political and economic instability; and
|
|
•
|
higher costs of doing business internationally.
|
As part of our business strategy, we may make our products and services available in more countries outside of the U.S. market, where we are currently focused. The markets in which we may undertake international expansion may have educational systems, technology and online industries that are different or less well developed than those in the United States, and if we are unable to address the challenges of operating in international markets, it could have an adverse effect on our results of operations and financial condition.
Colleges and certain governments may restrict access to the Internet or our website, which could lead to the loss of or slowing of growth in our student user base and their level of engagement with our platform.
The growth of our business and our brand depends on the ability of students to access the Internet and the products and services available on our website. Colleges that provide students with access to the Internet either through physical computer terminals on campus or through wired or wireless access points on campus could block or restrict access to our website, content or services or the Internet generally for a number of reasons including security or confidentiality concerns, regulatory reasons, such as compliance with the Family Educational Rights and Privacy Act, which restricts the disclosure of student information or concerns that certain of our products and services, such as Chegg Study, may contradict or violate their policies.
We depend in part on colleges to provide their students with access to the Internet. If colleges modify their policies in ways that are detrimental to the growth of our student user base or in ways that make it harder for students to use our website, or if our competitors’ are able to reach more students than us, the overall growth in our student user base would slow, student engagement would decrease and we would lose revenues. Any reduction in the number of students directed to our website would harm our business and operating results.
Our operations are susceptible to earthquakes, floods, rolling blackouts and other types of power loss. If these or other natural or man-made disasters were to occur, our operations and operating results would be adversely affected.
Our business and operations could be materially adversely affected in the event of earthquakes, blackouts or other power losses, floods, fires, telecommunications failures, break-ins, acts of terrorism, inclement weather, shelving accidents or similar events. Our executive offices are located in the San Francisco Bay Area, an earthquake-sensitive area. If floods, fire, inclement weather including extreme rain, wind, heat or cold or accidents due to human error were to occur and cause damage to a warehouse of Ingram or its textbook library, Ingram's ability to fulfill orders for textbook rental and sales transactions could be materially and adversely affected and our results of operations would suffer, especially if such events were to occur during peak periods. We may not be able to effectively shift our operations due to disruptions arising from the occurrence of such events, and our business could be affected adversely as a result. Moreover, damage to or total destruction of our executive offices resulting from earthquakes may not be covered in whole or in part by any insurance we may have.
If we are unable to implement and maintain effective internal control over financial reporting in the future, the accuracy, and timeliness of our financial reporting may be adversely affected.
The Sarbanes-Oxley Act of 2002 (the Sarbanes-Oxley Act) requires, among other things, that we assess the effectiveness of our internal control over financial reporting annually and the effectiveness of our disclosure controls and procedures quarterly. If we are not able to comply with the requirements of the Sarbanes-Oxley Act in a timely manner, the market price of our stock could decline and we could be subject to sanctions or investigations by the New York Stock Exchange, the SEC or other regulatory authorities, which would require additional financial and management resources.
If we conclude in future periods that our internal control over financial reporting is not effective, we may be required to expend significant time and resources to correct the deficiency and could be subject to one or more investigations or enforcement actions by state or federal regulatory agencies, stockholder lawsuits or other adverse actions requiring us to incur defense costs, pay fines, settlements or judgments and causing investor perceptions to be adversely affected and potentially resulting in a decline in the market price of our stock.
Additionally, our independent registered public accounting firm is required to attest to the effectiveness of our internal control over financial reporting pursuant to Section 404. An independent assessment of the effectiveness of our internal controls
30
could detect problems that our management’s assessment might not. Material weaknesses in our internal controls could lead to financial statement restatements and require us to incur the expense of remediation. If we are unable to maintain effective internal control over financial reporting to meet the demands placed upon us as a public company, including the requirements of the Sarbanes-Oxley Act, we may be unable to accurately report our financial results, or report them within the timeframes required by law or exchange regulations.
We may be subject to greater than anticipated liabilities for income, property, sales and other taxes, and any successful action by federal, state, foreign or other authorities to collect additional taxes could adversely harm our business.
We are subject to regular review and audit by both U.S. federal and state and foreign tax authorities and such jurisdictions may assess additional taxes against us. Although we believe our tax estimates are reasonable, the final determination of tax audits and any related litigation could be materially different from our historical tax provisions and accruals and could have a negative effect on our financial position and results of operations. The taxing authorities of the jurisdictions in which we operate may challenge our methodologies for valuing and allocating income from our intercompany transactions, which could increase our worldwide effective income tax rate. Further, we file sales tax returns in a number of states within the United States as required by law and collect and remit sales tax for some content owners. We do not collect sales or other similar taxes in some U.S. and foreign jurisdictions, with respect to some of our sale, rental or service transactions because we believe that they do not apply to the relevant transactions. However, these and other tax laws and regulations are ambiguous or their application to our business is uncertain and the interpretation of them may be subject to change. In addition, one or more states could seek to impose new or additional sales, use or similar tax collection and record-keeping obligations on us. Any successful action by federal, state, foreign or other authorities to impose or collect additional income or property taxes, or compel us to collect and remit sales, use or similar taxes, either retroactively, prospectively or both, could harm our business, financial position and results of operations.
We may not be able to utilize a significant portion of our net operating loss or tax credit carryforwards, which could adversely affect our profitability.
At
December 31, 2017
, we had federal and state net operating loss carryforwards due to prior period losses of approximately
$257 million
and
$195 million
, respectively, which if not utilized will begin to expire in
2028
and
2018
for federal and state purposes, respectively. A portion of the state net operating loss carryforwards expired in
2017
. At
December 31, 2017
, we also had federal tax credit carryforwards of approximately
$5.6 million
, which if not utilized will begin to expire in
2030
, and state tax credit carryforwards of approximately
$6.4 million
, which do not expire. These net operating loss and tax credit carryforwards could expire unused and be unavailable to offset future income tax liabilities, which could adversely affect our profitability. For example, we have net operating loss carryforwards of
$22 million
related to our previous operations in Kentucky that will expire unused unless we have similar operations in Kentucky.
The Tax Cuts and Jobs Act of 2017 changed both the federal deferred tax value of the net operating loss carryforwards and the rules of utilization of federal net operating loss carryforwards. The Tax Cuts and Jobs Act of 2017 lowered the corporate tax rate from 35% to 21% effective for our 2018 financial year. For net operating loss carryforwards generated in years prior to 2018, there is no annual limitation on the utilization and the carryforward period remains at 20 years. However, net operating loss carryforwards generated in years after 2017 will only be available to offset 80% of future taxable income in any single year but will not expire.
In addition, under Section 382 of the Internal Revenue Code of 1986, as amended (the Code), our ability to utilize net operating loss carryforwards or other tax attributes, such as tax credits, in any taxable year may be limited if we experience an “ownership change.” A Section 382 “ownership change” generally occurs if one or more stockholders or groups of stockholders who own at least 5% of our stock increase their ownership by more than 50 percentage points over their lowest ownership percentage within a rolling three-year period. Similar rules may apply under state tax laws. As a result of prior equity issuances and other transactions in our stock, we have previously experienced “ownership changes” under Section 382 of the Code and comparable state tax laws. We may experience ownership changes in the future as a result of future issuances and other transactions of our stock. It is possible that any future ownership change could have a material effect on the use of our net operating loss carryforwards or other tax attributes, which could adversely affect our profitability.
U.S. federal income tax reform could adversely affect us.
On
December 22, 2017, the Tax Cuts and Jobs Act was signed into law
, enacting a broad range of changes to the U.S. Internal Revenue Code. The Tax Cuts and Jobs Act, among other things, includes changes to U.S. federal tax rates, imposes significant additional limitations on the deductibility of interest, executive compensation, other expenses, and future net operating losses, allows for the expensing of certain capital expenditures, and puts into effect a number of changes impacting
31
operations outside of the United States. In the fourth quarter of 2017, we reduced our net deferred tax asset by approximately
$42 million
as a result. The revaluation of our deferred tax assets including U.S. federal net operating losses is offset by an equal reduction in our valuation allowance and therefore there were no additional changes to our results of operations. We will continue to assess the impact of the new tax legislation on our net deferred tax assets and liabilities including state conformity, and will continue to examine the impact this tax legislation may have on our cash taxes and on our business.
Our effective tax rate may fluctuate as a result of new tax laws and our interpretations of those new tax laws, which are subject to significant judgments and estimates. The ongoing effects of the new tax laws and the refinement of provisional estimates could make our results difficult to predict.
Our effective tax rate may fluctuate in the future as a result of the U.S. Tax Cuts and Jobs Act (the Act), which was enacted on December 22, 2017. The Act introduces significant changes to U.S. income tax law that will have a meaningful impact on our provision for income taxes once we release our valuation allowance. Accounting for the income tax effects of the Act requires significant judgments and estimates in the interpretation and calculations of the provisions of the Act.
Due to the timing of the enactment and the complexity involved in applying the provisions of the Act, we made reasonable estimates of the effects and recorded provisional amounts in our financial statements for the year ended December 31, 2017. The U.S. Treasury Department, the Internal Revenue Service (IRS), and other standard-setting bodies may issue guidance on how provisions of the Act will be applied or otherwise administered that is different from our interpretation. As we collect and prepare necessary data, and interpret the Act and any additional guidance issued by the IRS or other standard-setting bodies, we may make adjustments to the provisional amounts that could materially affect our financial position and results of operations as well as our effective tax rate in the period in which the adjustments are made. Further, foreign governments may enact local tax laws in response to the Act which may result in additional changes that could materially affect our financial position and results of operations.
Our failure to comply with the terms of our revolving line of credit could have a material adverse effect on us.
We have a revolving line of credit pursuant to a credit facility with Wells Fargo Bank, National Association (Bank) that provides an aggregate principal amount of
$30.0 million
with an accordion feature that, subject to the Bank's discretion, allows us to borrow up to a total of
$50.0 million
(the Line of Credit). The Line of Credit expires in September 2019. We currently have no amount drawn down under our Line of Credit. Our personal property secures the Line of Credit. If we default on our credit obligations, the Bank may, among other things, require immediate repayment of amounts drawn on the Line of Credit or terminate the Line of Credit or may foreclose on our personal property that secures the Line of Credit.
The agreements governing our indebtedness contain various covenants, including those that restrict our ability to, among other things:
|
•
|
borrow money and guarantee or provide other support for indebtedness of third-parties;
|
|
•
|
pay dividends on, redeem or repurchase our capital stock;
|
|
•
|
acquire entities or assets;
|
|
•
|
make investments in entities that we do not control, including joint ventures;
|
|
•
|
consummate a merger, consolidation or sale of all or substantially all of our assets;
|
|
•
|
enter into certain asset sale transactions; and
|
|
•
|
enter into secured financing arrangements;
|
These covenants may limit our ability to effectively operate our businesses. Any failure to comply with the restrictions of any agreement governing our other indebtedness may result in an event of default under those agreements.
Our reported financial results may be harmed by changes in the accounting principles generally accepted in the
United States.
Generally accepted accounting principles in the United States are subject to interpretation by the Financial Accounting Standards Board (FASB), the SEC, and various bodies formed to promulgate and interpret appropriate accounting principles. A change in these principles or interpretations could have a significant effect on our reported financial results, and may even affect the reporting of transactions completed before the announcement or effectiveness of a change. For example, in May 2014 the FASB issued ASU No. 2014-09,
Revenue from Contracts with Customers, as amended (Topic 606)
, for which certain elements affected our accounting for revenue and costs incurred to acquire contracts. We have adopted Topic 606 using the modified retrospective transition method. Other companies in our industry may apply these accounting principles differently than we do, adversely affecting the comparability of our financial statements. See Note 2 to our accompanying financial statements for information about Topic 606.
32
Risks Related to Ownership of Our Common Stock
Our stock price has been and will likely continue to be volatile.
The trading price of our common stock has been, and is likely to continue to be, volatile. Since shares of our common stock were sold in our IPO in November 2013 at a price of $12.50 per share, our stock price has ranged from $3.15 to $16.67 through
December 31, 2017
. In addition to the factors discussed in this
Annual
Report on Form
10-K
, the trading price of our common stock may fluctuate significantly in response to numerous factors, many of which are beyond our control, including:
|
•
|
actual or anticipated fluctuations in our financial condition and operating results, including as a result of the seasonality in our business that results from the academic calendar;
|
|
•
|
our announcement of actual results for a fiscal period that are higher or lower than projected results or our announcement of revenues or earnings guidance that is higher or lower than expected, including as a result of difficulty forecasting seasonal variations in our financial condition and operating results or the revenues generated by our offerings;
|
|
•
|
issuance of new or updated research or reports by securities analysts, including the publication of unfavorable reports or change in recommendation or downgrading of our common stock;
|
|
•
|
announcements by us or our competitors of significant products or features, technical innovations, acquisitions, strategic relationships and partnerships, joint ventures or capital commitments;
|
|
•
|
actual or anticipated changes in our growth rate relative to our competitors;
|
|
•
|
changes in the economic performance or market valuations of companies perceived by investors to be comparable to us;
|
|
•
|
the expiration of market standoff or contractual lock-up agreements and future sales of our common stock by our officers, directors and existing stockholders or the anticipation of such sales;
|
|
•
|
issuances of additional shares of our common stock in connection with acquisitions;
|
|
•
|
share price and volume fluctuations attributable to inconsistent trading volume levels of our shares;
|
|
•
|
lawsuits threatened or filed against us;
|
|
•
|
regulatory developments in our target markets affecting us, students, colleges or brands, publishers or our competitors;
|
|
•
|
political climate in the United States, with a focus on cutting or limiting budgets, higher education and taxation;
|
|
•
|
terrorist attacks or natural disasters or other such events impacting countries where we have operations;
|
|
•
|
international stock market conditions; and
|
|
•
|
general economic and market conditions, such as recessions, unemployment rates, the limited availability of consumer credit, interest rate changes and currency fluctuations.
|
Furthermore, both domestic and international stock markets have experienced extreme price and volume fluctuations that have affected and continue to affect the market prices of equity securities of companies in general and technology companies in particular. These fluctuations often have been unrelated or disproportionate to the operating performance of those companies. We believe our stock price may be particularly susceptible to volatility as the stock prices of technology and Internet companies have often been subject to wide fluctuations. In the past, companies that have experienced volatility in the market price of their stock have been subject to securities class action litigation. We may be the target of this type of litigation in the future. Securities litigation against us could result in substantial costs and divert our management’s attention from other business concerns, which could seriously harm our business.
Our management, with the oversight of the board of directors, has broad discretion as to the use of the proceeds from previous and future sales of securities and we may not use the proceeds effectively.
Our management, with the oversight of the board of directors, has broad discretion in the application of the net proceeds from our past and future sales of securities and could spend the proceeds in ways that do not improve our results of operations or enhance the value of our common stock or with which our stockholders otherwise disagree. The failure of our management to apply these funds effectively could result in unfavorable returns and uncertainty about our prospects, each of which could cause the price of our common stock to decline.
33
If securities or industry analysts do not publish research reports about our business or publish inaccurate or unfavorable research about our business, our stock price could decline.
The trading market for our common stock will depend in part on the research and reports that securities or industry analysts publish about us or our business. If one or more of the analysts who cover us downgrade our common stock or publish inaccurate or unfavorable research about our business, our common stock price would likely decline. If one or more of these analysts cease coverage of our company or fail to regularly publish reports on us, we could lose visibility in the financial markets, which could cause our share price or trading volume to decline.
We do not intend to pay dividends for the foreseeable future.
We have never declared or paid cash dividends on our capital stock. We currently intend to retain any future earnings to finance the operation and expansion of our business, and we do not expect to declare or pay any dividends in the foreseeable future. As a result, our stockholders may only receive a return on their investment in our common stock if the market price of our common stock increases. In addition, our credit facility contains restrictions on our ability to pay dividends.
Delaware law and provisions in our restated certificate of incorporation and restated bylaws could make a merger, tender offer or proxy contest difficult, thereby depressing the trading price of our common stock.
Our status as a Delaware corporation and the anti-takeover provisions of the Delaware General Corporation Law may discourage, delay or prevent a change in control by prohibiting us from engaging in a business combination with an interested stockholder for a period of three years after the person becomes an interested stockholder, even if a change of control would be beneficial to our existing stockholders. In addition, our restated certificate of incorporation and restated bylaws contain provisions that may make the acquisition of our company more difficult, including the following:
|
•
|
our board of directors is classified into three classes of directors with staggered three-year terms and directors can only be removed from office for cause and by the approval of the holders of at least two-thirds of our outstanding common stock;
|
|
•
|
subject to certain limitations, our board of directors has the sole right to set the number of directors and to fill a vacancy resulting from any cause or created by the expansion of our board of directors, which prevents stockholders from being able to fill vacancies on our board of directors;
|
|
•
|
only our board of directors is authorized to call a special meeting of stockholders;
|
|
•
|
certain litigation against us can only be brought in Delaware;
|
|
•
|
our restated certificate of incorporation authorizes undesignated preferred stock, the terms of which may be established and shares of which may be issued, without the approval of the holders of common stock;
|
|
•
|
advance notice procedures apply for stockholders to nominate candidates for election as directors or to bring matters before an annual meeting of stockholders;
|
|
•
|
our stockholders cannot act by written consent;
|
|
•
|
our restated bylaws can only be amended by our board of directors or by the approval of the holders of at least two-thirds of our outstanding common stock; and
|
|
•
|
certain provisions of our restated certificate of incorporation can only be amended by the approval of the holders of at least two-thirds of our outstanding common stock.
|
None.
Our corporate headquarters are located in Santa Clara, California and consist of approximately 45,000 square feet of space under a lease that expires in February 2019. We have additional offices in California, Oregon and New York in the United States and internationally in India, Israel and Berlin, under leases that expire at varying times between 2018 and
2022
. We believe our facilities are adequate for our current needs and for the foreseeable future; however, we will continue to seek additional space as needed to accommodate our growth. We also have an office space in Georgia, which we are subleasing, under a lease that expires in January 2021.
34
From time to time, third parties may assert patent infringement claims against us in the form of letters, litigation or other forms of communication. In addition, we may from time to time be subject to other legal proceedings and claims in the ordinary course of business, including claims of alleged infringement of trademarks, copyrights and other intellectual property rights; employment claims; and general contract or other claims. We may also, from time to time be subject to various legal or government claims, disputes, or investigations. Such matters may include, but not be limited to, claims, disputes or investigations related to warranty, refund, breach of contract, employment, intellectual property, government regulation or compliance or other matters.
We are not aware of any other pending legal matters or claims, individually or in the aggregate, that are expected to have a material adverse impact on our consolidated financial position, results of operations or cash flows. However, our analysis of whether a claim may proceed to litigation cannot be predicted with certainty, nor can the results of litigation be predicted with certainty. Nevertheless, defending any of these actions, regardless of the outcome, may be costly, time consuming, distract management personnel and have a negative effect on our business. An adverse outcome in any of these actions, including a judgment or settlement, may cause a material adverse effect on our future business, operating results and/or financial condition.
Not Applicable.
35
Market Information
Our common stock has been listed on the New York Stock Exchange under the symbol “CHGG” since November 13, 2013.
The following table sets forth for the indicated periods the high and low closing sales prices of our common stock as reported by the New York Stock Exchange.
|
High
|
Low
|
|||||
|
Years Ended December 31, 2017
|
||||||
|
Fourth quarter
|
$
|
16.49
|
|
$
|
13.99
|
|
|
Third quarter
|
$
|
15.36
|
|
$
|
11.96
|
|
|
Second quarter
|
$
|
12.99
|
|
$
|
8.05
|
|
|
First quarter
|
$
|
8.46
|
|
$
|
6.89
|
|
|
Years Ended December 31, 2016
|
||||||
|
Fourth quarter
|
$
|
8.48
|
|
$
|
6.54
|
|
|
Third quarter
|
$
|
7.21
|
|
$
|
4.90
|
|
|
Second quarter
|
$
|
5.08
|
|
$
|
4.27
|
|
|
First quarter
|
$
|
6.56
|
|
$
|
3.47
|
|
Stockholders of Record
As of
January 31, 2018
,
there were
55
stockholders of record of our common stock, and the closing price of our common stock was
$17.32
per share as reported on the New York Stock Exchange. Because many of our shares of common stock are held by brokers and other institutions on behalf of stockholders, we are unable to estimate the total number of stockholders represented by these record holders.
Dividend Policy
We have never declared or paid any cash dividend on our common stock. We intend to retain any future earnings and do not expect to pay dividends in the foreseeable future. In addition, our credit facility contains restrictions on our ability to pay dividends.
Unregistered Sales of Securities
We had no unregistered sales of our securities in 2017 not previously reported.
Issuer Repurchases
We did not repurchase any of our common stock in 2017, other than in connection with the forfeiture of common stock by holders of restricted stock units in exchange for payments by the Company of statutory tax withholding amounts on behalf of the holders arising as a result of the vesting of restricted stock units.
Stock Performance Graph
This performance graph shall not be deemed “soliciting material” or to be “filed” with the SEC for purposes of Section 18 of the Exchange Act, or otherwise subject to the liabilities under that Section, and shall not be deemed to be incorporated by reference into any filing of Chegg under the Securities Act or the Exchange Act.
The following graph shows a comparison from November 13, 2013 (the date our common stock commenced trading on the New York Stock Exchange) through
December 31, 2017
of the cumulative total return for our common stock, the
36
Standard & Poor’s 500 Stock Index (S&P 500) and the Russell 2000 Index (Russell 2000). The graph assumes that $100 was invested at the market close on November 13, 2013 in the common stock of Chegg, Inc., the S&P 500 Index and the Russell 2000 Index and data for the S&P 500 Index and the Russell 2000 Index assumes reinvestments of dividends. The stock price performance of the following graph is not necessarily indicative of future stock price performance.
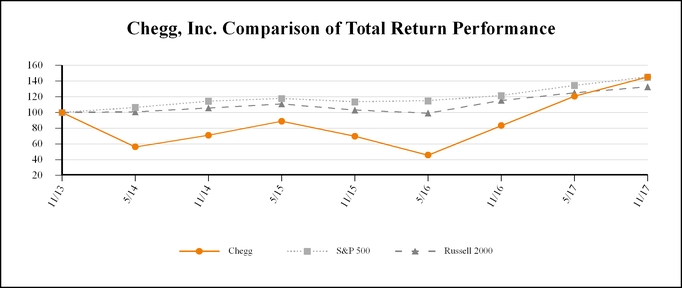
The selected financial data set forth below should be read together with Part II, Item 7, “Management’s Discussion and Analysis of Financial Condition and Results of Operations” and our consolidated financial statements and related notes included in Part II, Item 8, “Consolidated Financial Statements and Supplementary Data” of this Annual Report on Form 10-K. Our historical results are not necessarily indicative of our results in any future period.
|
|
Years Ended December 31,
|
||||||||||||||||||
|
|
2017
|
2016
|
2015
|
2014
|
2013
|
||||||||||||||
|
|
(in thousands, except per share amounts)
|
||||||||||||||||||
|
Consolidated Statements of Operations Data:
|
|
|
|
|
|
||||||||||||||
|
Total net revenues
|
$
|
255,066
|
|
$
|
254,090
|
|
$
|
301,373
|
|
$
|
304,834
|
|
$
|
255,575
|
|
||||
|
Gross profit
|
174,891
|
|
134,489
|
|
111,524
|
|
93,849
|
|
80,515
|
|
|||||||||
|
Net loss
|
(20,283
|
)
|
(42,245
|
)
|
(59,210
|
)
|
(64,758
|
)
|
(55,850
|
)
|
|||||||||
|
Deemed dividend to preferred stockholders
(1)
|
—
|
|
—
|
|
—
|
|
—
|
|
(102,557
|
)
|
|||||||||
|
Net loss attributable to common stockholders
|
$
|
(20,283
|
)
|
$
|
(42,245
|
)
|
$
|
(59,210
|
)
|
$
|
(64,758
|
)
|
$
|
(158,407
|
)
|
||||
|
Net loss per share attributable to common stockholders, basic and diluted
|
$
|
(0.20
|
)
|
$
|
(0.47
|
)
|
$
|
(0.68
|
)
|
$
|
(0.78
|
)
|
$
|
(7.58
|
)
|
||||
|
Weighted-average shares used to compute net loss per share attributable to common stockholders, basic and diluted
|
100,022
|
|
90,534
|
|
86,818
|
|
83,205
|
|
20,902
|
|
|||||||||
______________________________
(1) The completion of our IPO resulted in certain accounting effects and cash tax payments related to the issuance of 11,667,254 shares of our common stock in the form of a deemed stock dividend to the holders of our Series D and Series E convertible preferred stock valued at approximately $102.6 million and the share-based compensation expense associated with RSUs that we had granted prior to our IPO that vested as a result of the completion of our IPO. These RSUs vested upon satisfaction of both a time-based service component and a performance condition which occurred on March 15, 2014.
37
|
December 31,
|
|||||||||||||||||||
|
2017
|
2016
|
2015
|
2014
|
2013
|
|||||||||||||||
|
(in thousands)
|
|||||||||||||||||||
|
Consolidated Balance Sheet Data:
|
|||||||||||||||||||
|
Total assets
|
$
|
446,930
|
|
$
|
290,652
|
|
$
|
291,356
|
|
$
|
318,127
|
|
$
|
327,371
|
|
||||
|
Deferred revenue
|
13,440
|
|
14,836
|
|
14,971
|
|
24,591
|
|
22,804
|
|
|||||||||
|
Common stock and additional paid-in capital
|
782,955
|
|
593,443
|
|
560,330
|
|
516,929
|
|
479,361
|
|
|||||||||
|
Total stockholders' equity
|
391,062
|
|
221,939
|
|
231,075
|
|
247,043
|
|
274,240
|
|
|||||||||
38
You should read the following discussion of our financial condition and results of operations in conjunction with our audited consolidated financial statements and the related notes included in Part II, Item 8, “Consolidated Financial Statements and Supplementary Data” of this
Annual
Report on Form
10-K
. In addition to historical consolidated financial information, the following discussion contains forward-looking statements that reflect our plans, estimates, and beliefs. Our actual results could differ materially from those discussed in the forward-looking statements. See the “Note about Forward-Looking Statements” for additional information. Factors that could cause or contribute to these differences include those discussed below and elsewhere in this
Annual
Report on Form
10-K
, particularly in Part I, Item 1A, “Risk Factors.”
Overview
Chegg is the smarter way to student. As the leading direct-to-student learning platform, we strive to improve educational outcomes by putting the student first in all our decisions. We support students on their journey from high school to college and into their career with tools designed to help them pass their test, pass their class, and save money on required materials. Our services are available online, anytime and anywhere, so we can reach students when they need us most.
Students subscribe to our digital products and services, which we collectively refer to as Chegg Services. These include
Chegg Study, Chegg Writing, Chegg Tutors, Brand Partnership, Test Prep and Internships
. Our Chegg Study service provides step-by-step Textbook Solutions and Expert Answers, helping students with their course work. When students need help creating citations for their papers, they can use one of our Chegg Writing properties, including EasyBib, Citation Machine, BibMe, CiteThisForMe, and NormasAPA. When students need additional help on a subject, they can reach a live tutor online, anytime, anywhere through Chegg Tutors. We work with leading brands to provide students with discounts, promotions, and other products. We provide access to internships to help students gain skills and experiences that are critical to securing their first job. We provide students with an online adaptive test preparation service currently covering the ACT and SAT exams and, in August 2017, we entered into a partnership with Kaplan Test Prep (Kaplan) to provide their test prep courses, practice products, and books through our website. Additionally, Chegg and Kaplan recently launched co-branded new test prep programs starting as low as $99. Through our strategic partnership with Ingram Content Group (Ingram), we offer Required Materials, which includes an extensive print textbook and eTextbook library for rent and sale, helping students save money compared to the cost of buying new.
To deliver services to students, we partner with a variety of third parties. We source print textbooks, eTextbooks, and supplemental materials directly or indirectly from thousands of publishers in the United States, including Pearson, Cengage Learning, McGraw Hill, Wiley, and MacMillan. We have a large network of students and professionals who leverage our platform to tutor in their spare time and employers who leverage our platform to post their internships and jobs. In addition, because we have a large student user base, local and national brands partner with us to reach the college and high school demographics.
During the
years ended December 31, 2017
,
2016
and
2015
, we generated net revenues of
$255.1 million
,
$254.1 million
and
$301.4 million
, respectively, and in the same periods had net losses of
$20.3 million
,
$42.2 million
and
$59.2 million
, respectively. We plan to continue to invest in our long-term growth, particularly further investment in the technology that powers our learning platform and the development of additional products and services that serve students.
Our strategy for achieving and maintaining profitability is centered upon our ability to utilize Chegg Services to increase student engagement with our learning platform. We plan to continue to invest in the expansion of our Chegg Services to provide a more compelling and personalized solution and deepen engagement with students. In October 2017, we acquired Cogeon GmbH, a privately held online learning company based in Berlin, Germany that provides adaptive math technology, primarily through its application, Math 42. We anticipate this acquisition to increase value to existing subscribers and deepen our reach into the high school market which will allow us to drive further growth in our existing Chegg Services. In addition, we believe that the investments we have made to achieve our current scale will allow us to drive increased operating margins over time that, together with increased contributions of Chegg Services products, will enable us to accomplish profitability and become cash-flow positive in the long-term. Our ability to achieve these long-term objectives is subject to numerous risks and uncertainties, including our ability to attract, retain, and increasingly engage the student population, intense competition in our markets, the ability to achieve sufficient contributions to revenue from Chegg Services and other factors described in greater detail in Part I, Item 1A, “Risk Factors.”
39
We have presented revenues for our two product lines, Chegg Services and Required Materials, based on how students view us and the utilization of our products by them. More detail on our two product lines is discussed in the next two sections titled "Chegg Services" and "Required Materials."
Chegg Services
Our Chegg Services for students primarily includes our Chegg Study service, our Chegg Writing service, and our Chegg Tutors service. We also work with leading brands, such as Proctor & Gamble, Sallie Mae, Discover, Truth, DIRECTV and YouTube to provide students with discounts, promotions, and other products that, based on student feedback, delight them. For example, for Proctor & Gamble, we inserted free laundry care samples in our print textbook rental shipments to students, and for DIRECTV, we promoted a 50% off college student discount to the popular NFL Sunday Ticket streaming service via our email and digital channels. All of our brand advertising services and the discounts, promotions, and other products provided to students are paid for by the brands. We additionally provide Internship services and, through our partnership with Kaplan, our Test Prep services covering a variety of exams.
Students typically pay to access Chegg Services such as Chegg Study on a monthly or annual basis. In the aggregate, Chegg Services revenues were
73%
,
51%
and
31%
of net revenues during the
years ended
December 31, 2017
,
2016
and
2015
, respectively.
Required Materials
Our Required Materials product line includes
commissions from Ingram and other partners, on the rental and sale of print textbooks, as well as revenues from eTextbooks
. We offer our eTextbooks on a standalone basis or as a rental-equivalent solution and for free to students awaiting the arrival of their print textbook rental for select print textbooks. eTextbooks and supplemental course materials are available from approximately 120 publishers as of
December 31, 2017
.
We also use our website to rent and sell, on behalf of Ingram and other partners, as well as source for used print textbooks for our partner Ingram. We attract students to our website by offering more for their used print textbooks than they could generally get by selling them back to their campus bookstore.
In the aggregate, Required Materials revenues were
27%
,
49%
, and
69%
of net revenues during the
years ended December 31, 2017
,
2016
and
2015
, respectively.
Strategic Partnership with Ingram and Agreements with Other Partners
Our strategic partnership with Ingram and agreements with other partners have helped to accelerate the growth of our Chegg Services products by allowing us to utilize capital otherwise historically spent on the purchase of print textbooks, and at the same time allowing us to maintain a leading position and high brand recognition through our iconic orange boxes. We entered into a definitive inventory purchase and consignment agreement with Ingram that allows us to focus on eTextbooks and Chegg Services. Under the agreement, since May 2015, Ingram has been responsible for all new investments in the print textbook library, fulfillment logistics, and has title and risk of loss related to print textbook rentals. We have also entered into agreements with other partners to provide our customers with better pricing and a wider variety of new editions of print textbooks. As a result of our strategic partnership with Ingram and agreements with other partners,
our revenues include a commission on the total transaction amount that we earn upon Ingram's fulfillment of a rental transaction using print textbooks for which Ingram or the other partner has title and risk of loss, as opposed to the total rental transaction amount.
These partnerships allow us to reduce and eliminate the capital requirements and operating expenses we historically incurred to acquire and maintain a print textbook library. We will continue to procure books on Ingram’s behalf including books through our buyback program and invoice Ingram at cost.
Seasonality of Our Business
Historically, a substantial majority of our revenues were recognized ratably over the term a student rents our print textbooks and eTextbooks or has access to our Chegg Services. This has generally resulted in our highest revenues in the fourth quarter as it reflects more days of the academic year and our lowest revenues in the second quarter as colleges conclude their academic year for summer and there are fewer days of rentals. The recognition of revenues from our eTextbooks and Chegg Services will continue to follow these trends. As a result of our strategic partnership with Ingram, however, revenues from all print textbook transactions will now be higher in the first and third quarters as we recognize a commission on the transaction immediately rather than recognizing the revenues ratably over the term the student rents the print textbooks.
40
The variable expenses associated with our shipments of print textbooks and marketing activities historically were highest in the first and third quarters as shipping and other fulfillment costs and marketing expenses are expensed when incurred, generally at the beginning of academic terms. However, these variable expenses related to the shipments of print textbooks have decreased as we have completely transitioned the shipping and fulfillment activities related to print textbooks to Ingram.
As a result of these factors, the most concentrated periods for our revenues and expenses did not necessarily coincide, and comparisons of our historical quarterly operating results on a sequential basis may not provide meaningful insight into our overall financial performance. Our strategic partnership with Ingram has shifted peak revenues in the periods that a student rents a textbook as a result of the immediate revenue recognition as well as our revenue sharing agreement such that we believe our revenues will provide more meaningful insight on a sequential basis going forward. Further, while our expenses associated with the print textbook rental business have decreased, our variable expenses related to marketing activities continue to remain highest in the first and third quarter such that our profitability may not provide meaningful insight on a sequential basis.
Components of Results of Operations
Net Revenues
We derive our revenues from our Chegg Services, the rental or sale of print textbooks and eTextbooks, commissions earned from Ingram and other partners from the rental or sale of their textbooks, net of allowances for refunds or charge backs from our payment processors who process payments from credit cards, debit cards and PayPal. As of December 2016, we no longer rent or sell our print textbooks and therefore all revenues from print textbook rental and sale orders from this date forward are commission-based.
Our Chegg Services product line includes our
Chegg Study service, our Chegg Writing service, our Chegg Tutors service, Test Prep, through our partnership with Kaplan, Internship services, Brand Partnership services that we offer to brands and Enrollment Marketing services to colleges, through our strategic partnership with NRCCUA.
Chegg Services are offered to students through weekly, monthly or annual subscriptions, and we recognize revenues ratably over the respective subscription period.
Enrollment Marketing services and Brand Partnership services are offered either on a subscription or on an a la carte basis. Revenues are recognized ratably or as earned over the subscription service period, generally one year. Revenues from Enrollment Marketing services or Brand Partnership services delivered on an a la carte basis, without a subscription, are recognized when delivery of the respective lead or service has occurred. For these services, we bill the customer at the inception, over the term of the customer arrangement or as the services are performed. Upon satisfactory assessment of creditworthiness, we generally grant credit to our Enrollment Marketing and Brand Partnership customers with normal credit terms, typically 30 days.
We historically generated revenues from the rental of print textbooks and to a lesser extent, through the sales of print textbooks through our website on a just-in-time basis. Rental revenues for textbooks that we owned were previously recognized ratably over the term of the rental period, generally two to five months. Commissions earned on rental textbooks owned by Ingram and other partners are recognized immediately when a book ships to the student.
During the year ended December 31, 2017, revenues from selling textbooks on a just-in-time basis are commission based as a result of the transition to Ingram and other partners.
Our customers pay for the rental and sale of print textbooks on our website primarily by credit card, resulting in immediate settlement of our accounts receivable.
We did not recognize any revenues from the rental or sale of our own print textbooks during the year ended December 31, 2017
and net revenues from the rental or sale of print textbooks represented
27%
and
54%
of our net revenues in the
years ended December 31, 2016
and
2015
, respectively,
reflecting our transition of print textbook rentals to Ingram and the increasing growth in our Chegg Services.
Revenues from the rental or sale of eTextbooks is recognized ratably over the contractual period, generally two to five months or at time of the sale, respectively
, and our customers pay for these services through payment processors, resulting in immediate settlement of our accounts receivable.
As a result of our strategic partnership with Ingram and other partners, we no longer recognize rental revenues or sales revenues from the rental or sale of a print textbook. Instead, our services revenues includes a commission on the total transaction amount that we earn from Ingram and other partners upon Ingram's fulfillment of a rental transaction using books for which Ingram or other partner has title and risk of loss, as opposed to the total rental transaction amount.
When deciding the most appropriate basis for presenting revenues or costs of revenues, both the legal form and substance of the agreement between us and our business partners are reviewed to determine each party’s respective role in the
41
transaction. Where our role in a transaction is that of principal, revenues are recognized on a gross basis. This requires revenue to comprise the gross value of the transaction billed to the customer, after trade discounts, with any related expenditure charged as a cost of revenues. Where our role in a transaction is that of an agent, revenues are recognized on a net basis with revenues representing the margin earned. In relation to our partnership with Ingram and other partners and the rental and sale of print textbooks, we recognize revenues on a net basis based on our role in the transaction as an agent.
Deferred revenue primarily consists of advance payments from students and customers related to rentals and subscriptions that have not been recognized and marketing services that have yet to be performed. Deferred revenue is recognized as revenues ratably over the term or when the services are provided and all other revenue recognition criteria have been met.
Cost of Revenues
Our cost of revenues consists primarily of expenses associated with the delivery and distribution of our products and services. Certain cost of revenues, including textbook depreciation expense, the cost of textbooks sold, write-offs and allowances related to the print textbook library, have decreased during 2016 and in to 2017 as we have completely transitioned the shipping and fulfillment activities related to the rental and sale of print textbooks to Ingram. Cost of revenues consists of publisher content fees for eTextbooks, content amortization expense related to content that we develop or license, including publisher agreements for which we pay one-time license fees for published content, payment processing costs, the payments made to tutors through our Chegg Tutors service, Enrollment Marketing services leads purchased from third-party suppliers to fulfill leads that we are unable to fulfill through our internal database, personnel costs and other direct costs related to providing content or services. In addition, cost of revenues includes allocated information technology and facilities costs.
Changes in our cost of revenues may be disproportionate to changes in our revenues because unrecoverable costs, such as outbound shipping and other fulfillment and payment processing fees, are expensed in the period they are incurred while our revenues may be recognized ratably over the subscription or rental term. This effect is particularly pronounced in the first and third quarters, corresponding to the beginning of academic terms.
We anticipate that to the extent Chegg Services revenues grow and the execution of our strategic partnership with Ingram is successful, our gross margins will continue to improve over time.
Operating Expenses
We classify our operating expenses into five categories: technology and development, sales and marketing, general and administrative, restructuring charges (credits) and gain on liquidation of textbooks. One of the most significant components of our operating expenses is employee-related costs, which include share-based compensation expenses. We expect to continue to hire new employees in order to support our current and anticipated growth. In any particular period, the timing of additional hires could materially affect our operating expenses, both in absolute dollars and as a percentage of revenues. Our costs and expenses contain information technology expenses and facilities expenses such as webhosting, depreciation on our infrastructure systems, lease expense and the employee-related costs for information technology support staff. We allocate these costs to each expense category, including cost of revenues, technology and development, sales and marketing and general and administrative. The allocation is primarily based on the headcount in each group at the end of a period. As our business grows, our operating expenses may increase over time to expand capacity and sustain our workforce.
Technology and Development
Our technology and development expenses consist of salaries, benefits and share-based compensation expense for employees in our product and web design, engineering and technical teams who are responsible for maintaining our website, developing new products and improving existing products. Technology and development costs also include amortization of acquired intangible assets, webhosting costs, third-party development costs, research and development expenses and allocated information technology and facilities expenses. We expense substantially all of our technology and development expenses as they are incurred.
In the past three years, our expenses have increased to support new products and services as well as to expand our infrastructure capabilities to support back-end processes associated with our revenue transactions and internal systems. We intend to continue making significant investments in developing new products and services and enhancing the functionality of existing products and services.
42
Sales and Marketing
Our sales and marketing expenses consist of user and advertiser-facing marketing and promotional expenditures through a number of targeted online marketing channels, sponsored search, display advertising, email marketing campaigns and other initiatives. We incur salaries, benefits and share-based compensation expenses for our employees engaged in marketing, business development and sales and sales support functions and amortization of acquired intangible assets and allocated information technology and facilities costs. Our marketing expenses are largely variable; and we tend to incur these in the first and third quarters of the year due to our efforts to target students at the beginning of academic terms. To the extent there is increased or decreased competition for these traffic sources, or to the extent our mix of these channels shifts, we would expect to see a corresponding change in our marketing expense. Sales and marketing expenses also include lead generation services and sales commissions for our Enrollment Marketing services and brand advertising.
General and Administrative
Our general and administrative expenses consist of salaries, benefits and share-based compensation expense for certain executives as well as our finance, legal, human resources and other administrative employees. In addition, general and administrative expenses include outside consulting, legal and accounting services, provision for doubtful accounts and allocated information technology and facilities costs. We have incurred additional costs as we transitioned from an “emerging growth company” to a large accelerated filer including increased audit, legal, regulatory and other related fees.
Restructuring Charges (Credits)
Restructuring charges (credits) are primarily comprised of severance costs, contract and program termination costs, asset impairments and costs of facility consolidation and closure. Restructuring charges are recorded upon approval of a formal management plan and are included in the operating results of the period in which such plan is approved and the expense becomes estimable.
Gain on Liquidation of Textbooks
Gain on liquidation of textbooks consists of proceeds we receive from the sale of previously rented print textbooks, through our website or to wholesalers and other channels, offset by the net book value of such textbooks. Our gain on liquidation of textbooks is driven by several factors including age of the books liquidated, the volume of books liquidated at a given point in time and the channel through which we liquidate. When the proceeds received exceed the net book value of the textbooks liquidated, we record a gain on liquidation of textbooks.
Interest Expense, Net and Other Income (Expense), Net
Interest expense, net consists primarily of interest expense on our debt obligations. Other income (expense), net consists primarily of interest income on our cash and cash equivalents and investment balances as well as the accretion of the deferred cash consideration as a result of our acquisition of Imagine Easy Solutions.
Provision for Income Taxes
Provision for income taxes consists primarily of federal and state income taxes in the United States and income taxes in foreign jurisdictions in which we conduct business. Due to the uncertainty as to the realization of the benefits of our domestic deferred tax assets, we have recorded a full valuation allowance against such assets. We intend to continue to maintain a full valuation allowance on our domestic deferred tax assets until there is sufficient evidence to support the reversal of all or some portion of these allowances.
43
Results of Operations
The following table summarizes our historical consolidated statements of operations (in thousands, except percentage of total net revenues):
|
|
Years Ended December 31,
|
|||||||||||||||||||
|
|
2017
|
2016
|
2015
|
|||||||||||||||||
|
Net revenues:
|
||||||||||||||||||||
|
Rental
|
$
|
—
|
|
—
|
%
|
$
|
39,837
|
|
16
|
%
|
$
|
120,365
|
|
40
|
%
|
|||||
|
Services
|
255,066
|
|
100
|
|
182,399
|
|
72
|
|
133,095
|
|
44
|
|
||||||||
|
Sales
|
—
|
|
—
|
|
31,854
|
|
12
|
|
47,913
|
|
16
|
|
||||||||
|
Total net revenues
|
255,066
|
|
100
|
|
254,090
|
|
100
|
|
301,373
|
|
100
|
|
||||||||
|
Cost of revenues
(1)
:
|
||||||||||||||||||||
|
Rental
|
—
|
|
—
|
|
28,637
|
|
11
|
|
98,162
|
|
33
|
|
||||||||
|
Services
|
80,175
|
|
31
|
|
56,206
|
|
22
|
|
45,458
|
|
15
|
|
||||||||
|
Sales
|
—
|
|
—
|
|
34,758
|
|
14
|
|
46,229
|
|
15
|
|
||||||||
|
Total cost of revenues
|
80,175
|
|
31
|
|
119,601
|
|
47
|
|
189,849
|
|
63
|
|
||||||||
|
Gross profit
|
174,891
|
|
69
|
|
134,489
|
|
53
|
|
111,524
|
|
37
|
|
||||||||
|
Operating expenses
(1)
:
|
|
|
|
|||||||||||||||||
|
Technology and development
|
81,926
|
|
32
|
|
66,331
|
|
26
|
|
59,391
|
|
20
|
|
||||||||
|
Sales and marketing
|
51,240
|
|
20
|
|
53,949
|
|
21
|
|
64,082
|
|
21
|
|
||||||||
|
General and administrative
|
64,411
|
|
25
|
|
55,372
|
|
22
|
|
45,209
|
|
15
|
|
||||||||
|
Restructuring charges (credits)
|
1,047
|
|
1
|
|
(423
|
)
|
—
|
|
4,868
|
|
2
|
|
||||||||
|
Gain on liquidation of textbooks
|
(4,766
|
)
|
(2
|
)
|
(670
|
)
|
—
|
|
(4,326
|
)
|
(2
|
)
|
||||||||
|
Total operating expenses
|
193,858
|
|
76
|
|
174,559
|
|
69
|
|
169,224
|
|
56
|
|
||||||||
|
Loss from operations
|
(18,967
|
)
|
(7
|
)
|
(40,070
|
)
|
(16
|
)
|
(57,700
|
)
|
(19
|
)
|
||||||||
|
Total interest expense, net and other income (expense), net
|
486
|
|
—
|
|
(468
|
)
|
—
|
|
(31
|
)
|
—
|
|
||||||||
|
Loss before provision for income taxes
|
(18,481
|
)
|
(7
|
)
|
(40,538
|
)
|
(16
|
)
|
(57,731
|
)
|
(19
|
)
|
||||||||
|
Provision for income taxes
|
1,802
|
|
(1
|
)
|
1,707
|
|
(1
|
)
|
1,479
|
|
(1
|
)
|
||||||||
|
Net loss
|
$
|
(20,283
|
)
|
(8
|
)%
|
$
|
(42,245
|
)
|
(17
|
)%
|
$
|
(59,210
|
)
|
(20
|
)%
|
|||||
|
(1)
Includes share-based compensation expense as follows:
|
||||||||||||||||||||
|
Cost of revenues
|
$
|
316
|
|
$
|
172
|
|
$
|
262
|
|
|||||||||||
|
Technology and development
|
14,333
|
|
14,771
|
|
11,992
|
|
||||||||||||||
|
Sales and marketing
|
5,007
|
|
6,124
|
|
7,901
|
|
||||||||||||||
|
General and administrative
|
18,703
|
|
20,718
|
|
18,620
|
|
||||||||||||||
|
Total share-based compensation expense
|
$
|
38,359
|
|
$
|
41,785
|
|
$
|
38,775
|
|
|||||||||||
44
Years Ended
December 31, 2017
,
2016
and
2015
Net Revenues
Net revenues in the
year
ended
December 31, 2017
increased
$1.0 million
, remaining relatively flat, compared to the same period in
2016
. Rental revenues
decreased
$39.8 million
, or
100%
, while services revenues
increased
$72.7 million
, or
40%
, and sales revenues
decreased
$31.9 million
, or
100%
.
Net revenues in the year ended December 31, 2016 decreased $47.3 million, or 16%, compared to the same period in 2015. Rental revenues decreased $80.5 million or 67%, while services revenues increased $49.3 million, or 37%, and sales revenues decreased
$16.1 million
, or
34%
.
The
decrease
in rental revenues and sales revenues during the
years ended December 31, 2017
and
2016
was due to our strategic partnership with Ingram. As a result of our strategic partnership, our rental revenues and sales revenues are classified as services revenues to represent the commission on the total transaction amount that we earn from Ingram upon their fulfillment of a rental transaction using books for which Ingram has title and risk of loss rather than recognizing the total rental or sales revenues from transactions using our print textbooks. The
increase
in services revenues during the years ended
December 31, 2017
and
2016
was driven primarily from growth across our other offerings for students which included increased revenues from Chegg Study and Chegg Writing services as well as an increase in the commissions earned from Ingram.
The following table sets forth our total net revenues for the periods shown for our Chegg Services and Required Materials product lines (dollars in thousands):
|
|
Years Ended December 31,
|
Change in 2017
|
Change in 2016
|
||||||||||||||||||||||
|
|
2017
|
2016
|
2015
|
$
|
%
|
$
|
%
|
||||||||||||||||||
|
Chegg Services
|
$
|
185,683
|
|
$
|
129,335
|
|
$
|
94,285
|
|
$
|
56,348
|
|
44
|
%
|
$
|
35,050
|
|
37
|
%
|
||||||
|
Required Materials
|
69,383
|
|
124,755
|
|
207,088
|
|
(55,372
|
)
|
(44
|
)%
|
(82,333
|
)
|
(40
|
)%
|
|||||||||||
|
Total net revenues
|
$
|
255,066
|
|
$
|
254,090
|
|
$
|
301,373
|
|
$
|
976
|
|
—
|
%
|
$
|
(47,283
|
)
|
(16
|
)%
|
||||||
Chegg Services revenues
increased
$56.3 million
, or
44%
, in the
year ended
December 31, 2017
, compared to the same period in
2016
due to growth in our Chegg Study and Chegg Writing services. Chegg Services revenues represented
73%
and
51%
of net revenues during the
years ended December 31, 2017
and
2016
, respectively. Required Materials revenues
decreased
$55.4 million
, or
44%
, in the
year ended
December 31, 2017
compared to the same period in
2016
primarily due to our strategic partnership with Ingram. Our Required Materials revenues are comprised of a commission on the total transaction amount that we earn from Ingram rather than recognizing the total rental or sales revenues from transactions using our print textbooks.. Required Materials revenues decreased throughout 2017 as we fully transitioned new investments in the print textbook library and logistics and fulfillment for print textbook rental and sale orders to Ingram. Required Materials revenues represented
27%
and
49%
of net revenues during the
years ended
December 31, 2017
and
2016
, respectively.
Chegg Services revenues increased $35.1 million, or 37%, in the year ended December 31, 2016, compared to the same period in 2015 due to growth in subscribers for our Chegg Study and Chegg Tutors services as well as revenues from our acquisition of Imagine Easy in the second quarter of 2016. Chegg Services revenues represented 51% and 31% of net revenues during the years ended December 31, 2016 and 2015, respectively. Required Materials revenues decreased $82.3 million, or 40%, in the year ended December 31, 2016 compared to the same period in 2015 primarily due to our strategic partnership with Ingram. Our Required Materials revenues are increasingly comprised of a commission on the total transaction amount that we earn from Ingram rather than recognizing the total rental or sales revenues from transactions using our print textbooks.. Required Materials revenues decreased throughout 2016 as we fully transitioned new investments in the print textbook library and logistics and fulfillment for print textbook rental and sale orders to Ingram. Required Materials revenues represented 49% and 69% of net revenues during the years ended December 31, 2016 and 2015, respectively.
45
Cost of Revenues
The following table sets forth our cost of revenues for the periods shown (dollars in thousands):
|
|
Years Ended December 31,
|
Change in 2017
|
Change in 2016
|
||||||||||||||||||||||
|
|
2017
|
2016
|
2015
|
$
|
%
|
$
|
%
|
||||||||||||||||||
|
Cost of revenues
(1)
|
$
|
80,175
|
|
$
|
119,601
|
|
$
|
189,849
|
|
$
|
(39,426
|
)
|
(33
|
)%
|
$
|
(70,248
|
)
|
(37
|
)%
|
||||||
|
(1)
Includes share-based compensation expense of:
|
$
|
316
|
|
$
|
172
|
|
$
|
262
|
|
$
|
144
|
|
84
|
%
|
$
|
(90
|
)
|
(34
|
)%
|
||||||
Cost of revenues in the
year ended
December 31, 2017
decreased
by
$39.4 million
, or
33%
, compared to the same period in
2016
. The decrease was primarily attributable to a decrease in textbook depreciation of
$9.3 million
, lower order fulfillment costs of
$11.3 million
, and lower cost of print textbooks sold of
$25.3 million
. These decreases were partially offset by higher amortization of digital content of
$2.6 million
, higher payment processing fees of
$1.0 million
, and higher employee-related expenses of
$1.2 million
. As a result, gross margins increased to
69%
in the
year ended
December 31, 2017
, from
53%
during the same period in
2016
.
Cost of revenues in the year ended December 31, 2016 decreased by $70.2 million, or 37%, compared to the same period in 2015. The decrease was primarily attributable to a decrease in textbook depreciation of $34.3 million, lower order fulfillment costs of $18.3 million, lower write-offs related to our print textbook library of $4.2 million, lower warehouse personnel costs of $3.1 million and lower cost of print textbooks sold of $16.4 million. These decreases were partially offset by higher amortization of digital content of $5.3 million. As a result, gross margins increased to 53% in the year ended December 31, 2016, from 37% during the same period in 2015.
The decreases in cost of revenues in the
year ended
December 31, 2017
compared to the same period in
2016
and in the
year ended
December 31, 2016
compared to the same period in
2015
resulted primarily from Ingram's fulfillment of print textbook rental and sale orders.
Operating Expenses
The following table sets forth our total operating expenses for the periods shown (dollars in thousands):
|
|
Years Ended December 31,
|
Change in 2017
|
Change in 2016
|
||||||||||||||||||||||
|
|
2017
|
2016
|
2015
|
$
|
%
|
$
|
%
|
||||||||||||||||||
|
Technology and development
(1)
|
$
|
81,926
|
|
$
|
66,331
|
|
$
|
59,391
|
|
$
|
15,595
|
|
24
|
%
|
$
|
6,940
|
|
12
|
%
|
||||||
|
Sales and marketing
(1)
|
51,240
|
|
53,949
|
|
64,082
|
|
(2,709
|
)
|
(5
|
)
|
(10,133
|
)
|
(16
|
)
|
|||||||||||
|
General and administrative
(1)
|
64,411
|
|
55,372
|
|
45,209
|
|
9,039
|
|
16
|
|
10,163
|
|
22
|
|
|||||||||||
|
Restructuring charges (credits)
|
1,047
|
|
(423
|
)
|
4,868
|
|
1,470
|
|
n/m
|
|
(5,291
|
)
|
n/m
|
|
|||||||||||
|
Gain on liquidation of textbooks
|
(4,766
|
)
|
(670
|
)
|
(4,326
|
)
|
(4,096
|
)
|
611
|
|
3,656
|
|
(85
|
)
|
|||||||||||
|
Total operating expenses
|
$
|
193,858
|
|
$
|
174,559
|
|
$
|
169,224
|
|
$
|
19,299
|
|
11
|
%
|
$
|
5,335
|
|
3
|
%
|
||||||
|
(1)
Includes share-based compensation expense of:
|
|
|
|
|
|||||||||||||||||||||
|
Technology and development
|
$
|
14,333
|
|
$
|
14,771
|
|
$
|
11,992
|
|
$
|
(438
|
)
|
(3
|
)%
|
$
|
2,779
|
|
23
|
%
|
||||||
|
Sales and marketing
|
5,007
|
|
6,124
|
|
7,901
|
|
(1,117
|
)
|
(18
|
)
|
(1,777
|
)
|
(22
|
)
|
|||||||||||
|
General and administrative
|
18,703
|
|
20,718
|
|
18,620
|
|
(2,015
|
)
|
(10
|
)
|
2,098
|
|
11
|
|
|||||||||||
|
Share-based compensation expense
|
$
|
38,043
|
|
$
|
41,613
|
|
$
|
38,513
|
|
$
|
(3,570
|
)
|
(9
|
)%
|
$
|
3,100
|
|
8
|
%
|
||||||
_______________________________________
n/m - not meaningful
46
Technology and Development
Technology and development expenses during the
year ended
December 31, 2017
increased
$15.6 million
, or
24%
, compared to the same period in
2016
. The increase was primarily attributable to higher employee-related expenses of
$10.4 million
, higher web hosting and software license fees of
$3.4 million
, higher outside services of
$0.9 million
, higher depreciation of
$0.7 million
, compared to the same period in
2016
. Technology and development as a percentage of net revenues were
32%
during the
year ended
December 31, 2017
compared to
26%
of net revenues during the same period in
2016
.
Technology and development expenses during the year ended December 31, 2016 increased $6.9 million, or 12%, compared to the same period in 2015. The increase was primarily attributable to higher employee-related expenses of $2.7 million, higher share-based compensation expense of $2.8 million, and higher web hosting and software licensing fees of $2.0 million, compared to the same period in 2015. Technology and development as a percentage of net revenues were 26% during the year ended December 31, 2016 compared to 20% of net revenues during the same period in 2015.
Sales and Marketing
Sales and marketing expenses during the
year ended
December 31, 2017
decreased
by
$2.7 million
, or
5%
, compared to the same period in
2016
. The
decrease
was primarily attributable to lower employee-related expenses of
$2.7 million
, lower share-based compensation expense of
$1.1 million
, and lower marketing expenses of
$1.3 million
, compared to the same period in
2016
. These decreases were partially offset by higher software license fees of
$1.3 million
and higher outside services of
$1.0 million
compared to the same period in
2016
. Sales and marketing expenses as a percentage of net revenues were
20%
during the
year ended
December 31, 2017
compared to
21%
of net revenues during the same period in
2016
.
Sales and marketing expenses during the year ended December 31, 2016 decreased by $10.1 million, or 16%, compared to the same period in 2015. The decrease was primarily attributable to lower employee-related expenses of $1.5 million, lower share-based compensation expense of $1.8 million, and lower marketing expenses of $7.4 million, compared to the same period in 2015. Sales and marketing expenses as a percentage of net revenues remained flat during the year ended December 31, 2016 compared the same period in 2015.
General and Administrative
General and administrative expenses in the
year ended
December 31, 2017
increased
$9.0 million
, or
16%
, compared to the same period in
2016
. The
increase
was primarily attributable to higher employee-related expenses of
$4.6 million
, higher professional fees of
$4.1 million
primarily the result of the transition to Section 404(b) of the Sarbanes-Oxley Act of 2002, implementation of Accounting Standards Codification 606, and legal fees, higher facilities expenses of
$1.1 million
, and higher office expenses of
$1.0 million
, compared to the same period in
2016
. These increases were partially offset by lower share-based compensation expense of
$2.0 million
, compared to the same period in 2016. General and administrative expenses as a percentage of net revenues were
25%
during the
year ended
December 31, 2017
compared to
22%
of net revenues during the same period in
2016
.
General and administrative expenses in the year ended December 31, 2016 increased $10.2 million, or 22%, compared to the same period in 2015. The increase was primarily attributable to higher employee-related expenses of $5.3 million, higher share-based compensation expenses of $2.1 million, higher technology expenses of $0.9 million, higher outside services of $0.7 million, and higher professional fees of $0.9 million, compared to the same period in 2015. General and administrative expenses as a percentage of net revenues were 22% during the year ended December 31, 2016 compared to 15% of net revenues during the same period in 2015.
Restructuring Charges (Credits)
Restructuring charges of
$1.0 million
recorded during the
year ended
December 31, 2017
were related to our strategic partnership with NRCCUA which resulted in the termination of employees supporting the sales and account support functions of our Enrollment Marketing offering. We expect costs incurred to date related to workforce reduction to be fully paid in 2018.
Restructuring credits of $0.4 million recorded during the year ended December 31, 2016 were primarily related to a partial reversal of previously accrued lease termination costs due to our subtenant leasing additional space. We expect costs incurred to date related to the lease termination and other costs are expected to be fully paid by 2021.
47
Gain on Liquidation of Textbooks
During the
years ended December 31, 2017
,
2016
and
2015
, we recorded a gain on liquidation of print textbooks of
$4.8 million
,
$0.7 million
and
$4.3 million
, respectively, resulting from proceeds received from liquidation of previously rented print textbooks on our website and through various other liquidation channels.
Interest Expense, Net and Other Income (Expense), Net
The following table sets forth our interest expense, net, and other income (expense), net, for the periods shown (dollars in thousands):
|
|
Years Ended December 31,
|
Change in 2017
|
Change in 2016
|
||||||||||||||||||||||
|
|
2017
|
2016
|
2015
|
$
|
%
|
$
|
%
|
||||||||||||||||||
|
Interest expense, net
|
$
|
(74
|
)
|
$
|
(171
|
)
|
$
|
(247
|
)
|
$
|
97
|
|
(57
|
)%
|
$
|
76
|
|
(31
|
)%
|
||||||
|
Other income (expense), net
|
560
|
|
(297
|
)
|
216
|
|
857
|
|
n/m
|
|
(513
|
)
|
n/m
|
|
|||||||||||
|
Total interest expense, net and other income (expense), net
|
$
|
486
|
|
$
|
(468
|
)
|
$
|
(31
|
)
|
$
|
954
|
|
n/m
|
|
$
|
(437
|
)
|
n/m
|
|
||||||
_______________________________________
n/m - not meaningful
Interest expense, net,
decreased
during the
year ended
December 31, 2017
compared to the same period in
2016
and in the
year ended
December 31, 2016
compared to the same period in 2015. During the
year ended
December 31, 2016
we replaced our previous expired credit facility with a new line of credit that carries a lower interest rate.
Other income (expense), net, was a net income during the
year ended
December 31, 2017
compared to a net expense in the same period in
2016
, primarily attributable to interest earned on investments purchased in 2017 with the net proceeds from our follow-on offering compared to the accretion of the deferred cash consideration as a result of our acquisition of Imagine Easy Solutions. Other income (expense), net, was a net expense during the year ended December 31, 2016 compared to a net income in the same period in 2015, primarily attributable to the accretion of the deferred cash consideration as a result of our acquisition of Imagine Easy Solutions.
Provision for Income Taxes
The following table sets forth our provision for income taxes for the periods shown (dollars in thousands):
|
|
Years Ended December 31,
|
Change in 2017
|
Change in 2016
|
||||||||||||||||||||||
|
|
2017
|
2016
|
2015
|
$
|
%
|
$
|
%
|
||||||||||||||||||
|
Provision for income taxes
|
$
|
1,802
|
|
$
|
1,707
|
|
$
|
1,479
|
|
$
|
95
|
|
6
|
%
|
$
|
228
|
|
15
|
%
|
||||||
We recorded an income tax provision of approximately
$1.8 million
,
$1.7 million
, and
$1.5 million
for the
years ended December 31, 2017
,
2016
, and
2015
, respectively, which was primarily due to state and foreign income tax expense and federal and state tax expense related to the tax amortization of acquired indefinite lived intangible assets.
48
Liquidity and Capital Resources
As of
December 31, 2017
, our principal sources of liquidity were cash, cash equivalents, and investments totaling
$228.5 million
, which were held for working capital purposes. In August 2017, we completed a follow-on offering in which we raised net proceeds of
$147.6 million
after deducting underwriting discounts, commissions and offering costs. The substantial majority of our net revenues are from e-commerce transactions with students, which are settled immediately through payment processors, as opposed to our accounts payable, which are settled based on contractual payment terms with our suppliers. We also have an aggregate principal amount of
$30.0 million
available under our Line of Credit with an accordion feature that, subject to the lender's discretion, allows us to borrow up to a total of
$50.0 million
. The Line of Credit expires in September 2019. As of
December 31, 2017
, we were in compliance with the financial covenants of the Line of Credit. Further, we had no amounts outstanding and were able to borrow up to
$30.0 million
under the Line of Credit.
As a result of our strategic partnership with Ingram, we will continue to buy used print textbooks on Ingram’s behalf, including print textbooks through our buyback program, and invoice Ingram at cost. We provided Ingram with extended payment terms in 2015 and 2016 for the purchase of print textbooks, before moving to normal payment terms in January 2017. We had a reimbursement balance included within other current assets on our consolidated balance sheets related to the purchase of these textbooks of
$4.2 million
and
$18.8 million
as of
December 31, 2017
and
2016
, respectively. As a result of our strategic partnership with Ingram, we anticipate having significantly more working capital.
During the
years ended
December 31, 2017
,
2016
, and
2015
, our proceeds from print textbook liquidations exceeded our purchases of print textbooks and resulted in a cash inflow of
$6.9 million
,
$24.8 million
, and
$6.0 million
, respectively. As a result of our strategic partnership with Ingram, we no longer make new investments in the print textbook library and since May 1, 2015, Ingram has been responsible for all new investments in the print textbook library.
As of
December 31, 2017
, we have incurred cumulative losses of
$391.6 million
from our operations and we expect to incur additional losses in the future. Our operations have been financed primarily by our initial public offering of our common stock (IPO), our 2017 follow-on public offering, and cash generated from operations.
We believe that our existing sources of liquidity will be sufficient to fund our operations and debt service obligations for at least the next 12 months. Our future capital requirements will depend on many factors including our rate of revenue growth, our investments in technology and development activities, our acquisition of new products and services and our sales and marketing activities. To the extent that existing cash and cash from operations are insufficient to fund our future activities, we may need to raise additional funds through public or private equity or debt financing. Additional funds may not be available on terms favorable to us or at all. If adequate funds are not available on acceptable terms, or at all, we may be unable to adequately fund our business plans and it could have a negative effect on our business, operating cash flows and financial condition.
Most of our cash is held in the United States. As of
December 31, 2017
, our foreign subsidiaries held an insignificant amount of cash in foreign jurisdictions. We currently do not foresee a need to repatriate these funds however we may take advantage of the transition tax in the 2017 Tax Cuts and Jobs Act that taxes any previously deferred foreign earnings and profits in 2017 at a reduced tax rate. In addition, based on our current and future needs, we believe our current funding and capital resources for our international operations are adequate.
The following table sets forth our cash flows (in thousands):
|
Years Ended December 31,
|
|||||||||||
|
|
2017
|
2016
|
2015
|
||||||||
|
Consolidated Statements of Cash Flows Data:
|
|
|
|||||||||
|
Net cash provided by (used in) operating activities
|
$
|
51,148
|
|
$
|
24,938
|
|
$
|
(82
|
)
|
||
|
Net cash (used in) provided by investing activities
|
$
|
(136,234
|
)
|
$
|
(5,963
|
)
|
$
|
8,271
|
|
||
|
Net cash provided by (used in) financing activities
|
$
|
134,214
|
|
$
|
(8,675
|
)
|
$
|
2,723
|
|
||
Cash Flows from Operating Activities
Although we incurred net losses during the
years ended December 31, 2017
,
2016
and
2015
, our net losses were fully or partially offset by non-cash expenditures such as other depreciation and amortization expense, share-based compensation expense, and historically from print textbook library depreciation expense.
Net cash
provided by
operating activities during the
year ended
December 31, 2017
was
$51.1 million
. Our net loss of
49
$20.3 million
was offset by significant non-cash operating expenses, including other depreciation and amortization expense of
$19.3 million
, share-based compensation expense of
$38.4 million
, and the change in our prepaid and other current assets of
$13.6 million
, which was primarily driven by the decline in the reimbursement balance from Ingram as they moved to normal payment terms in 2017.
Net cash provided by operating activities during the year ended December 31, 2016 was $24.9 million. Our net loss of $42.2 million was offset by significant non-cash operating expenses, including print textbook library depreciation expense of $9.3 million, other depreciation and amortization expense of $14.6 million, share-based compensation expense of $41.8 million and loss from write-offs of print textbooks of $1.1 million.
Net cash used in operating activities during the year ended December 31, 2015 was $0.1 million. Our net loss of $59.2 million was increased by the change in our prepaid expenses and other current assets of $27.9 million and partially offset by significant non-cash operating expenses, including print textbook library depreciation expense of $43.6 million, other depreciation and amortization expense of $11.7 million, share-based compensation expense of $38.8 million and loss from write-offs of print textbooks of $5.3 million. During the year ended December 31, 2015, we saw a decline in our textbook depreciation expense and an increase in the change of our prepaid expenses and other current assets, which was a result of our strategic partnership with Ingram, where we are no longer making investments in our print textbook library yet continue to buy books on Ingram's behalf, while providing them with extended payment terms. The effects of these two items were the primary reasons we had net cash used in operating activities for the year ended December 31, 2015.
Cash Flows from Investing Activities
Cash flows from investing activities have been primarily related to the purchase of marketable securities, acquisition of businesses, purchases of property and equipment, and historically from the purchases of print textbooks, offset by proceeds from the sale and maturity of marketable securities and the proceeds from the liquidation of print textbooks.
Net cash
used in
investing activities during the
year ended
December 31, 2017
was
$136.2 million
and was primarily used for the purchases of marketable securities of
$128.2 million
, purchases of property and equipment of
$26.1 million
, and the acquisition of business of
$14.9 million
, partially offset by proceeds from the sale or maturity of marketable securities of
$26.1 million
and proceeds from the liquidation of print textbooks of
$6.9 million
.
Net cash used in investing activities during the year ended December 31, 2016 was $6.0 million and was primarily used for the purchases of marketable securities of $7.6 million, purchases of property and equipment of $24.7 million, acquisition of businesses of $27.1 million, and the purchase of a strategic equity investment in a third party of $1.0 million, partially offset by proceeds from the sale or maturity of marketable securities of $29.7 million and proceeds from the liquidation of print textbooks of $25.6 million.
Net cash provided by investing activities during the year ended December 31, 2015 was $8.3 million and was primarily used for the purchases of print textbooks of $32.3 million, purchases of marketable securities of $35.6 million, purchases of property and equipment of $8.3 million, and the purchase of a strategic equity investment in a third party of $2.0 million, partially offset by proceeds from the sale or maturity of marketable securities of $48.2 million and proceeds from the liquidation of print textbooks of $38.3 million.
Cash Flows from Financing Activities
Cash flows from financing activities have been primarily related to the issuance of common stock under stock plans offset by the payment of taxes related to the net share settlement of equity awards.
Net cash
provided by
financing activities during the
year ended
December 31, 2017
was
$134.2 million
and was related to the proceeds from our follow-on offering, net of offering costs, of
$147.6 million
and the proceeds from the issuance of common stock under stock plans of
$23.7 million
partially offset by the payment of
$20.1 million
in taxes related to the net share settlement of equity awards and the payment of deferred cash consideration related to prior acquisitions of
$16.9 million
.
Net cash used in financing activities during the year ended December 31, 2016 was $8.7 million and was related to the payment of $10.8 million in taxes related to the net share settlement of equity awards partially offset by the proceeds from the issuance of common stock under stock plans of $2.1 million.
Net cash provided by financing activities during the year ended December 31, 2015 was $2.7 million and was related to the proceeds from the issuance of common stock under stock plans of $13.7 million partially offset by the payment of $8.7
50
million in taxes related to the net share settlement of equity awards, and the repurchase of common stock of $2.3 million associated with a put option granted in connection with a prior acquisition.
Contractual Obligations and Other Commitments
The following is a summary of the contractual commitments associated with our lease obligations as of
December 31, 2017
(in thousands):
|
Less than
|
More than
|
||||||||||||||||||
|
Total
|
1 Year
|
1-3 Years
|
3-5 Years
|
5 Years
|
|||||||||||||||
|
Purchase obligations
|
$
|
22,245
|
|
$
|
14,457
|
|
$
|
7,688
|
|
$
|
100
|
|
$
|
—
|
|
||||
|
Operating lease obligations
(1)
|
6,626
|
|
2,934
|
|
2,977
|
|
715
|
|
—
|
|
|||||||||
|
Total contractual obligations
|
$
|
28,871
|
|
$
|
17,391
|
|
$
|
10,665
|
|
$
|
815
|
|
$
|
—
|
|
||||
_____________________________________________________
(1) Our offices are leased under operating leases, which expire at various dates through 2022.
In addition, our other liabilities include
$2.0 million
related to uncertain tax positions as of
December 31, 2017
. The timing of the resolution of these positions is uncertain and we are unable to make a reasonably reliable estimate of the timing of payments in individual years beyond one year. As a result, this amount is not included in the above table.
Off-Balance Sheet Arrangements
Through
December 31, 2017
, we did not have any relationships with unconsolidated organizations or financial partnerships, such as structured finance or special purpose entities that would have been established for the purpose of facilitating off-balance sheet arrangements or other contractually narrow or limited purposes.
Critical Accounting Policies, Significant Judgments and Estimates
Our consolidated financial statements are prepared in accordance with generally accepted accounting principles in the United States (U.S. GAAP). The preparation of these consolidated financial statements requires us to make estimates and assumptions that affect the reported amounts of assets, liabilities, revenues, costs and expenses and related disclosures. These estimates form the basis for judgments we make about the carrying values of our assets and liabilities, which are not readily apparent from other sources. We base our estimates and judgments on historical experience and on various other assumptions that we believe are reasonable under the circumstances. On an ongoing basis, we evaluate our estimates and assumptions. Our actual results may differ from these estimates under different assumptions or conditions.
An accounting policy is deemed to be critical if it requires an accounting estimate to be made based on assumptions about matters that are highly uncertain at the time the estimate is made, if different estimates reasonably could have been used, or if changes in the estimate that are reasonably possible could materially impact the financial statements. We believe that assumptions and estimates of the following accounting policies involve a greater degree of judgment and complexity. Accordingly, these are the policies we believe are the most critical to aid in fully understanding and evaluating our financial condition and results of operations. For further information on all of our significant accounting policies, see Note 2 of our accompanying Notes to Consolidated Financial Statements included in Part II, Item 8, "Consolidated Financial Statements and Supplementary Data" of this Annual Report on Form 10-K.
Revenue Recognition and Deferred Revenue
We evaluate whether we are acting as a principal or an agent in a transaction, and therefore whether we would record the gross sales amount and related costs as revenues or the net amount earned as commissions from the sale of third-party products. Our determination is based on our evaluation of certain indicators including whether we are responsible for fulfillment of the products or services in the transaction, are subject to inventory risk, have latitude in establishing prices and selecting suppliers, none of which is presumptive or determinative. Our evaluation requires management to make a judgment based on the terms of an arrangement in our determination of whether we act as a principal or an agent. If our evaluation of an arrangement was incorrect, this could impact the amount of revenues and cost of revenues recognized in a given period.
51
Some of our customer arrangements for Enrollment Marketing and Brand Partnership services include multiple deliverables, which include the delivery of student leads as well as other services to the end customer. We have determined these deliverables qualify as separate units of accounting, as they have value to the customer on a standalone basis and our arrangements do not contain a right of return. For these arrangements that contain multiple deliverables, we allocate the arrangement consideration based on the relative selling price method in accordance with the selling price hierarchy, which includes: (i) vendor-specific objective evidence of fair value (VSOE), when available; (ii) third-party evidence of selling price (TPE), if VSOE does not exist; and (iii) estimated selling price (ESP), if neither VSOE nor TPE is available.
We determine VSOE based on our historical pricing and discounting practices for the specific solution when sold separately and when a substantial majority of the selling prices for these services fall within a narrow range. TPE is determined based on competitor prices for similar deliverables when sold separately. Generally our go-to-market strategy differs from that of our peers, and our offerings contain a significant level of differentiation such that the comparable pricing of services with similar functionality cannot be obtained.
As we have not established VSOE or TPE for our marketing services, we have used ESP in our allocation of arrangement consideration. We have determined ESP by considering multiple factors including, but not limited to, prices charged for similar offerings, sales volume, geographies, market conditions, the competitive landscape and pricing practices. Our determination of ESP requires management to make a judgment in which factors to consider when determining ESP. If different factors were considered we could conclude a different determination of ESP and this could have a material impact to the amount of revenues recognized. We believe the factors considered best represent the price at which we would transact a sale if the services were sold on a standalone basis, and we regularly assess the method used to determine ESP.
Impairment of Acquired Intangible Assets and Other Long-Lived Assets
We assess the impairment of acquired intangible assets and other long-lived assets at least annually and whenever events or changes in circumstances indicate that the carrying amount of such assets may not be recoverable. Factors that we consider in determining when to perform an impairment review include significant negative industry or economic trends or significant changes or planned changes in the use of the assets. When measuring the recoverability of these assets, we will make assumptions regarding our estimated future cash flows expected to be generated by the assets. If our estimates or related assumptions change in the future, we may be required to impair these assets. We did not record any impairment charges related to acquired intangible assets or other long-live assets during the
years ended December 31, 2017
,
2016
, and
2015
. As of
December 31, 2017
and
2016
, we had intangible assets, net, of
$21.2 million
and
$20.7 million
, respectively and property and equipment, net of
$47.5 million
and
$35.3 million
, respectively.
Goodwill and Indefinite Lived Intangible Asset
Goodwill and our indefinite lived intangible asset are tested for impairment at least annually or whenever events or changes in circumstances indicate that their carrying values may not be recoverable. We first assess qualitative factors to determine whether it is necessary to perform the two-step quantitative impairment test. In our qualitative assessment, we consider factors including economic conditions, industry and market conditions and developments, overall financial performance and other relevant entity-specific events in determining whether it is more likely than not that the fair value of our reporting unit is less than the carrying amount. Our qualitative assessment requires management to make judgments based on the factors listed above in our determination of whether events or changes in circumstances indicate that the carrying values may not be recoverable. Should we conclude that it is more likely than not that our carrying values have been impaired, we would perform a two-step impairment test. The two-step impairment test requires us to perform a valuation of our goodwill and indefinite lived intangible asset which includes making assumptions regarding our estimated future cash flows to determine the fair value of our business. If our estimates or related assumptions change in the future, we may be required to record impairment loss. We have not recognized any impairment of goodwill or our indefinite lived intangible asset since our inception. As of
December 31, 2017
and
2016
, we had goodwill of
$125.3 million
and
$116.2 million
, respectively, and an indefinite lived intangible asset related to the internships.com trade name of
$3.6 million
.
Share-based Compensation
We measure and recognize share-based compensation expense for all awards made to employees, directors and consultants, including restricted stock units (RSUs), performance-based RSUs (PSUs) and our employee stock purchase plan (ESPP) based on estimated fair values.
52
We must estimate a forfeiture rate to calculate the share-based compensation expense related to our awards. Estimated forfeitures are determined based on historical data and management’s expectation of exercise behaviors. We will continue to evaluate the appropriateness of the forfeiture rate based on actual forfeiture experience, analysis of employee turnover and other factors. Quarterly changes in the estimated forfeiture rate can have a significant impact on our share-based compensation expense as the cumulative effect of adjusting the rate is recognized in the period the forfeiture estimate is changed. If a revised forfeiture rate is higher than the previously estimated forfeiture rate, an adjustment is made that will result in a decrease to the share-based compensation expense recognized in the financial statements. If a revised forfeiture rate is lower than the previously estimated forfeiture rate, an adjustment is made that will result in an increase to the share-based compensation expense recognized in the financial statements.
Share-based compensation expense recognized related to PSUs is subject to the achievement of performance objectives and requires significant judgment by management in determining the current level of attainment of such performance objectives. Management may consider factors such as the latest revenue forecasts and general business trends in the assessment of whether or not a PSU award will be obtained. Subsequent changes to these considerations may have a material impact on the amount of share-based compensation expense recognized in the period related to PSU awards, which may lead to volatility of share-based compensation expense period-to-period.
We will continue to use judgment in evaluating the assumptions related to our share-based compensation expense on a prospective basis. As we continue to accumulate additional data related to our common stock, we may refine our estimates, which could materially impact our future share-based compensation expense.
Income Taxes
We account for income taxes under the asset and liability method, which requires the recognition of deferred tax assets and liabilities for the expected future tax consequences of events that have been included in the financial statements. We currently are providing a valuation allowance on domestic deferred tax assets. If or when recognizing deferred tax assets in the future, we will consider all available positive and negative evidence including future reversals of existing taxable temporary differences, projected future taxable income, tax-planning strategies, and results of recent operations.
We record uncertain tax positions on the basis of a two-step process in which (1) we determine whether it is more likely than not that the tax positions will be sustained on the basis of technical merits of the position and (2) for those tax positions that meet the more likely than not recognition threshold, we recognize the tax benefit as the largest amount that is cumulative more than 50 percent likely to be realized upon ultimate settlement with the related tax authority.
Recent Accounting Pronouncements
For relevant recent accounting pronouncements, see Note 2-Significant Accounting Policies of our accompanying Notes to Consolidated Financial Statements included in Part II, Item 8, "Consolidated Financial Statements and Supplementary Data" of this Annual Report on Form 10-K.
We are exposed to market risk, including changes to foreign currency exchange rates, interest rates and inflation.
Foreign Currency Exchange Risk
International revenues as a percentage of net revenues is not significant and our sales contracts are denominated primarily in U.S. dollars. A portion of our operating expenses are incurred outside the United States and are denominated in foreign currencies, which are subject to fluctuations due to changes in foreign currency exchange rates, particularly changes in the Chinese Renminbi and Indian Rupee. To date, we have not entered into derivatives or hedging strategies as our exposure to foreign currency exchange rates has not been material to our historical operating results. There were no significant foreign exchange gains or losses in the years ended
December 31, 2017
,
2016
and
2015
.
Interest Rate Sensitivity
We had cash and cash equivalents totaling
$126.5 million
and
$77.3 million
as of
December 31, 2017
and
2016
, respectively. Additionally, we had investments of
$102.0 million
as of
December 31, 2017
which were purchased during the
year ended
December 31, 2017
.
Our cash and cash equivalents and investments consist of cash, money market funds,
53
commercial paper, corporate securities, and U.S. treasury securities. Our investment policy and strategy are focused on preservation of capital, supporting our liquidity requirements, and delivering competitive returns subject to prevailing market conditions. Changes in U.S. interest rates affect the interest earned on our cash and cash equivalents and investments and the market value of those securities. A hypothetical 100 basis point increase in interest rates would not result in a material impact in the fair value of our available-for-sale securities as of
December 31, 2017
. Any realized gains or losses resulting from such interest rate changes would only occur if we sold the investments prior to maturity. We were not exposed to material risks due to changes in market interest rates given the liquidity of the cash and money market accounts and investments in which we invested our cash.
Interest rate risk also reflects our exposure to movements in interest rates associated with our Line of Credit. The interest-bearing credit facility is denominated in U.S. dollars and the interest expense is based on the LIBOR interest rate. As of
December 31, 2017
, we did not have an outstanding balance on our Line of Credit.
54
Index to Consolidated Financial Statements
|
Page
|
|
55
Report of Independent Registered Public Accounting Firm
To the Stockholders and the Board of Directors of Chegg, Inc.
Opinion on the Financial Statements
We have audited the accompanying consolidated balance sheets of Chegg, Inc. (the Company) as of December 31, 2017 and 2016, the related consolidated statements of operations, comprehensive loss, stockholders' equity and cash flows for each of the three years in the period ended December 31, 2017, and the related notes and the financial statement schedules listed in the Index at Item 15.2 (collectively referred to as the “consolidated financial statements”). In our opinion, the consolidated financial statements present fairly, in all material respects, the financial position of the Company at December 31, 2017 and 2016, and the results of its operations and its cash flows for each of the three years in the period ended December 31, 2017, in conformity with U.S. generally accepted accounting principles.
We also have audited, in accordance with the standards of the Public Company Accounting Oversight Board (United States) (PCAOB), the Company's internal control over financial reporting as of December 31, 2017, based on criteria established in Internal Control-Integrated Framework issued by the Committee of Sponsoring Organizations of the Treadway Commission (2013 framework), and our report dated February 26, 2018 expressed an unqualified opinion thereon.
Basis for Opinion
These financial statements are the responsibility of the Company's management. Our responsibility is to express an opinion on the Company’s financial statements based on our audits. We are a public accounting firm registered with the PCAOB and are required to be independent with respect to the Company in accordance with the U.S. federal securities laws and the applicable rules and regulations of the Securities and Exchange Commission and the PCAOB.
We conducted our audits in accordance with the standards of the PCAOB. Those standards require that we plan and perform the audit to obtain reasonable assurance about whether the financial statements are free of material misstatement, whether due to error or fraud. Our audits included performing procedures to assess the risks of material misstatement of the financial statements, whether due to error or fraud, and performing procedures that respond to those risks. Such procedures included examining, on a test basis, evidence regarding the amounts and disclosures in the financial statements. Our audits also included evaluating the accounting principles used and significant estimates made by management, as well as evaluating the overall presentation of the financial statements. We believe that our audits provide a reasonable basis for our opinion.
/S/ Ernst & Young LLP
We have served as the Company’s auditor since 2009.
San Jose, California
February 26, 2018
56
Report of Independent Registered Public Accounting Firm
To the Stockholders and the Board of Directors of Chegg, Inc.
Opinion on Internal Control over Financial Reporting
We have audited Chegg Inc.’s internal control over financial reporting as of December 31, 2017, based on criteria established in Internal Control-Integrated Framework issued by the Committee of Sponsoring Organizations of the Treadway Commission (2013 framework)
,
(the COSO criteria). In our opinion, Chegg Inc. (the Company) maintained, in all material respects, effective internal control over financial reporting as of December 31, 2017, based on
the COSO criteria
.
As indicated in the accompanying Management's Annual Report on Internal Control Over Financial Reporting, management’s assessment of and conclusion on the effectiveness of internal control over financial reporting did not include the internal controls of Cogeon GmbH, which is included in the 2017 consolidated financial statements of the Company and constituted less than 1% and 1% of total and net assets, respectively, as of December 31, 2017 and less than 1% and 1% of revenues and net loss, respectively, for the year then ended. Our audit of internal control over financial reporting of the Company also did not include an evaluation of the internal control over financial reporting of
Cogeon GmbH.
We also have audited, in accordance with the standards of the Public Company Accounting Oversight Board (United States) (PCAOB), the 2017 consolidated financial statements of the Company and our report dated February 26, 2018 expressed an unqualified opinion thereon.
Basis for Opinion
The Company’s management is responsible for maintaining effective internal control over financial reporting and for its assessment of the effectiveness of internal control over financial reporting included in the accompanying Management's Annual Report on Internal Control Over Financial Reporting. Our responsibility is to express an opinion on the Company’s internal control over financial reporting based on our audit. We are a public accounting firm registered with the PCAOB and are required to be independent with respect to the Company in accordance with the U.S. federal securities laws and the applicable rules and regulations of the Securities and Exchange Commission and the PCAOB.
We conducted our audit in accordance with the standards of the PCAOB. Those standards require that we plan and perform the audit to obtain reasonable assurance about whether effective internal control over financial reporting was maintained in all material respects.
Our audit included obtaining an understanding of internal control over financial reporting, assessing the risk that a material weakness exists, testing and evaluating the design and operating effectiveness of internal control based on the assessed risk, and performing such other procedures as we considered necessary in the circumstances. We believe that our audit provides a reasonable basis for our opinion.
Definition and Limitations of Internal Control Over Financial Reporting
A company’s internal control over financial reporting is a process designed to provide reasonable assurance regarding the reliability of financial reporting and the preparation of financial statements for external purposes in accordance with generally accepted accounting principles. A company’s internal control over financial reporting includes those policies and procedures that (1) pertain to the maintenance of records that, in reasonable detail, accurately and fairly reflect the transactions and dispositions of the assets of the company; (2) provide reasonable assurance that transactions are recorded as necessary to permit preparation of financial statements in accordance with generally accepted accounting principles, and that receipts and expenditures of the company are being made only in accordance with authorizations of management and directors of the company; and (3) provide reasonable assurance regarding prevention or timely detection of unauthorized acquisition, use, or disposition of the company’s assets that could have a material effect on the financial statements.
57
Because of its inherent limitations, internal control over financial reporting may not prevent or detect misstatements. Also, projections of any evaluation of effectiveness to future periods are subject to the risk that controls may become inadequate because of changes in conditions, or that the degree of compliance with the policies or procedures may deteriorate.
/S/ Ernst & Young LLP
San Jose, California
February 26, 2018
58
CHEGG, INC.
(in thousands, except for number of shares and par value)
|
|
December 31, 2017
|
December 31, 2016
|
|||||
|
Assets
|
|
|
|||||
|
Current assets
|
|
|
|||||
|
Cash and cash equivalents
|
$
|
126,457
|
|
$
|
77,329
|
|
|
|
Short-term investments
|
81,742
|
|
—
|
|
|||
|
Accounts receivable, net of allowance for doubtful accounts of $259 and $436 at December 31, 2017 and December 31, 2016, respectively
|
10,855
|
|
10,451
|
|
|||
|
Prepaid expenses
|
2,043
|
|
2,579
|
|
|||
|
Other current assets
|
7,845
|
|
21,014
|
|
|||
|
Total current assets
|
228,942
|
|
111,373
|
|
|||
|
Long-term investments
|
20,305
|
|
—
|
|
|||
|
Textbook library, net
|
—
|
|
2,575
|
|
|||
|
Property and equipment, net
|
47,493
|
|
35,305
|
|
|||
|
Goodwill
|
125,272
|
|
116,239
|
|
|||
|
Intangible assets, net
|
21,153
|
|
20,748
|
|
|||
|
Other assets
|
3,765
|
|
4,412
|
|
|||
|
Total assets
|
$
|
446,930
|
|
$
|
290,652
|
|
|
|
Liabilities and stockholders' equity
|
|
|
|||||
|
Current liabilities
|
|
|
|||||
|
Accounts payable
|
$
|
7,049
|
|
$
|
5,175
|
|
|
|
Deferred revenue
|
13,440
|
|
14,836
|
|
|||
|
Accrued liabilities
|
31,074
|
|
44,319
|
|
|||
|
Total current liabilities
|
51,563
|
|
64,330
|
|
|||
|
Long-term liabilities
|
|
|
|||||
|
Total other long-term liabilities
|
4,305
|
|
4,383
|
|
|||
|
Total liabilities
|
55,868
|
|
68,713
|
|
|||
|
Commitments and contingencies (Note 10)
|
|
|
|||||
|
Stockholders' equity:
|
|
|
|||||
|
Preferred stock, $0.001 par value – 10,000,000 shares authorized, no shares issued and outstanding at December 31, 2017 and December 31, 2016
|
—
|
|
—
|
|
|||
|
Common stock, $0.001 par value – 400,000,000 shares authorized; 109,667,640 and 91,708,839 shares issued and outstanding at December 31, 2017 and December 31, 2016, respectively
|
110
|
|
92
|
|
|||
|
Additional paid-in capital
|
782,845
|
|
593,351
|
|
|||
|
Accumulated other comprehensive loss
|
(282
|
)
|
(176
|
)
|
|||
|
Accumulated deficit
|
(391,611
|
)
|
(371,328
|
)
|
|||
|
Total stockholders' equity
|
391,062
|
|
221,939
|
|
|||
|
Total liabilities and stockholders' equity
|
$
|
446,930
|
|
$
|
290,652
|
|
|
See Notes to Consolidated Financial Statements.
59
CHEGG, INC.
(in thousands, except per share amounts)
|
|
Years Ended December 31,
|
||||||||||
|
|
2017
|
2016
|
2015
|
||||||||
|
Net revenues:
|
|||||||||||
|
Rental
|
$
|
—
|
|
$
|
39,837
|
|
$
|
120,365
|
|
||
|
Services
|
255,066
|
|
182,399
|
|
133,095
|
|
|||||
|
Sales
|
—
|
|
31,854
|
|
47,913
|
|
|||||
|
Total net revenues
|
255,066
|
|
254,090
|
|
301,373
|
|
|||||
|
Cost of revenues:
|
|||||||||||
|
Rental
|
—
|
|
28,637
|
|
98,162
|
|
|||||
|
Services
|
80,175
|
|
56,206
|
|
45,458
|
|
|||||
|
Sales
|
—
|
|
34,758
|
|
46,229
|
|
|||||
|
Total cost of revenues
|
80,175
|
|
119,601
|
|
189,849
|
|
|||||
|
Gross profit
|
174,891
|
|
134,489
|
|
111,524
|
|
|||||
|
Operating expenses:
|
|||||||||||
|
Technology and development
|
81,926
|
|
66,331
|
|
59,391
|
|
|||||
|
Sales and marketing
|
51,240
|
|
53,949
|
|
64,082
|
|
|||||
|
General and administrative
|
64,411
|
|
55,372
|
|
45,209
|
|
|||||
|
Restructuring charges (credits)
|
1,047
|
|
(423
|
)
|
4,868
|
|
|||||
|
Gain on liquidation of textbooks
|
(4,766
|
)
|
(670
|
)
|
(4,326
|
)
|
|||||
|
Total operating expenses
|
193,858
|
|
174,559
|
|
169,224
|
|
|||||
|
Loss from operations
|
(18,967
|
)
|
(40,070
|
)
|
(57,700
|
)
|
|||||
|
Interest expense, net and other income (expense), net:
|
|||||||||||
|
Interest expense, net
|
(74
|
)
|
(171
|
)
|
(247
|
)
|
|||||
|
Other income (expense), net
|
560
|
|
(297
|
)
|
216
|
|
|||||
|
Total interest expense, net and other income (expense), net
|
486
|
|
(468
|
)
|
(31
|
)
|
|||||
|
Loss before provision for income taxes
|
(18,481
|
)
|
(40,538
|
)
|
(57,731
|
)
|
|||||
|
Provision for income taxes
|
1,802
|
|
1,707
|
|
1,479
|
|
|||||
|
Net loss
|
$
|
(20,283
|
)
|
$
|
(42,245
|
)
|
$
|
(59,210
|
)
|
||
|
Net loss per share, basic and diluted
|
$
|
(0.20
|
)
|
$
|
(0.47
|
)
|
$
|
(0.68
|
)
|
||
|
Weighted average shares used to compute net loss per share, basic and diluted
|
100,022
|
|
90,534
|
|
86,818
|
|
|||||
See Notes to Consolidated Financial Statements.
60
CHEGG, INC.
CONSOLIDATED STATEMENTS OF COMPREHENSIVE LOSS
(in thousands)
|
Years Ended December 31,
|
|||||||||||
|
2017
|
2016
|
2015
|
|||||||||
|
Net loss
|
$
|
(20,283
|
)
|
$
|
(42,245
|
)
|
$
|
(59,210
|
)
|
||
|
Other comprehensive loss:
|
|||||||||||
|
Change in unrealized (loss) gain on available for sale investments
|
(187
|
)
|
25
|
|
(8
|
)
|
|||||
|
Change in foreign currency translation adjustments, net of tax
|
81
|
|
(29
|
)
|
(151
|
)
|
|||||
|
Other comprehensive loss
|
(106
|
)
|
(4
|
)
|
(159
|
)
|
|||||
|
Total comprehensive loss
|
$
|
(20,389
|
)
|
$
|
(42,249
|
)
|
$
|
(59,369
|
)
|
||
See Notes to Consolidated Financial Statements.
61
CHEGG, INC.
CONSOLIDATED STATEMENTS OF STOCKHOLDERS' EQUITY
(in thousands)
|
Common Stock
|
|
|||||||||||||||||||||
|
|
Shares
|
Par
Value |
Additional Paid-In
Capital |
Accumulated Other Comprehensive Loss
|
Accumulated
Deficit |
Total Stockholders’ Equity
|
||||||||||||||||
|
Balances at December 31, 2014
|
84,008
|
|
$
|
84
|
|
$
|
516,845
|
|
$
|
(13
|
)
|
$
|
(269,873
|
)
|
$
|
247,043
|
|
|||||
|
Issuance of common stock upon exercise of stock options and ESPP
|
2,165
|
|
2
|
|
13,694
|
|
—
|
|
—
|
|
13,696
|
|
||||||||||
|
Net issuance of common stock for settlement of restricted stock units (RSUs)
|
1,624
|
|
2
|
|
(8,712
|
)
|
—
|
|
—
|
|
(8,710
|
)
|
||||||||||
|
Warrant exercises
|
368
|
|
—
|
|
—
|
|
—
|
|
—
|
|
—
|
|
||||||||||
|
Issuance of common stock in connection with acquisition
|
125
|
|
—
|
|
825
|
|
—
|
|
—
|
|
825
|
|
||||||||||
|
Repurchase of common stock
|
(190
|
)
|
—
|
|
(1,185
|
)
|
—
|
|
—
|
|
(1,185
|
)
|
||||||||||
|
Share-based compensation expense
|
—
|
|
—
|
|
38,775
|
|
—
|
|
—
|
|
38,775
|
|
||||||||||
|
Other comprehensive loss
|
—
|
|
—
|
|
—
|
|
(159
|
)
|
—
|
|
(159
|
)
|
||||||||||
|
Net loss
|
—
|
|
—
|
|
—
|
|
—
|
|
(59,210
|
)
|
(59,210
|
)
|
||||||||||
|
Balances at December 31, 2015
|
88,100
|
|
88
|
|
560,242
|
|
(172
|
)
|
(329,083
|
)
|
231,075
|
|
||||||||||
|
Issuance of common stock upon exercise of stock options and ESPP
|
590
|
|
1
|
|
2,103
|
|
—
|
|
—
|
|
2,104
|
|
||||||||||
|
Net issuance of common stock for settlement of RSUs
|
3,019
|
|
3
|
|
(10,779
|
)
|
—
|
|
—
|
|
(10,776
|
)
|
||||||||||
|
Share-based compensation expense
|
—
|
|
—
|
|
41,785
|
|
—
|
|
—
|
|
41,785
|
|
||||||||||
|
Other comprehensive loss
|
—
|
|
—
|
|
—
|
|
(4
|
)
|
—
|
|
(4
|
)
|
||||||||||
|
Net loss
|
—
|
|
—
|
|
—
|
|
—
|
|
(42,245
|
)
|
(42,245
|
)
|
||||||||||
|
Balances at December 31, 2016
|
91,709
|
|
92
|
|
593,351
|
|
(176
|
)
|
(371,328
|
)
|
221,939
|
|
||||||||||
|
Issuance of common stock in connection with follow-on offering, net of offering costs
|
11,500
|
|
12
|
|
147,597
|
|
—
|
|
—
|
|
147,609
|
|
||||||||||
|
Issuance of common stock upon exercise of stock options and ESPP
|
3,280
|
|
3
|
|
23,653
|
|
—
|
|
—
|
|
23,656
|
|
||||||||||
|
Net issuance of common stock for settlement of RSUs
|
3,155
|
|
3
|
|
(20,115
|
)
|
—
|
|
—
|
|
(20,112
|
)
|
||||||||||
|
Warrant exercises
|
24
|
|
—
|
|
—
|
|
—
|
|
—
|
|
—
|
|
||||||||||
|
Share-based compensation expense
|
—
|
|
—
|
|
38,359
|
|
—
|
|
—
|
|
38,359
|
|
||||||||||
|
Other comprehensive loss
|
—
|
|
—
|
|
—
|
|
(106
|
)
|
—
|
|
(106
|
)
|
||||||||||
|
Net loss
|
—
|
|
—
|
|
—
|
|
—
|
|
(20,283
|
)
|
(20,283
|
)
|
||||||||||
|
Balances at December 31, 2017
|
109,668
|
|
$
|
110
|
|
$
|
782,845
|
|
$
|
(282
|
)
|
$
|
(391,611
|
)
|
$
|
391,062
|
|
|||||
See Notes to Consolidated Financial Statements.
62
CHEGG, INC.
(in thousands)
|
|
Years Ended December 31,
|
||||||||||
|
|
2017
|
2016
|
2015
|
||||||||
|
Cash flows from operating activities
|
|
|
|||||||||
|
Net loss
|
$
|
(20,283
|
)
|
$
|
(42,245
|
)
|
$
|
(59,210
|
)
|
||
|
Adjustments to reconcile net loss to net cash provided by (used in) operating activities:
|
|
|
|||||||||
|
Textbook library depreciation expense
|
—
|
|
9,267
|
|
43,553
|
|
|||||
|
Amortization of warrants and deferred loan costs
|
—
|
|
105
|
|
151
|
|
|||||
|
Other depreciation and amortization expense
|
19,337
|
|
14,520
|
|
11,511
|
|
|||||
|
Share-based compensation expense
|
38,359
|
|
41,785
|
|
38,775
|
|
|||||
|
Provision (release) for bad debts
|
47
|
|
58
|
|
(77
|
)
|
|||||
|
Gain on liquidation of textbooks
|
(4,766
|
)
|
(670
|
)
|
(4,326
|
)
|
|||||
|
Loss from write-offs of textbooks
|
314
|
|
1,090
|
|
5,297
|
|
|||||
|
Realized loss (gain) on sale of securities
|
21
|
|
(11
|
)
|
—
|
|
|||||
|
Loss from write-off of property and equipment
|
1,368
|
|
—
|
|
967
|
|
|||||
|
Interest accretion on deferred consideration
|
(626
|
)
|
—
|
|
—
|
|
|||||
|
Change in assets and liabilities net of effect of acquisition of businesses:
|
|
|
|
||||||||
|
Accounts receivable
|
(175
|
)
|
(127
|
)
|
712
|
|
|||||
|
Prepaid expenses and other current assets
|
13,550
|
|
10,039
|
|
(27,878
|
)
|
|||||
|
Other assets
|
647
|
|
1,437
|
|
(592
|
)
|
|||||
|
Accounts payable
|
2,649
|
|
(728
|
)
|
(4,236
|
)
|
|||||
|
Deferred revenue
|
(1,396
|
)
|
(272
|
)
|
(9,620
|
)
|
|||||
|
Accrued liabilities
|
2,087
|
|
(9,499
|
)
|
5,237
|
|
|||||
|
Other liabilities
|
15
|
|
189
|
|
(346
|
)
|
|||||
|
Net cash provided by (used in) operating activities
|
51,148
|
|
24,938
|
|
(82
|
)
|
|||||
|
Cash flows from investing activities
|
|
|
|||||||||
|
Purchases of textbooks
|
—
|
|
(886
|
)
|
(32,297
|
)
|
|||||
|
Proceeds from liquidations of textbooks
|
6,943
|
|
25,646
|
|
38,260
|
|
|||||
|
Purchases of marketable securities
|
(128,247
|
)
|
(7,633
|
)
|
(35,610
|
)
|
|||||
|
Proceeds from sale of marketable securities
|
16,393
|
|
22,830
|
|
350
|
|
|||||
|
Maturities of marketable securities
|
9,750
|
|
6,844
|
|
47,840
|
|
|||||
|
Purchases of property and equipment
|
(26,142
|
)
|
(24,689
|
)
|
(8,253
|
)
|
|||||
|
Acquisition of businesses, net of cash acquired
|
(14,931
|
)
|
(27,055
|
)
|
—
|
|
|||||
|
Purchase of strategic equity investment
|
—
|
|
(1,020
|
)
|
(2,019
|
)
|
|||||
|
Net cash (used in) provided by investing activities
|
(136,234
|
)
|
(5,963
|
)
|
8,271
|
|
|||||
|
Cash flows from financing activities
|
|
|
|||||||||
|
Common stock issued under stock plans, net
|
23,659
|
|
2,104
|
|
13,696
|
|
|||||
|
Payment of taxes related to the net share settlement of equity awards
|
(20,115
|
)
|
(10,779
|
)
|
(8,710
|
)
|
|||||
|
Repurchase of common stock
|
—
|
|
—
|
|
(2,263
|
)
|
|||||
|
Payment of deferred cash consideration related to acquisitions
|
(16,939
|
)
|
—
|
|
—
|
|
|||||
|
Proceeds from follow-on offering, net of offering costs
|
147,609
|
|
—
|
|
—
|
|
|||||
|
Net cash provided by (used in) financing activities
|
134,214
|
|
(8,675
|
)
|
2,723
|
|
|||||
|
Net increase in cash and cash equivalents
|
49,128
|
|
10,300
|
|
10,912
|
|
|||||
|
Cash and cash equivalents, beginning of period
|
77,329
|
|
67,029
|
|
56,117
|
|
|||||
|
Cash and cash equivalents, end of period
|
$
|
126,457
|
|
$
|
77,329
|
|
$
|
67,029
|
|
||
|
Supplemental cash flow data:
|
|||||||||||
|
Cash paid during the period for:
|
|
|
|||||||||
|
Interest
|
$
|
85
|
|
$
|
50
|
|
$
|
95
|
|
||
|
Income taxes
|
$
|
1,790
|
|
$
|
1,094
|
|
$
|
827
|
|
||
|
Non-cash investing and financing activities:
|
|
|
|||||||||
|
Accrued purchases of long-lived assets
|
$
|
3,573
|
|
$
|
2,333
|
|
$
|
1,771
|
|
||
|
Issuance of common stock related to prior acquisition
|
$
|
—
|
|
$
|
—
|
|
$
|
825
|
|
||
See Notes to Consolidated Financial Statements.
63
CHEGG, INC.
NOTES TO CONSOLIDATED FINANCIAL STATEMENTS
Company and Background
Chegg, Inc. (Chegg, the Company, we, us, or our), headquartered in Santa Clara, California, was incorporated as a Delaware corporation in July 2005.
Chegg is the smarter way to student. As the leading direct-to-student learning platform, we strive to improve educational outcomes by putting the student first in all our decisions. We support students on their journey from high school to college and into their career with tools designed to help them pass their test, pass their class, and save money on required materials. Our services are available online, anytime and anywhere, so we can reach students when they need us most.
Basis of Presentation
Our fiscal year ends on December 31 and in this report, we refer to the year ended
December 31, 2017
,
December 31, 2016
, and
December 31, 2015
as
2017
,
2016
, and
2015
, respectively.
Reclassification of Prior Period Presentation
In order to conform with current period presentation,
$1.1 million
of sales revenues during each of the years ended
December 31, 2016
and
2015
have been reclassified to services revenues and
$1.4 million
and
$1.7 million
of sales cost of revenues during the years ended
December 31, 2016
and
2015
, respectively, have been reclassified to services cost of revenues on our condensed consolidated statements of operations. Additionally, we have reclassified
$1.2 million
from other current assets to accounts receivable on our consolidated balance sheet as of December 31, 2016. These changes in presentation do not affect previously reported results.
Use of Estimates
The preparation of financial statements in conformity with generally accepted accounting principles in the United States (U.S. GAAP) requires management to make estimates, judgments, and assumptions that affect the reported amounts of assets and liabilities; the disclosure of contingent liabilities at the date of the financial statements; and the reported amounts of revenues and expenses during the reporting periods. Significant estimates, assumptions, and judgments are used for, but not limited to: revenue recognition, recoverability of accounts receivable, restructuring charges (credits), share-based compensation expense including estimated forfeitures, accounting for income taxes, useful lives assigned to long-lived assets for depreciation and amortization, impairment of goodwill and long-lived assets, and the valuation of acquired intangible assets. We base our estimates on historical experience, knowledge of current business conditions, and various other factors we believe to be reasonable under the circumstances. These estimates are based on management’s knowledge about current events and expectations about actions we may undertake in the future. Actual results could differ from these estimates, and such differences could be material to our financial position and results of operations.
Principles of Consolidation
The consolidated financial statements include the accounts of Chegg and our wholly owned subsidiaries. All significant intercompany accounts and transactions have been eliminated in consolidation. The consolidated financial statements have been prepared in accordance with U.S. GAAP.
Cash and Cash Equivalents and Restricted Cash
We consider all highly liquid investments with an original maturity date of three months or less from the date of purchase to be cash equivalents. Cash and cash equivalents, which consist of cash, money market accounts, and commercial paper at financial institutions, are stated at cost, which approximates fair value.
We classify certain restricted cash balances within other current assets and other assets on the accompanying consolidated balance sheets based upon the term of the remaining restrictions.
64
As of
December 31, 2017
and
2016
, we had approximately
$0.5 million
and
$0.1 million
, respectively, of restricted cash that consisted of a security deposits for our corporate offices. As of
December 31, 2017
,
$0.1 million
of restricted cash is classified in other current assets and
$0.4 million
is classified in other assets in our consolidated balance sheets. As of
December 31, 2016
,
$0.1 million
of restricted cash is classified in other assets in our consolidated balance sheets
.
Investments
We hold investments in commercial paper, corporate securities and U.S. treasury securities. We classify our marketable securities as available-for-sale investments that are either short or long-term based on the nature of each security based on the contractual maturity of the investment when purchased. Our available-for-sale investments are carried at estimated fair value with any unrealized gains and losses, net of taxes, included in accumulated other comprehensive loss in stockholders’ equity. Unrealized losses are charged against other income (expense), net when a decline in fair value is determined to be other-than-temporary. We did not record any such impairment charges in the periods presented. We determined realized gains or losses on the sale of marketable securities on a specific identification method, and recorded such gains or losses as other income (expense), net. For the years ended
December 31, 2017
and
2016
, the Company's gross realized gains and losses on short-term investments were not significant.
Accounts Receivable
Accounts receivable are recorded at the invoiced amount and are non-interest bearing. We generally grant uncollateralized credit terms to our customers, which include textbook wholesalers, and marketing services customers, and maintain an allowance for doubtful accounts to account for potentially uncollectible receivables.
Allowance for Doubtful Accounts
We assess the creditworthiness of our customers based on multiple sources of information, and analyze such factors as our historical bad debt experience, industry and geographic concentrations of credit risk, economic trends, and customer payment history. This assessment requires significant judgment. Because of this assessment, we maintain an allowance for doubtful accounts for estimated losses resulting from the inability of certain customers to make all of their required payments. In making this estimate, we analyze historical payment performance and current economic trends when evaluating the adequacy of the allowance for doubtful accounts. Accounts receivable are written off as a decrease to the allowance for doubtful accounts when all collection efforts have been exhausted and an account is deemed uncollectible.
Concentration of Credit Risk
Financial instruments that potentially subject us to concentrations of credit risk consist primarily of cash and cash equivalents, restricted cash, and marketable securities invested in highly liquid instruments in accordance with our investment policy. We place the majority of our cash and cash equivalents and restricted cash with financial institutions in the United States that we believe to be of high credit quality, and accordingly minimal credit risk exists with respect to these instruments. Certain of our cash balances held with financial institutions are in excess of Federal Deposit Insurance Corporation limits. Our investment portfolio consists of investment-grade marketable securities diversified among security types, industries and issuers. Our investments were held and managed by recognized financial institutions that followed our investment policy with the main objective of preserving capital and maintaining liquidity.
Concentrations of credit risk with respect to trade receivables exist to the full extent of amounts presented in the financial statements. We had no textbook wholesalers or other customers that represented greater than 10% of our net accounts receivable balance as of
December 31, 2017
and
2016
. No customers represented over
10%
of net revenues in
2017
,
2016
or
2015
.
65
Property and Equipment
Property and equipment are recorded at cost less accumulated depreciation and content amortization. Depreciation and content amortization are computed using the straight-line method over the following estimated useful lives of the assets:
|
Classification
|
Useful Life
|
|
|
Computers and equipment
|
3 years
|
|
|
Software
|
3 years
|
|
|
Furniture and fixtures
|
5 years
|
|
|
Leasehold improvements
|
Shorter of the remaining lease term or the estimated useful life of 5 years
|
|
|
Content
|
Shorter of the licensed content term or the estimated useful life of 5 years
|
|
We capitalize content costs related to the purchase or development of Chegg Study and Test Prep content and amortize these costs over a period of
five
years.
Depreciation and content amortization expense are generally classified within the corresponding cost of revenues and operating expenses categories in our consolidated statements of operations. Depreciation and content amortization expense during the
years ended December 31, 2017
,
2016
and
2015
were approximately
$13.8 million
,
$9.9 million
and
$6.8 million
, respectively.
The cost of maintenance and repairs is expensed as incurred. When assets are retired or otherwise disposed of, the cost and related accumulated depreciation and amortization are removed from their respective accounts, and any gain or loss on such sale or disposal is reflected in loss from operations.
Business Combinations
We allocate the fair value of purchase consideration to the tangible assets acquired, liabilities assumed and intangible assets acquired based on their estimated fair values. The excess of the fair value of purchase consideration over the fair values of these identifiable assets and liabilities is recorded as goodwill. Such valuations require management to make significant estimates and assumptions, especially with respect to intangible assets. Significant estimates in valuing certain intangible assets include, but are not limited to, future expected cash flows from acquired users, acquired technology, and trade names from a market participant perspective, useful lives and discount rates. Management’s estimates of fair value are based upon assumptions believed to be reasonable, but which are inherently uncertain and unpredictable and, as a result, actual results may differ from estimates. During the measurement period, which is not to exceed one year from the acquisition date, we may record adjustments to the assets acquired and liabilities assumed, with the corresponding offset to goodwill. Upon the conclusion of the measurement period, any subsequent adjustments are recorded to earnings.
Goodwill and Indefinite-Lived Intangible Asset
Goodwill represents the excess of the fair value of consideration paid over the estimated fair value of assets acquired and liabilities assumed in a business acquisition. Our indefinite-lived intangible asset represents the internships.com trade name. Goodwill and our indefinite-lived intangible asset are not amortized but rather tested for impairment at least annually on October 1, or more frequently if certain events or indicators of impairment occur between annual impairment tests. We first assess qualitative factors to determine whether it is necessary to perform the two-step quantitative impairment test. In our qualitative assessment, we consider factors including economic conditions, industry and market conditions and developments, overall financial performance and other relevant entity-specific events in determining whether it is more likely than not that the fair value of our reporting unit is less than the carrying amount. We completed our annual impairment test on October 1 of
2017
and
2016
, each of which did not result in any impairment as our qualitative assessment did not indicate that it is more likely than not that the fair value of our reporting unit is less than the carrying amount.
Acquired Intangible Assets and Other Long-Lived Assets
Acquired intangible assets with finite useful lives, which include developed technology, customer lists, trade names, non-compete agreements, and master service agreements, are amortized over their estimated useful lives. We assess the impairment
66
of acquired intangible assets and other long-lived assets when events or changes in circumstances indicate that the carrying amount of such assets may not be recoverable.
Revenue Recognition and Deferred Revenue
Revenues are recognized when the four basic criteria for revenue recognition have been met as follows: persuasive evidence of an arrangement exists, delivery has occurred and title has transferred, the sale price is fixed or determinable, and collection is reasonably assured. Revenues are presented net of sales tax collected from customers to be remitted to governmental authorities and net of allowances for estimated cancellations and customer returns, which are based on historical data. Customer refunds, from cancellations and returns, or charge backs from our payment processors who process payments from credit cards, debit cards, and PayPal, are recorded as a reduction to revenues.
We generate revenues from our Chegg Services product line including our
Chegg Study service, our Chegg Writing service, our Chegg Tutors service, Test Prep, through our partnership with Kaplan, Internship services, Brand Partnership services that we offer to brands and Enrollment Marketing services to colleges, through our strategic partnership with NRCCUA.
Chegg Services are offered to students through weekly, monthly or annual subscriptions, and we recognize revenues ratably over the respective subscription period.
Enrollment Marketing services and Brand Partnership services are offered either on a subscription or on an a la carte basis. Revenues are recognized ratably or as earned over the subscription service period, generally one year. Revenues from Enrollment Marketing services or Brand Partnership services delivered on an a la carte basis, without a subscription, are recognized when delivery of the respective lead or service has occurred. For these services, we bill the customer at the inception, over the term of the customer arrangement or as the services are performed. Upon satisfactory assessment of creditworthiness, we generally grant credit to our Enrollment Marketing and Brand Partnership customers with normal credit terms, typically 30 days.
Some of our customer arrangements for Enrollment Marketing and Brand Partnership services include multiple deliverables, which include the delivery of student leads as well as other services to the end customer. We have determined these deliverables qualify as separate units of accounting, as they have value to the customer on a standalone basis and our arrangements do not contain a right of return. For these arrangements that contain multiple deliverables, we allocate the arrangement consideration based on the relative selling price method in accordance with the selling price hierarchy, which includes: (1) vendor-specific objective evidence of fair value (VSOE), when available; (2) third-party evidence of selling price (TPE), if VSOE does not exist; and (3) estimated selling price (ESP), if neither VSOE nor TPE is available.
We determine VSOE based on our historical pricing and discounting practices for the specific solution when sold separately and when a substantial majority of the selling prices for these services fall within a narrow range. TPE is determined based on competitor prices for similar deliverables when sold separately. Generally, our go-to-market strategy differs from that of our peers, and our offerings contain a significant level of differentiation such that the comparable pricing of services with similar functionality cannot be obtained. If we have not established VSOE or TPE for our Enrollment Marketing services, we have used ESP in our allocation of arrangement consideration. Additionally, we limit the amount of revenues recognized for delivered elements to the amount that is not contingent on future delivery of services or other future performance obligations.
Deferred revenue primarily consists of advanced payments from students related to rentals and subscriptions that have not been recognized, and marketing services that have yet to be performed. Deferred revenue is recognized as revenues ratably over the term or when the services are provided and all other revenue recognition criteria have been met.
We historically generated revenues from the rental of print textbooks and to a lesser extent, through the sales of print textbooks through our website on a just-in-time basis. Rental revenues for textbooks that we owned were previously recognized ratably over the term of the rental period, generally two to five months. Commissions earned on rental textbooks owned by Ingram and other partners are recognized immediately when a book ships to the student.
We did not recognize any revenues from the rental or sale of our own print textbooks during the year ended December 31, 2017
reflecting our transition of print textbook rentals to Ingram and the increasing growth in our Chegg Services.
Revenues from selling textbooks on a just-in-time basis were historically recognized upon shipment.
During the year ended December 31, 2017, revenues from selling textbooks on a just-in-time basis are commission based as a result of the transition to Ingram and other partners.
Revenues from the rental or sale of eTextbooks is recognized ratably over the contractual period, generally two to five months or at time of the sale, respectively
.
We evaluate whether we are acting as a principal or an agent in a transaction, and therefore would record the gross sales amount and related costs as revenues or the net amount earned as commissions from the sale of third-party products. Our
67
determination is based on our evaluation of certain indicators including whether we are the principal in the transaction, are subject to inventory risk, have latitude in establishing prices and selecting suppliers, none of which is presumptive or determinative. We generally operate as the principal and so in those instances revenues are recorded at the gross sale price. We generally record the net amounts as commissions earned when such amounts are determined using a fixed percentage of the transaction price, we are not subject to inventory risk or responsible for the fulfillment of the textbooks. We operate as an agent in our strategic partnership with Ingram and agreements with other partners and therefore
our revenues include a commission on the total transaction amount that we earn upon Ingram's fulfillment of a rental transaction using print textbooks for which Ingram or the other partner has title and risk of loss, as opposed to the total rental transaction amount.
We also present our revenues separately for rental, services and sales. Rental revenues historically included the rental of print textbooks for which we take title and bear the risk of loss, service revenues includes Chegg Study, Chegg Writing, Chegg Tutors, Enrollment Marketing, Brand Partnership, eTextbooks, and commissions we earn from Ingram, other partners, and e-commerce partners; sales revenues includes just-in-time sale of print textbooks and the sale of other required materials.
As a result of our strategic partnership with Ingram and other partners, we no longer recognize rental revenues or sales revenues from the rental or sale of a print textbook. Instead, our services revenues includes a commission on the total transaction amount that we earn from Ingram and other partners upon Ingram's fulfillment of a rental transaction using books for which Ingram or other partner has title and risk of loss, as opposed to the total rental transaction amount.
Cost of Revenues
Our cost of revenues consists primarily of expenses associated with the delivery and distribution of our products and services. Certain cost of revenues, including textbook depreciation expense, the cost of textbooks sold, write-offs and allowances related to the print textbook library, have decreased during 2016 and in to 2017 as we have completely transitioned the shipping and fulfillment activities related to the rental and sale of print textbooks to Ingram. Cost of revenues consists of publisher content fees for eTextbooks, content amortization expense related to content that we develop or license, including publisher agreements for which we pay one-time license fees for published content, payment processing costs, the payments made to tutors through our Chegg Tutors service, Enrollment Marketing services leads purchased from third-party suppliers to fulfill leads that we are unable to fulfill through our internal database, personnel costs and other direct costs related to providing content or services. In addition, cost of revenues includes allocated information technology and facilities costs.
Technology and Development Costs
Our technology and development expenses consist of salaries, benefits and share-based compensation expense for employees in our product and web design, engineering and technical teams who are responsible for maintaining our website, developing new products and improving existing products. Technology and development costs also include amortization of acquired intangible assets, webhosting costs, third-party development costs, research and development expenses and allocated information technology and facilities expenses. We expense substantially all of our technology and development expenses as they are incurred.
Advertising Costs
Advertising costs are expensed as incurred and consist primarily of online advertising and marketing promotional expenditures. During
years ended December 31, 2017
,
2016
and
2015
, advertising costs were approximately
$16.5 million
,
$18.4 million
, and
$25.0 million
, respectively.
Share-based Compensation
Share-based compensation expense for stock options, restricted stock units (RSUs), performance-based restricted stock units (PSUs), and employee stock purchase plan (ESPP) are accounted for under the fair value method, which requires us to measure the cost of employee share-based compensation awards based on the grant-date fair value of the award. Share-based compensation expense for stock options and our ESPP is estimated at the date of grant using the Black-Scholes-Merton option pricing model while expense for RSUs and PSUs is measured based on the closing fair market value of the Company’s common stock on the date of grant.
We recognize share-based compensation expense over the requisite service period, which is generally the vesting period, on a straight line basis for RSUs and on a graded basis for PSUs, contingent on the achievement of performance conditions.
These amounts are reduced by estimated forfeitures, which are estimated at the time of the grant and revised, if necessary, in subsequent periods if actual forfeitures differ from those estimates.
Equity awards issued to non-employees are recorded at their fair value on the measurement date and are subject to adjustment each period as the underlying awards vest or consulting services are performed.
68
Income Taxes
We account for income taxes under an asset and liability method whereby deferred tax asset and liability account balances are determined based on differences between the financial reporting and the tax basis of assets and liabilities, and are measured using the enacted tax rates and laws that will be in effect when the differences are expected to reverse. Valuation allowances are established, when necessary, to reduce deferred tax assets to an amount that is more likely than not to be realized. We recognize the benefit from a tax position only if it is more likely than not that the position would be sustained upon audit based solely on the technical merits of the tax position. Our policy is to include interest and penalties related to unrecognized tax benefits as a component of income tax expense.
Restructuring Charges
Restructuring charges are primarily comprised of severance costs, contract and program termination costs, asset impairments and costs of facility consolidation and closure. Restructuring charges are recorded upon approval of a formal management plan and are included in the operating results of the period in which such plan is approved and the expense becomes estimable. To estimate restructuring charges, management utilizes assumptions of the number of employees that would be involuntarily terminated and of future costs to operate and eventually vacate duplicate facilities. Severance and other employee separation costs are accrued when it is probable that benefits will be paid and the amount is reasonably estimable. The rates used in determining severance accruals are based on our policies and practices and negotiated settlements. Restructuring charges for employee workforce reductions are recorded upon employee notification for employees whose required continuing service period is
60
days or less and ratably over the employee’s continuing service period for employees whose required continuing service period is greater than 60 days.
Strategic Investment
We have entered into an equity investment in a privately-held foreign entity to explore expanding our reach internationally. Our investment is accounted for under the cost method and we periodically review this investment for other-than-temporary declines in fair value based on the specific identification method and write down the value of our investment when an other-than-temporary decline has occurred. Any fair value estimates are made based on consideration of the current cash position, recent operational performance, and forecasts of the investees. During
years ended December 31, 2017
,
2016
and
2015
, we did not record any other-than-temporary declines in the value of our investment.
Net Loss Per Share
Basic net loss per share is computed by dividing the net loss by the weighted-average number of shares of common stock outstanding during the period. Diluted net loss per share is computed by giving effect to all potential shares of common stock, including stock options, warrants, restricted stock units (RSUs), and performance-based restricted stock units (PSUs), to the extent dilutive. Basic and diluted net loss per share was the same for each period presented as the inclusion of all potential common shares outstanding would have been anti-dilutive.
The following table sets forth the computation of historical basic and diluted net loss per share (in thousands, except per share amounts):
|
Years Ended December 31,
|
|||||||||||
|
2017
|
2016
|
2015
|
|||||||||
|
Numerator:
|
|||||||||||
|
Net loss
|
$
|
(20,283
|
)
|
$
|
(42,245
|
)
|
$
|
(59,210
|
)
|
||
|
Denominator:
|
|||||||||||
|
Weighted average shares used to compute net loss per share, basic and diluted
|
100,022
|
|
90,534
|
|
86,818
|
|
|||||
|
Net loss per share, basic and diluted
|
$
|
(0.20
|
)
|
$
|
(0.47
|
)
|
$
|
(0.68
|
)
|
||
69
The following potential weighted-average shares of common stock outstanding were excluded from the computation of diluted net loss per share attributable to common stockholders because including them would have been anti-dilutive (in thousands):
|
Years Ended December 31,
|
||||||||
|
2017
|
2016
|
2015
|
||||||
|
Options to purchase common stock
|
3,045
|
|
10,799
|
|
11,446
|
|
||
|
RSUs and PSUs
|
153
|
|
1,239
|
|
200
|
|
||
|
Employee stock purchase plan
|
5
|
|
15
|
|
—
|
|
||
|
Warrants to purchase common stock
|
—
|
|
200
|
|
299
|
|
||
|
Total common stock equivalents
|
3,203
|
|
12,253
|
|
11,945
|
|
||
Foreign Currency Translation
The functional currency of our foreign subsidiaries is the local currency. Adjustments resulting from the translation of foreign currencies into U.S. dollars for balance sheet amounts are based on the exchange rates as of the consolidated balance sheet date. Non-monetary balance sheet items denominated in a currency other than the applicable functional currency are translated using the historical rate. Revenues and expenses are translated at average exchange rates during the period. Foreign currency translation gains or losses are included in accumulated other comprehensive loss as a component of stockholders’ equity on the consolidated balance sheets. Gains or losses resulting from foreign currency transactions, which are denominated in currencies other than the entity’s functional currency, are included in other income (expense), net in the consolidated statements of operations and were not material during
2017
,
2016
or
2015
.
Recent Accounting Pronouncements
In May 2017, the Financial Accounting Standards Board (FASB) issued Accounting Standards Update (ASU) No. 2017-09,
Compensation - Stock Compensation (Topic 718): Scope of Modification Accounting
. ASU 2017-09 clarifies when changes to the terms or conditions of a share-based payment award must be accounted for as a modification. The guidance is effective for annual periods beginning after December 15, 2017, with early adoption permitted, and the guidance requires a prospective application to awards modified on or after the adoption date. We elected to early adopt this standard as of July 1, 2017 and will account for any modifications after this date under the new guidance.
In January 2017, the FASB issued ASU No. 2017-04,
Intangibles - Goodwill and Other (Topic 350): Simplifying the Test for Goodwill Impairment
. ASU 2017-04 eliminates step 2 from the annual goodwill impairment test no longer requiring the comparison of the implied fair value of a reporting unit's goodwill with the carrying amount of goodwill. Early adoption is permitted and the guidance requires a prospective application. The guidance is effective for annual periods beginning after December 15, 2019, and we are currently in the process of evaluating the impact of this guidance.
In January 2017, the FASB issued ASU No. 2017-01,
Business Combinations (Topic 805): Clarifying the Definition of a Business
. ASU 2017-01 clarifies the definition of a business to assist entities with evaluating whether a transaction should be accounted for as acquisitions of assets or businesses. We will analyze the clarified definition of a business for potential future transactions to determine whether they should be accounted for as an asset acquisition or business combination under the new guidance. Early adoption is permitted and the guidance requires a prospective application. The guidance is effective for annual periods beginning after December 15, 2017 and we will adopt the guidance on January 1, 2018.
In November 2016, the FASB issued ASU 2016-18,
Statement of Cash Flows (Topic 230): Restricted Cash
. ASU 2016-18 requires an entity to explain the change during a period in restricted cash equivalents on the consolidated statements of cash flows and include such amounts when reconciling beginning-of-period and end-of-period total amounts shown on the consolidated statements of cash flows. Early adoption is permitted, and the guidance requires a retrospective adoption. The guidance is effective for annual periods beginning after December 15, 2017, and we will adopt the guidance on January 1, 2018.
In March 2016, the FASB issued ASU No. 2016-09,
Compensation - Stock Compensation (Topic 718): Improvements to Employee Share-Based Payment Accounting
to provide for simplification involving several aspects of the accounting for share-based payment transactions. The new standard requires excess tax benefits and tax deficiencies to be recorded in our consolidated statements of operations as a component of provision for income taxes when stock awards vest or are settled and an option to recognize gross share-based compensation expense with actual forfeitures recognized as they occur. In addition, it eliminates the requirement to reclassify cash flows related to excess tax benefits from operating activities to financing activities
70
on the consolidated statements of cash flows and clarifies that all cash payments made to tax authorities on an employee’s behalf for withheld shares should be presented as a financing activity on the consolidated statements of cash flows. The standard also allows us to withhold more of an employee’s vesting shares for tax withholding purposes without triggering liability accounting.
We adopted this standard in the first quarter of 2017 and the adoption had no impact to our consolidated financial statements. The requirement to record excess tax benefits and deficiencies in our consolidated statements of operations as a component of provision of income taxes when stock awards vest or are settled does not impact our provision of income taxes as we currently have a full valuation allowance recorded against our deferred tax assets related to share-based compensation. Additionally, we have elected to continue to recognize share-based compensation expense net of estimated forfeitures. We have not recorded an adjustment to retained earnings to reflect the modified retrospective adoption of this standard update as neither of these updates change the accounting of the prior period financial results.
We have elected to adopt the elimination of the requirement to reclassify cash flows related to excess tax benefits from operating activities to financing activities on the consolidated statements of cash flows prospectively and therefore prior periods have not been adjusted. Further, there was no change related to the requirement that all payments made to tax authorities on an employees' behalf for withheld shares be presented as a financing activity on the consolidated statements of cash flows as we have always recorded such amounts as a financing activity.
In February 2016, the FASB issued ASU 2016-02,
Leases (Topic 842)
. ASU 2016-02 requires an entity to recognize a right-of-use asset and lease liability for all leases with terms of more than 12 months. Recognition, measurement, and presentation of expenses will depend on classification as a finance or operating lease. The amendments in this update also require certain quantitative and qualitative disclosures about leasing arrangements. Early adoption is permitted, and the guidance requires a modified retrospective adoption. The guidance is effective for annual periods beginning after December 15, 2018 and we plan to adopt the guidance on January 1, 2019. We plan to elect the package of transition practical expedients which include not reassessing whether any expired or existing contracts are or contain leases, not reassessing the lease classification of expired or existing leases, and not reassessing initial direct costs for existing leases. We will continue to evaluate ASU 2016-02 as we near our adoption date.
In May 2014, the FASB issued ASU No. 2014-09,
Revenue from Contracts with Customers, as amended (Topic 606)
(ASU 2014-09), which will change the way we recognize revenue and significantly expand the disclosure requirements for revenue arrangements. In July 2015, the FASB approved a one-year deferral of the effective date of ASU 2014-09 for public companies and further amendments and technical corrections were made to ASU 2014-09 during 2016. ASU 2014-09 allows for companies to choose to apply the standard retrospectively to each prior reporting period presented (full retrospective application) or retrospectively with the cumulative effect of initially applying the standard as an adjustment to the opening balance of retained earnings of the annual reporting period that includes the date of initial application (modified retrospective application). ASU 2014-09 is effective for annual reporting periods beginning after December 15, 2017, including interim periods within that reporting period. Early application is permitted only as of annual reporting periods beginning after December 15, 2016, including interim periods within that reporting period. We will adopt ASU 2014-09 on January 1, 2018 under the modified retrospective application and our adjustment to the opening balance of retained earnings is immaterial.
We have determined the impact ASU 2014-09 will have on our consolidated financial statements, accounting policies, and related disclosures. We will continue to operate as an agent in our strategic partnership with Ingram and agreements with other partners under the new guidance and therefore continue to recognize a commission on print textbook rental transactions. We have determined two areas of impact. First, the timing of revenue recognition relating to our Enrollment Marketing and Brand Partnership product offerings will be recognized earlier in the contract life under ASU 2014-09 than under the current guidance. Second, we will estimate and account for the variable consideration earned relating to our performance related obligation with Ingram over the period in which it is earned under ASU 2014-09 as opposed to at the completion of the period under the current guidance. These are the significant areas that we have identified will be different under ASU 2014-09.
71
The following table shows our cash and cash equivalents, restricted cash and investments’ adjusted cost, net unrealized loss and fair value as of
December 31, 2017
(in thousands):
|
|
December 31, 2017
|
||||||||||
|
|
Cost
|
Net Unrealized Loss
|
Fair Value
|
||||||||
|
Cash and cash equivalents:
|
|
|
|
||||||||
|
Cash
|
$
|
98,370
|
|
$
|
—
|
|
$
|
98,370
|
|
||
|
Money market funds
|
5,358
|
|
—
|
|
5,358
|
|
|||||
|
Commercial paper
|
22,729
|
|
—
|
|
22,729
|
|
|||||
|
Total cash and cash equivalents
|
$
|
126,457
|
|
$
|
—
|
|
$
|
126,457
|
|
||
|
Short-term investments:
|
|
|
|
||||||||
|
Commercial paper
|
$
|
38,850
|
|
$
|
(27
|
)
|
$
|
38,823
|
|
||
|
Corporate securities
|
23,001
|
|
(43
|
)
|
22,958
|
|
|||||
|
U.S. treasury securities
|
19,978
|
|
(17
|
)
|
19,961
|
|
|||||
|
Total short-term investments
|
$
|
81,829
|
|
$
|
(87
|
)
|
$
|
81,742
|
|
||
|
Long-term corporate securities
|
$
|
20,405
|
|
$
|
(100
|
)
|
$
|
20,305
|
|
||
The adjusted cost and fair value of available-for-sale investments as of
December 31, 2017
by contractual maturity were as follows (in thousands):
|
|
Cost
|
Fair Value
|
|||||
|
Due in 1 year or less
|
$
|
104,558
|
|
$
|
104,471
|
|
|
|
Due in 1-2 years
|
20,405
|
|
20,305
|
|
|||
|
Investments not due at a single maturity date
|
5,358
|
|
5,358
|
|
|||
|
Total
|
$
|
130,321
|
|
$
|
130,134
|
|
|
Investments not due at a single maturity date in the preceding table consist of money market fund deposits.
As of
December 31, 2017
, we considered the declines in market value of our investment portfolio to be temporary in nature and did not consider any of our investments to be other-than-temporarily impaired. We typically invest in highly-rated securities with a minimum credit rating of A- and a weighted average maturity of
five
months, and our investment policy generally limits the amount of credit exposure to any one issuer. The policy requires investments generally to be investment grade, with the primary objective of preserving capital and maintaining liquidity. Fair values were determined for each individual security in the investment portfolio. When evaluating an investment for other-than-temporary impairment, we review factors such as the length of time and extent to which fair value has been below its cost basis, the financial condition of the issuer and any changes thereto, changes in market interest rates and our intent to sell, or whether it is more likely than not it will be required to sell, the investment before recovery of the investment’s cost basis. During the
year ended
December 31, 2017
, we did not recognize any impairment charges.
As of December 31, 2016, we did not carry a balance of cash equivalents, short-term or long-term investments.
Restricted Cash
As of
December 31, 2017
and
2016
, we had approximately
$0.5 million
and
$0.1 million
, respectively, of restricted cash that consisted of a security deposits for our corporate offices. As of
December 31, 2017
,
$0.1 million
of restricted cash is classified in other current assets and
$0.4 million
is classified in other assets in our consolidated balance sheets. As of
December 31, 2016
,
$0.1 million
of restricted cash is classified in other assets in our consolidated balance sheets
.
72
Strategic Investment
We previously invested
$3.0 million
in a foreign entity to explore expanding our reach internationally. Our investment is included in other assets on our consolidated balance sheets. We did not record other-than-temporary impairment charges on this investment during the
years ended December 31, 2017
,
2016
, and
2015
, as there were no significant identified events or changes in circumstances that would be considered an indicator for impairment.
We have established a fair value hierarchy used to determine the fair value of our financial instruments as follows:
Level 1—Inputs are unadjusted quoted prices in active markets for identical assets or liabilities.
Level 2—Inputs are quoted prices for similar assets and liabilities in active markets or inputs that are observable for the assets or liabilities, either directly or indirectly through market corroboration, for substantially the full term of the financial instruments.
A financial instrument’s classification within the fair value hierarchy is based on the lowest level of any input that is significant to the fair value measurement.
Financial instruments measured and recorded at fair value on a recurring basis as of
December 31, 2017
are classified based on the valuation technique level in the tables below (in thousands):
|
|
December 31, 2017
|
||||||||||
|
|
Total
|
Quoted Prices
in Active Markets for Identical Assets (Level 1) |
Significant
Other Observable Inputs (Level 2) |
||||||||
|
Assets:
|
|
|
|
||||||||
|
Cash equivalents:
|
|
|
|
||||||||
|
Money market funds
|
$
|
5,358
|
|
$
|
5,358
|
|
$
|
—
|
|
||
|
Commercial paper
|
22,729
|
|
—
|
|
22,729
|
|
|||||
|
Short-term investments:
|
|
||||||||||
|
Commercial paper
|
38,823
|
|
—
|
|
38,823
|
|
|||||
|
Corporate securities
|
22,958
|
|
—
|
|
22,958
|
|
|||||
|
U.S. treasury securities
|
19,961
|
|
19,961
|
|
—
|
|
|||||
|
Long-term corporate securities
|
20,305
|
|
—
|
|
20,305
|
|
|||||
|
Total assets measured and recorded at fair value
|
$
|
130,134
|
|
$
|
25,319
|
|
$
|
104,815
|
|
||
We value our marketable securities based on quoted prices in active markets for identical assets (Level 1 inputs) or inputs other than quoted prices that are observable either directly or indirectly (Level 2 inputs) in determining fair value. Other than our U.S. treasury securities, we classify our fixed income available-for-sale securities as having Level 2 inputs. The valuation techniques used to measure the fair value of our financial instruments having Level 2 inputs were derived from non-binding market consensus prices that are corroborated by observable market data, quoted market prices for similar instruments, or pricing models such as discounted cash flow techniques.
The methods described above may produce a fair value calculation that may not be indicative of net realizable value or reflective of future fair values. Furthermore, while we believe our valuation methods are appropriate and consistent with other market participants, the use of different methodologies or assumptions to determine the fair value of certain financial instruments could result in a different fair value measurement at the reporting date.
73
Textbook Library, Net
Textbook library, net consisted of the following (in thousands):
|
December 31, 2016
|
|||
|
Textbook library
|
$
|
33,980
|
|
|
Less accumulated depreciation
|
(31,405
|
)
|
|
|
Textbook library, net
|
$
|
2,575
|
|
As of December 31, 2017, we did not carry a balance of textbook library, net.
Property and Equipment, Net
Property and equipment, net consisted of the following (in thousands):
|
December 31,
|
|||||||
|
2017
|
2016
|
||||||
|
Computer and equipment
|
$
|
2,449
|
|
$
|
1,597
|
|
|
|
Software
|
5,317
|
|
4,324
|
|
|||
|
Furniture and fixtures
|
2,893
|
|
2,148
|
|
|||
|
Leasehold improvements
|
7,154
|
|
5,342
|
|
|||
|
Content
|
70,110
|
|
49,725
|
|
|||
|
Property and equipment
|
87,923
|
|
63,136
|
|
|||
|
Less accumulated depreciation and amortization
|
(40,430
|
)
|
(27,831
|
)
|
|||
|
Property and equipment, net
|
$
|
47,493
|
|
$
|
35,305
|
|
|
2017 Acquisition
In
October 2017
, we acquired all of the outstanding interests of Cogeon GmbH (Cogeon),
a provider of adaptive math technology and developer of the math application, Math 42
, based in Germany. With this acquisition, Chegg will be able to provide self-guided and individualized math solutions to more students, deepening our reach in to the high school market. The total fair value of the purchase consideration was
$15.0 million
which included an escrow amount of
$2.2 million
for general representations and warranties and potential post-closing adjustments. The escrow amount will be released in
24
months after the acquisition date.
The acquisition date fair value of the purchase consideration for the above transactions consisted of the following (in thousands):
|
Initial cash consideration
|
$
|
12,717
|
|
|
Net working capital adjustment
|
53
|
|
|
|
Escrow
|
2,244
|
|
|
|
Fair value of purchase consideration
|
$
|
15,014
|
|
Included in the purchase agreement for the acquisition of Cogeon are additional contingent payments of up to approximately
$9.0 million
subject to achievement of specified milestones and continued employment of the sellers. These payments will be expensed ratably as technology and development expense on our consolidated statements of operations. These contingent payments may be settled by us, at our sole discretion, either in cash or shares of our common stock. We have recorded approximately
$0.6 million
as of
December 31, 2017
included within accrued liabilities on our consolidated balance
74
sheet for these contingent payments. Additionally, included in the purchase agreement are contingent equity grants of up to approximately
$3.8 million
subject to achievement of the above specified milestones, continued employment of the sellers, and an adverse tax ruling on the additional contingent payments from the German tax authority. We have not recorded any expense amounts related to these contingent equity grants as the definition of a grant has not been met in accordance with share-based compensation accounting guidance.
The fair value of the intangible assets acquired was determined under the acquisition method of accounting for business combinations. The excess of the purchase consideration paid over the fair value of net identifiable assets acquired was recorded as goodwill. Goodwill is primarily attributable to the potential for future product offerings as well as our expanded student reach. The amounts recorded for goodwill are expected to be deductible for tax purposes.
The following table presents the total allocation of purchase consideration recorded in our consolidated balance sheets as of the acquisition date (in thousands):
|
Net tangible assets
|
$
|
60
|
|
|
Acquired intangible assets:
|
|||
|
Trade name
|
50
|
|
|
|
Domain names
|
230
|
|
|
|
Non-compete agreements
|
70
|
|
|
|
Developed technology
|
5,510
|
|
|
|
Content Library
|
70
|
|
|
|
Total acquired intangible assets
|
5,930
|
|
|
|
Total identifiable assets acquired
|
5,990
|
|
|
|
Goodwill
|
9,024
|
|
|
|
Total fair value of purchase consideration
|
$
|
15,014
|
|
During the
year ended
December 31, 2017
, we incurred
$0.7 million
of acquisition-related expenses associated with the above acquisition which have been included in general and administrative expenses in our consolidated statements of operations.
2016 Acquisitions
In
May 2016
, we acquired all of the outstanding interests of Imagine Easy Solutions, LLC (Imagine Easy), a privately held online learning company based in New York that provides a portfolio of online writing tools. We anticipate this acquisition will enhance our ability to acquire new students, increase the value of our platform to our existing students, and have a meaningful and positive impact on their outcomes. The total fair value of the purchase consideration was
$42.3 million
which included deferred cash consideration of
$17.0 million
. We recorded the present value of the deferred cash consideration of
$16.4 million
at the acquisition date and recorded accretion expense until it was paid to the sellers in April 2017. During the
year ended
December 31, 2017
and
2016
, we recorded accretion expense of
$0.2 million
and
$0.4 million
, respectively, through other income (expense), net on our consolidated statement of operations. Further, the consideration included an escrow and a hold-back amount of
$4.2 million
and
$0.5 million
, respectively, for general representations and warranties and potential post-closing adjustments. The escrow amount was released in July 2017 and the hold-back amount was released during the third quarter of 2016.
In
December 2016
, we acquired certain assets of RefME Ltd., a privately held online learning company based in London, England, to enhance our already existing portfolio of writing tools. The total fair value of the purchase consideration was
$1.8 million
. The purchase consideration included deferred cash consideration of
$0.8 million
, which was paid out in
four
quarterly installments during the
years ended December 31, 2017
and
2016
.
75
The acquisition date fair value of the purchase consideration for the above transactions consisted of the following (in thousands):
|
Initial cash consideration
|
$
|
22,007
|
|
|
Net working capital adjustment
|
200
|
|
|
|
Fair value of deferred cash consideration
|
17,127
|
|
|
|
Escrow
|
4,200
|
|
|
|
Hold-back
|
500
|
|
|
|
Fair value of purchase consideration
|
$
|
44,034
|
|
Included in the purchase agreement for the acquisition of Imagine Easy are additional contingent payments of up to
$18.0 million
, of which
$3.0 million
relates to the achievement of performance conditions for the fiscal year ended
2016
. These performance conditions were achieved therefore these payments will be made through April 2019, subject to continued employment of the sellers, and will be expensed ratably as technology and development and general and administrative expense on our consolidated statements of operations. These contingent payments may be settled by us, at our sole discretion, either in cash or shares of our common stock. We have recorded
$0.4 million
as of
December 31, 2017
included within prepaid expenses on our consolidated balance sheet and
$1.0 million
as of
December 31, 2016
included within accrued liabilities on our consolidated balance sheet for these contingent payments.
The fair value of the intangible assets acquired was determined under the acquisition method of accounting for business combinations. The excess of the purchase consideration paid over the fair value of net identifiable assets acquired was recorded as goodwill. Goodwill is primarily attributable to the potential for future product offerings as well as our expanded student reach. The amounts recorded for goodwill are expected to be deductible for tax purposes.
The following table presents the total allocation of purchase consideration recorded in our consolidated balance sheets as of the acquisition date (in thousands):
|
Cash
|
$
|
59
|
|
|
Accounts receivable
|
2,610
|
|
|
|
Favorable lease acquired
|
300
|
|
|
|
Other acquired assets
|
212
|
|
|
|
Acquired intangible assets:
|
|||
|
Trade names
|
1,840
|
|
|
|
Domain names
|
1,330
|
|
|
|
Advertiser relationships
|
6,600
|
|
|
|
User base
|
550
|
|
|
|
Non-compete agreements
|
508
|
|
|
|
Developed technology
|
5,660
|
|
|
|
Total acquired intangible assets
|
16,488
|
|
|
|
Total identifiable assets acquired
|
19,669
|
|
|
|
Liabilities assumed
|
(573
|
)
|
|
|
Net identifiable assets acquired
|
19,096
|
|
|
|
Goodwill
|
24,938
|
|
|
|
Total fair value of purchase consideration
|
$
|
44,034
|
|
During the
year ended
December 31, 2016
, we incurred
$1.1 million
of acquisition-related expenses associated with the above acquisitions which have been included in general and administrative expenses in our consolidated statements of operations.
76
Goodwill consists of the following (in thousands):
|
|
December 31, 2017
|
December 31, 2016
|
|||||
|
Beginning balance
|
$
|
116,239
|
|
$
|
91,301
|
|
|
|
Additions due to acquisitions
|
9,024
|
|
24,938
|
|
|||
|
Foreign currency translation adjustment
|
9
|
|
—
|
|
|||
|
Ending balance
|
$
|
125,272
|
|
$
|
116,239
|
|
|
Intangible assets as of
December 31, 2017
and
December 31, 2016
consist of the following (in thousands, except weighted-average amortization period):
|
|
December 31, 2017
|
|||||||||||||
|
|
Weighted-Average Amortization
Period
(in months)
|
Gross
Carrying
Amount
|
Accumulated
Amortization
|
Net
Carrying
Amount
|
||||||||||
|
Developed technologies and content library
|
70
|
|
$
|
20,657
|
|
$
|
(10,220
|
)
|
$
|
10,437
|
|
|||
|
Customer lists
|
47
|
|
9,970
|
|
(5,480
|
)
|
4,490
|
|
||||||
|
Trade names
|
46
|
|
5,793
|
|
(3,465
|
)
|
2,328
|
|
||||||
|
Non-compete agreements
|
30
|
|
1,798
|
|
(1,506
|
)
|
292
|
|
||||||
|
Master service agreements
|
21
|
|
1,030
|
|
(1,030
|
)
|
—
|
|
||||||
|
Indefinite-lived trade name
|
—
|
|
3,600
|
|
—
|
|
3,600
|
|
||||||
|
Foreign currency translation adjustment
|
—
|
|
6
|
|
—
|
|
6
|
|
||||||
|
Total intangible assets
|
57
|
|
$
|
42,854
|
|
$
|
(21,701
|
)
|
$
|
21,153
|
|
|||
|
|
December 31, 2016
|
|||||||||||||
|
|
Weighted-Average Amortization
Period
(in months)
|
Gross
Carrying
Amount
|
Accumulated
Amortization
|
Net
Carrying
Amount
|
||||||||||
|
Developed technologies
|
60
|
|
$
|
15,077
|
|
$
|
(8,245
|
)
|
$
|
6,832
|
|
|||
|
Customer lists
|
47
|
|
9,970
|
|
(3,673
|
)
|
6,297
|
|
||||||
|
Trade names
|
47
|
|
5,513
|
|
(1,998
|
)
|
3,515
|
|
||||||
|
Non-compete agreements
|
30
|
|
1,728
|
|
(1,249
|
)
|
479
|
|
||||||
|
Master service agreements
|
21
|
|
1,030
|
|
(1,005
|
)
|
25
|
|
||||||
|
Indefinite-lived trade name
|
—
|
|
3,600
|
|
—
|
|
3,600
|
|
||||||
|
Total intangible assets
|
51
|
|
$
|
36,918
|
|
$
|
(16,170
|
)
|
$
|
20,748
|
|
|||
During the
years ended December 31, 2017
,
2016
and
2015
, amortization expense related to our acquired intangible assets totaled approximately
$5.5 million
,
$4.6 million
and
$4.8 million
, respectively.
As part of our acquisition of internships.com in October
2015
, we acquired an indefinite-lived trade name intangible asset valued at
$3.6 million
. We assess this asset for impairment annually during the fourth quarter or whenever events or changes in circumstances indicate that the carrying value may not be recoverable and have not recorded any impairment charges during the
years ended December 31, 2017
,
2016
and
2015
.
77
As of
December 31, 2017
, the estimated future amortization expense related to our finite-lived intangible assets is as follows (in thousands):
|
2018
|
$
|
5,311
|
|
|
2019
|
4,347
|
|
|
|
2020
|
2,874
|
|
|
|
2021
|
1,518
|
|
|
|
2022
|
1,075
|
|
|
|
Thereafter
|
2,428
|
|
|
|
Total
|
$
|
17,553
|
|
Other Current Assets
Other current assets consist of the following (in thousands):
|
December 31,
|
|||||||
|
2017
|
2016
|
||||||
|
Reimbursement from Ingram and other partners
|
$
|
4,219
|
|
$
|
18,759
|
|
|
|
Other
|
3,626
|
|
2,255
|
|
|||
|
Other current assets
|
$
|
7,845
|
|
$
|
21,014
|
|
|
Accrued Liabilities
Accrued liabilities consist of the following (in thousands):
|
December 31,
|
|||||||
|
2017
|
2016
|
||||||
|
Payable to Ingram and other partners
|
$
|
8,001
|
|
$
|
8,237
|
|
|
|
Taxes payable
|
3,337
|
|
2,927
|
|
|||
|
Chegg credit
|
2,457
|
|
2,341
|
|
|||
|
Accrued purchases of long-lived assets
|
3,573
|
|
2,333
|
|
|||
|
Accrued deferred cash consideration related to acquisition
|
—
|
|
17,378
|
|
|||
|
Other
|
13,706
|
|
11,103
|
|
|||
|
Accrued liabilities
|
$
|
31,074
|
|
|
$
|
44,319
|
|
In
September 2016
, we entered into a revolving line of credit with an aggregate principal amount of
$30.0 million
(the Line of Credit) with an accordion feature that, subject to the lender's discretion, allows us to borrow up to a total of
$50.0 million
. This new line of credit replaced the previous line of credit that expired in August 2016. The Line of Credit matures September 2019 and requires us to repay the outstanding balance upon maturity. We will pay a fee equal to
0.25%
per year on the average daily unused amount of the Line of Credit and a base interest rate equal to the LIBOR. In addition, we will pay a fee for each issued letter of credit which will be determined based on our current leverage ratio at the time the letter of credit is issued. If our leverage ratio is less than
1.00%
, we will pay a fee equal to
1.50%
per year and if our leverage ratio is greater than or equal to
1.00%
, we will pay a fee equal to
2.50%
per year. Our leverage ratio is a ratio of all obligations owed to the bank divided by our consolidated EBITDA. EBITDA for the purposes of calculating our leverage ratio is defined as net profit (loss) before tax, plus interest expense, plus non-cash stock compensation (net of capitalized interest expense), depreciation expense, amortization expense and other non-cash expenses (assuming there are no future cash costs), plus expenses incurred in connection with permitted acquisitions (including without limitation accrued acquisition-related contingent expenses) in an amount not to exceed
$6.0 million
per calendar year, plus non-recurring expenses in an amount not to exceed
$2.0 million
per calendar year. We must maintain financial covenants under the Line of Credit as follows: (1) maintain a balance of unrestricted
78
cash at the Bank of not less than
$30.0 million
at all times, other than the three months ending
March 31, 2017
and
June 30, 2017
, and not less than
$25.0 million
during the three months ending
March 31, 2017
and
June 30, 2017
; and (2) achieve EBITDA, on a trailing 12 month basis, of not less than (i)
$25.0 million
for the period of time from
September 30, 2016
through
June 30, 2017
, (ii)
$30.0 million
for the period of time from
September 30, 2017
through
June 30, 2018
, and (iii)
$35.0 million
for the period of time from
September 30, 2018
through the maturity of the Line of Credit.
As of
December 31, 2015
, we had a revolving credit facility with an aggregate principal amount of
$30.0 million
(the Revolving Credit Facility) with an accordion feature that, subject to certain financial criteria, allowed us to borrow up to a total of
$65.0 million
beginning the quarter ended December 31, 2015. The Revolving Credit Facility carried, at our election, a base interest rate of the greater of the Federal Funds Rate plus
0.5%
or one-month LIBOR plus
1%
or a LIBOR based interest rate plus additional interest of up to
4.5%
depending on our leverage ratio. The Revolving Credit Facility expired in August 2016.
As of
December 31, 2017
, we were in compliance with the financial covenants of the Line of Credit. Further, we had
no
amounts outstanding and were able to borrow up to
$30.0 million
under the Line of Credit.
We lease our offices under operating leases, which expire at various dates through
2022
. Our primary operating lease commitments at
December 31, 2017
related to our headquarters in Santa Clara, California and our office in San Francisco, California. We recognize rent expense on a straight-line basis over the lease period. Where leases contain escalation clauses, rent abatements, or concessions, such as rent holidays and landlord or tenant incentives or allowances, we apply them in the determination of straight-line rent expense over the lease term. Rental expense, net of sublease income, was approximately
$2.7 million
,
$1.9 million
and
$2.5 million
in the
years ended December 31, 2017
,
2016
and
2015
, respectively.
The aggregate future minimum lease payments as of
December 31, 2017
, are as follows (in thousands):
|
2018
|
$
|
2,934
|
|
|
2019
|
2,038
|
|
|
|
2020
|
939
|
|
|
|
2021
|
485
|
|
|
|
2022
|
230
|
|
|
|
Thereafter
|
—
|
|
|
|
Total
|
$
|
6,626
|
|
From time to time, third parties may assert patent infringement claims against us in the form of letters, litigation, or other forms of communication. In addition, we may from time to time be subject to other legal proceedings and claims in the ordinary course of business, including claims of alleged infringement of trademarks, copyrights and other intellectual property rights; employment claims; and general contract or other claims. We may also, from time to time, be subject to various legal or government claims, disputes, or investigations. Such matters may include, but not be limited to, claims, disputes, or investigations related to warranty, refund, breach of contract, employment, intellectual property, government regulation, or compliance or other matters.
We are not aware of any other pending legal matters or claims, individually or in the aggregate, that are expected to have a material adverse impact on our consolidated financial position, results of operations, or cash flows. However, our determination of whether a claim will proceed to litigation cannot be made with certainty, nor can the results of litigation be predicted with certainty. Nevertheless, defending any of these actions, regardless of the outcome, may be costly, time consuming, distract management personnel, and have a negative effect on our business. An adverse outcome in any of these actions, including a judgment or settlement, may cause a material adverse effect on our future business, operating results, and/or financial condition.
79
We have agreed to indemnify our directors and officers for certain events or occurrences, subject to certain limits, while such persons are or were serving at our request in such capacity. We may terminate the indemnification agreements with these persons upon termination of employment, but termination will not affect claims for indemnification related to events occurring prior to the effective date of termination. We have a directors’ and officers’ insurance policy that limits our potential exposure up to the limits of our insurance coverage. In addition, we also have other indemnification agreements with various vendors against certain claims, liabilities, losses, and damages. The maximum amount of potential future indemnification is unlimited.
We believe the fair value of these indemnification agreements is minimal. We have not recorded any liabilities for these agreements as of
December 31, 2017
.
We are authorized to issue
400 million
shares of common stock, with a par value per share of
$0.001
. As of
December 31, 2017
, we have reserved the following shares of common stock for future issuance:
|
December 31, 2017
|
||
|
Warrants to purchase common stock
|
100,000
|
|
|
Outstanding stock options
|
8,066,846
|
|
|
Outstanding RSUs and PSUs
|
14,335,115
|
|
|
Shares available for grant under the stock plans
|
11,177,175
|
|
|
Shares available for issuance under employee stock purchase plan
|
5,849,986
|
|
|
Total common shares reserved for future issuance
|
39,529,122
|
|
Stock
Plans
2013 Equity Incentive Plan
On June 6, 2013, the Board of Directors adopted our 2013 Equity Incentive Plan (the 2013 Plan), which was subsequently approved by our stockholders on August 29, 2013. The 2013 Plan became effective on November 11, 2013 and replaced the 2005 Plan. On the effective date of the 2013 Plan,
12,000,000
shares of our common stock were reserved for issuance, plus an additional
3,838,985
shares reserved but not issued or subject to outstanding awards under our 2005 Plan on the effective date of the 2013 Plan, plus, on and after the effective date of the 2013 Plan, (i) shares that are subject to outstanding awards under the 2005 Plan which cease to be subject to such awards, (ii) shares issued under the 2005 Plan that are forfeited or repurchased at their original issue price and (iii) shares subject to awards under the 2005 Plan that are used to pay the exercise price of an option or withheld to satisfy the tax withholding obligations related to any award. As of
December 31, 2017
there were
11,177,175
shares available for grant under the 2013 Plan. The 2013 Plan permits the granting of incentive stock options, non-qualified stock options, RSUs, stock appreciation rights, restricted shares of common stock and performance share awards. The exercise price of stock options may not be less than the
100%
of the fair market value of the common stock on the date of grant. Options granted pursuant to the 2013 Plan generally expire no later than ten years.
2013 Employee Stock Purchase Plan
On June 6, 2013, our board of directors adopted our 2013 Employee Stock Purchase Plan (the 2013 ESPP) and our stockholders subsequently approved the 2013 ESPP Plan on August 29, 2013. The 2013 ESPP permits eligible employees to acquire shares of our common stock by accumulating funds through periodic payroll deductions of up to
15%
of base salary. Our 2013 ESPP is intended to qualify as an ESPP under Section 423 of the Code and employees will receive a
15%
discount to the lesser of the fair market value of our common stock on (i) the first trading day of the applicable offering period or (ii) the last day of each purchase period in the applicable offering period. Each offering period may run for no more than
six
months. We have reserved
4,000,000
shares of our common stock under our 2013 ESPP. The aggregate number of shares issued over the term of our 2013 ESPP will not exceed
20,000,000
shares of our common stock. As of
December 31, 2017
, there were
5,849,986
shares of common stock available for future issuance under the 2013 ESPP.
80
Share-based Compensation
Total share-based compensation expense recorded for employees and non-employees, is as follows (in thousands):
|
|
Years Ended December 31,
|
||||||||||
|
|
2017
|
2016
|
2015
|
||||||||
|
Cost of revenues
|
$
|
316
|
|
$
|
172
|
|
$
|
262
|
|
||
|
Technology and development
|
14,333
|
|
14,771
|
|
11,992
|
|
|||||
|
Sales and marketing
|
5,007
|
|
6,124
|
|
7,901
|
|
|||||
|
General and administrative
|
18,703
|
|
20,718
|
|
18,620
|
|
|||||
|
Total share-based compensation expense
|
$
|
38,359
|
|
$
|
41,785
|
|
$
|
38,775
|
|
||
Total share-based compensation expense for consultants was
$44 thousand
,
$0.5 million
and
$0.4 million
in the
years ended December 31, 2017
,
2016
and
2015
, respectively. There was no capitalized share-based compensation expense as of
December 31, 2017
,
2016
or
2015
.
Fair Value of Stock Options
We estimate the fair value of each stock option award using the Black-Scholes-Merton option-pricing model, which utilizes the fair value of our common stock based on active market and requires input on the following subjective assumptions:
Expected Term.
The expected term for options granted to employees, officers, and directors is calculated as the midpoint between the vesting date and the end of the contractual term of the options. The expected term for options granted to consultants is determined using the remaining contractual life.
Expected Volatility.
The expected volatility was historically based on the average volatility of public companies within our peer group as our common stock had previously not been publicly trading for a long enough period to rely on our own expected volatility. Beginning with stock options granted during the fourth quarter of 2015, we have based the expected volatility on the average volatility of our stock price as we now have over two years of trading history.
Expected Dividends.
The dividend assumption is based on our historical experience. To date we have not paid any dividends on our common stock.
Risk-Free Interest Rate.
The risk-free interest rate used in the valuation method is the implied yield currently available on the United States treasury zero-coupon issues, with a remaining term equal to the expected life term of our options.
The following table summarizes the key assumptions used to determine the fair value of our stock options granted to employees, officers and directors:
|
|
Years Ended December 31,
|
||||||
|
|
2016
|
2015
|
|||||
|
Expected term (years)
|
5.50
|
|
5.50-6.00
|
|
|||
|
Expected volatility
|
56.94
|
%
|
50.68%-51.69%
|
|
|||
|
Dividend yield
|
—
|
%
|
—
|
%
|
|||
|
Risk-free interest rate
|
1.43
|
%
|
1.75%-1.86%
|
|
|||
|
Weighted-average grant-date fair value per share
|
$
|
2.58
|
|
$
|
3.54
|
|
|
We did not grant any stock option awards during the
year ended
December 31, 2017
.
81
Fair Value of Restricted Stock Units (RSUs) and of Performance-Based Restricted Stock Units (PSUs)
RSUs and PSUs are converted into shares of our common stock upon vesting on a one-for-one basis. Vesting of RSUs is subject to the employee’s continuing service to us, while vesting of PSUs is subject to our achievement of specified corporate financial performance objectives in addition to the employee's continuing service to us.
We recognize share-based compensation expense over the requisite service period, which is generally the vesting period, on a straight line basis for RSUs and on a graded basis for PSUs, contingent on the achievement of performance conditions.
RSUs are typically fully vested at the end of
three
or
four years
while PSUs vest subject to the achievement of performance objectives and if achieved, typically vest over
two
to
three years
. We assess the achievement of performance objectives on a quarterly basis and adjust our share-based payment expense as appropriate.
Fair Value of 2013 ESPP
Under the 2013 ESPP, rights to purchase shares are generally granted during the second and fourth quarter of each year. We estimate the fair value of rights granted under the 2013 ESPP at the date of grant using the Black-Scholes-Merton option-pricing model. The following table summarizes the key assumptions used to determine the fair value of rights granted under the 2013 ESPP:
|
|
Years Ended December 31,
|
||||||||||
|
|
2017
|
2016
|
2015
|
||||||||
|
Expected term (years)
|
0.50
|
|
0.50
|
|
0.50
|
|
|||||
|
Expected volatility
|
38.15%-45.57%
|
|
35.10%-75.74%
|
|
36.20%-49.59%
|
|
|||||
|
Dividend yield
|
—
|
%
|
—
|
%
|
—
|
%
|
|||||
|
Risk-free interest rate
|
1.04%-1.42%
|
|
0.38%-0.62%
|
|
0.09%-0.31%
|
|
|||||
|
Weighted-average grant-date fair value per share
|
$
|
3.55
|
|
$
|
1.79
|
|
$
|
1.98
|
|
||
There were
377,530
shares purchased under the 2013 ESPP for the
year ended
December 31, 2017
at an average price per share of
$7.88
with cash proceeds from the issuance of shares of
$3.0 million
.
There were
467,979
shares purchased under the 2013 ESPP for the
year ended
December 31, 2016
at an average price per share of
$3.76
with cash proceeds from the issuance of shares of
$1.8 million
.
Stock Option Activity
Stock option activity under our equity incentive plans was as follows:
|
|
Options Outstanding
|
|||||||||||
|
|
Number of
Options
Outstanding
|
Weighted-
Average
Exercise
Price per
Share
|
Weighted-Average Remaining Contractual Term in Years
|
Aggregate
Intrinsic
Value
|
||||||||
|
Balance at December 31, 2016
|
11,333,624
|
|
$
|
8.60
|
|
5.22
|
$
|
6,608,611
|
|
|||
|
Granted
|
—
|
|
—
|
|
|
|||||||
|
Exercised
|
(2,902,403
|
)
|
7.13
|
|
|
|||||||
|
Canceled
|
(364,375
|
)
|
12.23
|
|
|
|||||||
|
Balance at December 31, 2017
|
8,066,846
|
|
$
|
8.97
|
|
4.64
|
$
|
59,318,983
|
|
|||
|
As of December 31, 2017
|
||||||||||||
|
Options exercisable
|
8,033,749
|
|
$
|
8.98
|
|
4.63
|
$
|
59,002,312
|
|
|||
|
Options vested and expected to vest
|
8,064,829
|
|
$
|
8.97
|
|
4.64
|
$
|
59,299,650
|
|
|||
The total intrinsic value of options exercised during
2017
,
2016
and
2015
, was approximately
$16.8 million
,
$0.6 million
and
$3.2 million
, respectively.
82
As of
December 31, 2017
, our total unrecognized compensation expense for stock options granted to employees, officers, directors, and consultants was approximately
$0.1 million
, which will be recognized over a weighted-average vesting period of approximately
0.8 years
.
We recognize only the portion of the stock options granted to employees that is ultimately expected to vest as compensation expense. Estimated forfeitures are determined based on historical data and management’s expectation of exercise behaviors. Forfeiture rates and the resulting compensation expense are revised in subsequent periods if actual forfeitures differ from the estimate.
RSU and PSU Activity
|
|
RSUs and PSUs Outstanding
|
|||||
|
|
Number of RSUs and PSUs
Outstanding
|
Weighted
Average Grant Date
Fair Value
|
||||
|
Balance at December 31, 2016
|
14,142,109
|
|
$
|
5.20
|
|
|
|
Granted
|
6,800,381
|
|
9.10
|
|
||
|
Released
|
(5,362,478
|
)
|
5.73
|
|
||
|
Canceled
|
(1,244,897
|
)
|
6.16
|
|
||
|
Balance at December 31, 2017
|
14,335,115
|
|
$
|
6.78
|
|
|
2015 PSU Grants
In February 2015, we granted PSUs under the 2013 Plan to certain of our key employees (the February 2015 grants). The PSUs entitle the employees to receive a certain number of shares of our common stock based on our satisfaction of certain financial and strategic performance targets during 2015 (the 2015 Performance Period) and 2016 (the 2016 Performance Period). Based on the achievement of the performance conditions during the 2015 Performance Period for the February 2015 grants, the final settlement met the minimum threshold for the 2015 Performance Period based on a specified objective formula approved by the Compensation Committee of the Board of Directors (the Compensation Committee). The PSUs related to the 2015 Performance Period vest annually over a
one
or
three
-year period depending on the employee, with the initial vesting occurring in February 2016. In March 2016, the financial and strategic performance targets were set by the Compensation Committee for the 2016 Performance Period for the February 2015 grants. Based on the achievement of the performance conditions during the 2016 Performance Period for the February 2015 grants, the final settlement met the minimum threshold for the 2016 Performance Period based on a specified objective formula approved by the Compensation Committee. The PSUs related to the 2016 Performance Period vest over a
one
-year period with vesting occurring in March 2017.
During the
year ended
December 31, 2016
, the Compensation Committee approved a modification of the performance targets related to the 2015 Performance Period of the February 2015 grant for
26
employees. As a result of the modification, we recorded an expense of
$1.5 million
during the
year ended
December 31, 2016
.
The number of shares underlying the PSUs granted during the
year ended
December 31, 2015
totaled
2,300,824
shares and had a weighted average grant date fair value of
$6.59
per share. During the
year ended
December 31, 2017
and
2016
,
850,066
and
688,464
shares, respectively, were released relating to the February 2015 grants.
2016 PSU Grants
In March 2016, we granted PSUs under the 2013 Plan to certain of our key executives. The PSUs entitle the executives to receive a certain number of shares of our common stock based on our satisfaction of certain financial and strategic performance targets during 2016. Based on the achievement of the performance conditions for the March 2016 grant, the final settlement met the minimum threshold based on a specified objective formula approved by the Compensation Committee. These PSUs will vest over a
three
-year period depending on the employee, with the initial vesting occurring in March 2018.
The number of shares underlying the PSUs granted during the
year ended
December 31, 2016 totaled
2,377,842
shares and had a weighted average grant date fair value of
$4.32
per share.
83
2017 PSU Grants
In March 2017, we granted PSUs under the 2013 Plan to certain of our key executives. The PSUs entitle the executives to receive a certain number of shares of our common stock based on our satisfaction of certain financial and strategic performance targets during 2017. Based on the achievement of the performance conditions for the March 2017 grant, the final settlement met the maximum threshold based on a specified objective formula approved by the Compensation Committee. These PSUs will vest over a
three
-year period, with the initial vesting occurring in March 2018.
The number of shares underlying the PSUs granted during the
year ended
December 31, 2017 totaled
1,822,284
shares and had a grant date fair value of
$8.91
per share.
As of
December 31, 2017
, we had a total of approximately
$52.1 million
of unrecognized compensation costs related to RSUs and PSUs that is expected to be recognized over the remaining weighted average period of
1.7 years
.
Stock Warrants
As of
December 31, 2017
, we had a total of
100,000
common stock warrants exercisable at an exercise price of
$12.00
.
During the year ended December 31, 2017,
100,000
common stock warrants were exercised at an exercise price of
$12.00
. No common stock warrants were exercised in the year ended December 31, 2016. During the year ended December 31, 2015,
795,549
common stock warrants were exercised at a weighted average exercise price of
$4.12
.
We recorded an income tax provision of approximately
$1.8 million
,
$1.7 million
and
$1.5 million
for the
years ended December 31, 2017
,
2016
and
2015
, respectively. The income tax provision for the
years ended December 31, 2017
,
2016
and
2015
was primarily due to state and foreign income tax expense and federal and state tax expense related to tax amortization of acquired indefinite lived intangible assets.
Our income tax provision consisted of the following (in thousands):
|
Years Ended December 31,
|
|||||||||||
|
2017
|
2016
|
2015
|
|||||||||
|
Current income taxes:
|
|||||||||||
|
Federal
|
$
|
(103
|
)
|
$
|
(18
|
)
|
$
|
—
|
|
||
|
State
|
100
|
|
321
|
|
263
|
|
|||||
|
Foreign
|
1,523
|
|
959
|
|
778
|
|
|||||
|
Total current income taxes
|
1,520
|
|
1,262
|
|
1,041
|
|
|||||
|
Deferred income taxes:
|
|||||||||||
|
Federal
|
(992
|
)
|
503
|
|
484
|
|
|||||
|
State
|
75
|
|
48
|
|
56
|
|
|||||
|
Foreign
|
1,199
|
|
(106
|
)
|
(102
|
)
|
|||||
|
Total deferred income taxes
|
282
|
|
445
|
|
438
|
|
|||||
|
Total income tax provision
|
$
|
1,802
|
|
$
|
1,707
|
|
$
|
1,479
|
|
||
84
Loss before provision for income taxes consisted of the following (in thousands):
|
Years Ended December 31,
|
|||||||||||
|
2017
|
2016
|
2015
|
|||||||||
|
United States
|
$
|
(20,983
|
)
|
$
|
(42,687
|
)
|
$
|
(59,376
|
)
|
||
|
Foreign
|
2,502
|
|
2,149
|
|
1,645
|
|
|||||
|
Total
|
$
|
(18,481
|
)
|
$
|
(40,538
|
)
|
$
|
(57,731
|
)
|
||
The differences between our income tax provision as presented in the accompanying consolidated statements of operations and the income tax expense computed at the federal statutory rate consists of the items shown in the following table as a percentage of pretax loss (in percentages):
|
Years Ended December 31,
|
||||||||
|
2017
|
2016
|
2015
|
||||||
|
Income tax at U.S. statutory rate
|
34.0
|
%
|
34.0
|
%
|
34.0
|
%
|
||
|
State, net of federal benefit
|
8.3
|
|
1.7
|
|
3.7
|
|
||
|
Foreign rate differential
|
(3.8
|
)
|
(0.3
|
)
|
(0.2
|
)
|
||
|
Share-based compensation
|
38.2
|
|
(9.1
|
)
|
(7.0
|
)
|
||
|
Non-deductible expenses
|
(1.1
|
)
|
(0.2
|
)
|
(0.2
|
)
|
||
|
Tax credits
|
7.8
|
|
(0.4
|
)
|
1.4
|
|
||
|
Tax Cuts and Jobs Act impact
|
(220.2
|
)
|
—
|
|
—
|
|
||
|
Other
|
0.4
|
|
(0.7
|
)
|
(1.2
|
)
|
||
|
Change in valuation allowance
|
126.6
|
|
(29.2
|
)
|
(33.1
|
)
|
||
|
Total
|
(9.8
|
)%
|
(4.2
|
)%
|
(2.6
|
)%
|
||
On December 22, 2017, the Tax Cuts and Jobs Act (Tax Act) was signed into law, enacting significant changes to the U.S. Internal Revenue Code. The Tax Act makes broad and complex changes to the U.S. tax code, including, but not limited to, reducing the U.S. federal corporate tax rate from 35 percent to 21 percent; requiring companies to pay a one-time transition tax on certain unrepatriated earnings of foreign subsidiaries; generally eliminating U.S. federal income taxes on dividends from foreign subsidiaries; requiring a current inclusion in U.S. federal taxable income of certain earnings of controlled foreign corporations; creating a global intangible low-taxed income inclusion (GILTI) and the base erosion anti-abuse tax (BEAT), a new minimum tax. The Tax Act, also imposes significant limitations on the deductibility of interest, executive compensation and future net operating losses. The Tax Act allows for the expensing of certain capital expenditures.
On December 22, 2017, Staff Accounting Bulletin No. 118 (SAB 118) was issued to address the application of US GAAP in situations when a registrant does not have the necessary information available, prepared, or analyzed in reasonable detail to complete the accounting for certain income tax effects of the Tax Act. In accordance with SAB 118, as of December 31, 2017, we had not yet completed our accounting for the tax effects of the enactment of the Act. Our provision for income taxes for the year ended December 31, 2017 is based in part on our best estimate of the effects of the transition tax and existing deferred tax balances with our understanding of the Tax Act and guidance available as of the date of this filing. For the amounts which we were able to reasonably estimate, we recognized a provisional remeasurement of certain deferred tax assets and liabilities based on the rates at which they are expected to reverse in the future of
$42 million
, which is offset by a valuation allowance. The provisional amount related to the one-time transition tax on the mandatory deemed repatriation of foreign earnings was a benefit of
$0.1 million
. We also provided withholding tax on the deemed repatriation of foreign earnings of
$1.2 million
. We are still analyzing certain aspects of the Tax Act and refining the estimate of the expected reversal of our deferred tax balance. This can potentially affect the measurement of these balances or potentially give rise to new deferred tax amounts.
The Act also includes provisions for the GILTI tax inclusion, wherein taxes on foreign income are imposed in excess of a deemed return on tangible assets of foreign corporations. This income will effectively be taxed at a
10.5%
tax rate in general. As a result, our deferred tax assets and liabilities are being evaluated if the deferred tax assets and liabilities should be recognized for the basis differences expected to reverse as a result of GILTI provisions that are effective for us after the calendar year ending December 31, 2017, or should the tax on GILTI provisions be recognized in the period the Act was signed into law. Because of
85
the complexity of the new provisions, we are continuing to evaluate on how the provisions will be accounted for under the U.S. generally accepted accounting principles wherein companies are allowed to make an accounting policy election of either (i) account for GILTI as a component of tax expense in the period in which we are subject to the rules (the “period cost method”), or (ii) account for GILTI in our measurement of deferred taxes (the “deferred method”). Currently, we have not elected a method and will only do so after our completion of the analysis of the GILTI provisions and our election method will depend, in part, on analyzing our global income to determine whether we expect to have future U.S. inclusions in our taxable income related to GILTI and, if so, the impact that is expected.
A summary of our deferred tax assets is as follows (in thousands):
|
Years Ended December 31,
|
|||||||
|
2017
|
2016
|
||||||
|
Deferred tax assets:
|
|||||||
|
Accrued expenses and reserves
|
$
|
1,665
|
|
$
|
5,069
|
|
|
|
Share-based compensation
|
14,430
|
|
23,864
|
|
|||
|
Deferred revenue
|
—
|
|
1,085
|
|
|||
|
Net operating loss carryforwards
|
71,653
|
|
73,708
|
|
|||
|
Property and equipment, textbooks and intangibles assets
|
3,905
|
|
5,168
|
|
|||
|
Other items
|
960
|
|
1,407
|
|
|||
|
Gross deferred tax assets
|
92,613
|
|
110,301
|
|
|||
|
Valuation allowance
|
(91,183
|
)
|
(110,045
|
)
|
|||
|
Total deferred tax assets
|
1,430
|
|
256
|
|
|||
|
Deferred tax liabilities:
|
|||||||
|
Other
|
(2,869
|
)
|
(1,413
|
)
|
|||
|
Total deferred tax liabilities
|
(2,869
|
)
|
(1,413
|
)
|
|||
|
Net deferred tax liability
|
$
|
(1,439
|
)
|
$
|
(1,157
|
)
|
|
At
December 31, 2017
and
2016
the deferred tax liability is created by the tax amortization of acquired indefinite lived intangible assets. Under the accounting guidance this deferred tax liability can be used as a source of income for recognition of deferred tax assets when determining the amount of valuation allowance to be recorded. The 2017 Tax Cuts and Job Acts changed the expiration of post 2017 net operating losses. Under the Act, post 2017 net operating losses can only be used to offset 80% of future taxable income; however, they do not expire. The indefinite-lived deferred tax liabilities are therefore a source of income for the indefinite-lived net operating loss carryforward and no valuation allowance is necessary on 80% of the deferred tax liabilities.
Realization of the deferred tax assets is dependent upon future taxable income, the amount and timing of which are uncertain. Accordingly, the federal and state gross deferred tax assets have been fully offset by a valuation allowance. The valuation allowance decreased by approximately
$18.9 million
during the year ended
December 31, 2017
and increased by
$11.8 million
during the year ended
December 31, 2016
.
As of
December 31, 2017
, we had net operating loss carryforwards for federal and state income tax purposes of approximately
$257 million
and
$195 million
, respectively, which will begin to expire in years beginning
2028
and
2018
, respectively.
As of
December 31, 2017
, we had tax credit carryforwards for federal and state income tax purposes of approximately
$5.6 million
and
$6.4 million
, respectively. The federal credits expire in various years beginning in
2030
. The state credits do not expire.
Utilization of our net operating losses and tax credit carryforwards may be subject to substantial annual limitations due to ownership change limitations provided by the Internal Revenue Code of 1986, as amended (IRC), and similar state
86
provisions. Such annual limitations could result in the expiration of the net operating losses and tax credit carryforwards before utilization.
As describe above, the Tax Act includes a transition tax in 2017 that taxes any previously deferred foreign earnings and profits in 2017 at a reduced tax rate. As a result of this tax and the accrual of associated withholding tax, we have no unrecorded tax liabilities associated with unremitted foreign retained earnings as of December 31, 2017. As of
December 31, 2016
, we permanently reinvested approximately
$6.0 million
of earnings from our international subsidiaries.
We recognize interest and penalties related to uncertain tax positions as a component of income tax expense. During the years ended
December 31, 2017
,
2016
and
2015
, we recognized an increase of
$0.2 million
, a decrease of
$18 thousand
and an increase of
$0.1 million
of interest and penalties, respectively. Accrued interest and penalties as of
December 31, 2017
and
2016
were approximately
$0.8 million
and
$0.6 million
, respectively.
During the year ended December 31, 2017, we settled an audit relating to an examination by the tax authorities in India for the fiscal filing period ending March 31, 2015. During the year ended December 31, 2017, we also settled two years, 2012 and 2013, of a four-year tax audit in Israel. The remaining years under audit, 2014 and 2015 are waiting on the settlement of similar court decisions prior to assessments by the Israel Tax Authority.
We file tax returns in U.S. federal, state, and certain foreign jurisdictions with varying statutes of limitations. Due to net operating loss and credit carryforwards, all of the tax years since inception through the 2017 tax year remain subject to examination by the U.S. federal and some state authorities. Foreign jurisdictions remain subject to examination up to approximately seven years from the filing date, depending on the jurisdiction.
A reconciliation of the beginning and ending balances of the total amount of unrecognized tax benefits, excluding accrued interest and penalties, is as follows (in thousands):
|
Years Ended December 31,
|
|||||||||||
|
2017
|
2016
|
2015
|
|||||||||
|
Beginning balance
|
$
|
4,882
|
|
$
|
4,849
|
|
$
|
4,272
|
|
||
|
Increase in tax positions for prior years
|
280
|
|
478
|
|
82
|
|
|||||
|
Decrease in tax positions for prior years
|
(101
|
)
|
(855
|
)
|
(416
|
)
|
|||||
|
Decrease in tax positions for prior year settlement
|
(172
|
)
|
(32
|
)
|
(61
|
)
|
|||||
|
Decrease in tax positions for prior years due to statutes lapsing
|
(169
|
)
|
(76
|
)
|
—
|
|
|||||
|
Increase in tax positions for current year
|
978
|
|
595
|
|
948
|
|
|||||
|
Change due to translation of foreign currencies
|
74
|
|
(77
|
)
|
24
|
|
|||||
|
Ending balance
|
$
|
5,772
|
|
$
|
4,882
|
|
$
|
4,849
|
|
||
The actual amount of any taxes due could vary significantly depending on the ultimate timing and nature of any settlement. We believe that the amount by which the unrecognized tax benefits may increase or decrease within the next 12 months is not estimable. The amount of unrecognized tax benefits, if recognized, that would affect the effective tax rate is
$1.2 million
for the year ended
December 31, 2017
. One or more of these unrecognized tax benefits could be subject to a valuation allowance if, and when recognized in a future period, which could impact the timing of any related effective tax rate benefit.
2017 Restructuring Plan
In January 2017, we entered into a strategic partnership with the National Research Center for College & University Admissions (NRCCUA) where NRCCUA will assume responsibility for managing, renewing, and maintaining our existing university contracts and become the exclusive reseller of our digital Enrollment Marketing services for colleges and universities. As a result of this strategic partnership, approximately
50
employees in China and the United States supporting the sales and account support functions of our Enrollment Marketing offering were terminated, resulting in one-time workforce reduction costs of
$0.9 million
and lease termination and other costs of
$0.1 million
recorded during the
year ended
December 31, 2017
. We expect costs incurred to date related to this workforce reduction to be fully paid within
three
months.
87
2015 Restructuring Plan
During the
years ended December 31, 2017
and
2016
, we recorded restructuring credits of
$42 thousand
and
$0.4 million
, respectively, primarily related to a partial reversal of previously accrued lease termination costs due to our subtenant leasing additional space. Costs incurred to date related to the lease termination and other costs are expected to be fully paid by 2021.
The following table summarizes the activity related to the accrual for restructuring charges (credits) (in thousands):
|
2017 Restructuring Plan
|
2015 Restructuring Plan
|
||||||||||||||||||
|
Workforce Reduction Costs
|
Lease Termination and Other Costs
|
Workforce Reduction Costs
|
Lease Termination and Other Costs
|
Total
|
|||||||||||||||
|
Balance at January 1, 2016
|
$
|
—
|
|
$
|
—
|
|
$
|
55
|
|
$
|
2,463
|
|
$
|
2,518
|
|
||||
|
Restructuring credits
|
—
|
|
—
|
|
—
|
|
(423
|
)
|
(423
|
)
|
|||||||||
|
Cash payments
|
—
|
|
—
|
|
(55
|
)
|
(1,734
|
)
|
(1,789
|
)
|
|||||||||
|
Balance at December 31, 2016
|
—
|
|
—
|
|
—
|
|
306
|
|
306
|
|
|||||||||
|
Restructuring charges (credits)
|
941
|
|
148
|
|
—
|
|
(42
|
)
|
1,047
|
|
|||||||||
|
Cash payments
|
(897
|
)
|
(128
|
)
|
—
|
|
(43
|
)
|
(1,068
|
)
|
|||||||||
|
Write-offs
|
—
|
|
(20
|
)
|
—
|
|
—
|
|
(20
|
)
|
|||||||||
|
Balance at December 31, 2017
|
$
|
44
|
|
$
|
—
|
|
$
|
—
|
|
$
|
221
|
|
$
|
265
|
|
||||
As of
December 31, 2017
, the
$0.3 million
liability was comprised of a short-term accrual of
$0.1 million
included within accrued liabilities and a long-term accrual of
$0.2 million
included within other liabilities on the consolidated balance sheet.
Our Chief Executive Officer is a member of the Board of Directors of Adobe Systems Incorporated (Adobe). During the
years ended December 31, 2017
,
2016
and
2015
, we had purchases of
$3.2 million
,
$3.1 million
and
$2.9 million
, respectively, from Adobe. We had
$0.1 million
in revenues
year ended
December 31, 2017
, no revenues in the
year ended
December 31, 2016
and
$0.1 million
in revenues in the
year ended
December 31, 2015
from Adobe. We had
$0.3 million
in payables as of
December 31, 2017
and
2016
to Adobe. We had an immaterial amount of outstanding receivables as of
December 31, 2017
and
no
outstanding accounts receivables as of
December 31, 2016
from Adobe.
One
of our board members is also a member of the Board of Directors of Cengage Learning, Inc. (Cengage). During the
years ended December 31, 2017
,
2016
and
2015
,
we had purchases of
$11.5 million
,
$10.2 million
and
$11.5 million
, respectively, from Cengage. We had
$1.9 million
,
$0.6 million
and
$0.1 million
in revenues from Cengage in the
years ended December 31, 2017
,
2016
and
2015
, respectively. We had
$0.1 million
in payables as of
December 31, 2017
and an immaterial amount in payables as of
December 31, 2016
to Cengage. We had
$0.3 million
and
$0.1 million
in outstanding accounts receivables as of
December 31, 2017
and
2016
, respectively, from Cengage.
One
of our board members is also a member of the Board of Directors of Synack, Inc. (Synack). During the
years ended December 31, 2017
,
2016
and
2015
, we had purchases of
$0.1 million
,
$0.2 million
and
$0.1 million
, respectively, of services from Synack.
The immediate family of
one
of our board members is also a member of the Board of Directors of PayPal Holdings, Inc. (PayPal). During the
year ended
December 31, 2017
,
2016
and
2015
, we incurred payment processing fees of
$1.0 million
,
$0.9 million
and
$0.7 million
, respectively, to PayPal.
We sponsor a 401(k) savings plan for eligible employees and their beneficiaries. Contributions by us are discretionary. Participants may contribute, on a pretax basis, a percentage of their annual compensation, but not to exceed a maximum contribution amount pursuant to Section 401(k) of the IRC. During the year ended
December 31, 2017
,
2016
and
2015
, our
88
matching contributions totaled approximately
$1.1 million
,
$0.9 million
, and
$0.8 million
, respectively.
Our chief operating decision-maker is our Chief Executive Officer who makes resource allocation decisions and reviews financial information presented on a consolidated basis. Accordingly, we have determined that we have a single operating and reporting segment and operating unit structure.
Product Information
We derive our revenues from our Chegg Services and Required Materials product lines. Chegg Services includes our products and services we provide to supplement the requirements and help students with their coursework as well as our marketing services which help to complete our offering of services to students. Required Materials includes all products that are essential for students to meet the requirements of their coursework. Chegg Services includes
Chegg Study, Chegg Writing, Chegg Tutors, Brand Partnership, Test Prep and Internships
. Required Materials includes
commissions from Ingram and other partners, on the rental and sale of print textbooks, as well as revenues from eTextbooks
.
The following table sets forth our total net revenues for the periods shown for our Chegg Services and Required Materials product lines (in thousands):
|
December 31,
|
|||||||||||
|
2017
|
2016
|
2015
|
|||||||||
|
Chegg Services
|
$
|
185,683
|
|
$
|
129,335
|
|
$
|
94,285
|
|
||
|
Required Materials
|
69,383
|
|
124,755
|
|
207,088
|
|
|||||
|
Total net revenues
|
$
|
255,066
|
|
$
|
254,090
|
|
$
|
301,373
|
|
||
Geographic Information
Our headquarters and most of our operations are located in the United States. We conduct our sales, marketing and customer service activities primarily in the United States. Geographic revenues information is based on the location of the customer. In
2017
,
2016
and
2015
, substantially all of our revenues and long-lived assets are located in the United States.
89
|
Three Months Ended
|
|||||||||||||||
|
March 31, 2017
|
June 30, 2017
|
September 30, 2017
|
December 31, 2017
|
||||||||||||
|
Total net revenues
|
$
|
62,602
|
|
$
|
56,317
|
|
$
|
62,640
|
|
$
|
73,507
|
|
|||
|
Gross profit
|
$
|
41,206
|
|
$
|
39,275
|
|
$
|
40,284
|
|
$
|
54,126
|
|
|||
|
Net (loss) income
|
$
|
(6,401
|
)
|
$
|
(6,025
|
)
|
$
|
(11,516
|
)
|
$
|
3,659
|
|
|||
|
Weighted average shares used to compute net (loss) income per share:
|
|||||||||||||||
|
Basic
|
92,830
|
|
95,047
|
|
103,041
|
|
108,968
|
|
|||||||
|
Diluted
|
92,830
|
|
95,047
|
|
103,041
|
|
121,557
|
|
|||||||
|
Net (loss) income per share:
|
|||||||||||||||
|
Basic
|
$
|
(0.07
|
)
|
$
|
(0.06
|
)
|
$
|
(0.11
|
)
|
$
|
0.03
|
|
|||
|
Diluted
|
$
|
(0.07
|
)
|
$
|
(0.06
|
)
|
$
|
(0.11
|
)
|
$
|
0.03
|
|
|||
|
Three Months Ended
|
|||||||||||||||
|
March 31, 2016
|
June 30, 2016
|
September 30, 2016
|
December 31, 2016
|
||||||||||||
|
Total net revenues
|
$
|
66,654
|
|
$
|
53,036
|
|
$
|
71,343
|
|
$
|
63,057
|
|
|||
|
Gross profit
|
$
|
27,731
|
|
$
|
31,629
|
|
$
|
32,644
|
|
$
|
42,485
|
|
|||
|
Net loss
|
$
|
(15,685
|
)
|
$
|
(9,008
|
)
|
$
|
(16,063
|
)
|
$
|
(1,489
|
)
|
|||
|
Weighted average shares used to compute net loss per share, basic and diluted
|
89,118
|
|
90,416
|
|
91,059
|
|
91,526
|
|
|||||||
|
Net loss per share, basic and diluted
|
$
|
(0.18
|
)
|
$
|
(0.10
|
)
|
$
|
(0.17
|
)
|
$
|
(0.02
|
)
|
|||
We recorded restructuring charges of
$24 thousand
,
$64 thousand
,
$59 thousand
and
$0.9 million
in the three months ended
December 31, 2017
,
September 30,
2017
,
June 30,
2017
and
March 31,
2017
, respectively. We recorded restructuring credits of
$0.1 million
,
$0.1 million
,
$0.2 million
and
$44 thousand
in the three months ended
December 31, 2016
,
September 30,
2016
,
June 30,
2016
and
March 31,
2016
, respectively.
90
None.
|
(a)
|
Evaluation of Disclosure Controls and Procedures
|
Under the supervision and with the participation of our management, including our principal executive officer and principal financial officer, we conducted an evaluation of the effectiveness of the design and operation of our disclosure controls and procedures, as defined in Rules 13a-15(e) and 15d-15(e) under the Exchange Act, as of the end of the period covered by this report.
In designing and evaluating our disclosure controls and procedures, management recognizes that any disclosure controls and procedures, no matter how well designed and operated, can provide only reasonable assurance of achieving the desired control objectives. In addition, the design of disclosure controls and procedures must reflect the fact that there are resource constraints and that management is required to apply its judgment in evaluating the benefits of possible controls and procedures relative to their costs.
Based on management’s evaluation, our principal executive officer and principal financial officer concluded that our disclosure controls and procedures are designed to, and are effective to, provide assurance at a reasonable level that the information we are required to disclose in reports that we file or submit under the Exchange Act is recorded, processed, summarized and reported within the time periods specified in SEC rules and forms and that such information is accumulated and communicated to our management, including our Chief Executive Officer and Chief Financial Officer, as appropriate, to allow timely decisions regarding required disclosures.
|
(b)
|
Management's Annual Report on Internal Control Over Financial Reporting
|
Our management is responsible for establishing and maintaining adequate internal control over financial reporting (as defined in Rule 13a-15(f) of the Securities Exchange Act of 1934, as amended). Our management assessed the effectiveness of our internal control over financial reporting as of
December 31, 2017
. In making this assessment, our management used the criteria set forth by the Committee of Sponsoring Organizations of the Treadway Commission (COSO) in Internal Control—Integrated Framework (2013 framework). The Company has excluded from its evaluation the internal control over financial reporting of Cogeon GmbH, which is included in the
December 31, 2017
consolidated financial statements and constituted less than 1% of total assets as of
December 31, 2017
, and less than 1% of total net revenues and net loss, respectively, for the year ended
December 31, 2017
. All control systems are subject to inherent limitations. Our management has concluded that, as of
December 31, 2017
, our internal control over financial reporting is effective based on these criteria. Additionally, our independent registered public accounting firm, Ernst & Young LLP, has issued an audit report on the Company's internal control over financial reporting, which appears in Part II, Item 8 of this Annual Report on Form 10-K.
|
(c)
|
Changes in Internal Control over Financial Reporting
|
During the fourth quarter of fiscal
2017
, there were no changes in our internal control over financial reporting identified in connection with the evaluation required by Rules 13a-15(d) and 15d-15(d) of the Exchange Act that occurred during our most recently completed fiscal quarter that materially affected, or are reasonably likely to materially affect, our internal control over financial reporting.
None.
91
The information concerning our directors, compliance with Section 16(a) of the Exchange Act, our Audit Committee and any changes to the process by which stockholders may recommend nominees to the Board required by this Item are incorporated herein by reference to information contained in the Proxy Statement, including “Proposal No. 1 Election of Directors”, “Committees of our Board of Directors”, “Section 16(a) Beneficial Ownership Reporting Compliance” and “Stockholder Proposals to Be Presented at Next Annual Meeting.”
The information concerning our executive officers required by this Item is incorporated herein by reference to information contained in the Proxy Statement, including “Our Management.”
We have adopted a code of ethics, our Code of Business Conduct and Ethics, which applies to all employees, including our principal executive officer, our principal financial officer, and all other executive officers, and our board of directors. The Code of Business Conduct and Ethics is available on our web-site at investor.chegg.com under “Corporate Governance.” We intend to satisfy the disclosure requirement under Item 5.05 of Form 8-K regarding amendment to, or waiver from, a provision of our Code of Business Conduct and Ethics by posting such information on our website at the address and location specified above.
The information required by this Item is incorporated herein by reference to information contained in the Proxy Statement, including “Compensation Committee Interlocks and Insider Participation” and “Executive Compensation.”
The information required by this Item is incorporated herein by reference to information contained in the Proxy Statement, including “Transactions with Related Parties, Founders and Control Persons” and “Independence of Directors.”
The information required by this Item is incorporated herein by reference to information contained in the Proxy Statement, including “Corporate Governance Standards and Director Independence” “Transactions with Related Parties, Founders and Control Persons” and “Termination and Change of Control Arrangements.”
The information required by this Item is incorporated herein by reference to information contained in the Proxy Statement, including “Proposal No. 2 Ratification of Independent Registered Public Accounting Firm”.
92
We have filed the following documents as part of this Annual Report on Form 10-K:
1. Consolidated Financial Statements
|
|
Page
|
|
Reports of Independent Registered Public Accounting Firm
|
|
|
Consolidated Balance Sheets
|
|
|
Consolidated Statements of Operations
|
|
|
Consolidated Statements of Comprehensive Loss
|
|
|
Consolidated Statements of Stockholders' Equity
|
|
|
Consolidated Statements of Cash Flows
|
|
|
Notes to Consolidated Financial Statements
|
|
2. Financial Statement Schedules
Schedule II-Valuation and Qualifying Accounts (in thousands):
|
|
Years Ended December 31, 2017, 2016, and 2015
|
||||||||||||||
|
|
Balance at
Beginning of Year |
Provision (Release) for Bad Debts
|
Net Write-offs
|
Balance at
End of Year |
|||||||||||
|
Allowance for doubtful accounts
|
|
|
|
|
|||||||||||
|
2017
|
$
|
436
|
|
$
|
47
|
|
$
|
(224
|
)
|
$
|
259
|
|
|||
|
2016
|
$
|
378
|
|
$
|
58
|
|
$
|
—
|
|
$
|
436
|
|
|||
|
2015
|
$
|
559
|
|
$
|
(77
|
)
|
$
|
(104
|
)
|
$
|
378
|
|
|||
|
|
Years Ended December 31, 2017, 2016, and 2015
|
||||||||||||||
|
|
Balance at
Beginning of Year |
Provision for Refunds
|
Refunds Issued
|
Balance at
End of Year |
|||||||||||
|
Refund Reserve
|
|
|
|
|
|||||||||||
|
2017
|
$
|
487
|
|
$
|
22,446
|
|
$
|
(22,651
|
)
|
$
|
282
|
|
|||
|
2016
|
$
|
4,538
|
|
$
|
26,373
|
|
$
|
(30,424
|
)
|
$
|
487
|
|
|||
|
2015
|
$
|
6,174
|
|
$
|
39,919
|
|
$
|
(41,555
|
)
|
$
|
4,538
|
|
|||
All other financial statement schedules are omitted because they are not applicable or the information is included in the Registrant’s consolidated financial statements or related notes.
3. Exhibits
|
|
|
|
Incorporated by Reference
|
|||||||||
|
Exhibit
No.
|
Exhibit
|
|
Form
|
|
File No
|
|
Filing Date
|
|
Exhibit No.
|
|
Filed
Herewith
|
|
|
10-K
|
001-36180
|
3/4/16
|
3.01
|
|||||||||
|
10-K
|
001-36180
|
3/4/16
|
3.02
|
|||||||||
|
S-1/A
|
333-190616
|
10/01/13
|
4.01
|
|
||||||||
93
|
S-1
|
333-190616
|
08/14/13
|
4.02
|
|
||||||||
|
S-1/A
|
333-190616
|
10/01/13
|
10.01
|
|
||||||||
|
S-1
|
333-190616
|
08/14/13
|
10.02
|
|
||||||||
|
S-1/A
|
333-190616
|
10/25/13
|
10.04
|
|
||||||||
|
S-1
|
333-190616
|
08/14/13
|
10.05
|
|
||||||||
|
S-1
|
333-190616
|
08/14/13
|
10.06
|
|
||||||||
|
S-1
|
333-190616
|
08/14/13
|
10.07
|
|
||||||||
|
10-K
|
001-36180
|
3/6/14
|
10.07
|
|
||||||||
|
10-K
|
001-36180
|
3/6/14
|
10.08
|
|
||||||||
|
S-1
|
333-190616
|
8/14/13
|
10.09
|
|||||||||
|
10-K
|
001-36180
|
3/6/14
|
10.09
|
|
||||||||
|
X
|
||||||||||||
|
S-1
|
333-190616
|
08/14/13
|
10.14
|
|
||||||||
|
S-1
|
333-190616
|
08/14/13
|
10.15
|
|
||||||||
|
S-1
|
333-190616
|
08/14/13
|
10.16
|
|
||||||||
|
S-1
|
333-190616
|
08/14/13
|
10.17
|
|
||||||||
|
X
|
||||||||||||
|
8-K
|
001-36180
|
5/2/16
|
99.03
|
|||||||||
|
8-K
|
001-36180
|
9/22/16
|
99.1
|
|||||||||
|
X
|
||||||||||||
94
|
X
|
||||||||||||
|
|
|
|
|
X
|
||||||||
|
|
|
|
|
X
|
||||||||
|
|
|
|
|
X
|
||||||||
|
|
|
|
|
|
|
|
|
|
X
|
|||
|
|
|
|
|
|
|
|
|
|
X
|
|||
|
|
|
|
|
|
|
|
|
|
X
|
|||
|
101.INS
|
XBRL Instance
|
|
|
|
|
|
|
|
|
|
X
|
|
|
101.SCH
|
XBRL Taxonomy Extension Schema
|
|
|
|
|
|
|
|
|
|
X
|
|
|
101.CAL
|
XBRL Taxonomy Extension Calculation
|
|
|
|
|
|
|
|
|
|
X
|
|
|
101.LAB
|
XBRL Taxonomy Extension Labels
|
|
|
|
|
|
|
|
|
|
X
|
|
|
101.PRE
|
XBRL Taxonomy Extension Presentation
|
|
|
|
|
|
|
|
|
|
X
|
|
|
101.DEF
|
XBRL Taxonomy Extension Definition
|
|
|
|
|
|
|
|
|
|
X
|
|
|
†
|
Confidential treatment has been granted for portions of this exhibit by the SEC.
|
|
††
|
Confidential treatment has been requested for portions of this exhibit pursuant to Rule 24b-2 promulgated under the Exchange Act. These portions have been omitted and submitted separately to the Securities and Exchange Commission.
|
|
*
|
Indicates a management contract or compensatory plan.
|
|
**
|
This certification is deemed not filed for purposes of section 18 of the Securities Exchange Act of 1934, as amended (Exchange Act), or otherwise subject to the liability of that section, nor shall it be deemed incorporated by reference into any filing under the Securities Act of 1933, as amended or the Exchange Act.
|
None.
95
SIGNATURES
Pursuant to the requirements of Section 13 or 15(d) of the Securities Exchange Act of 1934, the registrant has duly caused this report to be signed on its behalf by the undersigned, thereunto duly authorized.
|
|
CHEGG, INC.
|
||
|
February 26, 2018
|
By:
|
|
/S/ DAN ROSENSWEIG
|
|
|
|
|
Dan Rosensweig
|
|
|
|
|
President, Chief Executive Officer and Chairman
|
96
POWER OF ATTORNEY
KNOW ALL PERSONS BY THESE PRESENTS
that each individual whose signature appears below constitutes and appoints Dan Rosensweig, Andrew Brown and Dave Borders Jr., and each of them, his or her true and lawful attorneys-in-fact and agents with full power of substitution, for him or her and in his or her name, place and stead, in any and all capacities, to sign any amendments to this Annual Report on Form 10-K and to file the same, with all exhibits thereto and other documents in connection therewith, with the Securities and Exchange Commission, granting unto said attorneys-in-fact and agents, and each of them, full power and authority to do and perform each and every act and thing requisite and necessary to be done in and about the premises, as fully to all intents and purposes as he or she might or could do in person, hereby ratifying and confirming all that said attorneys-in-fact and agents or any of them, or his, her or their substitute or substitutes, may lawfully do or cause to be done or by virtue hereof.
Pursuant to the requirements of the Securities Exchange Act of 1934, this report has been signed below by the following persons on behalf of the registrant and in the capacities and on the dates indicated:
|
Name
|
Title
|
Date
|
|
/S/ DAN ROSENSWEIG
|
President, Chief Executive Officer and Chairman
|
February 26, 2018
|
|
Dan Rosensweig
|
(Principal Executive Officer)
|
|
|
/S/ ANDREW BROWN
|
Chief Financial Officer
|
February 26, 2018
|
|
Andrew Brown
|
(Principal Financial Officer)
|
|
|
/S/ ROBIN TOMASELLO
|
Vice President, Corporate Controller
|
February 26, 2018
|
|
Robin Tomasello
|
(Principal Accounting Officer)
|
|
|
|
Director
|
|
|
Jeffrey Housenbold
|
||
|
/S/ RENEE BUDIG
|
Director
|
February 26, 2018
|
|
Renee Budig
|
||
|
/S/ MARNE LEVINE
|
Director
|
February 26, 2018
|
|
Marne Levine
|
||
|
/S/ RICHARD SARNOFF
|
Director
|
February 26, 2018
|
|
Richard Sarnoff
|
||
|
/S/ TED SCHLEIN
|
Director
|
February 26, 2018
|
|
Ted Schlein
|
||
|
|
Director
|
|
|
John York
|
||
97
TABLE OF CONTENTS
Part IItem 1. BusinessItem 1A. Risk FactorsItem 1B. Unresolved Staff CommentsItem 2. PropertiesItem 3. Legal ProceedingsItem 4. Mine Safety DisclosuresPart IIItem 5. Market For Registrant S Common Equity, Related Stockholder Matters and Issuer Purchases Of Equity SecuritiesItem 6. Selected Financial DataItem 7. Management S Discussion and Analysis Of Financial Condition and Results Of OperationsItem 7A. Quantitative and Qualitative Disclosures About Market RiskItem 8. Consolidated Financial Statements and Supplementary DataNote 1. Background and Basis Of PresentationNote 2. Significant Accounting PoliciesNote 3. Cash and Cash Equivalents, and InvestmentsNote 4. Fair Value MeasurementNote 5. Long-lived AssetsNote 6. AcquisitionsNote 7. Goodwill and Intangible AssetsNote 8. Balance Sheet DetailsNote 9. Debt ObligationsNote 10. Commitments and ContingenciesNote 11. Guarantees and IndemnificationsNote 12. Common StockNote 13. Stockholders' EquityNote 14. Income TaxesNote 15. Restructuring Charges (credits)Note 16. Related-party TransactionsNote 17. Employee Benefit PlanNote 18. Segment InformationNote 19. Selected Quarterly Financial Data (unaudited)Item 9. Changes in and Disagreements with Accountants on Accounting and Financial DisclosureItem 9A. Controls and ProceduresItem 9B. Other InformationPart IIIItem 10. Directors, Executive Officers and Corporate GovernanceItem 11. Executive CompensationItem 12. Security Ownership Of Certain Beneficial Owners and Management and Related Stockholder MattersItem 13. Certain Relationships and Related Transactions, and Director IndependenceItem 14. Principal Accountant Fees and ServicesPart IVItem 15. Exhibits and Financial Statement SchedulesItem 16. Form 10-k Summary