UNITED STATES SECURITIES AND EXCHANGE COMMISSION
WASHINGTON, D.C. 20549
FORM 20-F
(Mark One)
|
|
¨
|
REGISTRATION STATEMENT PURSUANT TO SECTION 12(b) OR (g) OF THE SECURITIES EXCHANGE ACT OF 1934
|
OR
|
|
þ
|
ANNUAL REPORT PURSUANT TO SECTION 13 OR 15(d) OF THE SECURITIES EXCHANGE ACT OF 1934
|
For the fiscal year ended December 31, 2010
OR
|
|
¨
|
TRANSITION REPORT PURSUANT TO SECTION 13 OR 15(d) OF THE SECURITIES EXCHANGE ACT OF 1934
|
OR
|
|
¨
|
SHELL COMPANY REPORT PURSUANT TO SECTION 13 OR 15(d) OF THE SECURITIES EXCHANGE ACT OF 1934
|
Date of event requiring this shell company report _____________
For the transition period from _____to______
Commission file number 1-14660
(Exact name of Registrant as specified in its charter)
CHINA SOUTHERN AIRLINES COMPANY LIMITED
(Translation of Registrant’s name into English)
THE PEOPLE’S REPUBLIC OF CHINA
(Jurisdiction of incorporation or organization)
278 JI CHANG ROAD
GUANGZHOU, 510405
PEOPLE’S REPUBLIC OF CHINA
(Address of principal executive offices)
Mr. Xie Bing
Telephone: +86 20 86124462
E-mail:
ir@csair.com
Fax: +86 20 86659040
Address: 278 JI CHANG ROAD
GUANGZHOU, 510405
PEOPLE’S REPUBLIC OF CHINA
(Name, Telephone, E-mail and/or Facsimile number and Address of Company Contact Person)
Securities registered or to be registered pursuant to Section 12(b) of the Act.
|
Title of each class
|
Name of each exchange on which registered
|
|
|
Ordinary H Shares of par value
|
New York Stock Exchange, Inc.
|
|
|
RMB1.00 per share
|
||
|
represented by American
|
||
|
Depositary Receipts
|
Securities registered or to be registered pursuant to Section 12(g) of the Act.
None
(Title of Class)
|
SEC 1852 (05-06)
|
Persons who respond to the collection of information contained in this form are not required to respond unless the form displays a currently valid OMB control number.
|
Securities for which there is a reporting obligation pursuant to Section 15(d) of the Act.
None
(Title of Class)
Indicate the number of outstanding shares of each of the issuer’s classes of capital or common stock as of the close of the period covered by the annual report. 7,022,650,000 ordinary A Shares of par value RMB1.00 per share and 2,794,917,000 ordinary H Shares of par value RMB1.00 per share were issued and outstanding as of December 31, 2010.
Indicate by check mark if the registrant is a well-known seasoned issuer, as defined in Rule 405 of the Securities Act.
¨
Yes
þ
No
If this report is an annual or transition report, indicate by check mark if the registrant is not required to file reports pursuant to Section 13 or 15(d) of the Securities Exchange Act of 1934.
¨
Yes
þ
No
Note — Checking the box above will not relieve any registrant required to file reports pursuant to Section 13 or 15(d) of the Securities Exchange Act of 1934 from their obligations under those Sections.
Indicate by check mark whether the registrant (1) has filed all reports required to be filed by Section 13 or 15(d) of the Securities Exchange Act of 1934 during the preceding 12 months (or for such shorter period that the Registrant was required to file such reports), and (2) has been subject to such filing requirements for the past 90 days.
þ
Yes
¨
No
Indicate by check mark whether the registrant is a large accelerated filer, an accelerated filer, or a non-accelerated filer. See definition of “accelerated filer and large accelerated filer” in Rule 12b-2 of the Exchange Act. (Check one):
Large accelerated filer
þ
Accelerated filer
¨
Non-accelerated filer
¨
Indicate by check mark which basis of accounting the registrant has used to prepare the financial statements included in this filing:
|
U.S. GAAP
¨
|
International Financial Reporting Standards
þ
|
Other
¨
|
||
|
as issued by the International Accounting
|
||||
|
Standards Board
|
If “Other” has been checked in response to the previous question, indicate by check mark which financial statement item the registrant has elected to follow.
¨
Item 17
¨
Item 18
If this is an annual report, indicate by check mark whether the registrant is a shell company (as defined in Rule 12b-2 of the Exchange Act).
¨
Yes
þ
No
TABLE OF CONTENTS
China Southern Airlines Company Limited
|
Page
|
|
|
FORWARD-LOOKING STATEMENTS
|
5 |
|
INTRODUCTORY NOTE
|
5 |
|
GLOSSARY OF AIRLINE INDUSTRY TERMS
|
6 |
|
PART I
|
7 |
|
ITEM 1. IDENTITY OF DIRECTORS, SENIOR MANAGEMENT AND ADVISERS.
|
7 |
|
ITEM 2. OFFER STATISTICS AND EXPECTED TIMETABLE.
|
7 |
|
ITEM 3. KEY INFORMATION.
|
7 |
|
Selected Financial Data
|
7 |
|
Capitalization and Indebtedness
|
9 |
|
Reasons for the Offer and Use of Proceeds
|
9 |
|
Risk Factors
|
10 |
|
ITEM 4. INFORMATION ON THE COMPANY.
|
16 |
|
History and Development of the Company
|
16 |
|
Business Overview
|
17 |
|
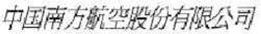
Organizational Structure
|
33 |
|
Property, Plant and Equipment
|
34 |
|
ITEM 4A. UNRESOLVED STAFF COMMENTS.
|
35 |
|
ITEM 5. OPERATING AND FINANCIAL REVIEW AND PROSPECTS.
|
35 |
|
Critical Accounting Policies
|
35 |
|
Recently Pronounced International Financial Reporting Standards
|
36 |
|
Overview
|
36 |
|
Certain Financial Information and Operating Data by Geographic Region
|
37 |
|
Operating Results
|
38 |
|
Liquidity and Capital Resources
|
44 |
|
Contractual Obligations and Commitments
|
46 |
|
Research and Development, Patents and Licenses, etc.
|
45 |
|
Trend Information
|
45 |
2
|
Off-Balance Sheet Arrangements
|
46 |
|
ITEM 6. DIRECTORS, SENIOR MANAGEMENT AND EMPLOYEES.
|
46 |
|
Directors, Senior Management and Employees
|
46 |
|
Compensation
|
50 |
|
Board Practices
|
52 |
|
Employees
|
53 |
|
Share Ownership
|
54 |
|
ITEM 7. MAJOR SHAREHOLDERS AND RELATED PARTY TRANSACTIONS.
|
54 |
|
Major Shareholders
|
54 |
|
Related Party Transactions
|
55 |
|
Interests of Experts and Counsel
|
58 |
|
ITEM 8. FINANCIAL INFORMATION.
|
58 |
|
Consolidated Statements and Other Financial Information
|
58 |
|
Significant Changes
|
58 |
|
Legal Proceedings
|
58 |
|
Dividend Information
|
58 |
|
ITEM 9. THE OFFER AND LISTING.
|
58 |
|
Offer and Listing Details
|
58 |
|
Plan of Distribution
|
60 |
|
Markets
|
60 |
|
Selling Shareholders
|
60 |
|
Dilution
|
60 |
|
Expenses of the Issue
|
60 |
|
ITEM 10. ADDITIONAL INFORMATION.
|
60 |
|
Share Capital
|
60 |
|
Memorandum and Articles of Association
|
60 |
|
Material Contracts
|
64 |
|
Exchange Controls
|
65 |
|
Taxation
|
65 |
3
|
Dividends and Paying Agents
|
69 |
|
Statement by Experts
|
69 |
|
Documents on Display
|
69 |
|
Subsidiary Information
|
69 |
|
ITEM 11. QUANTITATIVE AND QUALITATIVE DISCLOSURES ABOUT MARKET RISK.
|
69 |
|
ITEM 12. DESCRIPTION OF SECURITIES OTHER THAN EQUITY SECURITIES.
|
71 |
|
PART II
|
72 |
|
ITEM 13. DEFAULTS, DIVIDEND ARREARAGES AND DELINQUENCIES.
|
72 |
|
ITEM 14. MATERIAL MODIFICATIONS TO THE RIGHTS OF SECURITY HOLDERS AND USE OF PROCEEDS.
|
72 |
|
ITEM 15. CONTROLS AND PROCEDURES.
|
72 |
|
ITEM 16. RESERVED.
|
74 |
|
ITEM 16A. AUDIT COMMITTEE FINANCIAL EXPERT.
|
74 |
|
ITEM 16B. CODE OF ETHICS.
|
74 |
|
ITEM 16C. PRINCIPAL ACCOUNTING FEES AND SERVICES.
|
74 |
|
ITEM 16D. EXEMPTIONS FROM THE LISTING STANDARDS FOR AUDIT COMMITTEE.
|
74 |
|
ITEM 16E. PURCHASES OF EQUITY SECURITIES BY THE ISSUER AND AFFILIATED PURCHASERS.
|
75 |
|
ITEM 16F. CHANGES IN REGISTRANT’S CERTIFYING ACCOUNTANT.
|
75 |
|
ITEM 16G. CORPORATE GOVERNANCE.
|
75 |
|
PART III
|
77 |
|
ITEM 17. FINANCIAL STATEMENTS.
|
77 |
|
ITEM 18. FINANCIAL STATEMENTS.
|
77 |
|
ITEM 19. EXHIBITS.
|
77 |
|
Index to Exhibits
|
77 |
4
FORWARD-LOOKING STATEMENTS
This Annual Report contains forward-looking statements. These statements appear in a number of different places in this Annual Report. A forward-looking statement is usually identified by the use in this Annual Report of certain terminology such as “estimates”, “projects”, “expects”, “intends”, “believes”, “plans”, “anticipates”, or their negatives or other comparable words. Also look for discussions of strategy that involve risks and uncertainties. Forward-looking statements include statements regarding the outlook for the Company’s future operations, forecasts of future costs and expenditures, evaluation of market conditions, the outcome of legal proceedings (if any), the adequacy of reserves, or other business plans. You are cautioned that such forward-looking statements are not guarantees and involve risks, assumptions and uncertainties. The Company’s actual results may differ materially from those in the forward-looking statements due to risks facing the Company or due to actual facts differing from the assumptions underlying those forward-looking statements.
Some of these risks and assumptions, in addition to those identified under Item 3, “Key Information - Risk Factors,” include:
|
|
·
|
general economic and business conditions in markets where the Company operates, including changes in interest rates;
|
|
|
·
|
the effects of competition on the demand for and price of our services;
|
|
|
·
|
natural phenomena;
|
|
|
·
|
actions by government authorities, including changes in government regulations, and changes in the CAAC’s regulatory policies;
|
|
|
·
|
the Company’s relationship with China Southern Air Holding Company (the “CSAHC”);
|
|
|
·
|
uncertainties associated with legal proceedings;
|
|
|
·
|
technological development;
|
|
|
·
|
future decisions by management in response to changing conditions;
|
|
|
·
|
the Company’s ability to execute prospective business plans;
|
|
|
·
|
the availability of qualified flight personnel and airport facilities; and
|
|
|
·
|
misjudgments in the course of preparing forward-looking statements.
|
The Company advises you that these cautionary remarks expressly qualify in their entirety all forward-looking statements attributable to the Company, the Group and persons acting on their behalf.
INTRODUCTORY NOTE
In this Annual Report, unless the context indicates otherwise, the “Company” means China Southern Airlines Company Limited, a joint stock company incorporated in China on March 25, 1995, the “Group” means the Company and its consolidated subsidiaries, and “CSAHC” means China Southern Air Holding Company, the Company’s parent company which directly and indirectly holds a 53.07% interest in the Company as of April 21, 2011.
References to “China” or the “PRC” are to the People’s Republic of China, excluding Hong Kong, Macau and Taiwan. References to “Renminbi” or “RMB” are to the currency of China, references to “U.S. dollars”, “$” or “US$” are to the currency of the United States of America (the “U.S.” or “United States”), and reference to “HK$” is to the currency of Hong Kong. Reference to the “Chinese government” is to the national government of China. References to “Hong Kong” or “Hong Kong SAR” are to the Hong Kong Special Administrative Region of the PRC. References to “Macau” or “Macau SAR” are to the Macau Special Administrative Region of the PRC.
The Company presents its consolidated financial statements in Renminbi. The consolidated financial statements of the Company for the year ended December 31, 2010 (the “Financial Statements”) have been prepared in accordance with all applicable International Financial Reporting Standards (“IFRSs”), which collective term includes all applicable individual International Financial Reporting Standards, International Accounting Standards (“IAS”) and interpretations issued by the International Accounting Standards Board (the “IASB”).
5
Solely for the convenience of the readers, this Annual Report contains translations of certain Renminbi amounts into U.S. dollars at the rate of US$1.00 = RMB6.6227, which is the average of the buying and selling rates as quoted by the People’s Bank of China at the close of business on December 31, 2010. No representation is made that the Renminbi amounts or U.S. dollar amounts included in this Annual Report could have been or could be converted into U.S. dollars or Renminbi, as the case may be, at any particular rate or at all. Any discrepancies in the tables included herein between the amounts listed and the totals are due to rounding.
GLOSSARY OF AIRLINE INDUSTRY TERMS
In this Annual Report, unless the context indicates otherwise, the following terms have the respective meanings set forth below.
|
Capacity Measurements
|
||
|
“available seat kilometers” or “ASKs”
|
the number of seats made available for sale multiplied by the kilometers flown
|
|
|
“available ton kilometers” or “ATKs”
|
the tons of capacity available for the transportation of revenue load (passengers and cargo) multiplied by the kilometers flown
|
|
|
Traffic Measurements
|
||
|
“cargo ton kilometers”
|
the load in tons multiplied by the kilometers flown
|
|
|
“revenue passenger kilometers” or “RPKs”
|
the number of passengers carried multiplied by the kilometers flown
|
|
|
“revenue ton kilometers” or “RTKs”
|
the load (passenger and cargo) in tons multiplied by the kilometers flown
|
|
|
Yield Measurements
|
||
|
“average yield”
|
revenue from airline operations (passenger and cargo) divided by RTKs
|
|
|
“cargo yield”
|
revenue from cargo operations divided by cargo ton kilometers
|
|
|
“passenger yield”
|
revenue from passenger operations divided by RPKs
|
|
|
“ton”
|
a metric ton, equivalent to 2,204.6 pounds
|
|
|
Load Factors
|
||
|
“breakeven load factor”
|
the load factor required to equate scheduled traffic revenue with operating costs assuming that total operating surplus is attributable to scheduled traffic operations
|
|
|
“overall load factor”
|
RTKs expressed as a percentage of ATKs
|
|
|
“passenger load factor”
|
RPKs expressed as a percentage of ASKs
|
|
Utilization
|
||
|
“utilization rates”
|
the actual number of flight and taxi hours per aircraft per operating day
|
|
|
Equipment
|
||
|
“expendables”
|
aircraft parts that are ordinarily used up and replaced with new parts
|
|
|
“rotables”
|
aircraft parts that are ordinarily repaired and reused
|
|
|
Liquidity Ratios
|
||
|
“current ratio”
|
current assets divided by current liabilities
|
|
|
“quick ratio”
|
current assets excluding inventories divided by current liabilities
|
|
|
Others
|
||
|
“ADR”
|
American Depositary Receipt
|
6
|
“A Shares”
|
Shares issued by the Company to investors in the PRC for subscription in RMB, with par value of RMB1.00 each
|
|
|
“CAAC”
|
Civil Aviation Administration of China
|
|
|
“CAOSC”
|
China Aviation Oil Supplies Company
|
|
|
“CSRC”
|
China Securities Regulatory Commission
|
|
|
“H Shares”
|
Shares issued by the Company, listed on the Stock Exchange of Hong Kong Limited and subscribed for and traded in Hong Kong dollars, with par value of RMB1.00 each
|
|
|
“Nan Lung”
|
Nan Lung Holding Limited (a wholly-owned subsidiary of CSAHC)
|
|
|
“NDRC”
|
National Development and Reform Commission of China
|
|
|
“SA Finance”
|
Southern Airlines Group Finance Company Limited
|
|
|
“SAFE”
|
State Administration of Foreign Exchange of China
|
|
|
“SEC”
|
United States Securities and Exchange Commission
|
Not applicable.
Not applicable.
Selected Financial Data
The following tables present our selected financial data for the five-year period ended December 31, 2010. The selected consolidated income statement data for the three years ended December 31, 2008, 2009 and 2010 and selected consolidated balance sheet data as of December 31, 2009 and 2010, excluding basic and diluted earnings/(loss) per ADR, are derived from our consolidated financial statements and accompanying notes, which are included elsewhere in this Annual Report. The selected consolidated income statement data for the two years ended December 31, 2006 and 2007 and selected consolidated balance sheet data as of December 31, 2006, 2007 and 2008 are derived from our audited consolidated financial statements that are not included in this Annual Report.
The selected financial data should be read in conjunction with our audited consolidated financial statements together with accompanying notes and “Item 5. Operating and Financial Review and Prospects” as included elsewhere in this Annual Report. Our audited consolidated financial statements have been prepared and presented in accordance with International Financial Reporting Standards, or IFRSs.
|
Year ended December 31,
|
||||||||||||||||||||||||
|
2010
US$
|
2010
RMB
|
2009
RMB
|
2008
RMB
|
2007
RMB
|
2006
RMB
|
|||||||||||||||||||
|
(in millions, except per share data)
|
||||||||||||||||||||||||
|
Consolidated Income Statement Data:
|
||||||||||||||||||||||||
|
Operating revenue
|
11,550 | 76,495 | 54,802 | 55,288 | 54,401 | 46,081 | ||||||||||||||||||
|
Operating expenses
|
(10,673 | ) | (70,685 | ) | (55,351 | ) | (61,767 | ) | (52,956 | ) | (45,899 | ) | ||||||||||||
|
Operating profit/(loss)
|
949 | 6,286 | 1,440 | (5,646 | ) | 1,881 | 663 | |||||||||||||||||
|
Profit/(loss) before taxation
|
1,222 | 8,093 | 432 | (4,724 | ) | 2,879 | 227 | |||||||||||||||||
|
Profit/(loss) for the year
|
969 | 6,415 | 527 | (4,786 | ) | 2,032 | 104 | |||||||||||||||||
|
Profit/(loss) attributable to:
|
||||||||||||||||||||||||
|
Equity shareholders of the Company
|
875 | 5,795 | 330 | (4,823 | ) | 1,839 | 106 | |||||||||||||||||
|
Non-controlling interests
|
94 | 620 | 197 | 37 | 193 | (2 | ) | |||||||||||||||||
|
Basic and diluted earnings/(loss) per share
|
0.11 | 0.70 | 0.05 | (0.74 | ) | 0.28 | 0.02 | |||||||||||||||||
|
Basic and diluted earnings/(loss) per ADR
|
5.26 | 34.85 | 2.33 | (36.75 | ) | 14.01 | 0.81 | |||||||||||||||||
7
|
Year ended December 31,
|
||||||||||||||||||||||||
|
2010
US$
|
2010
RMB
|
2009
RMB
|
2008
RMB
|
2007
RMB
|
2006
RMB
|
|||||||||||||||||||
|
(in millions)
|
||||||||||||||||||||||||
|
Consolidated Balance Sheet Data:
|
||||||||||||||||||||||||
|
Cash and cash equivalents
|
1,570 | 10,404 | 4,343 | 4,649 | 3,824 | 2,264 | ||||||||||||||||||
|
Other current assets
|
824 | 5,455 | 4,785 | 4,599 | 4,966 | 4,419 | ||||||||||||||||||
|
Asset classified as held for sale
|
- | - | 529 | - | - | - | ||||||||||||||||||
|
Property, plant and equipment, net
|
12,112 | 80,214 | 63,673 | 53,237 | 58,441 | 56,335 | ||||||||||||||||||
|
Total assets
|
16,796 | 111,232 | 94,750 | 83,042 | 82,006 | 75,689 | ||||||||||||||||||
|
Bank and other loans, including long-term bank and other loans due within one year
|
1,408 | 9,324 | 17,452 | 22,178 | 24,948 | 23,822 | ||||||||||||||||||
|
Short-term financing bills
|
- | - | - | 2,000 | - | - | ||||||||||||||||||
|
Obligations under capital leases due within one year
|
250 | 1,654 | 1,431 | 1,781 | 2,877 | 3,091 | ||||||||||||||||||
|
Bank and other loans, excluding balance due within one year
|
4,813 | 31,876 | 27,875 | 17,429 | 9,074 | 10,018 | ||||||||||||||||||
|
Obligations under capital leases, excluding balance due within one year
|
1,929 | 12,776 | 11,887 | 11,157 | 12,858 | 12,307 | ||||||||||||||||||
|
Total equity
|
4,562 | 30,213 | 13,262 | 9,479 | 14,310 | 11,752 | ||||||||||||||||||
|
Number of shares (in millions)
|
9,818 | 9,818 | 8,003 | 6,561 | 4,374 | 4,374 | ||||||||||||||||||
Selected Operating Data
Our selected operating data as of the end of each year in the five-year period ended December 31, 2010 have been derived from our consolidated financial statements prepared in accordance with IFRSs and other data provided by the Group which have not been audited.
The operating data and the profit analysis and comparison for other years below have been calculated and disclosed in accordance with the statistical standards, which have been implemented by the Group since January 1, 2001. See “Glossary of Airline Industry Terms” at the front of this Annual Report for definitions of certain terms used herein.
|
Year ended December 31,
|
||||||||||||||||||||
|
2010
|
2009
|
2008
|
2007
|
2006
|
||||||||||||||||
|
Capacity
|
||||||||||||||||||||
|
ASK (millions)
|
140,498
|
123,441
|
112,767
|
109,733
|
97,059
|
|||||||||||||||
|
ATK (millions)
|
19,140
|
15,446
|
14,276
|
14,208
|
12,656
|
|||||||||||||||
|
Kilometers flown (thousands)
|
872,899
|
746,133
|
686,236
|
675,127
|
594,957
|
|||||||||||||||
|
Hours flown (thousands)
|
1,392
|
1,195
|
1,106
|
1,075
|
931
|
|||||||||||||||
|
Number of landing and take-offs
|
686,223
|
616,296
|
556,914
|
543,789
|
481,810
|
|||||||||||||||
|
Traffic
|
||||||||||||||||||||
|
RPK (millions)
|
111,328
|
93,002
|
83,184
|
81,727
|
69,582
|
|||||||||||||||
|
RTK (millions)
|
13,104
|
10,067
|
9,200
|
9,250
|
8,071
|
|||||||||||||||
|
Passengers carried (thousands)
|
76,456
|
66,281
|
58,237
|
56,903
|
49,206
|
|||||||||||||||
|
Cargo and mail carried (tons)
|
1,117,000
|
862,000
|
835,000
|
872,000
|
819,000
|
|||||||||||||||
|
Load Factors
|
||||||||||||||||||||
|
Passenger load factor (RPK/ASK) (%)
|
79.2
|
75.3
|
73.8
|
74.5
|
71.7
|
|||||||||||||||
|
Overall load factor (RTK/ATK) (%)
|
68.5
|
65.2
|
64.4
|
65.1
|
63.8
|
|||||||||||||||
|
Breakeven load factor (%)
|
65.3
|
68.1
|
73.8
|
64.8
|
65.1
|
|||||||||||||||
|
Yield
|
||||||||||||||||||||
|
Yield per RPK (RMB)
|
0.62
|
0.54
|
0.61
|
0.61
|
0.60
|
|||||||||||||||
|
Yield per cargo and mail ton
kilometers (RMB)
|
1.70
|
1.63
|
1.96
|
1.87
|
1.89
|
|||||||||||||||
|
Yield per RTK (RMB)
|
5.66
|
5.26
|
5.86
|
5.75
|
5.57
|
|||||||||||||||
|
Fleet
|
||||||||||||||||||||
|
— Boeing
|
208
|
194
|
179
|
177
|
159
|
|||||||||||||||
|
— Airbus
|
191
|
157
|
133
|
119
|
103
|
|||||||||||||||
|
— McDonnell Douglas
|
12
|
16
|
25
|
25
|
36
|
|||||||||||||||
|
— Others
|
11
|
11
|
11
|
11
|
11
|
|||||||||||||||
|
Total aircraft in service at period end
|
422
|
378
|
348
|
332
|
309
|
|||||||||||||||
|
Overall utilization rate (hours per day)
|
9.6
|
9.4
|
9.1
|
9.4
|
9.5
|
|||||||||||||||
|
Cost
|
|
|||||||||||||||||||
|
Operating cost per ATK (RMB)
|
3.69
|
3.58
|
4.33
|
3.73
|
3.63
|
|||||||||||||||
8
Exchange Rate Information
The following table sets forth certain information concerning exchange rates, based on the noon buying rates in New York City for cable transfers in foreign currencies, as certified for customs purposes by the Federal Reserve Bank of New York (the “Noon Buying Rate”), between Renminbi and U.S. dollar for the five most recent financial years.
|
Period
|
Period End
|
Average
(1)
(RMB per US$)
|
High
|
Low
|
||||||||||||
|
Annual Exchange Rate
|
||||||||||||||||
|
2006
|
7.8041
|
7.9723
|
8.0702
|
7.8041
|
||||||||||||
|
2007
|
7.2946
|
7.6058
|
7.8127
|
7.2946
|
||||||||||||
|
2008
|
6.8225
|
6.9477
|
7.2946
|
6.7800
|
||||||||||||
|
2009
|
6.8259
|
6.8307
|
6.8470
|
6.8176
|
||||||||||||
|
2010
|
6.6000
|
6.7696
|
6.8330
|
6.6000
|
||||||||||||
|
(1)
|
Determined by averaging the rates on the last business day of each month during the relevant period.
|
The following table sets out the range of high and low exchange rates, based on the Noon Buying Rate, between Renminbi and U.S. dollar, for the following periods.
|
Period
|
High
|
Low
|
||||||
|
Monthly Exchange Rate
|
||||||||
|
October 2010
|
6.6912
|
6.6397
|
||||||
|
November 2010
|
6.6892
|
6.6330
|
||||||
|
December 2010
|
6.6745
|
6.6000
|
||||||
|
January 2011
|
6.6364
|
6.5809
|
||||||
|
February 2011
|
6.5965
|
6.5520
|
||||||
|
March 2011
|
6.5743
|
6.5483
|
||||||
|
April 2011 (up to April 21, 2011)
|
6.5477 | 6.4920 | ||||||
Not applicable.
Reasons for the Offer and Use of Proceeds
Not applicable.
9
Risk Factors
Risks Relating to the Company
The Company is indirectly majority owned by the Chinese government, which may exert influence in a manner that may conflict with the interests of holders of ADRs, H Shares and A Shares.
Major Chinese airlines are wholly- or majority-owned either by the Chinese central government or by provincial or municipal governments in China. CSAHC, an entity wholly-owned by the Chinese central government, currently holds directly and indirectly and exercises the rights of ownership of 53.07% of the equity of the Company. On March 8, 2010, the Company entered into the A shares subscription agreement with CSAHC, pursuant to which CSAHC has conditionally agreed to subscribe and the Company has conditionally agreed to allot and issue new A shares of not more than 132,510,000 at the subscription price of not less than RMB5.66 per A share. In addition, the Company and Nan Lung, a wholly owned subsidiary of CSAHC entered into the H shares subscription agreement, pursuant to which Nan Lung has conditionally agreed to subscribe and the Company has conditionally agreed to allot and issue new H shares of not more than 312,500,000 at the subscription price of not less than HK$2.73 per H share. The foregoing subscriptions of 123,900,000 A shares by CSAHC and 312,500,000 H shares by Nan Lung were completed on October 29, 2010 and November 1, 2010, respectively. The interests of the Chinese government in the Company and in other Chinese airlines may conflict with the interests of the holders of ADRs, H Shares and A Shares. The public policy considerations of the Chinese government in regulating the Chinese commercial aviation industry may also conflict with its indirect ownership interest in the Company. In addition, the Company may accept further capital injection from CSAHC through non-public subscriptions, which may have dilutive impact for other holders of ADRs, H Shares and A Shares.
Due to high degree of operating leverage and high fixed costs, a decrease in revenues of the Group could result in a disproportionately higher decrease in its net income. The results of the Group’s operations are also significantly exposed to fluctuations in foreign exchange rates.
The airline industry is generally characterized by a high degree of operating leverage. In addition, due to high fixed costs, the expenses relating to the operation of any flight do not vary proportionately with the number of passengers carried, while revenues generated from a flight are directly related to the number of passengers carried and the fare structure of such flight. Accordingly, a decrease in revenues could result in a disproportionately higher decrease in net income. Moreover, as the Group has substantial obligations denominated in foreign currencies, its results of operations are significantly affected by fluctuations in foreign exchange rates, particularly by fluctuations in the Renminbi-U.S. dollar exchange rate. Net exchange gain increased by RMB1,653 million, from RMB93 million in 2009 to RMB1,746 million in 2010, mainly attributable to the exchange gain arising from retranslation and settlement of bank and other loans balances and finance lease obligations denominated in U.S. dollars, as a result of the significant appreciation of Renminbi against U.S. dollar in 2010.
The Group has significant committed capital expenditures in the next three years, and may face challenges and difficulties as it seeks to maintain liquidity.
As of December 31, 2010, the Group’s current liabilities exceeded its current assets by RMB16,466 million. The Group generally maintains sound operating cash flow. However, both current ratio and quick ratio are below average, which have negatively impacted, or may in the future negatively impact our liquidity. In addition, the Group has significant committed capital expenditures in the next three years, due to aircraft acquisitions. In 2011 and thereafter, the liquidity of the Group is primarily dependent on its ability to maintain adequate cash inflow from operations to meet its debt obligations as they fall due, and its ability to obtain adequate external financing to meet its committed future capital expenditures. The Group may not be able to meet its debt obligations as they fall due and commit future capital expenditures if certain assumptions about the operations and the availability of external financing on acceptable terms are inaccurate. In particular, our ability to obtain adequate external funding may be impacted by the economic stagnation globally.
As of December 31, 2010, the Group had banking facilities with several PRC commercial banks for providing loan finance up to approximately RMB146,702 million, of which approximately RMB39,173 million was utilized. The directors of the Company believe that sufficient financing will be available to the Group in 2011. However there can be no assurance that such loan financing will be available on terms acceptable to the Group.
CSAHC will continue to be the controlling shareholder of the Company, whose interests may conflict with those of the Group. CSAHC and certain of its associates will continue to provide certain important services to the Group. Any disruption of the provision of services by CSAHC or its associates could affect the Group’s operations and financial conditions.
CSAHC will continue to be the controlling shareholder of the Company. CSAHC and certain of its associates will continue to provide certain important services to the Group, including the import and export of aircraft spare parts and other flight equipment, advertising services, air ticket selling services, property management services, leasing of properties, financial services, and repair, overhaul and maintenance services on jet engines. The interests of CSAHC may conflict with those of the Group. In addition, any disruption of the provision of services by CSAHC’s associates or a default by CSAHC of its obligations owed to the Group could affect the Group’s operations and financial conditions. In particular, as part of its cash management system, the Group periodically places significant amount of demand deposits with SA Finance, a PRC authorized financial institution controlled by CSAHC and an associate of the Company. The Group has taken certain measures to monitor the fund flows between itself and SA Finance and the placement of funds by SA Finance. Such monitoring measures may help to enhance the safety of the Group’s deposits with SA Finance. In addition, the Company has received a letter of undertakings from CSAHC dated March 31, 2009, in which, among other things, CSAHC warranted that the Group’s deposits and loans with SA Finance were definitely secure and that SA Finance would continue to operate in strict compliance with the relevant rules and regulations. However, the deposits may be exposed to the risks associated with the business of SA Finance over which the Group does not exercise control. As of December 31, 2009 and 2010, the Group had deposits of RMB862 million and RMB1,111 million, respectively, with SA Finance.
10
Certain transactions between the Company and CSAHC or its associates (as defined in the Rules Governing the Listing of Securities on the Stock Exchange of Hong Kong Limited (the “Hong Kong Listing Rules”)) will constitute connected transactions of the Company under the Hong Kong Listing Rules and, unless exemptions are applicable or waivers are granted, will be subject to disclosure requirements and/or independent shareholders’ approval in a general meeting.
Both international and domestic economic fluctuations and Chinese government’s macroeconomic controls affect the demand for air travel, which will in turn cause volatility to the Group’s business and results of our operations.
Both international and domestic economic fluctuations and Chinese macroeconomic controls affect the demand for air travel. For example, US subprime crisis meltdown, an adverse impact on the global economy beginning in 2007 and lasting several years. Although the global economy started to pick up gradually in 2010, the aviation industry as a whole is experiencing significantly weaker demand for air travel driven by the severe downturn during the past few years. The global economic slowdown also had a negative effect on the growth rate of the Chinese economy. Chinese macroeconomic controls, taken to counteract such slowdown, such as financing adjustments, credit adjustments, price controls and exchange rate policies, would present unexpected changes to the aviation industry. As a result, the changing economic situation and Chinese macroeconomic controls may cause volatility to the Group’s business and results of our operations.
The financial crisis and other global events may reduce consumer spending or cause shifts in spending. A general reduction or shift in discretionary spending can result in decreased demand for leisure and business travel and can also impact the Group’s ability to raise fares to counteract increased fuel and labour costs. No assurance can be given that capacity reductions or other steps we may take will be adequate to offset the effects of reduced demand.
Additionally, increasingly strict security measures make air travel a hassle in the eyes of some consumers. These factors can have an uncertain impact on the development of the aviation industry.
The Group could be adversely affected by disease ourbreaks or large scale natural disasters that affect travel behavior.
The outbreak of the A/H1-N swine flu in March 2009 has had an adverse impact on the aviation industry globally (including the Group). The spread of the swine flu has been adversely affecting the Group’s international routes operations. If the swine flu spreads more widely, it could also affect the Group’s regional and domestic routes operations, and result in significant impact on our business operations. If there were another outbreak of a disease that affects travel behavior in the future, it could have a material adverse impact on us.
In 2010, a number of large-scale natural disasters occurred globally, such as earthquakes in Haiti, Mexico and Qinghai province of China, and the volcanic eruption in Iceland in April 2010. More recently, in March 2011, Japan was struck by a 9.0-magnitude earthquake and tsunami. While such events in the past have not had a material adverse impact on us as of the date of this Annual Report, future natural disasters may severely affect travel behavior in connection with affected areas, which may in turn materially reduce our revenues.
Lack of adequate documentation for land use rights and ownership of buildings subjects the Company to challenges and claims by third parties with respect to the Company’s use of such land and buildings.
Although systems for registration and transfer of land use rights and related real property interests in China have been implemented, such systems do not yet comprehensively account for all land and related property interests. The land in Guangzhou on which the Company’s headquarters and other facilities are located and the buildings in Wuhan and Haikou that the Company uses at its route bases are leased by the Company from CSAHC. However, CSAHC lacks adequate documentation evidencing CSAHC’s rights to such land and buildings, and, as a consequence, the lease agreements between CSAHC and the Company for such land have not been registered with the relevant authorities. As a result, such lease agreements may not be enforceable. Lack of adequate documentation for land use rights and ownership of buildings subjects the Company to challenges and claims by third parties with respect to the Company’s use of such land and buildings.
As of the date of this Annual Report, the Company has been occupying all of the land and buildings described above without challenge or claim by third parties. CSAHC has received written assurance from the CAAC to the effect that CSAHC is entitled to continued use and occupancy of the land and certain related buildings and facilities. However, such assurance does not constitute formal evidence of CSAHC’s right to occupy such lands, buildings and facilities or the right to transfer, mortgage or lease such real property interests. The Company cannot predict the magnitude of the adverse effect on its operations if its use of any one or more of these parcels of land or buildings were successfully challenged. CSAHC has agreed to indemnify the Company against any loss or damage caused by or arising from any challenge of, or interference with, the Company’s right to use certain land and buildings.
11
Given the preliminary stage of direct flights arrangement between Taiwan and Mainland China, no assurance can be given that the Group will generate significant yields from such new route. In addition, any discontinuity or disruption in such arrangement may negatively affect the Group’s results.
Further to temporary lifts of the ban on direct flights between Taiwan and Mainland China during certain festivals, as of July 4, 2008, the ban has been further liberalized to allow direct charter flights on weekends. Previously, travelers between Taiwan and Mainland China have had to make use of intermediate stops in Hong Kong or elsewhere. The Company became the first Chinese carrier to fly non-stop from Mainland China to Taiwan. On November 4, 2008, Mainland China and Taiwan agreed to regular direct passenger charter flights across the Taiwan Strait. On August 31, 2009, Mainland China and Taiwan extended the number of regular cross-Strait direct passenger flights from 108 to 270 a week. As a result, the permitted direct flights may benefit the Group by shortening flights time, cutting fuel costs and reducing flight fares between Taiwan and Mainland China. However, given the preliminary stage of such direct flights arrangement, no assurance can be given that the Group will generate significant yields from the new route. In addition, the results of the Group’s operations will be negatively impacted by any discontinuity or disruption in the direct flight arrangement, which in turn will be subject to a number of factors beyond our control.
Terrorist attacks or the fear of such attacks, even if not made directly on the airline industry, could negatively affect the Company and the airline industry as a whole. The travel industry continues to face on-going security concerns and cost burdens.
The aviation industry as a whole has been beset with high-profile terrorist attacks, most notably the one on September 11, 2001 in the United States. Terrorist attacks could also affect the aviation industry in China. Notably, on March 7, 2008, on a China Southern Airlines flight boarding in Urumqi, crew members discovered a suspected terrorist. On July 15, 2010, a passenger jet en route from Urumqi to Guangzhou was forced to make an emergency landing due to a bomb scare. CAAC has enhanced security measures, but the effectiveness of such measures cannot be ascertained. Additional terrorist attacks, even if not made directly on the aviation industry, or the fear of or the precautions taken in anticipation of such attacks (including elevated threat warnings or selective cancellation or redirection of flights) could materially and adversely affect the Company and the aviation industry. Among possible effects that terrorist attacks could have on the Company are substantial flight disruption costs caused by grounding of fleet, significant increase of security costs and associated passenger inconvenience, increased insurance costs, substantially higher ticket refunds and significant decrease in traffic measured in revenue passenger kilometer.
The Group could be adversely affected by a failure or disruption of our computer, communications or other technology systems.
The Group is increasingly dependent on technology to operate its business. In particular, to enhance its management of flight operations, the Group launched the computerized flight operations control system in May 1999. The system utilizes advanced computer and telecommunications technology to manage the Group’s flights on a centralized, real-time basis. The Group believes that the system will enhance the efficiency of flight schedule, increase the utilization of aircraft and improve the coordination of the Group’s aircraft maintenance and ground servicing functions. However, the computer and communications systems on which we rely could be disrupted due to various events, some of which are beyond our control, including natural disasters, power failures, terrorist attacks, equipment failures, software failures and computer viruses and hackers. The Group has taken certain steps to help reduce the risk of some of these potential disruptions. There can be no assurance, however, that the measures we have taken are adequate to prevent or remedy disruptions or failures of those systems. Any substantial or repeated failure of those systems could adversely affect our operations and customer services, result in the loss of important data, loss of revenues, and increased costs, and generally harm our business. Moreover, a failure of certain of our vital systems could limit our ability to operate our flights for an extended period of time, which would have a material adverse effect on our operations and our business.
We may lose investor confidence in the reliability of our financial statements if we fail to achieve and maintain effective internal control over financial reporting, which in turn could harm our business and negatively impact the trading prices of our ADRs, H Shares or A Shares.
The United States Securities and Exchange Commission, or the SEC, as required by Section 404 of the Sarbanes-Oxley Act of 2002, adopted rules requiring every public company in the United States to include a management report on such company’s internal control over financial reporting in its Annual Report, which contains management’s assessment of the effectiveness of the company’s internal control over financial reporting. In addition, the Company’s independent registered public accounting firm is required to report on the effectiveness of the Company's internal control over financial reporting. Our independent registered public accounting firm may not be satisfied with our internal controls, the level at which our controls are documented, designed, operated and reviewed. Our independent registered public accounting firm may also interpret the requirements, rules and regulations differently, and reach a different conclusion regarding the effectiveness of our internal control over financial reporting. Although our management have concluded that our internal control over financial reporting as of December 31, 2010 was effective, we may discover deficiencies in the course of our future evaluation of our internal control over financial reporting and may be unable to remediate such deficiencies in a timely manner. If we fail to maintain the adequacy of our internal control over financial reporting, we may not be able to conclude that we have effective internal control over financial reporting on an ongoing basis, as required under the Sarbanes-Oxley Act. Moreover, effective internal control is necessary for us to produce reliable financial reports and is important to prevent fraud. As a result, our failure to achieve and maintain effective internal control over financial reporting could result in the loss of investor confidence in the reliability of our financial statements, which in turn could harm our business and negatively impact the trading prices of our ADRs, H Shares or A Shares.
The Company could be classified as a passive foreign investment company
by the United States Internal Revenue Service and may therefore be subject to adverse tax impact.
Depending upon the value of our shares and ADRs and the nature of our assets and income over time, we could be classified as a passive foreign investment company, or PFIC, by the United States Internal Revenue Service, or IRS, for U.S. federal income tax purposes. The Company believes that it was not a PFIC for the taxable year 2010. However, there can be no assurance that the Company will not be a PFIC for the taxable year 2011 and/or later taxable years, as PFIC status is re-tested each year and depends on the facts in such year.
12
The Company will be classified as a PFIC in any taxable year if either: (1) the average percentage value of its gross assets during the taxable year that produce passive income or are held for the production of passive income is at least 50% of the value of its total gross assets (the “Asset Test”) or (2) 75% or more of its gross income for the taxable year is passive income (such as certain dividends, interest or royalties) (the “Income Test”). For purposes of the Asset Test: (1) any cash, cash equivalents, and cash invested in short-term, interest bearing, debt instruments, or bank deposits that is readily convertible into cash, will generally count as producing passive income or held for the production of passive income and (2) the average value of the Company’s gross assets is calculated based on its market capitalization.
If the Company were a PFIC, you would generally be subject to additional taxes and interest charges on certain “excess” distributions the Company makes regardless of whether the Company continues to be a PFIC in the year in which you receive an “excess” distribution or dispose of or are deemed to dispose of your ADRs. An excess distribution would be either (1) a distribution with respect to ADRs that is greater than 125% of the average of such distributions over the preceding three years, or (2) 100% of the gain from the disposition of shares/ADRs. For more information on the United States federal income tax consequences to you that would result from our classification as a PFIC, please see Item 10, “Taxation — United States Federal Income Taxation — U.S. Holders — Passive Foreign Investment Company”.
Risks Relating to the Chinese Commercial Aviation Industry
The Group’s business is subject to extensive government regulations, and there can be no
assurance as to the equal treatment of all airlines under those regulations.
The Group’s ability to implement its business strategy will continue to be affected by regulations and policies issued or implemented by the CAAC, which encompasses substantially all aspects of the Chinese commercial aviation industry, including the approval of domestic, regional and international routes allocation, air fares, aircraft acquisition, jet fuel prices and standards for aircraft maintenance, airport operations and air traffic control. Such regulations and policies limit the flexibility of the Group to respond to market conditions, competition or changes in the Group’s cost structure. The implementation of specific CAAC policies could from time to time adversely affect the Group’s operations. The CAAC has confirmed in writing that the Company will be treated equally with other Chinese airlines with respect to certain matters regulated by the CAAC. Nevertheless, there can be no assurance that the CAAC will, in all circumstances, apply its regulations and policies in a manner that results in equal treatment of all airlines.
The Group’s results may be negatively impacted by the fluctuation in domestic prices for jet fuel, and we would be adversely affected by disruptions in the supply of fuel.
The availability and cost of jet fuel have a significant impact on the Group’s results of operations. The Group’s jet fuel cost for 2010 accounted for 60.87% of its flight operations expenses. All of the domestic jet fuel requirements of Chinese airlines (other than at the Shenzhen, Zhuhai, Sanya, Haikou, Shanghai Pudong and other small airports) must be purchased from the exclusive providers, CAOSC and Bluesky Oil Supplies Company, which are controlled and supervised by the CAAC. Chinese airlines may also purchase jet fuel at the Shenzhen, Zhuhai, Sanya, Haikou, Shanghai Pudong and other small airports from joint ventures in which the CAOSC is a partner. Jet fuel obtained from the CAOSC’s regional branches is purchased at uniform prices throughout China that are determined and adjusted by the CAOSC from time to time with the approval of the CAAC and the pricing department of the NDRC based on market conditions and other factors. As a result, the costs of transportation and storage of jet fuel in all regions of China are spread among all domestic airlines.
Given the constant fluctuation in global oil prices, there is no way to assure that domestic prices for jet fuel do not fluctuate as well. For example, prior to 1994, domestic jet fuel prices were generally below international jet fuel prices. From 1994 to 2006, however, CAOSC’s domestic jet fuel prices were above international jet fuel prices, sometimes creating tensions over fuel supply. In 2007 through the first half of 2008, the crude oil price in the international market reached its historic high level. In response to the pressure imposed by such rocketing price, NDRC increased the domestic price for jet fuel on November 1, 2007 and June 20, 2008, respectively. The increased fuel costs have significantly limited the Group’s ability to generate operating profit. In the second half of 2008, the crude oil price in the international market began to decrease continuously. In order to cushion fuel cost pressure faced by Chinese airlines, on December 19, 2008 and January 1, 2009, respectively, NDRC approved reductions in domestic prices for jet fuel. Starting from February 2009, the crude oil price in the international market started to pick up gradually. As a result, NDRC increased the domestic price for jet fuel in July 2009 and made several adjustments thereafter. The NDRC further adjusted domestic price for jet fuel for multiple times in 2010, which have resulted in an increase in jet fuel price. (See “Item 4, Information on the Company - Business Overview - Jet Fuel” section below for further discussion.)
Given the constant fluctuation of volatile fuel price, no assurance can be given that the Group’s results will not be negatively affected by the fluctuation in domestic prices for jet fuel.
In addition, jet fuel shortages have occurred in China and, on some rare occasions prior to 1993, caused the Group to delay or even cancel flights. Although such shortages have not materially affected the Group’s operations since 1993, there can be no assurance that such a shortage will not occur in the future. If such a shortage occurs in the future and the Group is forced to delay or cancel flights due to fuel shortage, our operational reputation among passengers as well as our operations may suffer.
A reasonable possible 10% increase or decrease in jet fuel price, with fuel consumption and all other variables held constant, would cause an increase/decrease in fuel costs by approximately RMB2,349 million. The sensitivity analysis indicates the instantaneous change in the Group’s fuel cost that would arise assuming that the change in fuel price has occurred at the end of the reporting period.
13
The Group’s net income may suffer from an unexpected volatility caused by any fluctuation in the level of fuel surcharges.
The level of fuel surcharges, which is regulated by the Chinese government, affects domestic customers’ air travel demand as well as the Group’s ability to generate net incomes. On January 14, 2009, the NDRC and the CAAC jointly announced the suspension of the collection of passenger fuel surcharge for domestic routes since January 15, 2009. In response to the pick up of international fuel prices, the NDRC and CAAC on November 11, 2009 issued a notice to introduce a new pricing mechanism of fuel surcharge that links the surcharge with airlines’ jet fuel costs. According to the new mechanism, when the purchase cost of jet fuel is lower than RMB 4,140 per ton (i.e., the benchmark price of jet fuel), airlines should not charge fuel surcharge. When the purchase cost of jet fuel exceeds RMB 4,140 per ton, the airlines may charge appropriate fuel surcharge provided that such airlines should digest at least 20 percent of the increased cost. As such, following a suspension period of more than one year, in November, 2009, the Group resumed the imposing of fuel surcharges for the domestic routes. The NDRC has recently lowered the rate of fuel surcharge from 0.00002818 per km to 0.00002691 per km, starting from April 1, 2011 and ending on March 31, 2012. Based on that rate, for every RMB100 by which the cost of jet fuel exceeds RMB 4,140 per ton, the airlines are allowed to charge RMB0.002691 per km for the flight distance. The Group’s net income may suffer from an unexpected change in the fuel surcharge collection policy and other factors beyond our control.
The Group’s results of operations tend to be volatile and fluctuate due to seasonality.
The Group’s operating revenue is substantially dependent on the passenger and cargo traffic volume carried, which is subject to seasonal and other changes in traffic patterns, the availability of appropriate time slots for the Group’s flights and alternative routes, the degree of competition from other airlines and alternate means of transportation, as well as other factors that may influence passenger travel demand and cargo and mail volume. In particular, the Group’s airline revenue is generally higher in the second and third quarters than in the first and fourth quarters. As a result, the Group’s results tend to be volatile and subject to rapid and unexpected change.
The Group’s operations may be adversely affected by insufficient aviation infrastructure in
Chinese commercial aviation industry.
The rapid increase in air traffic volume in China in recent years has put pressure on many components of the Chinese commercial aviation industry, including China’s air traffic control system, the availability of qualified flight personnel and airport facilities. Airlines, such as the Group, which have route networks that emphasize short- to medium-haul routes, are generally more affected by insufficient aviation infrastructure in terms of on-time performance and high operating costs due to fuel inefficiencies resulting from the relatively short segments flown, as well as the relatively high proportion of time on the ground during turnaround. All of these factors may adversely affect the perception of the service provided by an airline and, consequently, the airline’s operating results. In recent years, the CAAC has placed increasing emphasis on the safety of Chinese airline operations and has implemented measures aimed at improving the safety record of the industry. The ability of the Group to increase utilization rates and to provide safe and efficient air transportation in the future will depend in part on factors such as the improvement of national air traffic control and navigation systems and ground control operations at Chinese airports, factors which are beyond the control of the Group.
The Group faces increasingly intense competition both in domestic aviation industry and in the international market, as well as from alternative means of transportation.
The CAAC’s extensive regulation of the Chinese commercial aviation industry has had the effect of managing competition among Chinese airlines. Nevertheless, competition has become increasingly intense in recent years due to a number of factors, including relaxation of certain regulations by the CAAC and an increase in the capacity, routes and flights of Chinese airlines. Competition in the Chinese commercial aviation industry has led to widespread price-cutting practices that do not in all respects comply with applicable regulations. Until the interpretation of CAAC regulations limiting such price-cutting has been finalized and strictly enforced, discounted tickets from competitors will continue to have an adverse effect on the Group’s sales.
The Group faces varying degrees of competition on its regional routes from certain Chinese airlines and Cathay Pacific Airways, Dragonair and Air Macau, and on its international routes, primarily from non-Chinese airlines, most of which have significantly longer operating histories, substantially greater financial and technological resources and greater name recognition than the Group. In addition, the public’s perception of the safety and service records of Chinese airlines could adversely affect the Group’s ability to compete against its regional and international competitors. Many of the Group’s international competitors have larger sales networks and participate in reservation systems that are more comprehensive and convenient than those of the Group, or engage in promotional activities, that may enhance their ability to attract international passengers.
Furthermore, for short-distance transportation, airplanes, trains and buses are alternatives to each other. Given the recent development of high-speed trains, the construction of nationwide high-speed railway network and the improvement of inter-city expressway network, the commercial aviation sector as a whole faces increasing competition from the alternative means of transportation such as railways and highways. In particular, the so-called “Four Longitudinal and Four Horizontal” high-speed railways under construction may have a huge negative impact on the domestic commercial aviation sector once it goes into operation. Since the Group has the most extensive domestic route network and the largest number of flights in China, the Group may be affected by the increasing popularity of high-speed trains to certain extent. For example, 42 lines of the “Four Longitudinal and Four Horizontal” overlap with current flights of the Group, 20 of which run for a distance of less than 4 hours. If the high-speed railways go into full operation, according to the statistic of the Group, 13 out of the total 18 airline subsidiaries and branches of the Group involving 968 flights (i.e. to and fro flights/week) may be seriously impacted.
14
Due to limitation on foreign ownership imposed by Chinese government policies, the Company may have no meaningful access to the international equity capital markets.
Chinese government policies limit foreign ownership in Chinese airlines. Under these policies, the percentage ownership of the Company’s total outstanding ordinary shares held by investors in Hong Kong and any country outside China (“Foreign Investors”) may not in the aggregate exceed 49%. Currently, we estimate that 28.47% of the total outstanding ordinary shares of the Company are held by Foreign Investors. For so long as the limitation on foreign ownership is in force, the Company will have no meaningful access to the international equity capital markets.
The European Emissions Trading Scheme may increase operational cost of the Group.
Starting on January 1, 2012, aviation sector will be included in the European Emissions Trading Scheme (ETS), EU’s mandatory cap-and-trade system for reduction of GHG emissions. Airline operators arriving and departing in the EU will receive tradable emission permits (aviation allowances) covering a certain level of their CO
2
emissions per year for their flights operating to and from EU airports. If an airline fails to obtain free-of-charge emission permits from the EU, it will have to buy around EUR10 million (RMB 100 million) worth of CO
2
emissions allowances from other greener industries. The China Air Transport Association estimated that Chinese carriers will be forced to pay an estimated RMB 743 million annually to comply with the ETS. Recently, a group representing China’s largest airlines sent a formal notice to the EU expressing strong opposition to non-member-state airlines’ inclusion in the EU’s Emissions Trading Scheme. There can be no assurance that the formal notice would change the position of the EU on the non-member-state airlines’ inclusion in the ETS.
Risks Relating to the PRC
The Group has significant exposure to foreign currency risk as
majority
of the Group’s lease obligations and bank and other loans are denominated in foreign currencies. Due to rigid foreign exchange control by Chinese government, the Group may face difficulties in obtaining sufficient foreign exchange to pay dividends or satisfy our foreign exchange liabilities.
Under current Chinese foreign exchange regulations, Renminbi is fully convertible for current account transactions, but is not freely convertible for capital account transactions. All foreign exchange transactions involving Renminbi must take place either through the People’s Bank of China or other institutions authorized to buy and sell foreign exchange or at a swap centre.
The Group has significant exposure to foreign currency risk as substantially all of the Group’s obligations under leases, bank and other loans and operating lease commitment are denominated in foreign currencies, principally US dollars. Depreciation or appreciation of the Renminbi against foreign currencies affects the Group’s results significantly because the Group’s foreign currency payments generally exceed its foreign currency receipts. The Group is not able to hedge its foreign currency exposure effectively other than by retaining its foreign currency denominated earnings and receipts to the extent permitted by SAFE, or subject to certain restrictive conditions, entering into foreign exchange forward option contracts with authorized banks. However, SAFE may limit or eliminate the Group’s ability to purchase and retain foreign currencies in the future. In addition, foreign currency transactions under the capital account are still subject to limitations and require approvals from SAFE. This may affect our ability to obtain foreign exchange through debt or equity financing, including by means of loans or capital contributions. No assurance can be given that the Group will be able to obtain sufficient foreign exchange to pay dividends or satisfy our foreign exchange liabilities.
The Group also has exposure to foreign currency risk in respect of net cash inflow denominated in Japanese Yen from ticket sales in overseas branch office after payment of expenses. The Group entered into certain foreign exchange forward option contracts to manage this foreign currency risk. However, like other derivative products, there can be no assurance that such option contracts can provide, at any given time, particular level of protection against foreign exchange risks.
The Group’s operations are subject to immature development of legal system in China. Lack of uniform interpretation and effective enforcement of laws and regulations may cause significant uncertainties to the Group’s operations.
The members of the Group are organized under the laws of China. The Chinese legal system is based on written statutes and is a system, unlike common law systems, in which decided legal cases have little precedential value. Since 1979, the Chinese government has been developing a comprehensive system of commercial laws and considerable progress has been made in the promulgation of laws and regulations dealing with economic matters, such as corporate organization and governance, foreign investments, commerce, taxation and trade. These laws, regulations and legal requirements are relatively recent, and, like other laws, regulations and legal requirements applicable in China (including with respect to the commercial aviation industry), their interpretation and enforcement involve significant uncertainties.
15
The PRC new tax law may in the future deprive the Company of preferential income tax rates, which the Company currently enjoys.
On March 16, 2007, the Fifth Plenary Session of the Tenth National People’s Congress passed the Corporate Income Tax Law of the PRC which took effect on January 1, 2008. As a result of the new tax law, the statutory income tax rate adopted by the Company and its subsidiaries has been changed to 25% with effect starting from January 1, 2008. Prior to enactment of the new tax law, certain branches and subsidiaries of the Company were taxed at rates ranging from 15% to 33%. Pursuant to the new tax law, the income tax rates of entities that previously enjoyed preferential tax rates of 15% and 18% have been revised to 18%, 20%, 22%, 24% and 25% for 2008, 2009, 2010, 2011 and 2012 onwards respectively. To the extent that there are any withdrawals of, or changes in, the preferential tax treatment that we currently enjoy, our tax liability may increase correspondingly and our results of operations and financial condition may be adversely affected.
The PRC new tax law may have negative tax impact on holders of H Shares or ADRs of the Company, by requiring the imposition of a withholding tax on dividends paid by a Chinese company to a non-resident enterprise
.
The new tax law generally provides for the imposition of a withholding tax on dividends paid by a Chinese company to a non-resident enterprise at a rate of 10%.
For individuals, Chinese tax law generally provides that an individual who receives dividends from the Company is subject to a 20% income tax. A 50% reduction of income tax is granted by Chinese tax law for an individual receiving dividends from a listed company on Shanghai Stock Exchange or Shenzhen Stock Exchange. As a result, the effective tax rate for dividends received by A Share individual holder is 10%. Currently, dividend income received by any foreign individual that holds overseas shares in any Chinese domestic enterprise is temporarily exempt from income tax. In the event that the exemption is discontinued, such payments will be subject to individual income tax at the 20% rate unless the holder is entitled to a tax waiver or a lower tax rate under an applicable double-taxation treaty.
History and Development of the Company
The Company is a joint stock company incorporated in China on March 25, 1995, and is 53.07% directly and indirectly owned by CSAHC. The registered address of the Company is Guangzhou Economic & Technology Development Zone, People’s Republic of China (telephone no: (86)20-8612-4462, website:
www.csair.com
).
On March 13, 2003, the Company obtained an approval certificate from the Ministry of Commerce to change to a permanent limited company with foreign investments and on October 17, 2003 obtained a business license for its new status, as a permanent limited company with foreign investments issued by the State Administration of Industry and Commerce of the People’s Republic of China.
Pursuant to an extraordinary general meeting of shareholders held on May 21, 2002, a resolution was passed authorizing the Company to issue not more than 1,000,000,000 A Shares of par value of RMB1.00 each. The Company issued and listed its 1,000,000,000 A Shares with a par value of RMB1.00 each on the Shanghai Stock Exchange in July 2003.
Pursuant to a sale and purchase agreement dated November 12, 2004 between the Company, CSAHC, China Northern Airlines Company (“CNA”) and Xinjiang Airlines Company (“XJA”) which was approved by the Company’s shareholders in an extraordinary general meeting held on December 31, 2004, the Company acquired the airline operations and certain related assets of CNA and XJA with effect from December 31, 2004 at a total consideration of RMB1,959 million.
On April 30, 2006, the Company acquired certain assets of CSAHC Hainan Co., Limited, a wholly owned subsidiary of CSAHC, at a total consideration of RMB294 million.
On June 16, 2007, the Company together with an independent third party established Chongqing Airlines Company Limited (“Chongqing Airlines”), a non-wholly owned subsidiary of the Company. Up to December 31, 2010, the Company has transferred four aircraft to Chongqing Airlines as capital contribution.
On August 14, 2007, the Company signed an agreement to acquire a 51% equity interest of Nan Lung International Freight Company Limited beneficially owned by and registered in the name of Nan Lung Travel & Express (Hong Kong) Limited which was a wholly owned subsidiary of CSAHC and a 100% equity interest in Southern Airlines (Group) Catering Co., Limited, a wholly owned subsidiary of CSAHC for a total consideration of RMB112 million.
On August 14, 2007, the Company signed an agreement to dispose of its 90% equity interest in Guangzhou Aviation Hotel Company Limited to CSAHC at a consideration of RMB75 million.
In August 2008, the Company entered into an agreement with China Post Group to dispose of all of its 49% equity interest in China Postal Cargo Airlines Limited, its jointly controlled entity which China Post Group is the other equity interest holder, at a consideration of RMB210 million and recorded a gain on disposal of RMB143 million.
In December 2008, the Company acquired a 26% equity interest in the China Southern West Australian Flying College Pty Ltd. (the “Australian Pilot College”), a subsidiary of the Company, from CSAHC, and Australian Pilot College became a 91% owned subsidiary of the Company.
16
In June 2009, the Company acquired 50% equity interest in a jointly controlled entity of the Company, Beijing Southern Airlines Ground Services Company Limited (“Beijing Ground Service”) from the other venturer, which has become a wholly-owned subsidiary of the Company since then.
On September 28, 2009, the Company entered into an agreement with CSAHC to dispose of its 50% equity interest in Zhuhai MTU Maintenance Zhuhai Co., Ltd (“Zhuhai MTU”), a jointly controlled entity of the Company, to CSAHC at a consideration of RMB1,607,850,000. The transfer was completed in February 2010.
On June 2, 2010, a third party company injected certain capital to China Southern West Australian Flying College Pty Ltd. (“Flying College”), which diluted the Company’s interest in Flying College from 91% to 48.12%. Flying College became a jointly controlled entity of the Company since then. The retained non-controlling equity interest in Flying College is re-measured to its fair value at the date when control was lost and a gain on deemed disposal of a subsidiary of RMB17 million was recorded during 2010.
In December, 2010, the Company, Xiamen Jianfa Group Co., Ltd. and Hebei Aviation Investment Group Corporation Limited (“Hebei Investment”) entered into an agreement, pursuant to which Hebei Investment agreed to inject a cash capital of RMB1,460 million into Xiamen Airlines Company Limited (“Xiamen Airlines”). Upon completion of the capital injections under the agreement, Hebei Investment will own 15% equity interest in Xiamen Airlines, the Company’s equity interest in Xiamen Airlines will decrease from 60% to 51%, and Xiamen Airlines will remain a subsidiary of the Company.
Aircraft Acquisitions
Pursuant to the an aircraft acquisition agreement dated April 18, 2008 between Xiamen Airlines and the Boeing Company (“Boeing”), Xiamen Airlines will acquire 20 Boeing B737 series aircraft from Boeing. According to the information provided by Boeing, the aggregate catalogue price for those aircraft is around US$1,500 million, including price for airframe and engines. The aggregate consideration for the acquisition will be partly payable in cash by Xiamen Airlines, and partly through financing arrangements with banking institutions. The Boeing aircraft will be delivered in stages to Xiamen Airlines during the period commencing from April 2014 to October 2015.
Pursuant to an A320 Series Aircraft Purchase Agreement dated January 20, 2010 between the Company and Airbus SNC, the Company will acquire 20 Airbus 320 series aircraft from Airbus SNC. According to the information provided by Airbus SNC, the catalogue price of an Airbus 320 aircraft is around US$76.9 million including price for airframe and engine. The aggregate consideration for the acquisition will be partly payable in cash and partly through financing arrangements with banking institutions. The Airbus aircraft will be delivered in stages to the Company from 2011 to 2013.
On September 30, 2010, Xiamen Airlines entered into a supplemental agreement with Boeing to purchase additional 10 Boeing B737 series aircraft. The aggregate catalogue price for those aircraft is around US$699 million, including price for airframe and engines. According to the information provided by Boeing, the aggregate consideration for the acquisition will be partly payable in cash by Xiamen Airlines, and partly through financing arrangements with banking institutions. The Boeing aircraft will be delivered in stages to Xiamen Airlines during the period commencing from 2015 to October 2016.
On November 4, 2010, the Company entered into an A320 family aircraft purchase agreement and an A330-300 aircraft purchase agreement with Airbus S.A.S. to purchase 30 Airbus A320 series aircraft and 6 Airbus A330 series aircraft. According to the information provided by Airbus S.A.S., the catalogue price of 6 Airbus A330 series aircraft and 30 Airbus A320 series aircraft is US$1.205 billion and US$2.575 billion, respectively, including price for airframe and engine.
The aggregate consideration for the acquisition will be partly payable by cash and partly by financing arrangements with banking institutions. The 6 Airbus A330 aircraft will be delivered in stages to the Company during the period commencing from 2013 to 2014 and the 30 Airbus A320 series aircraft will be delivered in stages to the Company during the period commencing from 2012 to 2015.
Capital Expenditure
The Group had RMB17,082 million, RMB17,178 million and RMB8,645 million capital expenditures in 2010, 2009 and 2008, respectively. Of such capital expenditures in 2010, RMB 3,056 million was financed by capital leases, RMB8,200 million was financed by bank borrowings while the remaining RMB5,826 million was financed by internal resources. The capital expenditures were primarily incurred on the additional investments in aircraft and flight equipment under the Group’s fleet expansion plans and, to a small extent, additional investments in other facilities and buildings for operations.
Business Overview
General
The Group provides commercial airline services throughout China, Hong Kong, Macau and Taiwan regions, Southeast Asia and other parts of the world. Based on the statistics from the CAAC, the Group is one of the largest Chinese airlines and, as of the year end of 2010, ranked first in terms of number of passengers carried, number of scheduled flights per week, number of hours flown, number of routes and size of aircraft fleet. During the three years ended December 31, 2010, the Group’s RPKs increased at a compound annual growth rate of 15.7% from 83,184 million in 2008 to 93,002 million in 2009, and to 111,328 million in 2010, while its capacity, measured in terms of ASKs, increased at a compound annual growth rate of 11.6%, from 112,767 million in 2008 to 123,441 million in 2009, and to 140,498 million in 2010. In 2010, the Group carried 76.46 million passengers and had passenger revenue of RMB 68,704 million (US$10,374 million).
17
The Group conducts a portion of its airline operations through its airline subsidiaries namely Xiamen Airlines, Shantou Airlines Company Limited (“Shantou Airlines”), Zhuhai Airlines Company Limited (“Zhuhai Airlines”), Guizhou Airlines Company Limited (“Guizhou Airlines”) and Chongqing Airlines Company Limited (“Chongqing Airlines”) (collectively, the “Airline Subsidiaries”). In 2010, the Airline Subsidiaries carried 18.79 million passengers and had passenger revenue of RMB15,479 million (US$2,337 million) and accounted for 25% and 23% of the Group’s passengers carried and passenger revenue, respectively.
The Group also provides air cargo and mail services. The cargo and mail revenue of the Group increased by 86.9% to RMB5,436 million (US$821 million) in 2010 as compared with that of 2009. The Group’s airline operations are fully integrated with its airline-related businesses, including aircraft and engine maintenance, flight simulation and air catering operations.
As of the year end of 2010, the Group operated 778 routes, of which 624 were domestic, 114 were international and 40 were regional. The Group operates the most extensive domestic route network among all Chinese airlines. Its route network covers commercial centers and rapidly developing economic regions in Mainland China.
The Group’s corporate headquarters and principal base of operations are located in Guangzhou, the capital of Guangdong Province and the largest city in southern China. Located in the rapidly developing Pearl River Delta region, Guangzhou is also the transportation hub of southern China and one of China’s major gateway cities. Guangzhou’s significance has increased as the transportation infrastructure of Guangdong Province has developed through the construction and development of expressways, an extensive rail network and the port cities of Guangzhou, Shenzhen, Zhanjiang, Zhuhai, Shantou and etc.
In December 2005, the Company established a branch company in Beijing and has added wide-body airplanes to its operation base in Beijing, with the view to expanding its Beijing aviation business and building another main hub there in addition to its Guangzhou base. The establishment of Guangzhou and Beijing hubs will facilitate strategic refinement and enhancement of its route network operations, putting the Company in a better position to explore and seize the opportunities in the aviation market.
The Group’s operations primarily focus on the domestic market. In addition, the Group also operates regional routes and international flights. As of the year end of 2010, the Group had 40 regional routes and 114 international routes. The Group’s regional operations include flights between destinations in Mainland China, Hong Kong, Macau and Taiwan. The Group’s international operations include scheduled services to the cities in Australia, Austria, Bangladesh, France, Germany, India, Japan, Kazakhstan, Korea, Kyrgyzstan, Maldives, Nepal, Netherlands, Nigeria, Pakistan, Russia, Saudi Arabia, Tajikistan, UAE, USA and Southeast Asian destinations.
After joining Skyteam Alliance, the Group has established a network reaching 898 destinations globally, connecting 169 countries of regions and covering major cities around the world.
As of December 31, 2010, the Group had a fleet of 422 aircraft, consisting primarily of Boeing 737 series, 747, 757, 777, Airbus 320 series, 300, 330 etc. The average age of the Group’s registered aircraft was 6.36 years as of the year end of 2010.
Restructuring and Initial Public Offering
As part of China’s economic reforms in the 1980’s, the PRC State Council directed the CAAC to separate its governmental, administrative and regulatory role from the commercial airline operations that were being conducted by the CAAC and its regional administrators. As a result, CSAHC was established on January 26, 1991 for the purpose of assuming the airline and airline-related commercial operations of the Guangzhou Civil Aviation Administration, one of the six regional bureaus of the CAAC. CSAHC was one of the 55 large-scale enterprises designated by the Chinese government to play a leading role in their respective industries.
CSAHC was restructured in 1994 and 1995 in anticipation of the initial public offering of the Company. The restructuring was effect through the establishment of the Company and the execution of the De-merger Agreement on March 25, 1995 by and between CSAHC and the Company. Upon the restructuring, the Company assumed substantially the entire airline and airline-related businesses, assets and liabilities of CSAHC, and CSAHC retained its non-airline-related businesses, assets and liabilities. All interests, rights, duties and obligations of CSAHC, whenever created or accrued, were divided between the Company and CSAHC based on the businesses, assets and liabilities assumed by each of them under the De-merger Agreement. Under the De-merger Agreement, CSAHC agreed not to conduct or participate or hold any interest in, either directly or indirectly, any business, activity or entity in or outside China that competes or is likely to compete with the commercial interests of the Group, although CSAHC may continue to hold and control its associates existing on the date of the De-merger Agreement and may continue to operate the businesses of such associates. Under the De-merger Agreement, CSAHC and the Company also agreed to indemnify each other against any and all losses, claims, damage, debts or expenses arising out of or in connection with the restructuring. As of the date of this Annual Report, no indemnity has been provided by either CSAHC or the Company.
18
In July 1997, the Company completed a private placement of 32,200,000 H Shares to certain limited partnership investment funds affiliated with Goldman Sachs & Co. and an initial public offering of 1,141,978,000 H Shares, par value RMB1.00 per share, and listing of the H Shares on the Stock Exchange of Hong Kong Limited (the “Hong Kong Stock Exchange”) and ADRs on the New York Stock Exchange. Prior to the private placement and the initial public offering, all of the issued and outstanding shares of capital stock of the Company, consisting of 2,200,000,000 non-tradable domestic shares (“Domestic Shares”), par value RMB1.00 per share, were owned by CSAHC, which owned and exercised, on behalf of the Chinese government and under the supervision of the CAAC, the rights of ownership of such Domestic Shares. After giving effect to the private placement and the initial public offering, CSAHC maintained its ownership of the 2,200,000,000 Domestic Shares (representing approximately 65.2% of the total share capital of the Company) and became entitled to elect all the directors of the Company and to control the management and policies of the Group. The Domestic Shares and H Shares are both ordinary shares of the Company.
In July 2003, the Company issued 1,000,000,000 A Shares with a par value of RMB1.00 each and listed these shares on the Shanghai Stock Exchange. Subsequent to the A Share issue, the shareholding of CSAHC in the Company was reduced from 65.2% to 50.30%.
Share Reform Scheme
Pursuant to relevant PRC laws, the Company launched the share reform scheme in May 2007, whereby all the 2,200,000,000 non-tradable Domestic Shares held by CSAHC shall be converted into tradable A Shares. Upon the completion of such scheme on June 20, 2008, all the non-tradable Domestic Shares have been successfully converted into tradable A Shares, subject to the restriction that CSAHC shall not transfer or trade these shares within 36 months after the commencement date of the share reform scheme (which was June 18, 2007).
Bonus Shares Issue by Conversion of Share Premium
On June 25, 2008, the shareholders of the Company approved a bonus share issue by way of conversion of share premium, and on August 14, 2008, the Ministry of Commerce approved the bonus share issue. The issue has been effected by conversion of share premium on the basis of 5 new shares, credited as fully paid, for every 10 existing shares. Upon the completion of the bonus share issue, which is based on 4,374,178,000 shares in issue as of December 31, 2007, the number of paid up shares has increased by 2,187,089,000 shares to 6,561,267,000 shares.
Non-Public Subscriptions
On December 10, 2008, the Company entered into an A Shares subscription agreement with CSAHC, pursuant to which CSAHC has conditionally agreed to subscribe and the Company has conditionally agreed to allot and issue 721,150,000 new A Shares for a consideration of RMB2,278,834,000, equivalent to the subscription price of RMB3.16 per new A Share. Separately and on the same date, the Company and Nan Lung (a wholly-owned subsidiary of CSAHC) entered into a H Shares subscription agreement, pursuant to which Nan Lung has conditionally agreed to subscribe and the Company has conditionally agreed to allot and issue 721,150,000 new H Shares for a consideration of RMB721, 150,000, equivalent to the subscription price of RMB1.00 (equivalent to approximately HK$1.13) per new H Share. The subscription agreements were approved in the Extraordinary General Meeting and the respective Class Meetings of shareholders of A and H Shares on February 26, 2009. On June 3, 2009, the Company received the formal approval from CSRC for the proposed non-public issue of H Shares. On August 14, 2009, the Company received the formal approval from CSRC for the proposed non-public issue of A Shares. The issuance of 721,150,000 new A Shares to CSAHC and 721,150,000 new H Shares to Nan Lung were completed on August 20, 2009 and August 21, 2009, respectively.
On March 8, 2010, the board of the Company approved the placement of not more than 1,766,780,000 new A shares to not more than 10 specific investors including CSAHC and the placement of not more than 312,500,000 new H shares to Nan Lung, a wholly-owned subsidiary of CSAHC. On the same date, the Company entered into the A shares subscription agreement with CSAHC, pursuant to which CSAHC conditionally agreed to subscribe and the Company conditionally agreed to allot and issue new A shares of not more than 132,510,000 at the subscription price of not less than RMB5.66 per A share. In addition, the Company and Nan Lung entered into the H shares subscription agreement, pursuant to which Nan Lung conditionally agreed to subscribe and the Company conditionally agreed to allot and issue new H shares of not more than 312,500,000 at the subscription price of not less than HKD2.73 per H share. The above placement and subscription agreements were approved in the Extraordinary General Meeting and the respective Class Meetings of shareholders of A and H shares on April 30, 2010. On September 8, 2010, the Company received the formal approval from CSRC for the proposed non-public issue of H Shares. On September 15, 2010, the Company received the formal approval from CSRC for the proposed non-public issue of A Shares. In November 2010, the Company completed the placements of 1,501,500,000 new A shares and 312, 500,000 H shares, among which 123,900,000 new A shares were issued to CSAHC at the subscription price of RMB6.66 per share, and 312,500,000 H shares were issued to Nan Lung at the subscription price of HKD2.73 per share.
Issuance of Short-term Financing Bills and Medium Term Notes
On April 18, 2008, the Company’s Board approved the proposed issue of short-term financing bills in the principal amount of up to RMB4 billion in the PRC, and the submission of this proposal to the annual general meeting for the shareholders’ approval. On June 25, 2008, shareholders of the Company approved such proposed bill issue at the annual general meeting for the year 2007. The Company believes that the bill issue will provide a further source of funding at an interest rate which is expected to be lower than that for loans from commercial banks, lower the financing cost of borrowings for the Company, and is in the interests of the Company and its shareholders as a whole. The Company has received the acceptance from National Association of Financial Market Institutional Investors to register the Company’s short-term financing bills in the amount of RMB3.5 billion for a period up to September 10, 2010. The bills were jointly underwritten by China CITIC Bank Cooperation Limited and Bank of China Limited. In October 2008, the Company issued short-term financing bills with total face value of RMB2 billion, bearing coupon interest rate at 4.7% with a maturity period of one year for funding of the business activities of the Company.
19
On May 28, 2008, the Board approved the proposed issue of medium term notes by the Company in the principal amount of up to RMB1.5 billion and the submission of such proposal to the shareholders for their consideration and approval. On June 25, 2008, shareholders of the Company approved such notes issue at the annual general meeting for the year 2007. The Company believes that the notes issue will provide a further source of medium to long term funding at an interest rate lower than the best lending rate for loans from commercial banks, lower the finance costs of borrowings for the Company and improve the debt structure of the Company. As of the date of this Annual Report, the Company has not issued any medium term notes as approved by the Board and shareholders.
Traffic
The following table sets forth certain statistical information with respect to the Group’s passenger, cargo and mail traffic for the years indicated.
|
Passenger carried
|
Cargo and Mail
Carried (tons)
|
Total traffic
(tons kilometers)
|
||||||||||||||||||||||
|
Year
|
Total
(in millions)
|
Increase
(decrease)
over
previous
year (%)
|
Total
(in
thousands)
|
Increase
(decrease)
over
previous
year (%)
|
Total
(in millions)
|
Increase
(decrease)
over
previous
year (%)
|
||||||||||||||||||
|
2008
|
58.24
|
2.3
|
835.0
|
(4.2
|
)
|
9,200.0
|
(0.5
|
)
|
||||||||||||||||
|
2009
|
66.28
|
13.8
|
862.0
|
3.2
|
10,067.0
|
9.4
|
||||||||||||||||||
|
2010
|
|
|
76.46
|
|
|
|
15.4
|
|
|
|
1,117.0
|
|
|
|
29.6
|
|
|
|
13,104.0
|
|
|
|
30.2
|
|
Route Network
Overview
The Group operates the most extensive route network among the Chinese airlines. As of December 31, 2010, the Group operated 778 routes consisting of 624 domestic routes, 40 regional routes and 114 international routes.
The Group continually evaluates its network of domestic, regional and international routes in light of its operating profitability and efficiency. The Group seeks to coordinate flight schedules with the Airline Subsidiaries on shared routes to maximize load factors and utilization rates. The acquisition of domestic, regional and international routes is subject to approval of the CAAC, and the acquisition of regional and international routes is also subject to the existence and the terms of agreements between the Chinese government and the government of the Hong Kong SAR, the government of the Macau SAR, the government of Taiwan province and the government of the proposed foreign destination.
In order to expand the Group’s international route network, the Group has entered into code-sharing agreements with several international airlines, including Delta Airlines, Asiana Airlines, Korean Air, Japan Air System, Vietnam Airlines, Air France, KLM Royal Dutch Airlines, Garuda Indonesian, Malaysian Airline, KENYA AIRWAYS, Pakistan International Airlines, Aeroflot-Russian Airlines and CSA Czech Airlines. Under the code sharing agreements, the participating airlines are permitted to sell tickets on certain international routes operated by the Group to passengers using the Group’s codes. Similarly, the Group is permitted to sell tickets for the other participating airlines using its “CZ” code. The code sharing agreements help increase the number of the Group’s international sales outlets. After joining Skyteam Alliance, the Group has further established a network reaching 898 destinations globally, connecting 169 countries of regions and covering major cities around the world.
Route Bases
In addition to its main route bases in Guangzhou and Beijing, the Group maintains certain regional route bases in Zhengzhou, Wuhan, Changsha, Shenzhen, Shenyang, Changchun, Dalian, Harbin, Urumqi, Haikou, Zhuhai, Xiamen, Shanghai, Xi’an, Fuzhou, Nanning, Guilin, Shantou, Guiyang, Chongqing and Sanya. Most of its regional route bases are located in provincial capitals or major commercial centers in the PRC.
The Group believes that its extensive network of route bases enable it to coordinate flights and deploy its aircraft more effectively and to provide more convenient connecting flight schedules and access service and maintenance facilities for its aircraft. The Group believes that the number and location of these route bases may enhance the Group’s ability to obtain the CAAC’s approval of requests by the Group to open new routes and provide additional flights between these bases and other destinations in China. Current regulations of the CAAC generally limit airlines to operations principally conducted from their respective route bases.
20
Domestic Routes
The Group’s domestic routes network serves substantially all provinces and autonomous regions in China, including Guangdong, Fujian, Hubei, Hunan, Hainan, Guangxi, Guizhou, Henan, Heilongjiang, Jilin, Liaoning and Xinjiang, and serves all four centrally-administered municipalities in China, namely, Beijing, Shanghai, Tianjin, and Chongqing. In 2010, the Group’s most profitable domestic routes were between: Guangzhou-Beijing, Beijing-Guangzhou, Shenzhen-Beijing, Guangzhou-Shanghai, Shanghai-Guangzhou, Beijing-Shenzhen, Shenzhen-Shanghai, Xiamen-Shanghai, Shanghai-Shenzhen, and Urumqi-Beijing.
Regional Routes
The Group offers scheduled service between Hong Kong and Guangzhou, Shenyang, Wu Yi Shan, Changchun, Xiamen, Shantou, Beijing, Guilin, Meixian, Haikou, Wuhan, Zhengzhou, Zhanjiang, Nanning, Changsha, Sanya and Hohhot; between Macau and Hangzhou, Xiamen and Quanzhou; between Taipei and Guangzhou, Shanghai, Fuzhou, Hangzhou, Xiamen, Shenyang, Changsha, Wuhan, Dalian, Guilin, Harbin, Guiyang, Zhengzhou and Shenzhen; between Hualien and Fuzhou, Xiamen; between Kaohsiung and Fuzhou, Xiamen; between Taichung and Xiamen. In 2010, the most profitable scheduled regional routes were between: Wu Yi Shan-Xiamen-Hong Kong, Taipei-Shanghai, Shanghai-Taipei, Fuzhou-Taipei, Taipei-Guangzhou, Guangzhou-Taipei, Xiamen-Hong Kong, Xiamen-Taipei, Hong Kong-Beijing, and Changchun-Guangzhou-Hong Kong.
In 2010, the Group conducted a total of 13,361 flights on its regional routes, accounting for approximately 23.39% of all passengers carried by Chinese airlines on routes between Hong Kong, Macau or Taiwan and destinations in China according to CAAC statistics.
Previously, direct flights between Taiwan and Mainland China had only been available during certain festivals. And travelers between Taiwan and Mainland China have had to make use of intermediate stops in Hong Kong or elsewhere. Since July, 2008, however, the ban on direct flights has been further liberalized to allow direct charter flights on weekends. The Company became the first Chinese carrier to fly nonstop to Taiwan. On November 4, 2008, the Mainland China and Taiwan agreed to regular direct passenger charter flights across the Taiwan Strait. On August 31, 2009, the Mainland China and Taiwan increased the number of regular cross-Strait direct passenger flights from 108 to 270 a week. The 108 direct passenger flights previously operating were all classed as charter flights. The new services comprise both regular charter and scheduled flights.
In order to further strengthen its presence in Taiwan, on June 23, 2008, the Company entered into a memorandum of cooperation with China Airlines, which is the largest carrier in Taiwan in terms of route network. Based on the memorandum, the scope of cooperation between the parties will cover passenger and cargo carrying, maintenance, and ground handling services.
International Routes
The Group is the principal Chinese airline serving Southeast Asian destinations, including Singapore and major cities in Indonesia, Thailand, Malaysia, the Philippines, Vietnam, Myanmar and Cambodia.
In addition, the Group also provides scheduled services to the cities in Australia, Austria, Bangladesh, France, Germany, India, Japan, Kazakhstan, Maldives, Korea, Kyrgyzstan, Nepal, Netherlands, Nigeria, Pakistan, Russia, Saudi Arabia, Tajikistan, Turkmenistan, UAE and USA.
After joining Skyteam Alliance, the Group has established a network reaching 898 destinations globally, connecting 169 countries of regions and covering major cities around the world.
In 2010, the Group’s most profitable international routes were: Guangzhou-Sydney, Guangzhou-Beijing-Amsterdam, Tianjin-Xiamen-Singapore, Guangzhou-Los Angeles, Guangzhou-Tokyo, Guangzhou-Osaka, Amsterdam-Beijing-Guangzhou, Tokyo-Guangzhou, Beijing-Guangzhou-Phnom Penh, and Hangzhou-Fuzhou- Singapore.
Aircraft Fleet
The Group’s fleet plan in recent years has emphasized expansion and modernization through the acquisition of new aircraft and the retirement of less efficient, older aircraft. As of December 31, 2010, the Group operated a fleet of 422 aircraft with an average age of 6.36 years. Most aircraft of the Group are Boeing and Airbus aircraft. The Group has the largest fleet among Chinese airline companies. Among all the aircraft, 209 aircraft operated by the Group are leased pursuant to various types of leasing arrangements.
The following table sets forth certain information regarding the Group’s fleet of 422 aircraft as of December 31, 2010.
21
|
Model
|
Number of
Aircraft
|
Average age
(years)
|
Average
Passenger
Capacity
|
|||||||||
|
Boeing 777-200A
|
4 | 14.72 | 373 | |||||||||
|
Boeing 777-200B
|
6 | 12.37 | 282 | |||||||||
|
Boeing 757-200
|
25 | 12.17 |
192/197/204
|
|||||||||
|
Boeing 747F
|
2 | 8.54 | n/a | |||||||||
|
Boeing 737-800
|
95 | 3.55 |
160/163/170
|
|||||||||
|
Boeing 737-700
|
46 | 6.32 |
120/128/138
|
|||||||||
|
Boeing 737-300
|
25 | 16.37 | 137/145 | |||||||||
|
Boeing 777F
|
5 | 0.70 | n/a | |||||||||
|
Airbus 319-100
|
44 | 4.38 | 121 | |||||||||
|
Airbus 300-600
|
4 | 16.29 | 271 | |||||||||
|
Airbus 320-200
|
69 | 5.72 | 151/156 | |||||||||
|
Airbus 321-200
|
57 | 3.08 | 178/182 | |||||||||
|
Airbus 330-200
|
9 | 3.63 | 216/256 | |||||||||
|
Airbus 330-300
|
8 | 2.59 | 283 | |||||||||
|
McDonnell Douglas 90
|
12 | 13.25 | 154 | |||||||||
|
Embraer 145 Jet
|
6 | 6.32 | 50 | |||||||||
|
ATR-72
|
5 | 13.59 | 57 | |||||||||
|
Total
|
422 | |||||||||||
In 2010, the Group continued to expand and modernize its aircraft fleet. During the year, the Group: (i) took scheduled delivery of fifty-two aircraft, including three A330-200 aircraft, sixteen A320-200 aircraft, seventeen A321-200 aircraft, two B737-800 aircraft, three B777F aircraft and eleven B737-800 aircraft; (ii) purchased one operating lease B757-200 aircraft; (iii) took scheduled delivery of two B737-800 aircraft under operating leases; (iii) returned five aircraft under operating leases upon expiry, including two B757-200 aircraft, one A320-200 aircraft and two B737-500 aircraft; (iv) disposed or reclassified five aircraft, including three MD82 aircraft, one MD90 aircraft and one A300-600 aircraft.
In 2010, the Company entered into three agreements for the acquisition of twenty A320 aircraft, six A330-300 aircraft and thirty A320 aircraft respectively. Xiamen Airlines entered into one purchase agreement for the acquisition of ten B737-800 aircraft. Aircraft under those acquisition agreements are scheduled for delivery during the period from 2011 to 2016.
Aircraft Financing Arrangements
Overview
A significant portion of the Group’s aircraft is acquired under long-term capital or operating leases or long-term mortgage loans with remaining terms to maturity ranging from one to twelve years. As of December 31, 2010, 65 of the Group’s 422 aircraft were operated under capital leases, 144 were operated under operating leases, 87 were financed by long-term mortgage loans, while the remaining were acquired either with cash proceeds or acquired by exercising the purchase options upon expiry of the respective capital leases. The Group’s planned acquisition of aircraft in the foreseeable future will generally be made through acquisition by bank loans and the Group’s own funds, and pursuant to operating leases or capital leases. The Group’s determination as to its acquisition strategy depends on the Group’s evaluation at the time of its capacity requirements, anticipated deliveries of aircraft, the Group’s capital structure and cash flow, prevailing interest rates and other general market conditions.
The following table sets forth, as of December 31, 2010, the number of aircraft operated by the Group pursuant to capital and operating leases and the remaining terms, expressed in years, of such leases.
|
Model
|
Capital
Lease
|
Operating
Lease
|
Average
Remaining
Lease Term
|
|||||||||
|
Boeing 777-200A and 777-200B
|
0
|
4
|
1.93
|
|||||||||
|
Boeing 757-200
|
0
|
5
|
0.87
|
|||||||||
|
Boeing 737-700
|
9
|
15
|
4.37
|
|||||||||
|
Boeing 737-800
|
12
|
42
|
5.10
|
|||||||||
|
Boeing 737-300
|
0
|
4
|
1.34
|
|||||||||
|
Boeing 777F
|
2
|
0
|
8.90
|
|||||||||
|
Airbus 319-100
|
6
|
30
|
5.19
|
|||||||||
|
Airbus 320-200
|
18
|
14
|
6.61
|
|||||||||
|
Airbus 321-200
|
13
|
20
|
7.98
|
|||||||||
|
Airbus 330-200
|
5
|
2
|
7.54
|
|||||||||
|
Airbus 330-300
|
0
|
8
|
9.66
|
|||||||||
|
Total
|
65
|
144
|
||||||||||
22
Capital leases
The majority of the capital leases in respect to aircraft and related equipment have terms of ten to twelve years expiring during the years 2011 to 2022. As of December 31, 2010, the Group’s aggregate future minimum lease payments (including future finance charges) required under its capital leases were RMB15,921 million. The Group’s capital leases typically cover a significant portion of the relevant aircraft’s useful life and transfer the benefits and risks of ownership to the Group. Under its capital leases, the Group generally has an option to purchase the aircraft at or near the end of the lease term. As is customary in the case of capital leases, the Group’s obligations are secured by the related aircraft, as well as other collateral.
Operating Leases
As of December 31, 2010, the Group’s aggregate future minimum lease payments required under its operating leases were RMB 25,977 million. As of the year end of 2010, the Group’s operating leases had original terms generally ranging from five to fifteen years from the date of delivery of the relevant aircraft, and the remaining terms of these leases ranged from one to eleven years. Pursuant to the terms of the operating leases, the Group is obligated to make rental payments based on the lease term, with no termination payment obligations or purchase option, and the lessor bears the economic benefits and risks of ownership. Under its operating leases, the Group has no option to purchase the aircraft and is required to return the aircraft in the agreed condition at the end of the lease term. Although title to the aircraft remains with the lessor, the Group is responsible during the lease term for the maintenance, servicing, insurance, repair and overhaul of the aircraft.
For capital leases or operating leases, the Group is obligated to indemnify the lessors against any withholding or similar taxes that may be imposed on the lessors by taxing authorities in China with regard to payments made pursuant to such leases. In accordance with relevant PRC tax regulations, a PRC lessee is liable to withhold PRC withholding tax in respect of any lease payments regularly made to an overseas lessor. Depending on the circumstances, this tax is generally imposed at a fixed rate ranging from 5% to 12% of the lease payments, or in certain cases, the interest components of such payments for capital lease. The PRC withholding tax payable in respect of the lease arrangements amounting RMB318 million, RMB198 million and RMB142 million during 2010, 2009 and 2008, respectively, have been included as part of the lease charges.
In August 2008, Xiamen Airlines, a subsidiary of the Company entered into an operating lease agreement with GE Commercial Aviation Services, which has been approved by the Board of the Company on August 18, 2008. Pursuant to the agreement, Xiamen Airlines plans to lease seven Boeing B737-800 aircraft by way of operating lease. The term of the lease is eight years from 2011 to 2019, with the price for the operating lease to be determined by the two parties with reference to the prevailing market price. The Board believes that the introduction of new aircraft under the operating lease is beneficial to the implementation of the Group’s development strategy, will improve the Group’s operating capacity to accommodate the continuous growth in demand for aviation services in the PRC, serve passengers with better services, and enhance the competitiveness of the Group.
Aircraft Flight Equipment
The jet engines used in the Group’s aircraft fleet are manufactured by General Electric Corporation, Rolls-Royce plc, United Technologies International, Inc., CFM International, Inc. and International Aviation Engines Corporation. The Group had 63 and 69 spare jet engines for its fleet as of the year end of 2010 and 2009, respectively. The Group determines its requirements for jet engines based on all relevant considerations, including manufacturers’ recommendations, the performance history of the jet engines and the planned utilization of its aircraft. Acquisition of rotables and certain of the expendables for the Group’s aircraft are generally handled by Southern Airlines (Group) Import & Export Trading Corporation (“SAIETC”), a subsidiary of CSAHC acting as agent for the Group, in consideration of an agency fee. The Group arranges the ordering of aircraft, jet engines and other flight equipment for the Airline Subsidiaries and keeps an inventory of rotables and expendables for the Airline Subsidiaries.
Aircraft Maintenance
A major part of the maintenance for the Group’s fleet other than overhauls of jet engines is performed by GAMECO, a jointly controlled entity established by the Company, Hutchison Whampoa (“Hutchison”) and South China International Aircraft Engineering Company Limited, consistent with the Group’s strategy to achieve fully integrated airline operations and to assure continued access to a stable source of high quality maintenance services. The remaining part of the maintenance for the Group’s fleet other than overhauls of jet engines is performed by service providers in China and overseas. GAMECO performs all types of maintenance services, ranging from maintenance inspections performed on aircraft (“line maintenance services”) to major overhaul performed at specified intervals. GAMECO was the first of three aircraft maintenance facilities in China having been certified as a repair station by both the CAAC and the Federal Aviation Administration. In March 1998, GAMECO received an approval certificate from the United Kingdom Civil Aviation Authority for the repair and maintenance of aircraft and aircraft engines.
The Group believes that GAMECO performs major maintenance checks on the Group’s aircraft within time periods generally consistent with those of large international airline maintenance centers. GAMECO’s repair and maintenance capacity include overhaul of more than 70% of the Group’s aircraft. Although rotables for the Group’s aircraft are generally imported through SAIETC, a portion of expendables and other maintenance materials are directly imported by GAMECO. GAMECO also provides line maintenance services to 13 other Chinese airlines and
22 international airlines. GAMECO provides heavy maintenance services to 8 other Chinese airlines and 15 international airlines
23
The Company and GAMECO had entered into an Aircraft Maintenance and Engineering Agreement for the provision of aircraft repair and maintenance services. On May 17, 1996, the Company and GAMECO entered into an agreement regarding the fee arrangement for the provision of such repair and maintenance services.
Overhauls of jet engines are performed by Zhuhai MTU, a former jointly controlled entity of the Company and MTU Aero Engines GmbH, and also by overseas qualified service providers in Germany, Malaysia, Canada and England. On September 28, 2009, the Company entered into an agreement with CSAHC to dispose of its 50% equity interest in Zhuhai MTU to CSAHC at a consideration of RMB1,607,850,000. The transfer was completed in February 2010.
The amounts incurred by the Group for comprehensive maintenance services provided by GAMECO and Zhuhai MTU were RMB1,742 million, RMB1,344 million, and RMB1,129 million for the three years ended December 31, 2010, 2009 and 2008, respectively.
Safety
The Group endeavors to maintain strict compliance with all laws and regulations applicable to flight safety. In addition, the Group has adopted measures to eliminate or minimize factors that may impair flight safety, including specialized training programs and safety manuals. The Air Safety Management Department of the Company implements safety-related training programs on an ongoing basis in all of the Group’s operations to raise the safety awareness of all employees. As a result, overall flight safety has gradually improved. There were no serious incidents involving casualty or flight damage throughout the three years ended December 31, 2010. For minor “incidents” which include various events and conditions prescribed by the CAAC which do not involve serious personal injury or material damage to flight equipment, the Group has kept the number consistently below the standard prescribed by the CAAC. For example, the Company’s “Accident Signs Per Ten Thousands Hours Ratio” was 0.008, 0.089 and 0.064 in 2010, 2009 and 2008, respectively. In comparison, CAAC’s published maximum acceptable Accident Signs Per Ten Thousands Hours Ratio was 0.6, 0.6, 0.6 in 2010, 2009 and 2008, respectively. This ratio is defined as the occurrence of one incident for every 10,000 hours of flight time. In 2010, the Group strengthened its flight safety management as per the internal and external safety requirements. In 2008, the Group received the “Five-Star Flight Safety Award” from CAAC, making it the first in the aviation industry to receive such a great honor. By December 2010, the Company’s continuous safe flight span totaled to 7.71 million hours.
Jet Fuel
Jet fuel costs typically represent a major component of an airline’s operating expenses. The Group’s jet fuel costs accounted for 33.2%, 29.6% and 37.4% of the Group’s operating expenses for the years ended December 31, 2010, 2009 and 2008, respectively. Like all Chinese airlines, the Group is generally required by the Chinese government to purchase its jet fuel requirements from regional branches of CAOSC and Bluesky Oil Supplies Company, except at the Shenzhen, Zhuhai, Sanya, Haikou, Shanghai Pudong and other small airports where jet fuel is supplied by Sino-foreign joint venture in which CAOSC is a joint venture partner. CAOSC is a State-owned organization controlled and supervised by the CAAC that controls the importation and distribution of jet fuel throughout China.
Jet fuel obtained from CAOSC’s regional branches is purchased at uniform prices throughout China that are determined and adjusted by CAOSC from time to time with the approval of the CAAC and the pricing department of the NDRC based on market conditions and other factors. As a result, the costs of transportation and storage of jet fuel in all regions of China are spread among all domestic airlines. Jet fuel costs in China are influenced by costs at State-owned oil refineries and limitations in the transportation infrastructure, as well as by insufficient storage facilities for jet fuel in certain regions of China.
Prior to 1994, domestic jet fuel prices were generally below international jet fuel prices. The Chinese government had gradually increased domestic jet fuel prices in order to reflect more accurately the costs of supplying jet fuel in China. As a result, domestic jet fuel prices have become higher than those in the international market since the beginning of 1994. In 2007 through the first half of 2008, the crude oil prices in the international market reached historic highs. In response to the pressure imposed by such rocketing prices, on November 1, 2007 and June 20, 2008, respectively, NDRC increased the domestic price for jet fuel. Thereafter, in order to cushion fuel cost pressure faced by Chinese airlines, on December 19, 2008 and January 1, 2009, respectively, NDRC approved reductions in domestic prices for jet fuel. However, starting from February 2009, the crude oil price in the international market started to pick up gradually. As a result, NDRC increased the domestic price for jet fuel in July 2009 and made several subsequent adjustments thereafter. The NDRC further adjusted domestic price for jet fuel for multiple times in 2010, which have resulted in an increase in the price.
Jet fuel costs increased from RMB16, 390 million in 2009 to RMB23,492 million in 2010 as a result of greater consumption of jet fuel and increase in average jet fuel price by 19.6%.
In addition to purchases of jet fuel from CAOSC, the Group is also permitted by the Chinese government to purchase a portion of its jet fuel requirements for its international flights from foreign fuel suppliers located outside China at prevailing international market prices. Jet fuel purchased from such sources outside China accounted for approximately 9% and 7% of the Group’s total jet fuel consumption in 2010 and 2009, respectively.
24
Fuel Surcharge
According to the relevant regulations promulgated by the NDRC and the CAAC, domestic airlines imposed fuel surcharges for all the domestic routes (excluding those from the mainland PRC to Hong Kong and Macau) with effect from August 1, 2005 (based on flight time). The imposition of the fuel surcharge helped relieve, to a certain extent, the burden of high jet fuel cost, on the Group. The level of fuel surcharges, and any adjustment of which, are determined by CAAC and NDRC based on such factors as jet fuel price, route miles and the location of destination. Due to the downward trend in domestic fuel prices, on December 19, 2008, the CAAC and the NDRC decided, on December 25, 2008, to reduce fuel surcharges for both domestic and international routes. Thereafter, the CAAC and the NDRC called for a stop on imposing fuel surcharges for domestic routes by Chinese airlines with effect from January 15, 2009. Such suspension on imposing fuel surcharge lasted until November 2009. As international fuel prices gradually pick up, and in response to rises in the fuel cost, on November 11, 2009, the NDRC issued a notice to introduce a new pricing mechanism of fuel surcharge that links it with airlines’ jet fuel costs. According to the new mechanism, when the purchase cost of jet fuel is lower than RMB 4,140 per ton (i.e., the benchmark price of jet fuel), airlines should not charge fuel surcharge. When the purchase cost of jet fuel exceeds RMB 4,140 per ton, the airlines may charge appropriate fuel surcharge provided that such airlines should digest at least 20 percent of the rising cost. As such, following a suspension period of almost one year, in November 2009, the Group resumed the imposing of fuel surcharges for domestic routes. The NDRC has recently lowered the rate of fuel surcharge from 0.00002818 per km to 0.00002691 per km, starting from April 1, 2011 to March 31, 2012. Based on that rate, for every RMB100 by which the cost of jet fuel exceeds RMB 4,140 per ton, the airlines are allowed to charge RMB0.002691 per km for the flight distance.
Flight Operations
Flight operations for the Group’s flights originating in Guangzhou are managed by the Company’s flight operations and marketing divisions, which are responsible for formulating flight plans and schedules consistent with route and flight approvals received from the CAAC. The Company’s flight operations center in Guangzhou is responsible for the on-site administration of flights, including the dispatch and coordination of flights, deployment of aircraft, ground services and crew staffing. In addition, each of the Airline Subsidiaries maintains flight operations centers at all servicing airports for on-site administration of their flights. The Company’s general dispatch offices are responsible for monitoring conditions on the Group’s route network, administering the Group’s flight plans, collecting and monitoring navigation data and analyzing and monitoring airport conditions.
To enhance its management of flight operations, the Group’s computerized flight operations control system (SOC) began operation in May 1999. The system utilizes advanced computer and telecommunications technology to manage the Group’s flights on a centralized, real-time basis. The Group believes that the system will assist it to (i) compile flight schedules more efficiently; (ii) increase the utilization of aircraft; (iii) allow real-time tracking of all of the Group’s flights; and (iv) improve coordination of the Group’s aircraft maintenance and ground servicing functions.
Training of Pilots and Flight Attendants
The Group believes that its pilot training program which was established in cooperation with the CAAC affiliated Beijing Aeronautics and Aviation University (the “BAAU”) has significantly improved the quality of the training received by the Group’s pilots and has helped maintain the quality of the Group’s staff of pilots at a level consistent with the expansion of operations called for by the Group’s business strategy.
In the Group’s pilot training program, trainees have two years of theoretical training at the BAAU. After successful completion of academic and physical examinations, the trainees receive flight training for a period of approximately 20 months at Australian Pilot College, a company that is 48.12% owned by the Company, 4.76% owned by CSAHC and 47.12% owned by a third party investor. Each trainee at the Australian Pilot College is required to fly at least 230 hours before being awarded a flight certificate. Graduates of the BAAU and the Australian Pilot College are hired by the Group as trainee pilots after passing a CAAC-administered examination to obtain a pilot license. The total training period for the Group’s trainee pilots is approximately four years. The Group has about 1,979 trainees as of April 21, 2011, about 600 trainees are expected to graduate in 2011.
As part of the pilot training program, trainee pilots receive their initial training in the operation of a specific aircraft with Zhuhai Xiang Yi Aviation Technology Company Limited (“Zhuhai Xiang Yi”), a jointly controlled entity between the Company and CAE International Holdings Limited, which also provides training to pilots from other Chinese airlines. Zhuhai Xiang Yi is equipped with simulators for all models of aircraft currently operated by the Group and provides flight simulation training services to the Group.
The Group’s pilots are required to be licensed by the CAAC, which requires an annual recertification examination. The Group’s pilots attend courses in simulator training twice annually and in simulator emergency procedures annually. The Group also conducts regular advanced training courses for captains and captain candidates. Pilots advance in rank based on number of hours flown, types of aircraft flown and their performance history.
The Group used to fund the training of its recruited pilots in previous years and, as a result, incurred significant costs over the years. Recently, there has been a trend in the financing of pilot training worldwide from employer-sponsored to self-sponsored scheme. Such a change will not only cut down the Group’s training expenses significantly, but also ensures the long-term dedicated service of the pilots. Starting from 2007, the Group began to recruit pilots under the self-sponsored training arrangement. On December 5, 2007, August 27, 2008, August 27, 2009, and August 26, 2010, the Board approved the Company to provide a guarantee with joint liability for the loans incurred under the self-sponsored pilot training program in an aggregate amount of RMB90,858,000, not more than RMB213,600,000, not more than RMB184,750,000 and not more than RMB179,269,600, respectively. On December 29, 2009, Xiamen Airlines, a then 60%-owned subsidiary of the Company agreed to provide a guarantee with joint liability for the loans incurred under the partial self-sponsored pilot training program in an aggregate amount of not more than RMB100 million covering a period till December 31, 2011. As of December 31, 2010, the Group has provided a guarantee with joint liability for the loans of such self-sponsored pilots in an aggregate amount of RMB249,972,000, under which an aggregate of personal bank loans of RMB150,849,821 were drawn down from the banks. During the year, the Group has made repayments of RMB2,000,000 due to the default of payments of certain pilot trainees.
25
Under the program, the self-sponsored pilots are bound to enter into service contracts with the Group when they finish their training courses. They have the choices to repay their loans in advance or in installments.
The Group conducts theoretical and practical training programs for its flight attendants at its Flight Attendants Training Center in Guangzhou (the “Guangzhou Training Center”). The Guangzhou Training Center is equipped with computerized training equipment, as well as simulator cabins for all models of aircraft currently operated by the Group. At the Guangzhou Training Center, flight attendants of the Group receive comprehensive training in areas such as in-flight service, emergency evacuation and water rescue.
Ground Services
The Group makes arrangements with airport authorities, other airlines or ground services companies for substantially all ground facilities, including jet-ways, waiting areas, ticket counters and support services buildings, at each airport that it serves. The Group pays landing, parking and other fees to such airports, including Guangzhou Baiyun Airport. At domestic airports, such fees are generally determined by the CAAC.
At Guangzhou Baiyun Airport, the Group operates its own passenger check-in, cargo, mail and baggage handling, aircraft maintenance and cleaning services. The Group also provides such services to other airlines that operate in Guangzhou Baiyun Airport.
Ground services at the airports in Shenzhen, Changsha, Wuhan, Zhengzhou, Haikou, Zhuhai, Xiamen, Fuzhou, Guilin, Shantou, Guiyang and Beihai are primarily operated directly by the Group. Ground services at the airport in Beijing are primarily provided by Beijing Ground Service, which became a wholly-own subsidiary of the Company in June 2009. Ground services at other airports in China are provided to the Group by local airport authorities or local airlines pursuant to various service agreements. Ground services and other services at airports outside China are provided to the Group by foreign services providers pursuant to various service agreements with such parties. All such agreements of the Group are short-term and otherwise on terms that are customary in the industry.
Air Catering
The Company owns a 55% equity interest in Guangzhou Nanland Air Catering Company Limited (“Nanland”) as of December 31, 2010. Nanland provides in-flight meals, snacks, drinks and related services for all of the Group’s flights originating in Guangzhou and substantially all other flights departing from Guangzhou Baiyun Airport. The Group contracts with various air catering suppliers with respect to in-flight catering services for flights originating from other airports, generally on an annual basis and otherwise on terms that are customary in the industry.
In order to optimize assets structure, tighten cost control, reduce the number of connected transactions and enhance the independence of operations in the long-run, the Company acquired 100% interest in China Southern Airlines Group Air Catering Company Limited (“SAG Air Catering”) on August 31, 2007 from CSAHC. SAG Air Catering provides in-flight meals for flights of the Company originating or stopping at domestic airports, mainly in northern China and Xinjiang regions.
Cargo and Mail
The Group also provides air cargo and mail services. A significant portion of these services are combined with passenger flights services. Currently, the Group has two Boeing 747 freighters, five Boeing 777 freighters and one A300-600, mainly servicing six international cargo routes, Shanghai to Amsterdam, Frankfurt, Vienna, Los Angeles, Chicago and Guangzhou to Amsterdam.
Currently, the Group conducts its cargo business primarily through its cargo division in Guangzhou and Shanghai.
Sales, Reservations and Marketing
Passenger Ticket Sales and Reservations
The Group’s ticket sales and reservations are conducted by or through independent sales agents and the Group’s own network of exclusive sales offices as well as the CAAC’s sales offices and CSAHC’s associates. The Group has sales offices in Guangzhou and its other route bases. In addition, the Group maintains regional sales offices in other cities in China, including Beijing and Shanghai. The Group maintains international sales offices in Almaty, Amsterdam, Ashkhabad, Baku, Bangkok, Bishkek, Brisbane, Busan, Chicago, Daegu, Daejeon, Delhi, Dubai (Sharjah), Dushanbe, Frankfurt, Fukuoka, Hanoi, Hiroshima, Ho Chi Minh City, Islamabad, Irkutsk, Jakarta, Jeddah, Kathmandu, Khabarovsk, Kitakyushu, Kuala Lumpur, Los Angeles, Manila, Melbourne, Moscow, Nagoga, Niigata, Novosibirsk, Osaka, Osh, Paris, Penang, Phnom Penh, Sapporo, Sendai, Seoul, Siem Reap, Singapore, Sydney, Tashkent, Tehran, Tokyo, Toyama, Vladivostok and Yangon.
26
The Group has agency agreements with airlines in the Asia-Pacific region, Europe, the United States and Africa for the processing of ticket sales and reservations on a reciprocal basis. In 2010, approximately 9.69% of all ticket sales for the Group’s scheduled flights were made by the Group’s network of sales offices and CSAHC’s associates. The Group also sells tickets and accepts reservations through an extensive network of non-exclusive independent sales agents. Under the agency agreements with these sales agents, the Group pays commissions based on the value of tickets sold. The Group pays independent sales agents a commission of 3%-9% of the ticket price. Sales agents are typically permitted to withhold their commission from the proceeds of ticket sales that are remitted to the Group. In 2010, independent sales agents accounted for approximately 90.31% of the Group’s ticket sales for its scheduled flights.
Substantially all of the Group’s sales offices and agents in China are linked electronically to the CAAC’s computerized ticketing and reservations system, which is in turn linked to all domestic airlines for flights throughout China. The Group has also entered into membership agreements with several international reservation systems, including ABACUS in Southeast Asia, SABRE and GALILEO in the United States, AMADEUS in Europe and INFINI in Japan. These systems facilitate reservations and sales of tickets for the Group’s international flights. During 2008, the Group further improved and optimized its online sales network, and launched Tencent sales counters in cooperation with Tencent Technology Limited, thus expanded the consumer sales network of the Group. Meanwhile, the Group upgraded and reconstructed the SMS platform, and launched the “95539” services hotlines, which provide SMS information services on mileage, flight schedule, flight status, and air ticket price.
Cargo
The Group’s cargo and mail services are promoted through its own cargo divisions and independent cargo agents both within and outside China that track available space among all airlines. In particular, the Group employs a number of cargo agents in the Pearl River Delta region. The Group generally pays such agents a commission of 2% - 4% of the relevant cargo freight rate for domestic and international services.
Promotional and Marketing Activities
The Group engages in regular promotional and marketing activities in an effort to increase its market share. The Group’s promotional and marketing activities for domestic routes emphasize safety, passenger comfort and the frequency of the Group’s flights. The Group’s promotional and marketing activities for international and regional passengers emphasize the Group’s quality of service, extensive route network in China and greater frequency of flights relative to other Chinese airlines. The Group is among the first to launch high-end economy class of seating. In addition, the Group also promotes and markets its regional and international routes on the basis of price.
The Group has been seeking to increase its name recognition by offering new services to passengers. For example, the Group was the first Chinese airline to provide off-airport check-in services. The Group also offers transfer and baggage “through-handling” services to passengers connecting to other airlines, including passengers connecting in Hong Kong for flights to Taiwan. The Group widened its use of information technology and introduced new services such as cell phone check-in, and SMS platforms. During the Beijing Olympic Games, the Group launched a special promotion known as “Welcome the Olympic Games with Gold Medal Services” and successfully fulfilled its duties to deliver quality services for the Beijing Olympic Games and Paralympics Games. In 2010, the Group successfully completed its missions to delivery quality services for the 16th Asian Games held in Guangzhou and the World Exposition Shanghai.
On the wake of permitted direct flights on weekends between Taiwan and Mainland China starting from July 4, 2008, the Company became the first Chinese carrier to fly nonstop to Taiwan. By taking advantage of such further liberalized air travel policy between Taiwan and Mainland China, the Company has taken measures to explore opportunities presented by and increase its name recognition in Taiwan market. On June 23, 2008, the Company entered into a memorandum of cooperation with China Airlines, which is the largest carrier in Taiwan by route network. Based on the memorandum, the scope of cooperation between the parties will cover passenger, cargo, maintenance, and ground handling services. The Company believes that its strategic collaboration with China Airlines will be beneficial to both parities, expand their route network worldwide, increase their freight load factors, reduce labor and operating costs, and enhance the competitiveness of both airlines in the global air travel market.
To enhance relationships with its passengers, the Group has launched two frequent flyer programs, namely the “China Southern Airlines Sky Pearl Club”, and the “Egret Mileage Plus”. By the end of 2010, the Group had approximately 11,114,647 members under these programs.
Regulation
The Chinese commercial aviation industry is subject to a high degree of regulation and oversight by the CAAC. Regulations and policies issued or implemented by the CAAC encompass substantially all aspects of airline operations, including the approval of domestic, regional and international route allocation, published air fares, aircraft acquisition, jet fuel prices and standards for aircraft maintenance, airport operations and air traffic control. The Civil Aviation Law, which became effective in March 1996, provides a framework for regulation of many of these aspects of commercial aviation activities. Although China’s airlines operate under the supervision and regulation of the CAAC, they are accorded an increasingly significant degree of operational autonomy, including with respect to the application for domestic, regional and international routes, the allocation of aircraft among routes, the purchase of flight equipment, the pricing of air fares within a certain range, the training and supervision of personnel and their day-to-day operations.
27
As an airline providing services on international routes, the Group is also subject to a variety of bilateral civil air transport agreements that provide for the exchange of air traffic rights between China and various other countries. In addition, China is a contracting state, as well as a permanent member, of the International Civil Aviation Organization (the “ICAO”), an agency of the United Nations established in 1947 to assist in the planning and development of international air transport, and is a party to many other international aviation conventions. The ICAO establishes technical standards for the international aviation industry. The Group believes that it, in all material respects, complies with all such technical standards.
Route Rights
Domestic Routes
. The right of any Chinese airline to carry passengers or cargo on any domestic route must be obtained from the CAAC. Non-Chinese airlines are not permitted to provide domestic air service between destinations in China. The CAAC’s policy is to assign a domestic route to the Chinese airline that is best suited to serve the route based, in part, on the location of the airline’s main or regional base at the point of origin. Under current regulations, airlines are generally expected to operate mainly from their route bases, and flights within a particular region are expected to be served by airlines based in that region. The Group believes that these regulatory parameters benefit airlines, such as the Group, that have a large number of regional route bases. The CAAC also considers other factors that may make a particular airline suitable to operate a domestic route, including the applicant’s general operating authority, compliance with pricing regulations and regulations applicable to safety and service quality, market demand, the ability of the applicant in terms of its existing routes, and airport facilities and related support services.
The CAAC considers market conditions for a domestic route in determining whether the route should be allocated to one or more airlines. Generally, the CAAC requires the passenger load factor on certain route should be above the average rate of the whole market in the last flight season before additional flights and participants may be put on that route.
Regional Routes
. Hong Kong and Macau routes and landing rights are derived from agreements between the Chinese government and the government of the Hong Kong SAR, and between the Chinese government and the government of Macau SAR. Such rights are allocated by the CAAC among the four Chinese airlines permitted to fly to Hong Kong or Macau. The Group understands that the criteria for determining whether a Hong Kong and Macau route will be allocated to a particular airline include market demand, the ability of the airline to service the route and the appropriateness of the airline’s aircraft for such route.
A number of Hong Kong routes are operated by Chinese airlines on a “charter” flight basis. Permission to operate these flights is in theory subject to monthly review by the CAAC and the Hong Kong Civil Aviation Department. The CAAC has informally indicated that it primarily considers market demand and airline capability in granting permission for such flights.
Previously, direct flights between Taiwan and Mainland China had only been available during certain festivals. Since July 4, 2008, however, the ban on direct flights has been further liberalized to allow direct charter flights on weekends. On November 4, 2008, the Mainland China and Taiwan agreed to regular direct passenger charter flights across the Taiwan Strait. On August 31, 2009, the Mainland China and Taiwan extended the number of regular cross-Strait direct passenger flights from 108 to 270 a week. The 108 direct passenger flights previously operating were all classed as charter flights. The new services comprise both regular charter and scheduled flights. The Company became the first Chinese carrier to fly nonstop to Taiwan. Previously, travelers between Taiwan and Mainland China have had to make use of intermediate stops in Hong Kong or elsewhere.
International Routes
. International route rights, as well as the corresponding landing rights, are derived from air services agreements negotiated between the Chinese government, through the CAAC, and the government of the relevant foreign country. Each government grants to the other the right to designate one or more domestic airlines to operate scheduled service between certain destinations within each of such countries. Upon entering into an air services agreement, the CAAC determines the airline to be awarded such routes based on various criteria, including the availability of appropriate aircraft, flight and management personnel, safety record, the overall size of the airline, financial condition and sufficiency of assets to bear civil liabilities in international air services. These route rights may be terminated by the CAAC under special circumstances.
The criteria for determining whether an international route will be allocated to a second airline generally include (i) the terms of the relevant bilateral civil aviation agreement; (ii) consistency with overall national plans and the national interest and the enhancement of reasonable competition; and (iii) whether the international airports to be used are sufficient for the aircraft flown and employ security measures consistent with international standards.
In addition, if the relevant bilateral civil aviation agreement permits more than one Chinese airline to operate a particular international route, the CAAC will only permit a second airline to operate on such route if the number of passengers carried annually exceeds 100,000 and if there is a minimum average load factor of 68% for routes with at least five weekly flights by Chinese airlines, or 80% for routes with four or fewer weekly flights by Chinese airlines.
28
Air Fare Pricing Policy
Pursuant to “Pricing Reform of Domestic Civil Aviation” as approved by the State Council of the PRC effective on April 20, 2004, prices on domestic routes now fluctuate freely within a predetermined range. Instead of direct supervision by setting prices of air tickets through a local price bureau, the government now provides guidance on domestic flights and domestic civil aviation is controlled by the government indirectly. Market-oriented pricing policy was introduced and pricing system has been adjusted as a result of the above pricing reform.
Published air fares of Chinese airlines for the Hong Kong and Macau routes are determined by the CAAC and the relevant civil aviation authorities in Hong Kong or Macau, subject to consultation between the relevant Chinese airlines and Hong Kong or Macau airlines. Airlines may offer discounts on flights on their Hong Kong regional routes. With respect to the Taiwan routes, the air fares are currently determined by Chinese airlines at their own discretion and may be subject to certain pricing guidance to be issued by the CAAC in the future.
Published air fares of Chinese airlines for international routes are determined through consultation between the relevant Chinese airlines and foreign airlines in accordance with the civil aviation agreements between the Chinese government and the relevant foreign government, taking into account the international air fare standards established through the International Air Transport Association. All air fares for international routes must be approved by the CAAC. Discounting of published international air fares is permitted.
Acquisition of Aircraft and Flight Equipment
The CAAC requires all Chinese airlines to acquire their aircraft through China Aviation Supplies Import and Export Corporation (“CASC”), an entity controlled by the CAAC. If a Chinese airline plans to acquire an aircraft, the airline must first seek approval from the CAAC and NDRC. The airline must, as a condition of approval, provide specific acquisition plans, which are subject to modification by the CAAC and NDRC. If the CAAC and NDRC approve an aircraft acquisition, the airline negotiates the terms of the acquisition with the manufacturer together with CASC because CASC possesses the license required to import or export aircraft, and CASC receives a commission in respect thereof. Most Chinese airlines are also required to acquire their aircraft engines, spare parts and other flight equipment through CASC. The Company and a few other Chinese airlines are permitted to import jet engines and other flight equipment for their own use without the participation of CASC. In the case of the Company, SAIETC acts as its import agent and is paid an agency fee for its services.
Jet Fuel Supply and Pricing
CAOSC and Bluesky Oil Supplies Company, companies controlled and supervised by the CAAC, are the only jet fuel supply companies in China, with the exception of the joint venture jet fuel supply companies that supply the Shenzhen, Zhuhai, Sanya, Haikou, Shanghai Pudong and other small airports, in each of which CAOSC is a partner. Airlines are generally not permitted to buy jet fuel from other suppliers in their domestic operations, since the direct import of jet fuel for domestic purposes is prohibited. As a result, all Chinese airlines purchase their domestic jet fuel supply requirements (other than the above mentioned exceptions) from the seven regional branches of CAOSC. Jet fuel obtained from such regional branches is purchased at uniform prices throughout China that are determined and adjusted by CAOSC from time to time with the approval of the CAAC and the pricing department of the NDRC based on market conditions and other factors.
Safety
The CAAC has made the improvement of air traffic safety in China a high priority and is responsible for the establishment of operational safety, maintenance and training standards for all Chinese airlines. The Chinese airlines are required to provide monthly flight safety reports to the CAAC, including reports of flight or other incidents or accidents and other safety related problems involving such airline’s aircraft occurring during the relevant reporting period. The CAAC periodically conducts safety inspections on individual airlines.
The CAAC oversees the standards of all Chinese airline pilots through its operation of the CAAC Aviation College. The CAAC Aviation College is a monitoring unit located in Tianjin which implements a uniform pilot certification process applicable to all Chinese airline pilots and is responsible for the issuance, renewal, suspension and cancellation of pilot licenses. Every pilot is required to pass CAAC-administered examinations before obtaining a pilot license and is subject to an annual recertification examination.
All aircraft operated by Chinese airlines, other than a limited number of leased aircraft registered in foreign countries, are required to be registered with the CAAC. All aircraft operated by Chinese airlines must have a valid certificate of airworthiness, which is issued annually by the CAAC. In addition, maintenance permits are issued to a Chinese airline only after its maintenance capabilities have been examined and assessed by the CAAC. Such maintenance permits are renewed annually. All aircraft operated by Chinese airlines may be maintained and repaired only by CAAC-certified maintenance facilities, whether located within or outside China. Aircraft maintenance personnel must be certified by the CAAC before assuming aircraft maintenance posts.
Security
The CAAC establishes and supervises the implementation of security standards and regulations for the Chinese commercial aviation industry. Such standards and regulations are based on Chinese laws, as well as standards developed by international commercial aviation organizations. Each airline and airport in China is required to submit to the CAAC an aviation security handbook describing specific security procedures established by such airline or airport for the day-to-day operations of commercial aviation and procedures for staff training on security. Such security procedures must be based on relevant CAAC regulations and international commercial aviation treaties. Chinese airports and airlines that operate international routes must also adopt security measures in accordance with the requirements of the relevant international agreements.
29
Noise and Environmental Regulation
All airlines in China must comply with the noise and environmental regulations of the PRC State Environmental Protection Agency. Applicable regulations of the CAAC permit Chinese airports to refuse take-off and landing rights to any aircraft that does not comply with noise regulations.
Chinese Airport Policy
The CAAC supervises and regulates all civilian airports in China. The local government of the PRC manages the administration of most civilian airports in China, including the Guangzhou Baiyun Airport with limited exceptions. Airports in China are also subject to regulation and ongoing review by the CAAC, which determines take-off and landing charges, as well as charges for the use of airports and airport services.
Competition
The CAAC’s extensive regulation of the Chinese commercial aviation industry has had the effect of managing competition among Chinese airlines. Nevertheless, competition has become increasingly intense in recent years due to a number of factors, including relaxation of certain regulations by the CAAC, an increase in the number of Chinese airlines and an increase in the capacity, routes and flights of Chinese airlines.
In the Chinese aviation industry, the three dominant airlines are the Group, Air China and China Eastern Airlines. In 2010, these three airlines together controlled approximately 76.65% of the commercial aviation market in China as measured by passengers carried.
Most major Chinese airlines have in recent years significantly expanded their fleets, while at the same time passenger traffic has not increased proportionately. This has resulted in a reduction in the passenger load factors for most Chinese airlines. As a result, Chinese airlines are required to be more competitive with respect to, for example, quality of service, including ticketing and reservations, in-flight services, flight scheduling and timeliness.
The Group expects that competition in China’s commercial aviation industry will continue to be intense. The Group will also face increasing competition from alternative means of transport, such as highway and rail, as China’s transportation infrastructure improves. In particular, the so-called “Four Longitudinal and Four Horizontal” high-speed railways under construction may have a huge negative impact on the domestic commercial aviation sector once it goes into operation. 42 lines of the “Four Longitudinal and Four Horizontal” overlap with current flights of the Group, 20 of which run for a distance of less than 4 hours. If the high-speed railways go into full operation, according to the statistic of the Group, 13 out of the total 18 subsidiaries and branches of the Company involving 968 flights (i.e. to and fro flights/week) may be seriously impacted.
Relative to other Chinese airlines, however, the Group believes that it possesses certain competitive advantages. The Group has the most extensive route network and the largest number of regional route bases among Chinese airlines, which the Group believes places it in a favorable position in the route allocation process. The Group also has the largest aircraft fleet of any Chinese airline, which, together with the Group’s planned aircraft acquisitions, will permit the Group to expand its operations and to improve the deployment of the aircraft in its fleet. The Group also believes that its dominant presence in the populous and economically developed southern and central regions of China provides it with a competitive advantage in attracting new customers and that its fully integrated flight training, aircraft and engine maintenance, and air catering operations enable it to achieve and maintain high quality service to its customers. In light of increasing competition from high speed trains, the Group intends to place more flight fleet to the international routes, where the Group enjoys an advantageous market position. The Group also believes that its optimized route network, increased operational efficiency and improved service quality will attract more customers. The proposed cooperation between the Company and the high speed trains operators will also enable the Group to render a seamless air-ground service to customers which will bring a win-win situation for both the Group and the high speed trains operators.
According to CAAC statistics, the following table sets forth the Group’s market share of passengers carried, cargo and mail carried and total traffic of Chinese airlines for the years indicated.
|
Passenger carried
|
Cargo and Mail
Carried (tons)
|
Total traffic
(ton kilometers)
|
||||||||||||||||||||||
|
Year
|
Industry
Total
(in millions)
|
Group’s
Share
(% of total)
|
Industry
Total
(in
thousands)
|
Group’s
Share
(% of total)
|
Industry
Total
(in billions)
|
Group’s
Share
(% of total)
|
||||||||||||||||||
|
2006
|
159.7
|
30.8
|
3,494
|
23.4
|
30.6
|
26.4
|
||||||||||||||||||
|
2007
|
185.8
|
30.6
|
4,018
|
21.7
|
36.5
|
25.3
|
||||||||||||||||||
|
2008
|
192.5
|
30.3
|
4,076
|
20.5
|
37.7
|
24.4
|
||||||||||||||||||
|
2009
|
230.5
|
28.8
|
4,455
|
19.3
|
42.7
|
23.6
|
||||||||||||||||||
|
2010
|
267.7
|
|
|
|
28.6
|
|
|
|
5,630
|
|
|
|
19.8
|
|
|
|
53.8
|
|
|
|
24.3
|
|||
30
Domestic Routes
The Group competes against its domestic competitors primarily on the basis of flight schedule, route network, quality of service, safety, type and age of aircraft and, to a lesser extent and until recently, price. The Group competes against other major Chinese airlines in its various domestic route markets. Of these competitors, the largest are two airlines owned or controlled by the Chinese government, and the remaining airlines are operated by or under the control of various Chinese provincial or municipal governments.
The following table sets forth the Group’s market share of the passengers carried, cargo and mail carried on departing flights and total departing flights at the ten busiest airports in China, based on passenger volume data from CAAC statistics, in 2010.
|
Cargo and Mail
|
||||||||||||
|
Airport
|
Passenger carried
(% of total)
|
Carried
(% of total)
|
Departing flight
(% of total)
|
|||||||||
|
Beijing
|
17.29 | 13.56 | 17.07 | |||||||||
|
Guangzhou
|
51.08 | 28.16 | 50.90 | |||||||||
|
Shanghai Pudong
|
9.79 | 5.58 | 10.57 | |||||||||
|
Shanghai Hongqiao
|
14.73 | 18.15 | 14.82 | |||||||||
|
Shenzhen
|
29.35 | 18.09 | 27.73 | |||||||||
|
Chengdu
|
13.29 | 14.15 | 12.64 | |||||||||
|
Kunming
|
15.76 | 17.82 | 14.85 | |||||||||
|
Xi’an
|
19.56 | 23.36 | 18.83 | |||||||||
|
Hangzhou
|
35.09 | 29.93 | 34.38 | |||||||||
|
Chongqing
|
24.74 | 27.27 | 23.92 | |||||||||
The following table sets forth the Group’s market share of the passengers carried, cargo and mail carried on departing flights and total departing flights at eight busiest airports in southern and central China (excluding Guangzhou and Shenzhen, which are included in the table above), based on passenger volume data from CAAC statistics, in 2010.
|
Cargo and Mail
|
||||||||||||
|
Airport
|
Passenger carried
(% of total )
|
Carried
(% of total)
|
Departing flight
(% of total)
|
|||||||||
|
Changsha
|
39.23
|
50.75
|
38.37
|
|||||||||
|
Wuhan
|
43.79
|
51.38
|
40.22
|
|||||||||
|
Sanya
|
29.05
|
31.59
|
28.74
|
|||||||||
|
Haikou
|
28.22
|
27.74
|
25.85
|
|||||||||
|
Zhengzhou
|
51.29
|
58.83
|
47.98
|
|||||||||
|
Nanning
|
35.87
|
35.59
|
33.10
|
|||||||||
|
Guilin
|
41.15
|
51.38
|
39.90
|
|||||||||
|
Zhuhai
|
50.33
|
56.08
|
22.35
|
|||||||||
Regional Routes
In 2010, the Group conducted a total of 13,361 flights on its regional routes, accounting for approximately 23.39% of all passengers carried by Chinese airlines on routes between Hong Kong, Macau or Taiwan and destinations in China. The Group faces less competition on regional routes than that on domestic and international, and earns higher operating margin. Air China, Eastern Airlines, Air Macau, Dragon Air and Cathay Pacific Airways compete with the Group in the regional traffic markets.
International Routes
The Group competes with Air China, China Eastern and many well-established foreign airlines on its international routes. Most of these international competitors have significantly longer operating histories, substantially greater financial and technological resources and greater name recognition than the Group. In addition, the public’s perception of the safety and service records of Chinese airlines may adversely affect the Group’s ability to compete against its regional and international competitors. Many of the Group’s international competitors have larger sales networks and participate in reservation systems that are more comprehensive and convenient than those of the Group, or engage in promotional activities that may enhance their ability to attract international passengers.
Air China has the most extensive international route network among Chinese airlines. Beijing, the hub of Air China’s operations, has been the destination for most international flights to China. The Group competes against, among other airlines, Thai Airways International, Singapore Airlines, Malaysian Airlines System, Air China and China Eastern on flights to Southeast Asian destinations. In the case of its European routes, the Group’s competitors include Cathay Pacific Airways. The Group faces competition on its international routes from Air China and China Eastern, each of which operates several routes between destinations in China and the United States, as well as international airlines that fly to Los Angeles from Hong Kong. The Group competes in the international market primarily on the basis of safety, price, timeliness and convenience of scheduling.
31
Airline Subsidiaries
The Airline Subsidiaries are joint ventures established by the Company and local companies in the provinces or special economic zones where the Airline Subsidiaries are based and are engaged in providing airline and related services. As of December 31, 2010, the Company owns a 60% equity interest in each of its Airline Subsidiaries.
As of December 31, 2010, Xiamen Airlines operated under its own “MF” code with a fleet of sixty-eight aircraft on one hundred and sixteen domestic routes, eight international routes and fourteen regional routes. In 2010, Xiamen Airlines carried a total of about 13.56 million passengers, or approximately 17.73% of the passengers carried by the Group in that year, and had RMB10,861 million in traffic revenue.
As of December 31, 2010, Shantou Airlines operated under the Group’s “CZ” code with a fleet of ten aircraft. In 2010, under the centralized allocation of flight routes of the Group, Shantou Airlines carried a total of about 2.21 million passengers, or 2.89% of the passengers carried by the Group in that year. Total traffic revenue of Shantou Airlines for the year ended December 31, 2010 was RMB1,737 million.
As of December 31, 2010, Chongqing Airlines operated under the “OQ” code with a fleet of seven aircraft. In 2010, under the centralized allocation of flight routes of the Group, Chongqing Airlines carried a total of about 1.45 million passengers, or 1.9% of the total number of passengers carried by the Group in that year. Total traffic revenue of Chongqing Airlines for the year ended December 31, 2010 was RMB973 million.
As of December 31, 2010, Zhuhai Airlines operated under the “CZ” code with a fleet of five aircraft. In 2010, under the centralized allocation of flight routes of the Group, Zhuhai Airlines carried a total of about 0.95 million passengers, or approximately 1.24% of the total number of passengers carried by the Group in that year. Total traffic revenue of Zhuhai Airlines for the year ended December 31, 2010 was RMB903 million.
As of December 31, 2010, Guizhou Airlines operated under the “CZ” code with a fleet of eight aircraft. In 2010, under the centralized allocation of flight routes of the Group, Guizhou Airlines carried a total of about 1.65 million passengers, or approximately 2.16% of the total number of passengers carried by the Group in that year. Total traffic revenue of Guizhou Airlines was approximately RMB1,442 million for the year ended December 31, 2010.
Insurance
The CAAC maintains fleet and legal liability insurance on behalf of the Group and all other Chinese airlines with PICC Property and Casualty Company Limited, or PICCP&C, and China Pacific Property Insurance Company Ltd., under the PICCP&C master policy. The Group maintains aviation hull all risks, spares and airline liability insurance, aircraft hull all risks and spare engines deductible insurance, aviation hull war and allied perils policy of the type and in the amount customary in the Chinese aviation industry.
Under the relevant PRC laws, civil liability of Chinese airlines for death or injuries suffered by passengers on domestic flights is limited to RMB400,000 (approximately US$60,398) per passenger. As of July 31, 2006, the Convention for the Unification of Certain Rules for International Carriage by Air of 1999, or Montreal Convention, became effective in China. Under the Montreal Convention, carriers of international flights are strictly liable for proven damages up to 100,000 Special Drawing Rights and beyond that, carriers are only able to exclude liability if they can prove that the damage was not due to negligence or other wrongful act of the carrier (and its agents), or the damage arose solely from the negligence or other wrongful act of a third party. The Group believes that it maintains adequate insurance coverage for the civil liability that can be imposed in respect of death or injuries to passengers under Chinese law, the Montreal Convention and any agreement which the Group is subject to.
The CAAC allocates insurance premiums payable in respect of the PICCP&C master policy to each participating airline based on the value of the airline’s insured aircraft or, in the case of leased aircraft, based on the amount required by the terms of the lease. Insurance claims made by any participating airline may cause the premiums paid by the Group under the PICCP&C master policy to increase. PICCP&C’s practice has been to reinsure a substantial portion of its aircraft insurance business through reinsurance brokers on the London reinsurance market.
Intellectual Property
The Group’s businesses and operations, other than the businesses and operations of Xiamen Airlines and Chongqing Airlines, are conducted under the names “China Southern” and “China Southern Airlines” in both English and Chinese. The Group uses as its logo a stylized rendition of a kapok plant. Xiamen Airlines conducts its businesses and operations under the name of “Xiamen Airlines” in English and Chinese and uses its own logo depicting a stylized rendition of an egret. Chongqing Airlines conducts its business and operations under the name of “Chongqing Airlines” in English and Chinese and uses its own logo depicting a cross of two rivers.
32
We own various trademarks and tradenames related to our business. The names “China Southern” and “China Southern Airlines” contain Chinese words of common usage and are therefore not eligible for registration as tradenames under current Chinese law. The kapok logo is a trademark registered in China and recorded with the International Air Transport Association (“IATA”), the rights to which are owned by CSAHC. The Company and CSAHC have entered into a trademark license agreement (the “Trademark License Agreement”), pursuant to which CSAHC has licensed to the Group the right to use the names “China Southern” and “China Southern Airlines” in both English and Chinese and granted the Company a 10-year renewable license from 1997 to use the kapok logo on a world-wide basis. CSAHC has retained the right to use the kapok logo in connection with its non-airline related businesses conducted as of the date of the Trademark License Agreement and to permit its associates that do not compete, directly or indirectly, with the Group to use the kapok logo. Unless CSAHC gives a written notice of termination three months before the expiration of the agreement, the agreement will be automatically renewed for another ten-year term. In May of 2007, the Trademark License Agreement has been renewed by the two parties for another ten-year term ending 2017. Xiamen Airlines owns all rights to its egret logo, which is a trademark registered in China, and recorded with the IATA. Chongqing Airlines also owns all rights to its logo, which is a trademark registered in China, and recorded with the IATA.
Organizational Structure
The following chart illustrates the corporate structure of the Group as of December 31, 2010 and the aggregate effective equity interest of the Company in each of its principal subsidiaries, associates and jointly controlled entities.
Note a: Including 13% ownership interest held by CSA’s subsidiaries.
The particulars of the Group’s principal subsidiaries as of December 31, 2010 are as follows:
|
Name of company
|
Place and date of
establishment
/operation
|
Proportion of
ownership
interest held
by the Company
|
||||
|
Shantou Airlines Company Limited
|
PRC July 20, 1993
|
60
|
%
|
|||
|
Zhuhai Airlines Company Limited
|
PRC May 8, 1995
|
60
|
%
|
|||
|
Xiamen Airlines Company Limited
|
PRC August 11, 1984
|
60
|
%
|
|||
|
Guizhou Airlines Company Limited
|
PRC November 12, 1991
|
60
|
%
|
|||
|
Chongqing Airlines Company Limited
|
PRC June 16, 2007
|
60
|
%
|
|||
|
Guangzhou Nanland Air Catering Company Limited
|
PRC November 21, 1989
|
55
|
%
|
|||
|
Guangzhou Baiyun International Logistics Company Limited
|
PRC July 23, 2002
|
61
|
%
|
|||
|
Xinjiang Civil Aviation Property Management Limited
|
PRC February 12, 2002
|
51.8
|
%
|
|||
|
China Southern Airlines Group Air Catering Company Limited
|
PRC December 25, 2003
|
100
|
%
|
|||
|
Nan Lung International Freight Limited
|
Hong Kong October 1, 1996
|
51
|
%
|
|||
|
Beijing Southern Airlines Ground Service Company Limited
|
PRC April 1, 2004
|
100
|
%
|
|||
33
The particulars of the Group’s principal associates and jointly controlled entities as of December 31, 2010 are as follows:
|
Proportion of ownership
interest held by
|
||||||||||||||
|
Name of company
|
Place and date of
Establishment
/operation
|
Group
effective
interest
|
The
Company
|
Subsidiaries
|
||||||||||
|
Guangzhou Aircraft Maintenance Engineering Company Limited
|
PRC October 28, 1989
|
50
|
%
|
50
|
%
|
—
|
||||||||
|
China Southern Airlines Group Finance Company Limited
|
PRC June 28, 1995
|
34
|
%
|
21.1
|
%
|
12. 9
|
%
|
|||||||
|
Sichuan Airlines Corporation Limited
|
PRC August 28, 2002
|
39
|
%
|
39
|
%
|
—
|
||||||||
|
Zhuhai Xiang Yi Aviation Technology Company Limited
|
PRC July 10, 2002
|
51
|
%
|
51
|
%
|
—
|
||||||||
|
Southern Airlines Culture and Media Co.,
Ltd.
|
PRC May 13, 2004
|
40
|
%
|
40
|
%
|
—
|
||||||||
|
China Southern West Australian Flying
College Pty Limited
|
Australia January 26, 1971
|
48.12
|
%
|
48.12
|
%
|
—
|
||||||||
|
Guangzhou China Southern Zhongmian Dutyfree Store Co., Limited
|
PRC September 29, 2006
|
50
|
%
|
50
|
%
|
—
|
||||||||
Property, Plant and Equipment
For a discussion of the Group’s aircraft, see Item 4, “Information on the Company — History and development of the Company — Aircraft Acquisitions.”
The Company’s headquarters in Guangzhou occupy an area of approximately 1,272,201 square meters of land and a total gross floor area of approximately 690,871 square meters. The Company leases from CSAHC the land in Guangzhou on which the Company’s headquarters and other facilities are located. The Company also leases from CSAHC certain buildings mainly at the Haikou, Wuhan, Nanyang, Shenyang, Dalian, Jilin, Harbin and Xinjiang.
The Company’s principal properties are located at its headquarters site and at its route bases. The following table sets forth certain information with respect to the Company’s properties at its headquarters in Guangzhou and certain route bases as of the date hereof.
|
Land
(in square meters)
|
Buildings
(in square meters )
|
|||||||||||||||
|
Owned
|
Leased
|
Owned
|
Leased
|
|||||||||||||
|
Guangzhou
|
1,172,531
|
99,670
|
679,408
|
11,463
|
||||||||||||
|
Shenzhen
|
246,397
|
—
|
105,040
|
—
|
||||||||||||
|
Zhuhai
|
170,062
|
—
|
18,791
|
—
|
||||||||||||
|
Changsha
|
173,745
|
6,629
|
70,338
|
12,536
|
||||||||||||
|
Zhengzhou
|
425,336
|
—
|
56,915
|
—
|
||||||||||||
|
Haikou
|
5,265
|
1,711
|
83,923
|
20,917
|
||||||||||||
|
Wuhan
|
16,712
|
47,882
|
29,893
|
44,282
|
||||||||||||
|
Nanyang
|
—
|
—
|
18,156
|
60,035
|
||||||||||||
|
Sanya
|
106,680
|
—
|
16,968
|
—
|
||||||||||||
|
Shenyang
|
135,455
|
103,715
|
101,224
|
6,674
|
||||||||||||
|
Dalian
|
—
|
14,403
|
20,290
|
33,597
|
||||||||||||
|
Jilin
|
134,488
|
65,076
|
42,312
|
7,767
|
||||||||||||
|
Harbin
|
2,499
|
286,871
|
36,925
|
25,513
|
||||||||||||
|
Xinjiang
|
—
|
559,416
|
122,890
|
3,396
|
||||||||||||
|
Guilin
|
120,705
|
—
|
53,080
|
6,805
|
||||||||||||
34
The following table sets forth certain information with respect to the properties of the Airline Subsidiaries as of the date hereof.
|
Land
(in square meters)
|
Buildings
(in square meters)
|
|||||||||||||||
|
Owned
|
Leased
|
Owned
|
Leased
|
|||||||||||||
|
Xiamen
|
782,070
|
—
|
512,197
|
23,557
|
||||||||||||
|
Shantou
|
36,931
|
53,000
|
61,468
|
2,773
|
||||||||||||
|
Zhuhai
|
99,306
|
—
|
57,730
|
1,800
|
||||||||||||
|
Guizhou
|
259,879
|
—
|
106,245
|
2,032
|
||||||||||||
|
Chongqing
|
82,449
|
—
|
6,785
|
4,519
|
||||||||||||
As systems for registration and transfer of land use rights and related real property interests in China have been implemented relatively recently, such systems do not yet comprehensively account for all land and related property interests. The land in Guangzhou on which the Company’s headquarters and other facilities are located and the buildings that the Company uses at its route base in Wuhan and Haikou are leased by the Company from CSAHC. However, CSAHC lacks adequate documentation evidencing CSAHC’s rights to such land and buildings, and, as a consequence, the lease agreements between CSAHC and the Company for such land may not be registered with the relevant authorities. Lack of registration may affect the validity of such lease agreements. There are certain other parcels of land and buildings owned or used by the Group that lack adequate documentation. Lack of adequate documentation for land use rights and ownership of buildings may impair the ability of the Group to dispose of or mortgage such land use rights and buildings. As of April 21, 2011, the Group was in the process of applying for the land use right certificates and property title certificates in respect of the properties located in Guangzhou (including Guangzhou Baiyun International Airport), Xiamen, Heilongjiang, Hainan, Jilin, Dalian, Hunan, Xinjiang, Henan, Shenzhen, Beijing, Shanghai, Sanya, Zhuhai and Shenyang in which the Group has interests and for which such certificates have not been granted. The directors of the Company are of the opinion that the use of and the conduct of operating activities at the properties referred to above are not affected by the fact that the Group has not yet obtained the relevant land use right certificates and property title certificates.
Not applicable.
The following discussion and analysis should be read in conjunction with the Financial Statements of the Group contained elsewhere in this Annual Report. The Group maintains its books and accounts in accordance with PRC Accounting Standards for Business Enterprises (“PRC GAAP”) and prepares its financial statements in accordance with both PRC GAAP and IFRSs. The Financial Statements contained elsewhere in this Annual Report have been prepared in accordance with IFRSs.
The discussion and analysis of the Group’s financial condition and results of operations are based on the consolidated financial statements, which have been prepared in accordance with IFRSs.
Critical Accounting Policies
The preparation of the consolidated financial statements requires the Group to make estimates and judgments that affect the reported amount of assets and liabilities, revenues and expenses, and related disclosure of contingent assets and liabilities at the date of the consolidated financial statements. Actual results may differ from these estimates under different assumptions or conditions.
Critical accounting policies are defined as those that are reflective of significant judgments and uncertainties, and potentially result in materially different results under different assumptions and conditions. Our principal accounting policies are set forth in Note 2 to the consolidated financial statements. The Group believes that the following critical accounting policies involve the most significant judgments and estimates used in the preparation of our financial statements.
Impairment for long-lived assets
If circumstances indicate that the net book value of a long-lived asset may not be recoverable, this asset may be considered “impaired”, and an impairment loss may be recognized in accordance with IAS 36, Impairment of Assets. The carrying amounts of long-lived assets are reviewed periodically in order to assess whether the recoverable amounts have declined below the carrying amounts. These assets are tested for impairment whenever events or changes in circumstances indicate that their recorded carrying amounts may not be recoverable. When such a decline has occurred, the carrying amount is reduced to the recoverable amount. The recoverable amount is the greater of the fair value less costs to sell and value in use. In determining the value in use, expected cash flows generated by the asset are discounted to their present value, which requires significant judgment relating to the level of traffic revenue and the amount of operating costs. The Group uses all readily available information in determining an amount that is a reasonable approximation of recoverable amount, including estimates based on reasonable and supportable assumptions for projections of traffic revenue and amount of operating costs.
Depreciation
Property, plant and equipment are depreciated on a straight-line basis over the estimated useful lives, after taking into account the estimated residual value. The Group reviews the estimated useful lives of assets regularly in order to determine the amount of depreciation expense to be recorded during any reporting period. The useful lives are based on the Group’s historical experience with similar assets and taking into account anticipated technological changes. The depreciation expense for future periods is adjusted if there are significant changes from previous estimates.
35
Recently Pronounced International Financial Reporting Standards
Information relating to the recently pronounced IFRSs is presented in Note 55 to the consolidated financial statements.
Overview
In 2010, facing slowly recovering global economies and a complicated domestic economy, China further accelerated its economic transformation and restructuring, preserving the sound trend in economic resilience and therefore ensuring a stable, rapid growth in its national economy. Facing the strong economic upturn and prosperous demand for airline operations, the Company, capitalized on market opportunities, aggressively leveraged its operation capacity, comprehensively propelled restructuring, earnestly implemented strategic transformation, successfully seized favorable opportunities arising from continuous prosperity in aviation industry and tenaciously overcame challenges brought about by restructuring in the industry and by operation of the high speed railway, thereby attaining a fruitful harvest in its overall production and operation.
In 2010, the Company strengthened safety surveillance and enhanced building of headquarter’s safety management capacity. Notwithstanding enormous pressures posed by changing market situation, strategic transformation, and security tasks for World Expo and Asian Games, it attained safety operation throughout the whole year and achieved the best safety performance ever in the history. In 2010, the Company had realized records of 1,181,000 safe flight hours, 7,711,000 accumulated safe flight hours, 134 consecutive safe flight months, and 198 consecutive months of air security.
In 2010, the Company fully pushed ahead restructuring while rationalized assets and liabilities, the structure, fleet composition and routes combination; these have clearly laid a solid foundation for further shift in development mode and improvement of overall competitiveness. The Company announced its proposal on non-public issue of A Shares and H Shares in March 2010 and completed the said issuances in November 2010, raising fund of RMB10,730,000,000 through this 2010 re-finance plan. As a result, the Company’s assets and liabilities structure has been largely improved, while its profitability has been greatly enhanced.
In 2010, the Company deepened its efforts in energy saving and emission reduction, devoted itself to special tasks and hence fulfilled its social responsibilities. The Company strived to effectuate Green Flight and speed up fleet upgrade and technical reform. In 2010, fuel consumption of the Company’s civil aircraft was 4.26L for each 100 passengers per kilometer, a 4.05% decline as compared with that in 2009. For this, the Company was accredited with the “2010 National Energy Saving Contribution Award (2010
年节能中国贡献奖
)” and “The PRC Top 10 Green Responsible Enterprises Award (
中国十佳绿色责任企业奖
)”. Moreover, the Company also took initiatives to fulfill its social responsibilities, which is demonstrated by 1,027 flights of special tasks like chartered flight, disaster relief, and evacuation of overseas compatriots. In 2010, our Ten Cent Care Foundation donated RMB13,680,000 in total for disaster relief, study support, and poverty relief. This helped the Company to have won the “Award for the PRC Preminent Enterprises in Corporate Social Responsibilities (
中国企业社会责任榜杰出企业奖
)” bestowed by China Business Network.
Nevertheless, the development of the airlines industry meets with a number of challenges, such as more factors making the recovery of global economy unstable and uncertain, faster growth in the total traffic capacity of the industry, impact of substitutive services such as Express Rail, as well as sharp fluctuation in oil price.
Since July 21, 2005, the PRC government has begun to adopt a managed floating exchange rate system based on market supply and demand of currencies, which is subject to adjustments with reference to a basket of currencies. The exchange rate of Renminbi would no longer be pegged to the U.S. dollar only and a more flexible exchange rate system was established. Because the Group finances its aircraft acquisitions mainly through capital leases or bank loans in U.S. dollars, and there are a substantial amount of transactions and obligations denominated in U.S. dollars in relation to its global purchases of jet fuel, lease and purchase of aviation equipment as well as major repairs, in addition to the landing fees of its international flights in the airports of other countries, the Group benefited from the RMB appreciation. RMB appreciation has brought a one-off exchange gain to the Group and reduced its operating costs which are denominated in foreign currencies. However, RMB appreciation also presents the Group with a challenge in price competition in international route operations.
The Group’s operating revenue is substantially dependent on the passenger and cargo traffic volume carried, which is subject to seasonal and other changes in traffic patterns, the availability of appropriate time slots for the Group’s flights and alternative routes, the degree of competition from other airlines and alternate means of transportation, as well as other factors that may influence passenger travel demand and cargo and mail volume. In particular, the Group’s airline revenue is generally higher in the second and third quarters than in the first and fourth quarters.
36
Like most airlines, the Group is subject to a high degree of financial and operating leverage. A significant percentage of the Group’s operating expenses are fixed costs that do not vary proportionally based on the Group’s yields or the load factors. These fixed costs include depreciation expense, jet fuel costs, landing and navigation fees, financing costs, operating lease payments, aircraft maintenance costs and labor for flight crew, cabin crew and ground personnel. Thus, a minor change in the Group’s yields or load factors would have a material effect on the Group’s results of operations. In addition, certain of these expenses, primarily financing costs and operating lease payments, labor costs and depreciation do not vary based on the number of flights flown. Thus, the Group’s operating results can also be substantially affected by minor changes in aircraft utilization rates. The Group is and will continue to be highly leveraged with substantial obligations denominated in foreign currencies and, accordingly, the results of its operations are significantly affected by fluctuations in foreign exchange rates, particularly for the U.S. dollar. Net exchange gain increased by RMB 1,653 million, from RMB93 million in 2009 to RMB1,746 million in 2010, mainly attributable to the exchange gain arising from retranslation and settlement of bank and other loans balances and financial lease obligations denominated in U.S. dollars, as a result of the significant appreciation of Renminbi against U.S. dollars in 2010.
A number of other external variables, including political and economic conditions in China, tend to have a major impact on the Group’s performance. The Group’s financial performance is also significantly affected by factors arising from operating in a regulated industry. As substantially all aspects of the Group’s airline operations are regulated by the PRC government, the Group’s operating revenues and expenses are directly affected by the PRC government’s policies with respect to domestic air fares, jet fuel prices and landing and navigation fees, among others. The nature and extent of airline competition and the ability of Chinese airlines to expand are also affected by CAAC’s control over route allocations. Any changes in the PRC government’s regulatory policies or any implementation of such policies could have a significant impact on the Group’s future operations and its ability to implement its operating strategy.
Certain Financial Information and Operating Data by Geographic Region
The following table sets forth certain financial information and operating data by geographic region for the years ended December 31, 2010, 2009 and 2008:
|
Year ended December 31,
|
2010 vs. 2009
% increase
|
2009 vs. 2008
% increase
|
||||||||||||||||||
|
Traffic
|
2010
|
2009
|
2008
|
(decrease)
|
(decrease)
|
|||||||||||||||
|
RPK (million)
|
||||||||||||||||||||
|
Domestic
|
94,014 | 80,697 | 70,619 | 16.5 | 14.3 | |||||||||||||||
|
Regional
|
1,788 | 1,337 | 1,139 | 33.7 | 17.4 | |||||||||||||||
|
International
|
15,526 | 10,968 | 11,426 | 41.6 | (4.0 | ) | ||||||||||||||
|
Total
|
111,328 | 93,002 | 83,184 | 19.7 | 11.8 | |||||||||||||||
|
RTK (million)
|
||||||||||||||||||||
|
Domestic
|
9,715 | 8,342 | 7,392 | 16.5 | 12.9 | |||||||||||||||
|
Regional
|
171 | 126 | 110 | 35.7 | 14.5 | |||||||||||||||
|
International
|
3,218 | 1,599 | 1,698 | 101.3 | (5.8 | ) | ||||||||||||||
|
Total
|
13,104 | 10,067 | 9,200 | 30.2 | 9.4 | |||||||||||||||
|
Passengers carried (thousand)
|
||||||||||||||||||||
|
Domestic
|
69,727 | 61,130 | 53,063 | 14.1 | 15.2 | |||||||||||||||
|
Regional
|
1,573 | 1,276 | 1,220 | 23.3 | 4.6 | |||||||||||||||
|
International
|
5,156 | 3,875 | 3,954 | 33.1 | (2.0 | ) | ||||||||||||||
|
Total
|
76,456 | 66,281 | 58,237 | 15.4 | 13.8 | |||||||||||||||
|
Cargo and mail carried (thousand tons)
|
||||||||||||||||||||
|
Domestic
|
874 | 750 | 713 | 16.5 | 5.2 | |||||||||||||||
|
Regional
|
12 | 9 | 11 | 33.3 | (18.2 | ) | ||||||||||||||
|
International
|
231 | 103 | 111 | 124.3 | (7.2 | ) | ||||||||||||||
|
Total
|
1,117 | 862 | 835 | 29.6 | 3.2 | |||||||||||||||
37
|
Year ended December 31,
|
2010 vs. 2009
% increase
|
2009 vs. 2008
% increase
|
||||||||||||||||||
|
Capacity
|
2010
|
2009
|
2008
|
(decrease)
|
(decrease)
|
|||||||||||||||
|
ASK (million)
|
||||||||||||||||||||
|
Domestic
|
117,383
|
105,379
|
93,384
|
11.4
|
12.8
|
|||||||||||||||
|
Regional
|
2,353
|
1,916
|
1,790
|
22.8
|
7.0
|
|||||||||||||||
|
International
|
20,762
|
16,146
|
17,593
|
28.6
|
(8.2
|
)
|
||||||||||||||
|
Total
|
140,498
|
123,441
|
112,767
|
13.8
|
9.5
|
|||||||||||||||
|
ATK (million)
|
|
|
||||||||||||||||||
|
Domestic
|
13,890
|
12,425
|
10,985
|
11.8
|
13.1
|
|||||||||||||||
|
Regional
|
269
|
219
|
200
|
22.8
|
9.5
|
|||||||||||||||
|
International
|
4,981
|
2,802
|
3,091
|
77.8
|
(9.3
|
)
|
||||||||||||||
|
Total
|
19,140
|
15,446
|
14,276
|
23.9
|
8.2
|
|||||||||||||||
|
Load Factors
|
|
|
||||||||||||||||||
|
Passenger load factor (RPK/ASK) (%)
|
|
|
||||||||||||||||||
|
Domestic
|
80.1
|
76.6
|
75.6
|
4.6
|
1.3
|
|||||||||||||||
|
Regional
|
76.0
|
69.8
|
63.6
|
8.9
|
9.7
|
|||||||||||||||
|
International
|
74.8
|
67.9
|
64.9
|
10.2
|
4.6
|
|||||||||||||||
|
Overall
|
79.2
|
75.3
|
73.8
|
5.2
|
2.0
|
|||||||||||||||
|
Overall load factor (RTK/ATK) (%)
|
|
|
||||||||||||||||||
|
Domestic
|
69.9
|
67.1
|
67.3
|
4.2
|
(0.3
|
)
|
||||||||||||||
|
Regional
|
63.6
|
57.7
|
55.0
|
10.2
|
4.9
|
|||||||||||||||
|
International
|
64.6
|
57.1
|
54.9
|
13.1
|
4.0
|
|||||||||||||||
|
Overall
|
68.5
|
65.2
|
64.4
|
5.1
|
1.2
|
|||||||||||||||
|
Yield
|
|
|
||||||||||||||||||
|
Yield per RPK (RMB)
|
|
|
||||||||||||||||||
|
Domestic
|
0.62
|
0.53
|
0.59
|
17.0
|
(10.2
|
)
|
||||||||||||||
|
Regional
|
0.85
|
0.75
|
0.84
|
13.3
|
(10.7
|
)
|
||||||||||||||
|
International
|
0.58
|
0.55
|
0.67
|
5.5
|
(17.9
|
)
|
||||||||||||||
|
Overall
|
0.62
|
0.54
|
0.61
|
14.8
|
(11.5
|
)
|
||||||||||||||
|
Yield per RTK (RMB)
|
|
|
||||||||||||||||||
|
Domestic
|
6.20
|
5.36
|
5.90
|
15.7
|
(9.2
|
)
|
||||||||||||||
|
Regional
|
9.29
|
8.30
|
9.23
|
11.9
|
(10.1
|
)
|
||||||||||||||
|
International
|
3.84
|
4.52
|
5.47
|
(15.0)
|
(17.4
|
)
|
||||||||||||||
|
Overall
|
5.66
|
5.26
|
5.86
|
7.6
|
(10.2
|
)
|
||||||||||||||
|
Financial
|
|
|||||||||||||||||||
|
Passenger revenue (RMB million)
|
|
|||||||||||||||||||
|
Domestic
|
58,155
|
43,033
|
41,854
|
35.1
|
2.8
|
|||||||||||||||
|
Regional
|
1,521
|
1,000
|
952
|
52.1
|
5.0
|
|||||||||||||||
|
International
|
9,028
|
6,026
|
7,606
|
49.8
|
(20.8
|
)
|
||||||||||||||
|
Total
|
68,704
|
50,059
|
50,412
|
37.2
|
(0.7
|
)
|
||||||||||||||
|
Cargo and mail revenue (RMB million)
|
5,436
|
2,908
|
3,501
|
86.9
|
(16.9
|
)
|
||||||||||||||
Operating Results
The historical results of operations discussed below may not be indicative of the Group’s future operating performance. In addition to the factors discussed under “Overview” above, the Group’s future operations will be affected by, among other things, changes in the aviation market, the cost of jet fuel, aircraft acquisition and leasing costs, aircraft maintenance expenses, take-off and landing charges, wages, salaries and benefits and other operating expenses, foreign exchange rates and the rates of income taxes paid.
2010 compared with 2009
The profit attributable to equity shareholders of the Company of RMB5,795 million was recorded in 2010 as compared to the profit attributable to equity shareholders of the Company of RMB330 million in 2009, owing to the Group’s operating revenue increased substantially. The Group’s operating revenue increased by RMB21,693 million or 39.6% from RMB54,802 million in 2009 to RMB76,495 million in 2010. Passenger load factor increased by 3.9 percentage point from 75.3% in 2009 to 79.2% in 2010. Passenger yield (in passenger revenue per RPK) increased by RMB0.08 or 14.8% from RMB0.54 in 2009 to RMB0.62 in 2010. Average yield (in traffic revenue per RTK) increased by 7.6% from RMB5.26 in 2009 to RMB5.66 in 2010. Operating expenses increased by RMB15,334 million or 27.7% from RMB55,351 million in 2009 to RMB70,685 million in 2010. As a result of the increase in operating revenue, operating profit of RMB6,286 million was recorded in 2010 as compared to operating profit of RMB1,440 million in 2009, up by RMB4,846 million.
38
Operating revenue
|
2010
|
2009
|
|||||||||||||||||||
|
Operating
revenue
|
Percentage
|
Operating
revenue
|
Percentage
|
Change in
revenue
|
||||||||||||||||
|
RMB
million
|
%
|
RMB
million
|
%
|
%
|
||||||||||||||||
|
Traffic revenue
|
74,140 | 96.9 | 52,967 | 96.7 | 40.0 | |||||||||||||||
|
Including: Passenger revenue
|
68,704 | 50,059 | 37.2 | |||||||||||||||||
|
– Domestic
|
58,155 | 43,033 | 35.1 | |||||||||||||||||
|
– Hong Kong, Macau and Taiwan
|
1,521 | 1,000 | 52.1 | |||||||||||||||||
|
– International
|
9,028 | 6,026 | 49.8 | |||||||||||||||||
|
Cargo and mail revenue
|
5,436 | 2,908 | 86.9 | |||||||||||||||||
|
Other operating revenue
|
2,355 | 3.1 | 1,835 | 3.3 | 28.3 | |||||||||||||||
|
Mainly including: Commission income
|
469 | 342 | 37.1 | |||||||||||||||||
|
Ground services income
|
390 | 320 | 21.9 | |||||||||||||||||
|
Expired sales in advance of carriage
|
664 | 350 | 89.7 | |||||||||||||||||
|
Total operating revenue
|
76,495 | 100.0 | 54,802 | 100.0 | 39.6 | |||||||||||||||
|
Less: fuel surcharge income
|
(5,583 | ) | (1,986 | ) | ||||||||||||||||
|
Total operating revenue excluding fuel surcharge
|
70,912 | 52,816 | ||||||||||||||||||
Traffic revenue composition
|
2010
|
2009
|
|||||||||||||||||||
|
Traffic
revenue
|
Traffic
revenue
|
Change
in traffic
|
||||||||||||||||||
|
RMB
million
|
Percentage
%
|
RMB
million
|
Percentage
%
|
revenue
%
|
||||||||||||||||
|
Passenger Revenue
|
68,704 | 92.7 | 50,059 | 94.5 | 37.2 | |||||||||||||||
|
Cargo and Mail Revenue
|
5,436 | 7.3 | 2,908 | 5.5 | 86.9 | |||||||||||||||
|
Traffic revenue
|
74,140 | 100.0 | 52,967 | 100.0 | 40.0 | |||||||||||||||
Passenger revenue composition
|
2010
|
2009
|
|||||||||||||||||||
|
Passenger
revenue
|
Percentage
|
Passenger
revenue
|
Percentage
|
Change in
passenger
revenue
|
||||||||||||||||
|
RMB million
|
%
|
RMB million
|
%
|
%
|
||||||||||||||||
|
Domestic
|
58,155 | 84.7 | 43,033 | 86.0 | 35.1 | |||||||||||||||
|
Hong Kong, Macau and Taiwan
|
1,521 | 2.2 | 1,000 | 2.0 | 52.1 | |||||||||||||||
|
International
|
9,028 | 13.1 | 6,026 | 12.0 | 49.8 | |||||||||||||||
|
Passenger revenue
|
68,704 | 100.0 | 50,059 | 100.0 | 37.2 | |||||||||||||||
Substantially all of the Group’s operating revenue is attributable to airline and airline related operations. Traffic revenue accounted for 96.9% and 96.7% of total operating revenue in 2010 and 2009, respectively. Passenger revenue and cargo and mail revenue accounted for 92.7% and 7.3%, respectively of the total traffic revenue in 2010. The other operating revenue is mainly derived from commission income, income from general aviation operations, fees charged for ground services rendered to other Chinese airlines and income from expired sales in advance of carriage.
The increase in operating revenue was primarily due to a 37.2% increase in passenger revenue from RMB50,059 million in 2009 to RMB68,704 million in 2010. The total number of passengers carried increased by 15.4% to 76.46 million passengers in 2010. RPKs increased by 19.7% from 93,002 million in 2009 to 111,328 million in 2010, primarily as a result of the increase in number of passengers carried. Passenger yield per RPK increased from RMB0.54 in 2009 to RMB0.62 in 2010.
Domestic passenger revenue, which accounted for 84.7% of the total passenger revenue in 2010, increased by 35.1% from RMB43,033 million in 2009 to RMB58,155 million in 2010. Domestic passenger traffic in RPKs increased by 16.5%, while passenger capacity in ASKs increased by 11.4%, resulting in an increase in passenger load factor by 3.5 percentage point from 76.6% in 2009 to 80.1% in 2010. Domestic passenger yield per RPK increased from RMB0.53 in 2009 to RMB0.62 in 2010, mainly resulted from the increase of domestic passenger revenue and fuel surcharge income during the year.
Hong Kong, Macau and Taiwan passenger revenue, which accounted for 2.2% of total passenger revenue, increased by 52.1% from RMB1,000 million in 2009 to RMB1,521 million in 2010. For Hong Kong, Macau and Taiwan flights, passenger traffic in RPKs increased by 33.7%, while passenger capacity in ASKs increased by 22.8%, resulting in an increase in passenger load factor by 6.2 percentage points from 69.8% in 2009 to 76.0% in 2010. Passenger yield per RPK increased from RMB0.75 in 2009 to RMB0.85 in 2010, mainly resulted from the increase of Hong Kong, Macau and Taiwan passenger revenue.
39
International passenger revenue, which accounted for 13.1% of total passenger revenue, increased by 49.8% from RMB6,026 million in 2009 to RMB9,028 million in 2010. For international flights, passenger traffic in RPKs increased by 41.6%, while passenger capacity in ASKs increased by 28.6%, resulting in a 6.9 percentage point increase in passenger load factor from 67.9% in 2009 to 74.8% in 2010. Passenger yield per RPK increased from RMB0.55 in 2009 to RMB0.58 in 2010, mainly resulted from the increase in international passenger revenue and fuel surcharge income during the year.
Cargo and mail revenue, which accounted for 7.3% of the Group’s total traffic revenue and 7.1% of total operating revenue, increased by 86.9% from RMB2,908 million in 2009 to RMB5,436 million in 2010. The increase was attributable to the increase in cargo traffic volume and fuel surcharge income.
Other operating revenue increased by 28.3% from RMB1,835 million in 2009 to RMB2,355 million in 2010. The increase was primarily due to the general growth in income from various auxiliary operations.
Operating expenses
Total operating expenses in 2010 amounted to RMB70,685 million, representing an increase of 27.7% or RMB15,334 million over 2009, primarily due to the total effect of increases in jet fuel costs, landing and navigation fees, maintenance expenses and other operating costs. Total operating expenses as a percentage of total operating revenue decreased from 101.0% in 2009 to 92.4% in 2010.
|
2010
|
2009
|
Change in
operating
expenses
|
||||||||||||||||||
|
RMB
million
|
Percentage
|
RMB
million
|
Percentage
|
Percentage
|
||||||||||||||||
|
Flight operations
|
38,593 | 54.6 | 29,296 | 52.9 | 31.7 | |||||||||||||||
|
Mainly including: Jet fuel costs
|
23,492 | 16,390 | 43.3 | |||||||||||||||||
|
Operating lease charges
|
5,298 | 5,123 | 3.4 | |||||||||||||||||
|
Flight personnel payroll and welfare
|
3,420 | 2,622 | 30.4 | |||||||||||||||||
|
Maintenance
|
5,586 | 7.9 | 4,446 | 8.0 | 25.6 | |||||||||||||||
|
Aircraft and traffic servicing
|
10,968 | 15.5 | 9,169 | 16.6 | 19.6 | |||||||||||||||
|
Promotion and sales
|
5,555 | 7.9 | 4,170 | 7.5 | 33.2 | |||||||||||||||
|
General and administrative
|
2,266 | 3.2 | 1,844 | 3.3 | 22.9 | |||||||||||||||
|
Impairment on property, plant and equipment
|
212 | 0.3 | 26 | 0.1 | 715.4 | |||||||||||||||
|
Depreciation and amortisation
|
7,061 | 10.0 | 5,971 | 10.8 | 18.3 | |||||||||||||||
|
Others
|
444 | 0.6 | 429 | 0.8 | 3.5 | |||||||||||||||
|
Total operating expenses
|
70,685 | 100.0 | 55,351 | 100.0 | 27.7 | |||||||||||||||
Flight operations expenses, which accounted for 54.6% of total operating expenses, increased by 31.7% from RMB29,296 million in 2009 to RMB38,593 million in 2010, primarily as a result of increase in jet fuel costs because greater consumption of jet fuel and increase in average fuel prices. Jet fuel costs, which accounted for 60.9% of flight operations expenses, increased by 43.3% from RMB16,390
million in 2009 to RMB23,492 million in 2010.
Maintenance expenses, which accounted for 7.9% of total operating expenses, increased by 25.6% from RMB4,446 million in 2009 to RMB5,586 million in 2010. The increase was mainly due to the increase in number of engines repaired and routine maintenance during the year.
Aircraft and traffic servicing expenses, which accounted for 15.5% of total operating expenses, increased by 19.6% from RMB9,169 million in 2009 to RMB10,968 million in 2010. The increase was primarily due to a 15.1% rise in landing and navigation fees from RMB6,772 million in 2009 to RMB7,792 million in 2010, resulted from the increase in number of flights.
Promotion and sales expenses, which accounted for 7.9% of total operating expenses, increased by 33.2% from RMB4,170 million in 2009 to RMB5,555 million in 2010.
General and administrative expenses, which accounted for 3.2% of the total operating expenses, increased by 22.9% from RMB1,844 million in 2009 to RMB2,266 million in 2010.
Impairment on property, plant and equipment increased by RMB186 million from RMB26 million in 2009 to RMB212 million in 2010.
40
Depreciation and amortization, which accounted for 10.0% of total operating expenses, increased by 18.3% from RMB5,971 million in 2009 to RMB7,061 million in 2010, mainly due to the additional depreciation charges on aircraft delivered in 2010.
Operating profit
Operating profit of RMB6,286 million was recorded in 2010 (2009: RMB1,440 million). The increase in profit was mainly due to the net effect of increase in operating revenue by RMB21,693 million or 39.6% in 2010 and increase in operating expenses by RMB15,334 million or 27.7%.
Other (expenses)/income
Other net income decreased from RMB1,989 million in 2009 to RMB476 million in 2010, down by 76.1%, mainly due to the receipt of CAAC Infrastructure Development Fund contributions of RMB1,328 million in 2009, and there was no such refund in 2010.
Interest expense decreased by RMB232 million from RMB1,497 million in 2009 to RMB1,265 million in 2010 was mainly due to the decrease in average effective interest rate, which ranged from 1.55% to 3.30% in 2009 while ranged from 1.13% to 1.97% in 2010.
In 2009, the Company entered into an agreement with CSAHC to dispose of its entire equity interest in Zhuhai MTU with carrying amount of RMB529 million to CSAHC. As of December 31,2009, the investment in Zhuhai MTU was classified as asset held for sale. The sale was completed in February 2010 and the Company recorded a gain of RMB1,078 million in 2010.
Income tax (expense)/benefit
Income tax expense of RMB1, 678 million was recorded in 2010 as compared to an income tax benefit of RMB95 million in 2009.
2009 compared with 2008
The profit attributable to equity shareholders of the Company of RMB330 million was recorded in 2009 as compared to the loss attributable to equity shareholders of the Company of RMB4,823 million in 2008, mainly due to the increase in revenue excluding fuel surcharge income and the decrease in fuel costs, which exceeded the drop in fuel surcharge income. Due to the decrease of fuel cost, the Group’s operating costs decreased sharply. The Group’s operating revenue decreased by RMB486 million or 0.9% from RMB55,288 million in 2008 to RMB54,802 million in 2009 resulting from the decrease in fuel surcharge income. Excluding the fuel surcharge income of RMB8,197 million and RMB1,986 million for 2008 and 2009, operating revenue increased from RMB47,091 million in 2008 to RMB52,816 million in 2009. Passenger load factor increased by 1.5 percentage point, from 73.8% in 2008 to 75.3% in 2009. Passenger yield (in passenger revenue per RPK) decreased by RMB0.07 or 11.5% from RMB0.61 in 2008 to RMB0.54 in 2009. Average yield (in traffic revenue per RTK) decreased by 10.2% from RMB5.86 in 2008 to RMB5.26 in 2009. Operating expenses decreased by RMB6,416 million or 10.4% from RMB61,767 million in 2008 to RMB55,351 million in 2009 due to the decrease of fuel cost from RMB23,086 million in 2008 to RMB16,390 million in 2009. As a result of the decrease in operating expenses, operating profit of RMB1,440 million was recorded in 2009 as compared to operating loss of RMB5,646 million in 2008.
|
2009
|
2008
|
|||||||||||||||||||
|
Operating
revenue
|
Percentage
|
Operating
revenue
|
Percentage
|
Change in
revenue
|
||||||||||||||||
|
RMB million
|
%
|
RMB million
|
%
|
%
|
||||||||||||||||
|
Traffic revenue
|
52,967
|
96.7
|
53,913
|
97.5
|
(1.8
|
)
|
||||||||||||||
|
Including: Passenger revenue
|
50,059
|
50,412
|
(0.7
|
)
|
||||||||||||||||
|
– Domestic
|
43,033
|
41,854
|
2.8
|
|||||||||||||||||
|
– Hong Kong, Macau and Taiwan
|
1,000
|
952
|
5.0
|
|||||||||||||||||
|
– International
|
6,026
|
7,606
|
(20.8
|
)
|
||||||||||||||||
|
Cargo and mail revenue
|
2,908
|
3,501
|
(16.9
|
)
|
||||||||||||||||
|
Other operating revenue
|
1,835
|
3.3
|
1,375
|
2.5
|
33.5
|
|||||||||||||||
|
Mainly including: Commission income
|
342
|
317
|
7.9
|
|||||||||||||||||
|
Ground services income
|
320
|
250
|
28.0
|
|||||||||||||||||
|
Expired sales in advance of carriage
|
350
|
276
|
26.8
|
|||||||||||||||||
|
Total operating revenue
|
54,802
|
100.0
|
55,288
|
100.0
|
(0.9
|
)
|
||||||||||||||
|
Less: fuel surcharge income
|
(1,986
|
)
|
(8,197
|
)
|
(75.8
|
)
|
||||||||||||||
|
Total operating revenue excluding fuel surcharge
|
52,816
|
47,091
|
12.2
|
|||||||||||||||||
41
Traffic revenue composition
|
2009
|
2008
|
|||||||||||||||||||
|
Traffic
revenue
|
Percentage
|
Traffic
revenue
|
Percentage
|
Change
in traffic
revenue
|
||||||||||||||||
|
RMB
million
|
%
|
RMB
million
|
%
|
%
|
||||||||||||||||
|
Passenger Revenue
|
50,059
|
94.5
|
50,412
|
93.5
|
(0.7
|
)
|
||||||||||||||
|
Cargo and Mail Revenue
|
2,908
|
5.5
|
3,501
|
6.5
|
(16.9
|
)
|
||||||||||||||
|
Traffic revenue
|
52,967
|
100.0
|
53,913
|
100.0
|
(1.8
|
)
|
||||||||||||||
Passenger revenue composition
|
2009
|
2008
|
|||||||||||||||||||
|
Passenger
revenue
|
Percentage
|
Passenger
revenue
|
Percentage
|
Change in
passenger
revenue
|
||||||||||||||||
|
RMB
million
|
%
|
RMB
million
|
%
|
%
|
||||||||||||||||
|
Domestic
|
43,033
|
86.0
|
41,854
|
83.0
|
2.8
|
|||||||||||||||
|
Hong Kong, Macau and Taiwan
|
1,000
|
2.0
|
952
|
1.9
|
5.0
|
|||||||||||||||
|
International
|
6,026
|
12.0
|
7,606
|
15.1
|
(20.8
|
)
|
||||||||||||||
|
Passenger revenue
|
50,059
|
100.0
|
50,412
|
100.0
|
(0.7
|
)
|
||||||||||||||
Substantially all of the Group’s operating revenue is attributable to airline and airline related operations. Traffic revenue accounted for 96.7% and 97.5% of total operating revenue in 2009 and 2008 respectively. Passenger revenue and cargo and mail revenue accounted for 94.5% and 5.5% respectively of the total traffic revenue in 2009. The other operating revenue is mainly derived from commission income, income from general aviation operations, fees charged for ground services rendered to other Chinese airlines and income from expired sales in advance of carriage.
The decrease in operating revenue was primarily due to a 0.7% decrease in passenger revenue from RMB50,412 million in 2008 to RMB50,059 million in 2009. The total number of passengers carried increased by 13.8% to 66.28 million passengers in 2009. RPKs increased by 11.8% from 83,184 million in 2008 to 93,002 million in 2009, primarily as a result of the increase in number of passengers carried. Passenger yield per RPK decreased from RMB0.61 in 2008 to RMB0.54 in 2009. Passenger revenue and passenger yield per RPK decreased mainly due to the decrease in fuel surcharge income.
Fuel surcharge income, which accounted for 3.6% and 14.8% of total operating revenue in 2009 and 2008, decreased by 75.8% or RMB6,211 million, from RMB8,197 million in 2008 to RMB1,986 million in 2009. On January 14, 2009, the National Development and Reform Commission (NDRC) and the CAAC jointly announced the suspension of the collection of passenger fuel surcharge since January 15, 2009. On November 11, 2009, the NDRC and the CAAC announced to resume the collection of fuel surcharge income and issued a new pricing mechanism, which was effective on November 14, 2009. Under the new pricing mechanism, domestic airline companies could adjust the fuel surcharge level within a prescribed range set by the pricing mechanism without prior approval of the relevant authorities. In addition, the Group reduced the fuel surcharge level of international routes in view of the decrease in fuel prices.
Domestic passenger revenue, which accounted for 86.0% of the total passenger revenue in 2009, increased by 2.8% from RMB41,854 million in 2008 to RMB43,033 million in 2009. Passenger capacity in ASKs increased by 12.8%, while domestic passenger traffic in RPKs increased by 14.3%, resulting in an increase in passenger load factor by 1.0 percentage point from 75.6% in 2008 to 76.6% in 2009. Domestic passenger yield per RPK decreased from RMB0.59 in 2008 to RMB0.53 in 2009.
Hong Kong, Macau and Taiwan passenger revenue, which accounted for 2.0% of total passenger revenue, increased by 5.0% from RMB952 million in 2008 to RMB1,000 million in 2009. For Hong Kong, Macau and Taiwan flights, passenger capacity in ASKs increased by 7.0%, while passenger traffic in RPKs increased by 17.4%, resulting in an increase in passenger load factor by 6.2 percentage points from 63.6% in 2008 to 69.8% in 2009. Passenger yield per RPK decreased from RMB0.84 in 2008 to RMB0.75 in 2009, mainly resulted from the decrease of fuel surcharge income and stronger competition in the region during the year.
International passenger revenue, which accounted for 12.0% of total passenger revenue, decreased by 20.8% from RMB7,606 million in 2008 to RMB6,026 million in 2009. For international flights, passenger capacity in ASKs decreased by 8.2%, while passenger traffic in RPKs decreased by 4.0%, resulting in a 3.0 percentage point increase in passenger load factor from 64.9% in 2008 to 67.9% in 2009. Passenger yield per RPK decreased by 17.9% from RMB0.67 in 2008 to RMB0.55 in 2009, mainly due to the decrease in fuel surcharge income and stronger competition in international routes during the year.
42
Cargo and mail revenue, which accounted for 5.5% of the Group’s total traffic revenue and 5.3% of total operating revenue, decreased by 16.9% from RMB3,501 million in 2008 to RMB2,908 million in 2009. The decrease was attributable to reduced cargo traffic demand under global financial crisis.
Other operating revenue increased by 33.5% from RMB1,375 million in 2008 to RMB1,835 million in 2009. The increase was primarily due to the general growth in income from various auxiliary operations.
Operating expenses
Total operating expenses in 2009 amounted to RMB55,351 million, representing a decrease of 10.4% or RMB6,416 million over 2008, primarily due to the total effect of decreases in jet fuel costs and impairment on property, plant and equipment. Total operating expenses as a percentage of total operating revenue decreased from 111.7% in 2008 to 101.0% in 2009.
|
2009
|
2008
|
Change in
operating
expenses
|
||||||||||||||||||
|
RMB
million
|
Percentage
|
RMB
million
|
Percentage
|
%
|
||||||||||||||||
|
Flight operations
|
29,296
|
52.9
|
34,982
|
56.6
|
(16.3
|
)
|
||||||||||||||
|
Mainly including: Jet fuel costs
|
16,390
|
23,086
|
(29.0
|
)
|
||||||||||||||||
|
Operating lease charges
|
5,123
|
4,527
|
13.2
|
|||||||||||||||||
|
Flight personnel payroll and welfare
|
2,622
|
2,490
|
5.3
|
|||||||||||||||||
|
Maintenance
|
4,446
|
8.0
|
4,890
|
7.9
|
(9.1
|
)
|
||||||||||||||
|
Aircraft and traffic servicing
|
9,169
|
16.6
|
8,476
|
13.7
|
8.2
|
|||||||||||||||
|
Promotion and sales
|
4,170
|
7.5
|
3,491
|
5.7
|
19.5
|
|||||||||||||||
|
General and administrative
|
1,844
|
3.3
|
2,041
|
3.3
|
(9.7
|
)
|
||||||||||||||
|
Impairment on property, plant and equipment
|
26
|
0.1
|
1,884
|
3.1
|
(98.6
|
)
|
||||||||||||||
|
Depreciation and amortisation
|
5,971
|
10.8
|
5,746
|
9.3
|
3.9
|
|||||||||||||||
|
Others
|
429
|
0.8
|
257
|
0.4
|
66.9
|
|||||||||||||||
|
Total operating expenses
|
55,351
|
100.0
|
61,767
|
100.0
|
(10.4
|
)
|
||||||||||||||
Flight operations expenses, which accounted for 52.9% of total operating expenses, decreased by 16.3% from RMB34,982 million in 2008 to RMB29,296 million in 2009, primarily as a result of significant decrease in jet fuel costs. Jet fuel costs, which accounted for 55.9% of flight operations expenses, decreased by 29.0% from RMB23,086 million in 2008 to RMB16,390 million in 2009 mainly as a result of decrease in average fuel costs by 35.3%.
Maintenance expenses, which accounted for 8.0% of total operating expenses, decreased by 9.1% from RMB4,890 million in 2008 to RMB4,446 million in 2009. The decrease was mainly due to the decrease in number of engines repaired during the year.
Aircraft and traffic servicing expenses, which accounted for 16.6% of total operating expenses, increased by 8.2% from RMB8,476 million in 2008 to RMB9,169 million in 2009. The increase was primarily due to a 10.4% rise in landing and navigation fees from RMB6,135 million in 2008 to RMB6,772 million in 2009, due to the increase in number of flights.
Promotional and sales expenses, which accounted for 7.5% of total operating expenses, increased by 19.5% from RMB3,491 million in 2008 to RMB4,170 million in 2009, which is in line with the increase in operating revenue excluding fuel surcharge income.
General and administrative expenses, which accounted for 3.3% of the total operating expenses, decreased by 9.7% from RMB2,041 million in 2008 to RMB1,844 million in 2009. The decrease was due to stricter cost control implemented by the Group in 2009.
Impairment on property, plant and equipment decreased by RMB1,858 million from RMB1,884 million in 2008 to RMB26 million in 2009. Please see Note 20(g) to the Financial Statements for more details.
Depreciation and amortization, which accounted for 10.8% of total operating expenses, increased by 3.9% from RMB5,746 million in 2008 to RMB5,971 million in 2009, mainly due to the additional depreciation charges on aircraft delivered in 2009.
43
Operating profit/(loss)
Operating profit of RMB1,440 million was recorded in 2009 as compared to operating loss of RMB5,646 million in 2008. The increase in profit was mainly due to the net effect of decrease in operating revenue by RMB486 million or 0.9% in 2009, decrease in operating expenses by RMB6,416 million or 10.4% and the receipt of CAAC Infrastructure Development Fund contributions of RMB1,328 million in 2009.
Other (expenses)/income
Interest expense decreased by 24.7% from RMB1,987 million in 2008 to RMB1,497 million in 2009, mainly due to the decrease in average effective interest rate of bank and other loans and obligations under finance leases.
Net exchange gain decreased by RMB2,499 million, from RMB2,592 million in 2008 to RMB93 million in 2009 because the exchange rate of RMB against USD was relatively stable in 2009 while RMB appreciated significantly against USD in 2008.
Taxation
Income tax benefit of RMB 95 million was recorded in 2009 as compared to an income tax expense of RMB 62 million in 2008, mainly due to the utilization of unused tax losses not recognized in prior year.
Liquidity and Capital Resources
Generally, the Group meets its working capital and capital expenditure requirements through cash from its operations, the proceeds of certain long-term and short-term bank loans, capital lease financing and rebates available under certain of the Group’s aircraft leases.
In addition, the Company received approximately RMB10,572 million proceeds from its non-public offerings of 1,501,500,000 A shares to CSAHC and certain third party investors in October 2010, and 312,500,000 H shares to Nan Lung in November 2010.
As of December 31, 2010, the Group had banking facilities with several PRC commercial banks for providing loan finance up to an approximate amount of RMB 146,702 million to the Group. As of December 31, 2010, an approximate amount of RMB39,173 million was utilized. As of December 31, 2010 and 2009, the Group’s cash and cash equivalents totaled RMB10,404 million and RMB4,343 million, respectively.
Net cash inflows from operating activities in 2010, 2009 and 2008 were RMB11,442 million, RMB8,959 million and RMB1,155 million, respectively. Operating cash inflows of the Group are primarily derived from the provision of air transportation and related service for customers. The vast majority of tickets are purchased prior to the day on which transportation is provided. Operating cash outflows primarily are related to the recurring operating expenses, including flight operation, maintenance, aircraft and traffic servicing, etc.
Net cash used in investing activities in 2010, 2009 and 2008 was RMB11,568 million, RMB14,478 million and RMB7,790 million, respectively. Cash capital expenditures in 2010, 2009 and 2008 were RMB13,469 million, RMB15,007 million and RMB8,364 million, respectively, reflecting predominantly additional investments in aircraft and flight equipment under the Group’s fleet expansion plans and Guangzhou new airport, and, to a small extent, additional investments in other facilities and buildings used in operations.
Financing activities resulted in net cash inflows of RMB6,187 million, RMB5,213 million and RMB7,460 million in 2010, 2009 and 2008, respectively. Net cash (outflow)/inflow from new bank loans, short-term financing bills and repayments amounted to RMB(2,876) million, RMB3,750 million and RMB9,667 million in 2010, 2009 and 2008, respectively. The additions of bank loans were used for capital expenditures and general working capital. Repayment of capital leases in 2010, 2009 and 2008 was RMB1,505 million, RMB1,750 million and RMB2,335 million, respectively, resulting from the aircraft acquisitions under capital leases.
As of December 31, 2010, the Group’s aggregate long-term bank and other loans and obligations under capital leases (including loans and capital leases obligations due within one year) totaled RMB52,062 million. In 2011, 2012, 2013, 2014 and thereafter, amounts payable under such loans and obligations will be RMB7,410 million, RMB12,134 million, RMB8,370 million, RMB3,420 million and RMB 20,728 million respectively. Such borrowings were denominated in United States dollars with a significant portion being floating interest rate borrowings. In the normal course of business, the Group is exposed to fluctuations in foreign currencies. The Group’s exposure to foreign currencies primarily results from its foreign currency liabilities. Depreciation or appreciation of the Renminbi against foreign currencies affects the Group’s results significantly because the Group’s foreign currency payments generally exceed its foreign currency receipts. The Group is not able to hedge its foreign currency exposure effectively other than by retaining its foreign currency denominated earnings and receipts to the extent permitted by the SAFE, or subject to certain restrictive conditions, entering into forward foreign exchange contracts with authorized banks.
As of December 31, 2010, the Group’s short-term bank loans were RMB3,568 million. The Group’s weighted average interest rate on short-term bank loans was 1.78% per annum as of December 31, 2010. The primary use of the proceeds of the Group’s short-term bank loans is to finance working capital and capital expenditure needs. The Group has generally been able to arrange short-term bank loans with domestic banks in China as necessary and believes it can continue to obtain them based on its well-established relationships with various lenders.
44
As of December 31, 2010, the Group had obligations under operating leases totaling RMB25,977 million, predominately for aircraft. Of such amount, RMB4,068 million, RMB4,036 million, RMB3,527 million, RMB3,225 million, RMB2,925 million, and RMB8,196 million respectively, is due in 2011, 2012, 2013, 2014, 2015 and thereafter.
As of December 31, 2010, the Group had a working capital deficit of RMB16,466 million, as compared to a working capital deficit of RMB28,441 million as of December 31, 2009. Historically, the Group operated in a negative working capital position, relying on cash inflow from operating activities and renewal of short-term bank loans to meet its short-term liquidity and working capital needs. The decrease in the Group’s working capital deficit from 2009 to 2010 was mainly because the Group sought increased long-term bank loans to finance its aircraft acquisitions and the Group received proceeds from the non-public offering mentioned above in 2010. In 2011 and thereafter, the liquidity of the Group is primarily dependent on its ability to maintain adequate cash inflows from operations to meet its debt obligations as they fall due, and its ability to obtain adequate external financing to meet its committed future capital expenditure. As of December 31, 2010, the Group had banking facilities with several PRC commercial banks for providing loan finance up to approximately RMB146,702 million (2009: RMB128,175 million), of which approximately RMB39,173 million (2009: RMB50,455 million) was utilised.
The directors of the Company have carried out a detailed review of the cash flow forecast of the Group for the twelve months ending 31 December 2011. Based on such forecast, the directors have determined that adequate liquidity exists to finance the working capital and capital expenditure requirements of the Group during that period. In preparing the cash flow forecast, the directors have considered historical cash requirements of the Group as well as other key factors, including the availability of the above-mentioned loan finance which may impact the operations of the Group during the next twelve-month period. The directors are of the opinion that the assumptions and sensitivities which are included in the cash flow forecast are reasonable. However, as with all assumptions in regard to future events, these are subject to inherent limitations and uncertainties and some or all of these assumptions may not be realised.
As the Group is subject to a high degree of operating leverage, a minor decrease in the Group’s yield and/or load factor could result in a significant decrease in its operating revenue and hence its operating cash flows. This could arise in such circumstances as where competition between Chinese airlines increases or where PRC aviation demand decreases. Similarly, a minor increase in the jet fuel prices, particularly in the domestic market, could result in a significant increase in the Group’s operating expenses and hence a significant decrease in its operating cash flows. This could be caused by fluctuations in supply and demand in international oil market. Currently, the Group’s existing loans and lease facilities do not contain any financial covenants. Nevertheless, as the Group is subject to a high degree of financial leverage, an adverse change in the Group’s operating cash flows could adversely affect its financial health and hence weaken its ability to obtain additional loans and lease facilities and to renew its short-term bank loans facilities as they fall due.
As of December 31, 2010, the Group had capital commitments as follows:
|
2011
|
2012
|
2013
|
2014
|
2015
and
afterwards
|
Total
|
|||||||||||||||||||
|
(RMB million)
|
||||||||||||||||||||||||
|
Acquisition of aircraft and related
equipment
|
20,445
|
20,033
|
15,980
|
10,720
|
6,731
|
73,909
|
||||||||||||||||||
|
Others
|
2,283
|
423
|
-
|
-
|
-
|
2,706
|
||||||||||||||||||
|
Total capital commitments
|
22,728
|
20,456
|
15,980
|
10,720
|
6,731
|
76,615
|
||||||||||||||||||
Others mainly represent airport and office facilities and equipment, overhaul and maintenance bases and training facilities.
As of December 31, 2010, the cash and cash equivalents of the Group totaled RMB10,404 million. Of such balance, 13% was denominated in US Dollars, Hong Kong Dollars, Australian Dollars, Japanese Yen and other foreign currencies.
In view of the unutilized bank facilities of RMB107,529 million, the Group expects that it will have sufficient funding sources to meet its cash requirements in the foreseeable future.
Research and Development, Patents and Licenses, etc.
None.
Trend Information
Other than as disclosed in the foregoing disclosures and elsewhere in this annual report, we are not aware of any trends, uncertainties, demands, commitments or events for the period from January 1, 2011 to December 31, 2011 that are reasonably likely to have a material adverse effect on our net revenues, income, profitability, liquidity or capital resources, or that would cause our disclosed financial information to be not necessarily indicative of future operating results or financial conditions.
45
Off-Balance Sheet Arrangements
We have not entered into any off-balance sheet arrangements that have or are reasonably likely to have a current or future effect on the Company’s financial condition that is material to investors. In particular, we (i) have not entered into any financial guarantees or other commitments to guarantee the payment obligations of any unconsolidated entity; (ii) have not entered into any derivative contracts that are both indexed to our own stock and classified in stockholders’ equity, or not reflected in our statement of financial position; and (iii) do not have any retained or contingent interest in assets transferred to an unconsolidated entity that serves as credit, liquidity or market risk support to such entity.
Contractual Obligations and Commitments
The following table sets forth the Group’s obligations and commitments to make future payments under contracts and under commitments as of December 31, 2010.
|
As of December 31, 2010
Payment due by period
|
As of
December
31, 2009
|
|||||||||||||||||||||||
|
Total
|
Less
than
1 year
|
1-3
years
|
3-5
years
|
After 5
years
|
Total
|
|||||||||||||||||||
|
Short-term bank loans (note 1)
|
3,594 | 3,594 | - | - | - | 11,094 | ||||||||||||||||||
|
Long-term bank and other loans (note 1)
|
39,872 | 6,380 | 18,139 | 5,059 | 10,294 | 36,014 | ||||||||||||||||||
|
Bills payable
|
104 | 104 | - | - | - | 3,207 | ||||||||||||||||||
|
Obligations under capital leases
|
15,921 | 2,015 | 3,736 | 3,881 | 6,289 | 15,812 | ||||||||||||||||||
|
Operating lease commitments
|
25,977 | 4,068 | 7,563 | 6,150 | 8,196 | 30,366 | ||||||||||||||||||
|
Aircraft purchase commitments (Note 2)
|
73,909 | 20,445 | 36,013 | 17,451 | - | 65,843 | ||||||||||||||||||
|
Other capital commitments
|
2,706 | 2,283 | 423 | - | - | 1,861 | ||||||||||||||||||
|
Total
|
162,083 | 38,889 | 65,874 | 32,541 | 24,779 | 164,197 | ||||||||||||||||||
The following table sets forth certain information concerning directors, senior management and supervisors of the Company in 2010:
|
Name
|
Position
|
Gender
|
Age
|
|||
|
Si Xian Min
(1)
|
Chairman of the Board, Non-executive Director
|
Male
|
54
|
|||
|
Li Wen Xin
|
Non-executive Director
|
Male
|
61
|
|||
|
Wang Quan Hua
|
Non-executive Director
|
Male
|
57
|
|||
|
Liu Bao Heng
(2)
|
Former non-executive Director
|
Male
|
61
|
|||
|
Tan Wan Geng
|
Executive Director
|
Male
|
47
|
|||
|
Zhang Zi Fang
|
Executive Director
|
Male
|
53
|
|||
|
Xu Jie Bo
|
Executive Director
|
Male
|
46
|
|||
|
Chen Zhen You
|
Executive Director
|
Male
|
59
|
|||
|
Wei Jin Cai
(3)
|
Independent Non-executive Director
|
Male
|
61
|
|||
|
Ning Xiang Dong
(3)
|
Independent Non-executive Director
|
Male
|
45
|
|||
|
Wang Zhi
(4)
|
Former Independent Non-executive Director
|
Male
|
69
|
|||
|
Sui Guang Jun
(4)
|
Former Independent Non-executive Director
|
Male
|
50
|
|||
|
Gong Hua Zhang
|
Independent Non-executive Director
|
Male
|
65
|
|||
|
Lam Kwong Yu
|
Independent Non-executive Director
|
Male
|
67
|
|||
|
Sun Xiao Yi
(5)
|
Former Chairman of the Supervisory Committee
|
Male
|
57
|
|||
|
Pan Fu
(6)
|
Chairman of the Supervisory Committee
|
Male
|
48
|
|||
|
Li Jia Shi
|
Supervisor
|
Male
|
50
|
|||
|
Zhang Wei
|
Supervisor
|
Female
|
45
|
|||
|
Yang Yi Hua
|
Supervisor
|
Female
|
51
|
|||
|
Liang Zhong Gao
|
Supervisor
|
Male
|
55
|
|||
|
Ren Ji Dong
|
Executive Vice President
|
Male
|
46
|
|||
|
He Zong Kai
|
Executive Vice President
|
Male
|
60
|
|||
|
Liu Qian
|
Executive Vice President
|
Male
|
47
|
|||
|
Dong Su Guang
|
Executive Vice President
|
Male
|
57
|
|||
|
Chen Gang
|
Executive Vice President
|
Male
|
45
|
|||
|
Zhang Zheng Rong
|
Chief pilot
|
Male
|
49
|
|||
|
Hu Chen Jie
|
Chief Information Officer
|
Male
|
42
|
|||
|
Su Liang
|
Chief Economist
|
Male
|
49
|
|||
|
Zhang He Ping
(7)
|
Former Chief Engineer
|
Male
|
58
|
|||
|
Chen Wei Hua
|
Chief Legal Adviser
|
Male
|
45
|
|||
|
Xie Bing
|
Company Secretary
|
Male
|
38
|
46
(1) On December 29, 2010, Mr. Si Xian Min was appointed at the board meeting as the Chairman of the Sixth Session of the Board.
(2) On November 24, 2010, the resignation of Mr. Liu Bao Heng as a director of the board was approved at the board meeting.
(3) On December 29, 2010, Mr. Wei Jin Cai and Mr. Ning Xiang Dong were appointed at the second extraordinary general meeting for 2010 of the Company as independent non-executive directors of the Sixth Session of the Board.
(4) Mr. Wang Zhi and Mr. Sui Guang Jun did not stand for re-election and retired as independent non-executive directors upon the conclusion of the second extraordinary general meeting for 2010 of the Company, as they have continuously been appointed as the independent non-executive directors for more than six years.
(5) Mr. Sun Xiao Yi did not stand for re-election and retired as a supervisor of the Company upon the conclusion of the second extraordinary general meeting for 2010 of the Company due to job arrangement.
(6) On December 29, 2010, Mr. Pan Fu was elected as the Chairman of the Sixth Session of the Supervisory Committee of the Company at the first meeting of the Sixth Session of the Supervisory Committee.
(7) On June 11, 2010, the Board of the Company approved the cessation of Mr. Zhang He Ping as the Chief Engineer of the Company.
Since January 1, 2011 through the date of this Annual Report, there has been no change to the Directors, Senior Management or Supervisors.
BOARD OF DIRECTORS
Si Xian Min
, aged 54, graduated with an Executive Master of Business Administration (EMBA) degree from Tsinghua University. He began his career in 1975. Mr. Si served as the director of the political division of China Southern Airlines Henan Branch; as the party secretary and vice president of Guizhou Airlines Company Limited; as the Vice Party Secretary and secretary to the disciplinary committee of the Company; and as the Party Secretary of CSAHC Northern Division. He has been the President of the Company from October 2004 to January 2009. Since 31 December 2004, Mr. Si has been the director of the Company. Since January 2009, Mr. Si has been the President and Deputy Party Secretary of CSAHC and the Chairman of the Board.
Li Wen Xin
, aged 61, graduated with a university degree from the Party School of the Central Committee of CPC majoring in economic management and is a senior expert of political science. Mr. Li began his career in 1969. Mr. Li was the secretary to the disciplinary committee, deputy party secretary and vice president of China General Aviation Corporation; as the party secretary and vice general manager of the Shanxi branch of China Eastern Airlines Corporation Limited; as the vice party secretary and secretary to the disciplinary committee of China Eastern Air Holding Company; and as the chairman of the supervisory committee of China Eastern Airlines Corporation Limited. From September 2002 to September 2006, he was appointed as the party secretary and vice president of China Eastern Air Holding Company. Since September 2006, he has been the Party Secretary and Vice President of CSAHC. Mr. Li has been a director of the Company since 28 December 2006.
Wang Quan Hua
, aged 57, graduated with a university degree from the Party School of the Central Committee of CPC majoring in economic management. Mr. Wang began his career in 1972. Mr. Wang served as the Director of the Planning and Operation Division of CSAHC; the General Manager of Strategy and Development Department of CSAHC; the Assistant to the President and the Director of the Strategy and Development Department and the Vice President of Southern Airlines (Group) Company. Mr. Wang has served as the Executive Vice President of CSAHC since September 2002. Since 13 May 2003, Mr. Wang has been a director of the Company. Mr. Wang has been the chairman of SACM. Currently, Mr. Wang is also the director of Nan Lung, Solar Insurance Group Company Limited and China National Aviation Corp (HK) Ltd. and the non-executive director of TravelSky Technology Limited (#696). He is also a director of Asia Travel Investment Company Limited.
Tan Wan Geng
, aged 47, is an economist graduated from Zhongshan University, majoring in regional geography, with qualification of post graduate degree and a master degree in economics. Mr. Tan began his career in civil aviation in 1990 and has served as the head of the infrastructure department and director of human resources department of the Beijing Aircraft Maintenance and Engineering Corporation, the Deputy Director General of Human Resources Division (Personnel and Education Division) of the Civil Aviation Administration of China (CAAC), and has been the Director General and Party Secretary of Civil Aviation Administration of China Northeastern Region. He has been the Party Secretary and Vice President of the Company from February 2006 to January 2009. Mr. Tan has been a director of the Company since 15 June 2006 and the President of the Company since January 2009.
47
Zhang Zi Fang
, aged 53, graduated with an Executive Master of Business Administration (EMBA) degree from Tsinghua University and is a senior expert of political science. Mr. Zhang began his career in 1976. He served as the deputy commissar and subsequently the commissar of the pilot corps of China Northern Airlines Company; as the party secretary of the Jilin Branch of China Northern Airlines Company and the General Manager of Dalian Branch of CSAHC Northern Airlines. Mr. Zhang was the Director of Political Works Department of CSAHC and was the Vice Party Secretary and Secretary of the Disciplinary Committee of the Company from February 2005 to December 2007. He has been the Executive Vice President and the Vice Party Secretary of the Company from December 2007 to February 2009. He has been the Party Secretary and Executive Vice President of the Company since February 2009. Mr. Zhang has been a director of the Company since 30 June 2009. He is also the Vice Chairman of SACM.
Xu Jie Bo
, aged 46, graduated with a bachelor degree from Tianjin University majoring in infrastructure and engineering management, and was subsequently awarded with a master degree in Business Administration from Hong Kong Baptist University and an Executive Master of Business Administration (EMBA) degree from Tsinghua University and is a qualified senior accountant. Mr. Xu began his career in 1986. He served as the division head of the infrastructure and finance division, the deputy director and director of the financial department of Central and Southern China Civil Aviation Administration; as the General Manager of the Financial Department; as the Chief Accountant and the General Manager of the Financial Department of the Company. He has been a director and the Chief Financial Officer of the Company since April 2001 and a director, the Executive Vice President, the Chief Financial Officer and the Chief Accountant of the Company since August 2003. Mr. Xu is also the chairman of Guizhou Airlines Company Limited; the vice chairman of Xiamen Airlines Company Limited and the vice chairman of Sichuan Airlines Corporation Limited.
Chen Zhen You
, aged 59, graduated with an MBA degree from Murdoch University in Australia, an economist. Mr. Chen started his career in 1969. He worked as the vice director of the Office of International Affairs of Guangzhou Civil Aviation Administration; as the vice director of the Office of Overseas Business and the general manager of the Department of Foreign Affairs of the Company; and as the Office Director and the Director of the Planning and Investment Department of CSAHC. He has been the Chairman of the Labour Union of the Company since February 2005. Mr. Chen has been a director of the Company since 15 June 2006. He is also the chairman of Zhuhai Airlines.
Gong Hua Zhang
, aged 65, a senior accountant at professor level. With over 40 years of accounting experience, Mr. Gong had served as a Deputy Chief Accountant, a director of the Financial Bureau of China Petroleum Pipeline Bureau, a Financial Secretary of China National Petroleum Corporation and a Chief Accountant of China National Petroleum Corporation. He was a director of PetroChina Company Limited from October 1999 to May 2008, the Chairman of the Board of PetroChina Finance Company Limited from May 1999 to September 2009 and a Director of China Cheung Kong Electric Power Co., Ltd. from September 2002 to June 2010. Mr. Gong has been an independent non-executive director of the Company since 28 June 2007 and vice president of Accounting Society of China, member of the Accounting Standards Committee of the Ministry of Finance and member of China Valuation Standards Committee. He is also an independent director of China Shenhua Energy Company Limited (#1088), an external director of China Dongfang Electricity Group Company Limited, an independent director of Nanyang Commercial Bank (China) Company Limited and an independent director of China Railway Group Limited (#390).
Lam Kwong Yu
, aged 67, is an expert in the field of civil aviation. Mr. Lam served as the General Manager of the Hong Kong Airport, the Vice Director and Director of the Civil Aviation Department of Hong Kong Government, a Director of the Airport Authority Hong Kong and the Chairman of the Aviation Advisory Board of Hong Kong, member of the Selection Committee for the Hong Kong Special Administrative Region. Mr. Lam once served as the COO of K. Wah Management Services Limited and an independent non-executive director of Hong Kong Aircraft Engineering Company (#44). Mr. Lam has been an independent non-executive director of the Company since 28 June 2007. He is concurrently an independent non-executive director of Lei Shing Hong Limited, an independent director of New World First Bus Services Limited and Citybus Limited, and an independent non-executive director of Gold Joy Travel Holding Company.
Wei Jin Cai
, aged 61, graduated from the Party School of the Central Committee of CPC majoring in economics and management. Mr. Wei has many years of experiences in civil aviation. He conducted an in-depth study on the operation and management of civil aviation and is influential in the civil aviation industry. Mr. Wei served as the deputy party secretary of the Party Committee of Institution of the Civil Aviation Administration of China before he was appointed as the party secretary of Civil Aviation Management Institute of China from March 1993 to November 2008 and the president of Civil Aviation Management Institute of China from November 2008 to August 2010. Mr. Wei has been an independent non-executive director of the Company since 29 December 2010. He is concurrently also serves as an independent director of Shandong Airlines Company Limited.
Ning Xiang Dong
, aged 45, graduated from the Quantitative Economics Faculty of the School of Economics and Management of Tsinghua University with a doctor degree. Mr. Ning started his career in 1990 and served as the assistant, lecturer and associate professor at Tsinghua University and the executive vice director of the National Center for Economic Research (NCER) at Tsinghua University. He was also a visiting scholar at Harvard Business School, University of Illinois, University of New South Wales, University of Sydney and Chinese University of Hong Kong. He currently serves as a professor and a doctorate-tutor of the School of Economics and Management of Tsinghua University, and the executive director of Centre for Corporate Governance at Tsinghua University. He was previously appointed as an independent director of Datang Telecom Technology Co., Ltd. Mr. Ning has been an independent non-executive director of the Company since 29 December 2010. He is concurrently also serves as an independent director of four listed companies, namely, Shantui Construction Machine Co. Ltd, Hong Yuan Securities Co., Ltd., Goer Tek Inc. and Aerospace Hi-Tech Holding Group Co., Ltd.
48
SUPERVISORY COMMITTEE
As required by the Company Law of the PRC and the Articles of Association of the Company, the Company has a supervisory committee (the “Supervisory Committee”) which is primarily responsible for the supervision of senior management of the Company, including the Board, executive officers and other senior management personnel, to ensure that they act in the interests of the Company, its shareholders and employees, as well as in compliance with applicable law. The Supervisory Committee consists of five Supervisors. Three of the Supervisors are appointed by shareholders, and the other two Supervisors are representatives of the Company’s employees. The Supervisors serve terms of three years and may serve consecutive terms.
Pan Fu
, aged 48, graduated with a master degree from Chongqing University majoring in power systems and automation, and also a senior engineer. Mr. Pan started his career in 1986, and served successively as the Deputy Chief Engineer of Power Laboratory and the Deputy Head of the Planning Department of Yunnan Provincial Electric Power Bureau, the Deputy Director of the Planning & Development Department of Yunnan Electric Power Group Co., Ltd., the Deputy Director and Director of Kunming Power Plant, the Deputy Chief Engineer and Chief Engineer of Yunnan Electric Power Corporation from 1993 to 2003; the Deputy Director and Director of the Security Department of Supervision of China Southern Power Grid Company Ltd. from February 2003 to April 2004; the Director of the China Southern Power Grid Technology and Research Center from April 2004 to January 2005; the General Manager, the Party Member and the Deputy Secretary of The Party of the Guizhou Power Grid Corporation from January 2005 to November 2007; the Director of the Planning Development Department of China Southern Power Grid Company Ltd. from November 2007 to November 2010. He served as the Party Member and the Party Discipline Inspection Team leader of CSAHC since November 2010 and served as the supervisor of the Company and the chairman of the Supervisory Committee since 29 December 2010. He is also the Chairman of PCACL.
Li Jia Shi
, aged 50, graduated with an Executive Master of Business Administration (EMBA) degree from Tsinghua University, EMBA major. Mr. Li started his career in 1976. He served as the Deputy Head of the Organization Division of the Party Committee of the CSAHC from September 1994 to February 1998; Party Secretary and vice general manager of Guangzhou Nanland Air Catering Company Limited from February 1998 to April 1999; the Deputy Head of the Organization Division of the Party Committee of the Company from April to December 1999; and the Head of the Organization Division of the Party Committee of the Company from December 1999 to December 2003. He served as the deputy secretary of the disciplinary committee and the office director of the disciplinary committee of the Company from December 2003 to December 2007. Mr. Li has served as the Secretary and Director of Office of the Disciplinary Committee of the Company since December 2007, and a supervisor of the Company since June 2009. He currently is also the chairman of Southern Airlines Ka Yuen (Guangzhou) Aviation Supply Company Limited and Guangzhou Nanland Air Catering Company Limited.
Zhang Wei
, aged 45, graduated with a master degree from Tianjin University majoring in investment skills and economics and a senior accountant. Ms. Zhang started her career in 1988 and served as clerk at deputy director level of the Finance Department, the Manager of the Fixed Assets Office of the Finance Department, the General Manager Assistant and Vice General Manager of the Finance Department of the Company from 1995 to 2005; the Vice Director of the Supervisory Bureau and the Director of the Audit Division of CSAHC from August 2005 to July 2006; and the General Manager and Party Secretary of SA Finance from August 2006 to October 2007. Ms. Zhang had then been the Vice Director of the Supervisory Bureau and the Director of the Audit Division of CSAHC from October 2007 to August 2008. Since August 2008, she has been the Director of the Audit Division of CSAHC. Ms. Zhang has been a supervisor of the Company since June 2008. Ms. Zhang is currently also the Convener of the Supervisory Committee of SA Finance, the Chairman of Supervisory Committee of SAIETC, the Chairman of Supervisory Committee of China Southern Airlines Group Construction and Development Company Limited and the Chairman of the supervisory committee of SACM.
Yang Yi Hua
, aged 51, a Supervisor of the Company. Ms. Yang is the General Manager of the Audit Department of the Company and a Certified Internal Auditor. She has successively served as Deputy Manager of the Clearance and Settlement Office of the Financial Division of the Guangzhou Civil Aviation Administration, Manager of the Financial Office of the Company’s Financial Division, and Deputy General Manager of the Company’s Audit Department. Ms. Yang currently is also the Chairman of the Supervisory Committee of Xiamen Airlines, Guizhou Airlines, Guangzhou Baiyun International Logistic Company Limited (“Baiyun Logistic”) and Nan Lung International Freight Limited and a supervisor of Chongqing Airlines, Beijing Southern Airlines Ground Services Company Limited and SA Finance.
Liang Zhong Gao
, aged 55, a Supervisor and the Director of the Disciplinary Supervision Department of the Company. He is an expert of political science with university qualification. Mr. Liang once served as the Party Secretary and Deputy General Manager of the Guangzhou Sales Office of the Company, Deputy Party Secretary and Secretary of the Disciplinary Committee of the Passenger Traffic Department of the Company, Party Secretary of the Passenger Traffic Department of the Company and General Manager of the Aviation Service Quality Control Department of the Company.
SENIOR MANAGEMENT
Ren Ji Dong
, aged 46, is the Executive Vice President of the Company. He graduated from the School of Economics and Management of Tsinghua University with a master degree in Business Administration (EMBA), and he is a senior engineer. He served as the Deputy Director of Urumqi Civil Aviation Administration, the Vice President of Xinjiang Airlines, the Party Secretary and the Vice President of the Xinjiang Branch of the Company, the Executive Vice President of the Company from February 2005 to January 2007, and the President of the Xinjiang Branch of the Company from January 2007 to April 2009. He has served as the Executive Vice President of the Company since May 2009.
He Zong Kai, aged 60, is the Executive Vice President of the Company. Mr. He graduated from Beijing Foreign Language Institute majoring in French, and he is a senior economist. Mr. He served as the Deputy Manager of the Operation Department of the Company, Manager of Passenger Transportation Department, Head of Seats Arrangement Department, Vice General Manager of the Marketing Department and General Manager of the Ground Services Department, President and Deputy Party Secretary of Hubei Branch. Mr. He has been an Executive Vice President of the Company since March 2005. Currently, Mr. He is also the Chairman of Chongqing Airlines.
49
Liu Qian
, aged 47, is currently the Executive Vice President of the Company. Mr. Liu graduated from China Civil Aviation Flying College with majoring in aircraft piloting. Mr. Liu served the CAAC as an assistant researcher of the piloting skills supervision division of the piloting standards department, an assistant researcher of the operation supervision division, an assistant researcher of the piloting standards department, the Deputy Head of the Piloting Standards Division of the Piloting Standards Department, and the Deputy Chief Pilot and Chief Pilot of the Company. He has been the Executive Vice President of the Company since August 2007. Mr. Liu served as the Chairman of Zhuhai Xiang Yi Aviation Technology Company Limited, a jointly-controlled entity of the Company.
Dong Su Guang
, aged 57, is the Executive Vice President of the Company. Graduated from Northwestern Polytechnical University majoring in aircraft design, and he is an engineer. Mr. Dong used to be a Vice President of Guangzhou Aircraft Maintaining and Engineering Co., Ltd. (“GAMECO”, a jointly-controlled entity of the Company), as well as Chief Engineer and the General Manager of Engineering Department of the Company. He has been the Executive Vice President of the Company since December 2007. Mr. Dong is also the Chairman of Shantou Airlines, GAMECO and Shenyang Northern Aircraft Maintenance Engineering Co., Ltd.
Chen Gang
, aged 45, is the Executive Vice President of the Company. He graduated from Zhongnan Finance and Economics University majoring in Industrial Enterprise Management and the School of Economics and Management of Tsinghua University with a master degree in Business Administration (EMBA). He began his career in 1987. He served as the Vice Director of the Enterprise Management Department, the Manager of the Planning Enterprise Management Department, the Manager of Operation Department of Henan Branch of the Company, the Vice President of Henan Branch of the Company, the President of Hubei Branch of the Company, and the Director of Commercial Steering Committee of the Company from November 2005 to August 2009. He has been the Executive Vice President of the Company since August 2009. Currently, Mr. Chen is also the Chairman of CSN – ETC E-commerce Limited and Baiyun Logistics.
Zhang Zheng Rong
, aged 49, is the Chief Pilot of the Company. He graduated from China Civil Aviation Flying College majoring in aircraft piloting and the School of Economics and Management of Tsinghua University with a master degree in Business Administration (EMBA). Mr. Zhang used to serve as the Captain of the First Squadron of CAAC, the Deputy General Manager of the Flight Operations Division and the Captain of the First Squadron as well as the General Manager of the Aviation Safety Monitoring Division of the Company. He has been the General Manager of the Guangzhou Flight Operations Division of the Company. He has been the Chief Pilot of the Company since August 2007. Mr. Zhang is also a director of Aviation Data Communication Corporation.
Hu Chen Jie
, aged 42, is the Chief Information Officer of the Company and graduated from Beijing University Aeronautics and Astronautics majoring in information management. Mr. Hu used to be a software engineer in the Computer Center of CAAC, a senior software engineer in Wei Hong International Technology Company (Singapore), Deputy Director of the Computer Center of the Company, a senior project manager of SITA INC. (US) and the General Manager of CSN-ETC e-Commerce Limited. He has been the Chief Information Officer of the Company since June 2007. Mr. Hu is also a director of Guangzhou Aircraft Hang Yi Information Technology Co., Ltd. and Chairman of THITC.
Su Liang
, aged 49, is the Chief Economist of the Company, and graduated from the University of Cranfield, United Kingdom with a master degree in Air Transport Management Engineering and the School of Economics and Management of Tsinghua University with a master degree in Business Administration (EMBA). Mr. Su was in charge of the flight operations, planning and international cargo project of the Company. From July 2000 to November 2007, Mr. Su was the Company Secretary of the Company. He has been the Chief Economist of the Company since December 2007. Mr. Su is also the Chairman of China Southern West Australian Flying College Pty Ltd (a subsidiary of the Company) and the Director of Sichuan Airlines Corporation Limited.
Chen Wei Hua
, aged 45, is the Chief Legal Adviser. Mr. Chen graduated from the school of law of Peking University and the School of Economics and Management of Tsinghua University with a master degree in Business Administration (EMBA). He is a qualified solicitor in the PRC and a qualified corporate legal counsellor. Mr. Chen joined the aviation industry in 1988. He then joined CSAHC in January 1991. From 1997 to 2003, he served as Vice Director and Director of the Legal Affairs Office of the Company. Currently, he is the Director of the Legal Department of the Company. Mr. Chen has been the Chief Legal Adviser to the Company since January 2004. Currently, Mr. Chen is also the Director of Xiamen Airlines.
Xie Bing
, aged 38, the Company Secretary of the Company. He graduated from Nanjing University of Aeronautics and Astronautics, majoring in civil aviation management. He subsequently received a master degree of business administration, a master degree of international finance and a master degree in Business Administration (EMBA) from Jinan University, the University of Birmingham, Britain and School of Economics and Management of Tsinghua University, respectively. Mr. Xie used to work in the Planning and Development Department, Company Secretary Office of the Company and Office of CSAHC. He has been the Company Secretary since November 2007.
Save as disclosed above, none of the above Director or Supervisor or senior management of the Company has any relationship with any Directors, Supervisors, senior management, substantial shareholders of the Company.
Compensation
The aggregate compensation paid to all Directors, Supervisors and Senior Management for 2010 was RMB15,286,000. For the year ended December 31, 2010, the Company paid an aggregate of approximately RMB1,009,000 on behalf of its executive Directors, Supervisors and Senior Management pursuant to the pension scheme and the retirement plans operated by various municipal governments in which the Company participates.
50
Details of Directors’ and Supervisors’ emoluments for the year ended December 31, 2010 are set out below:
|
Directors’
fees
RMB’000
|
Salaries,
allowances
and benefits
in kind
RMB’000
|
Discretionary
bonus
RMB’000
|
Retirement
scheme
contributions
RMB’000
|
Total
RMB’000
|
||||||||||||||||
|
Non-executive directors
|
||||||||||||||||||||
|
Si Xian Min
|
- | - | - | - | - | |||||||||||||||
|
Li Wen Xin
|
- | - | - | - | - | |||||||||||||||
|
Wang Quan Hua
|
- | - | - | - | - | |||||||||||||||
|
Liu Bao Heng
|
- | - | - | - | - | |||||||||||||||
|
Executive directors
|
||||||||||||||||||||
|
Tan Wan Geng
|
- | 817 | 150 | 61 | 1,028 | |||||||||||||||
|
Zhang Zi Fang
|
- | 778 | 150 | 60 | 988 | |||||||||||||||
|
Xu Jie Bo
|
- | 706 | 100 | 60 | 866 | |||||||||||||||
|
Chen Zhen You
|
- | 706 | 100 | 59 | 865 | |||||||||||||||
|
Supervisors
|
||||||||||||||||||||
|
Pan Fu
|
- | - | - | - | - | |||||||||||||||
|
Sun Xiao Yi
|
- | - | - | - | - | |||||||||||||||
|
Li Jia Shi
|
- | 708 | 100 | 58 | 866 | |||||||||||||||
|
Zhang Wei
|
- | - | - | - | - | |||||||||||||||
|
Yang Yi Hua
|
- | 368 | 20 | 56 | 444 | |||||||||||||||
|
Liang Zhong Gao
|
- | 373 | 20 | 57 | 450 | |||||||||||||||
|
Independent non-executive directors
|
||||||||||||||||||||
|
Wang Zhi
|
- | - | - | - | - | |||||||||||||||
|
Sui Guang Jun
|
100 | - | - | - | 100 | |||||||||||||||
|
Gong Hua Zhang
|
100 | - | - | - | 100 | |||||||||||||||
|
Lam Kwong Yu
|
87 | - | - | - | 87 | |||||||||||||||
|
Wei Jin Cai
|
- | - | - | - | - | |||||||||||||||
|
Ning Xiang Dong
|
- | - | - | - | - | |||||||||||||||
|
Total
|
287 | 4,456 | 640 | 411 | 5,794 | |||||||||||||||
51
Board Practices
Each Director’s service contract with the Company or any of its subsidiaries provides prorated monthly salary upon termination of employment in accordance with his contract. The Director is entitled to paid leave in accordance with his contract. The term of office of a Director is three years. The term of office of the current Directors will end in 2013. A Director may serve consecutive terms upon re-election.
Audit Committee
The audit committee is appointed by the Board of Directors and consists of three independent non-executive Directors. The current members of the audit committee are Gong Hua Zhang, Wei Jin Cai and Ning Xiang Dong. Gong Hua Zhang is the chairman of the audit committee. The term of office of each member will end in 2013. A member may serve consecutive terms upon re-election. At least once a year, the committee is required to meet with the Company’s external auditors without any executive members of the Board in attendance. The quorum necessary for the transaction of any business is two committee members. The Audit Committee held nine meetings in 2010, which were attended by all members.
The Audit Committee is required, amongst other things, to oversee the relationship with the external auditors, to review the Group’s interim results and annual financial statements, to monitor compliance with statutory and listing requirements, to review the scope, if necessary, to engage independent legal or other advisers as it determines is necessary and to perform investigations. In addition, the Audit Committee also examines the effectiveness of the Company’s internal controls, which involves regular reviews of the internal controls of various corporate structures and business processes on a continuous basis, and takes into account their respective potential risks and severity, in order to ensure the effectiveness of the Company’s business operations and the realization of its corporate objectives and strategies. The scope of such examinations and reviews includes finance, operations, regulatory compliance and risk management. The Audit Committee also reviews the Company’s internal audit plan, and submits relevant reports and concrete recommendations to the Board on a regular basis.
The Company has an internal audit department which reviews procedures in all major financial and operational activities. This department is led by the head of internal audit.
Remuneration and Assessment Committee
The Remuneration and Assessment Committee is comprised of three members. Currently, the Remuneration and Assessment Committee is chaired by independent non-executive Director Ning Xiang Dong with independent non-executive Director Gong Hua Zhang and executive Director Wang Quan Hua as members. The term of office of each member is three years. The term of office of the current members will end in 2013. A member may serve consecutive terms upon re-election. The Remuneration and Assessment Committee held two meetings in 2010, which were attended by all members.
The responsibilities of the Remuneration and Assessment Committee are to make recommendations on the remuneration policy and structure for Directors and senior management of the Company, to establish regular and transparent procedures on remuneration policy development and improvement and submit the Company’s “Administrative Measures on Remuneration of Directors” and “Administrative Measures on Remuneration of Senior Management”. In particular, the Remuneration and Assessment Committee has the duty to ensure that the Directors or any of their associates shall not be involved in the determination of their own remuneration packages.
The Remuneration and Assessment Committee consulted, when appropriate, the Chairman and/or the President about its proposals relating to the remuneration of other executive Directors. The Remuneration and Assessment Committee is provided with sufficient resources to discharge its duties and professional advice is available if necessary. The Remuneration and Assessment Committee is also responsible for assessing performance of executive Directors and approving the terms of executive Directors’ service contracts. The Remuneration and Assessment Committee has performed all its responsibilities under its terms of reference in 2010.
Nomination Committee
The Nomination Committee was established on June 28, 2007. Before that, nomination of directors and other senior management was mainly undertaken by the Board. According to the Articles of Association, the Board has the authority to appoint from time to time any person as director to fill a vacancy or as additional director. In selecting candidate directors, the Board focuses on their qualifications, technical skills, experiences (in particular, the experience in the industry in which the Group operates in case of candidates of executive directors) and expected contributions to the Group.
As of December 31, 2010, the Nomination Committee consists of three members, including Si Xian Min as chairman and Wei Jin Cai (Independent non-executive director) and Gong Hua Zhang (Independent non-executive director) as members. The responsibilities of the Nomination Committee are to make recommendations to the Board in respect of the size and composition of the Board based on the operational activities, assets and shareholding structure of the Company; study the selection criteria and procedures of Directors and executives and give advice to the Board; identify qualified candidates for Directors and executives; investigate and propose candidates for Directors and managers and other senior management members to the Board.
52
In accordance with relevant laws and regulations as well as the provisions of the Articles of Association of the Company, the Nomination Committee shall study and resolve on the selection criteria, procedures and terms of office for directors and managers with reference to the Company’s actual situation. Any resolution made in this regard shall be filed and proposed to the Board for approval and shall be implemented accordingly. The Nomination Committee is provided with sufficient resources to discharge its duties and independently engages intermediate agencies to provide professional advice on its proposals if necessary.
The Nomination Committee held two meetings in 2010, which was attended by all members.
Employees
As of December 31, 2010, the Group had 65,085 employees, including 4,758 pilots, 8,452 flight attendants, 9,214 maintenance personnel, 12,048 sales and marketing personnel, 6,070 ground service personnel, 2,025 flight operation officers, 2,135 financial personnel, 730 flight security guards, 917 computer technology personnel and 18,736 other personnel. All of the Group’s pilots, flight attendants, maintenance personnel, administrative personnel and sales and marketing personnel are contract employees.
The Company’s employees are members of a trade union organized under the auspices of the All-China Federation of Trade Unions, which is established in accordance with the Trade Union Law of China. A representative of the Company labor union currently serves on the Supervisory Committee of the Company. Each of the Company’s subsidiaries has its own trade union. The Group has not experienced any strikes, slowdowns or labor disputes that have interfered with its operations, and the Group believes that its relations with its employees are good.
All employees of the Group receive cash remuneration and certain non-cash benefits. Cash remuneration consists of salaries, bonuses and cash subsidies provided by the Group. Salaries are determined in accordance with the national basic wage standards. The total amount of wages payable by the Group to its employees is subject to a maximum limit based on the profitability of the Group and other factors. Bonuses are based on the profitability of the Group. Cash subsidies are intended as a form of cost-of-living adjustment. In addition to cash compensation, the Group’s contract employees receive certain non-cash benefits, including housing, education and health services, and the Group’s temporary employees receive limited health services, but not housing or education.
Employee benefits
Employee benefits are all forms of considerations given and other related expenditures incurred in exchange for services rendered by employees. Except for termination benefits, employee benefits are recognized as a liability in the period in which the associated services are rendered by employees, with a corresponding increase in cost of relevant assets or expenses in the current period.
(a) Retirement benefits
Pursuant to the relevant laws and regulations of the PRC, the Group has joined a defined contribution basic retirement scheme for the employees arranged by local Labor and Social Security Bureaus. The Group makes contributions to the retirement scheme at the applicable rates ranging from 8% to 25% (2009: 10% to 25%) as required by the government organization. The contributions are charged to profit or loss on an accrual basis. When employees retire, the local Labor and Social Security Bureaus are responsible for the payment of the basic retirement benefits to the retired employees.
In addition, the Group has established a supplementary defined contribution retirement scheme for the benefit of employees in accordance with relevant regulations in the PRC. Under such supplementary scheme, the Group is required to make contributions not exceeding one-twelfth of the prior year’s total salaries.
(b) Housing fund and other social insurances
Besides the retirement benefits, pursuant to the relevant laws and regulations of the PRC, the Group has joined defined social security contributions for employees, such as a housing fund, basic medical insurance, unemployment insurance, injury insurance and maternity insurance. The Group makes contributions to the housing fund and other social insurances mentioned above at the applicable rates based on the employees’ salaries. The contributions are recognized as cost of assets or charged to profit or loss on an accrual basis.
(c) Termination benefits
When the Group terminates the employment relationship with employees before the employment contracts have expired, or provides compensation as an offer to encourage employees to accept voluntary redundancy, a provision for the termination benefits provided, is recognized in profit or loss when both of the following conditions have been satisfied:
|
–
|
The Group has a formal plan for the termination of employment or has made an offer to employees for voluntary redundancy, which will be implemented shortly;
|
53
|
–
|
The Group is not allowed to withdraw from termination plan or redundancy offer unilaterally.
|
Workers’ Compensation
There is no workers’ compensation or other similar compensation scheme under the Chinese labor and employment system. As required by Chinese law, however, the Group, subject to certain conditions and limitations, pays for the medical expenses of any contract employee who suffer a work-related illness, injury or disability and continues to pay the full salary of, and provides all standard cash subsidies to, such employee during the term of such illness, injury or disability. The Group also pays for certain medical expenses of its temporary employees.
Share Ownership
As of the date of this Annual Report, no Director, Senior Management or Supervisor of the Company is a beneficial owner of any shares of the Company’s capital stock. As of the date of this Annual Report, no arrangement has been put in place involving issue or grant of options or shares or securities of the Company to any of the Director, Senior Management, Supervisor or employees of the Company.
Major Shareholders
Share Capital Structure
As of April 21, 2011 the total share capital of the Company was divided into 9,817,567,000 shares, of which approximately 42.22% (4,145,050,000 A Shares) was directly held by CSAHC, approximately 29.31% (2,877,600,000 A Shares) was held by other domestic shareholders, and approximately 28.47% (2,794,917,000 H Shares) was held by Hong Kong and overseas shareholders (among which, approximately 38.10% (1,064,770,000 H Shares) was indirectly held by CSAHC). CSAHC owns, directly and indirectly, 53.07% of the total share capital of the Company, therefore it is entitled to exercise all the rights of a controlling shareholder, including the election of executive Directors.
Substantial Shareholders
As of April 21, 2011 the following shareholders had an interest of 5% or more in the Company’s shares:
|
Name
|
Number of Shares
|
Approximate
Percentage
of the Total
Number of
Shares
|
||||
|
CSAHC
|
4,145,050,000A Shares
|
42.22 | % | |||
|
HKSCC Nominees Limited
|
1,749,455,398 H Shares
|
17.82 | % | |||
|
Nan Lung
|
1,064,770,000 H Shares
|
(1)
|
10.85 | % | ||
The table below sets forth, as of April 21, 2011, the following entities holding 5% or more of the total number of H Shares issued by the Company.
|
Name
|
Number of H
Shares
|
Approximate
Percentage of
the Total
Number of H
Shares
|
||||||
|
HKSCC Nominees Limited
|
1,749,455,398 | 62.59 | % | |||||
|
Nan Lung
|
1,064,770,000 | 38.10 | % | |||||
A Shares and H Shares have identical voting rights.
|
(1)
|
Among the 1,064,770,000 H Shares held by Nan Lung, CSAHC had an interest in an aggregate of 31,120,000 H Shares through Asia Travel Investment Company Limited, a wholly-owned subsidiary of CSAHC in Hong Kong (representing approximately 1.11% of the total issued H Shares).
|
54
Related Party Transactions
The Company enters into transactions from time to time with CSAHC and its associates. For a description of such transactions, see Note 45 to the Financial Statements. In particular, the following arrangements, which the Company believes are material to its operations, have been made between the Company and CSAHC and its associates during the year ended December 31, 2010 and up to the latest practicable date. The Company believes that these arrangements have been entered into by the Company in the ordinary course of business and in accordance with the agreements governing such transactions.
Arrangements with CSAHC
De-merger Agreement
The Company and CSAHC entered into a de-merger Agreement (“De-merger Agreement”) on March 25, 1995 (such agreement was amended by the Amendment Agreement No.1 on May 22, 1997), for the purpose of defining and allocating the assets and liabilities between CSAHC and the Company. Under the De-merger Agreement, CSAHC and the Company have agreed to indemnify the other party against claims, liabilities and expenses incurred by such other party relating to the businesses, assets and liabilities held or assumed by CSAHC or the Company pursuant to the De-merger Agreement.
Neither the Company nor CSAHC has made any payments in respect of such indemnification obligations from the date of the De-merger Agreement up to the date of this Annual Report.
Non-Public Subscriptions
On March 8, 2010, the board of the Company approved the placement of not more than 1,766,780,000 new A shares to not more than 10 specific investors, including CSAHC, and the placement of not more than 312,500,000 new H shares to Nan Lung, a wholly-owned subsidiary of CSAHC. On the same date, the Company entered into the A shares subscription agreement with CSAHC, pursuant to which CSAHC conditionally agreed to subscribe and the Company conditionally agreed to allot and issue new A shares of not more than 132,510,000 at the subscription price of not less than RMB5.66 per A share. In addition, the Company and Nan Lung entered into the H shares subscription agreement, pursuant to which Nan Lung conditionally agreed to subscribe and the Company conditionally agreed to allot and issue new H shares of not more than 312,500,000 at the subscription price of not less than HKD2.73 per H share. The above placement and subscription agreements were approved in the Extraordinary General Meeting and the respective Class Meetings of shareholders of A and H shares on April 30, 2010. On September 8, 2010, the Company received the formal approval from CSRC for the proposed non-public issue of H Shares. On September 15, 2010, the Company received the formal approval from CSRC for the proposed non-public issue of A Shares.
On October 29, 2010, the Company issued 123,900,000 A shares to CSAHC and 1,377,600,000 A shares to certain third party investors at a subscription price of RMB6.66 per share, for a net cash consideration of RMB812 million and RMB9,026 million, respectively. The A shares issued to CSAHC and certain third party investors are subject to a lock-up period to November 1, 2013 and November 1, 2011, respectively.
On November 1, 2010, the Company issued 312,500,000 H shares to Nan Lung at the subscription price of HKD2.73 per share, for a net cash consideration of RMB734 million.
Trademark License Agreement
The Company and CSAHC entered into a ten year trademark license agreement (the “Trademark License Agreement”) dated May 22, 1997 pursuant to which CSAHC acknowledges that the Company has the right to use the name “China Southern” and “China Southern Airlines” in both Chinese and English, and grants the Company a renewable royalty free license to use the kapok logo on a worldwide basis in connection with the Company’s airline and airline-related businesses. Unless CSAHC gives a written notice of termination three months before the expiration of the Trademark License Agreement, the Trademark License Agreement will be automatically renewed for another ten years term. In May 2007, the Trademark License Agreement entered into by the Company and CSAHC was automatically renewed for ten years until May 2017.
Leases
The Group as lessee and CSAHC as lessor have entered into the following lease agreements:
|
(1)
|
On December 19, 2006, the Company entered into a master lease agreement with CSAHC with a term valid from January 1, 2006 to December 31, 2008 (“Lease Agreement”). The Company renewed the Lease Agreement with CSAHC on December 29, 2008. Pursuant to the Lease Agreement, CSAHC agrees to continue to lease to the Company certain parcels of land, properties, and civil aviation structures and facilities at existing locations in Guangzhou, Haikou, Wuhan, Hengyang, Jingzhou (previously known as “Shashi”) and Nanyang as well as some additional locations in Beijing, Shanghai, Changsha, Shenyang, Dalian, Harbin and Changchun, etc.. The Lease Agreement is valid from January 1, 2009 to December 31, 2011 and the annual rents payable to CSAHC under the Lease Agreement for 2009, 2010 and 2011 are RMB37,148,660, RMB39,006,093 and RMB40,956,397.65 respectively.
|
55
For the year ended December 31, 2010, the rent incurred by the Group amounted to RMB 39,006,093 pursuant to such Lease Agreement.
|
(2)
|
The Company and CSAHC entered into an indemnification agreement dated May 22, 1997 in which CSAHC has agreed to indemnify the Company against any loss or damage caused by or arising from any challenge of, or interference with, the Company’s right to use certain lands and buildings.
|
CSAHC has not incurred any such indemnification obligations from the date of the indemnification Agreement up to the date of this Annual Report.
|
On January 10, 2008, the Company and CSAHC consolidated three previous agreements and entered into two lease agreements (the “Lease Agreements”), namely, the building lease agreement (the "Building Lease Agreement") and the land lease agreement (the “Land Lease Agreement”) for a fixed term of three years, commencing from January 1, 2008 to December 31, 2010. As provided for in the Land Lease Agreement and the Building Lease Agreement, the leased areas under the two agreements were changed to 1,104,209.69 square meters and 197,010.37 square meters respectively, and the annual rentals were adjusted to RMB21,817,145.00 and RMB48,474,632.77, respectively, for each of the years from 2008 to 2010. On February 14, 2011, the Company, based on its leasing requirements, renewed the Lease Agreements for additional terms of three years commencing from January 1, 2011 to December 31, 2013. The maximum annual aggregate amount of rent payable by the Company to CSAHC under the Land Lease Agreement and the Building Lease Agreement for each of the three years ending December 31, 2013 shall not exceed RMB 56,329,131 and RMB 42,975,542, respectively, payable on a semi-annual basis. The annual rental is determined after arm’s length negotiation between the parties and adjusted with regard to the current market rental standard set in accordance with the valuation prepared by Beijing Yintai Property Valuation Co., Ltd. (
北京銀通安泰房地產評估有限公司
) and the adjusted leased areas. The consideration will be funded wholly by the Company’s internal resources.
|
For the year ended December 31, 2010, the rents incurred by the Group under each of the Lease Agreements amounted to RMB 21,817,145.00 and RMB 42,975,542 respectively.
Arrangements with CSAHC’s Associates
Southern Airlines (Groups) Import and Export Trading Company (“SAIETC”), a wholly-owned subsidiary of CSAHC
On January 10, 2008, the Company entered into an Import and Export Agency Framework Agreement with SAIETC, pursuant to which the parties shall cooperate on the following business domains: import and export, customs clearance, customs declaration and inspection, tendering and agency, etc. The agreement is valid from January 1, 2008 to December 31, 2010, and the annual cap for the commission should not exceed RMB90,000,000. The Company and SAIETC renewed the Import and Export Agency Framework Agreement on January 28, 2011 for an additional term of three years, commencing from January 1, 2011 to December 31, 2013, with the annual cap under the agreement being revised to RMB97,200,000 million.
For the year ended December 31, 2010, the agency fee incurred by the Group in respect of the above import and export services was RMB 79,468,000.
Southern Airlines Culture and Media Co., Ltd. (“SACM”), which is 40% owned by the Company and 60% owned by CSAHC
On April 12, 2007, the Company and SACM entered into an Advertising Agency Framework Agreement for a term of three years commencing from the date of the agreement. Under the agreement, SACM will produce advertisement script, graphic and music for the Company with the copyrights of such products belonging to the Company, subject to compliance with the relevant provisions of the Listing Rules. The parties have determined the various rates for providing advertising services after negotiations on an arm's length basis, and SACM has promised that the advertising fees for which they charged the Company were all based on the prevailing market prices for similar business which were accepted by the Company. As set forth in the agreement, the transaction cap for 2007, 2008 and 2009 were RMB16,000,000, RMB20,500,000 and RMB25,500,000, respectively.
As the Advertising Agency Framework Agreement had expired and the transactions contemplated under the Advertising Agency Framework Agreement would continue to be entered into on a recurring basis with an expansion of scope between the parties, the Company has entered into the Media Services Framework Agreement on May 11, 2010 for a term of three years from January 1, 2010 to December 31, 2012. Pursuant to the agreement, SACM will provide the following services to the Group: (1) exclusive advertising agency services, including the design, production, broadcast and agency of international and domestic screen, print, outdoor and other forms of advertisement; (2) the plotting, purchase and production of in-flight TV and movie program agency services; (3) public relations services relating to recruitment of airhostess, including organising and implementation of the promotional recruitment activities, on-site recruitment activities, and production of promotional advertising program; and (4) services relating to the distribution of newspapers and magazines issued by SACM within places of the Company services. As set forth in the agreement, the revised transaction cap for 2010, 2011 and 2012 were RMB40,000,000, RMB48,000,000 and RMB58,000,000, respectively.
56
For the year ended December 31, 2010, the media fees incurred by the Group to SACM for the media services amounted to RMB34,305,000.
SA Finance which is 66% owned by CSAHC, 21% owned by the Company and 13% owned in aggregate by four subsidiaries of the Company
On November 15, 2007, the Company renewed the Financial Services Framework Agreement with SA Finance for a term of three years starting from January 1, 2008 to December 31, 2010.
Under such agreement, SA Finance agrees to provide to the Company deposit and loan services. SA Finance shall pay interests to the Company regularly at a rate not lower than the current deposit rates set by the People’s Bank of China. The Group’s deposits placed with SA Finance were re-deposited in a number of banks. SA Finance has agreed that the loans it provided to CSAHC and its subsidiaries other than the Group should not exceed the sum of SA Finance’s shareholders’ equity, capital reserves and total deposits received from other companies (excluding the Group). The rates should be determined on an arm’s length basis and based on fair market rate, and should not be higher than those available from independent third parties. The parties agreed that the balance of the Group’s deposits placed with SA Finance (including accrued interests) should not at any time exceed RMB2,600,000,000, nor should the balance of loans borrowed from SA Finance at any time exceed the above-mentioned level. The annual cap of fees payable to SA Finance for the other financial services should not exceed RMB5,000,000. The Company and SA Finance renewed the Financial Services Framework Agreement on November 8, 2010 for an additional term of three years, commencing from January 1, 2011 to December 31, 2013. In line with the Company’s business requirement, the parties agreed that deposit balance placed with SA Finance (including interest payable accrued thereon) in any day may not exceed RMB4,000,000,000, balance for provision of loan service to the Company by SA Finance (including total interests paid) in any day may not exceed the above level, and total annual amount of fees paid to SA Finance for other financial services may not exceed RMB5,000,000.
As of December 31, 2010, the Group’s deposits placed with SA Finance amounted to RMB1,111,045,000.
China Southern Airlines Group Passenger and Cargo Agent Company Limited (“PCACL”), a wholly-owned subsidiary of CSAHC
The Company has entered into Ticket Agency Agreements with several subsidiaries of CSAHC (the “Agents”) for the sale of the Group’s air tickets. The Agents charge commission with reference to the prevailing market rate. Besides, the Company has other air ticket sales agents in China who also charge commission at the same rates. The Agents also act as the ticket sales agents of other airline companies in China, and charge commission at the same rates offered to the Group.
The Company and China Southern Airlines Group Passenger and Cargo Agent Company Limited, a wholly-owned subsidiary of CSAHC have entered into the Framework Agreement on Expanded Businesses Including the Sale of Air Tickets, the Airfreight Forwarding Services, Chartered Flight and Pallets Agency Services, Delivery Services For the Outside Storage Area and the Relevant Internal Operation Services For the Inside Storage Area of China Southern Airlines Company Limited dated January 10, 2008 (the “Freight Agency Agreement”), which is valid from January 1, 2008 to December 31, 2010. Pursuant to the Freight Agency Agreement, the cooperative scope of both parties thereto mainly comprises extended businesses including air ticket sales agency services, airfreight forwarding sales agency services, chartered flight and pallets agency services, internal operation services for the inside storage area, and delivery services for the outside storage area and chartered flight and pallets sales agency business. The annual transaction cap of the sales value shall not exceed RMB250,000,000. The Company and PCACAL renewed the Freight Agency Agreement on January 21, 2011 for an additional term of three years, commencing from January 1, 2011 to December 31, 2013, with the annual cap of sales value under the agreement being revised to RMB250,000,000.
For the year ended December 31, 2010, the commission expense paid to PCACL and the income relating to other services was RMB16,032,000 and RMB49,292,000, respectively.
Guangzhou China Southern Airlines Property Management Company Limited (the “GCSAPMC”), which is 100% owned by CSAHC
The Company and GCSAPMC entered into a Framework Agreement for the Engagement of Property Management (“Property Management Framework Agreement”) dated January 1, 2006 to engage GCSAPMC to provide property management and improvement service for a term of three years. Pursuant to the agreement, the Company has appointed GCSAPMC to provide management and maintenance services for the Company’s headquarters in Guangzhou and to provide maintenance and management services for the 110KV transformer substation to ensure the ideal working conditions of the Company’s production and office facilities and physical environment, and the normal operation of equipment. The fee charging schedule (or charge standard) shall be determined on an arm’s length basis between both parties, and shall not be higher than the one charged by any independent third parties in the similar industry. The annual cap for the Property Management Framework Agreement is set at RMB47,010,000. The Company renewed the Property Management Framework Agreement with GCSAPMC on December 29, 2008 for a term of three years from January 1, 2009 to December 31, 2011, and there is no change in the scope of services and the annual caps.
For the year ended December 31, 2010, the property management and maintenance fee incurred by the Group amounted to RMB29,849,000 pursuant to the Property Management Framework Agreement.
57
MTU Maintenance Zhuhai Co., Ltd. (“Zhuhai MTU”), which is 50% owned by CSAHC
The Company entered into an agreement relating to continuing connected transactions with CSAHC, MTU Aero Engines GmbH (
“
MTU GmbH
”
) and Zhuhai MTU on September 28, 2009, by which Zhuhai MTU shall continue to provide the Company with engine repair and maintenance services subject to the international competitiveness and at the net most favourable terms, while the Company shall make relevant payment to Zhuhai MTU according to related charging standard. The agreement is effective from its date to April 5, 2031.
For the year ended December 31, 2010, the Group’s engine repair and maintenance service fees incurred under the agreement relating to continuing connected transactions amounted to RMB401,130,000.
Disposal of Equity Interest
On September 28, 2009, the Company entered into an equity interest transfer agreement with CSAHC, whereby the Company transferred its 50% equity interest in Zhuhai MTU to CSAHC for a consideration of RMB1,607,850,000. The transfer was considered and approved by the Independent Shareholders of the Company at the second extraordinary general meeting in 2009. The transfer was subsequently approved by the Ministry of Commerce of the PRC in January 2010 and was completed in February 2010.
Others
On May 7, 2009, the Company entered into the Airline Service Agreement with TravelSky Technology Limited (“TravelSky”) for the period from January 1, 2009 to December 31, 2009. In February 2011, the Company and TravekSky agreed to extend the term of the Airline Service Agreement for the period from January 1, 2011 to December 31, 2011. Mr. Wang Quan Hua, a director of the Company also serves directorship in TravelSky, which is a provider of information technology solutions for aviation and travel industry. Pursuant to the agreement, TravelSky agrees to provide to the Company with flight control system services, electronic travel distribution system services, ticket-reservation system extended services and civil aviation and commercial data network services. In return, the Company pays service fees to TravelSky with reference to the standard rate set by CAAC. Such transaction has been approved by the Board of the Company and will be submitted for approval at the General Meeting of the Shareholders. The total service fee paid by the Company to TravelSky for 2010 was RMB401 million.
All related party transactions have been approved by Independent Non-executive Directors.
Interests of Experts and Counsel
Not applicable.
Consolidated Statements and Other Financial Information
Our audited consolidated financial statements are set forth beginning on page F-1, which can be found after Item 19.
Significant Changes
No significant changes have occurred since the date of the financial statements.
Legal Proceedings
As of December 31, 2010, the Group was not involved in any material litigation.
Dividend Information
No interim dividend was paid during the year ended December 31, 2010. The Board of Directors does not recommend the payment of a final dividend in respect of the year ended December 31, 2010.
Offer and Listing Details
The principal trading market for the Company’s H Shares is the Hong Kong Stock Exchange, and the Company’s trading code is “1055”. The Company completed its initial public offering of H Shares on July 30, 1997. The ADRs, each representing 50 H Shares, are evidenced by ADRs issued by the Bank of New York as the depositary. The ADRs have been listed for trading on the New York Stock Exchange since July 31, 1997, under the symbol “ZNH”.
58
The principal trading market for the Company’s A Shares is the Shanghai Stock Exchange with trading code of “600029”. On July 25, 2003, the Company completed its initial public offering of A Shares.
Set forth below for the periods indicated are the high and low sales prices of H Shares on the Hong Kong Stock Exchange, ADRs on the New York Stock Exchange and A Shares on the Shanghai Stock Exchange.
|
The Hong Kong
Stock Exchange
Price per H Share
(HK$)
|
The New York
Stock Exchange
Price per ADR
(US$)
|
The Shanghai
Stock Exchange
Price per A Share
(RMB)
|
||||||||||||||||||||||
|
High
|
Low
|
High
|
Low
|
High
|
Low
|
|||||||||||||||||||
|
Annual Market Prices
|
||||||||||||||||||||||||
|
Fiscal Year ended December 31, 2006
|
3.42
|
1.60
|
22.43
|
10.51
|
4.09
|
2.24
|
||||||||||||||||||
|
Fiscal Year ended December 31, 2007
|
13.90
|
3.25
|
94.48
|
20.81
|
28.73
|
4.26
|
||||||||||||||||||
|
Fiscal Year ended December 31, 2008
|
10.44
|
0.83
|
65.31
|
5.56
|
28.68
|
2.72
|
||||||||||||||||||
|
Fiscal Year ended December 31, 2009
|
2.99
|
1.14
|
19.45
|
7.09
|
7.22
|
3.28
|
||||||||||||||||||
|
Fiscal Year ended December 31, 2010
|
5.91
|
2.47
|
38.65
|
15.98
|
12.58
|
5.84
|
||||||||||||||||||
|
Quarterly Market Prices
|
||||||||||||||||||||||||
|
Fiscal Year ended December 31, 2009
|
||||||||||||||||||||||||
|
First Quarter
|
1.57
|
1.14
|
10.18
|
7.09
|
5.61
|
3.28
|
||||||||||||||||||
|
Second Quarter
|
2.40
|
1.62
|
15.45
|
10.67
|
6.33
|
5.11
|
||||||||||||||||||
|
Third Quarter
|
2.99
|
2.02
|
19.45
|
12.75
|
7.22
|
4.96
|
||||||||||||||||||
|
Fourth Quarter
|
2.88
|
2.24
|
18.86
|
14.35
|
6.49
|
5.15
|
||||||||||||||||||
|
Fiscal Year ended December 31, 2010
|
||||||||||||||||||||||||
|
First Quarter
|
3.57
|
2.47
|
22.57
|
15.98
|
7.55
|
5.84
|
||||||||||||||||||
|
Second Quarter
|
4.09
|
3.11
|
26.38
|
19.22
|
9.20
|
6.28
|
||||||||||||||||||
|
Third Quarter
|
4.61
|
3.06
|
29.86
|
19.98
|
8.48
|
6.00
|
||||||||||||||||||
|
Fourth Quarter
|
5.91
|
4.34
|
38.65
|
28.18
|
12.58
|
8.64
|
||||||||||||||||||
|
Monthly Market Prices
|
||||||||||||||||||||||||
|
October 2010
|
5.91
|
4.54
|
38.65
|
29.09
|
12.58
|
8.64
|
||||||||||||||||||
|
November 2010
|
5.70
|
|
|
|
5.10
|
|
|
|
36.65
|
|
|
|
33.02
|
|
|
|
12.10
|
|
|
|
8.90
|
|
||
|
|
|
|
|
|
|
|
|
|
|
|
|
|
|
|
|
|
|
|
|
|
|
|||
|
December 2010
|
5.58
|
|
|
|
4.34
|
|
|
|
36.18
|
|
|
|
28.18
|
|
|
|
9.74
|
|
|
|
8.81
|
|
||
|
|
|
|
|
|
|
|
|
|
|
|
|
|
|
|
|
|
|
|
|
|
|
|||
|
January 2011
|
4.89
|
|
|
|
3.98
|
|
|
|
31.59
|
|
|
|
25.59
|
|
|
|
10.13
|
|
|
|
8.10
|
|
||
|
|
|
|
|
|
|
|
|
|
|
|
|
|
|
|
|
|
|
|
|
|
|
|||
|
February 2011
|
4.12
|
|
|
|
3.53
|
|
|
|
26.58
|
|
|
|
23.11
|
|
|
|
9.30
|
|
|
|
8.23
|
|
||
|
|
|
|
|
|
|
|
|
|
|
|
|
|
|
|
|
|
|
|
|
|
|
|||
|
March 2011
|
3.79
|
|
|
|
3.08
|
|
|
|
24.50
|
|
|
|
20.02
|
|
|
|
8.88
|
|
|
|
8.04
|
|
||
|
|
|
|
|
|
|
|
|
|
|
|
|
|
|
|
|
|
|
|
|
|
|
|||
|
April 2011 (up to April 21, 2011)
|
3.54
|
|
|
|
2.73
|
|
|
|
27.11
|
|
|
|
20.77
|
|
|
|
8.72
|
|
|
|
7.76
|
|
||
59
Plan of Distribution
Not applicable.
Markets
See “Offer and Listing Details” above.
Selling Shareholders
Not applicable.
Dilution
Not applicable.
Expenses of the Issue
Not applicable.
Share Capital
Not applicable.
Memorandum and Articles of Association
The following is a summary of certain provisions of our Articles of Association. As this is a summary, it does not contain all the information that may be important to you. You and your advisors should read the text of our most updated Articles of Association for further information, which is filed as an exhibit to this Annual Report.
The Company is registered with and has obtained a business license from the State Administration Bureau of Industry and Commerce of the People’s Republic of China on March 25, 1995.
On March 13, 2003, the Company obtained an approval certificate from the Ministry of Commerce to change to a permanent limited company with foreign investments.
Other Senior Administrative Officers
Pursuant to the Article 16 of the Articles of Association, other senior administrative officers of the Company refer to executive vice president, chief financial officer, the board secretary, chief economist, chief engineer, chief pilot, and chief legal adviser and chief information officer.
Objects and Purpose
Pursuant to the Article 18 of the Articles of Association, the scope of business of the Company includes: (I) provision of scheduled and non-scheduled domestic, regional and international air transportation services for passengers, cargo, mail and luggage; (II) undertaking general aviation services; (III) provision of aircraft repair and maintenance services; (IV) acting as agent for other domestic and international airlines; (V) provision of air catering services; (VI) provision of hotel business; (VII) acting as sale agent for aircraft leasing and aviation accident insurance; (VIII) engaging in other airline or airline-related business, including advertising for such services; and (IX) insurance agency business. (subject to approved of State Administration of Industry and Commerce).
60
Directors
Pursuant to Article 244 of the Articles of Association, where a Director of the Company is in any way, directly or indirectly, materially interested in a contract, transaction or arrangement or proposed contract, transaction or arrangement with the Company, (other than his contract of service with the Company), he shall declare the nature and extent of his interests to the Board of Directors at the earliest opportunity, whether or not the contract, transaction or arrangement or proposal is otherwise subject to the approval of the Board of Directors.
Pursuant to Article 174 of the Articles of Association, where a Director is interested in any resolution proposed at a board meeting, such Director shall not be present and shall not have a right to vote. Such Director shall not be counted in the quorum of the relevant meeting.
Pursuant to Article 252 of the Articles of Association, the Company shall, with the prior approval of shareholders in general meeting, enter into a contract in writing with a Director wherein his emoluments are stipulated. The aforesaid emoluments include, emoluments in respect of his service as Director, Supervisor or senior administrative officer of the Company or any subsidiary of the Company; emoluments in respect of the provision of other services in connection with the management of the affairs of the Company and any of its subsidiaries; and payment by way of compensation for loss of office, or as consideration for or in connection with his retirement from office.
Pursuant to Article 162(6) of the Articles of Association, the Board of Directors has the power to formulate proposals for increases or reductions in the Company’s registered capital and the issue of debentures of the Company; such resolutions must be passed by more than two-thirds of all the Directors.
There is no mandatory retirement age for the Directors of the Company. The Directors of the Company are not required to hold shares of the Company.
Ordinary Shares
Pursuant to Article 26 of the Articles of Association, subject to the approval of the securities authority of the State Council, the Company may issue and offer shares to domestic investors or foreign investors for subscription. Foreign investors are those investors of foreign countries and regions of Hong Kong, Macau and Taiwan who subscribe for shares issued by the Company. Domestic investors are those investors within the territory of the PRC (excluding investors of the regions referred to in the preceding sentence) who subscribe for shares issued by the Company.
Pursuant to Article 27 of the Articles of Association, shares issued by the Company to domestic investors for subscription in Renminbi shall be referred to as “Domestic-Invested Shares”. Shares issued by the Company to foreign investors for subscription in foreign currencies shall be referred to as “Foreign-Invested Shares”. Foreign-Invested Shares which are listed overseas are called “Overseas-Listed Foreign-Invested Shares”. The foreign currencies mean the legal currencies (apart from Renminbi) of other countries or districts which are recognized by the foreign exchange control authority of the state and can be used to pay the Company for the share price.
Pursuant to Article 28 of the Articles of Association, Domestic-Invested Shares issued by the Company are called “A Shares”. Overseas-Listed Foreign-Invested Shares issued by the Company and listed in Hong Kong are called “H Shares”. H Shares are shares which have been admitted for listing on The Stock Exchange of Hong Kong Limited, the par value of which is denominated in Renminbi and which are subscribed for and traded in Hong Kong dollars. H Shares can also be listed on a stock exchange in the United States of America in the form of ADR.
Pursuant to Article 62 of the Articles of Association, the ordinary shareholders of the Company shall enjoy the following rights:
|
(1)
|
the right to attend or appoint a proxy to attend shareholders’ general meetings and to vote thereat;
|
|
(2)
|
the right to dividends and other distributions in proportion to the number of shares held;
|
|
(3)
|
the right of supervisory management over the Company’s business operations, and the right to present proposals or enquiries;
|
|
(4)
|
the right to transfer, donate or pledge his shares in accordance with laws, administrative regulations and provisions of these Articles of Association;
|
|
(5)
|
the right of knowledge and decision making power with respect to important matters of the Company in accordance with laws, administrative regulations and these Articles of Association;
|
|
(6)
|
the right to obtain relevant information in accordance with the provisions of these Articles of Association, including:
|
|
(i)
|
the right to obtain a copy of these Articles of Association, subject to payment of the cost of such copy;
|
|
(ii)
|
the right to inspect and copy, subject to payment of a reasonable charge;
|
61
|
personal particulars of each of the Company’s directors, supervisors, president and other senior administrative officers, including:
|
|
(aa)
|
present name and alias and any former name or alias;
|
|
(bb)
|
principal address (residence);
|
|
(cc)
|
nationality;
|
|
(dd)
|
primary and all other part-time occupations and duties;
|
|
(ee)
|
identification documents and their relevant numbers;
|
|
(c)
|
state of the Company’s share capital;
|
|
(d)
|
reports showing the aggregate par value, quantity, highest and lowest price paid in respect of each class of shares repurchased by the Company since the end of last accounting year and the aggregate amount paid by the Company for this purpose;
|
|
(e)
|
minutes of shareholders’ general meetings; and
|
|
(f)
|
interim and annual reports of the Company.
|
|
(7)
|
in the event of the termination or liquidation of the Company, to participate in the distribution of surplus assets of the Company in accordance with the number of shares held; and
|
|
(8)
|
other rights conferred by laws, administrative regulations and these Articles of Association.
|
Pursuant to Article 67 of the Articles of Association, the ordinary shareholders of the Company shall assume the following obligations:
|
(1)
|
to abide by these Articles of Association;
|
|
(2)
|
to pay subscription monies according to the number of shares subscribed and the method of subscription;
|
|
(3)
|
no right to return shares to the Company unless laws and regulations provide otherwise; and
|
|
(4)
|
other obligations imposed by laws, administrative regulations and these Articles of Association.
|
Shareholders are not liable to make any further contribution to the share capital other than as agreed by the subscriber of the relevant shares on subscription.
Action necessary to change rights of shareholders
Pursuant to Article 152 of the Articles of Association, shareholders who hold different classes of shares are shareholders of different classes.
The holders of the Domestic Shares and holders of Overseas Listed Foreign Shares are deemed to be shareholders of different classes.
Pursuant to Article 153 of the Articles of Association, rights conferred on any class of shareholders in the capacity of shareholders (“class rights”) may not be varied or abrogated unless approved by a special resolution of shareholders in general meeting and by holders of shares of that class at a separate meeting.
Pursuant to Article 155 of the Articles of Association, shareholders of the affected class, whether or not otherwise having the right to vote at shareholders’ general meetings, shall nevertheless have the right to vote at class meetings in respect of the following matters: (i) to effect an exchange of all or part of the shares of such class into shares of another class or to effect an exchange or create a right of exchange of all or part of the shares of another class into the shares of such class; (ii) to restrict the transfer or ownership of the shares of such class or add to such restriction; (iii) to restructure the Company where the proposed restructuring will result in different classes of shareholders bearing a disproportionate burden of such proposed restructuring; and (iv) to vary or abrogate the provisions of these Articles of Association. However, interested shareholder(s) shall not be entitled to vote at class meetings.
62
Pursuant to Article 156 of the Articles of Association, resolutions of a class of shareholders shall be passed by votes representing more than two-thirds of the voting rights of shareholders of that class represented at the relevant meeting who are entitled to vote at class meetings.
Pursuant to Article 157 of the Articles of Association, written notice of a class meeting shall be given forty-five days before the date of the class meeting to notify all of the shareholders in the share register of the class of the matters to be considered, the date and the place of the class meeting. A shareholder who intends to attend the class meeting shall deliver his written reply concerning attendance at the class meeting to the Company twenty days before the date of the class meeting.
If the number of shares carrying voting rights at the meeting represented by the shareholders who intend to attend the class meeting reaches more than one half of the voting shares at the class meeting, the Company may hold the class meeting; if not, the Company shall within five (5) days notify the shareholders again by public notice of the matters to be considered, the date and the place for the class meeting. The Company may then hold the class meeting after such publication of notice.
Pursuant to Article 158 of the Articles of Association, notice of class meetings need only be served on shareholders entitled to vote thereat.
Meeting of any class of shareholders shall be conducted in a manner as similar as possible to that of general meetings of shareholders. The provisions of these Articles of Association relating to the manner to conduct any shareholders’ general meeting shall apply to any meeting of a class of shareholders.
Pursuant to Article 160 of the Articles of Association, the special procedures for voting at any meeting of a class of shareholders shall not apply to the following circumstances:
|
(1)
|
where the Company issues, upon the approval by special resolution of its shareholders in general meeting, either separately or concurrently once every twelve months, not more than 20 percent of each of its existing issued Domestic Shares and Overseas Listed Foreign Shares; and
|
|
(2)
|
where the Company’s plan to issue Domestic Shares and Overseas Listed Foreign Shares at the time of its establishment is carried out within fifteen months from the date of approval of the competent securities authority of the State Council.
|
Meetings of shareholders
Shareholders’ general meetings is the organ of authority of the Company and shall exercise its functions and powers, among other things, to decide on the Company’s operational policies and investment plans, to elect and replace directors and decide on matters relating to the remuneration of directors, to examine and approve reports of the board of directors, etc.
There are two types of shareholders’ general meetings: annual general meetings and extraordinary general meetings. Shareholders’ general meetings are convened by the Board of Directors. Annual general meetings are held once every year and within six months from the end of the preceding financial year.
Under any of the following circumstances, the Board of Directors shall convene an extraordinary general meeting within two months:
|
(1)
|
when the number of Directors is less than the number of Directors required by the Company Law or two thirds of the number of Directors specified in the Articles of Association;
|
|
(2)
|
when the accumulated losses of the Company amount to one third of the total amount of its share capital;
|
|
(3)
|
when shareholder(s) holding 10 percent or more of the Company’s issued and outstanding shares carrying voting rights request(s) in writing the convening of an extraordinary general meeting;
|
|
(4)
|
when deemed necessary by the Board of Directors or as requested by the Supervisory Committee;
|
|
(5)
|
More than one half of the independent directors propose to convene the meeting.
|
When the Company convenes a shareholders’ general meeting, written notice of the meeting is given forty five days before the date of the meeting to notify all of the shareholders in the share register of the matters to be considered and the date and the place of the meeting. A shareholder who intends to attend the meeting shall deliver his written reply concerning the attendance of the meeting to the Company twenty days before the date of the meeting.
The Company shall, based on the written replies received twenty days before the date of the shareholders’ general meeting from the shareholders, calculate the number of voting shares represented by the shareholders who intend to attend the meeting. If the number of voting shares represented by the shareholders who intend to attend the meeting reaches one half or more of the Company’s total voting shares, the Company may hold the meeting; if not, then the Company shall within five days notify the shareholders again by public notice of the matters to be considered, the place and date for, the meeting. The Company may then hold the meeting after such publication of notice.
63
Limitation on right to own securities
The PRC Special Regulations on Overseas Offering and the Listing of Shares by Companies Limited by Share (the “Special Regulations”) and the Mandatory Provisions for Articles of Association of Companies to be Listed Overseas (the “Mandatory Provisions”) provide for different classes of shares to be subscribed for and traded by local and overseas investors respectively. Shares which can be traded by overseas investors must be in registered form and while denominated in Renminbi, they are traded in foreign currency with dividends payable in foreign currency. Local investors are prohibited from dealing in such shares.
Cash dividends policy
Pursuant to Article 268 of the Articles of Association, in the event of distribution of dividend by way of cash, the accumulated payment of dividend by way of cash for the last three years may not be less than 30% of the Company’s average distributable profit for the last three years. Where the Company makes a payment of dividend satisfied by an allotment of new shares or completed conversion of capital common reserve fund into capital, the Company may not distribute dividend by way of cash in the same year.
Merger, acquisition or corporate restructuring
Pursuant to Article 291 of the Articles of Association, in the event of the merger or division of the Company, a plan shall be presented by the Company’s Board of Directors and shall be approved in shareholders’ general meeting and the relevant examining and approving formalities shall be processed as required by law. A shareholder who objects to the plan of merger or division shall have the right to demand the Company or the shareholders who consent to the plan of merger or division to acquire that dissenting shareholder’s shareholding at a fair price. The contents of the resolution of merger or division of the Company shall be made into special documents for shareholders’ inspection. Such special documents shall be sent by mail to holders of Overseas-Listed Foreign-Invested Shares.
The Articles of Association do not contain any provisions governing the ownership threshold above which shareholder ownership must be disclosed.
Material Contracts
The Company has not entered into any material contracts other than in the ordinary course of business and other than those described in this Item 10, Item 7, “Related Party Transactions”, Item 4, “Information on the Company” or elsewhere in this Annual Report on Form 20-F.
|
(a)
|
Pursuant to a Transfer Agreement dated September 28, 2009 and a Supplemental Transfer Agreement dated December 29, 2009 entered into between the Company and CSAHC, the Company agreed to sell and CSAHC agreed to acquire the 50% equity interest in Zhuhai MTU, a jointly controlled entity of the Company, at a consideration of US$235.47 million. The sale was approved by the Company’s shareholders in an extraordinary general meeting held on November 27, 2009. The sale was approved by the State Owned Assets Supervision and Administration Commission of the PRC and the Ministry of Commerce of the PRC subsequently, and the Company received the acquisition consideration from CSAHC in full in February 2010.
|
|
(b)
|
Pursuant to the Agreement entered into by and among the Company, CSAHC, Zhuhai MTU and MTU GmbH on September 28, 2009, the Company agreed to continue to perform certain existing obligations, in particular, the exclusive maintenance undertaking, under the JV Contract to ensure the continuity and stability of the business of Zhuhai MTU.
|
|
(c)
|
Pursuant to an A320 Series Aircraft Purchase Agreement dated January 20, 2010 between the Company and Airbus SNC, the Company will acquire 20 Airbus 320 series aircraft from Airbus SNC. According to the information provided by Airbus SNC, the catalogue price of an Airbus 320 aircraft is around US$76.9 million including price for airframe and engine. The aggregate consideration for the acquisition will be partly payable in cash and partly through financing arrangements with banking institutions. The Airbus aircraft will be delivered in stages to the Company from 2011 to 2013.
|
|
(d)
|
Pursuant to an aircraft acquisition agreement dated September 30, 2010 entered into between Xiamen Airlines Company Limited (“Xiamen Airlines”) and Boeing, Xiamen Airlines agreed to purchase from Boeing 10 Boeing B737 series aircraft. The aggregate catalogue price for those aircraft is around US$699 million, including price for airframe and engines. According to the information provided by Boeing, the aggregate consideration for the acquisition will be partly payable in cash by Xiamen Airlines, and partly through financing arrangements with banking institutions. The Boeing aircraft will be delivered in stages to Xiamen Airlines during the period commencing from 2015 to October 2016.
|
|
(e)
|
Pursuant to an aircraft acquisition agreement dated November 4, 2010 between the Company and Airbus S.A.S., the Company agrees to purchase 6 Airbus A330 aircraft from Airbus S.A.S. According to the information provided by Airbus S.A.S., the catalogue price of 6 Airbus A330 aircraft is US$1.205 billion, including price for airframe and engine.
The aggregate consideration for the acquisition will be partly payable by cash and partly by financing arrangements with banking institutions. The 6 Airbus A330 aircraft will be delivered in stages to the Company during the period commencing from 2013 to 2014.
|
64
|
(f)
|
Pursuant to an aircraft acquisition agreement dated November 4, 2010 between the Company and Airbus S.A.S., the Company agrees to purchase 30 Airbus A320 series aircraft from Airbus S.A.S. According to the information provided by Airbus S.A.S., the catalogue price of 30 Airbus A320 series aircraft is US$2.575 billion, including price for airframe and engine.
The aggregate consideration for the acquisition will be partly payable by cash and partly by financing arrangements with banking institutions. The 30 Airbus A320 series aircraft will be delivered in stages to the Company during the period commencing from 2012 to 2015.
|
|
(g)
|
Pursuant to an agreement entered into in December, 2010 by and among the Company, Xiamen Jianfa Group Co., Ltd. and Hebei Investment, Hebei Investment agrees to inject a cash capital of RMB 1,460 million into Xiamen Airlines. Upon completion of the capital injections under the agreement, Hebei Investment will own 15% equity interest in Xiamen Airlines, the Company’s equity interest in Xiamen Airlines will decrease from 60% to 51%, and Xiamen Airlines will remain a subsidiary of the Company.
|
Exchange Controls
Under current Chinese foreign exchange regulations, Renminbi is fully convertible for current account transactions, but is not freely convertible for capital account transactions. Current account foreign currency transactions can be undertaken without prior approval from the relevant Chinese government agencies by producing commercial documents evidencing such transactions, provided that they are processed through Chinese banks licensed to engage in foreign currency transactions. Conversion from Renminbi into a foreign currency or vice versa for purposes of capital account transactions requires prior approvals of relevant Chinese government agencies. This restriction on capital account transactions could affect the ability of the Company to acquire foreign currency for capital expenditures.
The Company is generally required by law to sell all its foreign currency revenues to Chinese banks. The Company may purchase foreign currency directly from Chinese banks for any current account transactions, such as trade transactions in its usual and normal course of business, including acquisition of aircraft, jet fuel and flight equipment (such acquisition requires approvals from the relevant Chinese government agencies). Payment of dividends by the Company to holders of the Company’s H Shares and ADRs is also considered a current account transaction under Chinese law. Therefore, there is no legal restriction on the conversion of Renminbi into foreign currency for the purpose of paying dividends to such holders of H Shares and ADRs. In addition, the Company’s Articles of Association require the Company to pay dividends to holders of the Company’s H Shares and ADRs in foreign currency.
On July 21, 2005, the PRC government changed its policy of pegging the value of the Renminbi to the U.S. dollar so that the Renminbi is now permitted to fluctuate within a band against a basket of certain foreign currencies. On May 18, 2007, the People’s Bank of China announced that the floating band of Renminbi would be permitted to rise or fall by as much as 0.5%. The PRC government has stated publicly that it intends to further liberalize its currency policy, which could result in a further and more significant change in the value of the Renminbi against the U.S. dollar. Any significant revaluation of the Renminbi may have a material adverse effect on the Company’s financial performance, and the value of, and any dividends payable on, the Company’s H Shares and ADRs in foreign currency terms.
Other Limitations
There are no limitations on the right of non-resident or foreign owners to hold or vote H Shares or ADRs imposed by Chinese law or by the Articles of Association or other constituent documents of the Company. However, under current Chinese law, foreign ownership of the Company may not exceed 49%.
Taxation
Chinese Taxation
The following is a general summary of certain Chinese tax consequences of the acquisition, ownership and disposition of A Shares, H Shares and ADRs. This summary is based upon tax laws of China as in effect on the date of this Annual Report, including the income tax treaty between the United States and China (the “U.S.-PRC Tax Treaty”), all of which are subject to change or different interpretation.
In general, for Chinese tax purposes, holders of ADRs will be treated as the owners of the H Shares represented by those ADRs, and exchanges of H Shares for ADRs, and ADRs for H Shares, will not be subject to taxation under the laws of China.
This summary does not purport to address all material tax consequences for holders or prospective purchasers of A Shares, H Shares or ADRs, and does not take into account the specific circumstances of such investors. Investors should consult their own tax advisors as to Chinese or other tax consequences of the acquisition, ownership and disposition of A shares, H Shares or ADRs.
As a result of the new corporate income tax law, the statutory corporate income tax rate currently adopted by the Company and its subsidiaries has been changed from 33% to 25% with effect from January 1, 2008. Pursuant to new corporate income tax law, the corporate income tax rates of entities that previously enjoyed preferential tax rates of 15% have been revised to 18%, 20%, 22%, 24% and 25% for 2008, 2009, 2010, 2011 and 2012 onwards, respectively.
65
Dividends
The new corporate income tax law and its relevant regulations generally provides for the imposition of a withholding tax on dividends paid by a Chinese company to a non-resident enterprise at a rate of 10%.
China currently has double-taxation treaties with a number of countries, including Australia, Canada, France, Germany, Japan, Malaysia, the Netherlands, Singapore, the United Kingdom and the United States. Under the U.S.-PRC Tax Treaty, China may tax a dividend paid by the Company to a U.S. holder up to a maximum of 10% of the gross amount of such dividend.
For individuals, Chinese tax law generally provides that an individual who receives dividends from Chinese companies is subject to a 20% individual income tax. A 50% reduction of taxable income is granted by Chinese tax law for an individual receiving dividends from a listed company on Shanghai Stock Exchange or Shenzhen Stock Exchange. As a result, the effective tax rate for dividends received by A share individual holder is 10%. Currently, dividend income received by any foreign individual that holds overseas shares in any Chinese domestic enterprise is temporarily exempt from individual income tax. In the event that the exemption is discontinued, such payments will be subject to individual income tax at the 20% rate unless the holder is entitled to a tax waiver or a lower tax rate under an applicable double-taxation treaty.
Capital Gains from Transfer or Disposition of Shares
The new corporate income tax law and its relevant regulations generally provides that a non-resident enterprise is subject to a 10% capital gains tax for the transfer or disposition of shares of a Chinese company.
For individual shareholders, Chinese tax law generally provide that an individual who transfers or otherwise disposes of a company’s shares of capital stock is subject to a 20% individual income tax on the capital gain, if any. Currently, all individuals are temporarily exempt from individual income tax on transfers of shares of joint stock companies listed on Shanghai Stock Exchange or Shenzhen Stock Exchange, such as the Company. Should such temporary exemption be discontinued, such holders may be subject to a 20% individual income tax on the capital gain, if any, unless reduced by an applicable double-taxation treaty.
United States Federal Income Taxation
This discussion describes general U.S. federal income tax consequences of the purchase, ownership and disposition of the Company’s ADRs. This discussion does not address any aspect of U.S. federal gift or estate tax, or the state, local or foreign tax consequences of an investment in the Company’s ADRs. This discussion applies to you only if you hold and beneficially own the Company’s ADRs as capital assets for tax purposes. This discussion does not apply to you if you are a member of a class of holders subject to special rules, such as:
|
·
|
dealers in securities or currencies;
|
|
·
|
traders in securities that elect to use a mark-to-market method of accounting for securities holdings;
|
|
·
|
banks or other financial institutions;
|
|
·
|
insurance companies;
|
|
·
|
tax-exempt organizations;
|
|
·
|
partnerships and other entities treated as partnerships for U.S. federal income tax purposes or persons holding ADRs through any such entities;
|
|
·
|
persons that hold ADRs as part of a hedge, straddle, constructive sale, conversion transaction or other integrated investment;
|
|
·
|
U.S. Holders (as defined below) whose functional currency for tax purposes is not the U.S. dollar;
|
|
·
|
persons liable for alternative minimum tax; or
|
|
·
|
persons who actually or constructively own 10% or more of the total combined voting power of all classes of the Company’s shares (including ADRs) entitled to vote.
|
66
This discussion is based on the U.S. Internal Revenue Code of 1986, as amended, which is referred to in this discussion as the Code, its legislative history, existing and proposed regulations promulgated thereunder, published rulings and court decisions, all as currently in effect. These laws are subject to change, possibly on a retroactive basis. In addition, this discussion relies on the assumptions regarding the value of the Company’s shares and the nature of its business over time. Finally, this discussion is based in part upon the representations of the depositary and the assumption that each obligation in the deposit agreement and any related agreement will be performed in accordance with its terms. For U.S. federal income tax purposes, as a holder of ADRs, you are treated as the owner of the underlying ordinary shares represented by such ADRs.
The discussions and comments included herein are only a general description of the tax aspects and they do not constitute a tax advice or opinion. Therefore, you should consult your own tax advisor concerning the particular U.S. federal income tax consequences to you of the purchase, ownership and disposition of the Company’s ADRs, as well as the consequences to you arising under the laws of any other taxing jurisdiction.
For purposes of the U.S. federal income tax discussion below, you are a “U.S. Holder” if you beneficially own ADRs and are:
|
·
|
a citizen or resident of the United States for U.S. federal income tax purposes;
|
|
·
|
a corporation, or other entity taxable as a corporation, that was created or organized in or under the laws of the United States or any political subdivision thereof;
|
|
·
|
an estate the income of which is subject to U.S. federal income tax regardless of its source; or
|
|
·
|
a trust if (a) a court within the United States is able to exercise primary supervision over its administration and one or more U.S. persons have the authority to control all substantial decisions of the trust, or (b) the trust has a valid election in effect to be treated as a U.S. person.
|
If you are not a U.S. person, please refer to the discussion below under “Non-U.S. Holders.”
For U.S. federal income tax purposes, income earned through a foreign or domestic partnership or other flow-through entity is attributed to its owners. Accordingly, if a partnership or other flow-through entity holds ADRs, the tax treatment of the holder will generally depend on the status of the partner or other owner and the activities of the partnership or other flow-through entity.
U.S. Holders
Dividends on ADRs
Subject to the PFIC discussion below, if the Company makes distributions and you are a U.S. Holder, the gross amount of any distributions you receive on your ADRs will generally be treated as dividend income if the distributions are made from the Company’s current or accumulated earnings and profits, calculated according to U.S. federal income tax principles. Dividends will generally be subject to U.S. federal income tax as ordinary income on the day you actually or constructively receive such income. However, if you are an individual and have held your ADRs for a sufficient period of time, dividend distributions on the Company’s ADRs will generally constitute qualified dividend income taxed at a preferential rate (generally 15% for dividend distributions before January 1, 2009) as long as the Company’s ADRs continue to be readily tradable on the New York Stock Exchange and certain other conditions apply. You should consult your own tax adviser as to the rate of tax that will apply to you with respect to dividend distributions, if any, you receive from us.
Distributions on the Company’s ADRs, if any, will generally be taxed to you as dividend distributions for U.S. tax purposes. Even if you are a corporation, you will not be entitled to claim a dividends-received deduction with respect to distributions you receive from the Company. Dividends generally will constitute foreign source passive income for U.S. foreign tax credit limitation purposes.
Sales and other dispositions of ADRs
Subject to the PFIC discussion below, when you sell or otherwise dispose of the Company’s ADRs, you will generally recognize capital gain or loss in an amount equal to the difference between the amount realized on the sale or other disposition and your adjusted tax basis in the ADRs, both as determined in U.S. dollars. Your adjusted tax basis will generally equal the amount you paid for the ADRs. Any gain or loss you recognize will be long-term capital gain or loss if your holding period in the Company’s ADRs is more than one year at the time of disposition. If you are an individual, any such long-term capital gain will be taxed at preferential rates. Your ability to deduct capital losses will be subject to various limitations.
Passive Foreign Investment Company
If the PFIC in any taxable year in which you hold the Company’s ADRs, as a U.S. Holder, you would generally be subject to adverse U.S. tax consequences, in the form of increased tax liabilities and special U.S. tax reporting requirements.
67
The Company will be classified as a PFIC in any taxable year if either: (1) the average percentage value of its gross assets during the taxable year that produce passive income or are held for the production of passive income is at least 50% of the value of its total gross assets (the “Asset Test”); or (2) 75% or more of its gross income for the taxable year is passive income (such as certain dividends, interest or royalties)(the “Income Test”). For purposes of the Asset Test: (1) any cash, cash equivalents, and cash invested in short-term, interest bearing, debt instruments, or bank deposits that is readily convertible into cash, will generally count as producing passive income or held for the production of passive income; and (2) the average value of the Company’s gross assets is calculated based on its market capitalization. In the case of publicly traded corporations, fair market value must be used for purposes of applying the Asset Test. In addition, regarding the above two tests, there are complex look-through rules to consider with respect to the assets and activities of related corporations from which the foreign corporation either receives income or in which it holds an interest. More specifically, certain adjustments are made to exclude certain income received from a related party or include income and assets held by a 25% or more owned subsidiary in determining whether a foreign company qualifies as a PFIC under the two tests. In particular: 1) passive income received from a related party is excluded if it is properly allocable to the non-passive income of the related party, and 2) a foreign company that owns directly or indirectly 25% or more of the stock of another corporation is treated as if it owned directly a proportionate share of that corporation’s assets and income.
The Company believes that it was not a PFIC for the taxable year 2010. However, there can be no assurance that the Company will not be a PFIC for the taxable year 2011 and/or later taxable years, as PFIC status is re-tested each year and depends on the facts in such year. For example, the Company would be a PFIC for the taxable year 2010 if the sum of its average market capitalization, which is its share price multiplied by the total amount of its outstanding shares, and its liabilities over that taxable year is not more than twice the value of its cash, cash equivalents, and other assets that are readily converted into cash.
If the Company were a PFIC, you would generally be subject to additional taxes and interest charges on certain “excess” distributions the Company makes regardless of whether the Company continues to be a PFIC in the year in which you receive an “excess” distribution or dispose of or are deemed to dispose of your ADRs. An excess distribution would be either (1) a distribution with respect to ADRs that is greater than 125% of the average of such distributions over the preceding three years, or (2) 100% of the gain from the disposition of shares/ADRs.
To compute the tax on “excess” distributions or any gain, (1) the “excess” distribution or the gain would be allocated ratably to each day in your holding period, (2) the amount allocated to the current year and any tax year before the Company became a PFIC would be taxed as ordinary income in the current year, (3) the amount allocated to other taxable years would be taxable at the highest applicable marginal rate in effect for that year, and (4) an interest charge at the rate for underpayment of taxes for any period described under (3) above would be imposed with respect to any portion of the “excess” distribution or gain that is allocated to such period. In addition, if the Company were a PFIC, no distribution that you receive from the Company would qualify for taxation at the preferential rate discussed in the “Dividends on ADRs” section above.
If the Company were a PFIC in any year, as a U.S. Holder, you would be required to make an annual return on IRS Form 8621 “Return by a Shareholder of a Passive Foreign Investment Company or a Qualified Electing Fund.” However, the Company does not intend to generate, or share with you, information that you might need to properly complete IRS Form 8621. You should consult with your own tax adviser regarding reporting requirements with regard to your ADRs.
As described above, if the Company were a PFIC in any year, you would generally be able to avoid the “excess” distribution rules described above by making a timely so-called “mark-to-market” election with respect to your ADRs provided the Company’s ADRs are “marketable”. The Company’s ADRs will be “marketable” as long as they remain regularly traded on a national securities exchange, such as the New York Stock Exchange. If you made this election in a timely fashion, you would generally recognize as ordinary income or ordinary loss the difference between the fair market value of your ADRs on the first day of any taxable year and their value on the last day of that taxable year. Any ordinary income resulting from this election would generally be taxed at ordinary income rates and would not be eligible for the reduced rate of tax applicable to qualified dividend income. Any ordinary losses would be limited to the extent of the net amount of previously included income as a result of the mark-to-market election, if any. Your basis in the ADRs would be adjusted to reflect any such income or loss. You should consult with your own tax adviser regarding potential advantages and disadvantages to you of making a “mark-to-market” election with respect to your ADRs. Separately, if the Company were a PFIC in any year, you would be able to avoid the “excess” distribution rules by making a timely election to treat us as a so-called “Qualified Electing Fund” or “QEF”. You would then generally be required to include in gross income for any taxable year (1) as ordinary income, your pro rata share of the Company’s ordinary earnings for the taxable year, and (2) as long-term capital gain, your pro rata share of the Company’s net capital gain for the taxable year. However, the Company does not intend to provide you with the information you would need to make or maintain a “QEF” election and you will, therefore, not be able to make or maintain such an election with respect to your ADRs.
Non-US Holders
If you beneficially own ADRs and are not a U.S. Holder for U.S. federal income tax purposes (a “Non-US Holder”), you generally will not be subject to U.S. federal income tax or U.S. withholding tax on dividends received from the Company with respect to ADRs unless that income is considered effectively connected with your conduct of a U.S. trade or business and, if an applicable income tax treaty so requires as a condition for you to be subject to U.S. federal income tax with respect to income from your ADRs, such dividends are attributable to a permanent establishment that you maintain in the United States. You generally will not be subject to U.S. federal income tax, including withholding tax, on any gain realized upon the sale or exchange of ADRs, unless:
68
|
·
|
that gain is effectively connected with the conduct of a U.S. trade or business and, if an applicable income tax treaty so requires as a condition for you to be subject to U.S. federal income tax with respect to income from your ADRs, such gain is attributable to a permanent establishment that you maintain in the United States; or
|
|
·
|
you are a non-resident alien individual and are present in the United States for at least 183 days in the taxable year of the sale or other disposition and either (1) your gain is attributable to an office or other fixed place of business that you maintain in the United States or (2) you have a tax home in the United States.
|
If you are engaged in a U.S. trade or business, unless an applicable tax treaty provides otherwise, the income from your ADRs, including dividends and the gain from the disposition of the Company’s ADRs, that is effectively connected with the conduct of that trade or business will generally be subject to the rules applicable to U.S. Holders discussed above. In addition, if you are a corporation, you may be subject to an additional branch profits tax at a rate of 30% or any lower rate under an applicable tax treaty.
U.S. information reporting and backup withholding rules
In general, dividend payments with respect to the ADRs and the proceeds received on the sale or other disposition of those ADRs may be subject to information reporting to the IRS and to backup withholding (currently imposed at a rate of 28%). Backup withholding will not apply, however, if you (1) are a corporation or come within certain other exempt categories and, when required, can demonstrate that fact or (2) provide a taxpayer identification number, certify as to no loss of exemption from backup withholding and otherwise comply with the applicable backup withholding rules. To establish your status as an exempt person, you will generally be required to provide certification on IRS Form W-9, W-8BEN or W-8ECI, as applicable. Any amounts withheld from payments to you under the backup withholding rules will be allowed as a refund or a credit against your U.S. federal income tax liability, provided that you furnish the required information to the IRS.
HOLDERS OF THE COMPANY’S ADRS SHOULD CONSULT WITH THEIR OWN TAX ADVISORS REGARDING THE APPLICATION OF THE U.S. FEDERAL INCOME TAX LAWS TO THEIR PARTICULAR SITUATIONS AS WELL AS ANY TAX CONSEQUENCES RESULTING FROM PURCHASING, HOLDING OR DISPOSING OF THE ADRS, INCLUDING THE APPLICABILITY AND EFFECT OF THE TAX LAWS OF ANY STATE, LOCAL OR FOREIGN JURISDICTION AND INCLUDING ESTATE, GIFT, AND INHERITANCE LAWS.
Dividends and Paying Agents
Not applicable.
Statement by Experts
Not applicable.
Documents on Display
The Company has filed this Annual Report on Form 20-F with the Securities and Exchange Commission under the Securities Exchange Act of 1934, as amended. Statements made in this Annual Report as to the contents of any document referred to are not necessarily complete. With respect to each such document filed as an exhibit to this Annual Report, reference is made to the exhibit for a more complete description of the matter involved, and each such statement shall be deemed qualified in its entirety by such reference.
The Company is subject to the informational requirements of the Exchange Act and file reports and other information with the Securities and Exchange Commission. Reports and other information which the Company filed with the Securities and Exchange Commission, including this Annual Report on Form 20-F, may be inspected and copied at the public reference room of the Securities and Exchange Commission at 450 Fifth Street N.W. Washington D.C. 20549.
You can also obtain copies of this Annual Report on Form 20-F by mail from the Public Reference Section of the Securities and Exchange Commission, 450 Fifth Street, N.W., Washington D.C. 20549, at prescribed rates. Additionally, copies of this material may be obtained from the Securities and Exchange Commission’s Internet site at http://www.sec.gov. The Commission’s telephone number is 1-800-SEC-0330. Copies of this material may also be obtained for the Company’s website at http:// www.csair.com.
Subsidiary Information
Not applicable.
The Group’s earnings are affected by changes in the price and availability of jet fuel. There are currently no effective means available to manage the Group’s exposure to the fluctuations in domestic jet fuel prices. The Group’s results of operations may be significantly affected by fluctuations in fuel prices which is a significant expense for the Group. A reasonable possible increase or decrease of 10% in jet fuel price, with volume of fuel consumed and all other variables held constant, would have increased/decreased the fuel costs by approximately RMB2,349 million. The sensitivity analysis of jet fuel price risk is disclosed in Note 49(e) to the Financial Statements.
69
The Group is subject to market risks due to fluctuations in interest rates. The majority of the Group’s borrowing is in the form of long-term fixed-rate and variable-rate debts with original maturities ranging from three to twelve years. Fluctuations in interest rates can lead to significant fluctuations in the fair value of such debt instruments. From time to time, the Group may enter into interest rate swaps designed to mitigate exposure relating to interest rate risks. No such contract was outstanding as of December 31, 2010. The sensitivity analysis of interest rate risk is disclosed in Note 49(b) to the Financial Statements.
The Group is also exposed to foreign currency risk as a result of its aircraft and flight equipment being sourced from overseas suppliers. Specifically, the Group’s foreign currency exposure relates primarily to its foreign currency long-term bank and other loans used to finance such capital expenditures and its capital commitments. Subject to certain restrictive conditions imposed by the SAFE, the Group may, from time to time, enter into foreign exchange forward option contracts to mitigate its foreign currency exposures. As of December 31, 2010, the Group had two outstanding foreign exchange forward option contracts of notional amount ranging from US$4 million to US$8 million. The contracts are to buy US Dollars by selling Japanese Yen at certain specified rates on monthly settlement dates until the maturity of the contracts in 2011. At December 31, 2010, the fair value of these foreign exchange forward option contracts was liabilities of approximately RMB13 million. The sensitivity analysis of foreign currency risk is disclosed in Note 49(c) to the Financial Statements.
As of December 31, 2010, the Group operated a total of 209 aircraft under operating leases and capital leases at rates that are substantially fixed. Such leases expose the Group to market risks; however, in accordance with Item 305 of Regulation S-K, such leases have been excluded from the following market risk tables. Commitments under capital leases and operating leases are disclosed in Note 50 to the Financial Statements, respectively.
The following table provides information regarding the Group’s material interest rate sensitive financial instruments as of December 31, 2010 and 2009:
|
As of December 31, 2010
Expected maturity date
|
As of December 31,
2009
|
|||||||||||||||||||||||||||||||||||||||
|
(RMB in millions)
|
||||||||||||||||||||||||||||||||||||||||
|
2011
|
2012
|
2013
|
2014
|
2015
|
Thereafter
|
Total
recorded
amount
|
Fair
value(2)
|
Total
recorded
amount
|
Fair
value(2)
|
|||||||||||||||||||||||||||||||
|
Fixed-rate bank
and other loans in
US$
|
260 | 203 | 168 | 171 | 423 | 122 | 1,347 | 1,386 | 772 | 795 | ||||||||||||||||||||||||||||||
|
Average interest rate
|
3.40 | % | 3.40 | % | 3.41 | % | 3.41 | % | 3.48 | % | 3.35 | % | - | - | - | - | ||||||||||||||||||||||||
|
Variable-rate bank and other loans in US$
|
8,720 | 10,005 | 6,481 | 1,634 | 2,384 | 9,786 | 39,010 | 39,010 | 38,399 | 38,399 | ||||||||||||||||||||||||||||||
|
Average interest rate
|
1.66 | % | 1.58 | % | 1.58 | % | 1.65 | % | 1.62 | % | 1.63 | % | - | - | - | - | ||||||||||||||||||||||||
|
Variable-rate bank and other loans in RMB
|
344 | 325 | 171 | - | - | - | 840 | 840 | 6,153 | 6,153 | ||||||||||||||||||||||||||||||
|
Average interest rate
|
4.89 | % | 4.98 | % | 4.99 | % | - | - | - | - | - | - | - | |||||||||||||||||||||||||||
|
Fixed-rate bills payable in RMB
|
- | - | - | - | - | - | - | - | 3,202 | 3,202 | ||||||||||||||||||||||||||||||
|
Average interest rate
|
- | - | - | - | - | - | - | - | - | - | ||||||||||||||||||||||||||||||
|
|
(1)
|
These interest rates are calculated based on the year end indices.
|
|
|
(2)
|
Fair value of debt instruments was estimated based on the interest rates applicable to similar debt instruments as of December 31, 2010 and 2009.
|
70
The following table provides information regarding the Group’s material foreign currency sensitive financial instruments and capital commitments as of December 31, 2010 and 2009:
|
As of December 31, 2010
Expected maturity date
|
||||||||||||||||||||||||||||||||||||||||
|
(RMB in millions)
|
As of December 31, 2009
|
|||||||||||||||||||||||||||||||||||||||
|
2011
|
2012
|
2013
|
2014
|
2015
|
Thereafter
|
Total
recorded
amount
|
Fair
value(1)
|
Total
recorded
amount
|
Fair
value(1)
|
|||||||||||||||||||||||||||||||
|
Fixed-rate bank and other loans In US$
|
260 | 203 | 168 | 171 | 423 | 122 | 1,347 | 1,386 | 772 | 795 | ||||||||||||||||||||||||||||||
|
Variable-rate bank and other loans In US$
|
8,720 | 10,005 | 6,481 | 1,634 | 2,384 | 9,786 | 39,010 | 39,010 | 38,399 | 38,399 | ||||||||||||||||||||||||||||||
|
Capital commitment in US$
|
20,445 | 20,033 | 15,980 | 10,720 | 6,731 | - | 73,909 | 73,909 | 65,843 | 65,843 | ||||||||||||||||||||||||||||||
|
(1)
|
Fair value of debt instruments was estimated based on the floating interest rates applicable to similar debt instruments as of December 31, 2010 and 2009.
|
|
A.
|
Debt Securities
|
Not applicable.
|
B.
|
American Depositary Shares
|
Not applicable.
|
C.
|
Other Securities
|
Not applicable.
The Bank of New York Mellon collects its fees for delivery and surrender of ADSs directly from investors depositing shares or surrendering ADSs for the purpose of withdrawal or from intermediaries acting for them. The Bank of New York Mellon collects fees for making distributions to investors by deducting those fees from the amounts distributed or by selling a portion of distributable property to pay the fees. The Bank of New York Mellon may collect its annual fee for depositary services by deductions from cash distributions or by directly billing investors or by charging the book-entry system accounts of participants acting for them. The Bank of New York Mellon may generally refuse to provide fee-attracting services until its fees for those services are paid.
|
Persons depositing or withdrawing shares must pay:
|
For:
|
|
|
$5.00 (or less) per 100 ADSs (or portion of 100 ADSs)
|
• Issuance of ADSs, including issuances resulting from a distribution of shares or rights or other property
• Cancellation of ADSs for the purpose of withdrawal, including if the deposit agreement terminates
|
|
|
$.02 (or less) per ADS
|
• Any cash distribution to ADS registered holders
|
|
|
A fee equivalent to the fee that would be payable if securities distributed to you had been shares and the shares had been deposited for issuance of ADSs
|
• Distribution of securities distributed to holders of deposited securities which are distributed by the depositary to ADS registered holders
|
|
|
$.02 (or less) per ADSs per calendar year
|
• Depositary services
|
|
|
Registration or transfer fees
|
• Transfer and registration of shares on our share register to or from the name of the depositary or its agent when you deposit or withdraw shares
|
71
|
Expenses of the depositary
|
• Cable, telex and facsimile transmissions (when expressly provided in the deposit agreement)
• Converting foreign currency to U.S. dollars
|
|
|
Taxes and other governmental charges the depositary or the custodian have to pay on any ADS or share underlying an ADS, for example, stock transfer taxes, stamp duty or withholding taxes
|
• As necessary
|
|
|
Any charges incurred by the depositary or its agents for servicing the deposited securities
|
• As necessary
|
Fees and Payments from the Depositary to Us
In 2010, the Company received from the depositary a reimbursement of US$85,556.78, net of withholding tax, for continuing annual stock exchange listing fees and expenses incurred by the Company in connection with the administration and maintenance of the depositary receipt facility.
Indirect payments
As part of its service to the Company, the Bank of New York Mellon waived a total amount of US$140,893.67 for the standard costs associated with the administration of the ADS program in 2010.
None.
|
A.
|
Material Modifications to the Instruments Defining the Rights of Security Holders
|
None.
|
B.
|
Material Modifications to the Rights of Registered Securities by Issuing or modifying any Other Class of Securities
|
None.
|
C.
|
Withdrawal or Substitution of A Material Amount of the Assets Securing Any Registered Securities
|
Not applicable.
|
D.
|
Change of Trustees or Paying Agents for Any Registered Securities
|
Not applicable.
|
E.
|
Use of Proceeds
|
Not applicable.
|
(a)
|
Disclosure controls and procedures
|
Our president and chief financial officer have evaluated the effectiveness of our disclosure controls and procedures (as defined in the Exchange Act Rules 13a-15(e) or 15d-15(e)), and concluded that, based on their evaluation, our disclosure controls and procedures are effective as of the end of the period covered by this Annual Report to ensure that information required to be disclosed by the Company in the reports that it files or submits under the Exchange Act is recorded, processed, summarized and reported, within the time periods specified in the SEC’s rules and forms.
72
|
(b)
|
Management’s annual report on internal control over financial reporting
|
Our management is responsible for establishing and maintaining adequate internal control over financial reporting as defined in Rules 13a-15(f) and 15d-15(f) under the Exchange Act. Internal control over financial reporting is a process designed to provide reasonable assurance regarding the reliability of financial reporting and the preparation of financial statements for external purposes in accordance with generally accepted accounting principles and includes those policies and procedures that (1) pertain to the maintenance of records that, in reasonable detail, accurately and fairly reflect the transactions and dispositions of a company’s assets, (2) provide reasonable assurance that transactions are recorded as necessary to permit preparation of consolidated financial statements in accordance with generally accepted accounting principles, and that a company’s receipts and expenditures are being made only in accordance with authorizations of a company’s management and directors, and (3) provide reasonable assurance regarding prevention or timely detection of unauthorized acquisition, use, or disposition of a company’s assets that could have a material effect on the consolidated financial statements. Our management has assessed the effectiveness of internal control over financial reporting based on the Internal Control - Integrated Framework issued by the Committee of Sponsoring Organizations of the Treadway Commission. Our management has concluded that our internal control over financial reporting was effective as of December 31, 2010.
Because of its inherent limitations, internal control over financial reporting may not prevent or detect misstatements. Also, projections of any evaluation of effectiveness to future periods are subject to the risk that controls may become inadequate because of changes in conditions, or that the degree of compliance with policies or procedures may deteriorate.
|
(c)
|
Attestation of the Registered Public Accounting Firm
|
Report of Independent Registered Public Accounting Firm
The Board of Directors and Shareholders of
China Southern Airlines Company Limited:
We have audited the internal control over financial reporting of China Southern Airlines Company Limited (the “Company”) as of December 31, 2010, based on criteria established in
Internal Control – Integrated Framework
issued by the Committee of Sponsoring Organizations of the Treadway Commission (COSO). The Company’s management is responsible for maintaining effective internal control over financial reporting and for its assessment of the effectiveness of internal control over financial reporting, included in the accompanying Management’s Report on Internal Control over Financial Reporting. Our responsibility is to express an opinion on the Company’s internal control over financial reporting based on our audit.
We conducted our audit in accordance with the standards of the Public Company Accounting Oversight Board (United States). Those standards require that we plan and perform the audit to obtain reasonable assurance about whether effective internal control over financial reporting was maintained in all material respects. Our audit included obtaining an understanding of internal control over financial reporting, assessing the risk that a material weakness exists, and testing and evaluating the design and operating effectiveness of internal control based on the assessed risk. Our audit also included performing such other procedures as we considered necessary in the circumstances. We believe that our audit provides a reasonable basis for our opinion.
A company’s internal control over financial reporting is a process designed to provide reasonable assurance regarding the reliability of financial reporting and the preparation of financial statements for external purposes in accordance with generally accepted accounting principles. A company’s internal control over financial reporting includes those policies and procedures that (1) pertain to the maintenance of records that, in reasonable detail, accurately and fairly reflect the transactions and dispositions of the assets of the company; (2) provide reasonable assurance that transactions are recorded as necessary to permit preparation of financial statements in accordance with generally accepted accounting principles, and that receipts and expenditures of the company are being made only in accordance with authorizations of management and directors of the company; and (3) provide reasonable assurance regarding prevention or timely detection of unauthorized acquisition, use, or disposition of the company’s assets that could have a material effect on the financial statements.
Because of its inherent limitations, internal control over financial reporting may not prevent or detect misstatements. Also, projections of any evaluation of effectiveness to future periods are subject to the risk that controls may become inadequate because of changes in conditions, or that the degree of compliance with the policies or procedures may deteriorate.
In our opinion, China Southern Airlines Company Limited maintained, in all material respects, effective internal control over financial reporting as of December 31, 2010, based on criteria established in
Internal Control – Integrated Framework
issued by the COSO.
We also have audited, in accordance with the standards of the Public Company Accounting Oversight Board (United States), the consolidated balance sheets of China Southern Airlines Company Limited and its subsidiaries as of December 31, 2010 and 2009, and the related consolidated income statements, consolidated statements of comprehensive income, consolidated statements of changes in equity, and consolidated cash flow statements for each of the years in the three-year period ended December 31, 2010, and our report dated March 28, 2011, expressed an unqualified opinion on those consolidated financial statements.
/s/ KPMG
Hong Kong, China
March 28, 2011
73
|
(d)
|
Changes in internal control over financial reporting
|
During the year ended December 31, 2010, there have been no changes in our internal control over financial reporting that have materially affected, or are reasonably likely to materially affect, our internal control over financial reporting.
The Board of Directors has determined that Mr. Gong Hua Zhang qualifies as an audit committee financial expert in accordance with the terms of Item 16A of Form 20-F. Mr. Gong Hua Zhang satisfies as an “independent director” within the meaning of NYSE Manual Section 303A and meets the criteria for independence set forth in Section 10A(m)(3) of the US Securities Exchange Act of 1934, as amended, or the Exchange Act, and Rule 10A-3 under the Exchange Act. See “Item 6 Directors, Senior Management and Employees — Directors and Senior Management”.
The Company has adopted a code of ethics that applies to the Company’s principal executive officer, principal financial officer and principal accounting officer. Such code is included in the director service agreements, a form of which is incorporated by reference in this Annual Report in Exhibit 4.1. Each of the aforementioned senior corporate officers currently serves as a Director and all of our Directors are subject to the director service contracts with the Company. Pursuant to the director service agreements, among other things, Directors (i) owe fiduciary duties to the Company and shall perform their duties in compliance with applicable governmental laws, rules and regulations; (ii) shall not engage in any activities in competition with the Company’s business or carry out any activities detrimental to the interests of the Company; and (iii) shall be held liable for any loss or injury incurred to the Company as a result of such Director’s violation of applicable laws and regulations.
The following table sets forth the aggregate audit fees, audit-related fees, tax fees of the Company’s principal accountants and all other fees billed for products and services provided by the Company’s principal accountants other than the audit fees, audit-related fees and tax fees for each of the fiscal years 2009 and 2010:
|
Audit Fees
|
Audit-Related
Fees
|
Tax Fees
|
Other Fees
|
|||||||||||||
|
2009
|
RMB
|
10.9 million
|
RMB
|
4.0 million
|
RMB
|
0.25 million
|
RMB
|
1.6 million
|
||||||||
|
2010
|
RMB
|
9.0 million
|
RMB
|
3.3 million
|
RMB
|
0.25 million
|
RMB
|
2.0 million
|
||||||||
Audit-related fees
Review of the Group’s 2009 interim financial report prepared under IFRSs and 2010 interim financial report prepared under IFRSs.
Tax fees
Services provided primarily consist of tax compliance services.
Other fees
Provision of services in respect of agreed upon procedures on statement of working capital sufficiency, indebtedness statement and profit forecast as required by Hong Kong Listing Rules, capital verifications and internal control advisory services.
Prior to our principal accountant being engaged by the Company or our subsidiaries to render the audit or non audit services, the engagements have been approved by our audit committee.
Not applicable.
74
The Company and its associates have not purchased any issued common shares of the Company during 2010 and up to the date of this Annual Report.
Not applicable.
Set out below is a summary of any significant ways in which the Company’s corporate governance practices differ from those followed by domestic companies under the listing standards of the New York Stock Exchange (“NYSE”):
|
The Company’s governance practices
|
||
|
Director Independence
A listed company must have a majority of independent directors on its board of directors. No director qualifies as “independent” unless the board of directors affirmatively determines that the director has no material relationship with the listed company (either directly or as a partner, shareholder or officer of an organization that has a relationship with the company). In addition, a director must meet certain standards to be deemed independent. For example, a director is not independent if the director is, or has been within the last three years, an employee of the listed company, or if the director has received, during any twelve-month period within the last three years, more than US$120,000 in direct compensation from the listed company, other than director and committee fees and pension or other forms of deferred compensation for prior service (provided such compensation is not contingent in any way on continued service).
|
Director Independence
The Company has complied with the relevant Chinese corporate governance rules and has implemented internal rules governing the independence and responsibilities of independent directors. The Company determines the independence of independent directors every year.
|
|
|
Executive Sessions
The non-management directors of each listed company must meet at regularly scheduled executive sessions without management.
|
Executive Sessions
No similar requirements.
|
|
|
Nominating/Corporate Governance Committee
Listed companies must have a nominating/corporate governance committee composed entirely of independent directors.
The nominating/corporate governance committee must have a written charter that addresses the committee’s purposes and responsibilities which, at minimum, must be to: identify individuals qualified to become board members, consistent with criteria approved by the board, and to select, or to recommend that the board select, the director nominees for the next annual meeting of shareholders; develop and recommend to the board a set of corporate governance guidelines applicable to the corporation; and oversee the evaluation of the board and management, and evaluate the performance of the committee every year.
|
Nominating/Corporate Governance Committee
The Company has established a nominating committee. As of December 31, 2010, the Nomination Committee consists of three members, Messrs Si Xian Min (non-executive Director), Wei Jin Cai (Independent non-executive Director) and Gong Hua Zhang (Independent non-executive Director). Mr. Si Xian Min was appointed as the chairman of the Nomination Committee on December 29, 2010. The responsibilities of the Nomination Committee are to make recommendations to the Board in respect of the size and composition of the Board based on the operational activities, assets and shareholding structure of the Company; study the selection criteria and procedures of directors and executives and give advice to the Board; identify qualified candidates for directors and executives; investigate and propose candidates for directors and managers and other senior management members to the Board.
|
|
|
Compensation Committee
Listed companies must have a compensation committee composed entirely of independent directors.
|
Compensation Committee
The Company has established a remuneration committee consisting of three members. As of December 31, 2010, the remuneration committee is chaired by independent non-executive Director Ning Xiang Dong with independent non-executive Director Gong Hua Zhang and non-executive Director Wang Quan Hua as members.
|
75
76
We have elected to provide the financial statements and related information specified in Item 18 in lieu of Item 17.
Reference is made to pages F-1 to F-90.
Index to Exhibits
|
Exhibit No.
|
Description of Exhibit
|
|
|
1.1
|
Restated and Amended Articles of Association of China Southern Airlines Company Limited
(1)
|
|
|
4.1
|
Form of Director’s Service Agreement
(2)
|
|
|
4.2
|
Form of Non-Executive Director’s Service Agreement
(3)
|
|
|
4.3
|
Aircraft General Terms Agreement entered into by and between Airbus S.A.S. and China Southern Airlines Company Limited on January 20, 2010
(4)
|
|
|
4.4
|
A320 Family Aircraft Purchase Agreement entered into by and between the Company and Airbus S.A.S. on January 20, 2010
(5)
|
|
|
4.5
|
A330-300 Aircraft Purchase Agreement entered into by and between the Company and Airbus S.A.S. on November 4, 2010*#
|
|
|
4.6
|
A320 Family Aircraft Purchase Agreement entered into by and between the Company and Airbus S.A.S. on November 4, 2010*#
|
|
|
4.7
|
Supplemental Agreement No. 1 to Purchase Agreement No. 3323 entered into by and between Xiamen Airlines and Boeing on September 30, 2010*
|
|
|
4.8
|
Joint Venture Agreement entered into by and among the Company, Hebei Aviation Investment Group Co., Ltd. and Xiamen Jianfa Group Co. Ltd. on December 20, 2010
|
|
|
4.9
|
A Shares Subscription Agreement entered into by and between the Company and CSAHC on March 8, 2010
(6)
|
|
|
4.10
|
H Shares Subscription Agreement entered into by and between the Company and Nan Lung Holding Limited on March 8, 2010
(7)
|
|
|
4.11
|
Transfer Agreement entered into by and among the Company, CSAHC, Zhuhai MTU and MTU Aero Engines GmbH on September 28, 2009
(8)
|
|
|
4.12
|
Transfer Agreement entered into between CSAHC and the Company on September 28, 2009 for the disposal of 50% Equity Interest in Zhuhai MTU
(9)
|
|
|
8.1
|
Subsidiaries of China Southern Airlines Company Limited
|
|
|
11.1
|
Code of Ethics (included in Exhibit 4.1)
|
|
|
12.1
|
Section 302 Certification of President
|
|
|
12.2
|
Section 302 Certification of Chief Financial Officer
|
|
|
13.1
|
Section 906 Certification of President
|
|
|
13.2
|
Section 906 Certification of Chief Financial Officer
|
|
* Portions of this document have been omitted pursuant to a confidential treatment request, and the full, unredacted document has been separately submitted to the Securities and Exchange Commission with a confidential treatment request.
# This purchase agreement references an aircraft general terms agreement stated to be dated February 2, 2010. This Aircraft General Terms Agreement is in fact the Aircraft General Terms Agreement filed as Exhibit 4.3 to our Form 20-F for the year ended December 31, 2009 and incorporated by reference herein as Exhibit 4.3.
77
(2) Incorporated by reference to the Exhibit 4.1 to our Form 20-F (File No. 001-14660) for the year ended December 31, 2005 filed with the Securities and Exchange Commission on June 30, 2006
(3) Incorporated by reference to the Exhibit 4.2 to our Form 20-F (File No. 001-14660) for the year ended December 31, 2005 filed with the Securities and Exchange Commission on June 30, 2006
(4) Incorporated by reference to the Exhibit 4.3 to our Form 20-F (File No. 001-14660) for the year ended December 31, 2009 filed with the Securities and Exchange Commission on May 28, 2010
(5) Incorporated by reference to the Exhibit 4.4 to our Form 20-F (File No. 001-14660) for the year ended December 31, 2009 filed with the Securities and Exchange Commission on May 28, 2010
(6) Incorporated by reference to the Exhibit 4.7 to our Form 20-F (File No. 001-14660) for the year ended December 31, 2009 filed with the Securities and Exchange Commission on May 28, 2010
(7) Incorporated by reference to the Exhibit 4.8 to our Form 20-F (File No. 001-14660) for the year ended December 31, 2009 filed with the Securities and Exchange Commission on May 28, 2010
(8) Incorporated by reference to the Exhibit 4.9 to our Form 20-F (File No. 001-14660) for the year ended December 31, 2009 filed with the Securities and Exchange Commission on May 28, 2010
(9) Incorporated by reference to the Exhibit 4.10 to our Form 20-F (File No. 001-14660) for the year ended December 31, 2009 filed with the Securities and Exchange Commission on May 28, 2010
78
SIGNATURES
The registrant hereby certifies that it meets all of the requirements for filing on Form 20-F and that it has duly caused and authorized the undersigned to sign this Annual Report on its behalf.
|
CHINA SOUTHERN AIRLINES COMPANY LIMITED
|
|
|
/s/ Si Xian Min
|
|
|
Name: Si Xian Min
|
|
|
Title: Chairman of the Board of Directors
|
Date: April 29, 2011
79
CHINA SOUTHERN AIRLINES COMPANY LIMITED
AND SUBSIDIARIES
INDEX TO CONSOLIDATED FINANCIAL STATEMENTS
|
Page
|
||
|
Report of Independent Registered Public Accounting Firm
|
F-1
|
|
|
Consolidated Income Statements
|
||
|
for the years ended December 31, 2010, 2009 and 2008
|
F-2
|
|
|
Consolidated Statements of Comprehensive Income
for the years ended December 31, 2010, 2009 and 2008
|
F-4
|
|
|
Consolidated Balance Sheets at December 31, 2010 and 2009
|
F-5
|
|
|
Consolidated Statements of Changes in Equity
|
||
|
for the years ended December 31, 2010, 2009 and 2008
|
F-7
|
|
|
Consolidated Cash Flow Statements
|
||
|
for the years ended December 31, 2010, 2009 and 2008
|
F-9
|
|
|
Notes to Consolidated Financial Statements
|
F-11
|
REPORT OF INDEPENDENT REGISTERED PUBLIC ACCOUNTING FIRM
The Board of Directors and Shareholders of
China Southern Airlines Company Limited
We have audited the accompanying consolidated balance sheets of China Southern Airlines Company Limited (the “Company”) and its subsidiaries (collectively, the “Group”) as of December 31, 2010 and 2009, and the related consolidated income statements, consolidated statements of comprehensive income, consolidated statements of changes in equity, and consolidated cash flow statements for each of the years in the three-year period ended December 31, 2010. These consolidated financial statements are the responsibility of the Company’s management. Our responsibility is to express an opinion on these consolidated financial statements based on our audits.
We conducted our audits in accordance with the standards of the Public Company Accounting Oversight Board (United States). Those standards require that we plan and perform the audit to obtain reasonable assurance about whether the consolidated financial statements are free of material misstatement. An audit includes examining, on a test basis, evidence supporting the amounts and disclosures in the consolidated financial statements. An audit also includes assessing the accounting principles used and significant estimates made by management, as well as evaluating the overall consolidated financial statements presentation. We believe that our audits provide a reasonable basis for our opinion.
In our opinion, the consolidated financial statements referred to above present fairly, in all material respects, the financial position of China Southern Airlines Company Limited and its subsidiaries as of December 31, 2010 and 2009, and the results of their operations and their cash flows for each of the years in the three-year period ended December 31, 2010, in conformity with International Financial Reporting Standards issued by the International Accounting Standards Board.
We have also audited, in accordance with the standards of the Public Company Accounting Oversight Board (Untied States), the Company’s internal control over financial reporting as of December 31, 2010, based on criteria established in Internal Control-Integrated Framework issued by the Committee of Sponsoring Organizations of the Treadway Commission (COSO), and our report dated March 28, 2011 expressed an unqualified opinion on the effectiveness of the Company’s internal control over financial reporting.
/s/KPMG
Hong Kong, China
March 28, 2011
F - 1
Consolidated Income Statements for the years ended December 31, 2010, 2009 and 2008
(Prepared in accordance with International Financial Reporting Standards)
(Expressed in Renminbi)
|
Note
|
2010
|
2009
|
2008
|
|||||||||||
|
RMB million
|
RMB million
|
RMB million
|
||||||||||||
|
Operating revenue
|
||||||||||||||
|
Traffic revenue
|
4
|
74,140 | 52,967 | 53,913 | ||||||||||
|
Other operating revenue
|
5
|
2,355 | 1,835 | 1,375 | ||||||||||
|
Total operating revenue
|
76,495 | 54,802 | 55,288 | |||||||||||
|
Operating expenses
|
||||||||||||||
|
Flight operations
|
6
|
38,593 | 29,296 | 34,982 | ||||||||||
|
Maintenance
|
7
|
5,586 | 4,446 | 4,890 | ||||||||||
|
Aircraft and traffic servicing
|
8
|
10,968 | 9,169 | 8,476 | ||||||||||
|
Promotion and sales
|
9
|
5,555 | 4,170 | 3,491 | ||||||||||
|
General and administrative
|
10
|
2,266 | 1,844 | 2,041 | ||||||||||
|
Impairment on property, plant and equipment
|
20(g)
|
212 | 26 | 1,884 | ||||||||||
|
Depreciation and amortisation
|
11
|
7,061 | 5,971 | 5,746 | ||||||||||
|
Others
|
444 | 429 | 257 | |||||||||||
|
Total operating expenses
|
70,685 | 55,351 | 61,767 | |||||||||||
|
Other net income
|
13
|
476 | 1,989 | 833 | ||||||||||
|
Operating profit / (loss)
|
6,286 | 1,440 | (5,646 | ) | ||||||||||
|
Interest income
|
93 | 68 | 103 | |||||||||||
|
Interest expense
|
14
|
(1,265 | ) | (1,497 | ) | (1,987 | ) | |||||||
|
Share of associates’ results
|
22
|
56 | 69 | (12 | ) | |||||||||
|
Share of jointly controlled entities’ results
|
23
|
112 | 214 | 170 | ||||||||||
|
Gain on sale of a jointly controlled entity classified as held for sale, net
|
31
|
1,078 | - | - | ||||||||||
|
(Loss) / gain on derivative financial instruments, net
|
(30 | ) | 45 | (124 | ) | |||||||||
|
Exchange gain, net
|
1,746 | 93 | 2,592 | |||||||||||
|
Gain on deemed disposal of a subsidiary
|
23
|
17 | - | - | ||||||||||
|
Gain on sale of a jointly controlled entity
|
- | - | 143 | |||||||||||
|
Gain on sale of equity interest in subsidiaries
|
- | - | 37 | |||||||||||
|
Profit / (loss) before taxation
|
8093 | 432 | (4,724 | ) | ||||||||||
|
Income tax (expense) / benefit
|
16
|
(1,678 | ) | 95 | (62 | ) | ||||||||
|
Profit / (loss) for the year
|
6,415 | 527 | (4,786 | ) | ||||||||||
F - 2
Consolidated Income Statements for the years ended December 31,
2010, 2009 and 2008 (continued)
(Prepared in accordance with International Financial Reporting Standards)
(Expressed in Renminbi)
|
Note
|
2010
|
2009
|
2008
|
|||||||||||
|
RMB million
|
RMB million
|
RMB million
|
||||||||||||
|
Attributable to:
|
||||||||||||||
|
Equity shareholders of the Company
|
5,795 | 330 | (4,823 | ) | ||||||||||
|
Non-controlling interests
|
620 | 197 | 37 | |||||||||||
|
Profit / (loss) for the year
|
6,415 | 527 | (4,786 | ) | ||||||||||
|
Earnings / (loss) per share
|
19
|
|||||||||||||
|
Basic and diluted
|
RMB |
0.70
|
RMB |
0.05
|
RMB |
(0.74
|
) | |||||||
The notes on pages F-11 to F-90 form part of these consolidated financial statements.
F - 3
Consolidated Statements of Comprehensive Income for the years ended December 31, 2010, 2009 and 2008
(Prepared in accordance with International Financial Reporting Standards)
(Expressed in Renminbi)
|
Note
|
2010
|
2009
|
2008
|
|||||||||||
|
RMB million
|
RMB million
|
RMB million
|
||||||||||||
|
Profit / (loss) for the year
|
6,415 | 527 | (4,786 | ) | ||||||||||
|
Other comprehensive income for the year (after tax and reclassification adjustments):
|
17
|
|||||||||||||
|
Available-for-sale securities:
|
||||||||||||||
|
net movement in the fair value reserve
|
(15 | ) | 30 | (192 | ) | |||||||||
|
Total comprehensive income for the year
|
6,400 | 557 | (4,978 | ) | ||||||||||
|
Attributable to:
|
||||||||||||||
|
Equity shareholders of the Company
|
5,789 | 349 | (4,988 | ) | ||||||||||
|
Non-controlling interests
|
611 | 208 | 10 | |||||||||||
|
Total comprehensive income for the year
|
6,400 | 557 | (4,978 | ) | ||||||||||
The notes on pages F-11 to F-90 form part of these consolidated financial statements.
F - 4
Consolidated Balance Sheets at December 31, 2010 and 2009
(Prepared in accordance with International Financial Reporting Standards)
(Expressed in Renminbi)
|
Note
|
2010
|
2009
|
||||||||
|
RMB million
|
RMB million
|
|||||||||
|
Non-current assets
|
||||||||||
|
Property, plant and equipment, net
|
20
|
80,214 | 63,673 | |||||||
|
Construction in progress
|
21
|
10,069 | 18,059 | |||||||
|
Lease prepayments
|
1,605 | 516 | ||||||||
|
Interest in associates
|
22
|
309 | 257 | |||||||
|
Interest in jointly controlled entities
|
23
|
863 | 728 | |||||||
|
Other investments in equity securities
|
24
|
166 | 166 | |||||||
|
Lease deposits
|
544 | 564 | ||||||||
|
Available-for-sale equity securities
|
25
|
80 | 93 | |||||||
|
Deferred tax assets
|
26
|
997 | 479 | |||||||
|
Other assets
|
27
|
526 | 558 | |||||||
| 95,373 | 85,093 | |||||||||
|
Current assets
|
||||||||||
|
Inventories
|
28
|
1,355 | 1,256 | |||||||
|
Trade receivables
|
29
|
1,992 | 1,359 | |||||||
|
Other receivables
|
1,394 | 1,408 | ||||||||
|
Prepaid expenses and other current assets
|
576 | 711 | ||||||||
|
Amounts due from related companies
|
37
|
138 | 51 | |||||||
|
Cash and cash equivalents
|
30
|
10,404 | 4,343 | |||||||
| 15,859 | 9,128 | |||||||||
|
Asset classified as held for sale
|
31
|
- | 529 | |||||||
| 15,859 | 9,657 | |||||||||
|
Current liabilities
|
||||||||||
|
Financial liabilities
|
32
|
13 | 44 | |||||||
|
Bank and other loans
|
33
|
9,324 | 17,452 | |||||||
|
Obligations under finance leases
|
34
|
1,654 | 1,431 | |||||||
|
Trade and bills payable
|
35
|
1,877 | 4,992 | |||||||
|
Sales in advance of carriage
|
3,604 | 2,196 | ||||||||
|
Deferred revenue
|
36
|
524 | 316 | |||||||
|
Income tax payable
|
1,985 | 44 | ||||||||
|
Amounts due to related companies
|
37
|
246 | 94 | |||||||
|
Accrued expenses
|
38
|
9,330 | 8,153 | |||||||
|
Other liabilities
|
39
|
3,768 | 3,376 | |||||||
| 32,325 | 38,098 | |||||||||
|
Net current liabilities
|
49
|
(16,466 | ) | (28,441 | ) | |||||
|
Total assets less current liabilities
|
78,907 | 56,652 | ||||||||
F - 5
Consolidated Balance Sheets at December 31, 2010 and 2009 (continued)
(Prepared in accordance with International Financial Reporting Standards)
(Expressed in Renminbi)
|
Note
|
2010
|
2009
|
||||||||
|
RMB million
|
RMB million
|
|||||||||
|
Non-current liabilities and deferred items
|
||||||||||
|
Bank and other loans
|
33
|
31,876 | 27,875 | |||||||
|
Obligations under finance leases
|
34
|
12,776 | 11,887 | |||||||
|
Deferred revenue
|
36
|
824 | 594 | |||||||
|
Provision for major overhauls
|
40
|
1,173 | 953 | |||||||
|
Provision for early retirement benefits
|
41
|
118 | 148 | |||||||
|
Deferred benefits and gains
|
42
|
1,015 | 1,080 | |||||||
|
Deferred tax liabilities
|
26
|
912 | 853 | |||||||
| 48,694 | 43,390 | |||||||||
|
Net assets
|
30,213 | 13,262 | ||||||||
|
Capital and reserves
|
||||||||||
|
Share capital
|
43
|
9,818 | 8,003 | |||||||
|
Reserves
|
44
|
16,896 | 2,348 | |||||||
|
Total equity attributable to equity shareholders of the Company
|
26,714 | 10,351 | ||||||||
|
Non-controlling interests
|
3,499 | 2,911 | ||||||||
|
Total equity
|
30,213 | 13,262 | ||||||||
The notes on pages F-11 to F-90 form part of these consolidated financial statements.
F - 6
Consolidated Statements of Changes in Equity for the years ended December 31, 2010, 2009 and 2008,
(Prepared in accordance with International Financial Reporting Standards)
(Expressed in Renminbi)
|
Attributable to equity shareholders of the Company
|
||||||||||||||||||||||||||||||||
|
Retained
|
||||||||||||||||||||||||||||||||
|
profits /
|
Non-
|
|||||||||||||||||||||||||||||||
|
Share
|
Share
|
Fair value
|
Other
|
(accumulated
|
Controlling
|
Total
|
||||||||||||||||||||||||||
|
capital
|
premium
|
reserves
|
reserves
|
losses)
|
Total
|
interests
|
equity
|
|||||||||||||||||||||||||
|
RMB
|
RMB
|
RMB
|
RMB
|
RMB
|
RMB
|
RMB
|
RMB
|
|||||||||||||||||||||||||
|
million
|
million
|
million
|
million
|
million
|
million
|
million
|
million
|
|||||||||||||||||||||||||
|
(Note (a))
|
||||||||||||||||||||||||||||||||
|
Balance at January 1, 2008
|
4,374 | 5,325 | 183 | 607 | 1,374 | 11,863 | 2,447 | 14,310 | ||||||||||||||||||||||||
|
Changes in equity for 2008:
|
||||||||||||||||||||||||||||||||
|
(Loss) / profit for the year
|
- | - | - | - | (4,823 | ) | (4,823 | ) | 37 | (4,786 | ) | |||||||||||||||||||||
|
Other comprehensive income
|
- | - | (165 | ) | - | - | (165 | ) | (27 | ) | (192 | ) | ||||||||||||||||||||
|
Total comprehensive income
|
- | - | (165 | ) | - | (4,823 | ) | (4,988 | ) | 10 | (4,978 | ) | ||||||||||||||||||||
|
Bonus share issue
|
2,187 | (2,187 | ) | - | - | - | - | - | - | |||||||||||||||||||||||
|
Acquisition of China Southern West Australian Flying College Pty Limited (Note 45(c)(xv))
|
- | - | - | (5 | ) | - | (5 | ) | - | (5 | ) | |||||||||||||||||||||
|
Disposal of partial equity interest in a subsidiary to non-controlling shareholders
|
- | - | - | - | - | - | 24 | 24 | ||||||||||||||||||||||||
|
Distributions to non-controlling shareholders
|
- | - | - | - | - | - | (28 | ) | (28 | ) | ||||||||||||||||||||||
|
Government contributions
|
- | - | - | 151 | - | 151 | 5 | 156 | ||||||||||||||||||||||||
|
Balance at December 31, 2008 and January 1, 2009
|
6,561 | 3,138 | 18 | 753 | (3,449 | ) | 7,021 | 2,458 | 9,479 | |||||||||||||||||||||||
|
Changes in equity for 2009:
|
||||||||||||||||||||||||||||||||
|
Profit for the year
|
- | - | - | - | 330 | 330 | 197 | 527 | ||||||||||||||||||||||||
|
Other comprehensive income
|
- | - | 19 | - | - | 19 | 11 | 30 | ||||||||||||||||||||||||
|
Total comprehensive income
|
- | - | 19 | - | 330 | 349 | 208 | 557 | ||||||||||||||||||||||||
|
Issuance of shares (Note 43(a))
|
1,442 | 1,538 | - | - | - | 2,980 | - | 2,980 | ||||||||||||||||||||||||
|
Paid in capital from non-controlling equity holders of subsidiaries
|
- | - | - | - | - | - | 261 | 261 | ||||||||||||||||||||||||
|
Liquidation of subsidiaries
|
- | - | - | - | - | - | (6 | ) | (6 | ) | ||||||||||||||||||||||
|
Distributions to non-controlling shareholders
|
- | - | - | - | - | - | (10 | ) | (10 | ) | ||||||||||||||||||||||
|
Government contributions (Note 44(c))
|
- | - | - | 1 | - | 1 | - | 1 | ||||||||||||||||||||||||
|
Balance at December 31, 2009 and January 1, 2010
|
8,003 | 4,676 | 37 | 754 | (3,119 | ) | 10,351 | 2,911 | 13,262 | |||||||||||||||||||||||
|
Changes in equity for 2010:
|
||||||||||||||||||||||||||||||||
|
Profit for the year
|
- | - | - | - | 5,795 | 5,795 | 620 | 6,415 | ||||||||||||||||||||||||
|
Other comprehensive income
|
- | - | (6 | ) | - | - | (6 | ) | (9 | ) | (15 | ) | ||||||||||||||||||||
|
Total comprehensive income
|
- | - | (6 | ) | - | 5,795 | 5,789 | 611 | 6,400 | |||||||||||||||||||||||
|
Issuance of shares (Note 43(a))
|
1,815 | 8,757 | - | - | - | 10,572 | - | 10,572 | ||||||||||||||||||||||||
|
Decrease in non-controlling interest as a result of loss of control of a subsidiary (Note 23)
|
- | - | - | - | - | - | (2 | ) | (2 | ) | ||||||||||||||||||||||
|
Distributions to non-controlling shareholders
|
- | - | - | - | - | - | (6 | ) | (6 | ) | ||||||||||||||||||||||
|
Acquisition of equity interest of a subsidiary from a non-controlling shareholder (Note (b))
|
- | - | - | - | - | - | (15 | ) | (15 | ) | ||||||||||||||||||||||
|
Government contributions (Note 44(c))
|
- | - | - | 2 | - | 2 | - | 2 | ||||||||||||||||||||||||
|
Balance at December 31, 2010
|
9,818 | 13,433 | 31 | 756 | 2,676 | 26,714 | 3,499 | 30,213 | ||||||||||||||||||||||||
F - 7
Consolidated Statements of Changes in Equity for the years ended December 31, 2010, 2009 and 2008 (continued)
(Prepared in accordance with International Financial Reporting Standards)
(Expressed in Renminbi)
|
Note (a):
|
Other reserves represent statutory surplus reserve, discretionary surplus reserve and others. Details are set out in Note 44.
|
|
Note (b):
|
In June 2010, China Southern Airlines Group Air Catering Company Limited (“CSA Catering”), a subsidiary of the Company, acquired 49% equity interest in its subsidiary, Xinjiang Air Catering Company Limited (“Xinjiang Catering”), from the non-controlling shareholder of Xinjiang Catering at a consideration of RMB15 million. Xinjiang Catering became a wholly-owned subsidiary of CSA Catering since then.
|
The notes on pages F-11 to F-90 form part of these consolidated financial statements.
F - 8
Consolidated Cash Flow Statements for the years ended December 31,
2010, 2009 and 2008
(Prepared in accordance with International Financial Reporting Standards)
(Expressed in Renminbi)
|
Note
|
2010
|
2009
|
2008
|
|||||||||||
|
RMB million
|
RMB million
|
RMB million
|
||||||||||||
|
Operating activities
|
||||||||||||||
|
Cash generated from operations
|
30(b)
|
13,024 | 11,232 | 4,256 | ||||||||||
|
Interest received
|
84 | 68 | 103 | |||||||||||
|
Interest paid
|
(1,473 | ) | (2,131 | ) | (2,805 | ) | ||||||||
|
Income tax paid
|
(193 | ) | (210 | ) | (399 | ) | ||||||||
|
Net cash generated from operating activities
|
11,442 | 8,959 | 1,155 | |||||||||||
|
Investing activities
|
||||||||||||||
|
Proceeds from disposal of property, plant and equipment
|
364 | 320 | 312 | |||||||||||
|
Proceeds from sale of available-for-sale equity securities
|
- | 138 | - | |||||||||||
|
Proceeds from sale of jointly controlled entities
|
1,607 | - | 210 | |||||||||||
|
Proceeds from sale of equity interest in subsidiaries
|
- | - | 61 | |||||||||||
|
Net cash settlement of derivative financial instruments
|
(61 | ) | (27 | ) | (11 | ) | ||||||||
|
Dividends received from associates
|
- | 47 | - | |||||||||||
|
Dividends received from jointly controlled entities
|
10 | - | 14 | |||||||||||
|
Dividends received from other investments
|
13 | 14 | 14 | |||||||||||
|
Refund of the investment in an associate
|
4 | - | - | |||||||||||
|
Payment of lease deposits
|
(16 | ) | (10 | ) | - | |||||||||
|
Payment for available-for-sale equity securities
|
(5 | ) | - | - | ||||||||||
|
Refund of lease deposits
|
19 | 8 | 54 | |||||||||||
|
Capital expenditures
|
(13,469 | ) | (15,007 | ) | (8,364 | ) | ||||||||
|
Decrease / (increase) in pledged bank deposits
|
- | 51 | (51 | ) | ||||||||||
|
Payment for the investment in an associate, jointly control entities, a subsidiary and other investments
|
- | (6 | ) | (29 | ) | |||||||||
|
Liquidation of subsidiaries
|
- | (6 | ) | - | ||||||||||
|
Acquisition of equity interest of a subsidiary from a non-controlling shareholder
|
(15 | ) | - | - | ||||||||||
|
Deemed disposal of a subsidiary
|
48(b) | (19 | ) | - | - | |||||||||
|
Net cash used in investing activities
|
(11,568 | ) | (14,478 | ) | (7,790 | ) | ||||||||
F - 9
Consolidated Cash Flow Statements for the years ended December 31, 2010, 2009 and 2008 (continued)
(Prepared in accordance with International Financial Reporting Standards)
(Expressed in Renminbi)
|
Note
|
2010
|
2009
|
2008
|
|||||||||||
|
RMB million
|
RMB million
|
RMB million
|
||||||||||||
|
Financing activities
|
||||||||||||||
|
Proceeds from issue of shares
|
43(a)
|
10,572 | 2,980 | - | ||||||||||
|
Proceeds from bank and other loans
|
22,100 | 37,146 | 41,450 | |||||||||||
|
Repayment of bank and other loans
|
(24,976 | ) | (31,396 | ) | (33,783 | ) | ||||||||
|
Proceeds from issue of short-term financing bills
|
- | - | 2,000 | |||||||||||
|
Repayment of short-term financing bills
|
- | (2,000 | ) | - | ||||||||||
|
Repayment of principal under finance lease obligations
|
(1,505 | ) | (1,750 | ) | (2,335 | ) | ||||||||
|
Capital contributions received from government
|
44(c)
|
2 | 1 | 156 | ||||||||||
|
Paid in capital from non-controlling equity holders of subsidiaries
|
- | 242 | - | |||||||||||
|
Dividends paid to non-controlling shareholders
|
(6 | ) | (10 | ) | (28 | ) | ||||||||
|
Net cash from financing activities
|
6,187 | 5,213 | 7,460 | |||||||||||
|
Net increase / (decrease) in cash and cash equivalents
|
6,061 | (306 | ) | 825 | ||||||||||
|
Cash and cash equivalents at January 1
|
4,343 | 4,649 | 3,824 | |||||||||||
|
Cash and cash equivalents at December 31
|
10,404 | 4,343 | 4,649 | |||||||||||
The notes on pages F-11 to F-90 form part of these consolidated financial statements.
F - 10
Notes to the Consolidated Financial Statements
(Prepared in accordance with International Financial Reporting Standards)
(Expressed in Renminbi)
|
1
|
Basis of presentation
|
China Southern Airlines Company Limited (the “Company”) and its subsidiaries (the “Group”) are principally engaged in the provision of domestic, Hong Kong, Macau and Taiwan and international passenger, cargo and mail airline services.
The Company was established in the People’s Republic of China (the “PRC” or “China”) on March 25, 1995 as a joint stock limited company as part of the reorganization (the “Reorganizations”) of the Company’s holding company, China Southern Air Holding Company (“CSAHC”). CSAHC is a state-owned enterprise under the supervision of the PRC central government.
The Company’s H Shares and American Depositary Receipts (“ADR”) (each ADR representing 50 H Shares) have been listed on The Stock Exchange of Hong Kong Limited and the New York Stock Exchange, respectively since July 1997. In July 2003, the Company issued 1,000,000,000 A Shares which are listed on the Shanghai Stock Exchange.
The 2007 bonus share issue of 2,187,089,000 shares, by the conversion of share premium to share capital, was implemented in August 2008.
On August 20, 2009 and August 21, 2009, the Company issued 721,150,000 A shares to CSAHC and 721,150,000 H shares to Nan Lung Holdings Ltd. (“Nan Lung”), a wholly-owned subsidiary of CSAHC, respectively.
On October 29, 2010, the Company issued 123,900,000 A shares and 1,377,600,000 A shares to CSAHC and certain third party investors, respectively. On November 1, 2010, the Company issued 312,500,000 H shares to Nan Lung.
|
2
|
Principal accounting policies
|
|
(a)
|
Statement of compliance
|
These consolidated financial statements have been prepared in accordance with all applicable International Financial Reporting Standards (“IFRSs”), which collective term includes all applicable individual International Financial Reporting Standards, International Accounting Standards (“IASs”) and Interpretations issued by the International Accounting Standards Board (the “IASB”).
Note 3 provides information on the impact of the new and revised IFRSs and interpretations that are first effective for the current accounting period and the changes in accounting policies for the current and prior accounting periods reflected in these consolidated financial statements.
The consolidated financial statements were approved and authorized for issue by Board of Directors on March 28, 2011.
|
(b)
|
Basis of preparation of the consolidated financial statements
|
At December 31, 2010, the Group’s current liabilities exceeded its current assets by RMB16,466 million, which includes bank and other loans repayable within one year of RMB9,324 million. In preparing the consolidated financial statements, the directors have considered the Group’s sources of liquidity and believe that adequate funding is available to fulfill the Group’s short-term obligations and capital expenditure requirements. Accordingly, the consolidated financial statements have been prepared on a basis that the Group will be able to continue as a going concern. Further details are set out in Note 49(a).
F - 11
|
2
|
Principal accounting policies (continued)
|
|
(b)
|
Basis of preparation of the consolidated financial statements (continued)
|
The consolidated financial statements for the year ended December 31, 2010 comprise the Company and its subsidiaries and the Group’s interest in associates and jointly controlled entities.
The measurement basis used in the preparation of the consolidated financial statements is the historical cost basis except that the following assets and liabilities are stated at their fair value as explained in the accounting policies set out below:
- Derivative financial instruments (Note 2(g)); and
- Available-for-sale equity securities (Note 2(f)).
Non-current assets held for sale are stated at the lower of carrying amount and fair value less costs to sell (Note 2(cc)).
The preparation of consolidated financial statements in conformity with IFRSs requires management to make judgments, estimates and assumptions that affect the application of policies and reported amounts of assets and liabilities, income and expenses. The estimates and associated assumptions are based on historical experience and various other factors that are believed to be reasonable under the circumstances, the results of which form the basis of making the judgments about carrying values of assets and liabilities that are not readily apparent from other sources. Actual results may differ from these estimates.
The estimates and underlying assumptions are reviewed on an ongoing basis. Revisions to accounting estimates are recognized in the period in which the estimate is revised if the revision affects only that period, or in the period of the revision and future periods if the revision affects both current and future periods.
Judgments made by management in the application of IFRSs that have significant effect on the consolidated financial statements and major sources of estimation uncertainty are discussed in Note 54.
|
(c)
|
Subsidiaries and non-controlling interests
|
Subsidiaries are entities controlled by the Group. Control exists when the Group has the power to govern the financial and operating policies of an entity so as to obtain benefits from its activities. In assessing control, potential voting rights that presently are exercisable are taken into account.
An investment in a subsidiary is consolidated into the consolidated financial statements from the date that control commences until the date that control ceases. Intra-group balances and transactions and any unrealized profits arising from intra-group transactions are eliminated in full in preparing the consolidated financial statements. Unrealized losses resulting from intra-group transactions are eliminated in the same way as unrealized gains but only to the extent that there is no evidence of impairment.
Non-controlling interests (previously known as “minority interest”) represent the equity in a subsidiary not attributable directly or indirectly to the Company, and in respect of which the Group has not agreed any additional terms with the holders of those interests which would result in the Group as a whole having a contractual obligation in respect of those interests that meets the definition of a financial liability. For each business combination, the Group measures non-controlling interests at their proportionate share of the subsidiary’s net identifiable assets.
F - 12
|
2
|
Principal accounting policies (continued)
|
|
(c)
|
Subsidiaries and non-controlling interests (continued)
|
Non-controlling interests are presented in the consolidated balance sheet within equity, separately from equity attributable to the equity shareholders of the Company. Non-controlling interests in the results of the Group are presented on the face of the consolidated income statement and the consolidated statement of comprehensive income as an allocation of the total profit or loss and total comprehensive income for the year between non-controlling interests and the equity shareholders of the Company. Loans from holders of non-controlling interests and other contractual obligations towards these holders are presented as financial liabilities in accordance with Notes 2(o) or (p) depending on the nature of the liability.
Changes in the Group’s interests in a subsidiary that do not result in a loss of control are accounted for as equity transactions, whereby adjustments are made to the amounts of controlling and non-controlling interests within consolidated equity to reflect the change in relative interests, but no adjustments are made to goodwill and no gain or loss is recognized.
When the Group loses control of a subsidiary, it is accounted for as a disposal of the entire interest in that subsidiary, with a resulting gain or loss being recognized in profit or loss. Any interest retained in that former subsidiary at the date when control is lost is recognized at fair value and this amount is regarded as the fair value on initial recognition of a financial asset (Note 2(f)) or, when appropriate, the cost on initial recognition of an investment in an associate or jointly controlled entity (Note 2(d)).
|
(d)
|
Associates and jointly controlled entities
|
An associate is an entity in which the Group or the Company has significant influence, but not control or joint control, over its management, including participation in the financial and operating policy decisions.
A jointly controlled entity is an entity which operates under a contractual arrangement between the Group or the Company and other parties, where the contractual arrangement establishes that the Group or Company and one or more of the other parties share joint control over the economic activities of the entity.
An investment in an associate or a jointly controlled entity is accounted for in the consolidated financial statements under the equity method, unless it is classified as held for sale (or included in a disposal group that is classified as held for sale) (Note 2(cc)). Under the equity method, the investment is initially recorded at cost, adjusted for any excess of the Group’s share of the acquisition-date fair values of the investee’s identifiable net assets over the cost of the investment (if any). Thereafter, the investment is adjusted for the post acquisition change in the Group’s share of the investee’s net assets and any impairment loss relating to the investment (Notes 2(e) and (l)). Any acquisition-date excess over cost, the Group’s share of the post-acquisition, post-tax results of the investees and any impairment losses for the year are recognized in the consolidated income statement, whereas the Group’s share of the post-acquisition post-tax items of the investees’ other comprehensive income is recognized in the consolidated statement of comprehensive income.
When the Group’s share of losses exceeds its interest in the associate or the jointly controlled entity, the Group’s interest is reduced to nil and recognition of further losses is discontinued except to the extent that the Group has incurred legal or constructive obligations or made payments on behalf of the investee. For this purpose, the Group’s interest is the carrying amount of the investment under the equity method together with the Group’s long-term interests that in substance form part of the Group’s net investment in the associate or the jointly controlled entity.
Unrealized profits and losses arising from transactions between the Group and its associates and jointly controlled entities are eliminated to the extent of the Group’s interest in the investee, except where unrealized losses provide evidence of an impairment of the asset transferred, in which case they are recognized immediately in profit or loss.
F - 13
|
2
|
Principal accounting policies (continued)
|
|
(d)
|
Associates and jointly controlled entities (continued)
|
When the Group ceases to have significant influence over an associate or joint control over a jointly controlled entity, it is accounted for as a disposal of the entire interest in that investee, with a resulting gain or loss being recognized in profit or loss. Any interest retained in that former investee at the date when significant influence or joint control is lost is recognized at fair value and this amount is regarded as the fair value on initial recognition of a financial asset (Note 2(f)) or, when appropriate, the cost on initial recognition of an investment in an associate (Note 2(d)).
|
(e)
|
Goodwill
|
Goodwill represents the excess of
|
|
(i)
|
the aggregate of the fair value of the consideration transferred, the amount of any non-controlling interest in the acquiree and the fair value of the Group’s previously held equity interest in the acquiree; over
|
|
|
(ii)
|
the Group’s interest in the net fair value of the acquiree’s identifiable assets and liabilities measured as at the acquisition date.
|
When (ii) is greater than (i), then this excess is recognized immediately in profit or loss as a gain on a bargain purchase.
Goodwill is stated at cost less accumulated impairment losses. Goodwill arising on a business combination is allocated to each cash-generating unit, or groups of cash generating units, that is expected to benefit from the synergies of the combination and is tested annually for impairment (Note 2(l)).
On disposal of a cash generating unit during the year, any attributable amount of purchased goodwill is included in the calculation of the profit or loss on disposal.
|
(f)
|
Other investments in equity securities
|
The Group’s and the Company’s policies for investments in equity securities, other than investments in subsidiaries, associates and jointly controlled entities, are as follows:
Investments in equity securities are initially stated at fair value, which is their transaction price unless fair value can be more reliably estimated using valuation techniques whose variables include only data from observable markets. Cost includes attributable transaction costs, except where indicated otherwise below. These investments are subsequently accounted for as follows, depending on their classification:
Available-for-sale equity securities are those non-derivative financial assets that are designated as available for sale. At the end of each reporting period the fair value is remeasured, with any resultant gain or loss being recognized in other comprehensive income and accumulated separately in equity in the fair value reserve, except foreign exchange gains and losses resulting from changes in the amortized cost of monetary items which are recognized directly in profit or loss. Dividend income from these investments is recognized in profit or loss in accordance with the policy set out in Note 2(v)(iv). When these investments are derecognized or impaired (Note 2(l)), the cumulative gain or loss is reclassified from equity to profit or loss.
The Group’s other investments in equity securities represent unlisted equity securities of companies established in the PRC. They do not have a quoted market price in an active market and their fair values cannot be reliably measured. Accordingly, they are recognized in the balance sheet at cost less impairment losses (Note 2(l)).
Investments are recognized / derecognized on the date the Group commits to purchase / sell the investments or they expire.
F - 14
|
2
|
Principal accounting policies (continued)
|
|
(g)
|
Derivative financial instruments
|
Derivative financial instruments are recognized initially at fair value. At the end of each reporting period the fair value is remeasured. The gain or loss on remeasurement to fair value is recognized immediately in profit or loss.
|
(h)
|
Property, plant and equipment
|
|
(i)
|
Investment property
|
Investment properties are land and / or buildings which are owned or held under a leasehold interest (Note 2(j)) to earn rental income and / or for capital appreciation.
Investment properties are stated at cost, less accumulated depreciation and impairment losses (Note 2(l)). Depreciation is calculated to write off the cost of items of investment property, less their estimated residual value, if any, using the straight line method over their estimated useful lives. Rental income from investment properties is accounted for as described in Note 2(v)(iii).
|
(ii)
|
Other property, plant and equipment
|
Property, plant and equipment are stated at cost less accumulated depreciation and impairment losses (Note 2(l)).
The cost of self-constructed items of property, plant and equipment includes the cost of materials, the initial estimate, where relevant, of the costs of dismantling and removing the items and restoring the site on which they are located, and an appropriate proportion of production overheads and borrowing costs (Note 2(y)).
Gains or losses arising from the retirement or disposal of an item of property, plant and equipment are determined as the difference between the net disposal proceeds and the carrying amount of the item and are recognized in profit or loss on the date of retirement or disposal.
Depreciation is calculated to write off the cost of items of property, plant and equipment, less their estimated residual value, if any, using the straight line method over their estimated useful lives as follows:
|
Buildings
|
30 to 35 years
|
|
Owned and leased aircraft
|
15 to 20 years
|
|
Other flight equipment
|
|
|
- Jet engines
|
15 to 20 years
|
|
- Others, including rotable spares
|
3 to 15 years
|
|
Machinery and equipment
|
4 to 10 years
|
|
Vehicles
|
6 to 8 years
|
Where parts of an item of property, plant and equipment have different useful lives, the cost of the item is allocated on a reasonable basis between the parts and each part is depreciated separately. Both the useful life of an asset and its residual value, if any, are reviewed annually.
|
(i)
|
Construction in progress
|
Construction in progress represents office buildings, various infrastructure projects under construction and equipment pending installation, and is stated at cost less impairment losses (Note 2(l)). Capitalization of these costs ceases and the construction in progress is transferred to property, plant and equipment when the asset is substantially ready for its intended use, notwithstanding any delay in the issue of the relevant commissioning certificates by the relevant PRC authorities.
No depreciation is provided in respect of construction in progress.
F - 15
|
2
|
Principal accounting policies (continued)
|
|
(j)
|
Leased assets
|
An arrangement, comprising a transaction or a series of transactions, is or contains a lease if the Group determines that the arrangement conveys a right to use a specific asset or assets for an agreed period of time in return for a payment or a series of payments. Such a determination is made based on an evaluation of the substance of the arrangement and is regardless of whether the arrangement takes the legal form of a lease.
|
(i)
|
Classification of assets leased to the Group
|
Assets that are held by the Group under leases which transfer to the Group substantially all the risks and rewards of ownership are classified as being held under finance leases. Leases which do not transfer substantially all the risks and rewards of ownership to the Group are classified as operating leases, except for land held for own use under an operating lease, the fair value of which cannot be measured separately from the fair value of a building situated thereon at the inception of the lease, is accounted for as being held under a finance lease, unless the building is also clearly held under an operating lease. For these purposes, the inception of the lease is the time that the lease was first entered into by the Group, or taken over from the previous lessee.
|
(ii)
|
Assets acquired under finance leases
|
Where the Group acquires the use of assets under finance leases, the amounts representing the fair value of the leased asset, or, if lower, the present value of the minimum lease payments, of such assets are included in property, plant and equipment and the corresponding liabilities, net of finance charges, are recorded as obligations under finance leases. Depreciation is provided at rates which write off the cost or valuation of the assets over the term of the relevant lease or, where it is likely the Group will obtain ownership of the asset, the life of the asset, as set out in Note 2(h)(ii). Impairment losses are accounted for in accordance with the accounting policy as set out in Note 2(l). Finance charges implicit in the lease payments are charged to profit or loss over the period of the leases so as to produce an approximately constant periodic rate of charge on the remaining balance of the obligations for each accounting period. Contingent rentals are charged to profit or loss in the accounting period in which they are incurred.
|
(iii)
|
Operating lease charges
|
Where the Group has the use of assets held under operating leases, payments made under the leases are charged to profit or loss in equal installments over the accounting periods covered by the lease term, except where an alternative basis is more representative of the pattern of benefits to be derived from the leased asset. Lease incentives received are recognized in profit or loss as an integral part of the aggregate net lease payments made.
The cost of acquiring land held under an operating lease is amortized on a straight-line basis over the respective periods of lease terms which ranges from 30 to 70 years, except where the property is classified as an investment property (Note 2(h)(i)).
F - 16
|
2
|
Principal accounting policies (continued)
|
|
(j)
|
Leased assets (continued)
|
|
(iv)
|
Sale and leaseback transactions
|
Gains or losses on sale and leaseback transactions which result in finance leases are deferred and amortized over the terms of the related leases. Gains or losses on other aircraft sale and leaseback transactions which result in operating leases are recognized immediately if the transactions are established at fair value. If the sale price is at or below fair value then the gain or loss is recognized immediately. However, if a loss is compensated for by future rentals at a below-market price, then the loss is deferred and amortized over the period that the aircraft is expected to be used. If the sale price is above fair value, then any gain is deferred and amortized over the useful life of the assets.
|
(k)
|
Deferred expenditure
|
Lump sum housing benefits payable to employees of the Group are deferred and amortized on a straight-line basis over a period of 10 years, which represents the benefit vesting period of the employees.
Deferred expenditure is stated at cost less impairment losses (Note 2(l)).
|
(l)
|
Impairment of assets
|
|
(i)
|
Impairment of investments in equity securities and other receivables
|
Investments in equity securities (other than investments in subsidiaries: (Note 2(l)(ii)) and other current and non-current receivables that are stated at cost or amortized cost or are classified as available-for-sale equity securities are reviewed at the end of each reporting period to determine whether there is objective evidence of impairment. Objective evidence of impairment includes observable data that comes to the attention of the Group about one or more of the following loss events:
|
|
-
|
significant financial difficulty of the debtor;
|
|
|
-
|
a breach of contract, such as a default or delinquency in interest or principal payments;
|
|
|
-
|
it becoming probable that the debtor will enter bankruptcy or other financial reorganization;
|
|
|
-
|
significant changes in the technological, market, economic or legal environment that have an adverse effect on the debtor; and
|
|
|
-
|
a significant or prolonged declined in the fair value of an investment in an equity instrument below its cost.
|
If any such evidence exists, any impairment loss is determined and recognized as follows:
|
|
-
|
For investments in associates and jointly controlled entities recognized using the equity method (Note 2(d)), the impairment loss is measured by comparing the recoverable amount of the investment as a whole with its carrying amount in accordance with Note 2(l)(ii). The impairment loss is reversed if there has been a favorable change in the estimates used to determine the recoverable amount in accordance with Note 2(l)(ii).
|
|
|
-
|
For unquoted equity securities carried at cost, the impairment loss is measured as the difference between the carrying amount of the financial asset and the estimated future cash flows, discounted at the current market rate of return for a similar financial asset where the effect of discounting is material. Impairment losses for equity securities carried at cost are not reversed.
|
F - 17
|
2
|
Principal accounting policies (continued)
|
|
(l)
|
Impairment of assets (continued)
|
|
(i)
|
Impairment of investments in equity securities and other receivables (continued)
|
|
|
-
|
For trade and other current receivables and other financial assets carried at amortized cost, the impairment loss is measured as the difference between the asset’s carrying amount and the present value of estimated future cash flows, discounted at the financial asset’s original effective interest rate (i.e. the effective interest rate computed at initial recognition of these assets), where the effect of discounting is material. This assessment is made collectively where financial assets carried at amortized cost share similar risk characteristics, such as similar past due status, and have not been individually assessed as impaired. Future cash flows for financial assets which are assessed for impairment collectively are based on historical loss experience for assets with credit risk characteristics similar to the collective group.
|
If in a subsequent period, the amount of an impairment loss decreases and the decrease can be linked objectively to an event occurring after the impairment loss was recognized, the impairment loss is reversed through profit or loss. A reversal of an impairment loss shall not result in the asset’s carrying amount exceeding that which would have been determined had no impairment loss been recognized in prior years.
|
|
-
|
For available-for-sale securities, the cumulative loss that has been recognized in the fair value reserve is reclassified to profit or loss. The amount of the cumulative loss that is recognized in profit or loss is the difference between the acquisition cost (net of any principal repayment and amortization) and current fair value, less any impairment loss on that asset previously recognized in profit or loss.
|
Impairment losses recognized in profit or loss in respect of available-for-sale equity securities are not reversed through profit or loss. Any subsequent increase in the fair value of such assets is recognized directly in other comprehensive income.
Impairment losses are written off against the corresponding asset directly, except for impairment losses recognized in respect of trade and other receivables, whose recovery is considered doubtful but not remote. In this case, the impairment losses for doubtful debts are recorded using an allowance account. When the Group is satisfied that recovery is remote, the amount considered irrecoverable is written off against trade and other receivables directly and any amounts held in the allowance account relating to that debt are reversed. Subsequent recoveries of amounts previously charged to the allowance account are reversed against the allowance account. Other changes in the allowance account and subsequent recoveries of amounts previously written off directly are recognized in profit or loss.
F - 18
|
2
|
Principal accounting policies (continued)
|
|
(l)
|
Impairment of assets (continued)
|
|
(ii)
|
Impairment of other assets
|
Internal and external sources of information are reviewed at the end of each reporting period to identify indications that the following assets may be impaired or, except in the case of goodwill, an impairment loss previously recognized no longer exists or may have decreased:
|
|
-
|
Property, plant and equipment;
|
|
|
-
|
Construction in progress;
|
|
|
-
|
Lease deposits;
|
|
|
-
|
Lease prepayments;
|
|
|
-
|
Deferred expenditure;
|
|
|
-
|
Investments in subsidiaries; and
|
|
|
-
|
Goodwill.
|
If any such indication exists, the asset’s recoverable amount is estimated. For goodwill, the recoverable amount is estimated annually whether or not there is any indication of impairment.
|
-
|
Calculation of recoverable amount
|
The recoverable amount of an asset is the greater of its fair value less costs to sell and value in use. In assessing value in use, the estimated future cash flows are discounted to their present value using a pre-tax discount rate that reflects current market assessments of the time value of money and the risks specific to the asset. Where an asset does not generate cash inflows largely independent of those from other assets, the recoverable amount is determined for the smallest group of assets that generates cash inflows independently (i.e. a cash-generating unit).
|
-
|
Recognition of impairment losses
|
An impairment loss is recognized in profit or loss if the carrying amount of an asset, or the cash-generating unit to which it belongs, exceeds its recoverable amount. Impairment losses recognized in respect of cash-generating units are allocated first to reduce the carrying amount of any goodwill allocated to the cash-generating unit (or group of units) and then, to reduce the carrying amount of the other assets in the unit (or group of units) on a pro rata basis, except that the carrying value of an asset will not be reduced below its individual fair value less costs to sell, or value in use, if determinable.
F - 19
|
2
|
Principal accounting policies (continued)
|
|
(l)
|
Impairment of assets (continued)
|
|
(ii)
|
Impairment of other assets (continued)
|
|
-
|
Reversals of impairment losses
|
In respect of assets other than goodwill, an impairment loss is reversed if there has been a favorable change in the estimates used to determine the recoverable amount. An impairment loss in respect of goodwill is not reversed.
A reversal of an impairment loss is limited to the asset’s carrying amount that would have been determined had no impairment loss been recognized in prior years. Reversals of impairment losses are credited to profit or loss in the year in which the reversals are recognized.
|
(iii)
|
Interim financial reporting and impairment
|
Impairment losses recognized in an interim period in respect of goodwill, available-for-sale equity securities and unquoted equity securities carried at cost are not reversed in a subsequent period. This is the case even if no loss, or a smaller loss, would have been recognized had the impairment been assessed only at the end of the financial year to which the interim period relates. Consequently, if the fair value of an available-for-sale equity security increases in the remainder of the annual period, or in any other period subsequently, the increase is recognized in other comprehensive income and not profit or loss.
|
(m)
|
Inventories
|
Inventories, which consist primarily of expendable spare parts and supplies, are stated at cost less any applicable provision for obsolescence, and are charged to profit or loss when used in operations. Cost represents the average unit cost.
Inventories held for disposal are carried at the lower of cost and net realizable value. Net realizable value is the estimated selling price in the ordinary course of business less the estimated costs of completion and the estimated costs necessary to make the sale.
|
(n)
|
Trade and other receivables
|
Trade and other receivables are initially recognized at fair value and thereafter stated at amortized cost less allowance for impairment of bad and doubtful debts (Note 2(l)), except where the effect of discounting would be immaterial. In such cases, the receivables are stated at cost less allowance for impairment of bad and doubtful debts.
|
(o)
|
Interest-bearing borrowings
|
Interest-bearing borrowings are recognized initially at fair value less attributable transaction costs. Subsequent to initial recognition, interest-bearing borrowings are stated at amortized cost with any difference between the amount initially recognized and redemption value being recognized in profit or loss over the period of the borrowings, together with any interest and fees payable, using the effective interest method.
F - 20
|
2
|
Principal accounting policies (continued)
|
|
(p)
|
Trade and other payables
|
Trade and other payables are initially recognized at fair value. Except for financial guarantee liabilities measured in accordance with Note 2(r)(i), trade and other payables are subsequently stated at amortized cost unless the effect of discounting would be immaterial, in which case they are stated at cost.
|
(q)
|
Cash and cash equivalents
|
Cash and cash equivalents comprise cash at bank and on hand, demand deposits with banks and other financial institutions having been within three months of maturity at acquisition. Bank overdrafts that are repayable on demand and form an integral part of the Group’s cash management are also included as a component of cash and cash equivalents for the purpose of the consolidated cash flow statement.
|
(r)
|
Financial guarantees issued, provisions and contingent liabilities
|
|
(i)
|
Financial guarantees issued
|
Financial guarantees are contracts that require the issuer (i.e. the guarantor) to make specified payments to reimburse the beneficiary of the guarantee (the “holder”) for a loss the holder incurs because a specified debtor fails to make payment when due in accordance with the terms of a debt instrument.
Where the Group issues a financial guarantee, the fair value of the guarantee (being the transaction price, unless the fair value can otherwise be reliably estimated) is initially recognized as deferred income within trade and other payables. Where consideration is received or receivable for the issuance of the guarantee, the consideration is recognized in accordance with the Group’s policies applicable to that category of asset. Where no such consideration is received or receivable, an immediate expense is recognized in profit or loss on initial recognition of any deferred income.
The amount of the guarantee initially recognized as deferred income is amortized in profit or loss over the term of the guarantee as income from financial guarantees issued. In addition, provisions are recognized in accordance with Note 2(r)(ii) if and when (i) it becomes probable that the holder of the guarantee will call upon the Group under the guarantee, and (ii) the amount of that claim on the Group is expected to exceed the amount currently carried in trade and other payables in respect of that guarantee i.e. the amount initially recognized, less accumulated amortization.
|
(ii)
|
Provision and contingent liabilities
|
Provisions are recognized for other liabilities of uncertain timing or amount when the Group or the Company has a legal or constructive obligation arising as a result of a past event, it is probable that an outflow of economic benefits will be required to settle the obligation and a reliable estimate can be made. Where the time value of money is material, provisions are stated at the present value of the expenditures expected to settle the obligation.
Where it is not probable that an outflow of economic benefits will be required, or the amount cannot be estimated reliably, the obligation is disclosed as a contingent liability, unless the probability of outflow of economic benefits is remote. Possible obligations, whose existence will only be confirmed by the occurrence or non-occurrence of one or more future events are also disclosed as contingent liabilities unless the probability of outflow of economic benefits is remote.
F - 21
|
2
|
Principal accounting policies (continued)
|
|
(s)
|
Defeasance of long-term liabilities
|
Where long-term liabilities have been defeased by the placement of security deposits, those liabilities and deposits (and income and charge arising therefrom) are netted off in order to reflect the overall commercial effect of the arrangements. Such netting off has been effected where a right is held by the Group to insist on net settlement of the liability and deposit including in all situations of default and where that right is assured beyond doubt.
|
(t)
|
Deferred benefits and gains
|
In connection with the acquisitions or operating leases of certain aircraft and engines, the Group receives various credits. Such credits are deferred until the aircraft and engines are delivered, at which time they are either applied as a reduction of the cost of acquiring the aircraft and engines, resulting in a reduction of future depreciation, or amortized as a reduction of rental expense for aircraft and engines under operating leases.
|
(u)
|
Income tax
|
Income tax for the year comprises current tax and movements in deferred tax assets and liabilities. Current tax and movements in deferred tax assets and liabilities are recognized in profit or loss except to the extent that they relate to business combinations, or items recognized in other comprehensive income or directly in equity, in which case the relevant amounts of tax are recognized in other comprehensive income or directly in equity, respectively.
Current tax is the expected tax payable on the taxable income for the year, using tax rates enacted or substantively enacted at the end of the reporting period, and any adjustment to tax payable in respect of previous years.
Deferred tax assets and liabilities arise from deductible and taxable temporary differences respectively, being the differences between the carrying amounts of assets and liabilities for financial reporting purposes and their tax bases. Deferred tax assets also arise from unused tax losses and unused tax credits.
Apart from certain limited exceptions, all deferred tax liabilities, and all deferred tax assets to the extent that it is probable that future taxable profits will be available against which the asset can be utilized, are recognized. Future taxable profits that may support the recognition of deferred tax assets arising from deductible temporary differences include those that will arise from the reversal of existing taxable temporary differences, provided those differences relate to the same taxation authority and the same taxable entity, and are expected to reverse either in the same period as the expected reversal of the deductible temporary difference or in periods into which a tax loss arising from the deferred tax asset can be carried back or forward. The same criteria are adopted when determining whether existing taxable temporary differences support the recognition of deferred tax assets arising from unused tax losses and credits, that is, those differences are taken into account if they relate to the same taxation authority and the same taxable entity, and are expected to reverse in a period, or periods, in which the tax loss or credit can be utilized.
The limited exception to the recognition of deferred tax assets and liabilities are those temporary differences arising from goodwill not deductible for tax purposes, the initial recognition of assets or liabilities that affect neither accounting nor taxable profit (provided they are not part of a business combination), and temporary differences relating to investments in subsidiaries to the extent that, in the case of taxable differences, the Group controls the timing of the reversal and it is probable that the differences will not reverse in the foreseeable future, or in the case of deductible differences, unless it is probable that they will reverse in the future.
F - 22
|
2
|
Principal accounting policies (continued)
|
|
(u)
|
Income tax (continued)
|
The amount of deferred tax recognized is measured based on the expected manner of realization or settlement of the carrying amount of the assets and liabilities, using tax rates enacted or substantively enacted at the end of the reporting period. Deferred tax assets and liabilities are not discounted.
The carrying amount of a deferred tax asset is reviewed at the end of each reporting period and is reduced to the extent that it is no longer probable that sufficient taxable profits will be available to allow the related tax benefit to be utilized. Any such reduction is reversed to the extent that it becomes probable that sufficient taxable profits will be available.
Current tax balances and deferred tax balances, and movements therein, are presented separately from each other and are not offset. Current tax assets are offset against current tax liabilities, and deferred tax assets against deferred tax liabilities, if the Company or the Group has the legally enforceable right to set off current tax assets against current tax liabilities and the following additional conditions are met:
|
|
-
|
in the case of current tax assets and liabilities, the Company or the Group intends either to settle on a net basis, or to realize the asset and settle the liability simultaneously; or
|
|
|
-
|
in the case of deferred tax assets and liabilities, if they relate to income taxes levied by the same taxation authority on either:
|
|
|
-
|
the same taxable entity; or
|
|
|
-
|
different taxable entities, which, in each future period in which significant amounts of deferred tax liabilities or assets are expected to be settled or recovered, intend to realize the current tax assets and settle the current tax liabilities on a net basis or realize and settle simultaneously.
|
|
(v)
|
Revenue recognition
|
Revenue is measured at the fair value of the consideration received or receivable. Provided it is probable that the economic benefits will flow to the Group and the revenue and costs, if applicable, can be measured reliably, revenue is recognized in profit or loss as follows:
|
|
(i)
|
Passenger, cargo and mail revenues
|
|
|
Passenger, cargo and mail revenues are recognized at the fair value of the consideration received when the transportation is provided. Ticket sales for transportation not yet provided are included in current liabilities as sales in advance of carriage. Revenues from airline-related business are recognized when services are rendered. Revenue is stated net of sales tax.
|
|
|
(ii)
|
Frequent flyer revenue
|
|
|
The Group maintains two frequent flyer award programs, namely, the China Southern Airlines Sky Pearl Club and the Egrets Mileage Plus, which provide travel and other awards to members based on accumulated mileages.
|
|
|
Revenue received in relation to mileage earning flights is allocated, based on fair value, between the flight and mileages earned by members of the Group’s frequent flyer award programs. The value attributed to the awarded mileages is deferred as a liability, within deferred revenue, until the mileages are ultimately utilized.
|
|
|
Revenue received from third parties for the issue of mileages under the frequent flyer award programs is also deferred as a liability, within deferred revenue.
|
F - 23
|
2
|
Principal accounting policies (continued)
|
|
(v)
|
Revenue recognition (continued)
|
|
|
(ii)
|
Frequent flyer revenue (continued)
|
|
|
As members of the frequent flyer award programs redeem mileages for an award, revenue is recorded in profit or loss. Revenue in relation to flight awards is recognized when the transportation is provided. Revenue is recognized at the point of redemption where non-flight rewards are selected.
|
|
|
The value attributed to mileages that are expected to expire is recognized as revenue, based on the number of mileages that have been redeemed relative to the total number expected to be redeemed.
|
|
|
(iii)
|
Rental income receivable under operating leases is recognized in profit or loss in equal installments over the periods covered by the lease term, except where an alternative basis is more representative of the pattern of benefits to be derived from the use of the leased asset. Lease incentives granted are recognized in profit or loss as an integral part of the aggregate net lease payments receivables.
|
|
|
(iv)
|
Dividend income is recognized when the shareholder’s right to receive payment is established.
|
|
|
(v)
|
Government grants are recognized in the balance sheet initially when there is reasonable assurance that they will be received and that the Group will comply with the conditions attaching to them. Grants that compensate the Group for expenses incurred are recognized as revenue in profit or loss on a systematic basis in the same periods in which the expenses are incurred. Grants that compensate the Group for the cost of an asset are deducted from the carrying amount of the asset and consequently are effectively recognized in profit or loss over the useful life of the asset by way of reduced depreciation expense.
|
|
|
(vi)
|
Interest income is recognized as it accrues using the effective interest method.
|
|
(w)
|
Traffic commissions
|
Traffic commissions are expensed in profit or loss when the transportation is provided and the related revenue is recognized. Traffic commissions for transportation not yet provided are recorded on the balance sheet as a prepaid expense.
|
(x)
|
Maintenance and overhaul costs
|
Routine maintenance, repairs and overhauls are charged to profit or loss as and when incurred.
In respect of owned and finance leased aircraft, components within the aircraft subject to replacement during major overhauls are depreciated over the average expected life between major overhauls. When each major overhaul is performed, its cost is recognized in the carrying amount of property, plant and equipment and is depreciated over the estimated period between major overhauls. Any remaining carrying amount of cost of previous major overhaul is derecognized and charged to profit or loss.
In respect of aircraft held under operating leases, the Group has responsibility to fulfill certain return conditions under relevant lease agreements. In order to fulfill these return conditions, major overhauls are required to be conducted on a regular basis. Accordingly, estimated costs of major overhauls are accrued and charged to profit or loss over the estimated period between overhauls. After the aircraft has completed its last overhaul cycle prior to being returned, expected cost of overhaul to be incurred at the end of the lease is estimated and accrued over the remaining period of the lease. Differences between the estimated costs and the actual costs of overhauls are charged to profit or loss in the period when the overhaul is performed.
F - 24
|
2
|
Principal accounting policies (continued)
|
|
(y)
|
Borrowing costs
|
Borrowing costs that are directly attributable to the acquisition, construction or production of an asset which necessarily takes a substantial period of time to get ready for its intended use or sale are capitalized as part of the cost of that asset. Other borrowing costs are expensed in the period in which they are incurred.
The capitalization of borrowing costs as part of the cost of a qualifying asset commences when expenditure for the asset is being incurred, borrowing costs are being incurred and activities that are necessary to prepare the asset for its intended use are in progress. Capitalization of borrowing costs is suspended or ceases when substantially all the activities necessary to prepare the qualifying asset for its intended use are interrupted or complete.
|
(z)
|
Short term employee benefits and contributions to defined contribution retirement schemes
|
Salaries, annual bonuses and contributions to defined contribution retirement schemes are accrued in the year in which the associated services are rendered by employees. Where payment or settlement is deferred and the effect would be material, these amounts are stated at their present values.
|
(aa)
|
Termination benefits
|
Termination benefits are recognized when, and only when, the Group demonstrably commits itself to terminate employment or to provide benefits as a result of voluntary redundancy by having a detailed formal plan which is without realistic possibility of withdrawal.
|
(bb)
|
Translation of foreign currencies
|
Foreign currencies transactions during the year are translated into Renminbi at the applicable rates of exchange quoted by the People’s Bank of China (“PBOC”) prevailing at the transaction dates. Monetary assets and liabilities denominated in foreign currencies are translated into Renminbi at the PBOC exchange rates prevailing at the end of the reporting period. Exchange gains and losses are recognized in profit or loss.
Non-monetary assets and liabilities that are measured in terms of historical cost in a foreign currency are translated into Renminbi at the PBOC exchange rates prevailing at the transaction dates. Non-monetary assets and liabilities denominated in foreign currencies that are stated at fair value are translated into Renminbi at the PBOC exchange rates prevailing at the dates the fair value was determined.
|
(cc)
|
Non-current assets held for sale
|
A non-current asset is classified as held for sale if it is highly probable that its carrying amount will be recovered through a sale transaction rather than through continuing use and the asset is available for sale in its present condition.
When the Group is committed to a sale plan involving loss of control of a subsidiary, all the assets and liabilities of that subsidiary are classified as held for sale when the above criteria for classification as held for sale are met, regardless of whether the Group will retain a non-controlling interest in the subsidiary after the sale.
F - 25
|
2
|
Principal accounting policies (continued)
|
|
(cc)
|
Non-current assets held for sale (continued)
|
Immediately before classification as held for sale, the measurement of the non-current assets is brought up-to-date in accordance with the accounting policies before the classification. Then, on initial classification as held for sale and until disposal, the non-current assets (except for certain assets as explained below), are recognized at the lower of their carrying amount and fair value less costs to sell. The principal exceptions to this measurement policy so far as the consolidated financial statements of the Group are concerned are deferred tax assets, financial assets (other than investments in subsidiaries, associates and jointly controlled entities) and investment properties. These assets, even if held for sale, would continue to be measured in accordance with the policies set out elsewhere in Note 2.
Impairment losses on initial classification as held for sale, and on subsequent remeasurement while held for sale, are recognized in profit or loss. As long as a non-current asset is classified as held for sale, the non-current asset is not depreciated or amortized.
|
(dd)
|
Related parties
|
For the purposes of these consolidated financial statements, a party is considered to be related to the Group if:
|
|
(i)
|
the party has the ability, directly or indirectly through one or more intermediaries, to control the Group or exercise significant influence over the Group in making financial and operating policy decisions, or has joint control over the Group;
|
|
|
(ii)
|
the Group and the party are subject to common control;
|
|
|
(iii)
|
the party is an associate of the Group or a joint venture in which the Group is a venturer;
|
|
|
(iv)
|
the party is a member of key management personnel of the Group or the Group’s parent, or a close family member of such an individual, or is an entity under the control, joint control or significant influence of such individuals;
|
|
|
(v)
|
the party is a close family member of a party referred in (i) or is an entity under the control, joint control or significant influence of such individuals; or
|
|
|
(vi)
|
the party is a post-employment benefit plan which is for the benefit of employees of the Group or of any entity that is a related party of the Group.
|
Close family members of an individual are those family members who may be expected to influence, or be influenced by, that individual in their dealings with the entity.
|
(ee)
|
Segmental reporting
|
Operating segments, and the amounts of each segment item reported in the consolidated financial statements, are identified from the financial information provided regularly to the Group’s most senior executive management for the purposes of allocating resources to, and assessing the performance of, the Group’s various lines of business and geographical locations.
Individually material operating segments are not aggregated for financial reporting purposes unless the segments have similar economic characteristics and are similar in respect of the nature of products and services, the nature of production processes, the type or class of customers, the methods used to distribute the products or provide the services, and the nature of the regulatory environment. Operating segments which are not individually material may be aggregated if they share a majority of these criteria.
F - 26
|
3
|
Changes in accounting policies
|
The IASB has issued two revised IFRSs, a number of amendments to IFRSs and one new Interpretation that are first effective for the current accounting period of the Group. Of these, the following developments are relevant to the Group’s financial statements:
|
•
|
IFRS 3 (revised 2008),
Business combinations
|
|
|
•
|
Amendments to IAS 27,
Consolidated and separate financial statements
|
|
|
•
|
Improvements to IFRSs (2009)
|
The Group has not applied any new standard or interpretation that is not yet effective for the current accounting period.
These developments resulted in changes in accounting policies but none of these changes in policies have a material impact on the current or comparative periods, for the following reasons:
|
|
•
|
The impact of the majority of the revisions to IFRS 3 and IAS 27 have not yet had a material effect on the Group’s financial statements as these changes will first be effective as and when the Group enters into a relevant transaction (for example, a business combination) and there is no requirement to restate the amounts recorded in respect of previous such transactions.
|
|
|
•
|
The impact of IAS 27 (in respect of loss of control of a subsidiary and allocation of losses to non-controlling interests (previously known as minority interests) in excess of their equity interest) have had no material impact as there is no requirement to restate amounts recorded in previous periods.
|
|
|
•
|
The amendment introduced by the
Improvements to IFRSs (2009)
omnibus standard in respect of IAS 17,
Leases
, have had no material impact as the Group considers current classification of interests in leasehold land as operating leases remains appropriate.
|
F - 27
|
3
|
Changes in accounting policies (continued)
|
Further details of these changes in accounting policies are as follows:
|
|
•
|
As a result of the adoption of IFRS 3 (revised 2008), any business combination acquired on or after January 1, 2010 will be recognized in accordance with the new requirements and detailed guidance contained in IFRS 3 (revised 2008). These include the following changes in accounting policies:
|
|
|
-
|
Transaction costs that the Group incurs in connection with a business combination, such as finder’s fees, legal fees, due diligence fees, and other professional and consulting fees, will be expensed as incurred, whereas previously they were accounted for as part of the cost of the business combination and therefore impacted the amount of goodwill recognized.
|
|
|
-
|
If the Group holds interests in the acquiree immediately prior to obtaining control, these interests will be treated as if disposed of and re-acquired at fair value on the date of obtaining control. Previously, the step-up approach would have been applied, whereby goodwill was computed as if accumulated at each stage of the acquisition.
|
|
|
-
|
Contingent consideration will be measured at fair value at the acquisition date. Subsequent changes in the measurement of that contingent consideration unrelated to facts and circumstances that existed at the acquisition date will be recognized in profit or loss, whereas previously these changes were recognized as an adjustment to the cost of the business combination and therefore impacted the amount of goodwill recognized.
|
|
|
-
|
If the acquiree has accumulated tax losses or other temporary deductible differences and these fail to meet the recognition criteria for deferred tax assets at the date of acquisition, then any subsequent recognition of these assets will be recognized in profit or loss, rather than as an adjustment to goodwill as was previously the policy.
|
|
|
-
|
In addition to the Group’s existing policy of measuring the non-controlling interests (previously known as the “minority interests”) in the acquiree at the non-controlling interest’s proportionate share of the acquiree’s net identifiable assets, in future the Group may elect, on a transaction by transaction basis, to measure the non-controlling interest at fair value.
|
F - 28
|
3
|
Changes in accounting policies (continued)
|
In accordance with the transitional provisions in IFRS 3 (revised 2008), these new accounting policies are applied prospectively to any business combinations in the current or future periods. The new policy in respect of recognition in the movement of deferred tax assets is also applied prospectively to accumulated tax losses and other temporary deductible differences acquired in previous business combinations. No adjustments have been made to the carrying values of assets and liabilities that arose from business combinations whose acquisition dates preceded the application of this revised standard.
|
|
•
|
As a result of the adoption of IAS 27 (amended 2008), the following changes in policies are applied as from January 1, 2010:
|
|
|
-
|
If the Group acquires an additional interest in a non-wholly owned subsidiary, the transaction will be accounted for as a transaction with equity shareholders (the non-controlling interests) in their capacity as owners and therefore no goodwill will be recognized as a result of such transactions. Similarly, if the Group disposes of part of its interest in a subsidiary but still retains control, this transaction will also be accounted for as a transaction with equity shareholders (the non-controlling interests) in their capacity as owners and therefore no profit or loss will be recognized as a result of such transactions. Previously, the Group treated such transactions as step-up transactions and partial disposals, respectively.
|
|
|
-
|
If the Group’s non-wholly owned subsidiaries incur losses, these losses incurred will be allocated between the controlling and non-controlling interests in proportion to their interests in that entity, even if this results in a deficit balance within consolidated equity being attributed to the non-controlling interests. Previously, if the allocation of losses to the non-controlling interests would have resulted in a deficit balance, the losses were only allocated to the non-controlling interests if the non-controlling interests were under a binding obligation to make good the losses. In accordance with the transitional provisions in IAS 27, this new accounting policy is being applied prospectively and therefore previous periods have not been restated.
|
In accordance with the transitional provisions in IAS 27, these new accounting policies are applied prospectively to transactions in current or future periods and therefore previous periods have not been restated.
|
|
•
|
In order to be consistent with the above amendments to IFRS 3 and IAS 27, and as a result of amendments to IAS 28,
Investments in associates
, and IAS 31,
Interests in joint ventures
, the following policies are applied as from January 1, 2010:
|
|
|
-
|
If the Group holds interests in the acquiree immediately prior to obtaining significant influence or joint control, these interests will be treated as if disposed of and re-acquired at fair value on the date of obtaining significant influence or joint control. Previously, the step-up approach would have been applied, whereby goodwill was computed as if accumulated at each stage of the acquisition.
|
|
|
-
|
If the Group loses significant influence or joint control, the transaction will be accounted for as a disposal of the entire interest in that investee, with any remaining interest being recognized at fair value as if re-acquired. Previously, such transactions were treated as partial disposals.
|
Consistent with the transitional provisions in IFRS 3 and IAS 27, these new accounting policies are applied prospectively to transactions in current or future periods and therefore previous periods have not been restated.
F - 29
|
3
|
Changes in accounting policies (continued)
|
|
|
•
|
As a result of the amendment to IAS 17,
Leases
, arising from the
Improvements to IFRSs (2009)
omnibus standard, the Group has re-evaluated the classification of its interests in leasehold land as to whether, in the Group’s judgment, the lease transfers substantially all the risks and rewards of ownership of the land such that the Group is in a position economically similar to that of a purchaser. The Group has concluded that the classification of such leases as operating leases remains appropriate as the leases do not transfer substantially all the risks and rewards of ownership of the land to the Group.
|
|
4
|
Traffic revenue
|
|
2010
|
2009
|
2008
|
||||||||||
|
RMB million
|
RMB million
|
RMB million
|
||||||||||
|
Passenger
|
64,308 | 48,488 | 42,808 | |||||||||
|
Cargo and mail
|
4,249 | 2,493 | 2,908 | |||||||||
|
Fuel surcharge income
|
5,583 | 1,986 | 8,197 | |||||||||
| 74,140 | 52,967 | 53,913 | ||||||||||
Pursuant to various sales tax rules and regulations, the Group is required to pay sales tax (mainly including business tax) to national and local tax authorities at the rate of approximately 3% of the traffic revenue in respect of domestic flights and international, Hong Kong, Macau and Taiwan flights.
Pursuant to the “Notice of exemption of business tax on international traffic revenue” issued jointly by the PRC Ministry of Finance and the State Administration of Taxation in 2010, the Group is exempted from business tax on international (including Hong Kong, Macau and Taiwan) traffic revenue from January 1, 2010.
Pursuant to the “Notice of exemption of business tax on fuel surcharge for airline companies” issued jointly by the PRC Ministry of Finance and the State Administration of Taxation, the Group is exempted from business tax on fuel surcharge income received during the period from January 1, 2008 to December 31, 2010.
Sales tax incurred by the Group during the year ended December 31, 2010, netted off against revenue, amounted to RMB1,851 million (2009: RMB1,532 million; 2008: RMB1,337 million). Traffic revenue is stated net of sales tax.
|
5
|
Other operating revenue
|
|
2010
|
2009
|
2008
|
||||||||||
|
RMB million
|
RMB million
|
RMB million
|
||||||||||
|
Commission income
|
469 | 342 | 317 | |||||||||
|
General aviation income
|
283 | 197 | 133 | |||||||||
|
Ground services income
|
390 | 320 | 250 | |||||||||
|
Air catering income
|
132 | 112 | 107 | |||||||||
|
Rental income
|
122 | 116 | 120 | |||||||||
|
Expired sales in advance of carriage
|
664 | 350 | 276 | |||||||||
|
Aircraft lease income
|
- | 83 | - | |||||||||
|
Others
|
295 | 315 | 172 | |||||||||
| 2,355 | 1,835 | 1,375 | ||||||||||
F - 30
|
6
|
Flight operations expenses
|
|
2010
|
2009
|
2008
|
||||||||||
|
RMB million
|
RMB million
|
RMB million
|
||||||||||
|
Jet fuel costs
|
23,492 | 16,390 | 23,086 | |||||||||
|
Operating lease charges
|
||||||||||||
|
- Aircraft and flight equipment
|
4,821 | 4,740 | 4,166 | |||||||||
|
- Land and buildings
|
477 | 383 | 361 | |||||||||
|
Air catering expenses
|
1,808 | 1,392 | 1,363 | |||||||||
|
Aircraft insurance
|
206 | 188 | 174 | |||||||||
|
Flight personnel payroll and welfare
|
3,420 | 2,622 | 2,490 | |||||||||
|
Training expenses
|
628 | 556 | 577 | |||||||||
|
Civil Aviation Administration of China (“CAAC”) Infrastructure Development Fund contributions
|
1,622 | 1,418 | 1,289 | |||||||||
|
Others
|
2,119 | 1,607 | 1,476 | |||||||||
| 38,593 | 29,296 | 34,982 | ||||||||||
|
7
|
Maintenance expenses
|
|
2010
|
2009
|
2008
|
||||||||||
|
RMB million
|
RMB million
|
RMB million
|
||||||||||
|
Repair and maintenance charges
|
4,985 | 3,903 | 4,406 | |||||||||
|
Maintenance materials
|
601 | 543 | 484 | |||||||||
| 5,586 | 4,446 | 4,890 | ||||||||||
|
8
|
Aircraft and traffic servicing expenses
|
|
2010
|
2009
|
2008
|
||||||||||
|
RMB million
|
RMB million
|
RMB million
|
||||||||||
|
Landing and navigation fees
|
7,792 | 6,772 | 6,135 | |||||||||
|
Ground service and other charges
|
3,176 | 2,397 | 2,341 | |||||||||
| 10,968 | 9,169 | 8,476 | ||||||||||
F - 31
|
9
|
Promotion and sales expenses
|
|
2010
|
2009
|
2008
|
||||||||||
|
RMB million
|
RMB million
|
RMB million
|
||||||||||
|
Sales commissions
|
3,232 | 2,539 | 1,853 | |||||||||
|
Ticket office expenses
|
1,373 | 1,055 | 1,055 | |||||||||
|
Computer reservation services
|
446 | 327 | 331 | |||||||||
|
Advertising and promotion
|
147 | 46 | 52 | |||||||||
|
Others
|
357 | 203 | 200 | |||||||||
| 5,555 | 4,170 | 3,491 | ||||||||||
|
10
|
General and administrative expenses
|
|
2010
|
2009
|
2008
|
||||||||||
|
RMB million
|
RMB million
|
RMB million
|
||||||||||
|
General corporate expenses
|
2,158 | 1,760 | 1,973 | |||||||||
|
Auditors’ remuneration
|
14 | 16 | 16 | |||||||||
|
Other taxes and levies
|
94 | 68 | 52 | |||||||||
| 2,266 | 1,844 | 2,041 | ||||||||||
|
11
|
Depreciation and amortisation
|
|
2010
|
2009
|
2008
|
||||||||||
|
RMB million
|
RMB million
|
RMB million
|
||||||||||
|
Depreciation
|
||||||||||||
|
- Owned assets
|
5,724 | 4,702 | 4,199 | |||||||||
|
- Assets acquired under finance leases
|
1,301 | 1,260 | 1,560 | |||||||||
|
Amortisation of deferred benefits and gains
|
(71 | ) | (71 | ) | (71 | ) | ||||||
|
Other amortisation
|
107 | 80 | 58 | |||||||||
| 7,061 | 5,971 | 5,746 | ||||||||||
|
12
|
Staff costs
|
|
2010
|
2009
|
2008
|
||||||||||
|
RMB million
|
RMB million
|
RMB million
|
||||||||||
|
Salaries, wages and welfare
|
7,713 | 5,887 | 5,591 | |||||||||
|
Retirement scheme contributions
|
808 | 567 | 686 | |||||||||
|
Early retirement benefits (Note 41)
|
29 | 6 | 10 | |||||||||
| 8,550 | 6,460 | 6,287 | ||||||||||
Staff costs relating to flight operations, maintenance, aircraft and traffic servicing, promotion and sales and general and administrative expenses are also included in the respective total amounts disclosed separately in Notes 6 to 10 above.
F - 32
|
13
|
Other net income
|
|
2010
|
2009
|
2008
|
||||||||||
|
RMB million
|
RMB million
|
RMB million
|
||||||||||
|
Refund of CAAC infrastructure development fund
|
- | 1,328 | - | |||||||||
|
Government subsidies
|
553 | 541 | 901 | |||||||||
|
(Loss) / gain on sale of property, plant and equipment, net
|
||||||||||||
|
- Aircraft and spare engines
|
(8 | ) | 14 | (20 | ) | |||||||
|
- Other property, plant and equipment
|
(1 | ) | 17 | (39 | ) | |||||||
|
Gain on sale of available-for-sale equity
|
||||||||||||
|
securities (Note 17(b))
|
- | 78 | - | |||||||||
|
Others
|
(68 | ) | 11 | (9 | ) | |||||||
| 476 | 1,989 | 833 | ||||||||||
Pursuant to the “Notice of refund of CAAC infrastructure development fund” jointly issued by CAAC and the Ministry of Finance of the PRC in 2009, RMB1,328 million of CAAC infrastructure development fund paid for the period from July 1, 2008 to June 30, 2009 was refunded in 2009. There was no such refund during 2010.
|
14
|
Interest expense
|
|
2010
|
2009
|
2008
|
||||||||||
|
RMB million
|
RMB million
|
RMB million
|
||||||||||
|
Interest on bank and other loans wholly repayable within five years
|
777 | 1,333 | 1,934 | |||||||||
|
Interest on other loans
|
263 | 120 | 30 | |||||||||
|
Finance charges on obligations under finance leases
|
403 | 471 | 678 | |||||||||
|
Other interest expense (Note 41)
|
8 | 14 | 19 | |||||||||
|
Less: borrowing costs capitalised
|
(186 | ) | (441 | ) | (674 | ) | ||||||
| 1,265 | 1,497 | 1,987 | ||||||||||
The borrowing costs have been capitalised at rates ranging from 1.13% to 1.87% per annum in 2010 (2009: 1.55% to 3.30% per annum; 2008: 5.17% to 5.28% per annum).
F - 33
|
15
|
Emoluments of directors, supervisors and senior management
|
Details of directors’ and supervisors’ emoluments for the year ended December 31, 2010 are set out below:
|
Salaries,
|
||||||||||||||||||||
|
allowances
|
||||||||||||||||||||
|
and
|
Retirement
|
|||||||||||||||||||
|
Directors’
|
benefits
|
Discretionary
|
scheme
|
|||||||||||||||||
|
Name
|
fees
|
in kind
|
bonuses
|
contributions
|
Total
|
|||||||||||||||
|
RMB’000
|
RMB’000
|
RMB’000
|
RMB’000
|
RMB’000
|
||||||||||||||||
|
Non-executive directors
|
||||||||||||||||||||
|
Si Xian Min (Note (i) and (vii))
|
- | - | - | - | - | |||||||||||||||
|
Li Wen Xin (Note (i) and (vii))
|
- | - | - | - | - | |||||||||||||||
|
Wang Quan Hua (Note (i) and (vii))
|
- | - | - | - | - | |||||||||||||||
|
Executive directors
|
||||||||||||||||||||
|
Liu Bao Heng (Note (ii) and (vii))
|
- | - | - | - | - | |||||||||||||||
|
Tan Wan Geng
|
- | 817 | 150 | 61 | 1,028 | |||||||||||||||
|
Zhang Zi Fang
|
- | 778 | 150 | 60 | 988 | |||||||||||||||
|
Xu Jie Bo
|
- | 706 | 100 | 60 | 866 | |||||||||||||||
|
Chen Zhen You
|
- | 706 | 100 | 59 | 865 | |||||||||||||||
|
Supervisors
|
||||||||||||||||||||
|
Pan Fu (Note (iv) and (vii))
|
- | - | - | - | - | |||||||||||||||
|
Sun Xiao Yi (Note (iii) and (vii))
|
- | - | - | - | - | |||||||||||||||
|
Li Jia Shi
|
- | 708 | 100 | 58 | 866 | |||||||||||||||
|
Zhang Wei (Note (vii))
|
- | - | - | - | - | |||||||||||||||
|
Yang Yi Hua
|
- | 368 | 20 | 56 | 444 | |||||||||||||||
|
Liang Zhong Gao
|
- | 373 | 20 | 57 | 450 | |||||||||||||||
|
Independent non-executive directors
|
||||||||||||||||||||
|
Wang Zhi (Note (iii))
|
- | - | - | - | - | |||||||||||||||
|
Sui Guang Jun (Note (iii))
|
100 | - | - | - | 100 | |||||||||||||||
|
Gong Hua Zhang
|
100 | - | - | - | 100 | |||||||||||||||
|
Lam Kwong Yu
|
87 | - | - | - | 87 | |||||||||||||||
|
Wei Jin Cai (Note (iv))
|
- | - | - | - | - | |||||||||||||||
|
Ning Xiang Dong (Note (iv))
|
- | - | - | - | - | |||||||||||||||
| 287 | 4,456 | 640 | 411 | 5,794 | ||||||||||||||||
F - 34
|
15
|
Emoluments of directors, supervisors and senior management (continued)
|
Details of directors’ and supervisors’ emoluments for the year ended December 31, 2009 are set out below:
|
Salaries,
|
||||||||||||||||||||
|
allowances
|
||||||||||||||||||||
|
and
|
Retirement
|
|||||||||||||||||||
|
Directors’
|
benefits
|
Discretionary
|
scheme
|
|||||||||||||||||
|
Name
|
fees
|
in kind
|
bonuses
|
contributions
|
Total
|
|||||||||||||||
|
RMB’000
|
RMB’000
|
RMB’000
|
RMB’000
|
RMB’000
|
||||||||||||||||
|
Executive directors
|
||||||||||||||||||||
|
Si Xian Min
|
- | 698 | - | 40 | 738 | |||||||||||||||
|
Li Wen Xin
|
- | 608 | - | 40 | 648 | |||||||||||||||
|
Wang Quan Hua
|
- | 550 | - | 40 | 590 | |||||||||||||||
|
Liu Bao Heng
|
- | 550 | - | 40 | 590 | |||||||||||||||
|
Tan Wan Geng
|
- | 672 | - | 38 | 710 | |||||||||||||||
|
Xu Jie Bo
|
- | 572 | - | 38 | 610 | |||||||||||||||
|
Chen Zhen You
|
- | 572 | - | 38 | 610 | |||||||||||||||
|
Zhang Zi Fang (Note (v))
|
- | 590 | - | 38 | 628 | |||||||||||||||
|
Supervisors
|
||||||||||||||||||||
|
Sun Xiao Yi
|
- | 550 | - | 40 | 590 | |||||||||||||||
|
Yang Guang Hua (Note (vi))
|
- | 407 | - | 17 | 424 | |||||||||||||||
|
Zhang Wei
|
- | 345 | - | 40 | 385 | |||||||||||||||
|
Yang Yi Hua
|
- | 266 | - | 38 | 304 | |||||||||||||||
|
Liang Zhong Gao
|
- | 269 | - | 38 | 307 | |||||||||||||||
|
Li Jia Shi (Note (v))
|
- | 118 | - | 19 | 137 | |||||||||||||||
|
Independent non-executive directors
|
||||||||||||||||||||
|
Wang Zhi
|
50 | - | - | - | 50 | |||||||||||||||
|
Sui Guang Jun
|
100 | - | - | - | 100 | |||||||||||||||
|
Gong Hua Zhang
|
100 | - | - | - | 100 | |||||||||||||||
|
Lam Kwong Yu
|
88 | - | - | - | 88 | |||||||||||||||
| 338 | 6,767 | - | 504 | 7,609 | ||||||||||||||||
F - 35
|
15
|
Emoluments of directors, supervisors and senior management (continued)
|
Details of directors’ and supervisors’ emoluments for the year ended December 31, 2008 are set out below:
|
Salaries,
|
||||||||||||||||||||
|
allowances
|
||||||||||||||||||||
|
and
|
Retirement
|
|||||||||||||||||||
|
Directors’
|
benefits
|
Discretionary
|
scheme
|
|||||||||||||||||
|
Name
|
fees
|
in kind
|
bonuses
|
contributions
|
Total
|
|||||||||||||||
|
RMB’000
|
RMB’000
|
RMB’000
|
RMB’000
|
RMB’000
|
||||||||||||||||
|
Executive directors
|
||||||||||||||||||||
|
Si Xian Min
|
- | 857 | - | 60 | 917 | |||||||||||||||
|
Li Wen Xin
|
- | 596 | - | 80 | 676 | |||||||||||||||
|
Wang Quan Hua
|
- | 535 | - | 61 | 596 | |||||||||||||||
|
Liu Bao Heng (Note (ix))
|
- | - | - | - | - | |||||||||||||||
|
Tan Wan Geng
|
- | 854 | - | 59 | 913 | |||||||||||||||
|
Xu Jie Bo
|
- | 711 | - | 57 | 768 | |||||||||||||||
|
Chen Zhen You
|
- | 711 | - | 55 | 766 | |||||||||||||||
|
Liu Shao Yong (Notes (viii) and (x))
|
- | 597 | - | 79 | 676 | |||||||||||||||
|
Zhao Liu An (Notes (viii) and (xi))
|
- | 442 | - | 61 | 503 | |||||||||||||||
|
Supervisors
|
||||||||||||||||||||
|
Sun Xiao Yi
|
- | 535 | - | 61 | 596 | |||||||||||||||
|
Yang Guang Hua
|
- | 712 | - | 28 | 740 | |||||||||||||||
|
Yang Yi Hua
|
- | 292 | - | 53 | 345 | |||||||||||||||
|
Liang Zhong Gao
|
- | 296 | - | 54 | 350 | |||||||||||||||
|
Zhang Wei (Note (xii))
|
- | 282 | - | 61 | 343 | |||||||||||||||
|
Independent non-executive directors
|
||||||||||||||||||||
|
Wang Zhi
|
100 | - | - | - | 100 | |||||||||||||||
|
Sui Guang Jun
|
100 | - | - | - | 100 | |||||||||||||||
|
Gong Hua Zhang
|
100 | - | - | - | 100 | |||||||||||||||
|
Lam Kwong Yu
|
89 | - | - | - | 89 | |||||||||||||||
| 389 | 7,420 | - | 769 | 8,578 | ||||||||||||||||
F - 36
|
15
|
Emoluments of directors, supervisors and senior management (continued)
|
Notes:
|
|
(i)
|
These three directors were appointed as non-executive directors on December 29, 2010.
|
|
|
(ii)
|
Resigned on November 24, 2010.
|
|
|
(iii)
|
Resigned on December 29, 2010.
|
|
|
(iv)
|
Appointed on December 29, 2010.
|
|
|
(v)
|
Appointed on June 30, 2009.
|
|
|
(vi)
|
Resigned on June 30, 2009.
|
|
|
(vii)
|
These directors or supervisors do not receive any remunerations for their services in the capacity of the directors or supervisors of the Company. They also held management positions in CSAHC and their salaries were borne by CSAHC.
|
|
|
(viii)
|
The above amounts included salaries paid to these directors as pilots of the Company.
|
|
|
(ix)
|
Appointed on December 29, 2008.
|
|
|
(x)
|
Resigned on December 12, 2008.
|
|
|
(xi)
|
Resigned on September 19, 2008.
|
|
|
(xii)
|
Appointed on June 25, 2008.
|
F - 37
|
16
|
Income tax expense / (benefit)
|
|
(a)
|
Income tax expense / (benefit) in the consolidated income statements
|
|
2010
|
2009
|
2008
|
||||||||||
|
RMB million
|
RMB million
|
RMB million
|
||||||||||
|
PRC income tax
|
||||||||||||
|
Provision for the year
|
2,134 | 90 | 25 | |||||||||
|
Over-provision in prior year
|
- | - | (6 | ) | ||||||||
| 2,134 | 90 | 19 | ||||||||||
|
Deferred tax (Note 26)
|
||||||||||||
|
Origination and reversal of temporary differences
|
(92 | ) | 327 | 232 | ||||||||
|
Utilisation of unused tax losses and deductible temporary differences not recognized
in prior year
(Note 16(b))
|
(364 | ) | (512 | ) | - | |||||||
|
Effect on deferred tax balances resulting from a change in tax rate
|
- | - | (189 | ) | ||||||||
| (456 | ) | (185 | ) | 43 | ||||||||
|
Income tax expense / (benefit)
|
1,678 | (95 | ) | 62 | ||||||||
In respect of majority of the Group’s overseas airline activities, the Group has either obtained exemptions from overseas taxation pursuant to the bilateral aviation agreements between the overseas governments and the PRC government, or has sustained tax losses in these overseas jurisdictions. Accordingly, no provision for overseas tax has been made for such overseas airline activities both the current and prior years.
The Corporate Income Tax Law of the PRC (“new tax law”) took effect on January 1, 2008 and the statutory income tax rate adopted by the Company and its subsidiaries has been changed from 33% to 25% with effect from January 1, 2008.
Pursuant to the new tax law, the income tax rates of entities that previously enjoyed preferential tax rates of 15% and 18% have been revised to 18%, 20%, 22%, 24% and 25% for 2008, 2009, 2010, 2011 and 2012 onwards respectively.
F - 38
|
16
|
Income tax expense / (benefit) (continued)
|
|
(b)
|
Reconciliation between actual tax expense / (benefit) and calculated tax based on accounting profit/(loss) at applicable tax rates
|
|
2010
|
2009
|
2008
|
||||||||||
|
RMB million
|
RMB million
|
RMB million
|
||||||||||
|
Profit/(loss) before taxation
|
8,093 | 432 | (4,724 | ) | ||||||||
|
Notional tax on profit/(loss) before taxation, calculated at the rates applicable to profit/(loss) in the tax jurisdictions concerned (Note (i))
|
1,974 | 87 | (913 | ) | ||||||||
|
Adjustments for tax effect of:
|
||||||||||||
|
Non-deductible expenses
|
112 | 63 | 64 | |||||||||
|
Non-taxable income
|
||||||||||||
|
- Share of results of associates and jointly controlled entities
|
(42 | ) | (76 | ) | (38 | ) | ||||||
|
- Others
|
(2 | ) | (20 | ) | - | |||||||
|
Recognition of taxable temporary difference on asset classified as held for sale
|
- | 67 | - | |||||||||
|
Unused tax losses not recognized
|
- | 216 | 566 | |||||||||
|
Deductible temporary differences not recognized
|
- | - | 577 | |||||||||
|
Utilisation of unused tax losses and deductible temporary differences not recognized in prior year (Note 16(a)/Note (ii))
|
(364 | ) | (512 | ) | - | |||||||
|
Difference in tax rates (Note (ii))
|
- | 81 | - | |||||||||
|
Effect of change in tax rate (Note (iii))
|
- | - | (189 | ) | ||||||||
|
Over provision in prior years
|
- | - | (6 | ) | ||||||||
|
Others
|
- | (1 | ) | 1 | ||||||||
|
Actual tax expense / (benefit)
|
1,678 | (95 | ) | 62 | ||||||||
Notes:
|
|
(i)
|
The headquarters of the Company and its branches are taxed at rates ranging from 22% to 25% (2009: 20% to 25%; 2008: 18% to 25%). The subsidiaries of the Group are taxed at rates ranging from 15% to 25% (2009: 15% to 25%; 2008: 15% to 25%).
|
F - 39
|
16
|
Income tax expense / (benefit) (continued)
|
|
(b)
|
Reconciliation between actual tax expense / (benefit) and calculated tax based on accounting profit/(loss) at applicable tax rates (continued)
|
|
|
(ii)
|
The Company’s retained profits under PRC Accounting Standards for Business Enterprises (“PRC GAAP”) was increased as a result of changes in accounting policies in 2003 and 2007. As at December 31, 2008, the Company recognized deferred tax liabilities of RMB498 million and an income tax payable of RMB112 million in respect of the increase in retained profits of RMB3,320 million in 2003 and RMB627 million in 2007, respectively in the consolidated financial statements prepared under IFRSs. In 2009, the Company agreed with the local tax authority that the above deferred tax liabilities and income tax payable would be settled from 2009 to 2011.
|
|
|
(iii)
|
The deferred tax assets and liabilities as at December 31, 2008 have been remeasured for the change in applicable tax rates as a result of enactment of regulations governing administration of income tax among headquarters and branches in 2008.
|
|
17
|
Other comprehensive income
|
|
(a)
|
Tax effects relating to other comprehensive income
|
|
2010
|
2009
|
2008
|
||||||||||||||||||||||||||||||||||
|
Before-tax
|
Tax
|
Net-of-tax
|
Before-tax
|
Tax
|
Net-of-tax
|
Before-tax
|
Tax
|
Net-of-tax
|
||||||||||||||||||||||||||||
|
Amount
|
benefit
|
amount
|
amount
|
expense
|
amount
|
amount
|
benefit
|
amount
|
||||||||||||||||||||||||||||
|
RMB
|
RMB
|
RMB
|
RMB
|
RMB
|
RMB
|
RMB
|
RMB
|
RMB
|
||||||||||||||||||||||||||||
|
million
|
million
|
million
|
million
|
million
|
million
|
million
|
million
|
million
|
||||||||||||||||||||||||||||
|
Available-for-sales
securities:
|
||||||||||||||||||||||||||||||||||||
|
net movement in
fair value reserve
|
(18 | ) | 3 | (15 | ) | 39 | (9 | ) | 30 | (248 | ) | 56 | (192 | ) | ||||||||||||||||||||||
|
(b)
|
Reclassification adjustments relating to components of other comprehensive income
|
|
2010
|
2009
|
2008
|
||||||||||
|
RMB million
|
RMB million
|
RMB million
|
||||||||||
|
Available-for-sale securities:
|
||||||||||||
|
Changes in fair value recognized during the year
|
(18 | ) | 117 | (248 | ) | |||||||
|
Reclassification adjustment for amount transferred to profit or loss:
|
||||||||||||
|
- gain on disposal (Note 13)
|
- | (78 | ) | - | ||||||||
|
Net deferred tax credited / (debited) to other comprehensive income
(Note 26(a))
|
3 | (9 | ) | 56 | ||||||||
|
Net movement in the fair value reserve during the year recognized in other comprehensive income
|
(15 | ) | 30 | (192 | ) | |||||||
|
18
|
Dividends
|
The board of directors of the Company does not recommend the payment of a dividend in respect of the year ended December 31, 2010.
No dividend was paid in respect of the year ended December 31, 2009 and 2008.
F - 40
The calculation of basic earnings/(loss) per share for the year ended December 31, 2010 is based on the profit attributable to equity shareholders of the Company of RMB5,795 million (2009 profit of RMB330 million; 2008 loss of RMB4,823 million) and the weighted average of 8,314,100,000 shares in issue during the year (2009: 7,084,842,000 shares; 2008: 6,561,267,000 shares).
|
2010
|
2009
|
2008
|
||||||||||
|
Million shares
|
Million shares
|
Million shares
|
||||||||||
|
Issued ordinary shares at January 1
|
8,003 | 6,561 | 4,374 | |||||||||
|
Effect of bonus share issue
|
- | - | 2,187 | |||||||||
|
Effect of issuance of A shares (Note 43)
|
259 | 263 | - | |||||||||
|
Effect of issuance of H shares (Note 43)
|
52 | 261 | - | |||||||||
|
Weighted average number of ordinary shares at December 31
|
8,314 | 7,085 | 6,561 | |||||||||
The amounts of diluted earnings / (loss) per share are the same as basic earnings / (loss) per share as there were no dilutive potential ordinary shares in existence for both the current and prior years.
|
20
|
Property, plant and equipment, net
|
|
Aircraft
|
Other
|
|||||||||||||||||||||||||||
|
Acquired
|
flight
|
Machinery,
|
||||||||||||||||||||||||||
|
under
|
equipment,
|
equipment
|
||||||||||||||||||||||||||
|
Investment
|
finance
|
including
|
and
|
|||||||||||||||||||||||||
|
properties
|
Buildings
|
Owned
|
leases
|
rotables
|
vehicles
|
Total
|
||||||||||||||||||||||
|
RMB
|
RMB
|
RMB
|
RMB
|
RMB
|
RMB
|
RMB
|
||||||||||||||||||||||
|
million
|
million
|
million
|
million
|
million
|
million
|
million
|
||||||||||||||||||||||
|
Cost:
|
||||||||||||||||||||||||||||
|
At January 1, 2009
|
776 | 6,185 | 42,687 | 22,122 | 11,119 | 3,727 | 86,616 | |||||||||||||||||||||
|
Additions
|
- | 67 | 4,490 | 2,326 | 1,067 | 402 | 8,352 | |||||||||||||||||||||
|
Transfer from construction in progress (Note 21)
|
- | 356 | 7,603 | 102 | 150 | 104 | 8,315 | |||||||||||||||||||||
|
Reclassification on exercise of purchase options
|
- | - | 2,586 | (2,586 | ) | - | - | - | ||||||||||||||||||||
|
Reclassification to lease prepayments
|
(12 | ) | - | - | - | - | - | (12 | ) | |||||||||||||||||||
|
Disposals
|
- | (36 | ) | (1,209 | ) | (37 | ) | (480 | ) | (109 | ) | (1,871 | ) | |||||||||||||||
|
Other reclassifications
|
(181 | ) | 179 | (77 | ) | - | 77 | 2 | - | |||||||||||||||||||
|
At December 31, 2009
|
583 | 6,751 | 56,080 | 21,927 | 11,933 | 4,126 | 101,400 | |||||||||||||||||||||
|
At January 1, 2010
|
583 | 6,751 | 56,080 | 21,927 | 11,933 | 4,126 | 101,400 | |||||||||||||||||||||
|
Additions
|
- | 18 | 4,921 | 3,552 | 1,368 | 405 | 10,264 | |||||||||||||||||||||
|
Transfer from construction in progress (Note 21)
|
- | 700 | 12,665 | - | 359 | 41 | 13,765 | |||||||||||||||||||||
|
Disposals
|
- | (81 | ) | (1,294 | ) | (11 | ) | (202 | ) | (246 | ) | (1,834 | ) | |||||||||||||||
|
Other reclassifications
|
28 | (28 | ) | (41 | ) | - | 41 | - | - | |||||||||||||||||||
|
At December 31, 2010
|
611 | 7,360 | 72,331 | 25,468 | 13,499 | 4,326 | 123,595 | |||||||||||||||||||||
F - 41
|
20
|
Property, plant and equipment, net (continued)
|
|
Aircraft
|
Other
|
|||||||||||||||||||||||||||
|
Acquired
|
flight
|
Machinery,
|
||||||||||||||||||||||||||
|
under
|
equipment,
|
equipment
|
||||||||||||||||||||||||||
|
Investment
|
finance
|
including
|
and
|
|||||||||||||||||||||||||
|
properties
|
Buildings
|
Owned
|
leases
|
rotables
|
vehicles
|
Total
|
||||||||||||||||||||||
|
RMB
|
RMB
|
RMB
|
RMB
|
RMB
|
RMB
|
RMB
|
||||||||||||||||||||||
|
million
|
million
|
million
|
million
|
million
|
million
|
million
|
||||||||||||||||||||||
|
Accumulated depreciation and
impairment losses:
|
||||||||||||||||||||||||||||
|
At January 1, 2009
|
136 | 1,193 | 18,606 | 4,069 | 6,924 | 2,451 | 33,379 | |||||||||||||||||||||
|
Depreciation charge for the year
|
19 | 234 | 3,260 | 1,260 | 844 | 345 | 5,962 | |||||||||||||||||||||
|
Reclassification on exercise of purchase options
|
- | - | 1,354 | (1,354 | ) | - | - | - | ||||||||||||||||||||
|
Reclassification to lease prepayments
|
(1 | ) | - | - | - | - | - | (1 | ) | |||||||||||||||||||
|
Disposals
|
- | (11 | ) | (970 | ) | (37 | ) | (428 | ) | (93 | ) | (1,539 | ) | |||||||||||||||
|
Other reclassifications
|
(32 | ) | 31 | (66 | ) | - | 66 | 1 | - | |||||||||||||||||||
|
Impairment losses for the year (Note (g))
|
- | - | - | - | 26 | - | 26 | |||||||||||||||||||||
|
Impairment losses written off on disposal
|
- | - | (97 | ) | - | (3 | ) | - | (100 | ) | ||||||||||||||||||
|
At December 31, 2009
|
122 | 1,447 | 22,087 | 3,938 | 7,429 | 2,704 | 37,727 | |||||||||||||||||||||
|
At January 1, 2010
|
122 | 1,447 | 22,087 | 3,938 | 7,429 | 2,704 | 37,727 | |||||||||||||||||||||
|
Depreciation charge for the year
|
18 | 248 | 4,226 | 1,301 | 872 | 360 | 7,025 | |||||||||||||||||||||
|
Disposals
|
- | (28 | ) | (967 | ) | (11 | ) | (186 | ) | (233 | ) | (1,425 | ) | |||||||||||||||
|
Other reclassifications
|
(2 | ) | 2 | (35 | ) | - | 35 | - | - | |||||||||||||||||||
|
Impairment losses for the year (Note (g))
|
- | - | 189 | - | 22 | 1 | 212 | |||||||||||||||||||||
|
Impairment losses written off on disposal
|
- | - | (156 | ) | - | (2 | ) | - | (158 | ) | ||||||||||||||||||
|
At December 31, 2010
|
138 | 1,669 | 25,344 | 5,228 | 8,170 | 2,832 | 43,381 | |||||||||||||||||||||
|
Net book value:
|
||||||||||||||||||||||||||||
|
At December 31, 2010
|
473 | 5,691 | 46,987 | 20,240 | 5,329 | 1,494 | 80,214 | |||||||||||||||||||||
|
At December 31, 2009
|
461 | 5,304 | 33,993 | 17,989 | 4,504 | 1,422 | 63,673 | |||||||||||||||||||||
|
(a)
|
Most of the Group’s buildings are located in the PRC. The Group was formally granted the rights to use the thirty-two parcels of land in Guangzhou, Shenzhen, Zhuhai, Beihai, Changsha, Shantou, Haikou, Zhengzhou, Jilin, Guiyang and Wuhan, etc. by the relevant PRC authorities for periods of 30 to 70 years, which expire between 2020 and 2073. For other land in the PRC on which the Group’s buildings are erected, the Group was formally granted the rights to use such land for periods of one to three years pursuant to various lease agreements between the Company and CSAHC. In this connection, rental payments in respect of land use rights totaling RMB22 million were paid to CSAHC during 2010 (2009 and 2008: RMB22 million) in respect of these leases.
|
F - 42
|
20
|
Property, plant and equipment, net (continued)
|
|
(b)
|
As at December 31, 2010, certain aircraft of the Group with an aggregate carrying value of approximately RMB46,194 million (2009: RMB34,384 million) were mortgaged under certain loan and lease agreements (Notes 33 and 34).
|
|
(c)
|
The Group leased out investment properties and certain flight training facilities under operating leases. The leases typically run for an initial period of one to fourteen years, with an option to renew the lease after that date at which time all terms are renegotiated. None of the leases includes contingent rentals. In this connection, rental income totalling RMB74 million (2009: RMB62 million; 2008: RMB54 million) was received by the Group during the year in respect of the leases.
|
All properties held under operating leases that would otherwise meet the definition of investment property are classified as investment property.
The Group’s total future minimum lease payments to be received under non-cancellable operating leases are as follows:
|
2010
|
2009
|
|||||||
|
RMB million
|
RMB million
|
|||||||
|
Within 1 year
|
76 | 56 | ||||||
|
After 1 year but within 5 years
|
97 | 182 | ||||||
|
After 5 years
|
1 | 111 | ||||||
| 174 | 349 | |||||||
As at December 31, 2010, the net book value of the aircraft and flight training facilities leased out by the Group under operating leases amounted to RMB43 million (2009: RMB52 million).
|
(d)
|
The investment properties are located in the PRC, where comparable market transactions are infrequent. In the absence of the current or recent prices in an active market and alternative reliable estimates of fair value (for example, discounted cash flow projection) are not available, the Group could not reliably determine the fair value of the investment properties.
|
|
(e)
|
The Company entered into two separate arrangements (the “Arrangements”) with certain independent third parties during each of 2002 and 2003. Under each of the Arrangements, the Company sold an aircraft and then immediately leased back the aircraft for an agreed period. The Company has an option to purchase the aircraft at a pre-determined date. In the event that the lease agreement is early terminated by the Company, the Company is liable to pay a pre-determined penalty to the lessor. Provided that the Company complies with the lease agreements, the Company is entitled to the continued possession and operation of the aircraft. Since the Company retains substantially all risks and rewards incidental to ownership of the aircraft and enjoys substantially the same rights to their use as before the Arrangements, no adjustment has been made to the property, plant and equipment.
|
|
(f)
|
As at December 31, 2010 and up to the date of approval of these consolidated financial statements, the Group is in the process of applying for the land use right certificates and property title certificates in respect of the properties located in Guangzhou (including Guangzhou Baiyun International Airport), Xiamen, Heilongjiang, Hainan, Jilin, Dalian, Hunan, Xinjiang, Henan, Shenzhen, Beijing, Shanghai, Sanya, Zhuhai and Shenyang in which the Group has interests and for which such certificates have not been granted. As at December 31, 2010, carrying value of such properties of the Group amounted to RMB3,271 million (2009: RMB2,638 million). The directors of the Company are of the opinion that the use of and the conduct of operating activities at the properties referred to above are not affected by the fact that the Group has not yet obtained the relevant land use right certificates and property title certificates.
|
F - 43
|
20
|
Property, plant and equipment, net (continued)
|
|
(g)
|
In 2009, in view of the age of the Group’s fleet of ATR72 aircraft, the Group determined to dispose of these aircraft and commenced its process of seeking buyers for these aircraft. As a result, the Group assessed the recoverable amounts of these aircraft and related fleet assets. The carrying amount of the related fleet assets was written down by RMB26 million. The estimates of recoverable amounts were based on the assets’ fair value less costs to sell, determined by reference to the recent observable market prices for the aircraft and related fleet assets.
|
During 2010, in view of the age of 4 Boeing 757-200 aircraft in Xiamen Airlines Company Limited (“Xiamen Airlines”)’s fleet of Boeing 757-200 aircraft, Xiamen Airlines determined to dispose of these aircraft and commenced its process of seeking buyers for these aircraft. As a result, Xiamen Airlines assessed the recoverable amounts of these aircraft and the carrying amount of these aircraft was written down by RMB109 million. The estimates of recoverable amounts were based on the assets’ fair value less cost to sell, determined by reference to the recent observable market prices for the aircraft fleet and related fleet assets.
In prior years, the Group determined to dispose of the Group’s fleet of Boeing 777-200A, MD90 and ATR72 aircraft and these aircraft and related assets’ carrying amounts were written down to their recoverable amounts. The recoverable amounts of these aircraft and related assets as at December 31, 2010 were reviewed by the Group and the carrying amounts of the aircraft and related assets were further written down by RMB102 million. The estimates of recoverable amounts were based on the assets’ fair value less costs to sell, determined by reference to the recent observable market prices for the aircraft fleet and related fleet assets.
|
21
|
Construction in progress
|
|
2010
|
2009
|
|||||||
|
RMB million
|
RMB million
|
|||||||
|
At January 1
|
18,059 | 17,321 | ||||||
|
Additions
|
6,068 | 9,070 | ||||||
|
Transferred to property, plant and equipment (Note 20)
|
(13,765 | ) | (8,315 | ) | ||||
|
Transferred to lease prepayment and other assets upon completion of development
|
(293 | ) | (17 | ) | ||||
|
At December 31
|
10,069 | 18,059 | ||||||
The construction in progress as at December 31, 2010 mainly related to advance payments for acquisition of aircraft and flight equipment and progress payments for other construction projects at the Fuzhou Linpu base, Xiamen Yuan Quan pilot apartment, Dalian and Fuzhou airports and Shenyang aircraft maintenance warehouse.
As at December 31, 2010, advance payments for acquisition of aircraft of the Group of approximately RMB2,869 million (2009: RMB7,601 million) were mortgaged under certain loan agreements (Note 33).
F - 44
|
22
|
Interest in associates
|
|
2010
|
2009
|
|||||||
|
RMB million
|
RMB million
|
|||||||
|
Share of net assets
|
309 | 257 | ||||||
The details of the Group’s principal associates are set out in Note 57, all of which are unlisted corporate entities.
During 2010, CSAHC injected capital of RMB39 million to Southern Airlines Culture and Media Co., Ltd. (“SACM”), which diluted the Company’s equity interests in SACM from 50% to 40%. Summary of financial information on associates:
|
100 Percent
|
Group’s effective interest
|
|||||||||||||||||||||||
|
2010
|
2009
|
2008
|
2010
|
2009
|
2008
|
|||||||||||||||||||
|
RMB
|
RMB
|
RMB
|
RMB
|
RMB
|
RMB
|
|||||||||||||||||||
|
million
|
million
|
million
|
million
|
million
|
million
|
|||||||||||||||||||
|
Non-current assets
|
13,026 | 11,190 | 4,909 | 4,210 | ||||||||||||||||||||
|
Current assets
|
4,802 | 3,597 | 1,275 | 986 | ||||||||||||||||||||
|
Non-current liabilities
|
(6,975 | ) | (7,347 | ) | (2,718 | ) | (2,861 | ) | ||||||||||||||||
|
Current liabilities
|
(9,993 | ) | (6,837 | ) | (3,286 | ) | (2,229 | ) | ||||||||||||||||
|
Net assets
|
860 | 603 | 180 | 106 | ||||||||||||||||||||
|
Net liabilities not shared by the Group
|
129 | 151 | ||||||||||||||||||||||
| 309 | 257 | |||||||||||||||||||||||
|
Revenue
|
9,924 | 7,123 | 5,761 | 3,843 | 2,750 | 2,234 | ||||||||||||||||||
|
Expenses
|
(9,706 | ) | (7,009 | ) | (6,071 | ) | (3,765 | ) | (2,715 | ) | (2,312 | ) | ||||||||||||
|
Profit / (loss) for the year
|
218 | 114 | (310 | ) | 78 | 35 | (78 | ) | ||||||||||||||||
|
Net (profit) / loss not shared by the Group
|
(22 | ) | 34 | 66 | ||||||||||||||||||||
|
The Group’s share of associates’ results
|
56 | 69 | (12 | ) | ||||||||||||||||||||
During 2010, an associate of the Group was in a net liability position. The Group only shared its accumulated losses up to the Group’s investment cost in the associate.
F - 45
|
23
|
Interest in jointly controlled entities
|
|
2010
|
2009
|
|||||||
|
RMB million
|
RMB million
|
|||||||
|
Share of net assets
|
863 | 728 | ||||||
The details of the Group’s principal jointly controlled entities are set out in Note 57, all of which are unlisted corporate entities.
During 2010, a third party company injected certain capital to China Southern West Australian Flying College Pty Ltd. (“Flying College”). This diluted the Company’s interest in Flying College from 91% to 48.12%. Flying College became a jointly controlled entity of the Company since then.
The retained non-controlling equity interest in Flying College was remeasured to its fair value at the date when control was lost and a gain on deemed disposal of a subsidiary of RMB17 million was recorded during 2010. The Company’s equity interests in Flying College with a carrying amount of RMB33 million was reclassified as interest in jointly controlled entity.
Summary of financial information on jointly controlled entities:
|
Group’s effective interest
|
||||||||||||
|
2010
|
2009
|
2008
|
||||||||||
|
RMB million
|
RMB million
|
RMB million
|
||||||||||
|
Non-current assets
|
806 | 812 | ||||||||||
|
Current assets
|
691 | 547 | ||||||||||
|
Non-current liabilities
|
(207 | ) | (231 | ) | ||||||||
|
Current liabilities
|
(427 | ) | (400 | ) | ||||||||
|
Net assets
|
863 | 728 | ||||||||||
|
Revenue
|
943 | 1,973 | 2,382 | |||||||||
|
Expenses
|
(831 | ) | (1,759 | ) | (2,212 | ) | ||||||
|
Profit for the year
|
112 | 214 | 170 | |||||||||
|
24
|
Other investments in equity securities
|
|
2010
|
2009
|
|||||||
|
RMB million
|
RMB million
|
|||||||
|
Unlisted equity securities, at cost
|
166 | 166 | ||||||
Dividend income from unlisted securities of the Group amounted to RMB11 million during the year ended December 31, 2010 (2009: RMB10 million; 2008: RMB13 million).
F - 46
|
25
|
Available-for-sale equity securities
|
|
2010
|
2009
|
|||||||
|
RMB million
|
RMB million
|
|||||||
|
Available-for-sale equity securities
|
||||||||
|
- Listed in the PRC
|
80 | 93 | ||||||
|
Market value of listed securities
|
80 | 93 | ||||||
Dividend income from listed securities of the Group amounted to RMB2 million during the year ended December 31, 2010 (2009: RMB2 million; 2008: RMB1 million).
|
26
|
Deferred tax assets / (liabilities)
|
|
(a)
|
Movements of net deferred tax assets / (liabilities) are as follows:
|
|
2010
|
2009
|
|||||||
|
RMB million
|
RMB million
|
|||||||
|
At January 1
|
(374 | ) | (594 | ) | ||||
|
Credited to profit or loss (Note 16(a))
|
456 | 185 | ||||||
|
Credited / (charged) to other comprehensive income (Note 17(b))
|
3 | (9 | ) | |||||
|
Transferred to income tax payable
|
- | 44 | ||||||
|
At December 31
|
85 | (374 | ) | |||||
F - 47
|
26
|
Deferred tax assets / (liabilities) (continued)
|
|
(b)
|
The components of deferred tax assets / (liabilities) recognized are analysed as follows:
|
|
2010
|
2009
|
|||||||
|
RMB million
|
RMB million
|
|||||||
|
Deferred tax assets:
|
||||||||
|
Accrued expenses
|
802 | 490 | ||||||
|
Deferred revenue
|
334 | 118 | ||||||
|
Provision for impairment losses
|
127 | 109 | ||||||
|
Others
|
61 | 52 | ||||||
|
Total deferred tax assets
|
1,324 | 769 | ||||||
|
Deferred tax liabilities:
|
||||||||
|
Accrued expenses
|
(390 | ) | (334 | ) | ||||
|
Depreciation allowances in excess of the related depreciation
|
(781 | ) | (672 | ) | ||||
|
Change in fair value of available-for-sale equity securities
|
(14 | ) | (17 | ) | ||||
|
Asset classified as held for sale
|
- | (67 | ) | |||||
|
Others
|
(54 | ) | (53 | ) | ||||
|
Total deferred tax liabilities
|
(1,239 | ) | (1,143 | ) | ||||
|
Net deferred tax assets / (liabilities)
|
85 | (374 | ) | |||||
| 2010 | 2009 | |||||||
|
RMB million
|
RMB million
|
|||||||
|
Net deferred tax asset recognized on the consolidated balance sheet
|
997 | 479 | ||||||
|
Net deferred tax liability recognized on the consolidated balance sheet
|
(912 | ) | (853 | ) | ||||
| 85 | (374 | ) | ||||||
F - 48
|
26
|
Deferred tax assets / (liabilities) (continued)
|
|
(c)
|
Deferred tax assets not recognized
|
At December 31, 2010, deferred tax assets were not recognized in relation to certain unused tax losses and other deductible temporary differences. The unrecognized unused tax losses and deductible temporary differences are analysed as follows:
|
2010
|
2009
|
|||||||
|
RMB
|
RMB
|
|||||||
|
million
|
million
|
|||||||
|
Tax losses
|
574 | 1,720 | ||||||
|
Other deductible temporary differences:
|
||||||||
|
- Accrued expenses
|
168 | 499 | ||||||
|
- Provision for impairment losses
|
1,861 | 1,916 | ||||||
| 2,029 | 2,415 | |||||||
| 2,603 | 4,135 | |||||||
At December 31, 2010, the Group’s deductible temporary differences amounting to RMB2,029 million (2009: RMB2,415 million) have not been recognized as deferred tax assets as it was determined by management that it is not probable that future taxable profits will be available when these deductible temporary differences reverse in the foreseeable future.
Tax losses in the PRC are available for carry forward to set off future assessable income for a maximum period of five years. The Group’s unused tax losses of RMB574 million (2009: RMB1,720 million) have not been recognized as deferred tax assets, as it was determined by management that it is not probable that future taxable profits against which the losses can be utilised will be available before they expire. The expiry dates of unrecognized unused tax losses are analysed as follows:
|
2010
|
2009
|
|||||||
|
RMB million
|
RMB million
|
|||||||
|
Expiring in:
|
||||||||
|
2011
|
23 | 309 | ||||||
|
2012
|
13 | 92 | ||||||
|
2013
|
370 | 373 | ||||||
|
2014
|
168 | 946 | ||||||
| 574 | 1,720 | |||||||
F - 49
|
27
|
Other assets
|
Other assets of the Group mainly include lump sum housing benefits (Note 46(b)(i)), computer software used for airline operation and prepayment for exclusive use right of an airport terminal.
Movements of lump sum housing benefits, computer software and prepayment for exclusive use right of an airport terminal are as follows:
|
Prepayment
|
||||||||||||
|
for exclusive
|
||||||||||||
|
Lump sum
|
use right of
|
|||||||||||
|
housing
|
Computer
|
an airport
|
||||||||||
|
benefits
|
software
|
terminal
|
||||||||||
|
RMB million
|
RMB million
|
RMB million
|
||||||||||
|
At January 1, 2009
|
93 | 109 | 150 | |||||||||
|
Additions
|
- | 32 | 150 | |||||||||
|
Amortisation for the year
|
(26 | ) | (45 | ) | - | |||||||
|
At December 31, 2009
|
67 | 96 | 300 | |||||||||
|
At January 1, 2010
|
67 | 96 | 300 | |||||||||
|
Additions
|
- | 6 | - | |||||||||
|
Transferred from construction in progress
|
- | 39 | - | |||||||||
|
Amortisation for the year
|
(26 | ) | (48 | ) | (10 | ) | ||||||
|
At December 31, 2010
|
41 | 93 | 290 | |||||||||
|
28
|
Inventories
|
|
2010
|
2009
|
|||||||
|
RMB million
|
RMB million
|
|||||||
|
Expendable spare parts and maintenance materials
|
1,219 | 1,112 | ||||||
|
Other supplies
|
136 | 144 | ||||||
| 1,355 | 1,256 | |||||||
The analysis of the amount of inventories recognized as an expense and included in profit or loss is as follows:
|
2010
|
2009
|
2008
|
||||||||||
|
RMB million
|
RMB million
|
RMB million
|
||||||||||
|
Consumption
|
1,040 | 887 | 828 | |||||||||
|
Write-down of inventories
|
8 | 30 | 189 | |||||||||
| 1,048 | 917 | 1,017 | ||||||||||
Inventories have been written down as a result of fleet adjustments during the current and prior years.
F - 50
|
29
|
Trade receivables
|
|
2010
|
2009
|
|||||||
|
RMB million
|
RMB million
|
|||||||
|
Trade receivables
|
2,022 | 1,389 | ||||||
|
Allowance for doubtful debts
|
(30 | ) | (30 | ) | ||||
| 1,992 | 1,359 | |||||||
|
(a)
|
Ageing analysis
|
Credit terms granted by the Group to sales agents and other customers generally range from one to three months. An ageing analysis of trade receivables, net of allowance for doubtful debts, is set out below:
|
2010
|
2009
|
|||||||
|
RMB million
|
RMB million
|
|||||||
|
Within 1 month
|
1,829 | 1,191 | ||||||
|
More than 1 month but less than 3 months
|
134 | 147 | ||||||
|
More than 3 months but less than 12 months
|
29 | 21 | ||||||
| 1,992 | 1,359 | |||||||
All of the trade receivables are expected to be recovered within one year.
|
(b)
|
Impairment of trade receivables
|
Impairment loss in respect of trade receivables is recorded using an allowance account unless the Group is satisfied that recovery of the amount is remote, in which case the impairment loss is written off against trade receivables directly.
The movements in the allowance for doubtful debts during the year are as follows:
|
2010
|
2009
|
|||||||
|
RMB million
|
RMB million
|
|||||||
|
At January 1
|
30 | 31 | ||||||
|
Impairment loss recognized
|
- | 14 | ||||||
|
Impairment loss written back
|
- | (13 | ) | |||||
|
Uncollectible amounts written off
|
- | (2 | ) | |||||
|
At December 31
|
30 | 30 | ||||||
|
(c)
|
Trade receivables that are not impaired
|
The ageing analysis of trade receivables that is neither individually nor collectively considered to be impaired is as follows:
|
2010
|
2009
|
|||||||
|
RMB million
|
RMB million
|
|||||||
|
Neither past due nor impaired
|
1,963 | 1,338 | ||||||
Trade receivables that were neither past due nor impaired relate to customers for whom there was no recent history of default.
F - 51
|
30
|
Cash and cash equivalents
|
|
(a)
|
Cash and cash equivalents comprise:
|
|
2010
|
2009
|
|||||||
|
RMB million
|
RMB million
|
|||||||
|
Deposits with banks
|
7,445 | 1,116 | ||||||
|
Cash at bank and in hand
|
2,959 | 3,227 | ||||||
|
Cash and cash equivalents in the consolidated balance sheet
|
10,404 | 4,343 | ||||||
Southern Airlines Group Finance Company Limited (“SA Finance”) is a PRC authorised financial institution controlled by CSAHC and is an associate of the Group. In accordance with the financial agreement dated May 22, 1997, as revised subsequently on December 31, 2004 and November 15, 2007 between the Company and SA Finance, all of the Group’s deposits accepted by SA Finance would be simultaneously placed with several designated major PRC banks by SA Finance. As at December 31, 2010, the Group’s deposits with SA Finance amounted to RMB1,111 million (2009: RMB862 million) (Note 45(d)).
F - 52
|
30
|
Cash and cash equivalents (continued)
|
|
(b)
|
Reconciliation of profit / (loss) before taxation to cash generated from operations:
|
|
2010
|
2009
|
2008
|
||||||||||||
|
Note
|
RMB million
|
RMB million
|
RMB million
|
|||||||||||
|
Profit / (loss) before taxation
|
8,093 | 432 | (4,724 | ) | ||||||||||
|
Depreciation of property, plant and equipment
|
20
|
7,025 | 5,962 | 5,759 | ||||||||||
|
Other amortisation
|
11
|
107 | 80 | 58 | ||||||||||
|
Amortisation of deferred benefits and gains
|
11
|
(71 | ) | (71 | ) | (71 | ) | |||||||
|
Impairment loss on property, plant and equipment
|
20
|
212 | 26 | 1,884 | ||||||||||
|
Share of associates’ results
|
22
|
(56 | ) | (69 | ) | 12 | ||||||||
|
Share of jointly controlled entities’ results
|
23
|
(112 | ) | (214 | ) | (170 | ) | |||||||
|
Loss / (gain) on sale of property, plant and equipment, net
|
13
|
9 | (31 | ) | 59 | |||||||||
|
Gain on sale of available-for-sale equity securities
|
13
|
- | (78 | ) | - | |||||||||
|
Gain on sale of jointly controlled entities
|
31
|
(1,078 | ) | - | (143 | ) | ||||||||
|
Gain on deemed disposal of equity interest in a subsidiary
|
23
|
(17 | ) | - | - | |||||||||
|
Gain on sale of equity interest in subsidiaries
|
- | - | (37 | ) | ||||||||||
|
Interest income
|
(93 | ) | (68 | ) | (103 | ) | ||||||||
|
Interest expense
|
14
|
1,265 | 1,497 | 1,987 | ||||||||||
|
Loss / (gain) on derivative financial instruments, net
|
30 | (45 | ) | 124 | ||||||||||
|
Dividend income from other investments in equity securities
|
(13 | ) | (14 | ) | (14 | ) | ||||||||
|
Unrealised exchange gain, net
|
(1,673 | ) | (70 | ) | (2,649 | ) | ||||||||
|
Increase in inventories
|
(107 | ) | (27 | ) | (16 | ) | ||||||||
|
(Increase) / decrease in trade receivables
|
(647 | ) | (42 | ) | 649 | |||||||||
|
Decrease / (increase) in other receivables
|
14 | (15 | ) | 203 | ||||||||||
|
Decrease / (increase) in prepaid expenses and other current assets
|
130 | (91 | ) | (28 | ) | |||||||||
|
Increase / (decrease) in net amounts due to related companies
|
74 | (48 | ) | 15 | ||||||||||
|
(Decrease) / increase in trade and bills payable
|
(3,109 | ) | 3,639 | (491 | ) | |||||||||
|
Increase / (decrease) in sales in advance of carriage
|
1,408 | (48 | ) | 353 | ||||||||||
|
Increase / (decrease) in accrued expenses
|
1,199 | (49 | ) | 1,274 | ||||||||||
|
(Decrease) / increase in other liabilities
|
(200 | ) | 353 | (36 | ) | |||||||||
|
Increase in deferred revenue
|
438 | 204 | 116 | |||||||||||
|
Increase in provision for major overhauls
|
220 | 8 | 262 | |||||||||||
|
Decrease in provision for early retirement benefits
|
(30 | ) | (31 | ) | (51 | ) | ||||||||
|
Increase in deferred benefits and gains
|
6 | 42 | 34 | |||||||||||
|
Cash generated from operations
|
13,024 | 11,232 | 4,256 | |||||||||||
F - 53
|
31
|
Asset classified as held for sale
|
|
2010
|
2009
|
|||||||
|
RMB million
|
RMB million
|
|||||||
|
Share of net assets
|
- | 529 | ||||||
In 2009, the Company entered into an agreement with CSAHC to dispose of its entire equity interest in MTU Maintenance Zhuhai Co., Ltd. (“MTU”) with carrying amount of RMB529 million to CSAHC. As at December 31, 2009, the investment in MTU was classified as asset held for sale. The sale was completed in February 2010 and the Company recorded a gain of RMB1,078 million in 2010.
|
32
|
Financial liabilities
|
|
2010
|
2009
|
|||||||
|
RMB million
|
RMB million
|
|||||||
|
Foreign exchange forward option contracts
|
13 | 44 | ||||||
Further disclosure of the financial derivative instruments are set out in Notes 49(c) and (f).
|
33
|
Bank and other loans
|
|
(a)
|
At December 31, 2010, bank and other loans were repayable as follows:
|
|
2010
|
2009
|
|||||||
|
RMB million
|
RMB million
|
|||||||
|
Within 1 year or on demand
|
9,324 | 17,452 | ||||||
|
After 1 year but within 2 years
|
10,533 | 8,223 | ||||||
|
After 2 years but within 5 years
|
11,432 | 12,038 | ||||||
|
After 5 years
|
9,911 | 7,614 | ||||||
| 31,876 | 27,875 | |||||||
| 41,200 | 45,327 | |||||||
F - 54
|
33
|
Bank and other loans (continued)
|
|
(b)
|
At December 31, 2010, bank and other loans are analysed as follows:
|
|
2010
|
2009
|
|||||||
|
RMB million
|
RMB million
|
|||||||
|
Short-term bank loans
|
3,568 | 11,012 | ||||||
|
Long-term bank and other loans due within one year (classified as current liabilities)
|
5,756 | 6,440 | ||||||
| 9,324 | 17,452 | |||||||
|
Long-term bank and other loans due after one year (classified as non-current liabilities)
|
31,876 | 27,875 | ||||||
| 41,200 | 45,327 | |||||||
|
Representing:
|
||||||||
|
Bank loans
|
41,197 | 45,324 | ||||||
|
Other loans
|
3 | 3 | ||||||
| 41,200 | 45,327 | |||||||
|
(c)
|
As at December 31, 2010, the Group’s weighted average interest rate on short-term borrowings was 1.78% per annum (2009: 1.18% per annum).
|
F - 55
|
33
|
Bank and other loans (continued)
|
|
(d)
|
Details of bank and other loans with original maturity over one year are as follows:
|
|
2010
|
2009
|
|||||||
|
RMB million
|
RMB million
|
|||||||
|
Renminbi denominated loans
|
||||||||
|
Non-interest bearing loan from a municipal government authority
|
3 | 3 | ||||||
|
Floating interest rates ranging from 90% of benchmark interest rate (stipulated by PBOC) as at December 31, 2010, with maturities through 2013
|
832 | 5,660 | ||||||
|
United States Dollars denominated loans
|
||||||||
|
Fixed interest rates ranging from 3.00% to 7.20% per annum as at December 31, 2010, with maturities through 2017
|
1,347 | 772 | ||||||
|
Floating interest rates ranging from 1-month LIBOR + 0.50% to 2.20% per annum as at December 31, 2010, with maturities through 2020
|
4,677 | 4,681 | ||||||
|
Floating interest rates ranging from 3-month LIBOR + 0.50% to 2.20% per annum as at December 31, 2010, with maturities through 2020
|
21,376 | 13,937 | ||||||
|
Floating interest rates ranging from 6-month LIBOR + 0.30% to 3.15% per annum as at December 31, 2010, with maturities through 2020
|
9,397 | 9,262 | ||||||
| 37,632 | 34,315 | |||||||
|
Less: loans due within one year classified as current liabilities
|
(5,756 | ) | (6,440 | ) | ||||
| 31,876 | 27,875 | |||||||
F - 56
|
33
|
Bank and other loans (continued)
|
|
(e)
|
The remaining contractual maturities at the end of the reporting period of the Group’s bank and other loans, which are based on contractual undiscounted cash flows (including interest payments computed using contractual rates, or if floating, based on rates current at the end of the reporting period) and the earliest date the Group can be required to pay, are as follows:
|
|
2010
|
2009
|
|||||||
|
RMB million
|
RMB million
|
|||||||
|
Contractual undiscounted cash flows
|
||||||||
|
Within 1 year
|
9,974 | 18,141 | ||||||
|
After 1 year but within 2 years
|
10,997 | 8,640 | ||||||
|
After 2 years but within 5 years
|
12,201 | 12,461 | ||||||
|
After 5 years
|
10,294 | 7,866 | ||||||
| 43,466 | 47,108 | |||||||
|
|
41,200 | 45,327 | ||||||
|
(f)
|
As at December 31, 2010, bank and other loans of the Group totaling RMB22,060 million (2009: RMB17,677 million) were secured by mortgages over certain of the Group’s aircraft and advance payments for aircraft with aggregate carrying amount of RMB28,823 million (2009: RMB23,996 million).
|
|
(g)
|
As at December 31, 2010, certain bank and other loans were guaranteed by the following parties:
|
|
2010
|
2009
|
|||||||
|
RMB million
|
RMB million
|
|||||||
|
Guarantors
|
||||||||
|
Export-Import Bank of the United States
|
21 | 149 | ||||||
|
CSAHC (Note 45(e))
|
364 | 512 | ||||||
| 385 | 661 | |||||||
|
(h)
|
As at December 31, 2010, loans to the Group from SA Finance amounted to RMB520 million (2009: RMB819 million) (Note 45(d)).
|
|
(i)
|
The Group has significant bank and other loans balances as well as obligations under finance leases (Note 34) which are denominated in US dollars as at December 31, 2010. The net exchange gain of RMB1,746 million (2009: RMB93 million; 2008: RMB2,592 million) recorded by the Group was mainly attributable to the exchange gain arising from retranslation and settlement of bank and other loans balances and finance lease obligations denominated in US dollars. The foreign currency risk is further discussed in Note 49(c).
|
|
(j)
|
As at December 31, 2010, a long-term loan of RMB10 million (2009: RMB10 million) was granted by SA Finance to a subsidiary of the Company. The loan was secured by the trade receivables of the subsidiary due from the Company during the loan period. As at December 31, 2010, the balance of the trade receivables of the subsidiary due from the Company amounted to RMB28 million (2009: RMB21 million).
|
F - 57
|
34
|
Obligations under finance leases
|
The Group have commitments under finance lease agreements in respect of aircraft and related equipment. The majority of these leases have terms of 10 to 12 years expiring during the years 2011 to 2022. As at December 31, 2010, future payments under these finance leases are as follows:
|
2010
|
2009
|
|||||||||||||||||||||||
|
Present
|
Total
|
Present
|
Total
|
|||||||||||||||||||||
|
value of the
|
Minimum
|
value of the
|
minimum
|
|||||||||||||||||||||
|
minimum lease
|
lease
|
minimum lease
|
lease
|
|||||||||||||||||||||
|
payments
|
payments
|
Interest
|
payments
|
payments
|
Interest
|
|||||||||||||||||||
|
RMB
|
RMB
|
RMB
|
RMB
|
RMB
|
RMB
|
|||||||||||||||||||
|
million
|
million
|
million
|
million
|
million
|
million
|
|||||||||||||||||||
|
Within 1 year
|
1,654 | 2,015 | 361 | 1,431 | 1,972 | 541 | ||||||||||||||||||
|
After 1 year but within 2 years
|
1,601 | 1,916 | 315 | 1,495 | 1,970 | 475 | ||||||||||||||||||
|
After 2 years but within 5 years
|
5,043 | 5,701 | 658 | 4,240 | 5,274 | 1,034 | ||||||||||||||||||
|
After 5 years
|
6,132 | 6,289 | 157 | 6,152 | 6,596 | 444 | ||||||||||||||||||
| 14,430 | 15,921 | 1,491 | 13,318 | 15,812 | 2,494 | |||||||||||||||||||
|
Less: balance due within one year classified as current liabilities
|
(1,654 | ) | (1,431 | ) | ||||||||||||||||||||
| 12,776 | 11,887 | |||||||||||||||||||||||
F - 58
|
34
|
Obligations under finance leases (continued)
|
Details of obligations under finance leases are as follows:
|
2010
|
2009
|
|||||||
|
RMB million
|
RMB million
|
|||||||
|
United States Dollars denominated obligations
|
||||||||
|
Fixed interest rates ranging from 4.24% to 6.01% per annum as at December 31, 2010
|
6,067 | 7,035 | ||||||
|
Floating interest rates ranging from 3-month LIBOR + 0.55% to 3% per annum as at December 31, 2010
|
4,796 | 2,172 | ||||||
|
Floating interest rates ranging from 6-month LIBOR + 0.03% to 1.05% per annum as at December 31, 2010
|
3,567 | 4,111 | ||||||
| 14,430 | 13,318 | |||||||
Under the terms of the leases, the Group has an option to purchase, at or near the end of the lease term, certain aircraft and related equipment at either fair market value or a percentage of the respective lessor’s defined cost.
Security, including charges over the assets concerned and relevant insurance policies, is provided to the lessors. As at December 31, 2010, certain of the Group’s aircraft with carrying amount of RMB20,240 million (2009: RMB17,989 million) were mortgaged to secure finance lease obligations totalling RMB14,430 million (2009: RMB13,318 million).
|
35
|
Trade and bills payable
|
|
2010
|
2009
|
|||||||
|
RMB million
|
RMB million
|
|||||||
|
Bills payable
|
104 | 3,207 | ||||||
|
Trade payables
|
1,773 | 1,785 | ||||||
| 1,877 | 4,992 | |||||||
F - 59
|
35
|
Trade and bills payable (continued)
|
The following is the ageing analysis of trade and bills payable:
|
2010
|
2009
|
|||||||
|
RMB million
|
RMB million
|
|||||||
|
Within 1 month
|
1,261 | 1,873 | ||||||
|
More than 1 month but less than 3 months
|
337 | 1,545 | ||||||
|
More than 3 months but less than 6 months
|
240 | 1,566 | ||||||
|
More than 6 months but less than 1 year
|
12 | 8 | ||||||
|
More than 1 year
|
27 | - | ||||||
| 1,877 | 4,992 | |||||||
|
36
|
Deferred revenue
|
|
2010
|
2009
|
|||||||
|
RMB million
|
RMB million
|
|||||||
|
Current portion
|
524 | 316 | ||||||
|
Non-current portion
|
824 | 594 | ||||||
| 1,348 | 910 | |||||||
Deferred revenue represents the unredeemed frequent flyer revenue.
|
37
|
Amounts due from/to related companies
|
|
(a)
|
Amounts due from related companies
|
|
2010
|
2009
|
|||||||
|
RMB million
|
RMB million
|
|||||||
|
CSAHC and its affiliates (Note 45(c))
|
12 | 6 | ||||||
|
An associate (Note 45(c))
|
16 | 14 | ||||||
|
Jointly controlled entities (Note 45(c))
|
110 | 31 | ||||||
| 138 | 51 | |||||||
The amounts due from related companies are unsecured, interest free and have no fixed terms of repayment. They are expected to be recovered within one year.
|
(b)
|
Amounts due to related companies
|
|
2010
|
2009
|
|||||||
|
RMB million
|
RMB million
|
|||||||
|
CSAHC and its affiliates (Note 45(c))
|
139 | 43 | ||||||
|
An associate (Note 45(c))
|
27 | - | ||||||
|
Jointly controlled entities (Note 45(c))
|
80 | 51 | ||||||
| 246 | 94 | |||||||
The amounts due to related companies are unsecured, interest free and have no fixed terms of repayment. They are expected to be settled within one year.
F - 60
|
38
|
Accrued expenses
|
|
2010
|
2009
|
|||||||
|
RMB million
|
RMB million
|
|||||||
|
Jet fuel costs
|
1,727 | 1,368 | ||||||
|
Air catering expenses
|
150 | 115 | ||||||
|
Salaries and welfare
|
1,970 | 1,545 | ||||||
|
Repairs and maintenance
|
1,959 | 1,827 | ||||||
|
Provision for major overhauls (Note 40)
|
223 | 503 | ||||||
|
Provision for early retirement benefits (Note 41)
|
52 | 57 | ||||||
|
Landing and navigation fees
|
2,295 | 1,899 | ||||||
|
Computer reservation services
|
545 | 518 | ||||||
|
Interest expenses
|
123 | 146 | ||||||
|
Others
|
286 | 175 | ||||||
| 9,330 | 8,153 | |||||||
|
39
|
Other liabilities
|
|
2010
|
2009
|
|||||||
|
RMB million
|
RMB million
|
|||||||
|
CAAC Infrastructure Development Fund, airport construction surcharge and airport tax payable
|
760 | 1,052 | ||||||
|
Construction cost payable
|
714 | 154 | ||||||
|
Advance payments on chartered flights
|
73 | 71 | ||||||
|
Sales agent deposits
|
282 | 224 | ||||||
|
Other taxes payable
|
493 | 611 | ||||||
|
Others
|
1,446 | 1,264 | ||||||
| 3,768 | 3,376 | |||||||
|
40
|
Provision for major overhauls
|
Details of provision for major overhauls in respect of aircraft held under operating leases are as follows:
|
2010
|
2009
|
|||||||
|
RMB million
|
RMB million
|
|||||||
|
At January 1
|
1,456 | 1,354 | ||||||
|
Provision for the year
|
462 | 398 | ||||||
|
Provision utilised during the year
|
(522 | ) | (296 | ) | ||||
|
At December 31
|
1,396 | 1,456 | ||||||
|
Less: current portion included in accrued expenses (Note 38)
|
(223 | ) | (503 | ) | ||||
| 1,173 | 953 | |||||||
F - 61
|
41
|
Provision for early retirement benefits
|
Details of provision for early retirement benefits in respect of obligations to early retired employees are as follows:
|
2010
|
2009
|
|||||||
|
RMB million
|
RMB million
|
|||||||
|
At January 1
|
205 | 247 | ||||||
|
Provision for the year (Note 12)
|
29 | 6 | ||||||
|
Financial costs (Note 14)
|
8 | 14 | ||||||
|
Payments made during the year
|
(75 | ) | (80 | ) | ||||
|
Effect of changes in discount rate
|
3 | 18 | ||||||
|
At December 31
|
170 | 205 | ||||||
|
Less: current portion included in accrued expenses (Note 38)
|
(52 | ) | (57 | ) | ||||
| 118 | 148 | |||||||
The Group has implemented an early retirement plan for certain employees. The benefits of the early retirement plan are calculated based on factors including the remaining number of years of services from the date of early retirement to the normal retirement date and the salary amount on the date of early retirement of the employees. The present value of the future cash flows expected to be required to settle the obligations is recognized as provision for early retirement benefits.
|
42
|
Deferred benefits and gains
|
|
2010
|
2009
|
|||||||
|
RMB million
|
RMB million
|
|||||||
|
Leases rebates (Note (i))
|
723 | 801 | ||||||
|
Gains on sale and leaseback (Note (ii))
|
197 | 222 | ||||||
|
Others
|
95 | 57 | ||||||
| 1,015 | 1,080 | |||||||
Notes:
|
|
(i)
|
The Company was granted certain cash rebates by the lessors under certain lease arrangements when it fulfilled certain requirements. The rebates were deferred and amortised using the straight-line method over the residual lease terms.
|
|
|
(ii)
|
The Company entered into sale and leaseback transactions which result in operating leases with certain third parties. The gains were deferred and amortised over the lease terms of these aircraft.
|
F - 62
|
43
|
Share capital and capital management
|
|
(a)
|
Share capital
|
|
2010
|
2009
|
|||||||
|
RMB million
|
RMB million
|
|||||||
|
Registered, issued and paid up capital:
|
||||||||
|
845,050,000 domestic state-owned shares with selling restrictions of RMB1.00 each (2009: 4,021,150,000 shares of RMB1.00 each)
|
845 | 4,021 | ||||||
|
3,300,000,000 domestic state-owned shares of RMB 1.00 each (2009: nil)
|
3,300 | - | ||||||
|
1,377,600,000 A shares with selling restrictions of RMB1.00 each (2009: nil)
|
1,378 | - | ||||||
|
1,500,000,000 A shares of RMB1.00 each (2009: 1,500,000,000 shares of RMB1.00 each)
|
1,500 | 1,500 | ||||||
|
2,794,917,000 H shares of RMB1.00 each (2009: 2,482,417,000 shares of RMB1.00 each)
|
2,795 | 2,482 | ||||||
| 9,818 | 8,003 | |||||||
On August 20, 2009 and August 21, 2009, the Company issued 721,150,000 A shares to CSAHC and 721,150,000 H shares to Nan Lung, a wholly-owned subsidiary of CSAHC, for net cash considerations of RMB2,259 million and RMB721 million, respectively (Note 45(c)(xiii)). The A shares and H shares are subject to a lock-up period to August 20, 2012 and August 21, 2010, respectively.
The 3,300,000,000 domestic state-owned shares were subject to a lock-up period to August 2010 and became listed and tradable since then.
On October 29, 2010, the Company issued 123,900,000 A shares to CSAHC and 1,377,600,000 A shares to certain third party investors for net cash considerations of RMB812 million and RMB9,026 million, respectively. The A shares issued to CSAHC and certain third party investors are subject to a lock-up period to November 1, 2013 and November 1, 2011, respectively.
On November 1, 2010, the Company issued 312,500,000 H shares to Nan Lung, for a net cash consideration of RMB734 million.
All the domestic state-owned, H and A shares rank pari passu in all material respects.
F - 63
|
43
|
Share capital and capital management (continued)
|
|
(b)
|
Capital management
|
The Group’s primary objectives in managing capital are to safeguard its ability to continue as a going concern, and to generate sufficient profit to maintain growth and provide returns to its shareholders, by securing access to finance at a reasonable cost.
The Group manages the amount of capital in proportion to risk and managing its debt portfolio in conjunction with projected financing requirements. The Group monitors capital on the basis of the debt to equity ratio, which is calculated as net debt as a percentage of the total equity where net debt is represented by the aggregate of bank and other loans, obligations under finance leases, trade and bills payable, sales in advance of carriage, amounts due to related companies, accrued expenses and other liabilities less cash and cash equivalents.
There was no change in the Group’s approach to capital management during 2010 as compared with previous years. Neither the Company nor any of its subsidiaries are subject to externally imposed capital requirements. The Group’s debt to equity ratio decreased to 212% at December 31, 2010 (2009: 551%) which is mainly because of the issuance of shares during the year.
F - 64
|
44
|
Reserves
|
|
2010
|
2009
|
|||||||
|
RMB million
|
RMB million
|
|||||||
|
Share premium
|
||||||||
|
At January 1
|
4,676 | 3,138 | ||||||
|
Issue of shares (Note 43)
|
8,757 | 1,538 | ||||||
|
At December 31
|
13,433 | 4,676 | ||||||
|
Fair value reserve
|
||||||||
|
At January 1
|
37 | 18 | ||||||
|
Change in fair value of available-for-sale equity securities
|
(6 | ) | 19 | |||||
|
At December 31
|
31 | 37 | ||||||
|
Statutory surplus reserve
(Note (a))
|
||||||||
|
At January 1 and at December 31
|
526 | 526 | ||||||
|
Discretionary surplus reserve
|
||||||||
|
At January 1 and at December 31
|
77 | 77 | ||||||
|
Other reserve
|
||||||||
|
At January 1
|
151 | 150 | ||||||
|
Government contributions (Note (c))
|
2 | 1 | ||||||
|
At December 31
|
153 | 151 | ||||||
|
Retained profits / (accumulated losses)
|
||||||||
|
At January 1
|
(3,119 | ) | (3,449 | ) | ||||
|
Profit for the year
|
5,795 | 330 | ||||||
|
At December 31
|
2,676 | (3,119 | ) | |||||
|
Total
|
16,896 | 2,348 | ||||||
F - 65
|
44
|
Reserves (continued)
|
|
(a)
|
According to the PRC Company Law and the Articles of Association of the Company and certain of its subsidiaries, the Company and the relevant subsidiaries are required to transfer 10% of their annual net profits after taxation, as determined under the PRC accounting rules and regulations, to a statutory surplus reserve until the reserve balance reaches 50% of the registered capital. The transfer to this reserve must be made before distribution of a dividend to shareholders and when there are retained profits at the financial year end.
|
Statutory surplus reserve can be used to offset prior years’ losses, if any, and may be converted into share capital by the issue of new shares to shareholders in proportion to their existing shareholding or by increasing the par value of the shares currently held by them, provided that the balance after such issue is not less than 25% of the registered capital.
|
(b)
|
Dividend distributions may be proposed at the discretion of the Company’s board of directors, after consideration of the transfers of reserves referred to above and making up cumulative prior years’ losses. Pursuant to the Articles of Association of the Company, the net profit of the Company for the purpose of profit distribution is deemed to be the lesser of (i) the net profit determined in accordance with the PRC accounting rules and regulations, and (ii) the net profit determined in accordance with IFRSs. As of December 31, 2010, the Company did not have any distributable reserves (2009: Nil).
|
|
(c)
|
Pursuant to the “Notice of approval for funds to be used specifically for the reconstruction” issued by the CAAC, national funds amounted to RMB2 million were contributed during the year ended December 31, 2010 by the PRC government to the Company. Such funds are to be used specifically for the reconstruction of Nanyang Airport.
|
Pursuant to the “Notice of approval for funds to be used specifically for the purchase of snow handling equipment” issued by the CAAC, national fund amounting to RMB1 million was contributed during the year ended December 31, 2009 by the PRC government to the Company. Such fund is to be used specifically for the maintenance of safety condition of airports located at Zhengzhou, Luoyang and Nanyang.
Pursuant to the requirements of the relevant notice, the national funds were designated as capital contribution and vested solely by the PRC government. They can be converted to share capital of the entities receiving the funds upon approval by their shareholders and completion of specified procedures.
F - 66
|
45
|
Material related party transactions
|
|
(a)
|
Key management personnel remuneration
|
Remuneration for key management personnel of the Group, including amounts paid to the Company’s directors as disclosed in Note 14, is as follows:
|
2010
|
2009
|
2008
|
||||||||||
|
RMB’000
|
RMB’000
|
RMB’000
|
||||||||||
|
Short-term employees benefits
|
14,277 | 13,991 | 14,117 | |||||||||
|
Post-employment benefits
|
1,009 | 922 | 1,268 | |||||||||
| 15,286 | 14,913 | 15,385 | ||||||||||
|
2010
|
2009
|
2008
|
||||||||||
|
RMB’000
|
RMB’000
|
RMB’000
|
||||||||||
|
Directors and supervisors (Note 14)
|
5,794 | 7,609 | 8,578 | |||||||||
|
Senior management
|
9,492 | 7,304 | 6,807 | |||||||||
| 15,286 | 14,913 | 15,385 | ||||||||||
Total remuneration is included in “staff costs” (Note 12).
|
(b)
|
Contributions to post-employment benefit plans
|
The Group participates in various defined contribution retirement plans organised by municipal and provincial governments for its staff. Details of the Group’s employee benefits plan are disclosed in Note 46.
F - 67
|
45
|
Material related party transactions (continued)
|
|
(c)
|
Transactions with CSAHC and its affiliates (the “CSAHC Group”), and the associates and jointly controlled entities of the Group
|
The Group obtained various operational services provided by the CSAHC Group and the associates and jointly controlled entities of the Group during the normal course of its business.
Details of the significant transactions carried out by the Group are as follows:
|
2010
|
2009
|
2008
|
||||||||||||
|
Note
|
RMB million
|
RMB million
|
RMB million
|
|||||||||||
|
Income received from the CSAHC Group
|
||||||||||||||
|
Charter flight and pallet income
|
(i)
|
36 | 39 | 63 | ||||||||||
|
Cargo handling income
|
(i)
|
14 | 13 | - | ||||||||||
|
Commission income
|
(ii)
|
4 | 2 | 1 | ||||||||||
|
Expenses paid to the CSAHC Group
|
||||||||||||||
|
Handling charges
|
(iii)
|
79 | 68 | 50 | ||||||||||
|
Air catering supplies
|
(iv)
|
- | - | 60 | ||||||||||
|
Commission expense
|
(v)
|
16 | 6 | 4 | ||||||||||
|
Lease charges for land and buildings
|
(vi)
|
109 | 107 | 100 | ||||||||||
|
Property management fee
|
(vii)
|
30 | 19 | 31 | ||||||||||
|
Expenses paid to jointly controlled entities and an associate
|
||||||||||||||
|
Ground service expenses
|
(viii)
|
- | 36 | 64 | ||||||||||
|
Repairing charges
|
(ix)
|
1,341 | 1,344 | 1,129 | ||||||||||
|
Flight simulation service charges
|
(x)
|
198 | 172 | 150 | ||||||||||
|
Advertising expenses
|
(xi)
|
34 | 21 | 20 | ||||||||||
|
Training expenses
|
(xii)
|
63 | - | - | ||||||||||
|
Income received from a jointly controlled entity
|
||||||||||||||
|
Rental income
|
(x)
|
37 | 47 | 33 | ||||||||||
|
Issuance of A shares to CSAHC
|
(xiii)
|
825 | 2,279 | - | ||||||||||
|
Issuance of H shares to Nan Lung
|
(xiii)
|
736 | 721 | - | ||||||||||
|
Disposal to the CSAHC Group
|
||||||||||||||
|
Consideration for disposal of equity interest in MTU (Note 31)
|
1,608 | - | - | |||||||||||
|
Transfer of exclusive right to use certain advertising resources to SACM
|
(xiv)
|
- | - | 35 | ||||||||||
|
Acquisition of 26% equity interest in Flying College from CSAHC Group
|
(xv)
|
- | - | 5 | ||||||||||
|
Disposal of certain buildings to SACM
|
(xvi)
|
- | - | 2 | ||||||||||
F - 68
|
45
|
Material related party transactions (continued)
|
|
(c)
|
Transactions with CSAHC and its affiliates (the “CSAHC Group”), and the associates and jointly controlled entities of the Group (continued)
|
|
|
(i)
|
China Southern Airlines Group Passenger and Cargo Agent Company Limited (“PCACL”), a wholly-owned subsidiary of CSAHC, purchases cargo spaces and charters flight from the Group. In addition, cargo handling income is earned by the Group in connection with provision of cargo handling service to PCACL.
|
|
|
(ii)
|
The Group provided certain website resources to SA Finance to sell air insurance to passengers.
|
|
|
(iii)
|
The Group acquires aircraft, flight equipment and other airline-related facilities through Southern Airlines (Group) Import and Export Trading Company Limited (“SAIETC”), a wholly-owned subsidiary of CSAHC and pays handling charges to SAIETC.
|
|
|
(iv)
|
The Group purchases certain in flight meals and related services from Shenzhen Air Catering Company Limited (“SZ Catering”), which was an associate of CSAHC. SZ Catering ceased to be a related party of the Company in November 2008.
|
|
|
(v)
|
Commission is earned by certain subsidiaries of CSAHC in connection with the air tickets sold by them on behalf of the Group. Commission is calculated based on the rates stipulated by the CAAC and International Air Transportation Association.
|
|
|
(vi)
|
The Group leases certain land and buildings in the PRC from CSAHC. Rental payments for land and buildings were paid or payable to CSAHC.
|
|
|
(vii)
|
Guangzhou China Southern Airlines Property Management Co., Ltd., a subsidiary of CSAHC, provides property management services to the Group.
|
|
|
(viii)
|
Beijing Southern Airlines Ground Services Company Limited (“Beijing Ground Services”), a former jointly controlled entity of the Group, provides airport ground service to the Group. In June 2009, the Company acquired 50% equity interests in Beijing Ground Services from the other venture of Beijing Ground Services and it became a wholly-owned subsidiary of the Company.
|
|
|
(ix)
|
Guangzhou Aircraft Maintenance Engineering Company Limited (“GAMECO”), a jointly controlled entity of the Group, and MTU, a former jointly controlled entity which was disposed of to CSAHC, provide comprehensive maintenance services to the Group. In February 2010, the Group disposed of all equity interest in MTU and MTU ceased to be a related party of the Group. The repairing charges paid or payable to MTU for the full year is RMB487 million.
|
|
|
(x)
|
Zhuhai Xiang Yi Aviation Technology Company Limited (“Zhuhai Xiang Yi”), a jointly controlled entity of the Group, provides flight simulation services to the Group. In addition, the Group entered into operating lease agreements to lease certain flight training facilities and buildings to Zhuhai Xiang Yi.
|
|
|
(xi)
|
Southern Airlines Culture and Media Co., Ltd., an associate of the Group, provides advertising services to the Group.
|
|
|
(xii)
|
Flying College, a former subsidiary of the Company, provides training services to the Group. Flying College became a jointly controlled entity of the Company since June 2010.
|
F - 69
|
45
|
Material related party transactions (continued)
|
|
(c)
|
Transactions with CSAHC and its affiliates (the “CSAHC Group”), and the associates and jointly controlled entities of the Group (continued)
|
|
|
(xiii)
|
On October 29, 2010 and November 1, 2010, the Company issued 123,900,000 A shares to CSAHC and 312,500,000 H shares to Nan Lung, for cash considerations of RMB825 million and RMB736 million, respectively.
|
On August 20, 2009 and August 21, 2009, the Company issued 721,150,000 A shares to CSAHC and 721,150,000 H shares to Nan Lung, a wholly-owned subsidiary of CSAHC, for cash considerations of RMB2,279 million and RMB721 million, respectively.
|
|
(xiv)
|
On November 11, 2008, the Company signed an agreement to transfer the exclusive right to use certain advertising space on the aircraft fleet for a period of 18 years to Southern Airlines Culture and Media Co., Ltd., an associate of the Group, for a total consideration of RMB35 million.
|
|
|
|
|
(xv)
|
On December 30, 2008, the Company signed an agreement to acquire 26% equity interest in Flying College from CSAHC at a consideration of RMB5 million.
|
|
|
(xvi)
|
On November 11, 2008, the Company signed an agreement to transfer certain buildings to Southern Airlines Culture and Media Co., Ltd., an associate of the Group, at a consideration of RMB2 million.
|
In addition to the above, certain subsidiaries of CSAHC also provided hotel and other services to the Group during the year. The total amount involved is not material to the results of the Group for the year.
Details of amounts due from / to the CSAHC Group, and the associates and jointly controlled entities of the Group:
|
2010
|
2009
|
|||||||||
|
Note
|
RMB million
|
RMB million
|
||||||||
|
Receivables:
|
||||||||||
|
The CSAHC Group
|
12 | 6 | ||||||||
|
An Associate
|
16 | 14 | ||||||||
|
Jointly controlled entities
|
110 | 31 | ||||||||
|
37
|
138 | 51 | ||||||||
|
Payables:
|
||||||||||
|
The CSAHC Group
|
139 | 43 | ||||||||
|
An associate
|
27 | - | ||||||||
|
Jointly controlled entities
|
80 | 51 | ||||||||
|
37
|
246 | 94 | ||||||||
The amounts due from/to the CSAHC Group, the associates and jointly controlled entities of the Group are unsecured, interest free and have no fixed terms of repayment.
F - 70
|
45
|
Material related party transactions (continued)
|
|
(d)
|
Loans from and deposits placed with SA Finance
|
|
(i)
|
Loans from SA Finance
|
At December 31, 2010, loans from SA Finance to the Group amounted to RMB520 million (2009: RMB819 million).
The unsecured loans were repayable as follows:
|
2010
|
2009
|
|||||||||
|
Note
|
RMB million
|
RMB million
|
||||||||
|
Within 1 year
|
320 | 400 | ||||||||
|
After 1 year but within 2 years
|
60 | - | ||||||||
|
After 2 years but within 5 years
|
140 | 419 | ||||||||
|
33
|
520 | 819 | ||||||||
Interest expense paid on such loans amounted to RMB27 million (2009: RMB71 million; 2008: RMB38 million) and the interest rates ranged from 4.86% to 5.27% per annum during the year ended December 31, 2010 (2009: 1.25% to 7.56% per annum; 2008: 4.75% to 7.56% per annum).
|
(ii)
|
Deposits placed with SA Finance
|
At December 31, 2010, the Group’s deposits with SA Finance amounted to RMB1,111 million (2009: RMB862 million). The applicable interest rates are determined in accordance with the rates published by the PBOC.
Interest income received on such deposits amounted to RMB17 million (2009: RMB11 million; 2008: RMB22 million) during the year ended December 31, 2010.
|
(e)
|
Guarantees from CSAHC
|
Certain bank loans of the Group amounting to RMB364 million (2009: RMB512 million) were guaranteed by CSAHC.
F - 71
|
45
|
Material related party transactions (continued)
|
|
(f)
|
Transactions with other state-controlled entities
|
The Company is a state-controlled entity and operates in an economic regime currently dominated by entities directly or indirectly controlled by the PRC government (“state-controlled entities”) through its government authorities, agencies, affiliations and other organisations.
Other than those transactions with the CSAHC Group, and the associates and jointly controlled entities of the Group as disclosed in Notes 45(c), (d), and (e) above, the Group conducts transactions with other state-controlled entities which include but are not limited to the following:
|
|
-
|
Transportation services;
|
|
|
-
|
Leasing arrangements;
|
|
|
-
|
Purchase of equipment;
|
|
|
-
|
Purchase of ancillary materials and spare parts;
|
|
|
-
|
Ancillary and social services; and
|
|
|
-
|
Financial services arrangement.
|
These transactions are conducted in the ordinary course of the Group’s business on terms comparable to those with other entities that are not state-controlled. The Group has established its buying, pricing strategy and approval process for purchases and sales of products and services. Such buying, pricing strategy and approval processes do not depend on whether the counterparties are state-controlled entities or not.
Having considered the potential for transactions to be impacted by related party relationships, the Group’s pricing strategy, buying and approval processes, and what information would be necessary for an understanding of the potential effect of the relationship on the consolidated financial statements, the directors are of the opinion that the following transactions with other state-controlled entities require disclosure:
|
|
(i)
|
The Group’s transactions with other state-controlled entities, including state-controlled banks in the PRC
|
|
2010
|
2009
|
2008
|
||||||||||
|
RMB million
|
RMB million
|
RMB million
|
||||||||||
|
Jet fuel cost
|
21,345 | 15,260 | 21,042 | |||||||||
|
Interest income
|
66 | 56 | 77 | |||||||||
|
Interest expense
|
808 | 1,249 | 1,719 | |||||||||
|
|
(ii)
|
The Group’s balances with other state-controlled entities, including state-controlled banks in the PRC
|
|
2010
|
2009
|
|||||||
|
RMB million
|
RMB million
|
|||||||
|
Cash and deposits at bank
|
7,899 | 3,174 | ||||||
|
Short-term bank loans and current portion of long-term bank loans
|
8,956 | 16,068 | ||||||
|
Long-term bank loans, less current portion
|
31,152 | 26,646 | ||||||
F - 72
|
46
|
Retirement and housing benefits
|
|
(a)
|
Retirement benefits
|
Employees of the Group participate in several defined contribution retirement schemes organized separately by the PRC municipal governments in regions where the major operations of the Group are located. The Group is required to contribute to these schemes at the rates ranging from 8% to 25% (2009: 10% to 25%; 2008: 9% to 24%) of salary costs including certain allowances. A member of the retirement schemes is entitled to pension benefits from the Local Labor and Social Security Bureau upon his/her retirement. The retirement benefit obligations of all retired staff of the Group are assumed by these schemes.
In addition, the Group has established a supplementary defined contribution retirement scheme for the benefit of employees in accordance with relevant regulations in the PRC. In this connection, employees of the Group participate in a supplementary defined contribution retirement scheme whereby the Group is required to make contributions not exceeding one-twelfth of the prior year’s total salaries.
|
(b)
|
Housing benefits
|
The Group contributes on a monthly basis to housing funds organised by municipal and provincial governments based on certain percentages of the salaries of employees. The Group’s liability in respect of these funds is limited to the contributions payable in each year.
In addition to the housing funds, certain employees of the Group are eligible to one of the following housing benefit schemes:
|
|
(i)
|
Pursuant to a staff housing benefit scheme effective on September 2002, the Group agreed to pay lump sum housing allowances to certain employees who have not received quarters from CSAHC or the Group according to the relevant PRC housing reform policy, for subsidizing their purchases of houses. An employee who quits prior to the end of the vesting benefit period is required to pay back a portion of the lump sum housing benefits determined on a pro-rata basis of the vesting benefit period. The Group has the right to effect a charge on the employee’s house and to enforce repayment through selling the house in the event of default in repayment. Any shortfall in repayment would be charged to profit or loss.
|
|
|
(ii)
|
The Group also pays cash housing subsidies on a monthly basis to eligible employees. The monthly cash housing subsidies are charged to profit or loss.
|
F - 73
|
47
|
Segmental reporting
|
|
(a)
|
Business segments
|
The Group’s network passenger and cargo operations are managed as a single business unit. The Group’s chief operating decision maker makes resource allocation decisions based on route profitability, which considers aircraft type and route economics. The objective in making resource allocation decisions is to optimize consolidated financial results. Therefore, based on the way the Group manages the network passenger and cargo operations, and the manner in which resource allocation decisions are made, the Group has only one reportable operating segment for financial reporting purposes, reported as the “airline business”.
Financial results from other operating segments are below the quantitative threshold for determining reportable operating segments and consist primarily of business segments of aviation repair services, ground services, air catering and other miscellaneous services. These other operating segments are combined and reported as “all other segments”. Inter-segment sales are based on prices set on an arm’s length basis.
For the purposes of assessing segment performance and allocating resources between segments, the Group’s chief operating decision maker monitors the results, assets and liabilities attributable to each reportable segment based on financial results prepared under PRC GAAP. As such, the amount of each material reconciling item from the Group’s reportable segment revenue, profit or loss, assets and liabilities arising from different accounting policies are set out in Note 47(c).
F - 74
|
47
|
Segmental reporting (continued)
|
|
(a)
|
Business segments (continued)
|
Information regarding the Group’s reportable segments as provided to the Group’s chief operating decision maker for the purposes of resource allocation and assessment of segment performance for the years in the three-year period ended December 31, 2010 is set out below.
|
Airline business
|
All other segments
|
Elimination
|
Unallocated*
|
Total
|
||||||||||||||||||||||||||||||||||||||||||||||||||||||||
|
2010
|
2009
|
2008
|
2010
|
2009
|
2008
|
2010
|
2009
|
2008
|
2010
|
2009
|
2008
|
2010
|
2009
|
2008
|
||||||||||||||||||||||||||||||||||||||||||||||
|
RMB
|
RMB
|
RMB
|
RMB
|
RMB
|
RMB
|
RMB
|
RMB
|
RMB
|
RMB
|
RMB
|
RMB
|
RMB
|
RMB
|
RMB
|
||||||||||||||||||||||||||||||||||||||||||||||
|
million
|
million
|
million
|
million
|
million
|
million
|
million
|
million
|
million
|
million
|
million
|
million
|
million
|
million
|
million
|
||||||||||||||||||||||||||||||||||||||||||||||
|
Revenue from external
customers
|
77,394 | 55,708 | 56,150 | 394 | 335 | 277 | - | - | - | - | - | - | 77,788 | 56,043 | 56,427 | |||||||||||||||||||||||||||||||||||||||||||||
|
Inter-segment sales
|
- | - | 4 | 861 | 674 | 506 | (861 | ) | (674 | ) | (510 | ) | - | - | - | - | - | - | ||||||||||||||||||||||||||||||||||||||||||
|
Reportable segment revenue
|
77,394 | 55,708 | 56,154 | 1,255 | 1,009 | 783 | (861 | ) | (674 | ) | (510 | ) | - | - | - | 77,788 | 56,043 | 56,427 | ||||||||||||||||||||||||||||||||||||||||||
|
Reportable segment profit/(loss) before taxation
|
6,742 | 27 | (5,031 | ) | 81 | 56 | (68 | ) | - | - | - | 1,275 | 374 | 351 | 8,098 | 457 | (4,748 | ) | ||||||||||||||||||||||||||||||||||||||||||
|
Reportable segment assets
|
108,222 | 91,322 | 1,757 | 1,776 | (191 | ) | (159 | ) | 1,441 | 1,797 | 111,229 | 94,736 | ||||||||||||||||||||||||||||||||||||||||||||||||
|
Addition to non- current segment assets during the year
|
17,188 | 17,558 | 38 | 66 | - | - | 5 | 13 | 17,231 | 17,637 | ||||||||||||||||||||||||||||||||||||||||||||||||||
|
Reportable segment liabilities
|
80,033 | 80,435 | 1,168 | 1,202 | (191 | ) | (159 | ) | - | - | 81,010 | 81,478 | ||||||||||||||||||||||||||||||||||||||||||||||||
|
Other segment information
|
||||||||||||||||||||||||||||||||||||||||||||||||||||||||||||
|
Interest income
|
91 | 65 | 99 | 2 | 3 | 4 | - | - | - | - | - | - | 93 | 68 | 103 | |||||||||||||||||||||||||||||||||||||||||||||
|
Interest expenses
|
1,222 | 1,446 | 1,923 | 43 | 51 | 64 | - | - | - | - | - | - | 1,265 | 1,497 | 1,987 | |||||||||||||||||||||||||||||||||||||||||||||
|
Depreciation and amortisation for the year
|
7,050 | 5,954 | 5,724 | 83 | 85 | 94 | - | - | - | - | - | - | 7,133 | 6,039 | 5,818 | |||||||||||||||||||||||||||||||||||||||||||||
|
Impairment losses (including impact on PP&E, allowance for doubtful debts and provision for inventories)
|
220 | 57 | 2,073 | - | - | - | - | - | - | - | - | - | 220 | 57 | 2,073 | |||||||||||||||||||||||||||||||||||||||||||||
*Unallocated assets primarily include investments in associates and jointly controlled entities, available-for-sale securities and other investments. Unallocated results primarily include the share of results of associates and jointly
controlled entities and gain on disposal of a jointly controlled entity classified as held for sale.
F - 75
|
47
|
Segmental reporting (continued)
|
|
(b)
|
Geographic information
|
|
2010
|
2009
|
2008
|
||||||||||
|
RMB million
|
RMB million
|
RMB million
|
||||||||||
|
Domestic
|
63,850 | 47,645 | 45,972 | |||||||||
|
Hong Kong, Macau and Taiwan
|
1,589 | 1,067 | 1,051 | |||||||||
|
International *
|
12,349 | 7,331 | 9,404 | |||||||||
| 77,788 | 56,043 | 56,427 | ||||||||||
|
*
|
Asian market accounted for approximately 57% (2009: 74%; 2008: 72%) of the Group’s total international traffic revenue for the year ended December 31, 2010. The remaining portion was mainly derived from the Group’s flights to/from European, North American regions and Australian.
|
The major revenue earning assets of the Group are its aircraft fleet which is registered in the PRC and is employed across its worldwide route network. The chief operating decision maker considers that there is no suitable basis for allocating such assets and related liabilities to geographical locations. Accordingly, geographical segment assets and liabilities are not disclosed.
|
(c)
|
Reconciliations of reportable segment revenue, profit or loss, assets and liabilities arising from different accounting policies
|
|
Note
|
2010
|
2009
|
2008
|
||||||||||
|
RMB million
|
RMB million
|
RMB million
|
|||||||||||
|
Revenue
|
|||||||||||||
|
Reportable segment revenue
|
78,649 | 56,717 | 56,937 | ||||||||||
|
Elimination of inter-segment revenues
|
(861 | ) | (674 | ) | (510 | ) | |||||||
|
Reclassification of expired sales in
advance of carriage
|
(i)
|
664 | 350 | 276 | |||||||||
|
Reclassification of business tax
|
(ii)
|
(1,957 | ) | (1,591 | ) | (1,415 | ) | ||||||
|
Consolidated revenue
|
76,495 | 54,802 | 55,288 | ||||||||||
F - 76
|
47
|
Segmental reporting (continued)
|
|
(c)
|
Reconciliations of reportable segment revenue, profit or loss, assets and liabilities arising from different accounting policies (continued)
|
|
Note
|
2010
|
2009
|
2008
|
||||||||||
|
RMB million
|
RMB million
|
RMB million
|
|||||||||||
|
Profit
|
|||||||||||||
|
Reportable segment profit/
(loss) before taxation
|
6,823 | 83 | (5,099 | ) | |||||||||
|
Unallocated amounts
|
1,275 | 374 | 351 | ||||||||||
|
Losses on lump sum housing benefits
|
(iii)
|
(26 | ) | (26 | ) | (26 | ) | ||||||
|
Revaluation of land use rights
|
(iv)
|
4 | 4 | 4 | |||||||||
|
Adjustments arising from
business combinations under common control
|
(v)
|
(1 | ) | (7 | ) | (7 | ) | ||||||
|
Capitalization of exchange difference of specific loans
|
(vi)
|
17 | 3 | 51 | |||||||||
|
Government grants
|
(vii)
|
1 | 1 | 2 | |||||||||
|
Consolidated profit/(loss) before taxation
|
8,093 | 432 | (4,724 | ) | |||||||||
|
2010
|
2009
|
||||||||
|
Note
|
RMB million
|
RMB million
|
|||||||
|
Assets
|
|||||||||
|
Reportable segment assets
|
109,979 | 93,098 | |||||||
|
Elimination of inter-segment balances
|
(191 | ) | (159 | ) | |||||
|
Other unallocated amounts
|
1,441 | 1,797 | |||||||
|
Losses on lump sum housing benefits
|
(iii)
|
40 | 66 | ||||||
|
Revaluation of land use rights
|
(iv)
|
(138 | ) | (142 | ) | ||||
|
Adjustments arising from business combinations under common control
|
(v)
|
- | 1 | ||||||
|
Capitalization of exchange difference of specific loans
|
(vi)
|
128 | 111 | ||||||
|
Government grants
|
(vii)
|
(38 | ) | (39 | ) | ||||
|
Effect of the above adjustments on taxation
|
11 | 17 | |||||||
|
Consolidated total assets
|
111,232 | 94,750 | |||||||
| 2010 | 2009 | ||||||||
|
RMB million
|
RMB million
|
||||||||
|
Liabilities
|
|||||||||
|
Reportable segment liabilities
|
81,201 | 81,637 | |||||||
|
Elimination of inter-segment balances
|
(191 | ) | (159 | ) | |||||
|
Effect of the above adjustments on taxation
|
9 | 10 | |||||||
|
Consolidated total liabilities
|
81,019 | 81,488 | |||||||
F - 77
|
47
|
Segmental information (continued)
|
|
(c)
|
Reconciliations of reportable segment revenue, profit or loss, assets and liabilities arising from different accounting policies (continued)
|
Notes:
|
|
(i)
|
In accordance with the PRC GAAP, expired sales in advance of carriage are recorded under non-operating income. Under IFRSs, such income is recognized as other operating income.
|
|
|
(ii)
|
In accordance with the PRC GAAP, business tax and surcharge is separately disclosed rather than deducted from revenue under IFRSs.
|
|
|
(iii)
|
In accordance with the PRC accounting rules and regulations, losses on the lump sum housing benefits executed by CSAHC are charged to retained profits as of January 1, 2001 pursuant to the relevant regulations. Under IFRSs, losses on lump sum housing benefits are charged to the consolidated income statements, which are spread over the vesting benefit periods stipulated by the relevant contracts.
|
|
|
(iv)
|
In accordance with the PRC accounting rules and regulations, land use rights are carried at revalued amounts. Under IFRSs, land use rights are carried at cost with effect from January 1, 2002, and accordingly, the unamortised surplus on revaluation of land use rights was reversed against shareholders’ equity.
|
|
|
(v)
|
In accordance with the PRC GAAP, business combinations under common control should be accounted for by applying the pooling-of-interest method. The carrying amount of the assets and liabilities in the books of subsidiaries acquired were used for consolidation. Under IFRSs, purchase accounting is adopted. The assets and liabilities of the subsidiaries are recorded at fair value.
|
|
|
(vi)
|
In accordance with the PRC GAAP, exchange difference arising on translation of specific loans and related interest denominated in a foreign currency is capitalised as part of the cost of qualifying assets. Under IFRSs, such exchange difference should be recognized in profit or loss unless the exchange difference represents an adjustment to interest.
|
|
|
(vii)
|
In accordance with the PRC GAAP, special funds such as investment grants allocated by the government, if clearly defined in official documents as part of “capital reserve”, are credited to capital reserve, and amortised over the respective useful lives of corresponding assets. Under IFRSs, government grants relating to purchase of fixed assets are deducted from the cost of the related fixed assets.
|
|
48
|
Supplementary information to the consolidated cash flow statements
|
|
(a)
|
Non cash transactions - acquisition of aircraft
|
During the year ended December 31, 2010, aircraft acquired under finance leases amounted to RMB3,056 million (2009: RMB2,171 million; 2008: RMB281 million).
F - 78
|
48
|
Supplementary information to the consolidated cash flow statements (continued)
|
|
(b)
|
Effect of the deemed disposal of Flying College
|
During the year, a third party company injected capital amounting to RMB37 million to Flying College. This diluted the Company’s interest in Flying College from 91% to 48.12%. Flying College became a jointly controlled entity of the Company since June 2, 2010. Details are as follows:
|
RMB million
|
||||
|
Assets deemed disposed of:
|
||||
|
Property, plant and equipment, net
|
46 | |||
|
Inventories
|
8 | |||
|
Trade receivables
|
14 | |||
|
Cash and cash equivalents
|
19 | |||
|
Others
|
20 | |||
| 107 | ||||
|
Liabilities deemed disposed of:
|
||||
|
Trade payables
|
6 | |||
|
Advance from customers
|
85 | |||
|
Other liabilities
|
1 | |||
| 92 | ||||
|
Net identifiable assets
|
15 | |||
F - 79
|
49
|
Financial risk management and fair values
|
Exposure to liquidity, interest rate, currency, credit risks arises and jet fuel price risk in the normal course of the Group’s business. The Group’s exposure to these risks and the financial risk management policies and practices used by the Group to manage these risks are described below.
|
(a)
|
Liquidity risk
|
As at December 31, 2010, the Group’s current liabilities exceeded its current assets by RMB16,466 million. For the year ended December 31, 2010, the Group recorded a net cash inflow from operating activities of RMB11,442 million, a net cash outflow from investing activities of RMB11,568 million and a net cash inflow from financing activities of RMB6,187 million, and resulted in a net decrease in cash and cash equivalents of RMB6,061 million.
In 2011 and thereafter, the liquidity of the Group is primarily dependent on its ability to maintain adequate cash inflow from operations to meet its debt obligations as they fall due, and its ability to obtain adequate external financing to meet its committed future capital expenditures. As at December 31, 2010, the Group had banking facilities with several PRC commercial banks for providing loan finance up to approximately RMB146,702 million (2009: RMB128,175 million), of which approximately RMB39,173 million (2009: RMB50,455 million ) was utilised. The directors of the Company believe that sufficient financing will be available to the Group.
The directors of the Company have carried out a detailed review of the cash flow forecast of the Group for the twelve months ending December 31, 2011. Based on such forecast, the directors have determined that adequate liquidity exists to finance the working capital and capital expenditure requirements of the Group during that period. In preparing the cash flow forecast, the directors have considered historical cash requirements of the Group as well as other key factors, including the availability of the above-mentioned loan finance which may impact the operations of the Group during the next twelve-month period. The directors are of the opinion that the assumptions and sensitivities which are included in the cash flow forecast are reasonable. However, as with all assumptions in regard to future events, these are subject to inherent limitations and uncertainties and some or all of these assumptions may not be realized.
As at December 31, 2010, the Group’s recognized financial liabilities, bank and other loans, obligations under finance lease, trade and bills payables and amounts due to related companies as disclosed in Notes 32, 33, 34, 35 and 37 respectively, are not materially different from the amount determined based on contractual undiscounted cash flows (including interest payments computed using contractual rates or, if floating, based on rates current at the end of the reporting period). During the year ended December 31, 2010, the Group had derivatives settled gross in respect of the foreign exchange forward option contracts, of which the outflow amounted to RMB467 million (2009: RMB426 million) and inflow amounted to RMB406 million (2009: RMB399 million).
|
(b)
|
Interest rate risk
|
The interest rates and maturity information of the Group’s bank and other loans and obligations under finance leases are disclosed in Notes 33 and 34 respectively.
At December 31, 2010, it is estimated that a general increase/decrease of 100 basis points in interest rates, with all other variables held constant, would have decreased/increased the Group’s profit after tax and retained profits by approximately RMB220 million (2009: would have decreased / increased the Group’s profit after tax and increased / decreased accumulated losses by approximately RMB238 million). Other components of consolidated equity would not be affected (2009: Nil) by the changes in interest rates.
F - 80
|
49
|
Financial risk management and fair values (continued)
|
|
(b)
|
Interest rate risk (continued)
|
The sensitivity analysis above indicates the instantaneous change in the Group’s profit after tax (and retained profits) and other components of consolidated equity that would arise assuming that the change in interest rates had occurred at the end of the reporting period and had been applied to re-measure those financial instruments held by the Group which expose the Group to fair value interest rate risk at the end of the reporting period. In respect of the exposure to cash flow interest rate risk arising from floating rate non-derivative instruments held by the Group at the end of the reporting period, the impact on the Group’s profit after tax (and retained profits) and other components of consolidated equity is estimated as an annualised impact on interest expense or income of such a change in interest rates. The analysis is performed on the same basis for 2009.
|
(c)
|
Foreign currency risk
|
The Renminbi is not freely convertible into foreign currencies. All foreign exchange transactions involving Renminbi must take place either through the PBOC or other institutions authorized to buy and sell foreign exchange or at a swap centre.
The Group has significant exposure to foreign currency risk as substantially all of the Group’s obligations under finance leases (Note 34), bank and other loans (Note 33) and operating lease commitment (Note 50(b)) are denominated in foreign currencies, principally US dollars. Depreciation or appreciation of the Renminbi against foreign currencies affects the Group’s results significantly because the Group’s foreign currency payments generally exceed its foreign currency receipts. The Group is not able to hedge its foreign currency exposure effectively other than by retaining its foreign currency denominated earnings and receipts to the extent permitted by the State Administration of Foreign Exchange, or subject to certain restrictive conditions, entering into forward foreign exchange contracts with authorised banks.
The Group also has exposure to foreign currency risk in respect of net cash inflow denominated in Japanese Yen from ticket sales in overseas branch office after payment of expenses. As at December 31, 2010, the Group had two outstanding forward option contracts of notional amount ranging from USD4 million to USD8 million (2009: USD34 million to USD68 million). The contracts are to buy USD1 million and USD1.5 million respectively (or USD2 million and USD3 million respectively if the spot exchange rate at settlement date is below certain specified strike rates) by selling Japanese Yen at certain specified rates on monthly settlement dates until the maturity of the contracts in 2011. Both contracts have a knock-out clause where the contracts early terminate upon the exchange rate of Japanese Yen to US dollar reaching a certain knock-out level. For the year ended December 31, 2010, a net gain of approximately RMB31 million (2009: a gain of RMB72 million) arising from changes in the fair value of these foreign exchange forward option contracts has been recognized in profit or loss. At December 31, 2010, the fair value of these forward option contracts was financial liabilities of approximately RMB13 million (2009: RMB44 million).
F - 81
|
49
|
Financial risk management and fair values (continued)
|
|
(c)
|
Foreign currency risk (continued)
|
As at December 31, 2010, it is estimated that if an appreciation/depreciation of 1.5% in exchange rate of US dollar against Japanese Yen, with all other variables held constant, would have increased/decreased the Group’s profit after tax and retained profits by approximately RMB0.4 million / RMB2 million (2009: would have increased/decreased the Group’s profit after tax and decreased/increased the Group’s accumulated losses by approximately RMB15 million/RMB16 million), respectively.
The exchange rate of Renminbi to US dollar was set by the PBOC and had fluctuated within a narrow band prior to July 21, 2005. Since then, a managed floating exchange rate regime based on market supply and demand with reference to a basket of foreign currencies has been used and the US dollar exchange rate has gradually declined against the Renminbi.
The following table indicates the instantaneous change in Group’s profit or loss after tax (and retained profits) that would arise if foreign exchange rates to which the Group has significant exposure at the end of the reporting period had changed at that date, assuming all other risk variables remained constant.
|
2010
|
2009
|
|||||||||||||||
|
Appreciation /
|
Decrease/(increase)
|
Appreciation/
|
Increase/(decrease)
|
|||||||||||||
|
(depreciation) of
|
on profit after tax and
|
(depreciation) of
|
on profit after tax
|
|||||||||||||
|
Renminbi against
|
retained profits
|
Renminbi against
|
and increase / (decrease)
|
|||||||||||||
|
foreign
|
RMB million
|
foreign
|
on accumulated losses
|
|||||||||||||
|
currency
|
currency
|
RMB million
|
||||||||||||||
|
United States Dollars
|
2 | % | (798 | ) | 2 | % | (764 | ) | ||||||||
|
|
(2 | )% | 798 | (2 | )% | 764 | ||||||||||
Results of the analysis as presented in the above table represent an aggregation of the instantaneous effects on each of the Group entities’ profit or loss after tax and equity measured in the respective functional currencies, translated into Renminbi at the exchange rate ruling at the end of the reporting period for presentation purposes.
The sensitivity analysis assumes that the change in foreign exchange rates had been applied to re-measure those financial instruments held by the Group which expose the Group to foreign currency risk at the end of the reporting period, including inter-company payables and receivables within the Group which are denominated in a currency other than the functional currencies of the lender or the borrower. The analysis excludes differences that would result from the translation of the financial statements of foreign operations into the Group’s presentation currency. The analysis is performed on the same basis for 2009.
|
(d)
|
Credit risk
|
The Group’s credit risk is primarily attributable to cash and cash equivalents and trade receivables.
Substantially all of the Group’s cash and cash equivalents are deposited with PRC financial institutions, which management believes are of high credit quality.
F - 82
|
49
|
Financial risk management and fair values (continued)
|
|
(d)
|
Credit risk (continued)
|
A significant portion of the Group’s air tickets are sold by agents participating in the Billing and Settlement Plan (“BSP”), a clearing scheme between airlines and sales agents organised by International Air Transportation Association which has insignificant credit risk to the Group. As at December 31, 2010, the balance due from BSP agents amounted to RMB909 million (2009: RMB631 million). The credit risk exposure to BSP and the remaining trade receivables balance are monitored by the Group on an ongoing basis and the allowance for impairment of doubtful debts is within management’s expectations. Further quantitative disclosures in respect of the Group’s exposure to credit risk arising from trade receivables is set out in Note 29.
|
(e)
|
Jet fuel price risk
|
The Group’s results of operations may be significantly affected by fluctuations in fuel prices which is a significant expense for the Group. A reasonable possible increase or decrease of 10% (2009: 10%) in jet fuel price, with volume of fuel consumed and all other variables held constant, would have increased/decreased the fuel costs by approximately RMB2,349 million (2009: RMB1,639 million). The sensitivity analysis indicates the instantaneous change in the Group’s fuel cost that would arise assuming that the change in fuel price had occurred at the end of the reporting period.
|
(f)
|
Fair value
|
|
(i)
|
Financial instruments carried at fair value
|
The following table presents the carrying value of financial instruments measured at fair value at the end of the reporting period across the three levels of the fair value hierarchy defined in IFRS 7,
Financial Instruments: Disclosures
, with the fair value of each financial instrument categorised in its entirety based on the lowest level of input that is significant to that fair value measurement. The levels are defined as follows:
|
|
-
|
Level 1 (highest level): fair values measured using quoted prices (unadjusted) in active markets for identical financial instruments
|
|
|
-
|
Level 2: fair values measured using quoted prices in active markets for similar financial instruments, or using valuation techniques in which all significant inputs are directly or indirectly based on observable market data
|
|
|
-
|
Level 3 (Lowest level): fair values measured using valuation techniques in which any significant input is not based on observable market data
|
2010
|
Level 1
|
Level 2
|
Level 3
|
Total
|
|||||||||||||
|
RMB
|
RMB
|
RMB
|
RMB
|
|||||||||||||
|
million
|
million
|
million
|
million
|
|||||||||||||
|
Assets
|
||||||||||||||||
|
Available-for-sale equity securities:
|
||||||||||||||||
|
- Listed
|
80 | - | - | 80 | ||||||||||||
|
Liabilities
|
||||||||||||||||
|
Derivative financial instruments:
|
||||||||||||||||
|
- Foreign exchange forward option contracts
|
- | 13 | - | 13 | ||||||||||||
F - 83
|
49
|
Financial risk management and fair values (continued)
|
|
(f)
|
Fair value (continued)
|
|
(i)
|
Financial instruments carried at fair value (continued)
|
2009
|
Level 1
|
Level 2
|
Level 3
|
Total
|
|||||||||||||
|
RMB
|
RMB
|
RMB
|
RMB
|
|||||||||||||
|
million
|
million
|
million
|
million
|
|||||||||||||
|
Assets
|
||||||||||||||||
|
Available-for-sale equity securities:
|
||||||||||||||||
|
- Listed
|
93 | - | - | 93 | ||||||||||||
|
Liabilities
|
||||||||||||||||
|
Derivative financial instruments:
|
||||||||||||||||
|
- Foreign exchange forward option contracts
|
- | 44 | - | 44 | ||||||||||||
During the year ended December 31, 2010 and 2009, there were no significant transfers between instruments in Level 1 and Level 2.
Fair value of available-for-sale securities is based on quoted market prices at the end of the reporting period without any deduction for transaction costs.
The fair value of forward exchange contracts is estimated by using Black Scholes Pricing Model, taking into account the terms and conditions of the forward exchange contracts. The major inputs used in estimation process include implied volatility, benchmark interest rates and foreign exchange spot and forward rates, which can be obtained from observable markets.
|
(ii)
|
Other non-current investments represent unlisted equity securities of companies established in the PRC. There is no quoted market price for such equity securities and accordingly a reasonable estimate of the fair value could not be measured reliably.
|
|
(iii)
|
Amounts due from/to related companies are unsecured, interest-free and have no fixed terms of repayment. Given these terms, it is not meaningful to disclose fair values of these balances.
|
|
(iv)
|
Loans, trade and other payables and bills payable are carried at amounts not materially different from their fair values as at December 31, 2010 and December 31, 2009.
|
F - 84
|
50
|
Commitments
|
|
(a)
|
Capital commitments
|
Capital commitments outstanding at December 31, 2010 not provided for in the consolidated financial statements were as follows:
|
2010
|
2009
|
|||||||
|
RMB million
|
RMB million
|
|||||||
|
Commitments in respect of aircraft and flight
equipment
|
||||||||
|
- authorised and contracted for
|
73,909 | 57,890 | ||||||
|
- authorised but not contracted for
|
- | 7,953 | ||||||
| 73,909 | 65,843 | |||||||
|
Other commitments
|
||||||||
|
- authorised and contracted for
|
757 | 462 | ||||||
|
- authorised but not contracted for
|
1,949 | 1,399 | ||||||
| 2,706 | 1,861 | |||||||
| 76,615 | 67,704 | |||||||
As at December 31, 2010, the Group had on order 193 aircraft and certain flight equipment, scheduled for deliveries in 2011 to 2016, and deposits of RMB7,979 million have been made towards the purchase of these aircraft and related equipment. As at December 31, 2010, the approximate total future payments, including estimated amounts for price escalation through anticipated delivery dates for these aircraft and flight equipment are as follows:
|
2010
|
2009
|
|||||||
|
RMB million
|
RMB million
|
|||||||
|
2010
|
- | 16,404 | ||||||
|
2011
|
20,445 | 17,482 | ||||||
|
2012
|
20,033 | 17,421 | ||||||
|
2013
|
15,980 | 9,845 | ||||||
|
2014
|
10,720 | 4,691 | ||||||
|
2015 and afterwards
|
6,731 | - | ||||||
| 73,909 | 65,843 | |||||||
F - 85
|
50
|
Commitments (continued)
|
|
(a)
|
Capital commitments (continued)
|
As at December 31, 2010, the Group’s attributable share of the capital commitments of jointly controlled entities was as follows:
|
2010
|
2009
|
|||||||
|
RMB million
|
RMB million
|
|||||||
|
Authorised and contracted for
|
14 | 2 | ||||||
|
Authorised but not contracted for
|
- | 40 | ||||||
| 14 | 42 | |||||||
|
(b)
|
Operating lease commitments
|
As at December 31, 2010, the total future minimum lease payments under non-cancellable operating leases in respect of properties, aircraft and flight equipment were payable as follows:
|
2010
|
2009
|
|||||||
|
RMB million
|
RMB million
|
|||||||
|
Payments due
|
||||||||
|
Within 1 year
|
4,068 | 4,028 | ||||||
|
After 1 year but within 5 years
|
13,713 | 15,107 | ||||||
|
After 5 years
|
8,196 | 11,231 | ||||||
| 25,977 | 30,366 | |||||||
|
51
|
Contingent liabilities
|
|
(a)
|
The Group leased certain properties and buildings from CSAHC which located in Guangzhou, Wuhan and Haikou, etc. However, such properties and buildings lack adequate documentation evidencing CSAHC’s rights thereto.
|
Pursuant to an indemnification agreement dated May 22, 1997 between the Group and CSAHC, CSAHC has agreed to indemnify the Group against any loss or damage arising from any challenge of the Group’s right to use the certain properties and buildings.
|
(b)
|
The Company and its subsidiary, Xiamen Airlines, entered into agreements with its pilot trainees and certain banks to provide guarantees on personal bank loans amounting to RMB249,972,000 (2009: RMB292,586,000) to be granted to its pilot trainees to finance their respective flight training expenses. As at December 31, 2010, an aggregate of personal bank loans of RMB151 million (2009: RMB60 million), under these guarantees, were drawn down from the banks. During the year, the Group has made repayments of RMB2,000,000 due to the default of payments of certain pilot trainees.
|
F - 86
|
52
|
Non-adjusting post balance sheet events
|
On December 20, 2010, the Company, Xiamen Jianfa Group Co., Ltd. (“Xiamen Jianfa”), a non-controlling shareholder of Xiamen Airlines, and Hebei Aviation Investment Group Corporation Limited (“Hebei Investment”) entered into an agreement. Pursuant to the agreement, Hebei Investment agreed to inject a cash capital of RMB1,460 million into Xiamen Airlines. Upon the completion of the capital injections, Hebei Investment will own 15% equity interest in Xiamen Airlines. The Company’s equity interest in Xiamen Airlines will decrease from 60% to 51%. Xiamen Airlines will remain a subsidiary of the Company.
Up to the date of this report, Hebei Investment has injected cash capital of RMB1,460 million to Xiamen Airlines as agreed.
|
53
|
Immediate and ultimate controlling party
|
As at December 31, 2010, the directors of the Company consider the immediate parent and ultimate controlling party of the Group to be CSAHC, a state-owned enterprise established in the PRC. CSAHC does not produce financial statements available for public use.
|
54
|
Accounting judgements and estimates
|
The Groups’ financial position and results of operations are sensitive to accounting methods, assumptions and estimates that underlie the preparation of the consolidated financial statements. The Group bases the assumptions and estimates on historical experience and on various other assumptions that the Group believes to be reasonable and which form the basis for making judgments about matters that are not readily apparent from other sources. On an on-going basis, management evaluates its estimates. Actual results may differ from those estimates as facts, circumstances and conditions change.
The selection of critical accounting policies, the judgments and other uncertainties affecting application of those policies and the sensitivity of reported results to changes in condition and assumptions are factors to be considered when reviewing the consolidated financial statements. The principal accounting policies are set forth in Note 2. The Group believes the following critical accounting policies involve the most significant judgments and estimates used in the preparation of the consolidated financial statements.
|
(a)
|
Impairment of long-lived assets
|
If circumstances indicate that the net book value of a long-lived asset may not be recoverable, this asset may be considered “impaired”, and an impairment loss may be recognized in accordance with IAS 36,
Impairment of Assets
. The carrying amounts of long-lived assets are reviewed periodically in order to assess whether the recoverable amounts have declined below the carrying amounts. These assets are tested for impairment whenever events or changes in circumstances indicate that their recorded carrying amounts may not be recoverable. When such a decline has occurred, the carrying amount is reduced to the recoverable amount. The recoverable amount is the greater of the fair value less costs to sell and value in use. In determining the value in use, expected cash flows generated by the asset are discounted to their present value, which requires significant judgments relating to the level of traffic revenue and the amount of operating costs. The Group uses all readily available information in determining an amount that is a reasonable approximation of recoverable amount, including estimates based on reasonable and supportable assumptions for projections of traffic revenue and amount of operating costs.
F - 87
|
54
|
Accounting judgements and estimates (continued)
|
|
(b)
|
Depreciation
|
Property, plant and equipment are depreciated on a straight-line basis over the estimated useful lives, after taking into account the estimated residual value. The Group reviews the estimated useful lives of assets regularly in order to determine the amount of depreciation expense to be recorded during any reporting period. The useful lives are based on the Group’s historical experience with similar assets and taking into account anticipated technological changes. The depreciation expense for future periods is adjusted if there are significant changes from previous estimates.
|
55
|
Possible impact of amendments, new standards and interpretations issued but not yet effective for the year ended December 31, 2010
|
Up to the date of issue of these consolidated financial statements, the IASB has issued a number of amendments, Interpretations and the new standard which are not yet effective for the year ended December 31, 2010 and which have not been adopted in these consolidated financial statements.
The Group is in the process of making an assessment of what the impact of these amendments, Interpretations and one new standard is expected to be in the period of initial application. So far it has concluded that the adoption of them is unlikely to have a significant impact on the Group’s results of operations and financial position.
In addition, the following developments are expected to result in amended disclosures in the consolidated financial statements, including restatement of comparative amounts in the first period of adoption:
|
Effective for accounting
periods beginning on or after
|
|
|
IAS 24 (Revised),
Related party disclosures
|
January 1, 2011
|
|
IFRS 9,
Financial instruments
|
January 1, 2013
|
F - 88
|
56
|
Subsidiaries
|
The particulars of the Group’s principal subsidiaries as of December 31, 2010 are as follows:
|
Name of company
|
Place of
establishment/
operation
|
Registered capital
|
Proportion of
ownership
interest held
by the
Company
|
Principal
activities
|
||||
|
Shantou Airlines Company Limited (a)
|
PRC
|
RMB280,000,000
|
60% |
Airline
|
||||
|
Chongqing Airlines Company Limited (a)
|
PRC
|
RMB1,200,000,000
|
60% |
Airline
|
||||
|
Zhuhai Airlines Company Limited (a)
|
PRC
|
RMB250,000,000
|
60% |
Airline
|
||||
|
Xiamen Airlines Company Limited (a)
|
PRC
|
RMB1,200,000,000
|
60% |
Airline
|
||||
|
Guizhou Airlines Company Limited (a)
|
PRC
|
RMB80,000,000
|
60% |
Airline
|
||||
|
Nan Lung International Freight Limited
|
HK
|
HKD3,270,000
|
51% |
Freight services
|
||||
|
Guangzhou Baiyun International Logistic Company Limited (a)
|
PRC
|
RMB50,000,000
|
61% |
Logistics operations
|
||||
|
China Southern Airlines Group Air Catering Company Limited (a)
|
PRC
|
RMB10,200,000
|
100% |
Air catering
|
||||
|
Guangzhou Nanland Air Catering Company Limited (“Nanland”) (b)
|
PRC
|
RMB120,000,000
|
55% |
Air catering
|
||||
|
Xinjiang Civil Aviation Property Management Limited (a)
|
PRC
|
RMB251,332,832
|
51.8% |
Property management
|
||||
|
Beijing Southern Airlines Ground Services Company Limited (a)
|
PRC
|
RMB18,000,000
|
100% |
Provision of airport ground services
|
|
|
(a)
|
These subsidiaries are PRC limited liability companies.
|
|
|
(b)
|
This subsidiary is Sino-foreign equity joint venture company established in the PRC.
|
|
|
(c)
|
Certain of the Group’s subsidiaries are PRC joint ventures which have limited lives pursuant to the PRC law.
|
F - 89
|
57
|
Associates and jointly controlled entities
|
The particulars of the Group’s principal associates and jointly controlled entities as of December 31, 2010 are as follows:
|
Proportion of ownership interest held
by
|
|||||||||||||||
|
Name of company
|
Place of
establishment/
operation
|
Group’s
effective
interest
|
The
Company
|
Subsidiaries
|
Principal activities
|
||||||||||
|
Guangzhou Aircraft Maintenance Engineering Company Limited (a)
|
PRC
|
50 | % | 50 | % | - |
Provision of aircraft repair and maintenance services
|
||||||||
|
China Southern Airlines Group Finance Company Limited
|
PRC
|
34 | % | 21.1 | % | 12.9 | % |
Provision of financial services
|
|||||||
|
Sichuan Airlines Corporation Limited
|
PRC
|
39 | % | 39 | % | - |
Airline
|
||||||||
|
Southern Airlines Culture and Media Co., Ltd.
|
PRC
|
40 | % | 40 | % | - |
Provision of advertising services
|
||||||||
|
Zhuhai Xiang Yi Aviation Technology Company Limited (a)
|
PRC
|
51 | % | 51 | % | - |
Provision of flight simulation services
|
||||||||
|
Guangzhou China Southern Zhongmian Dutyfree Store Co., Limited (a)
|
PRC
|
50 | % | 50 | % | - |
Sales of duty free goods in flight
|
||||||||
|
China Southern West Australian Flying College Pty Limited (a)
|
Australia
|
48.12 | % | 48.12 | % | - |
Pilot training services
|
||||||||
|
(a)
|
These are jointly controlled entities.
|
|
(b)
|
Certain of the Group’s jointly controlled entities are PRC joint ventures which have limited lives pursuant to the PRC law.
|
F - 90
TABLE OF CONTENTS
Part IItem 1. Identity Of Directors, Senior Management and AdvisersItem 2. Offer Statistics and Expected TimetableItem 3. Key InformationItem 4. Information on The CompanyItem 4A. Unresolved Staff CommentsItem 5. Operating and Financial Review and ProspectsNote 1 Interest on Variable Rate Loans Was Estimated Based on The Current Rate in Effect At December 31, 2010Note 2 Amounts Shown Are Net Of Previously Paid Purchase DepositsItem 6. Directors, Senior Management and EmployeesItem 7. Major Shareholders and Related Party TransactionsItem 8. Financial InformationItem 9. The Offer and ListingItem 10. Additional InformationItem 11. Quantitative and Qualitative Disclosures About Market RiskItem 12. Description Of Securities Other Than Equity SecuritiesPart IIItem 13. Defaults, Dividend Arrearages and DelinquenciesItem 14. Material Modifications To The Rights Of Security Holders and Use Of ProceedsItem 15. Controls and ProceduresItem 16. ReservedItem 16A. Audit Committee Financial ExpertItem 16B. Code Of EthicsItem 16C. Principal Accounting Fees and ServicesItem 16D. Exemptions From The Listing Standards For Audit CommitteeItem 16E. Purchases Of Equity Securities By The Issuer and Affiliated PurchasersItem 16F. Changes in Registrant S Certifying AccountantItem 16G. Corporate GovernancePart IIIItem 17. Financial StatementsItem 18. Financial StatementsItem 19. Exhibits