C. H. ROBINSON WORLDWIDE, INC.
10-Ks and 10-Qs
|
|
|
|
|
|
|
|
|
|
|
|
|
|
|
|
|
|
|
|
|
|
|
|
|
|
|
|
|
|
|
|
|
|
|
|
|
|
|
|
|
|
|
|
|
|
|
|
|
|
|
|
|
UNITED STATES
SECURITIES AND EXCHANGE COMMISSION
Washington, D.C. 20549
FORM 10-K
ANNUAL REPORT PURSUANT TO SECTION 13 OR 15(d) OF THE SECURITIES EXCHANGE ACT OF 1934
For the fiscal year ended
December 31, 2017
Commission File Number: 000-23189
C.H. ROBINSON WORLDWIDE, INC.
(Exact name of registrant as specified in its charter)
|
Delaware
|
|
41-1883630
|
|
(State or other jurisdiction of
incorporation or organization)
|
|
(I.R.S. Employer
Identification No.)
|
|
14701 Charlson Road, Eden Prairie, Minnesota
|
|
55347-5088
|
|
(Address of principal executive offices)
|
|
(Zip Code)
|
Registrant’s telephone number, including area code: 952-937-8500
Securities registered pursuant to Section 12(b) of the Act:
|
Title of each class
|
|
Name of each exchange on which registered
|
|
Common Stock, par value $.10 per share
|
|
The NASDAQ Global Select Market
|
Securities registered pursuant to Section 12(g) of the Act: None
Indicate by check mark if the registrant is a well-known seasoned issuer, as defined in Rule 405 of the Securities Act. Yes
ý
No
¨
Indicate by check mark if the registrant is not required to file reports pursuant to Section 13 or Section 15(d) of the Act. Yes
¨
No
ý
Indicate by check mark whether the registrant (1) has filed all reports required to be filed by Section 13 or 15(d) of the Securities Exchange Act of 1934 during the preceding 12 months (or for such shorter period that the registrant was required to file such reports) and (2) has been subject to such filing requirements for the past 90 days. Yes
ý
No
¨
Indicate by check mark whether the registrant has submitted electronically and posted on its corporate website, if any, every Interactive Date File required to be submitted and posted pursuant to Rule 405 of Regulation S-T (§232.405 of this chapter) during the preceding 12 months (or for such shorter period that the registrant was required to submit and post such files). Yes
ý
No
¨
Indicate by check mark if disclosure of delinquent filers pursuant to Item 405 of Regulation S-K is not contained herein, and will not be contained, to the best of registrant’s knowledge, in definitive proxy or information statements incorporated by reference in Part III of this Form 10-K or any amendment to this Form 10-K.
¨
Indicate by check mark whether the registrant is a large accelerated filer, an accelerated filer, a non-accelerated filer, a smaller reporting company, or emerging growth company. See definitions of “large accelerated filer,” “accelerated filer,” “smaller reporting company,” “emerging growth company” in Rule 12b-2 of the Exchange Act. (Check one)
|
Large accelerated filer
|
ý
|
Accelerated filer
|
¨
|
Non-accelerated filer
|
¨
|
Smaller reporting company
|
¨
|
|
Emerging growth company
|
¨
|
||||||
If an emerging growth company, indicate by check mark if the registrant has elected not to use the extended transition period for complying with any new or revised financial accounting standards provided pursuant to Section 13(a) of the Exchange Act.
¨
Indicate by check mark whether the registrant is a shell company (as defined in Rule 12b-2 of the Exchange Act). Yes
¨
No
ý
The aggregate market value of voting stock held by non-affiliates of the registrant as of June 30, 2017 was approximately
$9,616,075,533
(based upon the closing price of $68.68 per common share on that date as quoted on The NASDAQ Global Select Market).
As of
February 22, 2018
, the number of shares outstanding of the registrant’s common stock, par value $.10 per share, was
139,748,794
.
DOCUMENTS INCORPORATED BY REFERENCE
Portions of the Registrant’s Proxy Statement relating to its Annual Meeting of Stockholders to be held May 10, 2018 (the “Proxy Statement”), are incorporated by reference in Part III.
C.H. ROBINSON WORLDWIDE, INC.
ANNUAL REPORT ON FORM 10-K
For the Year Ended
December 31, 2017
TABLE OF CONTENTS
|
|
||
|
|
PART I
|
Page
|
|
Item 1.
|
||
|
Item 1A.
|
||
|
Item 1B.
|
||
|
Item 2.
|
||
|
Item 3.
|
||
|
Item 4.
|
||
|
PART II
|
||
|
Item 5.
|
||
|
Item 6.
|
||
|
Item 7.
|
||
|
Item 7A.
|
||
|
Item 8.
|
||
|
Item 9.
|
||
|
Item 9A.
|
||
|
Item 9B.
|
||
|
PART III
|
||
|
Item 10.
|
||
|
Item 11.
|
||
|
Item 12.
|
||
|
Item 13.
|
||
|
Item 14.
|
||
|
PART IV
|
||
|
Item 15.
|
||
2
|
ITEM 1.
|
BUSINESS
|
Overview
C.H. Robinson Worldwide, Inc. (“C.H. Robinson,” “the company,” “we,” “us,” or “our”) is one of the largest third party logistics companies in the world with consolidated total revenues of
$14.9 billion
in
2017
. We are a service company. We provide freight transportation services and logistics solutions to companies of all sizes, in a wide variety of industries. During
2017
, we handled approximately
19
million shipments and worked with more than
120,000
customers. We operate through a network of offices in North America, Europe, Asia, Australia, New Zealand, and South America. We have developed global transportation and distribution networks to provide transportation and supply chain services worldwide. As a result, we have the capability of facilitating most aspects of the supply chain on behalf of our customers. We have three reportable segments: North American Surface Transportation (“NAST”), Global Forwarding, and Robinson Fresh, with our remaining operating segments reported as All Other and Corporate. For financial information concerning our reportable segments and geographic regions, refer to Note 9 of our consolidated financial statements.
As a third party logistics provider, we enter into contractual relationships with a wide variety of transportation companies, and utilize those relationships to efficiently and cost-effectively arrange the transport of our customers’ freight. We utilized approximately
73,000
contracted transportation companies, including motor carriers, railroads (primarily intermodal service providers), and air and ocean carriers in 2017. Depending on the needs of our customer and their supply chain requirements, we select and hire the appropriate transportation for each shipment. Our model enables us to be flexible and provide solutions that optimize service for our customers. As an integral part of our transportation services, we provide a wide range of value-added logistics services, such as freight consolidation, supply chain consulting and analysis, optimization, and reporting.
In addition to transportation, we provide sourcing services under the trade name Robinson Fresh
®
(“Robinson Fresh”). Our sourcing services consist primarily of the buying, selling, and/or marketing of fresh fruits, vegetables, and other value-added perishable items. It was our original business when we were founded in 1905. The foundation for much of our logistics expertise can be traced to our significant experience in handling produce and temperature controlled commodities. We supply fresh produce through a network of independent produce growers and suppliers. Our customers include grocery retailers, restaurants, foodservice distributors, and produce wholesalers. In many cases, we also arrange the logistics and transportation of the products we sell and provide related supply chain services, such as replenishment, category management, and managed procurement services. We have developed proprietary brands of produce and have exclusive licensing agreements to distribute fresh and value-added produce under recognized consumer brand names. The produce for these brands is sourced through a preferred grower network and packed to order through contract packing agreements. We have instituted quality assurance and monitoring procedures with each of these preferred growers.
Our flexible business model has been the main driver of our historical results and has positioned us for continued growth. One of our competitive advantages is our network of offices. Our employees are in close proximity to both customers and transportation providers, which gives them broad knowledge of their local markets and enables them to respond quickly to customers’ and transportation providers’ changing needs. Employees act as a team in their sales efforts, customer service, and operations. A significant portion of most employees’ compensation is performance-oriented, based on profitability and their contributions to the success of the company. We believe this makes our employees more service-oriented and focused on driving growth and maximizing office productivity.
Our network of offices work together to meet our customers’ needs and cross-sell our services. For large, multi-location customers, we often coordinate our efforts in global account centers or in one office and rely on multiple offices to deliver specific geographic or modal needs. The majority of our global network operates on a single global technology platform called Navisphere
®
that is used to match customer needs with supplier capabilities, to collaborate with other offices, and to utilize centralized support resources to complete all facets of the transaction.
We have grown primarily through internal growth, by increasing market share through the addition of new customers and expanding relationships with our current customers, adding new services, expanding our market presence and operations globally, and hiring additional employees. We continually look to grow through selective acquisitions. In August 2017, we acquired Milgram & Company Ltd. (“Milgram”), a provider of freight forwarding, customs brokerage, and surface transportation primarily in Canada. The acquisition strengthens our freight forwarding and customs brokerage offerings in Canada. Milgram operates primarily in our Global Forwarding segment.
3
In September 2016, we completed the acquisition of APC Logistics (“APC”), a privately held company based in Australia, for the purpose of expanding our global presence and bringing additional capabilities and expertise to our portfolio. APC provides international freight forwarding and customs brokerage services in Australia and New Zealand. APC operates in our Global Forwarding segment.
On January 1, 2015, we acquired all of the outstanding stock of Freightquote.com, Inc. (“Freightquote”) for the purpose of enhancing our less than truckload (“LTL”) and truckload businesses and expanding our ecommerce capabilities. Freightquote operates in our NAST segment.
Net revenues are a Non-GAAP financial measure calculated as total revenues less the cost of purchased transportation and related services and the cost of purchased products sourced for resale. We believe net revenues are a useful measure of our ability to source, add value, and sell services and products that are provided by third parties, and we consider net revenues to be our primary performance measurement. Accordingly, the discussion of our results of operations focuses on the changes in our net revenues. The reconciliation of total revenues to net revenues is presented below (in thousands):
|
For the years ended December 31,
|
||||||||||||
|
2017
|
2016
|
2015
|
||||||||||
|
Revenues:
|
||||||||||||
|
Transportation
|
$
|
13,502,906
|
|
$
|
11,704,745
|
|
$
|
11,989,780
|
|
|||
|
Sourcing
|
1,366,474
|
|
1,439,668
|
|
1,486,304
|
|
||||||
|
Total revenues
|
14,869,380
|
|
13,144,413
|
|
13,476,084
|
|
||||||
|
Costs and expenses:
|
||||||||||||
|
Purchased transportation and related services
|
11,257,290
|
|
9,549,934
|
|
9,842,271
|
|
||||||
|
Purchased products sourced for resale
|
1,244,040
|
|
1,316,951
|
|
1,365,333
|
|
||||||
|
Total costs and expenses
|
12,501,330
|
|
10,866,885
|
|
11,207,604
|
|
||||||
|
Net revenues
|
$
|
2,368,050
|
|
$
|
2,277,528
|
|
$
|
2,268,480
|
|
|||
Transportation and Logistics Services
C.H. Robinson provides freight transportation and related logistics and supply chain services. Our services range from commitments on a specific shipment to much more comprehensive and integrated relationships. We execute these service commitments by hiring and training people, developing proprietary systems and processes, and utilizing a network of contracted transportation providers, including, but not limited to, contract motor carriers, railroads, and air and ocean carriers. We make a profit on the difference between what we charge to our customers for the totality of services provided to them and what we pay to the transportation providers to handle or transport the freight. While industry definitions vary, given our extensive contracting to create a flexible network of solutions, we are generally referred to in the industry as a third party logistics company.
We provide all of the following transportation and logistics services:
|
•
|
Truckload: Through our contracts with motor carriers, we have access to dry vans, temperature controlled vans, flatbeds, and bulk capacity. We help our customers connect with carriers who are interested in their lanes and product types, and we help carriers find shipments to make effective use of their equipment.
|
|
•
|
Less than Truckload: LTL transportation involves the shipment of single or multiple pallets of freight. We focus on shipments of a single pallet or larger, although we handle any size shipment. Through our contracts with motor carriers and our operating system, we consolidate freight and freight information to provide our customers with a single source of information on their freight. In many instances, we will consolidate partial shipments for several customers into full truckloads.
|
|
•
|
Intermodal: Our intermodal transportation service is the shipment of freight in trailers or containers by a combination of truck and rail. We have intermodal marketing agreements with container owners and all Class 1 railroads in North America, and we arrange local pickup and delivery (known as drayage) through local contracted motor carriers. In addition, we own approximately 1,500 intermodal containers and lease approximately 1,700 containers.
|
4
|
•
|
Ocean: As a non-vessel ocean common carrier (“NVOCC”) or freight forwarder, we consolidate shipments, determine routing, select ocean carriers, contract for ocean shipments, and/or provide for local pickup and delivery of shipments.
|
|
•
|
Air: As a certified indirect air carrier (“Indirect Air Carrier” or “IAC”) or freight forwarder, we organize air shipments and provide door-to-door service.
|
|
•
|
Customs: Our customs brokers are licensed and regulated by U.S. Customs and Border Protection to assist importers and exporters in meeting federal requirements governing imports and exports.
|
|
•
|
Other Logistics Services: We provide fee-based managed services, warehousing services, small parcel, and other services.
|
Customers communicate their freight needs, typically on a shipment-by-shipment basis, to the C.H. Robinson team responsible for their account. The team ensures that all appropriate information about each shipment is available in our proprietary operating system. This information is entered by our employees, by the customer through our web tools, or received electronically from the customers’ systems. We utilize the information from our operating system and other available sources to select the best available carrier based upon factors such as their service score, equipment availability, freight rates, and other relevant factors.
Once the contracted carrier is selected, we receive the contract carrier’s commitment to provide the transportation. During the time when a shipment is executed, we connect frequently with the contract carrier to track the status of the shipment to meet the unique needs of our customers.
For most of our transportation and logistics services, we are a service provider. By accepting the customer’s order, we accept certain responsibilities for transportation of the shipment from origin to destination. The carrier’s contract is with us, not the customer, and we are responsible for prompt payment of freight charges. In the cases where we have agreed (either contractually or otherwise) to pay for claims for damage to freight while in transit, we pursue reimbursement from the contracted carrier for the claims. In our managed services business, we are acting as the shipper’s agent. In those cases, the carrier’s contract is typically with the customer, and we collect a fee for our services.
As a result of our logistics capabilities, some of our customers have us handle all, or a substantial portion, of their freight transportation requirements. Our employees price our services to provide a profit to us for the totality of services performed for the customer. In some cases, our services to the customer are priced on a spot market, or transactional, basis. In a number of instances, we have contracts with the customer in which we agree to handle an estimated number of shipments, usually to specified destinations, such as from the customer’s plant to a distribution center. Our commitments to handle the shipments are usually at pre-determined rates. Most of our rate commitments are for one year or less and allow for renegotiation. As is typical in the transportation industry, most of these contracts do not include specific volume commitments. When we enter into prearranged rate agreements for truckload services with our customers, we usually have fuel surcharge agreements, in addition to the underlying line-haul portion of the rate.
We purchase the majority of our truckload services from our contract truckload carriers on a spot market, or transactional, basis, even when we are working with the customer on a contractual basis. In a small number of cases, we may get advance commitments from one or more contract carriers to transport contracted shipments for the length of our customer contract. In those cases, where we have prearranged rates with contract carriers, there is a calculated fuel surcharge based on a mutually agreed-upon formula.
In the course of providing day-to-day transportation services, our employees often identify opportunities for additional logistics services as they become more familiar with our customers’ daily operations and the nuances of our customers’ supply chains. We offer a wide range of logistics services on a worldwide basis that reduce or eliminate supply chain inefficiencies. We will analyze customers’ current transportation rate structures, modes of shipping, and carrier selection. We can identify opportunities to consolidate shipments for cost savings. We will suggest ways to improve operating and shipping procedures and manage claims. We can help customers minimize storage through crossdocking and other flow-through operations. Many of these services are provided in connection with providing the transportation services and are not typically priced separately. They are usually included as a part of the cost of transportation services provided by us, based on the nature of the customer relationship. In addition to these transportation services, we may provide additional logistics services, such as contract warehousing, consulting, transportation management, and other services, for which we are usually paid separately.
As we have emphasized integrated logistics solutions, our relationships with many customers have broadened, and we have become a key provider to them by managing a greater portion of their supply chains. We may serve our customers through specially created teams and through several locations. Our transportation services are provided to numerous international
5
customers through our worldwide network. See Note 9 to our
2017
consolidated financial statements included in Part II, Item 8 of this report for disclosure of our total revenues from domestic and foreign customers for the years ended December 31,
2017
,
2016
, and
2015
and our long-lived assets as of December 31,
2017
,
2016
, and
2015
in the United States and in foreign locations.
The table below shows our net revenues by transportation mode, for the years ended December 31 (in thousands):
|
2017
|
2016
|
2015
|
2014
|
2013
|
|||||||||||||||
|
Truckload
|
$
|
1,229,999
|
|
$
|
1,257,191
|
|
$
|
1,316,533
|
|
$
|
1,190,372
|
|
$
|
1,065,315
|
|
||||
|
LTL
|
407,012
|
|
381,817
|
|
360,706
|
|
258,884
|
|
239,477
|
|
|||||||||
|
Intermodal
|
29,145
|
|
33,482
|
|
41,054
|
|
40,631
|
|
39,084
|
|
|||||||||
|
Ocean
|
290,630
|
|
244,276
|
|
223,643
|
|
208,422
|
|
187,671
|
|
|||||||||
|
Air
|
100,761
|
|
82,167
|
|
79,096
|
|
79,125
|
|
73,089
|
|
|||||||||
|
Customs
|
70,952
|
|
50,509
|
|
43,929
|
|
41,575
|
|
36,578
|
|
|||||||||
|
Other Logistics Services
|
117,117
|
|
105,369
|
|
82,548
|
|
73,097
|
|
67,931
|
|
|||||||||
|
Total
|
$
|
2,245,616
|
|
$
|
2,154,811
|
|
$
|
2,147,509
|
|
$
|
1,892,106
|
|
$
|
1,709,145
|
|
||||
Transportation services accounted for approximately 95 percent of net revenues in 2017, 2016, and 2015. For additional information, see Management’s Discussion and Analysis of Financial Condition and Results of Operations in Item 7 of Part II of this report.
Sourcing
Since we were founded in 1905, we have been in the business of sourcing fresh produce. Much of our logistics expertise can be traced to our significant experience in handling produce and other perishable commodities. Because of its perishable nature, produce must be rapidly packaged; carefully transported within tight timetables, usually in temperature controlled equipment; and quickly distributed to replenish high-turnover inventories maintained by our customers. In many instances, we consolidate individual customer’s produce orders into truckload quantities at the point of origin and arrange for transportation of the truckloads, often to multiple destinations.
Our sourcing customer base includes grocery retailers, restaurants, foodservice distributors, and produce wholesalers.
Our sourcing services include inventory forecasting and replenishment, brand management, and category development services. We have various national and regional branded produce programs, including both proprietary brands and national licensed brands. These programs contain a wide variety of high quality, fresh bulk, and value added fruits and vegetables. These brands have expanded our market presence and relationships with many of our retail customers. We have also instituted quality assurance and monitoring programs as part of our branded and preferred grower programs.
Sourcing accounted for approximately five percent of our net revenues in 2017, 2016, and 2015.
Organization
Segment information.
We have continued to expand our services and diversify our business and have also made changes to align executive oversight to the business. We have three reportable segments: NAST, Global Forwarding, and Robinson Fresh, with our remaining operating segments reported as All Other and Corporate. The All Other and Corporate segment includes Managed Services, Other Surface Transportation outside of North America, and other miscellaneous revenues and unallocated corporate expenses. See additional disclosure in Note 9 to our consolidated financial statements.
NAST provides freight transportation services across North America through a network of offices in the United States, Canada, and Mexico. The primary services provided by NAST include truckload, LTL, and intermodal.
Global Forwarding provides global logistics services through an international network of offices in North America, Europe, Asia, Australia, New Zealand, and South America; and also contracts with independent agents worldwide. The primary services provided by Global Forwarding include ocean freight services, air freight services, and customs brokerage.
Robinson Fresh provides sourcing under the trade name Robinson Fresh. Our sourcing services primarily include the buying, selling, and marketing of fresh fruits, vegetables, and other perishable items. Robinson Fresh sources products from around the world. This segment often provides the logistics and transportation of the products they sell, in addition to temperature controlled transportation services for its customers.
6
All Other and Corporate primarily consists of Managed Services and Other Surface Transportation outside of North America. Managed Services is primarily comprised of our division, TMC, which offers Managed TMS
®
. Managed TMS combines a global transportation management system (“TMS”), logistics process expertise, and consulting services. Customers can access Navisphere technology, logistics experts, and supply chain engineers to manage their day-to-day operations and optimize supply chain performance.
Other Surface Transportation revenues are primarily earned by our Europe Surface Transportation operating segment. Europe Surface Transportation provides services similar to NAST across Europe.
Office Network.
To keep us close to our customers and markets, we operate through a network of offices in North America, Europe, Asia, Australia, New Zealand, and South America.
Each office is responsible for its own growth and profitability. Our employees are responsible for developing new business, negotiating and pricing services, receiving and processing service requests from customers, and negotiating with carriers to provide the transportation requested. In addition to routine transportation, employees are often called upon to handle customers’ unusual, seasonal, and emergency needs. Shipments to be transported by truck are priced at the local level, and offices cooperate with each other to hire contract carriers to provide transportation. Employees often rely on expertise in other offices when contracting LTL, intermodal, ocean, and air shipments. Multiple network offices often also work together to service larger, global accounts where the expertise and resources of more than one office are required to meet the customer’s needs. Their efforts are usually coordinated by one “lead” office on the account.
Network Employees.
Employees both sell to and service their customers. Sales opportunities are identified through our internal database, referrals from current customers, leads generated by people through knowledge of their local and regional markets, and company marketing efforts. Employees are also responsible for recruiting new motor carriers, who are referred to our centralized carrier services group to confirm they are properly licensed and insured, have acceptable Federal Motor Carrier Safety Administration (“FMCSA”) issued safety ratings, and will enter into a contract for transportation services with C.H. Robinson.
Each office is responsible for its hiring and headcount decisions, based on the needs of their office and to balance personnel resources with business requirements. Because the quality of our employees is essential to our success, we are highly selective in our recruiting and hiring. To support our hiring processes, we have a corporate talent acquisition team that develops a pipeline of qualified candidates that managers can draw from. Our applicants typically have college degrees, and some have business experience, although not necessarily within the transportation industry.
Our employees go through centralized onboarding that emphasizes development of the skills necessary to become productive employees, including technology training on our proprietary systems and our customer service philosophy. Centralized training is followed by ongoing, on-the-job training. We expect most new employees to start contributing in a matter of weeks.
Compensation programs are performance-based, and cash incentives are directly tied to productivity and performance. Most network management compensation is dependent on the profitability of their particular office. They are paid a performance-based bonus, which is a portion of the office’s earnings for that calendar year. The percentage they can potentially earn is predetermined in an annual bonus contract and is based on their productivity and contributions to the overall success of the office.
All of our managers and certain other employees who have significant responsibilities are eligible to receive equity awards because we believe these awards are an effective tool for creating long-term ownership and alignment between employees and our shareholders. Generally, these awards are eligible to vest over five-year periods and may also include financial performance-based requirements for management employees.
Employees benefit both through the growth and profitability of individual offices and by achieving individual goals. They are motivated by the opportunity to advance in a variety of career paths, including management, corporate sales, and customer and carrier account management.
Shared Services.
Our network offices are supported by our shared and centralized services. Approximately ten percent of our employees provide shared services in centralized centers. Approximately 50 percent of these shared services employees are information technology personnel who develop and maintain our proprietary operating system software and our wide area network.
7
Executive Officers
The Board of Directors designates the executive officers annually. Below are the names, ages, and positions of the executive officers as of February 8, 2018:
|
Name
|
Age
|
Position
|
||
|
John P. Wiehoff
|
56
|
Chief Executive Officer, President, and Chairman of the Board
|
||
|
Robert C. Biesterfeld
|
42
|
President of North American Surface Transportation
|
||
|
Ben G. Campbell
|
52
|
Chief Legal Officer and Secretary
|
||
|
Andrew C. Clarke
|
47
|
Chief Financial Officer
|
||
|
Jeroen Eijsink
|
45
|
President of C.H. Robinson Europe
|
||
|
Angela K. Freeman
|
50
|
Chief Human Resources Officer
|
||
|
Jordan T. Kass
|
45
|
President of Managed Services
|
||
|
James P. Lemke
|
50
|
President of Robinson Fresh
|
||
|
Chad M. Lindbloom
|
53
|
Chief Information Officer
|
||
|
Christopher J. O’Brien
|
50
|
Chief Commercial Officer
|
||
|
Michael J. Short
|
47
|
President of Global Freight Forwarding
|
||
John P. Wiehoff has been Chief Executive Officer of C.H. Robinson since May 2002, President of the Company since December 1999, a director since 2001, and became the chairman in January 2007. Previous positions with the company include senior vice president from October 1998, chief financial officer from July 1998 to December 1999, treasurer from August 1997 to June 1998, and corporate controller from 1992 to June 1998. Prior to that, John was employed by Arthur Andersen LLP. John also serves on the Boards of Directors of Polaris Industries Inc. (NYSE: PII) and Donaldson Company, Inc. (NYSE: DCI). He holds a Bachelor of Science degree from St. John’s University.
Robert C. Biesterfeld was named president of North American Surface Transportation in January 2016. Prior to that, Bob served as Vice President of Truckload from January 2014 to December 2015, Vice President of Sourcing and Temperature Controlled Transportation from January 2013 to December 2014, and General Manager for the U.S. West Sourcing Region for the company’s sourcing division from 2003 to 2011. He began his career with C.H. Robinson in 1999 in the Corporate Procurement and Distribution Services office. Bob serves on several industry and non-profit boards and committees. Bob graduated from Winona State University with a Bachelor of Arts degree.
Ben G. Campbell was named Chief Legal Officer and Secretary in January 2015. Previous positions with the company include Vice President, General Counsel and Secretary from January 2009 to December 2014 and Assistant General Counsel from February 2004 to December 2008. Ben joined C.H. Robinson in 2004. Before coming to C.H. Robinson, Ben was a partner at Rider Bennett, LLP, in Minneapolis, MN. Ben holds a Bachelor of Science degree from St. John’s University and a Juris Doctor from William Mitchell College of Law.
Andrew C. Clarke was named Chief Financial Officer in June 2015. Prior to joining C.H. Robinson, Andrew was an industry consultant from February 2013 to May 2015. From July 2006 to February 2013, Andrew served as President and Chief Executive Officer of Panther Expedited Services, now a wholly owned subsidiary of Arkansas Best Corporation. Prior to that, Andrew served as Chief Financial Officer of Forward Air Corporation from 2001 to 2006. Previously, Andrew served on the Board of Directors for Blount International, Inc., Forward Air Corporation, and Pacer International, Inc. He holds a Bachelor of Science degree from Washington University in Missouri, and a Master of Business Administration degree from the University of Chicago Booth School of Business.
Jeroen Eijsink was named President of C.H. Robinson Europe in September 2015. Jeroen served as Chief Executive Officer of DHL Freight Germany, where he was responsible for the road and rail transport activities for DHL in Germany from March 2013 to August 2015. He also served as Chief Executive Officer of DHL Freight Belgium, Netherlands, and United Kingdom from January 2011 to February 2013 and managing director of DHL Freight United Kingdom and Ireland from May 2006 to December 2010.
Angela K. Freeman was named Chief Human Resources Officer in January 2015. Prior to that, she served as Vice President of Human Resources from August 2012 to December 2014. Previous positions with C.H. Robinson include Vice President of Investor Relations and Public Affairs from January 2009 to August 2012 and Director of Investor Relations and Director of Marketing Communications. She also serves as the president of the C.H. Robinson Worldwide Foundation. Prior to joining C.H. Robinson in 1998, Angela was with McDermott/O’Neill & Associates, a Boston-based public affairs firm. She holds a Bachelor of Arts degree and a Bachelor of Science degree from the University of North Dakota, and a Master of Science degree
8
from the London School of Economics. Angela also serves on the Board of Directors of LeadersUp, a national non-profit organization.
Jordan T. Kass was named President of Managed Services in January 2015. He previously served as Vice President of Management Services from January 2013 to January 2015. Previous positions with C.H. Robinson include director of TMC. Jordan began his career in 1994 at American Backhaulers and subsequently joined C.H. Robinson in 2000 following our acquisition of American Backhaulers. Jordan holds a Bachelor of Arts degree from Indiana University.
James P. Lemke was named President of Robinson Fresh in January 2015. Prior to that, he served as Senior Vice President from December 2007 to December 2014, having previously served as Vice President, Sourcing, since 2003. Prior to that time, he served as the Vice President and Manager of C.H. Robinson’s Corporate Procurement and Distribution Services office. Jim joined the company in 1989. Jim holds a Bachelor of Arts degree in International Relations from the University of Minnesota. Jim is also the chairman of the Foundation Board of the United Fresh Produce Association. He also serves as a director for Second Harvest Heartland.
Chad M. Lindbloom was named Chief Information Officer in January 2015. He served as Senior Vice President from 2007 to 2014 and Chief Financial Officer from 1999 until June 2015. From June 1998 until December 1999, he served as Corporate Controller. Chad joined the company in 1990. Chad holds a Bachelor of Science degree and a Master of Business Administration degree from the Carlson School of Management at the University of Minnesota.
Christopher J. O’Brien was named Chief Commercial Officer in January 2015. Prior to that, he served as a Senior Vice President from May 2012 to December 2014. He has served as a Vice President since May 2003. Additional positions with C.H. Robinson include President of the company’s European division and manager of the Raleigh, North Carolina, office. Christopher joined the company in 1993. He holds a Bachelor of Arts degree from Alma College in Michigan.
Michael J. Short was named President of Global Freight Forwarding in May 2015. He joined C.H. Robinson through the acquisition of Phoenix International in 2012 and is an 18-year veteran of the global forwarding industry. Prior to being named President, Mike served as Vice President, Global Forwarding North America. Mike held a number of roles at Phoenix, including Regional Manager, General Manager of the St. Louis office, and Sales Manager. He graduated from the University of Missouri in 1993 with a Bachelor of Arts degree in Business.
Employees
As of
December 31, 2017
, we had a total of
15,074
employees, approximately 13,700 of whom were located in our network offices. Our remaining employees centrally serve our network of offices in areas such as finance, information technology, legal, marketing, and human resources.
Customer Relationships
We work to establish long-term relationships with our customers and to increase the amount of business done with each customer by providing them with a full range of logistics services. During
2017
, we served over
120,000
customers worldwide, ranging from Fortune 100 companies to small businesses in a wide variety of industries.
During
2017
, our largest customer accounted for approximately
two
percent of total revenues. In recent years, we have grown by adding new customers and by increasing our volumes with, and providing more services to, our existing customers.
We seek additional business from existing customers and pursue new customers based on our knowledge of the marketplace and the range of logistics services that we can provide. We believe that our account management disciplines and decentralized structure enable our employees to better serve our customers by combining a broad knowledge of logistics and market conditions with a deep understanding of the specific supply chain issues facing individual customers and certain vertical industries. With the guidance of our executive and shared services teams, offices are given significant latitude to pursue opportunities and to commit our resources to serve our customers.
Relationships with Transportation Providers
We continually work on establishing contractual relationships with qualified transportation providers that also meet our service requirements to provide dependable services, favorable pricing, and contract carrier availability during periods when demand for transportation equipment is greater than the supply. Because we own very little transportation equipment and do not employ the people directly involved with the delivery of our customers’ freight, these relationships are critical to our success.
In
2017
, we worked with approximately
73,000
transportation providers worldwide, of which the vast majority are contracted motor carriers. To strengthen and maintain our relationships with motor carriers, our employees regularly communicate with
9
carriers and try to assist them by increasing their equipment utilization, reducing their empty miles, and repositioning their equipment. To make it easier for contract carriers to work with us, we have a policy of payment upon receipt of proof of delivery. For those contract carriers who would like a faster payment, we also offer payment within 48 hours of receipt of proof of delivery in exchange for a discount, along with offering in-trip cash advances.
Contracted motor carriers provide access to dry vans, temperature controlled vans, flatbeds, and bulk capacity. These contract carriers are of all sizes, including owner-operators of a single truck, small and midsize fleets, private fleets, and the largest national trucking companies. Consequently, we are not dependent on any one contract carrier. Our largest truck transportation provider was less than
two
percent of our total cost of transportation in
2017
. Motor carriers that had fewer than 100 tractors transported approximately
82
percent of our truckload shipments in
2017
. Every United States and Canadian motor carrier with which we do business is required to execute a contract that establishes that the carrier is acting as an independent contractor. At the time the contract is executed, and thereafter, through subscriptions with a third party service, we confirm that each United States motor carrier is properly licensed and insured, has the necessary federally-issued authority to provide transportation services, and has the ability to provide the necessary level of service on a dependable basis. Our motor carrier contracts require that the motor carrier issue invoices only to and accept payment solely from us for the shipments that they transport under their contract with us, and allow us to withhold payment to satisfy previous claims or shortages. Our standard contracts do not include volume commitments, and the initial contract rate is modified each time we confirm an individual shipment with a carrier.
We also have intermodal marketing agreements with container owners and all Class 1 railroads in North America, giving us access to additional trailers and containers. Our contracts with railroads specify the transportation services and payment terms by which our intermodal shipments are transported by rail. Intermodal transportation rates are typically negotiated between us and the railroad on a customer-specific basis. We own approximately 1,500 53-foot containers and lease approximately 1,700 containers. We believe that these containers have helped us better serve our customers, and we will continue to analyze the strategy of controlling containers.
In our NVOCC ocean transportation business, we have contracts with most of the major ocean carriers, which support a variety of service and rate needs for our customers. We negotiate annual contracts that establish the predetermined rates we agree to pay the ocean carriers. The rates are negotiated based on expected volumes from our customers in specific trade lanes. These contracts are often amended throughout the year to reflect changes in market conditions for our business, such as additional trade lanes.
We operate both as a consolidator and as a transactional IAC in the United States and internationally. We select air carriers and provide for local pickup and delivery of shipments. We execute our air freight services through our relationships with air carriers, through charter services, block space agreements, capacity space agreements, and transactional spot market negotiations. Through charter services, we contract part or all of an airplane to meet customer requirements. Our block space agreements and capacity space agreements are contracts for a defined time period. The contracts include fixed allocations for predetermined flights at agreed upon rates that are reviewed periodically throughout the year. The transactional negotiations afford us the ability to capture excess capacity at prevailing market rates for a specific shipment.
Competition
The transportation services industry is highly competitive and fragmented. We compete against a large number of logistics companies, trucking companies, property freight brokers, carriers offering logistics services, NVOCCs, IACs, and freight forwarders. We also buy from and sell transportation services to companies that compete with us.
In our sourcing business, we compete with produce brokers, produce growers, produce marketing companies, produce wholesalers, and foodservice buying groups. We also buy from and sell produce to companies that compete with us.
We often compete with respect to price, scope of services, or a combination thereof, but believe that our most significant competitive advantages are:
|
•
|
People: Smart, dedicated, empowered people act as an extension of our customers’ teams to innovate and execute their supply chain strategies;
|
|
•
|
Process: Proven processes and solutions combine strategy with practical experience for customized action plans that succeed in the real world;
|
|
•
|
Technology: Navisphere, our proprietary technology, provides flexibility, global visibility, customized solutions, easy integration, broad connectivity, and advanced security;
|
10
|
•
|
Network: Our customers gain local presence, regional expertise, and multiple global logistics options from one of the world’s largest providers of logistics services;
|
|
•
|
Relationships: A large number of unique, strong relationships provide global connections and valuable market knowledge;
|
|
•
|
Portfolio of Services: A wide selection of services and products help provide our customers with consistent capacity and service levels;
|
|
•
|
Scale: Our customers leverage our industry-leading capacity, broad procurement options, and substantial shipment volumes for better efficiency, service, and marketplace advantages; and
|
|
•
|
Stability: Our financial strength, discipline, and consistent track record of success for strategic support of our customers’ supply chains.
|
Seasonality
Historically, our operating results have been subject to seasonal trends with operating income and earnings lower in the first quarter than in the other three quarters. We believe this historical pattern has been the result of, or influenced by, numerous factors, including national holidays, weather patterns, consumer demand, economic conditions, and other similar and subtle forces. Although seasonal changes in the transportation industry have not had a significant impact on our cash flow or results of operations, we expect this trend to continue and we cannot guarantee that it will not adversely impact us in the future. Our results did not follow this pattern in 2017 due primarily to changing transportation costs and customer pricing during the second half of the year.
Proprietary Information Technology and Intellectual Property
We rely on a combination of trademarks, copyrights, trade secrets, and nondisclosure and non-competition agreements to establish and protect our intellectual property and proprietary technology. Additionally, we have numerous registered trademarks, trade names, and logos in the United States and international locations.
Our information systems are essential to efficiently communicate, service our customers and contracted carriers, and manage our business. In
2017
, we executed approximately
19
million shipments for more than
120,000
customers with more than
73,000
contract carriers.
Our systems help our employees service customer orders, select the optimal mode of transportation, build and consolidate shipments, and identify appropriate carriers, all based on customer-specific service parameters. Our systems provide our organization with the necessary business intelligence to allow for near real time scorecards and necessary decision support in all areas of our business.
Our operations primarily use Navisphere, a single global platform that allows customers to communicate worldwide with parties in their supply chain across languages, currencies, and continents. Navisphere offers sophisticated business analytics to help improve supply chain performance and meet increasing customer demands.
The Navisphere Vision web-based product allows our customers to see all of their freight across all modes and services globally in a single view. Details of shipment contents, status of shipments based on milestones, disruptions to shipments and resulting estimated time of arrival adjustment using Artificial Intelligence are provided for the user to manage their supply chain exceptions. Collaboration, intelligent notifications, and performance score carding allow customers to manage their supply chain and identify inefficiencies.
The Navisphere Carrier web-based platform provides contracted carriers additional access to our systems. Contract carriers can access available freight, perform online check calls, keep track of receivables, and upload scanned documentation. Many of our carriers’ favorite features from Navisphere Carrier are also available through our Navisphere Carrier mobile application available for Android and IOS mobile operating systems.
The Navisphere Driver mobile application provides drivers with load status automation capabilities. Drivers can elect to allow the application to complete all stop updates and in-transit calls. Drivers can also capture and upload bill of lading documentation to initiate payment processes. The high fidelity track and trace capabilities give our systems and customers frequent load status information.
11
Government Regulation
Our operations may be regulated and licensed by various federal, state, and local transportation agencies in the United States and similar governmental agencies in foreign countries in which we operate.
We are subject to licensing and regulation as a property freight broker and are licensed by the U.S. Department of Transportation (“DOT”) to arrange for the transportation of property by motor vehicle. The DOT prescribes qualifications for acting in this capacity, including certain surety bonding requirements. We are also subject to regulation by the Federal Maritime Commission as an ocean freight forwarder and a NVOCC and we maintain separate bonds and licenses for each. We operate as a Department of Homeland Security certified IAC, providing air freight services, subject to commercial standards set forth by the International Air Transport Association and federal regulations issued by the Transportation Security Administration. We provide customs brokerage services as a customs broker under a license issued by the Bureau of U.S. Customs and Border Protection. We also have and maintain other licenses as required by law.
Although Congress enacted legislation in 1994 that substantially preempts the authority of states to exercise economic regulation of motor carriers and brokers of freight, some intrastate shipments for which we arrange transportation may be subject to additional licensing, registration, or permit requirements. We generally contractually require and/or rely on the carrier transporting the shipment to ensure compliance with these types of requirements. We, along with the contracted carriers that we rely on in arranging transportation services for our customers, are also subject to a variety of federal and state safety and environmental regulations. Although compliance with the regulations governing licensees in these areas has not had a materially adverse effect on our operations or financial condition in the past, there can be no assurance that such regulations or changes thereto will not adversely impact our operations in the future. Violation of these regulations could also subject us to fines, as well as increased claims liability.
We buy and sell fresh produce under licenses issued by the U.S. Department of Agriculture as required by the Perishable Agricultural Commodities Act. Other sourcing and distribution activities may be subject to various federal and state food and drug statutes and regulations.
We are subject to a variety of other U.S. and foreign laws and regulations including, but not limited to, the Foreign Corrupt Practices Act and other similar anti-bribery and anti-corruption statutes.
Risk Management and Insurance
We contractually require all motor carriers we work with to carry at least $750,000 in automobile liability insurance and $25,000 in cargo insurance. We also require all motor carriers to maintain workers compensation and other insurance coverage as required by law. Most contacted carriers have insurance exceeding these minimum requirements. Railroads, which are generally self-insured, provide limited common carrier cargo loss or damage liability protection, generally up to $250,000 per shipment.
As a property freight broker, we are not legally liable for loss or damage to our customers’ cargo. In our customer contracts, we may agree to assume cargo liability up to a stated maximum. We typically do not assume cargo liability to our customers above minimum industry standards in our international freight forwarding, ocean transportation, or air freight businesses on international or domestic air shipments. With regards to international freight forwarding, ocean transportation, international domestic air freight shipments, and shipments transacted by Freightquote, we offer our customers the option to purchase shippers’ interest coverage to insure goods in transit. When we agree to store goods for our customers for longer terms, we provide limited warehouseman’s coverage to our customers and typically contract for warehousing services from companies that provide us the same degree of coverage.
We maintain a broad cargo liability insurance policy to help protect us against catastrophic losses that may not be recovered from the responsible contracted carrier. We also carry various liability insurance policies, including automobile and general liability, with a $200 million umbrella. Our contingent automobile liability coverage has a retention of $5 million per incident.
As a seller of produce, we may, under certain circumstances, have legal responsibility arising from produce sales. We carry product liability coverage under our general liability and umbrella policies to cover tort claims. The deductible on our general liability coverage is $250,000 per incident. In addition, in the event of a recall, we may be required to bear the costs of repurchasing, transporting, and destroying any allegedly contaminated product, as well as potential consequential damages which were generally not insured. We carry product recall insurance coverage of $50 million. This policy has a retention of $5 million per incident.
12
Investor Information
We were reincorporated in Delaware in 1997 as the successor to a business existing, in various legal forms, since 1905. Our corporate office is located at 14701 Charlson Road, Eden Prairie, Minnesota, 55347-5088, and our telephone number is (952) 937-8500. Copies of our Annual Report on Form 10-K, Quarterly Reports on Form 10-Q, Current Reports on Form 8-K, and amendments to those reports filed or furnished pursuant to Section 13(a) or 15(d) of the Securities Exchange Act of 1934 are available free of charge through our website (www.chrobinson.com) as soon as reasonably practicable after we electronically file the material with the Securities and Exchange Commission. Information contained on our website is not part of this report.
Cautionary Statement Relevant to Forward-Looking Information
This Annual Report on Form 10-K, including our financial statements, “Management’s Discussion and Analysis of Financial Condition and Results of Operations” in Item 7 of Part II of this report, and other documents incorporated by reference, contain certain “forward-looking statements” within the meaning of Section 27A of the Securities Act of 1933, as amended, and Section 21E of the Securities Exchange Act of 1934, as amended. When used in this Form 10-K and in our other filings with the Securities and Exchange Commission, in our press releases, presentations to securities analysts or investors, in oral statements made by or with the approval of any of our executive officers, the words or phrases “believes,” “may,” “could,” “will,” “expects,” “should,” “continue,” “anticipates,” “intends,” “will likely result,” “estimates,” “projects,” or similar expressions and variations thereof are intended to identify such forward-looking statements.
Except for the historical information contained in this Form 10-K, the matters set forth in this document may be deemed to be forward-looking statements that represent our expectations, beliefs, intentions, or strategies concerning future events. These forward-looking statements are subject to certain risks and uncertainties that could cause actual results to differ materially from our historical experience or our present expectations, including, but not limited to, such factors such as changes in economic conditions, including uncertain consumer demand; changes in market demand and pressures on the pricing for our services; competition and growth rates within the third party logistics industry; freight levels and increasing costs and availability of truck capacity or alternative means of transporting freight; changes in relationships with existing contracted truck, rail, ocean, and air carriers; changes in our customer base due to possible consolidation among our customers; our ability to successfully integrate the operations of acquired companies with our historic operations; risks associated with litigation, including contingent auto liability and insurance coverage; risks associated with operations outside of the U.S.; risks associated with the potential impact of changes in government regulations; risks associated with the produce industry, including food safety and contamination issues; fuel price increases or decreases, or fuel shortages; cyber-security related risks; the impact of war on the economy; changes to our capital structure, and other risks and uncertainties, including those described below. Forward-looking statements speak only as of the date they are made. We undertake no obligation to update these statements in light of subsequent events or developments.
13
|
ITEM 1A.
|
RISK FACTORS
|
The following are important factors that could affect our financial performance and could cause actual results for future periods to differ materially from our anticipated results or other expectations, including those expressed in any forward-looking statements made in this 10-K. We may also refer to this disclosure to identify factors that may cause actual results to differ from those expressed in other forward-looking statements, including those made in oral presentations such as telephone conferences and webcasts open to the public.
Economic recessions could have a significant, adverse impact on our business.
The transportation industry historically has experienced cyclical fluctuations in financial results due to economic recession, downturns in business cycles of our customers, interest rate fluctuations, and other economic factors beyond our control. Deterioration in the economic environment subjects our business to various risks, which may have a material and adverse impact on our operating results and cause us to not reach our long-term growth goals:
|
•
|
Decrease in volumes: A reduction in overall freight volumes in the marketplace reduces our opportunities for growth. A significant portion of our freight is transactional or “spot” market opportunities. The transactional market may be more impacted than the freight market by overall economic conditions. In addition, if a downturn in our customers’ business cycles causes a reduction in the volume of freight shipped by those customers, particularly among certain national retailers or in the food, beverage, retail, manufacturing, paper, or printing industries, our operating results could be adversely affected.
|
|
•
|
Credit risk and working capital: Some of our customers may face economic difficulties and may not be able to pay us, and some may go out of business. In addition, some customers may not pay us as quickly as they have in the past, causing our working capital needs to increase.
|
|
•
|
Transportation provider failures: A significant number of our transportation providers may go out of business and we may be unable to secure sufficient equipment or other transportation services to meet our commitments to our customers.
|
|
•
|
Expense management: We may not be able to appropriately adjust our expenses to changing market demands. Personnel expenses are our largest expense. In order to maintain high variability in our business model, it is necessary to adjust staffing levels to changing market demands. In periods of rapid change, it is more difficult to match our staffing levels to our business needs. In addition, we have other expenses that are fixed for a period of time, and we may not be able to adequately adjust them in a period of rapid change in market demand.
|
Higher carrier prices may result in decreased net revenue margin.
Carriers can be expected to charge higher prices if market conditions warrant, or to cover higher operating expenses. Our net revenues and income from operations may decrease if we are unable to increase our pricing to our customers. Increased demand for truckload services and changes in regulations may reduce available capacity and increase carrier pricing. In some instances where we have entered into contract freight rates with customers, in the event market conditions change and those contracted rates are below market rates, we may be required to provide transportation services at a revenue loss.
Changing fuel costs and interruptions of fuel supplies may have an impact on our net revenue margins.
In our truckload transportation business, which is the largest source of our net revenues, fluctuating fuel prices may result in decreased net revenue margin. While our different pricing arrangements with customers and contracted carriers make it very difficult to measure the precise impact, we believe that fuel costs essentially act as a pass-through cost to our truckload business. In times of fluctuating fuel prices, our net revenue margin may also fluctuate.
14
Our dependence on third parties to provide equipment and services may impact the delivery and quality of our transportation and logistics services.
We do not employ the people directly involved in delivering our customers’ freight. We depend on independent third parties to provide truck, rail, ocean, and air services and to report certain events to us, including delivery information and freight claims. These independent third parties may not fulfill their obligations to us, preventing us from meeting our commitments to our customers. This reliance also could cause delays in reporting certain events, including recognizing revenue and claims. In addition, if we are unable to secure sufficient equipment or other transportation services from third parties to meet our commitments to our customers, our operating results could be materially and adversely affected, and our customers could switch to our competitors temporarily or permanently. Many of these risks are beyond our control, including:
|
•
|
equipment shortages in the transportation industry, particularly among contracted truckload carriers;
|
|
•
|
changes in regulations impacting transportation;
|
|
•
|
disruption in the supply or cost of fuel;
|
|
•
|
reduction or deterioration in rail service; and
|
|
•
|
unanticipated changes in transportation rates.
|
We are subject to negative impacts of changes in political and governmental conditions.
Our operations are subject to the influences of significant political, governmental, and similar changes and our ability to respond to them, including:
|
•
|
changes in political conditions and in governmental policies;
|
|
•
|
changes in and compliance with international and domestic laws and regulations; and
|
|
•
|
wars, civil unrest, acts of terrorism, and other conflicts.
|
We may be subject to negative impacts of catastrophic events
. A disruption or failure of our systems or operations in the event of a major earthquake, weather event, cyber-attack, heightened security measures, actual or threatened, terrorist attack, strike, civil unrest, pandemic, or other catastrophic event could cause delays in providing services or performing other critical functions. A catastrophic event that results in the destruction or disruption of any of our critical business or information systems could harm our ability to conduct normal business operations and adversely impact our operating results.
Our international operations subject us to operational and financial risks.
We provide services within and between foreign countries on an increasing basis. Our business outside of the United States is subject to various risks, including:
|
•
|
changes in tariffs, trade restrictions, trade agreements, and taxations;
|
|
•
|
difficulties in managing or overseeing foreign operations and agents;
|
|
•
|
limitations on the repatriation of funds because of foreign exchange controls;
|
|
•
|
different liability standards; and
|
|
•
|
intellectual property laws of countries that do not protect our rights in our intellectual property, including, but not limited to, our proprietary information systems, to the same extent as the laws of the United States.
|
The occurrence or consequences of any of these factors may restrict our ability to operate in the affected region and/or decrease the profitability of our operations in that region.
As we continue to expand our business internationally, we expose the company to increased risk of loss from foreign currency fluctuations and exchange controls, as well as longer accounts receivable payment cycles. Foreign currency fluctuations could result in currency translation exchange gains or losses or could affect the book value of our assets and liabilities. Furthermore, we may experience unanticipated changes to our income tax liabilities resulting from changes in geographical income mix and changing international tax legislation. We have limited control over these risks, and if we do not correctly anticipate changes in international economic and political conditions, we may not alter our business practices in time to avoid adverse effects.
15
Our ability to appropriately staff and retain employees is important to our variable cost model.
Our continued success depends upon our ability to attract and retain a large group of motivated salespeople and other logistics professionals. In order to maintain high variability in our business model, it is necessary to adjust staffing levels to changing market demands. In periods of rapid change, it is more difficult to match our staffing level to our business needs. We cannot guarantee that we will be able to continue to hire and retain a sufficient number of qualified personnel. Because of our comprehensive employee training program, our employees are attractive targets for new and existing competitors. Continued success depends in large part on our ability to develop successful employees into managers.
We face substantial industry competition.
Competition in the transportation services industry is intense and broad-based. We compete against traditional and non-traditional logistics companies, including transportation providers that own equipment, third party freight brokers, technology matching services, internet freight brokers, carriers offering logistics services, and on-demand transportation service providers. We also compete against carriers’ internal sales forces. In addition, customers can bring in-house some of the services we provide to them. We often buy and sell transportation services from and to many of our competitors. Increased competition could reduce our market opportunity and create downward pressure on freight rates, and continued rate pressure may adversely affect our net revenue and income from operations. In some instances where we have entered into contract freight rates with customers, in the event market conditions change and those contracted rates are below market rates, we may be required to provide transportation services at a revenue loss.
We rely on technology to operate our business.
We have internally developed the majority of our operating systems. Our continued success is dependent on our systems continuing to operate and to meet the changing needs of our customers and users. We rely on our technology staff and vendors to successfully implement changes to and maintain our operating systems in an efficient manner. If we fail to maintain and enhance our operating systems, we may be at a competitive disadvantage and lose customers.
As demonstrated by recent material and high-profile data security breaches, computer malware, viruses, and computer hacking and phishing attacks have become more prevalent, have occurred on our systems in the past, and may occur on our systems in the future. Previous attacks on our systems have not had a material financial impact on our operations, but we cannot guarantee that future attacks will have little to no impact on our business. Furthermore, given the interconnected nature of the supply chain and our significant presence in the industry, we believe that we may be an attractive target for such attacks.
Though it is difficult to determine what, if any, harm may directly result from any specific interruption or attack, a significant impact on the performance, reliability, security, and availability of our systems and technical infrastructure to the satisfaction of our users may harm our reputation, impair our ability to retain existing customers or attract new customers, and expose us to legal claims and government action, each of which could have a material adverse impact on our financial condition, results of operations, and growth prospects.
Because we manage our business on a decentralized basis, our operations may be materially adversely affected by inconsistent management practices.
We manage our business on a decentralized basis through a network of offices throughout North America, Europe, Asia, Australia, New Zealand, and South America, supported by executives and shared and centralized services, with local management responsible for day-to-day operations, profitability, personnel decisions, the growth of the business, and adherence to applicable local laws. Our decentralized operating strategy can make it difficult for us to implement strategic decisions and coordinated procedures throughout our global operations. In addition, some of our offices operate with management, sales, and support personnel that may be insufficient to support growth in their respective location without significant central oversight and coordination. Our decentralized operating strategy could result in inconsistent management practices and materially and adversely affect our overall profitability and expose us to litigation.
Our earnings may be affected by seasonal changes in the transportation industry.
Results of operations for our industry generally show a seasonal pattern as customers reduce shipments during and after the winter holiday season. Historically, operating income and earnings are lower in the first quarter than in the other three quarters. We believe this historical pattern has been the result of, or influenced by, numerous factors, including national holidays, weather patterns, consumer demand, economic conditions, and other similar and subtle forces. Although seasonal changes in the transportation industry have not had a significant impact on our cash flow or results of operations, we expect this trend to continue and we cannot guarantee that it will not adversely impact us in the future. Our results did not follow this pattern in 2017 due primarily to changing transportation costs and customer pricing in the second half of the year.
16
We are subject to claims arising from our transportation operations.
We use the services of thousands of transportation companies in connection with our transportation operations. From time to time, the drivers employed and engaged by the carriers we contract with are involved in accidents, which may result in serious personal injuries. The resulting types and/or amounts of damages may be excluded by or exceed the amount of insurance coverage maintained by the contracted carrier. Although these drivers are not our employees and all of these drivers are employees, owner-operators, or independent contractors working for carriers, from time to time, claims may be asserted against us for their actions, or for our actions in retaining them. Claims against us may exceed the amount of our insurance coverage, or may not be covered by insurance at all. In addition, our automobile liability policy has a retention of $5 million per incident. A material increase in the frequency or severity of accidents, liability claims or workers’ compensation claims, or unfavorable resolutions of claims could materially and adversely affect our operating results. In addition, significant increases in insurance costs or the inability to purchase insurance as a result of these claims could reduce our profitability. Our involvement in the transportation of certain goods, including but not limited to hazardous materials, could also increase our exposure in the event one of our contracted carriers is involved in an accident resulting in injuries or contamination.
Our sourcing business is dependent upon the supply and price of fresh produce.
The supply and price of fresh produce is affected by weather and growing conditions (such as drought, insects, and disease) and other conditions over which we have no control. Commodity prices can be affected by shortages or overproduction and are often highly volatile. If we are unable to secure fresh produce to meet our commitments to our customers, our operating results could be materially and adversely affected, and our customers could switch to our competitors temporarily or permanently. To assure access to certain commodities, we occasionally make monetary advances to growers to finance their operations. Repayment of these advances is dependent upon the growers’ ability to grow and harvest marketable crops.
Buying and reselling fresh produce exposes us to possible product liability.
Agricultural chemicals used on fresh produce are subject to various approvals, and the commodities themselves are subject to regulations on cleanliness and contamination. Product recalls in the produce industry have been caused by concern about particular chemicals and alleged contamination, often leading to lawsuits brought by consumers of allegedly affected produce. We may face claims for a variety of damages arising from the sale of produce, which may include potentially uninsured consequential damages. While we are insured for up to $201 million for product liability claims subject to a $250,000 per incident deductible, settlement of class action claims is often costly, and we cannot guarantee that our liability coverage will be adequate and will continue to be available. If we have to recall produce, we may be required to bear the cost of repurchasing, transporting, and destroying any allegedly contaminated product, as well as consequential damages. We carry product recall insurance coverage of $50 million. This policy has a retention of $5 million per incident. Any recall or allegation of contamination could affect our reputation, particularly of our proprietary and/or licensed branded produce programs. Loss due to spoilage (including the need for disposal) is also a routine part of the sourcing business.
Our business depends upon compliance with numerous government regulations.
Our operations may be regulated and licensed by various federal, state, and local transportation agencies in the United States and similar governmental agencies in foreign countries in which we operate.
We are subject to licensing and regulation as a property freight broker and are licensed by the DOT to arrange for the transportation of property by motor vehicle. The DOT prescribes qualifications for acting in this capacity, including certain surety bonding requirements. We are also subject to regulation by the Federal Maritime Commission as an ocean freight forwarder and a NVOCC, and we maintain separate bonds and licenses for each. We operate as a Department of Homeland Security certified IAC, providing air freight services, subject to commercial standards set forth by the International Air Transport Association and federal regulations issued by the Transportation Security Administration. We provide customs brokerage services as a customs broker under a license issued by the Bureau of U.S. Customs and Border Protection. We also have and maintain other licenses as required by law.
We source fresh produce under a license issued by the U.S. Department of Agriculture. We are also subject to various regulations and requirements promulgated by other international, domestic, state, and local agencies and port authorities. Our failure to comply with the laws and regulations applicable to entities holding these licenses could materially and adversely affect our results of operations or financial condition.
17
Legislative or regulatory changes can affect the economics of the transportation industry by requiring changes in operating practices or influencing the demand for, and the cost of providing, transportation services. As part of our logistics services, we operate leased warehouse facilities. Our operations at these facilities include both warehousing and distribution services, and we are subject to various federal, state, and international environmental, work safety, and hazardous materials regulations. We may experience an increase in operating costs, such as security costs, as a result of governmental regulations that have been and will be adopted in response to terrorist activities and potential terrorist activities. No assurances can be given that we will be able to pass these increased costs on to our customers in the form of rate increases or surcharges, and our operations and profitability may suffer as a result.
Department of Homeland Security regulations applicable to our customers who import goods into the United States and our contracted ocean carriers can impact our ability to provide and/or receive services with and from these parties. Enforcement measures related to violations of these regulations can slow and/or prevent the delivery of shipments, which may negatively impact our operations.
We cannot predict what impact future regulations may have on our business. Our failure to maintain required permits or licenses, or to comply with applicable regulations, could result in substantial fines or revocation of our operating permits and licenses.
Our contract carriers are subject to increasingly stringent laws protecting the environment, including those relating to climate change, which could directly or indirectly have a material adverse effect on our business.
Future and existing environmental regulatory requirements in the U.S. and abroad could adversely affect operations and increase operating expenses, which in turn could increase our purchased transportation costs. If we are unable to pass such costs along to our customers, our business could be materially and adversely affected. Even without any new legislation or regulation, increased public concern regarding greenhouse gases emitted by transportation carriers could harm the reputations of companies operating in the transportation logistics industries and shift consumer demand toward more locally sourced products and away from our services.
We derive a significant portion of our total revenues and net revenues from our largest customers.
Our top 100 customers comprise approximately
35
percent of our consolidated total revenues and
23
percent of consolidated net revenues. Our largest customer comprises approximately
two
percent of our consolidated total revenues. The sudden loss of many of our major clients could materially and adversely affect our operating results.
We may be unable to identify or complete suitable acquisitions and investments.
We may acquire or make investments in complementary businesses, products, services, or technologies. We cannot guarantee that we will be able to identify suitable acquisitions or investment candidates. Even if we identify suitable candidates, we cannot guarantee that we will make acquisitions or investments on commercially acceptable terms, if at all. The timing and number of acquisitions we pursue may also cause volatility in our financial results. In addition, we may incur debt or be required to issue equity securities to pay for future acquisitions or investments. The issuance of any equity securities could be dilutive to our stockholders.
We may have difficulties integrating acquired companies.
For acquisitions, success depends upon efficiently integrating the acquired business into our existing operations. These risks could be heightened if we complete a large acquisition or multiple acquisitions within a short period of time. We are required to integrate these businesses into our internal control environment, which may present challenges that are different than those presented by organic growth and that may be difficult to manage. If we are unable to successfully integrate and grow these acquisitions and to realize contemplated revenue synergies and cost savings, our business, prospects, results of operations, financial position, and cash flows could be materially and adversely affected.
Our growth and profitability may not continue, which may result in a decrease in our stock price.
Our long-term growth objective is to grow earnings per share by 10 percent. Long-term growth targets represent an over time perspective and do not necessarily represent an expected annual growth rate. There can be no assurance that our long-term growth objective will be achieved or that we will be able to effectively adapt our management, administrative, and operational systems to respond to any future growth. Future changes in and expansion of our business, or changes in economic or political conditions, could adversely affect our operating margins. Slower or less profitable growth or losses could adversely affect our stock price.
|
ITEM 1B.
|
UNRESOLVED STAFF COMMENTS
|
None.
18
|
ITEM 2.
|
PROPERTIES
|
Our corporate headquarters is in Eden Prairie, Minnesota. The total square footage of our four buildings in Eden Prairie is 357,000. This total includes approximately 221,000 square feet used for our corporate and shared services, our data center of approximately 18,000 square feet, and 118,000 square feet used for office operations.
Most of our offices are leased from third parties under leases with initial terms ranging from three to fifteen years. Our office locations range in space from 1,000 to 208,000 square feet. Because we are a global enterprise characterized by substantial intersegment cooperation, properties are often used by multiple business segments. The following table lists our office locations of greater than 20,000 square feet:
____________________________
|
Location
|
Approximate
Square Feet
|
|
|
Kansas City, MO
(1)
|
208,000
|
|
|
Eden Prairie, MN
|
153,000
|
|
|
Eden Prairie, MN
(1)
|
105,000
|
|
|
Eden Prairie, MN
(1)
|
81,000
|
|
|
Chicago, IL
(1)
|
80,000
|
|
|
Wood Dale, IL
|
72,000
|
|
|
Chicago, IL
|
48,000
|
|
|
Shanghai, China
|
43,000
|
|
|
Auburn Hills, MI
|
41,000
|
|
|
Atlanta, GA
|
40,000
|
|
|
Amsterdam, Netherlands
|
37,000
|
|
|
Oronoco, MN
(1)
|
32,000
|
|
|
Miami, FL
|
25,200
|
|
|
Woodridge, IL
|
22,000
|
|
|
Minneapolis, MN
|
21,000
|
|
|
(1)
|
These properties are owned. All other properties in the table above are leased from third parties.
|
We also own or lease warehouses totaling approximately 1.5 million square feet of space in nearly 40 cities around the world. The following table lists our warehouses over 50,000 square feet:
____________________________
|
Location
|
Approximate
Square Feet
|
|
|
Carson, CA
|
228,000
|
|
|
Des Plaines, IL
|
219,000
|
|
|
Rancho Dominguez, CA
|
130,000
|
|
|
San Bernardino, CA
|
105,000
|
|
|
Atlanta, GA
|
95,000
|
|
|
Bethlehem, PA
|
85,000
|
|
|
Vancouver, WA
|
79,000
|
|
|
Edinburg, TX
|
72,000
|
|
|
Miramar, FL
|
67,000
|
|
|
Bydgoszcz, Poland
|
52,000
|
|
|
Cobden, IL
(1)
|
52,000
|
|
|
(1)
|
This property is owned. All other properties in the table above are leased from third parties.
|
We consider our current office spaces and warehouse facilities adequate for our current level of operations. We have not had difficulty in obtaining sufficient office space and believe we can renew existing leases or relocate to new offices as leases expire. We have entered into a lease for a building to be built in Chicago, Illinois, with a substantial completion date in 2018. The lease of approximately 200,000 square feet will replace certain current space in Chicago that we own.
19
|
ITEM 3.
|
LEGAL PROCEEDINGS
|
We are not subject to any pending or threatened litigation other than routine litigation arising in the ordinary course of our business operations. For some legal proceedings, we have accrued an amount that reflects the aggregate liability deemed probable and estimable, but this amount is not material to our consolidated financial position, results of operations, or cash flows. Because of the preliminary nature of many of these proceedings, the difficulty in ascertaining the applicable facts relating to many of these proceedings, the inconsistent treatment of claims made in many of these proceedings, and the difficulty of predicting the settlement value of many of these proceedings, we are not able to estimate an amount or range of any reasonably possible additional losses. However, based upon our historical experience, the resolution of these proceedings is not expected to have a material adverse effect on our consolidated financial position, results of operations, or cash flows.
|
ITEM 4.
|
MINE SAFETY DISCLOSURES
|
Not applicable.
20
|
ITEM 5.
|
MARKET FOR REGISTRANT’S COMMON EQUITY, RELATED STOCKHOLDER MATTERS, AND ISSUER PURCHASES OF EQUITY SECURITIES
|
Our common stock began trading on The NASDAQ National Market under the symbol “CHRW” on October 15, 1997, and currently trades on the NASDAQ Global Select Market.
Quarterly market information can be found in Part II, Item 8. Financial Statements and Supplementary Data, Note 12.
On
February 22, 2018
, the closing sales price per share of our common stock as quoted on the NASDAQ Global Select Market was $90.09 per share. On
February 22, 2018
, there were approximately 140 holders of record and approximately 79,442 beneficial owners of our common stock.
We declared quarterly dividends during 2016 aggregating to $1.74 per share and quarterly dividends during 2017 aggregating to $1.81 per share. We have declared a quarterly dividend of $0.46 per share payable to shareholders of record as of March 2, 2018, payable on March 30, 2018. Our declaration of dividends is subject to the discretion of the Board of Directors. Any determination as to the payment of dividends will depend upon our results of operations, capital requirements and financial condition, and such other factors as the Board of Directors may deem relevant. Accordingly, there can be no assurance that the Board of Directors will declare or continue to pay dividends on the shares of common stock in the future.
The following table provides information about company purchases of common stock during the quarter ended
December 31, 2017
:
|
Total Number
of Shares
Purchased
(a)
|
Average Price
Paid Per
Share
|
Total Number of Shares Purchased as Part of Publicly Announced
Plans or Programs
(a)
|
Maximum Number of
Shares That May Yet Be Purchased Under the
Plans or Programs
(b)
|
|||||||||
|
October 1, 2017-October 31, 2017
|
573,266
|
|
$
|
77.49
|
|
567,793
|
|
2,086,508
|
|
|||
|
November 1, 2017-November 30, 2017
|
41,124
|
|
80.30
|
|
37,307
|
|
2,049,201
|
|
||||
|
December 1, 2017-December 31, 2017
|
58,011
|
|
87.60
|
|
57,044
|
|
1,992,157
|
|
||||
|
Fourth quarter 2017
|
672,401
|
|
$
|
78.53
|
|
662,144
|
|
1,992,157
|
|
|||
________________________________
(a) The total number of shares purchased includes: (i) 662,144 shares of common stock purchased under the authorization described below; and (ii) 10,257 shares of common stock surrendered to satisfy statutory tax withholding obligations under our stock incentive plans.
(b) In August 2013, the Board of Directors increased the number of shares authorized to be repurchased by 15,000,000 shares. As of
December 31, 2017
, there were
1,992,157
shares remaining for future repurchases under this authorization. Purchases can be made in the open market or in privately negotiated transactions, including Rule 10b5-1 plans and accelerated share repurchase programs.
21
The graph below compares the cumulative 5-year total return of holders of C.H. Robinson Worldwide, Inc.’s common stock with the cumulative total returns of the S&P 500 index, the NASDAQ Transportation index, and the S&P Midcap 400 index. The graph tracks the performance of a $100 investment in our common stock and in each index (with the reinvestment of all dividends) from December 31, 2012, to December 31, 2017.
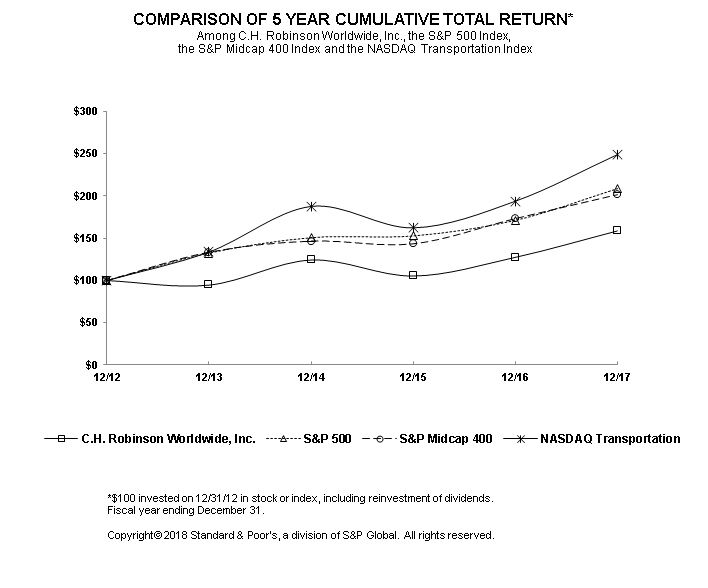
|
December 31,
|
||||||||||||||||||
|
2012
|
2013
|
2014
|
2015
|
2016
|
2017
|
|||||||||||||
|
C.H. Robinson Worldwide, Inc.
|
$
|
100.00
|
|
94.59
|
|
124.24
|
|
105.33
|
|
127.44
|
|
158.69
|
|
|||||
|
S&P 500
|
$
|
100.00
|
|
132.39
|
|
150.51
|
|
152.59
|
|
170.84
|
|
208.14
|
|
|||||
|
S&P Midcap 400
|
$
|
100.00
|
|
133.50
|
|
146.54
|
|
143.35
|
|
173.08
|
|
201.20
|
|
|||||
|
NASDAQ Transportation
|
$
|
100.00
|
|
133.76
|
|
187.65
|
|
162.30
|
|
193.79
|
|
248.92
|
|
|||||
The stock price performance included in this graph is not necessarily indicative of future stock price performance.
22
|
ITEM 6.
|
SELECTED FINANCIAL DATA
|
This table includes selected financial data for the last five years (amounts in thousands, except per share amounts and operating data for employees). This financial data should be read together with our consolidated financial statements and related notes, Management’s Discussion and Analysis of Financial Condition and Results of Operations, and other financial data appearing elsewhere in this report.
|
STATEMENT OF OPERATIONS DATA
|
|||||||||||||||||||
|
Year Ended December 31,
|
2017
|
2016
|
2015
|
2014
|
2013
|
||||||||||||||
|
Total revenues
|
$
|
14,869,380
|
|
$
|
13,144,413
|
|
$
|
13,476,084
|
|
$
|
13,470,067
|
|
$
|
12,752,076
|
|
||||
|
Net revenues
|
2,368,050
|
|
2,277,528
|
|
2,268,480
|
|
2,007,652
|
|
1,836,095
|
|
|||||||||
|
Income from operations
|
775,119
|
|
837,531
|
|
858,310
|
|
748,418
|
|
682,650
|
|
|||||||||
|
Net income
|
504,893
|
|
513,384
|
|
509,699
|
|
449,711
|
|
415,904
|
|
|||||||||
|
Net income per share
|
|||||||||||||||||||
|
Basic
|
$
|
3.59
|
|
$
|
3.60
|
|
$
|
3.52
|
|
$
|
3.06
|
|
$
|
2.65
|
|
||||
|
Diluted
|
$
|
3.57
|
|
$
|
3.59
|
|
$
|
3.51
|
|
$
|
3.05
|
|
$
|
2.65
|
|
||||
|
Weighted average number of shares outstanding (in thousands)
|
|||||||||||||||||||
|
Basic
|
140,610
|
|
142,706
|
|
144,967
|
|
147,202
|
|
156,915
|
|
|||||||||
|
Diluted
|
141,382
|
|
142,991
|
|
145,349
|
|
147,542
|
|
157,080
|
|
|||||||||
|
Dividends per share
|
$
|
1.81
|
|
$
|
1.74
|
|
$
|
1.57
|
|
$
|
1.43
|
|
$
|
1.40
|
|
||||
|
BALANCE SHEET DATA
|
|||||||||||||||||||
|
As of December 31,
|
|||||||||||||||||||
|
Working capital
|
$
|
523,487
|
|
$
|
162,384
|
|
$
|
282,101
|
|
$
|
529,599
|
|
$
|
394,504
|
|
||||
|
Total assets
|
4,235,834
|
|
3,687,758
|
|
3,184,358
|
|
3,214,338
|
|
2,802,818
|
|
|||||||||
|
Current portion of debt
|
715,000
|
|
740,000
|
|
450,000
|
|
605,000
|
|
375,000
|
|
|||||||||
|
Long-term notes payable
|
750,000
|
|
500,000
|
|
500,000
|
|
500,000
|
|
500,000
|
|
|||||||||
|
Stockholders’ investment
|
1,425,745
|
|
1,257,847
|
|
1,150,450
|
|
1,047,015
|
|
939,724
|
|
|||||||||
|
OPERATING DATA
|
|||||||||||||||||||
|
As of December 31,
|
|||||||||||||||||||
|
Employees
|
15,074
|
|
14,125
|
|
13,159
|
|
11,521
|
|
11,676
|
|
|||||||||
23
|
ITEM 7.
|
MANAGEMENT’S DISCUSSION AND ANALYSIS OF FINANCIAL CONDITION AND RESULTS OF OPERATIONS
|
OVERVIEW
Our company.
We are a global provider of transportation services and logistics solutions, operating through a network of offices in North America, Europe, Asia, Australia, New Zealand, and South America. As a third party logistics provider, we enter into contractual relationships with a wide variety of transportation companies, and utilize those relationships to efficiently and cost effectively transport our customers’ freight. We have contractual relationships with approximately
73,000
active transportation companies in 2017, including motor carriers, railroads (primarily intermodal service providers), air freight, and ocean carriers. Depending on the needs of our customer and their supply chain requirements, we select and hire the appropriate transportation for each shipment. Our model enables us to be flexible and provide solutions that optimize service for our customers.
In addition to transportation and logistics services, we also provide sourcing services. Our sourcing business consists of buying, selling, and marketing fresh produce. We purchase fresh produce through our network of produce suppliers and sell it to grocery retailers, restaurants, foodservice distributors, and produce wholesalers. In some cases, we also arrange the transportation of the produce we sell through our relationships with specialized transportation companies. Transportation revenues generated by Robinson Fresh are included in our transportation service line in the first two tables below, but are included in Robinson Fresh in the segment revenue table below.
Our reportable segments are North American Surface Transportation (“NAST”), Global Forwarding, Robinson Fresh, and All Other and Corporate. The All Other and Corporate segment includes Managed Services, Other Surface Transportation outside of North America, and other miscellaneous revenues and unallocated corporate expenses. We group offices primarily by services they provide. For financial information concerning our reportable segments and geographic regions, refer to Note 9 of our consolidated financial statements.
Our business model.
We are primarily a service company. We add value and expertise in the procurement and execution of transportation and logistics, including sourcing of produce products for our customers. Our total revenues represent the total dollar value of services and goods we sell to our customers. Our net revenues are our total revenues less purchased transportation and related services, including contracted motor carrier, rail, ocean, air, and other costs, and the purchase price and services related to the products we source. Our net revenues are the primary indicator of our ability to source, add value, and sell services and products that are provided by third parties, and we consider them to be our primary performance measurement. Accordingly, the discussion of our results of operations below focuses on the changes in our net revenues.
We keep our business model as variable as possible to allow us to be flexible and adapt to changing economic and industry conditions. We sell transportation services and produce to our customers with varied pricing arrangements. Some prices are committed to for a period of time, subject to certain terms and conditions, and some prices are set on a spot market basis. We buy most of our truckload transportation capacity and produce on a spot market basis. Because of this, our net revenue per transaction tends to increase in times when there is excess supply and decrease in times when demand is strong relative to supply.
In 2017, changing market conditions continued to impact our results. We had volume increases in all of our service lines, and experienced pricing and cost increases in nearly all of our service lines, which negatively impacted our margins. Truckload margin compression was a challenge to our earnings per share during much of the year. In August 2017, we acquired Milgram & Company Ltd. (“Milgram”), a provider of freight forwarding, customs brokerage, and surface transportation primarily in Canada. Milgram operates primarily in our Global Forwarding segment.
In 2016, changing market conditions impacted our results. We had volume increases in nearly all of our service lines, but also experienced pricing declines, which impacted our net revenue margins. Truckload margin compression was a challenge to our earnings per share during the second half of the year. In September 2016, we completed the acquisition of APC Logistics (“APC”), a privately held company based in Australia, for the purpose of expanding our global presence and bringing additional capabilities and expertise to our portfolio. APC provides international freight forwarding and customs brokerage services in Australia and New Zealand. APC operates in our Global Forwarding segment.
Fuel prices declined throughout 2015, which contributed to slower growth of our total revenues and an increase in our transportation net revenue margins. In 2015, we completed the acquisition of Freightquote.com, Inc. (“Freightquote”), a privately held freight broker based in Kansas City, Missouri. Freightquote provides services throughout North America. The acquisition enhances and brings synergies to our LTL and truckload businesses, and expands our ecommerce capabilities. Freightquote operates in our NAST segment.
24
We keep our personnel and other operating expenses as variable as possible. Compensation is tied to productivity and performance. Each office is responsible for its hiring and headcount decisions, based on the needs of their office and to balance personnel resources with business requirements. This helps keep our personnel expense as variable as possible with the business.
Our office network.
Our office network is a competitive advantage. Building local customer and contract carrier relationships has been an important part of our success, and our worldwide network of offices supports our core strategy of serving customers locally, nationally, and globally. Our network of offices helps us penetrate local markets, provides face-to-face service when needed, and enables us to recruit contract carriers. Our network also gives us knowledge of local market conditions, which is important in the transportation industry because it is market driven and very dynamic.
Our people.
Because we are a service company, our continued success is dependent on our ability to continue to hire and retain talented, productive people, and to properly align our headcount and personnel expense with our business. Our headcount increased by 949 employees during
2017
, which includes approximately 325 employees added as a result of the Milgram acquisition. Compensation programs are performance-based and cash incentives are directly tied to productivity and performance. Most network management compensation is dependent on the profitability of their particular office. We believe this makes our employees more service-oriented and focused on driving growth and maximizing office productivity. All of our managers and certain other employees who have significant responsibilities are eligible to receive equity awards because we believe these awards are an effective tool for creating long-term ownership and alignment between employees and our shareholders.
Our customers.
In
2017
, we worked with more than
120,000
customers. We work with a wide variety of companies, ranging in size from Fortune 100 companies to small family businesses, in many different industries. Our customer base is very diverse and unconcentrated. In
2017
, our top 100 customers represented approximately
35
percent of our total revenues and approximately
23
percent of our net revenues. Our largest customer was approximately
two
percent of our total revenues.
Our contracted carriers.
Our contracted carrier base includes motor carriers, railroads (primarily intermodal service providers), air freight, and ocean carriers. In
2017
, we worked with approximately
73,000
transportation providers worldwide, up from approximately 71,000 in
2016
. Motor carriers with fewer than 100 tractors transported approximately
82
percent of our truckload shipments in
2017
. In our transportation business, no single contracted carrier represents more than approximately
two
percent of our contracted carrier capacity.
CONSOLIDATED RESULTS OF OPERATIONS
The following table summarizes our total revenues by service line (dollars in thousands):
|
For the years ended December 31,
|
2017
|
2016
|
Change
|
2015
|
Change
|
||||||||||||
|
Transportation
|
$
|
13,502,906
|
|
$
|
11,704,745
|
|
15.4
|
%
|
$
|
11,989,780
|
|
(2.4
|
)%
|
||||
|
Sourcing
|
1,366,474
|
|
1,439,668
|
|
(5.1
|
)%
|
1,486,304
|
|
(3.1
|
)%
|
|||||||
|
Total
|
$
|
14,869,380
|
|
$
|
13,144,413
|
|
13.1
|
%
|
$
|
13,476,084
|
|
(2.5
|
)%
|
||||
The following table illustrates our net revenue margins by service line:
|
For the years ended December 31,
|
2017
|
2016
|
2015
|
|||||
|
Transportation
|
16.6
|
%
|
18.4
|
%
|
17.9
|
%
|
||
|
Sourcing
|
9.0
|
%
|
8.5
|
%
|
8.1
|
%
|
||
|
Total
|
15.9
|
%
|
17.3
|
%
|
16.8
|
%
|
||
25
The following table summarizes our net revenues by service line (dollars in thousands):
|
For the years ended December 31,
|
2017
|
2016
|
Change
|
2015
|
Change
|
||||||||||||
|
Net revenues:
|
|||||||||||||||||
|
Transportation
|
|||||||||||||||||
|
Truckload
|
$
|
1,229,999
|
|
$
|
1,257,191
|
|
(2.2
|
)%
|
$
|
1,316,533
|
|
(4.5
|
)%
|
||||
|
LTL
(1)
|
407,012
|
|
381,817
|
|
6.6
|
%
|
360,706
|
|
5.9
|
%
|
|||||||
|
Intermodal
|
29,145
|
|
33,482
|
|
(13.0
|
)%
|
41,054
|
|
(18.4
|
)%
|
|||||||
|
Ocean
|
290,630
|
|
244,276
|
|
19.0
|
%
|
223,643
|
|
9.2
|
%
|
|||||||
|
Air
|
100,761
|
|
82,167
|
|
22.6
|
%
|
79,096
|
|
3.9
|
%
|
|||||||
|
Customs
|
70,952
|
|
50,509
|
|
40.5
|
%
|
43,929
|
|
15.0
|
%
|
|||||||
|
Other Logistics Services
|
117,117
|
|
105,369
|
|
11.1
|
%
|
82,548
|
|
27.6
|
%
|
|||||||
|
Total Transportation
|
2,245,616
|
|
2,154,811
|
|
4.2
|
%
|
2,147,509
|
|
0.3
|
%
|
|||||||
|
Sourcing
|
122,434
|
|
122,717
|
|
(0.2
|
)%
|
120,971
|
|
1.4
|
%
|
|||||||
|
Total
|
$
|
2,368,050
|
|
$
|
2,277,528
|
|
4.0
|
%
|
$
|
2,268,480
|
|
0.4
|
%
|
||||
__________________________
(1)
Less than truckload (“LTL”).
The following table represents certain statements of operations data, shown as percentages of our net revenues:
|
For the years ended December 31,
|
2017
|
2016
|
2015
|
|||||
|
Net revenues
|
100.0
|
%
|
100.0
|
%
|
100.0
|
%
|
||
|
Operating expenses:
|
||||||||
|
Personnel expenses
|
49.8
|
%
|
46.8
|
%
|
46.3
|
%
|
||
|
Other selling, general, and administrative expenses
|
17.5
|
%
|
16.4
|
%
|
15.8
|
%
|
||
|
Total operating expenses
|
67.3
|
%
|
63.2
|
%
|
62.2
|
%
|
||
|
Income from operations
|
32.7
|
%
|
36.8
|
%
|
37.8
|
%
|
||
|
Interest and other expense
|
(2.0
|
)%
|
(1.1
|
)%
|
(1.6
|
)%
|
||
|
Income before provision for income taxes
|
30.8
|
%
|
35.7
|
%
|
36.3
|
%
|
||
|
Provision for income taxes
|
9.4
|
%
|
13.1
|
%
|
13.8
|
%
|
||
|
Net income
|
21.3
|
%
|
22.5
|
%
|
22.5
|
%
|
||
26
The following table summarizes our results by reportable segment (dollars in thousands):
|
NAST
|
Global Forwarding
|
Robinson Fresh
|
All Other and Corporate
|
Eliminations
|
Consolidated
|
||||||||||||||||||
|
Twelve months ended December 31, 2017
|
|||||||||||||||||||||||
|
Revenues
|
$
|
9,728,810
|
|
$
|
2,140,987
|
|
$
|
2,415,740
|
|
$
|
583,843
|
|
$
|
—
|
|
$
|
14,869,380
|
|
|||||
|
Intersegment revenues
|
462,390
|
|
30,198
|
|
167,292
|
|
18,174
|
|
(678,054
|
)
|
—
|
|
|||||||||||
|
Total Revenues
|
10,191,200
|
|
2,171,185
|
|
2,583,032
|
|
602,017
|
|
(678,054
|
)
|
14,869,380
|
|
|||||||||||
|
Net Revenues
|
1,525,064
|
|
485,280
|
|
226,059
|
|
131,647
|
|
—
|
|
2,368,050
|
|
|||||||||||
|
Operating Income
|
628,110
|
|
91,842
|
|
53,374
|
|
1,793
|
|
—
|
|
775,119
|
|
|||||||||||
|
Twelve months ended December 31, 2016
|
|||||||||||||||||||||||
|
Revenues
|
$
|
8,737,716
|
|
$
|
1,574,686
|
|
$
|
2,344,131
|
|
$
|
487,880
|
|
$
|
—
|
|
$
|
13,144,413
|
|
|||||
|
Intersegment revenues
|
298,438
|
|
30,311
|
|
119,403
|
|
2,211
|
|
(450,363
|
)
|
—
|
|
|||||||||||
|
Total Revenues
|
9,036,154
|
|
1,604,997
|
|
2,463,534
|
|
490,091
|
|
(450,363
|
)
|
13,144,413
|
|
|||||||||||
|
Net Revenues
|
1,524,355
|
|
397,537
|
|
234,794
|
|
120,842
|
|
—
|
|
2,277,528
|
|
|||||||||||
|
Operating Income
|
674,436
|
|
80,931
|
|
75,757
|
|
6,407
|
|
—
|
|
837,531
|
|
|||||||||||
|
Twelve months ended December 31, 2015
|
|||||||||||||||||||||||
|
Revenues
|
$
|
8,968,349
|
|
$
|
1,639,944
|
|
$
|
2,395,440
|
|
$
|
472,351
|
|
$
|
—
|
|
$
|
13,476,084
|
|
|||||
|
Intersegment revenues
|
271,557
|
|
19,102
|
|
89,033
|
|
2,107
|
|
(381,799
|
)
|
—
|
|
|||||||||||
|
Total Revenues
|
9,239,906
|
|
1,659,046
|
|
2,484,473
|
|
474,458
|
|
(381,799
|
)
|
13,476,084
|
|
|||||||||||
|
Net Revenues
|
1,564,917
|
|
365,467
|
|
235,334
|
|
102,762
|
|
—
|
|
2,268,480
|
|
|||||||||||
|
Operating Income/(Loss)
|
718,329
|
|
76,081
|
|
81,332
|
|
(17,432
|
)
|
—
|
|
858,310
|
|
|||||||||||
2017
COMPARED TO 2016
Total revenues and direct costs.
Total transportation revenues
increased
15.4 percent
to
$13.5 billion
in
2017
from
$11.7 billion
in
2016
. This
increase
in transportation revenues was driven by volume increases in all of our transportation services and increased customer pricing in most services. Total purchased transportation and related services
increased
17.9 percent
in
2017
to
$11.3 billion
from
$9.5 billion
in
2016
. This
increase
was due to increased transportation costs and higher volumes in nearly all of our transportation services. Total sourcing revenues
decreased
5.1 percent
to
$1.37 billion
in
2017
from
$1.44 billion
in
2016
. Purchased products sourced for resale
decreased
5.5 percent
in
2017
to
$1.2 billion
from
$1.3 billion
in
2016
. These decreases were primarily due to lower market pricing and change in service mix.
Net revenues.
Total transportation net revenues
increased
4.2 percent
in
2017
to
$2.25 billion
from
$2.15 billion
in
2016
. Our transportation net revenue margin
decreased
to
16.6 percent
in
2017
from
18.4 percent
in
2016
. This
decrease
in net revenue margin was driven by increases in transportation costs, including fuel. Total sourcing net revenues
decreased
0.2 percent
to
$122.4 million
in
2017
from
$122.7 million
in
2016
. This
decrease
was primarily due to a decrease in net revenue per case, partially offset by a case volume increase across a variety of commodities and services. Sourcing net revenue margin
increased
to
9.0 percent
in
2017
from
8.5 percent
in
2016
.
Operating expenses.
Operating expenses consist of personnel and selling, general, and administrative expenses. Operating expenses
increased
10.6 percent
to
$1.6 billion
in
2017
from
$1.4 billion
in
2016
. This was due to an
increase
of
10.8 percent
in personnel expenses and an
increase
of
10.2 percent
in other selling, general, and administrative expenses. As a percentage of net revenues, operating expenses
increased
to
67.3 percent
in
2017
from
63.2 percent
in
2016
.
Our personnel expenses are driven primarily by headcount and earnings growth. In
2017
, personnel expenses
increased
10.8 percent
to
$1.2 billion
from
$1.1 billion
in
2016
. Personnel expenses as a percentage of net revenue increased in
2017
to
49.8 percent
from
46.8 percent
in
2016
. The
increase
in personnel expense was due primarily to growth in our average headcount of
7.4 percent
in
2017
compared to
2016
and increases in expenses related to incentive plans that are designed to keep expenses variable with changes in net revenues and profitability.
27
Other selling, general, and administrative expenses
increased
10.2 percent
to
$413.4 million
in
2017
from
$375.1 million
in
2016
. This
increase
in selling, general, and administrative expenses was primarily due to increases in acquisition amortization, warehousing and occupancy expenses, and the provision for bad debt, partially offset by a decrease in travel expenses and claims.
Income from operations.
Income from operations
decreased
7.5 percent
to
$775.1 million
in
2017
from
$837.5 million
in
2016
. Income from operations as a percentage of net revenues
decreased
to
32.7 percent
in
2017
from
36.8 percent
in
2016
. This
decrease
was due to our operating expenses growing more than our net revenues and a decline in transportation net revenue margin.
Interest and other expense.
Interest and other expense was
$46.7 million
in
2017
compared to
$25.6 million
in
2016
. The increase was primarily due to a higher average debt balance and higher interest rates in
2017
compared to
2016
.
Provision for income taxes.
Our effective income tax rate was
30.7 percent
for
2017
and
36.8 percent
for
2016
. During the
fourth quarter
of
2017
, the provision for income taxes decreased by $19.7 million due to the benefit of deductions under Section 199 of the Internal Revenue Code and $12.1 million due to the impact of the Tax Cuts and Jobs Act (the “Tax Act”), which was signed into law on December 22, 2017. The $12.1 million benefit resulting from the Tax Act was primarily the result of the revaluation of deferred tax assets and liabilities due to the decrease in the corporate Federal income tax rate from 35 percent to 21 percent and was partially offset by the impact of certain transition taxes and other impacts of the Tax Act.
During the first quarter of 2017, we adopted ASU 2016-09, Compensation - Stock Compensation (Topic 718). The adoption of ASU 2016-09 prospectively impacts the recording of income taxes related to share-based payment awards in our consolidated financial position and results of operations, as well as the operating and financing cash flows on the consolidated statements of cash flows. This adoption resulted in a net tax benefit of $13.7 million during the year.
During the first quarter of 2016, we asserted that we will indefinitely reinvest earnings of foreign subsidiaries to support expansion of our international businesses. During
2017
, our indefinite reinvestment strategy with respect to unremitted earnings of our foreign subsidiaries, provided an approximate
$3.7 million
benefit to our provision for income taxes. If we repatriated all foreign earnings, the estimated effect on income taxes payable would be an increase of approximately
$12.1 million
as of
December 31, 2017
.
Net income.
Net income
decreased
1.7 percent
to
$504.9 million
in
2017
from
$513.4 million
in
2016
. Basic net income per share
decreased
0.3 percent
to
$3.59
in
2017
from
$3.60
in
2016
. Diluted net income per share
decreased
0.6 percent
to
$3.57
in
2017
from
$3.59
in
2016
.
SEGMENT RESULTS OF OPERATIONS-
2017
COMPARED TO
2016
North American Surface Transportation.
NAST revenues
increased
11.3 percent
to
$9.7 billion
in
2017
compared to
$8.7 billion
in
2016
. This was primarily due to increased volumes and increased pricing to our customers. NAST cost of purchased transportation and related services
increased
13.7 percent
to
$8.2 billion
in
2017
from
$7.2 billion
in
2016
. This
increase
was primarily due to increased volumes and higher transportation costs. Total NAST net revenues were flat at
$1.5 billion
in
2017
. This was driven by a decline in truckload and intermodal net revenues, partially offset by an increase in LTL net revenues. NAST net revenue margin
decreased
primarily due to transportation costs growing faster than customer pricing in
2017
compared to
2016
.
NAST truckload net revenues
decreased
1.8 percent
in
2017
to
$1.09 billion
from
$1.11 billion
in
2016
. NAST truckload volumes increased approximately 4.5 percent in
2017
compared to
2016
. NAST truckload net revenue margin decreased in
2017
compared to
2016
, due primarily to increased transportation costs.
NAST truckload net revenues accounted for approximately 93 percent of our total North America truckload net revenues in
2017
and approximately 92 percent in
2016
. The majority of the remaining North American truckload net revenues is included in Robinson Fresh. Excluding the estimated impacts of the change in fuel prices, our average North America truckload rate per mile charged to our customers increased approximately 4.5 percent in
2017
compared to
2016
. Excluding the estimated impacts of the change in fuel prices, our average North America truckload transportation cost per mile increased approximately 6.5 percent in
2017
compared to
2016
.
NAST LTL net revenues
increased
6.2 percent
in
2017
to
$388.8 million
from
$366.1 million
in
2016
. NAST LTL volumes increased approximately eight percent in
2017
compared to
2016
and net revenue margin decreased. NAST LTL net revenue margin decreased due to increased transportation costs.
28
NAST intermodal net revenues
decreased
14.6 percent
to
$26.7 million
in
2017
from
$31.3 million
in
2016
. This was primarily due to declines in net revenue margin, partially offset by increased volumes with our lower-margin contractual customers, partially offset by a decrease in transactional business.
NAST operating expenses
increased
5.5 percent
in
2017
to
$897.0 million
from
$849.9 million
in
2016
. This was due to an increase in personnel expenses related to incentive plans that are designed to keep expenses variable with changes in net revenues and profitability, and an increase in selling, general, and administrative expenses. The operating expenses of NAST and all other segments include allocated corporate expenses.
NAST operating income
decreased
6.9 percent
to
$628.1 million
in
2017
from
$674.4 million
in
2016
. This was primarily due to increases in operating expenses, while net revenues remained flat.
Global Forwarding.
Global Forwarding revenues
increased
36.0 percent
to
$2.1 billion
in
2017
from
$1.6 billion
in
2016
. This
increase
was primarily related to increased volumes in all services and increased customer pricing. Global Forwarding costs of transportation and related services
increased
40.7 percent
to
$1.7 billion
in
2017
from
$1.2 billion
in
2016
. Global Forwarding net revenues
increased
22.1 percent
to
$485.3 million
in
2017
from
$397.5 million
in
2016
. Global Forwarding net revenue margin
decreased
due to transportation costs increasing at a faster rate than customer pricing. The acquisitions of APC and Milgram accounted for approximately eight percentage points of the net revenue growth in Global Forwarding.
Ocean transportation net revenues
increased
19.1 percent
to
$290.8 million
in
2017
from
$244.2 million
in
2016
. This was primarily due to increases in volumes, including those from acquisitions. Air net revenues
increased
24.1 percent
to
$94.5 million
in
2017
from
$76.1 million
in
2016
. This was primarily due to increases in volumes partially offset by cost increases. Customs net revenues
increased
40.5 percent
to
$70.9 million
in
2017
from
$50.5 million
in
2016
. The
increase
was primarily due to increased transaction volumes, including those from acquisitions.
Global Forwarding operating expenses
increased
24.3 percent
in
2017
to
$393.4 million
from
$316.6 million
in
2016
. This
increase
was due to increases in both personnel and selling, general, and administrative expenses. The personnel expense increase was driven by an average headcount increase of
17.3 percent
, primarily due to the additions of APC and Milgram. The selling, general, and administrative expense increase was also primarily driven by the additions of APC and Milgram.
Global Forwarding operating income
increased
13.5 percent
in
2017
to
$91.8 million
from
$80.9 million
in
2016
. This was primarily due to an
increase
in net revenues driven by increased volumes and customer pricing, partially offset by increased operating expenses.
Robinson Fresh.
Robinson Fresh revenues
increased
3.1 percent
to
$2.4 billion
in
2017
from
$2.3 billion
in
2016
. Robinson Fresh costs of transportation and related services and purchased products sourced for resale
increased
3.8 percent
to
$2.2 billion
in
2017
from
$2.1 billion
in
2016
. Robinson Fresh net revenues
decreased
3.7 percent
to
$226.1 million
in
2017
from
$234.8 million
in
2016
. This
decrease
was primarily due to declines in transportation net revenues.
Robinson Fresh sourcing net revenues
decreased
0.2 percent
to
$122.4 million
in
2017
from
$122.7 million
in
2016
. This
decrease
was primarily due to a decrease in net revenue per case, partially offset by a one percent case volume increase. Robinson Fresh net revenues from transportation services
decreased
7.5 percent
to
$103.6 million
in
2017
from
$112.1 million
in
2016
. This
decrease
was driven by a decline in truckload net revenues, partially offset by an increase in other transportation net revenues. Robinson Fresh transportation net revenue margin
decreased
in
2017
compared to
2016
, due primarily to increased costs of transportation.
Robinson Fresh operating expenses
increased
8.6 percent
to
$172.7 million
in
2017
from
$159.0 million
in
2016
. This was due to increases in both selling, general and administrative and personnel expenses. The increase in selling, general, and administrative expenses was due to higher warehousing and claims expenses in
2017
compared to
2016
. In
2017
, personnel expenses increased primarily due to an increase in salaries and an increase in average headcount of
1.6 percent
in
2017
compared to
2016
.
Robinson Fresh operating income
decreased
29.5 percent
to
$53.4 million
in
2017
from
$75.8 million
in
2016
. This was primarily due to an
increase
in operating expenses and a
decrease
in net revenues.
All Other and Corporate.
All Other and Corporate includes our Managed Services segment, as well as Other Surface Transportation outside of North America and other miscellaneous revenues and unallocated corporate expenses. Managed Services provides Transportation Management Services, or Managed TMS
®
. Other Surface Transportation revenues are primarily earned by Europe Surface Transportation. Europe Surface Transportation provides services similar to NAST across Europe.
29
Managed Services net revenues
increased
11.5 percent
to
$72.2 million
in
2017
from
$64.7 million
in
2016
. This
increase
was primarily due to volume growth with new and existing customers. Other Surface Transportation net revenues
increased
5.9 percent
to
$59.5 million
in
2017
from
$56.1 million
in
2016
. This
increase
is primarily the result of volume growth, partially offset by margin compression in the surface transportation business in Europe.
2016 COMPARED TO 2015
Total revenues and direct costs.
Total transportation revenues decreased 2.4 percent to $11.7 billion in 2016 from $12.0 billion in 2015. This decrease in transportation revenues was driven by lower customer pricing in truckload, partially offset by volume increases in nearly all of our transportation services. Total purchased transportation and related services decreased 3.0 percent in 2016 to $9.5 billion from $9.8 billion in 2015. This decrease was due to decreased transportation costs, partially offset by higher volumes in nearly all of our transportation services. Total sourcing revenues decreased 3.1 percent to $1.4 billion in 2016 from $1.5 billion in 2015. Purchased products sourced for resale decreased 3.5 percent in 2016 to $1.3 billion from $1.4 billion in 2015. These decreases were primarily due to lower market pricing and change in service mix.
Net revenues.
Total transportation net revenues increased 0.3 percent in 2016 to $2.2 billion from $2.1 billion in 2015. Our transportation net revenue margin increased to 18.4 percent in 2016 from 17.9 percent in 2015. This increase in net revenue margin was driven by decreases in transportation costs and customer pricing, including fuel. Total sourcing net revenues increased 1.4 percent to $122.7 million in 2016 from $121.0 million in 2015. This increase was primarily due to a case volume increase across a variety of commodities and services, partially offset by a decrease in net revenue per case. Sourcing net revenue margin increased to 8.5 percent in 2016 from 8.1 percent in 2015.
Operating expenses.
Operating expenses consist of personnel and selling, general, and administrative expenses. Operating expenses increased 2.1 percent to $1.44 billion in 2016 from $1.41 billion in 2015. This was due to an increase of 1.3 percent in personnel expenses and an increase of 4.5 percent in other selling, general, and administrative expenses. As a percentage of net revenues, operating expenses increased to 63.2 percent in 2016 from 62.2 percent in 2015.
Our personnel expenses are driven primarily by headcount and earnings growth. In 2016, personnel expenses increased 1.3 percent to $1.06 billion from $1.05 billion in 2015. Personnel expenses as a percentage of net revenue increased in 2016 to 46.8 percent from 46.3 percent in 2015. The increase in personnel expense was due primarily to an increase in average headcount growth of 6.0 percent in 2016, due in part to the acquisition of APC. The headcount growth was partially offset by decreases in personnel expenses related to incentive plans that are designed to keep expenses variable with changes in net revenues and profitability.
Other selling, general, and administrative expenses increased 4.5 percent to $375.1 million in 2016 from $358.8 million in 2015. This increase in selling, general, and administrative expenses was primarily due to increases in warehousing and travel expenses, partially offset by decreases in the provision for bad debt and occupancy expenses.
Income from operations.
Income from operations decreased 2.4 percent to $837.5 million in 2016 from $858.3 million in 2015. Income from operations as a percentage of net revenues decreased to 36.8 percent in 2016 from 37.8 percent in 2015. This decrease was due to our operating expenses growing more than our net revenues.
Interest and other expense.
Interest and other expense was $25.6 million in 2016 compared to $35.5 million in 2015. During the fourth quarter of 2015, we wrote off an indemnification asset of $7.2 million related to the acquisition of Phoenix as the indemnification obligations of the sellers expired. The impact of this write off was partially offset within the provision for income taxes by related tax liabilities that expired under applicable statute of limitations.
Provision for income taxes.
Our effective income tax rate was 36.8 percent for 2016 and 38.1 percent for 2015. During the first quarter of 2016, we asserted that we will indefinitely reinvest earnings of foreign subsidiaries to support expansion of our international businesses. During 2016, the assertion decreased deferred income taxes related to undistributed foreign earnings and reduced the effective tax rate compared to 2015. In 2016, our indefinite reinvestment strategy with respect to unremitted earnings of our foreign subsidiaries provided an approximate $5.1 million benefit to our provision for income taxes. If we repatriated all foreign earnings, the estimated effect on income taxes payable would be an increase of approximately
$16.6 million
as of December 31, 2016. Additionally, the effective income tax rate for both periods is greater than the statutory federal income tax rate, primarily due to state income taxes, net of federal benefit.
Net income.
Net income increased 0.7 percent to $513.4 million in 2016 from $509.7 million in 2015. Basic net income per share increased 2.3 percent to $3.60 in 2016 from $3.52 in 2015. Diluted net income per share increased 2.3 percent to $3.59 in 2016 from $3.51 in 2015.
30
SEGMENT RESULTS OF OPERATIONS-2016 COMPARED TO 2015
North American Surface Transportation.
NAST total revenues decreased 2.6 percent to $8.7 billion in 2016 compared to $9.0 billion in 2015. This was primarily due to decreased pricing to our customers, partially offset by increased volumes. NAST cost of purchased transportation and related services decreased 2.6 percent to $7.2 billion in 2016 from $7.4 billion in 2015. This decrease was primarily due to lower transportation costs. Total NAST net revenues decreased 2.6 percent to $1.5 billion in 2016 from $1.6 billion in 2015. The decrease was driven by a decline in truckload and intermodal net revenues, partially offset by an increase in LTL net revenues.
NAST truckload net revenues decreased 4.7 percent in 2016 to $1.1 billion from $1.2 billion in 2015. NAST truckload volumes increased approximately 5.5 percent in 2016 compared to 2015. NAST truckload net revenue margin decreased in 2016 compared to 2015, due primarily to lower customer pricing.
NAST truckload net revenues accounted for approximately 92 percent of our total North America truckload net revenues in 2016 and 2015. The majority of the remaining North American truckload net revenues is included in Robinson Fresh. Excluding the estimated impacts of the change in fuel prices, our average North America truckload rate per mile charged to our customers decreased approximately 5.0 percent in 2016 compared to 2015. Excluding the estimated impacts of the change in fuel prices, our average North America truckload transportation cost per mile decreased approximately 4.5 percent in 2016 compared to 2015.
NAST LTL net revenues increased 5.1 percent in 2016 to $366.1 million from $348.3 million in 2015. NAST LTL volumes increased approximately 7.5 percent in 2016 compared to 2015, and net revenue margin increased slightly.
NAST intermodal net revenues decreased 20.1 percent to $31.3 million in 2016 from $39.2 million in 2015. This was primarily due to declines in net revenue margin and volumes. During 2016, intermodal opportunities were negatively impacted by the alternative lower-cost truck market.
NAST operating expenses increased 0.4 percent in 2016 to $849.9 million from $846.6 million in 2015. This was primarily due to increases in selling, general, and administrative expenses, partially offset by a decrease in personnel expenses related to incentive plans that are designed to keep expenses variable with changes in net revenues and profitability. The operating expenses of NAST and all other segments include allocated corporate expenses.
NAST operating income decreased 6.1 percent to $674.4 million in 2016 from $718.3 million in 2015. This was primarily due to a decline in total revenues and net revenues caused by lower customer pricing.
Global Forwarding.
Global Forwarding total revenues decreased 4.0 percent to $1.57 billion in 2016 from $1.64 billion in 2015. This decrease was primarily related to lower customer pricing across ocean and air services, partially offset by increased volumes in all services. Global Forwarding costs of transportation and related services decreased 7.6 percent to $1.2 billion in 2016 from $1.3 billion in 2015. Global Forwarding net revenues increased 8.8 percent to $397.5 million in 2016 from $365.5 million in 2015. Global Forwarding net revenue margin increased due to transportation costs declining at a faster rate than customer pricing.
Ocean transportation net revenues increased 9.4 percent to $244.2 million in 2016 from $223.3 million in 2015. This was primarily due to increases in volumes. Air net revenues increased 3.9 percent to $76.1 million in 2016 from $73.3 million in 2015. This was primarily due to increases in volumes offset by pricing declines. Customs net revenues increased 14.9 percent to $50.5 million in 2016 from $44.0 million in 2015. The increase was primarily due to increased transaction volumes.
Global Forwarding operating expenses increased 9.4 percent in 2016 to $316.6 million from $289.4 million in 2015. This increase was primarily due to an increase in claims expense, and the acquisition of APC on September 30, 2016.
Global Forwarding operating income increased 6.4 percent in 2016 to $80.9 million from $76.1 million in 2015. This was primarily due to an increase in net revenues driven by higher volumes, partially offset by increased operating expenses.
Robinson Fresh.
Robinson Fresh total revenues decreased 2.1 percent to $2.3 billion in 2016 from $2.4 billion in 2015. Robinson Fresh costs of transportation and related services and purchased products sourced for resale decreased 2.4 percent in to $2.1 billion in 2016 from $2.2 billion in 2015. Robinson Fresh net revenues decreased 0.2 percent to $234.8 million in 2016 from $235.3 million in 2015. This decrease was due to declines in transportation net revenues, partially offset by an increase in sourcing net revenue.
Robinson Fresh net revenues from sourcing services increased 1.4 percent to $122.7 million in 2016 from $121.0 million in 2015. This increase was primarily due to a case volume increase across a variety of commodities and services, partially offset by a decrease in net revenue per case. Robinson Fresh net revenues from transportation services decreased 2.0 percent to
31
$112.1 million in 2016 from $114.4 million in 2015. Robinson Fresh transportation net revenue margin decreased in 2016 compared to 2015, due primarily to lower customer pricing.
Robinson Fresh operating expenses increased 3.3 percent to $159.0 million in 2016 from $154.0 million in 2015. This increase was primarily due to an increase in warehousing expenses. In 2016, growth in Robinson Fresh headcount was offset by a decrease in variable compensation.
Robinson Fresh operating income decreased 6.9 percent to $75.8 million in 2016 from $81.3 million in 2015. This was primarily due to a decrease in transportation services net revenues, and an increase in operating expenses.
All Other and Corporate.
All Other and Corporate includes our Managed Services segment, as well as Other Surface Transportation outside of North America and other miscellaneous revenues and unallocated corporate expenses. Managed Services provides Transportation Management Services, or Managed TMS. Other Surface Transportation revenues are primarily earned by Europe Surface Transportation. Europe Surface Transportation provides services similar to NAST across Europe.
Managed Services net revenues increased 32.7 percent to $64.7 million in 2016 from $48.7 million in 2015. This increase was primarily due to volume growth with new and existing customers. Other Surface Transportation net revenues increased 3.9 percent to $56.1 million in 2016 from $54.0 million in 2015, primarily the result of volume growth in Europe Surface Transportation.
LIQUIDITY AND CAPITAL RESOURCES
We have historically generated substantial cash from operations, which has enabled us to fund our growth while paying cash dividends and repurchasing stock. In December 2014, we amended our revolving credit facility to increase the amount available from $500 million to $900 million, to extend the expiration date from October 2017 to December 2019, and to revise a covenant ratio. In 2013, we entered into a Note Purchase Agreement to fund the accelerated share repurchase agreements to repurchase $500 million worth of our common stock. The Note Purchase Agreement was amended in February 2015 to conform its financial covenants to be consistent with the amended revolving credit facility. In April 2017, we entered into a $250 million U.S. Trade Accounts Receivable Securitization facility to reduce the amount outstanding on our revolving credit facility. We also expect to use the revolving credit facility, and potentially other indebtedness incurred in the future, to assist us in continuing to fund working capital, capital expenditures, possible acquisitions, dividends, and share repurchases. Cash and cash equivalents totaled
$333.9 million
and
$247.7 million
as of
December 31, 2017
and
2016
. Cash and cash equivalents held outside the United States totaled
$275.3 million
and $172.2 million as of
December 31, 2017
and
2016
. Working capital at
December 31, 2017
, was
$523.5 million
. Working capital at
December 31, 2016
, was
$162.4 million
.
We prioritize our investments to grow the business, as we require some working capital and a relatively small amount of capital expenditures to grow. We are continually looking for acquisitions, but those acquisitions must fit our culture and enhance our growth opportunities.
Cash flow from operating activities.
We generated
$384.0 million
,
$529.4 million
, and $718.3 million of cash flow from operations in
2017
,
2016
, and 2015. The decrease of
$145.4 million
and in cash flow from operations in
2017
from
2016
is primarily the result of increased working capital driven by the impact of increased volumes and a deterioration of our accounts receivable aging. The decrease of $188.9 million in cash flow from operations in 2016 from 2015 is primarily the result of increases in accounts receivable, partially offset by an increase in accounts payable. The increases in accounts receivable and accounts payable are primarily the result of increased volumes. Additionally, accruals for variable compensation were lower in 2016 compared to 2015.
Cash used for investing activities.
We used
$107.5 million
,
$313.0 million
, and $54.4 million of cash for investing activities in
2017
,
2016
, and 2015. Our investing activities consist primarily of capital expenditures and cash paid for acquisitions. In 2017, we paid
$47.3 million
for the acquisition of Milgram. In 2016, we paid
$220.2 million
for the acquisition of APC.
We used
$57.9 million
,
$91.4 million
, and $44.6 million of cash for capital expenditures in
2017
,
2016
, and 2015. We spent $29.0 million, $25.0 million, and $26.0 million in
2017
,
2016
, and 2015 primarily for annual investments in information technology equipment to support our operating systems, including the purchase and development of software. These information technology investments are intended to improve efficiencies and help grow the business. Additionally, in 2016, we completed construction of a second data recovery center. The cost of this data recovery center was $20.0 million, $19.3 million of which was spent in 2016.
We anticipate capital expenditures in 2018 to be approximately $60 to $70 million.
32
Cash used for financing activities.
We used
$202.1 million
,
$127.3 million
, and $607.7 million of cash flow for financing activities in
2017
,
2016
, and 2015.
We had net short-term repayments of
$25.0 million
in
2017
and net short-term borrowings of
$290.0 million
in
2016
. The outstanding balance on the revolving credit facility was
$715.0 million
as of
December 31, 2017
.
During 2017, we had long-term borrowings of $250.0 million on the Receivables Securitization Facility. The outstanding balance on the Receivables Securitization Facility was $250.0 million as of
December 31, 2017
. We were in compliance with all of the covenants under the Credit Agreement, Note Purchase Agreement, and Receivables Securitization Facility as of
December 31, 2017
.
We used
$258.2 million
,
$245.4 million
, and $235.6 million to pay cash dividends in
2017
,
2016
, and 2015. The increases were primarily the result of higher dividend rates, partially offset by fewer outstanding shares.
We used
$21.6 million
,
$36.7 million
, and $11.4 million for stock tendered for payment of withholding taxes in
2017
,
2016
, and 2015.
We also used
$185.5 million
,
$172.9 million
, and $229.9 million on share repurchases in
2017
,
2016
, and 2015, as part of our Board approved repurchase program. In August 2013, the Board of Directors increased the number of shares authorized to be repurchased by 15,000,000 shares. As of
December 31, 2017
, there were
1,992,157
shares remaining for future repurchases. The number of shares we repurchase, if any, during future periods will vary based on our cash position, potential uses of our cash, and market conditions.
Assuming no change in our current business plan, management believes that our available cash, together with expected future cash generated from operations, the amount available under our credit facility, and credit available in the market, will be sufficient to satisfy our anticipated needs for working capital, capital expenditures, and cash dividends for at least the next 12 months. We also believe we could obtain funds under lines of credit or other forms of indebtedness on short notice, if needed.
CRITICAL ACCOUNTING POLICIES AND ESTIMATES
Our consolidated financial statements include accounts of the company and all majority-owned subsidiaries. The preparation of financial statements in conformity with accounting principles generally accepted in the United States requires management to make estimates and assumptions. In certain circumstances, those estimates and assumptions can affect amounts reported in the accompanying consolidated financial statements and related footnotes. In preparing our financial statements, we have made our best estimates and judgments of certain amounts included in the financial statements, giving due consideration to materiality. We do not believe there is a great likelihood that materially different amounts would be reported related to the accounting policies described below. However, application of these accounting policies involves the exercise of judgment and use of assumptions as to future uncertainties and, as a result, actual results could differ from these estimates. Note 1 of the Notes to consolidated financial statements includes a summary of the significant accounting policies and methods used in the preparation of our consolidated financial statements. The following is a brief discussion of our critical accounting policies and estimates.
Revenue recognition.
Total revenues consist of the total dollar value of goods and services purchased from us by customers. Net revenues are total revenues less the direct costs of transportation, products, and handling. We act principally as the service provider for these transactions and recognize revenue as these services are rendered or goods are delivered. At that time, our obligations to the transactions are completed and collection of receivables is reasonably assured. Most transactions in our transportation and sourcing businesses are recorded at the gross amount we charge our customers for the service we provide and goods we sell. In these transactions, we are the primary obligor, we have credit risk, we have discretion to select the supplier, and we have latitude in pricing decisions.
Additionally, in our sourcing business, we take loss of inventory risk during shipment and have general inventory risk. Certain transactions in customs brokerage, managed services, freight forwarding, and sourcing are recorded at the net amount we charge our customers for the service we provide because many of the factors stated above are not present.
Valuations for accounts receivable.
Our allowance for doubtful accounts is calculated based upon the aging of our receivables, our historical experience of uncollectible accounts, and any specific customer collection issues that we have identified. The allowance of
$42.4 million
as of
December 31, 2017
, increased compared to the allowance of
$39.5 million
as of
December 31, 2016
. This increase was primarily due to growth in the balance and deterioration of the aging of our accounts receivable portfolio. We believe that the recorded allowance is sufficient and appropriate based on our customer aging trends, the exposures we have identified, and our historical loss experience.
33
Goodwill.
Goodwill represents the excess of the cost of acquired businesses over the net of the fair value of identifiable tangible net assets and identifiable intangible assets purchased and liabilities assumed.
Goodwill is tested for impairment annually on November 30, or more frequently if events or changes in circumstances indicate that the asset might be impaired. We first perform a qualitative assessment to determine whether it is more likely than not that the fair value of our reporting units is less than their respective carrying value (“Step Zero Analysis”). If the Step Zero Analysis indicates it is more likely than not that the fair value of our reporting units is less than their respective carrying value, an additional impairment assessment is performed (“Step 1 Analysis”). Based on our Step Zero Analysis, we determined that the more likely than not criteria had not been met, and therefore a Step 1 Analysis was not required.
When we perform a Step 1 Analysis, the fair value of each reporting unit is compared with the carrying amount of the reporting unit, including goodwill. If the carrying amount of a reporting unit exceeds its fair value, an impairment loss is recognized in an amount equal to that excess, limited to the total amount of goodwill allocated to that reporting unit. We have early adopted Accounting Standards Update 2017-04,
Intangibles–Goodwill and Other (Topic 350): Simplifying the Test for Goodwill Impairment,
which eliminates the need for further testing after the Step 1 Analysis.
In the Step 1 Analysis, the fair value of each reporting unit is determined using a discounted cash flow analysis and market approach. Projecting discounted future cash flows requires us to make significant estimates regarding future revenues and expenses, projected capital expenditures, changes in working capital, and the appropriate discount rate. Use of the market approach consists of comparisons to comparable publicly-traded companies that are similar in size and industry. Actual results may differ from those used in our valuations when a Step 1 analysis is performed.
Stock-based compensation.
We issue stock awards, including stock options, performance shares, and restricted stock units, to key employees and outside directors. In general, the awards vest over five years, either based on the company’s earnings growth or the passage of time. The fair value of each share-based payment award is established on the date of grant. For grants of restricted shares and restricted units, the fair value is established based on the market price on the date of the grant, discounted for post-vesting holding restrictions. The discounts on outstanding grants vary from
15 percent
to
21 percent
and are calculated using the Black-Scholes option pricing model. Changes in the measured stock price volatility and interest rates are the primary reason for changes in the discount. For grants of options, we use the Black-Scholes option pricing model to estimate the fair value of the awards. The determination of the fair value is affected by our stock price and a number of assumptions, including expected volatility, expected life, risk-free interest rate, and expected dividends.
34
DISCLOSURES ABOUT CONTRACTUAL OBLIGATIONS AND COMMERCIAL CONTINGENCIES
The following table aggregates all contractual commitments and commercial obligations, due by period, that affect our financial condition and liquidity position as of
December 31, 2017
(dollars in thousands):
|
2018
|
2019
|
2020
|
2021
|
2022
|
Thereafter
|
Total
|
|||||||||||||||||||||
|
Borrowings under credit agreements
|
$
|
715,000
|
|
$
|
250,000
|
|
$
|
—
|
|
$
|
—
|
|
$
|
—
|
|
$
|
—
|
|
$
|
965,000
|
|
||||||
|
Long-term notes payable
(1)
|
21,388
|
|
21,388
|
|
21,388
|
|
21,388
|
|
21,388
|
|
633,838
|
|
740,778
|
|
|||||||||||||
|
Operating leases
(2)
|
51,273
|
|
46,172
|
|
39,825
|
|
29,851
|
|
22,807
|
|
92,797
|
|
282,725
|
|
|||||||||||||
|
Purchase obligations
(3)
|
81,133
|
|
21,058
|
|
12,433
|
|
9,869
|
|
98
|
|
392
|
|
124,983
|
|
|||||||||||||
|
Total
|
$
|
868,794
|
|
$
|
338,618
|
|
$
|
73,646
|
|
$
|
61,108
|
|
$
|
44,293
|
|
$
|
727,027
|
|
$
|
2,113,486
|
|
||||||
|
(1)
|
Amounts payable relate to the semi-annual interest due on the long-term notes and the principal amount at maturity.
|
|
(2)
|
We have certain facilities and equipment under operating leases.
|
|
(3)
|
Purchase obligations include agreements for services that are enforceable and legally binding and that specify all significant terms. As of
December 31, 2017
, such obligations include ocean and air freight capacity, telecommunications services, and maintenance contracts.
|
We have no capital lease obligations. Long-term liabilities consist of noncurrent income taxes payable, long-term notes payable, and the obligation under our non-qualified deferred compensation plan. Due to the uncertainty with respect to the timing of future cash flows associated with our unrecognized tax benefits at
December 31, 2017
, we are unable to make reasonably reliable estimates of the period of cash settlement with the respective taxing authority. Therefore,
$38.6 million
of unrecognized tax benefits have been excluded from the contractual obligations table above. See Note 5 to the consolidated financial statements for a discussion on income taxes. The obligation under our non-qualified deferred compensation plan has also been excluded from the above table as the timing of cash payment is uncertain. As of
December 31, 2017
, we did not have any off-balance sheet arrangements as defined in Item 303(a)(4)(ii) of SEC Regulation S-K.
|
ITEM 7A.
|
QUANTITATIVE AND QUALITATIVE DISCLOSURES ABOUT MARKET RISK
|
We had
$333.9 million
of cash and cash equivalents on
December 31, 2017
. Substantially all of the cash equivalents are in demand accounts with financial institutions. The primary market risks associated with these investments are liquidity risks.
We are a party to a credit agreement with various lenders consisting of a $900 million revolving loan facility. Interest accrues on the revolving loan at variable rates based on LIBOR or “prime” plus the applicable add-on percentage as defined. At
December 31, 2017
, there was
$715 million
outstanding on the revolving loan.
We are a party to the Note Purchase Agreement, as amended, with various institutional investors with fixed rates consisting of: (i) $175 million of the company’s 3.97 percent Senior Notes, Series A, due August 27, 2023, (ii) $150 million of the company’s 4.26 percent Senior Notes, Series B, due August 27, 2028, and (iii) $175 million of the company’s 4.60 percent Senior Notes, Series C, due August 27, 2033. At
December 31, 2017
, there was $500 million outstanding on the notes.
We are a party to a receivables securitization facility with various lenders that provides funding of up to $250 million. Interest accrues on the facility at variable rates based on the asset-backed commercial paper rate or the 30-day LIBOR plus the applicable add-on percentage as defined therein. At
December 31, 2017
, there was $250 million outstanding on the securitization facility.
A hypothetical 100-basis-point change in the interest rate would not have a material effect on our earnings. We do not use derivative financial instruments to manage interest rate risk or to speculate on future changes in interest rates. A rise in interest rates could negatively affect the fair value of our investments. Market risk arising from changes in foreign currency exchange rates are not material due to the size of our international operations.
35
|
ITEM 8.
|
FINANCIAL STATEMENTS AND SUPPLEMENTARY DATA
|
REPORT OF INDEPENDENT REGISTERED PUBLIC ACCOUNTING FIRM
The Stockholders and the Board of Directors of
C.H. Robinson Worldwide, Inc.
Opinion on the Financial Statement
s
We have audited the accompanying consolidated balance sheets of C.H. Robinson Worldwide, Inc. and subsidiaries (the “Company”) as of December 31, 2017 and 2016, and the related consolidated statements of operations and comprehensive income, stockholders’ investment, and cash flows for each of the three years in the period ended December 31, 2017, and the related notes and the schedule listed in the Index at Item 15 (collectively referred to as the "financial statements"). In our opinion, the financial statements present fairly, in all material respects, the financial position of the Company as of December 31, 2017 and 2016, and the results of their operations and their cash flows for each of the three years in the period ended December 31, 2017, in conformity with accounting principles generally accepted in the United States of America.
We have also audited, in accordance with the standards of the Public Company Accounting Oversight Board (United States) (PCAOB), the Company's internal control over financial reporting as of December 31, 2017, based on criteria established in Internal Control - Integrated Framework (2013) issued by the Committee of Sponsoring Organizations of the Treadway Commission and our report dated February 28, 2018, expressed an unqualified opinion on the Company’s internal control over financial reporting.
Basis for Opinion
These financial statements are the responsibility of the Company's management. Our responsibility is to express an opinion on the Company's financial statements based on our audits. We are a public accounting firm registered with the PCAOB and are required to be independent with respect to the Company in accordance with the U.S. federal securities laws and the applicable rules and regulations of the Securities and Exchange Commission and the PCAOB.
We conducted our audits in accordance with the standards of the Public Company Accounting Oversight Board (United States). Those standards require that we plan and perform the audit to obtain reasonable assurance about whether the financial statements are free of material misstatement, whether due to error or fraud. Our audits included performing procedures to assess the risks of material misstatement of the financial statements, whether due to error or fraud, and performing procedures that respond to those risks. Such procedures included examining, on a test basis, evidence supporting the amounts and disclosures in the financial statements. Our audits also included assessing the accounting principles used and significant estimates made by management, as well as evaluating the overall financial statement presentation. We believe that our audits provide a reasonable basis for our opinion.

Minneapolis, Minnesota
February 28, 2018
We have served as the Company's auditor since 2002.
36
REPORT OF INDEPENDENT REGISTERED PUBLIC ACCOUNTING FIRM
To the Stockholders and the Board of Directors of
C.H. Robinson Worldwide, Inc.
Opinion on Internal Control over Financial Reporting
We have audited the internal control over financial reporting of C.H. Robinson Worldwide, Inc. and subsidiaries (the "Company") as of December 31, 2017, based on criteria established in
Internal Control - Integrated Framework (2013)
issued by the Committee of Sponsoring Organizations of the Treadway Commission (COSO). In our opinion, the Company maintained, in all material respects, effective internal control over financial reporting as of December 31, 2017, based on criteria established in
Internal Control - Integrated Framework (2013)
issued by COSO.
We have also audited, in accordance with the standards of the Public Company Accounting Oversight Board (United States) (PCAOB), the consolidated financial statements and financial statement schedule as of and for the fiscal year ended December 31, 2017, of the Company and our report dated February 28, 2018, expressed an unqualified opinion on those consolidated financial statements and financial statement schedule.
Basis for Opinion
The Company’s management is responsible for maintaining effective internal control over financial reporting and for its assessment of the effectiveness of internal control over financial reporting, included in the accompanying Management’s Report on Internal Control Over Financial Reporting. Our responsibility is to express an opinion on the Company’s internal control over financial reporting based on our audit. We are a public accounting firm registered with the PCAOB and are required to be independent with respect to the Company in accordance with the U.S. federal securities laws and the applicable rules and regulations of the Securities and Exchange Commission and the PCAOB.
We conducted our audit in accordance with the standards of the PCAOB. Those standards require that we plan and perform the audit to obtain reasonable assurance about whether effective internal control over financial reporting was maintained in all material respects. Our audit included obtaining an understanding of internal control over financial reporting, assessing the risk that a material weakness exists, testing and evaluating the design and operating effectiveness of internal control based on the assessed risk, and performing such other procedures as we considered necessary in the circumstances. We believe that our audit provides a reasonable basis for our opinion.
Definition and Limitations of Internal Control over Financial Reporting
A company's internal control over financial reporting is a process designed to provide reasonable assurance regarding the reliability of financial reporting and the preparation of financial statements for external purposes in accordance with generally accepted accounting principles. A company's internal control over financial reporting includes those policies and procedures that (1) pertain to the maintenance of records that, in reasonable detail, accurately and fairly reflect the transactions and dispositions of the assets of the company; (2) provide reasonable assurance that transactions are recorded as necessary to permit preparation of financial statements in accordance with generally accepted accounting principles, and that receipts and expenditures of the company are being made only in accordance with authorizations of management and directors of the company; and (3) provide reasonable assurance regarding prevention or timely detection of unauthorized acquisition, use, or disposition of the company's assets that could have a material effect on the financial statements.
Because of the inherent limitations of internal control over financial reporting may not prevent or detect misstatements. Also, projections of any evaluation of the effectiveness to future periods are subject to the risk that the controls may become inadequate because of changes in conditions, or that the degree of compliance with the policies or procedures may deteriorate.
Minneapolis, Minnesota
February 28, 2018
37
C.H. ROBINSON WORLDWIDE, INC.
(In thousands, except per share data)
|
|
December 31,
|
||||||
|
|
2017
|
2016
|
|||||
|
ASSETS
|
|||||||
|
Current assets:
|
|||||||
|
Cash and cash equivalents
|
$
|
333,890
|
|
$
|
247,666
|
|
|
|
Receivables, net of allowance for doubtful accounts of $42,409 and $39,543
|
2,113,930
|
|
1,711,191
|
|
|||
|
Prepaid expenses and other
|
63,116
|
|
49,245
|
|
|||
|
Total current assets
|
2,510,936
|
|
2,008,102
|
|
|||
|
Property and equipment
|
497,909
|
|
450,045
|
|
|||
|
Accumulated depreciation and amortization
|
(267,583
|
)
|
(217,092
|
)
|
|||
|
Net property and equipment
|
230,326
|
|
232,953
|
|
|||
|
Goodwill
|
1,275,816
|
|
1,232,796
|
|
|||
|
Other intangible assets, net of accumulated amortization of $122,283 and $87,486
|
151,585
|
|
167,525
|
|
|||
|
Deferred tax assets
|
6,870
|
|
2,250
|
|
|||
|
Other assets
|
60,301
|
|
44,132
|
|
|||
|
Total assets
|
$
|
4,235,834
|
|
$
|
3,687,758
|
|
|
|
LIABILITIES AND STOCKHOLDERS’ INVESTMENT
|
|||||||
|
Current liabilities:
|
|||||||
|
Accounts payable
|
$
|
1,000,305
|
|
$
|
839,736
|
|
|
|
Outstanding checks
|
96,359
|
|
82,052
|
|
|||
|
Accrued expenses–
|
|||||||
|
Compensation
|
105,316
|
|
98,107
|
|
|||
|
Income taxes
|
12,240
|
|
15,472
|
|
|||
|
Other accrued liabilities
|
58,229
|
|
70,351
|
|
|||
|
Current portion of debt
|
715,000
|
|
740,000
|
|
|||
|
Total current liabilities
|
1,987,449
|
|
1,845,718
|
|
|||
|
Long-term debt
|
750,000
|
|
500,000
|
|
|||
|
Noncurrent income taxes payable
|
26,684
|
|
18,849
|
|
|||
|
Deferred tax liabilities
|
45,355
|
|
65,122
|
|
|||
|
Other long-term liabilities
|
601
|
|
222
|
|
|||
|
Total liabilities
|
2,810,089
|
|
2,429,911
|
|
|||
|
Commitments and contingencies
|
|
|
|||||
|
Stockholders’ investment:
|
|||||||
|
Preferred stock, $.10 par value, 20,000 shares authorized; no shares issued or outstanding
|
—
|
|
—
|
|
|||
|
Common stock, $.10 par value, 480,000 shares authorized; 179,103 and 179,006 shares issued, 139,542 and 141,258 outstanding
|
13,954
|
|
14,126
|
|
|||
|
Additional paid-in capital
|
444,280
|
|
419,280
|
|
|||
|
Retained earnings
|
3,437,093
|
|
3,190,578
|
|
|||
|
Accumulated other comprehensive loss
|
(18,460
|
)
|
(61,442
|
)
|
|||
|
Treasury stock at cost (39,561 and 37,748 shares)
|
(2,451,122
|
)
|
(2,304,695
|
)
|
|||
|
Total stockholders’ investment
|
1,425,745
|
|
1,257,847
|
|
|||
|
Total liabilities and stockholders’ investment
|
$
|
4,235,834
|
|
$
|
3,687,758
|
|
|
See accompanying notes to the consolidated financial statements.
38
C.H. ROBINSON WORLDWIDE, INC.
(In thousands, except per share data)
|
|
For the years ended December 31,
|
||||||||||
|
2017
|
2016
|
2015
|
|||||||||
|
Revenues:
|
|||||||||||
|
Transportation
|
$
|
13,502,906
|
|
$
|
11,704,745
|
|
$
|
11,989,780
|
|
||
|
Sourcing
|
1,366,474
|
|
1,439,668
|
|
1,486,304
|
|
|||||
|
Total revenues
|
14,869,380
|
|
13,144,413
|
|
13,476,084
|
|
|||||
|
Costs and expenses:
|
|||||||||||
|
Purchased transportation and related services
|
11,257,290
|
|
9,549,934
|
|
9,842,271
|
|
|||||
|
Purchased products sourced for resale
|
1,244,040
|
|
1,316,951
|
|
1,365,333
|
|
|||||
|
Personnel expenses
|
1,179,527
|
|
1,064,936
|
|
1,051,410
|
|
|||||
|
Other selling, general, and administrative expenses
|
413,404
|
|
375,061
|
|
358,760
|
|
|||||
|
Total costs and expenses
|
14,094,261
|
|
12,306,882
|
|
12,617,774
|
|
|||||
|
Income from operations
|
775,119
|
|
837,531
|
|
858,310
|
|
|||||
|
Interest and other expense
|
(46,656
|
)
|
(25,581
|
)
|
(35,529
|
)
|
|||||
|
Income before provision for income taxes
|
728,463
|
|
811,950
|
|
822,781
|
|
|||||
|
Provision for income taxes
|
223,570
|
|
298,566
|
|
313,082
|
|
|||||
|
Net income
|
504,893
|
|
513,384
|
|
509,699
|
|
|||||
|
Other comprehensive income/(loss)
|
42,982
|
|
(23,496
|
)
|
(9,336
|
)
|
|||||
|
Comprehensive income
|
$
|
547,875
|
|
$
|
489,888
|
|
$
|
500,363
|
|
||
|
Basic net income per share
|
$
|
3.59
|
|
$
|
3.60
|
|
$
|
3.52
|
|
||
|
Diluted net income per share
|
$
|
3.57
|
|
$
|
3.59
|
|
$
|
3.51
|
|
||
|
Basic weighted average shares outstanding
|
140,610
|
|
142,706
|
|
144,967
|
|
|||||
|
Dilutive effect of outstanding stock awards
|
772
|
|
285
|
|
382
|
|
|||||
|
Diluted weighted average shares outstanding
|
141,382
|
|
142,991
|
|
145,349
|
|
|||||
See accompanying notes to the consolidated financial statements.
39
C.H. ROBINSON WORLDWIDE, INC.
CONSOLIDATED STATEMENTS OF STOCKHOLDERS’ INVESTMENT
(In thousands, except per share data)
|
Common
Shares
Outstanding
|
Amount
|
Additional
Paid-in
Capital
|
Retained
Earnings
|
Accumulated
Other
Comprehensive
Loss
|
Treasury
Stock
|
Total
Stockholders’
Investment
|
||||||||||||||||||||
|
Balance December 31, 2014
|
146,458
|
|
$
|
14,646
|
|
$
|
321,968
|
|
$
|
2,648,539
|
|
$
|
(28,610
|
)
|
$
|
(1,909,528
|
)
|
$
|
1,047,015
|
|
||||||
|
Net income
|
509,699
|
|
509,699
|
|
||||||||||||||||||||||
|
Foreign currency translation adjustment
|
(9,336
|
)
|
(9,336
|
)
|
||||||||||||||||||||||
|
Dividends declared, $1.57 per share
|
(235,618
|
)
|
(235,618
|
)
|
||||||||||||||||||||||
|
Stock issued for employee benefit plans
|
254
|
|
25
|
|
(9,095
|
)
|
13,258
|
|
4,188
|
|
||||||||||||||||
|
Issuance of restricted stock
|
164
|
|
16
|
|
(16
|
)
|
—
|
|
||||||||||||||||||
|
Stock-based compensation expense
|
58,039
|
|
28
|
|
58,067
|
|
||||||||||||||||||||
|
Excess tax benefit on deferred compensation and employee stock plans
|
8,548
|
|
8,548
|
|
||||||||||||||||||||||
|
Repurchase of common stock
|
(3,421
|
)
|
(342
|
)
|
(231,771
|
)
|
(232,113
|
)
|
||||||||||||||||||
|
Balance December 31, 2015
|
143,455
|
|
14,345
|
|
379,444
|
|
2,922,620
|
|
(37,946
|
)
|
(2,128,013
|
)
|
1,150,450
|
|
||||||||||||
|
Net income
|
513,384
|
|
513,384
|
|
||||||||||||||||||||||
|
Foreign currency translation adjustment
|
(23,496
|
)
|
(23,496
|
)
|
||||||||||||||||||||||
|
Dividends declared, $1.74 per share
|
(245,426
|
)
|
(245,426
|
)
|
||||||||||||||||||||||
|
Stock issued for employee benefit plans
|
32
|
|
3
|
|
(16,121
|
)
|
(1,287
|
)
|
(17,405
|
)
|
||||||||||||||||
|
Issuance of restricted stock
|
221
|
|
22
|
|
(22
|
)
|
—
|
|
||||||||||||||||||
|
Stock-based compensation expense
|
17
|
|
3
|
|
37,517
|
|
1,034
|
|
38,554
|
|
||||||||||||||||
|
Excess tax benefit on deferred compensation and employee stock plans
|
18,462
|
|
18,462
|
|
||||||||||||||||||||||
|
Repurchase of common stock
|
(2,467
|
)
|
(247
|
)
|
(176,429
|
)
|
(176,676
|
)
|
||||||||||||||||||
|
Balance December 31, 2016
|
141,258
|
|
14,126
|
|
419,280
|
|
3,190,578
|
|
(61,442
|
)
|
(2,304,695
|
)
|
1,257,847
|
|
||||||||||||
|
Net income
|
504,893
|
|
504,893
|
|
||||||||||||||||||||||
|
Foreign currency translation adjustment
|
42,982
|
|
42,982
|
|
||||||||||||||||||||||
|
Dividends declared, $1.81 per share
|
(258,378
|
)
|
(258,378
|
)
|
||||||||||||||||||||||
|
Stock issued for employee benefit plans
|
612
|
|
61
|
|
(16,760
|
)
|
33,271
|
|
16,572
|
|
||||||||||||||||
|
Issuance of restricted stock
|
97
|
|
10
|
|
(10
|
)
|
—
|
|
||||||||||||||||||
|
Stock-based compensation expense
|
1
|
|
41,770
|
|
44
|
|
41,814
|
|
||||||||||||||||||
|
Repurchase of common stock
|
(2,426
|
)
|
(243
|
)
|
(179,742
|
)
|
(179,985
|
)
|
||||||||||||||||||
|
Balance December 31, 2017
|
139,542
|
|
$
|
13,954
|
|
$
|
444,280
|
|
$
|
3,437,093
|
|
$
|
(18,460
|
)
|
$
|
(2,451,122
|
)
|
$
|
1,425,745
|
|
||||||
See accompanying notes to the consolidated financial statements.
40
C.H. ROBINSON WORLDWIDE, INC.
(In thousands)
|
|
For the year ended December 31,
|
||||||||||
|
2017
|
2016
|
2015
|
|||||||||
|
OPERATING ACTIVITIES
|
|||||||||||
|
Net income
|
$
|
504,893
|
|
$
|
513,384
|
|
$
|
509,699
|
|
||
|
Adjustments to reconcile net income to net cash provided by operating activities:
|
|||||||||||
|
Depreciation and amortization
|
92,977
|
|
74,669
|
|
66,409
|
|
|||||
|
Provision for doubtful accounts
|
13,489
|
|
5,136
|
|
11,538
|
|
|||||
|
Stock-based compensation
|
41,805
|
|
37,565
|
|
57,661
|
|
|||||
|
Deferred income taxes
|
(28,096
|
)
|
15,009
|
|
(17,095
|
)
|
|||||
|
Excess tax benefit on stock-based compensation
|
(13,657
|
)
|
(18,462
|
)
|
(8,548
|
)
|
|||||
|
Other
|
4,491
|
|
1,907
|
|
7,409
|
|
|||||
|
Changes in operating elements, net of effects of acquisitions:
|
|||||||||||
|
Receivables
|
(364,181
|
)
|
(173,211
|
)
|
107,560
|
|
|||||
|
Prepaid expenses and other
|
(9,173
|
)
|
(6,378
|
)
|
(228
|
)
|
|||||
|
Other non-current assets
|
(19,099
|
)
|
(3,934
|
)
|
741
|
|
|||||
|
Accounts payable and outstanding checks
|
144,041
|
|
115,917
|
|
(53,272
|
)
|
|||||
|
Accrued compensation
|
7,209
|
|
(47,570
|
)
|
18,580
|
|
|||||
|
Accrued income taxes
|
18,817
|
|
19,921
|
|
13,726
|
|
|||||
|
Other accrued liabilities
|
(9,515
|
)
|
(4,545
|
)
|
4,156
|
|
|||||
|
Net cash provided by operating activities
|
384,001
|
|
529,408
|
|
718,336
|
|
|||||
|
INVESTING ACTIVITIES
|
|||||||||||
|
Purchases of property and equipment
|
(40,122
|
)
|
(73,452
|
)
|
(28,115
|
)
|
|||||
|
Purchases and development of software
|
(17,823
|
)
|
(17,985
|
)
|
(16,527
|
)
|
|||||
|
Acquisitions, net of cash acquired
|
(49,068
|
)
|
(220,203
|
)
|
(369,833
|
)
|
|||||
|
Restricted cash
|
—
|
|
—
|
|
359,388
|
|
|||||
|
Other
|
(521
|
)
|
(1,348
|
)
|
641
|
|
|||||
|
Net cash used for investing activities
|
(107,534
|
)
|
(312,988
|
)
|
(54,446
|
)
|
|||||
|
FINANCING ACTIVITIES
|
|||||||||||
|
Proceeds from stock issued for employee benefit plans
|
38,130
|
|
19,271
|
|
15,557
|
|
|||||
|
Stock tendered for payment of withholding taxes
|
(21,557
|
)
|
(36,678
|
)
|
(11,368
|
)
|
|||||
|
Repurchase of common stock
|
(185,485
|
)
|
(172,925
|
)
|
(229,863
|
)
|
|||||
|
Cash dividends
|
(258,222
|
)
|
(245,430
|
)
|
(235,615
|
)
|
|||||
|
Excess tax benefit on stock-based compensation
|
—
|
|
18,462
|
|
8,548
|
|
|||||
|
Proceeds from long-term borrowings
|
250,000
|
|
—
|
|
—
|
|
|||||
|
Proceeds from short-term borrowings
|
8,784,000
|
|
6,600,000
|
|
6,833,000
|
|
|||||
|
Payments on short-term borrowings
|
(8,809,000
|
)
|
(6,310,000
|
)
|
(6,988,000
|
)
|
|||||
|
Net cash used for financing activities
|
(202,134
|
)
|
(127,300
|
)
|
(607,741
|
)
|
|||||
|
Effect of exchange rates on cash
|
11,891
|
|
(9,683
|
)
|
(16,860
|
)
|
|||||
|
Net change in cash and cash equivalents
|
86,224
|
|
79,437
|
|
39,289
|
|
|||||
|
Cash and cash equivalents, beginning of year
|
247,666
|
|
168,229
|
|
128,940
|
|
|||||
|
Cash and cash equivalents, end of year
|
$
|
333,890
|
|
$
|
247,666
|
|
$
|
168,229
|
|
||
|
Supplemental cash flow disclosures
|
|||||||||||
|
Cash paid for income taxes
|
$
|
262,861
|
|
$
|
269,187
|
|
$
|
311,800
|
|
||
|
Cash paid for interest
|
$
|
37,871
|
|
$
|
28,908
|
|
$
|
28,537
|
|
||
|
Accrued share repurchases held in other accrued liabilities
|
$
|
500
|
|
$
|
5,988
|
|
$
|
2,250
|
|
||
See accompanying notes to the consolidated financial statements.
41
C.H. ROBINSON WORLDWIDE, INC.
NOTES TO CONSOLIDATED FINANCIAL STATEMENTS
BASIS OF PRESENTATION.
C.H. Robinson Worldwide, Inc. and our subsidiaries (“the company,” “we,” “us,” or “our”) are a global provider of transportation services and logistics solutions through a network of offices operating in North America, Europe, Asia, Australia, New Zealand, and South America. The consolidated financial statements include the accounts of C.H. Robinson Worldwide, Inc. and our majority owned and controlled subsidiaries. Our minority interests in subsidiaries are not significant. All intercompany transactions and balances have been eliminated in the consolidated financial statements.
USE OF ESTIMATES.
The preparation of financial statements, in conformity with accounting principles generally accepted in the United States, requires management to make estimates and assumptions that affect the reported amounts of assets and liabilities as of the date of the financial statements and the reported amounts of revenues and expenses during the reporting period. Estimates have been prepared on the basis of the most current and best information, and our actual results could differ materially from those estimates.
REVENUE RECOGNITION.
Total revenues consist of the total dollar value of goods and services purchased from us by customers. Our net revenues are our total revenues less purchased transportation and related services, including contracted motor carrier, rail, ocean, air, and other costs, and the purchase price and services related to the products we source. We act principally as the service provider for these transactions and recognize revenue as these services are rendered or goods are delivered. At that time, our obligations to the transactions are completed and collection of receivables is reasonably assured. Most transactions in our transportation and sourcing businesses are recorded at the gross amount we charge our customers for the service we provide and goods we sell. In these transactions, we are the primary obligor, we have credit risk, we have discretion to select the supplier, and we have latitude in pricing decisions. Additionally, in our sourcing business, we take loss of inventory risk during shipment and have general inventory risk. Certain transactions in customs brokerage, managed services, freight forwarding, and sourcing are recorded at the net amount we charge our customers for the service we provide because many of the factors stated above are not present.
ALLOWANCE FOR DOUBTFUL ACCOUNTS.
Accounts receivable are reduced by an allowance for amounts that may become uncollectible in the future. We continuously monitor payments from our customers and maintain a provision for uncollectible accounts based upon our customer aging trends, historical loss experience, and any specific customer collection issues that we have identified.
FOREIGN CURRENCY.
Most balance sheet accounts of foreign subsidiaries are translated or remeasured at the current exchange rate as of the end of the year. Statement of operations items are translated at average exchange rates during the year. The resulting translation adjustment is recorded net of tax as a separate component of comprehensive income in our statements of operations and comprehensive income in 2015. In 2016, we asserted that we will indefinitely reinvest earnings of foreign subsidiaries to support expansion of our international businesses and now the translation adjustment is recorded gross of related income tax benefits.
CASH AND CASH EQUIVALENTS.
Cash and cash equivalents consist of bank deposits.
PREPAID EXPENSES AND OTHER.
Prepaid expenses and other include such items as prepaid rent, software maintenance contracts, insurance premiums, other prepaid operating expenses, and inventories, consisting primarily of produce and related products held for resale.
PROPERTY AND EQUIPMENT.
Property and equipment are recorded at cost. Maintenance and repair expenditures are charged to expense as incurred. Depreciation is computed using the straight-line method over the estimated lives of the assets. Amortization of leasehold improvements is computed over the shorter of the lease term or the estimated useful lives of the improvements.
We recognized the following depreciation expense (in thousands):
|
2017
|
$
|
42,817
|
|
|
|
2016
|
36,212
|
|
||
|
2015
|
32,412
|
|
||
42
A summary of our property and equipment as of December 31 is as follows (in thousands):
|
Useful Lives (in years)
|
2017
|
2016
|
|||||||
|
Furniture, fixtures, and equipment
|
3 to 12
|
$
|
277,014
|
|
$
|
236,180
|
|
||
|
Buildings
|
3 to 30
|
130,712
|
|
130,050
|
|
||||
|
Corporate aircraft
|
10
|
11,334
|
|
11,334
|
|
||||
|
Leasehold improvements
|
3 to 15
|
50,616
|
|
40,312
|
|
||||
|
Land
|
23,658
|
|
23,635
|
|
|||||
|
Construction in progress
|
4,575
|
|
8,534
|
|
|||||
|
Less accumulated depreciation
|
(267,583
|
)
|
(217,092
|
)
|
|||||
|
Net property and equipment
|
$
|
230,326
|
|
$
|
232,953
|
|
|||
GOODWILL.
Goodwill represents the excess of the cost of acquired businesses over the net of the fair value of identifiable tangible net assets and identifiable intangible assets purchased and liabilities assumed. Goodwill is tested for impairment at the reporting unit level (operating segment or one level below an operating segment) on an annual basis (November 30 for us) and between annual tests if an event occurs or circumstances change that would more likely than not reduce the fair value of a reporting unit below its carrying value. See Note 2.
OTHER INTANGIBLE ASSETS.
Other intangible assets include definite-lived customer lists, non-competition agreements, and indefinite-lived trademarks. The definite-lived intangible assets are being amortized using the straight-line method over their estimated lives, ranging from
5
to
8
years. Definite-lived intangible assets are evaluated for impairment whenever events or changes in circumstances indicate that the carrying amount may not be recoverable. The indefinite-lived trademarks are not amortized. Indefinite-lived intangible assets are evaluated for impairment whenever events or changes in circumstances indicate that the carrying amount may not be recoverable, or annually, at a minimum. See Note 2.
OTHER ASSETS.
Other assets include such items as purchased and internally developed software, and the investments related to our nonqualified deferred compensation plan. We amortize software using the straight-line method over
3
years. We recognized the following amortization expense of purchased and internally developed software (in thousands):
|
2017
|
$
|
13,887
|
|
|
|
2016
|
11,404
|
|
||
|
2015
|
9,624
|
|
||
A summary of our purchased and internally developed software as of December 31 is as follows (in thousands):
|
2017
|
2016
|
||||||
|
Purchased software
|
$
|
25,805
|
|
$
|
23,753
|
|
|
|
Internally developed software
|
55,165
|
|
51,507
|
|
|||
|
Less accumulated amortization
|
(54,194
|
)
|
(47,957
|
)
|
|||
|
Net software
|
$
|
26,776
|
|
$
|
27,303
|
|
|
INCOME TAXES.
Income taxes are accounted for using the asset and liability method. Under this method, deferred tax assets and liabilities are recognized for the future tax consequences of temporary differences between the carrying amounts and tax bases of assets and liabilities using enacted rates.
Annual tax provisions include amounts considered sufficient to pay assessments that may result from examination of prior year tax returns; however, the amount ultimately paid upon resolution of issues raised may differ from the amounts accrued.
The financial statement benefits of an uncertain income tax position are recognized when more likely than not, based on the technical merits, the position will be sustained upon examination. Unrecognized tax benefits are, more likely than not, owed to a taxing authority, and the amount of the contingency can be reasonably estimated. Uncertain income tax positions are included in “Noncurrent income taxes payable” in the consolidated balance sheets.
43
COMPREHENSIVE INCOME.
Our only component of other comprehensive income is foreign currency translation adjustment. It is presented on our consolidated statements of operations and comprehensive income gross of related income tax effects for 2017 and 2016, net of related income tax effects for 2015.
STOCK-BASED COMPENSATION.
We issue stock awards, including stock options, performance shares, and restricted stock units, to key employees and outside directors. In general, the awards vest over
five years
, either based on the company’s earnings growth or the passage of time. The related compensation expense for each award is recognized over the appropriate vesting period. The fair value of each share-based payment award is established on the date of grant. For grants of shares and restricted stock units, the fair value is established based on the market price on the date of the grant, discounted for post-vesting holding restrictions. The discounts on outstanding grants vary from
15 percent
to
21 percent
and are calculated using the Black-Scholes option pricing model-protective put method. Changes in measured stock volatility and interest rates are the primary reason for changes in the discount.
For grants of options, we use the Black-Scholes option pricing model to estimate the fair value of share-based payment awards. The determination of the fair value of share-based awards is affected by our stock price and a number of assumptions, including expected volatility, expected life, risk-free interest rate, and expected dividends.
Goodwill was allocated to each segment based on their relative fair value at November 30, 2016 due to the reorganization of our reporting structure. After that date, we allocate goodwill to reporting units based on the reporting unit expected to benefit from the business combination. The change in the carrying amount of goodwill is as follows (in thousands):
|
NAST
|
Global Forwarding
|
Robinson Fresh
|
All Other and Corporate
|
Total
|
||||||||||||||||
|
December 31, 2015 balance
|
$
|
815,639
|
|
$
|
142,993
|
|
$
|
125,469
|
|
$
|
24,236
|
|
$
|
1,108,337
|
|
|||||
|
Acquisitions
|
97,727
|
|
17,133
|
|
15,033
|
|
2,904
|
|
132,797
|
|
||||||||||
|
Translation
|
(6,136
|
)
|
(1,076
|
)
|
(944
|
)
|
(182
|
)
|
(8,338
|
)
|
||||||||||
|
December 31, 2016 balance
|
907,230
|
|
159,050
|
|
139,558
|
|
26,958
|
|
1,232,796
|
|
||||||||||
|
Acquisitions
|
3,673
|
|
24,918
|
|
—
|
|
—
|
|
28,591
|
|
||||||||||
|
Translation
|
10,583
|
|
1,905
|
|
1,627
|
|
314
|
|
14,429
|
|
||||||||||
|
December 31, 2017 balance
|
$
|
921,486
|
|
$
|
185,873
|
|
$
|
141,185
|
|
$
|
27,272
|
|
$
|
1,275,816
|
|
|||||
Goodwill is tested at least annually for impairment on November 30, or more frequently if events or changes in circumstances indicate that the asset might be impaired. We first perform a qualitative assessment to determine whether it is more likely than not that the fair value of our reporting units is less than their respective carrying value (“Step Zero analysis”). If the Step Zero analysis indicates it is more likely than not that the fair value of our reporting units is less than their respective carrying value, and additional impairment assessment is performed (“Step One Analysis”). Refer to Critical Accounting Policies and Estimates.
No goodwill impairment has been recorded in any period presented.
44
Identifiable intangible assets consisted of the following at December 31 (in thousands):
|
2017
|
2016
|
||||||||||||||||||||||
|
Cost
|
Accumulated Amortization
|
Net
|
Cost
|
Accumulated Amortization
|
Net
|
||||||||||||||||||
|
Finite-lived intangibles
|
|||||||||||||||||||||||
|
Customer relationships
|
$
|
263,093
|
|
$
|
(122,103
|
)
|
$
|
140,990
|
|
$
|
244,036
|
|
$
|
(87,199
|
)
|
$
|
156,837
|
|
|||||
|
Non-competition agreements
|
300
|
|
(180
|
)
|
120
|
|
500
|
|
(287
|
)
|
213
|
|
|||||||||||
|
Total finite-lived intangibles
|
263,393
|
|
(122,283
|
)
|
141,110
|
|
244,536
|
|
(87,486
|
)
|
157,050
|
|
|||||||||||
|
Indefinite-lived intangibles
|
|||||||||||||||||||||||
|
Trademarks
|
10,475
|
|
—
|
|
10,475
|
|
10,475
|
|
—
|
|
10,475
|
|
|||||||||||
|
Total intangibles
|
$
|
273,868
|
|
$
|
(122,283
|
)
|
$
|
151,585
|
|
$
|
255,011
|
|
$
|
(87,486
|
)
|
$
|
167,525
|
|
|||||
Amortization expense for other intangible assets was (in thousands):
|
2017
|
$
|
36,273
|
|
|
2016
|
27,053
|
|
|
|
2015
|
24,373
|
|
|
Finite-lived intangible assets, by reportable segment, as of
December 31, 2017
, will be amortized over their remaining lives as follows (in thousands):
|
NAST
|
Global Forwarding
|
Robinson Fresh
|
All Other and Corporate
|
Total
|
|||||||||||||||
|
2018
|
$
|
7,820
|
|
$
|
29,297
|
|
$
|
—
|
|
$
|
41
|
|
$
|
37,158
|
|
||||
|
2019
|
7,820
|
|
29,297
|
|
—
|
|
—
|
|
37,117
|
|
|||||||||
|
2020
|
260
|
|
26,593
|
|
—
|
|
—
|
|
26,853
|
|
|||||||||
|
2021
|
260
|
|
13,072
|
|
—
|
|
—
|
|
13,332
|
|
|||||||||
|
2022
|
260
|
|
13,072
|
|
—
|
|
—
|
|
13,332
|
|
|||||||||
|
Thereafter
|
480
|
|
12,838
|
|
—
|
|
—
|
|
13,318
|
|
|||||||||
|
Total
|
|
$
|
141,110
|
|
|||||||||||||||
Accounting guidance on fair value measurements for certain financial assets and liabilities requires that assets and liabilities carried at fair value be classified and disclosed in one of the following three categories:
|
•
|
Level 1-Quoted market prices in active markets for identical assets or liabilities.
|
|
•
|
Level 2-Observable market-based inputs or unobservable inputs that are corroborated by market data.
|
|
•
|
Level 3-Unobservable inputs reflecting the reporting entity’s own assumptions or external inputs from inactive markets.
|
A financial asset or liability’s classification within the hierarchy is determined based on the lowest level of input that is significant to the fair value measurement.
We had
no
Level 3 assets or liabilities as of and during the periods ended
December 31, 2017
, or
December 31, 2016
. There were no transfers between levels during the period.
45
Senior Unsecured Revolving Credit Facility
On October 29, 2012, we entered into a senior unsecured revolving credit facility for up to
$500 million
with a
$500 million
accordion feature (the “Credit Agreement”), with a syndicate of financial institutions led by U.S. Bank. In December 2014, we amended the credit facility to increase the amount available from
$500 million
to
$900 million
and to extend the expiration date from October 2017 to December 2019. This facility allows us to continue to fund working capital, capital expenditures, dividends, and share repurchases.
As of
December 31, 2017
and
2016
, we had
$715 million
and
$740 million
in borrowings outstanding under the Credit Agreement, which is classified as a current liability on the consolidated balance sheets. At
December 31, 2017
, we had borrowing availability of
$185 million
. The recorded amount of borrowings outstanding approximates fair value because of the short maturity period of the debt; therefore, we consider these borrowings to be a Level 2 financial liability.
Borrowings under the Credit Agreement generally bear interest at a variable rate determined by a pricing schedule or the base rate (which is the highest of (a) the administrative agent’s prime rate, (b) the federal funds rate plus
0.50 percent
, or (c) the sum of one-month LIBOR plus a specified margin). As of
December 31, 2017
, the variable rate equaled LIBOR plus
1.13 percent
. In addition, there is a commitment fee on the average daily undrawn stated amount under each letter of credit issued under the facility. The weighted average interest rate incurred on borrowings during
2017
was approximately
2.2 percent
and at
December 31, 2017
, was approximately
2.7 percent
. The weighted average interest rate incurred on borrowings during
2016
was approximately
1.5 percent
and at
December 31, 2016
, was approximately
1.9 percent
.
The Credit Agreement contains various restrictions and covenants. Among other requirements, we may not permit our leverage ratio, as of the end of each of our fiscal quarters, of (i) Consolidated Funded Indebtedness to (ii) Consolidated Total Capitalization to be greater than
0.65
to
1.00
. Additionally, as a result of amending the Note Purchase Agreement in February 2015, the ratio of (i) Consolidated Funded Indebtedness to (ii) EBITDA (earnings before interest, taxes, depreciation, and amortization), as of the end of each of our fiscal quarters, may not exceed
3.00
to
1.00
. We were in compliance with the financial debt covenants as of
December 31, 2017
.
The Credit Agreement also contains customary events of default. If an event of default under the Credit Agreement occurs and is continuing, then the administrative agent may declare any outstanding obligations under the Credit Agreement to be immediately due and payable. In addition, if we become the subject of voluntary or involuntary proceedings under any bankruptcy, insolvency, or similar law, then any outstanding obligations under the Credit Agreement will automatically become immediately due and payable.
Note Purchase Agreement
On August 23, 2013, we entered into a Note Purchase Agreement with certain institutional investors (the “Purchasers”) named therein (the “Note Purchase Agreement”). Pursuant to the Note Purchase Agreement, the Purchasers purchased, on August 27, 2013, (i)
$175 million
aggregate principal amount of the company’s
3.97 percent
Senior Notes, Series A, due August 27, 2023 (the “Series A Notes”), (ii)
$150 million
aggregate principal amount of the company’s
4.26 percent
Senior Notes, Series B, due August 27, 2028 (the “Series B Notes”), and (iii)
$175 million
aggregate principal amount of the company’s
4.60 percent
Senior Notes, Series C, due August 27, 2033 (the “Series C Notes” and, together with the Series A Notes and the Series B Notes, the “Notes”). Interest on the fixed-rate Notes is payable semi-annually in arrears. We applied the proceeds of the sale of the Notes for share repurchases.
The Note Purchase Agreement contains customary provisions for transactions of this type, including representations and warranties regarding the company and its subsidiaries and various covenants, including covenants that require us to maintain specified financial ratios. The Note Purchase Agreement includes the following financial covenants: we will not permit our leverage ratio, as of the end of each of our fiscal quarters, of (i) Consolidated Funded Indebtedness to (ii) Consolidated Total Capitalization to be greater than
0.65
to
1.00
; we will not permit the interest coverage ratio, as of the end of each of our fiscal quarters and for the twelve-month period ending, of (i) Consolidated EBIT (earnings before income taxes) to (ii) Consolidated Interest Expense to be less than
2.00
to
1.00
; we will not permit, as of the end of each of our fiscal quarters, Consolidated Priority Debt to exceed
15%
of Consolidated Total Assets. The Note Purchase Agreement was amended in February 2015 to conform its financial covenants to be consistent with the amended Credit Agreement. As a result of amending the Note Purchase Agreement in February 2015, the ratio of (i) Consolidated Funded Indebtedness to (ii) EBITDA (earnings before interest, taxes, depreciation, and amortization), as of the end of each of our fiscal quarters, may not exceed
3.00
to
1.00
. We were in compliance with the financial debt covenants as of
December 31, 2017
.
46
The Note Purchase Agreement provides for customary events of default, generally with corresponding grace periods, including, without limitation, payment defaults with respect to the Notes, covenant defaults, cross-defaults to other agreements evidencing indebtedness of the company or its subsidiaries, certain judgments against the company or its subsidiaries, and events of bankruptcy involving the company or its material subsidiaries. The occurrence of an event of default would permit certain Purchasers to declare certain Notes then outstanding to be immediately due and payable.
Under the terms of the Note Purchase Agreement, the Notes are redeemable, in whole or in part, at
100 percent
of the principal amount being redeemed together with a “make-whole amount,” and accrued and unpaid interest (as defined in the Note Purchase Agreement) with respect to each Note. The obligations of the company under the Note Purchase Agreement and the Notes are guaranteed by C.H. Robinson Company, a Delaware corporation and a wholly-owned subsidiary of the company, and by C.H. Robinson Company, Inc., a Minnesota corporation and an indirect wholly-owned subsidiary of the company.
The Notes were issued by the company to such initial Purchasers in a private placement in reliance on Section 4(2) of the Securities Act of 1933, as amended. The Notes will not be and have not been registered under the Securities Act and may not be offered or sold in the United States, absent registration or an applicable exemption from registration requirements.
The fair value of long-term debt was approximately
$546.6 million
at
December 31, 2017
, and
$528.0 million
at
December 31, 2016
. We estimate the fair value of our debt primarily using an expected present value technique, which is based on observable market inputs using interest rates currently available to companies of similar credit standing for similar terms and remaining maturities, and considering our own credit risk. If our long-term debt was recorded at fair value, it would be classified as Level 2.
U.S. Trade Accounts Receivable Securitization
On April 26, 2017, we entered into a receivables purchase agreement and related transaction documents with The Bank of Tokyo-Mitsubishi UFJ, Ltd., New York Branch and Wells Fargo Bank, National Association to provide a receivables securitization facility (the “Receivables Securitization Facility”). The Receivables Securitization Facility is based on the securitization of our U.S. trade accounts receivable and provides funding of up to
$250 million
. The borrowings outstanding under the Receivables Securitization Facility were
$250 million
as of
December 31, 2017
, and are classified as long-term debt on the condensed consolidated balance sheets. The borrowings under the Receivables Securitization Facility were used to pay down amounts previously outstanding on the Credit Agreement. The interest rate on borrowings under the Receivables Securitization Facility is based on the asset-backed commercial paper rate plus a margin or 30 day LIBOR plus a margin for a combined rate of
2.0 percent
for the year ended
December 31, 2017
. The Receivables Securitization Facility expires on April 26, 2019, unless extended by the parties. There is a commitment fee we are required to pay on any unused portion of the facility.
The Receivables Securitization Facility contains various customary affirmative and negative covenants, and it also contains customary default and termination provisions which provide for acceleration of amounts owed under the Receivables Securitization Facility upon the occurrence of certain specified events including, but not limited to, the failure to pay yield, fees, and other amounts due, defaults on certain other indebtedness, failure to discharge certain judgments, insolvency events, change in control, and exceeding certain financial ratios designed to capture events negatively affecting the overall credit quality of the receivables.
The recorded amount of borrowings outstanding on the Receivables Securitization Facility approximates fair value because it can be redeemed on short notice and the interest rate floats, therefore, we consider these borrowings to be a Level 2 financial liability.
As of
December 31, 2017
, we were in compliance with all of the covenants under the Credit Agreement, Note Purchase Agreement, and Receivables Securitization Facility.
47
C.H. Robinson Worldwide, Inc. and its
80
percent (or more) owned U.S. subsidiaries file a consolidated federal income tax return. We file unitary or separate state returns based on state filing requirements.
On December 22, 2017, the U.S. government enacted comprehensive tax legislation commonly referred to as the Tax Cuts and Jobs Act (the “Tax Act”). The Tax Act makes broad and complex changes to the U.S. tax code, including but not limited to, reducing the U.S. federal corporate tax rate from
35 percent
to
21 percent
and requiring companies to pay a one-time transition tax on certain unrepatriated earnings of foreign subsidiaries.
The SEC staff issued Staff Accounting Bulletin (“SAB”) 118, which provides guidance on accounting for the tax effects of the Tax Act. SAB 118 provides a measurement period that should not extend beyond one year from the Tax Act enactment date for companies to complete the accounting under Accounting Standards Codification (“ASC”) 740. In accordance with SAB 118, a company must reflect the income tax effects of those aspects of the Tax Act for which the accounting under ASC 740 is complete. To the extent that a company’s accounting for certain income tax effects of the Tax Act is incomplete but it is able to determine a reasonable estimate, it must record a provisional estimate in the financial statements.
In connection with our initial analysis of the impact of the Tax Act, we have recorded a discrete net tax benefit of
$12.1 million
in the year ended
December 31, 2017
. The net benefit consists of a benefit for the revaluation of deferred tax assets and liabilities of
$22.9 million
, a net expense for one-time impacts of the Tax Act of
$6.8 million
, and an expense for transition taxes of
$4.0 million
. We have not yet completed our accounting for the income tax effects of certain elements of the Tax Act but we were able to make reasonable estimates for elements in which our analysis is not complete and have therefore recorded provisional adjustments. These items include our revaluation of deferred tax assets and liabilities and the expense for transition taxes.
During 2017, we recorded a net tax benefit of
$19.7 million
due to deductions under Section 199 of the Internal Revenue Code.
During the first quarter of 2017, we adopted ASU 2016-09, Compensation - Stock Compensation (Topic 718). The adoption of ASU 2016-09 prospectively impacts the recording of income taxes related to share-based payment awards in our consolidated financial position and results of operations, as well as the operating and financing cash flows on the consolidated statements of cash flows. This adoption resulted in a net tax benefit of
$13.7 million
during the year.
During the first quarter of 2016, we asserted that we will indefinitely reinvest earnings of foreign subsidiaries to support expansion of our international business. In 2017, our indefinite reinvestment strategy, with respect to unremitted earnings of our foreign subsidiaries provided an approximate
$3.7 million
benefit to our provision for income taxes related to current year earnings. If we repatriated all foreign earnings, the estimated effect on income taxes payable would be an increase of approximately
$12.1 million
as of
December 31, 2017
. With few exceptions, we are no longer subject to audits of U.S. federal, state and local, or non-U.S. income tax returns before 2010.
Income before provision for income taxes consisted of (in thousands):
|
2017
|
2016
|
2015
|
||||||||||
|
Domestic
|
$
|
638,718
|
|
$
|
710,931
|
|
$
|
729,390
|
|
|||
|
Foreign
|
89,745
|
|
101,019
|
|
93,391
|
|
||||||
|
Total
|
$
|
728,463
|
|
$
|
811,950
|
|
$
|
822,781
|
|
|||
A reconciliation of the beginning and ending amount of unrecognized tax benefits, excluding interest and penalties, is as follows (in thousands):
|
2017
|
2016
|
2015
|
|||||||||
|
Unrecognized tax benefits, beginning of period
|
$
|
12,268
|
|
$
|
13,271
|
|
$
|
18,274
|
|
||
|
Additions based on tax positions related to the current year
|
4,014
|
|
—
|
|
1,520
|
|
|||||
|
Additions for tax positions of prior years
|
16,713
|
|
55
|
|
—
|
|
|||||
|
Reductions for tax positions of prior years
|
—
|
|
(211
|
)
|
(810
|
)
|
|||||
|
Lapse in statute of limitations
|
(1,189
|
)
|
(847
|
)
|
(5,188
|
)
|
|||||
|
Settlements
|
—
|
|
—
|
|
(525
|
)
|
|||||
|
Unrecognized tax benefits, end of the period
|
$
|
31,806
|
|
$
|
12,268
|
|
$
|
13,271
|
|
||
48
As of
December 31, 2017
, we had
$38.6 million
of unrecognized tax benefits and related interest and penalties, all of which would affect our effective tax rate if recognized. We are not aware of any tax positions for which it is reasonably possible that the total amount of unrecognized tax benefit will significantly increase or decrease in the next 12 months.
Income tax expense considers amounts which may be needed to cover exposures for open tax years. We do not expect any material impact related to open tax years; however, actual settlements may differ from amounts accrued.
We recognize interest and penalties related to uncertain tax positions in the provision for income taxes. During the years ended
December 31, 2017
,
2016
, and
2015
, we recognized approximately
$0.7 million
$0.9 million
, and
$1.2 million
in interest and penalties. We had approximately
$6.8 million
and
$6.6 million
for the payment of interest and penalties accrued within noncurrent income taxes payable as of
December 31, 2017
and
2016
. These amounts are not included in the reconciliation above.
The components of the provision for income taxes consist of the following for the years ended December 31 (in thousands):
|
2017
|
2016
|
2015
|
|||||||||
|
Tax provision:
|
|||||||||||
|
Federal
|
$
|
189,708
|
|
$
|
222,685
|
|
$
|
259,793
|
|
||
|
State
|
29,320
|
|
31,786
|
|
37,129
|
|
|||||
|
Foreign
|
32,638
|
|
29,086
|
|
33,255
|
|
|||||
|
251,666
|
|
283,557
|
|
330,177
|
|
||||||
|
Deferred provision (benefit):
|
|||||||||||
|
Federal
|
(21,389
|
)
|
13,936
|
|
(14,559
|
)
|
|||||
|
State
|
(3,048
|
)
|
1,986
|
|
(2,074
|
)
|
|||||
|
Foreign
|
(3,659
|
)
|
(913
|
)
|
(462
|
)
|
|||||
|
(28,096
|
)
|
15,009
|
|
(17,095
|
)
|
||||||
|
Total provision
|
$
|
223,570
|
|
$
|
298,566
|
|
$
|
313,082
|
|
||
Our provision for income taxes decreased by
$19.7 million
due to the benefit of deductions under section 199 of the Internal Revenue Code, by
$13.7 million
due to our adoption of ASU 2016-09, and
$12.1 million
due to the impact of the Tax Act.
A reconciliation of the provision for income taxes using the statutory federal income tax rate to our effective income tax rate for the years ended December 31 is as follows:
|
2017
|
2016
|
2015
|
||||||
|
Federal statutory rate
|
35.0
|
%
|
35.0
|
%
|
35.0
|
%
|
||
|
State income taxes, net of federal benefit
|
2.6
|
|
2.7
|
|
2.8
|
|
||
|
Tax Act impact
|
(1.7
|
)
|
—
|
|
—
|
|
||
|
Section 199 deduction
|
(2.8
|
)
|
—
|
|
—
|
|
||
|
ASU 2016-09 adoption
|
(1.9
|
)
|
—
|
|
—
|
|
||
|
Other
|
(0.5
|
)
|
(0.9
|
)
|
0.3
|
|
||
|
Effective income tax rate
|
30.7
|
%
|
36.8
|
%
|
38.1
|
%
|
||
49
Deferred tax assets (liabilities) are comprised of the following at December 31 (in thousands):
|
2017
|
2016
|
||||||
|
Deferred tax assets:
|
|||||||
|
Compensation
|
$
|
52,538
|
|
$
|
80,338
|
|
|
|
Receivables
|
8,819
|
|
13,471
|
|
|||
|
Other
|
7,892
|
|
11,433
|
|
|||
|
Deferred tax liabilities:
|
|||||||
|
Intangible assets
|
(81,932
|
)
|
(131,698
|
)
|
|||
|
Prepaid assets
|
(8,247
|
)
|
(14,540
|
)
|
|||
|
Long-lived assets
|
(15,465
|
)
|
(21,268
|
)
|
|||
|
Other
|
(2,090
|
)
|
(608
|
)
|
|||
|
Net deferred tax liabilities
|
$
|
(38,485
|
)
|
$
|
(62,872
|
)
|
|
The Tax Act reduces the corporate tax rate to
21 percent
, effective January 1, 2018. Consequently, we have recorded a provisional decrease related to deferred tax assets and deferred tax liabilities of
$34.4 million
and
$57.3 million
, respectively.
We had foreign net operating loss carryforwards with a tax effect of
$10.9 million
as of
December 31, 2017
, and
$9.0 million
as of
December 31, 2016
. The net operating loss carryforwards will expire at various dates from 2018 to 2025, with certain jurisdictions having indefinite carryforward terms. A full valuation allowance has been established for these net operating loss carryforwards due to the uncertainty of the use of the tax benefit in future periods.
PREFERRED STOCK.
Our Certificate of Incorporation authorizes the issuance of
20,000,000
shares of preferred stock, par value
$0.10
per share. There are
no
shares of preferred stock outstanding. The preferred stock may be issued by resolution of our Board of Directors at any time without any action of the stockholders. The Board of Directors may issue the preferred stock in one or more series and fix the designation and relative powers. These include voting powers, preferences, rights, qualifications, limitations, and restrictions of each series. The issuance of any such series may have an adverse effect on the rights of holders of common stock and may impede the completion of a merger, tender offer, or other takeover attempt.
COMMON STOCK.
Our Certificate of Incorporation authorizes
480,000,000
shares of common stock, par value
$.10
per share. Subject to the rights of preferred stock which may from time to time be outstanding, holders of common stock are entitled to receive dividends out of funds legally available, when and if declared by the Board of Directors, and to receive their share of the net assets of the company legally available for distribution upon liquidation or dissolution.
For each share of common stock held, stockholders are entitled to
one
vote on each matter to be voted on by the stockholders, including the election of directors. Holders of common stock are not entitled to cumulative voting. The stockholders do not have preemptive rights. All outstanding shares of common stock are fully paid and nonassessable.
STOCK AWARD PLANS.
Stock-based compensation cost is measured at the grant date based on the value of the award and is recognized as expense as it vests. A summary of our total compensation expense recognized in our consolidated statements of operations and comprehensive income for stock-based compensation is as follows (in thousands):
|
2017
|
2016
|
2015
|
|||||||||
|
Stock options
|
$
|
10,109
|
|
$
|
9,178
|
|
$
|
14,607
|
|
||
|
Stock awards
|
29,217
|
|
25,912
|
|
40,785
|
|
|||||
|
Company expense on ESPP discount
|
2,479
|
|
2,475
|
|
2,269
|
|
|||||
|
Total stock-based compensation expense
|
$
|
41,805
|
|
$
|
37,565
|
|
$
|
57,661
|
|
||
50
On May 12, 2016, our shareholders approved an amendment to and restatement of our 2013 Equity Incentive Plan, which allows us to grant certain stock awards, including stock options at fair market value and restricted shares and restricted stock units, to our key employees and outside directors. A maximum of
13,041,803
shares can be granted under this plan. Approximately
2,920,099
shares were available for stock awards under this plan as of
December 31, 2017
. Shares subject to awards that expire or are canceled without delivery of shares or that are settled in cash, generally become available again for issuance under the plan.
We have awarded performance-based stock options to certain key employees. These options are subject to certain vesting requirements over a
five
-year period, based on the company’s earnings growth. Any options remaining unvested at the end of the
five
-year vesting period are forfeited to the company. Although participants can exercise options via a stock swap exercise, we do not issue reloads (restoration options) on the grants.
The fair value of these options is established based on the market price on the date of grant, discounted for post-vesting holding restrictions, calculated using the Black-Scholes option pricing model. Changes in measured stock price volatility and interest rates are the primary reasons for changes in the discount. These grants are being expensed based on the terms of the awards. As of
December 31, 2017
, unrecognized compensation expense related to stock options was
$58.4 million
. The amount of future expense to be recognized will be based on the company’s earnings growth and certain other conditions.
The following schedule summarizes stock option activity in the plans. All outstanding unvested options as of
December 31, 2017
, relate to performance-based grants from 2013 and 2014 and time-based grants from 2015 through 2017.
|
Options
|
Weighted
Average
Exercise
Price
|
Aggregate
Intrinsic
Value
(in thousands)
|
Average
Remaining
Life
(years)
|
|||||||||
|
Outstanding at December 31, 2016
|
7,007,923
|
|
$
|
67.00
|
|
$
|
43,875
|
|
7.7
|
|||
|
Grants
|
1,452,765
|
|
87.11
|
|
||||||||
|
Exercised
|
(388,135
|
)
|
63.81
|
|
||||||||
|
Terminated
|
(690,481
|
)
|
62.17
|
|
||||||||
|
Outstanding at December 31, 2017
|
7,382,072
|
|
$
|
71.58
|
|
$
|
129,295
|
|
7.6
|
|||
|
Vested at December 31, 2017
|
2,990,514
|
|
$
|
65.79
|
|
6.3
|
||||||
|
Exercisable at December 31, 2017
|
2,990,514
|
|
$
|
65.79
|
|
6.3
|
||||||
Additional potential dilutive stock options totaling
1,357,290
for
2017
have been excluded from our diluted net income per share calculations because these securities’ exercise prices were anti-dilutive (e.g., greater than the average market price of our common stock).
Information on the intrinsic value of options exercised is as follows (in thousands):
|
2017
|
$
|
6,026
|
|
|
2016
|
981
|
|
|
|
2015
|
400
|
|
|
51
The following table summarizes performance based options by vesting period:
|
First Vesting Date
|
Last Vesting Date
|
Options
Granted, Net of Forfeitures |
Weighted
Average Grant Date Fair Value |
Unvested Options
|
||||||||
|
December 31, 2014
|
December 31, 2018
|
1,412,773
|
|
11.83
|
|
403,149
|
|
|||||
|
December 31, 2015
|
December 31, 2019
|
1,271,223
|
|
14.17
|
|
682,926
|
|
|||||
|
2,683,996
|
|
$
|
12.94
|
|
1,086,075
|
|
||||||
We issued
no
performance-based options in 2015, 2016, or 2017. We have awarded stock options to certain key employees that vest primarily based on their continued employment. The value of these awards is established by the market price on the date of the grant and is being expensed over the vesting period of the award. The following table summarizes these unvested stock option grants as of
December 31, 2017
:
|
First Vesting Date
|
Last Vesting Date
|
Options
Granted, Net of Forfeitures |
Weighted
Average Grant Date Fair Value |
Unvested Options
|
||||||||
|
December 31, 2016
|
December 31, 2020
|
1,423,053
|
|
$
|
12.66
|
|
855,984
|
|
||||
|
December 31, 2017
|
December 31, 2021
|
1,253,169
|
|
$
|
12.60
|
|
1,003,429
|
|
||||
|
December 31, 2018
|
December 31, 2022
|
1,446,070
|
|
$
|
14.24
|
|
1,446,070
|
|
||||
|
4,122,292
|
|
$
|
13.20
|
|
3,305,483
|
|
||||||
Determining Fair Value
We estimated the fair value of stock options granted using the Black-Scholes option pricing model. We estimate the fair value of restricted shares and units using the Black-Scholes option pricing model-protective put method. A description of significant assumptions used to estimate the expected volatility, risk-free interest rate, and expected terms is as follows:
Expected Volatility
-Expected volatility was determined based on implied volatility of our traded options and historical volatility of our stock price.
Risk-Free Interest Rate
-The risk-free interest rate was based on the implied yield available on U.S. Treasury zero-coupon issues at the date of grant with a term equal to the expected term.
Expected Term
-
Expected term represents the period that our stock-based awards are expected to be outstanding and was determined based on historical experience and anticipated future exercise patterns, giving consideration to the contractual terms of unexercised stock-based awards.
The fair value per option was estimated using the Black-Scholes option pricing model with the following assumptions:
|
2017 Grants
|
2016 Grants
|
2015 Grants
|
|||||||||
|
Risk-free interest rate
|
2.27-2.28%
|
|
2.13-2.14%
|
|
1.95-1.96%
|
|
|||||
|
Dividend per share (quarterly amounts)
|
$0.45-0.46
|
|
$0.43-0.45
|
|
$0.38-0.43
|
|
|||||
|
Expected volatility factor
|
19.0-21.5%
|
|
20.0-21.5%
|
|
22.0-24.0%
|
|
|||||
|
Expected option term
|
6.20 years
|
|
6.26 years
|
|
6.29 years
|
|
|||||
|
Weighted average fair value per option
|
$
|
14.23
|
|
$
|
12.60
|
|
$
|
12.68
|
|
||
FULL VALUE AWARDS.
We have awarded performance-based restricted shares and restricted stock units to certain key employees and non-employee directors. These awards are subject to certain vesting requirements over a
five
-year period, based on the company’s earnings growth. The awards also contain restrictions on the awardees’ ability to sell or transfer vested awards for a specified period of time. The fair value of these awards is established based on the market price on the date of grant, discounted for post-vesting holding restrictions. The discounts on outstanding grants vary from
15 percent
to
21 percent
and are calculated using the Black-Scholes option pricing model-protective put method. Changes in measured stock price volatility and interest rates are the primary reasons for changes in the discount. These grants are being expensed based on the terms of the awards.
52
The following table summarizes our unvested performance based restricted shares and restricted stock unit grants as of
December 31, 2017
:
|
Number of
Shares and Restricted Stock Units
|
Weighted Average
Grant Date Fair Value
|
|||||
|
Unvested at December 31, 2016
|
1,245,175
|
|
$
|
55.90
|
|
|
|
Granted
|
310,071
|
|
74.14
|
|
||
|
Vested
|
(121,030
|
)
|
55.77
|
|
||
|
Forfeitures
|
(218,757
|
)
|
49.51
|
|
||
|
Unvested at December 31, 2017
|
1,215,459
|
|
$
|
61.71
|
|
|
The following table summarizes performance based restricted shares and restricted stock units by vesting period:
|
First Vesting Date
|
Last Vesting Date
|
Performance Shares and Stock Units
Granted, Net of
Forfeitures
|
Weighted
Average Grant
Date Fair Value
(1)
|
Unvested Performance Shares and Restricted Stock Units
|
||||||||
|
December 31, 2014
|
December 31, 2018
|
387,587
|
|
$
|
46.50
|
|
109,784
|
|
||||
|
December 31, 2015
|
December 31, 2019
|
329,596
|
|
60.80
|
|
175,904
|
|
|||||
|
December 31, 2016
|
December 31, 2020
|
392,990
|
|
51.88
|
|
309,300
|
|
|||||
|
December 31, 2017
|
December 31, 2021
|
343,014
|
|
64.91
|
|
312,142
|
|
|||||
|
December 31, 2018
|
December 31, 2022
|
308,329
|
|
74.19
|
|
308,329
|
|
|||||
|
1,761,516
|
|
$
|
58.71
|
|
1,215,459
|
|
||||||
|
(1)
|
Amount shown is the weighted average grant date fair value of performance shares and restricted stock units granted, net of forfeitures.
|
We have also awarded time-based restricted shares and restricted stock units to certain key employees that vest primarily based on their continued employment. The value of these awards is established by the market price on the date of the grant and is being expensed over the vesting period of the award. The following table summarizes these unvested restricted share and restricted stock unit grants as of
December 31, 2017
:
|
Number of Restricted
Shares and Stock Units
|
Weighted Average
Grant Date Fair Value
|
|||||
|
Unvested at December 31, 2016
|
1,240,156
|
|
$
|
56.70
|
|
|
|
Granted
|
280,097
|
|
74.17
|
|
||
|
Vested
|
(386,859
|
)
|
54.39
|
|
||
|
Forfeitures
|
(75,944
|
)
|
56.41
|
|
||
|
Unvested at December 31, 2017
|
1,057,450
|
|
$
|
62.20
|
|
|
We have also issued to certain key employees and non-employee directors restricted stock units which are fully vested upon issuance. These units contain restrictions on the awardees’ ability to sell or transfer vested units for a specified period of time. The fair value of these units is established using the same method discussed above. These grants have been expensed during the year they were earned.
A summary of the fair value of full value awards vested (in thousands):
|
2017
|
$
|
29,217
|
|
|
2016
|
25,912
|
|
|
|
2015
|
40,785
|
|
|
As of
December 31, 2017
, there was unrecognized compensation expense of
$140.8 million
related to previously granted full value awards. The amount of future expense to be recognized will be based on the company’s earnings growth and the continued employment of certain key employees.
53
EMPLOYEE STOCK PURCHASE PLAN.
Our 1997 Employee Stock Purchase Plan allows our employees to contribute up to
$10,000
of their annual cash compensation to purchase company stock. Purchase price is determined using the closing price on the last day of the quarter discounted by
15 percent
. Shares are vested immediately. The following is a summary of the employee stock purchase plan activity (dollar amounts in thousands):
|
Shares Purchased
By Employees
|
Aggregate Cost
to Employees
|
Expense Recognized
By the Company
|
|||||||||
|
2017
|
215,613
|
|
$
|
14,048
|
|
$
|
2,479
|
|
|||
|
2016
|
225,241
|
|
14,032
|
|
2,475
|
|
|||||
|
2015
|
228,103
|
|
13,045
|
|
2,269
|
|
|||||
SHARE REPURCHASE PROGRAMS.
During 2013, our Board of Directors increased the number of shares authorized to be repurchased by
15,000,000
shares (the “2013 Program”). The activity under this authorization is as follows (dollar amounts in thousands):
|
Shares Repurchased
|
Total Value of Shares
Repurchased |
||||||
|
2013 Program
|
|||||||
|
2013 Repurchases
|
930,075
|
|
$
|
57,689
|
|
||
|
2014 Repurchases
|
3,763,583
|
|
239,037
|
|
|||
|
2015 Repurchases
|
3,420,681
|
|
232,113
|
|
|||
|
2016 Repurchases
|
2,467,097
|
|
176,676
|
|
|||
|
2017 Repurchases
|
2,426,407
|
|
179,985
|
|
|||
As of
December 31, 2017
, there were
1,992,157
shares remaining for repurchase under the 2013 authorization.
EMPLOYEE BENEFIT PLANS.
We offer a defined contribution plan, which qualifies under section 401(k) of the Internal Revenue Code and covers all eligible U.S. employees. We can also elect to make matching contributions to the plan. Annual discretionary contributions may also be made to the plan. Defined contribution plan expense, including matching contributions, was approximately (in thousands):
|
2017
|
$
|
27,530
|
|
|
2016
|
25,740
|
|
|
|
2015
|
46,507
|
|
|
We have committed to a defined contribution match of
four percent
of eligible compensation in 2018. We contributed a defined contribution match of
four percent
in 2017, 2016, and 2015.
NONQUALIFIED DEFERRED COMPENSATION PLAN.
All restricted shares vested but not yet delivered, as well as a deferred share award granted to our CEO, are held within this plan.
LEASE COMMITMENTS.
We lease certain facilities and equipment under operating leases. Information regarding our lease expense is as follows (in thousands):
|
2017
|
$
|
60,864
|
|
|
2016
|
55,170
|
|
|
|
2015
|
56,210
|
|
|
54
Minimum future lease commitments under noncancelable lease agreements in excess of one year as of
December 31, 2017
, are as follows (in thousands):
|
2018
|
$
|
51,273
|
|
|
2019
|
46,172
|
|
|
|
2020
|
39,825
|
|
|
|
2021
|
29,851
|
|
|
|
2022
|
22,807
|
|
|
|
Thereafter
|
92,797
|
|
|
|
Total
|
$
|
282,725
|
|
In addition to minimum lease payments, we are typically responsible under our lease agreements to pay our pro rata share of maintenance expenses, common charges, and real estate taxes of the buildings in which we lease space.
LITIGATION.
We are not subject to any pending or threatened litigation other than routine litigation arising in the ordinary course of our business operations, including
16
contingent auto liability cases as of
December 31, 2017
. For some legal proceedings, we have accrued an amount that reflects the aggregate liability deemed probable and estimable, but this amount is not material to our consolidated financial position, results of operations, or cash flows. Because of the preliminary nature of many of these proceedings, the difficulty in ascertaining the applicable facts relating to many of these proceedings, the inconsistent treatment of claims made in many of these proceedings, and the difficulty of predicting the settlement value of many of these proceedings, we are not able to estimate an amount or range of any reasonably possible additional losses. However, based upon our historical experience, the resolution of these proceedings is not expected to have a material effect on our consolidated financial position, results of operations, or cash flows.
55
On August 31, 2017, we acquired all of the outstanding shares of Milgram & Company Ltd. ("Milgram") for the purpose of expanding our global presence and bringing additional capabilities and expertise to our portfolio. Total purchase consideration, net of cash acquired, was
$47.3 million
, which was paid in cash. We used advances under the Credit Agreement to fund part of the cash consideration.
Identifiable intangible assets and estimated useful lives are as follows (dollars in thousands):
|
Estimated Life (years)
|
|||||
|
Customer relationships
|
7
|
$
|
14,004
|
|
|
There was
$28.6 million
of goodwill recorded related to the acquisition of Milgram. The Milgram goodwill is a result of acquiring and retaining the Milgram existing workforce and expected synergies from integrating its business into ours. Purchase accounting is considered preliminary, subject to revision primarily related to certain income tax related balances expected to be finalized in 2018. The goodwill is not deductible for tax purposes. The results of operations of Milgram have been included in our consolidated financial statements since September 1, 2017. Pro forma financial information for prior periods is not presented because we believe the acquisition to be not material to our consolidated results.
On September 30, 2016, we acquired all of the outstanding stock of APC Logistics (“APC”) for the purpose of expanding our global presence and bringing additional capabilities and expertise to the company’s portfolio. Total purchase consideration was
$229.4 million
, which was paid in cash. We used advances under the Credit Agreement to fund part of the cash consideration. The following is a summary of the allocation of purchase price consideration to the estimated fair value of net assets for the acquisition of APC (in thousands):
|
Cash and cash equivalents
|
$
|
10,181
|
|
|
Receivables
|
37,190
|
|
|
|
Other current assets
|
2,609
|
|
|
|
Property and equipment
|
1,696
|
|
|
|
Identifiable intangible assets
|
78,842
|
|
|
|
Goodwill
|
132,797
|
|
|
|
Other noncurrent assets
|
70
|
|
|
|
Long term deferred tax asset
|
814
|
|
|
|
Total assets
|
264,199
|
|
|
|
|
|||
|
Accounts payable
|
(22,147
|
)
|
|
|
Accrued expenses
|
(12,700
|
)
|
|
|
Net assets acquired
|
$
|
229,352
|
|
Identifiable intangible assets and estimated useful lives are as follows (dollars in thousands):
|
Estimated Life (years)
|
|||||
|
Customer relationships
|
7
|
|
$
|
78,842
|
|
The APC goodwill is a result of acquiring and retaining the APC existing workforce and expected synergies from integrating their business into ours. Purchase accounting is considered final. The goodwill will not be deductible for tax purposes. The results of operations of APC have been included in our consolidated financial statements since October 1, 2016. Pro forma financial information for prior periods is not presented because we believe the acquisition to be not material to our consolidated results.
56
On January 1, 2015, we acquired all of the outstanding stock of Freightquote.com, Inc., (“Freightquote”) for the purpose of enhancing our less than truckload (“LTL”) and truckload businesses and expanding our ecommerce capabilities. Total purchase consideration was
$398.6 million
, which was paid in cash. We used advances under the Credit Agreement to fund part of the cash consideration. The following is a summary of the allocation of purchase consideration to the estimated fair value of net assets for the acquisition of Freightquote (in thousands):
|
Cash and cash equivalents
|
$
|
29,302
|
|
|
Receivables
|
56,228
|
|
|
|
Other current assets
|
2,395
|
|
|
|
Property and equipment
|
43,687
|
|
|
|
Identifiable intangible assets
|
37,800
|
|
|
|
Goodwill
|
287,220
|
|
|
|
Trademarks
|
8,600
|
|
|
|
Other noncurrent assets
|
3,421
|
|
|
|
Total assets
|
468,653
|
|
|
|
|
|||
|
Accounts payable
|
(44,622
|
)
|
|
|
Accrued expenses
|
(5,485
|
)
|
|
|
Other liabilities
|
(19,939
|
)
|
|
|
Net assets acquired
|
$
|
398,607
|
|
Following are the details of the purchase price allocated to the intangible assets acquired (dollars in thousands):
|
|
Estimated Life (years)
|
|
|||
|
Customer relationships
|
5
|
|
$
|
37,500
|
|
|
Noncompete agreements
|
5
|
|
300
|
|
|
|
Total identifiable intangible assets
|
|
|
$
|
37,800
|
|
We also acquired a trademark valued at
$8.6 million
, which has been determined to be indefinite-lived. The Freightquote goodwill is a result of acquiring and retaining the Freightquote existing workforce and expected synergies from integrating their business into ours. Purchase accounting is considered final. The goodwill will not be deductible for tax purposes. The results of operations of Freightquote have been included in our consolidated financial statements since the acquisition date of January 1, 2015.
57
Our reportable segments are based on our method of internal reporting, which generally segregates the segments by service line and the primary services they provide to our customers. We identify
three
reportable segments as follows:
|
•
|
North American Surface Transportation:
NAST provides freight transportation services across North America through a network of offices in the United States, Canada, and Mexico. The primary services provided by NAST include truckload, LTL, and intermodal.
|
|
•
|
Global Forwarding:
Global Forwarding provides global logistics services through an international network of offices in North America, Asia, Europe, Australia, New Zealand, and South America and also contracts with independent agents worldwide. The primary services provided by Global Forwarding include ocean freight services, air freight services, and customs brokerage.
|
|
•
|
Robinson Fresh:
Robinson Fresh provides sourcing services under the trade name of Robinson Fresh. Our sourcing services primarily include the buying, selling, and marketing of fresh fruits, vegetables, and other perishable items. Robinson Fresh sources products from around the world and has a physical presence in North America, Europe, Asia, and South America. This segment often provides the logistics and transportation of the products they sell, in addition to temperature controlled transportation services for its customers.
|
|
•
|
All Other and Corporate:
All Other and Corporate includes our Managed Services segment, as well as Other Surface Transportation outside of North America and other miscellaneous revenues and unallocated corporate expenses. Managed Services provides Transportation Management Services, or Managed TMS
®
. Other Surface Transportation revenues are primarily earned by Europe Surface Transportation. Europe Surface Transportation provides services similar to NAST across Europe.
|
The internal reporting of segments is defined, based in part, on the reporting and review process used by our chief operating decision maker, our Chief Executive Officer. The accounting policies of our reporting segments are the same as those described in the summary of significant accounting policies. Segment information for prior years has been retroactively recast to align with current year presentation. Segment information as of, and for the years ended, December 31,
2017
,
2016
, and
2015
is as follows (dollars in thousands):
58
|
Twelve months ended December 31, 2017
|
|||||||||||||||||||||||
|
NAST
|
Global Forwarding
|
Robinson Fresh
|
All Other and Corporate
|
Eliminations
|
Consolidated
|
||||||||||||||||||
|
Revenues
|
$
|
9,728,810
|
|
$
|
2,140,987
|
|
$
|
2,415,740
|
|
$
|
583,843
|
|
$
|
—
|
|
$
|
14,869,380
|
|
|||||
|
Intersegment revenues
(1)
|
462,390
|
|
30,198
|
|
167,292
|
|
18,174
|
|
(678,054
|
)
|
—
|
|
|||||||||||
|
Total Revenues
|
$
|
10,191,200
|
|
$
|
2,171,185
|
|
$
|
2,583,032
|
|
$
|
602,017
|
|
$
|
(678,054
|
)
|
$
|
14,869,380
|
|
|||||
|
Net Revenues
|
$
|
1,525,064
|
|
$
|
485,280
|
|
$
|
226,059
|
|
$
|
131,647
|
|
$
|
—
|
|
$
|
2,368,050
|
|
|||||
|
Operating Income
|
628,110
|
|
91,842
|
|
53,374
|
|
1,793
|
|
—
|
|
775,119
|
|
|||||||||||
|
Depreciation and amortization
|
23,230
|
|
33,308
|
|
4,730
|
|
31,709
|
|
—
|
|
92,977
|
|
|||||||||||
|
Total assets
(2)
|
2,277,252
|
|
821,182
|
|
434,080
|
|
703,320
|
|
—
|
|
4,235,834
|
|
|||||||||||
|
Average headcount
|
6,907
|
|
4,310
|
|
957
|
|
2,513
|
|
—
|
|
14,687
|
|
|||||||||||
|
Twelve months ended December 31, 2016
|
|||||||||||||||||||||||
|
NAST
|
Global Forwarding
|
Robinson Fresh
|
All Other and Corporate
|
Eliminations
|
Consolidated
|
||||||||||||||||||
|
Revenues
|
$
|
8,737,716
|
|
$
|
1,574,686
|
|
$
|
2,344,131
|
|
$
|
487,880
|
|
$
|
—
|
|
$
|
13,144,413
|
|
|||||
|
Intersegment revenues
(1)
|
298,438
|
|
30,311
|
|
119,403
|
|
2,211
|
|
(450,363
|
)
|
—
|
|
|||||||||||
|
Total Revenues
|
$
|
9,036,154
|
|
$
|
1,604,997
|
|
$
|
2,463,534
|
|
$
|
490,091
|
|
$
|
(450,363
|
)
|
$
|
13,144,413
|
|
|||||
|
Net Revenues
|
$
|
1,524,355
|
|
$
|
397,537
|
|
$
|
234,794
|
|
$
|
120,842
|
|
$
|
—
|
|
$
|
2,277,528
|
|
|||||
|
Operating Income
|
674,436
|
|
80,931
|
|
75,757
|
|
6,407
|
|
—
|
|
837,531
|
|
|||||||||||
|
Depreciation and amortization
|
22,126
|
|
23,099
|
|
3,782
|
|
25,662
|
|
—
|
|
74,669
|
|
|||||||||||
|
Total assets
(2)
|
2,088,611
|
|
703,741
|
|
376,654
|
|
518,752
|
|
—
|
|
3,687,758
|
|
|||||||||||
|
Average headcount
|
6,773
|
|
3,673
|
|
942
|
|
2,282
|
|
—
|
|
13,670
|
|
|||||||||||
|
Twelve months ended December 31, 2015
|
|||||||||||||||||||||||
|
NAST
|
Global Forwarding
|
Robinson Fresh
|
All Other and Corporate
|
Eliminations
|
Consolidated
|
||||||||||||||||||
|
Revenues
|
$
|
8,968,349
|
|
$
|
1,639,944
|
|
$
|
2,395,440
|
|
$
|
472,351
|
|
$
|
—
|
|
$
|
13,476,084
|
|
|||||
|
Intersegment revenues
(1)
|
271,557
|
|
19,102
|
|
89,033
|
|
2,107
|
|
(381,799
|
)
|
—
|
|
|||||||||||
|
Total Revenues
|
$
|
9,239,906
|
|
$
|
1,659,046
|
|
$
|
2,484,473
|
|
$
|
474,458
|
|
$
|
(381,799
|
)
|
$
|
13,476,084
|
|
|||||
|
Net Revenues
|
$
|
1,564,917
|
|
$
|
365,467
|
|
$
|
235,334
|
|
$
|
102,762
|
|
$
|
—
|
|
$
|
2,268,480
|
|
|||||
|
Operating Income/(Loss)
|
718,329
|
|
76,081
|
|
81,332
|
|
(17,432
|
)
|
—
|
|
858,310
|
|
|||||||||||
|
Depreciation and amortization
|
21,846
|
|
20,790
|
|
2,927
|
|
20,846
|
|
—
|
|
66,409
|
|
|||||||||||
|
Total assets
(2)
|
1,878,203
|
|
556,606
|
|
346,728
|
|
402,821
|
|
—
|
|
3,184,358
|
|
|||||||||||
|
Average headcount
|
6,575
|
|
3,381
|
|
892
|
|
2,054
|
|
—
|
|
12,902
|
|
|||||||||||
__________________________
(1) Intersegment revenues represent the sales between our segments and are eliminated to reconcile to our consolidated results.
(2) All cash and cash equivalents and certain owned properties are included in All Other and Corporate.
59
The following table presents our total revenues (based on location of the customer) and long-lived assets (including intangible and other assets) by geographic regions (in thousands):
|
For the year ended December 31,
|
|||||||||||
|
|
2017
|
2016
|
2015
|
||||||||
|
Total revenues
|
|||||||||||
|
United States
|
$
|
12,865,087
|
|
$
|
11,749,602
|
|
$
|
12,097,633
|
|
||
|
Other locations
|
2,004,293
|
|
1,394,811
|
|
1,378,451
|
|
|||||
|
Total revenues
|
$
|
14,869,380
|
|
$
|
13,144,413
|
|
$
|
13,476,084
|
|
||
|
As of December 31,
|
|||||||||||
|
2017
|
2016
|
2015
|
|||||||||
|
Long-lived assets
|
|||||||||||
|
United States
|
$
|
335,072
|
|
$
|
348,299
|
|
$
|
320,445
|
|
||
|
Other locations
|
107,140
|
|
96,311
|
|
24,878
|
|
|||||
|
Total long-lived assets
|
$
|
442,212
|
|
$
|
444,610
|
|
$
|
345,323
|
|
||
Accumulated other comprehensive loss is included in the Stockholders’ investment on our consolidated balance sheets. The recorded balance at
December 31, 2017
, and
December 31, 2016
, was
$18.5 million
and
$61.4 million
, respectively, and is comprised solely of foreign currency translation adjustment.
In May 2014, the Financial Accounting Standards Board (“FASB”) issued Accounting Standards Update (“ASU”) 2014-09, “
Revenue from Contracts with Customers
,” and in August 2015 issued ASU 2015-14, which amended the standard as to effective date. The new comprehensive revenue recognition standard will supersede all existing revenue recognition guidance under U.S. GAAP. The standard’s core principle is that a company will recognize revenue when it transfers promised goods or services to a customer in an amount that reflects the consideration to which the company expects to be entitled in exchange for those goods or services. The standard requires more detailed disclosures to enable users of financial statements to understand the nature, amount, timing, and uncertainty of revenue and cash flows arising from contracts with customers. We adopted this new standard effective January 1, 2018 under the modified retrospective transition method with a cumulative adjustment to retained earnings of approximately
$10 million
.
The adoption of this standard will change the timing of revenue recognition for most of our transportation business from at delivery to over the transit period as our performance obligation is completed. Due to the short transit period of many of our performance obligations, we do not expect this change to have a material impact on our results of operations, financial position, or cash flows once implemented.
The new standard will expand our existing revenue recognition disclosures upon adoption beginning in the first quarter of 2018. In addition, we have identified certain customer contracts in our sourcing business that will change from a principal to an agent relationship under the new standard. This will cause the revenue associated with these contracts to be recognized at the net amount we charge our customers but will have no impact on income from operations.
60
In February 2016, the FASB issued ASU 2016-02,
Leases
(Topic 842). This update requires a lessee to recognize on the balance sheet a liability to make lease payments and a corresponding right-of-use asset. The guidance also requires certain qualitative and quantitative disclosures about the amount, timing, and uncertainty of cash flows arising from leases. This update is effective for annual and interim periods beginning after December 15, 2018, which will require us to adopt these provisions in the first quarter of 2019 using a modified retrospective approach. Early adoption is permitted, although we do not plan to adopt early. We have obligations under lease agreements for facilities and equipment, which are classified as operating leases under the existing lease standard. While we are still evaluating the impact ASU 2016-02 will have on our consolidated results of operations, financial condition, and cash flows, our financial statements will reflect an increase in both assets and liabilities due to the requirement to recognize right-of-use assets and lease liabilities on the consolidated balance sheets for our facility and equipment leases. See Note 7 to our consolidated financial statements which presents our operating lease commitments as of
December 31, 2017
.
In March 2016, the FASB issued ASU 2016-09,
Compensation - Stock Compensation
(Topic 718). This update was issued as part of the FASB’s simplification initiative and affects all entities that issue share-based payment awards to their employees. The amendments in this update cover such areas as the recognition of excess tax benefits and deficiencies, the classification of those excess tax benefits on the statement of cash flows, and accounting policy election for forfeitures, the amount an employer can withhold to cover income taxes and still qualify for equity classification, and the classification of those taxes paid on the statement of cash flows. This update is effective for annual and interim periods beginning after December 15, 2016. During the first quarter of 2017, we adopted ASU 2016-09,
Compensation - Stock Compensation
(Topic 718). The adoption of ASU 2016-09 prospectively impacts the recording of income taxes related to share-based payment awards in our consolidated statement of financial position and results of operations, as well as the operating and financing cash flows on the consolidated statements of cash flows. The magnitude of such impacts are dependent on our future grants of stock-based compensation, our future stock price in relation to the fair value of awards on grant date, and the exercise behavior of our option holders. We prospectively adopted these provisions in the first quarter of 2017. This adoption resulted in a decrease in our provision for income taxes for the year ended December 31, 2017 of
$13.7 million
.
In January 2017, the FASB issued ASU 2017-04,
Intangibles - Goodwill and other (Topic 350)
. This update simplifies the accounting for goodwill impairment and removes Step 2 of the goodwill impairment test. Instead, if the carrying amount of a reporting unit exceeds its fair value, any impairment loss shall be recognized in an amount equal to that excess, limited to the total amount of goodwill allocated to that reporting unit. Entities will continue to have the option to perform a qualitative assessment to determine if a quantitative impairment test is necessary. The ASU is effective for annual and any interim impairment tests for periods beginning after December 15, 2019. Early adoption is permitted for interim and annual goodwill impairment tests performed after January 1, 2017. We early adopted this ASU for our annual impairment test performed on November 30, 2017. There was no impact resulting from this adoption on our consolidated financial statements.
In May 2017, the FASB issued ASU 2017-09,
Compensation - Stock Compensation
(Topic 718):
Scope of Modification Accounting
. This update amends the scope of modification accounting for share-based payment arrangements. The ASU provides guidance on the types of changes to the terms or conditions of share-based payment awards to which an entity would be required to apply modification accounting under Topic 718. We adopted this new standard effective January 1, 2018. The amendments in this update will be applied prospectively to awards modified on or after January 1, 2018. The future impact of ASU 2017-09 will depend on the nature of future stock award modifications.
In February 2018, the FASB issued ASU 2018-02,
Reclassification of Certain Tax Effects From Accumulated Other Comprehensive Income
, which amends existing guidance for reporting comprehensive income to reflect changes resulting from the 2017 Tax Act. The amendment provides the option to reclassify stranded tax effects resulting from the 2017 Tax Act and within accumulated other comprehensive income (AOCI) to retained earnings. New disclosures will be required upon adoption, including the accounting policy for releasing income tax effects from AOCI, whether reclassification of stranded income tax effects is elected, and information about other income tax effect reclassifications. The amendment will become effective for us on January 1, 2019, though early adoption is permitted. We are currently evaluating the impact of adopting this standard on our consolidated financial statements and disclosures.
61
Our unaudited results of operations for each of the quarters in the years ended
December 31, 2017
and
2016
, are summarized below (in thousands, except per share data).
|
2017
|
March 31
(a)
|
June 30
|
September 30
|
December 31
(b)
|
||||||||||||
|
Revenues:
|
||||||||||||||||
|
Transportation
|
$
|
3,102,043
|
|
$
|
3,319,995
|
|
$
|
3,433,701
|
|
$
|
3,647,167
|
|
||||
|
Sourcing
|
313,082
|
|
390,023
|
|
350,750
|
|
312,619
|
|
||||||||
|
Total revenues
|
3,415,125
|
|
3,710,018
|
|
3,784,451
|
|
3,959,786
|
|
||||||||
|
Costs and expenses:
|
||||||||||||||||
|
Purchased transportation and related services
|
2,563,885
|
|
2,781,355
|
|
2,869,616
|
|
3,042,434
|
|
||||||||
|
Purchased products sourced for resale
|
282,674
|
|
354,874
|
|
320,989
|
|
285,503
|
|
||||||||
|
Personnel expenses
|
290,504
|
|
284,220
|
|
293,204
|
|
311,599
|
|
||||||||
|
Other selling, general, and administrative expenses
|
90,104
|
|
107,749
|
|
106,177
|
|
109,374
|
|
||||||||
|
Total costs and expenses
|
3,227,167
|
|
3,528,198
|
|
3,589,986
|
|
3,748,910
|
|
||||||||
|
Income from operations
|
187,958
|
|
181,820
|
|
194,465
|
|
210,876
|
|
||||||||
|
Net income
|
$
|
122,080
|
|
$
|
111,071
|
|
$
|
119,186
|
|
$
|
152,556
|
|
||||
|
Basic net income per share
|
$
|
0.86
|
|
$
|
0.79
|
|
$
|
0.85
|
|
$
|
1.09
|
|
||||
|
Diluted net income per share
|
$
|
0.86
|
|
$
|
0.78
|
|
$
|
0.85
|
|
$
|
1.08
|
|
||||
|
Basic weighted average shares outstanding
|
141,484
|
|
141,061
|
|
140,422
|
|
139,572
|
|
||||||||
|
Dilutive effect of outstanding stock awards
|
374
|
|
526
|
|
600
|
|
1,152
|
|
||||||||
|
Diluted weighted average shares outstanding
|
141,858
|
|
141,587
|
|
141,022
|
|
140,724
|
|
||||||||
|
Market price range of common stock:
|
||||||||||||||||
|
High
|
$
|
81.16
|
|
$
|
78.31
|
|
$
|
76.16
|
|
$
|
89.89
|
|
||||
|
Low
|
$
|
72.17
|
|
$
|
66.33
|
|
$
|
63.41
|
|
$
|
74.30
|
|
||||
__________________________
(a)
Our provision for income taxes decreased in the first quarter of 2017 by
$13.7 million
due to our adoption of ASU 2016-09.
(b)
Our provision for income taxes decreased in the fourth quarter by
$19.7 million
due to the benefit of deductions under section 199 of the Internal Revenue Code and
$12.1 million
due to the impact of the Tax Act.
62
|
2016
|
March 31
|
June 30
|
September 30
|
December 31
|
||||||||||||
|
Revenues:
|
||||||||||||||||
|
Transportation
|
$
|
2,713,688
|
|
$
|
2,881,496
|
|
$
|
2,998,583
|
|
$
|
3,110,978
|
|
||||
|
Sourcing
|
360,255
|
|
418,245
|
|
357,171
|
|
303,997
|
|
||||||||
|
Total revenues
|
3,073,943
|
|
3,299,741
|
|
3,355,754
|
|
3,414,975
|
|
||||||||
|
Costs and expenses:
|
||||||||||||||||
|
Purchased transportation and related services
|
2,179,622
|
|
2,324,995
|
|
2,469,939
|
|
2,575,378
|
|
||||||||
|
Purchased products sourced for resale
|
330,986
|
|
380,531
|
|
327,353
|
|
278,081
|
|
||||||||
|
Personnel expenses
|
277,497
|
|
270,251
|
|
256,883
|
|
260,305
|
|
||||||||
|
Other selling, general, and administrative expenses
|
86,886
|
|
90,217
|
|
90,312
|
|
107,646
|
|
||||||||
|
Total costs and expenses
|
2,874,991
|
|
3,065,994
|
|
3,144,487
|
|
3,221,410
|
|
||||||||
|
Income from operations
|
198,952
|
|
233,747
|
|
211,267
|
|
193,565
|
|
||||||||
|
Net income
|
$
|
118,963
|
|
$
|
143,090
|
|
$
|
129,028
|
|
$
|
122,303
|
|
||||
|
Basic net income per share
|
$
|
0.83
|
|
$
|
1.00
|
|
$
|
0.90
|
|
$
|
0.86
|
|
||||
|
Diluted net income per share
|
$
|
0.83
|
|
$
|
1.00
|
|
$
|
0.90
|
|
$
|
0.86
|
|
||||
|
Basic weighted average shares outstanding
|
143,525
|
|
142,998
|
|
142,611
|
|
141,711
|
|
||||||||
|
Dilutive effect of outstanding stock awards
|
133
|
|
218
|
|
272
|
|
453
|
|
||||||||
|
Diluted weighted average shares outstanding
|
143,658
|
|
143,216
|
|
142,883
|
|
142,164
|
|
||||||||
|
Market price range of common stock:
|
||||||||||||||||
|
High
|
$
|
75.11
|
|
$
|
76.10
|
|
$
|
75.69
|
|
$
|
77.89
|
|
||||
|
Low
|
$
|
60.31
|
|
$
|
69.84
|
|
$
|
66.62
|
|
$
|
65.57
|
|
||||
63
|
ITEM 9.
|
CHANGES IN AND DISAGREEMENTS WITH ACCOUNTANTS ON ACCOUNTING AND FINANCIAL DISCLOSURE
|
None.
|
ITEM 9A.
|
CONTROLS AND PROCEDURES
|
Disclosure Controls and Procedures
As of
December 31, 2017
, under the supervision and with the participation of our management, including our Chief Executive Officer and Chief Financial Officer, we evaluated the effectiveness of the design and operation of our disclosure controls and procedures (as defined in Rule 13a-15(e) under the Securities Exchange Act of 1934 (the “Exchange Act”)). Based upon that evaluation, the Chief Executive Officer and Chief Financial Officer concluded that our disclosure controls and procedures as of
December 31, 2017
were effective.
Management’s Report on Internal Control Over Financial Reporting
Our management is responsible for establishing and maintaining adequate internal control over financial reporting as such term is defined in Rule 13a-15(f) under the Exchange Act. All internal control systems, no matter how well designed, have inherent limitations. Therefore, even those systems determined to be effective can provide only reasonable assurance with respect to financial statement preparation and presentation.
Under the supervision and with the participation of our management, including our Chief Executive Officer and Chief Financial Officer, we conducted an evaluation of the effectiveness of our internal control over financial reporting as of
December 31, 2017
based on the framework in
Internal Control-Integrated Framework (2013)
issued by the Committee of Sponsoring Organizations of the Treadway Commission. Based on our evaluation under the framework in
Internal Control-Integrated Framework (2013)
, our management concluded that our internal control over financial reporting was effective as of
December 31, 2017
.
The effectiveness of our internal control over financial reporting as of
December 31, 2017
, has been audited by Deloitte & Touche LLP, an independent registered public accounting firm, as stated in their report, which is included in Item 8.
Changes in Internal Control Over Financial Reporting
There have not been any changes to the company’s internal control over financial reporting during the quarter ended
December 31, 2017
, to which this report relates, that have materially affected, or are reasonably likely to materially affect, the company’s internal control over financial reporting.
|
ITEM 9B.
|
OTHER INFORMATION
|
None.
64
|
ITEM 10.
|
DIRECTORS, EXECUTIVE OFFICERS, AND CORPORATE GOVERNANCE
|
Information with respect to our Board of Directors contained under the heading “Proposal One: Election of Directors,” and information contained under the heading “Section 16(a) Beneficial Ownership Reporting Compliance” in the Proxy Statement, are incorporated in this Form 10-K by reference. Information with respect to our executive officers is provided in Part I, Item 1 of this Form 10-K.
We have adopted a code of ethics that applies to our principal executive officer, principal financial officer, principal accounting officer, directors, and all other company employees performing similar functions. This code of ethics, which is part of our corporate compliance program, is posted on the Investors page of our website at www.chrobinson.com under the caption “Code of Ethics.”
We intend to satisfy the disclosure requirement under Item 10 of Form 8-K regarding an amendment to, or waiver from, a provision of this code of ethics by posting such information on our website, at the web address specified above.
|
ITEM 11.
|
EXECUTIVE COMPENSATION
|
The information contained under the heading “Named Executive Compensation” in the Proxy Statement (except for the information set forth under the subcaption “Compensation Committee Report on Executive Compensation”) is incorporated in this Form 10-K by reference.
|
ITEM 12.
|
SECURITY OWNERSHIP OF CERTAIN BENEFICIAL OWNERS AND MANAGEMENT AND RELATED STOCKHOLDER MATTERS
|
(a) Equity Compensation Plans
The following table summarizes share and exercise price information about our equity compensation plans as of
December 31, 2017
:
|
Plan Category
|
Number of Securities to Be Issued Upon Exercise of Outstanding Options, Warrants, and Rights
|
Weighted Average Exercise Price of Outstanding Options, Warrants, and Rights
|
Number of Securities Remaining Available for Future Issuance Under Equity Compensation Plans (Excluding Securities Reflected in the First Column)
|
|||||||
|
Equity compensation plans approved by security holders
(1)
|
10,600,204
|
|
$
|
71.58
|
|
2,920,099
|
|
|||
|
Equity compensation plans not approved by security holders
|
—
|
|
—
|
|
—
|
|
||||
|
Total
|
10,600,204
|
|
$
|
71.58
|
|
2,920,099
|
|
|||
________________________________
(1) Includes stock available for issuance under our Employee Stock Purchase Plan, as well as options, restricted stock granted, and shares that may become subject to future awards under our 2013 Equity Incentive Plan. Specifically, 3,218,132 shares remain available under our Employee Stock Purchase Plan, and 7,382,072 options remain outstanding for future exercise. Under our 2013 Equity Incentive Plan,
2,920,099
shares may become subject to future awards in the form of stock option grants or the issuance of restricted stock.
(b) Security Ownership
The information contained under the heading “Security Ownership of Certain Beneficial Owners and Management” in the Proxy Statement is incorporated in this Form 10-K by reference.
|
ITEM 13.
|
CERTAIN RELATIONSHIPS AND RELATED TRANSACTIONS, AND DIRECTOR INDEPENDENCE
|
The information contained under the heading “Related Party Transactions” in the Proxy Statement is incorporated in this Form 10-K by reference.
65
|
ITEM 14.
|
PRINCIPAL ACCOUNTING FEES AND SERVICES
|
The information contained under the heading “Proposal Four: Ratification of Independent Auditors” in the Proxy Statement is incorporated in this Form 10-K by reference.
|
ITEM 15.
|
EXHIBITS, FINANCIAL STATEMENT SCHEDULES
|
(a) The following documents are filed as part of this report:
(1) The company’s
2017
Consolidated Financial Statements and the Report of Independent Registered Public Accounting Firm are included in Part II, Item 8. Financial Statements and Supplementary Data.
(2) Financial Statement Schedules-The following Financial Statement Schedule should be read in conjunction with the Consolidated Financial Statements and Report of Independent Registered Public Accounting Firm included in Part II, Item 8 of this Annual report on Form 10-K:
Schedule II Valuation and Qualifying Accounts
Schedules other than the one listed above are omitted due to the absence of conditions under which they are required or because the information called for is included in Consolidated Financial Statements or the Notes to the Consolidated Financial Statements.
(b) Index to Exhibits-See Exhibit Index for a description of the documents that are filed as Exhibits to this report on Form 10-K or incorporated by reference herein. Any document incorporated by reference is identified by a parenthetical referencing the SEC filing which included the document. We will furnish a copy of any Exhibit at no cost to a security holder upon request.
SCHEDULE II. VALUATION AND QUALIFYING ACCOUNTS
Allowance for Doubtful Accounts
The transactions in the allowance for doubtful accounts for the years ended December 31, were as follows (in thousands):
|
2017
|
2016
|
2015
|
|||||||||
|
Balance, beginning of year
|
$
|
39,543
|
|
$
|
43,455
|
|
$
|
41,051
|
|
||
|
Provision
|
13,489
|
|
5,136
|
|
11,538
|
|
|||||
|
Write-offs
|
(10,623
|
)
|
(9,048
|
)
|
(9,134
|
)
|
|||||
|
Balance, end of year
|
$
|
42,409
|
|
$
|
39,543
|
|
$
|
43,455
|
|
||
66
INDEX TO EXHIBITS
|
Number
|
|
Description
|
|
2.1
|
||
|
2.2
|
||
|
3.1
|
|
|
|
3.2
|
|
|
|
4.1
|
|
|
|
†10.1
|
||
|
†10.2
|
|
|
|
10.3
|
||
|
10.4
|
||
|
10.5
|
||
|
10.6
|
||
|
10.7
|
||
|
10.8
|
||
|
10.9
|
||
|
10.10
|
||
|
10.11
|
||
|
†10.12
|
|
|
|
†10.13
|
|
|
|
†10.14
|
|
|
|
|
||
67
|
Number
|
|
Description
|
|
†10.15
|
|
|
|
†10.16
|
|
|
|
†10.17
|
|
|
|
†10.18
|
||
|
†10.19
|
||
|
†10.20
|
||
|
†10.21
|
||
|
†10.22
|
||
|
†10.23
|
||
|
†10.24
|
||
|
†10.25
|
||
|
*21
|
|
|
|
*23.1
|
|
|
|
*24
|
|
|
|
*31.1
|
|
|
|
*31.2
|
|
|
|
*32.1
|
|
|
|
*32.2
|
|
|
|
*101
|
|
The following financial statements from our Annual Report on Form 10-K for the year ended December 31, 2017, filed on February 28, 2018, formatted in XBRL: (i) Consolidated Statement of Operations and Comprehensive Income for the years ended December 31, 2017, 2016, and 2015, (ii) Consolidated Balance Sheets as of December 31, 2017 and 2016, (iii) Consolidated Statements of Cash Flows for the years ended December 31, 2017 and 2016, (iv) Consolidated Statements of Stockholders’ Investment for the years ended 2017, 2016, and 2015, and (v) the Notes to the Consolidated Financial Statements, tagged as blocks of text
|
|
*
|
Filed herewith
|
|
†
|
Management contract or compensatory plan or arrangement required to be filed as an exhibit to Form 10-K pursuant to Item 15(c) of the Form 10-K Report
|
68
SIGNATURES
Pursuant to the requirements of the Section 13 or 15(d) of the Securities Exchange Act of 1934, the registrant has duly caused this Report to be signed on its behalf by the undersigned, thereunto duly authorized, in the City of Eden Prairie, State of Minnesota, on February 28, 2018.
|
C.H. ROBINSON WORLDWIDE, INC.
|
||
|
By:
|
|
/s/ BEN G. CAMPBELL
|
|
|
Ben G. Campbell
|
|
|
|
Chief Legal Officer and Secretary
|
|
Pursuant to the requirements of the Securities Exchange Act of 1934, this Report has been signed below by the following persons on behalf of the registrant and in the capacities indicated on February 28, 2018.
|
Signature
|
Title
|
|
|
/s/ JOHN P. WIEHOFF
|
Chief Executive Officer, President, and Chairman of the Board (Principal Executive Officer)
|
|
|
John P. Wiehoff
|
||
|
/s/ ANDREW C. CLARKE
|
Chief Financial Officer (Principal Financial Officer and Principal Accounting Officer)
|
|
|
Andrew C. Clarke
|
||
|
*
|
Director
|
|
|
Scott P. Anderson
|
||
|
*
|
Director
|
|
|
Robert Ezrilov
|
||
|
*
|
Director
|
|
|
Wayne M. Fortun
|
||
|
*
|
Director
|
|
|
Timothy C. Gokey
|
||
|
*
|
Director
|
|
|
Mary J. Steele Guilfoile
|
||
|
*
|
Director
|
|
|
Jodee Kozlak
|
||
|
*
|
Director
|
|
|
Brian P. Short
|
||
|
*
|
Director
|
|
|
James B. Stake
|
||
|
*By:
|
/s/ BEN G. CAMPBELL
|
|
|
Ben G. Campbell
|
||
|
Attorney-in-Fact
|
||
69
TABLE OF CONTENTS
Part IItem 1. BusinessItem 1A. Risk FactorsItem 1B. Unresolved Staff CommentsItem 2. PropertiesItem 3. Legal ProceedingsItem 4. Mine Safety DisclosuresPart IIItem 5. Market For Registrant S Common Equity, Related Stockholder Matters, and Issuer Purchases Of Equity SecuritiesItem 6. Selected Financial DataItem 7. Management S Discussion and Analysis Of Financial Condition and Results Of OperationsItem 7A. Quantitative and Qualitative Disclosures About Market RiskItem 8. Financial Statements and Supplementary DataNote 1: Summary Of Significant Accounting PoliciesNote 2: Goodwill and Other Intangible AssetsNote 3: Fair Value MeasurementNote 4: Financing ArrangementsNote 5: Income TaxesNote 6: Capital Stock and Stock Award PlansNote 7: Commitments and ContingenciesNote 8: AcquisitionsNote 9: Segment ReportingNote 10: Changes in Accumulated Other Comprehensive LossNote 11: Recently Issued Accounting PronouncementsNote 12: Supplementary Data (unaudited)Item 9. Changes in and Disagreements with Accountants on Accounting and Financial DisclosureItem 9A. Controls and ProceduresItem 9B. Other InformationPart IIIItem 10. Directors, Executive Officers, and Corporate GovernanceItem 11. Executive CompensationItem 12. Security Ownership Of Certain Beneficial Owners and Management and Related Stockholder MattersItem 13. Certain Relationships and Related Transactions, and Director IndependenceItem 14. Principal Accounting Fees and ServicesPart IVItem 15. Exhibits, Financial Statement Schedules