CHARTER COMMUNICATIONS, INC. /MO/
10-Ks and 10-Qs
|
|
|
|
|
|
|
|
|
|
|
|
|
|
|
|
|
|
|
|
|
|
|
|
|
|
|
|
|
|
|
|
|
|
|
|
|
|
|
|
|
|
|
|
|
|
|
|
|
|
|
|
|
|
|
|
UNITED STATES
SECURITIES AND EXCHANGE COMMISSION
Washington, D.C. 20549
FORM 10-K
|
(Mark One)
|
||
|
[X]
|
ANNUAL REPORT PURSUANT TO SECTION 13 OR 15(d) OF THE SECURITIES EXCHANGE
ACT OF 1934
|
|
|
For the fiscal year ended December 31, 2010
|
||
|
or
|
||
|
[
]
|
TRANSITION REPORT PURSUANT TO SECTION 13 OR 15(d) OF THE SECURITIES
EXCHANGE ACT OF 1934
|
|
For the Transition Period From to
Commission File Number: 001-33664

Charter Communications, Inc.
(Exact name of registrant as specified in its charter)
|
Delaware
|
43-1857213
|
|
|
(State or other jurisdiction of incorporation or organization)
|
(I.R.S. Employer Identification Number)
|
|
|
12405 Powerscourt Drive
|
||
|
St. Louis, Missouri 63131
|
(314) 965-0555
|
|
|
(Address of principal executive offices including zip code)
|
(Registrant’s telephone number, including area code)
|
Securities registered pursuant to section 12(b) of the Act:
|
Title of each class
|
Name of Exchange which registered
|
|
|
Class A Common Stock, $.001 Par Value
|
NASDAQ Global Select Market
|
Securities registered pursuant to section 12(g) of the Act: None
Indicate by check mark if the registrant is a well-known seasoned issuer, as defined in Rule 405 of the Securities Act. Yes
þ
No
o
Indicate by check mark if the registrant is not required to file reports pursuant to Section 13 or Section 15(d) of the Act. Yes
o
No
þ
Indicate by check mark whether the registrant (1) has filed all reports required to be filed by Section 13 or 15(d) of the Securities Exchange Act of 1934 during the preceding 12 months (or for such shorter period that the registrant was required to file such reports), and (2) has been subject to such filing requirements for the past 90 days. Yes
þ
No
o
Indicate by check mark whether the registrants have submitted electronically and posted on their corporate website, if any, every Interactive Data File required to be submitted and posted pursuant to Rule 405 of Regulation S-T (§232.405 of this chapter) during the preceding 12 months (or for such shorter period that the registrants were required to submit and post such files). Yes
o
No
o
Indicate by check mark if disclosure of delinquent filers pursuant to Item 405 of Regulation S-K (§ 229.405 of this chapter) is not contained herein, and will not be contained, to the best of registrant’s knowledge, in definitive proxy or information statements incorporated by reference in Part III of this Form 10-K or any amendment to this Form 10-K.
þ
Indicate by check mark whether the registrant is a large accelerated filer, an accelerated filer, a non-accelerated filer, or a smaller reporting company. See definition of “accelerated filer,” “large accelerated filer,” and “smaller reporting company” in Rule 12b-2 of the Exchange Act. (Check one):
Large accelerated filer
þ
Accelerated filer
o
Non-accelerated filer
o
Smaller reporting company
o
Indicate by check mark whether the registrant is a shell company (as defined in Rule 12b-2 of the Act). Yes
o
No
þ
The aggregate market value of the registrant of outstanding Class A common stock held by non-affiliates of the registrant at June 30, 2010 was approximately $1.3 billion, computed based on the closing sale price as quoted on the OTC Bulletin Board on that date. For purposes of this calculation only, directors, executive officers and the principal controlling shareholders or entities controlled by such controlling shareholders of the registrant are deemed to be affiliates of the registrant.
APPLICABLE ONLY TO REGISTRANTS INVOLVED IN BANKRUPTCY
PROCEEDINGS DURING THE PRECEDING FIVE YEARS:
Indicate by check mark whether the registrant has filed all documents and reports required to be filed by Section 12, 13 or 15(d) of the Securities Exchange Act of 1934 subsequent to the distribution of securities under a plan confirmed by a court. Yes
þ
No
o
There were 114,566,527 shares of Class A common stock outstanding as of January 31, 2011. There were no shares of Class B common stock outstanding as of the same date.
Documents Incorporated By Reference
Information required by Part III is incorporated by reference from Registrant’s proxy statement or an amendment to this Annual Report on Form 10-K to be filed by April 30, 2011
CHARTER COMMUNICATIONS, INC.
FORM 10-K — FOR THE YEAR ENDED DECEMBER 31, 2010
TABLE OF CONTENTS
|
|
Page No.
|
|||
|
PART I
|
||||
|
Item 1
|
Business
|
1
|
||
|
Item 1A
|
Risk Factors
|
16
|
||
|
Item 1B
|
Unresolved Staff Comments
|
27
|
||
|
Item 2
|
Properties
|
28
|
||
|
Item 3
|
Legal Proceedings
|
28
|
||
|
PART II
|
||||
|
Item 5
|
Market for Registrant's Common Equity, Related Stockholder Matters and Issuer Purchases of Equity Securities
|
31
|
||
|
Item 6
|
Selected Financial Data
|
34
|
||
|
Item 7
|
Management's Discussion and Analysis of Financial Condition and Results of Operations
|
35
|
||
|
Item 7A
|
Quantitative and Qualitative Disclosure About Market Risk
|
61
|
||
|
Item 8
|
Financial Statements and Supplementary Data
|
63
|
||
|
Item 9
|
Changes in and Disagreements with Accountants on Accounting and Financial Disclosure
|
63
|
||
|
Item 9A
|
Controls and Procedures
|
63
|
||
|
Item 9B
|
Other Information
|
63
|
||
|
PART III
|
||||
|
Item 10
|
Directors, Executive Officers and Corporate Governance
|
64
|
||
|
Item 11
|
Executive Compensation
|
64
|
||
|
Item 12
|
Security Ownership of Certain Beneficial Owners and Management and Related Stockholder Matters
|
64
|
||
|
Item 13
|
Certain Relationships and Related Transactions, and Director Independence
|
64
|
||
|
Item 14
|
Principal Accounting Fees and Services
|
64
|
||
|
PART IV
|
||||
|
Item 15
|
Exhibits and Financial Statement Schedules
|
65
|
||
|
Signatures
|
S-1
|
|||
|
Exhibit Index
|
E-1
|
|||
This annual report on Form 10-K is for the year ended December 31, 2010. The Securities and Exchange Commission (“SEC”) allows us to “incorporate by reference” information that we file with the SEC, which means that we can disclose important information to you by referring you directly to those documents. Information incorporated by reference is considered to be part of this annual report. In addition, information that we file with the SEC in the future will automatically update and supersede information contained in this annual report. In this annual report, “we,” “us” and “our” refer to Charter Communications, Inc. and its subsidiaries.
i
CAUTIONARY STATEMENT REGARDING FORWARD-LOOKING STATEMENTS
This annual report contains “forward-looking statements” within the meaning of Section 27A of the Securities Act of 1933, as amended, which we refer to as the Securities Act, and Section 21E of the Securities Exchange Act of 1934, as amended, which we refer to as the Exchange Act, regarding, among other things, our plans, strategies and prospects, both business and financial, including, without limitation, the forward-looking statements set forth in Part I. Item 1. and in Part II. Item 7. under the heading “Management’s Discussion and Analysis of Financial Condition and Results of Operations” in this annual report. Although we believe that our plans, intentions and expectations reflected in or suggested by these forward-looking statements are reasonable, we cannot assure you that we will achieve or realize these plans, intentions or expectations. Forward-looking statements are inherently subject to risks, uncertainties and assumptions, including, without limitation, the factors described in Part I. Item 1A. under the heading "Risk Factors" and in Part II. Item 7. under the heading, “Management’s Discussion and Analysis of Financial Condition and Results of Operations” in this annual report. Many of the forward-looking statements contained in this annual report may be identified by the use of forward-looking words such as “believe,” “expect,” “anticipate,” “should,” “planned,” “will,” “may,” “intend,” “estimated,” “aim,” “on track,” “target,” “opportunity,” “tentative,” “positioning” and “potential,” among others. Important factors that could cause actual results to differ materially from the forward-looking statements we make in this annual report are set forth in this annual report and in other reports or documents that we file from time to time with the SEC, and include, but are not limited to:
|
·
|
our ability to sustain and grow revenues and free cash flow by offering video, high-speed Internet, telephone and other services to residential and commercial customers, to adequately meet the customer experience demands in our markets and to maintain and grow our customer base, particularly in the face of increasingly aggressive competition, the need for innovation and the related capital expenditures and the difficult economic conditions in the United States;
|
|
·
|
the impact of competition from other market participants, including but not limited to incumbent telephone companies, direct broadcast satellite operators, wireless broadband providers, and digital subscriber line (“DSL”) providers and competition from video provided over the Internet;
|
|
·
|
general business conditions, economic uncertainty or downturn, high unemployment levels and the level of activity in the housing sector;
|
|
·
|
our ability to obtain programming at reasonable prices or to raise prices to offset, in whole or in part, the effects of higher programming costs (including retransmission consents);
|
|
·
|
the effects of governmental regulation on our business;
|
|
·
|
the availability and access, in general, of funds to meet our debt obligations, prior to or when they become due, and to fund our operations and necessary capital expenditures, either through (i) cash on hand, (ii) free cash flow, or (iii) access to the capital or credit markets; and
|
|
·
|
our ability to comply with all covenants in our indentures and credit facilities, any violation of which, if not cured in a timely manner, could trigger a default of our other obligations under cross-default provisions.
|
All forward-looking statements attributable to us or any person acting on our behalf are expressly qualified in their entirety by this cautionary statement. We are under no duty or obligation to update any of the forward-looking statements after the date of this annual report.
ii
Introduction
We are among the largest providers of cable services in the United States, offering a variety of entertainment, information and communications solutions to residential and commercial customers. Our infrastructure consists of a hybrid of fiber and coaxial cable plant passing approximately 11.8 million homes, with 98% of homes passed at 550 megahertz (“MHz”) or greater and 97% of plant miles two-way active. A national Internet Protocol (IP) infrastructure interconnects all Charter Communications, Inc. (“Charter”) markets. See "Item 1. Business
— Products and Services
"
for further description of these terms and services, including
"
customers.
"
For the year ended December 31, 2010, we generated approximately $7.1 billion in revenue,
of which approximately 52% was generated from our residential video service
.
We also generated revenue from high-speed Internet, telephone service and advertising with residential and commercial high-speed Internet and telephone service contributing the majority of the recent growth in our revenue.
As of December 31, 2010, we served approximately 5.1 million customers. We sell our video, high-speed Internet and telephone services primarily on a subscription basis, often in a bundle of two or more services, providing savings and convenience to our customers. Bundled services are available to approximately 97% of our homes passed, and approximately 61% of our customers subscribe to a bundle of services.
We served approximately 4.5 million video customers as of December 31, 2010, of which approximately 74% subscribed to digital video service. Digital video enables our customers to access advanced video services such as high definition television, Charter OnDemand™
(“OnDemand”)
video programming, an interactive program guide and digital video recorder (“DVR”) service.
We also served approximately 3.2 million high-speed Internet customers as of December 31, 2010. Our high-speed Internet service is available in a variety of download speeds up to 60 megabits per second (“Mbps”). We also offer home networking service, or Wi-Fi, enabling our customers to connect up to five computers wirelessly in the home.
We provided telephone service to approximately 1.7 million customers as of December 31, 2010. Our telephone services typically include unlimited local and long distance calling to the U.S., Canada and Puerto Rico, plus other features, including voicemail, call waiting and caller ID.
Through Charter Business®, we provide scalable, tailored broadband communications solutions to business organizations, such as business-to-business Internet access, data networking, fiber connectivity to cellular towers, video and music entertainment services and business telephone. As of December 31, 2010, we served approximately 263,900 business revenue generating units, including small- and medium-sized commercial customers. Our advertising sales division, Charter Media®, provides local, regional and national businesses with the opportunity to advertise in individual markets on cable television networks.
We have a history of net losses. Our net losses are principally attributable to insufficient revenue to cover the combination of operating expenses, interest expenses that we incur because of our debt and depreciation expenses resulting from the capital investments we have made, and continue to make, in our cable properties, and in 2010, amortization expenses resulting from the application of fresh start accounting.
On March 27, 2009, we and certain affiliates filed voluntary petitions in the United States Bankruptcy Court for the Southern District of New York (the “Bankruptcy Court”), to reorganize under Chapter 11 of the United States Bankruptcy Code (the “Bankruptcy Code”). The Chapter 11 cases were jointly administered under the caption In re Charter Communications, Inc., et al., Case No. 09-11435. On May 7, 2009, we filed a Joint Plan of Reorganization (the “Plan”) and a related disclosure statement with the Bankruptcy Court. The Plan was confirmed by the Bankruptcy Court on November 17, 2009 (the “Confirmation Order”), and became effective on November 30, 2009 (the “Effective Date”), the date on which we emerged from protection under Chapter 11 of the Bankruptcy Code.
The terms “Charter,” “we,” “our” and “us,” when used in this report with respect to the period prior to Charter’s emergence from bankruptcy, are references to the Debtors (“Predecessor”) and, when used with respect to the period commencing after Charter’s emergence, are references to Charter (“Successor”). These references include the
1
subsidiaries of Predecessor or Successor, as the case may be, unless otherwise indicated or the context requires otherwise.
Our principal executive offices are located at 12405 Powerscourt Drive, St. Louis, Missouri 63131. Our telephone number is (314) 965-0555, and we have a website accessible at www.charter.com. Since January 1, 2002, our annual reports, quarterly reports and current reports on Form 8-K, and all amendments thereto, have been made available on our website free of charge as soon as reasonably practicable after they have been filed. The information posted on our website is not incorporated into this annual report.
Recent Events
On January 11, 2011, CCO Holdings, LLC (“CCO Holdings”) and CCO Holdings Capital Corp. completed the sale of $1.1 billion aggregate principal amount of 7.00% senior notes due 2019. The payment obligations under the notes are fully and unconditionally guaranteed on a senior unsecured basis by Charter. On January 24, 2011, CCO Holdings and CCO Holdings Capital Corp. completed the sale of $300 million aggregate principal amount of 7.00% senior notes due 2019. The notes formed part of the same series as the notes issued on January 11, 2011. Upon completion of this offering, the aggregate principal amount of outstanding notes under this series is $1.4 billion. The net proceeds of the issuances of the notes were contributed by CCO Holdings to Charter Communications Operating, LLC (“Charter Operating”) as a capital contribution and were used to repay indebtedness under the Amended and Restated Credit Agreement dated as of March 31, 2010, between Charter Operating, and various lenders thereunder.
As of December 31, 2010, Paul G. Allen held all 2,241,299 shares of Class B common stock of Charter. As the holder of the Class B common stock, he was entitled to appoint four members of Charter’s board of directors. Pursuant to the terms of the Certificate of Incorporation of Charter, on January 18, 2011, the Disinterested Members of the Board of Directors of Charter (as such term is defined in Charter’s Certificate of Incorporation) caused a conversion of the shares of Class B common stock into shares of Class A common stock on a one-for-one basis. As a result of such conversion, Mr. Allen no longer has the right to appoint four directors and the Class B directors became Class A directors. On January 18, 2011, directors William L. McGrath and Christopher M. Temple, both former Class B directors, resigned from Charter’s board of directors. Edgar Lee and Stan Parker were appointed to fill the vacant positions.
On February 14, 2011, we announced that Ted Schremp, Executive Vice President, Operations and Marketing had resigned.
2
Corporate Entity Structure
The chart below sets forth our entity structure and that of our direct and indirect subsidiaries. This chart does not include all of our affiliates and subsidiaries and, in some cases, we have combined separate entities for presentation purposes. The equity ownership percentages shown below are approximations and do not give effect to any exercise of then outstanding warrants. Indebtedness amounts shown below are principal amounts as of December 31, 2010, after giving effect to the issuance of the CCO Holdings notes in January 2011 and the application of proceeds to repay borrowings under the Charter Operating credit facilities. See Note 7 to the accompanying consolidated financial statements contained in “Item 8. Financial Statements and Supplementary Data,” which also includes the accreted values of the indebtedness described below.
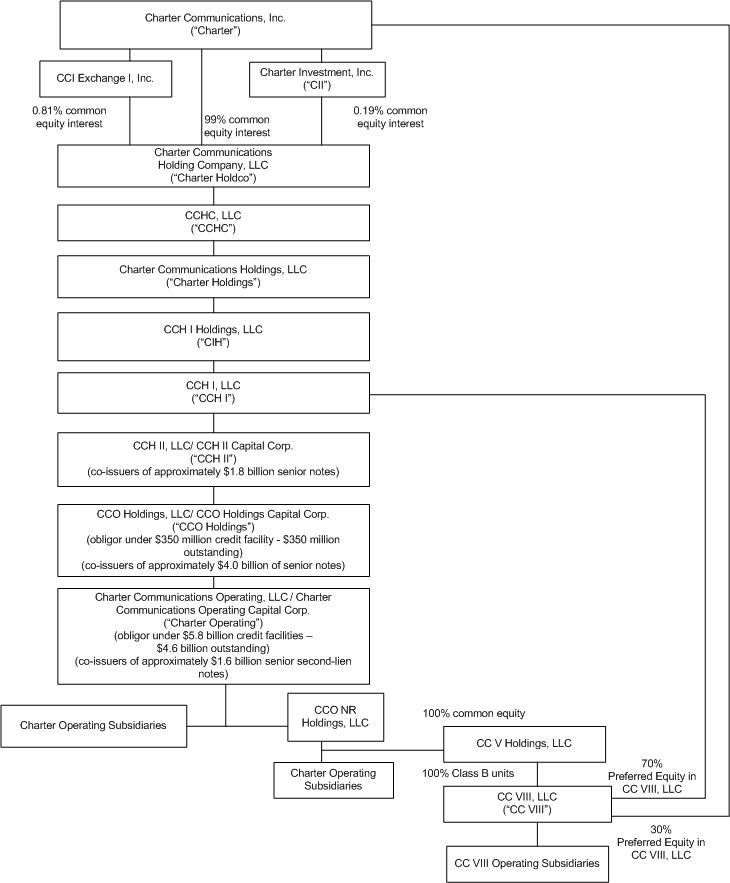
3
Charter Communications, Inc.
Charter owns 100% of Charter Communications Holding Company, LLC (“Charter Holdco”). Charter Holdco, through its subsidiaries, owns cable systems. As sole manager under applicable operating agreements, Charter controls the affairs of Charter Holdco and its limited liability company subsidiaries. In addition, Charter provides management services to Charter Holdco and its subsidiaries under a management services agreement.
Interim Holding Company Debt Issuers.
As indicated in the organizational chart above, our interim holding company debt issuers indirectly own the subsidiaries that own or operate all of our cable systems, subject to a CC VIII, LLC (“CC VIII”) minority interest held by CCH I, LLC (“CCH I”) and Charter as described below. For a description of the debt issued by these issuers please see “Item 7. Management’s Discussion and Analysis of Financial Condition and Results of Operations — Description of Our Outstanding Debt.”
Preferred Equity in CC VIII.
At December 31, 2010, Charter owned 30% of the CC VIII preferred membership interests. CCH I, an indirect subsidiary of Charter, directly owned the remaining 70% of these preferred interests. The common membership interests in CC VIII are indirectly owned by Charter Operating.
Products and Services
Through our hybrid fiber and coaxial cable network, we offer our customers traditional cable video services (basic and digital, which we refer to as “video” services), high-speed Internet services, and telephone services, as well as advanced video services (such as OnDemand, high definition television, and DVR service). Our telephone services are primarily provided using voice over Internet protocol (“VoIP”) technology, to transmit digital voice signals over our systems. Our video, high-speed Internet, and telephone services are offered to residential and commercial customers on a subscription basis, with prices and related charges that vary primarily based on the types of service selected, whether the services are sold as a “bundle” or on an individual basis, and the equipment necessary to receive the services, with some variation in prices.
The following table approximates our customer statistics for video, residential high-speed Internet and telephone as of December 31, 2010 and 2009.
|
Approximate as of
|
||||||||
|
December 31,
|
December 31,
|
|||||||
|
2010 (a)
|
2009 (a)
|
|||||||
|
Residential (non-bulk) basic video customers (b)
|
4,278,400 | 4,562,900 | ||||||
|
Multi-dwelling (bulk) and commercial unit customers (c)
|
242,000 | 261,100 | ||||||
|
Total basic video customers (b) (c)
|
4,520,400 | 4,824,000 | ||||||
|
Digital video customers (d)
|
3,363,200 | 3,218,100 | ||||||
|
Residential high-speed Internet customers (e)
|
3,246,100 | 3,062,300 | ||||||
|
Residential telephone customers (f)
|
1,717,000 | 1,556,000 | ||||||
|
Total Revenue Generating Units
(g)
|
12,846,700 | 12,660,400 | ||||||
After giving effect to sales and acquisitions of cable systems in 2009 and 2010, basic video customers, digital video customers, high-speed Internet customers, and telephone customers would have been 4,747,300, 3,180,700, 3,039,400, and 1,554,300, respectively, as of December 31, 2009.
|
|
(a)
|
We calculate the aging of customer accounts based on the monthly billing cycle for each account. On that basis, at December 31, 2010 and 2009, "customers" include approximately 15,700 and 25,900 persons, respectively, whose accounts were over 60 days past due in payment, approximately 1,800 and 3,500 persons, respectively, whose accounts were over 90 days past due in payment, and approximately 1,000 and 2,200 persons, respectively, whose accounts were over 120 days past due in payment.
|
|
|
(b)
|
“Basic video customers” include all residential customers who receive video cable services.
|
|
|
(c)
|
Included within "basic video customers" are those in commercial and multi-dwelling structures, which are calculated on an equivalent bulk unit (“EBU”) basis. We calculate EBUs by dividing the bulk price charged to accounts in an area by the published rate charged to non-bulk residential customers in that market for the comparable tier of service rather than the most prevalent price charged. This EBU method
|
4
|
|
|
of estimating basic video customers is consistent with the methodology used in determining costs paid to programmers and is consistent with the methodology used by other multiple system operators (“MSOs”). As we increase our published video rates to residential customers without a corresponding increase in the prices charged to commercial service or multi-dwelling customers, our EBU count will decline even if there is no real loss in commercial service or multi-dwelling customers.
|
|
|
(d)
|
"Digital video customers" include all basic video customers that have one or more digital set-top boxes or cable cards deployed.
|
|
|
(e)
|
"Residential high-speed Internet customers" represent those residential customers who subscribe to our high-speed Internet service.
|
|
|
(f)
|
“Residential telephone customers” represent those residential customers who subscribe to our telephone service.
|
|
|
(g)
|
"Revenue generating units" represent the sum total of all basic video, digital video, high-speed Internet and telephone customers, not counting additional outlets within one household. For example, a customer who receives two types of service (such as basic video and digital video) would be treated as two revenue generating units and, if that customer added on high-speed Internet service, the customer would be treated as three revenue generating units. This statistic is computed in accordance with the guidelines of the National Cable & Telecommunications Association (“NCTA”).
|
Video Services
In 2010, residential video services represented approximately 52% of our total revenues. Our video service offerings include the following:
|
•
|
Basic and Digital Video.
All of our video customers receive a package of basic programming which generally consists of local broadcast television, local community programming, including governmental and public access, and limited satellite-delivered or non-broadcast channels, such as weather, shopping and religious programming. Our digital video services include a digital set-top box, an interactive electronic programming guide with parental controls, an expanded menu of pay-per-view channels, including OnDemand (available nearly everywhere), digital quality music channels and the option to also receive a cable card. In addition to video programming, digital video service enables customers to receive our advanced video services such as DVRs and high definition television. Charter also offers premium sports content over the Internet on charter.net.
|
||
|
•
|
Premium Channels.
These channels provide original programming, commercial-free movies, sports, and other special event entertainment programming. Although we offer subscriptions to premium channels on an individual basis, we offer an increasing number of digital video channel packages and premium channel packages, and we offer premium channels combined with our advanced video services. Customers who purchase premium channels also have access to that programming OnDemand and increasingly over the Internet.
|
||
|
•
|
OnDemand, Subscription OnDemand and Pay-Per-View
.
OnDemand service allows customers to select from hundreds of movies and other programming at any time. These programming options may be accessed for a fee or, in some cases, for no additional charge. In some areas we also offer subscription OnDemand for a monthly fee or included in a digital tier premium channel subscription. Pay-per-view channels allow customers to pay on a per event basis to view a single showing of a recently released movie, a one-time special sporting event, music concert, or similar event on a commercial-free basis.
|
||
|
•
|
High Definition Television
.
High definition television offers our digital customers certain video programming at a higher resolution to improve picture and audio quality versus standard basic or digital video images. We have invested and continue to invest in switched digital video (“SDV”) technology and simulcast to increase the number of high definition channels offered.
|
||
|
•
|
Digital Video Recorder.
DVR service enables customers to digitally record programming and to pause and rewind live programming.
|
5
We recently announced a multi-year agreement with TiVo, Inc. (“TiVo”) that will leverage the TiVo user interface to bring an enhanced entertainment experience to customers using a hybrid platform that leverages traditional cable and next generation IP technologies.
High-Speed Internet Services
In 2010, residential high-speed Internet services represented approximately 23% of our total revenues. We currently offer several tiers of high-speed Internet services with speeds up to 60 megabytes per second download speed to our residential customers via cable modems attached to personal computers. We also offer home networking gateways to these customers, which permit customers to connect up to five computers in their home to the Internet simultaneously. We are rolling out DOCSIS 3.0 wideband technology allowing us to offer faster high-speed Internet service.
Telephone Services
In 2010, residential telephone services represented approximately 12% of our total revenues. We provide voice communications services primarily using VoIP technology to transmit digital voice signals over our systems. Charter Telephone includes unlimited nationwide and in-state calling, voicemail, call waiting, caller ID, call forwarding and other features. Charter Telephone® also provides international calling either by the minute or in a package of 250 minutes per month.
Commercial Services
In 2010, commercial services represented approximately 7% of our total revenues. Commercial services, offered through Charter Business™, include scalable broadband communications solutions for business organizations, such as business-to-business Internet access, data networking, fiber connectivity to cellular towers, video and music entertainment services, and business telephone.
We are investing in commercial business for connection growth and scaling operating platforms and systems for larger and broader customer needs.
Sale of Advertising
In 2010, sales of advertising represented approximately 4% of our total revenues. We receive revenues from the sale of local advertising on satellite-delivered networks such as MTV®, CNN® and ESPN®. In any particular market, we generally insert local advertising on up to 40 channels. We also provide cross-channel advertising to some programmers.
In 2010, Charter began deployment of Enhanced TV Binary Interchange Format (“EBIF”) technology to set top boxes in select service areas within the Charter footprint. EBIF is a technology foundation that will allow Charter to deliver enhanced and interactive television applications and enable our video customers to use their remote control to interact with their television programming and its advertisements. EBIF will enable Charter’s customers to request such items as coupons, samples, and brochures from advertisers and also will enable advertisers to reach audiences in new ways.
From time to time, certain of our vendors, including programmers and equipment vendors, have purchased advertising from us. For the years ending December 31, 2010, 2009 and 2008, we had advertising revenues from vendors of approximately $46 million, $41 million, and $39 million, respectively. These revenues resulted from purchases at market rates pursuant to binding agreements.
Pricing of Our Products and Services
Our revenues are derived principally from the monthly fees customers pay for the services we provide. We typically charge a one-time installation fee which is sometimes waived or discounted during certain promotional periods. The prices we charge for our products and services vary based on the level of service the customer chooses and the geographic market. In accordance with FCC rules, the prices we charge for video cable-related equipment, such as set-top boxes and remote control devices, and for installation services, are based on actual costs plus a permitted rate of return in regulated markets.
We offer reduced-price service for promotional periods in order to attract new customers, to promote the bundling of two or more services and to retain existing customers. We often also offer a two-year price guarantee to our customers. There is no assurance that these customers will remain as customers when the promotional pricing period
6
e
xpires. When customers bundle services, generally the prices are lower per service than if they had only purchased a single service. Approximately 61% of our customers subscribe to a bundle of services.
Our Network Technology
Our network utilizes the hybrid fiber coaxial cable (“HFC”) architecture, which combines the use of fiber optic cable with coaxial cable. In most systems, we deliver our signals via fiber optic cable from the headend to a group of nodes, and use coaxial cable to deliver the signal from individual nodes to the homes passed served by that node. On average, our system design enables up to 400 homes passed to be served by a single node and provides for six strands of fiber to each node, with two strands activated and four strands reserved for spares and future services. We believe that this hybrid network design provides high capacity and signal quality. The design also provides two-way signal capacity for the addition of further interactive services.
HFC architecture benefits include:
|
•
|
bandwidth capacity to enable traditional and two-way video and broadband services;
|
||
|
•
|
dedicated bandwidth for two-way services, which avoids return signal interference problems that can occur with two-way communication capability; and
|
||
|
•
|
signal quality and high service reliability.
|
The following table sets forth the technological capacity of our systems as of December 31, 2010 based on a percentage of homes passed:
|
Less than
|
Two-way
|
|||||||
|
550 MHz
|
550 MHz
|
750 MHz
|
860/870 MHz
|
activated
|
||||
|
2%
|
5%
|
46%
|
47%
|
97%
|
Approximately 98% of our homes passed are served by systems that have bandwidth of 550 megahertz or greater. This bandwidth capacity enables us to offer digital television, high-speed Internet services, telephone service and other advanced video services.
Through system upgrades and divestitures of non-strategic systems, we have reduced the number of headends that serve our customers from 1,138 at January 1, 2001 to 204 at December 31, 2010. Headends are the control centers of a cable system. Reducing the number of headends reduces related equipment, service personnel, and maintenance expenditures. As of December 31, 2010, approximately 93% of our customers were served by headends serving at least 10,000 customers.
As of December 31, 2010, our cable systems consisted of approximately 195,000 aerial and underground miles of coaxial cable, and approximately 55,000 aerial and underground miles of fiber optic cable, passing approximately 11.8 million households and serving approximately 5.1 million customers.
Charter has built and activated a national transport backbone inter-connecting 95% of Charter’s local and regional networks. The backbone is highly scalable enabling efficient and timely transport of Internet traffic, voice traffic, and high definition video content distribution.
In 2010, we deployed DOCSIS 3.0 wideband technology to 57% of our homes passed allowing us to offer faster high-speed Internet service. In 2011, we expect our roll-out of DOCSIS 3.0 to be substantially complete. We have also deployed SDV technology to accommodate the increasing demands for greater capacity in our network. SDV technology expands network capacity by transmitting only those digital and HD video channels that are being watched within a given grouping of homes at any given time which allows us to expand bandwidth for additional services. As of December 31, 2010, 63% of our homes passed received some portion of their video service via SDV technology, and we expect to substantially complete our roll-out of SDV technology in 2011.
Management, Customer Care and Marketing
Our corporate office, which includes employees of Charter, is responsible for coordinating and overseeing operations including establishing company-wide policies and procedures. The corporate office performs certain financial and administrative functions on a centralized basis and performs these services on a cost reimbursement
7
basis pursuant to a management services agreement with one of our subsidiaries. Our field operations are managed by geographic areas with shared service centers for our field sales and marketing function, human resources and training function, finance, and certain areas of customer operations.
Our customer care centers are managed centrally. We have eight internal customer care locations including our “centers of excellence” which route calls to the appropriate agents, plus several third-party call center locations that through technology and procedures function as an integrated system. We provide service to our customers 24 hours a day, seven days a week. We also utilize our website to enable our customers to view and pay their bills online, obtain information regarding their account or services, and perform various equipment troubleshooting procedures. Our customers may also obtain support through our on-line chat and e-mail functionality.
Our marketing strategy emphasizes our bundled services through targeted marketing programs to existing and potential customers and increases awareness and value of the Charter brand. Marketing expenditures increased by $14 million, or 5%, over the year ended December 31, 2009 to $286 million for the year ended December 31, 2010. Our marketing organization creates and executes marketing programs intended to increase customers, retain existing customers and cross-sell additional products to current customers. We monitor the effectiveness of our marketing efforts, customer perception, competition, pricing, and service preferences, among other factors, to increase our responsiveness to our customers.
Programming
General
We believe that offering a wide variety of programming influences a customer’s decision to subscribe to and retain our cable services. We rely on market research, customer demographics and local programming preferences to determine channel offerings in each of our markets. We obtain basic and premium programming from a number of suppliers, usually pursuant to written contracts. Our programming contracts generally continue for a fixed period of time, usually from three to ten years, and are subject to negotiated renewal. Some programming suppliers offer financial incentives to support the launch of a channel and/or ongoing marketing support. We also negotiate volume discount pricing structures. Programming costs are usually payable each month based on calculations performed by us and are generally subject to annual cost escalations and audits by the programmers.
Costs
Programming is usually made available to us for a license fee, which is generally paid based on the number of customers to whom we make such programming available. Such license fees may include “volume” discounts available for higher numbers of customers, as well as discounts for channel placement or service penetration. Some channels are available without cost to us for a limited period of time, after which we pay for the programming. For home shopping channels, we receive a percentage of the revenue attributable to our customers’ purchases, as well as, in some instances, incentives for channel placement.
Our programming costs have increased in every year we have operated in excess of customary inflationary and cost-of-living type increases. We expect them to continue to increase, and at a higher rate than in 2010, due to a variety of factors including amounts paid for retransmission consent, annual increases imposed by programmers and additional programming, including high-definition and OnDemand programming. In particular, sports programming costs have increased significantly over the past several years. In addition, contracts to purchase sports programming sometimes provide for optional additional programming to be available on a surcharge basis during the term of the contract.
Federal law allows commercial television broadcast stations to make an election between “must-carry” rights and an alternative “retransmission-consent” regime. When a station opts for the retransmission-consent regime, we are not allowed to carry the station’s signal without the station’s permission. Continuing demands by owners of broadcast stations for carriage of other services or cash payments to those broadcasters in exchange for retransmission consent will likely increase our programming costs or require us to cease carriage of popular programming, potentially leading to a loss of customers in affected markets.
Over the past several years, increases in our video service rates have not fully offset increasing programming costs, and with the impact of increasing competition and other marketplace factors, we do not expect them to do so in the foreseeable future. In addition, our inability to fully pass these programming cost increases on to our video
8
customers has had and is expected in the future to have an adverse impact on our cash flow and operating margins associated with the video product.
In order to mitigate reductions of our operating margins due to rapidly increasing programming costs, we continue to review our pricing and programming packaging strategies, and we plan to continue to migrate certain program services from our basic level of service to our digital tiers. As we migrate our programming to our digital tier packages, certain programming that was previously available to all of our customers via an analog signal may only be part of an elective digital tier package offered to our customers for an additional fee. As a result, we expect that the customer base upon which we pay programming fees will proportionately decrease, and the overall expense for providing that service will also decrease. However, reductions in the size of certain programming customer bases may result in the loss of specific volume discount benefits.
We have programming contracts that have expired and others that will expire at or before the end of 2011. We will seek to renegotiate the terms of these agreements. There can be no assurance that these agreements will be renewed on favorable or comparable terms. To the extent that we are unable to reach agreement with certain programmers on terms that we believe are reasonable, we have been, and may in the future be, forced to remove such programming channels from our line-up, which may result in a loss of customers.
Franchises
As of December 31, 2010, our systems operated pursuant to a total of approximately 3,000 franchises, permits, and similar authorizations issued by local and state governmental authorities. Such governmental authorities often must approve a transfer to another party. Most franchises are subject to termination proceedings in the event of a material breach. In addition, most franchises require us to pay the granting authority a franchise fee of up to 5.0% of revenues as defined in the various agreements, which is the maximum amount that may be charged under the applicable federal law. We are entitled to and generally do pass this fee through to the customer.
Prior to the scheduled expiration of most franchises, we generally initiate renewal proceedings with the granting authorities. This process usually takes three years but can take a longer period of time. The Communications Act of 1934, as amended (the “Communications Act”), which is the primary federal statute regulating interstate communications, provides for an orderly franchise renewal process in which granting authorities may not unreasonably withhold renewals. In connection with the franchise renewal process, many governmental authorities require the cable operator to make certain commitments, such as building out certain of the franchise areas, customer service requirements, and supporting and carrying public access channels. Historically we have been able to renew our franchises without incurring significant costs, although any particular franchise may not be renewed on commercially favorable terms or otherwise. Our failure to obtain renewals of our franchises, especially those in the major metropolitan areas where we have the most customers, could have a material adverse effect on our consolidated financial condition, results of operations, or our liquidity, including our ability to comply with our debt covenants. See “— Regulation and Legislation — Video Services — Franchise Matters.”
Competition
We face competition for both residential and commercial customers in the areas of price, service offerings, and service reliability. We compete with other providers of video, high-speed Internet access, telephone services, and other sources of home entertainment. We operate in a very competitive business environment, which can adversely affect the results of our business and operations. We cannot predict the impact on us of broadband services offered by our competitors.
In terms of competition for customers, we view ourselves as a member of the broadband communications industry, which encompasses multi-channel video for television and related broadband services, such as high-speed Internet, telephone, and other interactive video services. In the broadband communications industry, our principal competitor for video services throughout our territory is direct broadcast satellite (“DBS”) and our principal competitor for high-speed Internet services is DSL service provided by telephone companies. Our principal competitors for telephone services are established telephone companies, other telephone service providers, and other carriers, including VoIP providers. Based on telephone companies’ entry into video service and the upgrades of their networks, they have become significant competitors for both high-speed Internet and video customers. At this time, we do not consider other cable operators to be significant competitors in our overall market, as overbuilds are infrequent and geographically spotty (although in any particular market, a cable operator overbuilder would likely be a significant competitor at the local level).
9
Our key competitors include:
DBS
Direct broadcast satellite is a significant competitor to cable systems. The two largest DBS providers now serve more than 33 million subscribers nationwide. DBS service allows the subscriber to receive video services directly via satellite using a dish antenna.
Video compression technology and high powered satellites allow DBS providers to offer more than 280 digital channels from a single satellite, thereby surpassing the traditional analog cable system. In 2010, major DBS competitors offered a greater variety of channel packages, and were especially competitive with promotional pricing for more basic services. While we continue to believe that the initial investment by a DBS customer exceeds that of a cable customer, the initial equipment cost for DBS has decreased substantially, as the DBS providers have aggressively marketed offers to new customers of incentives for discounted or free equipment, installation, and multiple units. DBS providers are able to offer service nationwide and are able to establish a national image and branding with standardized offerings, which together with their ability to avoid franchise fees of up to 5% of revenues and property tax, leads to greater efficiencies and lower costs in the lower tiers of service. Also, DBS providers are currently offering more high definition programming, including local high definition programming. However, we believe that cable-delivered OnDemand and Subscription OnDemand services, which include HD programming, are superior to DBS service, because cable headends can provide two-way communication to deliver many titles which customers can access and control independently, whereas DBS technology can only make available a much smaller number of titles with DVR-like customer control. DBS providers have also made attempts at deployment of high-speed Internet access services via satellite, but those services have been technically constrained and of limited appeal.
Telephone Companies and Utilities
Our telephone service competes directly with established telephone companies and other carriers, including Internet-based VoIP providers, for voice service customers. Because we offer voice services, we are subject to considerable competition from telephone companies and other telecommunications providers, including wireless providers with an increasing number of consumers choosing wireless over wired telephone services. The telecommunications and competitive voice services industry is highly competitive and includes competitors with greater financial and personnel resources, strong brand name recognition, and long-standing relationships with regulatory authorities and customers. Moreover, mergers, joint ventures and alliances among our competitors have resulted in providers capable of offering cable television, Internet, and telephone services in direct competition with us.
Most telephone companies, which already have plant, an existing customer base, and other operational functions in place (such as billing and service personnel), offer DSL service. DSL service allows Internet access to subscribers at data transmission speeds greater than those available over conventional telephone lines. We believe DSL service is competitive with high-speed Internet service and is often offered at prices lower than our Internet services, although typically at speeds lower than the speeds we offer. However, DSL providers may currently be in a better position to offer data services to businesses since their networks tend to be more complete in commercial areas. We expect DSL to remain a significant competitor to our high-speed Internet services. In addition, the continuing deployment of fiber optics into telephone companies’ networks (primarily by Verizon Communications, Inc. (“Verizon”)) will enable them to provide even higher bandwidth Internet services.
Telephone companies, including AT&T Inc. (“AT&T”) and Verizon, offer video and other services in competition with us, and we expect they will increasingly do so in the future. Upgraded portions of these networks carry two-way video, data services and provide digital voice services similar to ours. In the case of Verizon, high-speed data services (fiber optic service (“FiOS”)) offer speeds as high as or higher than ours. In addition, these companies continue to offer their traditional telephone services, as well as service bundles that include wireless voice services provided by affiliated companies. Based on internal estimates, we believe that AT&T and Verizon are offering video services in areas serving approximately 24% to 29% and 3%, respectively, of our estimated homes passed as of December 31, 2010 and we have experienced customer losses in these areas. AT&T and Verizon have also launched campaigns to capture more of the multiple dwelling unit (“MDU”) market. Additional upgrades and product launches are expected in markets in which we operate.
In addition to telephone companies obtaining franchises or alternative authorizations in some areas, and seeking them in others, they have been successful through various means in reducing or streamlining the franchising requirements applicable to them. They have had significant success at the federal and state level in securing FCC
10
rulings and numerous statewide franchise laws that facilitate telephone company entry into the video marketplace. Because telephone companies have been successful in avoiding or reducing franchise and other regulatory requirements that remain applicable to cable operators like us, their competitive posture has often been enhanced. The large scale entry of major telephone companies as direct competitors in the video marketplace has adversely affected the profitability and valuation of our cable systems.
Additionally, we are subject to limited competition from utilities that possess fiber optic transmission lines capable of transmitting signals with minimal signal distortion. Certain utilities are also developing broadband over power line technology, which may allow the provision of Internet and other broadband services to homes and offices.
Broadcast Television
Cable television has long competed with broadcast television, which consists of television signals that the viewer is able to receive without charge using an “off-air” antenna. The extent of such competition is dependent upon the quality and quantity of broadcast signals available through “off-air” reception, compared to the services provided by the local cable system. Traditionally, cable television has provided higher picture quality and more channel offerings than broadcast television. However, the recent licensing of digital spectrum by the FCC now provides traditional broadcasters with the ability to deliver high definition television pictures and multiple digital-quality program streams, as well as advanced digital services such as subscription video and data transmission.
Traditional Overbuilds
Cable systems are operated under non-exclusive franchises historically granted by state and local authorities. More than one cable system may legally be built in the same area. It is possible that a franchising authority might grant a second franchise to another cable operator and that such franchise might contain terms and conditions more favorable than those afforded us. Well-financed businesses from outside the cable industry, such as public utilities that already possess fiber optic and other transmission lines in the areas they serve, may over time become competitors. There are a number of cities that have constructed their own cable systems, in a manner similar to city-provided utility services. There also has been interest in traditional cable overbuilds by private companies not affiliated with established local exchange carriers. Constructing a competing cable system is a capital intensive process which involves a high degree of risk. We believe that in order to be successful, a competitor’s overbuild would need to be able to serve the homes and businesses in the overbuilt area with equal or better service quality, on a more cost-effective basis than we can. Any such overbuild operation would require access to capital or access to facilities already in place that are capable of delivering cable television programming.
As of December 31, 2010, excluding telephone companies, we are aware of traditional overbuild situations impacting approximately 7% to 9% of our total homes passed and potential traditional overbuild situations in areas servicing approximately an additional 1% of our total homes passed. Additional overbuild situations may occur.
Private Cable
Additional competition is posed by satellite master antenna television systems, or SMATV systems, serving MDUs, such as condominiums, apartment complexes, and private residential communities. Private cable systems can offer improved reception of local television stations, and many of the same satellite-delivered program services that are offered by cable systems. Although disadvantaged from a programming cost perspective, SMATV systems currently benefit from operating advantages not available to franchised cable systems, including fewer regulatory burdens and no requirement to service low density or economically depressed communities. The FCC previously adopted regulations that favor SMATV and private cable operators serving MDU complexes, allowing them to continue to secure exclusive contracts with MDU owners. This regulatory disparity provides a competitive advantage to certain of our current and potential competitors.
Other Competitors
Local wireless Internet services operate in some markets using available unlicensed radio spectrum. Various wireless phone companies are now offering third and fourth generation (3G and 4G) wireless high-speed Internet services. In addition, a growing number of commercial areas, such as retail malls, restaurants and airports, offer Wi-Fi Internet service. Numerous local governments are also considering or actively pursuing publicly subsidized Wi-Fi and WiMAX Internet access networks. Operators are also marketing PC cards and “personal hotspots” offering wireless broadband access to their cellular networks. These service options offer another alternative to cable-based Internet access.
11
Internet Delivered Video
High-speed Internet access facilitates the streaming of video into homes and businesses. As the quality and availability of video streaming over the Internet improves, we expect video streaming to compete with the traditional delivery of video programming services over cable systems. It is possible that programming suppliers will consider bypassing cable operators and market their services directly to the consumer through video streaming over the Internet. If customers were to choose to receive video over the Internet rather than through our basic or digital video services, we could experience a reduction in our video revenues.
Regulation and Legislation
The following summary addresses the key regulatory and legislative developments affecting the cable industry and our three primary services for both residential and commercial customers: video service, high-speed Internet service, and telephone service. Cable system operations are extensively regulated by the federal government (primarily the FCC), certain state governments, and many local governments. A failure to comply with these regulations could subject us to substantial penalties. Our business can be dramatically impacted by changes to the existing regulatory framework, whether triggered by legislative, administrative, or judicial rulings. Congress and the FCC have frequently revisited the subject of communications regulation often designed to increase competition to the cable industry, and they are likely to do so in the future. We could be materially disadvantaged in the future if we are subject to new regulations that do not equally impact our key competitors. We cannot provide assurance that the already extensive regulation of our business will not be expanded in the future.
Video
Service
Cable Rate Regulation.
The cable industry has operated under a federal rate regulation regime for more than a decade. The regulations currently restrict the prices that cable systems charge for the minimum level of video programming service, referred to as “basic service,” and associated equipment. All other cable offerings are now universally exempt from rate regulation. Although basic service rate regulation operates pursuant to a federal formula, local governments, commonly referred to as local franchising authorities, are primarily responsible for administering this regulation. The majority of our local franchising authorities have never been certified to regulate basic service cable rates (and order rate reductions and refunds), but they generally retain the right to do so (subject to potential regulatory limitations under state franchising laws), except in those specific communities facing “effective competition,” as defined under federal law. We have already secured FCC recognition of effective competition, and become rate deregulated, in many of our communities.
There have been frequent calls to impose expanded rate regulation on the cable industry. Confronted with rapidly increasing cable programming costs, it is possible that Congress may adopt new constraints on the retail pricing or packaging of cable programming. For example, there has been legislative and regulatory interest in requiring cable operators to offer historically combined programming services on an à la carte basis. Any such mandate could adversely affect our operations.
Federal rate regulations generally require cable operators to allow subscribers to purchase premium or pay-per-view services without the necessity of subscribing to any tier of service, other than the basic service tier. The applicability of this rule in certain situations remains unclear, and adverse decisions by the FCC could affect our pricing and packaging of services. As we attempt to respond to a changing marketplace with competitive pricing practices, such as targeted promotions and discounts, we may face Communications Act uniform pricing requirements that impede our ability to compete.
Must Carry/Retransmission Consent.
There are two alternative legal methods for carriage of local broadcast television stations on cable systems. Federal “must carry” regulations require cable systems to carry local broadcast television stations upon the request of the local broadcaster. Alternatively, federal law includes “retransmission consent” regulations, by which popular commercial television stations can prohibit cable carriage unless the cable operator first negotiates for “retransmission consent,” which may be conditioned on significant payments or other concessions. Broadcast stations must elect “must carry” or “retransmission consent” every three years, with the election date of October 1, 2008, for the current period of 2009 through 2011. Either option has a potentially adverse effect on our business by utilizing bandwidth capacity. In addition, popular stations invoking “retransmission consent” increasingly have been demanding cash compensation in their negotiations with cable operators.
12
In September 2007, the FCC adopted an order increasing the cable industry’s existing must-carry obligations by requiring most cable operators to offer “must carry” broadcast signals in both analog and digital format (dual carriage) for a three year period after the broadcast television industry completed its ongoing transition from an analog to digital format, which occurred on June 12, 2009. The burden could increase further if cable systems were ever required to carry multiple program streams included within a single digital broadcast transmission (multicast carriage), which the recent FCC order did not mandate. Additional government-mandated broadcast carriage obligations could disrupt existing programming commitments, interfere with our preferred use of limited channel capacity, and limit our ability to offer services that appeal to our customers and generate revenues. We may need to take additional operational steps and/or make further operating and capital investments to ensure that customers, not otherwise equipped to receive digital programming, retain access to broadcast programming.
Access Channels.
Local franchise agreements often require cable operators to set aside certain channels for public, educational, and governmental access programming. Federal law also requires cable systems to designate a portion of their channel capacity for commercial leased access by unaffiliated third parties, who generally offer programming that our customers do not particularly desire. The FCC adopted new rules in 2007 mandating a significant reduction in the rates that operators can charge commercial leased access users and imposing additional administrative requirements that would be burdensome on the cable industry. The effect of the FCC’s new rules was stayed by a federal court, pending a cable industry appeal and a finding that the new rules did not comply with the requirements of the Office of Management and Budget. Under federal statute, commercial leased access programmers are entitled to use up to 15% of a cable system’s capacity. Increased activity in this area could further burden the channel capacity of our cable systems, and potentially limit the amount of services we are able to offer and may necessitate further investments to expand our network capacity.
Access to Programming.
The Communications Act and the FCC’s “program access” rules generally prevent satellite cable programming vendors in which a cable operator has an attributable interest and satellite broadcast programming vendors from favoring cable operators over competing multichannel video distributors, such as DBS, and limit the ability of such vendors to offer exclusive programming arrangements to cable operators. Given the heightened competition and media consolidation that we face, it is possible that we will find it increasingly difficult to gain access to popular programming at favorable terms. Such difficulty could adversely impact our business.
Ownership Restrictions.
Federal regulation of the communications field traditionally included a host of ownership restrictions, which limited the size of certain media entities and restricted their ability to enter into competing enterprises. Through a series of legislative, regulatory, and judicial actions, most of these restrictions have been either eliminated or substantially relaxed. Changes in this regulatory area could alter the business environment in which we operate.
Pole Attachments.
The Communications Act requires most utilities owning utility poles to provide cable systems with access to poles and conduits and simultaneously subjects the rates charged for this access to either federal or state regulation. The Communications Act specifies that significantly higher rates apply if the cable plant is providing “telecommunications” services rather than only video services. Although the FCC previously determined that the lower rate was applicable to the mixed use of a pole attachment for the provision of both video and Internet access services (a determination upheld by the U.S. Supreme Court), the FCC issued a
Notice of Proposed Rulemaking
(“NPRM”) on November 20, 2007, in which it “tentatively concludes” that such mixed use determination would likely be set aside. In addition, a group of electric utilities filed a petition in 2009 asking the FCC to declare that higher pole rents apply to cable operators that provide VoIP services. In its March 2010 National Broadband Plan, however, the FCC sought to promote the adoption of uniform pole attachment rates by cable operators and telecommunications providers by recommending a reduction of the pole attachment rate paid by telecommunications providers to, or close to, the pole attachment rate paid by cable operators. In May 2010, the FCC issued a Further Notice of Proposed Rulemaking seeking comment on how it could reduce variations in pole attachment rates and facilitate access to utility poles. While we cannot predict the outcome of these proceedings, they could significantly increase our annual pole attachment costs or substantially decrease the pole attachment costs paid by the telecommunication providers with which we compete.
Cable Equipment.
In 1996, Congress enacted a statute requiring the FCC to adopt regulations designed to assure the development of an independent retail market for “navigation devices,” such as cable set-top boxes. As a result, the FCC required cable operators to make a separate offering of security modules (
i.e
., a “CableCARD”) that can be used with retail navigation devices, and to use these separate security modules even in their own set-top boxes deployed after July 1, 2007. This requirement, known as the “integration ban,” has increased the cost of set-top boxes The FCC has, however, recently granted waivers that allow cable operators to use low-cost, one-way set-top boxes (without recording capability) that do not include CableCARDs. The FCC’s National Broadband Plan acknowledges that the
13
existing CableCARD rules have not resulted in a competitive retail market for navigation devices. In response to this finding, the FCC commenced a proceeding in April 2010 to adopt standards for a successor technology to CableCARD that would involve the development of smart video devices that are compatible with any multichannel video programming distributor
service in the United States. In October 2010, the FCC adopted new interim CableCARD rules applicable until a successor solution emerges. The new rules require cable operators to allow customers to self-install CableCARDs. They also require cable operators to provide and advertise a reasonable discount if subscribers use their own equipment, rather than using the operator-provided equipment otherwise included in a bundled package. The FCC’s actions in this area could impose additional costs on us and affect our ability to innovate.
MDUs / Inside Wiring
. The FCC has adopted a series of regulations designed to spur competition to established cable operators in MDU complexes. These regulations allow our competitors to access certain existing cable wiring inside MDUs. The FCC also adopted regulations limiting the ability of established cable operators, like us, to enter into exclusive service contracts for MDU complexes. Significantly, it has not yet imposed a similar restriction on private cable operators and SMATV systems serving MDU properties. In their current form, the FCC’s regulations in this area favor our competitors.
Privacy
Regulation
. The Communications Act limits our ability to collect and disclose subscribers’ personally identifiable information for our video, telephone, and high-speed Internet services, as well as provides requirements to safeguard such information. We are subject to additional federal, state, and local laws and regulations that impose additional subscriber and employee privacy restrictions. Further, the FCC, FTC, and many states regulate and restrict the marketing practices of cable operators, including telemarketing and online marketing efforts. Various federal agencies, including the FTC, are now considering new restrictions affecting the use of personal and profiling data for online advertising.
Other FCC Regulatory Matters.
FCC regulations cover a variety of additional areas, including, among other things: (1) equal employment opportunity obligations; (2) customer service standards; (3) technical service standards; (4) mandatory blackouts of certain network, syndicated and sports programming; (5) restrictions on political advertising; (6) restrictions on advertising in children's programming; (7) restrictions on origination cablecasting; (8) restrictions on carriage of lottery programming; (9) sponsorship identification obligations; (10) closed captioning of video programming; (11) licensing of systems and facilities; (12) maintenance of public files; and (13) emergency alert systems. Each of these regulations restricts our business practices to varying degrees.
It is possible that Congress or the FCC will expand or modify its regulation of cable systems in the future, and we cannot predict at this time how that might impact our business.
Copyright.
Cable systems are subject to a federal copyright compulsory license covering carriage of television and radio broadcast signals. The possible modification or elimination of this compulsory copyright license is the subject of continuing legislative and administrative review and could adversely affect our ability to obtain desired broadcast programming. The Satellite Television Extension and Localism Act of 2010 revised cable’s existing compulsory copyright license to remove certain uncertainties regarding the license’s operation, including the royalty calculation for broadcast signals that are offered to only some portions of a cable system and the treatment of new digital broadcast signals. The new legislation requires cable systems to pay an additional royalty fee for each digital multicast of a retransmitted distant broadcast signal and provides copyright owners with a new right to audit our semi-annual royalty filings.
Copyright clearances for non-broadcast programming services are arranged through private negotiations. Cable operators also must obtain music rights for locally originated programming and advertising from the major music performing rights organizations. These licensing fees have been the source of litigation in the past, and we cannot predict with certainty whether license fee disputes may arise in the future.
Franchise Matters.
Cable systems generally are operated pursuant to nonexclusive franchises granted by a municipality or other state or local government entity in order to utilize and cross public rights-of-way. Although some state franchising laws grant indefinite franchises, cable franchises generally are granted for fixed terms and in many cases include monetary penalties for noncompliance and may be terminable if the franchisee fails to comply with material provisions. The specific terms and conditions of cable franchises vary significantly between jurisdictions. Each franchise generally contains provisions governing cable operations, franchise fees, system construction, maintenance, technical performance, customer service standards, and changes in the ownership of the franchisee. A number of states subject cable systems to the jurisdiction of centralized state government agencies, such as public utility commissions. Although local franchising authorities have considerable discretion in establishing franchise terms, certain federal protections benefit cable operators. For example, federal law caps local
14
franchise fees and includes renewal procedures designed to protect incumbent franchisees from arbitrary denials of renewal. Even if a franchise is renewed, however, the local franchising authority may seek to impose new and more onerous requirements as a condition of renewal. Similarly, if a local franchising authority's consent is required for the purchase or sale of a cable system, the local franchising authority may attempt to impose more burdensome requirements as a condition for providing its consent.
The traditional cable franchising regime is currently undergoing significant change as a result of various federal and state actions. In a series of recent rulemakings, the FCC adopted new rules that streamlined entry for new competitors (particularly those affiliated with telephone companies) and reduced certain franchising burdens for these new entrants. The FCC adopted more modest relief for existing cable operators.
At the same time, a substantial number of states have adopted franchising laws. Again, these laws were principally designed to streamline entry for new competitors, and they often provide advantages for these new entrants that are not immediately available to existing cable operators. In many instances, these franchising regimes do not apply to established cable operators until the existing franchise expires or a competitor directly enters the franchise territory. In a number of instances, however, incumbent cable operators have the ability to immediately “opt into” the new franchising regime, which can provide significant regulatory relief. The exact nature of these state franchising laws, and their varying application to new and existing video providers, will impact our franchising obligations and our competitive position.
Internet Service
Over the past several years, proposals have been advanced at the FCC and Congress to adopt “net neutrality” rules that would require cable operators offering Internet service to provide non-discriminatory access to their networks and could interfere with the ability of cable operators to manage their networks.
In August 2005, the FCC issued a nonbinding policy statement identifying four principles it deemed necessary to ensure continuation of an “open” Internet that is not unduly restricted by network “gatekeepers.” In August 2008, the FCC issued an order concerning one Internet network management practice in use by another cable operator, effectively treating the four principles as rules and ordering a change in network management practices. On April 6, 2010, the United States Court of Appeals for the D.C. Circuit concluded that the FCC lacked jurisdictional authority and vacated the FCC’s 2008 order. On December 21, 2010, the FCC responded by enacting new “net neutrality” rules based on three core principles of: (1) transparency, (2) no blocking, and (3) no unreasonable discrimination. The “transparency” rule requires broadband Internet access providers to disclose applicable terms, performance, and network management practices to consumers and third party users. The “no blocking” rule restricts Internet access providers from blocking lawful content, applications, services, or devices. The “no unreasonable discrimination” rule prohibits Internet access providers from engaging in unreasonable discrimination in transmitting lawful traffic. The new rules will permit broadband service providers to exercise “reasonable network management” for legitimate management purposes, such as management of congestion, harmful traffic, and network security. The rules will also permit usage-based billing, and permit broadband service providers to offer additional specialized services such as facilities-based IP voice services, without being subject to restrictions on discrimination. These rules do not become effective until 60 days following the announcement in the Federal Register of the Office of Management and Budget’s decision regarding the information collection requirements associated with the new rules which has not yet occurred. When they become effective, the FCC will enforce these rules based on case-by-case complaints. Although the new rules encompass both wireline providers (like us) and wireless providers, the rules are less stringent with regard to wireless providers. The FCC premised these new “net neutrality” rules on its Title I and ancillary jurisdiction, and that jurisdictional authority already has been challenged in court. A legislative review is also possible. The FCC’s new rules, if they withstand such challenges, as well as any additional legislation or regulation, would impose new obligations and restraints on high-speed Internet providers. Any such additional rules or statutes could limit our ability to manage our cable systems to obtain value for use of our cable systems and respond to operational and competitive challenges.
As the Internet has matured, it has become the subject of increasing regulatory interest. Congress and federal regulators have adopted a wide range of measures directly or potentially affecting Internet use, including, for example, consumer privacy, copyright protections (which afford copyright owners certain rights against us that could adversely affect our relationship with a customer accused of violating copyright laws), defamation liability, taxation, obscenity, and unsolicited commercial e-mail. Content owners may also seek additional enforcement mechanisms for Internet service providers to address the issue of peer-to-peer copyright infringement through private contractual negotiations and other means. Additionally, the FCC and Congress are considering subjecting high-speed Internet access services to the Universal Service funding requirements. These funding requirements could impose significant new costs on our high-speed Internet service. State and local governmental organizations
15
have also adopted Internet-related regulations. These various governmental jurisdictions are also considering additional regulations in these and other areas, such as pricing, service and product quality, and intellectual property ownership. The adoption of new Internet regulations or the adaptation of existing laws to the Internet could adversely affect our business.
Telephone Service
The Telecommunications Act of 1996 created a more favorable regulatory environment for us to provide telecommunications and/or competitive voice services than had previously existed. In particular, it established requirements ensuring that competitive telephone companies could interconnect their networks with those providers of traditional telecommunications services to open the market to competition. There are substantial regulatory changes still being considered that could impact, in both positive and negative ways, our telephone business and that of our primary telecommunications competitors. The FCC and state regulatory authorities are considering, for example, whether certain common carrier regulations traditionally applied to incumbent local exchange carriers should be modified or reduced, and the extent to which common carrier requirements should be extended to VoIP providers. The FCC has already determined that certain providers of telephone services using Internet Protocol technology must comply with requirements relating to 911 emergency services (“E911”), the Communications Assistance for Law Enforcement Act ("CALEA") regarding law enforcement surveillance of communications, Universal Service fund contribution issues, customer privacy and Customer Proprietary Network Information issues, number portability, disability access, regulatory fees, and discontinuance of service. In March 2007, a federal appeals court affirmed the FCC’s decision concerning federal regulation of certain VoIP services, but declined to specifically find that VoIP service provided by cable companies, such as we provide, should be regulated only at the federal level. As a result, some states have begun proceedings to subject cable VoIP services to state level regulation. Also, the FCC and Congress continue to consider to what extent, VoIP service will have interconnection rights with telephone companies. Although we have registered with, or obtained certificates or authorizations from, the FCC and the state regulatory authorities in those states in which we offer competitive voice services in order to ensure the continuity of our services and to maintain needed network interconnection arrangements, it is unclear whether and how these and other ongoing regulatory matters ultimately will be resolved.
Employees
As of December 31, 2010, we had approximately 16,600 full-time equivalent employees. At December 31, 2010, approximately 67 of our employees were represented by collective bargaining agreements. We have never experienced a work stoppage.
Risks Related to Our Significant Indebtedness
We have a significant amount of debt and may incur significant additional debt, including secured debt, in the future, which could adversely affect our financial health and our ability to react to changes in our business.
We have a significant amount of debt and may (subject to applicable restrictions in our debt instruments) incur additional debt in the future. As of December 31, 2010, our total principal amount of debt was approximately $12.3 billion.
Because of our significant indebtedness, our ability to raise additional capital at reasonable rates, or at all, is uncertain, and the ability of our subsidiaries to make distributions or payments to their parent companies is subject to availability of funds and restrictions under applicable debt instruments and under applicable law.
Our significant amount of debt could have other important consequences. For example, the debt will or could:
|
·
|
make us vulnerable to interest rate increases, because approximately 35% of our borrowings are, and may continue to be, subject to variable rates of interest;
|
|
·
|
expose us to increased interest expense to the extent we refinance existing debt, particularly our bank debt, with higher cost debt;
|
|
·
|
require us to dedicate a significant portion of our cash flow from operating activities to make payments on our debt, reducing our funds available for working capital, capital expenditures, and other general corporate expenses;
|
16
|
·
|
limit our flexibility in planning for, or reacting to, changes in our business, the cable and telecommunications industries, and the economy at large;
|
|
·
|
place us at a disadvantage compared to our competitors that have proportionately less debt;
|
|
·
|
adversely affect our relationship with customers and suppliers;
|
|
·
|
limit our ability to borrow additional funds in the future, or to access financing at the necessary level of the capital structure, due to applicable financial and restrictive covenants in our debt;
|
|
·
|
make it more difficult for us to obtain financing;
|
|
·
|
make it more difficult for us to satisfy our obligations to the holders of our notes and for us to satisfy our obligations to the lenders under our credit facilities; and
|
|
·
|
limit future increases in the value, or cause a decline in the value of our equity, which could limit our ability to raise additional capital by issuing equity.
|
If current debt amounts increase, the related risks that we now face will intensify.
The agreements and instruments governing our debt contain restrictions and limitations that could significantly affect our ability to operate our business, as well as significantly affect our liquidity.
Our credit facilities and the indentures governing our debt contain a number of significant covenants that could adversely affect our ability to operate our business, our liquidity, and our results of operations. These covenants restrict, among other things, our and our subsidiaries’ ability to:
|
·
|
incur additional debt;
|
|
·
|
repurchase or redeem equity interests and debt;
|
|
·
|
issue equity;
|
|
·
|
make certain investments or acquisitions;
|
|
·
|
pay dividends or make other distributions;
|
|
·
|
dispose of assets or merge;
|
|
·
|
enter into related party transactions; and
|
|
·
|
grant liens and pledge assets.
|
Additionally, the Charter Operating credit facilities require Charter Operating to comply with a maximum total leverage covenant and a maximum first lien leverage covenant. The breach of any covenants or obligations in our indentures or credit facilities, not otherwise waived or amended, could result in a default under the applicable debt obligations and could trigger acceleration of those obligations, which in turn could trigger cross defaults under other agreements governing our long-term indebtedness. In addition, the secured lenders under the Charter Operating credit facilities, the holders of the Charter Operating senior second-lien notes, and the secured lenders under the CCO Holdings credit facility could foreclose on their collateral, which includes equity interests in our subsidiaries, and exercise other rights of secured creditors. Any default under those credit facilities or the indentures governing our debt could adversely affect our growth, our financial condition, our results of operations and our ability to make payments on our notes and credit facilities, and could force us to seek the protection of the bankruptcy laws.
We depend on generating (and having available to the applicable obligor) sufficient cash flow to fund our debt obligations, capital expenditures, and ongoing operations.
W
e are dependent on our cash on hand and free cash flow to fund our debt obligations, capital expenditures and ongoing operations.
Our ability to service our debt and to fund our planned capital expenditures and ongoing operations will depend on our ability to continue to generate cash flow and our access (by dividend or otherwise) to additional liquidity sources at the applicable obligor. Our ability to continue to generate cash flow is dependent on many factors, including:
|
·
|
our ability to sustain and grow revenues and free cash flow by offering video, high-speed Internet, telephone and other services to residential and commercial customers, to adequately meet the customer experience demands in our markets and to maintain and grow our customer base, particularly in the face of increasingly aggressive competition, the need for innovation and the related capital expenditures and the difficult economic conditions in the United States;
|
17
|
·
|
the impact of competition from other market participants, including but not limited to incumbent telephone companies, direct broadcast satellite operators, wireless broadband providers and DSL providers and competition from video provided over the Internet;
|
|
·
|
general business conditions, economic uncertainty or downturn, high unemployment levels and the level of activity in the housing sector;
|
|
·
|
our ability to obtain programming at reasonable prices or to raise prices to offset, in whole or in part, the effects of higher programming costs (including retransmission consents); and
|
|
·
|
the effects of governmental regulation on our business.
|
Some of these factors are beyond our control. If we are unable to generate sufficient cash flow or we are unable to access additional liquidity sources, we may not be able to service and repay our debt, operate our business, respond to competitive challenges, or fund our other liquidity and capital needs.
Restrictions in our subsidiaries' debt instruments and under applicable law limit their ability to provide funds to us and our subsidiaries that are debt issuers.
Our primary assets are our equity interests in our subsidiaries. Our operating subsidiaries are separate and distinct legal entities and are not obligated to make funds available to us for payments on our notes or other obligations in the form of loans, distributions, or otherwise. Charter Operating’s and CCO Holdings’ ability to make distributions to us or the applicable debt issuers to service debt obligations is subject to their compliance with the terms of their credit facilities and indentures, and restrictions under applicable law. See “Part II. Item 7. Management’s Discussion and Analysis of Financial Condition and Results of Operations — Liquidity and Capital Resources — Limitations on Distributions” and “— Summary of Restrictive Covenants of Our Notes – Restrictions on Distributions.” Under the Delaware Limited Liability Company Act (the “Act”), our subsidiaries may only make distributions if the relevant entity has “surplus” as defined in the Act. Under fraudulent transfer laws, our subsidiaries may not pay dividends if the relevant entity is insolvent or is rendered insolvent thereby. The measures of insolvency for purposes of these fraudulent transfer laws vary depending upon the law applied in any proceeding to determine whether a fraudulent transfer has occurred. Generally, however, an entity would be considered insolvent if:
|
·
|
the sum of its debts, including contingent liabilities, was greater than the fair saleable value of all its assets;
|
|
·
|
the present fair saleable value of its assets was less than the amount that would be required to pay its probable liability on its existing debts, including contingent liabilities, as they become absolute and mature; or
|
|
·
|
it could not pay its debts as they became due.
|
While we believe that our relevant subsidiaries currently have surplus and are not insolvent, there can otherwise be no assurance that these subsidiaries will not become insolvent or will be permitted to make distributions in the future in compliance with these restrictions in amounts needed to service our indebtedness. Our direct or indirect subsidiaries include the borrowers under the CCO Holdings credit facility and the borrowers and guarantors under the Charter Operating credit facilities. Charter Operating is also an obligor, and its subsidiaries are guarantors under senior second-lien notes, and CCO Holdings is an obligor under its senior notes. As of December 31, 2010, our total principal amount of debt was approximately $12.3 billion.
In the event of bankruptcy, liquidation, or dissolution of one or more of our subsidiaries, that subsidiary's assets would first be applied to satisfy its own obligations, and following such payments, such subsidiary may not have sufficient assets remaining to make payments to its parent company as an equity holder or otherwise. In that event:
|
·
|
the lenders under CCO Holdings’ credit facility and Charter Operating's credit facilities and senior second-lien notes, whose interests are secured by substantially all of our operating assets, and all holders of other debt of CCO Holdings and Charter Operating, will have the right to be paid in full before us from any of our subsidiaries' assets; and
|
|
·
|
Charter and CCH I, the holders of preferred membership interests in our subsidiary, CC VIII, would have a claim on a portion of CC VIII’s assets that may reduce the amounts available for repayment to holders of our outstanding notes.
|
18
All of our outstanding debt is subject to change of control provisions. We may not have the ability to raise the funds necessary to fulfill our obligations under our indebtedness following a change of control, which would place us in default under the applicable debt instruments.
We may not have the ability to raise the funds necessary to fulfill our obligations under our notes and our credit facilities following a change of control. Under the indentures governing our notes, upon the occurrence of specified change of control events, the applicable note issuer is required to offer to repurchase all of its outstanding notes. However, we may not have sufficient access to funds at the time of the change of control event to make the required repurchase of the applicable notes, and all of the notes issuers are limited in their ability to make distributions or other payments to their respective parent company to fund any required repurchase. In addition, a change of control under the Charter Operating credit facilities would result in a default under those credit facilities. Because such credit facilities and our subsidiaries’ notes are obligations of our subsidiaries, the credit facilities and our subsidiaries’ notes would have to be repaid by our subsidiaries before their assets could be available to their parent companies to repurchase their notes. Any failure to make or complete a change of control offer would place the applicable note issuer or borrower in default under its notes. The failure of our subsidiaries to make a change of control offer or repay the amounts accelerated under their notes and credit facilities would place them in default.
Risks Related to Our Business
We operate in a very competitive business environment, which affects our ability to attract and retain customers and can adversely affect our business and operations.
The industry in which we operate is highly competitive and has become more so in recent years. In some instances, we compete against companies with fewer regulatory burdens, better access to financing, greater personnel resources, greater resources for marketing, greater and more favorable brand name recognition, and long-established relationships with regulatory authorities and customers. Increasing consolidation in the cable industry and the repeal of certain ownership rules have provided additional benefits to certain of our competitors, either through access to financing, resources, or efficiencies of scale.
Our principal competitors for video services throughout our territory are DBS providers. The two largest DBS providers are DirecTV and DISH Network. Competition from DBS, including intensive marketing efforts with aggressive pricing, exclusive programming and increased high definition broadcasting has had an adverse impact on our ability to retain customers. DBS companies have also expanded their activities in the MDU market. The cable industry, including us, has lost a significant number of video customers to DBS competition, and we face serious challenges in this area in the future.
Telephone companies, including two major telephone companies, AT&T and Verizon, offer video and other services in competition with us, and we expect they will increasingly do so in the future. Upgraded portions of these networks carry two-way video, data service offerings and provide digital voice services similar to ours. In the case of Verizon, high-speed data services offer speeds as high as or higher than ours. In addition, these companies continue to offer their traditional telephone services, as well as service bundles that include wireless voice services provided by affiliated companies. Based on our internal estimates, we believe that AT&T and Verizon are offering video services in areas serving approximately 24% to 29% and 3%, respectively, of our estimated homes passed as of December 31, 2010, and we have experienced customer losses in these areas. AT&T and Verizon have also launched campaigns to capture more of the MDU market. Additional upgrades and product launches are expected in markets in which we operate. With respect to our Internet access services, we face competition, including intensive marketing efforts and aggressive pricing, from telephone companies and other providers of DSL. DSL service competes with our high-speed Internet service and is often offered at prices lower than our Internet services, although often at speeds lower than the speeds we offer. In addition, in many of our markets, these companies have entered into co-marketing arrangements with DBS providers to offer service bundles combining video services provided by a DBS provider with DSL and traditional telephone and wireless services offered by the telephone companies and their affiliates. These service bundles offer customers similar pricing and convenience advantages as our bundles. Continued growth in our residential telephone business faces risks. The competitive landscape for residential and commercial telephone services is intense; we face competition from providers of Internet telephone services, as well as incumbent telephone companies. Further, we face increasing competition for residential telephone services as more consumers in the United States are replacing traditional telephone service with wireless service.
The existence of more than one cable system operating in the same territory is referred to as an overbuild. Overbuilds could adversely affect our growth, financial condition, and results of operations, by creating or
19
increasing competition. Based on internal estimates and excluding telephone companies, as of December 31, 2010, we are aware of traditional overbuild situations impacting approximately 7% to 9% of our estimated homes passed, and potential traditional overbuild situations in areas servicing approximately an additional 1% of our estimated homes passed. Additional overbuild situations may occur in other systems.
In order to attract new customers, from time to time we make promotional offers, including offers of temporarily reduced price or free service. These promotional programs result in significant advertising, programming and operating expenses, and also may require us to make capital expenditures to acquire and install customer premise equipment. Customers who subscribe to our services as a result of these offerings may not remain customers following the end of the promotional period. A failure to retain customers could have a material adverse effect on our business.
Mergers, joint ventures, and alliances among franchised, wireless, or private cable operators, DBS providers, local exchange carriers, and others, may provide additional benefits to some of our competitors, either through access to financing, resources, or efficiencies of scale, or the ability to provide multiple services in direct competition with us.
In addition to the various competitive factors discussed above, our business is subject to risks relating to increasing competition for the leisure and entertainment time of consumers. Our business competes with all other sources of entertainment and information delivery, including broadcast television, movies, live events, radio broadcasts, home video products, console games, print media, and the Internet. Technological advancements, such as video-on-demand, new video formats, and Internet streaming and downloading, have increased the number of entertainment and information delivery choices available to consumers, and intensified the challenges posed by audience fragmentation. The increasing number of choices available to audiences could also negatively impact advertisers’ willingness to purchase advertising from us, as well as the price they are willing to pay for advertising. If we do not respond appropriately to further increases in the leisure and entertainment choices available to consumers, our competitive position could deteriorate, and our financial results could suffer.
Our services may not allow us to compete effectively. Additionally, as we expand our offerings to introduce new and enhanced services, we will be subject to competition from other providers of the services we offer. Competition may reduce our expected growth of future cash flows which may contribute to future impairments of our franchises and goodwill.
Economic conditions in the United States may adversely impact the growth of our business.
We believe that continued competition and the weakened economic conditions in the United States, including the housing market and relatively high unemployment levels, have adversely affected consumer demand for our services. In addition, we believe these factors have contributed to an increase in the number of homes that replace their traditional telephone service with wireless service thereby impacting the growth of our telephone business. These conditions have affected our net customer additions and revenue growth during 2009 and 2010
and contributed to the franchise impairment charge incurred in 2009. If these conditions do not improve, we believe the growth of our business and results of operations will be further adversely affected which may contribute to future impairments of our franchises and goodwill.
We face risks inherent in our commercial business.
We may encounter unforeseen difficulties as we increase the scale of our service offerings to businesses. We sell video, high-speed data and network and transport services to businesses and have increased our focus on growing this business. In order to grow our commercial business, we expect to increase expenditures on technology, equipment and personnel focused on the commercial business. Commercial business customers often require service level agreements and generally have heightened customer expectations for reliability of services. If our efforts to build the infrastructure to scale the commercial business are not successful, the growth of our commercial services business would be limited. We depend on interconnection and related services provided by certain third parties for the growth of our commercial business. As a result, our ability to implement changes as the services grow may be limited. If we are unable to meet these service level requirements or expectations, our commercial business could be adversely affected. Finally, we expect advances in communications technology, as well as changes in the marketplace and the regulatory and legislative environment. Consequently, we are unable to predict the effect that ongoing or future developments in these areas might have on our telephone and commercial businesses and operations.
20
Our exposure to the credit risks of our customers, vendors and third parties could adversely affect our cash flow, results of operations and financial condition.
We are exposed to risks associated with the potential financial instability of our customers, many of whom have been adversely affected by the general economic downturn. Dramatic declines in the housing market, including falling home prices and increasing foreclosures, together with significant increases in unemployment, have severely affected consumer confidence and caused increased delinquencies or cancellations by our customers or lead to unfavorable changes in the mix of products purchased. These events have adversely affected, and may continue to adversely affect our cash flow, results of operations and financial condition.
In addition, we are susceptible to risks associated with the potential financial instability of the vendors and third parties on which we rely to provide products and services or to which we outsource certain functions. The same economic conditions that may affect our customers, as well as volatility and disruption in the capital and credit markets, also could adversely affect vendors and third parties and lead to significant increases in prices, reduction in output or the bankruptcy of our vendors or third parties upon which we rely. Any interruption in the services provided by our vendors or by third parties could adversely affect our cash flow, results of operation and financial condition.
We may not have the ability to reduce the high growth rates of, or pass on to our customers, our increasing programming costs, which would adversely affect our cash flow and operating margins.
Programming has been, and is expected to continue to be, our largest operating expense item. In recent years, the cable industry has experienced a rapid escalation in the cost of programming. We expect programming costs to continue to increase, and at a higher rate than in 2010, because of a variety of factors including amounts paid for retransmission consent, annual increases imposed by programmers and additional programming, including high definition and OnDemand programming, being provided to customers. The inability to fully pass these programming cost increases on to our customers has had an adverse impact on our cash flow and operating margins associated with the video product. We have programming contracts that have expired and others that will expire at or before the end of 2011. There can be no assurance that these agreements will be renewed on favorable or comparable terms. To the extent that we are unable to reach agreement with certain programmers on terms that we believe are reasonable we may be forced to remove such programming channels from our line-up, which could result in a further loss of customers.
Increased demands by owners of some broadcast stations for carriage of other services or payments to those broadcasters for retransmission consent are likely to further increase our programming costs. Federal law allows commercial television broadcast stations to make an election between “must-carry” rights and an alternative “retransmission-consent” regime. When a station opts for the latter, cable operators are not allowed to carry the station’s signal without the station’s permission. In some cases, we carry stations under short-term arrangements while we attempt to negotiate new long-term retransmission agreements. If negotiations with these programmers prove unsuccessful, they could require us to cease carrying their signals, possibly for an indefinite period. Any loss of stations could make our video service less attractive to customers, which could result in less subscription and advertising revenue. In retransmission-consent negotiations, broadcasters often condition consent with respect to one station on carriage of one or more other stations or programming services in which they or their affiliates have an interest. Carriage of these other services, as well as increased fees for retransmission rights, may increase our programming expenses and diminish the amount of capacity we have available to introduce new services, which could have an adverse effect on our business and financial results.
Our inability to respond to technological developments and meet customer demand for new products and services could limit our ability to compete effectively.
Our business is characterized by rapid technological change and the introduction of new products and services, some of which are bandwidth-intensive. We may not be able to fund the capital expenditures necessary to keep pace with technological developments, or anticipate the demand of our customers for products and services requiring new technology or bandwidth. Our inability to maintain and expand our upgraded systems and provide advanced services in a timely manner, or to anticipate the demands of the marketplace, could materially adversely affect our ability to attract and retain customers. Consequently, our growth, financial condition and results of operations could suffer materially.
21
We depend on third party service providers, suppliers and licensors; thus, if we are unable to procure the necessary services, equipment, software or licenses on reasonable terms and on a timely basis, our ability to offer services could be impaired, and our growth, operations, business, financial results and financial condition could be materially adversely affected.
We depend on third party service providers, suppliers and licensors to supply some of the services, hardware, software and operational support necessary to provide some of our services. We obtain these materials from a limited number of vendors, some of which do not have a long operating history or which may not be able to continue to supply the equipment and services we desire. Some of our hardware, software and operational support vendors, and service providers represent our sole source of supply or have, either through contract or as a result of intellectual property rights, a position of some exclusivity. If demand exceeds these vendors’ capacity or if these vendors experience operating or financial difficulties, or are otherwise unable to provide the equipment or services we need in a timely manner and at reasonable prices, our ability to provide some services might be materially adversely affected, or the need to procure or develop alternative sources of the affected materials or services might delay our ability to serve our customers. These events could materially and adversely affect our ability to retain and attract customers, and have a material negative impact on our operations, business, financial results and financial condition. A limited number of vendors of key technologies can lead to less product innovation and higher costs. For these reasons, we generally endeavor to establish alternative vendors for materials we consider critical, but may not be able to establish these relationships or be able to obtain required materials on favorable terms.
In that regard, we currently purchase set-top boxes from a limited number of vendors, because each of our cable systems use one or two proprietary conditional access security schemes, which allows us to regulate subscriber access to some services, such as premium channels. We believe that the proprietary nature of these conditional access schemes makes other manufacturers reluctant to produce set-top boxes. Future innovation in set-top boxes may be restricted until these issues are resolved. In addition, we believe that the general lack of compatibility among set-top box operating systems has slowed the industry’s development and deployment of digital set-top box applications.
We depend on patent, copyright, trademark and trade secret laws and licenses to establish and maintain its intellectual property rights in technology and the products and services used in our operating activities. Any of our intellectual property rights could be challenged or invalidated, or such intellectual property rights may not be sufficient to permit us to continue to use certain intellectual property, which could result in discontinuance of certain product or service offerings or other competitive harm, our incurring substantial monetary liability or being enjoined preliminarily or permanently from further use of the intellectual property in question.
Malicious and abusive Internet practices could impair our high-speed Internet services.
Our high-speed Internet customers utilize our network to access the Internet and, as a consequence, we or they may become victim to common malicious and abusive Internet activities, such as peer-to-peer file sharing, unsolicited mass advertising (i.e., “spam”) and dissemination of viruses, worms, and other destructive or disruptive software. These activities could have adverse consequences on our network and our customers, including degradation of service, excessive call volume to call centers, and damage to our or our customers' equipment and data. Significant incidents could lead to customer dissatisfaction and, ultimately, loss of customers or revenue, in addition to increased costs to service our customers and protect our network. Any significant loss of high-speed Internet customers or revenue, or significant increase in costs of serving those customers, could adversely affect our growth, financial condition and results of operations.
For tax purposes, we experienced a deemed ownership change upon emergence from Chapter 11 bankruptcy, resulting in an annual limitation on our ability to use our existing tax loss carryforwards. We could experience another deemed ownership change in the future that could further limit our ability to use our tax loss carryforwards.
As of December 31, 2010, we had approximately $6.9 billion of federal tax net operating and capital loss carryforwards resulting in a gross deferred tax asset of approximately $2.4 billion, expiring in the years 2014 through 2030. These losses resulted from the operations of Charter Holdco and its subsidiaries. In addition, as of December 31, 2010, we had state tax net operating and capital loss carryforwards, resulting in a gross deferred tax asset (net of federal tax benefit) of approximately $228 million, generally expiring in years 2011 through 2030. Due to uncertainties in projected future taxable income, valuation allowances have been established against the gross deferred tax assets for book accounting purposes, except for future taxable income that will result from the reversal
22
of existing temporary differences for which deferred tax liabilities are recognized. Such tax loss carryforwards can accumulate and be used to offset our future taxable income.
The consummation of the Plan generated an “ownership change” as defined in Section 382 of the Internal Revenue Code of 1986, as amended (the “Code”). In general, an “ownership change” occurs whenever the percentage of the stock of a corporation owned, directly or indirectly, by “5-percent stockholders” (within the meaning of Section 382 of the Code) increases by more than 50 percentage points over the lowest percentage of the stock of such corporation owned, directly or indirectly, by such “5-percent stockholders” at any time over the preceding three
years. As a result, Charter is subject to an annual limitation on the use of our loss carryforwards which existed at November 30, 2009. Further, our loss carryforwards have been reduced by the amount of the cancellation of debt income resulting from the Plan that was allocable to Charter. The limitation on our ability to use our loss carryforwards, in conjunction with the loss carryforward expiration provisions, could reduce our ability to use a portion of our loss carryforwards to offset future taxable income which could result in us being required to make material cash tax payments. Our ability to make such income tax payments, if any, will depend at such time on our liquidity or our ability to raise additional capital, and/or on receipt of payments or distributions from Charter Holdco and its subsidiaries.
If Charter were to experience a second ownership change in the future (as a result of purchases and sales of stock by Charter’s 5-percent stockholders, new issuances or redemptions of Charter’s stock, certain acquisitions of Charter’s stock and issuances, redemptions, sales or other dispositions or acquisitions of interests in Charter’s 5-percent stockholders), Charter’s ability to use our loss carryforwards could become subject to further limitations. Our common stock is subject to certain transfer restrictions contained in our amended and restated certificate of incorporation. These restrictions, which are designed to minimize the likelihood of an ownership change occurring and thereby preserve our ability to utilize our loss carryforwards, are not currently operative but could become operative in the future if certain events occur and the restrictions are imposed by Charter’s board of directors. However, there can be no assurance that Charter’s board of directors would choose to impose these restrictions or that such restrictions, if imposed, would prevent an ownership change from occurring.
If we are unable to retain key employees, our ability to manage our business could be adversely affected.
Our operational results have depended, and our future results will depend, upon the retention and continued performance of our management team. Over the last twelve months, we have experienced significant changes in our management team and may experience additional changes in the future. Our ability to retain key employees for management positions could be impacted adversely by the competitive environment for management talent in the telecommunications industry. The loss of the services of key members of management and the inability to hire new key employees could adversely affect our ability to manage our business and our future operational and financial results.
Risks Related to Ownership Positions of Charter’s Principal Shareholders
Charter’s principal stockholders own a significant amount of Charter’s common stock, giving them influence over corporate transactions and other matters.
Charter’s principal stockholders have appointed members to Charter’s board of directors in accordance with the Plan, including: Mr. Darren Glatt, who is an employee of Apollo Management, L.P.; and Mr. Bruce Karsh, who was appointed by Oaktree Opportunities Investments, L.P. and is the president of Oaktree Capital Management, L.P. On January 18, 2011, Charter’s board of directors appointed Mr. Stan Parker, a senior partner of Apollo Global Management LLC, and Mr. Edgar Lee, a Senior Vice President of Oaktree Capital Management, L.P. as members of the board of directors to fill two vacancies on the board. As of January 31, 2011, funds affiliated with AP Charter Holdings, L.P. beneficially hold approximately 31% of the Class A common stock of Charter. Oaktree Opportunities Investments, L.P. and certain affiliated funds beneficially hold approximately 18% of the Class A common stock of Charter. Funds advised by Franklin Advisers, Inc. beneficially hold approximately 17% of the Class A common stock of Charter. Charter’s principal stockholders may be able to exercise substantial influence over all matters requiring stockholder approval, including the election of directors and approval of significant corporate action, such as mergers and other business combination transactions should these stockholders retain a significant ownership interest in us.
Charter’s principal stockholders are not restricted from investing in, and have invested in, and engaged in, other businesses involving or related to the operation of cable television systems, video programming, high-speed Internet
23
service, telephone or business and financial transactions conducted through broadband interactivity and Internet services. The principal stockholders may also engage in other businesses that compete or may in the future compete with us.
The principal stockholders’ substantial influence over our management and affairs could create conflicts of interest if any of them were faced with decisions that could have different implications for them and us.
If we were to have a person with a 35% or greater voting interest and Paul G. Allen did not then have a voting interest in us greater than such holder, a change of control default could be triggered under our subsidiary's credit facilities.
On March 31, 2010, Charter Operating entered into an amended and restated credit agreement governing its credit facility. Such amendment removed the requirement that Mr. Allen retain a voting interest in us. On January 18, 2011, Mr. Allen’s Class B shares were converted to Class A shares, and as a result, Mr. Allen currently holds less than 10% of a voting interest in us. The credit agreement provides that a change of control under certain of our other debt instruments could result in an event of default under the credit agreement. Certain of those other instruments define a change of control as including a holder holding more than 35% of our direct or indirect voting interest and the failure by (a) Mr. Allen, (b) his estate, spouse, immediate family members and heirs and (c) any trust, corporation, partnership or other entity, the beneficiaries, stockholders, partners or other owners of which consist exclusively of Mr. Allen or such other persons referred to in (b) above or a combination thereof to maintain a greater percentage of direct or indirect voting interest than such other holder. Such a default could result in the acceleration of repayment of our indebtedness, including borrowings under the Charter Operating credit facilities. As of January 31, 2011, funds affiliated with AP Charter Holdings, L.P. beneficially hold approximately 31% of the Class A common stock of Charter. See “— Risks Related to Our Significant Indebtedness and the Notes—All of our outstanding debt is subject to change of control provisions. We may not have the ability to raise the funds necessary to fulfill our obligations under our indebtedness following a change of control, which would place us in default under the applicable debt instruments.”
Risks Related to Regulatory and Legislative Matters
Our business is subject to extensive governmental legislation and regulation, which could adversely affect our business.
Regulation of the cable industry has increased cable operators' operational and administrative expenses and limited their revenues. Cable operators are subject to, among other things:
|
·
|
rules governing the provision of cable equipment and compatibility with new digital technologies;
|
|
·
|
rules and regulations relating to subscriber and employee privacy;
|
|
·
|
limited rate regulation;
|
|
·
|
rules governing the copyright royalties that must be paid for retransmitting broadcast signals;
|
|
·
|
requirements governing when a cable system must carry a particular broadcast station and when it must first obtain retransmission consent to carry a broadcast station;
|
|
·
|
requirements governing the provision of channel capacity to unaffiliated commercial leased access programmers;
|
|
·
|
rules limiting our ability to enter into exclusive agreements with multiple dwelling unit complexes and control our inside wiring;
|
|
·
|
rules, regulations, and regulatory policies relating to provision of high-speed Internet service, including net neutrality rules;
|
|
·
|
rules, regulations, and regulatory policies relating to provision of voice communications;
|
|
·
|
rules for franchise renewals and transfers; and
|
|
·
|
other requirements covering a variety of operational areas such as equal employment opportunity, emergency alert systems, technical standards, and customer service requirements.
|
Additionally, many aspects of these regulations are currently the subject of judicial proceedings and administrative or legislative proposals. In March 2010, the FCC submitted its National Broadband Plan to Congress and announced its intention to initiate approximately 40 rulemakings addressing a host of issues related to the delivery of broadband services, including video, data, VoIP and other services. The broad reach of these rulemakings could ultimately impact the environment in which we operate.
On December 21, 2010, the FCC enacted new “net neutrality” rules, regulating the provision of broadband Internet access.
There are also ongoing efforts to amend or
24
expand the federal, state, and local regulation of some of our cable systems, which may compound the regulatory risks we already face, and proposals that might make it easier for our employees to unionize. For example, Congress and various federal agencies are now considering adoption of significant new privacy restrictions, including new restrictions on the use of personal and profiling information for behavioral advertising. In addition, the Twenty-First Century Communications and Video Accessibility Act of 2010, which the FCC is now in the process of implementing, includes various provisions intended to ensure communications services are accessible to
people with disabilities. Certain states and localities are considering new cable and telecommunications taxes that could increase operating expenses.
Our cable system franchises are subject to non-renewal or termination. The failure to renew a franchise in one or more key markets could adversely affect our business.
Our cable systems generally operate pursuant to franchises, permits, and similar authorizations issued by a state or local governmental authority controlling the public rights-of-way. Many franchises establish comprehensive facilities and service requirements, as well as specific customer service standards and monetary penalties for non-compliance. In many cases, franchises are terminable if the franchisee fails to comply with significant provisions set forth in the franchise agreement governing system operations. Franchises are generally granted for fixed terms and must be periodically renewed. Franchising authorities may resist granting a renewal if either past performance or the prospective operating proposal is considered inadequate. Franchise authorities often demand concessions or other commitments as a condition to renewal. In some instances, local franchises have not been renewed at expiration, and we have operated and are operating under either temporary operating agreements or without a franchise while negotiating renewal terms with the local franchising authorities.
The traditional cable franchising regime is currently undergoing significant change as a result of various federal and state actions. Some of the new state franchising laws do not allow us to immediately opt into statewide franchising until (i) we have completed the term of the local franchise, in good standing, (ii) a competitor has entered the market, or (iii) in limited instances, where the local franchise allows the state franchise license to apply. In many cases, state franchising laws, and their varying application to us and new video providers, will result in less franchise imposed requirements for our competitors who are new entrants than for us until we are able to opt into the applicable state franchise.
We cannot assure you that we will be able to comply with all significant provisions of our franchise agreements and certain of our franchisors have from time to time alleged that we have not complied with these agreements. Additionally, although historically we have renewed our franchises without incurring significant costs, we cannot assure you that we will be able to renew, or to renew as favorably, our franchises in the future. A termination of or a sustained failure to renew a franchise in one or more key markets could adversely affect our business in the affected geographic area.
Our cable system franchises are non-exclusive. Accordingly, local and state franchising authorities can grant additional franchises and create competition in market areas where none existed previously, resulting in overbuilds, which could adversely affect results of operations.
Our cable system franchises are non-exclusive. Consequently, local and state franchising authorities can grant additional franchises to competitors in the same geographic area or operate their own cable systems. In some cases, local government entities and municipal utilities may legally compete with us without obtaining a franchise from the local franchising authority. In addition, certain telephone companies are seeking authority to operate in communities without first obtaining a local franchise. As a result, competing operators may build systems in areas in which we hold franchises.
In a series of recent rulemakings, the FCC adopted new rules that streamline entry for new competitors (particularly those affiliated with telephone companies) and reduce franchising burdens for these new entrants. At the same time, a substantial number of states recently have adopted new franchising laws. Again, these new laws were principally designed to streamline entry for new competitors, and they often provide advantages for these new entrants that are not immediately available to existing operators. As a result of these new franchising laws and regulations, we have seen an increase in the number of competitive cable franchises or operating certificates being issued, and we anticipate that trend to continue.
25
Local franchise authorities have the ability to impose additional regulatory constraints on our business, which could further increase our expenses.
In addition to the franchise agreement, cable authorities in some jurisdictions have adopted cable regulatory ordinances that further regulate the operation of cable systems. This additional regulation increases the cost of operating our business. Local franchising authorities may impose new and more restrictive requirements. Local franchising authorities who are certified to regulate rates in the communities where they operate generally have the power to reduce rates and order refunds on the rates charged for basic service and equipment.
Tax legislation and administrative initiatives or challenges to our tax positions could adversely affect our results of operations and financial condition.
We operate cable systems in locations throughout the United States and, as a result, we are subject to the tax laws and regulations of federal, state and local governments. From time to time, various legislative and/or administrative initiatives may be proposed that could adversely affect our tax positions. There can be no assurance that our effective tax rate or tax payments will not be adversely affected by these initiatives. As a result of state and local budget shortfalls due primarily to the recession as well as other considerations, certain states and localities have imposed or are considering imposing new or additional taxes or fees on our services or changing the methodologies or base on which certain fees and taxes are computed. Such potential changes include additional taxes or fees on our services which could impact our customers, combined reporting and other changes to general business taxes, central/unit-level assessment of property taxes and other matters that could increase our income, franchise, sales, use and/or property tax liabilities. In addition, federal, state and local tax laws and regulations are extremely complex and subject to varying interpretations. There can be no assurance that our tax positions will not be challenged by relevant tax authorities or that we would be successful in any such challenge.
Further regulation of the cable industry could cause us to delay or cancel service or programming enhancements, or impair our ability to raise rates to cover our increasing costs, resulting in increased losses.
Currently, rate regulation is strictly limited to the basic service tier and associated equipment and installation activities. However, the FCC and Congress continue to be concerned that cable rate increases are exceeding inflation. It is possible that either the FCC or Congress will further restrict the ability of cable system operators to implement rate increases. Should this occur, it would impede our ability to raise our rates. If we are unable to raise our rates in response to increasing costs, our losses would increase.
There has been legislative and regulatory interest in requiring cable operators to offer historically combined programming services on an á la carte basis. It is possible that new marketing restrictions could be adopted in the future. Such restrictions could adversely affect our operations.
Actions by pole owners might subject us to significantly increased pole attachment costs.
Pole attachments are cable wires that are attached to utility poles. Cable system attachments to public utility poles historically have been regulated at the federal or state level, generally resulting in favorable pole attachment rates for attachments used to provide cable service. The FCC previously determined that the lower cable rate was applicable to the mixed use of a pole attachment for the provision of both cable and Internet access services. However, in late 2007, the FCC issued a NPRM, in which it “tentatively concludes” that this approach should be modified. In 2009, a group of electric utilities petitioned the FCC to increase the pole attachment rates applicable to voice service provided through any technology. These changes could affect the pole attachment rates we pay when we offer either data or voice services over our broadband facility. Any changes in the FCC approach could result in a substantial increase in our pole attachment costs. In its March 2010 National Broadband Plan and a May 2010 former Notice of Proposed Rulemaking, however, the FCC suggested it might actually lower the pole attachment rates applicable to telecommunications delivery to the prevailing cable rate calculation.
Increasing regulation of our Internet service product could adversely affect our ability to provide new products and services.
There has been continued advocacy by certain Internet content providers and consumer groups for new federal laws or regulations to adopt so-called “net neutrality” principles limiting the ability of broadband network owners (like us) to manage and control their own networks. In August 2005, the FCC issued a nonbinding policy statement identifying four principles it deemed necessary to ensure continuation of an “open” Internet that is not unduly restricted by network “gatekeepers.” In August 2008, the FCC issued an order concerning one Internet network
26
management practice in use by another cable operator, effectively treating the four principles as rules and ordering a
change in network management practices. On April 6, 2010, the United States Court of Appeals for the D.C. Circuit concluded that the FCC lacked jurisdictional authority and vacated the FCC’s 2008 order. On December 21, 2010, the FCC responded by enacting new “net neutrality” rules based on three core principles of: (1) transparency, (2) no blocking, and (3) no unreasonable discrimination. The “transparency” rule requires broadband Internet access providers to disclose applicable terms, performance, and network management practices to consumers and third party users. The “no blocking” rule restricts Internet access providers from blocking lawful content, applications, services, or devices. The “no unreasonable discrimination” rule prohibits Internet access providers from engaging in unreasonable discrimination in transmitting lawful traffic. The new rules will permit broadband service providers to
exercise “reasonable network management” for legitimate management purposes, such as management of congestion, harmful traffic, and network security. The rules will also permit usage-based billing, and permit broadband service providers to offer additional specialized services such as facilities-based IP voice services, without being subject to restrictions on discrimination. These rules do not become effective until 60 days following the announcement in the Federal Register of the Office of Management and Budget’s decision regarding the information collection requirements associated with the new rules which has not yet occurred. When they become effective, the FCC will enforce these rules based on case-by-case complaints. Although the new rules encompass both wireline providers (like us) and wireless providers, the rules are less stringent with regard to wireless providers. The FCC premised the new “net neutrality” rules on its Title I and ancillary jurisdiction, and that jurisdictional authority already has been challenged in court. A legislative review is also possible. The FCC’s new rules, if they withstand such challenges, as well as any additional legislation or regulation, could impose new obligations and restraints on high-speed Internet providers. Any such rules or statutes could limit our ability to manage our cable systems to obtain value for use of our cable systems and respond to operational and competitive challenges.
Changes in channel carriage regulations could impose significant additional costs on us.
Cable operators also face significant regulation of their channel carriage. We can be required to devote substantial capacity to the carriage of programming that we might not carry voluntarily, including certain local broadcast signals; local public, educational and government access (“PEG”) programming; and unaffiliated, commercial leased access programming (required channel capacity for use by persons unaffiliated with the cable operator who desire to distribute programming over a cable system). The FCC adopted a plan in 2007 addressing the cable industry’s broadcast carriage obligations once the broadcast industry migration from analog to digital transmission is completed, which occurred in June 2009. Under the FCC’s plan, most cable systems are required to offer both an analog and digital version of local broadcast signals. This burden could increase further if we are required to carry multiple programming streams included within a single digital broadcast transmission (multicast carriage) or if our broadcast carriage obligations are otherwise expanded. At the same time, the cost that cable operators face to secure retransmission consent for the carriage of popular broadcast stations is increasing significantly. The FCC also adopted new commercial leased access rules (currently stayed while under appeal) which dramatically reduce the rate we can charge for leasing this capacity and dramatically increase our associated administrative burdens. These regulatory changes could disrupt existing programming commitments, interfere with our preferred use of limited channel capacity, and limit our ability to offer services that would maximize our revenue potential. It is possible that other legal restraints will be adopted limiting our discretion over programming decisions.
Offering voice communications service may subject us to additional regulatory burdens, causing us to incur additional costs.
We offer voice communications services over our broadband network and continue to develop and deploy VoIP services. The FCC has declared that certain VoIP services are not subject to traditional state public utility regulation. The full extent of the FCC preemption of state and local regulation of VoIP services is not yet clear. Expanding our offering of these services may require us to obtain certain additional authorizations. We may not be able to obtain such authorizations in a timely manner, or conditions could be imposed upon such licenses or authorizations that may not be favorable to us. The FCC has extended certain traditional telecommunications carrier requirements, such as E911, Universal Service fund collection, CALEA, Customer Proprietary Network Information, number porting and telephone relay requirements to many VoIP providers such as us. Telecommunications companies generally are subject to other significant regulation which could also be extended to VoIP providers. If additional telecommunications regulations are applied to our VoIP service, it could cause us to incur additional costs.
None.
27
Our principal physical assets consist of cable distribution plant and equipment, including signal receiving, encoding and decoding devices, headend reception facilities, distribution systems, and customer premise equipment for each of our cable systems.
Our cable plant and related equipment are generally attached to utility poles under pole rental agreements with local public utilities and telephone companies, and in certain locations are buried in underground ducts or trenches. We own or lease real property for signal reception sites, and own our service vehicles.
Our subsidiaries generally lease space for business offices. Our headend and tower locations are located on owned or leased parcels of land, and we generally own the towers on which our equipment is located. Charter Holdco owns the land and building for our principal executive office.
The physical components of our cable systems require maintenance as well as periodic upgrades to support the new services and products we introduce. See “Item 1. Business – Our Network Technology.” We believe that our properties are generally in good operating condition and are suitable for our business operations.
Patent Litigation
Ronald A. Katz Technology Licensing, L.P. v. Charter Communications, Inc. et. al
. On September 5, 2006, Ronald A. Katz Technology Licensing, L.P. served a lawsuit on Charter and a group of other companies in the U. S. District Court for the District of Delaware alleging that Charter and the other defendants have infringed its interactive call processing patents. Charter denied the allegations raised in the complaint. On March 20, 2007, the Judicial Panel on Multi-District Litigation transferred this case, along with 24 others, to the U.S. District Court for the Central District of California for coordinated and consolidated pretrial proceedings. On May 5, 2010, the court denied Katz’s motion for summary judgment, struck two affirmative defenses that Charter had raised, invalidated one of the nine remaining claims Katz had asserted and entered a ruling limiting Katz’s damages claims. Charter is vigorously contesting this matter.
Rembrandt Patent Litigation.
On June 6, 2006, Rembrandt Technologies, LP sued Charter and several other cable companies in the U.S. District Court for the Eastern District of Texas, alleging that each defendant's high-speed data
service infringes three patents owned by Rembrandt and that Charter's receipt and retransmission of Advanced Television Systems Committee digital terrestrial broadcast signals infringes a fourth patent owned by Rembrandt
(Rembrandt I).
On November 30, 2006, Rembrandt Technologies, LP again filed suit against Charter and another cable company in the U.S. District Court for the Eastern District of Texas, alleging patent infringement of an additional five patents allegedly related to high-speed Internet over cable
(Rembrandt II).
Charter has denied all of Rembrandt’s allegations. On June 18, 2007, the
Rembrandt I
and
Rembrandt
II
cases were combined in a multi-district litigation proceeding in the U.S. District Court for the District of Delaware. On November 21, 2007, certain vendors of the equipment that is the subject of
Rembrandt I
and
Rembrandt II
cases filed an action against Rembrandt in U.S. District Court for the District of Delaware seeking a declaration of non-infringement and invalidity on all but one of the patents at issue in those cases. On January 16, 2008 Rembrandt filed an answer in that case and a third party counterclaim against Charter and the other MSOs for infringement of all but one of the patents already at issue in
Rembrandt I
and
Rembrandt II cases
. On February 7, 2008, Charter filed an answer to Rembrandt’s counterclaims and added a counter-counterclaim against Rembrandt for a declaration of noninfringement on the remaining patent. On October 28, 2009, Rembrandt filed a Supplemental Covenant Not to Sue promising not to sue Charter and the other defendants on eight of the contested patents. One patent remains in litigation, and Charter is vigorously contesting Rembrandt's claims regarding it.
We are also defendants or co-defendants in several other unrelated lawsuits claiming infringement of various patents relating to various aspects of our businesses. Other industry participants are also defendants in certain of these cases, and, in many cases including those described above, we expect that any potential liability would be the responsibility of our equipment vendors pursuant to applicable contractual indemnification provisions.
In the event that a court ultimately determines that we infringe on any intellectual property rights, we may be subject to substantial damages and/or an injunction that could require us or our vendors to modify certain products and services we offer to our subscribers, as well as negotiate royalty or license agreements with respect to the patents at
28
issue. While we believe the lawsuits are without merit and intend to defend the actions vigorously, no assurance can be given that any adverse outcome would not be material to our consolidated financial condition, results of operations, or liquidity.
Bankruptcy Proceedings
On March 27, 2009, Charter filed its chapter 11 petition in the United States Bankruptcy Court for the Southern District of New York. On the same day, JPMorgan Chase Bank, N.A., (“JPMorgan”), for itself and as Administrative Agent under the Charter Operating Credit Agreement, filed an adversary proceeding (the “JPMorgan Adversary Proceeding”) in Bankruptcy Court against Charter Operating and CCO Holdings seeking a declaration that there were events of default under the Charter Operating Credit Agreement. JPMorgan, as well as other parties, objected to the Plan. The Bankruptcy Court jointly held 19 days of trial in the JPMorgan Adversary Proceeding and on the objections to the Plan.
On November 17, 2009, the Bankruptcy Court issued its Order and Opinion confirming the Plan over the objections of JPMorgan and various other objectors. The Court also entered an order ruling in favor of Charter in the JPMorgan Adversary Proceeding. Several objectors attempted to stay the consummation of the Plan, but those motions were denied by the Bankruptcy Court and the U.S. District Court for the Southern District of New York. Charter consummated the Plan on November 30, 2009 and reinstated the Charter Operating Credit Agreement and certain other debt of its subsidiaries.
Six appeals were filed relating to confirmation of the Plan. The parties initially pursuing appeals were: (i) JPMorgan; (ii) Wilmington Trust Company (“Wilmington Trust”) (as indenture trustee for the holders of the 8% Senior Second Lien Notes due 2012 and 8.375% senior second lien notes due 2014 issued by and among Charter Operating and Charter Communications Operating Capital Corp. and the 10.875% senior second lien notes due 2014 issued by and among Charter Operating and Charter Communications Operating Capital Corp.); (iii) Wells Fargo Bank, N.A. (“Wells Fargo”) (in its capacities as successor Administrative Agent and successor Collateral Agent for the third lien prepetition secured lenders to CCO Holdings under the CCO Holdings credit facility); (iv) Law Debenture Trust Company of New York (“Law Debenture Trust”) (as the Trustee with respect to the $479 million in aggregate principal amount of 6.50% convertible senior notes due 2027 issued by Charter which are no longer outstanding following consummation of the Plan); (v) R2 Investments, LDC (“R2 Investments”) (an equity interest holder in Charter); and (vi) certain plaintiffs representing a putative class in a securities action against three former Charter officers or directors filed in the United States District Court for the Eastern District of Arkansas (Iron Workers Local No. 25 Pension Fund, Indiana Laborers Pension Fund, and Iron Workers District Council of Western New York and Vicinity Pension Fund, in the action styled
Iron Workers Local No. 25 Pension Fund v. Allen, et al.
, Case No. 4:09-cv-00405-JLH (E.D. Ark.).
Charter Operating amended its senior secured credit facilities effective March 31, 2010. In connection with the closing of these amendments, each of Bank of America, N.A. and JPMorgan, for itself and on behalf of the lenders under the Charter Operating senior secured credit facilities, agreed to dismiss the pending appeal of our Confirmation Order pending before the District Court for the Southern District of New York and to waive any objections to our Confirmation Order issued by the United States Bankruptcy Court for the Southern District of New York. The lenders filed their Stipulation of that dismissal and waiver of objections and it was signed by the judge on April 1, 2010 and the case dismissed. On December 3, 2009, Wilmington Trust withdrew its notice of appeal. On April 14, 2010, Wells Fargo filed their Stipulation of Dismissal of their appeal on behalf of the lenders under the CCO Holdings credit facility. This Stipulation was signed by the judge on April 19, 2010 and the case dismissed. The remaining appeals by Law Debenture Trust, R2 Investments and the securities plaintiffs have been briefed but have not been argued to, or ruled upon by the District Court for the Southern District of New York. We cannot predict the ultimate outcome of the appeals.
Other Proceedings
In March 2009, Gerald Paul Bodet, Jr. filed a putative class action against Charter and Charter Holdco (
Gerald Paul Bodet, Jr. v. Charter Communications, Inc. and Charter Communications Holding Company, LLC
) in the U.S. District Court for the Eastern District of Louisiana. In April 2010, plaintiff filed a Third Amended Complaint which also named Charter Communications, LLC as a defendant. In the Third Amended Complaint, plaintiff alleges that the defendants violated the Sherman Act, state antitrust law and state unjust enrichment law by forcing subscribers to rent a set top box in order to subscribe to cable video services which are not available to subscribers by simply plugging a cable into a cable-ready television. In June 2009, Derrick Lebryk and Nichols Gladson filed, but did not serve, a putative class action against Charter, Charter Communications Holding Company, LLC, CCHC, LLC and
29
Charter Communications Holding, LLC
(
Derrick Lebryk and Nicholas Gladson v. Charter Communications, Inc., Charter Communications Holding Company, LLC, CCHC, LLC and Charter Communications Holding, LLC)
in the U.S. District Court for the Southern District of Illinois. The plaintiffs allege that the defendants violated the Sherman Act based on similar allegations as those alleged in
Bodet v. Charter, et al.
We understand similar claims
have been made against other MSOs. The Charter defendants deny any liability and plan to vigorously contest these cases.
We are also aware of three suits filed by holders of securities issued by us or our subsidiaries.
Key Colony Fund, LP. v. Charter Communications, Inc. and Paul W. Allen
(sic), was filed in February 2009 in the Circuit Court of Pulaski County, Arkansas and asserts violations of the Arkansas Deceptive Trade Practices Act and fraud claims. Key Colony alleges that it purchased certain senior notes based on representations of Charter and agents and representatives of Paul Allen as part of a scheme to defraud certain Charter noteholders.
Clifford James Smith v. Charter Communications, Inc. and Paul Allen
, was filed in May 2009 in the United States District Court for the Central District of California. Mr. Smith alleges that he purchased Charter common stock based on statements by Charter and Mr. Allen and that Charter’s bankruptcy filing was not necessary. The defendants’ responded to that Complaint in February 2010 and filed a motion to dismiss thereafter. In April 2010, the court entered an order dismissing the Complaint, holding that Mr. Smith’s claims are expressly released by the Third Party Release and Injunction within Charter’s Plan of Reorganization. Mr. Smith has appealed.
Herb Lair, Iron Workers Local No. 25 Pension Fund et al. v. Neil Smit, Eloise Schmitz, and Paul G. Allen
(“
Iron Workers Local No. 25
”), was filed in the United States District Court for the Eastern District of Arkansas on June 1, 2009. Mr. Smit was the Chief Executive Officer and Ms. Schmitz was the Chief Financial Officer of Charter. The plaintiffs, who seek to represent a class of plaintiffs who acquired Charter stock between October 23, 2006 and February 12, 2009, allege that they and others similarly situated were misled by statements by Ms. Schmitz, Mr. Smit, Mr. Allen and/or in Charter SEC filings. The plaintiffs assert violations of the Securities Exchange Act of 1934. In February 2010, the United States Bankruptcy Court for the Southern District of New York held that these plaintiffs’ causes of action were released by the Third Party Release and Injunction within Charter’s Plan of Reorganization. Plaintiffs thereafter filed an appeal with the United States District Court for the Southern District of New York. Charter denies the allegations made by the plaintiffs in these matters, believes all of the claims asserted in these cases were released through the Plan and intends to seek dismissal of these cases and otherwise vigorously contest these cases.
We also are party to other lawsuits and claims that arise in the ordinary course of conducting our business. The ultimate outcome of these other legal matters pending against us or our subsidiaries cannot be predicted, and although such lawsuits and claims are not expected individually to have a material adverse effect on our consolidated financial condition, results of operations, or liquidity, such lawsuits could have in the aggregate a material adverse effect on our consolidated financial condition, results of operations, or liquidity. Whether or not we ultimately prevail in any particular lawsuit or claim, litigation can be time consuming and costly and injure our reputation.
30
(A) Market Information
Charter’s Class A common stock is listed on the NASDAQ Global Select Market under the symbol “CHTR.”
Prior to April 6, 2009, Predecessor common stock traded on the NASDAQ Global Select Market. From April 7, 2009 through the Effective Date, shares of common stock of Predecessor traded on the OTC Bulletin Board or in the “Pink Sheets.” On the Effective Date, all of the outstanding common stock and all other outstanding equity securities of Predecessor were cancelled pursuant to the terms of the Plan. The Successor’s common stock was quoted on the OTC Bulletin Board from the Effective Date until the stock was listed on the NASDAQ Global Select Market on September 14, 2010.
The following table sets forth, for the periods indicated, the range of high and low last reported sale price per share of Predecessor’s Class A common stock through April 6, 2009, and from April 7 through November 30, 2009, the range of high and low last reported bid price per share, and Charter’s Class A common stock after its emergence from bankruptcy from December 1, 2009 to September 13, 2010 on the OTC Bulletin Board or in the “Pink Sheets,” and from September 14, 2010 to December 31, 2010 on the NASDAQ Global Select Market. There was no established trading market for Charter’s Class B common stock prior to its conversion on January 18, 2011.
Class A Common Stock
|
High
|
Low
|
|||||||
|
Predecessor
|
||||||||
|
2009
|
||||||||
|
First quarter
|
$ | 0.22 | $ | 0.02 | ||||
|
Second quarter
|
$ | 0.05 | $ | 0.02 | ||||
|
Third quarter
|
$ | 0.04 | $ | 0.01 | ||||
|
Fourth quarter (through November 30, 2009)
|
$ | 0.03 | $ | 0.01 | ||||
|
Successor
|
||||||||
|
2009
|
||||||||
|
Fourth quarter (December 1, 2009 to December 31, 2009)
|
$ | 36.50 | $ | 33.00 | ||||
|
2010
|
||||||||
|
First quarter
|
$ | 35.00 | $ | 29.50 | ||||
|
Second quarter
|
$ | 39.75 | $ | 33.75 | ||||
|
Third quarter
|
$ | 36.50 | $ | 32.50 | ||||
|
Fourth quarter
|
$ | 38.94 | $ | 32.00 | ||||
(B) Holders
As of January 31, 2011, there were approximately 1,356 holders of record of Charter’s Class A common stock.
(C) Dividends
Predecessor and Charter have not paid stock or cash dividends on any of its common stock.
Charter would be dependent on distributions from Charter Holdco if Charter were to make any dividends. Charter Holdco may make pro rata distributions to all holders of its common membership units, including Charter. Covenants in the indentures and credit agreements governing the debt obligations of CCH II, LLC (“CCH II”) and its subsidiaries restrict their ability to make distributions to us, and accordingly, limit our ability to declare or pay cash dividends. See “Item 7. Management’s Discussion and Analysis of Financial Condition and Results of Operations.” Future cash dividends, if any, will be at the discretion of Charter’s board of directors and will depend upon, among other things, our future operations and earnings, capital requirements, general financial condition, contractual restrictions and such other factors as Charter’s board of directors may deem relevant.
31
(D) Securities Authorized for Issuance Under Equity Compensation Plans
All shares issued or granted by Predecessor and not yet vested were cancelled on November 30, 2009 along with the 2001 Stock Incentive Plan. The 2009 Stock Incentive Plan was adopted by Charter’s board of directors.
The following information is provided as of December 31, 2010 with respect to equity compensation plans:
|
Number of Securities
|
Number of Securities
|
|||||||
|
to be Issued Upon
|
Weighted Average
|
Remaining Available
|
||||||
|
Exercise of Outstanding
|
Exercise Price of
|
for Future Issuance
|
||||||
|
Options, Warrants
|
Outstanding Options,
|
Under Equity
|
||||||
|
Plan Category
|
and Rights
|
Warrants and Rights
|
Compensation Plans
|
|||||
|
Equity compensation plans approved
by security holders
|
13,797,026
|
|
$ 36.90
|
4,817,818
|
||||
|
Equity compensation plans not
approved by security holders
|
--
|
(1)
|
$ --
|
-- (1)
|
||||
|
TOTAL
|
13,797,026
|
(1)
|
$ 36.90
|
4,817,818(1)
|
||||
|
(1)
|
This total does not include 1,081,108 shares issued pursuant to restricted stock grants made under our 2009 Stock Incentive Plan, which are subject to vesting based on continued employment.
|
For information regarding securities issued under our equity compensation plans, see Note 17 to our accompanying consolidated financial statements contained in “Item 8. Financial Statements and Supplementary Data.”
(E) Performance Graph
The graph below shows the cumulative total return on Charter’s Class A common stock for the period from December 2, 2009 through December 31, 2010, in comparison to the cumulative total return on Standard & Poor’s 500 Index and a peer group consisting of the national cable operators that are most comparable to us in terms of size and nature of operations. The Company’s peer group consists of Cablevision Systems Corporation, Comcast Corporation, Mediacom Communications Corp., and Time Warner Cable, Inc. The results shown assume that $100 was invested on December 2, 2009 in Charter and peer group stock or on November 30, 2009 for the S&P 500 index and that all dividends were reinvested. These indices are included for comparative purposes only and do not reflect whether it is management’s opinion that such indices are an appropriate measure of the relative performance of the stock involved, nor are they intended to forecast or be indicative of future performance of Charter’s Class A common stock.
32
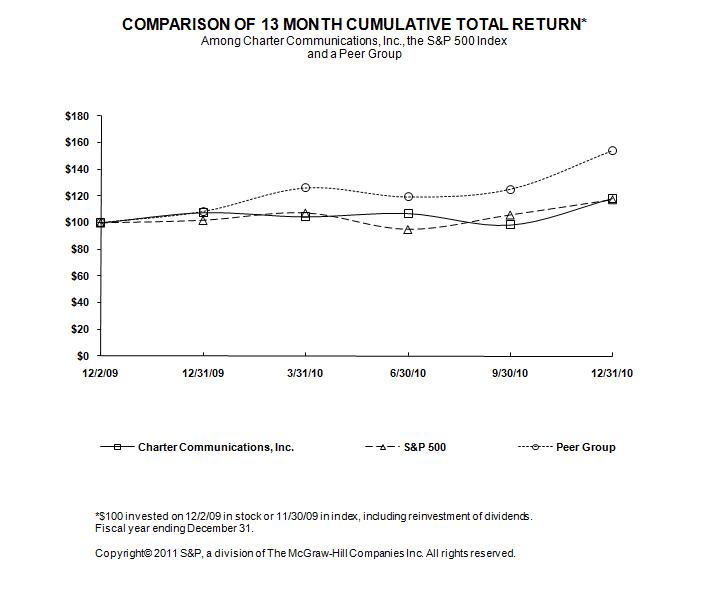
(F) Recent Sales of Unregistered Securities
During 2010, there were no unregistered sales of securities of the registrant other than those previously reported on a Quarterly Report on Form 10-Q or Current Report on Form 8-K.
|
Period
|
(a)
Total Number of Shares Purchased
|
(b)
Average Price Paid per Share
|
(c)
Total Number of Shares Purchased as Part of Publicly Announced Plans or Programs
|
(d)
Maximum Number of Shares that May Yet Be Purchased Under the Plans or Programs
|
|
October 1-31, 2010
|
0
|
0
|
N/A
|
N/A
|
|
November 1-30, 2010
|
176,475 (1)
|
$33.68
|
N/A
|
N/A
|
|
December 1-31, 2010
|
0
|
0
|
N/A
|
N/A
|
(1) On November 30, 2010, 527,468 restricted shares of Charter’s Class A common stock, which had been granted in 2009 to employees under Charter’s 2009 Stock Incentive Plan, vested. The grantees of the shares were given the option of having Charter withhold an amount of shares sufficient to cover the taxes due by the grantees upon the vesting of the shares. As a result, Charter withheld 176,475 restricted shares, valued at $33.68, the average of the high and low share price on November 30, 2010 on the NASDAQ Global Select Market, to cover the taxes of the participants. We do not have a publicly announced plan or program to purchase shares of Charter’s Class A common stock.
33
The following table presents selected consolidated financial data for the periods indicated (dollars in millions, except share data):
|
Successor
|
Predecessor
|
|||||||||||||||||||||||
|
Year Ended
|
One Month Ended
|
Eleven Months Ended
|
||||||||||||||||||||||
|
December 31,
|
December 31,
|
November 30,
|
For the Years Ended December 31,
|
|||||||||||||||||||||
|
2010
|
2009
|
2009
|
2008 (a)
|
2007 (a)
|
2006 (a)
|
|||||||||||||||||||
|
Statement of Operations Data:
|
||||||||||||||||||||||||
|
Revenues
|
$ | 7,059 | $ | 572 | $ | 6,183 | $ | 6,479 | $ | 6,002 | $ | 5,504 | ||||||||||||
|
Operating income (loss) from
continuing operations
|
$ | 1,024 | $ | 84 | $ | (1,063 | ) | $ | (614 | ) | $ | 548 | $ | 367 | ||||||||||
|
Interest expense, net
|
$ | (877 | ) | $ | (68 | ) | $ | (1,020 | ) | $ | (1,905 | ) | $ | (1,861 | ) | $ | (1,901 | ) | ||||||
|
Income (loss) from continuing
operations before income taxes
|
$ | 58 | $ | 10 | $ | 9,748 | $ | (2,550 | ) | $ | (1,318 | ) | $ | (1,479 | ) | |||||||||
|
Net income (loss) – Charter shareholders
|
$ | (237 | ) | $ | 2 | $ | 11,364 | $ | (2,451 | ) | $ | (1,534 | ) | $ | (1,454 | ) | ||||||||
|
Basic earnings (loss) from continuing
operations per common share
|
$ | (2.09 | ) | $ | 0.02 | $ | 30.00 | $ | (6.56 | ) | $ | (4.17 | ) | $ | (5.03 | ) | ||||||||
|
Diluted earnings (loss) from continuing
operations per common share
|
$ | (2.09 | ) | $ | 0.02 | $ | 12.61 | $ | (6.56 | ) | $ | (4.17 | ) | $ | (5.03 | ) | ||||||||
|
Basic earnings (loss) per common share
|
$ | (2.09 | ) | $ | 0.02 | $ | 30.00 | $ | (6.56 | ) | $ | (4.17 | ) | $ | (4.38 | ) | ||||||||
|
Diluted earnings (loss) per common
share
|
$ | (2.09 | ) | $ | 0.02 | $ | 12.61 | $ | (6.56 | ) | $ | (4.17 | ) | $ | (4.38 | ) | ||||||||
|
Weighted-average shares outstanding,
basic
|
113,138,461 | 112,078,089 | 378,784,231 | 373,464,920 | 368,240,608 | 331,941,788 | ||||||||||||||||||
|
Weighted-average shares outstanding,
diluted
|
113,138,461 | 114,346,861 | 902,067,116 | 373,464,920 | 368,240,608 | 331,941,788 | ||||||||||||||||||
|
Balance Sheet Data (end of period):
|
||||||||||||||||||||||||
|
Investment in cable properties
|
$ | 15,027 | $ | 15,391 | $ | 12,448 | $ | 14,123 | $ | 14,505 | ||||||||||||||
|
Total assets
|
$ | 15,707 | $ | 16,658 | $ | 13,882 | $ | 14,666 | $ | 15,100 | ||||||||||||||
|
Total debt (including debt subject to
compromise)
|
$ | 12,306 | $ | 13,322 | $ | 21,666 | $ | 19,903 | $ | 18,962 | ||||||||||||||
|
Note payable – related party
|
$ | -- | $ | -- | $ | 75 | $ | 65 | $ | 57 | ||||||||||||||
|
Temporary equity (b)
|
$ | -- | $ | -- | $ | 241 | $ | 215 | $ | 198 | ||||||||||||||
|
Noncontrolling interest (c)
|
$ | -- | $ | 2 | $ | -- | $ | -- | $ | -- | ||||||||||||||
|
Charter shareholders’ equity (deficit)
|
$ | 1,478 | $ | 1,916 | $ | (10,506 | ) | $ | (7,887 | ) | $ | (6,119 | ) | |||||||||||
|
Other Financial Data:
|
||||||||||||||||||||||||
|
Ratio of earnings to fixed charges (d)
|
1.07 | 1.14 | 8.41 | N/A | N/A | N/A | ||||||||||||||||||
|
Deficiency of earnings to cover fixed
Charges (d)
|
N/A | N/A | N/A | $ | 2,550 | $ | 1,318 | $ | 1,241 | |||||||||||||||
|
(a)
|
Years ended December 31, 2008, 2007 and 2006 have been restated to reflect the retrospective application of accounting guidance for convertible debt with cash settlement features.
|
|
(b)
|
Prior to November 30, 2009, temporary equity represented nonvested shares of restricted stock and performance shares issued to employees and Mr. Allen’s previous 5.6% preferred membership interests in our indirect subsidiary, CC VIII. Mr. Allen’s CC VIII interest was classified as temporary equity as a result of Mr. Allen’s previous ability to put his interest to the Company upon a change in control. Mr. Allen has subsequently transferred his CC VIII interest to Charter pursuant to the Plan.
|
|
(c)
|
Noncontrolling interest, as of December 31, 2009, represents the fair value of Mr. Allen’s previous 0.19% interest of Charter Holdco on the Effective Date plus the allocation of income for the month ended December 31, 2009. On February 8, 2010, Mr. Allen exercised his remaining right to exchange Charter Holdco units for shares of Charter Class A common stock after which Charter Holdco became 100% owned by Charter.
|
|
(d)
|
Earnings include income (loss) before noncontrolling interest and income taxes plus fixed charges. Fixed charges consist of interest expense and an estimated interest component of rent expense.
|
34
Comparability of the above information from year to year is affected by acquisitions and dispositions completed by us. In addition, upon our emergence from bankruptcy, we adopted fresh start accounting. This resulted in us becoming a new entity on December 1, 2009, with a new capital structure, a new accounting basis in the identifiable assets and liabilities assumed and no retained earnings or accumulated losses. Accordingly, the consolidated financial statements on or after December 1, 2009 are not comparable to the consolidated financial statements prior to that date. The financial statements for the periods ended prior to November 30, 2009 do not include the effect of any changes in our capital structure or changes in the fair value of assets and liabilities as a result of fresh start accounting.
Reference is made to “Part I. Item 1A. Risk Factors” and “Cautionary Statement Regarding Forward-Looking Statements,” which describe important factors that could cause actual results to differ from expectations and non-historical information contained herein. In addition, the following discussion should be read in conjunction with the audited consolidated financial statements and accompanying notes thereto of Charter Communications, Inc. and subsidiaries included in “Item 8. Financial Statements and Supplementary Data.”
Upon our emergence from bankruptcy on November 30, 2009, we adopted fresh start accounting. In accordance with accounting principles generally accepted in the United States (“GAAP”), the accompanying consolidated statements of operations and cash flows contained in “Item 8. Financial Statements and Supplementary Data” present the results of operations and the sources and uses of cash for (i) the eleven months ended November 30, 2009 of the Predecessor and (ii) the one month ended December 31, 2009 of the Successor. However, for purposes of management’s discussion and analysis of the results of operations and the sources and uses of cash in this Form 10-K, we have combined the results of operations for the Predecessor and the Successor for 2009. The results of operations of the Predecessor and Successor are not comparable due to the change in basis resulting from the emergence from bankruptcy. This combined presentation is being made solely to explain the changes in results of operations for the periods presented in the financial statements. We also compare the combined results of operations and the sources and uses of cash for the twelve months ended December 31, 2009 with the corresponding periods in 2010 and 2008.
We believe the combined results of operations for the twelve months ended December 31, 2009 provide management and investors with a more meaningful perspective on our ongoing financial and operational performance and trends than if we did not combine the results of operations of the Predecessor and the Successor in this manner.
Overview
We are a cable operator providing services in the United States with approximately 5.1 million customers at December 31, 2010. We offer our customers video services, high-speed Internet access, and telephone services, as well as advanced video services (such as OnDemand, high definition television service and DVR). We also provide advertising and backhaul services. See "Part I. Item 1. Business
— Products and Services
"
for further description of these services, including
"
customers.
"
For the years ended December 31, 2010, 2009 and 2008, adjusted earnings (loss) before interest expense, income taxes, depreciation and amortization (“Adjusted EBITDA”) was $2.6 billion, $2.5 billion, and $2.3 billion, respectively. See “—Use of Adjusted EBITDA and Free Cash Flow” for further information on Adjusted EBITDA and free cash flow. Adjusted EBITDA increased as a result of continued growth in high-speed Internet and telephone customers combined with growth in our commercial services and advertising sales businesses. For the years ended December 31, 2010, our income from operations was $1.0 billion and for the years ended 2009 and 2008, our loss from operations was $979 million and $614 million, respectively. Our income from operations for the year ended December 31, 2010 compared to the loss from operations for the years ended December 31, 2009 and 2008 is primarily due to impairment of franchises incurred during 2009 and 2008 that did not recur in 2010.
We believe that
continued competition and
the weakened economic conditions in the United States, including the housing market and relatively high unemployment levels, have adversely affected consumer demand for our services. In addition, we believe these factors have contributed to an increase in the number of homes that replace their traditional telephone service with wireless service thereby impacting the growth of our telephone business. These conditions have affected our net customer additions and revenue growth during 2009 and 2010, especially with our basic video customers,
and contributed to the franchise impairment charge incurred in 2009
. In 2009 and
35
2010, we experienced a reduction in total customers of approximately 112,300 and 129,000, respectively. If these conditions do not improve, we believe the growth of our business and results of operations will be further adversely affected which may contribute to future impairments of our franchises and goodwill.
Our most significant competitors are DBS providers and certain telephone companies that offer services that provide features and functions similar to our video, high-speed Internet, and telephone services, including in some cases wireless services and they also offer these services in bundles similar to ours. See “Business — Competition.” In the recent past, we have grown revenues by offsetting basic video customer losses with price increases and sales of incremental services such as high-speed Internet, OnDemand, DVR, high definition television, and telephone. We expect to continue to grow revenues in this manner and in addition, we expect to increase revenues by expanding the sales of our services to our commercial customers. However, we cannot assure you that we will be able to grow revenues at recent historical rates. Our business plans include goals for increasing the number of customers which contribute to recurring revenue and the opportunity to sell additional services to existing customers. In 2011, we may continue to experience challenges in increasing, or we may continue to lose, customers.
Approximately 87% and 84% of our revenues for the years ended December 31, 2010 and 2009, respectively, are attributable to monthly subscription fees charged to customers for our video, high-speed Internet, telephone, and commercial services provided by our cable systems. Generally, these customer subscriptions may be discontinued by the customer at any time. The remaining 13% and 16% of revenue for fiscal years 2010 and 2009, respectively, is derived primarily from advertising revenues, franchise fee revenues (which are collected by us but then paid to local franchising authorities), pay-per-view and OnDemand programming, installation or reconnection fees charged to customers to commence or reinstate service, and commissions related to the sale of merchandise by home shopping services.
Our expenses primarily consist of operating costs, selling, general and administrative expenses, depreciation and amortization expense, impairment of franchise intangibles and interest expense. Operating costs primarily include programming costs, the cost of our workforce, cable service related expenses, advertising sales costs and franchise fees. Selling, general and administrative expenses primarily include salaries and benefits, rent expense, billing costs, call center costs, internal network costs, bad debt expense, and property taxes. We control our costs of operations by maintaining strict controls on expenditures. More specifically, we are focused on managing our cost structure by improving workforce productivity, and leveraging our scale, and increasing the effectiveness of our purchasing activities.
We have a history of net losses. Our net losses are principally attributable to insufficient revenue to cover the combination of operating expenses, interest expenses that we incur because of our debt, depreciation expenses resulting from the capital investments we have made and continue to make in our cable properties, and in 2010, amortization expenses resulting from the application of fresh start accounting. The Plan resulted in the reduction of the principal amount of our debt by approximately $8 billion, reducing our interest expense by approximately $830 million annually.
In prior years and continuing through 2010, we sold several cable systems to divest geographically non-strategic assets and allow for more efficient operations. In 2008, 2009, and 2010, we closed the sale of certain cable systems representing a total of approximately 14,100, 12,400 and 76,700 basic video customers, respectively. As a result of these sales we have improved our geographic footprint by reducing our number of headends, increasing the number of customers per headend, and reducing the number of states in which the majority of our customers reside.
Critical Accounting Policies and Estimates
Certain of our accounting policies require our management to make difficult, subjective or complex judgments. Management has discussed these policies with the Audit Committee of Charter’s board of directors, and the Audit Committee has reviewed the following disclosure. We consider the following policies to be the most critical in understanding the estimates, assumptions and judgments that are involved in preparing our financial statements, and the uncertainties that could affect our results of operations, financial condition and cash flows:
|
·
|
Property, plant and equipment
|
|
·
|
Capitalization of labor and overhead costs
|
|
·
|
Impairment
|
|
·
|
Useful lives of property, plant and equipment
|
36
|
·
|
Intangible assets
|
|
·
|
Impairment of franchises
|
|
·
|
Impairment and amortization of customer relationships
|
|
·
|
Impairment of goodwill
|
|
·
|
Impairment of trademarks
|
|
·
|
Income taxes
|
|
·
|
Litigation
|
|
·
|
Programming agreements
|
In addition, there are other items within our financial statements that require estimates or judgment that are not deemed critical, such as the allowance for doubtful accounts and valuations of our derivative instruments, if any, but changes in estimates or judgment in these other items could also have a material impact on our financial statements.
Property, plant and equipment
The cable industry is capital intensive, and a large portion of our resources are spent on capital activities associated with extending, rebuilding, and upgrading our cable network. As of December 31, 2010 and 2009, the net carrying amount of our property, plant and equipment (consisting primarily of cable network assets) was approximately $6.8 billion (representing 43% of total assets) and $6.8 billion (representing 41% of total assets), respectively. Total capital expenditures for the years ended December 31, 2010, 2009, and 2008 were approximately $1.2 billion, $1.1 billion, and $1.2 billion, respectively.
Effective December 1, 2009, we applied fresh start accounting resulting in an approximately $2.0 billion increase to total property, plant and equipment. The cost approach was the primary method used to establish fair value for our property, plant and equipment in connection with the application of fresh start accounting. The cost approach considers the amount required to replace an asset by constructing or purchasing a new asset with similar utility, then adjusts the value in consideration of all forms of depreciation as of the appraisal date.
Capitalization of labor and overhead costs.
Costs associated with network construction, initial customer installations (including initial installations of new or additional advanced video services), installation refurbishments, and the addition of network equipment necessary to provide new or advanced video services, are capitalized. While our capitalization is based on specific activities, once capitalized, we track these costs by fixed asset category at the cable system level, and not on a specific asset basis. For assets that are sold or retired, we remove the estimated applicable cost and accumulated depreciation. Costs capitalized as part of initial customer installations include materials, direct labor, and certain indirect costs. These indirect costs are associated with the activities of personnel who assist in connecting and activating the new service, and consist of compensation and overhead costs associated with these support functions. The costs of disconnecting service at a customer’s dwelling or reconnecting service to a previously installed dwelling are charged to operating expense in the period incurred. As our service offerings mature and our reconnect activity increases, our capitalizable installations will continue to decrease and therefore our operating expenses will increase. Costs for repairs and maintenance are charged to operating expense as incurred, while equipment replacement, including replacement of certain components, and betterments, including replacement of cable drops from the pole to the dwelling, are capitalized.
We make judgments regarding the installation and construction activities to be capitalized. We capitalize direct labor and overhead using standards developed from actual costs and applicable operational data. We calculate standards annually (or more frequently if circumstances dictate) for items such as the labor rates, overhead rates, and the actual amount of time required to perform a capitalizable activity. For example, the standard amounts of time required to perform capitalizable activities are based on studies of the time required to perform such activities. Overhead rates are established based on an analysis of the nature of costs incurred in support of capitalizable activities, and a determination of the portion of costs that is directly attributable to capitalizable activities. The impact of changes that resulted from these studies were not material in the periods presented.
Labor costs directly associated with capital projects are capitalized. Capitalizable activities performed in connection with customer installations include such activities as:
|
·
|
Dispatching a “truck roll” to the customer’s dwelling for service connection;
|
|
·
|
Verification of serviceability to the customer’s dwelling (i.e., determining whether the customer’s dwelling is capable of receiving service by our cable network and/or receiving advanced or Internet services);
|
37
|
·
|
Customer premise activities performed by in-house field technicians and third-party contractors in connection with customer installations, installation of network equipment in connection with the installation of expanded services, and equipment replacement and betterment; and
|
|
·
|
Verifying the integrity of the customer’s network connection by initiating test signals downstream from the headend to the customer’s digital set-top box.
|
Judgment is required to determine the extent to which overhead costs incurred result from specific capital activities, and therefore should be capitalized. The primary costs that are included in the determination of the overhead rate are (i) employee benefits and payroll taxes associated with capitalized direct labor, (ii) direct variable costs associated with capitalizable activities, consisting primarily of installation and construction vehicle costs, (iii) the cost of support personnel, such as dispatchers, who directly assist with capitalizable installation activities, and (iv) indirect costs directly attributable to capitalizable activities.
While we believe our existing capitalization policies are appropriate, a significant change in the nature or extent of our system activities could affect management’s judgment about the extent to which we should capitalize direct labor or overhead in the future. We monitor the appropriateness of our capitalization policies, and perform updates to our internal studies on an ongoing basis to determine whether facts or circumstances warrant a change to our capitalization policies. We capitalized internal direct labor and overhead of $205 million, $199 million and $199 million, respectively, for the years ended December 31, 2010, 2009, and 2008.
Impairment.
We evaluate the recoverability of our property, plant and equipment upon the occurrence of events or changes in circumstances indicating that the carrying amount of an asset may not be recoverable. Such events or changes in circumstances could include such factors as the impairment of our indefinite life franchises, changes in technological advances, fluctuations in the fair value of such assets, adverse changes in relationships with local franchise authorities, adverse changes in market conditions, or a deterioration of current or expected future operating results. A long-lived asset is deemed impaired when the carrying amount of the asset exceeds the projected undiscounted future cash flows associated with the asset. No impairments of long-lived assets to be held and used were recorded in the years ended December 31, 2010, 2009, and 2008.
Useful lives of property, plant and equipment.
We evaluate the appropriateness of estimated useful lives assigned to our property, plant and equipment, based on annual analyses of such useful lives, and revise such lives to the extent warranted by changing facts and circumstances. Any changes in estimated useful lives as a result of these analyses are reflected prospectively beginning in the period in which the study is completed. Our analysis of useful lives in 2010 did not indicate a change in useful lives. The effect of a one-year decrease in the weighted average remaining useful life of our property, plant and equipment as of December 31, 2010 would be an increase in annual depreciation expense of approximately $225 million. The effect of a one-year increase in the weighted average remaining useful life of our property, plant and equipment as of December 31, 2010 would be a decrease in annual depreciation expense of approximately $208 million.
Depreciation expense related to property, plant and equipment totaled $1.2 billion for the year ended December 31, 2010 and $1.3 billion for each of the years ended December 31, 2009 and 2008, representing approximately 20%, 17% and 18% of costs and expenses, respectively. Depreciation is recorded using the straight-line composite method over management’s estimate of the useful lives of the related assets as listed below:
|
Cable distribution systems
|
7-20 years
|
|
Customer equipment and installations
|
4-8 years
|
|
Vehicles and equipment
|
1-6 years
|
|
Buildings and leasehold improvements
|
15-40 years
|
|
Furniture, fixtures and equipment
|
6-10 years
|
Intangible assets
In connection with the application of fresh start accounting, franchises and customer relationships were valued using an income approach and were valued at $5.3 billion and $2.4 billion, respectively, as of December 1, 2009. The relief from royalty method was used to value trademarks at $158 million as of December 1, 2009. The fresh start adjustments also resulted in the recording of goodwill of $951 million. See discussion below for a description of the methods used to value intangible assets.
38
Impairment of franchises.
The net carrying value of franchises as of December 31, 2010 and 2009 was approximately $5.3 billion (representing 33% of total assets) and $5.3 billion (representing 32% of total assets), respectively. Franchise rights represent the value attributed to agreements or authorizations with local and state authorities that allow access to homes in cable service areas. For valuation purposes, they are defined as the future economic benefits of the right to solicit and service potential customers (customer marketing rights), and the right to deploy and market new services, such as Internet and telephone, to potential customers (service marketing rights).
Franchise intangible assets that meet specified indefinite life criteria must be tested for impairment annually, or more frequently as warranted by events or changes in circumstances. In determining whether our franchises have an indefinite life, we considered the likelihood of franchise renewals, the expected costs of franchise renewals, and the technological state of the associated cable systems, with a view to whether or not we are in compliance with any technology upgrading requirements specified in a franchise agreement. We have concluded that as of December 31, 2010 and 2009 all of our franchises qualify for indefinite life treatment.
The fair value of franchises for impairment testing is determined based on estimated discrete discounted future cash flows using assumptions consistent with internal forecasts. The franchise after-tax cash flow is calculated as the after-tax cash flow generated by the potential customers obtained (less the anticipated customer churn), and the new services added to those customers in future periods. The sum of the present value of the franchises' after-tax cash flow in years 1 through 10 and the continuing value of the after-tax cash flow beyond year 10 yields the fair value of the franchises. Franchises are expected to generate cash flows indefinitely and are tested for impairment annually, or more frequently as warranted by events or changes in circumstances. Franchises are aggregated into essentially inseparable units of accounting to conduct the valuations. The units of accounting generally represent geographical clustering of our cable systems into groups by which such systems are managed. Management believes such grouping represents the highest and best use of those assets.
We determined the estimated fair value of each unit of accounting utilizing an income approach model based on the present value of the estimated discrete future cash flows attributable to each of the intangible assets identified for each unit assuming a discount rate. This approach makes use of unobservable factors such as projected revenues, expenses, capital expenditures, and a discount rate applied to the estimated cash flows. The determination of the discount rate was based on a weighted average cost of capital approach, which uses a market participant’s cost of equity and after-tax cost of debt and reflects the risks inherent in the cash flows.
We estimated discounted future cash flows using reasonable and appropriate assumptions including among others, penetration rates for basic and digital video, high-speed Internet, and telephone; revenue growth rates; operating margins; and capital expenditures. The assumptions are derived based on Charter’s and its peers’ historical operating performance adjusted for current and expected competitive and economic factors surrounding the cable industry. The estimates and assumptions made in our valuations are inherently subject to significant uncertainties, many of which are beyond our control, and there is no assurance that these results can be achieved. The primary assumptions for which there is a reasonable possibility of the occurrence of a variation that would significantly affect the measurement value include the assumptions regarding revenue growth, programming expense growth rates, the amount and timing of capital expenditures and the discount rate utilized.
The franchise valuation completed for the year ended December 31, 2010 showed franchise values in excess of book values and thus resulted in no impairment. We recorded non-cash franchise impairment charges of $2.2 billion and $1.5 billion for the years ended December 31, 2009 and 2008, respectively. The impairment charges recorded in 2009 and 2008 were primarily the result of the impact of the economic downturn along with increased competition. The valuations used in our impairment assessments involve numerous assumptions as noted above. While economic conditions applicable at the time of the valuations indicate the combination of assumptions utilized in the valuations are reasonable, as market conditions change so will the assumptions, with a resulting impact on the valuations and consequently the potential impairment charge. At December 31, 2010, a 20% decline in the estimated fair value of our franchise assets in each of our units of accounting would have resulted in an aggregate impairment charge of approximately $49 million in three of our units of accounting. Management has no reason to believe that any one unit of accounting is more likely than any other to incur impairments of its intangible assets.
Impairment and amortization of customer relationships.
The net carrying value of customer relationships as of December 31, 2010 and 2009 was approximately $2.0 billion (representing 13% of total assets) and $2.3 billion (representing 14% of total assets), respectively. Customer relationships, for valuation purposes, represent the value of the business relationship with existing customers (less the anticipated customer churn), and are calculated by projecting the discrete future after-tax cash flows from these customers, including the right to deploy and market additional services to these customers. The present value of these after-tax cash flows yields the fair value of the
39
customer relationships. The use of different valuation assumptions or definitions of franchises or customer relationships, such as our inclusion of the value of selling additional services to our current customers within customer relationships versus franchises, could significantly impact our valuations and any resulting impairment.
We evaluate the recoverability of customer relationships upon the occurrence of events or changes in circumstances indicating that the carrying amount of an asset may not be recoverable. Customer relationships are deemed impaired when the carrying value exceeds the projected undiscounted future cash flows associated with the customer relationships. No impairment of customer relationships was recorded in the years ended December 31, 2010, 2009 or 2008.
Customer relationships are amortized on an accelerated method over useful lives of 11-15 years based on the period over which current customers are expected to generate cash flows. Amortization expense related to customer relationships for the years ended December 31, 2010, 2009, and 2008 was approximately $331 million, $29 million, and $1 million, respectively.
Impairment of goodwill.
The net carrying value of goodwill as of December 31, 2010 and 2009 was approximately $951 million (representing 6% of total assets). Goodwill was recorded in 2009 as the excess of reorganization value on the Effective Date over amounts assigned to the other assets.
Goodwill is tested for impairment as of November 30 of each year, or more frequently as warranted by events or changes in circumstances. The first step involves a comparison of the estimated fair value of each of our reporting units to its carrying amount. If the estimated fair value of a reporting unit exceeds its carrying amount, goodwill of the reporting unit is not considered impaired and the second step of the goodwill impairment is not necessary. If the carrying amount of a reporting unit exceeds its estimated fair value, then the second step of the goodwill impairment test must be performed, and a comparison of the implied fair value of the reporting unit’s goodwill is compared to its carrying amount to determine the amount of impairment, if any. Reporting units are consistent with the units of accounting used for franchise impairment testing. Likewise the fair values of the reporting units are determined using a consistent income approach model as that used for franchise impairment testing. Our 2010, 2009, and 2008 impairment analyses did not result in any goodwill impairment charges. At December 31, 2010 a 10% decline in the fair value of each of our reporting units would have resulted in $5 million of impairment in one reporting unit and a 20% decline would have resulted in $29 million of aggregate impairment in two of our reporting units.
Impairment of trademarks.
The net carrying value of trademarks as of December 31, 2010 and 2009 was approximately $158 million (representing 1% of total assets). Trademarks are tested annually for impairment, or more frequently as warranted by events or changes in circumstances. The fair value of trademarks is determined using the relief-from-royalty method which applies a fair royalty rate to estimated revenue. Royalty rates are estimated based on a review of market royalty rates in the communications and entertainment industries. As we expect to continue to use each trade name indefinitely, trademarks have been assigned an indefinite life and are tested annually for impairment. The valuation in 2010 showed trademark values in excess of book value, and thus resulted in no impairment.
Income taxes
All of Charter’s operations are held through Charter Holdco and its direct and indirect subsidiaries. Charter Holdco and the majority of its subsidiaries are generally limited liability companies that are not subject to income tax. However, certain of these limited liability companies are subject to state income tax. In addition, the indirect subsidiaries that are corporations are subject to federal and state income tax. All of the remaining taxable income, gains, losses, deductions and credits of Charter Holdco pass through to Charter.
In connection with the Plan, Charter, CII, Mr. Allen and Charter Holdco entered into an exchange agreement (the “Exchange Agreement”), pursuant to which CII had the right to require Charter to (i) exchange all or a portion of CII’s membership interest in Charter Holdco or 100% of CII for $1,000 in cash and shares of Charter’s Class A common stock in a taxable transaction, or (ii) merge CII with and into Charter, or a wholly-owned subsidiary of Charter, in a tax-free transaction (or undertake a tax-free transaction similar to the taxable transaction in subclause (i)), subject to CII meeting certain conditions. In addition, Charter had the right, under certain circumstances involving a change of control of Charter to require CII to effect an exchange transaction of the type elected by CII from subclauses (i) or (ii) above, which election is subject to certain limitations.
40
On December 28, 2009, CII exercised its right, under the Exchange Agreement with Charter, to exchange 81% of its common membership interest in Charter Holdco for $1,000 in cash and 907,698 shares of Charter’s Class A common stock in a fully taxable transaction. As a result of this transaction, Charter’s deferred tax liability increased by $100 million. Charter also received a step-up in tax basis in Charter Holdco’s assets, under section 743 of the Code, relative to the interest in Charter Holdco it acquired from CII. Based upon the taxable exchange which occurred on December 28, 2009, CII fulfilled the conditions necessary to allow it to elect a tax-free transaction at any time during the remaining term of the Exchange Agreement. On February 8, 2010, the remaining interest was exchanged after which Charter Holdco became 100% owned by Charter. As a result, during 2010, Charter’s deferred tax liabilities were increased by approximately $99 million. The $99 million is the result of an overall increase in the gross deferred tax liability of $221 million and a corresponding reduction of valuation allowance of $122 million. The combined net effects of this transaction were recorded in the financial statements as a $168 million reduction of additional paid-in capital and a $69 million reduction of income tax expense for the year ended December 31, 2010.
As of December 31, 2010, Charter and its indirect corporate subsidiaries had approximately $6.9 billion of federal tax net operating and capital loss carryforwards, resulting in a gross deferred tax asset of approximately $2.4 billion, expiring in the years 2014 through 2030. These losses arose from the operations of Charter Holdco and its subsidiaries. In addition, as of December 31, 2010, Charter and its indirect corporate subsidiaries had state tax net operating and capital loss carryforwards, resulting in a gross deferred tax asset (net of federal tax benefit) of approximately $228 million, generally expiring in years 2011 through 2030. Due to uncertainties in projected future taxable income, valuation allowances have been established against the gross deferred tax assets for book accounting purposes, except for future taxable income that will result from the reversal of existing temporary differences for which deferred tax liabilities are recognized. Such tax loss carryforwards can accumulate and be used to offset Charter’s future taxable income.
The consummation of the Plan generated an “ownership change” as defined in Section 382 of the Code. As a result, Charter is subject to limitation on the use of a majority of its tax loss carryforwards. Further, Charter’s net operating loss carryforwards have been reduced by the amount of the cancellation of debt income resulting from the Plan that was allocable to Charter. The limitation on Charter’s ability to use its tax loss carryforwards, in conjunction with the loss expiration provisions, could reduce its ability to use a portion of Charter’s tax loss carryforwards to offset future taxable income.
As of December 31, 2010, $1.3 billion of federal tax loss carryforwards are unrestricted and available for Charter’s immediate use, while approximately $5.6 billion of federal tax loss carryforwards are still subject to Section 382 restrictions. Pursuant to these restrictions, an aggregate of $2.1 billion, in varying amounts from 2011 to 2014, and an additional $176 million annually over each of the next 18 years of federal tax loss carryforwards, should become unrestricted and available for Charter’s use. Both Charter’s indirect corporate subsidiary and state tax loss carryforwards are subject to similar but varying restrictions.
In addition to its tax loss carryforward attributes, Charter also has $4.9 billion of tax basis in intangible assets and $4.9 billion of tax basis in property, plant and equipment as of December 31, 2010. The tax basis in these assets is not subject to Section 382 limitations and therefore the related tax basis amortization and depreciation is available and deductible for tax purposes on an annual basis.
As of December 31, 2010 and 2009, we have recorded net deferred income tax liabilities of $762 million and $306 million, respectively. As part of our net liability, on December 31, 2010 and 2009, we had deferred tax assets of $3.5 billion and $3.4 billion, respectively, which primarily relate to tax losses allocated to Charter from Charter Holdco. In assessing the realizability of deferred tax assets, management considers whether it is more likely than not that some portion or all of the deferred tax assets will be realized. Due to our history of losses, we were unable to assume future taxable income in our analysis and accordingly valuation allowances have been established except for deferred benefits available to offset certain deferred tax liabilities that will reverse over time. Accordingly, our deferred tax assets have been offset with a corresponding valuation allowance of $2.3 billion and $2.0 billion at December 31, 2010 and 2009, respectively.
In determining our tax provision for financial reporting purposes, Charter establishes a reserve for uncertain tax positions unless such positions are determined to be “more likely than not” of being sustained upon examination, based on their technical merits. In evaluating whether a tax position has met the more-likely-than-not recognition threshold, we presume the position will be examined by the appropriate taxing authority that has full knowledge of all relevant information. A tax position that meets the more-likely-than-not recognition threshold is measured to determine the amount of benefit to be recognized in our financial statements. The tax position is measured at the
41
largest amount of benefit that has a greater than 50% likelihood of being realized when the position is ultimately resolved. There is considerable judgment involved in determining whether positions taken on the tax return are “more likely than not” of being sustained.
Charter adjusts its uncertain tax reserve estimates periodically because of ongoing examinations by, and settlements with, the various taxing authorities, as well as changes in tax laws, regulations and interpretations.
No tax years for Charter or Charter Holdco are currently under examination by the Internal Revenue Service. Tax years ending 2007 through 2010 remain subject to examination and assessment. Years prior to 2007 remain open solely for purposes of examination of Charter’s loss and credit carryforwards.
Litigation
Legal contingencies have a high degree of uncertainty. When a loss from a contingency becomes estimable and probable, a reserve is established. The reserve reflects management's best estimate of the probable cost of ultimate resolution of the matter and is revised as facts and circumstances change. A reserve is released when a matter is ultimately brought to closure or the statute of limitations lapses. We have established reserves for certain matters. Although certain matters are not expected individually to have a material adverse effect on our consolidated financial condition, results of operations or liquidity, such matters could have, in the aggregate, a material adverse effect on our consolidated financial condition, results of operations or liquidity.
Programming Agreements
We exercise significant judgment in estimating programming expense associated with certain video programming contracts. Our policy is to record video programming costs based on our contractual agreements with our programming vendors, which are generally multi-year agreements that provide for us to make payments to the programming vendors at agreed upon market rates based on the number of customers to which we provide the programming service. If a programming contract expires prior to the parties' entry into a new agreement and we continue to distribute the service, we estimate the programming costs during the period there is no contract in place. In doing so, we consider the previous contractual rates, inflation and the status of the negotiations in determining our estimates. When the programming contract terms are finalized, an adjustment to programming expense is recorded, if necessary, to reflect the terms of the new contract. We also make estimates in the recognition of programming expense related to other items, such as the accounting for free periods and credits from service interruptions, as well as the allocation of consideration exchanged between the parties in multiple-element transactions.
Significant judgment is also involved when we enter into agreements that result in us receiving cash consideration from the programming vendor, usually in the form of advertising sales, channel positioning fees, launch support or marketing support. In these situations, we must determine based upon facts and circumstances if such cash consideration should be recorded as revenue, a reduction in programming expense or a reduction in another expense category (e.g., marketing).
42
Results of Operations
The following table sets forth the percentages of revenues that items in the accompanying consolidated statements of operations constituted for the periods presented (dollars in millions, except per share data):
|
Successor
|
Combined
|
Predecessor
|
|||||||||||||||||||
|
2010
|
2009
|
2008
|
|||||||||||||||||||
|
Revenues
|
$ | 7,059 | 100 | % | $ | 6,755 | 100 | % | $ | 6,479 | 100 | % | |||||||||
|
Costs and Expenses:
|
|||||||||||||||||||||
|
Operating (excluding depreciation and amortization)
|
3,064 | 43 | % | 2,909 | 43 | % | 2,807 | 43 | % | ||||||||||||
|
Selling, general and administrative
|
1,422 | 20 | % | 1,380 | 20 | % | 1,386 | 21 | % | ||||||||||||
|
Depreciation and amortization
|
1,524 | 22 | % | 1,316 | 20 | % | 1,310 | 20 | % | ||||||||||||
|
Impairment of franchises
|
-- | -- | 2,163 | 32 | % | 1,521 | 24 | % | |||||||||||||
|
Other operating (income) expenses, net
|
25 | -- | (34 | ) | (1 | %) | 69 | 1 | % | ||||||||||||
| 6,035 | 85 | % | 7,734 | 114 | % | 7,093 | 109 | % | |||||||||||||
|
Income (loss) from operations
|
1,024 | 15 | % | (979 | ) | (14 | %) | (614 | ) | (9 | %) | ||||||||||
|
Interest expense, net (excluding unrecorded interest
expense of $558 for year ended December 31, 2009)
|
(877 | ) | (1,088 | ) | (1,905 | ) | |||||||||||||||
|
Gain due to Plan effects
|
-- | 6,818 | -- | ||||||||||||||||||
|
Gain due to fresh start accounting adjustments
|
-- | 5,659 | -- | ||||||||||||||||||
|
Reorganization items, net
|
(6 | ) | (647 | ) | -- | ||||||||||||||||
|
Gain (loss) on extinguishment of debt
|
(85 | ) | -- | 4 | |||||||||||||||||
|
Change in value of derivatives
|
-- | (4 | ) | (29 | ) | ||||||||||||||||
|
Other income (expense), net
|
2 | (1 | ) | (6 | ) | ||||||||||||||||
|
Income (loss) before income taxes
|
58 | 9,758 | (2,550 | ) | |||||||||||||||||
|
Income tax benefit (expense)
|
(295 | ) | 343 | 103 | |||||||||||||||||
|
Consolidated net income (loss)
|
(237 | ) | 10,101 | (2,447 | ) | ||||||||||||||||
|
Less: Net (income) loss – noncontrolling interest
|
-- | 1,265 | (4 | ) | |||||||||||||||||
|
Net income (loss) – Charter shareholders
|
$ | (237 | ) | $ | 11,366 | $ | (2,451 | ) | |||||||||||||
Revenues.
Average monthly revenue per basic video customer, measured on an annual basis, has increased from $105 in 2008 to $114 in 2009 and $126 in 2010. Average monthly revenue per video customer represents total annual revenue, divided by twelve, divided by the average number of basic video customers during the respective period. Revenue growth primarily reflects increases in the number of residential and commercial telephone, high-speed Internet, and digital video customers, price increases, and incremental video revenues from premium, DVR, and high-definition television services, offset by a decrease in basic video customers. Asset sales, net of acquisitions, in 2008, 2009 and 2010 reduced the increase in revenues in 2010 as compared to 2009 by approximately $19 million and 2009 as compared to 2008 by approximately $17 million.
Revenues by service offering were as follows (dollars in millions):
|
Successor
|
Combined
|
Predecessor
|
||||||||||||||||||||||||||||||||||||||
|
2010
|
2009
|
2008
|
2010 over 2009
|
2009 over 2008
|
||||||||||||||||||||||||||||||||||||
|
Revenues
|
% of Revenues
|
Revenues
|
% of Revenues
|
Revenues
|
% of Revenues
|
Change
|
% Change
|
Change
|
% Change
|
|||||||||||||||||||||||||||||||
|
Video
|
$ | 3,689 | 52 | % | $ | 3,686 | 54 | % | $ | 3,692 | 57 | % | $ | 3 | -- | $ | (6 | ) | -- | |||||||||||||||||||||
|
High-speed Internet
|
1,606 | 23 | % | 1,476 | 22 | % | 1,356 | 21 | % | 130 | 9 | % | 120 | 9 | % | |||||||||||||||||||||||||
|
Telephone
|
823 | 12 | % | 750 | 11 | % | 583 | 9 | % | 73 | 10 | % | 167 | 29 | % | |||||||||||||||||||||||||
|
Commercial
|
494 | 7 | % | 446 | 7 | % | 392 | 6 | % | 48 | 11 | % | 54 | 14 | % | |||||||||||||||||||||||||
|
Advertising sales
|
291 | 4 | % | 249 | 4 | % | 308 | 5 | % | 42 | 17 | % | (59 | ) | (19 | %) | ||||||||||||||||||||||||
|
Other
|
156 | 2 | % | 148 | 2 | % | 148 | 2 | % | 8 | 5 | % | -- | -- | ||||||||||||||||||||||||||
| $ | 7,059 | 100 | % | $ | 6,755 | 100 | % | $ | 6,479 | 100 | % | $ | 304 | 5 | % | $ | 276 | 4 | % | |||||||||||||||||||||
43
Certain prior year amounts have been reclassified to conform with the 2010 presentation, including the reflection of franchise fees, equipment rental and video customer installation revenue as video revenue, and telephone regulatory fees as telephone revenue, rather than other revenue.
Video revenues consist primarily of revenues from basic and digital video services provided to our non-commercial customers, as well as franchise fees, equipment rental and video installation revenue. Basic video customers decreased by 303,600 and 212,400 customers in 2010 and 2009, respectively, of which 76,700 in 2010 and 12,400 in 2009 were related to asset sales, net of acquisitions. Digital video customers increased by 145,100 and 84,700 customers in 2010 and 2009, respectively. The increase in 2010 and 2009 was reduced by asset sales, net of acquisitions, of 37,400 and 1,200 digital customers, respectively. The increases in video revenues are attributable to the following (dollars in millions):
|
2010 compared
to 2009
|
2009 compared
to 2008
|
|||||||
|
Incremental video services and rate adjustments
|
$ | 57 | $ | 57 | ||||
|
Increase in digital video customers
|
62 | 42 | ||||||
|
Decrease in basic video customers
|
(102 | ) | (94 | ) | ||||
|
Asset sales, net of acquisitions
|
(14 | ) | (11 | ) | ||||
| $ | 3 | $ | (6 | ) | ||||
Residential high-speed Internet customers grew by 183,800 and 187,100 customers in 2010 and 2009, respectively. The increase in 2010 was reduced by asset sales, net of acquisitions, of 22,900 high-speed Internet customers and the increase in 2009 included asset acquisitions, net of sales, of 400 high-speed Internet customers. The increases in high-speed Internet revenues from our residential customers are attributable to the following (dollars in millions):
|
2010 compared
to 2009
|
2009 compared
to 2008
|
|||||||
|
Increase in residential high-speed Internet customers
|
$ | 109 | $ | 88 | ||||
|
Rate adjustments and service upgrades
|
23 | 34 | ||||||
|
Asset sales, net of acquisitions
|
(2 | ) | (2 | ) | ||||
| $ | 130 | $ | 120 | |||||
Residential telephone customers grew by 161,000 and 247,100 customers in 2010 and 2009, respectively. The increase in 2010 was reduced by asset sales, net of acquisitions, of 1,700 telephone customers. The increases in residential telephone revenues from our residential customers is attributable to the following (dollars in millions):
|
2010 compared
to 2009
|
2009 compared
to 2008
|
|||||||
|
Increase in residential telephone customers
|
$ | 102 | $ | 150 | ||||
|
Rate adjustments and service upgrades
|
(29 | ) | 17 | |||||
|
Asset sales, net of acquisitions
|
-- | -- | ||||||
| $ | 73 | $ | 167 | |||||
Average monthly revenue per telephone customer decreased during 2010 compared to 2009 due to promotional activity to increase sales of the Charter Bundle®.
Commercial revenues consist primarily of revenues from services provided to our commercial customers. Commercial revenues increased primarily as a result of increased sales of the Charter Business Bundle® to our small and medium sized business customers and increases in carrier site customers. The increases in 2010 and 2009 were reduced by approximately $1 million as a result of asset sales.
Advertising sales revenues consist primarily of revenues from commercial advertising customers, programmers and other vendors. In 2010, advertising sales revenues increased as a result of increases in all sectors, especially the
44
political and automotive sectors. The increase in 2010 was reduced by approximately $1 million as a result of asset sales. In 2009, advertising sales revenues decreased primarily as a result of significant decreases in revenues from the political, automotive and retail sectors coupled with a decrease of $2 million related to asset sales. For the years ended December 31, 2010, 2009, and 2008, we received $46 million, $41 million and $39 million, respectively, in advertising sales revenues from vendors.
Other revenues consist of home shopping, late payment fees, wire maintenance fees and other miscellaneous revenues. The increase in 2010 was primarily the result of increases in home shopping, wire maintenance fees and late payment fees reduced by approximately $1 million as a result of asset sales.
Operating expenses
.
The increases in our operating expenses are attributable to the following (dollars in millions):
|
2010 compared
to 2009
|
2009 compared
to 2008
|
|||||||
|
Programming costs
|
$ | 82 | $ | 96 | ||||
|
Labor costs
|
38 | 26 | ||||||
|
Franchise and regulatory fees
|
16 | 10 | ||||||
|
Commercial services
|
10 | (1 | ) | |||||
|
Vehicle costs
|
6 | (12 | ) | |||||
|
Ad sales
|
6 | (10 | ) | |||||
|
Other, net
|
5 | -- | ||||||
|
Asset sales, net of acquisitions
|
(8 | ) | (7 | ) | ||||
| $ | 155 | $ | 102 | |||||
Programming costs were approximately $1.8 billion, $1.7 billion and $1.6 billion, representing 59%, 60% and 59% of total operating expenses for the years ended December 31, 2010, 2009 and 2008, respectively. Programming costs consist primarily of costs paid to programmers for basic, premium, digital, OnDemand, and pay-per-view programming. The increases in programming costs are primarily a result of annual contractual rate adjustments, offset in part by asset sales and customer losses. Programming costs were also offset by the amortization of payments received from programmers of $17 million, $26 million and $33 million in 2010, 2009 and 2008, respectively. We expect programming expenses to continue to increase, and at a higher rate than in 2010, due to a variety of factors, including amounts paid for retransmission consent, annual increases imposed by programmers, and additional programming, including high-definition, OnDemand, and pay-per-view programming, being provided to our customers.
Service labor increased as a result of increases in service calls resulting from our strategic bandwidth initiatives and commercial services expenses increased as a result of growth in our commercial business. Our strategic bandwidth initiatives will continue in 2011 and while our service labor expenses stabilized in the fourth quarter of 2010, there can be no assurance that they will not increase in 2011.
Selling, general and administrative expenses.
The increases (decreases) in selling, general and administrative expenses are attributable to the following (dollars in millions):
|
2010 compared
to 2009
|
2009 compared
to 2008
|
|||||||
|
Commercial services
|
$ | 22 | $ | 7 | ||||
|
Marketing costs
|
15 | 5 | ||||||
|
Bad debt and collection costs
|
3 | 9 | ||||||
|
Customer care
|
3 | (4 | ) | |||||
|
Employee costs
|
2 | (7 | ) | |||||
|
Stock compensation
|
(1 | ) | (6 | ) | ||||
|
Other, net
|
3 | (6 | ) | |||||
|
Asset sales, net of acquisitions
|
(5 | ) | (4 | ) | ||||
| $ | 42 | $ | (6 | ) | ||||
45
Depreciation and amortization.
Depreciation and amortization expense increased by $208 million and $6 million in 2010 and 2009, respectively. The increases were primarily the result of increased amortization associated with the increase in customer relationships as a part of applying fresh start accounting offset by asset sales.
Impairment of franchises.
We recorded impairment of $2.2 billion and $1.5 billion for the years ended December 31, 2009 and 2008, respectively. The impairments recorded in 2009 and 2008 were a result of the continued economic pressure on our customers from the economic downturn along with increased competition and the related impact to our projected future growth rates. The valuation completed in 2010 showed franchise values in excess of book value, and thus resulted in no impairment.
Other operating (income) expenses, net.
The changes in other operating (income) expenses, net are attributable to the following (dollars in millions):
|
2010 compared
to 2009
|
2009 compared
to 2008
|
|||||||
|
Increases (decreases) in losses on sales of assets
|
$ | 2 | $ | (6 | ) | |||
|
Increases (decreases) in special charges, net
|
57 | (97 | ) | |||||
| $ | 59 | $ | (103 | ) | ||||
The change in special charges in 2010 and 2009, as compared to prior periods, is a result of amounts paid or net amounts received in litigation settlements. For more information, see Note 14 to the accompanying consolidated financial statements contained in “Item 8. Financial Statements and Supplementary Data.”
Interest expense, net.
Net interest expense decreased by $211 million in 2010 from 2009 and $817 million in 2009 from 2008. Net interest expense decreased in 2010 compared to 2009 primarily as a result of a decrease in average debt outstanding as a result of the completion of our reorganization under Chapter 11 of the Bankruptcy Code and the related reduction of $8 billion principal amount of debt. Because we filed for Chapter 11 bankruptcy on March 27, 2009, we no longer accrued interest on debt subject to compromise effective March 27, 2009, except on CCH II debt, as we intended to pay the interest under the Plan. As such, interest expense for 2009 decreased as compared to 2008. The amount of contractual interest expense not recorded for the year ended December 31, 2009 was approximately $558 million.
Gain due to Plan effects.
Gain due to Plan effects represents the net gains recorded as a result of implementing the Plan including the impact of eliminating $8 billion in debt. For more information, see Note 23 to the accompanying condensed consolidated financial statements contained in “Item 8. Financial Statements and Supplementary Data.”
Gain due to fresh start accounting adjustments.
Upon our emergence from bankruptcy, the Company applied fresh start accounting. Gain due to fresh start accounting adjustments represents the net gains recognized as a result of adjusting all assets and liabilities to fair value. For more information, see Note 23 to the accompanying condensed consolidated financial statements contained in “Item 8. Financial Statements and Supplementary Data.”
Reorganizations items, net.
Reorganization items, net of $6 million and $647 million for the years ended December 31, 2010 and 2009, respectively, represent items of income, expense, gain or loss that we realized or incurred related to our reorganization under Chapter 11 of the Bankruptcy Code. For more information, see Note 23 to the accompanying condensed consolidated financial statements contained in “Item 8. Financial Statements and Supplementary Data.”
46
Gain (loss) on extinguishment of debt.
Gain (loss) on extinguishment of debt consists of the following for the years ended December 31, 2010, 2009 and 2008 (dollars in millions):
|
Successor
|
Combined
|
Predecessor
|
||||||||||
|
2010
|
2009
|
2008
|
||||||||||
|
Charter Holdings debt notes repurchases / exchanges
|
$ | -- | $ | -- | $ | 3 | ||||||
|
Charter convertible note repurchases / exchanges
|
-- | -- | 5 | |||||||||
|
CCH II tender offer
|
-- | -- | (4 | ) | ||||||||
|
CCO Holdings debt notes repurchases / exchanges
|
(17 | ) | -- | -- | ||||||||
|
Charter Operating debt notes repurchases
|
(17 | ) | -- | -- | ||||||||
|
Charter Operating credit amendment / prepayments
|
(51 | ) | -- | -- | ||||||||
| $ | (85 | ) | $ | -- | $ | 4 | ||||||
For more information, see Notes 7 and 15 to the accompanying consolidated financial statements contained in “Item 8. Financial Statements and Supplementary Data.”
Change in value of derivatives.
Interest rate swaps are held to manage our interest costs and reduce our exposure to increases in floating interest rates. We expense the change in fair value of derivatives that do not qualify for hedge accounting and cash flow hedge ineffectiveness on interest rate swap agreements. Upon filing for Chapter 11 bankruptcy, the counterparties to the interest rate swap agreements terminated the underlying contracts and, upon emergence from bankruptcy, received payment for the market value of the interest rate swap agreement as measured on the date the counterparties terminated. Additionally, certain provisions of our 5.875% and 6.50% convertible senior notes issued in November 2004 and October 2007, respectively, were considered embedded derivatives for accounting purposes and were required to be accounted for separately from the convertible senior notes and marked to fair value at the end of each reporting period. On the Effective Date, the convertible debt was cancelled. Change in value of derivatives consists of the following for the years ended December 31, 2010, 2009 and 2008 (dollars in millions):
|
Successor
|
Combined
|
Predecessor
|
||||||||||
|
2010
|
2009
|
2008
|
||||||||||
|
Interest rate swaps
|
$ | -- | $ | (4 | ) | $ | (62 | ) | ||||
|
Embedded derivatives from convertible senior notes
|
-- | -- | 33 | |||||||||
| $ | -- | $ | (4 | ) | $ | (29 | ) | |||||
Other income (expense), net.
The changes in other income (expense), net are attributable to the following (dollars in millions):
|
2010 compared
to 2009
|
2009 compared
to 2008
|
|||||||
|
Increases (decreases) in investment income
|
$ | (1 | ) | $ | 2 | |||
|
Change in value of preferred stock
|
5 | (3 | ) | |||||
|
Other, net
|
(1 | ) | 6 | |||||
| $ | 3 | $ | 5 | |||||
For more information, see Note 16 to the accompanying consolidated financial statements contained in “Item 8. Financial Statements and Supplementary Data.”
Income tax benefit (expense).
Income tax expense of $295 million was recognized for the year ended December 31, 2010, primarily through increases in deferred tax liabilities related to our investment in Charter Holdco and certain of our indirect subsidiaries, in addition to $8 million of current federal and state income tax expense. Income tax expense for the year ended December 31, 2010 included $23 million related primarily to changes in estimates on the 2009 tax provision, a $16 million expense related to asset sales occurring in 2010 and a $69 million benefit related to the February 8, 2010 Charter Holdco partnership interest exchange.
47
Income tax benefit of $343 million for the year ended December 31, 2009 was realized primarily as a result of decreases in certain deferred tax liabilities related to our investment in Charter Holdco and certain of our subsidiaries. These decreases are primarily attributable to the impairment of franchises and fresh start accounting adjustments for financial statement purposes and not for tax purposes. It included $8 million of current federal and state income tax expense.
Income tax benefit of $103 million for the year ended December 31, 2008 included $325 million of deferred tax benefit related to the impairment of franchises and $2 million of deferred tax benefit related to asset acquisitions and sales occurring in 2008. It included $4 million of current federal and state income tax expense.
Net (income) loss – noncontrolling interest.
Noncontrolling interest represented the allocation of income to Mr. Allen’s previous 5.6% membership interests in CC VIII and the allocation of losses to Mr. Allen’s noncontrolling interest in Charter Holdco. Mr. Allen has subsequently transferred his CC VIII interest to Charter on the Effective Date of the Plan. On February 8, 2010, Mr. Allen exercised his remaining right to exchange Charter Holdco units for shares of Charter Class A common stock after which Charter Holdco became 100% owned by Charter. See Notes 9 and 23 to our accompanying consolidated financial statements contained in “Item 8. Financial Statements and Supplementary Data.” The increase in losses allocated is the result of the adoption on January 1, 2009 of new accounting guidance which requires losses to be allocated to noncontrolling interest even when such interest is in a deficit position.
Net income (loss).
The impact to net income (loss) as a result of impairment charges, loss on extinguishment of debt, reorganization items and gains due to Plan effects and fresh start accounting, net of tax, was to increase net loss by approximately $91 million in 2010, increase net income by approximately $11.0 billion in 2009 and to increase net loss in 2008 by approximately $1.2 billion.
Use of Adjusted EBITDA
and Free Cash Flow
We use certain measures that are not defined by GAAP to evaluate various aspects of our business. Adjusted EBITDA and free cash flow are non-GAAP financial measures and should be considered in addition to, not as a substitute for, net income (loss) and net cash flows from operating activities reported in accordance with GAAP. These terms, as defined by us, may not be comparable to similarly titled measures used by other companies. Adjusted EBITDA and free cash flow are reconciled to consolidated net income (loss) and net cash flows from operating activities, respectively, below.
Adjusted EBITDA is defined as consolidated net income (loss) plus net interest expense, income taxes, depreciation and amortization, gains realized due to Plan effects and fresh start accounting adjustments, reorganization items, impairment of franchises, stock compensation expense, change in value of derivatives, gain (loss) on extinguishment of debt and other operating expenses, such as special charges and loss on sale or retirement of assets. As such, it eliminates the significant non-cash depreciation and amortization expense that results from the capital-intensive nature of our businesses as well as other non-cash or non-recurring items, and is unaffected by our capital structure or investment activities. Adjusted EBITDA is used by management and Charter’s board of directors to evaluate the performance of our business. For this reason, it is a significant component of Charter’s annual incentive compensation program. However, this measure is limited in that it does not reflect the periodic costs of certain capitalized tangible and intangible assets used in generating revenues and our cash cost of financing. Management evaluates these costs through other financial measures.
Free cash flow is defined as net cash flows from operating activities, less capital expenditures and changes in accrued expenses related to capital expenditures.
We believe that Adjusted EBITDA and free cash flow provide information useful to investors in assessing our performance and our ability to service our debt, fund operations and make additional investments with internally generated funds. In addition, Adjusted EBITDA generally correlates to the leverage ratio calculation under our credit facilities or outstanding notes to determine compliance with the covenants contained in the facilities and notes (all such documents have been previously filed with the United States Securities and Exchange Commission). Adjusted EBITDA includes management fee expenses in the amount of $144 million, $136 million and $131 million for the years ended December 31, 2010, 2009 and 2008, respectively, which expense amounts are excluded for the purposes of calculating compliance with leverage covenants.
48
|
Successor
|
Combined
|
Predecessor
|
||||||||||
|
2010
|
2009
|
2008
|
||||||||||
|
Consolidated net income (loss)
|
$ | (237 | ) | $ | 10,101 | $ | (2,447 | ) | ||||
|
Plus: Interest expense, net
|
877 | 1,088 | 1,905 | |||||||||
|
Income tax (benefit) expense
|
295 | (343 | ) | (103 | ) | |||||||
|
Depreciation and amortization
|
1,524 | 1,316 | 1,310 | |||||||||
|
Impairment of franchises
|
-- | 2,163 | 1,521 | |||||||||
|
Stock compensation expense
|
26 | 27 | 33 | |||||||||
|
(Gain) loss due to bankruptcy related items
|
6 | (11,830 | ) | -- | ||||||||
|
(Gain) loss on extinguishment of debt
|
85 | -- | (4 | ) | ||||||||
|
Other, net
|
23 | (29 | ) | 104 | ||||||||
|
Adjusted EBITDA
|
$ | 2,599 | $ | 2,493 | $ | 2,319 | ||||||
|
Net cash flows from operating activities
|
$ | 1,911 | $ | 594 | $ | 399 | ||||||
|
Less: Purchases of property, plant and equipment
|
(1,209 | ) | (1,134 | ) | (1,202 | ) | ||||||
|
Change in accrued expenses related to capital expenditures
|
8 | (10 | ) | (39 | ) | |||||||
|
Free cash flow
|
$ | 710 | $ | (550 | ) | $ | (842 | ) |
Liquidity and Capital Resources
Introduction
This section contains a discussion of our liquidity and capital resources, including a discussion of our cash position, sources and uses of cash, access to credit facilities and other financing sources, historical financing activities, cash needs, capital expenditures and outstanding debt.
Overview of Our Debt and Liquidity
Although we reduced our debt by approximately $8 billion on November 30, 2009 pursuant to the Plan, we continue to have significant amounts of debt. The accreted value of our debt as of December 31, 2010 was $12.3 billion, consisting of $5.9 billion of credit facility debt and $6.4 billion of high-yield notes. Our business requires significant cash to fund principal and interest payments on our debt. As of December 31, 2010, after giving effect to the issuance of the CCO Holdings notes in January 2011 and the application of proceeds to repay borrowings under the Charter Operating credit facilities, $44 million of our long-term debt matures in 2011, $1.1 billion in 2012, $323 million in 2013, $2.2 billion in 2014, $30 million in 2015, $4.6 billion in 2016 and $4.0 billion thereafter.
As we continue to evaluate potential uses of our anticipated future free cash flow, we will consider all of our options, including reducing leverage and investing in our business growth and other strategic opportunities, including mergers and acquisitions, as well as dividends and stock repurchases. We intend to make all capital allocation decisions in a way that maximizes the long-term value for our stockholders.
As of December 31, 2010, the amount available under the revolving credit facility was approximately $1.1 billion. The revolving credit facility matures in March 2015. However, if on December 1, 2013 Charter Operating has scheduled maturities in excess of $1.0 billion between January 1, 2014 and April 30, 2014, the revolving credit facility will mature on December 1, 2013 unless lenders holding more than 50% of the revolving credit facility consent to the maturity being March 2015. As of
January 31,
2011, Charter Operating had maturities of $
1.3
billion between January 1, 2014 and April 30, 2014. We expect to utilize free cash flow and availability under our revolving credit facilities as well as future refinancing transactions to further extend or reduce the maturities of our principal obligations. The timing and terms of any refinancing transactions will be subject to market conditions. Additionally, we may, from time to time, depending on market conditions and other factors, use cash on hand and the proceeds from securities offerings or other borrowings, to retire our debt through open market purchases, privately negotiated purchases, tender offers, or redemption provisions.
Our business also requires significant cash to fund capital expenditures and ongoing operations. Our projected cash needs and projected sources of liquidity depend upon, among other things, our actual results, and the timing and
49
amount of our expenditures. We believe we have sufficient liquidity from cash on hand, free cash flow and Charter Operating’s revolving credit facility as well as access to the capital markets to fund our projected operating cash needs.
Free Cash Flow
Free cash flow was $710 million for the year ended December 31, 2010 compared to negative free cash flow of $550 million and $842 million for the years ended December, 31, 2009 and 2008, respectively. The increase in free cash flow in 2010 compared to 2009 is primarily due to decreases in cash paid for interest and reorganization items offset by increases in capital investments to enhance our residential and commercial products and service capabilities. The decrease in negative free cash flow in 2009 compared to 2008 is primarily due to a decrease in cash paid for interest and an increase in Adjusted EBITDA, offset by reorganization items.
As of December 31, 2010, the accreted value of our total debt was approximately $12.3 billion, as summarized below (dollars in millions):
|
December 31, 2010
|
|||||||||||
|
Semi-Annual
|
|||||||||||
|
Principal
|
Accreted
|
Interest Payment
|
Maturity
|
||||||||
|
Amount
|
Value (a)
|
Dates
|
Date (b)
|
||||||||
|
CCH II, LLC:
|
|||||||||||
|
13.5% senior notes due 2016
|
$ | 1,766 | $ | 2,057 |
2/15 & 8/15
|
11/30/16
|
|||||
|
CCO Holdings, LLC:
|
|||||||||||
|
7.25% senior notes due 2017
|
1,000 | 1,000 |
4/30 & 10/30
|
10/30/17
|
|||||||
|
7.875% senior notes due 2018
|
900 | 900 |
4/30 & 10/30
|
4/30/18
|
|||||||
|
8.125% senior notes due 2020
|
700 | 700 |
4/30 & 10/30
|
4/30/20
|
|||||||
|
Credit facility
|
350 | 314 |
9/6/14
|
||||||||
|
Charter Communications Operating, LLC:
|
|||||||||||
|
8.00% senior second-lien notes due 2012
|
1,100 | 1,112 |
4/30 & 10/30
|
4/30/12
|
|||||||
|
10.875% senior second-lien notes due 2014
|
546 | 591 |
3/15 & 9/15
|
9/15/14
|
|||||||
|
Credit facilities
|
5,954 | 5,632 |
Varies (c)
|
||||||||
| $ | 12,316 | $ | 12,306 | ||||||||
|
(a)
|
The accreted values of the CCH II and Charter Operating notes and the CCO Holdings and Charter Operating credit facilities presented above represent the fair value of the debt as of the Effective Date, plus the accretion to the balance sheet date. However, the amount that is currently payable if the debt becomes immediately due is equal to the principal amount of the debt. We have availability under the revolving portion of our credit facility of approximately $1.1 billion as of December 31, 2010.
|
|
(b)
|
In general, the obligors have the right to redeem all of the notes set forth in the above table in whole or in part at their option, beginning at various times prior to their stated maturity dates, subject to certain conditions, upon the payment of the outstanding principal amount (plus a specified redemption premium) and all accrued and unpaid interest. For additional information see Note 7 to the accompanying consolidated financial statements contained in “Item 8. Financial Statements and Supplementary Data.”
|
|
(c)
|
Includes $2.4 billion and $307 million principal amount of term B-1 and term B-2 loans, respectively, repayable in equal quarterly installments and aggregating in each loan year to 1% of the original amount of the term loan, with the remaining balance due at final maturity on March 6, 2014, $3.0 billion principal amount of the term C loan repayable in equal quarterly installments and aggregating in each loan year to 1% of the original amount of the term loan, with the remaining balance due at final maturity on September 6, 2016, $199 million principal amount of a non-revolving loan repayable in full on March 6, 2013 and $80 million outstanding under a revolving credit facility. Amounts outstanding under the revolving credit facility mature on March 6, 2015; provided, however, that unless otherwise directed by the revolving lenders holding more than 50% of the revolving commitments, the termination date will be December 1, 2013 if, on December 1, 2013, Charter Operating and its subsidiaries do not have less than $1.0 billion of indebtedness on a consolidated basis with maturities between January 1, 2014 and April 30, 2014.
|
50
Contractual Obligations
The following table summarizes our payment obligations as of December 31, 2010 under our long-term debt and certain other contractual obligations and commitments (dollars in millions.)
|
Payments by Period
|
||||||||||||||||||||
|
Less than
|
1-3 | 3-5 |
More than
|
|||||||||||||||||
|
Total
|
1 year
|
years
|
years
|
5 years
|
||||||||||||||||
|
Contractual Obligations
|
||||||||||||||||||||
|
Long-Term Debt Principal Payments (1)
|
$ | 12,316 | $ | 58 | $ | 1,495 | $ | 3,561 | $ | 7,202 | ||||||||||
|
Long-Term Debt Interest Payments (2)
|
4,896 | 847 | 1,648 | 1,365 | 1,036 | |||||||||||||||
|
Capital and Operating Lease Obligations (3)
|
89 | 23 | 36 | 20 | 10 | |||||||||||||||
|
Programming Minimum Commitments (4)
|
267 | 103 | 164 | -- | -- | |||||||||||||||
|
Other (5)
|
290 | 235 | 10 | 45 | -- | |||||||||||||||
|
Total
|
$ | 17,858 | $ | 1,266 | $ | 3,353 | $ | 4,991 | $ | 8,248 | ||||||||||
|
(1)
|
The table presents maturities of long-term debt outstanding as of December 31, 2010 and does not reflect the issuance of the CCO Holdings notes in January 2011 and the application of proceeds to repay borrowings under the Charter Operating credit facilities. Refer to Notes 7 and 21 to our accompanying consolidated financial statements contained in “Item 8. Financial Statements and Supplementary Data” for a description of our long-term debt and other contractual obligations and commitments.
|
|
|
(2)
|
Interest payments on variable debt are estimated using amounts outstanding at December 31, 2010 and the average implied forward London Interbank Offering Rate (“LIBOR”) rates applicable for the quarter during the interest rate reset based on the yield curve in effect at December 31, 2010. Actual interest payments will differ based on actual LIBOR rates and actual amounts outstanding for applicable periods.
|
|
|
(3)
|
We lease certain facilities and equipment under noncancelable operating leases. Leases and rental costs charged to expense for the years ended December 31, 2010, 2009, and 2008, were $24 million, $25 million and $24 million, respectively.
|
|
|
(4)
|
We pay programming fees under multi-year contracts ranging from three to ten years, typically based on a flat fee per customer, which may be fixed for the term, or may in some cases escalate over the term. Programming costs included in the accompanying statement of operations were approximately $1.8 billion, $1.7 billion and $1.6 billion, for the years ended December 31, 2010, 2009, and 2008, respectively. Certain of our programming agreements are based on a flat fee per month or have guaranteed minimum payments. The table sets forth the aggregate guaranteed minimum commitments under our programming contracts.
|
|
|
(5)
|
“Other” represents other guaranteed minimum commitments, which consist primarily of commitments to our billing services vendors.
|
The following items are not included in the contractual obligations table because the obligations are not fixed and/or determinable due to various factors discussed below. However, we incur these costs as part of our operations:
|
|
·
|
We rent utility poles used in our operations. Generally, pole rentals are cancelable on short notice, but we anticipate that such rentals will recur. Rent expense incurred for pole rental attachments for the years ended December 31, 2010, 2009, and 2008, was $50 million, $47 million and $47 million.
|
|
|
·
|
We pay franchise fees under multi-year franchise agreements based on a percentage of revenues generated from video service per year. We also pay other franchise related costs, such as public education grants, under multi-year agreements. Franchise fees and other franchise-related costs included in the accompanying statement of operations were $178 million, $176 million and $179 million for the years ended December 31, 2010, 2009, and 2008, respectively.
|
|
|
·
|
We also have $73 million in letters of credit, primarily to our various worker’s compensation, property and casualty, and general liability carriers, as collateral for reimbursement of claims.
|
51
Limitations on Distributions
Distributions by Charter’s subsidiaries to a parent company for payment of principal on parent company notes are restricted under indentures and credit facilities governing our indebtedness, unless there is no default under the applicable indenture and credit facilities, and unless each applicable subsidiary’s leverage ratio test is met at the time of such distribution. As of December 31, 2010, there was no default under any of these indentures or credit facilities and each subsidiary met its applicable leverage ratio tests based on December 31, 2010 financial results. Such distributions would be restricted, however, if any such subsidiary fails to meet these tests at the time of the contemplated distribution. In the past, certain subsidiaries have from time to time failed to meet their leverage ratio test. There can be no assurance that they will satisfy these tests at the time of the contemplated distribution. Distributions by Charter Operating for payment of principal on parent company notes are further restricted by the covenants in its credit facilities.
Distributions by CCO Holdings and Charter Operating to a parent company for payment of parent company interest are permitted if there is no default under the aforementioned indentures and CCO Holdings and Charter Operating credit facilities.
In addition to the limitation on distributions under the various indentures discussed above, distributions by our subsidiaries may be limited by applicable law, including the Delaware Limited Liability Company Act, under which our subsidiaries may only make distributions if they have “surplus” as defined in the act. See “Part I. Item 1A. Risk Factors —Restrictions in our subsidiaries’ debt instruments and under applicable law limit their ability to provide funds to us or our subsidiaries that are debt issuers.”
Historical Operating, Investing, and Financing Activities
Cash and Cash Equivalents.
We held $32 million in cash and cash equivalents, including $28 million of restricted cash, as of December 31, 2010 compared to $754 million as of December 31, 2009.
The decrease in cash resulted primarily from payments on our credit facilities.
Operating Activities.
Net cash provided by operating activities increased $1.3 billion from $594 million for the year ended December 31, 2009 to $1.9 billion for the year ended December 31, 2010, primarily as the result of a decrease of $495 million in cash paid for a swap termination liability, $365 million in cash paid for interest, $182 million in cash paid for reorganization items other than interest, changes in operating assets and liabilities that provided $242 million more cash during the same period, and revenues increasing at a faster rate than cash expenses.
Net cash provided by operating activities increased $195 million from $399 million for the year ended December 31, 2008 to $594 million for the year ended December 31, 2009, primarily as a result of a decrease of $747 million in cash paid for interest, and revenues increasing at a faster rate than cash expenses. These amounts were partially offset by cash paid for a swap termination liability of $495 million and cash reorganization items of $188 million for the year ended December 31, 2009.
Investing Activities.
Net cash used in investing activities for the years ended December 31, 2010, 2009, and 2008, was $1.2 billion, $1.3 billion and $1.2 billion, respectively. The decrease in 2010 compared to 2009 is primarily due to the purchase of the CC VIII interest in 2009 in connection with the Plan, offset by an increase of $75 million in purchases of property, plant and equipment as a result of capital investments to enhance our residential and commercial products and services capabilities. The increase in 2009 compared to 2008 is primarily due to the purchase of the CC VIII interest in 2009 in connection with the Plan, offset by a decrease of $68 million in purchases of property, plant, and equipment.
Financing Activities.
Net cash used in financing activities was $1.5 billion for the year ended December 31, 2010, and net cash provided by financing activities was $504 million and $1.7 billion for the years ended December 31, 2009 and 2008, respectively. The increase in cash used during the year ended December 31, 2010 compared to the corresponding period in 2009 was primarily due to increased repayments of long-term debt and repayment of preferred stock, offset by borrowings of long-term debt. The decrease in cash provided during the year ended December 31, 2009 compared to the corresponding period in 2008 was primarily the result of no borrowings of long-term debt in 2009.
52
Capital Expenditures
We have significant ongoing capital expenditure requirements. Capital expenditures were $1.2 billion, $1.1 billion and $1.2 billion for the years ended December 31, 2010, 2009 and 2008, respectively, and increased as a result of strategic investments including DOCSIS 3.0, bandwidth reclamation projects such as switch-digital video launches and investments made to move into new commercial segments. We expect these expenditures to continue to increase in 2011. See the table below for more details.
Our capital expenditures are funded primarily from free cash flow and borrowings on our credit facility. In addition, our liabilities related to capital expenditures increased by $8 million for the year ended December 31, 2010 and decreased by $10 million and $39 million for the years ended December 31, 2009 and 2008, respectively.
During 2011, we expect capital expenditures to be between $1.3 billion and $1.4 billion. We expect the nature of these expenditures will continue to be composed primarily of purchases of customer premise equipment related to advanced video services, scalable infrastructure and support capital. The actual amount of our capital expenditures depends in part on the deployment of advanced video services and offerings. Capital expenditures will increase if there is accelerated growth in high-speed Internet, telephone, commercial business or digital customers or there is an increased need to respond to competitive pressures by expanding the delivery of other advanced video services.
The following table presents our major capital expenditures categories in accordance with NCTA disclosure guidelines for the years ended December 31, 2010, 2009 and 2008. The disclosure is intended to provide more consistency in the reporting of capital expenditures among peer companies in the cable industry. These disclosure guidelines are not required disclosures under GAAP, nor do they impact our accounting for capital expenditures under GAAP (dollars in millions):
|
Successor
|
Combined
|
Predecessor
|
||||||||||
|
2010
|
2009
|
2008
|
||||||||||
|
Customer premise equipment (a)
|
$ | 543 | $ | 593 | $ | 595 | ||||||
|
Scalable infrastructure (b)
|
311 | 216 | 251 | |||||||||
|
Line extensions (c)
|
90 | 70 | 80 | |||||||||
|
Upgrade/rebuild (d)
|
21 | 28 | 40 | |||||||||
|
Support capital (e)
|
244 | 227 | 236 | |||||||||
|
Total capital expenditures (f)
|
$ | 1,209 | $ | 1,134 | $ | 1,202 | ||||||
|
(a)
|
Customer premise equipment includes costs incurred at the customer residence to secure new customers, revenue units and additional bandwidth revenues. It also includes customer installation costs and customer premise equipment (e.g., set-top boxes and cable modems).
|
|
(b)
|
Scalable infrastructure includes costs not related to customer premise equipment or our network, to secure growth of new customers, revenue units, and additional bandwidth revenues, or provide service enhancements (e.g., headend equipment).
|
|
(c)
|
Line extensions include network costs associated with entering new service areas (e.g., fiber/coaxial cable, amplifiers, electronic equipment, make-ready and design engineering).
|
|
(d)
|
Upgrade/rebuild includes costs to modify or replace existing fiber/coaxial cable networks, including betterments.
|
|
(e)
|
Support capital includes costs associated with the replacement or enhancement of non-network assets due to technological and physical obsolescence (e.g., non-network equipment, land, buildings and vehicles).
|
|
(f)
|
Total capital expenditures includes $138 million, $83 million and $79 million of capital expenditures related to commercial services for the years ended December 31, 2010, 2009 and 2008, respectively.
|
Description of Our Outstanding Debt
Overview
As of December 31, 2010 and 2009, the blended weighted average interest rate on our debt was 6.7% and 5.5%, respectively. The interest rate on approximately 65% and 37% of the total principal amount of our debt was effectively fixed, including the effects of our interest rate hedge agreements, if any, as of December 31, 2010 and 2009, respectively. The fair value of our high-yield notes was $6.6 billion and $5.4 billion at December 31, 2010
53
and 2009, respectively. The fair value of our credit facilities was $6.3 billion and $8.0 billion at December 31, 2010 and 2009, respectively. The fair value of our high-yield notes and credit facilities were based on quoted market prices.
The following description is a summary of certain provisions of our credit facilities and our notes (the “Debt Agreements”). The summary does not restate the terms of the Debt Agreements in their entirety, nor does it describe all terms of the Debt Agreements. The agreements and instruments governing each of the Debt Agreements are complicated and you should consult such agreements and instruments for more detailed information regarding the Debt Agreements.
Credit Facilities – General
CCO Holdings Credit Facility
In March 2007, CCO Holdings entered into a credit agreement (the “CCO Holdings credit facility”) which consists of a $350 million term loan facility. The facility matures in September 2014. Borrowings under the CCO Holdings credit facility bear interest at a variable interest rate based on either LIBOR or a base rate plus, in either case, an applicable margin. The applicable margin for LIBOR term loans is 2.50% above LIBOR. If an event of default were to occur, CCO Holdings would not be able to elect LIBOR and would have to pay interest at the base rate plus the applicable margin. The CCO Holdings credit facility is secured by the equity interests of Charter Operating, and all proceeds thereof.
Charter Operating Credit Facilities
The Charter Operating credit facilities have an outstanding principal amount of $6.0 billion at December 31, 2010 as follows:
|
·
|
A term B-1 loan with a remaining principal amount of approximately $2.4 billion, which is repayable in equal quarterly installments and aggregating $25 million in each loan year, with the remaining balance due at final maturity on March 6, 2014;
|
|
·
|
A term B-2 loan with a remaining principal amount of approximately $307 million, which is repayable in equal quarterly installments and aggregating $3 million in each loan year, with the remaining balance due at final maturity on March 6, 2014;
|
|
·
|
A term C loan with a remaining principal amount of approximately $3.0 billion, which is repayable in equal quarterly installments and aggregating $30 million in each loan year, with the remaining balance due at final maturity on September 6, 2016;
|
|
·
|
A non-revolving loan with a remaining principal amount of approximately $199 million repayable in full on March 6, 2013; and
|
|
·
|
A revolving loan with an outstanding balance of $80 million at December 31, 2010 and allowing for borrowings of up to $1.3 billion.
|
The revolving loan matures in March 2015. However, if on December 1, 2013 Charter Operating has scheduled maturities in excess of $1.0 billion between January 1, 2014 and April 30, 2014, the revolving loan will mature on December 1, 2013 unless lenders holding more than 50% of the revolving loan consent to the maturity being March 2015. As of January 31, 2011, Charter Operating had maturities of $1.3 billion between January 1, 2014 and April 30, 2014. The revolving credit facility amount may be increased, but it may not exceed $1.75 billion in aggregate revolving commitments plus the amount outstanding under the non-revolving loan.
Amounts outstanding under the Charter Operating credit facilities bear interest, at Charter Operating’s election, at a base rate or LIBOR, as defined, plus a margin. The applicable LIBOR margin for the non-revolving loans and the term B-1 loans is 2%. The LIBOR term B-2 loan bears interest at LIBOR plus 5.0%, with a LIBOR floor of 3.5%, or at Charter Operating’s election, a base rate plus a margin of 4.00%. Charter Operating has currently elected to pay based on the base rate. The applicable margin for the term C loans is currently 3.25% in the case of LIBOR loans, provided that if certain other term loans are borrowed or certain extended loans are established, then the term C loans shall automatically increase to the extent necessary to cause the yield for the term C loans to be 25 basis points less than the yield for the other certain term loans. Charter Operating pays interest equal to LIBOR plus 3.0% on amounts borrowed under the revolving credit facility and pays a revolving
commitment fee of .5% per annum on the daily average available amount of the revolving commitment, payable quarterly.
54
The Charter Operating credit facilities also allow us to enter into incremental term loans in the future with an aggregate, together with all other then outstanding first lien indebtedness, including any first lien notes, of no more than $7.5 billion (less any principal payments of term loan indebtedness and first lien notes as a result of any sale of assets), with amortization as set forth in the notices establishing such term loans, but with no amortization greater than 1% per year prior to the final maturity of the existing term loans.
Although the Charter Operating credit facilities allow for the incurrence of a certain amount of incremental term loans,
no assurance can be given that the Company could obtain additional incremental term loans in the future if Charter Operating sought to do so or what amount of incremental term loans would be allowable at any given time under the terms of the Charter Operating credit facilities.
The obligations of Charter Operating under the Charter Operating credit facilities (the “Obligations”) are guaranteed by Charter Operating’s immediate parent company, CCO Holdings, and subsidiaries of Charter Operating, except for certain subsidiaries, including immaterial subsidiaries and subsidiaries precluded from guaranteeing by reason of the provisions of other indebtedness to which they are subject (the “non-guarantor subsidiaries”). The Obligations are also secured by (i) a lien on substantially all of the assets of Charter Operating and its subsidiaries (other than assets of the non-guarantor subsidiaries), to the extent such lien can be perfected under the Uniform Commercial Code by the filing of a financing statement, and (ii) a pledge by CCO Holdings of the equity interests owned by it in Charter Operating or any of Charter Operating’s subsidiaries, as well as intercompany obligations owing to it by any of such entities.
Credit Facilities — Restrictive Covenants
CCO Holdings Credit Facility
The CCO Holdings credit facility contains covenants that are substantially similar to the restrictive covenants for the CCO Holdings notes except that the leverage ratio is 5.50 to 1.0 and the change of control definition provides that a change of control occurs if a holder becomes the beneficial owner of 35% of more of Charter’s voting stock unless Paul G. Allen beneficially owns a greater percentage. See “—Summary of Restricted Covenants of Our Notes.” The CCO Holdings credit facility contains provisions requiring mandatory loan prepayments under specific circumstances, including in connection with certain sales of assets, so long as the proceeds have not been reinvested in the business. The CCO Holdings credit facility permits CCO Holdings and its subsidiaries to make distributions to pay interest on the CCH II notes, the CCO Holdings notes, the Charter Operating credit facilities and the Charter Operating second-lien notes, provided that, among other things, no default has occurred and is continuing under the CCO Holdings credit facility.
Charter Operating Credit Facilities
The Charter Operating credit facilities contain representations and warranties, and affirmative and negative covenants customary for financings of this type. The financial covenants measure performance against standards set for leverage to be tested as of the end of each quarter. Additionally, the Charter Operating credit facilities contain provisions requiring mandatory loan prepayments under specific circumstances, including in connection with certain sales of assets, so long as the proceeds have not been reinvested in the business. The Charter Operating credit facilities permit Charter Operating and its subsidiaries to make distributions to pay interest on the currently outstanding subordinated and parent company indebtedness, provided that, among other things, no default has occurred and is continuing under the Charter Operating credit facilities.
The events of default under the Charter Operating credit facilities include, among other things:
|
•
|
the failure to make payments when due or within the applicable grace period;
|
|
|
•
|
the failure to comply with specified covenants, including, but not limited to, a covenant to deliver audited financial statements for Charter Operating with an unqualified opinion from our independent accountants and without a “going concern” or like qualification or exception;
|
|
|
•
|
the failure to pay or the occurrence of events that cause or permit the acceleration of other indebtedness owing by CCO Holdings, Charter Operating, or Charter Operating’s subsidiaries in aggregate principal amounts in excess of $100 million;
|
|
|
•
|
the failure to pay or the occurrence of events that result in the acceleration of other indebtedness owing by certain of CCO Holdings’ direct and indirect parent companies in aggregate principal amounts in excess of $200 million;
|
|
|
•
|
the consummation of any transaction resulting in any person or group having power, directly or indirectly, to vote more than 50% of the ordinary voting power for the management of Charter Operating on a fully diluted basis or a change of control shall occur under any indebtedness of CCO Holdings, any first lien notes of Charter Operating |
55
|
|
or any specified long-term indebtedness of Charter Operating (as defined in the Credit Agreement) in excess of $200 million in aggregate principal amount some of which instruments contain a 35% beneficial ownership change of control provision; and
|
|
|
•
|
Charter Operating ceasing to be a wholly-owned direct subsidiary of CCO Holdings, except in certain limited circumstances.
|
Notes
Provided below is a brief description of the notes issued by CCH II, CCO Holdings and Charter Operating.
CCH II Notes
On November 30, 2009, CCH II and CCH II Capital Corp. issued approximately $1.8 billion in total principal amount of new 13.5% senior notes (the “CCH II 2016 Notes”). Such notes are guaranteed by Charter. The CCH II 2016 Notes pay interest in cash semi-annually in arrears at the rate of 13.5% per annum and are unsecured and will mature on November 30, 2016. The CCH II 2016 Notes are structurally subordinated to all obligations of the subsidiaries of CCH II, including the CCO Holdings notes and credit facility and the Charter operating notes and credit facilities.
CCO Holdings Notes
On April 28, 2010, CCO Holdings and CCO Holdings Capital Corp. jointly issued $900 million aggregate principal amount of 7.875% Senior Notes due 2018 (the “CCO Holdings 2018 Notes”) and $700 million aggregate principal amount of 8.125% Senior Notes due 2020 (the “CCO Holdings 2020 Notes”). On September 27, 2010, CCO Holdings and CCO Holdings Capital Corp. issued $1.0 billion aggregate principal amount of 7.25% Senior Notes due 2017 (the “CCO Holdings 2017 Notes”). Such notes are guaranteed by Charter.
The CCO Holdings 2017 Notes, CCO Holdings 2018 Notes and CCO Holdings 2020 Notes are senior debt obligations of CCO Holdings and CCO Holdings Capital Corp. They rank equally with all other current and future unsecured, unsubordinated obligations of CCO Holdings and CCO Holdings Capital Corp. The CCO Holdings 2017 Notes, CCO Holdings 2018 Notes and CCO Holdings 2020 Notes are structurally subordinated to all obligations of subsidiaries of CCO Holdings, including the Charter Operating notes and Charter Operating credit facilities.
On January 11, 2011, CCO Holdings, LLC and CCO Holdings Capital Corp. completed the sale of $1.1 billion aggregate principal amount of 7.00% senior notes due 2019. On January 24, 2011, CCO Holdings and CCO Holdings Capital Corp. completed the sale of $300 million aggregate principal amount of 7.00% senior notes due 2019. Upon completion of this offering, the aggregate principal amount of outstanding notes under this series is $1.4 billion
(the “CCO Holdings 2019 Notes”)
. The payment obligations under the notes are fully and unconditionally guaranteed on a senior unsecured basis by Charter. The net proceeds of the issuances of the CCO Holdings 2019 Notes were contributed by CCO Holdings to Charter Operating as a capital contribution and were used to repay indebtedness under the Charter Operating credit facilities.
The CCO Holdings 2019 Notes are senior debt obligations of CCO Holdings and CCO Holdings Capital Corp. They rank equally with all other current and future unsecured, unsubordinated obligations of CCO Holdings and CCO Holdings Capital Corp. The CCO Holdings 2019 Notes are structurally subordinated to all obligations of subsidiaries of CCO Holdings, including the Charter Operating notes and Charter Operating credit facilities.
Charter Operating Notes
As of December 31, 2010, Charter Operating had $1.1 billion principal amount of 8.0% senior second-lien notes due 2012 and $546 million principal amount of 10.875% senior second-lien notes due 2014.
Subject to specified limitations, CCO Holdings and those subsidiaries of Charter Operating that are guarantors of, or otherwise obligors with respect to, indebtedness under the Charter Operating credit facilities and related obligations are required to guarantee the Charter Operating notes. The note guarantee of each such guarantor is:
|
|
·
|
a senior obligation of such guarantor;
|
|
|
·
|
structurally senior to the outstanding CCO Holdings notes and the outstanding CCH II notes;
|
56
|
|
·
|
senior in right of payment to any future subordinated indebtedness of such guarantor; and
|
|
·
|
effectively senior to the relevant subsidiary’s unsecured indebtedness, to the extent of the value of the
collateral but subject to the prior lien of the credit facilities.
|
The Charter Operating notes and related note guarantees are secured by a second-priority lien on all of Charter Operating’s and its subsidiaries’ assets that secure the obligations of Charter Operating or any subsidiary of Charter Operating with respect to the Charter Operating credit facilities and the related obligations. The collateral currently consists of the capital stock of Charter Operating held by CCO Holdings, all of the intercompany obligations owing to CCO Holdings by Charter Operating or any subsidiary of Charter Operating, and substantially all of Charter Operating’s and the guarantors’ assets (other than the assets of CCO Holdings) in which security interests may be perfected under the Uniform Commercial Code by filing a financing statement (including capital stock and intercompany obligations), including, but not limited to:
|
|
·
|
with certain exceptions, all capital stock (limited in the case of capital stock of foreign subsidiaries, if any, to 66% of the capital stock of first tier foreign Subsidiaries) held by Charter Operating or any guarantor;
and
|
|
|
·
|
with certain exceptions, all intercompany obligations owing to Charter Operating or any guarantor.
|
In the event that additional liens are granted by Charter Operating or its subsidiaries to secure obligations under the Charter Operating credit facilities or the related obligations, second priority liens on the same assets will be granted to secure the Charter Operating notes, which liens will be subject to the provisions of an intercreditor agreement (to which none of Charter Operating or its affiliates are parties). Notwithstanding the foregoing sentence, no such second priority liens need be provided if the time such lien would otherwise be granted is not during a guarantee and pledge availability period (when the Leverage Condition is satisfied), but such second priority liens will be required to be provided in accordance with the foregoing sentence on or prior to the fifth business day of the commencement of the next succeeding guarantee and pledge availability period.
The Charter Operating notes are senior debt obligations of Charter Operating and Charter Communications Operating Capital Corp. To the extent of the value of the collateral (but subject to the prior lien of the credit facilities), they rank effectively senior to all of Charter Operating’s future unsecured senior indebtedness.
Redemption Provisions of Our Notes
The various notes issued by our subsidiaries included in the table may be redeemed in accordance with the following table or are not redeemable until maturity as indicated:
|
Note Series
|
Redemption Dates
|
Percentage of Principal
|
||||
|
CCH II:
|
||||||
|
13.5% senior notes due 2016
|
December 1, 2012 – November 30, 2013
|
106.75%
|
||||
|
December 1, 2013 – November 30, 2014
|
103.375%
|
|||||
|
December 1, 2014 – November 30, 2015
|
101.6875%
|
|||||
|
Thereafter
|
100.000%
|
|||||
|
CCO Holdings:
|
||||||
|
7.25% senior notes due 2017
|
October 30, 2013 – October 29, 2014
|
105.438%
|
||||
|
October 30, 2014 – October 29, 2015
|
103.625%
|
|||||
|
October 30, 2015 – October 29, 2016
|
101.813%
|
|||||
|
Thereafter
|
100.000%
|
|||||
|
7.875% senior notes due 2018
|
April 30, 2013 – April 29, 2014
|
105.906%
|
||||
|
April 30, 2014 – April 29, 2015
|
103.938%
|
|||||
|
April 30, 2015 – April 29, 2016
|
101.969%
|
|||||
|
Thereafter
|
100.000%
|
|||||
|
8.125% senior notes due 2020
|
April 30, 2015 – April 29, 2016
|
104.063%
|
||||
|
April 30, 2016 – April 29, 2017
|
102.708%
|
|||||
|
April 30, 2017 – April 29, 2018
|
101.354%
|
|||||
57
|
Thereafter
|
100.000%
|
|||||
|
Charter Operating:
|
||||||
|
8% senior second-lien notes due 2012
|
Non-callable
|
*
|
||||
|
10.875% senior second-lien notes due 2014
|
March 15, 2012 – March 14, 2013
|
105.483%
|
||||
|
March 15, 2013 – March 14, 2014
|
102.719%
|
|||||
|
Thereafter
|
100.000%
|
|
|
*
|
Charter Operating may, at any time and from time to time, at their option, redeem the outstanding 8% second lien notes due 2012, in whole or in part, at a redemption price equal to 100% of the principal amount thereof plus accrued and unpaid interest, if any, to the redemption date, plus the Make-Whole Premium. The Make-Whole Premium is an amount equal to the excess of (a) the present value of the remaining interest and principal payments due on an 8% senior second-lien notes due 2012 to its final maturity date, computed using a discount rate equal to the Treasury Rate on such date plus 0.50%, over (b) the outstanding principal amount of such note.
|
In the event that a specified change of control event occurs, each of the respective issuers of the notes must offer to repurchase any then outstanding notes at 101% of their principal amount or accrued value, as applicable, plus accrued and unpaid interest, if any.
Summary of Restrictive Covenants of Our Notes
The following description is a summary of certain restrictions of our Debt Agreements. The summary does not restate the terms of the Debt Agreements in their entirety, nor does it describe all restrictions of the Debt Agreements. The agreements and instruments governing each of the Debt Agreements are complicated and you should consult such agreements and instruments for more detailed information regarding the Debt Agreements.
The notes issued by certain of our subsidiaries (together, the “note issuers”) were issued pursuant to indentures that contain covenants that restrict the ability of the note issuers and their subsidiaries to, among other things:
|
·
|
incur indebtedness;
|
|
·
|
pay dividends or make distributions in respect of capital stock and other restricted payments;
|
|
·
|
issue equity;
|
|
·
|
make investments;
|
|
·
|
create liens;
|
|
·
|
sell assets;
|
|
·
|
consolidate, merge, or sell all or substantially all assets;
|
|
·
|
enter into sale leaseback transactions;
|
|
·
|
create restrictions on the ability of restricted subsidiaries to make certain payments; or
|
|
·
|
enter into transactions with affiliates.
|
However, such covenants are subject to a number of important qualifications and exceptions. Below we set forth a brief summary of certain of the restrictive covenants.
Restrictions on Additional Debt
The limitations on incurrence of debt and issuance of preferred stock contained in various indentures permit each of the respective notes issuers and its restricted subsidiaries to incur additional debt or issue preferred stock, so long as, after giving pro forma effect to the incurrence, the leverage ratio would be below a specified level for each of the note issuers. The leverage ratios for CCH II, CCO Holdings and Charter Operating are as follows:
|
Issuer
|
Leverage Ratio
|
|
|
CCH II
|
5.75 to 1
|
|
|
CCO Holdings
|
6.0 to 1
|
|
|
Charter Operating
|
4.25 to 1
|
58
In addition, regardless of whether the leverage ratio could be met, so long as no default exists or would result from the incurrence or issuance, each issuer and their restricted subsidiaries are permitted to issue among other permitted indebtedness:
|
|
·
|
up to an amount of debt under credit facilities not otherwise allocated as indicated below:
|
|
·
|
CCH II: $1 billion
|
|
·
|
CCO Holdings: $1.5 billion
|
|
·
|
Charter Operating: $6.8 billion
|
|
|
·
|
up to $75 million of debt incurred to finance the purchase or capital lease of new assets;
|
|
|
·
|
up to $300 million of additional debt for any purpose (in the case of CCO Holdings notes, the limit is the greater of $300 million and 5% of consolidated net tangible assets); and
|
|
|
·
|
other items of indebtedness for specific purposes such as intercompany debt, refinancing of existing debt, and interest rate swaps to provide protection against fluctuation in interest rates.
|
Indebtedness under a single facility or agreement may be incurred in part under one of the categories listed above and in part under another, and generally may also later be reclassified into another category including as debt incurred under the leverage ratio. Accordingly, indebtedness under our credit facilities is incurred under a combination of the categories of permitted indebtedness listed above. The restricted subsidiaries of note issuers are generally not permitted to issue subordinated debt securities.
Restrictions on Distributions
Generally, under the various indentures each of the note issuers and their respective restricted subsidiaries are permitted to pay dividends on or repurchase equity interests, or make other specified restricted payments, only if the applicable issuer can incur $1.00 of new debt under the applicable leverage ratio test after giving effect to the transaction and if no default exists or would exist as a consequence of such incurrence. If those conditions are met, restricted payments may be made in a total amount of up to the following amounts for the applicable issuer as indicated below:
|
·
|
CCH II: the sum of 100% of CCH II’s Consolidated EBITDA, as defined, minus 1.3 times its Consolidated Interest Expense, as defined, cumulatively from October 1, 2009 plus 100% of new cash and appraised non-cash equity proceeds received by CCH II and not allocated to certain investments, cumulatively from November 30, 2009;
|
|
·
|
CCO Holdings: the sum of 100% of CCO Holdings’ Consolidated EBITDA, as defined, minus 1.3 times its Consolidated Interest Expense, as defined, cumulatively from April 1, 2010, plus 100% of new cash and appraised non-cash equity proceeds received by CCO Holdings and not allocated to certain investments, cumulatively from the issue date, plus $2 billion; and
|
|
·
|
Charter Operating: the sum of 100% of Charter Operating’s Consolidated EBITDA, as defined, minus 1.3 times its Consolidated Interest Expense, as defined, plus 100% of new cash and appraised non-cash equity proceeds received by Charter Operating and not allocated to certain investments, cumulatively from April 1, 2004, plus $100 million.
|
In addition, each of the note issuers may make distributions or restricted payments, so long as no default exists or would be caused by transactions among other distributions or restricted payments:
|
|
·
|
to repurchase management equity interests in amounts not to exceed $10 million per fiscal year;
|
|
|
·
|
regardless of the existence of any default, to pay pass-through tax liabilities in respect of ownership of equity interests in the applicable issuer or its restricted subsidiaries; or
|
|
|
·
|
to make other specified restricted payments including merger fees up to 1.25% of the transaction value, repurchases using concurrent new issuances, and certain dividends on existing subsidiary preferred equity interests.
|
Charter Operating and its restricted subsidiaries may make distributions or restricted payments: (i) so long as certain defaults do not exist and even if the applicable leverage test referred to above is not met, to enable certain of its parents to pay interest on certain of their indebtedness or (ii) so long as the applicable issuer could incur $1.00 of indebtedness under the applicable leverage ratio test referred to above, to enable certain of its parents to purchase, redeem or refinance certain indebtedness. CCO Holdings may make distributions or restricted payments even if the applicable leverage test referred to above is not met to enable any parent to pay interest on, or to purchase, redeem, repay or prepay certain of their indebtedness.
59
Restrictions on Investments
Each of the note issuers and their respective restricted subsidiaries may not make investments except (i) permitted investments or (ii) if, after giving effect to the transaction, their leverage would be above the applicable leverage ratio.
Permitted investments include, among others:
|
·
|
investments in and generally amoung restricted subsidiaries or by restricted subsidiaries in the applicable issuer;
|
|
·
|
For CCH II:
|
|
·
|
investments aggregating up to $650 million at any time outstanding;
|
|
·
|
investments aggregating up to 100% of new cash equity proceeds received by CCH II since November 30, 2009 to the extent the proceeds have not been allocated to the restricted payments covenant;
|
|
·
|
For CCO Holdings:
|
|
·
|
investments aggregating up to $750 million at any time outstanding;
|
|
·
|
investments aggregating up to 100% of new cash equity proceeds received by CCO Holdings since the issue date to the extent the proceeds have not been allocated to the restricted payments covenant;
|
|
·
|
For Charter Operating:
|
|
·
|
investments aggregating up to $750 million at any time outstanding;
|
|
·
|
investments aggregating up to 100% of new cash equity proceeds received by CCO Holdings since April 27, 2004 to the extent the proceeds have not been allocated to the restricted payments covenant.
|
Restrictions on Liens
Charter Operating and its restricted subsidiaries are not permitted to grant liens senior to the liens securing the Charter Operating notes, other than permitted liens, on their assets to secure indebtedness or other obligations, if, after giving effect to such incurrence, the senior secured leverage ratio (generally, the ratio of obligations secured by first priority liens to four times the last quarterly EBITDA, as defined, for the most recent fiscal quarter for which internal financial reports are available) would exceed 3.75 to 1.0. The restrictions on liens for each of the other note issuers only applies to liens on assets of the issuers themselves and does not restrict liens on assets of subsidiaries. With respect to all of the note issuers, permitted liens include liens securing indebtedness and other obligations under credit facilities (subject to specified limitations in the case of Charter Operating), liens securing the purchase price of financed new assets, liens securing indebtedness of up to $50 million (in the case of CCO Holdings notes, the greater of $50 million and 1.0% of consolidated net tangible assets) and other specified liens.
Restrictions on the Sale of Assets; Mergers
The note issuers are generally not permitted to sell all or substantially all of their assets or merge with or into other companies unless their leverage ratio after any such transaction would be no greater than their leverage ratio immediately prior to the transaction, or unless after giving effect to the transaction, leverage would be below the applicable leverage ratio for the applicable issuer, no default exists, and the surviving entity is a U.S. entity that assumes the applicable notes.
The note issuers and their restricted subsidiaries may generally not otherwise sell assets or, in the case of restricted subsidiaries, issue equity interests, in excess of $100 million unless they receive consideration at least equal to the fair market value of the assets or equity interests, consisting of at least 75% in cash, assumption of liabilities, securities converted into cash within 60 days, or productive assets. The note issuers and their restricted subsidiaries are then required within 365 days after any asset sale either to use or commit to use the net cash proceeds over a specified threshold to acquire assets used or useful in their businesses or use the net cash proceeds to repay specified debt, or to offer to repurchase the issuer’s notes with any remaining proceeds.
Restrictions on Sale and Leaseback Transactions
The note issuers and their restricted subsidiaries may generally not engage in sale and leaseback transactions unless, at the time of the transaction, the applicable issuer could have incurred secured indebtedness under its leverage ratio test in an amount equal to the present value of the net rental payments to be made under the lease, and the sale of the assets and application of proceeds is permitted by the covenant restricting asset sales.
60
Prohibitions on Restricting Dividends
The note issuers’ restricted subsidiaries may generally not enter into arrangements involving restrictions on their ability to make dividends or distributions or transfer assets to the applicable note issuer unless those restrictions with respect to financing arrangements are on terms that are no more restrictive than those governing the credit facilities existing when they entered into the applicable indentures or are not materially more restrictive than customary terms in comparable financings and will not materially impair the applicable note issuers’ ability to make payments on the notes.
Affiliate Transactions
The indentures also restrict the ability of the note issuers and their restricted subsidiaries to enter into certain transactions with affiliates involving consideration in excess of $15 million ($25 million in the case of CCO Holdings notes) without a determination by the board of directors of the applicable note issuer
that the transaction complies with this covenant, or transactions with affiliates involving over $50 million ($100 million in the case of CCO Holdings notes) without receiving an opinion as to the fairness to the holders of such transaction from a financial point of view issued by an accounting, appraisal or investment banking firm of national standing.
Cross Acceleration
The indentures of our subsidiaries include various events of default, including cross acceleration provisions. Under these provisions, a failure by any of the issuers or any of their restricted subsidiaries to pay at the final maturity thereof the principal amount of other indebtedness having a principal amount of $100 million or more (or any other default under any such indebtedness resulting in its acceleration) would result in an event of default under the indenture governing the applicable notes. As a result, an event of default related to the failure to repay principal at maturity or the acceleration of the indebtedness under the CCH II notes, CCO Holdings notes, CCO Holdings credit facility, Charter Operating notes or the Charter Operating credit facilities could cause cross-defaults under our subsidiaries’ indentures.
Recently Issued Accounting Standards
In October 2009, the FASB issued guidance included in ASU 2009-13,
Multiple-Deliverable Revenue Arrangements
(“ASU 2009-13”). ASU 2009-13 sets forth requirements that must be met for an entity to recognize revenue from the sale of a delivered item that is part of a multiple-element arrangement when other items have not yet been delivered. We adopted ASU 2009-13 on January 1, 2011. The adoption did not have a material impact to our consolidated financial statements.
In January 2010, the FASB issued guidance included in ASU 2010-06,
Fair Value Measurements and Disclosures – Improving Disclosures about Fair Value Measurements
(“ASU 2010-06”). ASU 2010-06 provides amendments to Topic 820 to provide more robust fair value disclosures. The disclosures about purchases, sales, issuances and settlements relating to Level 3 measurements is effective for fiscal years beginning after December 15, 2010 and all interim periods within. We adopted ASU 2010-06 on January 1, 2011. The adoption did not have a material impact on our consolidated financial statements.
Interest Rate Risk
We are exposed to various market risks, including fluctuations in interest rates. We have used interest rate swap agreements
to manage our interest costs and reduce our exposure to increases in floating interest rates
. We manage our exposure to fluctuations in interest rates by maintaining a mix of fixed and variable rate debt. Using interest rate swap agreements, we agree to exchange, at specified intervals through 2015, the difference between fixed and variable interest amounts calculated by reference to agreed-upon notional principal amounts.
As of December 31, 2010 and 2009, the accreted value of our debt was approximately $12.3 billion and $13.3 billion, respectively. As of December 31, 2010 and 2009, the weighted average interest rate on the credit facility debt, including the effects of our interest rate swap agreements, was approximately 3.8% and 2.6%, respectively, and the weighted average interest rate on the high-yield notes was approximately 9.7% and 10.4%, respectively, resulting in a blended weighted average interest rate of 6.7% and 5.5%, respectively. The increase in the credit
61
facility and blended weighted average interest rates is primarily due to the $2.0 billion notional amount of interest rate swap agreements entered into in April 2010. The interest rate on approximately 65% and 37% of the total principal amount of our debt was effectively fixed, including the effects of our interest rate swap agreements, as of December 31, 2010 and 2009, respectively.
We do not hold or issue derivative instruments for speculative trading purposes. We have interest rate derivative instruments that have been designated as cash flow hedging instruments. Such instruments effectively convert variable interest payments on certain debt instruments into fixed payments. For qualifying hedges, realized derivative gains and losses offset related results on hedged items in the consolidated statements of operations. We formally document, designate and assess the effectiveness of transactions that receive hedge accounting.
For each of the years ended December 31, 2010, 2009 and 2008, there was no cash flow hedge ineffectiveness on interest rate swap agreements.
Changes in the fair value of interest rate agreements that are designated as hedging instruments of the variability of cash flows associated with floating-rate debt obligations, and that meet effectiveness criteria are reported in other comprehensive loss. For the years ended December 31, 2010, 2009 and 2008, losses of $57 million, $9 million and $180 million, respectively, were recorded in other comprehensive loss. The amounts are subsequently reclassified as an increase or decrease to interest expense in the same periods in which the related interest on the floating-rate debt obligations affects earnings (losses).
Certain interest rate derivative instruments were not designated as hedges as they did not meet effectiveness criteria. However, management believes such instruments were closely correlated with the respective debt, thus managing associated risk. Interest rate derivative instruments not designated as hedges were marked to fair value, with the impact recorded as other income (expenses), net in our consolidated statements of operations. For the years ended
December 31, 2009 and 2008
, other income (expense), net included losses of $4 million and $62 million, respectively, resulting from interest rate derivative instruments not designated as hedges.
We did not hold any interest rate derivatives not designated as hedges during 2010.
The table set forth below summarizes the fair values and contract terms of financial instruments subject to interest rate risk maintained by us as of December 31, 2010 (dollars in millions) and does not reflect the issuance of the CCO Holdings notes in January 2011 and the application of proceeds to repay borrowings under the Charter Operating credit facilities:
|
2011
|
2012
|
2013
|
2014
|
2015
|
Thereafter
|
Total
|
Fair Value at December 31, 2010
|
|||||||||||||||||||||||||
|
Debt:
|
||||||||||||||||||||||||||||||||
|
Fixed Rate
|
$ | -- | $ | 1,100 | $ | -- | $ | 546 | $ | -- | $ | 4,366 | $ | 6,012 | $ | 6,596 | ||||||||||||||||
|
Average Interest Rate
|
-- | 8.00 | % | -- | 10.88 | % | -- | 10.05 | % | 9.75 | % | |||||||||||||||||||||
|
Variable Rate
|
$ | 58 | $ | 58 | $ | 337 | $ | 2,985 | $ | 30 | $ | 2,836 | $ | 6,304 | $ | 6,252 | ||||||||||||||||
|
Average Interest Rate
|
3.50 | % | 4.24 | % | 4.75 | % | 5.69 | % | 7.25 | % | 7.75 | % | 6.54 | % | ||||||||||||||||||
|
Interest Rate Instruments:
|
||||||||||||||||||||||||||||||||
|
Variable to Fixed Rate
|
$ | -- | $ | -- | $ | 900 | $ | 800 | $ | 300 | $ | -- | $ | 2,000 | $ | 57 | ||||||||||||||||
|
Average Pay Rate
|
-- | -- | 5.21 | % | 5.65 | % | 5.99 | % | -- | 5.50 | % | |||||||||||||||||||||
|
Average Receive Rate
|
-- | -- | 5.51 | % | 6.41 | % | 7.00 | % | -- | 6.09 | % | |||||||||||||||||||||
Amounts outstanding under the revolving credit facility mature on March 6, 2015; provided, however, that unless otherwise directed by the revolving lenders holding more than 50% of the revolving commitments, the termination date will be December 1, 2013 if, on December 1, 2013, Charter Operating and its subsidiaries do not have less than $1.0 billion of indebtedness on a consolidated basis with maturities between January 1, 2014 and April 30, 2014. Because Charter Operating currently has indebtedness in excess of $1.0 billion with maturities between January 1, 2014 and April 30, 2014, the amount outstanding under the revolving credit facility is included in 2013 in the above table.
At December 31, 2010, we had $2.0 billion in notional amounts of interest rate swaps outstanding.
The notional amounts of interest rate instruments do not represent amounts exchanged by the parties and, thus, are not a measure of our exposure to credit loss. The amounts exchanged are determined by reference to the notional amount and the
62
other terms of the contracts. The estimated fair value is determined using a present value calculation based on an implied forward LIBOR curve (adjusted for Charter Operating’s or counterparties’ credit risk). Interest rates on variable debt are estimated using the average implied forward LIBOR for the year of maturity based on the yield curve in effect at December 31, 2010 including applicable bank spread.
Our consolidated financial statements, the related notes thereto, and the reports of independent accountants are included in this annual report beginning on page F-1.
None.
Conclusion Regarding the Effectiveness of Disclosure Controls and Procedures
As of the end of the period covered by this report, under the supervision and with the participation of our management, including our Chief Executive Officer and Chief Financial Officer, we have evaluated the effectiveness of the design and operation of our disclosure controls and procedures with respect to the information generated for use in this annual report. The evaluation was based in part upon reports and certifications provided by a number of executives. Based upon, and as of the date of that evaluation, our Chief Executive Officer and Chief Financial Officer concluded that the disclosure controls and procedures were effective to provide reasonable assurances that information required to be disclosed in the reports we file or submit under the Securities Exchange Act of 1934 is recorded, processed, summarized and reported within the time periods specified in the SEC’s rules and forms.
In designing and evaluating the disclosure controls and procedures, our management recognized that any controls and procedures, no matter how well designed and operated, can provide only reasonable, not absolute, assurance of achieving the desired control objectives, and management necessarily was required to apply its judgment in evaluating the cost-benefit relationship of possible controls and procedures. Based upon the above evaluation, we believe that our controls provide such reasonable assurances.
There was no change in our internal control over financial reporting during the fourth quarter of 2010 that has materially affected, or is reasonably likely to materially affect, our internal control over financial reporting.
Management’s Report on Internal Control Over Financial Reporting
Our management is responsible for establishing and maintaining adequate internal control over financial reporting (as defined in Rule 13a-15(f) under the Exchange Act) for the Company. Our internal control system was designed to provide reasonable assurance to Charter’s management and board of directors regarding the preparation and fair presentation of published financial statements.
Management has assessed the effectiveness of our internal control over financial reporting as of December 31, 2010. In making this assessment, we used the criteria set forth by the Committee of Sponsoring Organizations of the Treadway Commission (“COSO”) in
Internal Control
— Integrated Framework
.
Based on management’s assessment utilizing these criteria we believe that, as of December 31, 2010, our internal control over financial reporting was effective
.
Our independent auditors, KPMG LLP, have audited our internal control over financial reporting as stated in their report on page F-2.
None.
63
The information required by Item 10 will be included in Charter’s 2011 Proxy Statement (the “Proxy Statement”) under the headings “Election of Class A Directors,” “Section 16(a) Beneficial Ownership Reporting Requirements,” and “Code of Ethics,” or in amendment to this Annual Report on Form 10-K and is incorporated herein by reference.
The information required by Item 11 will be included in the Proxy Statement under the headings “Executive Compensation,” “Election of Class A Directors – Director Compensation” and “Compensation Discussion and Analysis,” or in an amendment to this Annual Report on Form 10-K and is incorporated herein by reference. Information contained in the Proxy Statement or an amendment to this Annual Report on Form 10-K under the caption “Report of Compensation and Benefits Committee” is furnished and not deemed filed with the SEC.
The information required by Item 12 will be included in the Proxy Statement under the heading “Security Ownership of Certain Beneficial Owners and Management” or in amendment to this Annual Report on Form 10-K and is incorporated herein by reference.
The information required by Item 13 will be included in the Proxy Statement under the heading “Certain Relationships and Related Transactions” and “Election of Class A Directors” or in amendment to this Annual Report on Form 10-K and is incorporated herein by reference.
The information required by Item 14 will be included in the Proxy Statement under the heading “Accounting Matters” or in amendment to this Annual Report on Form 10-K and is incorporated herein by reference.
64
|
|
(a)
|
The following documents are filed as part of this annual report:
|
|
|
(1)
|
Financial Statements.
|
A listing of the financial statements, notes and reports of independent public accountants required by Item 8 begins on page F-1 of this annual report.
|
|
(2)
|
Financial Statement Schedules.
|
No financial statement schedules are required to be filed by Items 8 and 15(d) because they are not required or are not applicable, or the required information is set forth in the applicable financial statements or notes thereto.
|
|
(3)
|
The index to the exhibits begins on page E-1 of this annual report.
|
65
Pursuant to the requirements of Section 13 or 15(d) of the Securities Exchange Act of 1934, Charter Communications, Inc. has duly caused this annual report to be signed on its behalf by the undersigned, thereunto duly authorized.
|
CHARTER COMMUNICATIONS, INC.,
|
||||
|
Registrant
|
||||
|
By:
|
/s/ Michael J. Lovett
|
|||
|
Michael J. Lovett
|
||||
|
President, Chief Executive Officer and Director
|
||||
|
Date: March 1, 2011
|
||||
Pursuant to the requirements of the Securities Exchange Act of 1934, this report has been signed below by the following persons on behalf of Charter Communications, Inc. and in the capacities and on the dates indicated.
|
Signature
|
Title
|
Date
|
||
|
/s/ Michael J. Lovett
Michael J. Lovett
|
President, Chief Executive Officer, Director
(Principal Executive Officer)
|
March 1, 2011
|
||
|
/s/ Christopher L. Winfrey
Christopher L. Winfrey
|
Executive Vice President and Chief Financial Officer
(Principal Financial Officer)
|
March 1, 2011
|
||
|
/s/ Kevin D. Howard
Kevin D. Howard
|
Senior Vice President – Finance, Controller and Chief
Accounting Officer (Principal Accounting Officer)
|
March 1, 2011
|
||
|
/s/ Robert Cohn
Robert Cohn
|
Director
|
March 1, 2011
|
||
|
/s/ W. Lance Conn
W. Lance Conn
|
Director
|
March 1, 2011
|
||
|
/s/ Darren Glatt
Darren Glatt
|
Director
|
March 1, 2011
|
||
|
/s/ Craig A. Jacobson
Craig A. Jacobson
|
Director
|
March 1, 2011
|
||
|
/s/ Bruce A. Karsh
Bruce A. Karsh
|
Director
|
March 1, 2011
|
||
|
/s/ Edgar Lee
Edgar Lee
|
Director
|
March 1, 2011
|
||
|
/s/ John D. Markley, Jr.
John D. Markley, Jr.
|
Director
|
March 1, 2011
|
||
|
/s/ David C. Merritt
David C. Merritt
|
Director
|
March 1, 2011
|
||
|
/s/ Stan Parker
Stan Parker
|
Director
|
March 1, 2011
|
||
|
/s/ Eric L. Zinterhofer
Eric L. Zinterhofer
|
Director
|
March 1, 2011
|
S-1
Exhibits are listed by numbers corresponding to the Exhibit Table of Item 601 in Regulation S-K.
|
Exhibit
|
Description
|
|
|
2.1
|
Debtors’ Joint Plan of Reorganization filed pursuant to Chapter 11 of the United States Bankruptcy Code filed on July 15, 2009 with the United States Bankruptcy Court for the Southern District of New York in Case No. 09-11435 (Jointly Administered) (incorporated by reference to Exhibit 10.2 to the quarterly report on Form 10-Q of Charter Communications, Inc. filed on August 6, 2009 (File No. 001-33664).
|
|
|
3.1
|
Amended and Restated Certificate of Incorporation of Charter Communications, Inc. (originally incorporated July 22, 1999) (incorporated by reference to Exhibit 3.1 to the current report on Form 8-K of Charter Communications, Inc. filed on August 20, 2010 (File No. 001-33664)).
|
|
|
3.2
|
Amended and Restated By-laws of Charter Communications, Inc. as of November 30, 2009 (incorporated by reference to Exhibit 3.2 to the current report on Form 8-K of Charter Communications, Inc. filed on December 4, 2009 (File No. 001-33664)).
|
|
|
4.1
|
Warrant Agreement, dated as of November 30, 2009, by and between Charter Communications, Inc. and Mellon Investor Services LLC (incorporated by reference to Exhibit 4.1 to the current report on Form 8-K of Charter Communications, Inc. filed on December 4, 2009 (File No. 001-33664)).
|
|
|
4.2
|
Warrant Agreement, dated as of November 30, 2009, by and between Charter Communications, Inc. and Mellon Investor Services LLC (incorporated by reference to Exhibit 4.2 to the current report on Form 8-K of Charter Communications, Inc. filed on December 4, 2009 (File No. 001-33664)).
|
|
|
4.3
|
Warrant Agreement, dated as of November 30, 2009, by and between Charter Communications, Inc. and Mellon Investor Services LLC (incorporated by reference to Exhibit 4.3 to the current report on Form 8-K of Charter Communications, Inc. filed on December 4, 2009 (File No. 001-33664)).
|
|
|
10.1(a)
|
Restructuring Agreement, dated February 11, 2009, by and between Charter Communications, Inc. and certain members of the Crossover Committee (incorporated by reference to Exhibit 10.1 to the current report on Form 8-K of Charter Communications, Inc. filed on February 13, 2009 (File No. 001-33664)).
|
|
|
10.1(b)
|
Amendment to Restructuring Agreement, dated July 30, 2009, by and between Charter Communications, Inc. and certain members of the Crossover Committee (incorporated by reference to Exhibit 10.1 to the quarterly report on Form 10-Q of Charter Communications, Inc. filed on November 9, 2009 (File No. 001-33664)).
|
|
|
10.1(c)
|
Second Amendment to Restructuring Agreement, dated September 29, 2009, by and between Charter Communications, Inc. and certain members of the Crossover Committee (incorporated by reference to Exhibit 10.3 to the quarterly report on Form 10-Q of Charter Communications, Inc. filed on November 9, 2009 (File No. 001-33664)).
|
|
|
10.1(d)
|
Third Amendment to Restructuring Agreement, dated October 13, 2009, by and between Charter Communications, Inc. and certain members of the Crossover Committee (incorporated by reference to Exhibit 10.5 to the quarterly report on Form 10-Q of Charter Communications, Inc. filed on November 9, 2009 (File No. 001-33664)).
|
|
|
10.1(e)
|
Fourth Amendment to Restructuring Agreement, dated October 30, 2009, by and between Charter Communications, Inc. and certain members of the Crossover Committee (incorporated by reference to Exhibit 10.7 to the quarterly report on Form 10-Q of Charter Communications, Inc. filed on November 9, 2009 (File No. 001-33664)).
|
|
|
10.1(f)
|
Fifth Amendment to Restructuring Agreement, dated November 10, 2009, by and between Charter Communications, Inc. and certain members of the Crossover Committee (incorporated by reference to same numbered exhibit to the Registration Statement on Form S-1 of Charter Communications, Inc. filed on December 31, 2009 (SEC File No. 333-164105)).
|
|
|
10.1(g)
|
Sixth Amendment to Restructuring Agreement, dated November 25, 2009, by and between Charter Communications, Inc. and certain members of the Crossover Committee (incorporated by reference to same numbered exhibit to the Registration Statement on Form S-1 of Charter Communications, Inc. filed on December 31, 2009 (SEC File No. 333-164105)).
|
|
|
10.2(a)
|
Restructuring Agreement, dated as of February 11, 2009, by and among Paul G. Allen, Charter Investment, Inc. and Charter Communications, Inc. (incorporated by reference to Exhibit 10.4 to the current report on Form 8-K of Charter Communications, Inc. filed on February 13, 2009 (File No. 001-33664)).
|
|
|
10.2(b)
|
Amendment to Restructuring Agreement, dated July 30, 2009, by and among Paul G. Allen, Charter
|
E-1
|
|
Investment, Inc. and Charter Communications, Inc. (incorporated by reference to Exhibit 10.2 to the quarterly report on Form 10-Q of Charter Communications, Inc. filed on November 9, 2009 (File No. 001-33664)).
|
|
|
10.2(c)
|
Second Amendment to Restructuring Agreement, dated September 29, 2009, by and among Paul G. Allen, Charter Investment, Inc. and Charter Communications, Inc. (incorporated by reference to Exhibit 10.4 to the quarterly report on Form 10-Q of Charter Communications, Inc. filed on November 9, 2009 (File No. 001-33664)).
|
|
|
10.2(d)
|
Third Amendment to Restructuring Agreement, dated October 13, 2009, by and among Paul G. Allen, Charter Investment, Inc. and Charter Communications, Inc. (incorporated by reference to Exhibit 10.6 to the quarterly report on Form 10-Q of Charter Communications, Inc. filed on November 9, 2009 (File No. 001-33664)).
|
|
|
10.2(e)
|
Fourth Amendment to Restructuring Agreement, dated October 30, 2009, by and among Paul G. Allen, Charter Investment, Inc. and Charter Communications, Inc. (incorporated by reference to Exhibit 10.8 to the quarterly report on Form 10-Q of Charter Communications, Inc. filed on November 9, 2009 (File No. 001-33664)).
|
|
|
10.2(f)
|
Fifth Amendment to Restructuring Agreement, dated November 11, 2009, by and among Paul G. Allen, Charter Investment, Inc. and Charter Communications, Inc. (incorporated by reference to same numbered exhibit to the Registration Statement on Form S-1 of Charter Communications, Inc. filed on December 31, 2009 (SEC File No. 333-164105)).
|
|
|
10.2(g)
|
Sixth Amendment to Restructuring Agreement, dated November 25, 2009, by and among Paul G. Allen, Charter Investment, Inc. and Charter Communications, Inc. (incorporated by reference to same numbered exhibit to the Registration Statement on Form S-1 of Charter Communications, Inc. filed on December 31, 2009 (SEC File No. 333-164105)).
|
|
|
10.3
|
Indenture relating to the 13.50% senior notes due 2016, dated as of November 30, 2009, by and among CCH II, LLC, CCH II Capital Corp. and The Bank of New York Mellon Trust Company, NA (incorporated by reference to Exhibit 10.1 to the current report on Form 8-K of Charter Communications, Inc. filed on December 4, 2009 (File No. 001-33664)).
|
|
|
10.4
|
Indenture relating to the 7.875% Senior Notes due 2018 and 8.125% Senior Notes due 2020, dated as of April 18, 2010, by and among CCO Holdings, LLC, CCO Holdings Capital Corp. and The Bank of New York Mellon Trust Company, N.A., as trustee (incorporated by reference to Exhibit 10.6 to the registration statement on Form S-1of Charter Communications, Inc. filed on June 30, 2010 (File No. 333-167877)).
|
|
|
10.5
|
Indenture relating to the 7.25% senior notes due 2017, dated as of September 27, 2010, by and among CCO Holdings, LLC, and CCO Holdings Capital Corp., as Issuers, Charter Communications, Inc., as Parent Guarantor, and The Bank of New York Mellon Trust Company, N.A., as Trustee (incorporated by reference to Exhibit 10.1 to the current report on Form 8-K of Charter Communications, Inc. filed on September 30, 2010 (File No. 001-33664)).
|
|
|
10.6
|
Indenture relating to the 7.00% senior notes due 2019, dated as of January 11, 2011, by and among CCO Holdings, LLC, and CCO Holdings Capital Corp., as Issuers, Charter Communications, Inc., as Parent Guarantor, and The Bank of New York Mellon Trust Company, N.A., as Trustee (incorporated by reference to Exhibit 10.1 to the current report on Form 8-K of Charter Communications, Inc. filed on January 14, 2011 (File No. 001-33664)).
|
|
|
10.7
|
Indenture relating to the 8% senior second lien notes due 2012 dated as of April 27, 2004, by and among Charter Communications Operating, LLC, Charter Communications Operating Capital Corp. and Wells Fargo Bank, N.A. as trustee (incorporated by reference to Exhibit 10.32 to Amendment No. 2 to the registration statement on Form S-4 of CCH II, LLC filed on May 5, 2004 (File No. 333-111423)).
|
|
|
10.8(a)
|
Indenture relating to the 10.875% senior second lien notes due 2014 dated as of March 19, 2008, by and among Charter Communications Operating, LLC, Charter Communications Operating Capital Corp. and Wilmington Trust Company, trustee (incorporated by reference to Exhibit 10.1 to the quarterly report filed on Form 10-Q of Charter Communications, Inc. filed on May 12, 2008 (File No. 000-027927)).
|
|
|
10.8(b)
|
Collateral Agreement, dated as of March 19, 2008 by and among Charter Communications Operating, LLC, Charter Communications Operating Capital Corp., CCO Holdings, LLC and certain of its subsidiaries in favor of Wilmington Trust Company, as trustee (incorporated by reference to Exhibit 10.2 to the quarterly report filed on Form 10-Q of Charter Communications, Inc. filed on May 12, 2008 (File No. 000-027927)).
|
|
|
10.9
|
Registration Rights Agreement, dated as of November 30, 2009, by and among Charter Communications, Inc. and certain investors listed therein (incorporated by reference to Exhibit 10.2 to the current report on Form 8-K of Charter Communications, Inc. filed on December 4, 2009 (File
|
E-2
|
|
No. 001-33664)).
|
|
|
10.10
|
Exchange and Registration Rights Agreement, dated as of November 30, 2009, by and among CCH II, LLC, CCH II Capital Corp and certain investors listed therein (incorporated by reference to Exhibit 10.3 to the current report on Form 8-K of Charter Communications, Inc. filed on December 4, 2009 (File No. 001-33664)).
|
|
|
10.11
|
Exchange and Registration Rights Agreement related to the 7.875% Senior Notes due 2018 of CCO Holdings, LLC, CCO Holdings Capital Corp., dated as of April 28, 2010, by and among CCO Holdings, LLC, CCO Holdings Capital Corp., Charter Communications, Inc. and Credit Suisse Securities (USA) LLC, as representative of the several initial purchasers (incorporated by reference to Exhibit 10.9 to the registration statement on Form S-1of Charter Communications, Inc. filed on June 30, 2010 (File No. 333-167877)).
|
|
|
10.12
|
Exchange and Registration Rights Agreement related to the 8.125% Senior Notes due 2020 of CCO Holdings, LLC, CCO Holdings Capital Corp., dated as April 28, 2010, by and among CCO Holdings, LLC, CCO Holdings Capital Corp., Charter Communications, Inc. and Credit Suisse Securities (USA) LLC, as representative of the several initial purchasers (incorporated by reference to Exhibit 10.10 to the registration statement on Form S-1of Charter Communications, Inc. filed on June 30, 2010 (File No. 333-167877)).
|
|
|
10.13
|
Exchange and Registration Rights Agreement relating to the 7.25% senior notes due 2017, dated as of September 27, 2010,
by and among
CCO Holdings, LLC, CCO Holdings Capital Corp., Charter Communications, Inc., and
Citigroup Global Markets Inc., Banc of America Securities LLC, Credit Suisse Securities (USA) LLC, Deutsche Bank Securities Inc., and UBS Securities LLC, as representatives of the initial purchasers (incorporated by reference to Exhibit 10.2 to the current report on Form 8-K of Charter Communications, Inc. filed on September 30, 2010 (File No. 001-33664)).
|
|
|
10.14
|
Exchange and Registration Rights Agreement relating to $300 Million aggregate principal amount of the 7.00% senior notes due 2019, dated as of January 25, 2011 by and among CCO Holdings, LLC, CCO Holdings Capital Corp., Charter Communications, Inc., and
Deutsche Bank Securities Inc.,
Merrill Lynch, Pierce, Fenner & Smith Incorporated,
Citigroup Global Markets Inc., Credit Suisse Securities (USA) LLC, and UBS Securities LLC,
as representatives of the initial purchasers (incorporated by reference to Exhibit 10.2 to the current report on Form 8-K of Charter Communications, Inc. filed on January 27, 2011 (File No. 001-33664)).
|
|
|
10.15
|
Credit Agreement, dated as of March 6, 2007, among CCO Holdings, LLC, the lenders from time to time parties thereto and Bank of America, N.A., as administrative agent (incorporated by reference to Exhibit 10.3 to the current report on Form 8-K of Charter Communications, Inc. filed on March 12, 2007 (File No. 000-27927)).
|
|
|
10.16
|
Pledge Agreement made by CCO Holdings, LLC in favor of Bank of America, N.A., as Collateral Agent, dated as of March 6, 2007 (incorporated by reference to Exhibit 10.4 to the current report on Form 8-K of Charter Communications, Inc. filed on March 12, 2007 (File No. 000-27927)).
|
|
|
10.17
|
Amended and Restated Credit Agreement, dated as of March 31, 2010, among Charter Communications Operating, LLC, CCO Holdings, LLC, the lenders from time to time parties thereto and Bank of America, N.A., as administrative agent (incorporated by reference to Exhibit 10.1 to the current report on Form 8-K of Charter Communications, Inc. filed on April 6, 2010 (File No. 001-33664)).
|
|
|
10.18
|
Amended and Restated Guarantee and Collateral Agreement made by CCO Holdings, LLC, Charter Communications Operating, LLC and certain of its subsidiaries in favor of Bank of America, N.A., as administrative agent, dated as of March 18, 1999, as amended and restated as of March 31, 2010 (incorporated by reference to Exhibit 10.2 to the current report on Form 8-K of Charter Communications, Inc. filed on April 6, 2010 (File No. 001-33664)).
|
|
|
10.19
|
Amended and Restated Limited Liability Company Agreement, dated as of November 30, 2009, among Charter Communications, Inc, Charter Investment, Inc. and Charter Communications Holding Company, LLC (incorporated by reference to Exhibit 10.4 to the current report on Form 8-K of Charter Communications, Inc. filed on December 4, 2009 (File No. 001-33664)).
|
|
|
10.20
|
Exchange Agreement, dated as of November 30, 2009, among Charter Communications, Inc. , Charter Investment, Inc. Paul G. Allen and Charter Communications Holding Company, LLC (incorporated by reference to Exhibit 10.5 to the current report on Form 8-K of Charter Communications, Inc. filed on December 4, 2009 (File No. 001-33664)).
|
|
|
10.21(a)
|
Amended and Restated Management Agreement, dated as of June 19, 2003, between Charter Communications Operating, LLC and Charter Communications, Inc. (incorporated by reference to Exhibit 10.4 to the quarterly report on Form 10-Q filed by Charter Communications, Inc. on August 5, 2003 (File No. 333-83887)).
|
|
|
10.21(b)
|
First Amendment to the Amended and Restated Management Agreement, dated as of July 20, 2010,
|
E-3
|
|
between Charter Communications Operating, LLC and Charter Communications, Inc. (incorporated by reference to Exhibit 10.6 to the quarterly report on Form 10-Q filed by Charter Communications, Inc. on August 4, 2010 (File No. 001-33664)).
|
|
|
10.22(a)
|
Second Amended and Restated Mutual Services Agreement, dated as of June 19, 2003 between Charter Communications, Inc. and Charter Communications Holding Company, LLC (incorporated by reference to Exhibit 10.5(a) to the quarterly report on Form 10-Q filed by Charter Communications, Inc. on August 5, 2003 (File No. 000-27927)).
|
|
|
10.22(b)
|
First Amendment to the Second Amended and Restated Mutual Services Agreement, dated as of July 20, 2010, between Charter Communications, Inc. and Charter Communications Holding Company, LLC (incorporated by reference to Exhibit 10.7 to the quarterly report on Form 10-Q filed by Charter Communications, Inc. on August 4, 2010 (File No. 001-33664)).
|
|
|
10.23+
|
Charter Communications, Inc. Executive Bonus Plan (incorporated by reference to Exhibit 10.1 to the Current Report on Form 8-K of Charter Communications, Inc. filed on December 16, 2010 (File No. 001-33664)).
|
|
|
10.24+
|
Charter Communications, Inc. Executive Incentive Performance Plan (incorporated by reference to Exhibit 10.2 to the Current Report on Form 8-K of Charter Communications, Inc. filed December 16, 2010 (File No. 001-33664)).
|
|
|
10.25+
|
Charter Communications, Inc. Amended and Restated 2009 Stock Incentive Plan (incorporated by reference to Exhibit 10.1 to the Current Report on Form 8-K of Charter Communications, Inc. filed on December 21, 2009 (File No. 001-33664)).
|
|
|
10.26+
|
Summary of Charter Communications, Inc. 2010 Executive Bonus Plan (incorporated by reference to Exhibit 10.6 to the quarterly report on Form 10-Q of Charter Communications, Inc. filed on May 6, 2010 (File No. 001-33664)).
|
|
|
10.27+
|
Amended and Restated Employment Agreement between Michael J. Lovett and Charter Communications, Inc., dated effective as of February 1, 2010 (incorporated by reference to Exhibit 10.1 to the current report on Form 8-K of Charter Communications, Inc. filed on April 13, 2010 (File No. 001-33664)).
|
|
|
10.28+
|
Employment Agreement between Christopher L. Winfrey and Charter Communications, Inc., dated as of November 1, 2010 (incorporated by reference to Exhibit 10.3 to the quarterly report on Form 10-Q of Charter Communications, Inc. filed on November 3, 2010 (File No. 001-33664)).
|
|
|
10.29+*
|
Amended and Restated Employment Agreement between Marwan Fawaz and Charter Communications, Inc. dated January 3, 2011.
|
|
|
10.30(a)+*
|
Amended and Restated Employment Agreement between Ted W. Schremp and Charter Communications, Inc. dated January 3, 2011.
|
|
|
10.30(b)+*
|
Separation Agreement and Mutual Release between Ted W. Schremp and Charter Communications, Inc. dated February 22, 2011.
|
|
|
10.31+*
|
Amended and Restated Employment Agreement between Gregory Doody and Charter Communications, Inc. dated as of January 3, 2011.
|
|
|
10.32+
|
Amended and Restated Employment Agreement between Kevin D. Howard and Charter Communications, Inc. dated as of March 1, 2010 (incorporated by reference to Exhibit 10.2 to the current report on Form 8-K filed by Charter Communications, Inc. on August 2, 2010 (File No. 001-33664)).
|
|
|
10.33(a)+
|
Amended and Restated Employment Agreement between Eloise E. Schmitz and Charter Communications, Inc., dated as of July 1, 2008 (incorporated by reference to Exhibit 10.4 to the quarterly report on Form 10-Q of Charter Communications, Inc. filed on August 5, 2008 (File No. 000-27927)).
|
|
|
10.33(b)+
|
Amendment to Amended and Restated Employment Agreement of Eloise Schmitz, dated November 30, 2009 (incorporated by reference to Exhibit 10.8 to the current report on Form 8-K of Charter Communications, Inc. filed on December 4, 2009 (File No. 001-33664)).
|
|
|
10.33(c)+
|
Separation Agreement and Mutual Release between Eloise Schmitz and Charter Communications, Inc. dated July 31, 2010 (incorporated by reference to Exhibit 10.1 to the current report on Form 8-K of Charter Communications, Inc. filed on August 6, 2010 (File No. 001-33664)).
|
|
|
10.34+
|
Charter Communications, Inc. Value Creation Plan adopted on March 12, 2009 (incorporated by reference to Exhibit 10.1 to the quarterly report on Form 10-Q of Charter Communications, Inc. filed on May 7, 2009 (File No. 001-33664)).
|
|
|
10.35
|
Form of Indemnification Agreement (incorporated by reference to Exhibit 10.1 to the current report on Form 8-K of Charter Communications, Inc. filed on February 12, 2010 (File No. 001-33664)).
|
|
|
12.1*
|
Computation of Ratio of Earnings to Fixed Charges.
|
|
|
21.1*
|
Subsidiaries of Charter Communications, Inc.
|
|
|
23.1*
|
Consent of KPMG LLP.
|
E-4
|
31.1*
|
|
Certificate of Chief Executive Officer pursuant to Rule 13a-14(a)/Rule 15d-14(a) under the Securities Exchange Act of 1934.
|
|
31.2*
|
|
Certificate of Chief Financial Officer pursuant to Rule 13a-14(a)/Rule 15d-14(a) under the Securities Exchange Act of 1934.
|
|
32.1*
|
|
Certification pursuant to 18 U.S.C. Section 1350, as adopted pursuant to Section 906 of the Sarbanes-Oxley Act of 2002 (Chief Executive Officer).
|
|
32.2*
|
|
Certification pursuant to 18 U.S.C. Section 1350, as adopted pursuant to Section 906 of the Sarbanes-Oxley Act of 2002 (Chief Financial Officer).
|
|
|
_____________
|
|
*
|
Document attached.
|
+ Management compensatory plan or arrangement
E-5
INDEX TO FINANCIAL STATEMENTS
|
Page
|
||
|
Audited Financial Statements
|
||
|
Report of Independent Registered Public Accounting Firm
|
F-2
|
|
|
Consolidated Balance Sheets as of December 31, 2010 and 2009 (Successor)
|
F-4
|
|
|
Consolidated Statements of Operations for the Year Ended December 31, 2010 (Successor), One Month Ended
December 31, 2009 (Successor), Eleven Months Ended
November 30, 2009 (Predecessor) and Year Ended
December 31, 2008 (Predecessor)
|
F-5
|
|
|
Consolidated Statements of Changes in Shareholders’ Equity (Deficit) for the Year Ended December 31, 2010
(Successor), One Month Ended December 31, 2009
(Successor), Eleven Months Ended November 30, 2009
(Predecessor) and Year Ended December 31, 2008 (Predecessor)
|
F-6
|
|
|
Consolidated Statements of Cash Flows for the Year Ended December 31, 2010 (Successor), One Month Ended
December 31, 2009 (Successor), Eleven Months Ended
November 30, 2009 (Predecessor) and Year Ended
December 31, 2008 (Predecessor)
|
F-7
|
|
|
Notes to Consolidated Financial Statements
|
F-8
|
F-1
Report of Independent Registered Public Accounting Firm
The Board of Directors and Shareholders
Charter Communications, Inc.:
We have audited the accompanying consolidated
balance sheets of Charter Communications, Inc. and subsidiaries (the Company) as of December 31, 2010 and 2009 (Successor) and the related consolidated statements of operations, changes in shareholders' equity (deficit), and cash flows for the year ended December 31, 2010 (Successor), the one month ended December 31, 2009 (Successor), the eleven months ended November 30, 2009 (Predecessor), and for the year ended December 31, 2008 (Predecessor). We also have audited the Company’s internal control over financial reporting as of December 31, 2010, based on criteria established in
Internal Control - Integrated Framework
issued by the Committee of Sponsoring Organizations of the Treadway Commission (COSO). The Company’s management is responsible for these consolidated financial statements, for maintaining effective internal control over financial reporting, and for its assessment of the effectiveness of internal control over financial reporting, included in the accompanying Management’s Report on Internal Control over Financial Reporting (Item 9A). Our responsibility is to express an opinion on these consolidated financial statements and an opinion on the Company's internal control over financial reporting based on our audits.
We conducted our audits in accordance with the standards of the Public Company Accounting Oversight Board (United States). Those standards require that we plan and perform the audits to obtain reasonable assurance about whether the financial statements are free of material misstatement and whether effective internal control over financial reporting was maintained in all material respects. Our audits of the consolidated financial statements included examining, on a test basis, evidence supporting the amounts and disclosures in the financial statements, assessing the accounting principles used and significant estimates made by management, and evaluating the overall financial statement presentation. Our audit of internal control over financial reporting included obtaining an understanding of internal control over financial reporting, assessing the risk that a material weakness exists, and testing and evaluating the design and operating effectiveness of internal control based on the assessed risk. Our audits also included performing such other procedures as we considered necessary in the circumstances. We believe that our audits provide a reasonable basis for our opinions.
A company's internal control over financial reporting is a process designed to provide reasonable assurance regarding the reliability of financial reporting and the preparation of financial statements for external purposes in accordance with generally accepted accounting principles. A company's internal control over financial reporting includes those policies and procedures that (1) pertain to the maintenance of records that, in reasonable detail, accurately and fairly reflect the transactions and dispositions of the assets of the company; (2) provide reasonable assurance that transactions are recorded as necessary to permit preparation of financial statements in accordance with generally accepted accounting principles, and that receipts and expenditures of the company are being made only in accordance with authorizations of management and directors of the company; and (3) provide reasonable assurance regarding prevention or timely detection of unauthorized acquisition, use, or disposition of the company's assets that could have a material effect on the financial statements.
Because of its inherent limitations, internal control over financial reporting may not prevent or detect misstatements. Also, projections of any evaluation of effectiveness to future periods are subject to the risk that controls may become inadequate because of changes in conditions, or that the degree of compliance with the policies or procedures may deteriorate.
In our opinion, the consolidated financial statements referred to above present fairly, in all material respects, the financial position of Charter Communications, Inc. and subsidiaries as of December 31, 2010 and 2009 (Successor), and the results of their operations and their cash flows for the year ended December 31, 2010 (Successor), the one month ended December 31, 2009 (Successor), the eleven months ended November 30, 2009 (Predecessor), and for the year ended December 31, 2008 (Predecessor), in conformity with US generally accepted accounting principles. Also in our opinion, the Company maintained in all material respects, effective internal control over financial reporting as of December 31, 2010, based on the criteria established in Internal Control - Integrated Framework issued by the Committee of Sponsoring Organizations of the Treadway Commission.
As discussed in Notes 1 and 23 to the consolidated financial statements, the Company filed a petition for reorganization under Chapter 11 of the United States Bankruptcy Code on March 27, 2009. The Company’s plan of reorganization became effective and the Company emerged from bankruptcy protection on November 30, 2009. In
F-2
connection with its emergence from bankruptcy, the Company adopted fresh-start accounting in conformity with AICPA Statement of Position 90-7,
Financial Reporting by Entities in Reorganization Under the Bankruptcy Code
(included in FASB ASC Topic 852
, Reorganizations),
effective as of November 30, 2009. Accordingly, the Company’s consolidated financial statements prior to November 30, 2009 are not comparable to its consolidated financial statements for periods after November 30, 2009.
As discussed in Note 9 to the consolidated financial statements, effective January 1, 2009, the Company adopted Statement of Financial Accounting Standards No. 160,
Noncontrolling Interests in Consolidated Financial Statements – An Amendment of ARB No. 51
(included in FASB ASC Topic 810,
Consolidations
).
/s/ KPMG
St. Louis, Missouri
February 28, 2011
F-3
CHARTER COMMUNICATIONS, INC. AND SUBSIDIARIES
(dollars in millions, except share data)
|
Successor
|
||||||||
|
December 31,
2010
|
December 31,
2009
|
|||||||
|
ASSETS
|
||||||||
|
CURRENT ASSETS:
|
||||||||
|
Cash and cash equivalents
|
$ | 4 | $ | 709 | ||||
|
Restricted cash and cash equivalents
|
28 | 45 | ||||||
|
Accounts receivable, less allowance for doubtful accounts of
|
||||||||
|
$17 and $11, respectively
|
247 | 248 | ||||||
|
Prepaid expenses and other current assets
|
47 | 69 | ||||||
|
Total current assets
|
326 | 1,071 | ||||||
|
INVESTMENT IN CABLE PROPERTIES:
|
||||||||
|
Property, plant and equipment, net of accumulated
|
||||||||
|
depreciation of $1,190 and $94, respectively
|
6,819 | 6,833 | ||||||
|
Franchises
|
5,257 | 5,272 | ||||||
|
Customer relationships, net
|
2,000 | 2,335 | ||||||
|
Goodwill
|
951 | 951 | ||||||
|
Total investment in cable properties, net
|
15,027 | 15,391 | ||||||
|
OTHER NONCURRENT ASSETS
|
354 | 196 | ||||||
|
Total assets
|
$ | 15,707 | $ | 16,658 | ||||
|
|
||||||||
|
LIABILITIES AND SHAREHOLDERS’ EQUITY
|
||||||||
|
CURRENT LIABILITIES:
|
||||||||
|
Accounts payable and accrued expenses
|
$ | 1,049 | $ | 898 | ||||
|
Current portion of long-term debt
|
-- | 70 | ||||||
|
Total current liabilities
|
1,049 | 968 | ||||||
|
LONG-TERM DEBT
|
12,306 | 13,252 | ||||||
|
OTHER LONG-TERM LIABILITIES
|
874 | 520 | ||||||
|
SHAREHOLDERS’ EQUITY:
|
||||||||
|
Class A common stock; $.001 par value; 900 million shares authorized;
|
||||||||
|
112,494,166 and 112,576,872 shares issued, respectively
|
-- | -- | ||||||
|
Class B common stock; $.001 par value; 25 million shares authorized;
|
||||||||
|
2,241,299 shares issued and outstanding
|
-- | -- | ||||||
|
Preferred stock; $.001 par value; 250 million shares
|
||||||||
|
authorized; no non-redeemable shares issued and outstanding
|
-- | -- | ||||||
|
Additional paid-in capital
|
1,776 | 1,914 | ||||||
|
Accumulated equity (deficit)
|
(235 | ) | 2 | |||||
|
Treasury stock at cost; 176,475 and no shares, respectively
|
(6 | ) | -- | |||||
|
Accumulated other comprehensive loss
|
(57 | ) | -- | |||||
|
Total Charter shareholders’ equity
|
1,478 | 1,916 | ||||||
|
Noncontrolling interest
|
-- | 2 | ||||||
|
Total shareholders’ equity
|
1,478 | 1,918 | ||||||
|
Total liabilities and shareholders’ equity
|
$ | 15,707 | $ | 16,658 | ||||
The accompanying notes are an integral part of these consolidated financial statements.
F-4
CHARTER COMMUNICATIONS, INC. AND SUBSIDIARIES
(dollars in millions, except per share and share data)
|
Successor
|
Predecessor
|
|||||||||||||||
|
Year Ended
December 31,
|
One Month
Ended
December 31,
|
Eleven Months
Ended
November 30,
|
Year Ended
December 31,
|
|||||||||||||
|
2010
|
2009
|
2009
|
2008
|
|||||||||||||
|
REVENUES
|
$ | 7,059 | $ | 572 | $ | 6,183 | $ | 6,479 | ||||||||
|
COSTS AND EXPENSES:
|
||||||||||||||||
|
Operating (excluding depreciation and amortization)
|
3,064 | 246 | 2,663 | 2,807 | ||||||||||||
|
Selling, general and administrative
|
1,422 | 116 | 1,264 | 1,386 | ||||||||||||
|
Depreciation and amortization
|
1,524 | 122 | 1,194 | 1,310 | ||||||||||||
|
Impairment of franchises
|
-- | -- | 2,163 | 1,521 | ||||||||||||
|
Other operating (income) expenses, net
|
25 | 4 | (38 | ) | 69 | |||||||||||
| 6,035 | 488 | 7,246 | 7,093 | |||||||||||||
|
Income (loss) from operations
|
1,024 | 84 | (1,063 | ) | (614 | ) | ||||||||||
|
OTHER INCOME AND EXPENSES:
|
||||||||||||||||
|
Interest expense, net (excluding unrecorded interest
expense of $558 for the eleven months ended November 30, 2009)
|
(877 | ) | (68 | ) | (1,020 | ) | (1,905 | ) | ||||||||
|
Gain due to Plan effects
|
-- | -- | 6,818 | -- | ||||||||||||
|
Gain due to fresh start accounting adjustments
|
-- | -- | 5,659 | -- | ||||||||||||
|
Reorganization items, net
|
(6 | ) | (3 | ) | (644 | ) | -- | |||||||||
|
Gain (loss) on extinguishment of debt
|
(85 | ) | -- | -- | 4 | |||||||||||
|
Change in value of derivatives
|
-- | -- | (4 | ) | (29 | ) | ||||||||||
|
Other income (expense), net
|
2 | (3 | ) | 2 | (6 | ) | ||||||||||
| (966 | ) | (74 | ) | 10,811 | (1,936 | ) | ||||||||||
|
Income (loss) before income taxes
|
58 | 10 | 9,748 | (2,550 | ) | |||||||||||
|
Income tax benefit (expense)
|
(295 | ) | (8 | ) | 351 | 103 | ||||||||||
|
Consolidated net income (loss)
|
(237 | ) | 2 | 10,099 | (2,447 | ) | ||||||||||
|
Less: Net (income) loss – noncontrolling interest
|
-- | -- | 1,265 | (4 | ) | |||||||||||
|
Net income (loss) – Charter shareholders
|
$ | (237 | ) | $ | 2 | $ | 11,364 | $ | (2,451 | ) | ||||||
|
EARNINGS (LOSS) PER COMMON SHARE –
CHARTER SHAREHOLDERS:
|
||||||||||||||||
|
Basic
|
$ | (2.09 | ) | $ | 0.02 | $ | 30.00 | $ | (6.56 | ) | ||||||
|
Diluted
|
$ | (2.09 | ) | $ | 0.02 | $ | 12.61 | $ | (6.56 | ) | ||||||
|
Weighted average common shares outstanding, basic
|
113,138,461 | 112,078,089 | 378,784,231 | 373,464,920 | ||||||||||||
|
Weighted average common shares outstanding, diluted
|
113,138,461 | 114,346,861 | 902,067,116 | 373,464,920 | ||||||||||||
The accompanying notes are an integral part of these consolidated financial statements.
F-5
CHARTER COMMUNICATIONS, INC. AND SUBSIDIARIES
CONSOLIDATED STATEMENTS OF CHANGES IN SHAREHOLDERS’ EQUITY (DEFICIT)
(dollars in millions)
|
Accumulated
|
||||||||||||||||||||||||
|
Class A
|
Class B
|
Additional
|
Accumulated
|
Other
|
Total Charter
|
|||||||||||||||||||
|
Common
|
Common
|
Paid-In
|
Equity
|
Treasury
|
Comprehensive
|
Shareholders'
|
||||||||||||||||||
|
Stock
|
Stock
|
Capital
|
(Deficit)
|
Stock
|
Income (Loss)
|
Equity (Deficit)
|
||||||||||||||||||
|
PREDECESSOR:
|
||||||||||||||||||||||||
|
BALANCE, December 31, 2007, Predecessor
|
$ | -- | $ | -- | $ | 5,382 | $ | (13,146 | ) | $ | -- | $ | (123 | ) | $ | (7,887 | ) | |||||||
|
Changes in fair value of interest rate
|
||||||||||||||||||||||||
|
agreements
|
-- | -- | -- | -- | -- | (180 | ) | (180 | ) | |||||||||||||||
|
Stock compensation expense, net
|
-- | -- | 12 | -- | -- | -- | 12 | |||||||||||||||||
|
Preferred stock redemption
|
-- | -- | 5 | -- | -- | -- | 5 | |||||||||||||||||
|
Reacquisition of equity component of
|
||||||||||||||||||||||||
|
convertible notes
|
-- | -- | (5 | ) | -- | -- | -- | (5 | ) | |||||||||||||||
|
Net loss
|
-- | -- | -- | (2,451 | ) | -- | -- | (2,451 | ) | |||||||||||||||
|
BALANCE, December 31, 2008, Predecessor
|
-- | -- | 5,394 | (15,597 | ) | -- | (303 | ) | (10,506 | ) | ||||||||||||||
|
Changes in fair value of interest rate
|
||||||||||||||||||||||||
|
agreements
|
-- | -- | -- | -- | -- | (5 | ) | (5 | ) | |||||||||||||||
|
Stock compensation expense, net
|
-- | -- | 5 | -- | -- | -- | 5 | |||||||||||||||||
|
Net income
|
-- | -- | -- | 11,364 | -- | -- | 11,364 | |||||||||||||||||
|
Amortization of accumulated other
comprehensive loss related to interest
rate agreements
|
-- | -- | -- | -- | -- | 32 | 32 | |||||||||||||||||
|
Cancellation of Predecessor common stock
|
-- | -- | (5,399 | ) | -- | -- | -- | (5,399 | ) | |||||||||||||||
|
Elimination of Predecessor accumulated
deficit and accumulated other
comprehensive income (loss)
|
-- | -- | -- | 4,233 | -- | 276 | 4,509 | |||||||||||||||||
|
BALANCE, November 30, 2009, Predecessor
|
-- | -- | -- | -- | -- | -- | -- | |||||||||||||||||
|
SUCCESSOR:
|
||||||||||||||||||||||||
|
Issuance of new equity
|
-- | -- | 2,003 | -- | -- | -- | 2,003 | |||||||||||||||||
|
BALANCE, November 30, 2009, Successor
|
-- | -- | 2,003 | -- | -- | -- | 2,003 | |||||||||||||||||
|
Net income
|
-- | -- | -- | 2 | -- | -- | 2 | |||||||||||||||||
|
Charter Investment Inc.’s exchange of
Charter Holdco interest (see Note 18)
|
-- | -- | (90 | ) | -- | -- | -- | (90 | ) | |||||||||||||||
|
Stock compensation expense, net
|
-- | -- | 1 | -- | -- | -- | 1 | |||||||||||||||||
|
BALANCE, December 31, 2009, Successor
|
-- | -- | 1,914 | 2 | -- | -- | 1,916 | |||||||||||||||||
|
Net loss
|
-- | -- | -- | (237 | ) | -- | -- | (237 | ) | |||||||||||||||
|
Charter Investment Inc.’s exchange of
Charter Holdco interest (see Note 18)
|
-- | -- | (166 | ) | -- | -- | -- | (166 | ) | |||||||||||||||
|
Change in fair value of interest rate swap
agreements
|
-- | -- | -- | -- | -- | (57 | ) | (57 | ) | |||||||||||||||
|
Stock compensation expense, net
|
-- | -- | 28 | -- | -- | -- | 28 | |||||||||||||||||
|
Purchase of treasury stock
|
-- | -- | -- | -- | (6 | ) | -- | (6 | ) | |||||||||||||||
|
BALANCE, December 31, 2010, Successor
|
$ | -- | $ | -- | $ | 1,776 | $ | (235 | ) | $ | (6 | ) | $ | (57 | ) | $ | 1,478 | |||||||
The accompanying notes are an integral part of these consolidated financial statements.
F-6
CHARTER COMMUNICATIONS, INC. AND SUBSIDIARIES
(dollars in millions)
|
Successor
|
Predecessor
|
|||||||||||||||
|
Year Ended December 31,
|
One Month
Ended
December 31,
|
Eleven Months
Ended
November 30,
|
Year Ended December 31,
|
|||||||||||||
|
2010
|
2009
|
2009
|
2008
|
|||||||||||||
|
CASH FLOWS FROM OPERATING ACTIVITIES:
|
||||||||||||||||
|
Net income (loss) – Charter shareholders
|
$ | (237 | ) | $ | 2 | $ | 10,099 | $ | (2,447 | ) | ||||||
|
Adjustments to reconcile net income (loss) to net cash flows
from operating activities:
|
||||||||||||||||
|
Depreciation and amortization
|
1,524 | 122 | 1,194 | 1,310 | ||||||||||||
|
Impairment of franchises
|
-- | -- | 2,163 | 1,521 | ||||||||||||
|
Noncash interest expense
|
74 | 5 | 42 | 61 | ||||||||||||
|
Change in value of derivatives
|
-- | -- | 4 | 29 | ||||||||||||
|
Gain due to effects of Plan
|
-- | -- | (6,818 | ) | -- | |||||||||||
|
Gain due to fresh start accounting adjustments
|
-- | -- | (5,659 | ) | -- | |||||||||||
|
Noncash reorganizations items, net
|
-- | -- | 170 | -- | ||||||||||||
|
(Gain) loss on extinguishment of debt
|
81 | -- | -- | (5 | ) | |||||||||||
|
Deferred income taxes
|
287 | 7 | (358 | ) | (107 | ) | ||||||||||
|
Other, net
|
34 | 3 | 31 | 48 | ||||||||||||
|
Changes in operating assets and liabilities, net of effects from
acquisitions and dispositions:
|
||||||||||||||||
|
Accounts receivable
|
-- | 26 | (52 | ) | 3 | |||||||||||
|
Prepaid expenses and other assets
|
22 | 2 | (36 | ) | (1 | ) | ||||||||||
|
Accounts payable, accrued expenses and other
|
126 | 16 | (344 | ) | (13 | ) | ||||||||||
|
Payment of deferred management fees – related party
|
-- | -- | (25 | ) | -- | |||||||||||
|
Net cash flows from operating activities
|
1,911 | 183 | 411 | 399 | ||||||||||||
|
CASH FLOWS FROM INVESTING ACTIVITIES:
|
||||||||||||||||
|
Purchases of property, plant and equipment
|
(1,209 | ) | (108 | ) | (1,026 | ) | (1,202 | ) | ||||||||
|
Change in accrued expenses related to capital expenditures
|
8 | -- | (10 | ) | (39 | ) | ||||||||||
|
Purchase of CC VIII, LLC interest
|
-- | -- | (150 | ) | -- | |||||||||||
|
Other, net
|
31 | (3 | ) | (7 | ) | 31 | ||||||||||
|
Net cash flows from investing activities
|
(1,170 | ) | (111 | ) | (1,193 | ) | (1,210 | ) | ||||||||
|
CASH FLOWS FROM FINANCING ACTIVITIES:
|
||||||||||||||||
|
Proceeds from Rights Offering
|
-- | -- | 1,614 | -- | ||||||||||||
|
Borrowings of long-term debt
|
3,115 | -- | -- | 3,105 | ||||||||||||
|
Repayments of long-term debt
|
(4,352 | ) | (17 | ) | (1,054 | ) | (1,354 | ) | ||||||||
|
Repayment of preferred stock
|
(138 | ) | -- | -- | -- | |||||||||||
|
Payments for debt issuance costs
|
(76 | ) | -- | (39 | ) | (42 | ) | |||||||||
|
Purchase of treasury stock
|
(6 | ) | -- | -- | -- | |||||||||||
|
Other, net
|
(6 | ) | -- | -- | (13 | ) | ||||||||||
|
Net cash flows from financing activities
|
(1,463 | ) | (17 | ) | 521 | 1,696 | ||||||||||
|
NET INCREASE (DECREASE) IN CASH AND CASH
EQUIVALENTS
|
(722 | ) | 55 | (261 | ) | 885 | ||||||||||
|
CASH AND CASH EQUIVALENTS, beginning of period
|
754 | 699 | 960 | 75 | ||||||||||||
|
CASH AND CASH EQUIVALENTS, end of period
|
$ | 32 | $ | 754 | $ | 699 | $ | 960 | ||||||||
|
CASH PAID FOR INTEREST
|
$ | 735 | $ | 4 | $ | 1,096 | $ | 1,847 | ||||||||
|
NONCASH TRANSACTIONS:
|
||||||||||||||||
|
Liabilities subject to compromise discharged at emergence
|
$ | -- | $ | -- | $ | 7,829 | $ | -- | ||||||||
The accompanying notes are an integral part of these consolidated financial statements.
F-7
CHARTER COMMUNICATIONS, INC. AND SUBSIDIARIES
NOTES TO CONSOLIDATED FINANCIAL STATEMENTS
DECEMBER 31, 2010, 2009 AND 2008
(dollars in millions, except share or per share data or where indicated)
1. Organization and Basis of Presentation
Organization
Charter Communications, Inc. (“Charter”) is a holding company whose principal asset is a 100% common equity interest in Charter Communications Holding Company, LLC (“Charter Holdco”). Charter Holdco is the sole owner of Charter’s subsidiaries where the underlying operations reside, which are collectively, with Charter, referred to herein as the “Company.”
The Company is a cable operator providing services in the United States. The Company offers to residential and commercial customers traditional cable video programming (basic and digital video), high-speed Internet services, and telephone services, as well as advanced video services such as Charter OnDemand™, high definition television, and digital video recorder (“DVR”) service. The Company sells its cable video programming, high-speed Internet, telephone, and advanced video services primarily on a subscription basis. The Company also sells local advertising on cable networks.
Basis of Presentation
The consolidated financial statements have been prepared in accordance with accounting principles generally accepted in the United States (“GAAP”). On May 7, 2009, the Company filed a Joint Plan of Reorganization (the “Plan”) and a related disclosure statement (the “Disclosure Statement”) with the United States Bankruptcy Court for the Southern District of New York (the “Bankruptcy Court”). On November 30, 2009 the Company emerged from protection under Chapter 11 of the United States Code (the “Bankruptcy Code”). Upon the Company’s emergence from bankruptcy, the Company applied fresh start accounting. This resulted in the Company becoming a new entity on December 1, 2009, with a new capital structure, a new accounting basis in the identifiable assets and liabilities assumed and no retained earnings or accumulated losses. Accordingly, the consolidated financial statements on or after December 1, 2009 (“Successor”) are not comparable to the consolidated financial statements prior to that date. The financial statements for the periods through November 30, 2009 (“Predecessor”) do not include the effect of any changes in our capital structure or changes in the fair value of assets and liabilities as a result of fresh start accounting.
The preparation of financial statements in conformity with GAAP requires management to make estimates and assumptions that affect the reported amounts of assets and liabilities and disclosure of contingent assets and liabilities at the date of the financial statements and the reported amounts of revenues and expenses during the reporting period. Areas involving significant judgments and estimates include capitalization of labor and overhead costs; depreciation and amortization costs; impairments of property, plant and equipment, intangibles and goodwill; income taxes; contingencies; programming expense and fresh start accounting. Actual results could differ from those estimates.
Certain prior year amounts have been reclassified to conform with the 2010 presentation.
2. Summary of Significant Accounting Policies
Consolidation
The accompanying consolidated financial statements include the accounts of Charter and its majority owned subsidiaries. The Company consolidates variable interest entities based upon evaluation of the Company’s power, through voting rights or similar rights, to direct the activities of another entity that most significantly impact the entity’s economic performance; its obligation to absorb the expected losses of the entity; and its right to receive the expected residual returns of the entity. All significant intercompany accounts and transactions among consolidated entities have been eliminated.
F-8
CHARTER COMMUNICATIONS, INC. AND SUBSIDIARIES
NOTES TO CONSOLIDATED FINANCIAL STATEMENTS
DECEMBER 31, 2010, 2009 AND 2008
(dollars in millions, except share or per share data or where indicated)
Cash and Cash Equivalents
The Company considers all highly liquid investments with original maturities of three months or less to be cash equivalents. These investments are carried at cost, which approximates market value. Cash and cash equivalents consist primarily of money market funds and commercial paper.
Restricted cash and cash equivalents consist of amounts held in escrow accounts pending final resolution from the Bankruptcy Court (see Note 23). Restricted cash is included in cash and cash equivalents on the accompanying condensed consolidated statements of cash flows. Approximately $17 million of restricted cash held in an escrow account established in bankruptcy proceedings was used to pay for professional services for the year ended December 31, 2010.
Property, Plant and Equipment
Additions to property, plant and equipment are recorded at cost, including all material, labor and certain indirect costs associated with the construction of cable transmission and distribution facilities. While the Company’s capitalization is based on specific activities, once capitalized, costs are tracked by fixed asset category at the cable system level and not on a specific asset basis. For assets that are sold or retired, the estimated historical cost and related accumulated depreciation is removed. Costs associated with initial customer installations and the additions of network equipment necessary to enable advanced video services are capitalized. Costs capitalized as part of initial customer installations include materials, labor, and certain indirect costs. Indirect costs are associated with the activities of the Company’s personnel who assist in connecting and activating the new service and consist of compensation and other costs associated with these support functions. Indirect costs primarily include employee benefits and payroll taxes, direct variable costs associated with capitalizable activities, consisting primarily of installation and construction vehicle costs, the cost of dispatch personnel and indirect costs directly attributable to capitalizable activities. The costs of disconnecting service at a customer’s dwelling or reconnecting service to a previously installed dwelling are charged to operating expense in the period incurred. Costs for repairs and maintenance are charged to operating expense as incurred, while plant and equipment replacement and betterments, including replacement of cable drops from the pole to the dwelling, are capitalized.
Depreciation is recorded using the straight-line composite method over management’s estimate of the useful lives of the related assets as follows:
|
Cable distribution systems
|
7-20 years
|
|
Customer equipment and installations
|
4-8 years
|
|
Vehicles and equipment
|
1-6 years
|
|
Buildings and leasehold improvements
|
15-40 years
|
|
Furniture, fixtures and equipment
|
6-10 years
|
Asset Retirement Obligations
Certain of the Company’s franchise agreements and leases contain provisions requiring the Company to restore facilities or remove equipment in the event that the franchise or lease agreement is not renewed. The Company expects to continually renew its franchise agreements and has concluded that substantially all of the related franchise rights are indefinite lived intangible assets. Accordingly, the possibility is remote that the Company would be required to incur significant restoration or removal costs related to these franchise agreements in the foreseeable future. A liability is required to be recognized for an asset retirement obligation in the period in which it is incurred if a reasonable estimate of fair value can be made. The Company has not recorded an estimate for potential franchise related obligations, but would record an estimated liability in the unlikely event a franchise agreement containing such a provision were no longer expected to be renewed. The Company also expects to renew many of its lease agreements related to the continued operation of its cable business in the franchise areas. For the Company’s lease agreements, the estimated liabilities related to the removal provisions, where applicable, have been recorded and are not significant to the financial statements.
F-9
CHARTER COMMUNICATIONS, INC. AND SUBSIDIARIES
NOTES TO CONSOLIDATED FINANCIAL STATEMENTS
DECEMBER 31, 2010, 2009 AND 2008
(dollars in millions, except share or per share data or where indicated)
Franchises
Franchise rights represent the value attributed to agreements with local authorities that allow access to homes in cable service areas acquired through the purchase of cable systems. Management estimates the fair value of franchise rights at the date of acquisition and determines if the franchise has a finite life or an indefinite life. All franchises that qualify for indefinite life treatment are tested for impairment annually or more frequently as warranted by events or changes in circumstances (see Note 5). The Company concluded that all of its franchises qualify for indefinite life treatment.
Customer Relationships
Customer relationships represent the value attributable to the Company's business relationships with its current customers including the right to deploy and market additional services to these customers. Customer relationships are amortized on an accelerated basis over the period the relationships with current customers are expected to generate cash flows (11-15 years).
Goodwill
The Company assesses the recoverability of its goodwill as of November 30 of each year, or more frequently whenever events or changes in circumstances indicate that the asset might be impaired. The Company performs the assessment of its goodwill one level below the operating segment level, which is represented by geographical groupings of cable systems by which such systems are managed.
Other Noncurrent Assets
Other noncurrent assets primarily include trademarks and deferred financing costs as of December 31, 2010 and trademarks as of December 31, 2009. Costs related to borrowings are deferred and amortized to interest expense over the terms of the related borrowings. All deferred financing costs prior to emergence were eliminated as part of fresh start accounting. Trademarks have been determined to have an indefinite life and are tested annually for impairment.
Valuation of Long-Lived Assets
The Company evaluates the recoverability of long-lived assets to be held and used for impairment when events or changes in circumstances indicate that the carrying amount of an asset may not be recoverable. Such events or changes in circumstances could include such factors as impairment of the Company’s indefinite life assets, changes in technological advances, fluctuations in the fair value of such assets, adverse changes in relationships with local franchise authorities, adverse changes in market conditions or a deterioration of operating results. If a review indicates that the carrying value of such asset is not recoverable from estimated undiscounted cash flows, the carrying value of such asset is reduced to its estimated fair value. While the Company believes that its estimates of future cash flows are reasonable, different assumptions regarding such cash flows could materially affect its evaluations of asset recoverability. No impairments of long-lived assets to be held and used were recorded in 2010, 2009 and 2008.
Derivative Financial Instruments
Gains or losses related to derivative financial instruments which qualify as hedging activities are recorded in accumulated other comprehensive income (loss). For all other derivative instruments, the related gains or losses are recorded in the statements of operations. The Company uses interest rate swap agreements to manage its interest costs and reduce the Company’s exposure to increases in floating interest rates. The Company manages its exposure to fluctuations in interest rates by maintaining a mix of fixed and variable rate debt. Using interest rate swap agreements, the Company agrees to exchange, at specified intervals
through 2015
, the difference between fixed and variable interest amounts calculated by reference to agreed-upon notional principal amounts. The Company did not
F-10
CHARTER COMMUNICATIONS, INC. AND SUBSIDIARIES
NOTES TO CONSOLIDATED FINANCIAL STATEMENTS
DECEMBER 31, 2010, 2009 AND 2008
(dollars in millions, except share or per share data or where indicated)
hold any derivative financial instruments as of December 31, 2009, as upon filing for Chapter 11 bankruptcy, the counterparties to the interest rate swap agreements terminated the underlying contracts and upon emergence from bankruptcy, received payment for the market value of the interest rate swap as measured on the date the counterparties terminated. In April 2010, the Company entered into $2.0 billion notional amounts of interest rate swap agreements.
For the year ended December 31, 2008 (Predecessor), the Company recognized a gain of $33 million, related to certain provisions of the Company’s 5.875% and 6.50% convertible senior notes issued in November 2004 and October 2007, respectively, which were considered embedded derivatives for accounting purposes and were required to be accounted for separately from the convertible senior notes. These derivatives were marked to market with gains or losses recorded as the change in value of derivatives on the Company’s consolidated statements of operations. On the Effective Date, the Company’s 5.875% and 6.50% convertible senior notes were cancelled. See Note 23.
Revenue Recognition
Revenues from residential and commercial video, high-speed Internet and telephone services are recognized when the related services are provided. Advertising sales are recognized at estimated realizable values in the period that the advertisements are broadcast. Franchise fees imposed by local governmental authorities are collected on a monthly basis from the Company’s customers and are periodically remitted to local franchise authorities. Franchise fees of $182 million, $15 million, $166 million and $187 million for the year ended December 31, 2010 (Successor), one month ended December 31, 2009 (Successor), eleven months ended November 30, 2009 (Predecessor) and year ended December 31, 2008 (Predecessor), respectively, are reported in video revenues, on a gross basis with a corresponding operating expense
.
Sales taxes collected and remitted to state and local authorities are recorded on a net basis.
The Company’s revenues by product line are as follows:
|
Successor
|
Predecessor
|
||||||||||
|
Year Ended
December 31,
|
One Month
Ended
December 31,
|
Eleven Months
Ended
November 30,
|
Year Ended
December 31,
|
||||||||
|
2010
|
2009
|
2009
|
2008
|
||||||||
|
Video
|
$
|
3,689
|
$
|
306
|
$
|
3,380
|
$
|
3,692
|
|||
|
High-speed Internet
|
1,606
|
127
|
1,349
|
1,356
|
|||||||
|
Telephone
|
823
|
65
|
685
|
583
|
|||||||
|
Commercial
|
494
|
39
|
407
|
392
|
|||||||
|
Advertising sales
|
291
|
22
|
227
|
308
|
|||||||
|
Other
|
156
|
13
|
135
|
148
|
|||||||
|
$
|
7,059
|
$
|
572
|
$
|
6,183
|
$
|
6,479
|
||||
Certain prior year amounts have been reclassified to conform with the 2010 presentation, including the reflection of franchise fees, equipment rental and video customer installation revenue as video revenue, and telephone regulatory fees as telephone revenue, rather than other revenue.
Programming Costs
The Company has various contracts to obtain basic, digital and premium video programming from programming vendors whose compensation is typically based on a flat fee per customer. The cost of the right to exhibit network programming under such arrangements is recorded in operating expenses in the month the programming is available for exhibition. Programming costs are paid each month based on calculations performed by the Company and are subject to periodic audits performed by the programmers. Certain programming contracts contain incentives to be
F-11
CHARTER COMMUNICATIONS, INC. AND SUBSIDIARIES
NOTES TO CONSOLIDATED FINANCIAL STATEMENTS
DECEMBER 31, 2010, 2009 AND 2008
(dollars in millions, except share or per share data or where indicated)
paid by the programmers. The Company receives these payments and recognizes the incentives on a straight-line basis over the life of the programming agreement as a reduction of programming expense. This offset to programming expense was $17 million, $2 million, $24 million, and $33 million for the year ended December 31, 2010 (Successor), one month ended December 31, 2009 (Successor), eleven months ended November 30, 2009 (Predecessor) and year ended December 31, 2008 (Predecessor), respectively. As of December 31, 2010 (Successor) and 2009 (Successor), the deferred amounts of such economic consideration, included in other long-term liabilities, were $11 million and $26 million, respectively. Programming costs included in the accompanying statements of operations were $1.8 billion, $146 million, $1.6 billion and $1.6 billion for the year ended December 31, 2010 (Successor), one month ended December 31, 2009 (Successor), eleven months ended November 30, 2009 (Predecessor) and year ended December 31, 2008 (Predecessor), respectively.
Advertising Costs
Advertising costs associated with marketing the Company’s products and services are generally expensed as costs are incurred. Such advertising expense was $282 million, $20 million, $230 million and $229 million for the year ended December 31, 2010 (Successor), one month ended December 31, 2009 (Successor), eleven months ended November 30, 2009 (Predecessor) and year ended December 31, 2008 (Predecessor), respectively.
Multiple-Element Transactions
In the normal course of business, the Company enters into multiple-element transactions where it is simultaneously both a customer and a vendor with the same counterparty or in which it purchases multiple products and/or services, or settles outstanding items contemporaneous with the purchase of a product or service from a single counterparty. Transactions, although negotiated contemporaneously, may be documented in one or more contracts. The Company’s policy for accounting for each transaction negotiated contemporaneously is to record each element of the transaction based on the respective estimated fair values of the products or services purchased and the products or services sold. In determining the fair value of the respective elements, the Company refers to quoted market prices (where available), historical transactions or comparable cash transactions.
Stock-Based Compensation
Restricted stock, stock options and performance units and shares are measured at the grant date fair value and amortized to stock compensation expense over the vesting period. The Company recorded $26 million, $1 million, $26 million and $33 million of stock compensation expense which is included in general and administrative expenses for the year ended December 31, 2010 (Successor), one month ended December 31, 2009 (Successor), eleven months ended November 30, 2009 (Predecessor) and year ended December 31, 2008 (Predecessor), respectively.
The fair value of each option granted is estimated on the date of grant using the Black-Scholes option-pricing model. The following weighted average assumptions were used for grants during the years ended December 31, 2010 (Successor) and 2008 (Predecessor), respectively; risk-free interest rates of 2.5% and 3.5%; expected volatility of 47.7% and 88.1%, and expected lives of 6.3 years and 6.3 years, respectively. Volatility assumptions for 2010 were based on historical volatility of a peer group while volatility assumptions for 2008 were based on Charter’s historical volatility. The Company’s volatility assumption for 2010 represents management’s best estimate and was based on historical volatility of a peer group because management does not believe Charter’s pre-emergence historical volatility to be representative of its future volatility. Expected lives were calculated based on the simplified-method due to insufficient historical exercise data. The valuations assume no dividends are paid. The Company did not grant stock options in 2009.
Income Taxes
The Company recognizes deferred tax assets and liabilities for temporary differences between the financial reporting basis and the tax basis of the Company’s assets and liabilities and expected benefits of utilizing loss carryforwards. The impact on deferred taxes of changes in tax rates and tax law, if any, applied to the years during which temporary
F-12
CHARTER COMMUNICATIONS, INC. AND SUBSIDIARIES
NOTES TO CONSOLIDATED FINANCIAL STATEMENTS
DECEMBER 31, 2010, 2009 AND 2008
(dollars in millions, except share or per share data or where indicated)
differences are expected to be settled, are reflected in the consolidated financial statements in the period of enactment (see Note 18).
Earnings (Loss) per Common Share
Basic earnings (loss) per common share is computed by dividing the net income (loss) available to common shareholders by the weighted-average common shares outstanding during the respective periods. Diluted loss per common share equals basic loss per common share for the years ended December 31, 2010 and 2008, as the effect of stock options and other convertible securities are antidilutive because the Company incurred net losses. Diluted earnings per common share for the one month ended December 31, 2009 and eleven months ended November 30, 2009 is based on the average number of shares used for the basic earnings per common share calculation, adjusted for the dilutive effect of stock options and other convertible securities (See Note 19). Predecessor shares were cancelled on the Effective Date and shares of Successor were issued. As a result, earnings (loss) per share information for the Successor is not comparable to the Predecessor loss per share.
The 21.8 million shares outstanding as of December 31, 2008 (Predecessor), pursuant to the share lending agreement described in Note 10 were required to be returned, in accordance with the contractual arrangement, and were treated in basic and diluted earnings per common share as if they were already returned and retired. Consequently, there was no impact of the shares of common stock lent under the share lending agreement in the earnings per common share calculation.
Segments
The Company’s operations are managed on the basis of geographic operating segments. The Company has evaluated the criteria for aggregation of the geographic operating segments and believes it meets each of the respective criteria set forth. The Company delivers similar products and services within each of its geographic operations. Each geographic service area utilizes similar means for delivering the programming of the Company’s services; have similarity in the type or class of customer receiving the products and services; distributes the Company’s services over a unified network; and operates within a consistent regulatory environment. In addition, each of the geographic operating segments has similar economic characteristics. In light of the Company’s similar services, means for delivery, similarity in type of customers, the use of a unified network and other considerations across its geographic operating structure, management has determined that the Company has one reportable segment, broadband services.
3. Allowance for Doubtful Accounts
Activity in the allowance for doubtful accounts is summarized as follows for the years presented:
|
Successor
|
Predecessor
|
|||||||||||||||
|
Year Ended December 31,
|
One Month
Ended
December 31,
|
Eleven Months Ended
November 30,
|
Year Ended December 31,
|
|||||||||||||
|
2010
|
2009
|
2009
|
2008
|
|||||||||||||
|
Balance, beginning of period
|
$ | 11 | $ | -- | $ | 18 | $ | 18 | ||||||||
|
Charged to expense
|
133 | 10 | 120 | 122 | ||||||||||||
|
Uncollected balances written off, net of recoveries
|
(127 | ) | 1 | (116 | ) | (122 | ) | |||||||||
|
Fresh start accounting adjustments
|
-- | -- | (22 | ) | -- | |||||||||||
|
Balance, end of period
|
$ | 17 | $ | 11 | $ | -- | $ | 18 | ||||||||
On the Effective Date, the Company applied fresh start accounting and adjusted its accounts receivable to reflect fair value. Therefore, the allowance for doubtful accounts was eliminated at November 30, 2009.
F-13
CHARTER COMMUNICATIONS, INC. AND SUBSIDIARIES
NOTES TO CONSOLIDATED FINANCIAL STATEMENTS
DECEMBER 31, 2010, 2009 AND 2008
(dollars in millions, except share or per share data or where indicated)
4. Property, Plant and Equipment
Property, plant and equipment consists of the following as of December 31, 2010 and 2009:
|
Successor
|
||||||||
|
December 31,
2010
|
December 31,
2009
|
|||||||
|
Cable distribution systems
|
$ | 5,251 | $ | 4,762 | ||||
|
Customer equipment and installations
|
2,101 | 1,597 | ||||||
|
Vehicles and equipment
|
115 | 95 | ||||||
|
Buildings and leasehold improvements
|
306 | 302 | ||||||
|
Furniture, fixtures and equipment
|
236 | 171 | ||||||
| 8,009 | 6,927 | |||||||
|
Less: accumulated depreciation
|
(1,190 | ) | (94 | ) | ||||
| $ | 6,819 | $ | 6,833 | |||||
The Company periodically evaluates the estimated useful lives used to depreciate its assets and the estimated amount of assets that will be abandoned or have minimal use in the future. A significant change in assumptions about the extent or timing of future asset retirements, or in the Company’s use of new technology and upgrade programs, could materially affect future depreciation expense. On the Effective Date, the Company applied fresh start accounting and as such adjusted its property, plant and equipment to reflect fair value and adjusted remaining useful lives for existing property, plant and equipment and for future purchases.
Depreciation expense for the year ended December 31, 2010 (Successor), one month ended December 31, 2009 (Successor), eleven months ended November 30, 2009 (Predecessor) and year ended December 31, 2008 (Predecessor) was $1.2 billion, $94 million, $1.2 billion and $1.3 billion, respectively.
5. Franchises, Goodwill and Other Intangible Assets
Franchise rights represent the value attributed to agreements or authorizations with local and state authorities that allow access to homes in cable service areas. Franchises are tested for impairment annually, or more frequently as warranted by events or changes in circumstances. Franchises are aggregated into essentially inseparable units of accounting to conduct the valuations. The units of accounting generally represent geographical clustering of the Company’s cable systems into groups by which such systems are managed. Management believes such grouping represents the highest and best use of those assets.
The Company recorded non-cash franchise impairment charges of $2.2 billion and $1.5 billion for the eleven months ended November 30, 2009 (Predecessor) and year ended December 31, 2008 (Predecessor), respectively. The impairment charges recorded in 2009 and 2008 were primarily the result of the impact of the economic downturn along with increased competition. The Company’s 2010 impairment analyses did not result in any franchise impairment charges.
On the Effective Date, the Company applied fresh start accounting and adjusted its franchise, goodwill, and other intangible assets including trademarks and customer relationships to reflect fair value. The Company’s valuations, which are based on the present value of projected after tax cash flows, resulted in a value for property, plant and equipment, franchises, and customer relationships for each unit of accounting. As a result of applying fresh start accounting, the Company recorded goodwill of $951 million which represents the excess of reorganization value over amounts assigned to the other assets.
F-14
CHARTER COMMUNICATIONS, INC. AND SUBSIDIARIES
NOTES TO CONSOLIDATED FINANCIAL STATEMENTS
DECEMBER 31, 2010, 2009 AND 2008
(dollars in millions, except share or per share data or where indicated)
Franchises, for valuation purposes, are defined as the future economic benefits of the right to solicit and service potential customers (customer marketing rights), and the right to deploy and market new services, such as Internet and telephone, to potential customers (service marketing rights). Fair value is determined based on estimated discrete discounted future cash flows using assumptions consistent with internal forecasts. The franchise after-tax cash flow is calculated as the after-tax cash flow generated by the potential customers obtained (less the anticipated customer churn), and the new services added to those customers in future periods. The sum of the present value of the franchises' after-tax cash flow in years 1 through 10 and the continuing value of the after-tax cash flow beyond year 10 yields the fair value of the franchises.
The Company determined the estimated fair value of each unit of accounting utilizing an income approach model based on the present value of the estimated discrete future cash flows attributable to each of the intangible assets identified for each unit assuming a discount rate. This approach makes use of unobservable factors such as projected revenues, expenses, capital expenditures, and a discount rate applied to the estimated cash flows. The determination of the discount rate was based on a weighted average cost of capital approach, which uses a market participant’s cost of equity and after-tax cost of debt and reflects the risks inherent in the cash flows.
The Company estimated discounted future cash flows using reasonable and appropriate assumptions including among others, penetration rates for basic and digital video, high-speed Internet, and telephone; revenue growth rates; operating margins; and capital expenditures. The assumptions are derived based on the Company’s and its peers’ historical operating performance adjusted for current and expected competitive and economic factors surrounding the cable industry. The estimates and assumptions made in the Company’s valuations are inherently subject to significant uncertainties, many of which are beyond its control, and there is no assurance that these results can be achieved. The primary assumptions for which there is a reasonable possibility of the occurrence of a variation that would significantly affect the measurement value include the assumptions regarding revenue growth, programming expense growth rates, the amount and timing of capital expenditures and the discount rate utilized.
Goodwill is tested for impairment as of November 30 of each year, or more frequently as warranted by events or changes in circumstances. The first step involves a comparison of the estimated fair value of each of our reporting units to its carrying amount. If the estimated fair value of a reporting unit exceeds its carrying amount, goodwill of the reporting unit is not considered impaired and the second step of the goodwill impairment is not necessary. If the carrying amount of a reporting unit exceeds its estimated fair value, then the second step of the goodwill impairment test must be performed, and a comparison of the implied fair value of the reporting unit’s goodwill is compared to its carrying amount to determine the amount of impairment, if any. Reporting units are consistent with the units of accounting used for franchise impairment testing. Likewise the fair values of the reporting units are determined using a consistent income approach model as that used for franchise impairment testing. The Company’s 2010 impairment analyses did not result in any goodwill impairment charges.
Customer relationships, for valuation purposes, represent the value of the business relationship with existing customers (less the anticipated customer churn), and are calculated by projecting the discrete future after-tax cash flows from these customers, including the right to deploy and market additional services to these customers. The present value of these after-tax cash flows yields the fair value of the customer relationships. Customer relationships are amortized on an accelerated method over useful lives of 11-15 years based on the period over which current customers are expected to generate cash flows. Customer relationships are evaluated upon the occurrence of events or changes in circumstances indicating that the carrying amount of an asset may not be recoverable.
The fair value of trademarks was determined using the relief-from-royalty method which applies a fair royalty rate to estimated revenue. Royalty rates are estimated based on a review of market royalty rates in the communications and entertainment industries. As the Company expects to continue to use each trademark indefinitely, trademarks have been assigned an indefinite life and are tested annually for impairment, or more frequently as warranted by events or changes in circumstances. The Company’s 2010 impairment analyses did not result in any trademark impairment charges.
F-15
CHARTER COMMUNICATIONS, INC. AND SUBSIDIARIES
NOTES TO CONSOLIDATED FINANCIAL STATEMENTS
DECEMBER 31, 2010, 2009 AND 2008
(dollars in millions, except share or per share data or where indicated)
As of December 31, 2010 and 2009, indefinite lived and finite-lived intangible assets are presented in the following table:
|
Successor
|
||||||||||||||||||||||||
|
2010
|
2009
|
|||||||||||||||||||||||
|
Gross
|
Net
|
Gross
|
Net
|
|||||||||||||||||||||
|
Carrying
|
Accumulated
|
Carrying
|
Carrying
|
Accumulated
|
Carrying
|
|||||||||||||||||||
|
Amount
|
Amortization
|
Amount
|
Amount
|
Amortization
|
Amount
|
|||||||||||||||||||
|
Indefinite lived intangible assets:
|
||||||||||||||||||||||||
|
Franchises
|
$ | 5,257 | $ | -- | $ | 5,257 | $ | 5,272 | $ | -- | $ | 5,272 | ||||||||||||
|
Goodwill
|
951 | -- | 951 | 951 | -- | 951 | ||||||||||||||||||
|
Trademarks
|
158 | -- | 158 | 158 | 158 | |||||||||||||||||||
| $ | 6,366 | $ | -- | $ | 6,366 | $ | 6,381 | $ | -- | $ | 6,381 | |||||||||||||
|
Finite-lived intangible assets:
|
||||||||||||||||||||||||
|
Customer relationships
|
$ | 2,358 | $ | 358 | $ | 2,000 | $ | 2,363 | $ | 28 | $ | 2,335 | ||||||||||||
|
Other intangible assets
|
53 | 7 | 46 | 33 | -- | 33 | ||||||||||||||||||
| $ | 2,411 | $ | 365 | $ | 2,046 | $ | 2,396 | $ | 28 | $ | 2,368 | |||||||||||||
Amortization expense related to customer relationships and other intangible assets for the year ended December 31, 2010 (Successor), one month ended December 31, 2009 (Successor), eleven months ended November 30, 2009 (Predecessor), and year ended December 31, 2008 (Predecessor) was $337 million, $28 million, $5 million and $5 million, respectively. During the year ended December 31, 2010 (Successor) and eleven months ended November 30, 2009 (Predecessor), the net carrying amount of franchises was reduced by $15 million and $9 million, respectively, and customer relationships was reduced by $5 million and $0, respectively, related to cable asset sales, net of acquisitions completed in 2010 and 2009.
The Company expects amortization expense on its finite-lived intangible assets will be as follows.
|
2011
|
$ | 313 | ||
|
2012
|
287 | |||
|
2013
|
261 | |||
|
2014
|
234 | |||
|
2015
|
208 | |||
|
Thereafter
|
743 | |||
| $ | 2,046 |
Actual amortization expense in future periods could differ from these estimates as a result of new intangible asset acquisitions or divestitures, changes in useful lives, impairments and other relevant factors.
F-16
CHARTER COMMUNICATIONS, INC. AND SUBSIDIARIES
NOTES TO CONSOLIDATED FINANCIAL STATEMENTS
DECEMBER 31, 2010, 2009 AND 2008
(dollars in millions, except share or per share data or where indicated)
6. Accounts Payable and Accrued Expenses
Accounts payable and accrued expenses consist of the following as of December 31, 2010 and 2009:
|
Successor
|
||||||||
|
December 31,
|
December 31,
|
|||||||
|
2010
|
2009
|
|||||||
|
Accounts payable – trade
|
$ | 168 | $ | 113 | ||||
|
Accrued capital expenditures
|
54 | 46 | ||||||
|
Accrued expenses:
|
||||||||
|
Interest
|
162 | 90 | ||||||
|
Programming costs
|
282 | 270 | ||||||
|
Franchise related fees
|
53 | 53 | ||||||
|
Compensation
|
124 | 102 | ||||||
|
Other
|
206 | 224 | ||||||
| $ | 1,049 | $ | 898 | |||||
7. Long-Term Debt
Long-term debt consists of the following as of December 31, 2010 and 2009:
|
December 31, 2010
|
December 31, 2009
|
|||||||||||||||
|
Principal
|
Accreted
|
Principal
|
Accreted
|
|||||||||||||
|
Amount
|
Value
|
Amount
|
Value
|
|||||||||||||
|
CCH II, LLC:
|
||||||||||||||||
|
13.500% senior notes due November 15, 2016
|
$ | 1,766 | $ | 2,057 | $ | 1,766 | $ | 2,092 | ||||||||
|
CCO Holdings, LLC:
|
||||||||||||||||
|
8.75% senior notes due November 15, 2013
|
-- | -- | 800 | 812 | ||||||||||||
|
7.25% senior notes due October 30, 2017
|
1,000 | 1,000 | -- | -- | ||||||||||||
|
7.875% senior notes due April 30, 2018
|
900 | 900 | -- | -- | ||||||||||||
|
8.125% senior notes due April 30, 2020
|
700 | 700 | -- | -- | ||||||||||||
|
Credit facility
|
350 | 314 | 350 | 304 | ||||||||||||
|
Charter Communications Operating, LLC:
|
||||||||||||||||
|
8.00% senior second-lien notes due April 30, 2012
|
1,100 | 1,112 | 1,100 | 1,120 | ||||||||||||
|
8.375% senior second-lien notes due April 30, 2014
|
-- | -- | 770 | 779 | ||||||||||||
|
10.875% senior second-lien notes due September 15, 2014
|
546 | 591 | 546 | 601 | ||||||||||||
|
Credit facilities
|
5,954 | 5,632 | 8,177 | 7,614 | ||||||||||||
|
Total Debt
|
$ | 12,316 | $ | 12,306 | $ | 13,509 | $ | 13,322 | ||||||||
|
Less: Current Portion
|
-- | -- | 70 | 70 | ||||||||||||
|
Long-Term Debt
|
$ | 12,316 | $ | 12,306 | $ | 13,439 | $ | 13,252 | ||||||||
As of December 31, 2010 and 2009, the accreted values of the CCH II, LLC (“CCH II”) and Charter Communications Operating, LLC (“Charter Operating”)
notes and the CCO Holdings, LLC (“CCO Holdings”) and Charter Operating credit facilities presented above represent the fair value of the debt as of the Effective Date, plus the accretion to the balance sheet date. However, the amount that is currently payable if the debt becomes immediately due is equal to the principal amount of the debt. The Company has availability under the revolving portion of its credit facility of approximately $1.1 billion as of December 31, 2010. As such, debt scheduled to mature during the next 12 months is reflected as long-term as of December 31, 2010.
F-17
CHARTER COMMUNICATIONS, INC. AND SUBSIDIARIES
NOTES TO CONSOLIDATED FINANCIAL STATEMENTS
DECEMBER 31, 2010, 2009 AND 2008
(dollars in millions, except share or per share data or where indicated)
CCH II Notes
On the Effective Date, CCH II and CCH II Capital Corp. issued approximately $1.8 billion in total principal amount of new 13.5% senior notes. Such notes are guaranteed by Charter. Existing holders of $1.5 billion principal amount of senior notes of CCH II and CCH II Capital Corp. (“CCH II Notes”) exchanged their CCH II Notes plus accrued interest for $1.7 billion principal amount ($2.0 billion fair value) of new 13.5% Senior Notes of CCH II and CCH II Capital Corp. (the “New CCH II Notes”). CCH II Notes and accrued interest that were not exchanged were paid in cash in an amount equal to $1.1 billion.
The New CCH II Notes are senior debt obligations of CCH II and CCH II Capital Corp. The New CCH II Notes rank equally with all other current and future unsecured, unsubordinated obligations of CCH II and CCH II Capital Corp. The New CCH II notes are structurally subordinated to all obligations of the subsidiaries of CCH II, including the CCO Holdings notes and credit facility and the Charter Operating notes and credit facilities.
At any time prior to the third anniversary of their issuance, CCH II will be permitted to redeem up to 35% of the New CCH II Notes with the proceeds of an equity offering, for cash equal to 113.5% of the then-outstanding principal amount of the New CCH II Notes being redeemed, plus accrued and unpaid interest. At or any time prior to the third anniversary of their issuance, CCH II will be permitted to redeem the New CCH II Notes, in whole or in part, at 100% of the principal amount outstanding thereof plus accrued and unpaid interest, if any, to the redemption date, plus the Applicable Premium. The Applicable Premium is an amount equal to the excess of (a) the present value of the remaining interest and principal payments due on a New CCH II Note to its final maturity date, computed using a discount rate equal to the Treasury Rate on such date plus 0.50%, over (y) the outstanding principal amount of such note. On or after the third anniversary of their issuance, the New CCH II Notes may be redeemed by CCH II for cash equal to 106.75% of the principal amount of the New CCH II Notes being redeemed for redemptions made during the fourth year following their issuance, 103.375% for redemptions made during the fifth year following their issuance, 101.6875% for redemptions made during the sixth year following their issuance, and 100.000% for redemptions made thereafter, in each case, together with accrued and unpaid interest.
In the event of specified change of control events, CCH II must offer to purchase the outstanding CCH II notes from the holders at a purchase price equal to 101% of the total principal amount of the notes, plus any accrued and unpaid interest.
CCO Holdings Notes
On April 28, 2010, CCO Holdings and CCO Holdings Capital Corp. closed on transactions in which they issued $900 million aggregate principal amount of 7.875% Senior Notes due 2018 (the “2018 Notes”) and $700 million aggregate principal amount of 8.125% Senior Notes due 2020 (the “2020 Notes”). The net proceeds were used to finance the tender offers and redemptions in which $800 million principal amount of CCO Holdings' outstanding 8.75% Senior Notes due 2013 (the “2013 Notes”) and $770 million principal amount of Charter Operating’s outstanding 8.375% Senior Second Lien Notes due 2014 (the “2014 Notes) were repurchased.
In September 2010, CCO Holdings and CCO Holdings Capital Corp. closed on transactions in which they issued $1.0 billion aggregate principal amount of 7.25% Senior Notes due 2017 (the “2017 Notes”). The proceeds were used to repay amounts outstanding under the Charter Operating credit facilities.
In January 2011, CCO Holdings and CCO Holdings Capital Corp. closed on transactions in which they issued $1.4 billion aggregate principal amount of 7.00% Senior Notes due 2019 (the “2019 Notes”).
The net proceeds of the issuances of the 2019 Notes were contributed by CCO Holdings to Charter Operating as a capital contribution and were used to repay indebtedness under the Charter Operating credit facilities.
The Company expects to record a loss on extinguishment of debt of approximately $67 million in the first quarter of 2011 related to these transactions.
The CCO Holdings notes are guaranteed by Charter. They are senior debt obligations of CCO Holdings and CCO Holdings Capital Corp and rank equally with all other current and future unsecured, unsubordinated obligations of
F-18
CHARTER COMMUNICATIONS, INC. AND SUBSIDIARIES
NOTES TO CONSOLIDATED FINANCIAL STATEMENTS
DECEMBER 31, 2010, 2009 AND 2008
(dollars in millions, except share or per share data or where indicated)
CCO Holdings and CCO Holdings Capital Corp. The CCO Holdings notes are structurally subordinated to all obligations of subsidiaries of CCO Holdings, including the Charter Operating notes and Charter Operating credit facilities.
CCO Holdings may redeem some or all of the CCO Holdings notes at any time at a premium. The optional redemption price declines to 100% of the respective series’ principal amount, plus accrued and unpaid interest, if any, on or after varying dates in 2015 through 2018.
In addition, at any time prior to April 30, 2013 in the case of the 2018 and 2020 Notes, October 30, 2013 in the case of the 2017 Notes and January 15, 2014 in the case of the 2019 Notes, CCO Holdings may redeem up to 35% of the aggregate principal amount of the notes at a redemption price at a premium plus accrued and unpaid interest to the redemption date, with the net cash proceeds of one or more equity offerings (as defined in the indenture); provided that certain conditions are met.
In the event of specified change of control events, CCO Holdings must offer to purchase the outstanding CCO Holdings notes from the holders at a purchase price equal to 101% of the total principal amount of the notes, plus any accrued and unpaid interest.
Charter Operating Notes
The Charter Operating notes are senior debt obligations of Charter Operating and Charter Communications Operating Capital Corp. To the extent of the value of the collateral (but subject to the prior lien of the credit facilities), they rank effectively senior to all of Charter Operating’s future unsecured senior indebtedness. The collateral currently consists of the capital stock of Charter Operating held by CCO Holdings, all of the intercompany obligations owing to CCO Holdings by Charter Operating or any subsidiary of Charter Operating, and substantially all of Charter Operating’s and the guarantors’ assets (other than the assets of CCO Holdings). CCO Holdings and those subsidiaries of Charter Operating that are guarantors of, or otherwise obligors with respect to, indebtedness under the Charter Operating credit facilities and related obligations, guarantee the Charter Operating notes.
Charter Operating may, at any time and from time to time, at their option, redeem the outstanding 8.00% second-lien notes due 2012, in whole or in part, at a redemption price equal to 100% of the principal amount thereof plus accrued and unpaid interest, if any, to the redemption date, plus the Make-Whole Premium. The Make-Whole Premium is an amount equal to the excess of (a) the present value of the remaining interest and principal payments due on an 8% senior second-lien note due 2012 to its final maturity date, computed using a discount rate equal to the Treasury Rate on such date plus 0.50%, over (b) the outstanding principal amount of such note.
In March 2008, Charter Operating issued $546 million principal amount of 10.875% senior second-lien notes due 2014, guaranteed by CCO Holdings and certain other subsidiaries of Charter Operating, in a private transaction. Net proceeds from the senior second-lien notes were used to reduce borrowings, but not commitments, under the revolving portion of the Charter Operating credit facilities.
High-Yield Restrictive Covenants; Limitation on Indebtedness.
The indentures governing the CCH II, CCO Holdings and Charter Operating notes contain certain covenants that restrict the ability of CCH II, CCH II Capital Corp., CCO Holdings, CCO Holdings Capital Corp., Charter Operating, Charter Communications Operating Capital Corp., and all of their restricted subsidiaries to:
|
|
·
|
incur additional debt;
|
|
|
·
|
pay dividends on equity or repurchase equity;
|
|
|
·
|
make investments;
|
|
|
·
|
sell all or substantially all of their assets or merge with or into other companies;
|
|
|
·
|
sell assets;
|
|
|
·
|
enter into sale-leasebacks;
|
F-19
CHARTER COMMUNICATIONS, INC. AND SUBSIDIARIES
NOTES TO CONSOLIDATED FINANCIAL STATEMENTS
DECEMBER 31, 2010, 2009 AND 2008
(dollars in millions, except share or per share data or where indicated)
|
|
·
|
in the case of restricted subsidiaries, create or permit to exist dividend or payment restrictions with respect to the bond issuers, guarantee their parent companies debt, or issue specified equity interests;
|
|
|
·
|
engage in certain transactions with affiliates; and
|
|
|
·
|
grant liens.
|
CCO Holdings Credit Facility
In March 2007, CCO Holdings entered into a credit agreement (the “CCO Holdings credit facility”) which consists of a $350 million term loan facility. The facility matures in September 2014. Borrowings under the CCO Holdings credit facility bear interest at a variable interest rate based on either LIBOR (0.26% as of December 31, 2010) or a base rate plus, in either case, an applicable margin. The applicable margin for LIBOR term loans is 2.50% above LIBOR. If an event of default were to occur, CCO Holdings would not be able to elect LIBOR and would have to pay interest at the base rate plus the applicable margin. The CCO Holdings credit facility is secured by the equity interests of Charter Operating, and all proceeds thereof.
Charter Operating Credit Facilities
The Charter Operating credit facilities have an outstanding principal amount of $6.0 billion at December 31, 2010 as follows:
|
·
|
A term B-1 loan with a remaining principal amount of approximately $2.4 billion, which is repayable in equal quarterly installments and aggregating $25 million in each loan year, with the remaining balance due at final maturity on March 6, 2014;
|
|
·
|
A term B-2 loan with a remaining principal amount of approximately $307 million, which is repayable in equal quarterly installments and aggregating $3 million in each loan year, with the remaining balance due at final maturity on March 6, 2014;
|
|
·
|
A term C loan with a remaining principal amount of approximately $3.0 billion, which is repayable in equal quarterly installments and aggregating $30 million in each loan year, with the remaining balance due at final maturity on September 6, 2016;
|
|
·
|
A non-revolving loan with a remaining principal amount of approximately $199 million repayable in full on March 6, 2013; and
|
|
·
|
A revolving loan with an outstanding balance of $80 million at December 31, 2010 and allowing for borrowings of up to $1.3 billion.
|
The revolving loan matures on March 6, 2015. However, if on December 1, 2013, Charter Operating has scheduled maturities in excess of $1.0 billion between January 1, 2014 and April 30, 2014, the revolving loan will mature on December 1, 2013 unless lenders holding more than 50% of the revolving loan consent to the maturity being March 6, 2015. As of January 31, 2011, Charter Operating had maturities of $1.3 billion between January 1, 2014 and April 30, 2014. The revolving credit facility amount may be increased, but it may not exceed $1.75 billion in aggregate revolving commitments including the amount outstanding under the non-revolving loan.
Amounts outstanding under the Charter Operating credit facilities bear interest, at Charter Operating’s election, at a base rate or LIBOR (0.27% as of December 31, 2010 (0.31% for term C) and 0.26% as of December 31, 2009), as defined, plus a margin. The applicable LIBOR margin for the non-revolving loans and the term B-1 loans is currently 2.00%. The LIBOR term B-2 loan bears interest at LIBOR plus 5.0%, with a LIBOR floor of 3.5%, or at Charter Operating’s election, a base rate plus a margin of 4.00%. Charter Operating has currently elected to pay based on the base rate. The applicable margin for the term C loans is currently 3.25% in the case of LIBOR loans, provided that if certain other term loans are borrowed or certain extended loans are established, then the term C loans shall automatically increase to the extent necessary to cause the yield for the term C loans to be 25 basis points less than the yield for the other certain term loans. Charter Operating pays interest equal to LIBOR plus 3.0% on amounts borrowed under the revolving credit facility and pays a revolving
commitment fee of .5% per annum on the daily average available amount of the revolving commitment, payable quarterly.
F-20
CHARTER COMMUNICATIONS, INC. AND SUBSIDIARIES
NOTES TO CONSOLIDATED FINANCIAL STATEMENTS
DECEMBER 31, 2010, 2009 AND 2008
(dollars in millions, except share or per share data or where indicated)
The Charter Operating credit facilities also allow the Company to enter into incremental term loans in the future with an aggregate, together with all other then outstanding first lien indebtedness, including any first lien notes, of no more than $7.5 billion (less any principal payments of term loan indebtedness and first lien notes as a result of any sale of assets), with amortization as set forth in the notices establishing such term loans, but with no amortization greater than 1% per year prior to the final maturity of the existing term loans.
Although the Charter Operating credit facilities allow for the incurrence of a certain amount of incremental term loans,
no assurance can be given that the Company could obtain additional incremental term loans in the future if Charter Operating sought to do so or what amount of incremental term loans would be allowable at any given time under the terms of the Charter Operating credit facilities.
The obligations of Charter Operating under the Charter Operating credit facilities (the “Obligations”) are guaranteed by Charter Operating’s immediate parent company, CCO Holdings, and subsidiaries of Charter Operating, except for certain subsidiaries, including immaterial subsidiaries and subsidiaries precluded from guaranteeing by reason of the provisions of other indebtedness to which they are subject (the “non-guarantor subsidiaries”). The Obligations are also secured by (i) a lien on substantially all of the assets of Charter Operating and its subsidiaries (other than assets of the non-guarantor subsidiaries), to the extent such lien can be perfected under the Uniform Commercial Code by the filing of a financing statement, and (ii) a pledge by CCO Holdings of the equity interests owned by it in Charter Operating or any of Charter Operating’s subsidiaries, as well as intercompany obligations owing to it by any of such entities.
Credit Facilities — Restrictive Covenants
CCO Holdings Credit Facility
The CCO Holdings credit facility contains covenants that are substantially similar to the restrictive covenants for the CCO Holdings notes except that the leverage ratio is 5.50 to 1.0 and the change of control definition provides that a change of control occurs if a holder becomes the beneficial owner of 35% or more of Charter’s voting stock unless Paul G. Allen (“Mr. Allen”) beneficially owns a greater percentage. The CCO Holdings credit facility contains provisions requiring mandatory loan prepayments under specific circumstances, including in connection with certain sales of assets, so long as the proceeds have not been reinvested in the business. The CCO Holdings credit facility permits CCO Holdings and its subsidiaries to make distributions to pay interest on the CCH II notes, the CCO Holdings notes, and the Charter Operating second-lien notes, provided that, among other things, no default has occurred and is continuing under the CCO Holdings credit facility.
Charter Operating Credit Facilities
The Charter Operating credit facilities contain representations and warranties, and affirmative and negative covenants customary for financings of this type. The financial covenants measure performance against standards set for leverage to be tested as of the end of each quarter. Additionally, the Charter Operating credit facilities contain provisions requiring mandatory loan prepayments under specific circumstances, including in connection with certain sales of assets, so long as the proceeds have not been reinvested in the business. The Charter Operating credit facilities permit Charter Operating and its subsidiaries to make distributions to pay interest on the currently outstanding subordinated and parent company indebtedness, provided that, among other things, no default has occurred and is continuing under the Charter Operating credit facilities.
The events of default under the Charter Operating credit facilities include, among other things:
|
|
·
|
the failure to make payments when due or within the applicable grace period;
|
|
|
·
|
the failure to comply with specified covenants, including but not limited to a covenant to deliver audited financial statements for Charter Operating with an unqualified opinion from the Company’s independent accountants and without a “going concern” or like qualification or exception;
|
|
|
·
|
the failure to pay or the occurrence of events that cause or permit the acceleration of other indebtedness owing by CCO Holdings, Charter Operating, or Charter Operating’s subsidiaries in aggregate principal amounts in excess of $100 million;
|
F-21
CHARTER COMMUNICATIONS, INC. AND SUBSIDIARIES
NOTES TO CONSOLIDATED FINANCIAL STATEMENTS
DECEMBER 31, 2010, 2009 AND 2008
(dollars in millions, except share or per share data or where indicated)
|
|
·
|
the failure to pay or the occurrence of events that result in the acceleration of other indebtedness owing by certain of CCO Holdings’ direct and indirect parent companies in aggregate principal amounts in excess of $200 million;
|
|
|
·
|
the consummation of any transaction resulting in any person or group having power, directly or indirectly, to vote more than 50% of the ordinary voting power for the management of Charter Operating on a fully diluted basis or a change of control shall occur under any indebtedness of CCO Holdings, any first lien notes of Charter Operating or any specified long-term indebtedness of Charter Operating (as defined in the Credit Agreement) in excess of $200 million in aggregate principal amount some of which instruments contain a 35% beneficial ownership change of control provision; and
|
|
|
·
|
Charter Operating ceasing to be a wholly-owned direct subsidiary of CCO Holdings, except in certain limited circumstances.
|
Limitations on Distributions
Distributions by the Company’s subsidiaries to a parent company for payment of principal on parent company notes are restricted under the indentures and credit facilities discussed above, unless there is no default under the applicable indenture and credit facilities, and unless each applicable subsidiary’s leverage ratio test is met at the time of such distribution. As of December 31, 2010, there was no default under any of these indentures or credit facilities. Distributions by Charter Operating for payment of principal on parent company notes are further restricted by the covenants in its credit facilities.
Distributions by CCO Holdings, and Charter Operating to a parent company for payment of parent company interest are permitted if there is no default under the aforementioned indentures and CCO Holdings and Charter Operating credit facilities.
In addition to the limitation on distributions under the various indentures discussed above, distributions by the Company’s subsidiaries may only be made if they have “surplus” as defined in the Delaware Limited Liability Company Act.
Liquidity and Future Principal Payments
The Company continues to have significant amounts of debt, and its business requires significant cash to fund principal and interest payments on its debt, capital expenditures and ongoing operations. As set forth below, the Company has significant future principal payments beginning in 2012 and beyond. The Company continues to monitor the capital markets, and it expects to undertake refinancing transactions and utilize free cash flow and cash on hand to further extend or reduce the maturities of its principal obligations. The timing and terms of any refinancing transactions will be subject to market conditions.
Based upon outstanding indebtedness as of December 31, 2010, the amortization of term loans, and the maturity dates for all senior and subordinated notes, total future principal payments on the total borrowings under all debt agreements as of December 31, 2010, are as follows:
|
Year
|
Amount
|
|||
|
2011
|
$ | 58 | ||
|
2012
|
1,158 | |||
|
2013
|
337 | |||
|
2014
|
3,531 | |||
|
2015
|
30 | |||
|
Thereafter
|
7,202 | |||
| $ | 12,316 | |||
F-22
CHARTER COMMUNICATIONS, INC. AND SUBSIDIARIES
NOTES TO CONSOLIDATED FINANCIAL STATEMENTS
DECEMBER 31, 2010, 2009 AND 2008
(dollars in millions, except share or per share data or where indicated)
8. Preferred Stock
On the Effective Date, Charter issued approximately 5.5 million shares of 15% Pay-In-Kind Preferred Stock having an aggregate liquidation preference of $138 million to holders of Charter convertible notes (the “Preferred Stock”). Pursuant to the terms of the Preferred Stock, the Company was required to pay a dividend at an annual rate equal to 15% on the liquidation preference of the Preferred Stock. The liquidation preference of the Preferred Stock was $25 per share. On April 16, 2010, Charter redeemed all of the shares of the Preferred Stock for a redemption payment of $25.948 per share or a total redemption payment for all shares of approximately $143 million.
The Preferred Stock was included in other long-term liabilities on the Company’s consolidated balance sheets at fair value of $148 million as of December 31, 2009 (Successor). The Preferred Stock was recorded at fair value with gains or losses recorded in other income (expense), net.
9. Noncontrolling Interest
On February 8, 2010, Mr. Allen exercised his remaining right to exchange Charter Holdco units for shares of Class A common stock after which Charter Holdco became 100% owned by Charter. Noncontrolling interest on the Company’s condensed consolidated balance sheets at December 31, 2009 represented the fair value of Mr. Allen’s .19% interest of Charter Holdco plus the allocation of income for the month ended December 31, 2009.
On January 1, 2009, Charter adopted new accounting guidance regarding consolidations and noncontrolling interests
,
which requires losses to be allocated to noncontrolling interest even when such amounts are deficits. As such, losses are allocated between Charter and the noncontrolling interest. Net income and basic and diluted earnings per common share would have been $10.1 billion and $26.68 and $11.20, respectively, for the eleven months ended November 30, 2009 if such new accounting guidance had not been adopted.
F-23
CHARTER COMMUNICATIONS, INC. AND SUBSIDIARIES
NOTES TO CONSOLIDATED FINANCIAL STATEMENTS
DECEMBER 31, 2010, 2009 AND 2008
(dollars in millions, except share or per share data or where indicated)
Changes to controlling and noncontrolling interest consist of the following for the periods presented:
|
Controlling
|
Noncontrolling
|
|||||||||||
|
Interest
|
Interest
|
Total
|
||||||||||
|
PREDECESSOR:
|
||||||||||||
|
Balance, December 31, 2008, Predecessor
|
$ | (10,506 | ) | $ | -- | $ | (10,506 | ) | ||||
|
Net income (loss)
|
11,364 | (1,265 | ) | 10,099 | ||||||||
|
Loss included in temporary equity (see Note 11)
|
-- | 7 | 7 | |||||||||
|
Changes in the fair value of interest rate agreements
|
(5 | ) | (4 | ) | (9 | ) | ||||||
|
Stock compensation expense, net
|
5 | -- | 5 | |||||||||
|
Amortization of accumulated other comprehensive loss related to interest rate agreements
|
32 | 29 | 61 | |||||||||
|
Cancellation of Predecessor common stock and
noncontrolling interest
|
(5,399 | ) | 1,233 | (4,166 | ) | |||||||
|
Elimination of Predecessor accumulated deficit and
accumulated other comprehensive income (loss)
|
4,509 | -- | 4,509 | |||||||||
|
Balance, November 30, 2009, Predecessor
|
-- | -- | -- | |||||||||
|
SUCCESSOR:
|
||||||||||||
|
Issuance of new equity
|
2,003 | 12 | 2,015 | |||||||||
|
Balance, November 30, 2009, Successor
|
2,003 | 12 | 2,015 | |||||||||
|
Net income
|
2 | -- | 2 | |||||||||
|
Charter Investment Inc.’s (“CII”) exchange of Charter Holdco
interest (see Note 18)
|
(90 | ) | (10 | ) | (100 | ) | ||||||
|
Stock compensation expense, net
|
1 | -- | 1 | |||||||||
|
Balance, December 31, 2009, Successor
|
1,916 | 2 | 1,918 | |||||||||
|
Net loss
|
(237 | ) | -- | (237 | ) | |||||||
|
CII’s exchange of Charter Holdco interest (see Note 18)
|
(166 | ) | (2 | ) | (168 | ) | ||||||
|
Change in fair value of interest rate swap agreements
|
(57 | ) | -- | (57 | ) | |||||||
|
Stock compensation expense, net
|
28 | -- | 28 | |||||||||
|
Purchase of treasury stock
|
(6 | ) | -- | (6 | ) | |||||||
|
Balance, December 31, 2010, Successor
|
$ | 1,478 | $ | -- | $ | 1,478 | ||||||
10. Common Stock
All of the issued and outstanding shares of Predecessor common stock, par value $.001 per share, and any other outstanding equity securities of Predecessor, including all options and restricted stock, were cancelled on the Effective Date, and Successor issued 109.7 million shares of new Charter Class A common stock, par value $.001 per share and 2.2 million shares of new Charter Class B common stock, par value $.001 per share.
Charter’s Class A common stock and Class B common stock were identical except with respect to certain voting, transfer and conversion rights. Holders of Class A common stock are entitled to one vote per share and the holder of Class B common stock was entitled to votes equaling 35% of the voting interests in Charter on a fully diluted basis. Charter Holdco membership units were exchangeable on a one-for-one basis for shares of Class A common stock.
As of December 31, 2010, Mr. Allen held all 2,241,299 shares of Class B common stock of Charter. Pursuant to the terms of the Certificate of Incorporation of Charter, on January 18, 2011, the Disinterested Members of the Board of Directors of Charter caused a conversion of the shares of Class B common stock into shares of Class A common stock on a one-for-one basis.
F-24
CHARTER COMMUNICATIONS, INC. AND SUBSIDIARIES
NOTES TO CONSOLIDATED FINANCIAL STATEMENTS
DECEMBER 31, 2010, 2009 AND 2008
(dollars in millions, except share or per share data or where indicated)
On the Effective Date, holders of notes issued by CIH and Charter Holdings received 6.4 million and 1.3 million warrants, respectively, to purchase shares of new Charter Class A common stock with an exercise price of $46.86 and $51.28 per share, respectively, that expire five years from the date of issuance, and CII received 4.7 million warrants to purchase shares of new Charter Class A common stock with an exercise price of $19.80 per share that expire seven years from the date of issuance. The warrants were valued at approximately $90 million using the Black-Scholes option-pricing model and are included in the accompanying balance sheets in total Charter shareholders’ equity.
The following table summarizes our share activity for the three years ended December 31, 2010:
|
Class A
|
Class B
|
|||||||
|
Common
|
Common
|
|||||||
|
Stock
|
Stock
|
|||||||
|
PREDECESSOR:
|
||||||||
|
BALANCE, January 1, 2008, Predecessor
|
398,226,468 | 50,000 | ||||||
|
Option exercises and performance share vesting
|
1,616,906 | -- | ||||||
|
Restricted stock issuances, net of cancellations
|
10,194,534 | -- | ||||||
|
Issuances in exchange for preferred shares
|
4,699,986 | -- | ||||||
|
Returns pursuant to share lending agreement
|
(3,000,000 | ) | -- | |||||
|
BALANCE, December 31, 2008, Predecessor
|
411,737,894 | 50,000 | ||||||
|
Performance share vesting
|
890,692 | -- | ||||||
|
Restricted stock cancellations
|
(10,518,362 | ) | -- | |||||
|
Returns pursuant to share lending agreement
|
(18,784,300 | ) | -- | |||||
|
Cancellation of Predecessor Class A and Class B common stock
|
(383,325,924 | ) | (50,000 | ) | ||||
|
BALANCE, November 30, 2009, Predecessor
|
-- | -- | ||||||
|
SUCCESSOR:
|
||||||||
|
Issuance of new Charter Class A and Class B common
stock in connection with emergence from Chapter 11
|
109,748,948 | 2,241,299 | ||||||
|
Balance, November 30, 2009, Successor
|
109,748,948 | 2,241,299 | ||||||
|
CII exchange of Charter Holdco interest (see Note 18)
|
907,698 | -- | ||||||
|
Restricted stock issuances
|
1,920,226 | -- | ||||||
|
BALANCE, December 31, 2009, Successor
|
112,576,872 | 2,241,299 | ||||||
|
CII exchange of Charter Holdco interest (see Note 18)
|
212,923 | -- | ||||||
|
Restricted stock issuances, net of cancellations
|
(311,650 | ) | -- | |||||
|
Warrant exercise
|
21 | -- | ||||||
|
Stock issuance
|
16,000 | -- | ||||||
|
Purchase of treasury stock
|
(176,475 | ) | -- | |||||
|
BALANCE, December 31, 2010, Successor
|
112,317,691 | 2,241,299 | ||||||
In 2006 and 2005, Charter issued 116.9 million shares of Class A common stock in public offerings. These offerings of Class A common stock were conducted to facilitate transactions by which investors in Charter’s 5.875% convertible senior notes due 2009 hedged their investments in the convertible senior notes. The shares were issued pursuant to the share lending agreement, pursuant to which Charter had previously agreed to loan up to 150 million shares to Citigroup Global Markets Limited (“CGML”). As of November 30, 2009, 113.9 million shares had been returned under the share lending agreement. The remaining shares were cancelled on the Effective Date.
F-25
CHARTER COMMUNICATIONS, INC. AND SUBSIDIARIES
NOTES TO CONSOLIDATED FINANCIAL STATEMENTS
DECEMBER 31, 2010, 2009 AND 2008
(dollars in millions, except share or per share data or where indicated)
During the year ended December 31, 2010, the Company withheld 176,475 shares of its common stock in payment of income tax withholding owed by employees upon vesting of restricted shares. The Company accounts for treasury stock using the cost method and includes treasury stock as a component of total Charter shareholders’ equity. The Company currently does not have or intend to initiate a share repurchase program.
11. Comprehensive Income (Loss)
The Company reports changes in the fair value of interest rate swap agreements designated as hedging the variability of cash flows associated with floating-rate debt obligations, that meet effectiveness criteria in accumulated other comprehensive income (loss). Consolidated comprehensive loss for the years ended December 31, 2010 (Successor) and 2008 (Predecessor) was $294 million and $2.6 billion, respectively. Consolidated comprehensive income for the one month ended December 31, 2009 (Successor) and eleven months ended November 30, 2009 (Predecessor) was $2 million and $10.2 billion, respectively. Consolidated comprehensive income (loss) for the year ended December 31, 2010 (Successor), eleven months ended November 30, 2009 (Predecessor) and the year ended December 31, 2008 (Predecessor), includes a $57 million, $9 million and $180 million loss, respectively, on the fair value of interest rate swap agreements designated as cash flow hedges. For the eleven months ended November 30, 2009, consolidated comprehensive income also included a $61 million gain related to the amortization of the accumulated other comprehensive loss related to terminated interest rate swap agreements in connection with the bankruptcy.
12. Accounting for Derivative Instruments and Hedging Activities
The Company uses interest rate swap agreements to manage its interest costs and reduce the Company’s exposure to increases in floating interest rates. The Company manages its exposure to fluctuations in interest rates by maintaining a mix of fixed and variable rate debt. Using interest rate swap agreements, the Company agrees to exchange, at specified intervals through 2015, the difference between fixed and variable interest amounts calculated by reference to agreed-upon notional principal amounts.
The Company does not hold or issue derivative instruments for speculative trading purposes. The Company has certain interest rate derivative instruments that have been designated as cash flow hedging instruments. Such instruments effectively convert variable interest payments on certain debt instruments into fixed payments. For qualifying hedges, realized derivative gains and losses offset related results on hedged items in the consolidated statements of operations. The Company formally documents, designates and assesses the effectiveness of transactions that receive hedge accounting.
Interest rate swap agreements are included in other long-term liabilities at fair value of $57 million as of December 31, 2010 (Successor). Changes in the fair value of interest rate agreements that are designated as hedging instruments of the variability of cash flows associated with floating-rate debt obligations, and that meet effectiveness criteria are reported in accumulated other comprehensive income (loss). The amounts are subsequently reclassified as an increase or decrease to interest expense in the same periods in which the related interest on the floating-rate debt obligations affected earnings (losses).
In 2009 and 2008, certain interest rate derivative instruments did not meet effectiveness criteria. Management believed such instruments were closely correlated with the respective debt, thus managing associated risk. Interest rate derivative instruments not designated as hedges were marked to fair value, with the impact recorded as other income (expenses), net in the Company’s consolidated statements of operations.
As of December 31, 2010 (Successor), the Company had $2.0 billion in notional amounts of interest rate swap agreements outstanding. The notional amounts of interest rate instruments do not represent amounts exchanged by the parties and, thus, are not a measure of exposure to credit loss. The amounts exchanged were determined by reference to the notional amount and the other terms of the contracts.
F-26
CHARTER COMMUNICATIONS, INC. AND SUBSIDIARIES
NOTES TO CONSOLIDATED FINANCIAL STATEMENTS
DECEMBER 31, 2010, 2009 AND 2008
(dollars in millions, except share or per share data or where indicated)
The effect of derivative instruments on the Company’s consolidated statements of operations is presented in the table below.
|
Successor
|
Predecessor
|
|||||||||||||||
|
Year Ended December 31,
|
One Month
Ended
December 31,
|
Eleven Months Ended
November 31,
|
Year Ended December 31,
|
|||||||||||||
|
2010
|
2009
|
2009
|
2008
|
|||||||||||||
|
Other income (expense), net:
|
||||||||||||||||
|
Loss on interest rate derivates not designated
as hedges or ineffective portion of hedges
|
$ | -- | $ | -- | $ | (4 | ) | $ | (62 | ) | ||||||
|
Gain on embedded derivatives
|
-- | -- | -- | 33 | ||||||||||||
| $ | -- | $ | -- | $ | (4 | ) | $ | (29 | ) | |||||||
|
Accumulated other comprehensive loss:
|
||||||||||||||||
|
Loss on interest rate derivatives designated as
hedges (effective portion)
|
$ | (57 | ) | $ | -- | $ | (9 | ) | $ | (180 | ) | |||||
| $ | (57 | ) | $ | -- | $ | (9 | ) | $ | (180 | ) | ||||||
|
Amount of gain (loss) reclassified from
accumulated other comprehensive loss into
interest
expense or reorganization items, net
|
$ | (27 | ) | $ | -- | $ | 275 | $ | (76 | ) | ||||||
13. Fair Value Measurements
Financial Assets and Liabilities
The Company has estimated the fair value of its financial instruments as of December 31, 2010 and 2009 using available market information or other appropriate valuation methodologies. Considerable judgment, however, is required in interpreting market data to develop the estimates of fair value. Accordingly, the estimates presented in the accompanying consolidated financial statements are not necessarily indicative of the amounts the Company would realize in a current market exchange.
The carrying amounts of cash and cash equivalents, receivables, payables and other current assets and liabilities approximate fair value because of the short maturity of those instruments.
The estimated fair value of the Company’s debt at December 31, 2010 and 2009 are based on quoted market prices and is classified within Level 1 (defined below) of the valuation hierarchy.
A summary of the carrying value and fair value of the Company’s debt at December 31, 2010 and 2009 is as follows:
|
December 31, 2010
|
December 31, 2009
|
||||||||||||||
|
Carrying
|
Fair
|
Carrying
|
Fair
|
||||||||||||
|
Value
|
Value
|
Value
|
Value
|
||||||||||||
|
Debt
|
|
||||||||||||||
|
CCH II debt
|
$
|
2,057
|
$
|
2,113
|
$
|
2,092
|
$
|
2,086
|
|||||||
|
CCO Holdings debt
|
$
|
2,600
|
$
|
2,709
|
$
|
812
|
$
|
816
|
|||||||
|
Charter Operating debt
|
$
|
1,703
|
$
|
1,774
|
$
|
2,500
|
$
|
2,527
|
|||||||
|
Credit facilities
|
$
|
5,946
|
$
|
6,252
|
$
|
7,918
|
$
|
8,000
|
|||||||
F-27
CHARTER COMMUNICATIONS, INC. AND SUBSIDIARIES
NOTES TO CONSOLIDATED FINANCIAL STATEMENTS
DECEMBER 31, 2010, 2009 AND 2008
(dollars in millions, except share or per share data or where indicated)
The accounting guidance
establishes a three-level hierarchy for disclosure of fair value measurements, based upon the transparency of inputs to the valuation of an asset or liability as of the measurement date, as follows:
|
·
|
Level 1 – inputs to the valuation methodology are quoted prices (unadjusted) for identical assets or liabilities in active markets.
|
|
·
|
Level 2 – inputs to the valuation methodology include quoted prices for similar assets and liabilities in active markets, and inputs that are observable for the asset or liability, either directly or indirectly, for substantially the full term of the financial instrument.
|
|
·
|
Level 3 – inputs to the valuation methodology are unobservable and significant to the fair value measurement.
|
The interest rate derivatives designated as hedges were valued at December 31, 2010 using a present value calculation based on an implied forward LIBOR curve (adjusted for Charter Operating’s or counterparties’ credit risk) and were classified within Level 2 of the valuation hierarchy. The weighted average pay rate for the Company’s interest rate swap agreements was 2.25% at December 31, 2010 (exclusive of applicable spreads).
The Preferred Stock was valued at December 31, 2009 using an income approach based on yields of the Company’s debt securities and was classified within Level 3 of the valuation hierarchy. On April 16, 2010, Charter redeemed all of the shares of the Preferred Stock.
At December 31, 2010 and 2009, the Company’s financial liabilities that were accounted for at fair value on a recurring basis are presented in the table below:
|
Fair Value As of December 31, 2010
|
Fair Value As of December 31, 2009
|
|||||||||||||||||||||||||||||||
|
Level 1
|
Level 2
|
Level 3
|
Total
|
Level 1
|
Level 2
|
Level 3
|
Total
|
|||||||||||||||||||||||||
|
Other long-term liabilities:
|
||||||||||||||||||||||||||||||||
|
Preferred stock
|
$ | -- | $ | -- | $ | -- | $ | -- | $ | -- | $ | -- | $ | 148 | $ | 148 | ||||||||||||||||
|
Interest rate derivatives
designated as hedges
|
-- | 57 | -- | 57 | -- | -- | -- | -- | ||||||||||||||||||||||||
| $ | -- | $ | 57 | $ | -- | $ | 57 | $ | -- | $ | -- | $ | 148 | $ | 148 | |||||||||||||||||
The Company’s long-term debt was adjusted to fair value on the Effective Date. Debt instruments with a fair value of $9.8 billion were classified as Level 1 within the fair value hierarchy and debt instruments with a fair value of $3.5 billion were classified as Level 2 in the fair value hierarchy on the Effective Date.
Nonfinancial Assets and Liabilities
The Company adopted new accounting guidance effective January 1, 2009 with respect to its nonfinancial assets and liabilities including fair value measurements of franchises, property, plant, and equipment, and other intangible assets. These assets are not measured at fair value on a recurring basis; however they are subject to fair value adjustments in certain circumstances, such as when there is evidence that an impairment may exist. During 2009, the Company recorded an impairment on its franchise assets of $2.2 billion and reflected its franchises, property, plant and equipment, customer relationships and goodwill at fair value based on applying fresh start accounting. The fair value of these assets was determined utilizing an income approach or cost approach that makes use of significant unobservable inputs. Such fair values are classified as level 3 in the fair value hierarchy. See Note 5 for additional information.
F-28
CHARTER COMMUNICATIONS, INC. AND SUBSIDIARIES
NOTES TO CONSOLIDATED FINANCIAL STATEMENTS
DECEMBER 31, 2010, 2009 AND 2008
(dollars in millions, except share or per share data or where indicated)
14. Other Operating (Income) Expenses, Net
Other operating (income) expenses, net consist of the following for the years presented:
|
Successor
|
Predecessor
|
|||||||||||||||
|
Year Ended December 31,
|
One Month
Ended
December 31,
|
Eleven Months Ended
November 31,
|
Year Ended December 31,
|
|||||||||||||
|
2010
|
2009
|
2009
|
2008
|
|||||||||||||
|
Loss on sale of assets, net
|
$ | 9 | $ | 1 | $ | 6 | $ | 13 | ||||||||
|
Special charges, net
|
16 | 3 | (44 | ) | 56 | |||||||||||
| $ | 25 | $ | 4 | $ | (38 | ) | $ | 69 | ||||||||
Loss on sale of assets, net
Loss on sale of assets represents the loss recognized on the sales of fixed assets and cable systems, including the sale of systems serving approximately 64,900 basic video customers in October 2010.
Special charges, net
Special charges, net for the year ended December 31, 2010, one month ended December 31, 2009, eleven months ended November 30, 2009 and year ended December 31, 2008 primarily includes net amounts received or paid in litigation settlements and severance charges.
15. Gain (Loss) on Extinguishment of Debt
Gain (loss) on extinguishment of debt consists of the following for years presented:
|
Successor
|
Predecessor
|
|||||||||||||||
|
Year Ended December 31,
|
One Month
Ended
December 31,
|
Eleven Months Ended
November 30,
|
Year Ended December 31,
|
|||||||||||||
|
2010
|
2009
|
2009
|
2008
|
|||||||||||||
|
Charter Holdings debt notes repurchases / exchanges
|
$ | -- | $ | -- | $ | -- | $ | 3 | ||||||||
|
Charter convertible note repurchases / exchanges
|
-- | -- | -- | 5 | ||||||||||||
|
CCH II tender offer
|
-- | -- | -- | (4 | ) | |||||||||||
|
CCO Holdings debt notes repurchases / exchanges
|
(17 | ) | -- | -- | -- | |||||||||||
|
Charter Operating debt notes repurchases
|
(17 | ) | -- | -- | -- | |||||||||||
|
Charter Operating credit amendment / prepayments
|
(51 | ) | -- | -- | -- | |||||||||||
| $ | (85 | ) | $ | -- | $ | -- | $ | 4 | ||||||||
In October and December 2010, the Company prepaid $266 million principal amount of term B-1 and B-2 loans under the Charter Operating credit facilities resulting in a loss on extinguishment of debt of approximately $13 million for the year ended December 31, 2010 (Successor).
On September 27, 2010 CCO Holdings and CCO Holdings Capital Corp. closed on transactions in which they issued the 2017 Notes. The net proceeds were used in October to repay amounts outstanding under the Charter Operating credit facilities. The transaction resulted in a loss on extinguishment of debt of approximately $34 million for the year ended December 31, 2010 (Successor).
F-29
CHARTER COMMUNICATIONS, INC. AND SUBSIDIARIES
NOTES TO CONSOLIDATED FINANCIAL STATEMENTS
DECEMBER 31, 2010, 2009 AND 2008
(dollars in millions, except share or per share data or where indicated)
In August and September 2010, the Company prepaid $122 million principal amount of term B-2 loans under the Charter Operating credit facilities resulting in a loss on extinguishment of debt of approximately $3 million for the year ended December 31, 2010 (Successor).
On April 28, 2010, CCO Holdings and CCO Holdings Capital Corp. closed on transactions in which they issued the 2018 Notes and 2020 Notes. The net proceeds were used to finance the tender offers and redemptions of CCO Holdings’ 2013 Notes and Charter Operating’s 2014 Notes. The transactions resulted in a loss on extinguishment of debt of approximately $34 million for the year ended December 31, 2010 (Successor).
On March 31, 2010, Charter Operating entered into an amended and restated credit agreement. The refinancing resulted in a loss on extinguishment of debt of approximately $1 million for the year ended December 31, 2010 (Successor).
In October 2008, Charter Holdco completed a tender offer, in which a total of approximately $102 million principal amount of various Charter Holdings notes due 2009 and 2010 were exchanged for approximately $99 million of cash. Charter Holdco held the Charter Holdings notes. The transactions resulted in a gain on extinguishment of debt of approximately $2 million for the year ended December 31, 2008 (Predecessor).
In July 2008, CCH II completed a tender offer, in which $338 million of CCH II’s 10.25% senior notes due 2010 were accepted for $364 million of CCH II’s 10.25% Senior Notes due 2013, which were issued as part of the same series of notes as CCH II’s $250 million aggregate principal amount of 10.25% Senior Notes due 2013, which were issued in September 2006. The transactions resulted in a loss on extinguishment of debt of approximately $4 million for the year ended December 31, 2008 (Predecessor).
In the second quarter of 2008, Charter Holdco repurchased, in private transactions from a small number of institutional holders, a total of approximately $35 million principal amount of various Charter Holdings notes due 2009 and 2010 for approximately $35 million of cash. Charter Holdco held the Charter Holdings notes. The transactions resulted in a gain on extinguishment of debt of approximately $1 million for the year ended December 31, 2008 (Predecessor).
In the second quarter of 2008, Charter Holdco repurchased, in private transactions, from a small number of institutional holders, a total of approximately $46 million principal amount of Charter’s 5.875% Convertible Senior Notes due 2009, for approximately $42 million of cash. The purchased 5.875% Convertible Senior Notes were cancelled resulting in approximately $3 million principal amount of such notes remaining outstanding. The transactions resulted in a gain on extinguishment of debt of approximately $5 million for the year ended December 31, 2008 (Predecessor).
16. Other Income (Expense), Net
Other income (expense), net consists of the following for years presented:
|
Successor
|
Predecessor
|
|||||||||||||||
|
Year Ended December 31,
|
One Month
Ended
December 31,
|
Eleven Months Ended
November 30,
|
Year Ended December 31,
|
|||||||||||||
|
2010
|
2009
|
2009
|
2008
|
|||||||||||||
|
Gain (loss) on investment
|
$ | -- | $ | -- | $ | 1 | $ | (1 | ) | |||||||
|
Change in value of preferred stock
|
2 | (3 | ) | -- | -- | |||||||||||
|
Other, net
|
-- | -- | 1 | (5 | ) | |||||||||||
| $ | 2 | $ | (3 | ) | $ | 2 | $ | (6 | ) | |||||||
F-30
CHARTER COMMUNICATIONS, INC. AND SUBSIDIARIES
NOTES TO CONSOLIDATED FINANCIAL STATEMENTS
DECEMBER 31, 2010, 2009 AND 2008
(dollars in millions, except share or per share data or where indicated)
17. Stock Compensation Plans
In accordance with the Plan, the Company's board of directors adopted the Charter Communications, Inc. 2009 Stock Incentive Plan (the “2009 Stock Plan”). The 2009 Stock Plan provides for grants of nonqualified stock options, incentive stock options, stock appreciation rights, dividend equivalent rights, performance units and performance shares, share awards, phantom stock, restricted stock units and restricted stock. Directors, officers and other employees of the Company and its subsidiaries, as well as others performing consulting services for the Company, are eligible for grants under the 2009 Stock Plan.
In 2009, the majority of restricted stock and performance units and shares were voluntarily forfeited by participants without termination of the service period, and the remaining, along with all stock options, were cancelled on the Effective Date.
The Plan included an allocation of not less than 3% of new equity for employee grants with 50% of the allocation to be granted within thirty days of the Company's emergence from bankruptcy. In December 2009, the Company's board of directors authorized 8 million shares under the 2009 Stock Plan and awarded to certain employees 2 million shares of restricted stock, one-third of which are to vest on each of the first three anniversaries of the Effective Date. Such grant of new awards is deemed to be a modification of old awards and was accounted for as a modification of the original awards. As a result, unamortized compensation cost of $12 million was added to the cost of the new award and is being amortized over the vesting period.
Under the 2009 Stock Plan, restricted stock vests annually over a one to three-year period beginning from the date of grant. Stock options vest annually over four years from the grant date and expire ten years from the grant date. As of December 31, 2010 (Successor), total unrecognized compensation remaining to be recognized in future periods totaled $39 million for restricted stock and $19 million for stock options and the weighted average period over which it is expected to be recognized is 2 years for restricted stock and 4 years for stock options. During 2009, no equity awards were granted; however Charter granted $12 million of performance cash and restricted cash under Charter’s 2009 incentive program.
The Company recorded $26 million, $1 million, $26 million and $33 million of stock compensation expense for the year ended December 31, 2010 (Successor), one month ended December 31, 2009 (Successor), eleven months ended November 30, 2009 (Predecessor) and year ended December 31, 2008 (Predecessor), respectively, which is included in selling, general, and administrative expense.
F-31
CHARTER COMMUNICATIONS, INC. AND SUBSIDIARIES
NOTES TO CONSOLIDATED FINANCIAL STATEMENTS
DECEMBER 31, 2010, 2009 AND 2008
(dollars in millions, except share or per share data or where indicated)
A summary of the activity for the Company’s stock options for the year ended December 31, 2010, one month ended December 31, 2009, eleven months ended November 30, 2009 and year ended December 31, 2008, is as follows (amounts in thousands, except per share data):
|
Successor
|
Predecessor
|
|||||||||||||||||||||||||||||||
|
Year Ended
|
One Month Ended
|
Eleven Months Ended
|
Year Ended
|
|||||||||||||||||||||||||||||
|
December 31, 2010
|
December 31, 2009
|
November 30, 2009
|
December 31, 2008
|
|||||||||||||||||||||||||||||
|
Weighted
|
Weighted
|
Weighted
|
Weighted
|
|||||||||||||||||||||||||||||
|
Average
|
Average
|
Average
|
Average
|
|||||||||||||||||||||||||||||
|
Exercise
|
Exercise
|
Exercise
|
Exercise
|
|||||||||||||||||||||||||||||
|
Shares
|
Price
|
Shares
|
Price
|
Shares
|
Price
|
Shares
|
Price
|
|||||||||||||||||||||||||
|
Outstanding,
beginning of period
|
-- | $ | -- | -- | $ | -- | 22,044 | $ | 3.82 | 25,682 | $ | 4.02 | ||||||||||||||||||||
|
Granted
|
1,461 | $ | 35.12 | -- | $ | -- | -- | $ | -- | 45 | $ | 1.19 | ||||||||||||||||||||
|
Exercised
|
-- | $ | -- | -- | $ | -- | -- | $ | -- | (53 | ) | $ | 1.18 | |||||||||||||||||||
|
Cancelled
|
(30 | ) | $ | 35.38 | -- | $ | -- | (22,044 | ) | $ | 3.82 | (3,630 | ) | $ | 5.27 | |||||||||||||||||
|
Outstanding,
end of period
|
1,431 | $ | 35.12 | -- | $ | -- | -- | $ | -- | 22,044 | $ | 3.82 | ||||||||||||||||||||
|
Weighted average
remaining contractual
life
|
10 years
|
-- | -- |
6 years
|
||||||||||||||||||||||||||||
|
Options exercisable,
end of period
|
-- | $ | -- | -- | $ | -- | -- | $ | -- | 15,787 | $ | 4.53 | ||||||||||||||||||||
|
Weighted average fair
value of options g
ranted
|
$ | 17.00 | $ | -- | $ | -- | $ | 0.90 | ||||||||||||||||||||||||
A summary of the activity for the Company’s restricted stock for the year ended December 31, 2010, one month ended December 31, 2009, eleven months ended November 30, 2009 and year ended December 31, 2008, is as follows (amounts in thousands, except per share data):
|
Successor
|
Predecessor
|
||||||||||||||||||||||
|
Year Ended
December 31,
|
One Month Ended
December 31,
|
Eleven Months Ended
November 30,
|
Year Ended
December 31,
|
||||||||||||||||||||
|
2010
|
2009
|
2009
|
2008
|
||||||||||||||||||||
|
Weighted
|
Weighted
|
Weighted
|
Weighted
|
||||||||||||||||||||
|
Average
|
Average
|
Average
|
Average
|
||||||||||||||||||||
|
Grant
|
Grant
|
Grant
|
Grant
|
||||||||||||||||||||
|
Shares
|
Price
|
Shares
|
Price
|
Shares
|
Price
|
Shares
|
Price
|
||||||||||||||||
|
Outstanding, beginning of period
|
1,920
|
$
|
35.25
|
--
|
$
|
--
|
12,009
|
$
|
1.21
|
4,112
|
$
|
2.87
|
|||||||||||
|
Granted
|
177
|
$
|
32.23
|
1,920
|
$
|
35.25
|
--
|
$
|
--
|
10,761
|
$
|
0.85
|
|||||||||||
|
Vested
|
(527)
|
$
|
35.14
|
--
|
$
|
--
|
(259)
|
$
|
1.08
|
(2,298)
|
$
|
2.36
|
|||||||||||
|
Cancelled
|
(489)
|
$
|
35.25
|
--
|
$
|
--
|
(11,750)
|
$
|
1.21
|
(566)
|
$
|
1.57
|
|||||||||||
|
Outstanding, end of period
|
1,081
|
$
|
34.81
|
1,920
|
$
|
35.25
|
--
|
$
|
--
|
12,009
|
$
|
1.21
|
|||||||||||
F-32
CHARTER COMMUNICATIONS, INC. AND SUBSIDIARIES
NOTES TO CONSOLIDATED FINANCIAL STATEMENTS
DECEMBER 31, 2010, 2009 AND 2008
(dollars in millions, except share or per share data or where indicated)
No performance units or shares were granted in 2009 or 2010. On the Effective Date, all remaining performance units and shares were cancelled. A summary of the activity for the Company’s performance units and shares for the eleven months ended November 30, 2009 (Predecessor) and year ended December 31, 2008 (Predecessor) is as follows (amounts in thousands, except per share data):
|
Predecessor
|
||||||||||
|
Eleven Months Ended
|
Year Ended,
|
|||||||||
|
November 30, 2009
|
December 31, 2008
|
|||||||||
|
Weighted
|
Weighted
|
|||||||||
|
Average
|
Average
|
|||||||||
|
Grant
|
Grant
|
|||||||||
|
Shares
|
Price
|
Shares
|
Price
|
|||||||
|
Outstanding, beginning of period
|
33,037
|
$
|
1.80
|
28,013
|
$
|
2.16
|
||||
|
Granted
|
--
|
$
|
--
|
10,137
|
$
|
0.84
|
||||
|
Vested
|
(951)
|
$
|
1.21
|
(1,562)
|
$
|
1.49
|
||||
|
Cancelled
|
(32,086)
|
$
|
1.81
|
(3,551)
|
$
|
2.08
|
||||
|
Outstanding, end of period
|
--
|
$
|
--
|
33,037
|
$
|
1.80
|
||||
18. Income Taxes
All of Charter’s operations are held through Charter Holdco and its direct and indirect subsidiaries. Charter Holdco and the majority of its subsidiaries are generally limited liability companies that are not subject to income tax. However, certain of these limited liability companies are subject to state income tax. In addition, the indirect subsidiaries that are corporations are subject to federal and state income tax. All of the remaining taxable income, gains, losses, deductions and credits of Charter Holdco are passed through to Charter.
In connection with the Plan, Charter, CII, Mr. Allen and Charter Holdco entered into an exchange agreement (the “Exchange Agreement”), pursuant to which CII had the right to require Charter to (i) exchange all or a portion of CII’s membership interest in Charter Holdco or 100% of CII for $1,000 in cash and shares of Charter’s Class A common stock in a taxable transaction, or (ii) merge CII with and into Charter, or a wholly-owned subsidiary of Charter, in a tax-free transaction (or undertake a tax-free transaction similar to the taxable transaction in subclause (i)), subject to CII meeting certain conditions. In addition, Charter had the right, under certain circumstances involving a change of control of Charter to require CII to effect an exchange transaction of the type elected by CII from subclauses (i) or (ii) above, which election is subject to certain limitations.
On December 28, 2009, CII exercised its right, under the Exchange Agreement with Charter, to exchange 81% of its common membership interest in Charter Holdco for $1,000 in cash and 907,698 shares of Charter’s Class A common stock in a fully taxable transaction. As a result of this transaction, Charter’s deferred tax liability increased by $100 million. Charter also received a step-up in tax basis in Charter Holdco’s assets, under section 743 of the Code, relative to the interest in Charter Holdco it acquired from CII. Based upon the taxable exchange which occurred on December 28, 2009, CII fulfilled the conditions necessary to allow it to elect a tax-free transaction at any time during the remaining term of the Exchange Agreement.
On February 8, 2010, the remaining CII interest in Charter Holdco was exchanged for 212,923 shares of Charter’s Class A common stock in a non-taxable transaction after which Charter Holdco became 100% owned by Charter. As a result of this transaction, Charter recorded the tax attributes previously attributed to the CII noncontrolling interest which increased net deferred tax liabilities by approximately $99 million. The $99 million is the result of an overall increase in the gross deferred tax liability of $221 million and a corresponding reduction of valuation allowance of $122 million. The combined net effects of this transaction were recorded in the financial statements as a $168 million reduction of additional paid-in capital and a $69 million reduction of income tax expense for the year ended December 31, 2010 (Successor).
F-33
CHARTER COMMUNICATIONS, INC. AND SUBSIDIARIES
NOTES TO CONSOLIDATED FINANCIAL STATEMENTS
DECEMBER 31, 2010, 2009 AND 2008
(dollars in millions, except share or per share data or where indicated)
For the year ended December 2010 (Successor), one month ended December 31, 2009 (Successor), eleven months ended November 30, 2009 (Predecessor) and year ended December 31, 2008 (Predecessor), the Company recorded deferred income tax expense and benefits as shown below. The income tax expense is recognized primarily through increases in deferred tax liabilities related to our investment in Charter Holdco, as well as through current federal and state income tax expense and increases in the deferred tax liabilities of certain of our indirect corporate subsidiaries. The income tax benefits were realized through reductions in the deferred tax liabilities related to Charter’s investment in Charter Holdco, as well as the deferred tax liabilities of certain of Charter’s indirect corporate subsidiaries. The tax provision in future periods will vary based on current and future temporary differences, as well as future operating results.
Current and deferred income tax benefit (expense) is as follows:
|
Successor
|
Predecessor
|
|||||||||||||||
|
Year Ended
|
One Month
Ended
|
Eleven Months Ended
|
Year Ended
|
|||||||||||||
|
December 31,
2010
|
December 31,
2009
|
November 30,
2009
|
December 31,
2008
|
|||||||||||||
|
Current expense:
|
||||||||||||||||
|
Federal income taxes
|
$ | -- | $ | -- | $ | (1 | ) | $ | (2 | ) | ||||||
|
State income taxes
|
(8 | ) | (1 | ) | (6 | ) | (2 | ) | ||||||||
|
Current income tax expense
|
(8 | ) | (1 | ) | (7 | ) | (4 | ) | ||||||||
|
Deferred benefit (expense):
|
||||||||||||||||
|
Federal income taxes
|
(263 | ) | (6 | ) | 343 | 95 | ||||||||||
|
State income taxes
|
(24 | ) | (1 | ) | 15 | 12 | ||||||||||
|
Deferred income tax benefit (expense)
|
(287 | ) | (7 | ) | 358 | 107 | ||||||||||
|
Total income benefit (expense)
|
$ | (295 | ) | $ | (8 | ) | $ | 351 | $ | 103 | ||||||
Income tax benefit for the eleven months ended November 30, 2009 (Predecessor) and year ended December 31, 2008 (Predecessor) included $480 million and $325 million, respectively, of deferred tax benefit related to the impairment of franchises.
F-34
CHARTER COMMUNICATIONS, INC. AND SUBSIDIARIES
NOTES TO CONSOLIDATED FINANCIAL STATEMENTS
DECEMBER 31, 2010, 2009 AND 2008
(dollars in millions, except share or per share data or where indicated)
The Company’s effective tax rate differs from that derived by applying the applicable federal income tax rate of 35% for the year ended December 31, 2010, one month ended December 31, 2009, eleven months ended November 30, 2009 and year ended December 31, 2008, respectively, as follows:
|
Successor
|
Predecessor
|
|||||||||||
|
Year Ended
December 31,
|
One Month
Ended
December 31,
|
Eleven Months
Ended
November 30,
|
Year Ended
December 31,
|
|||||||||
|
2010
|
2009
|
2009
|
2008
|
|||||||||
|
Statutory federal income taxes
|
$
|
(20)
|
$
|
(4)
|
$
|
(3,412)
|
$
|
894
|
||||
|
Statutory state income taxes, net
|
(8)
|
(1)
|
(298)
|
151
|
||||||||
|
Nondeductible expenses
|
(4)
|
--
|
--
|
--
|
||||||||
|
Non-includable reorganization income
|
--
|
--
|
420
|
--
|
||||||||
|
Franchises
|
--
|
--
|
--
|
107
|
||||||||
|
Change in valuation allowance
|
(248)
|
(3)
|
3,826
|
(1,049)
|
||||||||
|
Changes in provision estimates
|
(23)
|
--
|
--
|
--
|
||||||||
|
Other
|
8
|
--
|
(185)
|
--
|
||||||||
|
Income tax benefit (expense)
|
$
|
(295)
|
$
|
(8)
|
$
|
351
|
$
|
103
|
||||
The tax effects of these temporary differences that give rise to significant portions of the deferred tax assets and deferred tax liabilities at December 31, 2010 and 2009 which are included in other long-term liabilities accompanying consolidated balance sheets are presented below.
|
Successor
|
||||||||
|
December 31,
|
December 31,
|
|||||||
|
2010
|
2009
|
|||||||
|
Deferred tax assets:
|
||||||||
|
Goodwill
|
$ | 192 | $ | 194 | ||||
|
Deferred financing
|
31 | 214 | ||||||
|
Investment in partnership
|
450 | 400 | ||||||
|
Loss carryforwards
|
2,643 | 2,428 | ||||||
|
Accrued and other
|
148 | 131 | ||||||
|
Total gross deferred tax assets
|
3,464 | 3,367 | ||||||
|
Less: valuation allowance
|
(2,275 | ) | (1,955 | ) | ||||
|
Deferred tax assets
|
$ | 1,189 | $ | 1,412 | ||||
|
Deferred tax liabilities:
|
||||||||
|
Indefinite life intangibles
|
$ | (575 | ) | $ | (123 | ) | ||
|
Other intangibles
|
(489 | ) | (705 | ) | ||||
|
Property, plant and equipment
|
(626 | ) | (642 | ) | ||||
|
Other
|
(1 | ) | -- | |||||
|
Indirect corporate subsidiaries:
|
||||||||
|
Indefinite life intangibles
|
(117 | ) | (114 | ) | ||||
|
Other
|
(143 | ) | (134 | ) | ||||
|
Deferred tax liabilities
|
(1,951 | ) | (1,718 | ) | ||||
|
Net deferred tax liabilities
|
$ | (762 | ) | $ | (306 | ) | ||
F-35
CHARTER COMMUNICATIONS, INC. AND SUBSIDIARIES
NOTES TO CONSOLIDATED FINANCIAL STATEMENTS
DECEMBER 31, 2010, 2009 AND 2008
(dollars in millions, except share or per share data or where indicated)
In assessing the realizability of deferred tax assets, management considers whether it is more likely than not that some portion or all of the deferred tax assets will be realized. Due to the Company’s history of losses and the limitations imposed under Section 382 of the Code, discussed below, on Charter’s ability to use existing loss carryforwards in the future, valuation allowances have been established except for future taxable income that will result from the reversal of existing temporary differences for which deferred tax liabilities are recognized. The 2010 increase in valuation allowance includes an increase of $50 million related to Charter’s investment in partnership interest and an increase of $22 million related to adjustments to cash flow hedges included in other comprehensive income.
As of December 31, 2010, Charter and its indirect corporate subsidiaries had approximately $6.9 billion of federal tax net operating and capital loss carryforwards, resulting in a gross deferred tax asset of approximately $2.4 billion, expiring in the years 2014 through 2030. These losses resulted from the operations of Charter Holdco and its subsidiaries. In addition, as of December 31, 2010, Charter and its indirect corporate subsidiaries had state tax net operating losses, resulting in a gross deferred tax asset (net of federal tax benefit) of approximately $228 million, generally expiring in years 2011 through 2030.
Upon emergence from bankruptcy, Charter experienced an “ownership change” as defined in Section 382 of the Code. Therefore, the use of Charter’s tax loss carryforwards is subject to certain limitations under Section 382. As of December 31, 2010, $1.3 billion of federal tax loss carryforwards are unrestricted and available for Charter’s immediate use, while approximately $5.6 billion of federal tax loss carryforwards are still subject to Section 382 restrictions. Pursuant to these restrictions, an aggregate of $2.1 billion, in varying amounts from 2011 to 2014, and an additional $176 million annually over each of the next 18 years of federal tax loss carryforwards, should become unrestricted and available for Charter’s use. Those limitation amounts accumulate for future use to the extent they are not utilized in a given year. Charter’s state loss carryforwards are also subject to similar, but varying, restrictions on their future use. Charter’s indirect corporate subsidiaries are also subject to separate Section 382 limitations on the utilization of their net operating loss carryforwards. If the Company was to experience another “ownership change” in the future, its ability to use its loss carryforwards could be subject to further limitations.
In determining the Company’s tax provision for financial reporting purposes, the Company establishes a reserve for uncertain tax positions unless such positions are determined to be “more likely than not” of being sustained upon examination, based on their technical merits. There is considerable judgment involved in determining whether positions taken on the tax return are “more likely than not” of being sustained. The Company did not have any unrecognized tax benefits for the year ended December 31, 2008. A reconciliation of the beginning and ending amount of unrecognized tax benefits included in other long-term liabilities in the accompanying consolidated balance sheets of the Company is as follows.
|
Balance at January 1, 2009 (Predecessor)
|
$ | -- | ||
|
Additions based on tax positions related to current period
|
20 | |||
|
Balance at November 30, 2009 (Predecessor)
|
20 | |||
|
Additions based on tax positions related to current period
|
3 | |||
|
Balance at December 31, 2009 (Successor)
|
23 | |||
|
Additions based on tax positions related to prior year
|
228 | |||
|
Reductions due to tax positions related to prior year
|
(27 | ) | ||
|
Balance at December 31, 2010 (Successor)
|
$ | 224 |
Included in the balance at December 31, 2010, are additions to the uncertain tax position of $228 million related to a 2009 tax position for which the ultimate deductibility is highly certain, but for which there is uncertainty about the character of the deductibility. Included in the balance at December 31, 2009, are $23 million of uncertain tax positions for which the ultimate deductibility is highly certain, but for which there is uncertainty about the character of the deductibility. The change in character of the deduction would not impact the annual effective tax rate after consideration of the valuation allowance.
F-36
CHARTER COMMUNICATIONS, INC. AND SUBSIDIARIES
NOTES TO CONSOLIDATED FINANCIAL STATEMENTS
DECEMBER 31, 2010, 2009 AND 2008
(dollars in millions, except share or per share data or where indicated)
The Company does not currently anticipate that its existing reserves related to uncertain income tax positions as of December 31, 2010 will significantly increase or decrease during the twelve-month period ending December 31, 2011; however, various events could cause the Company’s current expectations to change in the future. These uncertain tax positions, if ever recognized in the financial statements, would be recorded in the consolidated statement of operations as part of the income tax provision.
No tax years for Charter, Charter Holdco, or its indirect subsidiaries are currently under examination by the Internal Revenue Service. Tax years ending 2007 through 2010 remain subject to examination and assessment. Years prior to 2007 remain open solely for purposes of examination of Charter’s loss and credit carryforwards.
19. Earnings (Loss) Per Share
Basic earnings (loss) per share is based on the average number of shares of common stock outstanding during the period. Diluted earnings per share is based on the average number of shares used for the basic earnings per share calculation, adjusted for the dilutive effect of stock options, restricted stock, performance shares and units, convertible debt, convertible redeemable preferred stock and exchangeable membership units. Basic loss per share equaled diluted loss per share for the years ended December 31, 2010 and 2008.
|
Successor
|
||||||||||||
|
One Month Ended December 31, 2009
|
||||||||||||
|
Earnings
|
Shares
|
Earnings Per Share
|
||||||||||
|
Basic earnings per share
|
$ | 2 | 112,078,089 | $ | 0.02 | |||||||
|
Effect of Class B common stock
|
-- | 212,923 | -- | |||||||||
|
CII warrants
|
-- | 2,055,849 | -- | |||||||||
|
Diluted earnings per share
|
$ | 2 | 114,346,861 | $ | 0.02 | |||||||
The shares of Class B common stock held by Mr. Allen had a 35% voting interest in Charter, on a fully diluted basis, and were exchangeable at any time on a one-for-one basis for shares of Charter Class A common stock. The CII warrants represent shares resulting from the exercise of warrants held by CII. See Note 23.
The 1.3 million Charter Holdings warrants and 6.4 million CIH warrants were not included in the computation of diluted earnings per share because their exercise prices were greater than the average market price of the common shares. Restricted stock was also not included in the computation of diluted earnings per share because the effect would have been antidilutive.
F-37
CHARTER COMMUNICATIONS, INC. AND SUBSIDIARIES
NOTES TO CONSOLIDATED FINANCIAL STATEMENTS
DECEMBER 31, 2010, 2009 AND 2008
(dollars in millions, except share or per share data or where indicated)
|
Predecessor
|
||||||||||||
|
Eleven Months Ended November 30, 2009
|
||||||||||||
|
Earnings
|
Shares
|
Earnings Per Share
|
||||||||||
|
Basic earnings per share
|
$ | 11,364 | 378,784,231 | $ | 30.00 | |||||||
|
Effect of CII Class B Charter Holdco units
|
-- | 222,818,858 | (11.11 | ) | ||||||||
|
Effect of Vulcan Class B Charter Holdco units
|
-- | 116,313,173 | (3.06 | ) | ||||||||
|
Effect of 5.875% convertible senior notes due 2009
|
-- | 1,287,190 | (0.03 | ) | ||||||||
|
Effect of CCHC note
|
1 | 42,282,098 | (0.87 | ) | ||||||||
|
Effect of 6.50% convertible senior notes due 2027
|
8 | 140,581,566 | (2.32 | ) | ||||||||
|
Diluted earnings per share
|
$ | 11,373 | 902,067,116 | $ | 12.61 | |||||||
Prior to the Effective Date, CII Class B Charter Holdco units and Vulcan Class B Charter Holdco units represented membership units in Charter Holdco, held by entities controlled by Mr. Allen, that were exchangeable at any time on a one-for-one basis for shares of Charter Class B common stock, which were in turn convertible on a one-for-one basis into shares of Charter Class A common stock. The 5.875% convertible senior notes due 2009 and 6.50% convertible senior notes due 2027 represent the shares resulting from the assumed conversion of the notes into shares of Charter’s Class A common stock. The CCHC note represented the shares resulting from the assumed conversion of the note into Charter Holdco units that were exchangeable on a one-for-one basis for shares of Charter Class B common stock, which were in turn convertible on a one-for-one basis into shares of Charter Class A common stock.
All options to purchase common stock, which were outstanding during the eleven months ended November 30, 2009, were not included in the computation of diluted earnings per share because the options’ exercise price was greater than the average market price of the common shares. All restricted stock and performance units were also not included in the computation of diluted earnings per share because the effect would have been antidilutive.
Shares issued pursuant to the share lending agreement were required to be returned, in accordance with the contractual arrangement, and were treated in basic and diluted earnings per share as if they were already returned and retired. Consequently, there was no impact of the shares of common stock lent under the share lending agreement in the earnings per share calculation.
20. Related Party Transactions
The following sets forth certain transactions in which the Company and the directors, executive officers, and affiliates of the Company are involved.
Charter is a holding company and its principal assets are its equity interest in Charter Holdco and prior to the Effective Date, certain mirror notes payable by Charter Holdco to Charter and mirror preferred units held by Charter, which had the same principal amount and terms as those of Charter’s convertible senior notes and Charter’s outstanding preferred stock. During the year ended December 31, 2008 (Predecessor), Charter Holdco paid to Charter $32 million related to interest on the mirror notes. No amounts were paid for 2009 and 2010.
Charter is a party to management arrangements with Charter Holdco and certain of its subsidiaries. Under these agreements, Charter and Charter Holdco provide management services for the cable systems owned or operated by their subsidiaries. The management services include such services as centralized customer billing services, data processing and related support, benefits administration and coordination of insurance coverage and self-insurance programs for medical, dental and workers’ compensation claims. Costs associated with providing these services are charged directly to the Company’s operating subsidiaries and are included within operating costs in the accompanying consolidated statements of operations. Such costs totaled $246 million, $21 million, $217 million and $213 million for the year ended December 31, 2010 (Successor), one month ended December 31, 2009
F-38
CHARTER COMMUNICATIONS, INC. AND SUBSIDIARIES
NOTES TO CONSOLIDATED FINANCIAL STATEMENTS
DECEMBER 31, 2010, 2009 AND 2008
(dollars in millions, except share or per share data or where indicated)
(Successor), eleven months ended November 30, 2009 (Predecessor) and year ended December 31, 2008 (Predecessor), respectively. All other costs incurred on behalf of Charter’s operating subsidiaries are considered a part of the management fee and are recorded as a component of selling, general and administrative expense, in the accompanying consolidated financial statements. The management fee charged to the Company’s operating subsidiaries approximated the expenses incurred by Charter Holdco and Charter on behalf of the Company’s operating subsidiaries in 2010, 2009 and 2008.
CC VIII, LLC Interest
For the year ended December 31, 2009, pursuant to indemnification provisions in the October 2005 settlement with Mr. Allen regarding the CC VIII, LLC (“CC VIII”) interest, the Company reimbursed Vulcan Inc. approximately $3 million in legal expenses.
Allen Agreement
In connection with the Plan, Charter, Mr. Allen and CII entered into a separate restructuring agreement (as amended, the “Allen Agreement”), in settlement and compromise of their legal, contractual and equitable rights, claims and remedies against Charter and its subsidiaries. In addition to any amounts received by virtue of CII’s holding other claims against Charter and its subsidiaries, on the Effective Date, CII was issued 2.2 million shares of the new Charter Class B common stock equal to 2% of the equity value of Charter, after giving effect to the equity rights offering, but prior to issuance of warrants and equity-based awards provided for by the Plan and 35% (determined on a fully diluted basis) of the total voting power of all new capital stock of Charter. Each share of new Charter Class B common stock is convertible, at the option of the holder or the Disinterested Members of the Board of Directors of Charter, into one share of new Charter Class A common stock, and is subject to significant restrictions on transfer and conversion. Certain holders of new Charter Class A common stock (and securities convertible into or exercisable or exchangeable therefore) and new Charter Class B common stock received certain customary registration rights with respect to their shares. On the Effective Date, CII received: (i) 4.7 million warrants to purchase shares of new Charter Class A common stock, (ii) $85 million principal amount of new CCH II notes (transferred from CCH I, LLC (“CCH I”) noteholders), (iii) $25 million in cash for amounts previously owed to CII under a management agreement, (iv) $20 million in cash for reimbursement of fees and expenses in connection with the Plan, and (v) an additional $150 million in cash. The warrants described above have an exercise price of $19.80 per share and expire seven years after the date of issuance. In addition, on the Effective Date, CII retained a minority equity interest in reorganized Charter Holdco of 1% and a right to exchange such interest into new Charter Class A common stock. On December 28, 2009, CII exchanged 81% of its interest in Charter Holdco, and on February 8, 2010 the remaining interest was exchanged after which Charter Holdco became 100% owned by Charter. Further, Mr. Allen transferred his preferred equity interest in CC VIII to Charter. As of December 31, 2010, Mr. Allen held all 2,241,299 shares of Class B common stock of Charter. Pursuant to the terms of the Certificate of Incorporation of Charter, on January 18, 2011, the Disinterested Members of the Board of Directors of Charter caused a conversion of the shares of Class B common stock into shares of Class A common stock on a one-for-one basis.
As a result of such conversion, Mr. Allen no longer has the right to appoint four directors and the Class B directors became Class A directors. On January 18, 2011, directors William L. McGrath and Christopher M. Temple, both former Class B directors, resigned from Charter’s board of directors. Edgar Lee and Stan Parker were appointed to fill the vacant positions.
F-39
CHARTER COMMUNICATIONS, INC. AND SUBSIDIARIES
NOTES TO CONSOLIDATED FINANCIAL STATEMENTS
DECEMBER 31, 2010, 2009 AND 2008
(dollars in millions, except share or per share data or where indicated)
21. Commitments and Contingencies
Commitments
The following table summarizes the Company’s payment obligations as of December 31, 2010 for its contractual obligations.
|
Total
|
2011
|
2012
|
2013
|
2014
|
2015
|
Thereafter
|
||||||||||||||||||||||
|
Contractual Obligations
|
||||||||||||||||||||||||||||
|
Capital and Operating Lease Obligations (1)
|
$ | 89 | $ | 23 | $ | 20 | $ | 16 | $ | 13 | $ | 7 | $ | 10 | ||||||||||||||
|
Programming Minimum Commitments(2)
|
267 | 103 | 108 | 56 | -- | -- | -- | |||||||||||||||||||||
|
Other (3)
|
290 | 235 | 7 | 3 | 1 | 44 | -- | |||||||||||||||||||||
|
Total
|
$ | 646 | $ | 361 | $ | 135 | $ | 75 | $ | 14 | $ | 51 | $ | 10 | ||||||||||||||
|
|
(1) The Company leases certain facilities and equipment under noncancelable operating leases. Leases and rental costs charged to expense for the year ended December 31, 2010 (Successor), one month ended December 31, 2009 (Successor), eleven months ended November 30, 2009 (Predecessor) and year ended December 31, 2008 (Predecessor), were $24 million, $2 million, $23 million and $24 million, respectively.
|
|
|
(2) The Company pays programming fees under multi-year contracts ranging from three to ten years, typically based on a flat fee per customer, which may be fixed for the term, or may in some cases escalate over the term. Programming costs included in the accompanying statement of operations were $1.8 billion, $146 million, $1.6 billion and $1.6 billion, for the year ended December 31, 2010 (Successor), one month ended December 31, 2009 (Successor), eleven months ended November 30, 2009 (Predecessor) and year ended December 31, 2008 (Predecessor), respectively. Certain of the Company’s programming agreements are based on a flat fee per month or have guaranteed minimum payments. The table sets forth the aggregate guaranteed minimum commitments under the Company’s programming contracts.
|
|
|
(3) “Other” represents other guaranteed minimum commitments, which consist primarily of commitments to the Company’s billing services vendors.
|
The following items are not included in the contractual obligation table due to various factors discussed below. However, the Company incurs these costs as part of its operations:
|
|
·
|
The Company rents utility poles used in its operations. Generally, pole rentals are cancelable on short notice, but the Company anticipates that such rentals will recur. Rent expense incurred for pole rental attachments for the year ended December 31, 2010 (Successor), one month ended December 31, 2009 (Successor), eleven months ended November 30, 2009 (Predecessor) and year ended December 31, 2008 (Predecessor), was $50 million, $4 million, $43 million and $47 million, respectively.
|
|
|
·
|
The Company pays franchise fees under multi-year franchise agreements based on a percentage of revenues generated from video service per year. The Company also pays other franchise related costs, such as public education grants, under multi-year agreements. Franchise fees and other franchise-related costs included in the accompanying statement of operations were $178 million, $15 million, $161 million and $179 million for the year ended December 31, 2010 (Successor), one month ended December 31, 2009 (Successor), eleven months ended November 30, 2009 (Predecessor) and year ended December 31, 2008 (Predecessor), respectively.
|
|
|
·
|
The Company also has $73 million in letters of credit, primarily to its various worker’s compensation, property and casualty, and general liability carriers, as collateral for reimbursement of claims.
|
F-40
CHARTER COMMUNICATIONS, INC. AND SUBSIDIARIES
NOTES TO CONSOLIDATED FINANCIAL STATEMENTS
DECEMBER 31, 2010, 2009 AND 2008
(dollars in millions, except share or per share data or where indicated)
Litigation
On August 28, 2008, a lawsuit was filed against Charter and Charter Communications, LLC (“Charter LLC”) in the United States District Court for the Western District of Wisconsin (now entitled,
Marc Goodell et al. v. Charter Communications, LLC and Charter Communications, Inc.
). The plaintiffs sought to represent a class of current and former broadband, system and other types of technicians who are or were employed by Charter or Charter LLC in the states of Michigan, Minnesota, Missouri or California. Plaintiffs alleged that Charter and Charter LLC violated certain wage and hour statutes of those four states by failing to pay technicians for all hours worked. In May 2010, the parties entered into a settlement agreement disposing of all claims, including those potential wage and hour claims for potential class members in additional states beyond the four identified above. On September 24, 2010, the court granted final approval of the settlement. The Company accrued and paid expected settlement costs associated with this case. The Company has been subjected, in the normal course of business, to the assertion of other wage and hour claims and could be subjected to additional such claims in the future. The Company cannot predict the outcome of any such claims.
On March 27, 2009, Charter filed its chapter 11 petition in the United States Bankruptcy Court for the Southern District of New York. On the same day, JPMorgan Chase Bank, N.A., (“JPMorgan”), for itself and as Administrative Agent under the Charter Operating Credit Agreement, filed an adversary proceeding (the “JPMorgan Adversary Proceeding”) in Bankruptcy Court against Charter Operating and CCO Holdings seeking a declaration that there were events of default under the Charter Operating Credit Agreement. JPMorgan, as well as other parties, objected to the Plan. The Bankruptcy Court jointly held 19 days of trial in the JPMorgan Adversary Proceeding and on the objections to the Plan.
On November 17, 2009, the Bankruptcy Court issued its Order and Opinion confirming the Plan over the objections of JPMorgan and various other objectors. The Court also entered an order ruling in favor of Charter in the JPMorgan Adversary Proceeding. Several objectors attempted to stay the consummation of the Plan, but those motions were denied by the Bankruptcy Court and the U.S. District Court for the Southern District of New York. Charter consummated the Plan on November 30, 2009 and reinstated the Charter Operating Credit Agreement and certain other debt of its subsidiaries.
Six appeals were filed relating to confirmation of the Plan. The parties initially pursing appeals were: (i) JPMorgan; (ii) Wilmington Trust Company (“Wilmington Trust”) (as indenture trustee for the holders of the 8% senior second lien notes due 2012 and 8.375% senior second lien notes due 2014 issued by and among Charter Operating and Charter Communications Operating Capital Corp. and the 10.875% senior second lien notes due 2014 issued by and among Charter Operating and Charter Communications Operating Capital Corp.); (iii) Wells Fargo Bank, N.A. (“Wells Fargo”) (in its capacities as successor Administrative Agent and successor Collateral Agent for the third lien prepetition secured lenders to CCO Holdings under the CCO Holdings credit facility); (iv) Law Debenture Trust Company of New York (“Law Debenture Trust”) (as the Trustee with respect to the $479 million in aggregate principal amount of 6.50% convertible senior notes due 2027 issued by Charter which are no longer outstanding following consummation of the Plan); (v) R2 Investments, LDC (“R2 Investments”) (an equity interest holder in Charter); and (vi) certain plaintiffs representing a putative class in a securities action against three former Charter officers or directors filed in the United States District Court for the Eastern District of Arkansas (Iron Workers Local No. 25 Pension Fund, Indiana Laborers Pension Fund, and Iron Workers District Council of Western New York and Vicinity Pension Fund, in the action styled
Iron Workers Local No. 25 Pension Fund v. Allen, et al.
, Case No. 4:09-cv-00405-JLH (E.D. Ark.).
Charter Operating amended its senior secured credit facilities effective March 31, 2010. In connection with the closing of these amendments, each of Bank of America, N.A. and JPMorgan, for itself and on behalf of the lenders under the Charter Operating senior secured credit facilities, agreed to dismiss the pending appeal of the Company’s Confirmation Order pending before the District Court for the Southern District of New York and to waive any objections to the Company’s Confirmation Order issued by the United States Bankruptcy Court for the Southern District of New York. The lenders filed their Stipulation of that dismissal and waiver of objections and it was signed by the judge on April 1, 2010 and the case dismissed. On December 3, 2009, Wilmington Trust withdrew its notice of appeal. On April 14, 2010, Wells Fargo filed their Stipulation of Dismissal of their appeal on behalf of the
F-41
CHARTER COMMUNICATIONS, INC. AND SUBSIDIARIES
NOTES TO CONSOLIDATED FINANCIAL STATEMENTS
DECEMBER 31, 2010, 2009 AND 2008
(dollars in millions, except share or per share data or where indicated)
lenders under the CCO Holdings credit facility. This Stipulation was signed by the judge on April 19, 2010 and the case dismissed. The remaining appeals by Law Debenture Trust, R2 Investments and the securities plaintiffs have been briefed but have not been argued to, or ruled upon by the District Court for the Southern District of New York.
The Company cannot predict the ultimate outcome
of the appeals.
The Company is party to lawsuits and claims that arise in the ordinary course of conducting its business. The ultimate outcome of these other legal matters pending against the Company cannot be predicted, and although such lawsuits and claims are not expected individually to have a material adverse effect on the Company’s consolidated financial condition, results of operations or liquidity, such lawsuits could have, in the aggregate, a material adverse effect on the Company’s consolidated financial condition, results of operations or liquidity.
Regulation in the Cable Industry
The operation of a cable system is extensively regulated by the Federal Communications Commission (“FCC”), some state governments and most local governments. The FCC has the authority to enforce its regulations through the imposition of substantial fines, the issuance of cease and desist orders and/or the imposition of other administrative sanctions, such as the revocation of FCC licenses needed to operate certain transmission facilities used in connection with cable operations. The Telecommunications Act of 1996 altered the regulatory structure governing the nation’s communications providers. It removed barriers to competition in both the cable television market and the telephone market. Among other things, it reduced the scope of cable rate regulation and encouraged additional competition in the video programming industry by allowing telephone companies to provide video programming in their own telephone service areas.
Future legislative and regulatory changes could adversely affect the Company’s operations, including, without limitation, additional regulatory requirements the Company may be required to comply with as it offers services such as telephone.
22. Employee Benefit Plan
The Company’s employees may participate in the Charter Communications, Inc. 401(k) Plan. Employees that qualify for participation can contribute up to 50% of their salary, on a pre-tax basis, subject to a maximum contribution limit as determined by the Internal Revenue Service. For each payroll period, the Company contributed to the 401(k) Plan (a) the total amount of the salary reduction the employee elects to defer between 1% and 50% and (b) prior to January 1, 2010, a matching contribution equal to 50% of the amount of the salary reduction the participant elected to defer (up to 5% of the participant’s payroll compensation), excluding any catch-up contributions. The Company made contributions to the 401(k) plan totaling $1 million, $7 million and $8 million for the one month ended December 31, 2009 (Successor), eleven months ended November 30, 2009 (Predecessor) and year ended December 31, 2008 (Predecessor), respectively.
Effective January 1, 2010, the Company’s matching contribution is discretionary with the intent that any contribution be based on performance metrics used in its other bonus and incentive plans. The discretionary performance contribution is made on an annual basis (instead of on a per pay period basis). Each participant who makes before-tax contributions and is employed on the last day of the fiscal year received a portion of the discretionary performance contribution, if any, on a pro rata basis. The Company divided each participant’s before-tax contributions for the year (up to 5% of eligible earnings, excluding catch-up contributions) by the total employee contributions (up to 5% of eligible earnings, excluding catch-up contributions) for the year to determine each participant’s share of any discretionary performance contribution. The Company intends to make contributions to the 401(k) plan totaling $6 million for the year ended December 31, 2010 (Successor).
23. Emergence from Reorganization Proceedings
On March 27, 2009, the Company and certain affiliates filed voluntary petitions in the Bankruptcy Court to reorganize under the Bankruptcy Code. The Chapter 11 cases were jointly administered under the caption In re Charter Communications, Inc., et al., Case No. 09-11435. On May 7, 2009, the Company filed the Plan and
F-42
CHARTER COMMUNICATIONS, INC. AND SUBSIDIARIES
NOTES TO CONSOLIDATED FINANCIAL STATEMENTS
DECEMBER 31, 2010, 2009 AND 2008
(dollars in millions, except share or per share data or where indicated)
Disclosure Statement with the Bankruptcy Court. The Plan was confirmed by order of the Bankruptcy Court on November 17, 2009, and became effective on the Effective Date, the date on which the Company emerged from protection under Chapter 11 of the Bankruptcy Code.
The Company selected December 1, 2009 for application of fresh start accounting. Accordingly, the results of operations of the Company for the eleven months ended November 30, 2009 include reorganization items of $644 million and a pre-emergence gain of $6.8 billion primarily resulting from the discharge of long-term debt under the Plan and the related accrued interest offset by the issuance of common stock, preferred stock, warrants and new notes to holders of such notes. The following notes were eliminated on the Effective Date:
Charter Convertible Notes.
On the Effective Date, $482 million of Charter convertible senior notes were cancelled and holders of the convertible senior notes received $25 million in cash and 5.5 million shares of preferred stock issued by Charter valued at $145 million as of the Effective Date.
Charter Holdings Notes.
On the Effective Date, $440 million of Charter Holdings senior and senior discount notes were cancelled. Holders of Charter Holdings notes received 1.3 million warrants to purchase shares of new Charter Class A common stock with an exercise price of $51.28 per share that expire five years after the date of issuance. The warrants were valued at $6 million as of the Effective Date.
CCH I Holdings, LLC Notes.
On the Effective Date, $2.5 billion of CCH I Holdings, LLC (“CIH”) senior and senior discount notes were cancelled. Holders of CIH notes received 6.4 million warrants to purchase shares of new Charter Class A common stock with an exercise price of $46.86 per share that expire five years after the date of issuance. The warrants were valued at $35 million as of the Effective Date.
CCH I, LLC Notes.
On the Effective Date, $4.0 billion of CCH I senior and senior discount notes were cancelled. Holders of CCH I notes received 21.1 million shares of new Charter Class A common stock. In addition, as part of the Plan, the holders of CCH I notes received and transferred to Mr. Allen $85 million principal amount of new CCH II notes valued at $101 million as of the Effective Date.
CCH II, LLC Notes.
On the Effective Date, $2.5 billion of CCH II senior notes were cancelled through an exchange with holders who received new 13.500% senior CCH II notes and cash paid for the remaining unexchanged amount.
Fresh start accounting provided, among other things, for a determination of the value assigned to the equity of the emerging company as of a date selected for financial reporting purposes. In the Disclosure Statement, the reorganization value of the Company was set forth as approximately $14.1 billion to $16.6 billion, with a midpoint estimate of $15.4 billion. Under fresh start accounting, this reorganization value was allocated to the Company’s assets based on their respective fair values. The fresh start adjustments to fair value resulted in an increase to the carrying value of property, plant and equipment of $2.0 billion, the establishment of customer relationships at a fair value of $2.4 billion, and the recording of goodwill of $951 million. The reduction in long-term debt was $502 million to reflect it at its fair value and the net increase to shareholder’s equity was $6.0 billion.
Reorganization value, along with other terms of the Plan, was determined after extensive arms-length negotiations with the Company’s creditors. The value was based upon expected future cash flows of the business after emergence from Chapter 11, discounted at rates reflecting perceived business and financial risks (the discounted cash flows). This valuation and a valuation using market value multiples for peer companies were blended to arrive at the reorganization value. Reorganization value is intended to approximate the amount a willing buyer would pay for the assets of the Company immediately after the reorganization.
Based on conditions in the cable industry and general economic conditions, the mid-point of the range of valuations was used to determine the reorganization value. Under fresh start accounting, this reorganization value was allocated to the Company’s assets based on their respective fair values. The reorganization value, after adjustments for working capital, is reduced by the fair value of debt and other noncurrent liabilities, and preferred stock with the remainder representing the value to common shareholders. The market capitalization of Charter’s common stock may differ materially from this value.
F-43
CHARTER COMMUNICATIONS, INC. AND SUBSIDIARIES
NOTES TO CONSOLIDATED FINANCIAL STATEMENTS
DECEMBER 31, 2010, 2009 AND 2008
(dollars in millions, except share or per share data or where indicated)
The significant assumptions related to the valuations of the Company's assets and liabilities in connection with fresh start accounting include the following:
Property, plant and equipment
— Property, plant and equipment was valued at fair value of $6.8 billion as of November 30, 2009. In establishing fair value for the vast majority of the Company’s property, plant and equipment, the cost approach was utilized. The cost approach considers the amount required to replace an asset by constructing or purchasing a new asset with similar utility, then adjusts the value in consideration of all forms of depreciation as of the appraisal date.
The cost approach relies on management’s assumptions regarding current material and labor costs required to rebuild and repurchase significant components of the Company's property, plant and equipment along with assumptions regarding the age and estimated useful lives of the Company's property, plant and equipment.
Intangible Assets
— The Company identified the following intangible assets to be valued: (i) franchise marketing rights, (ii) customer relationships, and (iii) trademarks.
Franchise marketing rights and customer relationships were valued using an income approach and were valued at $5.3 billion and $2.4 billion, respectively, as of November 30, 2009. See Note 5 to the consolidated financial statements for a description of the methods used to value intangible assets.
The relief from royalty method was used to value trademarks at $158 million as of November 30, 2009. See Note 5 to the consolidated financial statements for a description of the methods used to value intangible assets.
Long-Term Debt
– Long-term debt was valued at fair value using quoted market prices.
We recorded a pre-tax gain of $5.7 billion resulting from the aggregate changes to the net carrying value of our pre-emergence assets and liabilities to record their fair values under fresh start accounting. Income tax benefit for the eleven months ended November 30, 2009 (Predecessor) includes $92 million of benefit related to these adjustments and to gains due to Plan effects.
Reorganization items, net is presented separately in the condensed consolidated statements of operations and represents items of income, expense, gain or loss that are realized or incurred by the Company because it was in reorganization under Chapter 11 of the U.S. Bankruptcy Code.
Reorganization items, net consisted of the following items:
|
Successor
|
Predecessor
|
|||||||||||
|
Year Ended
December 31,
2010
|
One Month
Ended
December 31,
2009
|
Eleven Months
Ended
November 30,
2009
|
||||||||||
|
Penalty interest, net
|
$ | -- | $ | -- | $ | 351 | ||||||
|
Loss on debt at allowed claim amount
|
-- | -- | 97 | |||||||||
|
Professional fees
|
6 | 3 | 167 | |||||||||
|
Paul Allen management fee settlement – related party
|
-- | -- | 11 | |||||||||
|
Other
|
-- | -- | 18 | |||||||||
|
Total Reorganization Items, Net
|
$ | 6 | $ | 3 | $ | 644 | ||||||
Reorganization items, net consist of adjustments to record liabilities at the allowed claim amounts, including the write off of deferred financing fees, and other expenses directly related to the Company’s bankruptcy proceedings. Post-
F-44
CHARTER COMMUNICATIONS, INC. AND SUBSIDIARIES
NOTES TO CONSOLIDATED FINANCIAL STATEMENTS
DECEMBER 31, 2010, 2009 AND 2008
(dollars in millions, except share or per share data or where indicated)
emergence professional fees relate to claim settlements, plan implementation and other transition costs related to the Plan.
24. Recently Issued Accounting Standards
In October 2009, the FASB issued guidance included in ASU 2009-13,
Multiple-Deliverable Revenue Arrangements
(“ASU 2009-13”). ASU 2009-13 sets forth requirements that must be met for an entity to recognize revenue from the sale of a delivered item that is part of a multiple-element arrangement when other items have not yet been delivered. The Company adopted ASU 2009-13 on January 1, 2011. The adoption did not have a material impact to its consolidated financial statements.
In January 2010, the FASB issued guidance included in ASU 2010-06,
Fair Value Measurements and Disclosures – Improving Disclosures about Fair Value Measurements
(“ASU 2010-06”). ASU 2010-06 provides amendments to Topic 820 to provide more robust fair value disclosures. The disclosures about purchases, sales, issuances and settlements relating to Level 3 measurements is effective for fiscal years beginning after December 15, 2010 and all interim periods within. The Company adopted ASU 2010-06 on January 1, 2011. The adoption did not have a material impact on its consolidated financial statements.
25. Unaudited Quarterly Financial Data
The following table presents quarterly data for the periods presented on the consolidated statement of operations:
|
Year Ended December 31, 2010
|
||||||||||||||||
|
Successor
|
||||||||||||||||
|
First
|
Second
|
Third
|
Fourth
|
|||||||||||||
|
Quarter
|
Quarter
|
Quarter
|
Quarter
|
|||||||||||||
|
Revenues
|
$ | 1,735 | $ | 1,771 | $ | 1,769 | $ | 1,784 | ||||||||
|
Income from operations
|
$ | 251 | $ | 254 | $ | 240 | $ | 279 | ||||||||
|
Net income (loss) – Charter
shareholders
|
$ | 24 | $ | (81 | ) | $ | (95 | ) | $ | (85 | ) | |||||
|
Earnings (loss) per common share –
Charter shareholders:
|
||||||||||||||||
|
Basic
|
$ | 0.21 | $ | (0.72 | ) | $ | (0.84 | ) | $ | (0.75 | ) | |||||
|
Diluted
|
$ | 0.21 | $ | (0.72 | ) | $ | (0.84 | ) | $ | (0.75 | ) | |||||
|
Weighted average common shares
outstanding:
|
||||||||||||||||
|
Basic
|
113,020,967 | 113,110,882 | 113,110,889 | 113,308,253 | ||||||||||||
|
Diluted
|
114,883,134 | 113,110,882 | 113,110,889 | 113,308,253 | ||||||||||||
F-45
CHARTER COMMUNICATIONS, INC. AND SUBSIDIARIES
NOTES TO CONSOLIDATED FINANCIAL STATEMENTS
DECEMBER 31, 2010, 2009 AND 2008
(dollars in millions, except share or per share data or where indicated)
|
Year Ended December 31, 2009
|
||||||||||||||||||||
|
Predecessor
|
Successor
|
|||||||||||||||||||
|
First
|
Second
|
Third
|
Two Months
Ended
November 30,
|
One Month
Ended
December 31,
|
||||||||||||||||
|
Quarter
|
Quarter
|
Quarter
|
2009
|
2009
|
||||||||||||||||
|
Revenues
|
$ | 1,662 | $ | 1,690 | $ | 1,693 | $ | 1,138 | $ | 572 | ||||||||||
|
Income (loss) from operations
|
$ | 334 | $ | 301 | $ | (2,591 | ) | $ | 893 | $ | 84 | |||||||||
|
Net income (loss) – Charter
shareholders
|
$ | (205 | ) | $ | (112 | ) | $ | (1,035 | ) | $ | 12,716 | $ | 2 | |||||||
|
Earnings (loss) per common share –
Charter shareholders:
|
||||||||||||||||||||
|
Basic
|
$ | (0.54 | ) | $ | (0.30 | ) | $ | (2.73 | ) | $ | 33.55 | $ | 0.02 | |||||||
|
Diluted
|
$ | (0.54 | ) | $ | (0.30 | ) | $ | (2.73 | ) | $ | 14.09 | $ | 0.02 | |||||||
|
Weighted average common shares
outstanding:
|
||||||||||||||||||||
|
Basic
|
378,095,547 | 378,982,037 | 379,066,320 | 379,080,041 | 112,078,089 | |||||||||||||||
|
Diluted
|
378,095,547 | 378,982,037 | 379,066,320 | 902,362,926 | 114,346,861 | |||||||||||||||
26. Consolidating Schedules
The CCO Holdings notes and the CCO Holdings credit facility are obligations of CCO Holdings. The CCH II notes issued on the Effective Date are obligations of CCH II. However, these obligations are also jointly, severally, fully and unconditionally guaranteed on an unsecured senior basis by Charter.
The accompanying condensed consolidating financial information has been prepared and presented pursuant to SEC Regulation S-X Rule 3-10,
Financial Statements of Guarantors and Affiliates Whose Securities Collateralize an Issue Registered or Being Registered.
This information is not intended to present the financial position, results of operations and cash flows of the individual companies or groups of companies in accordance with generally accepted accounting principles.
Condensed consolidating financial statements as of December 31, 2010 and 2009 and for the year ended December 31, 2010, one month ended December 31, 2009, eleven months ended November 30, 2009 and year ended December 31, 2008 follow.
F-46
CHARTER COMMUNICATIONS, INC. AND SUBSIDIARIES
NOTES TO CONSOLIDATED FINANCIAL STATEMENTS
DECEMBER 31, 2010, 2009 AND 2008
(dollars in millions, except share or per share data or where indicated)
|
Charter Communications, Inc.
|
||||||||||||||||||||||||||||
|
Condensed Consolidating Balance Sheet
|
||||||||||||||||||||||||||||
|
Successor
|
||||||||||||||||||||||||||||
|
As of December 31, 2010
|
||||||||||||||||||||||||||||
|
Charter
|
Intermediate Holding Companies
|
CCH II
|
CCO Holdings
|
Charter Operating
and Subsidiaries
|
Eliminations
|
Charter Consolidated
|
||||||||||||||||||||||
|
ASSETS
|
||||||||||||||||||||||||||||
|
CURRENT ASSETS:
|
||||||||||||||||||||||||||||
|
Cash and cash equivalents
|
$ | -- | $ | -- | $ | 3 | $ | 1 | $ | -- | $ | -- | $ | 4 | ||||||||||||||
|
Restricted cash and cash equivalents
|
-- | -- | -- | -- | 28 | -- | 28 | |||||||||||||||||||||
|
Accounts receivable, net
|
-- | 1 | -- | -- | 246 | -- | 247 | |||||||||||||||||||||
|
Receivables from related party
|
57 | 182 | 8 | 8 | -- | (255 | ) | -- | ||||||||||||||||||||
|
Prepaid expenses and other current assets
|
2 | 20 | -- | -- | 25 | -- | 47 | |||||||||||||||||||||
|
Total current assets
|
59 | 203 | 11 | 9 | 299 | (255 | ) | 326 | ||||||||||||||||||||
|
INVESTMENT IN CABLE PROPERTIES:
|
||||||||||||||||||||||||||||
|
Property, plant and equipment, net
|
-- | 34 | -- | -- | 6,785 | -- | 6,819 | |||||||||||||||||||||
|
Franchises
|
-- | -- | -- | -- | 5,257 | -- | 5,257 | |||||||||||||||||||||
|
Customer relationships, net
|
-- | -- | -- | -- | 2,000 | -- | 2,000 | |||||||||||||||||||||
|
Goodwill
|
-- | -- | -- | -- | 951 | -- | 951 | |||||||||||||||||||||
|
Total investment in cable properties, net
|
-- | 34 | -- | -- | 14,993 | -- | 15,027 | |||||||||||||||||||||
|
CC VIII PREFERRED INTEREST
|
79 | 183 | -- | -- | -- | (262 | ) | -- | ||||||||||||||||||||
|
INVESTMENT IN SUBSIDIARIES
|
1,889 | 1,409 | 3,296 | 5,946 | -- | (12,540 | ) | -- | ||||||||||||||||||||
|
LOANS RECEIVABLE – RELATED PARTY
|
-- | 42 | 248 | 252 | -- | (542 | ) | -- | ||||||||||||||||||||
|
OTHER NONCURRENT ASSETS
|
-- | 160 | -- | 43 | 153 | (2 | ) | 354 | ||||||||||||||||||||
|
Total assets
|
$ | 2,027 | $ | 2,031 | $ | 3,555 | $ | 6,250 | $ | 15,445 | $ | (13,601 | ) | $ | 15,707 | |||||||||||||
|
LIABILITIES AND SHAREHOLDERS’/MEMBER’S EQUITY
|
||||||||||||||||||||||||||||
|
CURRENT LIABILITIES:
|
||||||||||||||||||||||||||||
|
Accounts payable and accrued expenses
|
$ | 11 | $ | 138 | $ | 89 | $ | 40 | $ | 771 | $ | -- | $ | 1,049 | ||||||||||||||
|
Payables to related party
|
-- | -- | -- | -- | 255 | (255 | ) | -- | ||||||||||||||||||||
|
Total current liabilities
|
11 | 138 | 89 | 40 | 1,026 | (255 | ) | 1,049 | ||||||||||||||||||||
|
LONG-TERM DEBT
|
-- | -- | 2,057 | 2,914 | 7,335 | -- | 12,306 | |||||||||||||||||||||
|
LOANS PAYABLE – RELATED PARTY
|
-- | -- | -- | -- | 542 | (542 | ) | -- | ||||||||||||||||||||
|
OTHER LONG-TERM LIABILITIES
|
536 | 4 | -- | -- | 334 | -- | 874 | |||||||||||||||||||||
|
Shareholders’/Member’s equity
|
1,480 | 1,889 | 1,409 | 3,296 | 5,946 | (12,542 | ) | 1,478 | ||||||||||||||||||||
|
Noncontrolling interest
|
-- | -- | -- | -- | 262 | (262 | ) | -- | ||||||||||||||||||||
|
Total shareholders’/member’s equity
|
1,480 | 1,889 | 1,409 | 3,296 | 6,208 | (12,804 | ) | 1,478 | ||||||||||||||||||||
|
Total liabilities and shareholders’/member’s equity
|
$ | 2,027 | $ | 2,031 | $ | 3,555 | $ | 6,250 | $ | 15,445 | $ | (13,601 | ) | $ | 15,707 | |||||||||||||
F-47
CHARTER COMMUNICATIONS, INC. AND SUBSIDIARIES
NOTES TO CONSOLIDATED FINANCIAL STATEMENTS
DECEMBER 31, 2010, 2009 AND 2008
(dollars in millions, except share or per share data or where indicated)
|
Charter Communications, Inc.
|
||||||||||||||||||||||||||||
|
Condensed Consolidating Balance Sheet
|
||||||||||||||||||||||||||||
|
Successor
|
||||||||||||||||||||||||||||
|
As of December 31, 2009
|
||||||||||||||||||||||||||||
|
Charter
|
Intermediate Holding Companies
|
CCH II
|
CCO Holdings
|
Charter Operating
and Subsidiaries
|
Eliminations
|
Charter Consolidated
|
||||||||||||||||||||||
|
ASSETS
|
||||||||||||||||||||||||||||
|
CURRENT ASSETS:
|
||||||||||||||||||||||||||||
|
Cash and cash equivalents
|
$ | 185 | $ | 12 | $ | 6 | $ | -- | $ | 506 | $ | -- | $ | 709 | ||||||||||||||
|
Restricted cash and cash equivalents
|
18 | -- | -- | -- | 27 | -- | 45 | |||||||||||||||||||||
|
Accounts receivable, net
|
-- | 1 | -- | -- | 247 | -- | 248 | |||||||||||||||||||||
|
Receivables from related party
|
41 | 178 | 1 | 5 | -- | (225 | ) | -- | ||||||||||||||||||||
|
Prepaid expenses and other current assets
|
-- | 24 | -- | -- | 45 | -- | 69 | |||||||||||||||||||||
|
Total current assets
|
244 | 215 | 7 | 5 | 825 | (225 | ) | 1,071 | ||||||||||||||||||||
|
INVESTMENT IN CABLE PROPERTIES:
|
||||||||||||||||||||||||||||
|
Property, plant and equipment, net
|
-- | 36 | -- | -- | 6,797 | -- | 6,833 | |||||||||||||||||||||
|
Franchises
|
-- | -- | -- | -- | 5,272 | -- | 5,272 | |||||||||||||||||||||
|
Customer relationships, net
|
-- | -- | -- | -- | 2,335 | -- | 2,335 | |||||||||||||||||||||
|
Goodwill
|
-- | -- | -- | -- | 951 | -- | 951 | |||||||||||||||||||||
|
Total investment in cable properties, net
|
-- | 36 | -- | -- | 15,355 | -- | 15,391 | |||||||||||||||||||||
|
CC VIII PREFERRED INTEREST
|
68 | 157 | -- | -- | -- | (225 | ) | -- | ||||||||||||||||||||
|
INVESTMENT IN SUBSIDIARIES
|
1,853 | 1,414 | 3,280 | 4,158 | -- | (10,705 | ) | -- | ||||||||||||||||||||
|
LOANS RECEIVABLE – RELATED PARTY
|
-- | 13 | 239 | 242 | -- | (494 | ) | -- | ||||||||||||||||||||
|
OTHER NONCURRENT ASSETS
|
-- | 160 | -- | -- | 38 | (2 | ) | 196 | ||||||||||||||||||||
|
Total assets
|
$ | 2,165 | $ | 1,995 | $ | 3,526 | $ | 4,405 | $ | 16,218 | $ | (11,651 | ) | $ | 16,658 | |||||||||||||
|
LIABILITIES AND SHAREHOLDERS’/MEMBER’S EQUITY
|
||||||||||||||||||||||||||||
|
CURRENT LIABILITIES:
|
||||||||||||||||||||||||||||
|
Accounts payable and accrued expenses
|
$ | 8 | $ | 134 | $ | 20 | $ | 9 | $ | 727 | $ | -- | $ | 898 | ||||||||||||||
|
Current portion of long-term debt
|
-- | -- | -- | -- | 70 | -- | 70 | |||||||||||||||||||||
|
Payables to related party
|
-- | -- | -- | -- | 225 | (225 | ) | -- | ||||||||||||||||||||
|
Total current liabilities
|
8 | 134 | 20 | 9 | 1,022 | (225 | ) | 968 | ||||||||||||||||||||
|
LONG-TERM DEBT
|
-- | -- | 2,092 | 1,116 | 10,044 | -- | 13,252 | |||||||||||||||||||||
|
LOANS PAYABLE – RELATED PARTY
|
-- | -- | -- | -- | 494 | (494 | ) | -- | ||||||||||||||||||||
|
OTHER LONG-TERM LIABILITIES
|
239 | 6 | -- | -- | 275 | -- | 520 | |||||||||||||||||||||
|
Shareholders’/Member’s equity
|
1,918 | 1,853 | 1,414 | 3,280 | 4,158 | (10,707 | ) | 1,916 | ||||||||||||||||||||
|
Noncontrolling interest
|
-- | 2 | -- | -- | 225 | (225 | ) | 2 | ||||||||||||||||||||
|
Total shareholders’/member’s equity
|
1,918 | 1,855 | 1,414 | 3,280 | 4,383 | (10,932 | ) | 1,918 | ||||||||||||||||||||
|
Total liabilities and shareholders’/member’s equity
|
$ | 2,165 | $ | 1,995 | $ | 3,526 | $ | 4,405 | $ | 16,218 | $ | (11,651 | ) | $ | 16,658 | |||||||||||||
F-48
CHARTER COMMUNICATIONS, INC. AND SUBSIDIARIES
NOTES TO CONSOLIDATED FINANCIAL STATEMENTS
DECEMBER 31, 2010, 2009 AND 2008
(dollars in millions, except share or per share data or where indicated)
|
Charter Communications, Inc.
|
||||||||||||||||||||||||||||
|
Condensed Consolidating Statement of Operations
|
||||||||||||||||||||||||||||
|
Successor
|
||||||||||||||||||||||||||||
|
For the year ended December 31, 2010
|
||||||||||||||||||||||||||||
|
Charter
|
Intermediate Holding Companies
|
CCH II
|
CCO
Holdings
|
Charter Operating
and Subsidiaries
|
Eliminations
|
Charter Consolidated
|
||||||||||||||||||||||
|
REVENUES
|
$ | 33 | $ | 118 | $ | -- | $ | -- | $ | 7,059 | $ | (151 | ) | $ | 7,059 | |||||||||||||
|
COSTS AND EXPENSES:
|
||||||||||||||||||||||||||||
|
Operating (excluding depreciation and amortization)
|
-- | -- | -- | -- | 3,064 | -- | 3,064 | |||||||||||||||||||||
|
Selling, general and administrative
|
33 | 118 | -- | -- | 1,422 | (151 | ) | 1,422 | ||||||||||||||||||||
|
Depreciation and amortization
|
-- | -- | -- | -- | 1,524 | -- | 1,524 | |||||||||||||||||||||
|
Other operating expenses, net
|
-- | -- | -- | -- | 25 | -- | 25 | |||||||||||||||||||||
| 33 | 118 | -- | -- | 6,035 | (151 | ) | 6,035 | |||||||||||||||||||||
|
Income from operations
|
-- | -- | -- | -- | 1,024 | -- | 1,024 | |||||||||||||||||||||
|
OTHER INCOME AND (EXPENSES):
|
||||||||||||||||||||||||||||
|
Interest expense, net
|
-- | 1 | (196 | ) | (142 | ) | (540 | ) | -- | (877 | ) | |||||||||||||||||
|
Reorganization items, net
|
-- | -- | -- | -- | (6 | ) | -- | (6 | ) | |||||||||||||||||||
|
Loss on extinguishment of debt
|
-- | -- | -- | (17 | ) | (68 | ) | -- | (85 | ) | ||||||||||||||||||
|
Other income, net
|
2 | -- | -- | -- | -- | -- | 2 | |||||||||||||||||||||
|
Equity in income of subsidiaries
|
25 | (2 | ) | 194 | 353 | -- | (570 | ) | -- | |||||||||||||||||||
| 27 | (1 | ) | (2 | ) | 194 | (614 | ) | (570 | ) | (966 | ) | |||||||||||||||||
|
Income (loss) before income taxes
|
27 | (1 | ) | (2 | ) | 194 | 410 | (570 | ) | 58 | ||||||||||||||||||
|
INCOME TAX EXPENSE
|
(275 | ) | -- | -- | -- | (20 | ) | -- | (295 | ) | ||||||||||||||||||
|
Consolidated net income (loss)
|
(248 | ) | (1 | ) | (2 | ) | 194 | 390 | (570 | ) | (237 | ) | ||||||||||||||||
|
Less: Net (income) loss – noncontrolling interest
|
11 | 26 | -- | -- | (37 | ) | -- | -- | ||||||||||||||||||||
|
Net income (loss)
|
$ | (237 | ) | $ | 25 | $ | (2 | ) | $ | 194 | $ | 353 | $ | (570 | ) | $ | (237 | ) | ||||||||||
F-49
CHARTER COMMUNICATIONS, INC. AND SUBSIDIARIES
NOTES TO CONSOLIDATED FINANCIAL STATEMENTS
DECEMBER 31, 2010, 2009 AND 2008
(dollars in millions, except share or per share data or where indicated)
|
Charter Communications, Inc.
|
||||||||||||||||||||||||||||
|
Condensed Consolidating Statement of Operations
|
||||||||||||||||||||||||||||
|
Successor
|
||||||||||||||||||||||||||||
|
For the one month ended December 31, 2009
|
||||||||||||||||||||||||||||
|
Charter
|
Intermediate Holding Companies
|
CCH II
|
CCO
Holdings
|
Charter Operating
and Subsidiaries
|
Eliminations
|
Charter Consolidated
|
||||||||||||||||||||||
|
REVENUES
|
$ | 7 | $ | 12 | $ | -- | $ | -- | $ | 572 | $ | (19 | ) | $ | 572 | |||||||||||||
|
COSTS AND EXPENSES:
|
||||||||||||||||||||||||||||
|
Operating (excluding depreciation and amortization)
|
-- | -- | -- | -- | 246 | -- | 246 | |||||||||||||||||||||
|
Selling, general and administrative
|
7 | 10 | -- | -- | 116 | (17 | ) | 116 | ||||||||||||||||||||
|
Depreciation and amortization
|
-- | -- | -- | -- | 122 | -- | 122 | |||||||||||||||||||||
|
Other operating expenses, net
|
-- | -- | -- | -- | 4 | -- | 4 | |||||||||||||||||||||
| 7 | 10 | -- | -- | 488 | (17 | ) | 488 | |||||||||||||||||||||
|
Income from operations
|
-- | 2 | -- | -- | 84 | (2 | ) | 84 | ||||||||||||||||||||
|
OTHER INCOME AND (EXPENSES):
|
||||||||||||||||||||||||||||
|
Interest expense, net
|
-- | -- | (16 | ) | (7 | ) | (45 | ) | -- | (68 | ) | |||||||||||||||||
|
Reorganization items, net
|
-- | (2 | ) | -- | -- | (3 | ) | 2 | (3 | ) | ||||||||||||||||||
|
Other expense, net
|
(3 | ) | -- | -- | -- | -- | -- | (3 | ) | |||||||||||||||||||
|
Equity in income of subsidiaries
|
9 | 6 | 22 | 29 | -- | (66 | ) | -- | ||||||||||||||||||||
| 6 | 4 | 6 | 22 | (48 | ) | (64 | ) | (74 | ) | |||||||||||||||||||
|
Income before income taxes
|
6 | 6 | 6 | 22 | 36 | (66 | ) | 10 | ||||||||||||||||||||
|
INCOME TAX EXPENSE
|
(4 | ) | -- | -- | -- | (4 | ) | -- | (8 | ) | ||||||||||||||||||
|
Consolidated net income
|
2 | 6 | 6 | 22 | 32 | (66 | ) | 2 | ||||||||||||||||||||
|
Less: Net (income) loss – noncontrolling interest
|
-- | 3 | -- | -- | (3 | ) | -- | -- | ||||||||||||||||||||
|
Net income
|
$ | 2 | $ | 9 | $ | 6 | $ | 22 | $ | 29 | $ | (66 | ) | $ | 2 | |||||||||||||
F-50
CHARTER COMMUNICATIONS, INC. AND SUBSIDIARIES
NOTES TO CONSOLIDATED FINANCIAL STATEMENTS
DECEMBER 31, 2010, 2009 AND 2008
(dollars in millions, except share or per share data or where indicated)
|
Charter Communications, Inc.
|
||||||||||||||||||||||||||||
|
Condensed Consolidating Statement of Operations
|
||||||||||||||||||||||||||||
|
Predecessor
|
||||||||||||||||||||||||||||
|
For the eleven months ended November 30, 2009
|
||||||||||||||||||||||||||||
|
Charter
|
Intermediate Holding Companies
|
CCH II
|
CCO
Holdings
|
Charter Operating
and Subsidiaries
|
Eliminations
|
Charter Consolidated
|
||||||||||||||||||||||
|
REVENUES
|
$ | 29 | $ | 306 | $ | -- | $ | -- | $ | 6,183 | $ | (335 | ) | $ | 6,183 | |||||||||||||
|
COSTS AND EXPENSES:
|
||||||||||||||||||||||||||||
|
Operating (excluding depreciation and amortization)
|
-- | -- | -- | -- | 2,663 | -- | 2,663 | |||||||||||||||||||||
|
Selling, general and administrative
|
17 | 133 | -- | -- | 1,264 | (150 | ) | 1,264 | ||||||||||||||||||||
|
Depreciation and amortization
|
-- | -- | -- | -- | 1,194 | -- | 1,194 | |||||||||||||||||||||
|
Impairment of franchises
|
-- | -- | -- | -- | 2,163 | -- | 2,163 | |||||||||||||||||||||
|
Other operating income, net
|
-- | -- | -- | -- | (38 | ) | -- | (38 | ) | |||||||||||||||||||
| 17 | 133 | -- | -- | 7,246 | (150 | ) | 7,246 | |||||||||||||||||||||
|
Income (loss) from operations
|
12 | 173 | -- | -- | (1,063 | ) | (185 | ) | (1,063 | ) | ||||||||||||||||||
|
OTHER INCOME AND (EXPENSES):
|
||||||||||||||||||||||||||||
|
Interest expense, net
|
-- | (204 | ) | (233 | ) | (68 | ) | (515 | ) | -- | (1,020 | ) | ||||||||||||||||
|
Gain (loss) due to Plan effects
|
(229 | ) | 7,400 | (351 | ) | -- | (2 | ) | -- | 6,818 | ||||||||||||||||||
|
Gain due to fresh start accounting adjustments
|
-- | 158 | -- | 25 | 5,476 | -- | 5,659 | |||||||||||||||||||||
|
Reorganization items, net
|
(12 | ) | (229 | ) | (38 | ) | (22 | ) | (528 | ) | 185 | (644 | ) | |||||||||||||||
|
Change in value of derivatives
|
-- | -- | -- | -- | (4 | ) | -- | (4 | ) | |||||||||||||||||||
|
Other income, net
|
-- | -- | -- | -- | 2 | -- | 2 | |||||||||||||||||||||
|
Equity in income of subsidiaries
|
11,203 | 2,666 | 3,288 | 3,353 | -- | (20,510 | ) | -- | ||||||||||||||||||||
| 10,962 | 9,791 | 2,666 | 3,288 | 4,429 | (20,325 | ) | 10,811 | |||||||||||||||||||||
|
Income before income taxes
|
10,974 | 9,964 | 2,666 | 3,288 | 3,366 | (20,510 | ) | 9,748 | ||||||||||||||||||||
|
INCOME TAX BENEFIT (EXPENSE)
|
390 | -- | -- | -- | (39 | ) | -- | 351 | ||||||||||||||||||||
|
Consolidated net income
|
11,364 | 9,964 | 2,666 | 3,288 | 3,327 | (20,510 | ) | 10,099 | ||||||||||||||||||||
|
Less: Net loss – noncontrolling interest
|
-- | 1,239 | -- | -- | 26 | -- | 1,265 | |||||||||||||||||||||
|
Net income
|
$ | 11,364 | $ | 11,203 | $ | 2,666 | $ | 3,288 | $ | 3,353 | $ | (20,510 | ) | $ | 11,364 | |||||||||||||
F-51
CHARTER COMMUNICATIONS, INC. AND SUBSIDIARIES
NOTES TO CONSOLIDATED FINANCIAL STATEMENTS
DECEMBER 31, 2010, 2009 AND 2008
(dollars in millions, except share or per share data or where indicated)
|
Charter Communications, Inc.
|
||||||||||||||||||||||||||||
|
Condensed Consolidating Statement of Operations
|
||||||||||||||||||||||||||||
|
Predecessor
|
||||||||||||||||||||||||||||
|
For the year ended December 31, 2008
|
||||||||||||||||||||||||||||
|
Charter
|
Intermediate Holding Companies
|
CCH II
|
CCO
Holdings
|
Charter Operating
and Subsidiaries
|
Eliminations
|
Charter Consolidated
|
||||||||||||||||||||||
|
REVENUES
|
$ | 21 | $ | 166 | $ | -- | $ | -- | $ | 6,479 | $ | (187 | ) | $ | 6,479 | |||||||||||||
|
COSTS AND EXPENSES:
|
||||||||||||||||||||||||||||
|
Operating (excluding depreciation and amortization)
|
-- | -- | -- | -- | 2,807 | -- | 2,807 | |||||||||||||||||||||
|
Selling, general and administrative
|
21 | 166 | -- | -- | 1,386 | (187 | ) | 1,386 | ||||||||||||||||||||
|
Depreciation and amortization
|
-- | -- | -- | -- | 1,310 | -- | 1,310 | |||||||||||||||||||||
|
Impairment of franchises
|
-- | -- | -- | -- | 1,521 | -- | 1,521 | |||||||||||||||||||||
|
Other operating expenses, net
|
-- | -- | -- | -- | 69 | -- | 69 | |||||||||||||||||||||
| 21 | 166 | -- | -- | 7,093 | (187 | ) | 7,093 | |||||||||||||||||||||
|
Operating loss
|
-- | -- | -- | -- | (614 | ) | -- | (614 | ) | |||||||||||||||||||
|
OTHER INCOME AND (EXPENSES):
|
||||||||||||||||||||||||||||
|
Interest expense, net
|
-- | (841 | ) | (246 | ) | (74 | ) | (744 | ) | -- | (1,905 | ) | ||||||||||||||||
|
Change in value of derivatives
|
-- | 33 | -- | -- | (62 | ) | -- | (29 | ) | |||||||||||||||||||
|
Gain (loss) on extinguishment of debt
|
-- | 8 | (4 | ) | -- | -- | -- | 4 | ||||||||||||||||||||
|
Other expense, net
|
-- | -- | -- | -- | (6 | ) | -- | (6 | ) | |||||||||||||||||||
|
Equity in losses of subsidiaries
|
(2,514 | ) | (1,723 | ) | (1,473 | ) | (1,399 | ) | -- | 7,109 | -- | |||||||||||||||||
| (2,514 | ) | (2,523 | ) | (1,723 | ) | (1,473 | ) | (812 | ) | 7,109 | (1,936 | ) | ||||||||||||||||
|
Loss before income taxes
|
(2,514 | ) | (2,523 | ) | (1,723 | ) | (1,473 | ) | (1,426 | ) | 7,109 | (2,550 | ) | |||||||||||||||
|
INCOME TAX BENEFIT
|
63 | -- | -- | -- | 40 | -- | 103 | |||||||||||||||||||||
|
Consolidated net loss
|
(2,451 | ) | (2,523 | ) | (1,723 | ) | (1,473 | ) | (1,386 | ) | 7,109 | (2,447 | ) | |||||||||||||||
|
Less: Net (income) loss – noncontrolling interest
|
-- | 9 | -- | -- | (13 | ) | -- | (4 | ) | |||||||||||||||||||
|
Net loss
|
$ | (2,451 | ) | $ | (2,514 | ) | $ | (1,723 | ) | $ | (1,473 | ) | $ | (1,399 | ) | $ | 7,109 | $ | (2,451 | ) | ||||||||
F-52
CHARTER COMMUNICATIONS, INC. AND SUBSIDIARIES
NOTES TO CONSOLIDATED FINANCIAL STATEMENTS
DECEMBER 31, 2010, 2009 AND 2008
(dollars in millions, except share or per share data or where indicated)
|
Charter Communications, Inc.
|
||||||||||||||||||||||||||||
|
Condensed Consolidating Statement of Cash Flows
|
||||||||||||||||||||||||||||
|
Successor
|
||||||||||||||||||||||||||||
|
For the year ended December 31, 2010
|
||||||||||||||||||||||||||||
|
Charter
|
Intermediate Holding Companies
|
CCH II
|
CCO
Holdings
|
Charter Operating
and Subsidiaries
|
Eliminations
|
Charter Consolidated
|
||||||||||||||||||||||
|
CASH FLOWS FROM OPERATING ACTIVITIES:
|
||||||||||||||||||||||||||||
|
Consolidated net income (loss)
|
$ | (248 | ) | $ | (1 | ) | $ | (2 | ) | $ | 194 | $ | 390 | $ | (570 | ) | $ | (237 | ) | |||||||||
|
Adjustments to reconcile net income (loss) to net
cash flows
from operating activities:
|
||||||||||||||||||||||||||||
|
Depreciation and amortization
|
-- | -- | -- | -- | 1,524 | -- | 1,524 | |||||||||||||||||||||
|
Noncash interest expense
|
-- | -- | (35 | ) | 12 | 97 | -- | 74 | ||||||||||||||||||||
|
Loss on extinguishment of debt
|
-- | -- | -- | 15 | 66 | -- | 81 | |||||||||||||||||||||
|
Deferred income taxes
|
275 | -- | -- | -- | 12 | -- | 287 | |||||||||||||||||||||
|
Equity in losses of subsidiaries
|
(25 | ) | 2 | (194 | ) | (353 | ) | -- | 570 | -- | ||||||||||||||||||
|
Other, net
|
(2 | ) | 2 | -- | -- | 34 | -- | 34 | ||||||||||||||||||||
|
Changes in operating assets and liabilities, net
of effects from a
cquisitions and dispositions:
|
||||||||||||||||||||||||||||
|
Accounts receivable
|
-- | -- | -- | -- | -- | -- | -- | |||||||||||||||||||||
|
Prepaid expenses and other assets
|
(2 | ) | 4 | -- | -- | 20 | -- | 22 | ||||||||||||||||||||
|
Accounts payable, accrued expenses and other
|
-- | -- | 70 | 31 | 25 | -- | 126 | |||||||||||||||||||||
|
Receivables from and payables to related party
|
(18 | ) | (21 | ) | (16 | ) | (14 | ) | 69 | -- | -- | |||||||||||||||||
|
Net cash flows from operating activities
|
(20 | ) | (14 | ) | (177 | ) | (115 | ) | 2,237 | -- | 1,911 | |||||||||||||||||
|
CASH FLOWS FROM INVESTING ACTIVITIES:
|
||||||||||||||||||||||||||||
|
Purchases of property, plant and equipment
|
-- | -- | -- | -- | (1,209 | ) | -- | (1,209 | ) | |||||||||||||||||||
|
Change in accrued expenses related to capital
expenditures
|
-- | -- | -- | -- | 8 | -- | 8 | |||||||||||||||||||||
|
Investment in subsidiary
|
(45 | ) | (77 | ) | (5 | ) | (1,697 | ) | -- | 1,824 | -- | |||||||||||||||||
|
Distributions from subsidiary
|
6 | 36 | 172 | 251 | -- | (465 | ) | -- | ||||||||||||||||||||
|
Loans to subsidiaries
|
-- | (30 | ) | -- | -- | -- | 30 | -- | ||||||||||||||||||||
|
Other, net
|
-- | -- | -- | -- | 31 | -- | 31 | |||||||||||||||||||||
|
Net cash flows from investing activities
|
(39 | ) | (71 | ) | 167 | (1,446 | ) | (1,170 | ) | 1,389 | (1,170 | ) | ||||||||||||||||
|
CASH FLOWS FROM FINANCING ACTIVITIES:
|
||||||||||||||||||||||||||||
|
Borrowings of long-term debt
|
-- | -- | -- | 2,600 | 515 | -- | 3,115 | |||||||||||||||||||||
|
Repayments of long-term debt
|
-- | -- | -- | (826 | ) | (3,526 | ) | -- | (4,352 | ) | ||||||||||||||||||
|
Repayments of preferred stock
|
(138 | ) | -- | -- | -- | -- | -- | (138 | ) | |||||||||||||||||||
|
Payment for debt issuance costs
|
-- | -- | -- | (45 | ) | (31 | ) | -- | (76 | ) | ||||||||||||||||||
|
Purchase of treasury stock
|
(6 | ) | -- | -- | -- | -- | -- | (6 | ) | |||||||||||||||||||
|
Contributions from parent
|
-- | 109 | 13 | 5 | 1,697 | (1,824 | ) | -- | ||||||||||||||||||||
|
Distributions to parent
|
-- | (36 | ) | (6 | ) | (172 | ) | (251 | ) | 465 | -- | |||||||||||||||||
|
Borrowings from parent
|
-- | -- | -- | -- | 30 | (30 | ) | -- | ||||||||||||||||||||
|
Other, net
|
-- | -- | -- | -- | (6 | ) | -- | (6 | ) | |||||||||||||||||||
|
Net cash flows from financing activities
|
(144 | ) | 73 | 7 | 1,562 | (1,572 | ) | (1,389 | ) | (1,463 | ) | |||||||||||||||||
|
NET INCREASE (DECREASE) IN CASH AND
CASH
EQUIVALENTS
|
(203 | ) | (12 | ) | (3 | ) | 1 | (505 | ) | -- | (722 | ) | ||||||||||||||||
|
CASH AND CASH EQUIVALENTS, beginning of
period
|
203 | 12 | 6 | -- | 533 | -- | 754 | |||||||||||||||||||||
|
CASH AND CASH EQUIVALENTS, end of period
|
$ | -- | $ | -- | $ | 3 | $ | 1 | $ | 28 | $ | -- | $ | 32 | ||||||||||||||
F-53
CHARTER COMMUNICATIONS, INC. AND SUBSIDIARIES
NOTES TO CONSOLIDATED FINANCIAL STATEMENTS
DECEMBER 31, 2010, 2009 AND 2008
(dollars in millions, except share or per share data or where indicated)
|
Charter Communications, Inc.
|
||||||||||||||||||||||||||||
|
Condensed Consolidating Statement of Cash Flows
|
||||||||||||||||||||||||||||
|
Successor
|
||||||||||||||||||||||||||||
|
For the one month ended December 31, 2009
|
||||||||||||||||||||||||||||
|
Charter
|
Intermediate Holding Companies
|
CCH II
|
CCO
Holdings
|
Charter Operating
and Subsidiaries
|
Eliminations
|
Charter Consolidated
|
||||||||||||||||||||||
|
CASH FLOWS FROM OPERATING ACTIVITIES:
|
||||||||||||||||||||||||||||
|
Consolidated net income
|
$ | 2 | $ | 9 | $ | 6 | $ | 22 | $ | 29 | $ | (66 | ) | $ | 2 | |||||||||||||
|
Adjustments to reconcile net income to net cash
flows from o
perating activities:
|
||||||||||||||||||||||||||||
|
Depreciation and amortization
|
-- | -- | -- | -- | 122 | -- | 122 | |||||||||||||||||||||
|
Noncash interest expense
|
-- | -- | (5 | ) | 1 | 9 | -- | 5 | ||||||||||||||||||||
|
Deferred income taxes
|
4 | -- | -- | -- | 3 | -- | 7 | |||||||||||||||||||||
|
Equity in losses of subsidiaries
|
(9 | ) | (6 | ) | (22 | ) | (29 | ) | -- | 66 | -- | |||||||||||||||||
|
Other, net
|
2 | (2 | ) | -- | -- | 3 | -- | 3 | ||||||||||||||||||||
|
Changes in operating assets and liabilities, net of
effects from
acquisitions and dispositions:
|
||||||||||||||||||||||||||||
|
Accounts receivable
|
-- | -- | -- | -- | 26 | -- | 26 | |||||||||||||||||||||
|
Prepaid expenses and other assets
|
-- | --- | -- | -- | 2 | -- | 2 | |||||||||||||||||||||
|
Accounts payable, accrued expenses and
other
|
(14 | ) | (16 | ) | 21 | 6 | 19 | -- | 16 | |||||||||||||||||||
|
Receivables from and payables to related party
|
-- | 18 | -- | -- | (18 | ) | -- | -- | ||||||||||||||||||||
|
Net cash flows from operating activities
|
(15 | ) | 3 | -- | -- | 195 | -- | 183 | ||||||||||||||||||||
|
CASH FLOWS FROM INVESTING ACTIVITIES:
|
||||||||||||||||||||||||||||
|
Purchases of property, plant and equipment
|
-- | -- | -- | -- | (108 | ) | -- | (108 | ) | |||||||||||||||||||
|
Change in accrued expenses related to capital
expenditures
|
-- | -- | -- | -- | -- | -- | -- | |||||||||||||||||||||
|
Other, net
|
-- | -- | -- | -- | (3 | ) | -- | (3 | ) | |||||||||||||||||||
|
Net cash flows from investing activities
|
-- | -- | -- | -- | (111 | ) | -- | (111 | ) | |||||||||||||||||||
|
CASH FLOWS FROM FINANCING ACTIVITIES:
|
||||||||||||||||||||||||||||
|
Repayments of long-term debt
|
-- | -- | -- | -- | (17 | ) | -- | (17 | ) | |||||||||||||||||||
|
Net cash flows from financing activities
|
-- | -- | -- | -- | (17 | ) | -- | (17 | ) | |||||||||||||||||||
|
NET INCREASE (DECREASE) IN CASH AND
CASH
EQUIVALENTS
|
(15 | ) | 3 | -- | -- | 67 | -- | 55 | ||||||||||||||||||||
|
CASH AND CASH EQUIVALENTS, beginning of
period
|
218 | 9 | 6 | -- | 466 | -- | 699 | |||||||||||||||||||||
|
CASH AND CASH EQUIVALENTS, end of period
|
$ | 203 | $ | 12 | $ | 6 | $ | -- | $ | 533 | $ | -- | $ | 754 | ||||||||||||||
F-54
CHARTER COMMUNICATIONS, INC. AND SUBSIDIARIES
NOTES TO CONSOLIDATED FINANCIAL STATEMENTS
DECEMBER 31, 2010, 2009 AND 2008
(dollars in millions, except share or per share data or where indicated)
|
Charter Communications, Inc.
|
||||||||||||||||||||||||||||
|
Condensed Consolidating Statement of Cash Flows
|
||||||||||||||||||||||||||||
|
Predecessor
|
||||||||||||||||||||||||||||
|
For the eleven months ended November 30, 2009
|
||||||||||||||||||||||||||||
|
Charter
|
Intermediate Holding Companies
|
CCH II
|
CCO
Holdings
|
Charter Operating
and Subsidiaries
|
Eliminations
|
Charter Consolidated
|
||||||||||||||||||||||
|
CASH FLOWS FROM OPERATING ACTIVITIES:
|
||||||||||||||||||||||||||||
|
Consolidated net income
|
$ | 11,364 | $ | 9,964 | $ | 2,666 | $ | 3,288 | $ | 3,327 | $ | (20,510 | ) | $ | 10,099 | |||||||||||||
|
Adjustments to reconcile net income to net cash
flows from
operating activities:
|
||||||||||||||||||||||||||||
|
Depreciation and amortization
|
-- | -- | -- | -- | 1,194 | -- | 1,194 | |||||||||||||||||||||
|
Impairment of franchises
|
-- | -- | -- | -- | 2,163 | -- | 2,163 | |||||||||||||||||||||
|
Noncash interest expense
|
-- | 11 | 9 | 2 | 20 | -- | 42 | |||||||||||||||||||||
|
Change in value of derivatives
|
-- | -- | -- | -- | 4 | -- | 4 | |||||||||||||||||||||
|
(Gain) loss due to effects of Plan
|
229 | (7,400 | ) | 351 | -- | 2 | -- | (6,818 | ) | |||||||||||||||||||
|
Gain due to fresh start accounting adjustments
|
-- | (158 | ) | -- | (25 | ) | (5,476 | ) | -- | (5,659 | ) | |||||||||||||||||
|
Noncash reorganization items, net
|
-- | 56 | (8 | ) | -- | 122 | -- | 170 | ||||||||||||||||||||
|
Deferred income taxes
|
(390 | ) | -- | -- | -- | 32 | -- | (358 | ) | |||||||||||||||||||
|
Equity in income of subsidiaries
|
(11,203 | ) | (2,666 | ) | (3,288 | ) | (3,353 | ) | -- | 20,510 | -- | |||||||||||||||||
|
Other, net
|
-- | (1 | ) | -- | 1 | 31 | -- | 31 | ||||||||||||||||||||
|
Changes in operating assets and liabilities, net of
effects from
acquisitions and dispositions:
|
||||||||||||||||||||||||||||
|
Accounts receivable
|
-- | -- | -- | -- | (52 | ) | -- | (52 | ) | |||||||||||||||||||
|
Prepaid expenses and other assets
|
-- | (12 | ) | -- | -- | (24 | ) | -- | (36 | ) | ||||||||||||||||||
|
Accounts payable, accrued expenses and other
|
(18 | ) | 195 | 279 | (6 | ) | (658 | ) | (136 | ) | (344 | ) | ||||||||||||||||
|
Receivables from and payables to related party,
including
deferred management fees
|
-- | 14 | (8 | ) | (10 | ) | (21 | ) | -- | (25 | ) | |||||||||||||||||
|
Net cash flows from operating activities
|
(18 | ) | 3 | 1 | (103 | ) | 664 | (136 | ) | 411 | ||||||||||||||||||
|
CASH FLOWS FROM INVESTING ACTIVITIES:
|
||||||||||||||||||||||||||||
|
Purchases of property, plant and equipment
|
-- | -- | -- | -- | (1,026 | ) | -- | (1,026 | ) | |||||||||||||||||||
|
Change in accrued expenses related to capital
expenditures
|
-- | -- | -- | -- | (10 | ) | -- | (10 | ) | |||||||||||||||||||
|
Purchase of CC VIII interest
|
(150 | ) | -- | -- | -- | -- | -- | (150 | ) | |||||||||||||||||||
|
Purchase of CCH II notes and accrued interest
|
(1,112 | ) | -- | -- | -- | -- | 1,112 | -- | ||||||||||||||||||||
|
Investment in subsidiaries
|
(71 | ) | (255 | ) | (51 | ) | (25 | ) | -- | 402 | -- | |||||||||||||||||
|
Payments from subsidiaries
|
19 | -- | -- | 75 | -- | (94 | ) | -- | ||||||||||||||||||||
|
Other, net
|
-- | -- | -- | -- | (7 | ) | -- | (7 | ) | |||||||||||||||||||
|
Net cash flows from investing activities
|
(1,314 | ) | (255 | ) | (51 | ) | 50 | (1,043 | ) | 1,420 | (1,193 | ) | ||||||||||||||||
|
CASH FLOWS FROM FINANCING ACTIVITIES:
|
||||||||||||||||||||||||||||
|
Proceeds from Rights Offering
|
1,614 | -- | -- | -- | -- | -- | 1,614 | |||||||||||||||||||||
|
Repayments of long-term debt
|
(25 | ) | -- | -- | -- | (53 | ) | (976 | ) | (1,054 | ) | |||||||||||||||||
|
Repayments to parent companies
|
-- | (19 | ) | -- | -- | (75 | ) | 94 | -- | |||||||||||||||||||
|
Payments for debt issuance costs
|
(39 | ) | -- | -- | -- | -- | -- | (39 | ) | |||||||||||||||||||
|
Contributions from parent
|
-- | 275 | 51 | 51 | 25 | (402 | ) | -- | ||||||||||||||||||||
|
Other, net
|
-- | (2 | ) | -- | -- | 2 | -- | -- | ||||||||||||||||||||
|
Net cash flows from financing activities
|
1,550 | 254 | 51 | 51 | (101 | ) | (1,284 | ) | 521 | |||||||||||||||||||
|
NET INCREASE (DECREASE) IN CASH AND CASH
EQUIVALENTS
|
218 | 2 | 1 | (2 | ) | (480 | ) | -- | (261 | ) | ||||||||||||||||||
|
CASH AND CASH EQUIVALENTS, beginning of period
|
-- | 7 | 5 | 2 | 946 | -- | 960 | |||||||||||||||||||||
|
CASH AND CASH EQUIVALENTS, end of period
|
$ | 218 | $ | 9 | $ | 6 | $ | -- | $ | 466 | $ | -- | $ | 699 | ||||||||||||||
F-55
CHARTER COMMUNICATIONS, INC. AND SUBSIDIARIES
NOTES TO CONSOLIDATED FINANCIAL STATEMENTS
DECEMBER 31, 2010, 2009 AND 2008
(dollars in millions, except share or per share data or where indicated)
|
Charter Communications, Inc.
|
||||||||||||||||||||||||||||
|
Condensed Consolidating Statement of Cash Flows
|
||||||||||||||||||||||||||||
|
Predecessor
|
||||||||||||||||||||||||||||
|
For the year ended December 31, 2008
|
||||||||||||||||||||||||||||
|
Charter
|
Intermediate Holding Companies
|
CCH II
|
CCO
Holdings
|
Charter Operating
and Subsidiaries
|
Eliminations
|
Charter Consolidated
|
||||||||||||||||||||||
|
CASH FLOWS FROM OPERATING ACTIVITIES:
|
||||||||||||||||||||||||||||
|
Consolidated net loss
|
$ | (2,451 | ) | $ | (2,523 | ) | $ | (1,723 | ) | $ | (1,473 | ) | $ | (1,386 | ) | $ | 7,109 | $ | (2,447 | ) | ||||||||
|
Adjustments to reconcile net loss to net cash
flows from
operating activities:
|
||||||||||||||||||||||||||||
|
Depreciation and amortization
|
-- | -- | -- | -- | 1,310 | -- | 1,310 | |||||||||||||||||||||
|
Impairment of franchises
|
-- | -- | -- | -- | 1,521 | -- | 1,521 | |||||||||||||||||||||
|
Noncash interest expense
|
-- | 31 | 8 | 3 | 19 | -- | 61 | |||||||||||||||||||||
|
Change in value of derivatives
|
-- | (33 | ) | -- | -- | 62 | -- | 29 | ||||||||||||||||||||
|
(Gain) loss on extinguishment of debt
|
-- | (9 | ) | 4 | -- | -- | -- | (5 | ) | |||||||||||||||||||
|
Deferred income taxes
|
(63 | ) | 3 | -- | -- | (47 | ) | -- | (107 | ) | ||||||||||||||||||
|
Equity in losses of subsidiaries
|
2,514 | 1,723 | 1,473 | 1,399 | -- | (7,109 | ) | -- | ||||||||||||||||||||
|
Other, net
|
-- | -- | -- | -- | 48 | -- | 48 | |||||||||||||||||||||
|
Changes in operating assets and liabilities, net of
effects from
acquisitions and dispositions:
|
||||||||||||||||||||||||||||
|
Accounts receivable
|
-- | 4 | -- | -- | (1 | ) | -- | 3 | ||||||||||||||||||||
|
Prepaid expenses and other assets
|
-- | (1 | ) | -- | -- | -- | -- | (1 | ) | |||||||||||||||||||
|
Accounts payable, accrued expenses and
other
|
-- | 8 | -- | (1 | ) | (20 | ) | -- | (13 | ) | ||||||||||||||||||
|
Receivables from and payables to related
party, including
deferred management fees
|
-- | (22 | ) | (11 | ) | (19 | ) | 52 | -- | -- | ||||||||||||||||||
|
Net cash flows from operating activities
|
-- | (819 | ) | (249 | ) | (91 | ) | 1,558 | -- | 399 | ||||||||||||||||||
|
CASH FLOWS FROM INVESTING ACTIVITIES:
|
||||||||||||||||||||||||||||
|
Purchases of property, plant and equipment
|
-- | -- | -- | -- | (1,202 | ) | -- | (1,202 | ) | |||||||||||||||||||
|
Change in accrued expenses related to capital
expenditures
|
-- | -- | -- | -- | (39 | ) | -- | (39 | ) | |||||||||||||||||||
|
Investment in subsidiaries
|
-- | (17 | ) | -- | -- | -- | 17 | -- | ||||||||||||||||||||
|
Distributions from subsidiaries
|
-- | 1,347 | 1,072 | 1,163 | -- | (3,582 | ) | -- | ||||||||||||||||||||
|
Other, net
|
-- | -- | -- | -- | 31 | -- | 31 | |||||||||||||||||||||
|
Net cash flows from investing activities
|
-- | 1,330 | 1,072 | 1,163 | (1,210 | ) | (3,565 | ) | (1,210 | ) | ||||||||||||||||||
|
CASH FLOWS FROM FINANCING ACTIVITIES:
|
||||||||||||||||||||||||||||
|
Borrowings of long-term debt
|
-- | -- | -- | -- | 3,105 | -- | 3,105 | |||||||||||||||||||||
|
Repayments of long-term debt
|
-- | (175 | ) | -- | -- | (1,179 | ) | -- | (1,354 | ) | ||||||||||||||||||
|
Repayments to parent companies
|
-- | 115 | -- | -- | (115 | ) | -- | -- | ||||||||||||||||||||
|
Payments for debt issuance costs
|
-- | -- | (4 | ) | -- | (38 | ) | -- | (42 | ) | ||||||||||||||||||
|
Distributions to parent
|
-- | (511 | ) | (836 | ) | (1,072 | ) | (1,163 | ) | 3,582 | -- | |||||||||||||||||
|
Contributions from parent
|
-- | -- | 17 | -- | -- | (17 | ) | -- | ||||||||||||||||||||
|
Other, net
|
-- | (1 | ) | -- | -- | (12 | ) | -- | (13 | ) | ||||||||||||||||||
|
Net cash flows from financing activities
|
-- | (572 | ) | (823 | ) | (1,072 | ) | 598 | 3,565 | 1,696 | ||||||||||||||||||
|
NET INCREASE (DECREASE) IN CASH AND
CASH
EQUIVALENTS
|
-- | (61 | ) | -- | -- | 946 | -- | 885 | ||||||||||||||||||||
|
CASH AND CASH EQUIVALENTS, beginning of period
|
-- | 68 | 5 | 2 | -- | -- | 75 | |||||||||||||||||||||
|
CASH AND CASH EQUIVALENTS, end of period
|
$ | -- | $ | 7 | $ | 5 | $ | 2 | $ | 946 | $ | -- | $ | 960 | ||||||||||||||
F-56
TABLE OF CONTENTS
Part IItem 1. BusinessItem 1A. Risk FactorsItem 1B. Unresolved Staff CommentsItem 2. PropertiesItem 3. Legal ProceedingsPart IIItem 5. Market For Registrant S Common Equity, Related Stockholder Matters and Issuer Purchases Of Equity SecuritiesItem 6. Selected Financial DataItem 7. Management S Discussion and Analysis Of Financial Condition and Results Of OperationsItem 7A. Quantitative and Qualitative Disclosures About Market RiskItem 8. Financial Statements and Supplementary DataItem 9. Changes in and Disagreements with Accountants on Accounting and Financial DisclosureItem 9A. Controls and ProceduresItem 9B. Other InformationPart IIIItem 10. Directors, Executive Officers and Corporate GovernanceItem 11. Executive CompensationItem 12. Security Ownership Of Certain Beneficial Owners and Management and Related Stockholders MattersItem 13. Certain Relationships and Related Transactions, and Director IndependenceItem 14. Principal Accounting Fees and ServicesPart IVItem 15. Exhibits and Financial Statement Schedules