CHARTER COMMUNICATIONS, INC. /MO/
10-Ks and 10-Qs
|
|
|
|
|
|
|
|
|
|
|
|
|
|
|
|
|
|
|
|
|
|
|
|
|
|
|
|
|
|
|
|
|
|
|
|
|
|
|
|
|
|
|
|
|
|
|
|
|
|
|
|
|
|
|
|
UNITED STATES
SECURITIES AND EXCHANGE COMMISSION
SECURITIES AND EXCHANGE COMMISSION
Washington, D.C. 20549
______________
FORM 10-K
______________
|
(Mark One)
|
||
|
x
|
ANNUAL REPORT PURSUANT TO SECTION 13 OR 15(d) OF THE SECURITIES EXCHANGE
ACT OF 1934 |
|
|
For the fiscal year ended December 31, 2014
|
||
|
or
|
||
|
¨
|
TRANSITION REPORT PURSUANT TO SECTION 13 OR 15(d) OF THE SECURITIES
EXCHANGE ACT OF 1934 |
|
For the Transition Period From to
Commission File Number: 001-33664
Commission File Number: 001-33664

Charter Communications, Inc.
(Exact name of registrant as specified in its charter)
|
Delaware
|
43-1857213
|
|
|
(State or other jurisdiction of incorporation or organization)
|
(I.R.S. Employer Identification Number)
|
|
|
400 Atlantic Street
Stamford, Connecticut 06901
|
(203) 905-7801
|
|
|
(Address of principal executive offices including zip code)
|
(Registrant’s telephone number, including area code)
|
|
Securities registered pursuant to section 12(b) of the Act:
|
Title of each class
|
Name of Exchange which registered
|
|
|
Class A Common Stock, $.001 Par Value
|
NASDAQ Global Select Market
|
|
Securities registered pursuant to section 12(g) of the Act: None
Indicate by check mark if the registrant is a well-known seasoned issuer, as defined in Rule 405 of the Securities Act. Yes
x
No
o
Indicate by check mark if the registrant is not required to file reports pursuant to Section 13 or Section 15(d) of the Act. Yes
o
No
x
Indicate by check mark whether the registrant (1) has filed all reports required to be filed by Section 13 or 15(d) of the Securities Exchange Act of 1934 during the preceding 12 months (or for such shorter period that the registrant was required to file such reports), and (2) has been subject to such filing requirements for the past 90 days. Yes
x
No
o
Indicate by check mark whether the registrants have submitted electronically and posted on their corporate website, if any, every Interactive Data File required to be submitted and posted pursuant to Rule 405 of Regulation S-T (§232.405 of this chapter) during the preceding 12 months (or for such shorter period that the registrants were required to submit and post such files). Yes
x
No
o
Indicate by check mark if disclosure of delinquent filers pursuant to Item 405 of Regulation S-K (§ 229.405 of this chapter) is not contained herein, and will not be contained, to the best of registrant’s knowledge, in definitive proxy or information statements incorporated by reference in Part III of this Form 10-K or any amendment to this Form 10-K.
o
Indicate by check mark whether the registrant is a large accelerated filer, an accelerated filer, a non-accelerated filer, or a smaller reporting company. See definition of “accelerated filer,” “large accelerated filer,” and “smaller reporting company” in Rule 12b-2 of the Exchange Act. (Check one):
Large accelerated filer
x
Accelerated filer
o
Non-accelerated filer
o
Smaller reporting company
o
Indicate by check mark whether the registrant is a shell company (as defined in Rule 12b-2 of the Act). Yes
o
No
x
The aggregate market value of the registrant of outstanding Class A common stock held by non-affiliates of the registrant at
June 30, 2014
was approximately
$12.3 billion
, computed based on the closing sale price as quoted on the NASDAQ Global Select Market on that date. For purposes of this calculation only, directors, executive officers and the principal controlling shareholders or entities controlled by such controlling shareholders of the registrant are deemed to be affiliates of the registrant.
There were
111,999,687
shares of Class A common stock outstanding as of
December 31, 2014
. There were no shares of Class B common stock outstanding as of the same date.
Documents Incorporated By Reference
Information required by Part III is incorporated by reference from Registrant’s proxy statement or an amendment to this Annual Report on Form 10-K to be filed by April 30, 2015.
CHARTER COMMUNICATIONS, INC.
FORM 10-K — FOR THE YEAR ENDED DECEMBER 31, 2014
FORM 10-K — FOR THE YEAR ENDED DECEMBER 31, 2014
TABLE OF CONTENTS
|
Page No.
|
||||
This annual report on Form 10-K is for the year ended
December 31, 2014
. The Securities and Exchange Commission (“SEC”) allows us to “incorporate by reference” information that we file with the SEC, which means that we can disclose important information to you by referring you directly to those documents. Information incorporated by reference is considered to be part of this annual report. In addition, information that we file with the SEC in the future will automatically update and supersede information contained in this annual report. In this annual report, “we,” “us” and “our” refer to Charter Communications, Inc. and its subsidiaries.
i
CAUTIONARY STATEMENT REGARDING FORWARD-LOOKING STATEMENTS:
This annual report includes forward-looking statements within the meaning of Section 27A of the Securities Act of 1933, as amended (the “Securities Act”), and Section 21E of the Securities Exchange Act of 1934, as amended (the “Exchange Act”), regarding, among other things, our plans, strategies and prospects, both business and financial including, without limitation, the forward-looking statements set forth in Part I. Item 1. under the heading "Business" and in Part II. Item 7. under the heading “Management’s Discussion and Analysis of Financial Condition and Results of Operations” in this annual report. Although we believe that our plans, intentions and expectations reflected in or suggested by these forward-looking statements are reasonable, we cannot assure you that we will achieve or realize these plans, intentions or expectations. Forward-looking statements are inherently subject to risks, uncertainties and assumptions, including, without limitation, the factors described in Part I. Item 1A. under “Risk Factors” and in Part II. Item 7. under the heading, “Management’s Discussion and Analysis of Financial Condition and Results of Operations” in this annual report. Many of the forward-looking statements contained in this annual report may be identified by the use of forward‑looking words such as “believe,” “expect,” “anticipate,” “should,” “planned,” “will,” “may,” “intend,” “estimated,” “aim,” “on track,” “target,” “opportunity,” “tentative,” “positioning,” “designed,” “create,” “predict,” “project,” “seek,” “would,” “could,” “continue,” “ongoing,” “upside,” “increases” and “potential,” among others. Important factors that could cause actual results to differ materially from the forward-looking statements we make in this annual report are set forth in this annual report and in other reports or documents that we file from time to time with the SEC, and include, but are not limited to:
Risks Related to Comcast Corporation ("Comcast") Transactions
|
•
|
the ultimate outcome of the proposed transactions between us and Comcast including the possibility that such transactions may not occur if closing conditions are not satisfied;
|
|
•
|
if any such transactions were to occur, the ultimate outcome and results of integrating operations and application of our operating strategies to the acquired assets and the ultimate ability to realize synergies at the levels currently expected as well as potential programming dis-synergies;
|
|
•
|
the impact of the proposed transactions on our stock price and future operating results, including due to transaction and integration costs, increased interest expense, business disruption, and diversion of management time and attention;
|
|
•
|
the reduction in our current stockholders’ percentage ownership and voting interest as a result of the proposed transactions;
|
|
•
|
the increase in indebtedness as a result of the proposed transactions, which will increase interest expense and may decrease our operating flexibility;
|
Risks Related to Our Business
|
•
|
our ability to sustain and grow revenues and cash flow from operations by offering video, Internet, voice, advertising and other services to residential and commercial customers, to adequately meet the customer experience demands in our markets and to maintain and grow our customer base, particularly in the face of increasingly aggressive competition, the need for innovation and the related capital expenditures;
|
|
•
|
the impact of competition from other market participants, including but not limited to incumbent telephone companies, direct broadcast satellite operators, wireless broadband and telephone providers, digital subscriber line (“DSL”) providers, video provided over the Internet and providers of advertising over the Internet;
|
|
•
|
general business conditions, economic uncertainty or downturn, high unemployment levels and the level of activity in the housing sector;
|
|
•
|
our ability to obtain programming at reasonable prices or to raise prices to offset, in whole or in part, the effects of higher programming costs (including retransmission consents);
|
|
•
|
the development and deployment of new products and technologies including our cloud based user interface, Spectrum Guide
®
, and downloadable security for set-top boxes;
|
|
•
|
the effects of governmental regulation on our business or potential business combination transactions;
|
ii
|
•
|
the availability and access, in general, of funds to meet our debt obligations prior to or when they become due and to fund our operations and necessary capital expenditures, either through (i) cash on hand, (ii) free cash flow, or (iii) access to the capital or credit markets; and
|
|
•
|
our ability to comply with all covenants in our indentures and credit facilities, any violation of which, if not cured in a timely manner, could trigger a default of our other obligations under cross-default provisions.
|
All forward-looking statements attributable to us or any person acting on our behalf are expressly qualified in their entirety by this cautionary statement. We are under no duty or obligation to update any of the forward-looking statements after the date of this annual report.
iii
Item 1.
Business.
Introduction
We are among the largest providers of cable services in the United States, offering a variety of entertainment, information and communications solutions to residential and commercial customers. Our infrastructure consists of a hybrid of fiber and coaxial cable plant with approximately
12.9 million
estimated passings, with
97%
at 550 megahertz (“MHz”) or greater,
98%
of plant miles two-way active and 99% of plant all-digital. A national Internet Protocol ("IP") infrastructure interconnects Charter Communications, Inc. (“Charter”) markets. See "Item 1. Business — Products and Services" for further description of these terms and services, including "customers."
As of
December 31, 2014
, we served approximately
6.2 million
residential and commercial customers. We sell our video, Internet and voice services primarily on a subscription basis, often in a bundle of two or more services, providing savings and convenience to our customers. Bundled services are available to approximately
98%
of our passings, and approximately
62%
of our customers subscribe to a bundle of services.
We served approximately
4.2 million
residential video customers as of
December 31, 2014
. We completed our all-digital rollout in 2014 and substantially all of our markets now offer over 200 HD channels and faster Internet speeds. We have launched the Charter Spectrum® brand in our all-digital markets. Digital video enables our customers to access advanced video services such as high definition ("HD") television, video on demand programming, an interactive program guide and digital video recorder (“DVR”) service.
We also served approximately
4.8 million
residential Internet customers as of
December 31, 2014
. Our Internet service is available in a variety of download speeds of up to 100 megabits per second (“Mbps”), and up to 120 Mbps in certain markets, and upload speeds of up to 5 Mbps. Approximately 80% of our Internet customers have at least 60 Mbps download speed.
We provided voice service to approximately
2.4 million
residential customers as of
December 31, 2014
. Our voice services typically include unlimited local and long distance calling to the United States, Canada and Puerto Rico, plus other features, including voicemail, call waiting and caller ID.
Through Charter Business
®
, we provide scalable, tailored broadband communications solutions to business and carrier organizations, such as video entertainment services, Internet access, business telephone services, data networking and fiber connectivity to cellular towers and office buildings. As of
December 31, 2014
, we served approximately
619,000
commercial primary service units, primarily small- and medium-sized commercial customers. Our advertising sales division, Charter Media®, provides local, regional and national businesses with the opportunity to advertise in individual markets on cable television networks.
For the year ended
December 31, 2014
, we generated approximately
$9.1 billion
in revenue, of which approximately
83%
was generated from our residential video, Internet and voice services. We also generated revenue from providing video, Internet, voice and fiber connectivity services to commercial businesses and from the sale of advertising. Sales from residential triple play customers (customers receiving all three service offerings, video, Internet and voice) and from commercial services have contributed to the majority of our recent revenue growth.
We have a history of net losses. Our net losses are principally attributable to insufficient revenue to cover the combination of operating expenses, interest expenses that we incur on our debt, depreciation expenses resulting from the capital investments we have made, and continue to make, in our cable properties, amortization expenses related to our customer relationship intangibles and non-cash taxes resulting from increases in our deferred tax liabilities.
Our principal executive offices are located at 400 Atlantic Street, Stamford, Connecticut 06901. Our telephone number is (203) 905-7801, and we have a website accessible at www.charter.com. Our annual reports, quarterly reports and current reports on Form 8-K, and all amendments thereto, are available on our website free of charge as soon as reasonably practicable after they have been filed. The information posted on our website is not incorporated into this annual report.
Transactions with Comcast
On April 25, 2014, we entered into a binding definitive agreement (the “Transactions Agreement”) with Comcast Corporation (“Comcast”), which contemplates the following transactions: (1) an asset purchase, (2) an asset exchange and (3) a contribution
1
and spin-off transaction (collectively, the “Transactions”) as described in more detail below. The Transactions Agreement calls for the Transactions to be consummated substantially contemporaneously with each other as promptly as practicable following the merger of a subsidiary of Comcast with Time Warner Cable Inc. (“TWC”) as previously announced by Comcast and TWC. The completion of the Transactions will result in Charter acquiring approximately a net 1.3 million existing TWC residential and commercial video customers.
Asset Purchase
At closing, the Transactions Agreement calls for Charter to acquire from Comcast certain cable systems currently owned by TWC serving approximately 1.4 million video customers and all other assets and liabilities primarily related to such cable systems for cash consideration (the "Asset Purchase"). The Transactions Agreement calls for Charter to pay to Comcast the tax benefit of the step-up Charter receives in the tax basis of the assets. The Transactions Agreement calls for such tax benefit to Charter to be paid as realized by us over an eight-year period, with an additional payment to be made at the end of such eight-year period in the amount of any remaining tax benefit (on a present value basis) not previously realized by Charter.
Asset Exchange
At closing, we and Comcast will exchange certain cable systems currently serving approximately 1.5 million TWC video customers and approximately 1.6 million Charter video customers and all other assets and liabilities primarily related to such cable systems (the "Asset Exchange"). Most tax gains associated with the Asset Exchange are expected to be offset by Charter’s existing net operating losses.
Financing
Charter has received commitments from a number of leading Wall Street investment banks to provide incremental senior secured term loan facilities totaling up to $8.4 billion and a senior secured incremental revolving facility equal to $500 million under the Charter Communications Operating, LLC ("Charter Operating") credit facility. Pursuant to that commitment, Charter has fully drawn on $3.5 billion term loan G commitments. The amount of the commitments for incremental term loan facilities was further reduced by $3.5 billion at the closing of the offering of $1.5 billion aggregate principal amount of 5.50% senior notes due 2022 and $2.0 billion aggregate principal amount of 5.75% senior notes due 2024 (collectively, the "CCOH Safari Notes") by CCOH Safari, LLC ("CCOH Safari"). Charter has $1.4 billion remaining in committed Charter Operating term loans. The proceeds from the term loan G and the CCOH Safari Notes are being held in escrow subject to the closing of the Transactions and are recorded on our consolidated balance sheet as noncurrent restricted cash and cash equivalents. The escrow for the CCOH Safari Notes continues until November 5, 2015. The escrow for term loan G continues so long as we pre-fund interest and the release conditions can be satisfied. The consideration for the assets acquired and transaction expenses is currently estimated at approximately $7.2 billion. The proceeds of the incremental facilities and the CCOH Safari Notes will be used by Charter for the purpose of financing the Asset Purchase, paying fees and expenses incurred in connection with the Asset Purchase and the other Transactions, for providing ongoing working capital and for other general corporate purposes of Charter Operating and its subsidiaries.
Contribution and Spin-Off Transaction
CCH I, LLC (“CCH I”), a current indirect subsidiary of Charter, will be reorganized to be a direct subsidiary of Charter. CCH I will then form a new subsidiary that will merge with Charter, through a tax-free reorganization and become the new holding company (“New Charter”) that will own 100% of Charter and indirectly Charter Communications Holding Company, LLC (“Charter Holdco”) ("Charter Merger"). New Charter will then acquire an approximate 33% stake in a new publicly-traded cable provider to be spun-off by Comcast serving approximately 2.5 million existing Comcast video customers (the "Spin-Off"). The cable systems will be contributed to Midwest Cable, Inc., which upon consummation of the Transactions, is expected to change its name to GreatLand Connections Inc. (“GreatLand Connections”). New Charter will acquire its interest in GreatLand Connections by issuing New Charter stock to Comcast shareholders (including former TWC shareholders) as a result of a merger of a wholly owned subsidiary of New Charter with and into GreatLand Connections. Comcast shareholders, including the former TWC shareholders, are expected to own approximately 67% of GreatLand Connections, while New Charter is expected to directly own approximately 33% of GreatLand Connections. GreatLand Connections expects to incur leverage of approximately 5 times its estimated pro forma EBITDA (as such term is defined by GreatLand Connections’ financing sources for purposes of the financing) to fund a distribution to Comcast and issue notes to Comcast prior to the spin-off. Additionally, we will provide services to GreatLand Connections, and we will be reimbursed the actual economic costs of such services, in addition to a fee of 4.25% of GreatLand Connections' gross revenues.
The Asset Purchase, Asset Exchange and the acquisition of interests in GreatLand Connections will be valued at a 7.125 multiple of 2014 EBITDA (as defined by the parties), subject to certain post-closing adjustments.
2
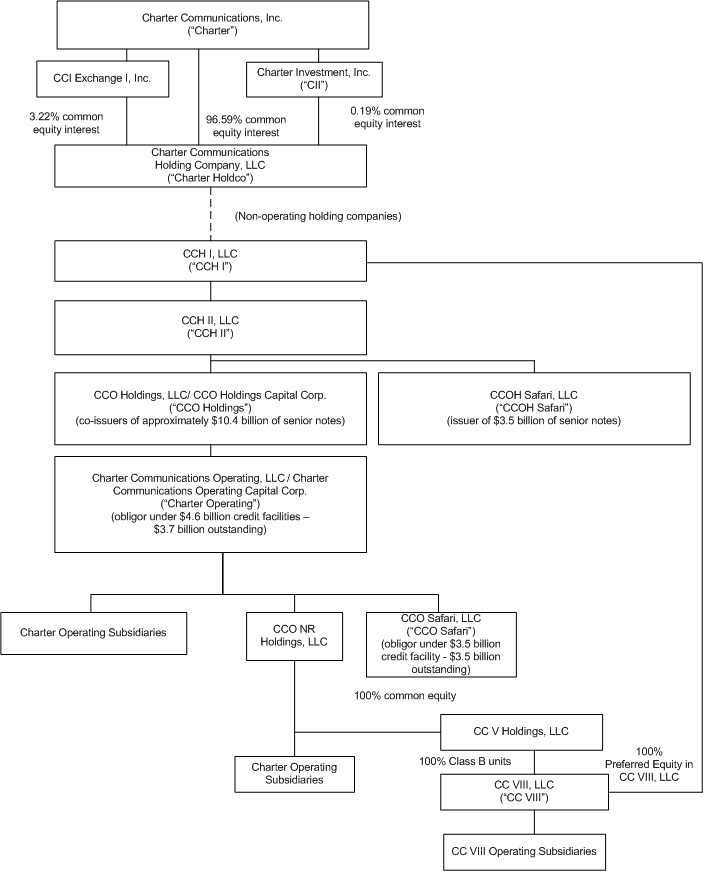
Corporate Entity Structure
The chart below sets forth our entity structure and that of our direct and indirect subsidiaries. This chart does not include all of our affiliates and subsidiaries and, in some cases, we have combined separate entities for presentation purposes. The equity ownership percentages shown below are approximations. Indebtedness amounts shown below are principal amounts as of
December 31, 2014
. See Note 8 to the accompanying consolidated financial statements contained in “Item 8. Financial Statements and Supplementary Data,” which also includes the accreted values of the indebtedness described below.
3
Charter Communications, Inc.
Charter owns 100% of Charter Holdco . Charter Holdco, through its subsidiaries, owns cable systems. As sole manager under applicable operating agreements, Charter controls the affairs of Charter Holdco and its limited liability company subsidiaries. In addition, Charter provides management services to Charter Holdco and its subsidiaries under a management services agreement.
Interim Holding Companies.
As indicated in the organizational chart above, our interim holding companies indirectly own the subsidiaries that own or operate all of our cable systems, subject to a CC VIII, LLC ("CC VIII") 100% preferred interest held by CCH I, and four of these companies, CCO Holdings, LLC ("CCO Holdings"), CCOH Safari, Charter Operating and CCO Safari, LLC ("CCO Safari") had debt obligations as of
December 31, 2014
. The amounts borrowed under CCO Safari's term loan G facility are not considered when calculating the leverage ratio on CCO Holdings' indentures as CCO Safari has been designated as an Unrestricted Subsidiary under CCO Holdings' indentures. For a description of the debt issued by these issuers please see “Part II. Item 7. Management’s Discussion and Analysis of Financial Condition and Results of Operations — Description of Our Outstanding Debt.”
Products and Services
Through our hybrid fiber and coaxial cable network, we offer our customers traditional cable video services, as well as advanced video services (such as video on demand, HD television, and DVR service), Internet services and voice services. Our voice services are primarily provided using voice over Internet protocol (“VoIP”) technology, to transmit digital voice signals over our systems. Our video, Internet, and voice services are offered to residential and commercial customers on a subscription basis, with prices and related charges based on the types of service selected, whether the services are sold as a “bundle” or on an individual basis, and the equipment necessary to receive the services.
The following table summarizes our customer statistics for video, Internet and voice as of
December 31, 2014
and
2013
(in thousands, except per customer data and footnotes).
|
Approximate as of
|
|||||||
|
December 31,
|
|||||||
|
2014 (a)
|
2013 (a)
|
||||||
|
Residential
|
|||||||
|
Video (b)
|
4,160
|
|
4,177
|
|
|||
|
Internet (c)
|
4,766
|
|
4,383
|
|
|||
|
Voice (d)
|
2,439
|
|
2,273
|
|
|||
|
Residential PSUs (e)
|
11,365
|
|
10,833
|
|
|||
|
Residential Customer Relationships (f)
|
5,841
|
|
5,561
|
|
|||
|
Monthly Residential Revenue per Residential Customer (g)
|
$
|
111.52
|
|
$
|
108.12
|
|
|
|
Commercial
|
|||||||
|
Video (b)(h)
|
133
|
|
165
|
|
|||
|
Internet (c)
|
306
|
|
257
|
|
|||
|
Voice (d)
|
180
|
|
145
|
|
|||
|
Commercial PSUs (e)
|
619
|
|
567
|
|
|||
|
Commercial Customer Relationships (f)(h)
|
386
|
|
375
|
|
|||
|
(a)
|
We calculate the aging of customer accounts based on the monthly billing cycle for each account. On that basis, as of
December 31, 2014
and
2013
, customers include approximately
35,100
and
11,300
customers, respectively, whose accounts were over 60 days, approximately
1,500
and
800
customers, respectively, whose accounts were over 90 days, and approximately
900
and
900
customers, respectively, whose accounts were over 120 days. The increase in aging of customer accounts over 60 days is primarily related to a third quarter change in our collections policy consistent with broader cable industry practices.
|
4
|
(b)
|
“Video customers” represent those customers who subscribe to our video cable services. Our methodology for reporting residential video customers generally excludes units under bulk arrangements, unless those units have a digital set-top box, thus a direct billing relationship. As we completed our all-digital transition, bulk units were supplied with digital set-top boxes adding to our bulk digital upgrade customers. Full year 2014 and 2013 residential video net additions include
56,000
and
18,000
, respectively, bulk video units as a result of adding digital set-top boxes to bulk units.
|
|
(c)
|
“Internet customers” represent those customers who subscribe to our Internet service.
|
|
(d)
|
“Voice customers” represent those customers who subscribe to our voice service.
|
|
(e)
|
“Primary Service Units” or “PSUs” represent the total of video, Internet and voice customers.
|
|
(f)
|
"Customer Relationships" include the number of customers that receive one or more levels of service, encompassing video, Internet and voice services, without regard to which service(s) such customers receive. This statistic is computed in accordance with the guidelines of the National Cable & Telecommunications Association ("NCTA"). Commercial customer relationships include video customers in commercial structures, which are calculated on an EBU basis (see footnote (h)) and non-video commercial customer relationships.
|
|
(g)
|
"Monthly Residential Revenue per Residential Customer" is calculated as total residential video, Internet and voice quarterly revenue divided by three divided by average residential customer relationships during the respective quarter.
|
|
(h)
|
Included within commercial video customers are those in commercial structures, which are calculated on an equivalent bulk unit (“EBU”) basis. We calculate EBUs by dividing the bulk price charged to accounts in an area by the published rate charged to non-bulk residential customers in that market for the comparable tier of service. This EBU method of estimating basic video customers is consistent with the methodology used in determining costs paid to programmers and is consistent with the methodology used by other multiple system operators. As we increase our published video rates to residential customers without a corresponding increase in the prices charged to commercial service customers, our EBU count will decline even if there is no real loss in commercial service customers. For example, commercial video customers decreased by 18,000 during the year ended December 31, 2014 due to a higher applicable video rate applied and other revisions to customer reporting methodology.
|
Video Services
In
2014
, residential video services represented approximately
49%
of our total revenues. Our video service offerings include the following:
|
•
|
Video.
All of our video customers receive a package of basic programming which generally consists of local broadcast television, local community programming, including governmental and public access, and limited satellite-delivered or non-broadcast channels, such as weather, shopping and religious programming along with a digital set-top box that provides an interactive electronic programming guide with parental controls, access to pay-per-view channels, including video on demand (available nearly everywhere), digital quality music channels and the option to also receive a cable card. Customers have the option to purchase additional tiers of services including premium channels which provide original programming, commercial-free movies, sports, and other special event entertainment programming. Although we offer subscriptions to premium channels on an individual basis, we also offer premium channels combined with our Internet and voice services. Much of our programming is now offered through video on demand and increasingly over the Internet.
|
|
•
|
Video On Demand, Subscription On Demand and Pay-Per-View
.
In most areas, we offer video on demand service which allows customers to select from 10,000 or more titles at any time. Video on demand includes standard definition, HD and three dimensional ("3D") content. Video on demand programming options may be accessed for free if the content is associated with the customer’s linear subscription, or for a fee on a transactional basis. Video on demand services may also be offered on a subscription basis included in a digital tier premium channel subscription or for a monthly fee. Pay-per-view channels allow customers to pay on a per-event basis to view a single showing of a recently released movie, a one-time special sporting event, music concert, or similar event on a commercial-free basis.
|
|
•
|
High Definition Television
.
HD television offers our digital customers certain video programming at a higher resolution to improve picture and audio quality versus standard basic or digital video images. In 2014, we completed our transition to all-digital transmission of channels which allowed us to increase the number of HD channels offered to more than 200
|
5
in substantially all of our markets. We are also rolling out HD auto-tune in our markets which is a feature that ensures HD set-tops tune to the HD version of a channel even when the standard definition version is selected.
|
•
|
Digital Video Recorder.
DVR service enables customers to digitally record programming and to pause and rewind live programming. Charter customers may lease multiple DVR set-top boxes to maximize recording capacity on multiple televisions in the home. Most of our customers also have the ability to program their DVR's remotely via tablet and phone applications or our website.
|
|
•
|
Charter TV App.
The Charter TV App enables Charter video customers to search and discover content on a variety of customer owned devices, including the iPhone
®
, iPad
®
, and iPod Touch
®
, as well as the most popular Android
™
based tablets. The Charter TV App allows customers to watch over 100 channels of cable TV and use the device as a remote to control their digital set-top box while in their home. It also allows customers the ability to browse Charter's program guide, search for programming, and schedule DVR recordings from inside and outside the home. Charter's online offerings include many of our largest and most popular networks. We also currently offer content already available online through Charter.net such as HBO Go
®
and WatchESPN
®
with other online content. We are currently testing Spectrum Guide, a network based user interface with the same look and feel of the Charter TV App. The user interface is being designed to work with all of our existing and future set-top boxes. Spectrum Guide was launched in one market in 2014 and will be more widely deployed in 2015.
|
Internet Services
In
2014
, residential Internet services represented approximately
28%
of our total revenues. Approximately
95%
of our estimated passings have DOCSIS 3.0 wideband technology, allowing us to offer our residential customers multiple tiers of Internet services with download speeds of up to 100 Mbps, and up to 120 Mbps in certain markets. Our Internet services also include a new and improved Internet portal, Charter.net, making it easier for customers to manage their account, seek self-help and watch TV online. Charter.net also provides multiple e-mail addresses, as well as variety of content and media from local, national and international providers including entertainment, games, news and sports. Finally, Charter Security Suite is included with Charter Internet services and protects computers from viruses and spyware and provides parental control features.
Accelerated growth in the number of IP devices and bandwidth used in homes has created a need for faster speeds and greater reliability. Charter is focused on providing services to fill those needs. Charter offers an in-home WiFi product permitting customers to lease a high performing wireless router to maximize their wireless Internet experience. Since going all-digital, our base Internet download speed offering is 60 Mbps, and 100 Mbps in certain markets.
Voice Services
In
2014
, residential voice services represented approximately
6%
of our total revenues. We provide voice communications services primarily using VoIP technology to transmit digital voice signals over our network. Charter Voice includes unlimited local and long distance calling to the United States, Canada and Puerto Rico, voicemail, call waiting, caller ID, call forwarding and other features and offers international calling either by the minute or through packages of minutes per month. For Charter Voice and video customers, caller ID on TV is also available in most areas.
Commercial Services
In
2014
, commercial services represented approximately
11%
of our total revenues. Commercial services offered through Charter Business, include scalable broadband communications solutions for businesses and carrier organizations of all sizes such as Internet access, data networking, fiber connectivity to cellular towers and office buildings, video entertainment services and business telephone services.
|
•
|
Small Business.
Charter offers small businesses (1 - 19 employees) services similar to our residential offerings including a full range of video programming tiers and music services, coax Internet speeds of up to 100 Mbps downstream, 200 Mbps in certain markets, and up to 7 Mbps upstream in its DOCSIS 3.0 markets, a set of business cloud services including web hosting, e-mail and security, and multi-line telephone services with more than 30 business features including web-based service management.
|
|
•
|
Medium Business
.
In addition to its other offerings, Charter also offers medium sized businesses (20-199 employees) more complex products such as fiber Internet with symmetrical speeds of up to 10 Gbps and voice trunking services such as Primary Rate Interface ("PRI") and Session Initiation Protocol ("SIP") Trunks which provide higher-capacity voice services. Charter also offers Metro Ethernet service that connects two or more locations for commercial
|
6
customers with geographically dispersed locations with services up to 10 Gbps. Metro Ethernet service can also extend the reach of the customer's local area network ("LAN") within and between metropolitan areas.
|
•
|
Large Business.
Charter offers large businesses (200+ employees) with multiple sites more specialized solutions such as custom fiber networks, Metro and long haul Ethernet, PRI and SIP Trunk services.
|
|
•
|
Carrier Wholesale.
Charter offers high-capacity last-mile data connectivity services to wireless and wireline carriers, Internet Service Providers ("ISPs") and other competitive carriers on a wholesale basis.
|
Sale of Advertising
In
2014
, sales of advertising represented approximately
4%
of our total revenues. We receive revenues from the sale of local advertising on satellite-delivered networks such as MTV
®
, CNN
®
and ESPN
®
. In any particular market, we generally insert local advertising on approximately 40 channels. In most cases, the available advertising time is sold by our sales force, however in some markets, we enter into representation agreements with contiguous cable system operators under which another operator in the area will sell advertising on our behalf for a percentage of the revenue. In some markets, we sell advertising on behalf of other operators.
Charter has deployed Enhanced TV Binary Interchange Format (“EBIF”) technology to set-top boxes in most service areas within the Charter footprint. EBIF is a technology foundation that will allow Charter to deliver enhanced and interactive television applications for advertising. From time to time, certain of our vendors, including programmers and equipment vendors, have purchased advertising from us.
Pricing of Our Products and Services
Our revenues are derived principally from the monthly fees customers pay for the services we provide. We typically charge a one-time installation fee which is sometimes waived or discounted during certain promotional periods. The prices we charge for our products and services vary based on the level of service the customer chooses and in some cases the geographic market. In accordance with Federal Communications Commission ("FCC") rules, the prices we charge for video cable-related equipment, such as set-top boxes and remote control devices, and for installation services, are based on actual costs plus a permitted rate of return in regulated markets.
In mid-2012, Charter launched a new pricing and packaging approach which emphasizes the triple play products of video, Internet and voice services and combines our most popular and competitive services in core packages at what we believe is a fair price. We believe the benefits of this approach are:
|
•
|
simplicity for both our customers in understanding our offers, and our employees in service delivery;
|
|
•
|
the ability to package more services at the time of sale and include more product in each service, thus increasing revenue per customer;
|
|
•
|
higher product offering quality through more HD channels, improved pricing for HD and HD/DVR equipment and faster Internet speeds;
|
|
•
|
lower expected churn as a result of higher customer satisfaction; and
|
|
•
|
gradual price increases at the end of promotional periods.
|
As of
December 31, 2014
, approximately 83% of our customers are in the new pricing and packaging plan, or 86% excluding those acquired in the acquisition of Bresnan Broadband Holdings, LLC and its subsidiaries (collectively, "Bresnan"). See “Part II. Item 7. Management’s Discussion and Analysis of Financial Condition and Results of Operations — Overview.”
Our Network Technology
and Customer Premise Equipment
Our network includes three components: the national backbone, regional/metro networks and the "last-mile" network. Both our national backbone and regional/metro network components utilize or plan to utilize a redundant Internet Protocol ("IP”) ring/mesh architecture. The national backbone provides connectivity from the regional demarcation points to nationally centralized content, connectivity and services. The regional/metro network components provide connectivity between the regional demarcation points and headends within a specific geographic area and enable the delivery of content and services between these network components.
Our last-mile network utilizes a hybrid fiber coaxial cable (“HFC”) architecture, which combines the use of fiber optic cable with coaxial cable. In most systems, we deliver our signals via fiber optic cable from the headend to a group of nodes, and use coaxial cable to deliver the signal from individual nodes to the homes served by that node. For our fiber Internet, Ethernet, carrier wholesale,
7
SIP and PRI commercial customers, fiber optic cable is extended from the individual nodes all the way to the customer's site. Our design standard is six strands of fiber to each node, with two strands activated and four strands reserved for spares and future services. We believe that this hybrid network design provides high capacity and signal quality. The design also provides two-way signal capabilities for the support of interactive services.
HFC architecture benefits include:
|
•
|
bandwidth capacity to enable traditional and two-way video and broadband services;
|
|
•
|
dedicated bandwidth for two-way services; and
|
|
•
|
signal quality and high service reliability.
|
Approximately
97%
of our estimated passings are served by systems that have bandwidth of 550 megahertz or greater and
98%
are two-way activated as of
December 31, 2014
. This bandwidth capacity enables us to offer digital television, Internet services, voice services and other advanced video services.
In 2014, we completed our transition from analog to digital transmission of the channels we distribute which allows us to recapture bandwidth. The all-digital platform enables us to offer a larger selection of HD channels, faster Internet speeds and better picture quality while providing greater plant security and lower transaction costs.
In 2014, we launched, in one market, Spectrum Guide
®
, a network, or “cloud,” based user interface designed to enable our customers to enjoy a common user interface with a state-of-the-art video experience on all existing and future set-top boxes. We plan to continue to deploy and enhance this technology in 2015.
For set-top boxes, we are implementing a video conditional access strategy utilizing our downloadable security on a set-top box specified by us which can be manufactured by many different manufacturers. We expect to roll out downloadable security throughout our current systems to be retained after the Transactions. Where we roll out downloadable security, we will utilize the Worldbox, and we expect to introduce Spectrum Guide
®
at that time as well. Our Spectrum Guide
®
will deliver an improved guide on all boxes. We believe Worldbox utilizing downloadable security along with the introduction of Spectrum Guide
®
will reduce our incremental set top box costs and allow for a consistent service for all of our customers and on all of their televisions with a service that is rich in HD, has modern search and discovery features and is capable of improved implementation of future enhancements.
Management, Customer Care and Marketing
Our operations are centralized with our corporate office responsible for coordinating and overseeing operations including establishing company-wide strategies, policies and procedures. Sales and marketing, network operations, field operations, customer care, engineering, advertising sales, human resources, legal, government relations, information technology and finance are all directed at the corporate level. Regional and local field operations are responsible for servicing customers and maintenance and construction of outside plant.
Charter continues to focus on improving the customer experience through improvements to our customer care processes, product offerings and the quality and reliability of our service. Our customer care centers are managed centrally. We have twelve internal customer care locations which route calls to the appropriate agents, plus several third-party call center locations that through technology and procedures function as an integrated system. We increased the portion of service calls handled by Charter employees in 2014 and intend to continue to do so in 2015. We also utilize our website to enable our customers to view and pay their bills on-line, obtain information regarding their account or services, and perform various equipment troubleshooting procedures. Our customers may also obtain support through our on-line chat functionality.
Our marketing strategy emphasizes our bundled services through targeted direct response marketing programs to existing and potential customers and increases awareness and value of the Charter brand. In 2014, Charter rolled out Charter Spectrum®, our new, national brand platform. Charter Spectrum® represents our combined video, Internet and voice offering for residential customers. This new brand reflects our comprehensive approach to industry-leading products, driven by speed, performance and innovation. Marketing expenditures increased by
$41 million
, or
8%
, over the year ended
December 31, 2013
to
$529 million
for the year ended
December 31, 2014
as a result of the acquisition of Bresnan in July 2013, heavier sales activity and sales channel development and higher commercial marketing. Our marketing organization creates and executes marketing programs intended to increase customers, retain existing customers and cross-sell additional products to current customers. We monitor the effectiveness of our marketing efforts, customer perception, competition, pricing, and service preferences, among other factors, to increase our responsiveness to our customers. Our marketing organization also manages and directs several sales channels including direct sales, on-line, outbound telemarketing and Charter stores.
8
Programming
General
We believe that offering a wide variety of programming influences a customer’s decision to subscribe to and retain our cable services. We rely on our experience in programming cable systems, which includes market research, customer demographics and local programming preferences to determine channel offerings in each of our markets. We obtain basic and premium programming from a number of suppliers, usually pursuant to written contracts. Our programming contracts generally continue for a fixed period of time, usually from three to eight years, and are subject to negotiated renewal. Some programming suppliers offer financial incentives to support the launch of a channel and/or ongoing marketing support. We also negotiate volume discount pricing structures. We have more recently negotiated for additional content rights allowing us to provide programming on-line to our authenticated customers.
Costs
Programming is usually made available to us for a license fee, which is generally paid based on the number of customers to whom we make such programming available. Programming costs are usually payable each month based on calculations performed by us and are generally subject to annual cost escalations and may be subject to audits by the programmers. Programming license fees may include “volume” discounts available for higher numbers of customers, as well as discounts for channel placement or service penetration. Some channels are available without cost to us for a limited period of time, after which we pay for the programming. For home shopping channels, we receive a percentage of the revenue attributable to our customers’ purchases, as well as, in some instances, incentives for channel placement.
Our programming costs have increased in every year we have operated in excess of customary inflationary and cost-of-living type increases. We expect them to continue to increase due to a variety of factors including amounts paid for retransmission consent, annual increases imposed by programmers with additional selling power as a result of media consolidation, and carriage of incremental programming, including new sports services and on-line linear services and video on demand programming. In particular, programming costs are increasing as a result of significant sports programming cost increases over the past several years and the demands of large media companies who link carriage of their most popular networks to carriage and cost increases for all of their networks. In addition, contracts to purchase sports programming sometimes provide for optional additional games to be added to the service and made available on a surcharge basis during the term of the contract. Programmers continue to create new networks and migrate popular programming, such as sporting events to those networks. Spreading popular programming across more networks often results in us having to pay more for a suite of networks offered by any one programmer. Finally, programmers have experienced declines in demand for advertising as advertisers shift more of their marketing spend online. We believe this results in programmers demanding higher programming fees from us as programmers seek to recover revenue they are losing to online advertising.
Federal law allows commercial television broadcast stations to make an election between “must-carry” rights and an alternative “retransmission-consent” regime. When a station opts for the retransmission-consent regime, we are not allowed to carry the station’s signal without the station’s permission. Continuing demands by owners of broadcast stations for cash payments at substantial increases over amounts paid in prior years in exchange for retransmission consent will increase our programming costs or require us to cease carriage of popular programming, potentially leading to a loss of customers in affected markets.
Over the past several years, increases in our video service rates have not fully offset increasing programming costs, and with the impact of increasing competition and other marketplace factors, we do not expect them to do so in the foreseeable future. Although we pass along a portion of amounts paid for retransmission consent to the majority of our customers, our inability to fully pass these programming cost increases on to our video customers has had and is expected in the future to have an adverse impact on our cash flow and operating margins associated with the video product.
In order to mitigate reductions of our operating margins due to rapidly increasing programming costs, we continue to review our pricing and programming packaging strategies, and we plan to continue to migrate certain program services from our basic level of service to our digital tiers, remove underperforming services and limit the launch of non-essential, new networks.
We have programming contracts that have expired and others that will expire at or before the end of 2015. We will seek to renegotiate the terms of these agreements. There can be no assurance that these agreements will be renewed on favorable or comparable terms. To the extent that we are unable to reach agreement with certain programmers on terms that we believe are reasonable, we have been, and may in the future be, forced to remove such programming channels from our line-up, which may result in a loss of customers.
9
Franchises
As of
December 31, 2014
, our systems operated pursuant to a total of approximately 3,300 franchises, permits, and similar authorizations issued by local and state governmental authorities. Such governmental authorities often must approve a transfer to another party. Most franchises are subject to termination proceedings in the event of a material breach. In addition, most franchises require us to pay the granting authority up to 5.0% of revenues as defined in the various agreements, which is the maximum amount that may be charged under the applicable federal law. We are entitled to and generally do pass this fee through to the customer.
Prior to the scheduled expiration of most franchises, we generally initiate renewal proceedings with the granting authorities. This process usually takes three years but can take a longer period of time. The Communications Act of 1934, as amended (the “Communications Act”), which is the primary federal statute regulating interstate communications, provides for an orderly franchise renewal process in which granting authorities may not unreasonably withhold renewals. In connection with the franchise renewal process, many governmental authorities require the cable operator to make certain commitments, such as building out certain of the franchise areas, customer service requirements, and supporting and carrying public access channels. Historically, we have been able to renew our franchises without incurring significant costs, although any particular franchise may not be renewed on commercially favorable terms or otherwise. If we fail to obtain renewals of franchises representing a significant number of our customers, it could have a material adverse effect on our consolidated financial condition, results of operations, or our liquidity, including our ability to comply with our debt covenants. See “— Regulation and Legislation — Video Services — Franchise Matters.”
Markets
We operate in geographically diverse areas which are organized in regional clusters we call key market areas. These key market areas are managed centrally on a consolidated level. Our twelve key market areas and the customer relationships within each market as of
December 31, 2014
are as follows (in thousands):
|
Key Market Area
|
Total Customer Relationships
|
|
|
Alabama/Georgia
|
666
|
|
|
California
|
638
|
|
|
Carolinas
|
614
|
|
|
Central States
|
643
|
|
|
Michigan
|
658
|
|
|
Minnesota/Nebraska
|
359
|
|
|
Mountain States
|
394
|
|
|
New England
|
371
|
|
|
Northwest
|
531
|
|
|
Tennessee/Louisiana
|
553
|
|
|
Texas
|
205
|
|
|
Wisconsin
|
595
|
|
Competition
We face competition for both residential and commercial customers in the areas of price, service offerings, and service reliability. In our residential business, we compete with other providers of video, high-speed Internet access, voice services, and other sources of home entertainment. In our commercial business, we compete with other providers of video, high-speed Internet access and related value-added services, fiber solutions, business telephony, and Ethernet services. We operate in a competitive business environment, which can adversely affect the results of our business and operations. We cannot predict the impact on us of broadband services offered by our competitors.
In terms of competition for customers, we view ourselves as a member of the broadband communications industry, which encompasses multi-channel video for television and related broadband services, such as high-speed Internet, voice, and other interactive video services. In the broadband communications industry, our principal competitors for video services are direct
10
broadcast satellite (“DBS”) and telephone companies that offer video services. Our principal competitors for high-speed Internet services are the broadband services provided by telephone companies, including both traditional DSL, fiber-to-the-node, and fiber-to-the-home offerings. Our principal competitors for voice services are established telephone companies, other telephone service providers, and other carriers, including VoIP providers. At this time, we do not consider other traditional cable operators to be significant competitors in our overall market, as overbuilds are infrequent and geographically spotty (although in any particular market, a cable operator overbuilder would likely be a significant competitor at the local level). We could, however, face additional competition from other cable operators if they began distributing video over the Internet to customers residing outside their current territories.
Our key competitors include:
DBS
Direct broadcast satellite is a significant competitor to cable systems. The two largest DBS providers now serve more than 34 million subscribers nationwide. DBS service allows the subscriber to receive video services directly via satellite using a dish antenna.
Video compression technology and high powered satellites allow DBS providers to offer more than 280 digital channels. In 2014, major DBS competitors were especially competitive with promotional pricing for more basic services. While we continue to believe that the initial investment by a DBS customer exceeds that of a cable customer, the initial equipment cost for DBS has decreased substantially, as the DBS providers have aggressively marketed offers to new customers of incentives for discounted or free equipment, installation, and multiple units. DBS providers are able to offer service nationwide and are able to establish a national image and branding with standardized offerings, which together with their ability to avoid franchise fees of up to 5% of revenues and property tax, leads to greater efficiencies and lower costs in the lower tiers of service. We believe that cable-delivered video on demand and subscription video on demand services, which include HD programming, are superior to DBS service, because cable headends can provide communication to deliver many titles which customers can access and control independently, whereas DBS technology can only make available a much smaller number of titles with DVR-like customer control. DBS providers have also made attempts at deployment of Internet access services via satellite, but those services have been technically constrained and of limited appeal.
Telephone Companies and Utilities
Incumbent telephone companies, including AT&T Inc. (“AT&T”) and Verizon Communications, Inc. ("Verizon"), offer video and other services in competition with us, and we expect they will increasingly do so in the future. These companies are able to offer and provide two-way video, data services and digital voice services that are similar to ours in various portions of their networks. In the case of Verizon, its high-speed data services (fiber optic service (“FiOS”)) offer speeds as high as or higher than ours. In addition, these companies continue to offer their traditional telephone services, as well as service bundles that include wireless voice services provided by affiliated companies. Based on internal estimates, we believe that AT&T and Verizon are offering video services in areas serving approximately
30%
and
4%
, respectively, of our estimated passings and we have experienced customer losses in these areas. AT&T and Verizon have also launched campaigns to capture more of the multiple dwelling unit (“MDU”) market. When AT&T or Verizon have introduced or expanded their offering of video products in our market areas, we have seen a decrease in our video revenue as AT&T and Verizon typically roll out aggressive marketing and discounting campaigns to launch their products. Additionally, in May 2014, AT&T announced its intention to acquire DirecTV, the nation’s largest DBS provider. If completed, this transaction will create an even larger competitor for Charter’s video services that will have the ability to expand its video service offerings to include bundled wireless offerings.
In addition to incumbent telephone companies obtaining video franchises or alternative authorizations in some areas, and seeking them in others, they have been successful through various means in reducing or streamlining the video franchising requirements applicable to them. They have had significant success at the federal and state level in securing FCC rulings and numerous statewide video franchise laws that facilitate telephone company entry into the video marketplace. Because telephone companies have been successful in avoiding or reducing franchise and other regulatory requirements that remain applicable to cable operators like us, their competitive posture has often been enhanced. The large scale entry of incumbent telephone companies as direct competitors in the video marketplace has adversely affected the profitability and valuation of our cable systems.
Most telephone companies, including AT&T and Verizon, which already have plant, an existing customer base, and other operational functions in place (such as billing and service personnel), offer Internet access via traditional DSL service. DSL service allows Internet access to subscribers at data transmission speeds greater than those formerly available over conventional telephone lines. We believe DSL service is an alternative to our high-speed Internet service and is often offered at prices lower than our Internet services, although typically at speeds lower than the speeds we offer. DSL providers may currently be in a better position to offer
11
voice and data services to businesses since their networks tend to be more complete in commercial areas. We expect DSL to remain a significant competitor to our high-speed Internet services.
Many large incumbent telephone companies also provide fiber-to-the-node or fiber-to-the-home services in select areas of their footprints. Fiber-to-the-node networks can provide faster Internet speeds than conventional DSL, but still cannot typically match our Internet speeds. Our primary fiber-to-the-node competitor is AT&T's U-verse. The competition from U-verse is expected to intensify over time as AT&T completes an expansion based on plans announced in late 2012 by the end of 2015. Fiber-to-the-home networks, however, can provide Internet speeds equal to or greater than Charter's current Internet speeds. Verizon's FiOS is the primary fiber-to-the-home competitor, although AT&T has also begun fiber-to-the home builds as well.
Our voice service competes directly with incumbent telephone companies and other carriers, including Internet-based VoIP providers, for both residential and commercial voice service customers. Because we offer voice services, we are subject to considerable competition from such companies and other telecommunications providers, including wireless providers, with an increasing number of consumers choosing wireless over wired telephone services. The telecommunications and voice services industry is highly competitive and includes competitors with greater financial and personnel resources, strong brand name recognition, and long-standing relationships with regulatory authorities and customers. Moreover, mergers, joint ventures and alliances among our competitors have resulted in providers capable of offering cable television, Internet, and voice services in direct competition with us.
Additionally, we are subject to limited competition from utilities and/or municipal utilities that possess fiber optic transmission lines capable of transmitting signals with minimal signal distortion. Certain of these utilities are also developing broadband over power line technology, which may allow the provision of Internet, phone and other broadband services to homes and offices.
Traditional Overbuilds
Cable systems are operated under non-exclusive franchises historically granted by state and local authorities. More than one cable system may legally be built in the same area. Franchising authorities may grant a second franchise to another cable operator that may contain terms and conditions more favorable than those afforded us. Well-financed businesses from outside the cable industry, such as public utilities that already possess fiber optic and other transmission lines in the areas they serve, have in some cases become competitors. There are a number of cities that have constructed their own cable systems, in a manner similar to city-provided utility services. There also has been interest in traditional cable overbuilds by private companies not affiliated with established local exchange carriers. Constructing a competing cable system is a capital intensive process which involves a high degree of risk. We believe that in order to be successful, a competitor’s overbuild would need to be able to serve the homes and businesses in the overbuilt area with equal or better service quality, on a more cost-effective basis than we can. Any such overbuild operation would require access to capital or access to facilities already in place that are capable of delivering cable television programming. We cannot predict the extent to which additional overbuild situations may occur.
Broadcast Television
Cable television has long competed with broadcast television, which consists of television signals that the viewer is able to receive without charge using an “off-air” antenna. The extent of such competition is dependent upon the quality and quantity of broadcast signals available through “off-air” reception, compared to the services provided by the local cable system. Traditionally, cable television has provided higher picture quality and more channel offerings than broadcast television. However, the recent licensing of digital spectrum by the FCC now provides traditional broadcasters with the ability to deliver HD television pictures and multiple digital-quality program streams, as well as advanced digital services such as subscription video and data transmission.
Internet Delivered Video
Internet access facilitates the streaming of video, including movies and television shows, into homes and businesses. Online video services include those offered by Hulu, Netflix, Amazon and Apple. Increasingly, content owners are using Internet-based delivery of content directly to consumers, some without charging a fee to access the content. Further, due to consumer electronic innovations, consumers are able to watch such Internet-delivered content on televisions, personal computers, tablets, gaming boxes connected to televisions and mobile devices. Recently, HBO and CBS announced plans to sell their programming direct to consumers over the Internet. DISH Network has also announced Sling TV which will include ESPN among other programming, and Sony has announced Playstation Vue which is expected to include 75 channels to be launched in the first quarter of 2015. We believe some customers have chosen or will choose to receive video over the Internet rather than through our video on demand and subscription video services, thereby reducing our video revenues. We cannot predict the impact that Internet delivered video will have on our revenues and adjusted EBITDA as technologies continue to evolve.
12
Private Cable
Additional competition is posed by satellite master antenna television systems, or SMATV systems, serving MDUs, such as condominiums, apartment complexes, and private residential communities. Private cable systems can offer improved reception of local television stations, and many of the same satellite-delivered program services that are offered by cable systems. Although disadvantaged from a programming cost perspective, SMATV systems currently benefit from operating advantages not available to franchised cable systems, including fewer regulatory burdens and no requirement to service low density or economically depressed communities. The FCC previously adopted regulations that favor SMATV and private cable operators serving MDU complexes, allowing them to continue to secure exclusive contracts with MDU owners. This regulatory disparity provides a competitive advantage to certain of our current and potential competitors.
Other Competitors
Local wireless Internet services operate in some markets using available unlicensed radio spectrum. Various wireless phone companies are now offering third and fourth generation (3G and 4G) wireless high-speed Internet services. In addition, a growing number of commercial areas, such as retail malls, restaurants and airports, offer Wi-Fi Internet service. Numerous local governments are also considering or actively pursuing publicly subsidized Wi-Fi Internet access networks. Operators are also marketing PC cards and “personal hotspots” offering wireless broadband access to their cellular networks. These service options offer another alternative to cable-based Internet access.
Seasonality and Cyclicality
Our business is subject to seasonal and cyclical variations. Our results are impacted by the seasonal nature of customers receiving our cable services in college and vacation markets. Our revenue is subject to cyclical advertising patterns and changes in viewership levels. Our U.S. advertising revenue is generally higher in the second and fourth calendar quarters of each year, due in part to increases in consumer advertising in the spring and in the period leading up to and including the holiday season. U.S. advertising revenue is also cyclical, benefiting in even-numbered years from advertising related to candidates running for political office and issue-oriented advertising.
Regulation and Legislation
The following summary addresses the key regulatory and legislative developments affecting the cable industry and our three primary services for both residential and commercial customers: video service, Internet service, and voice service. Cable system operations are extensively regulated by the federal government (primarily the FCC), certain state governments, and many local governments. A failure to comply with these regulations could subject us to substantial penalties. Our business can be dramatically impacted by changes to the existing regulatory framework, whether triggered by legislative, administrative, or judicial rulings. Congress and the FCC have frequently revisited the subject of communications regulation and they are likely to do so again in the future. We could be materially disadvantaged in the future if we are subject to new regulations that do not equally impact our key competitors. We cannot provide assurance that the already extensive regulation of our business will not be expanded in the future.
Video
Service
Cable Rate Regulation.
Federal regulations currently restrict the prices that cable systems charge for the minimum level of video programming service, referred to as “basic service,” and associated equipment. All other video service offerings are now universally exempt from rate regulation. Although basic service rate regulation operates pursuant to a federal formula, local governments, commonly referred to as local franchising authorities, are primarily responsible for administering this regulation. The majority of our local franchising authorities have never been certified to regulate basic service cable rates (and order rate reductions and refunds), but they generally retain the right to do so (subject to potential regulatory limitations under state franchising laws), except in those specific communities facing “effective competition,” as defined under federal law. We have secured FCC recognition of effective competition, and become rate deregulated, in many of our communities.
There have been frequent calls to impose expanded rate regulation on the cable industry. Confronted with rapidly increasing cable programming costs, it is possible that Congress may adopt new constraints on the retail pricing or packaging of cable programming. Any such constraints could adversely affect our operations.
Federal rate regulations include certain marketing restrictions that could affect our pricing and packaging of service tiers and equipment. As we attempt to respond to a changing marketplace with competitive pricing practices, we may face regulations that impede our ability to compete.
13
Must Carry/Retransmission Consent.
There are two alternative legal methods for carriage of local broadcast television stations on cable systems. Federal “must carry” regulations require cable systems to carry local broadcast television stations upon the request of the local broadcaster. Alternatively, federal law includes “retransmission consent” regulations, by which popular commercial television stations can prohibit cable carriage unless the cable operator first negotiates for “retransmission consent,” which may be conditioned on significant payments or other concessions. Congress passed legislation in 2014 imposing certain restrictions on broadcasters’ exercise of retransmission consent authority and directing the FCC to review aspects of its existing retransmission consent rules. Popular stations invoking “retransmission consent” have been demanding substantial compensation increases in their recent negotiations with cable operators, thereby significantly increasing our operating costs.
Additional government-mandated broadcast carriage obligations could disrupt existing programming commitments, interfere with our preferred use of limited channel capacity, and limit our ability to offer services that appeal to our customers and generate revenues.
Access Channels.
Local franchise agreements often require cable operators to set aside certain channels for public, educational, and governmental access programming. Federal law also requires cable systems to designate up to 15% of their channel capacity for commercial leased access by unaffiliated third parties, who may offer programming that our customers do not particularly desire. The FCC adopted revised rules in 2007 mandating a significant reduction in the rates that operators can charge commercial leased access users and imposing additional administrative requirements that would be burdensome on the cable industry. The effect of the FCC's revised rules was stayed by a federal court, pending a cable industry appeal and an adverse finding by the Office of Management and Budget. Although commercial leased access activity historically has been relatively limited, increased activity in this area could further burden the channel capacity of our cable systems.
Ownership Restrictions.
Federal regulation of the communications field traditionally included a host of ownership restrictions, which limited the size of certain media entities and restricted their ability to enter into competing enterprises. Through a series of legislative, regulatory, and judicial actions, most of these restrictions have been either eliminated or substantially relaxed. Changes in this regulatory area could alter the business environment in which we operate.
Pole Attachments.
The Communications Act requires most utilities owning utility poles to provide cable systems with access to poles and conduits and simultaneously subjects the rates charged for this access to either federal or state regulation. In 2011, the FCC amended its existing pole attachment rules to promote broadband deployment. The 2011 order allows for new penalties in certain cases involving unauthorized attachments, but generally strengthens the cable industry's ability to access investor-owned utility poles on reasonable rates, terms, and conditions. It specifically maintains the basic rate formula applicable to “cable” attachments, but reduces the rate formula previously applicable to “telecommunications” attachments. Although the order maintains the status quo treatment of cable-provided VoIP service as an unclassified service eligible for the favorable cable rate, the issue has not been fully resolved by the FCC, and a potential change in classification in a pending proceeding (as well as an unresolved dispute over the telecommunications rate calculation) could adversely impact our pole attachment rates.
Cable Equipment.
In 1996, Congress enacted a statute requiring the FCC to adopt regulations designed to assure the development of an independent retail market for “navigation devices,” such as cable set-top boxes. As a result, the FCC required cable operators to make a separate offering of security modules (
i.e
., a “CableCARD”) that can be used with retail navigation devices. Some of the FCC’s rules requiring support for CableCARDs were vacated by the United States Court of Appeals for the District of Columbia in 2013. The FCC had also adopted an “integration ban,” which had required cable operators to use CableCARDs in all of their new set-top boxes. In April 2013, Charter received a two-year waiver from the FCC’s “integration ban,” on the condition that Charter meet certain milestones regarding downloadable security by the end of the waiver period. This waiver affords Charter the ability to use lower-cost set-top boxes as it transitions to all-digital operations. In connection with our request for this waiver, Charter committed to continue to support CableCARDs and to follow the CableCARD-related rules that were struck down by the court in 2013. In December 2014, as part of the Satellite Television Extension and Localism Act Reauthorization Act of 2014 (“STELAR”), Congress repealed the integration ban, effective December 4, 2015, and extended the then-existing waivers, including Charter’s, through that date. STELAR also directed the FCC to establish within 45 days of enactment, a “working group of technical experts” to identify and report on downloadable security design options that are not unduly burdensome and that promote competition with respect to the availability of navigation devices. It is possible that the FCC could propose new equipment obligations as a result of the recommendation of this working group.
MDUs / Inside Wiring
. The FCC has adopted a series of regulations designed to spur competition to established cable operators in MDU complexes. These regulations allow our competitors to access certain existing cable wiring inside MDUs. The FCC also adopted regulations limiting the ability of established cable operators, like us, to enter into exclusive service contracts for MDU complexes. In their current form, the FCC’s regulations in this area favor our competitors.
14
Privacy
and Information Security Regulation
. The Communications Act limits our ability to collect and disclose subscribers’ personally identifiable information for our video, voice, and Internet services, as well as provides requirements to safeguard such information. We are subject to additional federal, state, and local laws and regulations that impose additional restrictions on the collection, use and disclosure of consumer, subscriber and employee information. Further, the FCC, FTC, and many states regulate and restrict the marketing practices of cable operators, including telemarketing and online marketing efforts. Various federal agencies, including the FTC, are now considering new restrictions affecting the use of personal and profiling data for online advertising.
Our operations are also subject to federal and state laws governing information security. In the event of an information security breach, such rules may require consumer and government agency notification and may result in regulatory enforcement actions with the potential of monetary forfeitures. The FCC has recently used the existing authority under its privacy and security requirements for voice services to bring enforcement actions against two companies for failing to protect customer data from unauthorized access by and disclosure to third parties, with proposed forfeitures totaling $10 million. Similarly, the FTC and state attorneys general regularly bring enforcement actions against companies related to information security breaches and privacy violations. Congress and several state legislatures are considering the adoption of new data security and cybersecurity legislation that could result in additional network and information security requirements for our business.
On February 12, 2014, the National Institute for Standards and Technologies ("NIST"), in cooperation with other federal agencies and owners and operators of U.S. critical infrastructure, released a voluntary framework that provides a prioritized and flexible model for organizations to identify and manage cyber risks inherent to their business. The NIST cybersecurity framework was directed by an Executive Order and a Presidential Policy Directive issued in 2013, and it is designed to supplement, not supersede, existing cybersecurity regulations and requirements. Several government agencies have encouraged compliance with the NIST cybersecurity framework, including the FCC, which is also considering expansion of its cybersecurity guidelines or the adoption of cybersecurity requirements. We cannot predict what proposals may be adopted or how new legislation and regulations, if any, would affect our business.
Other FCC Regulatory Matters.
FCC regulations cover a variety of additional areas, including, among other things: (1) equal employment opportunity obligations; (2) customer service standards; (3) technical service standards; (4) mandatory blackouts of certain network and syndicated programming; (5) restrictions on political advertising; (6) restrictions on advertising in children's programming; (7) licensing of systems and facilities; (8) maintenance of public files; (9) emergency alert systems; and (10) disability access, including new requirements governing video-description and closed-captioning. Each of these regulations restricts our business practices to varying degrees and may impose additional costs on our operations.
It is possible that Congress or the FCC will expand or modify its regulation of cable systems in the future, and we cannot predict at this time how that might impact our business.
Copyright.
Cable systems are subject to a federal copyright compulsory license covering carriage of television and radio broadcast signals. The possible modification or elimination of this compulsory copyright license is the subject of continuing legislative proposals and administrative review and could adversely affect our ability to obtain desired broadcast programming. The Copyright Office adopted final rules in 2014 implementing audit procedures for copyright owners to review operators’ copyright royalty reporting practices, and it is possible these audits could result in copyright owner demands for additional royalty fees.
Copyright clearances for non-broadcast programming services are arranged through private negotiations. Cable operators also must obtain music rights for locally originated programming and advertising from the major music performing rights organizations. These licensing fees have been the source of litigation in the past, and we cannot predict with certainty whether license fee disputes may arise in the future.
Franchise Matters.
Cable systems generally are operated pursuant to nonexclusive franchises granted by a municipality or other state or local government entity in order to utilize and cross public rights-of-way. Cable franchises generally are granted for fixed terms and in many cases include monetary penalties for noncompliance and may be terminable if the franchisee fails to comply with material provisions. The specific terms and conditions of cable franchises vary significantly between jurisdictions. Cable franchises generally contain provisions governing cable operations, franchise fees, system construction, maintenance, technical performance, customer service standards, and changes in the ownership of the franchisee. A number of states subject cable systems to the jurisdiction of centralized state government agencies, such as public utility commissions. Although local franchising authorities have considerable discretion in establishing franchise terms, certain federal protections benefit cable operators. For example, federal law caps local franchise fees and includes renewal procedures designed to protect incumbent franchisees from arbitrary denials of renewal. Even if a franchise is renewed, however, the local franchising authority may seek to impose new and more onerous requirements as a condition of renewal. Similarly, if a local franchising authority's consent is required for the
15
purchase or sale of a cable system, the local franchising authority may attempt to impose more burdensome requirements as a condition for providing its consent.
The traditional cable franchising regime has recently undergone significant change as a result of various federal and state actions. The FCC has adopted rules that streamline entry for new competitors (particularly those affiliated with telephone companies) and reduce certain franchising burdens for these new entrants. The FCC adopted more modest relief for existing cable operators.
At the same time, a substantial number of states have adopted new franchising laws. Again, these laws were principally designed to streamline entry for new competitors, and they often provide advantages for these new entrants that are not immediately available to existing cable operators. In many instances, these franchising regimes do not apply to established cable operators until the existing franchise expires or a competitor directly enters the franchise territory. The exact nature of these state franchising laws, and their varying application to new and existing video providers, will impact our franchising obligations and our competitive position.
Internet Service
On January 14, 2014, the D.C. Circuit Court of Appeals, in
Verizon v. FCC
, struck down major
portions of the FCC’s 2010 “net neutrality” rules governing the operating practices of broadband Internet access providers like us. The FCC originally designed the rules to ensure an “open Internet” and included three key requirements for broadband providers: (1) a prohibition against blocking websites or other online applications; (2) a prohibition against unreasonable discrimination among Internet users or among different websites or other sources of information; and (3) a transparency requirement compelling the disclosure of network management policies. The Court struck down the first two requirements, concluding that they constitute “common carrier” restrictions that are not permissible given the FCC’s earlier decision to classify Internet access as an “information service,” rather than a “telecommunications service.” The Court upheld the FCC’s transparency requirement and the FCC's authority to adopt regulations regarding the Internet.
On May 15, 2014, the FCC initiated a new rulemaking to issue new network neutrality regulations, potentially including a reclassification of broadband services as Title II common carrier services, which could subject our services to far more extensive and burdensome federal and state regulation. On February 4, 2015, the Chairman of the FCC released a fact sheet describing his proposed new rules. The Chairman's proposal reclassifies wireline and wireless broadband services as Title II common carrier services, and asserts legal authority to regulate broadband service offered by ISPs under Title II, Title III, and Section 706 of the Telecommunications Act. In an effort to protect consumers and edge providers, the new rules would prohibit ISPs from engaging in blocking, throttling, and paid prioritization, and the existing transparency rules would be enhanced. Reasonable network management activities would remain permitted. For the first time, the FCC would have authority to hear complaints and take enforcement action if it determines that the interconnection agreements of ISPs are not just and reasonable, or if ISPs fail to meet a new general obligation not to harm consumers or edge providers. The Chairman has proposed forbearing from certain Title II regulation, such as rate regulation, tariffs and last-mile unbundling. The Chairman of the FCC has indicated he intends to have the Commissioners vote on his proposal at the end of February 2015. As the FCC is made up of five Commissioners with three being Democrats, including the Chairman, it is likely the FCC will adopt the Chairman's proposed rules. If adopted, several broadband providers have already indicated their intention to challenge the regulations in court. There are also legislative proposals in Congress to preempt the Chairman’s proposed utility-style regulation, while still addressing many of the underlying concerns. We do not know at the current time if the new regulations proposed by the Chairman will go into effect, nor do we know how they would be administered, but they could limit our ability to efficiently manage our cable systems and respond to operational and competitive challenges.
As the Internet has matured, it has become the subject of increasing regulatory interest. Congress and federal regulators have adopted a wide range of measures directly or potentially affecting Internet use, including, for example, consumer privacy, copyright protections, defamation liability, taxation, obscenity, and unsolicited commercial e-mail. Our Internet services are subject to the Communications Assistance for Law Enforcement Act ("CALEA") requirements regarding law enforcement surveillance. Content owners are now seeking additional legal mechanisms to combat copyright infringement over the Internet. Pending and future legislation in this area could adversely affect our operations as an Internet service provider and our relationship with our Internet customers. Additionally, the FCC and Congress are considering subjecting Internet access services to the Universal Service funding requirements. These funding requirements could impose significant new costs on our high-speed Internet service. Also, the FCC and some state regulatory commissions direct certain subsidies to telephone companies deploying broadband to areas deemed to be “unserved” or “underserved.” Charter has opposed such subsidies when directed to areas that Charter serves. Despite Charter’s efforts, future subsidies may be directed to areas served by Charter, which could result in subsidized competitors operating in our service territories. State and local governmental organizations have also adopted Internet-related regulations. These various governmental jurisdictions are also considering additional regulations in these and other areas, such as privacy, pricing, service
16
and product quality, and taxation. The adoption of new Internet regulations or the adaptation of existing laws to the Internet could adversely affect our business.
The FCC is now considering whether online video distributors (“OVDs”) that offer programming to customers with a broadband Internet connection should be classified as multichannel video programming distributors (“MVPDs”), and thereby subject to the program access protections available to MVPDs, as well as some of the regulatory requirements applicable to MVPDs. The outcome of this proceeding, which could impact how OVDs compete in the future with traditional cable service, cannot be determined at the current time.
On January 29, 2015, the FCC, in a nation-wide proceeding evaluating whether “advanced broadband” is being deployed in a reasonable and timely fashion, increased the minimum connection speeds required to qualify as advanced broadband service to 25 Mbps for downloads and 3 Mbps for uploads. As a result, the FCC concluded that advanced broadband was not being sufficiently deployed and initiated a new inquiry into what steps it might take to encourage broadband deployment. This action may lead the FCC to adopt additional measures affecting our broadband business. At the same time, the FCC has ongoing proceedings to allocate additional spectrum for advanced wireless service, which could provide additional wireless competition to our broadband business.
The FCC is also currently considering two petitions from municipalities in North Carolina and Tennessee, respectively, seeking the preemption of state laws that restrict the ability of municipalities to construct and deploy broadband systems in competition with private offerings. The Chairman has proposed an order that grants the petitions. While such an order would only preempt the laws of the states at issue, municipalities in other states may seek similar relief. There are approximately 20 such state laws now in effect. FCC preemption would be predicated on the belief that such state laws are impeding the nation-wide deployment of broadband service. Any such action would likely be subject to appeal regarding the FCC’s preemptive authority, and Congress might also adopt legislation expressly limiting the FCC’s authority in this area. If the FCC does preempt state restrictions and that preemption is upheld, it could lead to increased competition from municipal-provided broadband.
Voice Service
The Telecommunications Act of 1996 created a more favorable regulatory environment for us to provide telecommunications and/or competitive voice services than had previously existed. In particular, it established requirements ensuring that competitive telephone companies could interconnect their networks with those providers of traditional telecommunications services to open the market to competition. The FCC has subsequently ruled that competitive telephone companies that support VoIP services, such as those we offer our customers, are entitled to interconnection with incumbent providers of traditional telecommunications services, which ensures that our VoIP services can compete in the market. Since that time, the FCC has initiated a proceeding to determine whether such interconnection rights should extend to traditional and competitive networks utilizing IP technology, and how to encourage the transition to IP networks throughout the industry. New rules or obligations arising from these proceedings may affect our ability to compete in the provision of voice services. On November 18, 2011, the FCC released an order significantly changing the rules governing intercarrier compensation payments for the termination of telephone traffic between carriers. The new rules will result in a substantial decrease in intercarrier compensation payments over a multi-year period. We received intercarrier compensation of approximately
$23 million
,
$21 million
and
$19 million
for the years ended
December 31, 2014
,
2013
and
2012
, respectively. The decreases over the multi-year transition will affect both the amounts that Charter pays to other carriers and the amounts that Charter receives from other carriers. The schedule and magnitude of these decreases, however, will vary depending on the nature of the carriers and the telephone traffic at issue, and the FCC's new ruling initiates further implementation rulemakings. We cannot yet predict with certainty the balance of the impact on Charter's revenues and expenses for voice services at particular times over this multi-year period.
Further regulatory changes are being considered that could impact our voice business and that of our primary telecommunications competitors. The FCC and state regulatory authorities are considering, for example, whether certain common carrier regulations traditionally applied to incumbent local exchange carriers should be modified or reduced, and the extent to which common carrier requirements should be extended to VoIP providers. The FCC has already determined that certain providers of voice services using Internet Protocol technology must comply with requirements relating to 911 emergency services (“E911”), the CALEA (the statute governing law enforcement access to and surveillance of communications), Universal Service Fund contributions, customer privacy and Customer Proprietary Network Information issues, number portability, network outage reporting, rural call completion, disability access, regulatory fees, and discontinuance of service. In March 2007, a federal appeals court affirmed the FCC’s decision concerning federal regulation of certain VoIP services, but declined to specifically find that VoIP service provided by cable companies, such as we provide, should be regulated only at the federal level. As a result, some states have begun proceedings to subject cable VoIP services to state level regulation. Although we have registered with, or obtained certificates or authorizations from the FCC and the state regulatory authorities in those states in which we offer competitive voice services in order to ensure
17
the continuity of our services and to maintain needed network interconnection arrangements, it is unclear whether and how these and other ongoing regulatory matters ultimately will be resolved.
In addition, in 2013 the FCC issued a broad data collection order that will require providers of point to point transport (“special access”) services, such as Charter, to produce information to the agency concerning the rates, terms and conditions of these services. The FCC will use the data to evaluate whether the market for such services is competitive, or whether the market should be subject to further regulation, which may increase our costs or constrain our ability to compete in this market. The FCC is also considering recommendations to select a new national local number portability administrator after the current administrator’s contract expires in June 2015. Any such change may impact our ability to manage number porting and related tasks.
Employees
As of
December 31, 2014
, we had approximately 23,200 full-time equivalent employees. At
December 31, 2014
, approximately 140 of our employees were represented by collective bargaining agreements. We have never experienced a work stoppage.
Item 1A.
Risk Factors.
Risks Related to Our Indebtedness
We have a significant amount of debt and may incur significant additional debt, including secured debt, in the future, which could adversely affect our financial health and our ability to react to changes in our business.
We have a significant amount of debt and may (subject to applicable restrictions in our debt instruments) incur additional debt in the future. As of
December 31, 2014
, our total principal amount of debt was approximately
$21.1 billion
, including $7.0 billion of debt for which proceeds are held in escrow pending consummation of the Transactions.
Our significant amount of debt could have consequences, such as:
|
•
|
impact our ability to raise additional capital at reasonable rates, or at all;
|
|
•
|
make us vulnerable to interest rate increases, because approximately
28%
of our borrowings are, and may continue to be, subject to variable rates of interest;
|
|
•
|
expose us to increased interest expense to the extent we refinance existing debt with higher cost debt;
|
|
•
|
require us to dedicate a significant portion of our cash flow from operating activities to make payments on our debt, reducing our funds available for working capital, capital expenditures, and other general corporate expenses;
|
|
•
|
limit our flexibility in planning for, or reacting to, changes in our business, the cable and telecommunications industries, and the economy at large;
|
|
•
|
place us at a disadvantage compared to our competitors that have proportionately less debt; and
|
|
•
|
adversely affect our relationship with customers and suppliers.
|
If current debt amounts increase, the related risks that we now face will intensify.
The agreements and instruments governing our debt contain restrictions and limitations that could significantly affect our ability to operate our business, as well as significantly affect our liquidity.
Our credit facilities and the indentures governing our debt contain a number of significant covenants that could adversely affect our ability to operate our business, our liquidity, and our results of operations. These covenants restrict, among other things, our and our subsidiaries’ ability to:
|
•
|
incur additional debt;
|
|
•
|
repurchase or redeem equity interests and debt;
|
|
•
|
issue equity;
|
|
•
|
make certain investments or acquisitions;
|
|
•
|
pay dividends or make other distributions;
|
|
•
|
dispose of assets or merge;
|
|
•
|
enter into related party transactions; and
|
|
•
|
grant liens and pledge assets.
|
Additionally, the Charter Operating credit facilities require Charter Operating to comply with a maximum total leverage covenant and a maximum first lien leverage covenant. The breach of any covenants or obligations in our indentures or credit facilities, not
18
otherwise waived or amended, could result in a default under the applicable debt obligations and could trigger acceleration of those obligations, which in turn could trigger cross defaults under other agreements governing our long-term indebtedness. In addition, the secured lenders under the Charter Operating credit facilities could foreclose on their collateral, which includes equity interests in our subsidiaries, and exercise other rights of secured creditors.
We depend on generating sufficient cash flow to fund our debt obligations, capital expenditures, and ongoing operations.
We are dependent on our cash on hand and cash flow from operations to fund our debt obligations, capital expenditures and ongoing operations.
Our ability to service our debt and to fund our planned capital expenditures and ongoing operations will depend on our ability to continue to generate cash flow and our access (by dividend or otherwise) to additional liquidity sources at the applicable obligor. Our ability to continue to generate cash flow is dependent on many factors, including:
|
•
|
our ability to sustain and grow revenues and cash flow from operations by offering video, Internet, voice, advertising and other services to residential and commercial customers, to adequately meet the customer experience demands in our markets and to maintain and grow our customer base, particularly in the face of increasingly aggressive competition, the need for innovation and the related capital expenditures;
|
|
•
|
the impact of competition from other market participants, including but not limited to incumbent telephone companies, direct broadcast satellite operators, wireless broadband and telephone providers, DSL providers, video provided over the Internet and providers of advertising over the Internet;
|
|
•
|
general business conditions, economic uncertainty or downturn, high unemployment levels and the level of activity in the housing sector;
|
|
•
|
our ability to obtain programming at reasonable prices or to raise prices to offset, in whole or in part, the effects of higher programming costs (including retransmission consents);
|
|
•
|
the development and deployment of new products and technologies; and
|
|
•
|
the effects of governmental regulation on our business or potential business combination transactions.
|
Some of these factors are beyond our control. If we are unable to generate sufficient cash flow or we are unable to access additional liquidity sources, we may not be able to service and repay our debt, operate our business, respond to competitive challenges, or fund our other liquidity and capital needs.
Restrictions in our subsidiaries' debt instruments and under applicable law limit their ability to provide funds to us and our subsidiaries that are debt issuers.
Our primary assets are our equity interests in our subsidiaries. Our operating subsidiaries are separate and distinct legal entities and are not obligated to make funds available to their debt issuer holding companies for payments on our notes or other obligations in the form of loans, distributions, or otherwise. Charter Operating’s ability to make distributions to us, CCOH Safari or CCO Holdings, our other primary debt issuers, to service debt obligations is subject to its compliance with the terms of its credit facilities, and restrictions under applicable law. See “Part II. Item 7. Management’s Discussion and Analysis of Financial Condition and Results of Operations — Liquidity and Capital Resources — Limitations on Distributions” and “— Summary of Restrictive Covenants of Our Notes – Restrictions on Distributions.” Under the Delaware Limited Liability Company Act (the “Act”), our subsidiaries may only make distributions if the relevant entity has “surplus” as defined in the Act. Under fraudulent transfer laws, our subsidiaries may not pay dividends if the relevant entity is insolvent or is rendered insolvent thereby. The measures of insolvency for purposes of these fraudulent transfer laws vary depending upon the law applied in any proceeding to determine whether a fraudulent transfer has occurred. Generally, however, an entity would be considered insolvent if:
|
•
|
the sum of its debts, including contingent liabilities, was greater than the fair saleable value of all its assets;
|
|
•
|
the present fair saleable value of its assets was less than the amount that would be required to pay its probable liability on its existing debts, including contingent liabilities, as they become absolute and mature; or
|
|
•
|
it could not pay its debts as they became due.
|
While we believe that our relevant subsidiaries currently have surplus and are not insolvent, these subsidiaries may become insolvent in the future. Our direct or indirect subsidiaries include the borrowers under the CCO Safari credit facility and the borrowers and guarantors under the Charter Operating credit facilities. CCOH Safari and CCO Holdings are each an obligor under their respective senior notes. As of
December 31, 2014
, our total principal amount of debt was approximately
$21.1 billion
, including $7.0 billion of debt for which proceeds are held in escrow pending consummation of the Transactions.
19
In the event of bankruptcy, liquidation, or dissolution of one or more of our subsidiaries, that subsidiary's assets would first be applied to satisfy its own obligations, and following such payments, such subsidiary may not have sufficient assets remaining to make payments to its parent company as an equity holder or otherwise. In that event:
|
•
|
the lenders under Charter Operating's credit facilities, whose interests are secured by substantially all of our operating assets, and all holders of other debt of CCOH Safari, CCO Holdings, Charter Operating and CCO Safari, will have the right to be paid in full before us from any of our subsidiaries' assets; and
|
|
•
|
CCH I, the holder of preferred membership interests in our subsidiary, CC VIII, would have a claim on a portion of CC VIII’s assets that may reduce the amounts available for repayment to holders of CCO Holdings' and CCOH Safari's outstanding notes.
|
All of our outstanding debt is subject to change of control provisions. We may not have the ability to raise the funds necessary to fulfill our obligations under our indebtedness following a change of control, which would place us in default under the applicable debt instruments.
We may not have the ability to raise the funds necessary to fulfill our obligations under our notes and our credit facilities following a change of control. Under the indentures governing our notes, upon the occurrence of specified change of control events, the debt issuer is required to offer to repurchase all of its outstanding notes. However, we may not have sufficient access to funds at the time of the change of control event to make the required repurchase of the applicable notes, and Charter Operating is limited in its ability to make distributions or other payments to any debt issuer to fund any required repurchase. In addition, a change of control under the Charter Operating credit facilities would result in a default under those credit facilities. Because such credit facilities are obligations of Charter Operating, the credit facilities would have to be repaid before Charter Operating's assets could be available to CCO Holdings or CCOH Safari to repurchase their notes. Any failure to make or complete a change of control offer would place CCO Holdings or CCOH Safari in default under its notes. The failure of our subsidiaries to make a change of control offer or repay the amounts accelerated under their notes and credit facilities would place them in default.
Risks Related to Our Business
We operate in a very competitive business environment, which affects our ability to attract and retain customers and can adversely affect our business, operations and financial results.
The industry in which we operate is highly competitive and has become more so in recent years. In some instances, we compete against companies with fewer regulatory burdens, better access to financing, greater personnel resources, greater resources for marketing, greater and more favorable brand name recognition, and long-established relationships with regulatory authorities and customers. Increasing consolidation in the cable industry and the repeal of certain ownership rules have provided additional benefits to certain of our competitors, either through access to financing, resources, or efficiencies of scale. We could also face additional competition from multi-channel video providers if they began distributing video over the Internet to customers residing outside their current territories.
Our principal competitors for video services throughout our territory are DBS providers. The two largest DBS providers are DirecTV and DISH Network. Competition from DBS, including intensive marketing efforts with aggressive pricing, exclusive programming and increased HD broadcasting has had an adverse impact on our ability to retain customers. DBS companies have also expanded their activities in the MDU market.
Telephone companies, including two major telephone companies, AT&T and Verizon, offer video and other services in competition with us, and we expect they will increasingly do so in the future. Upgraded portions of these networks carry two-way video, data services and provide digital voice services similar to ours. In the case of Verizon, FIOS high-speed data services offer speeds as high as or higher than ours. In addition, these companies continue to offer their traditional telephone services, as well as service bundles that include wireless voice services provided by affiliated companies. Based on our internal estimates, we believe that AT&T and Verizon are offering video services in areas serving approximately
30%
and
4%
, respectively, of our estimated passings and we have experienced customer losses in these areas. AT&T and Verizon have also launched campaigns to capture more of the MDU market. AT&T has publicly stated that it expects to roll out its video product beyond the territories currently served although it is unclear where and to what extent. When AT&T or Verizon have introduced or expanded their offering of video products in our market areas, we have seen a decrease in our video revenue as AT&T and Verizon typically roll out aggressive marketing and discounting campaigns to launch their products. Additionally, in May 2014, AT&T announced its intention to acquire DirecTV, the nation’s largest DBS provider. If completed, this transaction will create an even larger competitor for Charter’s video services that will have the ability to expand its video service offerings to include bundled wireless offerings.
20
Due to consumer electronic innovations, content owners are allowing consumers to watch Internet-delivered content on televisions, personal computers, tablets, gaming boxes connected to televisions and mobile devices, some without charging a fee to access the content. Technological advancements, such as video-on-demand, new video formats, and Internet streaming and downloading, have increased the number of entertainment and information delivery choices available to consumers, and intensified the challenges posed by audience fragmentation. For example, online video services continue to offer consumers alternatives including Hulu, Netflix, Amazon and Apple. Recently, HBO and CBS announced plans to sell their programming direct to consumers over the Internet. DISH has also announced Sling TV which will include ESPN among other programming, and Sony has announced PlayStation Vue which is expected to include 75 TV channels to be launched in the first quarter of 2015. The increasing number of choices available to audiences could also negatively impact advertisers’ willingness to purchase advertising from us, as well as the price they are willing to pay for advertising.
With respect to our Internet access services, we face competition, including intensive marketing efforts and aggressive pricing, from telephone companies, primarily AT&T and Verizon, and other providers of DSL, fiber-to-the-node and fiber-to-the-home services. DSL service competes with our Internet service and is often offered at prices lower than our Internet services, although often at speeds lower than the speeds we offer. Fiber-to-the-node networks can provide faster Internet speeds than conventional DSL, but still cannot typically match our Internet speeds. Fiber-to-the-home networks, however, can provide Internet speeds equal to or greater than our current Internet speeds. In addition, in many of our markets, DSL providers have entered into co-marketing arrangements with DBS providers to offer service bundles combining video services provided by a DBS provider with DSL and traditional telephone and wireless services offered by the telephone companies and their affiliates. These service bundles offer customers similar pricing and convenience advantages as our bundles.
Continued growth in our residential voice business faces risks. The competitive landscape for residential and commercial telephone services is intense; we face competition from providers of Internet telephone services, as well as incumbent telephone companies. Further, we face increasing competition for residential voice services as more consumers in the United States are replacing traditional telephone service with wireless service. We expect to continue to price our voice product aggressively as part of our triple play strategy which could negatively impact our revenue from voice services to the extent we do not increase volume.
The existence of more than one cable system operating in the same territory is referred to as an overbuild. Overbuilds could adversely affect our growth, financial condition, and results of operations, by creating or increasing competition. We are aware of traditional overbuild situations impacting certain of our markets, however, we are unable to predict the extent to which additional overbuild situations may occur.
In order to attract new customers, from time to time we make promotional offers, including offers of temporarily reduced price or free service. These promotional programs result in significant advertising, programming and operating expenses, and also may require us to make capital expenditures to acquire and install customer premise equipment. Customers who subscribe to our services as a result of these offerings may not remain customers following the end of the promotional period. A failure to retain customers could have a material adverse effect on our business.
Mergers, joint ventures, and alliances among franchised, wireless, or private cable operators, DBS providers, local exchange carriers, and others, may provide additional benefits to some of our competitors, either through access to financing, resources, or efficiencies of scale, or the ability to provide multiple services in direct competition with us.
In addition to the various competitive factors discussed above, our business competes with all other sources of entertainment and information delivery, including broadcast television, movies, live events, radio broadcasts, home video products, console games, print media, and the Internet. If we do not respond appropriately to further increases in the leisure and entertainment choices available to consumers, our competitive position could deteriorate, and our financial results could suffer.
Our services may not allow us to compete effectively. Competition may reduce our expected growth of future cash flows which may contribute to future impairments of our franchises and goodwill and our ability to meet cash flow requirements, including debt service requirements.
Our exposure to the economic conditions of our current and potential customers, vendors and third parties could adversely affect our cash flow, results of operations and financial condition.
We are exposed to risks associated with the economic conditions of our current and potential customers, the potential financial instability of our customers and their financial ability to purchase our products. If there were a general economic downtown, we may experience increased cancellations by our customers or unfavorable changes in the mix of products purchased. These events have adversely affected us in the past, and may adversely affect our cash flow, results of operations and financial condition if a downturn were to occur.
21
In addition, we are susceptible to risks associated with the potential financial instability of the vendors and third parties on which we rely to provide products and services or to which we outsource certain functions. The same economic conditions that may affect our customers, as well as volatility and disruption in the capital and credit markets, also could adversely affect vendors and third parties and lead to significant increases in prices, reduction in output or the bankruptcy of our vendors or third parties upon which we rely. Any interruption in the services provided by our vendors or by third parties could adversely affect our cash flow, results of operation and financial condition.
We face risks inherent in our commercial business.
We may encounter unforeseen difficulties as we increase the scale of our service offerings to businesses. We sell Internet access, data networking and fiber connectivity to cellular towers and office buildings, video and business voice services to businesses and have increased our focus on growing this business. In order to grow our commercial business, we expect to continue investment in technology, equipment and personnel focused on the commercial business. Commercial business customers often require service level agreements and generally have heightened customer expectations for reliability of services. If our efforts to build the infrastructure to scale the commercial business are not successful, the growth of our commercial services business would be limited. We depend on interconnection and related services provided by certain third parties for the growth of our commercial business. As a result, our ability to implement changes as the services grow may be limited. If we are unable to meet these service level requirements or expectations, our commercial business could be adversely affected. Finally, we expect advances in communications technology, as well as changes in the marketplace and the regulatory and legislative environment. Consequently, we are unable to predict the effect that ongoing or future developments in these areas might have on our voice and commercial businesses and operations.
Programming costs are rising at a much faster rate than wages or inflation, and we may not have the ability to reduce or moderate the growth rates of, or pass on to our customers, our increasing programming costs, which would adversely affect our cash flow and operating margins.
Programming has been, and is expected to continue to be, our largest operating expense item. In recent years, the cable industry has experienced a rapid escalation in the cost of programming. We expect programming costs to continue to increase because of a variety of factors including amounts paid for retransmission consent, annual increases imposed by programmers with additional selling power as a result of media consolidation, incremental programming, including new sports services, out-of-home or non-linear programming and attempts by programmers to replace advertising revenue they are losing to online marketing options and as a result of declining viewership ratings. The inability to fully pass these programming cost increases on to our customers has had an adverse impact on our cash flow and operating margins associated with the video product. We have programming contracts that have expired and others that will expire at or before the end of 2015. There can be no assurance that these agreements will be renewed on favorable or comparable terms. To the extent that we are unable to reach agreement with certain programmers on terms that we believe are reasonable, we may be forced to remove such programming channels from our line-up, which could result in a further loss of customers.
Increased demands by owners of some broadcast stations for carriage of other services or payments to those broadcasters for retransmission consent are likely to further increase our programming costs. Federal law allows commercial television broadcast stations to make an election between “must-carry” rights and an alternative “retransmission-consent” regime. When a station opts for the latter, cable operators are not allowed to carry the station’s signal without the station’s permission. In some cases, we carry stations under short-term arrangements while we attempt to negotiate new long-term retransmission agreements. If negotiations with these programmers prove unsuccessful, they could require us to cease carrying their signals, possibly for an indefinite period. Any loss of stations could make our video service less attractive to customers, which could result in less subscription and advertising revenue. In retransmission-consent negotiations, broadcasters often condition consent with respect to one station on carriage of one or more other stations or programming services in which they or their affiliates have an interest. Carriage of these other services, as well as increased fees for retransmission rights, may increase our programming expenses and diminish the amount of capacity we have available to introduce new services, which could have an adverse effect on our business and financial results.
Our inability to respond to technological developments and meet customer demand for new products and services could limit our ability to compete effectively.
Our business is characterized by rapid technological change and the introduction of new products and services, some of which are bandwidth-intensive. We may not be able to fund the capital expenditures necessary to keep pace with technological developments, execute the plans to do so, or anticipate the demand of our customers for products and services requiring new technology or bandwidth. The implementation of our network-based user interface, Spectrum Guide, and downloadable security necessary for our Worldbox set-top box strategy, may ultimately be unsuccessful or more expensive than anticipated. In order to realize the
22
benefits of our Worldbox technology, we must implement our downloadable conditional access security in our regional video networks. Our inability to maintain and expand our upgraded systems and provide advanced services such as a state of the art user interface in a timely manner, or to anticipate the demands of the marketplace, could materially adversely affect our ability to attract and retain customers. Consequently, our growth, financial condition and results of operations could suffer materially.
We depend on third party service providers, suppliers and licensors; thus, if we are unable to procure the necessary services, equipment, software or licenses on reasonable terms and on a timely basis, our ability to offer services could be impaired, and our growth, operations, business, financial results and financial condition could be materially adversely affected.
We depend on third party service providers, suppliers and licensors to supply some of the services, hardware, software and operational support necessary to provide some of our services. We obtain these materials from a limited number of vendors, some of which do not have a long operating history or which may not be able to continue to supply the equipment and services we desire. Some of our hardware, software and operational support vendors, and service providers represent our sole source of supply or have, either through contract or as a result of intellectual property rights, a position of some exclusivity. If demand exceeds these vendors’ capacity or if these vendors experience operating or financial difficulties, or are otherwise unable to provide the equipment or services we need in a timely manner, at our specifications and at reasonable prices, our ability to provide some services might be materially adversely affected, or the need to procure or develop alternative sources of the affected materials or services might delay our ability to serve our customers. These events could materially and adversely affect our ability to retain and attract customers, and have a material negative impact on our operations, business, financial results and financial condition. A limited number of vendors of key technologies can lead to less product innovation and higher costs. Our cable systems have historically been restricted to using one of two proprietary conditional access security systems, which we believe has limited the number of manufacturers producing set-top boxes for such systems. As an alternative, Charter has developed a conditional access security system which may be downloaded into set-top boxes with features we specify that could be provided by a variety of manufacturers. We refer to our specified set-top box as our Worldbox. In order to realize the benefits of our Worldbox technology, we must now implement the conditional access security system across our video network. We cannot provide assurances that this implementation will ultimately be successful or completed in the expected timeframe or at the expected budget.
We further depend on patent, copyright, trademark and trade secret laws and licenses to establish and maintain our intellectual property rights in technology and the products and services used in our operating activities. Any of our intellectual property rights could be challenged or invalidated, or such intellectual property rights may not be sufficient to permit us to continue to use certain intellectual property, which could result in discontinuance of certain product or service offerings or other competitive harm, our incurring substantial monetary liability or being enjoined preliminarily or permanently from further use of the intellectual property in question.
Various events could disrupt our networks, information systems or properties and could impair our operating activities and negatively impact our reputation.
Network and information systems technologies are critical to our operating activities, as well as our customers' access to our services. We may be subject to information technology system failures and network disruptions. Malicious and abusive activities, such as the dissemination of computer viruses, worms, and other destructive or disruptive software, computer hackings, social engineering, process breakdowns, denial of service attacks and other malicious activities have become more common in industry overall. If directed at us or technologies upon which we depend, these activities could have adverse consequences on our network and our customers, including degradation of service, excessive call volume to call centers, and damage to our or our customers' equipment and data. Further, these activities could result in security breaches, such as misappropriation, misuse, leakage, falsification or accidental release or loss of information maintained in our information technology systems and networks, and in our vendors’ systems and networks, including customer, personnel and vendor data. System failures and network disruptions may also be caused by natural disasters, accidents, power disruptions or telecommunications failures. If a significant incident were to occur, it could damage our reputation and credibility, lead to customer dissatisfaction and, ultimately, loss of customers or revenue, in addition to increased costs to service our customers and protect our network. These events also could result in large expenditures to repair or replace the damaged properties, networks or information systems or to protect them from similar events in the future. System redundancy may be ineffective or inadequate, and our disaster recovery planning may not be sufficient for all eventualities. Any significant loss of customers or revenue, or significant increase in costs of serving those customers, could adversely affect our growth, financial condition and results of operations.
For tax purposes, we could experience a deemed ownership change in the future that could limit our ability to use our tax loss carryforwards.
As of
December 31, 2014
, we had approximately
$9.5 billion
of federal tax net operating loss carryforwards resulting in a gross deferred tax asset of approximately
$3.3 billion
. Federal tax net operating loss carryforwards expire in the years 2020 through
23
2034. These losses resulted from the operations of Charter Holdco and its subsidiaries. In addition, as of
December 31, 2014
, we had state tax net operating loss carryforwards resulting in a gross deferred tax asset (net of federal tax benefit) of approximately
$321 million
. State tax net operating loss carryforwards generally expire in the years 2015 through 2034. Due to uncertainties in projected future taxable income, valuation allowances have been established against the gross deferred tax assets for book accounting purposes, except for future taxable income that will result from the reversal of existing temporary differences for which deferred tax liabilities are recognized. Such tax loss carryforwards can accumulate and be used to offset our future taxable income.
In the past, we have experienced “ownership changes” as defined in Section 382 of the Internal Revenue Code of 1986, as amended (the “Code”). In general, an “ownership change” occurs whenever the percentage of the stock of a corporation owned, directly or indirectly, by “5-percent stockholders” (within the meaning of Section 382 of the Code) increases by more than 50 percentage points over the lowest percentage of the stock of such corporation owned, directly or indirectly, by such “5-percent stockholders” at any time over the preceding three years. As a result, we are subject to an annual limitation on the use of our loss carryforwards which existed at November 30, 2009 for the first "ownership change" and those that existed at May 1, 2013 for the second "ownership change." The limitation on our ability to use our loss carryforwards, in conjunction with the loss carryforward expiration provisions, could reduce our ability to use a portion of our loss carryforwards to offset future taxable income, which could result in us being required to make material cash tax payments. Our ability to make such income tax payments, if any, will depend at such time on our liquidity or our ability to raise additional capital, and/or on receipt of payments or distributions from Charter Holdco and its subsidiaries.
If we were to experience a third ownership change in the future (as a result of purchases and sales of stock by our "5-percent stockholders," new issuances or redemptions of our stock, certain acquisitions of our stock and issuances, redemptions, sales or other dispositions or acquisitions of interests in our "5-percent stockholders"), our ability to use our loss carryforwards could become subject to further limitations. Our common stock is subject to certain transfer restrictions contained in our amended and restated certificate of incorporation. These restrictions, which are designed to minimize the likelihood of an ownership change occurring and thereby preserve our ability to utilize our loss carryforwards, are not currently operative but could become operative in the future if certain events occur and the restrictions are imposed by our board of directors. However, there can be no assurance that our board of directors would choose to impose these restrictions or that such restrictions, if imposed, would prevent an ownership change from occurring.
If we are unable to retain key employees, our ability to manage our business could be adversely affected.
Our operational results have depended, and our future results will depend, upon the retention and continued performance of our management team. Our ability to retain and hire new key employees for management positions could be impacted adversely by the competitive environment for management talent in the broadband communications industry. The loss of the services of key members of management and the inability or delay in hiring new key employees could adversely affect our ability to manage our business and our future operational and financial results.
Our inability to successfully acquire and integrate other businesses, assets, products or technologies could harm our operating results.
We continuously evaluate and pursue small and large acquisitions and strategic investments in businesses, products or technologies that we believe could complement or expand our business or otherwise offer growth or cost-saving opportunities. From time to time, including in the near term, we may enter into letters of intent with companies with which we are negotiating for potential acquisitions or investments, or as to which we are conducting due diligence. An investment in, or acquisition of, complementary businesses, products or technologies in the future could materially decrease the amount of our available cash or require us to seek additional equity or debt financing. We may not be successful in negotiating the terms of any potential acquisition, conducting thorough due diligence, financing the acquisition or effectively integrating the acquired business, product or technology into our existing business and operations. Our due diligence may fail to identify all of the problems, liabilities or other shortcomings or challenges of an acquired business, product or technology, including issues related to intellectual property, product quality or product architecture, regulatory compliance practices, revenue recognition or other accounting practices, or employee or customer issues.
Additionally, in connection with any acquisitions we complete, we may not achieve the growth, synergies or other benefits we expected to achieve, and we may incur write-downs, impairment charges or unforeseen liabilities that could negatively affect our operating results or financial position or could otherwise harm our business. Further, contemplating or completing an acquisition and integrating an acquired business, product or technology, individually or across multiple opportunities, could divert management and employee time and resources from other matters.
24
Risks Related to Ownership Position of Liberty Broadband Corporation
Liberty Broadband Corporation owns a significant amount of Charter’s common stock, giving it influence over corporate transactions and other matters.
Members of our board of directors include directors who are also officers and directors of our principal stockholder. Dr. John Malone is the Chairman of Liberty Broadband Corporation, and Mr. Greg Maffei is the president and chief executive officer of Liberty Broadband Corporation. As of
December 31, 2014
, Liberty Broadband Corporation beneficially held approximately 25.75% of our Class A common stock. Liberty Broadband Corporation has the right to designate up to four directors as nominees for our board of directors through our 2015 annual meeting of stockholders with one designated director to be appointed to each of the Audit Committee, the Nominating and Corporate Governance Committee and the Compensation and Benefits Committee. Liberty Broadband Corporation may be able to exercise substantial influence over all matters requiring stockholder approval, including the election of directors and approval of significant corporate action, such as mergers and other business combination transactions should Liberty Broadband Corporation retain a significant ownership interest in us. Liberty Broadband Corporation and its affiliates are not restricted from investing in, and have invested in, and engaged in, other businesses involving or related to the operation of cable television systems, video programming, Internet service, voice or business and financial transactions conducted through broadband interactivity and Internet services. Liberty Broadband Corporation and its affiliates may also engage in other businesses that compete or may in the future compete with us.
Liberty Broadband Corporation's substantial influence over our management and affairs could create conflicts of interest if Liberty Broadband Corporation faced decisions that could have different implications for it and us.
Risks Related to the Transactions
As a result of the Transactions, current Charter stockholders’ ownership interest in Charter will be diluted from 100% to approximately 92%.
Immediately following the Transactions, it is expected that the current stockholders of Charter, who presently own 100% of Charter, will own approximately 92% of the outstanding common stock of Charter. The Transactions therefore will result in substantial dilution of the ownership interest of the current Charter stockholders. Additionally, due to the ownership dilution, Charter’s current stockholders as a group will be able to exercise less influence after the Transactions than they currently exercise over the management, operations and policies for Charter. If GreatLand Connections raises less proceeds in the related financing Transactions than currently contemplated, Charter is obligated pursuant to the Merger Agreement and the financing arrangements to increase its stock consideration paid in the Charter Merger, which would further dilute existing Charter stockholders. Also, pursuant to the Merger Agreement, if the price at which shares of Charter trade were to be lower during the 60 days leading up to the closing of the Transactions, Charter would have to issue more shares further diluting existing Charter stockholders.
Completion of the Transactions is subject to a number of conditions and if these conditions are not satisfied or waived, the Transactions will not be completed.
Our obligation and the obligation of Comcast to complete the Transactions are subject to satisfaction or waiver of a number of conditions, including, among others:
|
•
|
completion of Comcast’s acquisition of TWC;
|
|
•
|
expiration or termination of the Hart-Scott-Rodino Antitrust Improvements Act ("HSR Act") waiting period and receipt of certain regulatory approvals for the Transactions, in most cases without the imposition of a burdensome condition;
|
|
•
|
unless not required under applicable law, approval by our stockholders;
|
|
•
|
receipt of opinions of counsel as to the tax-free nature of certain of the Transactions;
|
|
•
|
absence of injunction or legal impediment on any of the Transactions;
|
|
•
|
effectiveness of a registration statement for GreatLand Connections shares to be issued in the Transactions and approval for the listing on NASDAQ of the shares of GreatLand Connections’ common stock to be issued in the Transactions;
|
|
•
|
effectiveness of the registration statement filed by CCH I, which will become New Charter upon the closing of the Transactions ("New Charter") and approval for listing on NASDAQ of the shares of New Charter’s common stock;
|
|
•
|
accuracy of the representations and warranties with respect to each of the Transactions, subject to certain materiality thresholds;
|
|
•
|
performance of covenants with respect to each of the Transactions, subject to certain materiality thresholds;
|
|
•
|
with respect to Charter’s obligations, absence of a material adverse change with respect to the assets and liabilities transferred to GreatLand Connections and the assets and liabilities transferred by Comcast to us, taken as a whole, and
|
25
with respect to Comcast’s obligations, absence of a material adverse change with respect to the assets and liabilities transferred by us to Comcast and absence of a material adverse effect with respect to us, and also with respect to Charter’s obligations, absence of the assertion by Charter’s financing sources of a material adverse effect with respect to us; and
|
•
|
completion of the debt-for-debt exchange contemplated in connection with the GreatLand Connections spin-off from Comcast.
|
There can be no assurance that the conditions to closing of the Transactions will be satisfied or waived or that the Transactions will be completed.
In order to complete the Transactions, we along with Comcast must obtain certain governmental authorizations, and if such authorizations are not granted or are granted with conditions to the parties, completion of the Transactions may be jeopardized or the anticipated benefits of the Transactions could be reduced.
Completion of the Transactions is conditioned upon the expiration or early termination of the waiting periods relating to the Transactions under the HSR Act and the required governmental authorizations, including an order of the FCC, having been obtained and being in full force and effect. Although we and Comcast have agreed in the Transactions Agreement to use reasonable best efforts, subject to certain limitations, to obtain the required governmental authorizations, there can be no assurance that the relevant waiting periods will expire or that the relevant authorizations will be obtained. In addition, the governmental authorities with or from which these authorizations are required have broad discretion in administering the governing regulations. As a condition to authorization of the Transactions, these governmental authorities may impose requirements, limitations or costs or require divestitures or place restrictions on the conduct of our business after completion of the Transactions. There can be no assurance that regulators will not impose conditions, terms, obligations or restrictions and that such conditions, terms, obligations or restrictions will not have the effect of delaying completion of the Transactions or imposing additional material costs on or materially limiting the revenues of New Charter following the Transactions, or otherwise adversely affect our business and results of operations after completion of the Transactions. In addition, we can provide no assurance that these conditions, terms, obligations or restrictions will not result in the delay or abandonment of the Transactions.
We have relied on publicly available information and ongoing diligence on the systems being acquired by Charter and by GreatLand Connections.
We have relied on publicly available information and ongoing diligence regarding the systems being acquired by Charter and by GreatLand Connections. The Transactions accordingly provide for assumption by Charter and by GreatLand Connections of only those liabilities that are primarily related to the systems acquired by each of them respectively, and for valuation terms that will depend on actual Carveout 2014 EBITDA (as defined in the Transactions Agreement) produced by such systems, including true-up adjustment payments related to EBITDA and, in some cases, working capital. However, it is possible that significant liabilities, present, future or contingent, may be assumed by Charter or GreatLand Connections that are not fully reflected in the valuation terms, and accordingly could have a material adverse effect on Charter and/or its investment in GreatLand Connections. Similarly, it is possible that certain assets required to operate the systems acquired by GreatLand Connections and/or Charter, such as licenses, technologies and/or employees, may not be transferred in the Transactions, requiring GreatLand Connections and/or Charter to incur additional costs and invest additional resources to procure such assets and/or hire employees with expertise in the transferred business, which may adversely affect Charter’s ability to realize the anticipated benefits of the Transactions. As we have already entered into the Agreement for the Transactions without any diligence conditions, our ongoing diligence is not expected to give rise to any material adjustments in the Transactions, and our ongoing diligence continues to focus on the transition of the to be acquired systems to our ownership or the provision of services in the case of GreatLand Connections.
We may not realize anticipated cost synergies and growth opportunities.
We expect that we will realize cost synergies, growth opportunities and other financial and operating benefits as a result of the Transactions. Our success in realizing these cost synergies, growth opportunities and other financial and operating benefits, and the timing of this realization, depends on the successful integration of the business operations obtained in the Asset Exchange and the Asset Purchase and our ability to provide certain services to GreatLand Connections effectively pursuant to a services agreement. Even if we are able to integrate the business operations obtained in the Asset Exchange and the Asset Purchase successfully, we cannot predict with certainty if or when these cost synergies, growth opportunities and benefits will occur, or the extent to which they actually will be achieved. For example, the benefits from the Transactions may be offset by costs incurred in integrating the new business operations or in obtaining or attempting to obtain regulatory approvals for the Transactions, or negatively impacted by potential programming dis-synergies that we may experience as a result of the Transactions. Realization of any benefits and cost synergies could be affected by the factors described in other risk factors and a number of factors beyond our control, including, without limitation, general economic conditions, increased operating costs, the response of competitors and regulatory developments.
26
In addition, certain license and customer contracts which are required to be transferred to GreatLand Connections or Charter by Comcast require the consent of the licensor or customer party to the contract to effect this assignment. Comcast, GreatLand Connections and Charter may be unable to obtain these consents on terms favorable to GreatLand Connections or Charter, respectively, or at all, which could have a material adverse impact on GreatLand Connections’ (and hence on us) or on our business, financial condition and results of operations after the Transactions. There can be no assurance that third-party consents will be obtained prior to completion of the Transactions or at all.
The integration of the business acquired in the Asset Exchange and Asset Purchase with the businesses we operated prior to the Asset Exchange and Asset Purchase may not be successful or the anticipated benefits from the Asset Exchange and Asset Purchase may not be realized.
After consummation of the Asset Exchange and Asset Purchase, we will have significantly more systems, assets, investments, businesses, customers and employees than we did prior to the Asset Exchange and Asset Purchase. The process of integrating these assets with the businesses we operated prior to the Asset Exchange and Asset Purchase will require us to expend significant capital and significantly expand the scope of our operations and operating and financial systems. Our management will be required to devote a significant amount of time and attention to the process of integrating the operations of the acquired assets with our operations before the Asset Exchange and Asset Purchase. There is a significant degree of difficulty and management involvement inherent in that process. These difficulties include:
|
•
|
integrating the operations of the acquired assets while carrying on the ongoing operations of the businesses we operated prior to the Asset Exchange and Asset Purchase;
|
|
•
|
integrating information, purchasing, provisioning, accounting, finance, sales, billing, payroll, reporting and regulatory compliance systems;
|
|
•
|
integrating and unifying the product offerings and services available to customers, including customer premise equipment and video user interfaces;
|
|
•
|
completing the conversion of analog systems to all-digital for the systems to be acquired;
|
|
•
|
managing a significantly larger company than before consummation of the Asset Exchange and Asset Purchase;
|
|
•
|
integrating separate business cultures;
|
|
•
|
attracting and retaining the necessary personnel associated with the acquired assets; and
|
|
•
|
creating uniform standards, controls, procedures, policies and information systems and controlling the costs associated with such matters; and
|
|
•
|
the impact on our business of providing services to GreatLand Connections which will also face the foregoing difficulties.
|
Charter and Comcast have agreed to provide each other with transition services in connection with the transferred systems and relevant assets. Providing such services could divert management attention and result in additional costs, particularly as Charter starts up infrastructure and staff to take over transition services and provides transition services to Comcast for former Charter systems. In addition, the inability to procure such services could negatively impact our expected results of operations.
There is no assurance that the assets acquired in the Asset Exchange and Asset Purchase will be successfully or cost-effectively integrated into the businesses we operated prior to the Asset Exchange and Asset Purchase. The process of integrating the acquired assets into our operations prior to the Asset Exchange and Asset Purchase may cause an interruption of, or loss of momentum in, the activities of our business. If our management is not able to effectively manage the integration process, or if any significant business activities are interrupted as a result of the integration process, our business could suffer and our liquidity, results of operations and financial condition may be materially adversely impacted.
Even if we are able to successfully integrate the new assets, it may not be possible to realize the benefits that are expected to result from the Asset Exchange and Asset Purchase, or realize these benefits within the time frame that is expected. For example, the elimination of duplicative costs may not be possible or may take longer than anticipated, or the benefits from the Asset Exchange and Asset Purchase may be offset by costs incurred or delays in integrating the companies. Programming dis-synergies could also be larger than expected. If we fail to realize the benefits we anticipate from the acquisition, our liquidity, results of operations or financial condition may be adversely affected.
The value of our interests in GreatLand Connections following the Transactions may fluctuate from time to time based on factors beyond our control.
Following the Transactions, the value of our interests in GreatLand Connections will depend on GreatLand Connections’ operational performance and fluctuations in its share price. We will not control the management and operations of GreatLand Connections, and we will therefore not be able to prevent or address any decline in the operational performance or trading value of GreatLand Connections. In addition, the operational performance and trading value of GreatLand Connections may be influenced by other
27
factors outside our control, including risks resulting from the separation of the cable systems from Comcast; changes in earnings estimated by securities analysts or GreatLand Connections’ ability to meet those estimates; and domestic and foreign economic conditions.
If the operating results for GreatLand Connections following the Transactions are poor, we may not achieve the increases in revenues and earnings per share that we expect as a result of the Transactions.
We have projected that we will derive a portion of our revenues and earnings per share from GreatLand Connections after the Transactions, through receipt of a services fee of 4.25% of GreatLand Connections’ revenues pursuant to a services agreement. In addition, we will record 33% of GreatLand Connections’ net income, which will also have an impact on our operating results. Therefore, any negative impact on GreatLand Connections or the operations of GreatLand Connections' business could harm our operating results. Some of the significant factors that could harm GreatLand Connections and the operations of the GreatLand Connections' business, and therefore harm our future operating results after the Transactions, include competitive pressure from existing or new companies and a decline in the markets served by GreatLand Connections.
If the operating results of the TWC assets acquired in the Asset Exchange and the Asset Purchase are less than our expectations, or an increase in the capital expenditures to upgrade and maintain those assets as well as to keep pace with technological developments is necessary, Charter may not achieve the expected level of financial results from the Transactions.
We have projected that we will derive a portion of our revenues and earnings per share from the operation of the TWC assets that we will acquire in the Asset Exchange and the Asset Purchase. Therefore, any negative impact on the TWC assets to be acquired by us or the operating results derived from such exchanged and purchased assets could harm our operating results.
Our business is characterized by rapid technological change and the introduction of new products and services. We intend to make all-digital investments in the TWC assets acquired in the Asset Exchange and Asset Purchase and transition toward only using two-way interactive set-top boxes. The increase in capital expenditures necessary for the all-digital investment and the transition toward two-way set-top boxes in the TWC assets may negatively impact the expected financial results from the Transactions. We may not be able to fund the capital expenditures necessary to keep pace with technological developments, execute the plans to do so, or anticipate the demand of our customers for products and services requiring new technology or bandwidth. Our inability to maintain, expand and upgrade our existing or acquired assets, including through all-digital initiatives for the TWC assets, could materially adversely affect our financial condition and results of operations.
Because of high debt levels, we may not be able to service our debt obligations in accordance with our terms after the Transactions.
Our ability to meet our expense and debt service obligations contained in the agreements governing our indebtedness will depend on our future performance, which will be affected by financial, business, economic and other factors, including potential changes in customer preferences, the success of product and marketing innovation and pressure from competitors. Should our sales decline after the Transactions, we may not be able to generate sufficient cash flow to pay our debt service obligations when due. If we are unable to meet our debt service obligations after the Transactions or should we fail to comply with our financial and other restrictive covenants contained in the agreements governing our indebtedness, we may be required to refinance all or part of our debt, sell important strategic assets at unfavorable prices or borrow more money. We may not be able to, at any given time, refinance our debt, sell assets or borrow more money on terms acceptable to us or at all. Our inability to refinance our debt could have a material adverse effect on our financial condition and results from operations after the Transactions.
We may have difficulty attracting, motivating and retaining executives and other employees in light of the Transactions.
Uncertainty about the effect of the Transactions on our employees may have an adverse effect on us. This uncertainty may impair our ability to attract, retain and motivate personnel until the Transactions are completed. Employee retention may be particularly challenging during the pendency of the Transactions, as employees may feel uncertain about their future roles with us after the Transactions. If our employees depart because of issues relating to the uncertainty and difficulty of integration, our ability to realize the anticipated benefits of the Transactions could be reduced. Similar challenges exist for us in retaining employees being transferred to Charter in the Transactions and in attracting any additional personnel we may need after the Transactions.
A delay in the completion of the Transactions may diminish the anticipated benefits of the Transactions.
Completion of the Transactions is conditioned upon the receipt of certain governmental consents and approvals, orders, authorizations, and rulings, including the expiration or termination of any applicable waiting period (or extension thereof) under the HSR Act and the adoption of an order by the FCC granting its consent to the transfer of control or assignment of certain licenses and authorizations issued by the FCC. The requirement to receive these consents and approvals, orders, authorizations and rulings
28
before the Transactions could delay the completion of the Transactions if, for example, government agencies request additional information from the parties in order to facilitate their review of the Transactions or require any conditions precedent to granting their approval of the Transactions. In addition, these governmental agencies may attempt to condition their approval of the Transactions on the imposition of conditions that could have a material adverse effect on us after the Transactions, including but not limited to our operating results or the value of Charter Class A common stock. Any delay in the completion of the Transactions could diminish the anticipated benefits of the Transactions or result in additional transaction costs, loss of revenue or other effects associated with uncertainty about the Transactions. Any uncertainty over the ability of the companies to complete the Transactions could make it more difficult for us and GreatLand Connections to retain key employees or to pursue business strategies. In addition, until the Transactions are completed, the attention of our management may be diverted from ongoing business concerns and regular business responsibilities to the extent management is focused on matters relating to the Transactions
.
Failure to complete the Transactions could negatively impact our stock price and our future business and financial results.
If the Transactions are not completed for any reason, our ongoing business may be adversely affected and, without realizing any of the benefits of having completed the Transactions, we would be subject to a number of risks:
|
•
|
We may experience negative reactions from the financial markets, including negative impacts on our stock price;
|
|
•
|
We may experience negative reactions from our customers, regulators and employees;
|
|
•
|
We may be required to pay significant costs relating to the Transactions, and will have paid significant costs related to the Transactions such as interest on the $7.0 billion of debt incurred to fund the Transactions;
|
|
•
|
The Transactions Agreement places certain restrictions on the conduct of our business with respect to our assets being transferred to Comcast prior to completion of the Transactions. Such restrictions, the waiver of which is subject to the consent of the other party (in certain cases, not to be unreasonably withheld, conditioned or delayed), may have prevented us from taking certain specified actions or otherwise pursuing business opportunities during the pendency of the Transactions; and
|
|
•
|
Matters relating to the Transactions (including integration planning) will require substantial commitments of time and resources by our management and expenditures, which would otherwise have been devoted to day-to-day operations and other opportunities that may have been beneficial to us in the absence of the Transactions.
|
If the Transactions are not completed, the risks described above may materialize and they may adversely affect our business, financial condition, financial results and stock price.
In addition, we could be subject to litigation related to any failure to complete the Transactions or related to any enforcement proceeding commenced against us to perform our obligations under the Transactions Agreement.
If the Spin-Off does not qualify as a tax-free reorganization under Sections 368(a)(1)(D) and 355 of the Code, including as a result of subsequent acquisitions of stock of GreatLand Connections, then Comcast may recognize a very substantial amount of taxable gain and GreatLand Connections (and in certain circumstances, Charter) may be obligated to indemnify Comcast for these taxes.
The completion of the Transactions is conditioned upon the receipt of opinions from counsel as to the tax free nature of certain of the Transactions, including the Spin-Off. The opinions of counsel will be based on, among other things, current law and certain assumptions and representations as to factual matters made by Comcast, GreatLand Connections and Charter. Any change in currently applicable law, which may be retroactive, or the failure of any representation to be true, correct and complete, could adversely affect the conclusions reached by counsel in the opinions. Moreover, the opinions will not be binding on the Internal Revenue Service (“IRS”) or the courts, and the IRS or the courts may not agree with the conclusions reached in the opinions.
Even if the Spin-Off otherwise qualifies as a tax-free spin-off for U.S. federal income tax purposes, the Spin-Off will be taxable to Comcast pursuant to section 355(e) of the Code if 50% or more of the stock of either Comcast or GreatLand Connections is acquired, directly or indirectly (taking into account the stock of GreatLand Connections acquired by New Charter in the Merger and the stock of Comcast and GreatLand Connections acquired by TWC shareholders in the transaction between Comcast and TWC and in the Spin-Off), as part of a plan or series of related transactions that includes the Spin-Off. Because GreatLand Connections stockholders that are former Comcast shareholders (exclusive of former TWC shareholders) will own more than 50% of the common stock of GreatLand Connections following the Merger, the Merger standing alone is not expected to cause the Spin-Off to be taxable to Comcast under section 355(e) of the Code. However, if the IRS were to determine that other acquisitions of GreatLand Connections common stock or Comcast common stock, either before or after the Spin-Off are part of a plan or series of related transactions that includes the Spin-Off, such determination could result in the recognition of gain by Comcast under section 355(e) of the Code. If section 355(e) of the Code applied, Comcast might recognize a very substantial amount of taxable gain.
29
Under the tax sharing agreement that will be entered into by Comcast, GreatLand Connections and, to a limited extent, New Charter, in certain circumstances, and subject to certain limitations, GreatLand Connections will be required to indemnify Comcast against taxes on the Spin-Off that arise as a result of certain actions or failures to act by GreatLand Connections or as a result of certain changes in ownership of the stock of GreatLand Connections after the completion of the Transactions. GreatLand Connections will be unable to take certain actions after the Transactions because such actions could adversely affect the tax-free status of the Spin-Off, and such restrictions could be significant. If GreatLand Connections is required to indemnify Comcast in the event the Spin-Off is taxable, this indemnification obligation would be substantial and could have a material adverse effect on GreatLand Connections.
Moreover, under the tax sharing agreement, in certain circumstances, and subject to certain limitations, New Charter will be required to indemnify Comcast against taxes on the Spin-Off that arise from New Charter taking any actions that would result in New Charter holding GreatLand Connections shares in excess of the percentage of GreatLand Connections shares acquired in the Merger during the two year period following the Spin-Off. If New Charter is required to indemnify Comcast in the event the Spin-Off is taxable, this indemnification obligation would be substantial and could have a material adverse effect on New Charter.
New Charter and GreatLand Connections will be unable to take certain actions after the Transactions because such actions could adversely affect the tax-free status of the Spin-Off, and such restrictions could be significant.
The tax sharing agreement will prohibit New Charter, Charter and GreatLand Connections from taking actions that could cause the Spin-Off to be taxable to Comcast. In particular, for two years after the completion of the Transactions, New Charter and GreatLand Connections will not be permitted to take actions that would result in New Charter holding (or being treated as holding) GreatLand Connections shares in excess of the percentage of GreatLand Connections shares acquired by New Charter in the merger. These actions could include entering into certain merger or consolidation transactions, certain stock issuances and certain other desirable strategic transactions.
Because of these restrictions, GreatLand Connections may be limited in the amount of stock that it can issue to make acquisitions or raise additional capital in the two years subsequent to the completion of the Charter Merger, which could have a material adverse effect on GreatLand Connections’ liquidity and financial condition.
The tax sharing agreement will also provide that in certain circumstances, and subject to certain limitations, GreatLand Connections and New Charter will be required to indemnify Comcast against taxes on the Spin-Off that arise as a result of actions in violation of the prohibitions and limitations described above. If GreatLand Connections or New Charter is required to indemnify Comcast in the event the Spin-Off is taxable, this indemnification obligation would be substantial and could have a material adverse effect on GreatLand Connections or New Charter, as applicable.
We will incur significant transaction-related costs in connection with the Transactions.
We expect to incur a number of non-recurring costs associated with the Transactions before, at, and after closing the Transactions. We also will incur transaction fees and costs related to formulating and implementing integration plans, including facilities and systems implementation costs and employment-related costs. We continue to assess the magnitude of these costs, and additional unanticipated costs may be incurred in the Transactions and integration. Although we expect that the elimination of duplicative costs, as well as the realization of other efficiencies related to the integration of the businesses, should allow us to offset integration-related costs over time, this net benefit may not be achieved in the near term, or at all. In addition, if the Transactions are not consummated, we would bear some or all of these costs without the benefit of efficiencies from the integration of the businesses. Such costs could have a material adverse impact on our financial results.
Sales of our common stock after the Transactions may negatively affect the market price of New Charter common stock.
The shares of our common stock to be issued in the Transactions to holders of GreatLand Connections common stock (initially, the Comcast shareholders) will generally be eligible for immediate resale. The market price of our common stock could decline as a result of sales of a large number of shares of our common stock in the market after the consummation of the Transactions or even the perception that these sales could occur.
Currently, Comcast shareholders may include index funds that have performance tied to the Standard & Poor’s 500 Index or other stock indices, and institutional investors subject to various investing guidelines. Because New Charter may not be included in these indices following the consummation of the Transactions or may not meet the investing guidelines of some of these institutional investors, these index funds and institutional investors may decide to or may be required to sell the common stock that they receive
30
in the Transactions. These sales, or the possibility that these sales may occur, may also make it more difficult for New Charter to obtain additional capital by selling equity securities in the future at a time and at a price that it deems appropriate.
Risks Related to Regulatory and Legislative Matters
Our business is subject to extensive governmental legislation and regulation, which could adversely affect our business.
Regulation of the cable industry has increased cable operators' operational and administrative expenses and limited their revenues. Cable operators are subject to various laws and regulations including those covering the following:
|
•
|
the provisioning and marketing of cable equipment and compatibility with new digital technologies;
|
|
•
|
subscriber and employee privacy and data security;
|
|
•
|
limited rate regulation of video service;
|
|
•
|
copyright royalties for retransmitting broadcast signals;
|
|
•
|
when a cable system must carry a particular broadcast station and when it must first obtain retransmission consent to carry a broadcast station;
|
|
•
|
the provision of channel capacity to unaffiliated commercial leased access programmers;
|
|
•
|
limitations on our ability to enter into exclusive agreements with multiple dwelling unit complexes and control our inside wiring;
|
|
•
|
the provision of high-speed Internet service, including net neutrality rules;
|
|
•
|
the provision of voice communications;
|
|
•
|
cable franchise renewals and transfers;
|
|
•
|
equal employment opportunity, emergency alert systems, disability access, technical standards, marketing practices, customer service, and consumer protection; and
|
|
•
|
approval for mergers and acquisitions often accompanied by the imposition of restrictions and requirements on an applicant's business in order to secure approval of the proposed transaction.
|
Additionally, many aspects of these laws and regulations are often the subject of judicial proceedings and administrative or legislative proposals. There are also ongoing efforts to amend or expand the federal, state, and local regulation of some of the services offered over our cable systems, which may compound the regulatory risks we already face, and proposals that might make it easier for our employees to unionize. Some states are considering adopting energy efficiency regulations governing the operation of equipment (such as broadband modems) that we use to deliver Internet services, which could constrain innovation in broadband services and equipment. Congress is considering whether to rewrite the entire Communications Act to account for changes in the communications marketplace. Congress and various federal agencies are also considering more focused changes, such as new privacy restrictions and new restrictions on the use of personal and profiling information for behavioral advertising. In response to recent global data breaches, malicious activity and cyber threats, as well as the general increasing concerns regarding the protection of consumers’ personal information, Congress and various federal agencies are also considering the adoption of new data security and cybersecurity legislation and regulation that could result in additional network and information security requirements for our business. These new laws, as well as existing legal and regulatory obligations, could affect our operations and require significant expenditures. In addition, federal, state, and local regulators could deny necessary approval of the Transactions or impose additional regulatory conditions in connection with their review of the Transactions that could affect our operations.
Our cable system franchises are subject to non-renewal or termination. The failure to renew a franchise in one or more key markets could adversely affect our business.
Our cable systems generally operate pursuant to franchises, permits, and similar authorizations issued by a state or local governmental authority controlling the public rights-of-way. Many franchises establish comprehensive facilities and service requirements, as well as specific customer service standards and monetary penalties for non-compliance. In many cases, franchises are terminable if the franchisee fails to comply with significant provisions set forth in the franchise agreement governing system operations. Franchises are generally granted for fixed terms and must be periodically renewed. Franchising authorities may resist granting a renewal if either past performance or the prospective operating proposal is considered inadequate. Franchise authorities often demand concessions or other commitments as a condition to renewal. In some instances, local franchises have not been renewed at expiration, and we have operated and are operating under either temporary operating agreements or without a franchise while negotiating renewal terms with the local franchising authorities.
The traditional cable franchising regime has recently undergone significant change as a result of various federal and state actions. Some state franchising laws do not allow incumbent operators like us to opt into favorable statewide franchising as quickly as
31
new entrants, and often require us to retain certain franchise obligations that are more burdensome than those applied to new entrants.
We cannot assure you that we will be able to comply with all significant provisions of our franchise agreements and certain of our franchisers have from time to time alleged that we have not complied with these agreements. Additionally, although historically we have renewed our franchises without incurring significant costs, we cannot assure you that we will be able to renew, or to renew as favorably, our franchises in the future. A termination of or a sustained failure to renew a franchise in one or more key markets could adversely affect our business in the affected geographic area.
Our cable system franchises are non-exclusive. Accordingly, local and state franchising authorities can grant additional franchises and create additional competition for our products, resulting in overbuilds, which could adversely affect results of operations.
Our cable system franchises are non-exclusive. Consequently, local and state franchising authorities can grant additional franchises to competitors in the same geographic area or operate their own cable systems. In some cases, local government entities and municipal utilities may legally compete with us on more favorable terms. As a result, competing operators may build systems in areas in which we hold franchises.
The FCC has adopted rules that streamline entry for new competitors (particularly those affiliated with telephone companies) and reduce franchising burdens for these new entrants. At the same time, a substantial number of states have adopted new franchising laws, principally designed to streamline entry for new competitors, and often provide advantages for these new entrants that are not immediately available to existing operators. Broadband delivery of video content is not necessarily subject to the same franchising obligations applicable to our traditional cable systems.
The FCC administers a program that collects Universal Service Fund contributions from telecommunications service providers and uses them to subsidize the provision of telecommunications services in high-cost areas and to low-income consumers and the provision of Internet and telecommunications services to schools, libraries and certain health care providers. A variety of regulatory changes may lead the FCC to expand the collection of Universal Service Fund contributions to encompass Internet service providers.
The FCC already has begun to redirect the expenditure of some Universal Service Funding to broadband deployment in ways that could assist competitors in competing with our services.
Local franchise authorities have the ability to impose additional regulatory constraints on our business, which could further increase our expenses.
In addition to the franchise agreement, cable authorities in some jurisdictions have adopted cable regulatory ordinances that further regulate the operation of cable systems. This additional regulation increases the cost of operating our business. Local franchising authorities may impose new and more restrictive requirements. Local franchising authorities who are certified to regulate rates in the communities where they operate generally have the power to reduce rates and order refunds on the rates charged for basic service and equipment.
Tax legislation and administrative initiatives or challenges to our tax positions could adversely affect our results of operations and financial condition.
We operate cable systems in locations throughout the United States and, as a result, we are subject to the tax laws and regulations of federal, state and local governments. From time to time, various legislative and/or administrative initiatives may be proposed that could adversely affect our tax positions. There can be no assurance that our effective tax rate or tax payments will not be adversely affected by these initiatives. Certain states and localities have imposed or are considering imposing new or additional taxes or fees on our services or changing the methodologies or base on which certain fees and taxes are computed. The federal Internet Tax Freedom Act, which prohibits many taxes on Internet access service, will expire October 1, 2015, unless it is renewed by Congress. Potential changes include additional taxes or fees on our services which could impact our customers, combined reporting and other changes to general business taxes, central/unit-level assessment of property taxes and other matters that could increase our income, franchise, sales, use and/or property tax liabilities. In addition, federal, state and local tax laws and regulations are extremely complex and subject to varying interpretations. There can be no assurance that our tax positions will not be challenged by relevant tax authorities or that we would be successful in any such challenge.
32
Further regulation of the cable industry could impair our ability to raise rates to cover our increasing costs, resulting in increased losses.
Currently, rate regulation of cable systems is strictly limited to the basic service tier and associated equipment and installation activities. However, the FCC and Congress continue to be concerned that cable rate increases are exceeding inflation. It is possible that either the FCC or Congress will further restrict the ability of cable system operators to implement rate increases for our video services or even for our high-speed Internet and voice services. Should this occur, it would impede our ability to raise our rates. If we are unable to raise our rates in response to increasing costs, our losses would increase.
There has been legislative and regulatory interest in requiring companies that own multiple cable networks to make each of them available on a standalone, rather than a bundled basis to cable operators, and in requiring cable operators to offer historically bundled programming services on an á la carte basis to consumers. While any new regulation or legislation designed to enable cable operators to purchase programming on a standalone basis could be beneficial to Charter, any regulation or legislation that limits how we sell programming could adversely affect our business.
Actions by pole owners might subject us to significantly increased pole attachment costs.
Pole attachments are cable wires that are attached to utility poles. Cable system attachments to investor-owned public utility poles historically have been regulated at the federal or state level, generally resulting in favorable pole attachment rates for attachments used to provide cable service. In contrast, utility poles owned by municipalities or cooperatives are not subject to federal regulation and are generally exempt from state regulation. In 2011, the FCC amended its pole attachment rules to promote broadband deployment. The order overall strengthens the cable industry's ability to access investor-owned utility poles on reasonable rates, terms and conditions. It also allows for new penalties in certain cases involving unauthorized attachments that could result in additional costs for cable operators. The new rules were affirmed in 2013. Future regulatory changes in this area could impact the pole attachment rates we pay utility companies.
Increasing regulation of our Internet service product could adversely affect our ability to provide new products and services.
On May 15, 2014, the FCC initiated a rulemaking to issue new "network neutrality" regulations, potentially including a reclassification of broadband services as Title II common carrier services, which could subject our services to far more extensive and burdensome federal and state regulation. On February 4, 2015, the Chairman of the FCC released a fact sheet describing his proposed new rules. The Chairman’s proposal reclassifies wireline and wireless broadband services as Title II common carrier services. The new rules would prohibit ISPs from engaging in blocking, throttling, and paid prioritization, and the existing transparency rules compelling the disclosure of network management policies would be enhanced. The FCC would also have authority under the proposed rules to hear complaints and take enforcement action if it determines that the interconnection of ISPs are not just and reasonable, or if ISPs fail to meet a new general obligation not to harm consumers or edge providers. We do not know at the current time whether the regulations proposed by the Chairman will be adopted by the full Commission at a meeting scheduled for February 26, 2015, whether any rules adopted actually will go into effect or be struck down by a legal appeal, or how any new rules actually would be administered by the FCC, but such rules could limit our ability to efficiently manage our cable systems and respond to operational and competitive challenges.
Changes in channel carriage regulations could impose significant additional costs on us.
Cable operators also face significant regulation of their video channel carriage. We can be required to devote substantial capacity to the carriage of programming that we might not carry voluntarily, including certain local broadcast signals; local public, educational and governmental access (“PEG”) programming; and unaffiliated, commercial leased access programming (required channel capacity for use by persons unaffiliated with the cable operator who desire to distribute programming over a cable system). The FCC adopted revised commercial leased access rules which would dramatically reduce the rate we can charge for leasing this capacity and dramatically increase our administrative burdens, but these remain stayed while under appeal. Legislation has been introduced in Congress in the past that, if adopted, could impact our carriage of broadcast signals by simultaneously eliminating the cable industry’s compulsory copyright license and the retransmission consent requirements governing cable’s retransmission of broadcast signals. The FCC also continues to consider changes to the rules affecting the relationship between programmers (including broadcasters) and multichannel video distributors. Future regulatory changes could disrupt existing programming commitments, interfere with our preferred use of limited channel capacity, increase our programming costs, and limit our ability to offer services that would maximize our revenue potential. It is possible that other legal restraints will be adopted limiting our discretion over programming decisions.
33
Our voice service is subject to regulatory burdens which may increase, causing us to incur additional costs.
We offer voice communications services over our broadband network using VoIP services. The FCC has ruled that competitive telephone companies that support VoIP services, such as those we offer our customers, are entitled to interconnect with incumbent providers of traditional telecommunications services, which ensures that our VoIP services can compete in the market. The scope of these interconnection rights are being reviewed in a current FCC proceeding, which may affect our ability to compete in the provision of voice services or result in additional costs. The FCC has also declared that certain VoIP services are not subject to traditional state public utility regulation. The full extent of the FCC preemption of state and local regulation of VoIP services is not yet clear. Telecommunications companies generally are subject to other significant regulation which could also be extended to VoIP providers. If additional telecommunications regulations are applied to our VoIP service, it could cause us to incur additional costs. The FCC has already extended certain traditional telecommunications carrier requirements to many VoIP providers such as us, including E911, Universal Service fund collection, CALEA, privacy of Customer Proprietary Network Information, number porting, network outage reporting, rural call completion reporting, disability access and discontinuance of service requirements. In November 2011, the FCC released an order significantly changing the rules governing intercarrier compensation payments for the origination and termination of telephone traffic between carriers, including VoIP service providers like us. The United States Court of Appeals for the Tenth Circuit upheld the rules in May 2014. The new rules will result in a substantial decrease in intercarrier compensation payments over a multi-year period. We received intercarrier compensation of approximately
$23 million
,
$21 million
and
$19 million
for the years ended
December 31, 2014
,
2013
and
2012
, respectively.
Item 1B.
Unresolved Staff Comments
.
None.
Item 2.
Properties.
Our principal physical assets consist of cable distribution plant and equipment, including signal receiving, encoding and decoding devices, headend reception facilities, distribution systems, and customer premise equipment for each of our cable systems.
Our cable plant and related equipment are generally attached to utility poles under pole rental agreements with local public utilities and telephone companies, and in certain locations are buried in underground ducts or trenches. We own or lease real property for signal reception sites, and own our service vehicles.
Our subsidiaries generally lease space for business offices. Our headend and tower locations are located on owned or leased parcels of land, and we generally own the towers on which our equipment is located. Charter Holdco owns the land and building for our St. Louis corporate office. We lease space for our offices in Denver, Colorado and for our corporate headquarters in Stamford, Connecticut.
The physical components of our cable systems require maintenance as well as periodic upgrades to support the new services and products we introduce. See “Item 1. Business – Our Network Technology.” We believe that our properties are generally in good operating condition and are suitable for our business operations.
Item 3.
Legal Proceedings.
On January 15, 2014, the California Department of Justice, in conjunction with the Alameda County, California District Attorney’s Office, initiated an investigation into whether Charter’s waste disposal policies, practices, and procedures violate the provisions of the California Health and Safety Code, the California Hazardous Waste Control Law, and any of their related regulations. Charter is cooperating with the investigation. At this time Charter does not expect that its outcome will have a material effect on our operations, financial condition, or cash flows.
Patent Litigation
We are defendants or co-defendants in several unrelated lawsuits involving alleged infringement of various patents relating to various aspects of our businesses. Other industry participants are also defendants in certain of these cases.
In the event that a court ultimately determines that we infringe on any intellectual property rights, we may be subject to substantial damages and/or an injunction that could require us or our vendors to modify certain products and services we offer to our subscribers, as well as negotiate royalty or license agreements with respect to the patents at issue. While we believe the lawsuits are without merit and intend to defend the actions vigorously, no assurance can be given that any adverse outcome would not be material to our consolidated financial condition, results of operations, or liquidity.
34
Other Proceedings
We are party to other lawsuits and claims that arise in the ordinary course of conducting our business, including lawsuits claiming violation of anti-trust laws and violation of wage and hour laws. The ultimate outcome of these other legal matters pending against us or our subsidiaries cannot be predicted, and although such lawsuits and claims are not expected individually to have a material adverse effect on our consolidated financial condition, results of operations, or liquidity, such lawsuits could have in the aggregate a material adverse effect on our consolidated financial condition, results of operations, or liquidity. Whether or not we ultimately prevail in any particular lawsuit or claim, litigation can be time consuming and costly and injure our reputation.
Item 4.
Mine Safety Disclosures.
Not applicable.
35
Item 5.
Market for Registrant’s Common Equity, Related Stockholder Matters and Issuer Purchases of Equity Securities.
|
(A)
|
Market Information
|
Charter’s Class A common stock is listed on the NASDAQ Global Select Market under the symbol “CHTR.”
The following table sets forth, for the periods indicated, the range of high and low last reported sale price per share of Charter’s Class A common stock on the NASDAQ Global Select Market.
Class A Common Stock
|
High
|
Low
|
|||||||
|
2013
|
||||||||
|
First quarter
|
$
|
106.29
|
|
$
|
76.19
|
|
||
|
Second quarter
|
$
|
128.57
|
|
$
|
99.41
|
|
||
|
Third quarter
|
$
|
137.29
|
|
$
|
119.06
|
|
||
|
Fourth quarter
|
$
|
144.02
|
|
$
|
125.68
|
|
||
|
2014
|
||||||||
|
First quarter
|
$
|
138.86
|
|
$
|
121.25
|
|
||
|
Second quarter
|
$
|
158.38
|
|
$
|
117.83
|
|
||
|
Third quarter
|
$
|
164.15
|
|
$
|
151.37
|
|
||
|
Fourth quarter
|
$
|
169.70
|
|
$
|
140.25
|
|
||
|
(B)
|
Holders
|
As of
December 31, 2014
, there were approximately 38 holders of record of Charter’s Class A common stock.
|
(C)
|
Dividends
|
Charter has not paid stock or cash dividends on any of its common stock.
Charter would be dependent on distributions from its subsidiaries if Charter were to make any dividends. Covenants in the indentures and credit agreement governing the debt obligations of our subsidiaries restrict their ability to make distributions to us, and accordingly, limit our ability to declare or pay cash dividends. See “Part II. Item 7. Management’s Discussion and Analysis of Financial Condition and Results of Operations.” Future cash dividends, if any, will be at the discretion of Charter’s board of directors and will depend upon, among other things, our future operations and earnings, capital requirements, general financial condition, contractual restrictions and such other factors as Charter’s board of directors may deem relevant.
36
(D) Securities Authorized for Issuance Under Equity Compensation Plans
The following information is provided as of
December 31, 2014
with respect to equity compensation plans:
|
Plan Category
|
Number of Securities to be Issued Upon Exercise of Outstanding Options, Warrants and Rights
|
Weighted Average Exercise Price of Outstanding Warrants and Rights
|
Number of Securities Remaining Available for Future Issuance Under Equity Compensation Plans
|
|||||||||
|
Equity compensation plans approved by security holders
|
4,014,471
|
|
(1)
|
$
|
87.72
|
|
6,181,469
|
|
(1)
|
|||
|
Equity compensation plans not approved by security holders
|
—
|
|
$
|
—
|
|
—
|
|
|||||
|
TOTAL
|
4,014,471
|
|
(1)
|
6,181,469
|
|
(1)
|
||||||
|
(1)
|
This total does not include 430,942 shares issued pursuant to restricted stock grants made under our 2009 Stock Incentive Plan, which are subject to vesting based on continued employment and market conditions.
|
For information regarding securities issued under our equity compensation plans, see Note 15 to our accompanying consolidated financial statements contained in “Item 8. Financial Statements and Supplementary Data.”
37
(E) Performance Graph
The graph below shows the cumulative total return on Charter’s Class A common stock for the period from December 2, 2009 through
December 31, 2014
, in comparison to the cumulative total return on Standard & Poor’s 500 Index and a peer group consisting of the national cable operators that are most comparable to us in terms of size and nature of operations. The Company’s peer group consists of Cablevision Systems Corporation ("Cablevision"), Comcast, and TWC. The results shown assume that $100 was invested on December 2, 2009 in Charter and peer group stock or on November 30, 2009 for the S&P 500 index and that all dividends were reinvested. These indices are included for comparative purposes only and do not reflect whether it is management’s opinion that such indices are an appropriate measure of the relative performance of the stock involved, nor are they intended to forecast or be indicative of future performance of Charter’s Class A common stock.

(F) Recent Sales of Unregistered Securities
During
2014
, there were no unregistered sales of securities of the registrant other than those previously reported on a Quarterly Report on Form 10-Q or Current Report on Form 8-K.
38
(G)
Purchases of Equity Securities by the Issuer
The following table presents Charter's purchases of equity securities completed during the fourth quarter of
2014
representing shares withheld from employees for the payment of taxes upon the vesting of equity awards.
|
Period
|
(a)
Total Number of Shares Purchased
|
(b)
Average Price Paid per Share
|
(c)
Total Number of Shares Purchased as Part of Publicly Announced Plans or Programs
|
(d)
Maximum Number of Shares that May Yet Be Purchased Under the Plans or Programs
|
|||
|
October 1 - 31, 2014
|
4,414
|
$
|
145.16
|
|
—
|
|
N/A
|
|
November 1 - 30, 2014
|
338
|
$
|
154.97
|
|
—
|
|
N/A
|
|
December 1 - 31, 2014
|
13,863
|
$
|
165.29
|
|
—
|
|
N/A
|
Item 6.
Selected Financial Data
.
The following table presents selected consolidated financial data for the periods indicated (dollars in millions, except per share data):
|
Years Ended December 31,
|
|||||||||||||||||||
|
2014
|
2013
|
2012
|
2011
|
2010
|
|||||||||||||||
|
Statement of Operations Data:
|
|||||||||||||||||||
|
Revenues
|
$
|
9,108
|
|
$
|
8,155
|
|
$
|
7,504
|
|
$
|
7,204
|
|
$
|
7,059
|
|
||||
|
Income from operations
|
$
|
971
|
|
$
|
909
|
|
$
|
915
|
|
$
|
1,041
|
|
$
|
1,024
|
|
||||
|
Interest expense, net
|
$
|
(911
|
)
|
$
|
(846
|
)
|
$
|
(907
|
)
|
$
|
(963
|
)
|
$
|
(877
|
)
|
||||
|
Income (loss)
before income taxes
|
$
|
53
|
|
$
|
(49
|
)
|
$
|
(47
|
)
|
$
|
(70
|
)
|
$
|
58
|
|
||||
|
Net loss
|
$
|
(183
|
)
|
$
|
(169
|
)
|
$
|
(304
|
)
|
$
|
(369
|
)
|
$
|
(237
|
)
|
||||
|
Loss per common share, basic and diluted
|
$
|
(1.70
|
)
|
$
|
(1.65
|
)
|
$
|
(3.05
|
)
|
$
|
(3.39
|
)
|
$
|
(2.09
|
)
|
||||
|
Weighted-average shares outstanding, basic and diluted
|
108,374,160
|
|
101,934,630
|
|
99,657,989
|
|
108,948,554
|
|
113,138,461
|
|
|||||||||
|
Balance Sheet Data (end of period):
|
|||||||||||||||||||
|
Investment in cable properties
|
$
|
16,652
|
|
$
|
16,556
|
|
$
|
14,870
|
|
$
|
14,843
|
|
$
|
15,027
|
|
||||
|
Total assets
|
$
|
24,550
|
|
$
|
17,295
|
|
$
|
15,596
|
|
$
|
15,601
|
|
$
|
15,737
|
|
||||
|
Total debt
|
$
|
21,023
|
|
$
|
14,181
|
|
$
|
12,808
|
|
$
|
12,856
|
|
$
|
12,306
|
|
||||
|
Shareholders’ equity
|
$
|
146
|
|
$
|
151
|
|
$
|
149
|
|
$
|
409
|
|
$
|
1,478
|
|
||||
|
Other Financial Data:
|
|||||||||||||||||||
|
Ratio of earnings to fixed charges (a)
|
1.06
|
|
N/A
|
|
N/A
|
|
N/A
|
|
1.07
|
|
|||||||||
|
Deficiency of earnings to cover fixed charges (a)
|
N/A
|
|
$
|
49
|
|
$
|
47
|
|
$
|
70
|
|
N/A
|
|
||||||
|
(a)
|
Earnings include income (loss) before non-controlling interest and income taxes plus fixed charges. Fixed charges consist of interest expense and an estimated interest component of rent expense.
|
Comparability of the above information from year to year is affected by acquisitions and dispositions completed by us including the acquisition of Bresnan in July 2013 and restricted cash and cash equivalents currently held in escrow pending consummation of the Transactions. See “Part II. Item 7. Management’s Discussion and Analysis of Financial Condition and Results of Operations.”
Item 7.
Management’s Discussion and Analysis of Financial Condition and Results of Operations.
Reference is made to “Part I. Item 1A. Risk Factors” and “Cautionary Statement Regarding Forward-Looking Statements,” which describe important factors that could cause actual results to differ from expectations and non-historical information contained herein. In addition, the following discussion should be read in conjunction with the audited consolidated financial statements and
39
accompanying notes thereto of Charter Communications, Inc. and subsidiaries included in “Part II. Item 8. Financial Statements and Supplementary Data.”
Overview
We are a cable operator providing services in the United States with approximately
6.2 million
residential and commercial customers at
December 31, 2014
. We offer our customers traditional cable video programming, Internet services, and voice services, as well as advanced video services such as video on demand, HD television and DVR service. We also sell local advertising on cable networks and provide fiber connectivity to cellular towers. See “Part I. Item 1. Business — Products and Services” for further description of these services, including “customers.”
Our most significant competitors are DBS providers and certain telephone companies that offer services that provide features and functions similar to our video, high-speed Internet, and voice services, including in some cases wireless services, and they also offer these services in bundles similar to ours. Customers have been more willing to consider our competitors' products, partially because of increased marketing highlighting perceived differences between competitive video products, especially when those competitors are often offering significant incentives to switch providers. Some consumers have chosen to receive video over the Internet rather than through pay television services including from us, thereby reducing our video revenues. See “Part I. Item 1. Business — Competition.” In the recent past, we have grown revenues by offsetting basic video customer losses with price increases and sales of incremental services such as high-speed Internet, video on demand, DVR and HD television. We expect to continue to grow revenues by increasing the number of products in our current customer homes and obtaining new customers with an improved value offering. In addition, we expect to increase revenues by expanding the sales of services to our commercial customers. However, we cannot assure you that we will be able to grow revenues or maintain our margins at recent historical rates.
Our business plans include goals for increasing customers and revenue. To reach our goals, we have actively invested in our network and operations, and have improved the quality and value of the products and packages that we offer. We have enhanced our video product by moving to an all-digital platform, offering more HD channels and increasing digital and HD-DVR penetration. We simplified our offers and pricing and improved our packaging of products to bring more value to new and existing customers. As part of our effort to create more value for customers, we have focused on driving penetration of our triple play offering, which includes more than 200 HD channels in most of our markets, video on demand, Internet service, and fully-featured voice service. In addition, we have implemented a number of changes to our organizational structure, selling methods and operating tactics. We have fully insourced our direct sales workforce and are increasingly insourcing our field operations and call center workforces and modifying the way our sales workforce is compensated, which we believe positions us for better customer service and growth. We expect that our enhanced product set combined with improved customer service will lead to lower customer churn and longer customer lifetimes, allowing us to grow our customer base and revenue more quickly and economically. We expect our capital expenditures to remain elevated as we strive to increase digital and HD-DVR penetration and place higher levels of customer premise equipment per transaction.
In July 2013, Charter and Charter Operating acquired Bresnan from a wholly owned subsidiary of Cablevision, for $1.625 billion in cash, as well as a working capital adjustment and a reduction for certain funded indebtedness of Bresnan (the "Bresnan Acquisition"). Bresnan managed cable operating systems in Colorado, Montana, Wyoming and Utah that passed approximately 670,000 homes and served approximately 375,000 residential and commercial customer relationships at the time they were acquired.
Total revenue growth was
12%
for the year ended
December 31, 2014
compared to the corresponding period in
2013
, and
9%
for the year ended
December 31, 2013
compared to the corresponding period in
2012
, due to the Bresnan Acquisition and growth in our video, Internet and commercial businesses. Total revenue growth on a pro forma basis for the Bresnan Acquisition as if it had occurred on January 1, 2012 was
8%
for the year ended December 31, 2014 compared to the corresponding period in 2013, and
5%
for the year ended
December 31, 2013
compared to the corresponding period in
2012
. For the years ended
December 31, 2014
,
2013
and
2012
, Adjusted EBITDA was
$3.2 billion
,
$2.9 billion
and
$2.7 billion
, respectively. Adjusted EBITDA is defined as net loss plus net interest expense, income tax expense, depreciation and amortization, stock compensation expense, loss on extinguishment of debt, gain (loss) on derivative instruments, net, and other operating expenses, such as merger and acquisition costs, special charges and (gain) loss on sale or retirement of assets. See “—Use of Adjusted EBITDA and Free Cash Flow” for further information on Adjusted EBITDA. Adjusted EBITDA increased
12%
for the year ended December 31, 2014 compared to the corresponding period in 2013 and
6%
for the year ended December 31, 2013 compared to the corresponding period in 2012 as a result of the Bresnan Acquisition, which contributed $96 million and $90 million, respectively, and an increase in residential and commercial revenues offset by increases in programming costs and other operating costs. For the years ended
December 31, 2014
,
2013
and
2012
, our income from operations was
$971 million
,
$909 million
and
$915 million
, respectively. In addition to the factors discussed above, income from operations was affected by increases in depreciation and amortization primarily due to the Bresnan Acquisition and current capital expenditures.
40
In connection with the Transactions, in 2014 we have incurred approximately $14 million in operating costs and expenses and $27 million of capital expenditures related to incremental transition costs required to position Charter to double its service footprint. We also incurred $38 million of incremental expenses related to advisory, legal and accounting fees which are reflected in other operating expenses, as well as approximately $75 million of interest expense associated with term loan G that was entered into in September 2014 and the issuance of the CCOH Safari Notes in November 2014. See "Part I. Item 1. Business — Transactions with Comcast."
Approximately 90%, 89% and 87% of our revenues for years ended
December 31, 2014
,
2013
and
2012
, respectively, are attributable to monthly subscription fees charged to customers for our video, Internet, voice, and commercial services provided by our cable systems. Generally, these customer subscriptions may be discontinued by the customer at any time subject to a fee for certain commercial customers. The remaining 10%, 11% and 13% of revenue for fiscal years
2014
,
2013
and
2012
, respectively, is derived primarily from advertising revenues, franchise and other regulatory fee revenues (which are collected by us but then paid to local authorities), pay-per-view and video on demand programming, installation, processing fees or reconnection fees charged to customers to commence or reinstate service, and commissions related to the sale of merchandise by home shopping services.
Our expenses primarily consist of operating costs, depreciation and amortization expense and interest expense. Operating costs primarily include programming costs, connectivity, franchise and other regulatory costs, the cost to service our customers such as field, network and customer operations costs and marketing costs.
We have a history of net losses. Our net losses are principally attributable to insufficient revenue to cover the combination of operating expenses, interest expenses that we incur because of our debt, depreciation expenses resulting from the capital investments we have made and continue to make in our cable properties, amortization expenses related to our customer relationship intangibles and non-cash taxes resulting from increases in our deferred tax liabilities.
Critical Accounting Policies and Estimates
Certain of our accounting policies require our management to make difficult, subjective and/or complex judgments. Management has discussed these policies with the Audit Committee of Charter’s board of directors, and the Audit Committee has reviewed the following disclosure. We consider the following policies to be the most critical in understanding the estimates, assumptions and judgments that are involved in preparing our financial statements, and the uncertainties that could affect our results of operations, financial condition and cash flows:
|
•
|
Property, plant and equipment
|
|
•
|
Capitalization of labor and overhead costs
|
|
•
|
Valuation and impairment of property, plant and equipment
|
|
•
|
Useful lives of property, plant and equipment
|
|
•
|
Intangible assets
|
|
•
|
Valuation and impairment of franchises
|
|
•
|
Valuation and impairment and amortization of customer relationships
|
|
•
|
Valuation and impairment of goodwill
|
|
•
|
Impairment of trademarks
|
|
•
|
Income taxes
|
|
•
|
Litigation
|
|
•
|
Programming agreements
|
In addition, there are other items within our financial statements that require estimates or judgment that are not deemed critical, such as the allowance for doubtful accounts and valuations of our derivative instruments, but changes in estimates or judgment in these other items could also have a material impact on our financial statements.
Property, plant and equipment
The cable industry is capital intensive, and a large portion of our resources are spent on capital activities associated with extending, rebuilding, and upgrading our cable network. As of
December 31, 2014
and
2013
, the net carrying amount of our property, plant and equipment (consisting primarily of cable network assets) was approximately
$8.4 billion
(representing
34%
of total assets) and
$8.0 billion
(representing
46%
of total assets), respectively. Total capital expenditures for the years ended
December 31, 2014
,
2013
and
2012
were approximately
$2.2 billion
,
$1.8 billion
and
$1.7 billion
, respectively.
41
Capitalization of labor and overhead costs.
Costs associated with network construction, initial customer installations, installation refurbishments, and the addition of network equipment necessary to provide new or advanced video services, are capitalized. While our capitalization is based on specific activities, once capitalized, we track these costs by fixed asset category at the cable system level, and not on a specific asset basis. For assets that are sold or retired, we remove the estimated applicable cost and accumulated depreciation. Costs capitalized as part of initial customer installations include materials, direct labor, and certain indirect costs. These indirect costs are associated with the activities of personnel who assist in connecting and activating the new service, and consist of compensation and overhead costs associated with these support functions. The costs of disconnecting service at a customer’s dwelling or reconnecting service to a previously installed dwelling are charged to operating expense in the period incurred. Costs for repairs and maintenance are charged to operating expense as incurred, while equipment replacement, including replacement of certain components, and betterments, including replacement of cable drops from the pole to the dwelling, are capitalized.
We make judgments regarding the installation and construction activities to be capitalized. We capitalize direct labor and overhead using standards developed from actual costs and applicable operational data. We calculate standards annually (or more frequently if circumstances dictate) for items such as the labor rates, overhead rates, and the actual amount of time required to perform a capitalizable activity. For example, the standard amounts of time required to perform capitalizable activities are based on studies of the time required to perform such activities. Overhead rates are established based on an analysis of the nature of costs incurred in support of capitalizable activities, and a determination of the portion of costs that is directly attributable to capitalizable activities. The impact of changes that resulted from these studies were not material in the periods presented.
Labor costs directly associated with capital projects are capitalized. Capitalizable activities performed in connection with customer installations include such activities as:
|
•
|
dispatching a “truck roll” to the customer’s dwelling or business for service connection;
|
|
•
|
verification of serviceability to the customer’s dwelling or business (i.e., determining whether the customer’s dwelling is capable of receiving service by our cable network and/or receiving advanced or Internet services);
|
|
•
|
customer premise activities performed by in-house field technicians and third-party contractors in connection with customer installations, installation of network equipment in connection with the installation of advanced services, and equipment replacement and betterment; and
|
|
•
|
verifying the integrity of the customer’s network connection by initiating test signals downstream from the headend to the customer’s digital set-top box.
|
Judgment is required to determine the extent to which overhead costs incurred result from specific capital activities, and therefore should be capitalized. The primary costs that are included in the determination of the overhead rate are (i) employee benefits and payroll taxes associated with capitalized direct labor, (ii) direct variable costs associated with capitalizable activities, consisting primarily of installation and construction vehicle costs, (iii) the cost of support personnel, such as dispatchers, who directly assist with capitalizable installation activities, and (iv) indirect costs directly attributable to capitalizable activities.
While we believe our existing capitalization policies are appropriate, a significant change in the nature or extent of our system activities could affect management’s judgment about the extent to which we should capitalize direct labor or overhead in the future. We monitor the appropriateness of our capitalization policies, and perform updates to our internal studies on an ongoing basis to determine whether facts or circumstances warrant a change to our capitalization policies. We capitalized internal direct labor and overhead of $277 million, $219 million and $202 million, respectively, for the years ended
December 31, 2014
,
2013
and
2012
.
Valuation and impairment.
We evaluate the recoverability of our property, plant and equipment upon the occurrence of events or changes in circumstances indicating that the carrying amount of an asset may not be recoverable. Such events or changes in circumstances could include such factors as the impairment of our indefinite life franchises, changes in technological advances, fluctuations in the fair value of such assets, adverse changes in relationships with local franchise authorities, adverse changes in market conditions, or a deterioration of current or expected future operating results. A long-lived asset is deemed impaired when the carrying amount of the asset exceeds the projected undiscounted future cash flows associated with the asset. No impairments of long-lived assets to be held and used were recorded in the years ended
December 31, 2014
,
2013
and
2012
.
We utilize the cost approach as the primary method used to establish fair value for our property, plant and equipment in connection with business combinations. The cost approach considers the amount required to replace an asset by constructing or purchasing a new asset with similar utility, then adjusts the value in consideration of all forms of depreciation as of the appraisal date for physical depreciation and function and economic obsolescence. The cost approach relies on management’s assumptions regarding current material and labor costs required to rebuild and repurchase significant components of our property, plant and equipment along with assumptions regarding the age and estimated useful lives of our property, plant and equipment.
42
Useful lives of property, plant and equipment.
We evaluate the appropriateness of estimated useful lives assigned to our property, plant and equipment, based on annual analysis of such useful lives, and revise such lives to the extent warranted by changing facts and circumstances. Any changes in estimated useful lives as a result of this analysis are reflected prospectively beginning in the period in which the study is completed. Our analysis of useful lives in
2014
did not indicate a change in useful lives. The effect of a one-year decrease in the weighted average remaining useful life of our property, plant and equipment as of
December 31, 2014
would be an increase in annual depreciation expense of approximately $83 million. The effect of a one-year increase in the weighted average remaining useful life of our property, plant and equipment as of
December 31, 2014
would be a decrease in annual depreciation expense of approximately $224 million.
Depreciation expense related to property, plant and equipment totaled $1.8 billion, $1.6 billion and $1.4 billion for the years ended
December 31, 2014
,
2013
and
2012
, respectively, representing approximately 22%, 22% and 21% of costs and expenses, respectively. Depreciation is recorded using the straight-line composite method over management’s estimate of the useful lives of the related assets as listed below:
|
Cable distribution systems………………………………
|
7-20 years
|
|
|
Customer equipment and installations…………………..
|
3-8 years
|
|
|
Vehicles and equipment…………………………………
|
3-6 years
|
|
|
Buildings and leasehold improvements…………………
|
15-40 years
|
|
|
Furniture, fixtures and equipment….……………………
|
6-10 years
|
|
Intangible assets
Valuation and impairment of franchises.
The net carrying value of franchises as of
December 31, 2014
and
2013
was approximately
$6.0 billion
(representing
24%
of total assets) and
$6.0 billion
(representing
35%
of total assets), respectively. For more information and a complete discussion of how we test franchise assets for impairment, see Note 6 to the accompanying consolidated financial statements contained in “Part II. Item 8. Financial Statements and Supplementary Data.”
In 2014, 2013 and 2012, we concluded that it is more likely than not that the fair value of the franchise assets in each unit of accounting exceeds the carrying value of such assets and therefore did not perform a quantitative analysis. At our last quantitative assessment, the fair value of franchises exceeded the book values for each unit of accounting by 24% to 89%.
Valuation and impairment of goodwill.
The net carrying value of goodwill as of
December 31, 2014
and
2013
was approximately
$1.2 billion
(representing
5%
of total assets) and
$1.2 billion
(representing
7%
of total assets), respectively. For more information and a complete discussion on our valuation methodology, see Note 6 to the accompanying consolidated financial statements contained in “Part II. Item 8. Financial Statements and Supplementary Data.”
As with our franchise impairment testing, in 2014, 2013 and 2012, we elected to perform a qualitative assessment for our goodwill impairment testing and concluded that our goodwill is not impaired.
Valuation, impairment and amortization of customer relationships.
The net carrying value of customer relationships as of
December 31, 2014
and
2013
was approximately
$1.1 billion
(representing
5%
of total assets) and
$1.4 billion
(representing
8%
of total assets), respectively. Amortization expense related to customer relationships for the years ended
December 31, 2014
,
2013
and
2012
was approximately $282 million, $284 million and $280 million, respectively. For more information and a complete discussion on our valuation methodology, see Note 6 to the accompanying consolidated financial statements contained in “Part II. Item 8. Financial Statements and Supplementary Data.”
Impairment of trademarks.
The net carrying value of trademarks as of both
December 31, 2014
and
2013
was approximately $159 million and $158 million, respectively (representing 1% of total assets for both periods). For more information and a complete discussion on our valuation methodology, see Note 6 to the accompanying consolidated financial statements contained in “Part II. Item 8. Financial Statements and Supplementary Data.” The qualitative analysis in 2014, 2013 and 2012 did not identify any factors that would indicate that it was more likely than not that the fair value of trademarks were less than the carrying value and thus resulted in no impairment.
Income taxes
All of Charter’s operations are held through Charter Holdco and its direct and indirect subsidiaries. Charter Holdco and the majority of its subsidiaries are generally limited liability companies that are not subject to income tax. However, certain of these
43
limited liability companies are subject to state income tax. In addition, the indirect subsidiaries that are corporations are subject to federal and state income tax. All of the remaining taxable income, gains, losses, deductions and credits of Charter Holdco pass through to Charter and its direct subsidiaries.
As of
December 31, 2014
, Charter and its indirect corporate subsidiaries had approximately
$9.5 billion
of federal tax net operating loss carryforwards resulting in a gross deferred tax asset of approximately
$3.3 billion
. Federal tax net operating loss carryforwards expire in the years 2020 through 2034. These losses resulted from the operations of Charter Holdco and its subsidiaries. In addition, as of
December 31, 2014
, Charter and its indirect corporate subsidiaries had state tax net operating loss carryforwards, resulting in a gross deferred tax asset (net of federal tax benefit) of approximately
$321 million
. State tax net operating loss carryforwards generally expire in the years 2015 through 2034. Due to uncertainties in projected future taxable income, valuation allowances have been established against the gross deferred tax assets for book accounting purposes, except for future taxable income that will result from the reversal of existing temporary differences for which deferred tax liabilities are recognized. Such tax loss carryforwards can accumulate and be used to offset Charter’s future taxable income.
As of
December 31, 2014
,
$5.3 billion
of federal tax loss carryforwards are unrestricted and available for Charter’s immediate use, while approximately
$4.2 billion
of federal tax loss carryforwards are still subject to Section 382 and other restrictions. Pursuant to these restrictions, Charter estimates that approximately
$2.0 billion
and
$400 million
in the years 2015 and 2016, respectively, and an additional
$226 million
annually over each of the next eight years of federal tax loss carryforwards, should become unrestricted and available for Charter’s use. Both Charter’s indirect corporate subsidiary and state tax loss carryforwards are subject to similar but varying restrictions.
In addition to its tax loss carryforwards, Charter also has tax basis of $4.5 billion in intangible assets and $4.6 billion in property, plant, and equipment as of
December 31, 2014
. The tax basis in these assets is not subject to Section 382 limitations and therefore is currently deductible as depreciated or amortized. For illustrative purposes, Charter expects to reflect tax-deductible amortization and depreciation on assets owned as of
December 31, 2014
, beginning at approximately $1.9 billion in 2015 and $3.9 billion between 2016 through 2019, decelerating annually. The foregoing projected deductions do not include any amortization or depreciation related to future capital spend or potential acquisitions. In addition, the deductions assume Charter does not dispose of a material portion of its business or make modifications to the underlying partnerships it owns, all of which may materially affect the timing or amount of its existing amortization and depreciation deductions. Any one of these factors including pending transactions, future legislation or adjustments by the IRS upon examination could also affect the projected deductions.
As of
December 31, 2014
and
2013
, we have recorded net deferred income tax liabilities of
$1.6 billion
and
$1.4 billion
, respectively. Net deferred tax liabilities included approximately
$236 million
and
$226 million
at
December 31, 2014
and
2013
, respectively, relating to certain indirect subsidiaries of Charter Holdco that file separate federal or state income tax returns. The remainder of our net deferred tax liability arose from Charter's investment in Charter Holdco, and was largely attributable to the characterization of franchises for financial reporting purposes as indefinite-lived. As part of our net liability, on
December 31, 2014
and
2013
, we had gross deferred tax assets of
$4.4 billion
and
$3.9 billion
, respectively, which primarily relate to tax losses allocated to Charter from Charter Holdco. In assessing the realizability of deferred tax assets, management considers whether it is more likely than not that some portion or all of the deferred tax assets will be realized. Due to our history of losses and limitations imposed by Section 382 of the Code discussed above, we were unable to assume future taxable income in our analysis and accordingly valuation allowances have been established except for deferred benefits available to offset certain deferred tax liabilities that will reverse over time. Accordingly, our gross deferred tax assets have been offset with a corresponding valuation allowance of
$3.1 billion
and
$3.0 billion
at
December 31, 2014
and
2013
, respectively. The amount of the deferred tax assets considered realizable and, therefore, reflected in the consolidated balance sheet, would be increased at such time that it is more-likely-than-not future taxable income will be realized during the carryforward period. We periodically evaluate the facts and circumstances surrounding this assessment and, at the time this consideration is met, an adjustment to reverse some portion of the existing valuation allowance would result.
In determining our tax provision for financial reporting purposes, Charter establishes a reserve for uncertain tax positions unless such positions are determined to be “more likely than not” of being sustained upon examination, based on their technical merits. In evaluating whether a tax position has met the more-likely-than-not recognition threshold, we presume the position will be examined by the appropriate taxing authority that has full knowledge of all relevant information. A tax position that meets the more-likely-than-not recognition threshold is measured to determine the amount of benefit to be recognized in our financial statements. The tax position is measured as the largest amount of benefit that has a greater than 50% likelihood of being realized when the position is ultimately resolved. There is considerable judgment involved in determining whether positions taken on the tax return are “more likely than not” of being sustained.
Charter adjusts its uncertain tax reserve estimates periodically because of ongoing examinations by, and settlements with, the various taxing authorities, as well as changes in tax laws, regulations and interpretations.
44
No tax years for Charter or Charter Holdco, for income tax purposes, are currently under examination by the IRS. Tax years ending 2011 through 2014 remain subject to examination and assessment. Years prior to 2011 remain open solely for purposes of examination of Charter’s loss and credit carryforwards.
Litigation
Legal contingencies have a high degree of uncertainty. When a loss from a contingency becomes estimable and probable, a reserve is established. The reserve reflects management's best estimate of the probable cost of ultimate resolution of the matter and is revised as facts and circumstances change. A reserve is released when a matter is ultimately brought to closure or the statute of limitations lapses. We have established reserves for certain matters. Although certain matters are not expected individually to have a material adverse effect on our consolidated financial condition, results of operations or liquidity, such matters could have, in the aggregate, a material adverse effect on our consolidated financial condition, results of operations or liquidity.
Programming Agreements
We exercise significant judgment in estimating programming expense associated with certain video programming contracts. Our policy is to record video programming costs based on our contractual agreements with our programming vendors, which are generally multi-year agreements that provide for us to make payments to the programming vendors at agreed upon market rates based on the number of customers to which we provide the programming service. If a programming contract expires prior to the parties' entry into a new agreement and we continue to distribute the service, we estimate the programming costs during the period there is no contract in place. In doing so, we consider the previous contractual rates, inflation and the status of the negotiations in determining our estimates. When the programming contract terms are finalized, an adjustment to programming expense is recorded, if necessary, to reflect the terms of the new contract. We also make estimates in the recognition of programming expense related to other items, such as the accounting for free periods, timing of rate increases and credits from service interruptions, as well as the allocation of consideration exchanged between the parties in multiple-element transactions.
Significant judgment is also involved when we enter into agreements that result in us receiving cash consideration from the programming vendor, usually in the form of advertising sales, channel positioning fees, launch support or marketing support. In these situations, we must determine based upon facts and circumstances if such cash consideration should be recorded as revenue, a reduction in programming expense or a reduction in another expense category (e.g., marketing).
45
Results of Operations
The following table sets forth the percentages of revenues that items in the accompanying consolidated statements of operations constituted for the periods presented (dollars in millions, except per share data):
|
Year Ended December 31,
|
||||||||||||||||||||
|
2014
|
2013
|
2012
|
||||||||||||||||||
|
Revenues
|
$
|
9,108
|
|
100
|
%
|
$
|
8,155
|
|
100
|
%
|
$
|
7,504
|
|
100
|
%
|
|||||
|
Costs and Expenses:
|
||||||||||||||||||||
|
Operating costs and expenses (excluding depreciation and amortization)
|
5,973
|
|
66
|
%
|
5,345
|
|
66
|
%
|
4,860
|
|
65
|
%
|
||||||||
|
Depreciation and amortization
|
2,102
|
|
23
|
%
|
1,854
|
|
23
|
%
|
1,713
|
|
23
|
%
|
||||||||
|
Other operating expenses, net
|
62
|
|
1
|
%
|
47
|
|
1
|
%
|
16
|
|
—
|
%
|
||||||||
|
8,137
|
|
90
|
%
|
7,246
|
|
89
|
%
|
6,589
|
|
88
|
%
|
|||||||||
|
Income from operations
|
971
|
|
10
|
%
|
909
|
|
11
|
%
|
915
|
|
12
|
%
|
||||||||
|
Interest expense, net
|
(911
|
)
|
(846
|
)
|
(907
|
)
|
||||||||||||||
|
Loss on extinguishment of debt
|
—
|
|
(123
|
)
|
(55
|
)
|
||||||||||||||
|
Gain (loss) on derivative instruments, net
|
(7
|
)
|
11
|
|
—
|
|
||||||||||||||
|
Income (loss) before income taxes
|
53
|
|
(49
|
)
|
(47
|
)
|
||||||||||||||
|
Income tax expense
|
(236
|
)
|
(120
|
)
|
(257
|
)
|
||||||||||||||
|
Net loss
|
$
|
(183
|
)
|
$
|
(169
|
)
|
$
|
(304
|
)
|
|||||||||||
|
LOSS PER COMMON SHARE, BASIC AND DILUTED:
|
$
|
(1.70
|
)
|
$
|
(1.65
|
)
|
$
|
(3.05
|
)
|
|||||||||||
|
Weighted average common shares outstanding, basic and diluted
|
108,374,160
|
|
101,934,630
|
|
99,657,989
|
|
||||||||||||||
Revenues.
Total revenues grew
$953 million
or
12%
in the year ended
December 31, 2014
as compared to
2013
and grew
$651 million
or
9%
in the year ended
December 31, 2013
as compared to
2012
. Revenue growth primarily reflects increases in the number of residential Internet and triple play customers and in commercial business customers, growth in expanded basic and digital penetration, promotional and annual rate increases, and higher advanced services penetration offset by a decrease in basic video customers. The Bresnan Acquisition increased revenues in
2014
as compared to
2013
by approximately $276 million and approximately $270 million in
2013
as compared to
2012
.
Revenues by service offering were as follows (dollars in millions; all percentages are calculated using actual amounts. Minor differences may exist due to rounding):
|
Years ended December 31,
|
||||||||||||||||||||||||||||||||||
|
2014
|
2013
|
2012
|
2014 over 2013
|
2013 over 2012
|
||||||||||||||||||||||||||||||
|
Revenues
|
% of Revenues
|
Revenues
|
% of Revenues
|
Revenues
|
% of Revenues
|
Change
|
% Change
|
Change
|
% Change
|
|||||||||||||||||||||||||
|
Video
|
$
|
4,443
|
|
49
|
%
|
$
|
4,040
|
|
50
|
%
|
$
|
3,649
|
|
49
|
%
|
$
|
403
|
|
10
|
%
|
$
|
391
|
|
11
|
%
|
|||||||||
|
Internet
|
2,576
|
|
28
|
%
|
2,186
|
|
27
|
%
|
1,866
|
|
25
|
%
|
390
|
|
18
|
%
|
320
|
|
17
|
%
|
||||||||||||||
|
Voice
|
575
|
|
6
|
%
|
644
|
|
8
|
%
|
828
|
|
11
|
%
|
(69
|
)
|
(11
|
)%
|
(184
|
)
|
(22
|
)%
|
||||||||||||||
|
Commercial
|
993
|
|
11
|
%
|
812
|
|
10
|
%
|
648
|
|
9
|
%
|
181
|
|
22
|
%
|
164
|
|
25
|
%
|
||||||||||||||
|
Advertising sales
|
341
|
|
4
|
%
|
291
|
|
4
|
%
|
334
|
|
4
|
%
|
50
|
|
17
|
%
|
(43
|
)
|
(13
|
)%
|
||||||||||||||
|
Other
|
180
|
|
2
|
%
|
182
|
|
2
|
%
|
179
|
|
2
|
%
|
(2
|
)
|
(1
|
)%
|
3
|
|
2
|
%
|
||||||||||||||
|
$
|
9,108
|
|
100
|
%
|
$
|
8,155
|
|
100
|
%
|
$
|
7,504
|
|
100
|
%
|
$
|
953
|
|
12
|
%
|
$
|
651
|
|
9
|
%
|
||||||||||
46
Video revenues consist primarily of revenues from basic and digital video services provided to our non-commercial customers, as well as franchise fees, equipment rental and video installation revenue. Residential video customers decreased by
17,000
in
2014
and increased 188,000 in
2013
. However, after giving effect to the Bresnan Acquisition, residential basic video customers decreased by 109,000 in
2013
. The changes in video revenues are attributable to the following (dollars in millions):
|
2014 compared to 2013
|
2013 compared to 2012
|
|||||||
|
Incremental video services, price adjustments and bundle revenue allocation
|
$
|
330
|
|
$
|
375
|
|
||
|
Decrease in basic video customers
|
(49
|
)
|
(98
|
)
|
||||
|
Decrease in premium, video on demand and pay-per-view
|
(16
|
)
|
(20
|
)
|
||||
|
Bresnan Acquisition
|
138
|
|
134
|
|
||||
|
$
|
403
|
|
$
|
391
|
|
|||
Residential Internet customers grew by
383,000
and 598,000 customers in
2014
and
2013
, respectively, or 324,000 customers in
2013
, after giving effect to the Bresnan Acquisition. The increases in Internet revenues from our residential customers are attributable to the following (dollars in millions):
|
2014 compared to 2013
|
2013 compared to 2012
|
|||||||
|
Increase in residential Internet customers
|
$
|
200
|
|
$
|
142
|
|
||
|
Service level changes and price adjustments
|
116
|
|
106
|
|
||||
|
Bresnan Acquisition
|
74
|
|
72
|
|
||||
|
$
|
390
|
|
$
|
320
|
|
|||
Residential voice customers grew by
166,000
and 359,000 customers in
2014
and
2013
, respectively, or 200,000 customers in
2013
, after giving effect to the Bresnan Acquisition. The changes in voice revenues from our residential customers are attributable to the following (dollars in millions):
|
2014 compared to 2013
|
2013 compared to 2012
|
|||||||
|
Price adjustments and bundle revenue allocation
|
$
|
(135
|
)
|
$
|
(259
|
)
|
||
|
Increase in residential voice customers
|
43
|
|
51
|
|
||||
|
Bresnan Acquisition
|
23
|
|
24
|
|
||||
|
$
|
(69
|
)
|
$
|
(184
|
)
|
|||
47
Commercial revenues consist primarily of revenues from services provided to our commercial customers. Commercial PSUs increased
52,000
and 100,000 in
2014
and
2013
, respectively, or 64,000 customers in
2013
, after giving effect to the Bresnan Acquisition. The increases in commercial revenues are attributable to the following (dollars in millions):
|
2014 compared to 2013
|
2013 compared to 2012
|
|||||||
|
Sales to small-to-medium sized business customers
|
$
|
115
|
|
$
|
97
|
|
||
|
Carrier site customers
|
16
|
|
25
|
|
||||
|
Other
|
18
|
|
11
|
|
||||
|
Bresnan Acquisition
|
32
|
|
31
|
|
||||
|
$
|
181
|
|
$
|
164
|
|
|||
Advertising sales revenues consist primarily of revenues from commercial advertising customers, programmers and other vendors. Advertising sales revenues increased in
2014
primarily as a result of an increase in revenue from the political sector of $30 million. Advertising sales revenues decreased in
2013
primarily as a result of a decrease in revenue from the political and retail sectors of $30 million and $20 million, respectively. The Bresnan Acquisition increased advertising sales revenue by approximately $7 million in each of 2014 and 2013 compared to the corresponding prior year periods.
Other revenues consist of home shopping, late payment fees, wire maintenance fees and other miscellaneous revenues. The decrease in
2014
was primarily due to a decrease in wire maintenance fees. The increase in
2013
was primarily the result of increases in late payment fees. The Bresnan Acquisition increased other revenues in each of 2014 and 2013 compared to the corresponding prior year periods by approximately $2 million.
Operating costs and expenses
.
The increases in our operating costs and expenses are attributable to the following (dollars in millions):
|
2014 compared to 2013
|
2013 compared to 2012
|
|||||||
|
Programming
|
$
|
234
|
|
$
|
108
|
|
||
|
Franchise, regulatory and connectivity
|
11
|
|
(1
|
)
|
||||
|
Costs to service customers
|
67
|
|
116
|
|
||||
|
Marketing
|
27
|
|
38
|
|
||||
|
Other
|
109
|
|
44
|
|
||||
|
Bresnan Acquisition
|
180
|
|
180
|
|
||||
|
$
|
628
|
|
$
|
485
|
|
|||
Programming costs were approximately
$2.5 billion
,
$2.1 billion
and
$2.0 billion
, representing
41%
,
40%
and
40%
of operating costs and expenses for each of the years ended
December 31, 2014
,
2013
and
2012
, respectively. Programming costs consist primarily of costs paid to programmers for basic, digital, premium, video on demand, and pay-per-view programming. The increase in programming costs is primarily a result of annual contractual rate adjustments, including increases in amounts paid for retransmission consents, broader carriage of certain networks as a result of our all-digital initiative and the introduction of new networks to Charter's video offering. We expect programming expenses to continue to increase due to a variety of factors, including annual increases imposed by programmers with additional selling power as a result of media consolidation, increased demands by owners of broadcast stations for payment for retransmission consent or linking carriage of other services to retransmission consent, and additional programming, particularly new sports services. We have been unable to fully pass these increases on to our customers nor do we expect to be able to do so in the future without a potential loss of customers.
Costs to service customers include residential and commercial costs related to field operations, network operations and customer care including internal and third party labor for installations, service and repair, maintenance, billing and collection, occupancy and vehicle costs. The increase in costs to service customers was primarily the result of higher spending on labor to deliver
48
improved products and service levels and higher collection costs. During 2013, the increase was also the result of greater reconnect expense.
The increase in marketing costs during 2014 and 2013 was the result of heavier sales activity and sales channel development.
The increases in other expense are attributable to the following (dollars in millions):
|
2014 compared to 2013
|
2013 compared to 2012
|
|||||||
|
Administrative labor
|
$
|
46
|
|
$
|
(4
|
)
|
||
|
Commercial sales expense
|
27
|
|
30
|
|
||||
|
Advertising sales expense
|
17
|
|
6
|
|
||||
|
Bad debt
|
16
|
|
(6
|
)
|
||||
|
Stock compensation expense
|
7
|
|
(2
|
)
|
||||
|
Property tax and insurance
|
(9
|
)
|
14
|
|
||||
|
Other
|
5
|
|
6
|
|
||||
|
$
|
109
|
|
$
|
44
|
|
|||
The increase in administrative labor in 2014 compared to 2013 relates primarily to increases in the number of employees. Commercial sales expense and advertising sales expenses increased in
2014
and
2013
compared to the corresponding prior periods primarily related to growth in these businesses. The increase in bad debt in 2014 compared to 2013 is primarily related to a third quarter change in our collections policy and lower recoveries. The increase in property tax and insurance in 2013 compared to 2012 relates primarily to increases in the number of employees and vehicles.
Depreciation and amortization.
Depreciation and amortization expense increased by
$248 million
and
$141 million
in
2014
and
2013
, respectively, which primarily represents depreciation on more recent capital expenditures and the Bresnan Acquisition offset by certain assets becoming fully depreciated.
Other operating expenses, net.
The changes in other operating expenses, net are attributable to the following (dollars in millions):
|
2014 compared to 2013
|
2013 compared to 2012
|
|||||||
|
Increases in merger and acquisitions costs
|
$
|
22
|
|
$
|
15
|
|
||
|
Increases in (gain) loss on sales of assets
|
$
|
2
|
|
$
|
13
|
|
||
|
Increases (decreases) in special charges, net
|
(9
|
)
|
3
|
|
||||
|
$
|
15
|
|
$
|
31
|
|
|||
For more information, see Note 14 to the accompanying consolidated financial statements contained in “Part II. Item 8. Financial Statements and Supplementary Data.”
Interest expense, net.
Net interest expense increased by
$65 million
in
2014
from
2013
and decreased by
$61 million
in
2013
from
2012
. Net interest expense increased in
2014
compared to
2013
primarily as a result of an increase in our weighted average debt outstanding from $13.6 billion for the year ended
December 31, 2013
to $15.8 billion for the year ended
December 31, 2014
offset by a decrease in our weighted average interest rate from 5.8% for the year ended
December 31, 2013
to 5.5% for the year ended
December 31, 2014
. During the year ended December 31, 2014, we incurred approximately $75 million of interest expense associated with debt which proceeds are currently held in escrow pending consummation of the Transactions. Net interest expense decreased in
2013
compared to
2012
primarily as a result of a decrease in our weighted average interest rate from 6.5% for the year ended
December 31, 2012
to 5.8% for the year ended
December 31, 2013
offset by an increase in our weighted average debt outstanding from $13.0 billion for the year ended
December 31, 2012
to $13.6 billion for the year ended
December 31, 2013
.
49
Loss on extinguishment of debt.
Loss on extinguishment of debt consists of the following for the years ended
December 31, 2014
,
2013
and
2012
(dollars in millions):
|
Year ended December 31,
|
||||||||||||
|
2014
|
2013
|
2012
|
||||||||||
|
Charter Operating credit amendment / prepayments
|
$
|
—
|
|
$
|
58
|
|
$
|
92
|
|
|||
|
CCH II notes redemptions
|
—
|
|
—
|
|
(46
|
)
|
||||||
|
Charter Operating notes repurchases
|
—
|
|
—
|
|
9
|
|
||||||
|
CCO Holdings notes repurchases
|
—
|
|
65
|
|
—
|
|
||||||
|
$
|
—
|
|
$
|
123
|
|
$
|
55
|
|
||||
For more information, see Note 8 to the accompanying consolidated financial statements contained in “Part II. Item 8. Financial Statements and Supplementary Data.”
Gain (loss) on derivative instruments, net.
Interest rate derivative instruments are held to manage our interest costs and reduce our exposure to increases in floating interest rates. We recognized a loss of
$7 million
and a gain of
$11 million
during the years ended
December 31, 2014
and
2013
, respectively, which represents the amortization of accumulated other comprehensive loss for interest rate derivative instruments no longer designated as hedges for accounting purposes offset by their change in fair value. For more information, see Note 11 to the accompanying consolidated financial statements contained in “Part II. Item 8. Financial Statements and Supplementary Data.”
Income tax expense.
Income tax expense of
$236 million
,
$120 million
and
$257 million
was recognized for the years ended
December 31, 2014
,
2013
and
2012
, respectively, primarily through increases in deferred tax liabilities related to our investment in Charter Holdco and certain of our indirect subsidiaries, in addition to $3 million, $8 million and $7 million of current federal and state income tax expense, respectively. Income tax expense for the year ended December 31, 2013 decreased compared to the corresponding prior period, primarily as a result of step-ups in basis of indefinite-lived assets for tax, but not GAAP purposes, including the effects of partnership gains related to financing transactions and a partnership restructuring, which decreased our net deferred tax liability related to indefinite-lived assets by $137 million. Our tax provision in future periods will vary based on various factors including changes in our deferred tax liabilities attributable to indefinite-lived intangibles, as well as future operating results, however we do not anticipate having such a large reduction in income tax expense attributable to these items unless we enter into restructuring transactions or similar future financing. The ultimate impact on the tax provision of such future financing and restructuring activities, if any, will be dependent on the underlying facts and circumstances at the time.
Net loss.
We incurred net loss of
$183 million
,
$169 million
and
$304 million
for the years ended
December 31, 2014
,
2013
and
2012
, respectively, primarily as a result of the factors described above.
Loss per common share.
During
2014
and
2013
, net loss per common share increased by
$0.05
and decreased by
$1.40
, respectively, as a result of the factors described above.
Use of Adjusted EBITDA
and Free Cash Flow
We use certain measures that are not defined by GAAP to evaluate various aspects of our business. Adjusted EBITDA and free cash flow are non-GAAP financial measures and should be considered in addition to, not as a substitute for, net loss and net cash flows from operating activities reported in accordance with GAAP. These terms, as defined by us, may not be comparable to similarly titled measures used by other companies. Adjusted EBITDA and free cash flow are reconciled to net loss and net cash flows from operating activities, respectively, below.
Adjusted EBITDA is defined as net loss plus net interest expense, income taxes, depreciation and amortization, stock compensation expense, loss on extinguishment of debt, (gain) loss on derivative instruments, net and other operating expenses, such as merger and acquisition costs, special charges and (gain) loss on sale or retirement of assets. As such, it eliminates the significant non-cash depreciation and amortization expense that results from the capital-intensive nature of our businesses as well as other non-cash or special items, and is unaffected by our capital structure or investment activities. Adjusted EBITDA is used by management and Charter’s board of directors to evaluate the performance of our business. However, this measure is limited in that it does not reflect
50
the periodic costs of certain capitalized tangible and intangible assets used in generating revenues and our cash cost of financing. Management evaluates these costs through other financial measures.
Free cash flow is defined as net cash flows from operating activities, less capital expenditures and changes in accrued expenses related to capital expenditures.
We believe that Adjusted EBITDA and free cash flow provide information useful to investors in assessing our performance and our ability to service our debt, fund operations and make additional investments with internally generated funds. In addition, Adjusted EBITDA generally correlates to the leverage ratio calculation under our credit facilities or outstanding notes to determine compliance with the covenants contained in the facilities and notes (all such documents have been previously filed with the United States Securities and Exchange Commission). For the purpose of calculating compliance with leverage covenants, we use Adjusted EBITDA, as presented, excluding certain expenses paid by our operating subsidiaries to other Charter entities. Our debt covenants refer to these expenses as management fees, which fees were in the amount of
$253 million
,
$201 million
and
$191 million
for the years ended
December 31, 2014
,
2013
and
2012
, respectively.
|
Years ended December 31,
|
|||||||||||
|
2014
|
2013
|
2012
|
|||||||||
|
Net loss
|
$
|
(183
|
)
|
$
|
(169
|
)
|
$
|
(304
|
)
|
||
|
Plus: Interest expense, net
|
911
|
|
846
|
|
907
|
|
|||||
|
Income tax expense
|
236
|
|
120
|
|
257
|
|
|||||
|
Depreciation and amortization
|
2,102
|
|
1,854
|
|
1,713
|
|
|||||
|
Stock compensation expense
|
55
|
|
48
|
|
50
|
|
|||||
|
Loss on extinguishment of debt
|
—
|
|
123
|
|
55
|
|
|||||
|
(Gain) loss on derivative instruments, net
|
7
|
|
(11
|
)
|
—
|
|
|||||
|
Other, net
|
62
|
|
47
|
|
16
|
|
|||||
|
Adjusted EBITDA
|
$
|
3,190
|
|
$
|
2,858
|
|
$
|
2,694
|
|
||
|
Net cash flows from operating activities
|
$
|
2,359
|
|
$
|
2,158
|
|
$
|
1,876
|
|
||
|
Less: Purchases of property, plant and equipment
|
(2,221
|
)
|
(1,825
|
)
|
(1,745
|
)
|
|||||
|
Change in accrued expenses related to capital expenditures
|
33
|
|
76
|
|
13
|
|
|||||
|
Free cash flow
|
$
|
171
|
|
$
|
409
|
|
$
|
144
|
|
||
Liquidity and Capital Resources
Introduction
This section contains a discussion of our liquidity and capital resources, including a discussion of our cash position, sources and uses of cash, access to credit facilities and other financing sources, historical financing activities, cash needs, capital expenditures and outstanding debt.
Overview of Our Contractual Obligations and Liquidity
We have significant amounts of debt, including approximately $7.0 billion which proceeds are currently held in escrow pending consummation of the Transactions. The accreted value of our debt as of
December 31, 2014
was
$21.0 billion
, consisting of
$7.2 billion
of credit facility debt and
$13.8 billion
of high-yield notes. Our business requires significant cash to fund principal and interest payments on our debt. As of
December 31, 2014
,
$91 million
of our long-term debt matures in 2015,
$127 million
in 2016,
$1.1 billion
in 2017,
$967 million
in 2018,
$1.5 billion
in 2019 and
$17.3 billion
thereafter. As of
December 31, 2014
, we had other contractual obligations, including interest on our debt, totaling
$9.3 billion
.
Our projected cash needs and projected sources of liquidity depend upon, among other things, our actual results, and the timing and amount of our expenditures. Free cash flow was
$171 million
,
$409 million
and
$144 million
for the years ended
December 31, 2014
,
2013
and
2012
, respectively. As of
December 31, 2014
, the amount available under our credit facilities was approximately
51
$817 million
. In addition, a $500 million revolver extension is currently committed and available to Charter. The availability of this revolver is not contingent or related to the closing of the Transactions. We expect to utilize free cash flow and availability under our credit facilities as well as future refinancing transactions to further extend the maturities of or reduce the principal on our obligations. The timing and terms of any refinancing transactions will be subject to market conditions. Additionally, we may, from time to time, depending on market conditions and other factors, use cash on hand and the proceeds from securities offerings or other borrowings, to retire our debt through open market purchases, privately negotiated purchases, tender offers, or redemption provisions. We believe we have sufficient liquidity from cash on hand, free cash flow and Charter Operating's revolving credit facility as well as access to the capital markets to fund our projected operating cash needs.
We continue to evaluate the deployment of our anticipated future free cash flow including to reduce our leverage, and to invest in our business growth and other strategic opportunities, including mergers and acquisitions as well as stock repurchases and dividends. As possible acquisitions, swaps or dispositions arise in our industry, we actively review them against our objectives including, among other considerations, improving the operational efficiency, clustering or technology capabilities of our business and achieving appropriate return targets, and we may participate to the extent we believe these possibilities present attractive opportunities. However, there can be no assurance that we will actually complete any acquisition, disposition or system swap, including the transactions with Comcast, or that any such transactions will be material to our operations or results. See "Part I. Item 1A. Risk Factors - Our inability to successfully acquire and integrate other businesses, assets, products or technologies could harm our operating results."
Free Cash Flow
Free cash flow was
$171 million
,
$409 million
and
$144 million
for the years ended
December 31, 2014
,
2013
and
2012
, respectively. The decrease in free cash flow in
2014
compared to
2013
is primarily due to an increase of $396 million in capital expenditures primarily driven by our all-digital transition, an increase of $87 million in cash paid for interest, changes in operating assets and liabilities, excluding the change in accrued interest, that provided $52 million less cash during 2014 and an increase of $22 million in merger and acquisition costs. The increase in cash paid for interest includes approximately $52 million related to debt which proceeds are currently held in escrow pending consummation of the Transactions. The decrease in free cash flow was offset by an increase of $332 million in Adjusted EBITDA.
The increase in free cash flow in
2013
compared to
2012
is primarily due to an increase of $164 million in Adjusted EBITDA, a decrease of $141 million in cash paid for interest due to a decrease in our average interest rate and timing of interest payments with the completion of refinancings, and changes in operating assets and liabilities, excluding the change in accrued interest, that provided $31 million more cash during 2013. The increase in free cash flow was offset by an increase of $80 million in capital expenditures of which $30 million was related to Bresnan.
52
As of
December 31, 2014
, the accreted value of our total debt was approximately
$21.0 billion
, as summarized below (dollars in millions):
|
December 31, 2014
|
||||||||||||
|
Principal Amount
|
Accreted Value (a)
|
Semi-Annual Interest Payment Dates
|
Maturity Date (b)
|
|||||||||
|
CCOH Safari, LLC:
|
||||||||||||
|
5.500% senior notes due 2022
|
$
|
1,500
|
|
$
|
1,500
|
|
6/1 & 12/1
|
12/1/2022
|
||||
|
5.750% senior notes due 2024
|
2,000
|
|
2,000
|
|
6/1 & 12/1
|
12/1/2024
|
||||||
|
CCO Holdings, LLC:
|
||||||||||||
|
7.250% senior notes due 2017
|
1,000
|
|
1,000
|
|
4/30 & 10/30
|
10/30/2017
|
||||||
|
7.000% senior notes due 2019
|
1,400
|
|
1,394
|
|
1/15 & 7/15
|
1/15/2019
|
||||||
|
8.125% senior notes due 2020
|
700
|
|
700
|
|
4/30 & 10/30
|
4/30/2020
|
||||||
|
7.375% senior notes due 2020
|
750
|
|
750
|
|
6/1 & 12/1
|
6/1/2020
|
||||||
|
5.250% senior notes due 2021
|
500
|
|
500
|
|
3/15 & 9/15
|
3/15/2021
|
||||||
|
6.500% senior notes due 2021
|
1,500
|
|
1,500
|
|
4/30 & 10/30
|
4/30/2021
|
||||||
|
6.625% senior notes due 2022
|
750
|
|
747
|
|
1/31 & 7/31
|
1/31/2022
|
||||||
|
5.250% senior notes due 2022
|
1,250
|
|
1,240
|
|
3/30 & 9/30
|
9/30/2022
|
||||||
|
5.125% senior notes due 2023
|
1,000
|
|
1,000
|
|
2/15 & 8/15
|
2/15/2023
|
||||||
|
5.750% senior notes due 2023
|
500
|
|
500
|
|
3/1 & 9/1
|
9/1/2023
|
||||||
|
5.750% senior notes due 2024
|
1,000
|
|
1,000
|
|
1/15 & 7/15
|
1/15/2024
|
||||||
|
Charter Communications Operating, LLC:
|
||||||||||||
|
Credit facilities
|
3,742
|
|
3,709
|
|
Varies
|
|||||||
|
CCO Safari, LLC (an Unrestricted Subsidiary):
|
||||||||||||
|
Credit facility
|
3,500
|
|
3,483
|
|
9/12/2021
|
|||||||
|
$
|
21,092
|
|
$
|
21,023
|
|
|||||||
|
(a)
|
The accreted values presented above represent the principal amount of the debt less the original issue discount at the time of sale, plus the accretion to the balance sheet date. However, the amount that is currently payable if the debt becomes immediately due is equal to the principal amount of the debt. We have availability under our credit facilities of approximately
$817 million
as of
December 31, 2014
. In addition, a $500 million revolver extension is currently committed and available to Charter. The availability of this revolver is not contingent or related to the closing of the Transactions.
|
|
(b)
|
In general, the obligors have the right to redeem all of the notes set forth in the above table in whole or in part at their option, beginning at various times prior to their stated maturity dates, subject to certain conditions, upon the payment of the outstanding principal amount (plus a specified redemption premium) and all accrued and unpaid interest. For additional information see "Description of our Outstanding Debt" below.
|
53
Contractual Obligations
The following table summarizes our payment obligations as of
December 31, 2014
under our long-term debt and certain other contractual obligations and commitments (dollars in millions.)
|
Payments by Period
|
|||||||||||||||||||||
|
Total
|
Less than 1 year
|
1-3 years
|
3-5 years
|
More than 5 years
|
|||||||||||||||||
|
Contractual Obligations
(a)
|
|||||||||||||||||||||
|
Long-Term Debt Principal Payments (a)
|
$
|
21,092
|
|
$
|
91
|
|
$
|
1,264
|
|
$
|
2,429
|
|
$
|
17,308
|
|
||||||
|
Long-Term Debt Interest Payments (b)
|
8,053
|
|
1,130
|
|
2,365
|
|
2,178
|
|
2,380
|
|
|||||||||||
|
Capital and Operating Lease Obligations (c)
|
169
|
|
43
|
|
74
|
|
41
|
|
11
|
|
|||||||||||
|
Programming Minimum Commitments (d)
|
795
|
|
271
|
|
491
|
|
19
|
|
14
|
|
|||||||||||
|
Other (e)
|
319
|
|
291
|
|
25
|
|
3
|
|
—
|
|
|||||||||||
|
Total
|
$
|
30,428
|
|
$
|
1,826
|
|
$
|
4,219
|
|
$
|
4,670
|
|
$
|
19,713
|
|
||||||
|
(a)
|
The table presents maturities of long-term debt outstanding as of
December 31, 2014
, including approximately $7.0 billion of debt which proceeds are currently held in escrow pending consummation of the Transactions. Refer to Notes 8 and 18 to our accompanying consolidated financial statements contained in “Part II. Item 8. Financial Statements and Supplementary Data” for a description of our long-term debt and other contractual obligations and commitments.
|
|
(b)
|
Interest payments on variable debt are estimated using amounts outstanding at
December 31, 2014
and the average implied forward London Interbank Offering Rate (“LIBOR”) rates applicable for the quarter during the interest rate reset based on the yield curve in effect at
December 31, 2014
. Actual interest payments will differ based on actual LIBOR rates and actual amounts outstanding for applicable periods.
|
|
(c)
|
We lease certain facilities and equipment under noncancelable operating leases. Leases and rental costs charged to expense for the years ended
December 31, 2014
,
2013
and
2012
, were
$43 million
,
$34 million
and
$28 million
, respectively.
|
|
(d)
|
We pay programming fees under multi-year contracts ranging from three to ten years, typically based on a flat fee per customer, which may be fixed for the term, or may in some cases escalate over the term. Programming costs included in the accompanying statement of operations were approximately
$2.5 billion
,
$2.1 billion
and
$2.0 billion
, for the years ended
December 31, 2014
,
2013
and
2012
, respectively. Certain of our programming agreements are based on a flat fee per month or have guaranteed minimum payments. The table sets forth the aggregate guaranteed minimum commitments under our programming contracts.
|
|
(e)
|
“Other” represents other guaranteed minimum commitments, which consist primarily of commitments to our customer premise equipment vendors.
|
The following items are not included in the contractual obligations table because the obligations are not fixed and/or determinable due to various factors discussed below. However, we incur these costs as part of our operations:
|
•
|
We rent utility poles used in our operations. Generally, pole rentals are cancelable on short notice, but we anticipate that such rentals will recur. Rent expense incurred for pole rental attachments for the years ended
December 31, 2014
,
2013
and
2012
was
$49 million
,
$49 million
and
$47 million
, respectively.
|
|
•
|
We pay franchise fees under multi-year franchise agreements based on a percentage of revenues generated from video service per year. We also pay other franchise related costs, such as public education grants, under multi-year agreements. Franchise fees and other franchise-related costs included in the accompanying statement of operations were
$208 million
,
$190 million
and
$176 million
for the years ended
December 31, 2014
,
2013
and
2012
, respectively.
|
|
•
|
We also have
$85 million
in letters of credit, primarily to our various worker’s compensation, property and casualty, and general liability carriers, as collateral for reimbursement of claims.
|
Limitations on Distributions
Distributions by Charter’s subsidiaries to a parent company for payment of principal on parent company notes are restricted under indentures and credit facilities governing our indebtedness, unless there is no default under the applicable indenture and credit facilities, and unless each applicable subsidiary’s leverage ratio test is met at the time of such distribution. As of
December 31, 2014
, there was no default under any of these indentures or credit facilities and each subsidiary met its applicable leverage ratio
54
tests based on
December 31, 2014
financial results. Such distributions would be restricted, however, if any such subsidiary fails to meet these tests at the time of the contemplated distribution. In the past, certain subsidiaries have from time to time failed to meet their leverage ratio test. There can be no assurance that they will satisfy these tests at the time of the contemplated distribution. Distributions by Charter Operating for payment of principal on CCO Holdings' notes or CCOH Safari Notes are further restricted by the covenants in its credit facilities.
In addition to the limitation on distributions under the various indentures discussed above, distributions by our subsidiaries may be limited by applicable law, including the Delaware Limited Liability Company Act, under which our subsidiaries may only make distributions if they have “surplus” as defined in the act.
Historical Operating, Investing, and Financing Activities
Cash and Cash Equivalents.
We held
$3 million
and
$21 million
in cash and cash equivalents as of
December 31, 2014
and
2013
, respectively. We held
$7.1 billion
in restricted cash and cash equivalents as of
December 31, 2014
.
Operating Activities.
Net cash provided by operating activities increased
$201 million
from
$2.2 billion
for the year ended
December 31, 2013
to
$2.4 billion
for the year ended
December 31, 2014
, primarily due to an increase in Adjusted EBITDA of $332 million offset by an $87 million increase in cash paid for interest and a $22 million increase in merger and acquisition costs.
Net cash provided by operating activities increased
$282 million
from
$1.9 billion
for the year ended
December 31, 2012
to
$2.2 billion
for the year ended
December 31, 2013
, primarily due to an increase in Adjusted EBITDA of $164 million and a $141 million decrease in our cash paid for interest offset by changes in operating assets and liabilities, excluding the change in accrued interest and in liabilities related to capital expenditures, that provided $32 million less cash during 2013.
Investing Activities.
Net cash used in investing activities for the years ended
December 31, 2014
,
2013
and
2012
, was
$9.3 billion
,
$2.4 billion
and
$1.7 billion
, respectively. The increase in 2014 compared to 2013 is primarily due to the investment of $7.1 billion of net proceeds from the issuance of the term loan G and CCOH Safari Notes in long-term restricted cash and cash equivalents and higher capital expenditures offset by $676 million cash paid for the Bresnan Acquisition (net of debt assumed) in 2013. The increase in 2013 compared to 2012 is primarily due to $676 million cash paid for the Bresnan Acquisition (net of debt assumed) and higher capital expenditures.
Financing Activities.
Net cash provided by financing activities was
$6.9 billion
and
$299 million
for the years ended
December 31, 2014
and
2013
, respectively, and net cash used in financing activities was
$134 million
for the year ended
December 31, 2012
. The increase in cash provided during the year ended
December 31, 2014
as compared to the corresponding period in
2013
, was primarily due to the issuance of the term loan G and CCOH Safari Notes in 2014. The increase in cash provided during the year ended
December 31, 2013
as compared to the corresponding period in
2012
, was primarily the result of an increase in the amount by which borrowings of long-term debt exceeded repayments of long-term debt and an increase in proceeds from the exercise of options and warrants.
Capital Expenditures
We have significant ongoing capital expenditure requirements. Capital expenditures were
$2.2 billion
,
$1.8 billion
and
$1.7 billion
for the years ended
December 31, 2014
,
2013
and
2012
, respectively. The increase was driven by approximately
$410 million
related to our all-digital transition, investment in CPE to support customer growth, higher product development investments and ongoing insourcing initiative and the acquisition of Bresnan. See the table below for more details.
We currently expect capital expenditures in 2015 to be approximately $1.7 billion excluding potential expenditures related to the Transactions. We anticipate 2015 capital expenditures to be driven by growth in residential and commercial customers along with further spend related to product development. Our expected capital expenditures for 2015 are lower than capital expenditures in 2014 due to the completion of our all-digital initiative in 2014. The actual amount of our capital expenditures in 2015 will depend on a number of factors including the pace of transition planning to service a larger customer base upon closing of the Transactions.
Our capital expenditures are funded primarily from cash flows from operating activities and borrowings on our credit facility. In addition, our liabilities related to capital expenditures increased by
$33 million
,
$76 million
and
$13 million
for the years ended
December 31, 2014
,
2013
and
2012
, respectively.
55
The following table presents our major capital expenditures categories in accordance with NCTA disclosure guidelines for the years ended
December 31, 2014
,
2013
and
2012
. The disclosure is intended to provide more consistency in the reporting of capital expenditures among peer companies in the cable industry. These disclosure guidelines are not required disclosures under GAAP, nor do they impact our accounting for capital expenditures under GAAP (dollars in millions):
|
Year ended December 31,
|
|||||||||||
|
2014
|
2013
|
2012
|
|||||||||
|
Customer premise equipment (a)
|
$
|
1,082
|
|
$
|
841
|
|
$
|
795
|
|
||
|
Scalable infrastructure (b)
|
455
|
|
352
|
|
387
|
|
|||||
|
Line extensions (c)
|
176
|
|
219
|
|
192
|
|
|||||
|
Upgrade/rebuild (d)
|
167
|
|
183
|
|
212
|
|
|||||
|
Support capital (e)
|
341
|
|
230
|
|
159
|
|
|||||
|
Total capital expenditures (f)
|
$
|
2,221
|
|
$
|
1,825
|
|
$
|
1,745
|
|
||
|
(a)
|
Customer premise equipment includes costs incurred at the customer residence to secure new customers and revenue generating units, including customer installation costs and customer premise equipment (e.g., set-top boxes and cable modems).
|
|
(b)
|
Scalable infrastructure includes costs not related to customer premise equipment, to secure growth of new customers and revenue generating units, or provide service enhancements (e.g., headend equipment).
|
|
(c)
|
Line extensions include network costs associated with entering new service areas (e.g., fiber/coaxial cable, amplifiers, electronic equipment, make-ready and design engineering).
|
|
(d)
|
Upgrade/rebuild includes costs to modify or replace existing fiber/coaxial cable networks, including betterments.
|
|
(e)
|
Support capital includes costs associated with the replacement or enhancement of non-network assets due to technological and physical obsolescence (e.g., non-network equipment, land, buildings and vehicles).
|
|
(f)
|
Total capital expenditures include
$410 million
and
$88 million
related to our all-digital transition for the years ended
December 31, 2014
and
2013
and
$242 million
,
$300 million
and
$269 million
related to commercial services for the years ended
December 31, 2014
,
2013
and
2012
, respectively.
|
Description of Our Outstanding Debt
Overview
As of
December 31, 2014
and
2013
, the blended weighted average interest rate on our debt was
5.4%
and
5.6%
, respectively. The interest rate on approximately
72%
and
84%
of the total principal amount of our debt was effectively fixed, including the effects of our interest rate hedge agreements as of
December 31, 2014
and
2013
, respectively, and including $7.0 billion of debt which proceeds are currently held in escrow pending consummation of the Transactions as of December 31, 2014. The fair value of our high-yield notes was
$14.2 billion
and
$10.4 billion
at
December 31, 2014
and
2013
, respectively. The fair value of our credit facilities was
$7.2 billion
and
$3.8 billion
at
December 31, 2014
and
2013
, respectively. The fair value of our high-yield notes and credit facilities were based on quoted market prices.
The following description is a summary of certain provisions of our credit facilities and our note indentures (the “Debt Agreements”). The summary does not restate the terms of the Debt Agreements in their entirety, nor does it describe all the terms of the Debt Agreements. The agreements and instruments governing each of the Debt Agreements are complicated and you should consult such agreements and instruments for more detailed information regarding the Debt Agreements.
Charter Operating Credit Facilities – General
The Charter Operating credit facilities have an outstanding principal amount of
$3.7 billion
at
December 31, 2014
as follows:
|
•
|
A term loan A with a remaining principal amount of
$684 million
, which is repayable in quarterly installments and aggregating
$38 million
in 2015,
$66 million
in 2016 and
$75 million
in 2017, with the remaining balance due at final maturity on April 22, 2018;
|
|
•
|
A term loan E with a remaining principal amount of approximately
$1.5 billion
, which is repayable in equal quarterly installments and aggregating
$15 million
in each loan year, with the remaining balance due at final maturity on July 1, 2020;
|
56
|
•
|
A term loan F with a remaining principal amount of approximately
$1.2 billion
, which is repayable in equal quarterly installments and aggregating
$12 million
in each loan year, with the remaining balance due at final maturity on January 3, 2021; and
|
|
•
|
A revolving loan with an outstanding balance of
$399 million
at December 31, 2014 and allowing for borrowings of up to
$1.3 billion
, maturing on April 22, 2018.
|
Amounts outstanding under the Charter Operating credit facilities bear interest, at Charter Operating’s election, at a base rate or LIBOR, as defined, plus a margin. The applicable LIBOR margin for the term loan A is currently 2.00%. The term loans E and F bear interest at LIBOR plus 2.25%, with a LIBOR floor of 0.75%. Charter Operating pays interest equal to LIBOR plus 2.00% on amounts borrowed under the revolving credit facility and pays a revolving commitment fee of 0.30% per annum on the daily average available amount of the revolving commitment, payable quarterly.
The Charter Operating credit facilities also allow us to enter into incremental term loans in the future (including the incremental term loan A-2 described below), with amortization as set forth in the notices establishing such term loans. Although the Charter Operating credit facilities allow for the incurrence of a certain amount of incremental term loans subject to pro-forma compliance with its financial maintenance covenants, no assurance can be given that we could obtain additional incremental term loans in the future if Charter Operating sought to do so or what amount of incremental term loans would be allowable at any given time under the terms of the Charter Operating credit facilities.
As previously announced in July 2014, Charter Operating received a commitment from certain lenders to provide up to $1.0 billion in an incremental term loan A-2. The incremental term loan A-2 loan forms a portion of the incremental facilities commitments that would be used to fund the purchase of certain assets pursuant to the Transaction. If issued, such term loan A-2 loan would be issued under the Charter Operating credit facilities, would have a five year maturity and would bear interest at LIBOR plus 2.00%.
The obligations of Charter Operating under the Charter Operating credit facilities are guaranteed by Charter Operating’s immediate parent company, CCO Holdings, and subsidiaries of Charter Operating. The obligations are also secured by (i) a lien on substantially all of the assets of Charter Operating and its subsidiaries (excluding CCO Safari), to the extent such lien can be perfected under the Uniform Commercial Code by the filing of a financing statement, and (ii) a pledge by CCO Holdings of the equity interests owned by it in Charter Operating or any of Charter Operating’s subsidiaries, as well as intercompany obligations owing to it by any of such entities.
CCO Safari Credit Facility - General
In September 2014, Charter Operating entered into a new term loan G facility pursuant to the terms of the Charter Operating credit agreement providing for a
$3.5 billion
term loan maturing in 2021. Pricing on the term loan G was set at LIBOR plus 3.50% with a LIBOR floor of
0.75%
and issued at a price of
99.50%
of the aggregate principal amount. The term loan G forms a portion of the incremental facilities commitments as announced by us in July 2014 that will be used to fund the purchase of certain assets pursuant to the Transactions. Charter Operating assigned all of its obligations with respect to the term loan G and transferred all of the proceeds from the term loan G to a newly-created subsidiary, CCO Safari, which is considered a Non-Recourse Subsidiary under Charter Operating’s credit agreement, and CCO Safari placed the funds in an escrow account pending closing of the Transactions over which the administrative agent has a perfected first priority security interest on behalf of the lenders that are a party to the CCO Safari credit facility. The amounts borrowed under the term loan G facility are not considered when calculating the leverage ratio on the CCO Holdings Indentures as CCO Safari has been designated as an Unrestricted Subsidiary under the CCO Holdings Indenture. At closing of the Transactions, subject to certain conditions, Charter Operating will re-assume the obligations in respect of the term loan G under the Charter Operating credit agreement and the term loan G will be subject to the terms and conditions of the Charter Operating credit facilities. Such amounts, along with required original issuance discount and one month of interest, were placed in escrow and classified as noncurrent restricted cash and cash equivalents in our consolidated balance sheet as of December 31, 2014. To the extent the Transactions do not close, such amounts placed in escrow must be used to settle amounts outstanding under the term loan G. See "Part I. Item I. Business — Transactions with Comcast."
Charter Operating Credit Facilities — Restrictive Covenants
The Charter Operating credit facilities contain representations and warranties, and affirmative and negative covenants customary for financings of this type. The financial covenants measure performance against standards set for leverage to be tested as of the end of each quarter. The Charter Operating credit facilities contain provisions requiring mandatory loan prepayments under specific circumstances, including in connection with certain sales of assets, so long as the proceeds have not been reinvested in the business. Additionally, the Charter Operating credit facilities provisions contain an allowance for restricted payments so long as the consolidated leverage ratio at Charter Operating (excludes debt of CCO Safari since it is a Non-Recourse Subsidiary) is no greater
57
than 3.5 after giving pro forma effect to such restricted payment. The Charter Operating credit facilities permit Charter Operating and its subsidiaries to make distributions to pay interest on the currently outstanding subordinated and parent company indebtedness, provided that, among other things, no default has occurred and is continuing under the Charter Operating credit facilities.
The events of default under the Charter Operating credit facilities include, among other things:
|
•
|
the failure to make payments when due or within the applicable grace period;
|
|
•
|
the failure to comply with specified covenants including the covenant to maintain the consolidated leverage ratio at Charter Operating (excluding debt of CCO Safari since it is a Non-Recourse Subsidiary) at or below 5.0 to 1.0 and the consolidated first lien leverage ratio at or below 4.0 to 1.0;
|
|
•
|
the failure to pay or the occurrence of events that cause or permit the acceleration of other indebtedness owing by CCO Holdings, Charter Operating, or Charter Operating’s subsidiaries in aggregate principal amounts in excess of $100 million; and
|
|
•
|
similar to provisions contained in the note indentures, the consummation of any change of control transaction resulting in any person or group having power, directly or indirectly, to vote more than 50% of the ordinary voting power for the management of Charter Operating on a fully diluted basis and the occurrence of a ratings event including a downgrade in the corporate family rating during a ratings decline period.
|
At
December 31, 2014
, Charter Operating had a consolidated leverage ratio of approximately 1.3 to 1.0 and a consolidated first lien leverage ratio of 1.0 to 1.0. Both ratios are in compliance with the ratios required by the Charter Operating credit facilities. A failure by Charter Operating to maintain the financial covenants would result in an event of default under the Charter Operating credit facilities and the debt of CCO Holdings. See “— Cross Acceleration” and “Part I. Item 1A. Risk Factors — The agreements and instruments governing our debt contain restrictions and limitations that could significantly affect our ability to operate our business, as well as significantly affect our liquidity."
CCO Safari Credit Facility — Restrictive Covenants
The term loan G is subject to the terms and conditions of a separate credit facility and escrow agreement until Charter Operating reassumes its obligations for the loan. The CCO Safari credit facility contains customary representations and warranties and affirmative covenants with limited negative covenants prohibiting CCO Safari from engaging in any material activities other than performing its obligations under the credit facility and the escrow agreement or otherwise issuing other indebtedness pursuant to escrow arrangements similar to the CCO Safari credit facility and escrow agreement. As required by the CCO Safari credit facility, CCO Safari, Bank of America, N.A., and U.S. Bank, N.A., as escrow agent, entered into an escrow agreement pursuant to which, CCO Safari is required to maintain an escrow account over which the administrative agent has a perfected first priority security interest on behalf of the CCO Safari credit facility lenders. The events of default under the CCO Safari credit facility include, among others:
|
•
|
the failure to make payments when due or within the applicable grace period;
|
|
•
|
any acceleration of the loans and termination of the commitments under the Charter Operating credit facilities; and
|
|
•
|
the escrow agreement shall cease to be in full force and effect or the lien in the escrow account shall cease to be enforceable with the same effect and priority.
|
CCOH Safari Notes
In October 2014, Charter created CCOH Safari as a 100% wholly-owned indirect finance subsidiary of Charter. In November 2014, CCOH Safari, closed on transactions in which it issued $1.5 billion aggregate principal amount of 5.50% senior notes due 2022 and $2.0 billion aggregate principal amount of 5.75% senior notes due 2024. The net proceeds of the offering and sale of the CCOH Safari Notes and the next semi-annual interest payment will be held in escrow to fund a portion of the purchase of certain assets pursuant to the Transactions. The release of the proceeds from the escrow will be subject to the satisfaction of certain conditions, including the closing of the Transactions. Substantially concurrently with the escrow release, the CCOH Safari Notes will become obligations of CCO Holdings and CCO Holdings Capital. CCOH Safari will merge into CCO Holdings. Should the Transactions Agreement be terminated prior to the consummation of the Transactions, or upon expiration of the escrow agreement on November 5, 2015, such amounts placed in escrow must be used to settle amounts outstanding under the CCOH Safari Notes at par value. The amounts held in escrow are classified as noncurrent restricted cash and cash equivalents in our consolidated balance sheet as of December 31, 2014. See "Part I. Item I. Business — Transactions with Comcast."
Initially, the CCOH Safari Notes are senior debt obligations of CCOH Safari. Upon release of the proceeds from escrow, the CCOH Safari Notes will be senior debt obligations of CCO Holdings and CCO Holdings Capital Corp. and rank equally with all other current and future unsecured, unsubordinated obligations of CCO Holdings and CCO Holdings Capital Corp. The CCOH
58
Safari Notes are structurally subordinated to all obligations of subsidiaries of CCO Holdings, including the Charter Operating and CCO Safari credit facilities. The CCOH Safari Notes are guaranteed by Charter.
CCO Holdings Notes
The CCO Holdings notes are senior debt obligations of CCO Holdings and CCO Holdings Capital Corp. Such notes are guaranteed by Charter. They rank equally with all other current and future unsecured, unsubordinated obligations of CCO Holdings and CCO Holdings Capital Corp. They are structurally subordinated to all obligations of subsidiaries of CCO Holdings, including the Charter Operating credit facilities.
Redemption Provisions of Our Notes
The various notes issued by our subsidiaries included in the table may be redeemed in accordance with the following table or are not redeemable until maturity as indicated:
|
Note Series
|
Redemption Dates
|
Percentage of Principal
|
||
|
CCOH Safari, LLC:
|
||||
|
5.500% senior notes due 2022
|
December 1, 2017 - November 30, 2018
|
104.125%
|
||
|
December 1, 2018 - November 30, 2019
|
102.750%
|
|||
|
December 1, 2019 - November 30, 2020
|
101.375%
|
|||
|
Thereafter
|
100.000%
|
|||
|
5.750% senior notes due 2024
|
December 1, 2019 - November 30, 2020
|
102.875%
|
||
|
December 1, 2020 - November 30, 2021
|
101.917%
|
|||
|
December 1, 2021 - November 30, 2022
|
100.958%
|
|||
|
Thereafter
|
100.000%
|
|||
|
CCO Holdings, LLC:
|
||||
|
7.250% senior notes due 2017
|
October 30, 2014 – October 29, 2015
|
103.625%
|
||
|
October 30, 2015 – October 29, 2016
|
101.813%
|
|||
|
Thereafter
|
100.000%
|
|||
|
7.000% senior notes due 2019
|
January 15, 2015 – January 14, 2016
|
103.500%
|
||
|
January 15, 2016 – January 14, 2017
|
101.750%
|
|||
|
Thereafter
|
100.000%
|
|||
|
8.125% senior notes due 2020
|
April 30, 2015 – April 29, 2016
|
104.063%
|
||
|
April 30, 2016 – April 29, 2017
|
102.708%
|
|||
|
April 30, 2017 – April 29, 2018
|
101.354%
|
|||
|
Thereafter
|
100.000%
|
|||
|
7.375% senior notes due 2020
|
December 1, 2015 – November 30, 2016
|
103.688%
|
||
|
December 1, 2016 – November 30, 2017
|
101.844%
|
|||
|
Thereafter
|
100.000%
|
|||
|
5.250% senior notes due 2021
|
March 15, 2016 – March 14, 2017
|
103.938%
|
||
|
March 15, 2017 – March 14, 2018
|
102.625%
|
|||
|
March 15, 2018 – March 14, 2019
|
101.313%
|
|||
|
Thereafter
|
100.000%
|
|||
|
6.500% senior notes due 2021
|
April 30, 2015 – April 29, 2016
|
104.875%
|
||
|
April 30, 2016 – April 29, 2017
|
103.250%
|
|||
|
April 30, 2017 – April 29, 2018
|
101.625%
|
|||
|
Thereafter
|
100.000%
|
|||
|
6.625% senior notes due 2022
|
January 31, 2017 – January 30, 2018
|
103.313%
|
||
|
January 31, 2018 – January 30, 2019
|
102.208%
|
|||
|
January 31, 2019 – January 30, 2020
|
101.104%
|
|||
|
Thereafter
|
100.000%
|
|||
59
|
5.250% senior notes due 2022
|
September 30, 2017 – September 29, 2018
|
102.625%
|
||
|
September 30, 2018 – September 29, 2019
|
101.750%
|
|||
|
September 30, 2019 – September 29, 2020
|
100.875%
|
|||
|
Thereafter
|
100.000%
|
|||
|
5.125% senior notes due 2023
|
February 15, 2018 – February 14, 2019
|
102.563%
|
||
|
February 15, 2019 – February 14, 2020
|
101.708%
|
|||
|
February 15, 2020 – February 14, 2021
|
100.854%
|
|||
|
Thereafter
|
100.000%
|
|||
|
5.750% senior notes due 2023
|
March 1, 2018 – February 28, 2019
|
102.875%
|
||
|
March 1, 2019 – February 29, 2020
|
101.917%
|
|||
|
March 1, 2020 – February 28, 2021
|
100.958%
|
|||
|
Thereafter
|
100.000%
|
|||
|
5.750% senior notes due 2024
|
July 15, 2018 – July 14, 2019
|
102.875%
|
||
|
July 15, 2019 – July 14, 2020
|
101.917%
|
|||
|
July 15, 2020 – July 14, 2021
|
100.958%
|
|||
|
Thereafter
|
100.000%
|
|||
In the event that a specified change of control event occurs, each of the respective issuers of the notes must offer to repurchase any then outstanding notes at 101% of their principal amount or accrued value, as applicable, plus accrued and unpaid interest, if any.
Summary of Restrictive Covenants of Our Note Indentures
The following description is a summary of certain restrictions of our note indentures. The summary does not restate the terms of the note indentures in their entirety, nor does it describe all restrictions. The agreements and instruments governing each of the notes issued are complicated and you should consult such agreements and instruments for more detailed information regarding the notes issued.
The CCOH Safari Notes were issued pursuant to a base indenture and a first and second supplemental indenture to that base all dated November 5, 2014 (the “CCOH Safari Indentures”). The CCOH Safari Indentures provide that, with limited exceptions of covenants regarding compliance certificates and stay, extension and usury laws, covenants restricting the activities of the note issuer and its subsidiaries do not apply until such time as the CCOH Safari note proceeds are released from escrow. As stated previously, substantially concurrently with the escrow release, the CCOH Safari Notes will become obligations of CCO Holdings and CCO Holdings Capital, CCOH Safari will merge with CCO Holdings and the terms and conditions of the CCOH Safari Indentures will apply to CCO Holdings and CCO Holdings Capital.
The notes issued by CCO Holdings and CCO Holdings Capital were issued pursuant to certain indentures referred to in this section as the “CCO Holdings Indentures.” The CCO Holdings Indentures and the CCOH Safari Indentures (following the release of proceeds from escrow) contain covenants that restrict the ability of CCO Holdings and its subsidiaries to, among other things:
|
•
|
incur indebtedness;
|
|
•
|
pay dividends or make distributions in respect of capital stock and other restricted payments;
|
|
•
|
issue equity;
|
|
•
|
make investments;
|
|
•
|
create liens;
|
|
•
|
sell assets;
|
|
•
|
consolidate, merge, or sell all or substantially all assets;
|
|
•
|
create restrictions on the ability of restricted subsidiaries to make certain payments; or
|
|
•
|
enter into transactions with affiliates.
|
However, such covenants are subject to a number of important qualifications and exceptions. Below we set forth a brief summary of certain of the restrictive covenants.
60
Restrictions on Additional Debt
The limitations on incurrence of debt and issuance of preferred stock contained in the CCO Holdings Indentures and the CCOH Safari Indentures permit CCO Holdings and its restricted subsidiaries to incur additional debt or issue preferred stock, so long as, after giving pro forma effect to the incurrence, the leverage ratio would be below a specified level for CCO Holdings. The leverage ratio under the indentures is 6.0 to 1.
In addition, regardless of whether the leverage ratio could be met, so long as no default exists or would result from the incurrence or issuance, CCO Holdings and its restricted subsidiaries are permitted to issue among other permitted indebtedness:
|
•
|
up to $1.5 billion of debt under credit facilities not otherwise allocated;
|
|
•
|
up to the greater of $300 million (or $600 million in the case of the notes issued under the CCOH Safari Indentures)
|
and 5% of consolidated net tangible assets to finance the purchase or capital lease of new assets;
|
•
|
up to the greater of $300 million (or $600 million in the case of the notes issued under the CCOH Safari Indentures)
|
and 5% of consolidated net tangible assets of additional debt for any purpose; and
|
•
|
other items of indebtedness for specific purposes such as intercompany debt, refinancing of existing debt, and interest rate swaps to provide protection against fluctuation in interest rates.
|
Indebtedness under a single facility or agreement may be incurred in part under one of the categories listed above and in part under another, and generally may also later be reclassified into another category including as debt incurred under the leverage ratio. Accordingly, indebtedness under our credit facilities may be incurred under a combination of the categories of permitted indebtedness listed above. The restricted subsidiaries of CCO Holdings are generally not permitted to issue subordinated debt securities.
Restrictions on Distributions
Generally, under the indentures governing notes issued by CCO Holdings and CCOH Safari, CCO Holdings and its respective restricted subsidiaries are permitted to pay dividends on or repurchase equity interests, or make other specified restricted payments, only if it can incur $1.00 of new debt under the 6.0 to 1.0 leverage ratio test after giving effect to the transaction and if no default exists or would exist as a consequence of such incurrence. If those conditions are met, restricted payments may be made in a total amount of up to the sum of 100% of CCO Holdings’ Consolidated EBITDA, as defined, minus 1.3 times its Consolidated Interest Expense, as defined, cumulatively from April 1, 2010, plus 100% of new cash and appraised non-cash equity proceeds received by CCO Holdings and not allocated to certain investments, cumulatively from the issue date, plus $2 billion.
In addition, CCO Holdings may make distributions or restricted payments, so long as no default exists or would be caused by transactions among other distributions or restricted payments:
|
•
|
to repurchase management equity interests in amounts not to exceed $10 million per fiscal year (or $50 million per fiscal year in the case of notes issued under the CCOH Safari Indentures);
|
|
•
|
to pay pass-through tax liabilities in respect of ownership of equity interests in the applicable issuer or its restricted subsidiaries; or
|
|
•
|
to make other specified restricted payments including merger fees up to 1.25% of the transaction value, repurchases using concurrent new issuances, and certain dividends on existing subsidiary preferred equity interests.
|
Restrictions on Investments
CCO Holdings and its respective restricted subsidiaries may not make investments except (i) permitted investments or (ii) if, after giving effect to the transaction, their leverage would be above the applicable leverage ratio.
Permitted investments include, among others:
|
•
|
investments in and generally among restricted subsidiaries or by restricted subsidiaries in the applicable issuer;
|
|
•
|
investments aggregating up to $750 million (or $1.1 billion in the case of notes issued under CCO Holdings Indentures for the year 2011 through the date of this filing and for notes issued under the CCOH Safari Indentures) at any time outstanding; and
|
|
•
|
investments aggregating up to 100% of new cash equity proceeds received by CCO Holdings since the issue date to the extent the proceeds have not been allocated to the restricted payments covenant.
|
61
Restrictions on Liens
The restrictions on liens for CCO Holdings only apply to liens on assets of the issuer itself and do not restrict liens on assets of CCO Holdings' subsidiaries. Permitted liens include liens securing indebtedness and other obligations under credit facilities, liens securing the purchase price of financed new assets, liens securing indebtedness of up to the greater of $50 million (or $90 million in the case of notes issued under the CCOH Safari Indentures) and 1.0% of consolidated net tangible assets and other specified liens.
Restrictions on the Sale of Assets; Mergers
CCO Holdings is generally not permitted to sell all or substantially all of its assets or merge with or into other companies unless its leverage ratio after any such transaction would be no greater than its leverage ratio immediately prior to the transaction, or unless after giving effect to the transaction, leverage would be below 6.0 to 1.0, no default exists, and the surviving entity is a U.S. entity that assumes the applicable notes.
CCO Holdings and its restricted subsidiaries may generally not otherwise sell assets or, in the case of restricted subsidiaries, issue equity interests, in excess of $100 million unless they receive consideration at least equal to the fair market value of the assets or equity interests, consisting of at least 75% in cash, assumption of liabilities, securities converted into cash within 60 days, or productive assets. CCO Holdings and its restricted subsidiaries are then required within 365 days after any asset sale either to use or commit to use the net cash proceeds over a specified threshold to acquire assets used or useful in their businesses or use the net cash proceeds to repay specified debt, or to offer to repurchase the issuer’s notes with any remaining proceeds.
Prohibitions on Restricting Dividends
CCO Holdings' restricted subsidiaries may generally not enter into arrangements involving restrictions on their ability to make dividends or distributions or transfer assets to CCO Holdings unless those restrictions with respect to financing arrangements are on terms that are no more restrictive than those governing the credit facilities existing when they entered into the applicable indentures or are not materially more restrictive than customary terms in comparable financings and will not materially impair CCO Holdings' ability to make payments on the notes.
Affiliate Transactions
The CCO Holdings Indentures and CCOH Safari Indentures also restrict the ability of CCO Holdings and its restricted subsidiaries to enter into certain transactions with affiliates involving consideration in excess of $25 million without a determination by the board of directors that the transaction complies with this covenant, or transactions with affiliates involving over $100 million without receiving an opinion as to the fairness to the holders of such transaction from a financial point of view issued by an accounting, appraisal or investment banking firm of national standing.
Cross Acceleration
The CCO Holdings Indentures and CCOH Safari Indentures include various events of default, including cross acceleration provisions. Under these provisions, a failure by CCO Holdings or any of its restricted subsidiaries to pay at the final maturity thereof the principal amount of other indebtedness having a principal amount of $100 million or more (or any other default under any such indebtedness resulting in its acceleration) would result in an event of default under the indenture governing the applicable notes. As a result, an event of default related to the failure to repay principal at maturity or the acceleration of the indebtedness under the notes issued under the CCO Holdings Indentures or the CCOH Safari Indentures or the Charter Operating credit facilities could cause cross-defaults under all outstanding indentures.
Recently Issued Accounting Standards
In April 2014, the Financial Accounting Standards Board issued Accounting Standards Update No. 2014-08, Presentation of Financial Statements and Property, Plant, and Equipment: Reporting Discontinued Operations and Disclosures of Disposals of components of an Entity ("ASU 2014-08"). ASU 2014-08 changes the criteria for reporting a discontinued operation. Under the new guidance, a disposed component of an organization that represents a strategic shift that has (or will have) a major effect on its operations and financial results is a discontinued operation. For disposals of individually significant components that do not qualify for discontinued operations presentation, an entity must disclose pre-tax profit or loss of the disposed component. ASU 2014-08 requires prospective application to all disposals that are classified as held for sale and that occur within annual and interim periods beginning on or after December 15, 2014, with earlier application permitted for disposals that have not been reported in
62
previously issued financial statements. We adopted ASU 2014-08 on January 1, 2015. The adoption of ASU 2014-8 did not have a material impact on our consolidated financial statements.
In May 2014, the FASB issued ASU No. 2014-09, Revenue from Contracts with Customers ("ASU 2014-09"), which requires an entity to recognize the amount of revenue to which it expects to be entitled for the transfer of promised goods or services to customers. The ASU will replace most existing revenue recognition guidance in U.S. GAAP when it becomes effective. The effective date of ASU 2014-09 is fiscal years beginning after December 15, 2016, and interim periods within those years, with earlier adoption prohibited. Companies can transition to the standard either retrospectively or as a cumulative-effect adjustment as of the date of adoption. We have not yet selected a transition method nor have we determined the effect of ASU 2014-09 to our consolidated financial statements.
Item 7A.
Quantitative and Qualitative Disclosures About Market Risk.
We are exposed to various market risks, including fluctuations in interest rates. We use interest rate derivative instruments to manage our interest costs and reduce our exposure to increases in floating interest rates. We manage our exposure to fluctuations in interest rates by maintaining a mix of fixed and variable rate debt. Using interest rate derivative instruments, we agree to exchange, at specified intervals through 2017, the difference between fixed and variable interest amounts calculated by reference to agreed-upon notional principal amounts. For more information, see Note 11 to the accompanying consolidated financial statements contained in “Part II. Item 8. Financial Statements and Supplementary Data.”
As of
December 31, 2014
and
2013
, the principal amount of our debt was approximately
$21.1 billion
and
$14.2 billion
, respectively, including $7.0 billion of debt which proceeds are currently held in escrow pending consummation of the Transactions as of December 31, 2014. As of
December 31, 2014
and
2013
, the weighted average interest rate on the credit facility debt, including the effects of our interest rate swap agreements, was approximately 3.8% and 3.6%, respectively, and the weighted average interest rate on the high-yield notes was approximately 6.2% and 6.4%, respectively, resulting in a blended weighted average interest rate of
5.4%
and
5.6%
, respectively. The interest rate on approximately
72%
and
84%
of the total principal amount of our debt was effectively fixed, including the effects of our interest rate swap agreements, as of
December 31, 2014
and
2013
, respectively. Excluding $7.0 billion of debt whose proceeds are currently held in escrow, the interest rate on 82% of the total principal amount of our debt was effectively fixed, including the effects of our interest rate swap agreements, as of
December 31, 2014
.
The table set forth below summarizes the fair values and contract terms of financial instruments subject to interest rate risk maintained by us as of
December 31, 2014
(dollars in millions):
|
2015
|
2016
|
2017
|
2018
|
2019
|
Thereafter
|
Total
|
Fair Value at December 31, 2014
|
|||||||||||||||||||||||||
|
Debt:
|
||||||||||||||||||||||||||||||||
|
Fixed Rate
|
$
|
—
|
|
$
|
—
|
|
$
|
1,000
|
|
$
|
—
|
|
$
|
1,400
|
|
$
|
11,450
|
|
$
|
13,850
|
|
$
|
14,205
|
|
||||||||
|
Average Interest Rate
|
—
|
%
|
—
|
%
|
7.25
|
%
|
—
|
%
|
7.00
|
%
|
5.99
|
%
|
6.19
|
%
|
||||||||||||||||||
|
Variable Rate
|
$
|
91
|
|
$
|
127
|
|
$
|
137
|
|
$
|
967
|
|
$
|
62
|
|
$
|
5,858
|
|
$
|
7,242
|
|
$
|
7,186
|
|
||||||||
|
Average Interest Rate
|
3.17
|
%
|
3.91
|
%
|
4.57
|
%
|
4.42
|
%
|
5.18
|
%
|
5.71
|
%
|
5.45
|
%
|
||||||||||||||||||
|
Interest Rate Instruments:
|
||||||||||||||||||||||||||||||||
|
Variable to Fixed Rate
|
$
|
300
|
|
$
|
250
|
|
$
|
850
|
|
$
|
—
|
|
$
|
—
|
|
$
|
—
|
|
$
|
1,400
|
|
$
|
18
|
|
||||||||
|
Average Pay Rate
|
4.99
|
%
|
3.89
|
%
|
3.84
|
%
|
—
|
%
|
—
|
%
|
—
|
%
|
4.10
|
%
|
||||||||||||||||||
|
Average Receive Rate
|
2.53
|
%
|
4.03
|
%
|
4.55
|
%
|
—
|
%
|
—
|
%
|
—
|
%
|
4.03
|
%
|
||||||||||||||||||
At
December 31, 2014
, we had
$1.4 billion
in notional amounts of interest rate swaps outstanding. This includes
$150 million
in delayed start interest rate swaps that become effective in March 2015. Also in March 2015, $300 million of currently effective swaps expire and therefore the notional amount of currently effective interest rate derivative instruments will decrease.
The notional amounts of interest rate instruments do not represent amounts exchanged by the parties and, thus, are not a measure of our exposure to credit loss. The amounts exchanged are determined by reference to the notional amount and the other terms of the contracts. The estimated fair value is determined using a present value calculation based on an implied forward LIBOR curve (adjusted for Charter Operating’s or counterparties’ credit risk). Interest rates on variable debt are estimated using the
63
average implied forward LIBOR for the year of maturity based on the yield curve in effect at
December 31, 2014
including applicable bank spread.
Item 8.
Financial Statements and Supplementary Data.
Our consolidated financial statements, the related notes thereto, and the reports of independent accountants are included in this annual report beginning on page F-1.
Item 9.
Changes in and Disagreements with Accountants on Accounting and Financial Disclosure.
None.
Item 9A.
Controls and Procedures.
Conclusion Regarding the Effectiveness of Disclosure Controls and Procedures
As of the end of the period covered by this report, under the supervision and with the participation of our management, including our Chief Executive Officer and Chief Financial Officer, we have evaluated the effectiveness of the design and operation of our disclosure controls and procedures with respect to the information generated for use in this annual report. The evaluation was based in part upon reports and certifications provided by a number of executives. Based upon, and as of the date of that evaluation, our Chief Executive Officer and Chief Financial Officer concluded that the disclosure controls and procedures were effective to provide reasonable assurances that information required to be disclosed in the reports we file or submit under the Securities Exchange Act of 1934 is recorded, processed, summarized and reported within the time periods specified in the SEC’s rules and forms.
In designing and evaluating the disclosure controls and procedures, our management recognized that any controls and procedures, no matter how well designed and operated, can provide only reasonable, not absolute, assurance of achieving the desired control objectives, and management necessarily was required to apply its judgment in evaluating the cost-benefit relationship of possible controls and procedures. Based upon the above evaluation, we believe that our controls provide such reasonable assurances.
There was no change in our internal control over financial reporting during the
fourth
quarter of
2014
that has materially affected, or is reasonably likely to materially affect, our internal control over financial reporting.
Management’s Report on Internal Control Over Financial Reporting
Our management is responsible for establishing and maintaining adequate internal control over financial reporting (as defined in Rule 13a-15(f) under the Exchange Act) for the Company. Our internal control system was designed to provide reasonable assurance to Charter’s management and board of directors regarding the preparation and fair presentation of published financial statements.
Management has assessed the effectiveness of our internal control over financial reporting as of
2014
. In making this assessment, we used the criteria set forth by the Committee of Sponsoring Organizations of the Treadway Commission (“COSO”) in
Internal Control — Integrated Framework
(2013)
.
Based on management’s assessment utilizing these criteria we believe that, as of
December 31, 2014
, our internal control over financial reporting was effective
.
Our independent auditors, KPMG LLP, have audited our internal control over financial reporting as stated in their report on page F-2.
Item 9B.
Other Information.
None.
64
Item 10.
Directors, Executive Officers and Corporate Governance.
The information required by Item 10 will be included in Charter’s 2014 Proxy Statement (the “Proxy Statement”) under the headings “Election of Class A Directors,” “Section 16(a) Beneficial Ownership Reporting Requirements,” and “Code of Ethics,” or in amendment to this Annual Report on Form 10-K and is incorporated herein by reference.
Item 11.
Executive Compensation.
The information required by Item 11 will be included in the Proxy Statement under the headings “Executive Compensation,” “Election of Class A Directors – Director Compensation” and “Compensation Discussion and Analysis,” or in an amendment to this Annual Report on Form 10-K and is incorporated herein by reference. Information contained in the Proxy Statement or an amendment to this Annual Report on Form 10-K
under the caption “Report of Compensation and Benefits Committee” is furnished and not deemed filed with the SEC.
Item 12.
Security Ownership of Certain Beneficial Owners and Management and Related Stockholder Matters.
The information required by Item 12 will be included in the Proxy Statement under the heading “Security Ownership of Certain Beneficial Owners and Management” or in amendment to this Annual Report on Form 10-K and is incorporated herein by reference.
Item 13.
Certain Relationships and Related Transactions, and Director Independence.
The information required by Item 13 will be included in the Proxy Statement under the heading “Certain Relationships and Related Transactions” and “Election of Class A Directors” or in amendment to this Annual Report on Form 10-K and is incorporated herein by reference.
Item 14.
Principal Accounting Fees and Services
.
The information required by Item 14 will be included in the Proxy Statement under the heading “Accounting Matters” or in amendment to this Annual Report on Form 10-K and is incorporated herein by reference.
65
Item 15.
Exhibits and Financial Statement Schedules.
|
(a)
|
The following documents are filed as part of this annual report:
|
|
(1)
|
Financial Statements.
|
A listing of the financial statements, notes and reports of independent public accountants required by Item 8 begins on page F-1 of this annual report.
|
(2)
|
Financial Statement Schedules.
|
No financial statement schedules are required to be filed by Items 8 and 15(c) because they are not required or are not applicable, or the required information is set forth in the applicable financial statements or notes thereto.
|
(3)
|
The index to the exhibits begins on page E-1 of this annual report.
|
66
SIGNATURES
Pursuant to the requirements of Section 13 or 15(d) of the Securities Exchange Act of 1934, Charter Communications, Inc. has duly caused this annual report to be signed on its behalf by the undersigned, thereunto duly authorized.
|
CHARTER COMMUNICATIONS, INC.,
|
||||
|
Registrant
|
||||
|
By:
|
/s/ Thomas M. Rutledge
|
|||
|
Thomas M. Rutledge
|
||||
|
President, Chief Executive Officer and Director
|
||||
|
Date: February 23, 2015
|
||||
S- 1
POWER OF ATTORNEY
KNOW ALL MEN BY THESE PRESENTS, that each person whose signature appears below constitutes and appoints Richard R. Dykhouse and Kevin D. Howard, and each of them (with full power to each of them to act alone), his or her true and lawful attorney-in-fact and agent, with full power of substitution and resubstitution, for him or her and in his or her name, place and stead, in any and all capacities, to sign on his or her behalf individually and in each capacity stated below any and all amendments (including post-effective amendments) to this annual report, and to file the same, with all exhibits thereto and other documents in connection therewith, with the Securities and Exchange Commission, granting unto said attorneys-in-fact and agents, and each of them, full power and authority to do and perform each and every act and thing requisite and necessary to be done in and about the premises, as fully to all intents and purposes as he or she might or could do in person, hereby ratifying and confirming all that said attorneys-in-fact and agents and either of them, or their substitutes, may lawfully do or cause to be done by virtue hereof.
Pursuant to the requirements of the Securities Exchange Act of 1934, this report has been signed below by the following persons on behalf of Charter Communications, Inc. and in the capacities and on the dates indicated.
|
Signature
|
Title
|
Date
|
|
/s/ Thomas M. Rutledge
Thomas M. Rutledge |
President, Chief Executive Officer, Director
(Principal Executive Officer) |
February 23, 2015
|
|
/s/ Christopher L. Winfrey
Christopher L. Winfrey |
Executive Vice President and Chief Financial Officer (Principal Financial Officer)
|
February 23, 2015
|
|
/s/ Kevin D. Howard
Kevin D. Howard |
Senior Vice President – Finance, Controller and Chief Accounting Officer (Principal Accounting Officer)
|
February 23, 2015
|
|
/s/ Balan Nair
Balan Nair |
Director
|
February 23, 2015
|
|
/s/ W. Lance Conn
W. Lance Conn |
Director
|
February 23, 2015
|
|
/s/ Michael Huseby
Michael Huseby |
Director
|
February 23, 2015
|
|
/s/ Craig A. Jacobson
Craig A. Jacobson |
Director
|
February 23, 2015
|
|
/s/ Gregory Maffei
Gregory Maffei |
Director
|
February 23, 2015
|
|
/s/ John Malone
John Malone |
Director
|
February 23, 2015
|
|
/s/ John D. Markley, Jr.
John D. Markley, Jr. |
Director
|
February 23, 2015
|
|
/s/ David C. Merritt
David C. Merritt |
Director
|
February 23, 2015
|
|
/s/ Eric L. Zinterhofer
Eric L. Zinterhofer |
Director
|
February 23, 2015
|
S- 2
Exhibit Index
Exhibits are listed by numbers corresponding to the Exhibit Table of Item 601 in Regulation S-K.
|
Exhibit
|
Description
|
|
|
2.1
|
Purchase Agreement dated February 7, 2013 between CSC Holdings, LLC, and Charter Communications Operating, LLC (incorporated by reference to Exhibit 10.1 to the current report on Form 8-K of Charter Communications, Inc. filed on February 12, 2013 (File No. 001-33664)).
|
|
|
2.2
|
Comcast/Charter Transactions Agreement, dated as of April 25, 2014, by and between Charter Communications, Inc, and Comcast Corporation (incorporated by reference to Exhibit 2.1 to the current report on Form 8-K of Charter Communications, Inc. filed on April 28, 2014 (File No. 001-33664)).
|
|
|
3.1
|
Amended and Restated Certificate of Incorporation of Charter Communications, Inc. (incorporated by reference to Exhibit 3.1 to the current report on Form 8-K of Charter Communications, Inc. filed on August 20, 2010 (File No. 001-33664)).
|
|
|
3.2
|
Amended and Restated By-laws of Charter Communications, Inc. as of November 30, 2009 (incorporated by reference to Exhibit 3.2 to the current report on Form 8-K of Charter Communications, Inc. filed on December 4, 2009 (File No. 001-33664)).
|
|
|
4.1(a)
|
Stockholders Agreement of Liberty Media Corporation to purchase Charter Communications, Inc. shares dated March 19, 2013 (incorporated by reference to Exhibit 1.1 to the current report on Form 8-K of Charter Communications, Inc. filed March 19, 2013 (File No. 001-33664)).
|
|
|
4.1(b)
|
Amendment to Stockholders Agreement by and among Liberty Broadband Corporation, Liberty Media Corporation and Charter Communications, Inc., dated effective as of September 29, 2014 (incorporated by reference to Exhibit 10.1 to the current report on Form 8-K of Charter Communications, Inc. filed on October 14, 2014 (File No. 001-33664)).
|
|
|
10.1
|
Indenture relating to the 8.125% Senior Notes due 2020, dated as of April 18, 2010, by and among CCO Holdings, LLC, CCO Holdings Capital Corp. and The Bank of New York Mellon Trust Company, N.A., as trustee (incorporated by reference to Exhibit 10.6 to the registration statement on Form S-1 of Charter Communications, Inc. filed on June 30, 2010 (File No. 333-167877)).
|
|
|
10.2
|
Indenture relating to the 7.25% senior notes due 2017, dated as of September 27, 2010, by and among CCO Holdings, LLC, and CCO Holdings Capital Corp., as Issuers, Charter Communications, Inc., as Parent Guarantor, and The Bank of New York Mellon Trust Company, N.A., as Trustee (incorporated by reference to Exhibit 10.1 to the current report on Form 8-K of Charter Communications, Inc. filed on September 30, 2010 (File No. 001-33664)).
|
|
|
10.3
|
Indenture relating to the 7.00% senior notes due 2019, dated as of January 11, 2011, by and among CCO Holdings, LLC, and CCO Holdings Capital Corp., as Issuers, Charter Communications, Inc., as Parent Guarantor, and The Bank of New York Mellon Trust Company, N.A., as Trustee (incorporated by reference to Exhibit 10.1 to the current report on Form 8-K of Charter Communications, Inc. filed on January 14, 2011 (File No. 001-33664)).
|
|
|
10.4
|
Indenture dated as of May 10, 2011, by and among CCO Holdings, LLC, and CCO Holdings Capital Corp., as Issuers, Charter Communications, Inc., as Parent Guarantor, and The Bank of New York Mellon Trust Company, N.A., as Trustee (incorporated by reference to Exhibit 4.1 to the current report on Form 8-K of Charter Communications, Inc. filed on May 13, 2011 (File No. 001-33664)).
|
|
|
10.5
|
First Supplemental Indenture dated as of May 10, 2011 by and among CCO Holdings, LLC, and CCO Holdings Capital Corp., as Issuers, Charter Communications, Inc., as Parent Guarantor, and The Bank of New York Mellon Trust Company, N.A., as Trustee (incorporated by reference to Exhibit 4.2 to the current report on Form 8-K of Charter Communications, Inc. filed on May 13, 2011 (File No. 001-33664)).
|
|
|
10.6
|
Second Supplemental Indenture dated as of December 14, 2011 by and among CCO Holdings, LLC, and CCO Holdings Capital Corp., as Issuers, Charter Communications, Inc., as Parent Guarantor, and The Bank of New York Mellon Trust Company, N.A., as Trustee (incorporated by reference to Exhibit 4.2 to the current report on Form 8-K of Charter Communications, Inc. filed on December 20, 2011 (File No. 001-33664)).
|
|
|
10.7
|
Third Supplemental Indenture dated as of January 26, 2012 by and among CCO Holdings, LLC, and CCO Holdings Capital Corp., as Issuers, Charter Communications, Inc., as Parent Guarantor, and The Bank of New York Mellon Trust Company, N.A., as Trustee (incorporated by reference to Exhibit 4.2 to the current report on Form 8-K of Charter Communications, Inc. filed on February 1, 2012 (File No. 001-33664))
|
|
|
10.8
|
Fourth Supplemental Indenture dated August 22, 2012 relating to the 5.25% Senior Notes due 2022 by and among CCO Holdings, LLC, CCO Holdings Capital Corp. and The Bank of New York Mellon Trust Company, N.A., as trustee (incorporated by reference to Exhibit 10.1 to the quarterly report on Form 10-Q of Charter Communications, Inc. filed on November 6, 2012 (File No. 001-33664)).
|
|
E- 1
|
10.9
|
Fifth Supplemental Indenture dated December 17, 2012 relating to the 5.125% Senior Notes due 2023 by and among CCO Holdings, LLC, CCO Holdings Capital Corp. and The Bank of New York Mellon Trust Company, N.A., as trustee (incorporated by reference to Exhibit 10.9 to the annual report on Form 10-K of Charter Communications, Inc. filed February 22, 2013 (File No. 001-33664)).
|
|
|
10.10
|
Sixth Supplemental Indenture relating to the 5.25% senior notes due 2021, dated as of March 14, 2013, by and among CCO Holdings, LLC, and CCO Holdings Capital Corp., as Issuers, Charter Communications, Inc., as Parent Guarantor, and The Bank of New York Mellon Trust Company, N.A., as Trustee (incorporated by reference to Exhibit 10.1 to the current report on Form 8-K of Charter Communications, Inc. filed March 15, 2013 (File No. 001-33664)).
|
|
|
10.11
|
Seventh Supplemental Indenture relating to the 5.75% senior notes due 2023, dated as of March 14, 2013, by and among CCO Holdings, LLC, and CCO Holdings Capital Corp., as Issuers, Charter Communications, Inc., as Parent Guarantor, and The Bank of New York Mellon Trust Company, N.A., as Trustee (incorporated by reference to Exhibit 10.2 to the current report on Form 8-K of Charter Communications, Inc. filed March 15, 2013 (File No. 001-33664)).
|
|
|
10.12
|
Eighth Supplemental Indenture relating to the 5.75% senior notes due 2024, dated as of May 3, 2013, by and among CCO Holdings, LLC and CCO Holdings Capital Corp., as Issuers, Charter Communications, Inc., as Parent Guarantor, and The Bank of New York Mellon Trust Company, N.A., as Trustee (incorporated by reference to Exhibit 10.7 to the quarterly report on Form 10-Q of Charter Communications, Inc. filed on May 7, 2013 (File No. 001-33664)).
|
|
|
10.13
|
Indenture dated as of November 5, 2014, by and among CCO Holdings, LLC, CCO Holdings Capital Corp. and CCOH Safari, LLC, as Issuers, Charter Communications, Inc., as Parent Guarantor, and The Bank of New York Mellon Trust Company, N.A., as Trustee (incorporated by reference to Exhibit 4.1 to the current report on Form 8-K of Charter Communications, Inc. filed on November 10, 2014 (File No. 001-33664)).
|
|
|
10.14
|
First Supplemental Indenture dated as of November 5, 2014, by and among CCOH Safari, LLC, as Issuer, and The Bank of New York Mellon Trust Company, N.A., as Trustee (incorporated by reference to Exhibit 4.2 to the current report on Form 8-K of Charter Communications, Inc. filed on November 10, 2014 (File No. 001-33664)).
|
|
|
10.15
|
Second Supplemental Indenture dated as of November 5, 2014, by and among CCOH Safari, LLC, as Issuer, and The Bank of New York Mellon Trust Company, N.A., as Trustee (incorporated by reference to Exhibit 4.3 to the current report on Form 8-K of Charter Communications, Inc. filed on November 10, 2014 (File No. 001-33664)).
|
|
|
10.16
|
Escrow Agreement, dated as of November 5, 2014, among CCOH Safari, LLC, Charter Communications, Inc., U.S. Bank National Association, as escrow agent, and The Bank of New York Mellon Trust Company, N.A., as trustee (incorporated by reference to Exhibit 4.4 to the current report on Form 8-K of Charter Communications, Inc. filed on November 10, 2014 (File No. 001-33664).
|
|
|
10.17(a)
|
Restatement Agreement, dated as of April 11, 2012 by and among Charter Communications Operating, LLC, CCO Holdings, LLC, the lenders party thereto and Bank of America, N.A., as Administrative Agent (incorporated by reference to Exhibit 10.2 to the current report on Form 8-K filed by Charter Communications, Inc. on April 17, 2012 (File No. 001-33664)).
|
|
|
10.17(b)
|
Amendment No. 1 dated March 22, 2013 to the Amended and Restated Credit Agreement dated April 11, 2012 between Charter Communications Operating, LLC, as borrower, CCO Holdings, LLC, as guarantor, and Bank of America, N.A., as administrative agent (incorporated by reference to Exhibit 10.5 to the quarterly report on Form 10-Q of Charter Communications, Inc. filed on May 7, 2013 (File No. 001-33664)).
|
|
|
10.17(c)
|
Amendment No. 2 dated April 22, 2013 to the Amended and Restated Credit Agreement dated April 11, 2012 between Charter Communications Operating, LLC, as borrower, CCO Holdings, LLC, as guarantor, and Bank of America, N.A., as administrative agent (incorporated by reference to Exhibit 10.6 to the quarterly report on Form 10-Q of Charter Communications, Inc. filed on May 7, 2013 (File No. 001-33664)).
|
|
|
10.17(d)
|
Amendment No. 3, dated as of June 27, 2013, to the Amended and Restated Credit Agreement dated April 11, 2012 between Charter Communications Operating, LLC, as borrower, CCO Holdings, LLC, as guarantor, and Bank of America, N.A., as administrative agent (incorporated by reference to Exhibit 10.1 to the current report on Form 8-K filed by Charter Communications, Inc. on July 2, 2013 (File No. 001-33664)).
|
|
|
10.17(e)
|
Amendment No. 4, dated as of September 12, 2014, to the Amended and Restated Credit Agreement dated April 11, 2012 between Charter Communications Operating, LLC, as borrower and Bank of America, N.A., as administrative agent (incorporated by reference to Exhibit 10.2 to the current report on Form 8-K filed by Charter Communications, Inc. on September 18, 2014 (File No. 001-33664)).
|
|
|
10.17(f)
|
Amended and Restated Guarantee and Collateral Agreement made by CCO Holdings, LLC, Charter Communications Operating, LLC and certain of its subsidiaries in favor of Bank of America, N.A., as administrative agent, as amended and restated as of March 31, 2010 (incorporated by reference to Exhibit 10.2 to the current report on Form 8-K of Charter Communications, Inc. filed on April 6, 2010 (File No. 001-33664)).
|
|
E- 2
|
10.17(g)
|
Incremental Activation Notice, dated as of May 3, 2013 delivered by Charter Communications Operating, LLC, CCO Holdings, LLC, the Subsidiary Guarantors Party thereto and each Term F Lender party thereto to Bank of America, N.A., as Administrative Agent under the Amended and Restated Credit Agreement, dated as of April 11, 2012 (as further amended, restated or supplemented from time to time thereafter) (incorporated by reference to the quarterly report on Form 10-Q of Charter Communications, Inc. filed on May 7, 2013 (File No. 001-33664)).
|
|
|
10.17(h)
|
Incremental Activation Notice, dated as of July 1, 2013 delivered by Charter Communications Operating, LLC, CCO Holdings, LLC, the Subsidiary Guarantors Party thereto and each Term E Lender party thereto to Bank of America, N.A., as Administrative Agent under the Amended and Restated Credit Agreement, dated as of April 11, 2012 (as further amended, restated or supplemented from time to time thereafter) (incorporated by reference to Exhibit 10.2 to the current report on Form 8-K filed by Charter Communications, Inc. on July 2, 2013 (File No. 001-33664)).
|
|
|
10.17(i)
|
Incremental Activation Notice, dated as of September 12, 2014 delivered by Charter Communications Operating, LLC, the Subsidiary Guarantors Pary thereto and each Term G Lender party thereto to Bank of America, N.A., as Administrative Agent under the Amended and Restated Credit Agreement, dated as of April 11, 2012 (as further amended, restated or supplemented from time to time thereafter) (incorporated by reference to Exhibit 10.1 to the current report on Form 8-K filed by Charter Communications, Inc. on September 18, 2014 (File No. 001-33664)).
|
|
|
10.18(a)
|
Escrow Credit Agreement, dated as of September 12, 2014, between CCO Safari, LLC, as borrower, and Bank of America, N.A., as administrative agent, and the lenders party thereto (incorporated by reference to Exhibit 10.2 to the current report on Form 8-K filed by Charter Communications, Inc. on September 18, 2014 (File No. 001-33664)).
|
|
|
10.18(b)
|
Escrow Agreement, dated as of September 12, 2014, between CCO Safari, LLC, as borrower, Bank of America, N.A., as administrative agent, and U.S. Bank, N.A., as escrow agent (incorporated by reference to Exhibit 10.3 to the current report on Form 8-K filed by Charter Communications, Inc. on September 18, 2014 (File No. 001-33664)).
|
|
|
10.19(a)
|
Registration Rights Agreement dated as of November 30, 2009, by and among Charter Communications, Inc. and certain investors listed therein (incorporated by reference to Exhibit 10.2 to the current report on Form 8-K of Charter Communications, Inc. filed on December 4, 2009 (File No. 001-33664)).
|
|
|
10.19(b)
|
Amendment No. 1 to the Registration Rights Agreement dated November 30, 2009, by and among Charter Communications, Inc. and certain Investors listed therein (incorporated by reference to Exhibit 10.2 to the quarterly report on Form 10-Q of Charter Communications, Inc. filed on November 6, 2012 (File No. 001-33664)).
|
|
|
10.20(a)
|
Amended and Restated Management Agreement, dated as of June 19, 2003, between Charter Communications Operating, LLC and Charter Communications, Inc. (incorporated by reference to Exhibit 10.4 to the quarterly report on Form 10-Q filed by Charter Communications, Inc. on August 5, 2003 (File No. 333-83887)).
|
|
|
10.20(b)
|
First Amendment to the Amended and Restated Management Agreement, dated as of July 20, 2010, between Charter Communications Operating, LLC and Charter Communications, Inc. (incorporated by reference to Exhibit 10.6 to the quarterly report on Form 10-Q filed by Charter Communications, Inc. on August 4, 2010 (File No. 001-33664)).
|
|
|
10.21(a)
|
Second Amended and Restated Mutual Services Agreement, dated as of June 19, 2003 between Charter Communications, Inc. and Charter Communications Holding Company, LLC (incorporated by reference to Exhibit 10.5(a) to the quarterly report on Form 10-Q filed by Charter Communications, Inc. on August 5, 2003 (File No. 000-27927)).
|
|
|
10.21(b)
|
First Amendment to the Second Amended and Restated Mutual Services Agreement, dated as of July 20, 2010, between Charter Communications, Inc. and Charter Communications Holding Company, LLC (incorporated by reference to Exhibit 10.7 to the quarterly report on Form 10-Q filed by Charter Communications, Inc. on August 4, 2010 (File No. 001-33664)).
|
|
|
10.22+
|
Charter Communications, Inc. Executive Bonus Plan (incorporated by reference to Exhibit 10.1 to the Quarterly Report on Form 10-Q of Charter Communications, Inc. filed on May 8, 2012 (File No. 001-33664)).
|
|
|
10.23+
|
Charter Communications, Inc. Executive Incentive Performance Plan (incorporated by reference to Exhibit 10.21 to the annual report on Form 10-K filed by Charter Communications, Inc. on February 27, 2012 (File No. 001-33664)).
|
|
|
10.24+
|
Charter Communications, Inc. Amended and Restated 2009 Stock Incentive Plan (incorporated by reference to Exhibit 10.1 to the Current Report on Form 8-K of Charter Communications, Inc. filed on December 21, 2009 (File No. 001-33664)).
|
|
|
10.25+
|
Charter Communications, Inc.'s Amended and Restated Supplemental Deferred Compensation Plan, dated as of September 1, 2011(incorporated by reference to Exhibit 10.1 to the current report on Form 8-K filed by Charter Communications, Inc. on September 2, 2011 (File No. 001-33664)).
|
|
|
10.26+
|
Form of Non-Qualified Time Vesting Stock Option Agreement dated April 26, 2011(incorporated by reference to Exhibit 10.3 to the quarterly report on Form 10-Q filed by Charter Communications, Inc. on August 2, 2011 (File No. 001-33664)).
|
|
E- 3
|
10.27+
|
Form of Non-Qualified Price Vesting Stock Option Agreement dated April 26, 2011(incorporated by reference to Exhibit 10.2 to the quarterly report on Form 10-Q filed by Charter Communications, Inc. on August 2, 2011 (File No. 001-33664)).
|
|
|
10.28+
|
Form of Restricted Stock Unit Agreement dated April 26, 2011(incorporated by reference to Exhibit 10.4 to the quarterly report on Form 10-Q filed by Charter Communications, Inc. on August 2, 2011 (File No. 001-33664)).
|
|
|
10.29+
|
Form of Notice of LTIP Award Agreement Changes (RSU Awards) (incorporated by reference to Exhibit 10.3 to the current report on Form 8-K filed by Charter Communications, inc. on January 22, 2014 (File No. 001-33664)).
|
|
|
10.30+
|
Form of Notice of LTIP Award Agreement Changes (Time-Vesting Option Awards) (incorporated by reference to Exhibit 10.4 to the current report on Form 8-K filed by Charter Communications, Inc. on January 22, 2014 (File No. 001-33664)).
|
|
|
10.31+
|
Form of Notice of LTIP Award Agreement Changes (Restricted Stock Awards) (incorporated by reference to Exhibit 10.5 to the current report on Form 8-K filed by Charter Communications, inc. on January 22, 2014 (File No. 001-33664)).
|
|
|
10.32+
|
Form of Notice of LTIP Award Agreement Changes (Performance-Vesting Option Awards) (incorporated by reference to Exhibit 10.6 to the current report on Form 8-K filed by Charter Communications, Inc. on January 22, 2014 (File No. 001-33664)).
|
|
|
10.33+
|
Form of Stock Option Agreement dated January 15, 2014 (incorporated by reference to Exhibit 10.1 to the current report on Form 8-K filed by Charter Communications, Inc. on January 22, 2014 (File No. 001-33664)).
|
|
|
10.34+
|
Form of Restricted Stock Unit Agreement dated January 15, 2014 (incorporated by reference to Exhibit 10.2 to the current report on Form 8-K filed by Charter Communications, Inc. on January 22, 2014 (File No. 001-33664)).
|
|
|
10.35+
|
Employment Agreement between Thomas Rutledge and Charter Communications, Inc., dated as of December 19, 2011 (incorporated by reference to Exhibit 10.1 to the current report on Form 8-K of Charter Communications, Inc. filed on December 19, 2011 (File No. 001-33664)).
|
|
|
10.36(a)+
|
Amended and Restated Employment Agreement between Christopher L. Winfrey and Charter Communications, Inc., dated effective as of August 31, 2012 (incorporated by reference to Exhibit 10.24(a) to the annual report on Form 10-K filed by Charter Communications, Inc. on February 22, 2013 (File No. 001-33664)).
|
|
|
10.36(b)+
|
The New York Relocation Agreement and Release entered into by and between Charter Communications, Inc. and Christopher Winfrey dated as of October 23, 2012 (incorporated by reference to Exhibit 10.4 to the Quarterly Report on Form 10-Q of Charter Communications, Inc. filed on November 6, 2012 (File No. 001-33664)).
|
|
|
10.37(a)+
|
Employment Agreement dated as of April 30, 2012, by and between Charter Communications, Inc. and John Bickham (incorporated by reference to Exhibit 10.1 to the current report on Form 8-K filed by Charter Communications, Inc. on May 1, 2012 (File No. 001-33664)).
|
|
|
10.37(b)+
|
Time-Vesting Stock Option Agreement dated as of April 30, 2012 by and between Charter Communications, Inc. and John Bickham (incorporated by reference to Exhibit 10.2 to the current report on Form 8-K filed by Charter Communications, Inc. on May 1, 2012 (File No. 001-33664)).
|
|
|
10.37(c)+
|
Performance-Vesting Restricted Stock Agreement dated as of April 30, 2012 by and between Charter Communications, Inc. and John Bickham (incorporated by reference to Exhibit 10.3 to the current report on Form 8-K filed by Charter Communications, Inc. on May 1, 2012 (File No. 001-33664))
|
|
|
10.37(d)+
|
Performance-Vesting Stock Option Agreement dated as of April 30, 2012 by and between Charter Communications, Inc. and John Bickham (incorporated by reference to Exhibit 10.4 to the current report on Form 8-K filed by Charter Communications, Inc. on May 1, 2012 (File No. 001-33664))
|
|
|
10.37(e)+
|
Time-Vesting Restricted Stock Agreement dated as of April 30, 2012 by and between Charter Communications, Inc. and John Bickham (incorporated by reference to Exhibit 10.5 to the current report on Form 8-K filed by Charter Communications, Inc. on May 1, 2012 (File No. 001-33664)).
|
|
|
10.38+*
|
Employment Agreement dated effective as of December 10, 2013 by and between Charter Communications, Inc. and Donald Detampel.
|
|
|
10.39+*
|
Employment Agreement dated effective as of April 9, 2014 by and between Charter Communications, Inc. and Jonathan Hargis.
|
|
|
10.40
|
Form of First Amended and Restated Indemnification Agreement (incorporated by reference to Exhibit 10.3 to the quarterly report on Form 10-Q of Charter Communications, Inc. filed on August 6, 2013 (File No. 001-33664)).
|
|
|
12.1*
|
Computation of Ratio of Earnings to Fixed Charges.
|
|
|
21.1*
|
Subsidiaries of Charter Communications, Inc.
|
|
|
23.1*
|
Consent of KPMG LLP.
|
|
|
31.1*
|
Certificate of Chief Executive Officer pursuant to Rule 13a-14(a)/Rule 15d-14(a) under the Securities Exchange Act of 1934.
|
|
|
31.2*
|
Certificate of Chief Financial Officer pursuant to Rule 13a-14(a)/Rule 15d-14(a) under the Securities Exchange Act of 1934.
|
|
E- 4
|
32.1*
|
Certification pursuant to 18 U.S.C. Section 1350, as adopted pursuant to Section 906 of the Sarbanes-Oxley Act of 2002 (Chief Executive Officer).
|
|
|
32.2*
|
Certification pursuant to 18 U.S.C. Section 1350, as adopted pursuant to Section 906 of the Sarbanes-Oxley Act of 2002 (Chief Financial Officer).
|
|
|
101
|
The following financial information from the Annual Report of Charter Communications, Inc. on Form 10-K for the year ended December 31, 2014, filed with the SEC on February 23, 2015, formatted in eXtensible Business Reporting Language: (i) Consolidated Balance Sheets, (ii) Consolidated Statements of Operations, (iii) Consolidated Statements of Comprehensive Loss, (iv) Consolidated Statements of Changes in Shareholder Equity, (v) Consolidated Statements of Cash Flows, and (vi) Notes to Consolidated Financial Statements.
|
|
_____________
* Filed herewith.
+
Management compensatory plan or arrangement
E- 5
INDEX TO FINANCIAL STATEMENTS
|
Page
|
|
|
Audited Financial Statements
|
|
F- 1
Report of Independent Registered Public Accounting Firm
The Board of Directors and Shareholders
Charter Communications, Inc.:
We have audited the accompanying consolidated balance sheets of Charter Communications, Inc. and subsidiaries (the Company) as of December 31, 2014 and 2013, and the related consolidated statements of operations, comprehensive loss, changes in shareholders’ equity, and cash flows for each of the years in the three-year period ended December 31, 2014. We also have audited the Company’s internal control over financial reporting as of December 31, 2014, based on criteria established in
Internal Control - Integrated Framework (2013)
issued by the Committee of Sponsoring Organizations of the Treadway Commission (COSO). The Company’s management is responsible for these consolidated financial statements, for maintaining effective internal control over financial reporting, and for its assessment of the effectiveness of internal control over financial reporting, included in the accompanying Management’s Report on Internal Control over Financial Reporting (Item 9A). Our responsibility is to express an opinion on these consolidated financial statements and an opinion on the Company’s internal control over financial reporting based on our audits.
We conducted our audits in accordance with the standards of the Public Company Accounting Oversight Board (United States). Those standards require that we plan and perform the audits to obtain reasonable assurance about whether the financial statements are free of material misstatement and whether effective internal control over financial reporting was maintained in all material respects. Our audits of the consolidated financial statements included examining, on a test basis, evidence supporting the amounts and disclosures in the financial statements, assessing the accounting principles used and significant estimates made by management, and evaluating the overall financial statement presentation. Our audit of internal control over financial reporting included obtaining an understanding of internal control over financial reporting, assessing the risk that a material weakness exists, and testing and evaluating the design and operating effectiveness of internal control based on the assessed risk. Our audits also included performing such other procedures as we considered necessary in the circumstances. We believe that our audits provide a reasonable basis for our opinions.
A company’s internal control over financial reporting is a process designed to provide reasonable assurance regarding the reliability of financial reporting and the preparation of financial statements for external purposes in accordance with generally accepted accounting principles. A company’s internal control over financial reporting includes those policies and procedures that (1) pertain to the maintenance of records that, in reasonable detail, accurately and fairly reflect the transactions and dispositions of the assets of the company; (2) provide reasonable assurance that transactions are recorded as necessary to permit preparation of financial statements in accordance with generally accepted accounting principles, and that receipts and expenditures of the company are being made only in accordance with authorizations of management and directors of the company; and (3) provide reasonable assurance regarding prevention or timely detection of unauthorized acquisition, use, or disposition of the company’s assets that could have a material effect on the financial statements.
Because of its inherent limitations, internal control over financial reporting may not prevent or detect misstatements. Also, projections of any evaluation of effectiveness to future periods are subject to the risk that controls may become inadequate because of changes in conditions, or that the degree of compliance with the policies or procedures may deteriorate.
In our opinion, the consolidated financial statements referred to above present fairly, in all material respects, the financial position of Charter Communications, Inc. and subsidiaries as of December 31, 2014 and 2013, and the results of their operations and their cash flows for each of the years in the three-year period ended December 31, 2014, in conformity with U.S. generally accepted accounting principles. Also in our opinion, the Company maintained, in all material respects, effective internal control over financial reporting as of December 31, 2014, based on criteria established in
Internal Control - Integrated Framework (2013)
issued by the Committee of Sponsoring Organizations of the Treadway Commission.
(signed) KPMG LLP
St. Louis, Missouri
February 23, 2015
F- 2
CHARTER COMMUNICATIONS, INC. AND SUBSIDIARIES
CONSOLIDATED BALANCE SHEETS
(dollars in millions, except share data)
CONSOLIDATED BALANCE SHEETS
(dollars in millions, except share data)
|
December 31,
2014 |
December 31,
2013 |
||||||
|
ASSETS
|
|||||||
|
CURRENT ASSETS:
|
|||||||
|
Cash and cash equivalents
|
$
|
3
|
|
$
|
21
|
|
|
|
Accounts receivable, less allowance for doubtful accounts of
|
|||||||
|
$22 and $19, respectively
|
285
|
|
234
|
|
|||
|
Prepaid expenses and other current assets
|
83
|
|
67
|
|
|||
|
Total current assets
|
371
|
|
322
|
|
|||
|
RESTRICTED CASH AND CASH EQUIVALENTS
|
7,111
|
|
—
|
|
|||
|
INVESTMENT IN CABLE PROPERTIES:
|
|||||||
|
Property, plant and equipment, net of accumulated
|
|||||||
|
depreciation of $5,484 and $4,787, respectively
|
8,373
|
|
7,981
|
|
|||
|
Franchises
|
6,006
|
|
6,009
|
|
|||
|
Customer relationships, net
|
1,105
|
|
1,389
|
|
|||
|
Goodwill
|
1,168
|
|
1,177
|
|
|||
|
Total investment in cable properties, net
|
16,652
|
|
16,556
|
|
|||
|
OTHER NONCURRENT ASSETS
|
416
|
|
417
|
|
|||
|
Total assets
|
$
|
24,550
|
|
$
|
17,295
|
|
|
|
LIABILITIES AND SHAREHOLDERS’ EQUITY
|
|||||||
|
CURRENT LIABILITIES:
|
|||||||
|
Accounts payable and accrued liabilities
|
$
|
1,635
|
|
$
|
1,467
|
|
|
|
Total current liabilities
|
1,635
|
|
1,467
|
|
|||
|
LONG-TERM DEBT
|
21,023
|
|
14,181
|
|
|||
|
DEFERRED INCOME TAXES
|
1,674
|
|
1,431
|
|
|||
|
OTHER LONG-TERM LIABILITIES
|
72
|
|
65
|
|
|||
|
SHAREHOLDERS’ EQUITY:
|
|||||||
|
Class A common stock; $.001 par value; 900 million shares authorized;
|
|||||||
|
111,999,687 and 106,144,075 shares issued and outstanding, respectively
|
—
|
|
—
|
|
|||
|
Class B common stock; $.001 par value; 25 million shares authorized;
|
|||||||
|
no shares issued and outstanding
|
—
|
|
—
|
|
|||
|
Preferred stock; $.001 par value; 250 million shares authorized;
|
|||||||
|
no shares issued and outstanding
|
—
|
|
—
|
|
|||
|
Additional paid-in capital
|
1,930
|
|
1,760
|
|
|||
|
Accumulated deficit
|
(1,762
|
)
|
(1,568
|
)
|
|||
|
Accumulated other comprehensive loss
|
(22
|
)
|
(41
|
)
|
|||
|
Total shareholders’ equity
|
146
|
|
151
|
|
|||
|
Total liabilities and shareholders’ equity
|
$
|
24,550
|
|
$
|
17,295
|
|
|
The accompanying notes are an integral part of these consolidated financial statements.
F- 3
CHARTER COMMUNICATIONS, INC. AND SUBSIDIARIES
CONSOLIDATED STATEMENTS OF OPERATIONS
(dollars in millions, except per share and share data)
CONSOLIDATED STATEMENTS OF OPERATIONS
(dollars in millions, except per share and share data)
|
Year Ended December 31,
|
|||||||||||
|
2014
|
2013
|
2012
|
|||||||||
|
REVENUES
|
$
|
9,108
|
|
$
|
8,155
|
|
$
|
7,504
|
|
||
|
COSTS AND EXPENSES:
|
|||||||||||
|
Operating costs and expenses (excluding depreciation and amortization)
|
5,973
|
|
5,345
|
|
4,860
|
|
|||||
|
Depreciation and amortization
|
2,102
|
|
1,854
|
|
1,713
|
|
|||||
|
Other operating expenses, net
|
62
|
|
47
|
|
16
|
|
|||||
|
8,137
|
|
7,246
|
|
6,589
|
|
||||||
|
Income from operations
|
971
|
|
909
|
|
915
|
|
|||||
|
OTHER EXPENSES:
|
|||||||||||
|
Interest expense, net
|
(911
|
)
|
(846
|
)
|
(907
|
)
|
|||||
|
Loss on extinguishment of debt
|
—
|
|
(123
|
)
|
(55
|
)
|
|||||
|
Gain (loss) on derivative instruments, net
|
(7
|
)
|
11
|
|
—
|
|
|||||
|
(918
|
)
|
(958
|
)
|
(962
|
)
|
||||||
|
Income (loss) before income taxes
|
53
|
|
(49
|
)
|
(47
|
)
|
|||||
|
Income tax expense
|
(236
|
)
|
(120
|
)
|
(257
|
)
|
|||||
|
Net loss
|
$
|
(183
|
)
|
$
|
(169
|
)
|
$
|
(304
|
)
|
||
|
LOSS PER COMMON SHARE, BASIC AND DILUTED
|
$
|
(1.70
|
)
|
$
|
(1.65
|
)
|
$
|
(3.05
|
)
|
||
|
Weighted average common shares outstanding, basic and diluted
|
108,374,160
|
|
101,934,630
|
|
99,657,989
|
|
|||||
CHARTER COMMUNICATIONS, INC. AND SUBSIDIARIES
CONSOLIDATED STATEMENTS OF COMPREHENSIVE LOSS
(dollars in millions)
|
Year Ended December 31,
|
|||||||||||
|
2014
|
2013
|
2012
|
|||||||||
|
Net loss
|
$
|
(183
|
)
|
$
|
(169
|
)
|
$
|
(304
|
)
|
||
|
Net impact of interest rate derivative instruments, net of tax
|
19
|
|
34
|
|
(10
|
)
|
|||||
|
Comprehensive loss
|
$
|
(164
|
)
|
$
|
(135
|
)
|
$
|
(314
|
)
|
||
The accompanying notes are an integral part of these consolidated financial statements.
F- 4
CHARTER COMMUNICATIONS, INC. AND SUBSIDIARIES
CONSOLIDATED STATEMENTS OF CHANGES IN SHAREHOLDERS’ EQUITY
CONSOLIDATED STATEMENTS OF CHANGES IN SHAREHOLDERS’ EQUITY
(dollars in millions)
|
Class A Common Stock
|
Class B Common Stock
|
Additional Paid-In Capital
|
Accumulated Deficit
|
Treasury Stock
|
Accumulated Other Comprehensive Loss
|
Total Shareholders' Equity
|
||||||||||||||||||||||
|
BALANCE, December 31, 2011
|
$
|
—
|
|
$
|
—
|
|
$
|
1,556
|
|
$
|
(1,082
|
)
|
$
|
—
|
|
$
|
(65
|
)
|
$
|
409
|
|
|||||||
|
Net loss
|
—
|
|
—
|
|
—
|
|
(304
|
)
|
—
|
|
—
|
|
(304
|
)
|
||||||||||||||
|
Net impact of interest rate derivative instruments, net of tax
|
—
|
|
—
|
|
—
|
|
—
|
|
—
|
|
(10
|
)
|
(10
|
)
|
||||||||||||||
|
Stock compensation expense, net
|
—
|
|
—
|
|
50
|
|
—
|
|
—
|
|
—
|
|
50
|
|
||||||||||||||
|
Exercise of options
|
—
|
|
—
|
|
15
|
|
—
|
|
—
|
|
—
|
|
15
|
|
||||||||||||||
|
Purchase of treasury stock
|
—
|
|
—
|
|
—
|
|
—
|
|
(11
|
)
|
—
|
|
(11
|
)
|
||||||||||||||
|
Retirement of treasury stock
|
—
|
|
—
|
|
(5
|
)
|
(6
|
)
|
11
|
|
—
|
|
—
|
|
||||||||||||||
|
BALANCE, December 31, 2012
|
—
|
|
—
|
|
1,616
|
|
(1,392
|
)
|
—
|
|
(75
|
)
|
149
|
|
||||||||||||||
|
Net loss
|
—
|
|
—
|
|
—
|
|
(169
|
)
|
—
|
|
—
|
|
(169
|
)
|
||||||||||||||
|
Net impact of interest rate derivative instruments, net of tax
|
—
|
|
—
|
|
—
|
|
—
|
|
—
|
|
34
|
|
34
|
|
||||||||||||||
|
Stock compensation expense, net
|
—
|
|
—
|
|
48
|
|
—
|
|
—
|
|
—
|
|
48
|
|
||||||||||||||
|
Exercise of options and warrants
|
—
|
|
—
|
|
104
|
|
—
|
|
—
|
|
—
|
|
104
|
|
||||||||||||||
|
Purchase of treasury stock
|
—
|
|
—
|
|
—
|
|
—
|
|
(15
|
)
|
—
|
|
(15
|
)
|
||||||||||||||
|
Retirement of treasury stock
|
—
|
|
—
|
|
(8
|
)
|
(7
|
)
|
15
|
|
—
|
|
—
|
|
||||||||||||||
|
BALANCE, December 31, 2013
|
—
|
|
—
|
|
1,760
|
|
(1,568
|
)
|
—
|
|
(41
|
)
|
151
|
|
||||||||||||||
|
Net loss
|
—
|
|
—
|
|
—
|
|
(183
|
)
|
—
|
|
—
|
|
(183
|
)
|
||||||||||||||
|
Net impact of interest rate derivative instruments, net of tax
|
—
|
|
—
|
|
—
|
|
—
|
|
—
|
|
19
|
|
19
|
|
||||||||||||||
|
Stock compensation expense, net
|
—
|
|
—
|
|
55
|
|
—
|
|
—
|
|
—
|
|
55
|
|
||||||||||||||
|
Exercise of options and warrants
|
—
|
|
—
|
|
123
|
|
—
|
|
—
|
|
—
|
|
123
|
|
||||||||||||||
|
Purchase of treasury stock
|
—
|
|
—
|
|
—
|
|
—
|
|
(19
|
)
|
—
|
|
(19
|
)
|
||||||||||||||
|
Retirement of treasury stock
|
—
|
|
—
|
|
(8
|
)
|
(11
|
)
|
19
|
|
—
|
|
—
|
|
||||||||||||||
|
BALANCE, December 31, 2014
|
$
|
—
|
|
$
|
—
|
|
$
|
1,930
|
|
$
|
(1,762
|
)
|
$
|
—
|
|
$
|
(22
|
)
|
$
|
146
|
|
|||||||
The accompanying notes are an integral part of these consolidated financial statements.
F- 5
CHARTER COMMUNICATIONS, INC. AND SUBSIDIARIES
CONSOLIDATED STATEMENTS OF CASH FLOWS
(dollars in millions)
(dollars in millions)
|
Year Ended December 31,
|
||||||||||||
|
2014
|
2013
|
2012
|
||||||||||
|
CASH FLOWS FROM OPERATING ACTIVITIES:
|
||||||||||||
|
Net loss
|
$
|
(183
|
)
|
$
|
(169
|
)
|
$
|
(304
|
)
|
|||
|
Adjustments to reconcile net loss to net cash flows from operating activities:
|
||||||||||||
|
Depreciation and amortization
|
2,102
|
|
1,854
|
|
1,713
|
|
||||||
|
Non-cash interest expense
|
37
|
|
43
|
|
45
|
|
||||||
|
Loss on extinguishment of debt
|
—
|
|
123
|
|
55
|
|
||||||
|
(Gain) loss on derivative instruments, net
|
7
|
|
(11
|
)
|
—
|
|
||||||
|
Deferred income taxes
|
233
|
|
112
|
|
250
|
|
||||||
|
Other, net
|
65
|
|
82
|
|
45
|
|
||||||
|
Changes in operating assets and liabilities, net of effects from acquisitions and dispositions:
|
||||||||||||
|
Accounts receivable
|
(51
|
)
|
10
|
|
34
|
|
||||||
|
Prepaid expenses and other assets
|
(9
|
)
|
—
|
|
(8
|
)
|
||||||
|
Accounts payable, accrued liabilities and other
|
158
|
|
114
|
|
46
|
|
||||||
|
Net cash flows from operating activities
|
2,359
|
|
2,158
|
|
1,876
|
|
||||||
|
CASH FLOWS FROM INVESTING ACTIVITIES:
|
||||||||||||
|
Purchases of property, plant and equipment
|
(2,221
|
)
|
(1,825
|
)
|
(1,745
|
)
|
||||||
|
Change in accrued expenses related to capital expenditures
|
33
|
|
76
|
|
13
|
|
||||||
|
Sales (purchases) of cable systems, net
|
11
|
|
(676
|
)
|
19
|
|
||||||
|
Restricted cash in escrow
|
(7,111
|
)
|
—
|
|
—
|
|
||||||
|
Other, net
|
(16
|
)
|
(18
|
)
|
(24
|
)
|
||||||
|
Net cash flows from investing activities
|
(9,304
|
)
|
(2,443
|
)
|
(1,737
|
)
|
||||||
|
CASH FLOWS FROM FINANCING ACTIVITIES:
|
||||||||||||
|
Borrowings of long-term debt
|
8,806
|
|
6,782
|
|
5,830
|
|
||||||
|
Repayments of long-term debt
|
(1,980
|
)
|
(6,520
|
)
|
(5,901
|
)
|
||||||
|
Payments for debt issuance costs
|
(6
|
)
|
(50
|
)
|
(53
|
)
|
||||||
|
Purchase of treasury stock
|
(19
|
)
|
(15
|
)
|
(11
|
)
|
||||||
|
Proceeds from exercise of options and warrants
|
123
|
|
104
|
|
15
|
|
||||||
|
Other, net
|
3
|
|
(2
|
)
|
(14
|
)
|
||||||
|
Net cash flows from financing activities
|
6,927
|
|
299
|
|
(134
|
)
|
||||||
|
NET INCREASE (DECREASE) IN CASH AND CASH EQUIVALENTS
|
(18
|
)
|
14
|
|
5
|
|
||||||
|
CASH AND CASH EQUIVALENTS, beginning of period
|
21
|
|
7
|
|
2
|
|
||||||
|
CASH AND CASH EQUIVALENTS, end of period
|
$
|
3
|
|
$
|
21
|
|
$
|
7
|
|
|||
|
CASH PAID FOR INTEREST
|
$
|
850
|
|
$
|
763
|
|
$
|
904
|
|
|||
The accompanying notes are an integral part of these consolidated financial statements.
F- 6
CHARTER COMMUNICATIONS, INC. AND SUBSIDIARIES
NOTES TO CONSOLIDATED FINANCIAL STATEMENTS
DECEMBER 31, 2014, 2013 AND 2012
(dollars in millions, except share or per share data or where indicated)
1. Organization and Basis of Presentation
Organization
Charter Communications, Inc. (“Charter”) is a holding company whose principal asset is a
100%
common equity interest in Charter Communications Holding Company, LLC (“Charter Holdco”). Charter owns cable systems through its subsidiaries, which are collectively, with Charter, referred to herein as the “Company.”
The Company is a cable operator providing services in the United States. The Company offers to residential and commercial customers traditional cable video programming, Internet services, and voice services, as well as advanced video services such as video on demand, high definition television, and digital video recorder (“DVR”) service. The Company sells its cable video programming, Internet, voice, and advanced video services primarily on a subscription basis. The Company also sells local advertising on cable networks and on the Internet and provides fiber connectivity to cellular towers.
Basis of Presentation
The accompanying consolidated financial statements have been prepared in accordance with accounting principles generally accepted in the United States (“GAAP”) and the rules and regulations of the Securities and Exchange Commission (the “SEC”).
The preparation of financial statements in conformity with GAAP requires management to make estimates and assumptions that affect the reported amounts of assets and liabilities and disclosure of contingent assets and liabilities at the date of the financial statements and the reported amounts of revenues and expenses during the reporting period. Areas involving significant judgments and estimates include capitalization of labor and overhead costs; depreciation and amortization costs; valuations and impairments of property, plant and equipment, intangibles and goodwill; income taxes; contingencies and programming expense. Actual results could differ from those estimates.
Certain prior period amounts, primarily merger and acquisition costs, have been reclassified to conform with the 2014 presentation.
2. Summary of Significant Accounting Policies
Consolidation
The accompanying consolidated financial statements include the accounts of Charter and its wholly owned subsidiaries. The Company consolidates based upon evaluation of the Company’s power, through voting rights or similar rights, to direct the activities of another entity that most significantly impact the entity’s economic performance; its obligation to absorb the expected losses of the entity; and its right to receive the expected residual returns of the entity. All significant inter-company accounts and transactions among consolidated entities have been eliminated.
Cash and Cash Equivalents
The Company considers all highly liquid investments with original maturities of three months or less to be cash equivalents. These investments are carried at cost, which approximates market value. Cash and cash equivalents consist primarily of money market funds and commercial paper.
Property, Plant and Equipment
Additions to property, plant and equipment are recorded at cost, including all material, labor and certain indirect costs associated with the construction of cable transmission and distribution facilities. While the Company’s capitalization is based on specific activities, once capitalized, costs are tracked by fixed asset category at the cable system level and not on a specific asset basis. For assets that are sold or retired, the estimated historical cost and related accumulated depreciation is removed. Costs associated with initial customer installations and the additions of network equipment necessary to enable advanced video services are capitalized. Costs capitalized as part of initial customer installations include materials, labor, and certain indirect costs. Indirect costs are associated with the activities of the Company’s personnel who assist in connecting and activating the new service and consist of compensation and other costs associated with these support functions. Indirect costs primarily include employee benefits
F- 7
CHARTER COMMUNICATIONS, INC. AND SUBSIDIARIES
NOTES TO CONSOLIDATED FINANCIAL STATEMENTS
DECEMBER 31, 2014, 2013 AND 2012
(dollars in millions, except share or per share data or where indicated)
and payroll taxes, direct variable costs associated with capitalizable activities, consisting primarily of installation and construction, vehicle costs, the cost of dispatch personnel and indirect costs directly attributable to capitalizable activities. The costs of disconnecting service at a customer’s dwelling or reconnecting service to a previously installed dwelling are charged to operating expense in the period incurred. Costs for repairs and maintenance are charged to operating expense as incurred, while plant and equipment replacement and betterments, including replacement of cable drops from the pole to the dwelling, are capitalized.
Depreciation is recorded using the straight-line composite method over management’s estimate of the useful lives of the related assets as follows:
|
Cable distribution systems
|
7-20 years
|
|
|
Customer equipment and installations
|
3-8 years
|
|
|
Vehicles and equipment
|
3-6 years
|
|
|
Buildings and leasehold improvements
|
15-40 years
|
|
|
Furniture, fixtures and equipment
|
6-10 years
|
|
Asset Retirement Obligations
Certain of the Company’s franchise agreements and leases contain provisions requiring the Company to restore facilities or remove equipment in the event that the franchise or lease agreement is not renewed. The Company expects to continually renew its franchise agreements and has concluded that all of the related franchise rights are indefinite lived intangible assets. Accordingly, the possibility is remote that the Company would be required to incur significant restoration or removal costs related to these franchise agreements in the foreseeable future. A liability is required to be recognized for an asset retirement obligation in the period in which it is incurred if a reasonable estimate of fair value can be made. The Company has not recorded an estimate for potential franchise related obligations, but would record an estimated liability in the unlikely event a franchise agreement containing such a provision were no longer expected to be renewed. The Company also expects to renew many of its lease agreements related to the continued operation of its cable business in the franchise areas. For the Company’s lease agreements, the estimated liabilities related to the removal provisions, where applicable, have been recorded and are not significant to the financial statements.
Other Noncurrent Assets
Other noncurrent assets primarily include trademarks, right-of-entry costs and deferred financing costs. Trademarks have been determined to have an indefinite life and are tested annually for impairment. Right-of-entry costs represent costs incurred related to agreements entered into with landlords, real estate companies or owners to gain access to a building in order to provide cable service. Right-of-entry costs are generally deferred and amortized to amortization expense over the term of the agreement. Costs related to borrowings are deferred and amortized to interest expense over the terms of the related borrowings.
Valuation of Long-Lived Assets
The Company evaluates the recoverability of long-lived assets to be held and used when events or changes in circumstances indicate that the carrying amount of an asset may not be recoverable. Such events or changes in circumstances could include such factors as impairment of the Company’s indefinite life assets, changes in technological advances, fluctuations in the fair value of such assets, adverse changes in relationships with local franchise authorities, adverse changes in market conditions or a deterioration of operating results. If a review indicates that the carrying value of such asset is not recoverable from estimated undiscounted cash flows, the carrying value of such asset is reduced to its estimated fair value. While the Company believes that its estimates of future cash flows are reasonable, different assumptions regarding such cash flows could materially affect its evaluations of asset recoverability.
No
impairments of long-lived assets to be held and used were recorded in
2014
,
2013
and
2012
.
Revenue Recognition
Revenues from residential and commercial video, Internet and voice services are recognized when the related services are provided. Advertising sales are recognized at estimated realizable values in the period that the advertisements are broadcast. In some cases, the Company coordinates the advertising sales efforts of other cable operators in a certain market and remits amounts received from customers less an agreed-upon percentage to such cable operator. For those arrangements in which the Company acts as a
F- 8
CHARTER COMMUNICATIONS, INC. AND SUBSIDIARIES
NOTES TO CONSOLIDATED FINANCIAL STATEMENTS
DECEMBER 31, 2014, 2013 AND 2012
(dollars in millions, except share or per share data or where indicated)
principal, the Company records the revenues earned from the advertising customer on a gross basis and the amount remitted to the cable operator as an operating expense.
Fees imposed on Charter by various governmental authorities are passed through on a monthly basis to the Company’s customers and are periodically remitted to authorities. Fees of
$283 million
,
$263 million
and
$260 million
for the years ended
December 31, 2014
,
2013
and
2012
, respectively, are reported in video, voice and commercial revenues, on a gross basis with a corresponding operating expense because the Company is acting as a principal
.
Other taxes, such as sales taxes imposed on the Company's customers, collected and remitted to state and local authorities, are recorded on a net basis because the Company is acting as an agent in such situation.
The Company’s revenues by product line are as follows:
|
Year Ended December 31,
|
|||||||||||
|
2014
|
2013
|
2012
|
|||||||||
|
Video
|
$
|
4,443
|
|
$
|
4,040
|
|
$
|
3,649
|
|
||
|
Internet
|
2,576
|
|
2,186
|
|
1,866
|
|
|||||
|
Voice
|
575
|
|
644
|
|
828
|
|
|||||
|
Commercial
|
993
|
|
812
|
|
648
|
|
|||||
|
Advertising sales
|
341
|
|
291
|
|
334
|
|
|||||
|
Other
|
180
|
|
182
|
|
179
|
|
|||||
|
$
|
9,108
|
|
$
|
8,155
|
|
$
|
7,504
|
|
|||
Programming Costs
The Company has various contracts to obtain basic, digital and premium video programming from programming vendors whose compensation is typically based on a flat fee per customer. The cost of the right to exhibit network programming under such arrangements is recorded in operating expenses in the month the programming is available for exhibition. Programming costs are paid each month based on calculations performed by the Company and are subject to periodic audits performed by the programmers. Certain programming contracts contain incentives to be paid by the programmers. The Company receives these payments and recognizes the incentives on a straight-line basis over the life of the programming agreement as a reduction of programming expense. This offset to programming expense was
$19 million
,
$7 million
and
$6 million
for the years ended
December 31, 2014
,
2013
and
2012
, respectively. Programming costs included in the accompanying statements of operations were
$2.5 billion
,
$2.1 billion
and
$2.0 billion
for the years ended
December 31, 2014
,
2013
and
2012
, respectively.
Advertising Costs
Advertising costs associated with marketing the Company’s products and services are generally expensed as costs are incurred. Such advertising expense was
$380 million
,
$357 million
and
$325 million
for the years ended
December 31, 2014
,
2013
and
2012
, respectively.
Multiple-Element Transactions
In the normal course of business, the Company enters into multiple-element transactions where it is simultaneously both a customer and a vendor with the same counterparty or in which it purchases multiple products and/or services, or settles outstanding items contemporaneous with the purchase of a product or service from a single counterparty. Transactions, although negotiated contemporaneously, may be documented in one or more contracts. The Company’s policy for accounting for each transaction negotiated contemporaneously is to record each element of the transaction based on the respective estimated fair values of the products or services purchased and the products or services sold. In determining the fair value of the respective elements, the Company refers to quoted market prices (where available), historical transactions or comparable cash transactions.
F- 9
CHARTER COMMUNICATIONS, INC. AND SUBSIDIARIES
NOTES TO CONSOLIDATED FINANCIAL STATEMENTS
DECEMBER 31, 2014, 2013 AND 2012
(dollars in millions, except share or per share data or where indicated)
Stock-Based Compensation
Restricted stock, restricted stock units, stock options and performance units and shares are measured at the grant date fair value and amortized to stock compensation expense over the requisite service period. The Company recorded
$55 million
,
$48 million
and
$50 million
of stock compensation expense, which is included in operating costs and expenses and other operating expenses, net for the years ended
December 31, 2014
,
2013
and
2012
, respectively.
The fair value of options granted is estimated on the date of grant using the Black-Scholes option-pricing model and Monte Carlo simulations for options and restricted stock units with market conditions. The grant date weighted average assumptions used during the years ended
December 31, 2014
,
2013
and
2012
, respectively, were: risk-free interest rate of
2.0%
,
1.5%
and
1.5%
; expected volatility of
36.9%
,
37.8%
and
38.4%
, and expected lives of
6.5
years,
6.3
years and
6.3
years. The grant date weighted average cost of equity used was
16.2%
during each of the years ended
December 31, 2013
and
2012
. Volatility assumptions were based on historical volatility of Charter and a peer group. The Company’s volatility assumptions represent management’s best estimate and were partially based on historical volatility of a peer group because management does not believe Charter’s pre-emergence from bankruptcy historical volatility to be representative of its future volatility. Expected lives were calculated based on the simplified-method due to insufficient historical exercise data. The valuations assume no dividends are paid.
Income Taxes
The Company recognizes deferred tax assets and liabilities for temporary differences between the financial reporting basis and the tax basis of the Company’s assets and liabilities and expected benefits of utilizing loss carryforwards. The impact on deferred taxes of changes in tax rates and tax law, if any, applied to the years during which temporary differences are expected to be settled, are reflected in the consolidated financial statements in the period of enactment. See Note 16.
Loss per Common Share
Basic loss per common share is computed by dividing the net loss by the weighted-average common shares outstanding during the respective periods. Diluted loss per common share equals basic loss per common share for the periods presented, as the effect of stock options and other convertible securities are anti-dilutive because the Company incurred net losses.
Segments
The Company’s operations are conducted through the use of a unified network and are managed and reported to its Chief Executive Officer ("CEO"), the Company's chief operating decision maker, on a consolidated basis. The CEO assesses performance and allocates resources based on the consolidated results of operations. Under this organizational and reporting structure, the Company has one reportable segment, broadband services.
3. Acquisitions and Dispositions
Acquisition of Bresnan
On July 1, 2013, Charter and Charter Communications Operating, LLC ("Charter Operating") acquired Bresnan Broadband Holdings, LLC and its subsidiaries (collectively, “Bresnan”) from a wholly owned subsidiary of Cablevision Systems Corporation ("Cablevision"), for
$1.625 billion
in cash, as well as a working capital adjustment and a reduction for certain funded indebtedness of Bresnan. Bresnan manages cable operating systems in Montana, Wyoming, Colorado and Utah. Charter funded the purchase of Bresnan with a
$1.5 billion
term loan (see Note 8) and borrowings under the Charter Operating credit facilities.
F- 10
CHARTER COMMUNICATIONS, INC. AND SUBSIDIARIES
NOTES TO CONSOLIDATED FINANCIAL STATEMENTS
DECEMBER 31, 2014, 2013 AND 2012
(dollars in millions, except share or per share data or where indicated)
The following unaudited pro forma financial information of Charter is based on the historical consolidated financial statements of Charter and the historical consolidated financial statements of Bresnan and is intended to provide information about how the acquisition of Bresnan and related financing may have affected Charter's historical consolidated financial statements if they had closed as of January 1, 2012. The pro forma financial information below is based on available information and assumptions that the Company believes are reasonable. The pro forma financial information is for illustrative and informational purposes only and is not intended to represent or be indicative of what Charter's financial condition or results of operations would have been had the transactions described above occurred on the date indicated. The pro forma financial information also should not be considered representative of Charter's future financial condition or results of operations.
|
Year Ended December 31,
|
|||||||
|
2013
|
2012
|
||||||
|
(unaudited)
|
|||||||
|
Revenues
|
$
|
8,419
|
|
$
|
8,017
|
|
|
|
Net loss
|
$
|
(194
|
)
|
$
|
(392
|
)
|
|
|
Loss per common share, basic and diluted
|
$
|
(1.90
|
)
|
$
|
(3.93
|
)
|
|
Transactions with Comcast
On April 25, 2014, the Company entered into a binding definitive agreement (the “Transactions Agreement”) with Comcast Corporation (“Comcast”), which contemplates the following transactions: (1) an asset purchase, (2) an asset exchange and (3) a contribution and spin-off transaction (collectively, the “Transactions”) as described in more detail below. The Transactions Agreement calls for the Transactions to be consummated substantially contemporaneously with each other as promptly as practicable following the merger of a subsidiary of Comcast with Time Warner Cable Inc. (“TWC”) as previously announced by Comcast and TWC. The completion of the Transactions will result in Charter acquiring approximately a net
1.3 million
existing TWC residential and commercial video customers.
Asset Purchase
At closing, the Transactions Agreement calls for the Company to acquire from Comcast certain cable systems currently owned by TWC serving approximately
1.4 million
video customers and all other assets and liabilities primarily related to such cable systems for cash consideration. The Transactions Agreement calls for the Company to pay to Comcast the tax benefit of the step-up it receives in the tax basis of the assets. The Transactions Agreement calls for such tax benefit to Charter to be paid as realized by the Company over an eight-year period, with an additional payment to be made at the end of such eight-year period in the amount of any remaining tax benefit (on a present value basis) not previously realized by Charter.
Asset Exchange
At closing, the Company and Comcast will exchange certain cable systems currently serving approximately
1.5 million
TWC video customers and approximately
1.6 million
Charter video customers and all other assets and liabilities primarily related to such cable systems. Most tax gains associated with the Asset Exchange are expected to be offset by Charter’s existing net operating losses.
Financing
Charter has received commitments from a number of leading Wall Street investment banks to provide incremental senior secured term loan facilities totaling up to
$8.4 billion
and a senior secured incremental revolving facility equal to
$500 million
under the Charter Operating credit facility. Pursuant to that commitment, Charter has fully drawn on
$3.5 billion
term loan G commitments. The amount of the commitments for incremental term loan facilities was further reduced by
$3.5 billion
at the closing of the offering of
$1.5 billion
aggregate principal amount of
5.50%
senior notes due 2022 (the "2022 Notes") and
$2.0 billion
aggregate principal amount of
5.75%
senior notes due 2024 (the "2024 Notes") (collectively, the "CCO Safari Notes") by CCOH Safari, LLC ("CCOH Safari"). Charter has
$1.4 billion
remaining in committed Charter Operating term loans. The proceeds from the term loan G and the Notes are being held in escrow subject to the closing of the Transactions and are recorded on the Company's consolidated balance sheet as noncurrent restricted cash and cash equivalents. The escrow for the CCOH Safari Notes continues
F- 11
CHARTER COMMUNICATIONS, INC. AND SUBSIDIARIES
NOTES TO CONSOLIDATED FINANCIAL STATEMENTS
DECEMBER 31, 2014, 2013 AND 2012
(dollars in millions, except share or per share data or where indicated)
until November 5, 2015. The escrow for term loan G continues so long as we pre-fund interest and the release conditions can be satisfied. The consideration for the assets acquired and transaction expenses will be financed with new indebtedness of Charter and is currently estimated at approximately
$7.2 billion
. The proceeds of the incremental facilities and the Notes will be used by Charter for the purpose of financing the Asset Purchase, paying fees and expenses incurred in connection with the Asset Purchase and the other Transactions, for providing ongoing working capital and for other general corporate purposes of Charter Operating and its subsidiaries. See Note 8.
Contribution and Spin-Off Transaction
CCH I, LLC (“CCH I”), a current indirect subsidiary of Charter, will be reorganized to be a direct subsidiary of Charter. CCH I will then form a new subsidiary that will merge with Charter, through a tax-free reorganization and become the new holding company (“New Charter”) that will own
100%
of Charter and indirectly Charter Holdco. New Charter will then acquire an approximate
33%
stake in a new publicly-traded cable provider to be spun-off by Comcast serving approximately
2.5 million
existing Comcast video customers (the "Spin-Off"). The cable systems will be contributed to Midwest Cable, Inc., which upon consummation of the Transactions, is expected to change its name to GreatLand Connections Inc. (“GreatLand Connections”). New Charter will acquire its interest in GreatLand Connections by issuing New Charter stock to Comcast shareholders (including former TWC shareholders) as a result of a merger of a wholly owned subsidiary of New Charter with and into GreatLand Connections. Comcast shareholders, including the former TWC shareholders, are expected to own approximately
67%
of GreatLand Connections, while New Charter is expected to directly own approximately
33%
of GreatLand Connections. GreatLand Connections expects to incur leverage of approximately
5
times its estimated pro forma EBITDA (as such term is defined by GreatLand Connections’ financing sources for purposes of the financing) to fund a distribution to Comcast and issue notes to Comcast prior to the spin-off. Additionally, the Company will provide services to GreatLand Connections, and the Company will be reimbursed the actual economic costs of such services, in addition to a fee of
4.25%
of GreatLand Connections' gross revenues.
The Asset Purchase, Asset Exchange and the acquisition of interests in GreatLand Connections will be valued at a
7.125
multiple of 2014 EBITDA (as defined by the parties), subject to certain post-closing adjustments.
4. Allowance for Doubtful Accounts
Activity in the allowance for doubtful accounts is summarized as follows for the years presented:
|
Year Ended December 31,
|
|||||||||||
|
2014
|
2013
|
2012
|
|||||||||
|
Balance, beginning of period
|
$
|
19
|
|
$
|
14
|
|
$
|
16
|
|
||
|
Charged to expense
|
122
|
|
101
|
|
105
|
|
|||||
|
Uncollected balances written off, net of recoveries
|
(119
|
)
|
(96
|
)
|
(107
|
)
|
|||||
|
Balance, end of period
|
$
|
22
|
|
$
|
19
|
|
$
|
14
|
|
||
F- 12
CHARTER COMMUNICATIONS, INC. AND SUBSIDIARIES
NOTES TO CONSOLIDATED FINANCIAL STATEMENTS
DECEMBER 31, 2014, 2013 AND 2012
(dollars in millions, except share or per share data or where indicated)
5. Property, Plant and Equipment
Property, plant and equipment consists of the following as of
December 31, 2014
and
2013
:
|
December 31,
|
||||||||
|
2014
|
2013
|
|||||||
|
Cable distribution systems
|
$
|
7,919
|
|
$
|
7,556
|
|
||
|
Customer equipment and installations
|
4,388
|
|
4,061
|
|
||||
|
Vehicles and equipment
|
335
|
|
270
|
|
||||
|
Buildings and leasehold improvements
|
499
|
|
425
|
|
||||
|
Furniture, fixtures and equipment
|
716
|
|
456
|
|
||||
|
13,857
|
|
12,768
|
|
|||||
|
Less: accumulated depreciation
|
(5,484
|
)
|
(4,787
|
)
|
||||
|
$
|
8,373
|
|
$
|
7,981
|
|
|||
The Company periodically evaluates the estimated useful lives used to depreciate its assets and the estimated amount of assets that will be abandoned or have minimal use in the future. A significant change in assumptions about the extent or timing of future asset retirements, or in the Company’s use of new technology and upgrade programs, could materially affect future depreciation expense.
Depreciation expense for the years ended
December 31, 2014
,
2013
and
2012
was
$1.8 billion
,
$1.6 billion
, and
$1.4 billion
, respectively. Property, plant and equipment increased
$515 million
as a result of cable system acquisitions during the year ended December 31, 2013.
6. Franchises, Goodwill and Other Intangible Assets
Franchise rights represent the value attributed to agreements or authorizations with local and state authorities that allow access to homes in cable service areas. For valuation purposes, they are defined as the future economic benefits of the right to solicit and service potential customers (customer marketing rights), and the right to deploy and market new services to potential customers (service marketing rights).
Management estimates the fair value of franchise rights at the date of acquisition and determines if the franchise has a finite life or an indefinite life. All franchises that qualify for indefinite life treatment are tested for impairment annually or more frequently as warranted by events or changes in circumstances. In determining whether our franchises have an indefinite life, the Company considered the likelihood of franchise renewals, the expected costs of franchise renewals, and the technological state of the associated cable systems, with a view to whether or not it is in compliance with any technology upgrading requirements specified in a franchise agreement. The Company has concluded that as of
December 31, 2014
and
2013
all of its franchises qualify for indefinite life treatment.
Franchise assets are aggregated into essentially inseparable units of accounting to conduct valuations. The units of accounting generally represent geographical clustering of our cable systems into groups. The Company assesses qualitative factors to determine whether the existence of events or circumstances leads to a determination that it is more likely than not that an indefinite lived intangible asset has been impaired. If, after this qualitative assessment, the Company determines that it is not more likely than not that an indefinite lived intangible asset has been impaired, then no further quantitative testing is necessary. In completing the impairment testing, the Company evaluated the impact of various factors to the expected future cash flows attributable to its units of accounting and to the assumed discount rate which would be used to present value those cash flows. Such factors included macro-economic and industry conditions including the capital markets, regulatory, and competitive environment, and costs of programming and customer premise equipment along with changes to our organizational structure and strategies. After consideration of these qualitative factors, the Company concluded that it is more likely than not that the fair value of the franchise
F- 13
CHARTER COMMUNICATIONS, INC. AND SUBSIDIARIES
NOTES TO CONSOLIDATED FINANCIAL STATEMENTS
DECEMBER 31, 2014, 2013 AND 2012
(dollars in millions, except share or per share data or where indicated)
assets in each unit of accounting exceeds the carrying value of such assets and therefore did not perform a quantitative analysis in 2014, 2013 or 2012.
If the Company is required to perform a quantitative analysis to test its franchise assets for impairment, the Company determines the estimated fair value utilizing an income approach model based on the present value of the estimated discrete future cash flows attributable to each of the intangible assets identified assuming a discount rate. The fair value of franchises for impairment testing is determined based on estimated discrete discounted future cash flows using assumptions consistent with internal forecasts. The franchise after-tax cash flow is calculated as the after-tax cash flow generated by the potential customers obtained (less the anticipated customer churn), and the new services added to those customers in future periods. The sum of the present value of the franchises' after-tax cash flow in years 1 through 10 and the continuing value of the after-tax cash flow beyond year 10 yields the fair value of the franchises.
This approach makes use of unobservable factors such as projected revenues, expenses, capital expenditures, and a discount rate applied to the estimated cash flows. The determination of the discount rate is based on a weighted average cost of capital approach, which uses a market participant’s cost of equity and after-tax cost of debt and reflects the risks inherent in the cash flows. The Company estimates discounted future cash flows using reasonable and appropriate assumptions including among others, penetration rates for video, high-speed Internet, and voice; revenue growth rates; operating margins; and capital expenditures. The assumptions are based on the Company’s and its peers’ historical operating performance adjusted for current and expected competitive and economic factors surrounding the cable industry. The estimates and assumptions made in the Company’s valuations are inherently subject to significant uncertainties, many of which are beyond its control, and there is no assurance that these results can be achieved. The primary assumptions for which there is a reasonable possibility of the occurrence of a variation that would significantly affect the measurement value include the assumptions regarding revenue growth, programming expense growth rates, the amount and timing of capital expenditures and the discount rate utilized.
Goodwill is tested for impairment as of November 30 of each year
,
or more frequently as warranted by events or changes in circumstances. Accounting guidance also permits a qualitative assessment for goodwill to determine whether it is more likely than not that the carrying value of a reporting unit exceeds its fair value. If, after this qualitative assessment, the Company determines that it is not more likely than not that the fair value of a reporting unit is less than its carrying amount then no further quantitative testing would be necessary. If the Company is required to perform the two-step test under the accounting guidance, the first step involves a comparison of the estimated fair value of each reporting unit to its carrying amount. If the estimated fair value of a reporting unit exceeds its carrying amount, goodwill of the reporting unit is not considered impaired and the second step of the goodwill impairment is not necessary. If the carrying amount of a reporting unit exceeds its estimated fair value, then the second step of the goodwill impairment test must be performed, and a comparison of the implied fair value of the reporting unit’s goodwill is compared to its carrying amount to determine the amount of impairment, if any. The fair value of the reporting unit, when performing the second step of the goodwill impairment test, is determined using a consistent income approach model as that used for franchise impairment testing. As with the Company's franchise impairment testing, the Company elected to perform a qualitative assessment for its goodwill impairment testing in 2014, 2013 and 2012 and concluded that goodwill is not impaired.
Customer relationships, for valuation purposes, represent the value of the business relationship with existing customers (less the anticipated customer churn), and are calculated by projecting the discrete future after-tax cash flows from these customers, including the right to deploy and market additional services to these customers. The present value of these after-tax cash flows yields the fair value of the customer relationships. The use of different valuation assumptions or definitions of franchises or customer relationships, such as our inclusion of the value of selling additional services to our current customers within customer relationships versus franchises, could significantly impact our valuations and any resulting impairment. Customer relationships are amortized on an accelerated method over useful lives of
8
-
15
years based on the period over which current customers are expected to generate cash flows. Customer relationships are evaluated for impairment upon the occurrence of events or changes in circumstances indicating that the carrying amount of an asset may not be recoverable. Customer relationships are deemed impaired when the carrying value exceeds the projected undiscounted future cash flows associated with the customer relationships. No impairment of customer relationships was recorded in the years ended
December 31, 2014
,
2013
or
2012
.
The fair value of trademarks is determined using the relief-from-royalty method which applies a fair royalty rate to estimated revenue. Royalty rates are estimated based on a review of market royalty rates in the communications and entertainment industries. As the Company expects to continue to use each trademark indefinitely, trademarks have been assigned an indefinite life and are tested annually for impairment using either a qualitative analysis or quantitative analysis as elected by management. The qualitative
F- 14
CHARTER COMMUNICATIONS, INC. AND SUBSIDIARIES
NOTES TO CONSOLIDATED FINANCIAL STATEMENTS
DECEMBER 31, 2014, 2013 AND 2012
(dollars in millions, except share or per share data or where indicated)
analysis did not identify any factors that would indicate that it was more likely than not that the fair value of trademarks were less than the carrying value and thus resulted in no impairment in 2014, 2013 or 2012.
As of
December 31, 2014
and
2013
, indefinite lived and finite-lived intangible assets are presented in the following table:
|
December 31,
|
||||||||||||||||||||||||
|
2014
|
2013
|
|||||||||||||||||||||||
|
Gross Carrying Amount
|
Accumulated Amortization
|
Net Carrying Amount
|
Gross Carrying Amount
|
Accumulated Amortization
|
Net Carrying Amount
|
|||||||||||||||||||
|
Indefinite lived intangible assets:
|
||||||||||||||||||||||||
|
Franchises
|
$
|
6,006
|
|
$
|
—
|
|
$
|
6,006
|
|
$
|
6,009
|
|
$
|
—
|
|
$
|
6,009
|
|
||||||
|
Goodwill
|
1,168
|
|
—
|
|
1,168
|
|
1,177
|
|
—
|
|
1,177
|
|
||||||||||||
|
Trademarks
|
159
|
|
—
|
|
159
|
|
158
|
|
—
|
|
158
|
|
||||||||||||
|
Other intangible assets
|
4
|
|
—
|
|
4
|
|
4
|
|
—
|
|
4
|
|
||||||||||||
|
$
|
7,337
|
|
$
|
—
|
|
$
|
7,337
|
|
$
|
7,348
|
|
$
|
—
|
|
$
|
7,348
|
|
|||||||
|
Finite-lived intangible assets:
|
||||||||||||||||||||||||
|
Customer relationships
|
$
|
2,616
|
|
$
|
1,511
|
|
$
|
1,105
|
|
$
|
2,617
|
|
$
|
1,228
|
|
$
|
1,389
|
|
||||||
|
Other intangible assets
|
151
|
|
60
|
|
91
|
|
130
|
|
44
|
|
86
|
|
||||||||||||
|
$
|
2,767
|
|
$
|
1,571
|
|
$
|
1,196
|
|
$
|
2,747
|
|
$
|
1,272
|
|
$
|
1,475
|
|
|||||||
Amortization expense related to customer relationships and other intangible assets for the years ended
December 31, 2014
,
2013
and
2012
was
$299 million
,
$299 million
and
$293 million
, respectively.
The Company expects amortization expense on its finite-lived intangible assets will be as follows.
|
2015
|
$
|
267
|
|
|
|
2016
|
234
|
|
||
|
2017
|
200
|
|
||
|
2018
|
165
|
|
||
|
2019
|
131
|
|
||
|
Thereafter
|
199
|
|
||
|
$
|
1,196
|
|
||
Actual amortization expense in future periods could differ from these estimates as a result of new intangible asset acquisitions or divestitures, changes in useful lives, impairments and other relevant factors.
F- 15
CHARTER COMMUNICATIONS, INC. AND SUBSIDIARIES
NOTES TO CONSOLIDATED FINANCIAL STATEMENTS
DECEMBER 31, 2014, 2013 AND 2012
(dollars in millions, except share or per share data or where indicated)
7. Accounts Payable and Accrued Liabilities
Accounts payable and accrued liabilities consist of the following as of
December 31, 2014
and
2013
:
|
December 31,
|
||||||||
|
2014
|
2013
|
|||||||
|
Accounts payable – trade
|
$
|
140
|
|
$
|
91
|
|
||
|
Accrued capital expenditures
|
268
|
|
235
|
|
||||
|
Deferred revenue
|
85
|
|
90
|
|
||||
|
Accrued liabilities:
|
||||||||
|
Interest
|
212
|
|
195
|
|
||||
|
Programming costs
|
430
|
|
379
|
|
||||
|
Franchise related fees
|
65
|
|
62
|
|
||||
|
Compensation
|
169
|
|
156
|
|
||||
|
Other
|
266
|
|
259
|
|
||||
|
$
|
1,635
|
|
$
|
1,467
|
|
|||
F- 16
CHARTER COMMUNICATIONS, INC. AND SUBSIDIARIES
NOTES TO CONSOLIDATED FINANCIAL STATEMENTS
DECEMBER 31, 2014, 2013 AND 2012
(dollars in millions, except share or per share data or where indicated)
8. Long-Term Debt
Long-term debt consists of the following as of
December 31, 2014
and
2013
:
|
December 31,
|
|||||||||||||||
|
2014
|
2013
|
||||||||||||||
|
Principal Amount
|
Accreted Value
|
Principal Amount
|
Accreted Value
|
||||||||||||
|
CCOH Safari, LLC:
|
|||||||||||||||
|
5.500% senior notes due December 1, 2022
|
$
|
1,500
|
|
$
|
1,500
|
|
$
|
—
|
|
$
|
—
|
|
|||
|
5.750% senior notes due December 1, 2024
|
2,000
|
|
2,000
|
|
—
|
|
—
|
|
|||||||
|
CCO Holdings, LLC:
|
|||||||||||||||
|
7.250% senior notes due October 30, 2017
|
1,000
|
|
1,000
|
|
1,000
|
|
1,000
|
|
|||||||
|
7.000% senior notes due January 15, 2019
|
1,400
|
|
1,394
|
|
1,400
|
|
1,393
|
|
|||||||
|
8.125% senior notes due April 30, 2020
|
700
|
|
700
|
|
700
|
|
700
|
|
|||||||
|
7.375% senior notes due June 1, 2020
|
750
|
|
750
|
|
750
|
|
750
|
|
|||||||
|
5.250% senior notes due March 15, 2021
|
500
|
|
500
|
|
500
|
|
500
|
|
|||||||
|
6.500% senior notes due April 30, 2021
|
1,500
|
|
1,500
|
|
1,500
|
|
1,500
|
|
|||||||
|
6.625% senior notes due January 31, 2022
|
750
|
|
747
|
|
750
|
|
747
|
|
|||||||
|
5.250% senior notes due September 30, 2022
|
1,250
|
|
1,240
|
|
1,250
|
|
1,239
|
|
|||||||
|
5.125% senior notes due February 15, 2023
|
1,000
|
|
1,000
|
|
1,000
|
|
1,000
|
|
|||||||
|
5.750% senior notes due September 1, 2023
|
500
|
|
500
|
|
500
|
|
500
|
|
|||||||
|
5.750% senior notes due January 15, 2024
|
1,000
|
|
1,000
|
|
1,000
|
|
1,000
|
|
|||||||
|
Credit facility due September 6, 2014
|
—
|
|
—
|
|
350
|
|
342
|
|
|||||||
|
Charter Communications Operating, LLC:
|
|||||||||||||||
|
Credit facilities
|
3,742
|
|
3,709
|
|
3,548
|
|
3,510
|
|
|||||||
|
CCO Safari, LLC (an Unrestricted Subsidiary):
|
|||||||||||||||
|
Credit facilities
|
3,500
|
|
3,483
|
|
—
|
|
—
|
|
|||||||
|
$
|
21,092
|
|
$
|
21,023
|
|
$
|
14,248
|
|
$
|
14,181
|
|
||||
The accreted values presented above represent the principal amount of the debt less the original issue discount at the time of sale, plus the accretion to the balance sheet date. However, the amount that is currently payable if the debt becomes immediately due is equal to the principal amount of the debt. The Company has availability under its credit facilities of approximately
$817 million
as of
December 31, 2014
, and as such, debt maturing in the next twelve months is classified as long-term. In addition, a
$500 million
revolver extension is currently committed and available to Charter. The availability of this revolver is not contingent or related to the closing of the Transactions. See Note 3.
Loss on extinguishment of debt consists of the following for the years ended
December 31, 2014
,
2013
and
2012
:
|
Year ended December 31,
|
||||||||||||||
|
2014
|
2013
|
2012
|
||||||||||||
|
Charter Operating credit amendment / prepayments
|
$
|
—
|
|
—
|
|
$
|
58
|
|
58
|
|
$
|
92
|
|
|
|
CCH II notes redemptions
|
—
|
|
—
|
|
—
|
|
—
|
|
(46
|
)
|
||||
|
Charter Operating notes repurchases
|
—
|
|
—
|
|
—
|
|
—
|
|
9
|
|
||||
|
CCO Holdings notes repurchases
|
—
|
|
—
|
|
65
|
|
65
|
|
—
|
|
||||
|
$
|
—
|
|
—
|
|
$
|
123
|
|
123
|
|
$
|
55
|
|
||
F- 17
CHARTER COMMUNICATIONS, INC. AND SUBSIDIARIES
NOTES TO CONSOLIDATED FINANCIAL STATEMENTS
DECEMBER 31, 2014, 2013 AND 2012
(dollars in millions, except share or per share data or where indicated)
CCOH Safari Notes
In October 2014, Charter created CCOH Safari as a
100%
wholly-owned indirect finance subsidiary of Charter. In November 2014, CCOH Safari, closed on transactions in which it issued
$1.5 billion
aggregate principal amount of
5.500%
senior notes due 2022 and
$2.0 billion
aggregate principal amount of
5.750%
senior notes due 2024. The net proceeds of the offering and sale of the CCOH Safari Notes and the next semi-annual interest payment are being held in escrow to fund a portion of the purchase of certain assets pursuant to the Transactions. The release of the proceeds from the escrow will be subject to the satisfaction of certain conditions, including the closing of the Transactions. Substantially concurrently with the escrow release, the CCOH Safari Notes will become obligations of CCO Holdings and CCO Holdings Capital. CCOH Safari will merge into CCO Holdings. Should the Transactions Agreement be terminated prior to the consummation of the Transactions, or upon expiration of the escrow agreement on November 5, 2015, such amounts placed in escrow must be used to settle amounts outstanding under the CCOH Safari Notes at par value. The amounts held in escrow are classified as noncurrent restricted cash and cash equivalents in the Company's consolidated balance sheet as of December 31, 2014. See Note 3.
The CCOH Safari Notes are guaranteed by Charter. Initially, they are senior debt obligations of CCOH Safari. Upon release of the proceeds from escrow, the CCOH Safari Notes will be senior debt obligations of CCO Holdings and CCO Holdings Capital Corp. and rank equally with all other current and future unsecured, unsubordinated obligations of CCO Holdings and CCO Holdings Capital Corp. The CCOH Safari Notes are structurally subordinated to all obligations of subsidiaries of CCO Holdings, including the Charter Operating and CCO Safari, LLC ("CCO Safari") credit facilities.
Following the release of the proceeds, CCO Holdings may redeem some or all of the CCOH Safari Notes at any time at a premium. The optional redemption price declines to
100%
of the respective series' principal amount, plus accrued and unpaid interest, if any, on or after varying dates in 2017 through 2020 with respect to the 2022 Notes and 2019 through 2022 with respect to the 2024 Notes.
In addition, at any time following the release of the proceeds and prior to December 1, 2017, with respect to the 2022 Notes, and December 1, 2019, with respect to the 2024 Notes, CCO Holdings and CCO Holdings Capital Corp. may redeem up to
40%
of the aggregate principal amount of such CCOH Safari Notes at a redemption price at a premium plus accrued and unpaid interest to the redemption date, with the net cash proceeds of one or more equity offerings (as defined in the indenture); provided that certain conditions are met.
In the event of specified change of control events, CCO Holdings must offer to purchase the CCOH Safari Notes from the holders at a purchase price equal to
101%
of the total principal amount of the notes, plus any accrued and unpaid interest.
CCO Holdings Notes
The CCO Holdings notes are guaranteed by Charter. They are senior debt obligations of CCO Holdings and CCO Holdings Capital Corp. and rank equally with all other current and future unsecured, unsubordinated obligations of CCO Holdings and CCO Holdings Capital Corp. The CCO Holdings notes are structurally subordinated to all obligations of subsidiaries of CCO Holdings, including the Charter Operating credit facilities.
CCO Holdings may redeem some or all of the CCO Holdings notes at any time at a premium. The optional redemption price declines to
100%
of the respective series’ principal amount, plus accrued and unpaid interest, if any, on or after varying dates in 2016 through 2021.
In addition, at any time prior to varying dates in 2015 through 2016, CCO Holdings may redeem up to
35%
of the aggregate principal amount of the notes at a redemption price at a premium plus accrued and unpaid interest to the redemption date, with the net cash proceeds of one or more equity offerings (as defined in the indenture); provided that certain conditions are met.
In the event of specified change of control events, CCO Holdings must offer to purchase the outstanding CCO Holdings notes from the holders at a purchase price equal to
101%
of the total principal amount of the notes, plus any accrued and unpaid interest.
F- 18
CHARTER COMMUNICATIONS, INC. AND SUBSIDIARIES
NOTES TO CONSOLIDATED FINANCIAL STATEMENTS
DECEMBER 31, 2014, 2013 AND 2012
(dollars in millions, except share or per share data or where indicated)
High-Yield Restrictive Covenants; Limitation on Indebtedness.
The indentures governing the CCO Holdings notes and CCOH Safari notes (following the release of proceeds from escrow) contain certain covenants that restrict the ability of CCO Holdings, CCO Holdings Capital Corp. and all of their restricted subsidiaries to:
|
•
|
incur additional debt;
|
|
•
|
pay dividends on equity or repurchase equity;
|
|
•
|
make investments;
|
|
•
|
sell all or substantially all of their assets or merge with or into other companies;
|
|
•
|
sell assets;
|
|
•
|
in the case of restricted subsidiaries, create or permit to exist dividend or payment restrictions with respect to CCO Holdings, guarantee their parent companies debt, or issue specified equity interests;
|
|
•
|
engage in certain transactions with affiliates; and
|
|
•
|
grant liens.
|
The above limitations in certain circumstances regarding incurrence of debt, payment of dividends and making investments contained in the indentures of CCO Holdings and CCOH Safari, permit CCO Holdings and its restricted subsidiaries to perform the above, so long as, after giving pro forma effect to the above, the leverage ratio would be below a specified level for the issuer. The leverage ratio under the indentures is 6.0 to 1.
Charter Operating Credit Facilities
The Charter Operating credit facilities have an outstanding principal amount of
$3.7 billion
at
December 31, 2014
as follows:
|
•
|
A term loan A with a remaining principal amount of
$684 million
, which is repayable in quarterly installments and aggregating
$38 million
in 2015,
$66 million
in 2016 and
$75 million
in 2017, with the remaining balance due at final maturity on April 22, 2018. Pricing on term loan A is LIBOR plus
2%
;
|
|
•
|
A term loan E with a remaining principal amount of approximately
$1.5 billion
, which is repayable in equal quarterly installments and aggregating
$15 million
in each loan year, with the remaining balance due at final maturity on July 1, 2020. Pricing on term loan E is LIBOR plus
2.25%
with a LIBOR floor of
0.75%
;
|
|
•
|
A term loan F with a remaining principal amount of approximately
$1.2 billion
, which is repayable in equal quarterly installments and aggregating
$12 million
in each loan year, with the remaining balance due at final maturity on January 3, 2021. Pricing on term loan F is LIBOR plus
2.25%
with a LIBOR floor of
0.75%
; and
|
|
•
|
A revolving loan with an outstanding balance of
$399 million
at
December 31, 2014
and allowing for borrowings of up to
$1.3 billion
, maturing on April 22, 2018. Pricing on the revolving loan is LIBOR plus
2%
with a commitment fee of
0.30%
.
|
Amounts outstanding under the Charter Operating credit facilities bear interest, at Charter Operating’s election, at a base rate or LIBOR (
0.17%
as of
December 31, 2014
and
December 31, 2013
), as defined, plus an applicable margin.
The Charter Operating credit facilities also allow us to enter into incremental term loans in the future, with amortization as set forth in the notices establishing such term loans. Although the Charter Operating credit facilities allow for the incurrence of a certain amount of incremental term loans subject to pro-forma compliance with its financial maintenance covenants, no assurance can be given that the Company could obtain additional incremental term loans in the future if Charter Operating sought to do so or what amount of incremental term loans would be allowable at any given time under the terms of the Charter Operating credit facilities.
The obligations of Charter Operating under the Charter Operating credit facilities are guaranteed by Charter Operating’s immediate parent company, CCO Holdings, and subsidiaries of Charter Operating. The obligations are also secured by (i) a lien on substantially all of the assets of Charter Operating and its subsidiaries, to the extent such lien can be perfected under the Uniform Commercial Code by the filing of a financing statement, and (ii) a pledge by CCO Holdings of the equity interests owned by it in any of Charter Operating’s subsidiaries, as well as inter-company obligations owing to it by any of such entities.
F- 19
CHARTER COMMUNICATIONS, INC. AND SUBSIDIARIES
NOTES TO CONSOLIDATED FINANCIAL STATEMENTS
DECEMBER 31, 2014, 2013 AND 2012
(dollars in millions, except share or per share data or where indicated)
CCO Safari Credit Facility
In September 2014, Charter Operating entered into a new term loan G facility pursuant to the terms of the Charter Operating credit agreement providing for a
$3.5 billion
term loan maturing in 2021. Pricing on the term loan G was set at LIBOR plus
3.50%
with a LIBOR floor of
0.75%
and issued at a price of
99.50%
of the aggregate principal amount. The term loan G forms a portion of the incremental facilities commitments as announced by Charter in July 2014 that will be used to fund the purchase of certain assets pursuant to the Transactions. Charter Operating assigned all of its obligations with respect to the term loan G and transferred all of the proceeds from the term loan G to a newly-created subsidiary, CCO Safari, which is considered a Non-Recourse Subsidiary under Charter Operating’s credit agreement, and CCO Safari placed the funds in an escrow account pending closing of the Transactions. The administrative agent has a perfected first priority security interest in the escrow funds on behalf of the lenders that are a party to the CCO Safari credit facility. The amounts borrowed under the term loan G facility are not considered when calculating the leverage ratio on CCO Holdings' indentures as CCO Safari has been designated as an Unrestricted Subsidiary under CCO Holdings' indenture. At closing of the Transactions, subject to certain conditions, Charter Operating will re-assume the obligations in respect of the term loan G under the Charter Operating credit agreement and the term loan G will be subject to the terms and conditions of the Charter Operating credit facilities. Such amounts, along with required original issuance discount and one month of interest, were placed in escrow and classified as noncurrent restricted cash and cash equivalents in the Company's consolidated balance sheet as of December 31, 2014. Should the Transactions Agreement be terminated prior to the consummation of the Transactions, such amounts placed in escrow must be used to settle amounts outstanding under the term loan G at par value less the original issue discount. See Note 3.
Charter Operating Credit Facilities — Restrictive Covenants
The Charter Operating credit facilities contain representations and warranties, and affirmative and negative covenants customary for financings of this type. The financial covenants measure performance against standards set for leverage to be tested as of the end of each quarter. The Charter Operating credit facilities contain provisions requiring mandatory loan prepayments under specific circumstances, including in connection with certain sales of assets, so long as the proceeds have not been reinvested in the business. Additionally, the Charter Operating credit facilities provisions contain an allowance for restricted payments so long as the consolidated leverage ratio is no greater than
3.5
after giving pro forma effect to such restricted payment. The Charter Operating credit facilities permit Charter Operating and its subsidiaries to make distributions to pay interest on the currently outstanding subordinated and parent company indebtedness, provided that, among other things, no default has occurred and is continuing under the Charter Operating credit facilities.
The events of default under the Charter Operating credit facilities include, among other things:
|
•
|
the failure to make payments when due or within the applicable grace period;
|
|
•
|
the failure to comply with specified covenants including the covenant to maintain the consolidated leverage ratio at or below
5.0
to
1.0
and the consolidated first lien leverage ratio at or below
4.0
to
1.0
;
|
|
•
|
the failure to pay or the occurrence of events that cause or permit the acceleration of other indebtedness owing by CCO Holdings, Charter Operating, or Charter Operating’s subsidiaries in aggregate principal amounts in excess of
$100 million
; and
|
|
•
|
similar to provisions contained in the note indentures and credit facility, the consummation of any change of control transaction resulting in any person or group having power, directly or indirectly, to vote more than
50%
of the ordinary voting power for the management of Charter Operating on a fully diluted basis and the occurrence of a ratings event including a downgrade in the corporate family rating during a ratings decline period.
|
CCO Safari Credit Facility — Restrictive Covenants
The term loan G is subject to the terms and conditions of a separate credit facility and escrow agreement until Charter Operating re-assumes its obligations for the loan. The CCO Safari credit facility contains customary representations and warranties and affirmative covenants with limited negative covenants prohibiting CCO Safari from engaging in any material activities other than performing its obligations under the credit facility and the escrow agreement or otherwise issuing other indebtedness pursuant to escrow arrangements similar to the CCO Safari credit facility and escrow agreement. As required by the CCO Safari credit facility, CCO Safari, Bank of America, N.A., and U.S. Bank, N.A., as escrow agent, entered into an escrow agreement pursuant to which, CCO Safari is required to maintain an escrow account over which the administrative agent has a perfected first priority security
F- 20
CHARTER COMMUNICATIONS, INC. AND SUBSIDIARIES
NOTES TO CONSOLIDATED FINANCIAL STATEMENTS
DECEMBER 31, 2014, 2013 AND 2012
(dollars in millions, except share or per share data or where indicated)
interest on behalf of the CCO Safari credit facility lenders. The events of default under the CCO Safari credit facility include, among others:
|
•
|
the failure to make payments when due or within the applicable grace period;
|
|
•
|
any acceleration of the loans and termination of the commitments under the Charter Operating credit facilities; and
|
|
•
|
the escrow agreement shall cease to be in full force and effect or the lien in the escrow account shall cease to be enforceable with the same effect and priority.
|
Limitations on Distributions
Distributions by the Company’s subsidiaries to a parent company for payment of principal on parent company notes are restricted under the indentures and credit facilities discussed above, unless there is no default under the applicable indenture and credit facilities, and unless each applicable subsidiary’s leverage ratio test is met at the time of such distribution. As of
December 31, 2014
, there was no default under any of these indentures or credit facilities. Distributions by Charter Operating for payment of principal on parent company notes are further restricted by the covenants in its credit facilities.
In addition to the limitation on distributions under the various indentures discussed above, distributions by the Company’s subsidiaries may only be made if they have “surplus” as defined in the Delaware Limited Liability Company Act.
Liquidity and Future Principal Payments
The Company continues to have significant amounts of debt, and its business requires significant cash to fund principal and interest payments on its debt, capital expenditures and ongoing operations. As set forth below, the Company has significant future principal payments beginning in 2017 and beyond. The Company continues to monitor the capital markets, and it expects to undertake refinancing transactions and utilize free cash flow and cash on hand to further extend or reduce the maturities of its principal obligations. The timing and terms of any refinancing transactions will be subject to market conditions.
Based upon outstanding indebtedness as of
December 31, 2014
, the amortization of term loans, and the maturity dates for all senior and subordinated notes, total future principal payments on the total borrowings under all debt agreements as of
December 31, 2014
, are as follows:
|
Year
|
Amount
|
|||
|
2015
|
$
|
91
|
|
|
|
2016
|
127
|
|
||
|
2017
|
1,137
|
|
||
|
2018
|
967
|
|
||
|
2019
|
1,462
|
|
||
|
Thereafter
|
17,308
|
|
||
|
$
|
21,092
|
|
||
9. Treasury Stock
In December 2011, the Company purchased, in a private transaction with a shareholder,
750,000
shares at
$55.18
for a total of
$41 million
. The Company received
700,668
of the shares prior to December 31, 2011, with
49,332
shares received in January 2012.
During the years ended
December 31, 2014
,
2013
and
2012
, the Company withheld
141,257
,
150,258
and
129,417
shares, respectively, of its common stock in payment of
$19 million
,
$15 million
and
$9 million
, respectively, of tax withholdings owed by employees upon vesting of restricted shares.
F- 21
CHARTER COMMUNICATIONS, INC. AND SUBSIDIARIES
NOTES TO CONSOLIDATED FINANCIAL STATEMENTS
DECEMBER 31, 2014, 2013 AND 2012
(dollars in millions, except share or per share data or where indicated)
In December 2014 and 2013, Charter's board of directors approved the retirement of treasury stock and
141,257
and
150,258
shares of treasury stock were retired as of
December 31, 2014
and
2013
, respectively.
The Company accounted for treasury stock using the cost method and the treasury shares upon repurchase were reflected on the Company’s consolidated balance sheets as a component of total shareholders’ equity. Upon retirement, these treasury shares were allocated between additional paid-in capital and accumulated deficit based on the cost of original issue included in additional paid-in capital.
10. Common Stock
Charter’s Class A common stock and Class B common stock are identical except with respect to certain voting, transfer and conversion rights. Holders of Class A common stock are entitled to
one
vote per share and holders of Class B common stock are entitled to votes equaling
35%
of the voting interests in Charter on a fully diluted basis. The Company currently does not have any outstanding Class B Common Stock.
In 2014 and 2013, the Company issued approximately
5.2 million
and
4.5 million
shares, respectively, of Charter Class A common stock as a result of exercises by holders who received warrants pursuant to the Joint Plan of Reorganization upon the Company's emergence from bankruptcy in 2009. The exercises resulted in proceeds to the Company of approximately
$90 million
and
$76 million
, respectively. As of December 31, 2014, there were no warrants outstanding.
The following table summarizes our shares outstanding for the three years ended
December 31, 2014
:
|
Class A Common Stock
|
Class B Common Stock
|
|||||
|
BALANCE, December 31, 2011
|
100,570,418
|
|
—
|
|
||
|
Option exercises
|
370,715
|
|
—
|
|
||
|
Restricted stock issuances, net of cancellations
|
182,537
|
|
—
|
|
||
|
Stock issuances from exercise of warrants
|
179,850
|
|
—
|
|
||
|
Restricted stock unit vesting
|
51,476
|
|
—
|
|
||
|
Purchase of treasury stock (see Note 9)
|
(178,749
|
)
|
—
|
|
||
|
BALANCE, December 31, 2012
|
101,176,247
|
|
—
|
|
||
|
Option exercises
|
543,221
|
|
—
|
|
||
|
Restricted stock issuances, net of cancellations
|
4,879
|
|
—
|
|
||
|
Stock issuances from exercise of warrants
|
4,481,656
|
|
—
|
|
||
|
Restricted stock unit vesting
|
88,330
|
|
—
|
|
||
|
Purchase of treasury stock (see Note 9)
|
(150,258
|
)
|
—
|
|
||
|
BALANCE, December 31, 2013
|
106,144,075
|
|
—
|
|
||
|
Option exercises
|
640,342
|
|
—
|
|
||
|
Restricted stock issuances, net of cancellations
|
9,090
|
|
—
|
|
||
|
Stock issuances from exercise of warrants
|
5,243,167
|
|
—
|
|
||
|
Restricted stock unit vesting
|
104,270
|
|
—
|
|
||
|
Purchase of treasury stock (see Note 9)
|
(141,257
|
)
|
—
|
|
||
|
BALANCE, December 31, 2014
|
111,999,687
|
|
—
|
|
||
F- 22
CHARTER COMMUNICATIONS, INC. AND SUBSIDIARIES
NOTES TO CONSOLIDATED FINANCIAL STATEMENTS
DECEMBER 31, 2014, 2013 AND 2012
(dollars in millions, except share or per share data or where indicated)
11. Accounting for Derivative Instruments and Hedging Activities
The Company uses interest rate derivative instruments to manage its interest costs and reduce the Company’s exposure to increases in floating interest rates. The Company manages its exposure to fluctuations in interest rates by maintaining a mix of fixed and variable rate debt. Using interest rate derivative instruments, the Company agrees to exchange, at specified intervals through 2017, the difference between fixed and variable interest amounts calculated by reference to agreed-upon notional principal amounts. The Company does not hold or issue derivative instruments for speculative trading purposes.
The Company, until de-designating in the three months ended March 31, 2013, had certain interest rate derivative instruments that were designated as cash flow hedging instruments for GAAP purposes. Such instruments effectively converted variable interest payments on certain debt instruments into fixed payments. For qualifying hedges, realized derivative gains and losses offset related results on hedged items in the consolidated statements of operations. The Company formally documented, designated and assessed the effectiveness of transactions that received hedge accounting.
The effect of interest rate derivatives on the Company’s consolidated balance sheets is presented in the table below:
|
December 31, 2014
|
December 31, 2013
|
||||||
|
Accrued interest
|
$
|
2
|
|
$
|
8
|
|
|
|
Other long-term liabilities
|
$
|
16
|
|
$
|
22
|
|
|
|
Accumulated other comprehensive loss
|
$
|
(22
|
)
|
$
|
(41
|
)
|
|
Changes in the fair value of interest rate derivative instruments that were designated as hedging instruments of the variability of cash flows associated with floating-rate debt obligations, and that met effectiveness criteria were reported in accumulated other comprehensive loss. The amounts were subsequently reclassified as an increase or decrease to interest expense in the same periods in which the related interest on the floating-rate debt obligations affected earnings (losses).
Due to repayment of variable rate credit facility debt without a LIBOR floor, certain interest rate derivative instruments were de-designated as cash flow hedges during the three months ended March 31, 2013, as they no longer met the criteria for cash flow hedging specified by GAAP. In addition, on March 31, 2013, the remaining interest rate derivative instruments that continued to be highly effective cash flow hedges for GAAP purposes were electively de-designated. On the date of de-designation, the Company completed a final measurement test for each interest rate derivative instrument to determine any ineffectiveness and such amount was reclassified from accumulated other comprehensive loss into gain on derivative instruments, net in the Company's consolidated statements of operations. While these interest rate derivative instruments are no longer designated as cash flow hedges for accounting purposes, management continues to believe such instruments are closely correlated with the respective debt, thus managing associated risk. Interest rate derivative instruments not designated as hedges are marked to fair value, with the impact recorded as a gain or loss on derivative instruments, net in the Company's consolidated statements of operations. The balance that remains in accumulated other comprehensive loss for these interest rate derivative instruments will be amortized over the respective lives of the contracts and recorded as a loss within gain (loss) on derivative instruments, net in the Company's consolidated statements of operations. The estimated net amount of existing losses that are reported in accumulated other comprehensive loss as of
December 31, 2014
that is expected to be reclassified into earnings within the next twelve months is approximately
$9 million
.
F- 23
CHARTER COMMUNICATIONS, INC. AND SUBSIDIARIES
NOTES TO CONSOLIDATED FINANCIAL STATEMENTS
DECEMBER 31, 2014, 2013 AND 2012
(dollars in millions, except share or per share data or where indicated)
The effects of derivative instruments on the Company’s consolidated statements of comprehensive loss and consolidated statements of operations is presented in the table below.
|
Year Ended December 31, 2014
|
|||||||||||
|
2014
|
2013
|
2012
|
|||||||||
|
Gain (loss) on derivative instruments, net:
|
|||||||||||
|
Change in fair value of interest rate derivative instruments not designated as cash flow hedges
|
$
|
12
|
|
$
|
38
|
|
$
|
—
|
|
||
|
Loss reclassified from accumulated other comprehensive loss into earnings as a result of cash flow hedge discontinuance
|
(19
|
)
|
(27
|
)
|
—
|
|
|||||
|
$
|
(7
|
)
|
$
|
11
|
|
$
|
—
|
|
|||
|
Interest expense:
|
|||||||||||
|
Loss reclassified from accumulated other comprehensive loss into interest expense
|
$
|
—
|
|
$
|
(10
|
)
|
$
|
(36
|
)
|
||
As of
December 31, 2014
and
2013
, the Company had
$1.4 billion
and
$2.2 billion
in notional amounts of interest rate derivative instruments outstanding. As of
December 31, 2014
, this includes
$150 million
in delayed start interest rate derivative instruments that become effective in March 2015. Also in March 2015,
$300 million
of currently effective swaps expire and therefore the notional amount of currently effective interest rate derivative instruments will decrease.
The notional amounts of interest rate instruments do not represent amounts exchanged by the parties and, thus, are not a measure of exposure to credit loss. The amounts exchanged were determined by reference to the notional amount and the other terms of the contracts.
12. Fair Value Measurements
The accounting guidance
establishes a three-level hierarchy for disclosure of fair value measurements, based upon the transparency of inputs to the valuation of an asset or liability as of the measurement date, as follows:
|
•
|
Level 1 – inputs to the valuation methodology are quoted prices (unadjusted) for identical assets or liabilities in active markets.
|
|
•
|
Level 2 – inputs to the valuation methodology include quoted prices for similar assets and liabilities in active markets, and inputs that are observable for the asset or liability, either directly or indirectly, for substantially the full term of the financial instrument.
|
|
•
|
Level 3 – inputs to the valuation methodology are unobservable and significant to the fair value measurement.
|
Financial Assets and Liabilities
The Company has estimated the fair value of its financial instruments as of
December 31, 2014
and
2013
using available market information or other appropriate valuation methodologies. Considerable judgment, however, is required in interpreting market data to develop the estimates of fair value. Accordingly, the estimates presented in the accompanying consolidated financial statements are not necessarily indicative of the amounts the Company would realize in a current market exchange.
The carrying amounts of cash and cash equivalents, receivables, payables and other current assets and liabilities approximate fair value because of the short maturity of those instruments.
The Company's restricted cash and cash equivalents at
December 31, 2014
are primarily invested in money market funds and 90-day or less commercial paper. The money market funds are valued at the closing price reported by the fund sponsor from an actively traded exchange and the commercial paper is valued at cost plus the accretion of the discount on a yield to maturity basis, which approximates fair value. The money market funds and commercial paper potentially subject us to concentrations of credit
F- 24
CHARTER COMMUNICATIONS, INC. AND SUBSIDIARIES
NOTES TO CONSOLIDATED FINANCIAL STATEMENTS
DECEMBER 31, 2014, 2013 AND 2012
(dollars in millions, except share or per share data or where indicated)
risk. The amount invested within any one financial instrument did not exceed
$550 million
during the year ended December 31, 2014. As of December 31, 2014, there were no significant concentrations of financial instruments in a single investee, industry or geographic location.
The interest rate derivatives are valued using a present value calculation based on an implied forward LIBOR curve (adjusted for Charter Operating’s or counterparties’ credit risk). The weighted average pay rate for the Company’s currently effective interest rate swaps was
1.87%
and
2.17%
at
December 31, 2014
and
2013
(exclusive of applicable spreads).
The Company's financial instruments that are accounted for at fair value on a recurring basis are presented in the table below.
|
December 31, 2014
|
December 31, 2013
|
|||||||||||||||||||||||
|
Level 1
|
Level 2
|
Level 3
|
Level 1
|
Level 2
|
Level 3
|
|||||||||||||||||||
|
Assets
|
||||||||||||||||||||||||
|
Money market funds
|
$
|
4,112
|
|
$
|
—
|
|
$
|
—
|
|
$
|
—
|
|
$
|
—
|
|
$
|
—
|
|
||||||
|
Commercial paper
|
$
|
—
|
|
$
|
2,999
|
|
$
|
—
|
|
$
|
—
|
|
$
|
—
|
|
$
|
—
|
|
||||||
|
Liabilities
|
||||||||||||||||||||||||
|
Interest rate derivatives
|
$
|
—
|
|
$
|
18
|
|
$
|
—
|
|
$
|
—
|
|
$
|
30
|
|
$
|
—
|
|
||||||
A summary of the carrying value and fair value of the Company’s debt at
December 31, 2014
and
2013
is as follows:
|
December 31, 2014
|
December 31, 2013
|
|||||||||||||||
|
Carrying Value
|
Fair Value
|
Carrying Value
|
Fair Value
|
|||||||||||||
|
Debt
|
||||||||||||||||
|
Senior notes
|
$
|
13,831
|
|
$
|
14,205
|
|
$
|
10,329
|
|
$
|
10,384
|
|
||||
|
Credit facilities
|
$
|
7,192
|
|
$
|
7,186
|
|
$
|
3,852
|
|
$
|
3,848
|
|
||||
The estimated fair value of the Company’s senior notes at
December 31, 2014
and
2013
is based on quoted market prices in active markets and is classified within Level 1 of the valuation hierarchy, while the estimated fair value of the Company's credit facilities is based on quoted market prices in inactive markets and is classified within Level 2.
Non-financial Assets and Liabilities
The Company’s non-financial assets such as franchises, property, plant, and equipment, and other intangible assets are not measured at fair value on a recurring basis; however they are subject to fair value adjustments in certain circumstances, such as when there is evidence that an impairment may exist.
No
impairments were recorded in
2014
,
2013
and
2012
.
F- 25
CHARTER COMMUNICATIONS, INC. AND SUBSIDIARIES
NOTES TO CONSOLIDATED FINANCIAL STATEMENTS
DECEMBER 31, 2014, 2013 AND 2012
(dollars in millions, except share or per share data or where indicated)
13. Operating Costs and Expenses
Operating costs and expenses consist of the following for the years presented:
|
Year Ended December 31,
|
|||||||||||
|
2014
|
2013
|
2012
|
|||||||||
|
Programming
|
$
|
2,459
|
|
$
|
2,146
|
|
$
|
1,965
|
|
||
|
Franchise, regulatory and connectivity
|
428
|
|
399
|
|
383
|
|
|||||
|
Costs to service customers
|
1,675
|
|
1,561
|
|
1,394
|
|
|||||
|
Marketing
|
529
|
|
488
|
|
431
|
|
|||||
|
Other
|
882
|
|
751
|
|
687
|
|
|||||
|
$
|
5,973
|
|
$
|
5,345
|
|
$
|
4,860
|
|
|||
Programming costs consist primarily of costs paid to programmers for basic, premium, digital, video on demand, and pay-per-view programming. Franchise, regulatory and connectivity costs represent payments to franchise and regulatory authorities and costs directly related to providing Internet and voice services. Costs to service customers include residential and commercial costs related to field operations, network operations and customer care including internal and third party labor for installations, service and repairs, maintenance, billing and collection, occupancy and vehicle costs. Marketing costs represents the costs of marketing to our current and potential commercial and residential customers including labor costs. Other includes bad debt expense, corporate overhead, commercial and advertising sales expenses, property tax and insurance and stock compensation expense, among others.
14. Other Operating Expenses, Net
Other operating expenses, net consist of the following for the years presented:
|
Year Ended December 31,
|
|||||||||||
|
2014
|
2013
|
2012
|
|||||||||
|
Merger and acquisition costs
|
$
|
38
|
|
$
|
16
|
|
$
|
1
|
|
||
|
Special charges, net
|
14
|
|
23
|
|
20
|
|
|||||
|
(Gain) loss on sale of assets, net
|
10
|
|
8
|
|
(5
|
)
|
|||||
|
$
|
62
|
|
$
|
47
|
|
$
|
16
|
|
|||
Merger and acquisition costs
Merger and acquisition costs represents costs incurred in connection with merger and acquisition transactions, such as advisory, legal and accounting fees, among others.
Special charges, net
Special charges, net for the years ended
2014
,
2013
and
2012
primarily include severance charges and net amounts of litigation settlements.
(Gain) loss on sale of assets, net
(Gain) loss on sale of assets represents the gain or loss recognized on the sales and disposals of fixed assets and cable systems.
F- 26
CHARTER COMMUNICATIONS, INC. AND SUBSIDIARIES
NOTES TO CONSOLIDATED FINANCIAL STATEMENTS
DECEMBER 31, 2014, 2013 AND 2012
(dollars in millions, except share or per share data or where indicated)
15.
Stock Compensation Plans
Charter’s 2009 Stock Incentive Plan provides for grants of non-qualified stock options, incentive stock options, stock appreciation rights, dividend equivalent rights, performance units and performance shares, share awards, phantom stock, restricted stock units and restricted stock. Directors, officers and other employees of the Company and its subsidiaries, as well as others performing consulting services for the Company, are eligible for grants under the 2009 Stock Incentive Plan. The 2009 Stock Incentive Plan allows for the issuance of up to
14 million
shares of Charter Class A common stock (or units convertible into Charter Class A common stock).
Stock options granted prior to 2014 generally vest annually over
three
or
four
years from either the grant date or delayed vesting commencement dates. Stock options generally expire
ten
years from the grant date. Restricted stock vests annually over a
one
to
four
-year period beginning from the date of grant. Certain stock options and restricted stock vest based on achievement of stock price hurdles. Restricted stock units have no voting rights, and restricted stock units granted prior to 2014 vest ratably over
three
or
four
years from either the grant date or delayed vesting commencement dates. Stock options and restricted stock units granted in 2014 cliff vest over
three
years. As of
December 31, 2014
, total unrecognized compensation remaining to be recognized in future periods totaled
$66 million
for stock options,
$9 million
for restricted stock and
$26 million
for restricted stock units and the weighted average period over which they are expected to be recognized is
2
years for stock options,
1
years for restricted stock and
2
years for restricted stock units.
The Company recorded
$55 million
,
$48 million
and
$50 million
of stock compensation expense for the years ended
December 31, 2014
,
2013
and
2012
, respectively, which is included in operating costs and expenses.
A summary of the activity for the Company’s stock options for the years ended
December 31, 2014
,
2013
and
2012
, is as follows (amounts in thousands, except per share data):
|
Year Ended December 31,
|
|||||||||||||||||||||||
|
2014
|
2013
|
2012
|
|||||||||||||||||||||
|
Shares
|
Weighted Average Exercise Price
|
Shares
|
Weighted Average Exercise Price
|
Shares
|
Weighted Average Exercise Price
|
||||||||||||||||||
|
Outstanding, beginning of period
|
3,142
|
|
$
|
59.86
|
|
3,552
|
|
$
|
54.35
|
|
4,018
|
|
$
|
49.53
|
|
||||||||
|
Granted
|
1,234
|
|
$
|
136.75
|
|
276
|
|
$
|
108.89
|
|
813
|
|
$
|
69.00
|
|
||||||||
|
Exercised
|
(640
|
)
|
$
|
52.50
|
|
(543
|
)
|
$
|
51.22
|
|
(371
|
)
|
$
|
40.57
|
|
||||||||
|
Canceled
|
(47
|
)
|
$
|
104.57
|
|
(143
|
)
|
$
|
50.54
|
|
(908
|
)
|
$
|
51.74
|
|
||||||||
|
Outstanding, end of period
|
3,689
|
|
$
|
86.29
|
|
3,142
|
|
$
|
59.86
|
|
3,552
|
|
$
|
54.35
|
|
||||||||
|
Weighted average remaining contractual life
|
7
|
|
years
|
7
|
|
years
|
8
|
|
years
|
||||||||||||||
|
Options exercisable, end of period
|
1,317
|
|
$
|
55.65
|
|
1,128
|
|
$
|
52.07
|
|
469
|
|
$
|
46.23
|
|
||||||||
|
Weighted average fair value of options granted
|
$
|
55.08
|
|
$
|
41.52
|
|
$
|
28.17
|
|
||||||||||||||
F- 27
CHARTER COMMUNICATIONS, INC. AND SUBSIDIARIES
NOTES TO CONSOLIDATED FINANCIAL STATEMENTS
DECEMBER 31, 2014, 2013 AND 2012
(dollars in millions, except share or per share data or where indicated)
A summary of the activity for the Company’s restricted stock for the years ended
December 31, 2014
,
2013
and
2012
, is as follows (amounts in thousands, except per share data):
|
Year Ended December 31,
|
||||||||||||||||||||
|
2014
|
2013
|
2012
|
||||||||||||||||||
|
Shares
|
Weighted Average Grant Price
|
Shares
|
Weighted Average Grant Price
|
Shares
|
Weighted Average Grant Price
|
|||||||||||||||
|
Outstanding, beginning of period
|
653
|
|
$
|
56.14
|
|
928
|
|
$
|
54.16
|
|
1,115
|
|
$
|
45.72
|
|
|||||
|
Granted
|
9
|
|
$
|
138.57
|
|
13
|
|
$
|
101.81
|
|
244
|
|
$
|
60.48
|
|
|||||
|
Vested
|
(231
|
)
|
$
|
57.35
|
|
(280
|
)
|
$
|
51.62
|
|
(370
|
)
|
$
|
36.02
|
|
|||||
|
Canceled
|
—
|
|
$
|
—
|
|
(8
|
)
|
$
|
56.50
|
|
(61
|
)
|
$
|
35.25
|
|
|||||
|
Outstanding, end of period
|
431
|
|
$
|
57.24
|
|
653
|
|
$
|
56.14
|
|
928
|
|
$
|
54.16
|
|
|||||
A summary of the activity for the Company’s restricted stock units for the years ended
December 31, 2014
,
2013
and
2012
, is as follows (amounts in thousands, except per share data):
|
Year Ended December 31,
|
||||||||||||||||||||
|
2014
|
2013
|
2012
|
||||||||||||||||||
|
Shares
|
Weighted Average Grant Price
|
Shares
|
Weighted Average Grant Price
|
Shares
|
Weighted Average Grant Price
|
|||||||||||||||
|
Outstanding, beginning of period
|
288
|
|
$
|
74.73
|
|
327
|
|
$
|
61.79
|
|
273
|
|
$
|
54.86
|
|
|||||
|
Granted
|
153
|
|
$
|
136.54
|
|
73
|
|
$
|
109.96
|
|
142
|
|
$
|
71.33
|
|
|||||
|
Vested
|
(104
|
)
|
$
|
70.23
|
|
(88
|
)
|
$
|
61.17
|
|
(52
|
)
|
$
|
56.59
|
|
|||||
|
Canceled
|
(12
|
)
|
$
|
112.53
|
|
(24
|
)
|
$
|
55.28
|
|
(36
|
)
|
$
|
54.47
|
|
|||||
|
Outstanding, end of period
|
325
|
|
$
|
104.01
|
|
288
|
|
$
|
74.73
|
|
327
|
|
$
|
61.79
|
|
|||||
16. Income Taxes
All of Charter’s operations are held through Charter Holdco and its direct and indirect subsidiaries. Charter Holdco and the majority of its subsidiaries are generally limited liability companies that are not subject to income tax. However, certain of these limited liability companies are subject to state income tax. In addition, the indirect subsidiaries that are corporations are subject to federal and state income tax. All of the remaining taxable income, gains, losses, deductions and credits of Charter Holdco are passed through to Charter and its direct subsidiaries.
For the years ended
December 31, 2014
,
2013
, and
2012
, the Company recorded deferred income tax expense and benefits as shown below. Income tax expense is recognized primarily through increases in deferred tax liabilities related to the Company's investment in Charter Holdco, as well as through current federal and state income tax expense and increases in the deferred tax liabilities of certain of its indirect corporate subsidiaries. Income tax benefits are realized through reductions in the deferred tax liabilities related to Charter’s investment in Charter Holdco, as well as the deferred tax liabilities of certain of Charter’s indirect
F- 28
CHARTER COMMUNICATIONS, INC. AND SUBSIDIARIES
NOTES TO CONSOLIDATED FINANCIAL STATEMENTS
DECEMBER 31, 2014, 2013 AND 2012
(dollars in millions, except share or per share data or where indicated)
corporate subsidiaries. The tax provision in future periods will vary based on current and future temporary differences, as well as future operating results.
Current and deferred income tax expense is as follows:
|
Year Ended December 31,
|
|||||||||||||
|
2014
|
2013
|
2012
|
|||||||||||
|
Current expense:
|
|||||||||||||
|
Federal income taxes
|
$
|
(1
|
)
|
$
|
(1
|
)
|
$
|
—
|
|
||||
|
State income taxes
|
(2
|
)
|
(7
|
)
|
(7
|
)
|
|||||||
|
Current income tax expense
|
(3
|
)
|
(8
|
)
|
(7
|
)
|
|||||||
|
Deferred expense:
|
|||||||||||||
|
Federal income taxes
|
(192
|
)
|
(101
|
)
|
(223
|
)
|
|||||||
|
State income taxes
|
(41
|
)
|
(11
|
)
|
(27
|
)
|
|||||||
|
Deferred income tax expense
|
(233
|
)
|
(112
|
)
|
(250
|
)
|
|||||||
|
Total income tax expense
|
$
|
(236
|
)
|
$
|
(120
|
)
|
$
|
(257
|
)
|
||||
Income tax expense for the year ended December 31, 2013 decreased compared to the corresponding prior period, primarily as a result of step-ups in basis of indefinite-lived assets for tax, but not GAAP purposes, including the effects of partnership gains related to financing transactions and a partnership restructuring, which decreased the Company's net deferred tax liability related to indefinite-lived assets by
$137 million
.
Of the
$137 million
decrease in net deferred tax liability,
$101 million
of deferred tax benefits correspond to gains recognized by corporate subsidiaries of Charter, which are partners in Charter Holdco, and resulted primarily from the repayment of Charter Operating credit facility debt with proceeds from the CCO Holdings notes issued in March 2013. The repayment of Charter Operating credit facility debt, which is not guaranteed by Charter, with proceeds from the notes, which are guaranteed by Charter, had the effect of reducing the amount of debt allocable to the non-guarantor corporate subsidiaries of Charter. For partnership tax purposes, the reduction in the amount of non-guaranteed debt available to allocate to these corporate subsidiaries caused them to recognize gains due to limited basis in their partnership interests in Charter Holdco. These gains result in a step-up in the underlying tax basis of Charter Holdco's assets and a corresponding reduction in the deferred tax liabilities for financial reporting purposes. In addition, on December 31, 2013, Charter restructured one of its tax partnerships which resulted in a
$405 million
net step-up to primarily intangible assets and a deferred income tax benefit of
$36 million
due to a shift in step-ups to indefinite-lived intangibles. The tax provision in future periods will vary based on various factors including changes in the Company's deferred tax liabilities attributable to indefinite-lived intangibles, as well as future operating results, however the Company does not anticipate having such a large reduction in tax expense attributable to these items unless it enters into similar future financing or restructuring transactions. The ultimate impact on the tax provision of such future financing and restructuring activities, if any, will be dependent on the underlying facts and circumstances at the time.
F- 29
CHARTER COMMUNICATIONS, INC. AND SUBSIDIARIES
NOTES TO CONSOLIDATED FINANCIAL STATEMENTS
DECEMBER 31, 2014, 2013 AND 2012
(dollars in millions, except share or per share data or where indicated)
The Company’s effective tax rate differs from that derived by applying the applicable federal income tax rate of
35%
for the years ended
December 31, 2014
,
2013
, and
2012
, respectively, as follows:
|
Year Ended December 31,
|
||||||||||||
|
2014
|
2013
|
2012
|
||||||||||
|
Statutory federal income taxes
|
$
|
(18
|
)
|
$
|
17
|
|
$
|
17
|
|
|||
|
Statutory state income taxes, net
|
(2
|
)
|
(7
|
)
|
(7
|
)
|
||||||
|
Nondeductible expenses
|
(10
|
)
|
(3
|
)
|
(6
|
)
|
||||||
|
Change in valuation allowance
|
(203
|
)
|
(127
|
)
|
(264
|
)
|
||||||
|
State rate changes
|
(3
|
)
|
4
|
|
—
|
|
||||||
|
Other
|
—
|
|
(4
|
)
|
3
|
|
||||||
|
Income tax expense
|
$
|
(236
|
)
|
$
|
(120
|
)
|
$
|
(257
|
)
|
|||
For the year ended December 31, 2012 , the change in valuation allowance includes an increase of
$4 million
related to adjustments to cash flow hedges included in other comprehensive loss. In addition, the change in the valuation allowance above for the year ended December 31, 2014 differs from the change between the beginning and ending deferred tax position due to a reduction of certain deferred tax assets and valuation allowance with no impact to the consolidated statements of operations.
The tax effects of these temporary differences that give rise to significant portions of the deferred tax assets and deferred tax liabilities at
December 31, 2014
and
2013
are presented below.
|
December 31,
|
||||||||
|
2014
|
2013
|
|||||||
|
Deferred tax assets:
|
||||||||
|
Goodwill
|
$
|
251
|
|
$
|
274
|
|
||
|
Investment in partnership
|
293
|
|
289
|
|
||||
|
Loss carryforwards
|
3,595
|
|
3,170
|
|
||||
|
Other intangibles
|
112
|
|
48
|
|
||||
|
Accrued and other
|
172
|
|
112
|
|
||||
|
Total gross deferred tax assets
|
4,423
|
|
3,893
|
|
||||
|
Less: valuation allowance
|
(3,149
|
)
|
(2,961
|
)
|
||||
|
Deferred tax assets
|
$
|
1,274
|
|
$
|
932
|
|
||
|
Deferred tax liabilities:
|
||||||||
|
Indefinite life intangibles
|
$
|
(1,428
|
)
|
$
|
(1,205
|
)
|
||
|
Property, plant and equipment
|
(1,247
|
)
|
(901
|
)
|
||||
|
Indirect corporate subsidiaries:
|
||||||||
|
Indefinite life intangibles
|
(122
|
)
|
(122
|
)
|
||||
|
Other
|
(125
|
)
|
(119
|
)
|
||||
|
Deferred tax liabilities
|
(2,922
|
)
|
(2,347
|
)
|
||||
|
Net deferred tax liabilities
|
$
|
(1,648
|
)
|
$
|
(1,415
|
)
|
||
F- 30
CHARTER COMMUNICATIONS, INC. AND SUBSIDIARIES
NOTES TO CONSOLIDATED FINANCIAL STATEMENTS
DECEMBER 31, 2014, 2013 AND 2012
(dollars in millions, except share or per share data or where indicated)
Included in net deferred tax liabilities above is net current deferred tax assets of
$26 million
and
$16 million
as of
December 31, 2014
and
2013
, respectively, included in prepaid expenses and other current assets in the accompanying consolidated balance sheets of the Company. Net deferred tax liabilities included approximately
$236 million
and
$226 million
at
December 31, 2014
and
2013
, respectively, relating to certain indirect subsidiaries of Charter Holdco that file separate federal or state income tax returns. The remainder of the Company's net deferred tax liability arose from Charter's investment in Charter Holdco, and was largely attributable to the characterization of franchises for financial reporting purposes as indefinite-lived.
In assessing the realizability of deferred tax assets, management considers whether it is more likely than not that some portion or all of the deferred tax assets will be realized. Due to the Company’s history of losses and the limitations imposed under Section 382 of the Internal Revenue Code, discussed below, on Charter’s ability to use existing loss carryforwards in the future, valuation allowances have been established except for future taxable income that will result from the reversal of existing temporary differences for which deferred tax liabilities are recognized. Realization of deferred tax assets is dependent on generating sufficient taxable income prior to expiration of the loss carryforwards. The amount of the deferred tax assets considered realizable and, therefore, reflected in the consolidated balance sheet, would be increased at such time that it is more-likely-than-not future taxable income will be realized during the carryforward period. The Company periodically evaluates the facts and circumstances surrounding this assessment and, at the time this consideration is met, an adjustment to reverse some portion of the existing valuation allowance would result.
As of
December 31, 2014
, Charter and its indirect corporate subsidiaries had approximately
$9.5 billion
of federal tax net operating loss carryforwards resulting in a gross deferred tax asset of approximately
$3.3 billion
. Federal tax net operating loss carryforwards expire in the years 2020 through 2034. These losses resulted from the operations of Charter Holdco and its subsidiaries. In addition, as of
December 31, 2014
, Charter and its indirect corporate subsidiaries had state tax net operating loss carryforwards, resulting in a gross deferred tax asset (net of federal tax benefit) of approximately
$321 million
. State tax net operating loss carryforwards generally expire in the years 2015 through 2034. Included in the loss carryforwards is
$129 million
of loss, the tax benefit of which will be recorded through equity when realized as a reduction of income tax payable.
On May 1, 2013, Liberty Media Corporation (“Liberty Media”) completed its purchase of a
27%
beneficial interest in Charter (see Note 17). Upon closing, Charter experienced a second “ownership change” as defined in Section 382 of the Internal Revenue Code resulting in a second set of limitations on Charter’s use of its existing federal and state net operating losses, capital losses, and tax credit carryforwards. The first ownership change limitations that applied as a result of our emergence from bankruptcy in 2009 will also continue to apply. As of
December 31, 2014
,
$5.3 billion
of federal tax loss carryforwards are unrestricted and available for Charter’s immediate use, while approximately
$4.2 billion
of federal tax loss carryforwards are still subject to Section 382 and other restrictions. Pursuant to these restrictions, Charter estimates that approximately
$2.0 billion
and
$400 million
in the years 2015 and 2016, respectively, and an additional
$226 million
annually over each of the next eight years of federal tax loss carryforwards should become unrestricted and available for Charter's use. Since the limitation amounts accumulate for future use to the extent they are not utilized in any given year, Charter believes its loss carryforwards should become fully available to offset future taxable income, if any. Charter’s state loss carryforwards and indirect corporate subsidiaries’ loss carryforwards are subject to similar, but varying limitations on their future use. If the Company was to experience another “ownership change” in the future, its ability to use its loss carryforwards could be subject to further limitations.
In determining the Company’s tax provision for financial reporting purposes, the Company establishes a reserve for uncertain tax positions unless such positions are determined to be “more likely than not” of being sustained upon examination, based on their technical merits. There is considerable judgment involved in determining whether positions taken on the tax return are “more likely than not” of being sustained. The Company did not have any unrecognized tax benefits as of
December 31, 2014
and
2013
.
No tax years for Charter or Charter Holdco, for income tax purposes, are currently under examination by the IRS. Tax years ending 2011 through 2013 remain subject to examination and assessment. Years prior to 2011 remain open solely for purposes of examination of Charter’s loss and credit carryforwards.
17. Related Party Transactions
The following sets forth certain transactions in which the Company and the directors, executive officers, and affiliates of the Company are involved or, in the case of the management arrangements, subsidiaries that are debt issuers that pay certain of their parent companies for services.
F- 31
CHARTER COMMUNICATIONS, INC. AND SUBSIDIARIES
NOTES TO CONSOLIDATED FINANCIAL STATEMENTS
DECEMBER 31, 2014, 2013 AND 2012
(dollars in millions, except share or per share data or where indicated)
Charter is a party to management arrangements with Charter Holdco and certain of its subsidiaries. Under these agreements, Charter and Charter Holdco provide management services for the cable systems owned or operated by their subsidiaries. Costs associated with providing these services are charged directly to the Company’s operating subsidiaries and are included within operating costs and expenses in the accompanying consolidated statements of operations. Such costs totaled
$346 million
,
$305 million
, and
$247 million
for the years ended
December 31, 2014
,
2013
, and
2012
, respectively. All other costs incurred on behalf of Charter’s operating subsidiaries are considered a part of the management fee and are recorded as a component of operating costs and expenses, in the accompanying consolidated financial statements. The management fee charged to the Company’s operating subsidiaries approximated the expenses incurred by Charter Holdco and Charter on behalf of the Company’s operating subsidiaries in
2014
,
2013
, and
2012
.
Liberty Broadband
On May 1, 2013, Liberty Media completed its purchase from investment funds managed by, or affiliated with, Apollo Global Management, LLC ("Apollo"), Oaktree Capital Management, L.P. ("Oaktree") and Crestview Partners ("Crestview") of approximately
26.9 million
shares and warrants to purchase approximately
1.1 million
shares in Charter for approximately
$2.6 billion
(the "Liberty Transaction"), which represented, at the time, a price per share of
$95.50
and an approximate
27%
beneficial ownership in Charter.
In connection with the Liberty Transaction, Charter entered into a stockholders agreement with Liberty Media (as amended, the “Stockholders Agreement”). Pursuant to the Stockholders Agreement, at the closing of the Liberty Transaction on May 1, 2013, Charter’s board of directors appointed four designees of Liberty Media to the Charter board of directors: John C. Malone, Chairman of the Board of Liberty Media, Gregory B. Maffei, President and Chief Executive Officer of Liberty Media, Balan Nair, Executive Vice President and Chief Technology Officer of Liberty Global, Plc. and Michael P. Huseby, then the Chief Financial Officer, and currently the Chief Executive Officer, of Barnes & Noble, Inc. In connection with the distribution of all of the capital stock of Liberty Broadband Corporation (“Liberty Broadband”) to stockholders of Liberty Media in a spin off transaction that was completed in November 2014 and also in connection with the consummation of the previously announced reorganization of Charter in connection with the Transactions (the “Reorganization”), on September 29, 2014 Liberty Media, Liberty Broadband and Charter entered into an amendment to the Stockholders Agreement. Pursuant to that amendment, Liberty Media assigned all of its rights and obligations under the Stockholders Agreement to Liberty Broadband, Liberty Broadband assumed such rights and agreed to perform all such obligations and Charter consented to such assignment and assumption. As a result, Liberty Broadband was substituted for Liberty Media for all purposes under the Stockholders Agreement. Liberty Broadband also acknowledged and agreed that the four designees of Liberty Media serving on Charter’s board of directors would continue in such capacity as designees of Liberty Broadband. The amendment also provides that, effective upon the consummation of the Reorganization, Charter will assign all of its rights, liabilities and obligations under the stockholders agreement to the reorganized Charter and the reorganized Charter will assume all of Charter’s liabilities and obligations under the Stockholders agreement.
Subject to Liberty Broadband’s continued ownership of
20%
or more of the outstanding shares of Class A common stock of Charter, the Stockholders Agreement provides that Liberty Broadband will be entitled to designate up to four persons as nominees for election to Charter’s board of directors at least until January 2016 and that one such designee director (as specified by Liberty Broadband) will serve on each of the Audit Committee, the Nominating and Corporate Governance Committee, and the Compensation and Benefits Committee of Charter’s board of directors. Consistent with these provisions, Mr. Malone serves on the Nominating and Corporate Governance Committee, Mr. Maffei serves on the Finance Committee and the Compensation and Benefits Committee and Mr. Huseby serves on the Audit Committee. Liberty Broadband has agreed that, so long as its designees are included in the group recommended by the Nominating and Corporate Governance Committee, it will vote its shares of Class A common stock in accordance with the recommendation of the Nominating and Corporate Governance Committee of the board of directors with respect to the election or removal of directors. Charter can elect, by notice to Liberty Broadband in early January 2016, to terminate the obligation to nominate Liberty Broadband’s designees to the board and, in such event, the standstill provisions noted below will also terminate. Beginning in 2017, Liberty Broadband and Charter will each have an annual right to terminate the board nomination and standstill obligations by delivering notice to the other party of such termination in early January of such year. Subject to certain limited exceptions, Liberty Broadband agreed that it will not, directly or indirectly; acquire voting securities of Charter in excess of
35%
prior to the fifth business day of January 2016 and thereafter in excess of
39.99%
of the outstanding voting securities of Charter. Liberty Broadband is also subject to certain customary standstill provisions that prohibit it from, among other things, engaging in any solicitation of proxies or consents relating to the election of directors, proposing a matter for submission to a vote of shareholders of Charter or calling a meeting of shareholders of Charter or taking any action or making any public statement not approved by the board of directors to seek to control or influence the management, the board of directors
F- 32
CHARTER COMMUNICATIONS, INC. AND SUBSIDIARIES
NOTES TO CONSOLIDATED FINANCIAL STATEMENTS
DECEMBER 31, 2014, 2013 AND 2012
(dollars in millions, except share or per share data or where indicated)
or the policies of Charter. The standstill limitations described above will cease to apply to Liberty Broadband beginning in January 2016 if Charter elects to terminate its obligation to nominate Liberty Broadband’s designees for election at the 2016 annual meeting of stockholders, as described above. In addition, the standstill limitations will cease to apply once Liberty Broadband owns less than
5%
of the outstanding Class A common stock and upon termination by either party in 2017 and thereafter as described above.
The Company is aware that Dr. Malone may be deemed to have a
36.0%
voting interest in Liberty Interactive Corp. (“Liberty Interactive”) and is Chairman of the board of directors, an executive officer position, of Liberty Interactive. Liberty Interactive owns
37.6%
of the common stock of HSN, Inc. (“HSN”) and has the right to elect
20%
of the board members of HSN. Liberty Interactive wholly owns QVC, Inc (“QVC”). The Company has programming relationships with HSN and QVC which pre-date the Liberty Media Transaction. For the year ended
December 31, 2014
and nine months ended December 31, 2013, the Company recorded payments in aggregate of approximately
$14 million
and
$10 million
, respectively, from HSN and QVC as part of channel carriage fees and revenue sharing arrangements for home shopping sales made to customers in Charter's footprint.
Dr. Malone also serves on the board of directors of Discovery Communications, Inc., (“Discovery”) and the Company is aware that Dr. Malone owns
4.5%
in the aggregate of the common stock of Discovery and has a
28.9%
voting interest in Discovery for the election of directors. In addition, Dr. Malone owns
10.1%
in the aggregate of the common stock of Starz and has
45.5%
of the voting power. Mr. Maffei is a non-executive Chairman of the board of Starz. The Company purchases programming from both Discovery and Starz pursuant to agreements entered into prior to the Liberty Media Transaction and Dr. Malone and Mr. Maffei joining Charter's board of directors. Based on publicly available information, the Company does not believe that either Discovery or Starz would currently be considered related parties. The amounts paid in aggregate to Discovery and Starz represent less than
3%
of total operating costs and expenses for the year ended
December 31, 2014
and nine months ended December 31, 2013.
18. Commitments and Contingencies
Commitments
The following table summarizes the Company’s payment obligations as of
December 31, 2014
for its contractual obligations.
|
Total
|
2015
|
2016
|
2017
|
2018
|
2019
|
Thereafter
|
|||||||||||||||||||||||
|
Contractual Obligations
|
|||||||||||||||||||||||||||||
|
Capital and Operating Lease Obligations (1)
|
$
|
169
|
|
$
|
43
|
|
$
|
39
|
|
$
|
35
|
|
$
|
25
|
|
16
|
|
$
|
11
|
|
|||||||||
|
Programming Minimum Commitments (2)
|
795
|
|
271
|
|
256
|
|
235
|
|
9
|
|
10
|
|
14
|
|
|||||||||||||||
|
Other (3)
|
319
|
|
291
|
|
16
|
|
9
|
|
3
|
|
—
|
|
—
|
|
|||||||||||||||
|
Total
|
$
|
1,283
|
|
$
|
605
|
|
$
|
311
|
|
$
|
279
|
|
$
|
37
|
|
$
|
26
|
|
$
|
25
|
|
||||||||
(1) The Company leases certain facilities and equipment under non-cancelable operating leases. Leases and rental costs charged to expense for the years ended
December 31, 2014
,
2013
and
2012
were
$43 million
,
$34 million
,
$28 million
, respectively.
(2) The Company pays programming fees under multi-year contracts ranging from
three
to
ten
years, typically based on a flat fee per customer, which may be fixed for the term, or may in some cases escalate over the term. Programming costs included in the accompanying statement of operations were
$2.5 billion
,
$2.1 billion
and
$2.0 billion
for the years ended
December 31, 2014
,
2013
, and
2012
respectively. Certain of the Company’s programming agreements are based on a flat fee per month or have guaranteed minimum payments. The table sets forth the aggregate guaranteed minimum commitments under the Company’s programming contracts.
(3) “Other” represents other guaranteed minimum commitments, which consist primarily of commitments to the Company's customer premise equipment vendors.
F- 33
CHARTER COMMUNICATIONS, INC. AND SUBSIDIARIES
NOTES TO CONSOLIDATED FINANCIAL STATEMENTS
DECEMBER 31, 2014, 2013 AND 2012
(dollars in millions, except share or per share data or where indicated)
The following items are not included in the contractual obligation table due to various factors discussed below. However, the Company incurs these costs as part of its operations:
|
•
|
The Company rents utility poles used in its operations. Generally, pole rentals are cancelable on short notice, but the Company anticipates that such rentals will recur. Rent expense incurred for pole rental attachments for the years ended
December 31, 2014
,
2013
, and
2012
was
$49 million
,
$49 million
, and
$47 million
, respectively.
|
|
•
|
The Company pays franchise fees under multi-year franchise agreements based on a percentage of revenues generated from video service per year. The Company also pays other franchise related costs, such as public education grants, under multi-year agreements. Franchise fees and other franchise-related costs included in the accompanying statement of operations were
$208 million
,
$190 million
, and
$176 million
for the years ended
December 31, 2014
,
2013
, and
2012
respectively.
|
|
•
|
The Company also has
$85 million
in letters of credit, primarily to its various worker’s compensation, property and casualty, and general liability carriers, as collateral for reimbursement of claims.
|
Litigation
The Montana Department of Revenue ("Montana DOR") generally assesses property taxes on cable companies at
3%
and on telephone companies at
6%
. Historically, Bresnan's cable and telephone operations have been taxed separately by the Montana DOR. In 2010, the Montana DOR assessed Bresnan as a single telephone business and retroactively assessed it as such for 2007 through 2009. Bresnan filed a declaratory judgment action against the Montana DOR in Montana State Court challenging its property tax classifications for 2007 through 2010. The Montana State Court issued decisions in favor of Bresnan. The Montana DOR filed a notice of appeal to the Montana Supreme Court on September 20, 2012. On December 2, 2013, the Montana Supreme Court reversed the trial court’s decision. On June 19, 2014, the parties settled this dispute. For tax years 2007 through 2009, Charter reduced Bresnan acquisition liabilities by approximately
$8 million
with the offset to goodwill, and operating expenses were reduced by approximately
$3 million
for post-acquisition tax years.
The Company is a defendant or co-defendant in several lawsuits involving alleged infringement of various patents relating to various aspects of its businesses. Other industry participants are also defendants in certain of these cases. In the event that a court ultimately determines that the Company infringes on any intellectual property rights, the Company may be subject to substantial damages and/or an injunction that could require the Company or its vendors to modify certain products and services the Company offers to its subscribers, as well as negotiate royalty or license agreements with respect to the patents at issue. While the Company believes the lawsuits are without merit and intends to defend the actions vigorously, no assurance can be given that any adverse outcome would not be material to the Company's consolidated financial condition, results of operations, or liquidity. The Company cannot predict the outcome of any such claims nor can it reasonably estimate a range of possible loss.
The Company is party to lawsuits and claims that arise in the ordinary course of conducting its business, including lawsuits claiming violation of wage and hour laws. The ultimate outcome of these other legal matters pending against the Company cannot be predicted, and although such lawsuits and claims are not expected individually to have a material adverse effect on the Company’s consolidated financial condition, results of operations or liquidity, such lawsuits could have, in the aggregate, a material adverse effect on the Company’s consolidated financial condition, results of operations or liquidity. Whether or not the Company ultimately prevails in any particular lawsuit or claim, litigation can be time consuming and costly and injure the Company's reputation.
Regulation in the Cable Industry
The operation of a cable system is extensively regulated by the Federal Communications Commission (“FCC”), some state governments and most local governments. The FCC has the authority to enforce its regulations through the imposition of substantial fines, the issuance of cease and desist orders and/or the imposition of other administrative sanctions, such as the revocation of FCC licenses needed to operate certain transmission facilities used in connection with cable operations. The Telecommunications Act of 1996 altered the regulatory structure governing the nation’s communications providers. It removed barriers to competition in both the cable television market and the telephone market. Among other things, it reduced the scope of cable rate regulation and encouraged additional competition in the video programming industry by allowing telephone companies to provide video programming in their own telephone service areas. Future legislative and regulatory changes could adversely affect the Company’s operations.
F- 34
CHARTER COMMUNICATIONS, INC. AND SUBSIDIARIES
NOTES TO CONSOLIDATED FINANCIAL STATEMENTS
DECEMBER 31, 2014, 2013 AND 2012
(dollars in millions, except share or per share data or where indicated)
19. Employee Benefit Plan
The Company’s employees may participate in the Charter Communications, Inc. 401(k) Plan. Employees that qualify for participation can contribute up to
50%
of their salary, on a pre-tax basis, subject to a maximum contribution limit as determined by the Internal Revenue Service. Each payroll period, the Company will contribute to the 401(k) Plan the total amount of the salary contribution the employee elects to defer between
1%
and
50%
. The Company’s matching contribution is discretionary and is equal to
50%
of the amount of the salary reduction the participant elects to defer (up to
6%
of the participant’s eligible compensation), excluding any catch-up contributions and is paid by the Company on a per pay period basis. The Company made contributions to the 401(k) plan totaling
$19 million
,
$16 million
and
$8 million
for the years ended
December 31, 2014
,
2013
and
2012
, respectively.
20. Recently Issued Accounting Standards
In April 2014, the Financial Accounting Standards Board ("FASB") issued Accounting Standards Update ("ASU") No. 2014-08, Presentation of Financial Statements and Property, Plant, and Equipment: Reporting Discontinued Operations and Disclosures of Disposals of components of an Entity ("ASU 2014-08"). ASU 2014-08 changes the criteria for reporting a discontinued operation. Under the new guidance, a disposed component of an organization that represents a strategic shift that has (or will have) a major effect on its operations and financial results is a discontinued operation. For disposals of individually significant components that do not qualify for discontinued operations presentation, an entity must disclose pre-tax profit or loss of the disposed component. ASU 2014-08 requires prospective application to all disposals that are classified as held for sale and that occur within annual and interim periods beginning on or after December 15, 2014, with earlier application permitted for disposals that have not been reported in previously issued financial statements. The Company adopted ASU 2014-08 on January 1, 2015. The adoption of ASU 2014-8 did not have a material impact on its consolidated financial statements.
In May 2014, the FASB issued ASU No. 2014-09, Revenue from Contracts with Customers ("ASU 2014-09"), which requires an entity to recognize the amount of revenue to which it expects to be entitled for the transfer of promised goods or services to customers. The ASU will replace most existing revenue recognition guidance in U.S. GAAP when it becomes effective. The effective date of ASU 2014-09 is fiscal years beginning after December 15, 2016, and interim periods within those years, with earlier adoption prohibited. Companies can transition to the standard either retrospectively or as a cumulative-effect adjustment as of the date of adoption. The Company has not yet selected a transition method nor has it determined the effect of ASU 2014-09 to its consolidated financial statements.
21. Unaudited Quarterly Financial Data
The following table presents quarterly data for the periods presented on the consolidated statement of operations:
|
Year Ended December 31, 2014
|
||||||||||||||||
|
First
Quarter
|
Second Quarter
|
Third
Quarter
|
Fourth Quarter
|
|||||||||||||
|
Revenues
|
$
|
2,202
|
|
$
|
2,259
|
|
$
|
2,287
|
|
$
|
2,360
|
|
||||
|
Income from operations
|
$
|
240
|
|
$
|
236
|
|
$
|
218
|
|
$
|
277
|
|
||||
|
Net loss
|
$
|
(37
|
)
|
$
|
(45
|
)
|
$
|
(53
|
)
|
$
|
(48
|
)
|
||||
|
Loss per common share, basic and diluted
|
$
|
(0.35
|
)
|
$
|
(0.42
|
)
|
$
|
(0.49
|
)
|
$
|
(0.44
|
)
|
||||
|
Weighted average common shares
outstanding, basic and diluted |
106,439,198
|
|
107,975,937
|
|
108,792,605
|
|
110,242,507
|
|
||||||||
F- 35
CHARTER COMMUNICATIONS, INC. AND SUBSIDIARIES
NOTES TO CONSOLIDATED FINANCIAL STATEMENTS
DECEMBER 31, 2014, 2013 AND 2012
(dollars in millions, except share or per share data or where indicated)
|
Year Ended December 31, 2013
|
||||||||||||||||
|
First
Quarter
|
Second Quarter
|
Third
Quarter
|
Fourth Quarter
|
|||||||||||||
|
Revenues
|
$
|
1,917
|
|
$
|
1,972
|
|
$
|
2,118
|
|
$
|
2,148
|
|
||||
|
Income from operations
|
$
|
222
|
|
$
|
234
|
|
$
|
209
|
|
$
|
244
|
|
||||
|
Net income (loss)
|
$
|
(42
|
)
|
$
|
(96
|
)
|
$
|
(70
|
)
|
$
|
39
|
|
||||
|
Loss per common share:
|
||||||||||||||||
|
Basic
|
$
|
(0.42
|
)
|
$
|
(0.96
|
)
|
$
|
(0.68
|
)
|
$
|
0.38
|
|
||||
|
Diluted
|
(0.42
|
)
|
(0.96
|
)
|
(0.68
|
)
|
0.35
|
|
||||||||
|
Weighted average common shares outstanding:
|
||||||||||||||||
|
Basic
|
100,327,418
|
|
100,600,678
|
|
102,924,443
|
|
103,836,535
|
|
||||||||
|
Diluted
|
100,327,418
|
|
100,600,678
|
|
102,924,443
|
|
111,415,982
|
|
||||||||
22.
Consolidating Schedules
The CCOH Safari notes are obligations of CCOH Safari. However, substantially concurrently with the release of the proceeds to fund a portion of the purchase of certain assets pursuant to the Transactions, the CCOH Safari notes will become obligations of CCO Holdings and CCO Holdings Capital Corp. and CCOH Safari will merge into CCO Holdings. The CCO Holdings notes are obligations of CCO Holdings. See Notes 3 and 8. However, the CCO Holdings notes and CCOH Safari notes are also jointly, severally, fully and unconditionally guaranteed on an unsecured senior basis by Charter. The Charter Operating and Restricted Subsidiaries column is presented as a requirement pursuant to the terms of the Charter Operating credit agreement. The Unrestricted Subsidiary - CCO Safari column is a Non-Recourse Subsidiary under the Charter Operating credit agreement. In September 2014, Charter Operating entered into a term loan G facility and assigned all of its obligations with respect to the term loan G and transferred all of the proceeds from the term loan G to CCO Safari. See Note 8.
The accompanying condensed consolidating financial information has been prepared and presented pursuant to SEC Regulation S-X Rule 3-10,
Financial Statements of Guarantors and Affiliates Whose Securities Collateralize an Issue Registered or Being Registered.
This information is not intended to present the financial position, results of operations and cash flows of the individual companies or groups of companies in accordance with generally accepted accounting principles.
Condensed consolidating financial statements as of
December 31, 2014
and
2013
and for the years ended
December 31, 2014
,
2013
and
2012
follow.
F- 36
CHARTER COMMUNICATIONS, INC. AND SUBSIDIARIES
NOTES TO CONSOLIDATED FINANCIAL STATEMENTS
DECEMBER 31, 2014, 2013 AND 2012
(dollars in millions, except share or per share data or where indicated)
|
Charter Communications, Inc.
|
|||||||||||||||||||||||||||||||
|
|
|||||||||||||||||||||||||||||||
|
As of December 31, 2014
|
|||||||||||||||||||||||||||||||
|
Charter
|
Intermediate Holding Companies
|
CCOH Safari
|
CCO Holdings
|
Charter Operating and Restricted Subsidiaries
|
Unrestricted Subsidiary - CCO Safari
|
Eliminations
|
Charter Consolidated
|
||||||||||||||||||||||||
|
ASSETS
|
|||||||||||||||||||||||||||||||
|
CURRENT ASSETS:
|
|||||||||||||||||||||||||||||||
|
Cash and cash equivalents
|
$
|
3
|
|
$
|
—
|
|
$
|
—
|
|
$
|
—
|
|
$
|
—
|
|
$
|
—
|
|
$
|
—
|
|
$
|
3
|
|
|||||||
|
Accounts receivable, net
|
4
|
|
6
|
|
—
|
|
—
|
|
275
|
|
—
|
|
—
|
|
285
|
|
|||||||||||||||
|
Receivables from related party
|
55
|
|
221
|
|
—
|
|
11
|
|
—
|
|
—
|
|
(287
|
)
|
—
|
|
|||||||||||||||
|
Prepaid expenses and other current assets
|
23
|
|
10
|
|
—
|
|
—
|
|
50
|
|
—
|
|
—
|
|
83
|
|
|||||||||||||||
|
Total current assets
|
85
|
|
237
|
|
—
|
|
11
|
|
325
|
|
—
|
|
(287
|
)
|
371
|
|
|||||||||||||||
|
RESTRICTED CASH AND CASH EQUIVALENTS
|
—
|
|
—
|
|
3,597
|
|
—
|
|
—
|
|
3,514
|
|
—
|
|
7,111
|
|
|||||||||||||||
|
INVESTMENT IN CABLE PROPERTIES:
|
|||||||||||||||||||||||||||||||
|
Property, plant and equipment, net
|
—
|
|
29
|
|
—
|
|
—
|
|
8,344
|
|
—
|
|
—
|
|
8,373
|
|
|||||||||||||||
|
Franchises
|
—
|
|
—
|
|
—
|
|
—
|
|
6,006
|
|
—
|
|
—
|
|
6,006
|
|
|||||||||||||||
|
Customer relationships, net
|
—
|
|
—
|
|
—
|
|
—
|
|
1,105
|
|
—
|
|
—
|
|
1,105
|
|
|||||||||||||||
|
Goodwill
|
—
|
|
—
|
|
—
|
|
—
|
|
1,168
|
|
—
|
|
—
|
|
1,168
|
|
|||||||||||||||
|
Total investment in cable properties, net
|
—
|
|
29
|
|
—
|
|
—
|
|
16,623
|
|
—
|
|
—
|
|
16,652
|
|
|||||||||||||||
|
CC VIII PREFERRED INTEREST
|
—
|
|
436
|
|
—
|
|
—
|
|
—
|
|
—
|
|
(436
|
)
|
—
|
|
|||||||||||||||
|
INVESTMENT IN SUBSIDIARIES
|
1,509
|
|
482
|
|
—
|
|
10,331
|
|
27
|
|
—
|
|
(12,349
|
)
|
—
|
|
|||||||||||||||
|
LOANS RECEIVABLE – RELATED PARTY
|
—
|
|
326
|
|
—
|
|
584
|
|
—
|
|
—
|
|
(910
|
)
|
—
|
|
|||||||||||||||
|
OTHER NONCURRENT ASSETS
|
—
|
|
166
|
|
3
|
|
104
|
|
139
|
|
4
|
|
—
|
|
416
|
|
|||||||||||||||
|
Total assets
|
$
|
1,594
|
|
$
|
1,676
|
|
$
|
3,600
|
|
$
|
11,030
|
|
$
|
17,114
|
|
$
|
3,518
|
|
$
|
(13,982
|
)
|
$
|
24,550
|
|
|||||||
|
LIABILITIES AND SHAREHOLDERS’/MEMBER’S EQUITY
|
|||||||||||||||||||||||||||||||
|
CURRENT LIABILITIES:
|
|||||||||||||||||||||||||||||||
|
Accounts payable and accrued liabilities
|
$
|
11
|
|
$
|
152
|
|
$
|
18
|
|
$
|
187
|
|
$
|
1,259
|
|
$
|
8
|
|
$
|
—
|
|
$
|
1,635
|
|
|||||||
|
Payables to related party
|
—
|
|
—
|
|
—
|
|
—
|
|
287
|
|
—
|
|
(287
|
)
|
—
|
|
|||||||||||||||
|
Total current liabilities
|
11
|
|
152
|
|
18
|
|
187
|
|
1,546
|
|
8
|
|
(287
|
)
|
1,635
|
|
|||||||||||||||
|
LONG-TERM DEBT
|
—
|
|
—
|
|
3,500
|
|
10,331
|
|
3,709
|
|
3,483
|
|
—
|
|
21,023
|
|
|||||||||||||||
|
LOANS PAYABLE – RELATED PARTY
|
—
|
|
—
|
|
112
|
|
—
|
|
798
|
|
—
|
|
(910
|
)
|
—
|
|
|||||||||||||||
|
DEFERRED INCOME TAXES
|
1,437
|
|
—
|
|
—
|
|
—
|
|
237
|
|
—
|
|
—
|
|
1,674
|
|
|||||||||||||||
|
OTHER LONG-TERM LIABILITIES
|
—
|
|
15
|
|
—
|
|
—
|
|
57
|
|
—
|
|
—
|
|
72
|
|
|||||||||||||||
|
Shareholders’/Member’s equity
|
146
|
|
1,509
|
|
(30
|
)
|
512
|
|
10,331
|
|
27
|
|
(12,349
|
)
|
146
|
|
|||||||||||||||
|
Non-controlling interest
|
—
|
|
—
|
|
—
|
|
—
|
|
436
|
|
—
|
|
(436
|
)
|
—
|
|
|||||||||||||||
|
Total shareholders’/member’s equity
|
146
|
|
1,509
|
|
(30
|
)
|
512
|
|
10,767
|
|
27
|
|
(12,785
|
)
|
146
|
|
|||||||||||||||
|
Total liabilities and shareholders’/member’s equity
|
$
|
1,594
|
|
$
|
1,676
|
|
$
|
3,600
|
|
$
|
11,030
|
|
$
|
17,114
|
|
$
|
3,518
|
|
$
|
(13,982
|
)
|
$
|
24,550
|
|
|||||||
F- 37
CHARTER COMMUNICATIONS, INC. AND SUBSIDIARIES
NOTES TO CONSOLIDATED FINANCIAL STATEMENTS
DECEMBER 31, 2014, 2013 AND 2012
(dollars in millions, except share or per share data or where indicated)
|
Charter Communications, Inc.
|
|||||||||||||||||||||||||||||||
|
Condensed Consolidating Balance Sheet
|
|||||||||||||||||||||||||||||||
|
As of December 31, 2013
|
|||||||||||||||||||||||||||||||
|
Charter
|
Intermediate Holding Companies
|
CCOH Safari
|
CCO Holdings
|
Charter Operating and Restricted Subsidiaries
|
Unrestricted Subsidiary - CCO Safari
|
Eliminations
|
Charter Consolidated
|
||||||||||||||||||||||||
|
ASSETS
|
|||||||||||||||||||||||||||||||
|
CURRENT ASSETS:
|
|||||||||||||||||||||||||||||||
|
Cash and cash equivalents
|
$
|
—
|
|
$
|
5
|
|
$
|
—
|
|
$
|
—
|
|
$
|
16
|
|
$
|
—
|
|
$
|
—
|
|
$
|
21
|
|
|||||||
|
Accounts receivable, net
|
4
|
|
4
|
|
—
|
|
—
|
|
226
|
|
—
|
|
—
|
|
234
|
|
|||||||||||||||
|
Receivables from related party
|
54
|
|
170
|
|
—
|
|
11
|
|
—
|
|
—
|
|
(235
|
)
|
—
|
|
|||||||||||||||
|
Prepaid expenses and other current assets
|
14
|
|
10
|
|
—
|
|
—
|
|
43
|
|
—
|
|
—
|
|
67
|
|
|||||||||||||||
|
Total current assets
|
72
|
|
189
|
|
—
|
|
11
|
|
285
|
|
—
|
|
(235
|
)
|
322
|
|
|||||||||||||||
|
INVESTMENT IN CABLE PROPERTIES:
|
|||||||||||||||||||||||||||||||
|
Property, plant and equipment, net
|
—
|
|
30
|
|
—
|
|
—
|
|
7,951
|
|
—
|
|
—
|
|
7,981
|
|
|||||||||||||||
|
Franchises
|
—
|
|
—
|
|
—
|
|
—
|
|
6,009
|
|
—
|
|
—
|
|
6,009
|
|
|||||||||||||||
|
Customer relationships, net
|
—
|
|
—
|
|
—
|
|
—
|
|
1,389
|
|
—
|
|
—
|
|
1,389
|
|
|||||||||||||||
|
Goodwill
|
—
|
|
—
|
|
—
|
|
—
|
|
1,177
|
|
—
|
|
—
|
|
1,177
|
|
|||||||||||||||
|
Total investment in cable properties, net
|
—
|
|
30
|
|
—
|
|
—
|
|
16,526
|
|
—
|
|
—
|
|
16,556
|
|
|||||||||||||||
|
CC VIII PREFERRED INTEREST
|
—
|
|
392
|
|
—
|
|
—
|
|
—
|
|
—
|
|
(392
|
)
|
—
|
|
|||||||||||||||
|
INVESTMENT IN SUBSIDIARIES
|
1,295
|
|
325
|
|
—
|
|
10,592
|
|
—
|
|
—
|
|
(12,212
|
)
|
—
|
|
|||||||||||||||
|
LOANS RECEIVABLE – RELATED PARTY
|
—
|
|
318
|
|
—
|
|
461
|
|
—
|
|
—
|
|
(779
|
)
|
—
|
|
|||||||||||||||
|
OTHER NONCURRENT ASSETS
|
—
|
|
160
|
|
—
|
|
119
|
|
138
|
|
—
|
|
—
|
|
417
|
|
|||||||||||||||
|
Total assets
|
$
|
1,367
|
|
$
|
1,414
|
|
$
|
—
|
|
$
|
11,183
|
|
$
|
16,949
|
|
$
|
—
|
|
$
|
(13,618
|
)
|
$
|
17,295
|
|
|||||||
|
LIABILITIES AND SHAREHOLDERS’/MEMBER’S EQUITY
|
|||||||||||||||||||||||||||||||
|
CURRENT LIABILITIES:
|
|||||||||||||||||||||||||||||||
|
Accounts payable and accrued liabilities
|
$
|
12
|
|
$
|
113
|
|
$
|
—
|
|
$
|
187
|
|
$
|
1,155
|
|
$
|
—
|
|
$
|
—
|
|
$
|
1,467
|
|
|||||||
|
Payables to related party
|
—
|
|
—
|
|
—
|
|
—
|
|
235
|
|
—
|
|
(235
|
)
|
—
|
|
|||||||||||||||
|
Total current liabilities
|
12
|
|
113
|
|
—
|
|
187
|
|
1,390
|
|
—
|
|
(235
|
)
|
1,467
|
|
|||||||||||||||
|
LONG-TERM DEBT
|
—
|
|
—
|
|
—
|
|
10,671
|
|
3,510
|
|
—
|
|
—
|
|
14,181
|
|
|||||||||||||||
|
LOANS PAYABLE – RELATED PARTY
|
—
|
|
—
|
|
—
|
|
—
|
|
779
|
|
—
|
|
(779
|
)
|
—
|
|
|||||||||||||||
|
DEFERRED INCOME TAXES
|
1,204
|
|
—
|
|
—
|
|
—
|
|
227
|
|
—
|
|
—
|
|
1,431
|
|
|||||||||||||||
|
OTHER LONG-TERM LIABILITIES
|
—
|
|
6
|
|
—
|
|
—
|
|
59
|
|
—
|
|
—
|
|
65
|
|
|||||||||||||||
|
Shareholders’/Member’s equity
|
151
|
|
1,295
|
|
—
|
|
325
|
|
10,592
|
|
—
|
|
(12,212
|
)
|
151
|
|
|||||||||||||||
|
Non-controlling interest
|
—
|
|
—
|
|
—
|
|
—
|
|
392
|
|
—
|
|
(392
|
)
|
—
|
|
|||||||||||||||
|
Total shareholders’/member’s equity
|
151
|
|
1,295
|
|
—
|
|
325
|
|
10,984
|
|
—
|
|
(12,604
|
)
|
151
|
|
|||||||||||||||
|
Total liabilities and shareholders’/member’s equity
|
$
|
1,367
|
|
$
|
1,414
|
|
$
|
—
|
|
$
|
11,183
|
|
$
|
16,949
|
|
$
|
—
|
|
$
|
(13,618
|
)
|
$
|
17,295
|
|
|||||||
F- 38
CHARTER COMMUNICATIONS, INC. AND SUBSIDIARIES
NOTES TO CONSOLIDATED FINANCIAL STATEMENTS
DECEMBER 31, 2014, 2013 AND 2012
(dollars in millions, except share or per share data or where indicated)
|
Charter Communications, Inc.
|
|||||||||||||||||||||||||||||||
|
|
|||||||||||||||||||||||||||||||
|
For the year ended December 31, 2014
|
|||||||||||||||||||||||||||||||
|
Charter
|
Intermediate Holding Companies
|
CCOH Safari
|
CCO Holdings
|
Charter Operating and Restricted Subsidiaries
|
Unrestricted Subsidiary - CCO Safari
|
Eliminations
|
Charter Consolidated
|
||||||||||||||||||||||||
|
REVENUES
|
$
|
22
|
|
$
|
235
|
|
$
|
—
|
|
$
|
—
|
|
$
|
9,108
|
|
$
|
—
|
|
$
|
(257
|
)
|
$
|
9,108
|
|
|||||||
|
COSTS AND EXPENSES:
|
|||||||||||||||||||||||||||||||
|
Operating costs and expenses (excluding depreciation and amortization)
|
22
|
|
235
|
|
—
|
|
—
|
|
5,973
|
|
—
|
|
(257
|
)
|
5,973
|
|
|||||||||||||||
|
Depreciation and amortization
|
—
|
|
—
|
|
—
|
|
—
|
|
2,102
|
|
—
|
|
—
|
|
2,102
|
|
|||||||||||||||
|
Other operating expenses, net
|
—
|
|
—
|
|
—
|
|
—
|
|
62
|
|
—
|
|
—
|
|
62
|
|
|||||||||||||||
|
22
|
|
235
|
|
—
|
|
—
|
|
8,137
|
|
—
|
|
(257
|
)
|
8,137
|
|
||||||||||||||||
|
Income from operations
|
—
|
|
—
|
|
—
|
|
—
|
|
971
|
|
—
|
|
—
|
|
971
|
|
|||||||||||||||
|
OTHER INCOME AND (EXPENSES):
|
|||||||||||||||||||||||||||||||
|
Interest expense, net
|
—
|
|
8
|
|
(30
|
)
|
(679
|
)
|
(165
|
)
|
(45
|
)
|
—
|
|
(911
|
)
|
|||||||||||||||
|
Loss on derivative instruments, net
|
—
|
|
—
|
|
—
|
|
—
|
|
(7
|
)
|
—
|
|
—
|
|
(7
|
)
|
|||||||||||||||
|
Equity in income (loss) of subsidiaries
|
40
|
|
(12
|
)
|
—
|
|
697
|
|
(45
|
)
|
—
|
|
(680
|
)
|
—
|
|
|||||||||||||||
|
40
|
|
(4
|
)
|
(30
|
)
|
18
|
|
(217
|
)
|
(45
|
)
|
(680
|
)
|
(918
|
)
|
||||||||||||||||
|
Income (loss) before income taxes
|
40
|
|
(4
|
)
|
(30
|
)
|
18
|
|
754
|
|
(45
|
)
|
(680
|
)
|
53
|
|
|||||||||||||||
|
INCOME TAX EXPENSE
|
(223
|
)
|
—
|
|
—
|
|
—
|
|
(13
|
)
|
—
|
|
—
|
|
(236
|
)
|
|||||||||||||||
|
Consolidated net income (loss)
|
(183
|
)
|
(4
|
)
|
(30
|
)
|
18
|
|
741
|
|
(45
|
)
|
(680
|
)
|
(183
|
)
|
|||||||||||||||
|
Less: Net (income) loss – non-controlling interest
|
—
|
|
44
|
|
—
|
|
—
|
|
(44
|
)
|
—
|
|
—
|
|
—
|
|
|||||||||||||||
|
Net income (loss)
|
$
|
(183
|
)
|
$
|
40
|
|
$
|
(30
|
)
|
$
|
18
|
|
$
|
697
|
|
$
|
(45
|
)
|
$
|
(680
|
)
|
$
|
(183
|
)
|
|||||||
F- 39
CHARTER COMMUNICATIONS, INC. AND SUBSIDIARIES
NOTES TO CONSOLIDATED FINANCIAL STATEMENTS
DECEMBER 31, 2014, 2013 AND 2012
(dollars in millions, except share or per share data or where indicated)
|
Charter Communications, Inc.
|
|||||||||||||||||||||||||||||||
|
Condensed Consolidating Statement of Operations
|
|||||||||||||||||||||||||||||||
|
For the year ended December 31, 2013
|
|||||||||||||||||||||||||||||||
|
Charter
|
Intermediate Holding Companies
|
CCOH Safari
|
CCO Holdings
|
Charter Operating and Restricted Subsidiaries
|
Unrestricted Subsidiary - CCO Safari
|
Eliminations
|
Charter Consolidated
|
||||||||||||||||||||||||
|
REVENUES
|
$
|
22
|
|
$
|
188
|
|
$
|
—
|
|
$
|
—
|
|
$
|
8,155
|
|
$
|
—
|
|
$
|
(210
|
)
|
$
|
8,155
|
|
|||||||
|
COSTS AND EXPENSES:
|
|||||||||||||||||||||||||||||||
|
Operating costs and expenses (excluding depreciation and amortization)
|
22
|
|
188
|
|
—
|
|
—
|
|
5,345
|
|
—
|
|
(210
|
)
|
5,345
|
|
|||||||||||||||
|
Depreciation and amortization
|
—
|
|
—
|
|
—
|
|
—
|
|
1,854
|
|
—
|
|
—
|
|
1,854
|
|
|||||||||||||||
|
Other operating expenses, net
|
—
|
|
—
|
|
—
|
|
—
|
|
47
|
|
—
|
|
—
|
|
47
|
|
|||||||||||||||
|
22
|
|
188
|
|
—
|
|
—
|
|
7,246
|
|
—
|
|
(210
|
)
|
7,246
|
|
||||||||||||||||
|
Income from operations
|
—
|
|
—
|
|
—
|
|
—
|
|
909
|
|
—
|
|
—
|
|
909
|
|
|||||||||||||||
|
OTHER INCOME AND (EXPENSES):
|
|||||||||||||||||||||||||||||||
|
Interest expense, net
|
—
|
|
8
|
|
—
|
|
(681
|
)
|
(173
|
)
|
—
|
|
—
|
|
(846
|
)
|
|||||||||||||||
|
Loss on extinguishment of debt
|
—
|
|
—
|
|
—
|
|
(65
|
)
|
(58
|
)
|
—
|
|
—
|
|
(123
|
)
|
|||||||||||||||
|
Gain on derivative instruments, net
|
—
|
|
—
|
|
—
|
|
—
|
|
11
|
|
—
|
|
—
|
|
11
|
|
|||||||||||||||
|
Equity in income (loss) of subsidiaries
|
(75
|
)
|
(114
|
)
|
—
|
|
632
|
|
—
|
|
—
|
|
(443
|
)
|
—
|
|
|||||||||||||||
|
(75
|
)
|
(106
|
)
|
—
|
|
(114
|
)
|
(220
|
)
|
—
|
|
(443
|
)
|
(958
|
)
|
||||||||||||||||
|
Income (loss) before income taxes
|
(75
|
)
|
(106
|
)
|
—
|
|
(114
|
)
|
689
|
|
—
|
|
(443
|
)
|
(49
|
)
|
|||||||||||||||
|
INCOME TAX EXPENSE
|
(108
|
)
|
(1
|
)
|
—
|
|
—
|
|
(11
|
)
|
—
|
|
—
|
|
(120
|
)
|
|||||||||||||||
|
Consolidated net income (loss)
|
(183
|
)
|
(107
|
)
|
—
|
|
(114
|
)
|
678
|
|
—
|
|
(443
|
)
|
(169
|
)
|
|||||||||||||||
|
Less: Net (income) loss – non-controlling interest
|
14
|
|
32
|
|
—
|
|
—
|
|
(46
|
)
|
—
|
|
—
|
|
—
|
|
|||||||||||||||
|
Net income (loss)
|
$
|
(169
|
)
|
$
|
(75
|
)
|
$
|
—
|
|
$
|
(114
|
)
|
$
|
632
|
|
$
|
—
|
|
$
|
(443
|
)
|
$
|
(169
|
)
|
|||||||
F- 40
CHARTER COMMUNICATIONS, INC. AND SUBSIDIARIES
NOTES TO CONSOLIDATED FINANCIAL STATEMENTS
DECEMBER 31, 2014, 2013 AND 2012
(dollars in millions, except share or per share data or where indicated)
|
Charter Communications, Inc.
|
|||||||||||||||||||||||||||||||
|
Condensed Consolidating Statement of Operations
|
|||||||||||||||||||||||||||||||
|
For the year ended December 31, 2012
|
|||||||||||||||||||||||||||||||
|
Charter
|
Intermediate Holding Companies
|
CCOH Safari
|
CCO Holdings
|
Charter Operating and Restricted Subsidiaries
|
Unrestricted Subsidiary - CCO Safari
|
Eliminations
|
Charter Consolidated
|
||||||||||||||||||||||||
|
REVENUES
|
$
|
24
|
|
$
|
159
|
|
$
|
—
|
|
$
|
—
|
|
$
|
7,504
|
|
$
|
—
|
|
$
|
(183
|
)
|
$
|
7,504
|
|
|||||||
|
COSTS AND EXPENSES:
|
|||||||||||||||||||||||||||||||
|
Operating costs and expenses (excluding depreciation and amortization)
|
24
|
|
159
|
|
—
|
|
—
|
|
4,860
|
|
—
|
|
(183
|
)
|
4,860
|
|
|||||||||||||||
|
Depreciation and amortization
|
—
|
|
—
|
|
—
|
|
—
|
|
1,713
|
|
—
|
|
—
|
|
1,713
|
|
|||||||||||||||
|
Other operating expenses, net
|
—
|
|
—
|
|
—
|
|
—
|
|
16
|
|
—
|
|
—
|
|
16
|
|
|||||||||||||||
|
24
|
|
159
|
|
—
|
|
—
|
|
6,589
|
|
—
|
|
(183
|
)
|
6,589
|
|
||||||||||||||||
|
Income from operations
|
—
|
|
—
|
|
—
|
|
—
|
|
915
|
|
—
|
|
—
|
|
915
|
|
|||||||||||||||
|
OTHER INCOME AND (EXPENSES):
|
|||||||||||||||||||||||||||||||
|
Interest expense, net
|
—
|
|
(103
|
)
|
—
|
|
(541
|
)
|
(263
|
)
|
—
|
|
—
|
|
(907
|
)
|
|||||||||||||||
|
Gain (loss) on extinguishment of debt
|
—
|
|
46
|
|
—
|
|
—
|
|
(101
|
)
|
—
|
|
—
|
|
(55
|
)
|
|||||||||||||||
|
Equity in income (loss) of subsidiaries
|
(63
|
)
|
(35
|
)
|
—
|
|
506
|
|
—
|
|
—
|
|
(408
|
)
|
—
|
|
|||||||||||||||
|
(63
|
)
|
(92
|
)
|
—
|
|
(35
|
)
|
(364
|
)
|
—
|
|
(408
|
)
|
(962
|
)
|
||||||||||||||||
|
Income (loss) before income taxes
|
(63
|
)
|
(92
|
)
|
—
|
|
(35
|
)
|
551
|
|
—
|
|
(408
|
)
|
(47
|
)
|
|||||||||||||||
|
INCOME TAX EXPENSE
|
(254
|
)
|
—
|
|
—
|
|
—
|
|
(3
|
)
|
—
|
|
—
|
|
(257
|
)
|
|||||||||||||||
|
Consolidated net income (loss)
|
(317
|
)
|
(92
|
)
|
—
|
|
(35
|
)
|
548
|
|
—
|
|
(408
|
)
|
(304
|
)
|
|||||||||||||||
|
Less: Net (income) loss – non-controlling interest
|
13
|
|
29
|
|
—
|
|
—
|
|
(42
|
)
|
—
|
|
—
|
|
—
|
|
|||||||||||||||
|
Net income (loss)
|
$
|
(304
|
)
|
$
|
(63
|
)
|
$
|
—
|
|
$
|
(35
|
)
|
$
|
506
|
|
$
|
—
|
|
$
|
(408
|
)
|
$
|
(304
|
)
|
|||||||
F- 41
CHARTER COMMUNICATIONS, INC. AND SUBSIDIARIES
NOTES TO CONSOLIDATED FINANCIAL STATEMENTS
DECEMBER 31, 2014, 2013 AND 2012
(dollars in millions, except share or per share data or where indicated)
|
Charter Communications, Inc.
|
|||||||||||||||||||||||||||||||
|
Condensed Consolidating Statement of Comprehensive Income (Loss)
|
|||||||||||||||||||||||||||||||
|
For the year ended December 31, 2014
|
|||||||||||||||||||||||||||||||
|
Charter
|
Intermediate Holding Companies
|
CCOH Safari
|
CCO Holdings
|
Charter Operating and Restricted Subsidiaries
|
Unrestricted Subsidiary - CCO Safari
|
Eliminations
|
Charter Consolidated
|
||||||||||||||||||||||||
|
Consolidated net income (loss)
|
$
|
(183
|
)
|
$
|
(4
|
)
|
$
|
(30
|
)
|
$
|
18
|
|
$
|
741
|
|
$
|
(45
|
)
|
$
|
(680
|
)
|
$
|
(183
|
)
|
|||||||
|
Net impact of interest rate derivative instruments, net of tax
|
—
|
|
—
|
|
—
|
|
—
|
|
19
|
|
—
|
|
—
|
|
19
|
|
|||||||||||||||
|
Comprehensive income (loss)
|
$
|
(183
|
)
|
$
|
(4
|
)
|
$
|
(30
|
)
|
$
|
18
|
|
$
|
760
|
|
$
|
(45
|
)
|
$
|
(680
|
)
|
$
|
(164
|
)
|
|||||||
|
Charter Communications, Inc.
|
|||||||||||||||||||||||||||||||
|
Condensed Consolidating Statement of Comprehensive Income (Loss)
|
|||||||||||||||||||||||||||||||
|
For the year ended December 31, 2013
|
|||||||||||||||||||||||||||||||
|
Charter
|
Intermediate Holding Companies
|
CCOH Safari
|
CCO Holdings
|
Charter Operating and Restricted Subsidiaries
|
Unrestricted Subsidiary - CCO Safari
|
Eliminations
|
Charter Consolidated
|
||||||||||||||||||||||||
|
Consolidated net income (loss)
|
$
|
(183
|
)
|
$
|
(107
|
)
|
$
|
—
|
|
$
|
(114
|
)
|
$
|
678
|
|
$
|
—
|
|
$
|
(443
|
)
|
$
|
(169
|
)
|
|||||||
|
Net impact of interest rate derivative instruments, net of tax
|
—
|
|
—
|
|
—
|
|
—
|
|
34
|
|
—
|
|
—
|
|
34
|
|
|||||||||||||||
|
Comprehensive income (loss)
|
$
|
(183
|
)
|
$
|
(107
|
)
|
$
|
—
|
|
$
|
(114
|
)
|
$
|
712
|
|
$
|
—
|
|
$
|
(443
|
)
|
$
|
(135
|
)
|
|||||||
|
Charter Communications, Inc.
|
|||||||||||||||||||||||||||||||
|
Condensed Consolidating Statement of Comprehensive Income (Loss)
|
|||||||||||||||||||||||||||||||
|
For the year ended December 31, 2012
|
|||||||||||||||||||||||||||||||
|
Charter
|
Intermediate Holding Companies
|
CCOH Safari
|
CCO Holdings
|
Charter Operating and Restricted Subsidiaries
|
Unrestricted Subsidiary - CCO Safari
|
Eliminations
|
Charter Consolidated
|
||||||||||||||||||||||||
|
Consolidated net income (loss)
|
$
|
(317
|
)
|
$
|
(92
|
)
|
$
|
—
|
|
$
|
(35
|
)
|
$
|
548
|
|
$
|
—
|
|
$
|
(408
|
)
|
$
|
(304
|
)
|
|||||||
|
Net impact of interest rate derivative instruments, net of tax
|
—
|
|
—
|
|
—
|
|
—
|
|
(10
|
)
|
—
|
|
—
|
|
(10
|
)
|
|||||||||||||||
|
Comprehensive income (loss)
|
$
|
(317
|
)
|
$
|
(92
|
)
|
$
|
—
|
|
$
|
(35
|
)
|
$
|
538
|
|
$
|
—
|
|
$
|
(408
|
)
|
$
|
(314
|
)
|
|||||||
F- 42
CHARTER COMMUNICATIONS, INC. AND SUBSIDIARIES
NOTES TO CONSOLIDATED FINANCIAL STATEMENTS
DECEMBER 31, 2014, 2013 AND 2012
(dollars in millions, except share or per share data or where indicated)
|
Charter Communications, Inc.
|
|||||||||||||||||||||||||||||||
|
Condensed Consolidating Statement of Cash Flows
|
|||||||||||||||||||||||||||||||
|
For the year ended December 31, 2014
|
|||||||||||||||||||||||||||||||
|
Charter
|
Intermediate Holding Companies
|
CCOH Safari
|
CCO Holdings
|
Charter Operating and Restricted Subsidiaries
|
Unrestricted Subsidiary - CCO Safari
|
Eliminations
|
Charter Consolidated
|
||||||||||||||||||||||||
|
CASH FLOWS FROM OPERATING ACTIVITIES:
|
|||||||||||||||||||||||||||||||
|
Consolidated net income (loss)
|
$
|
(183
|
)
|
$
|
(4
|
)
|
$
|
(30
|
)
|
$
|
18
|
|
$
|
741
|
|
$
|
(45
|
)
|
$
|
(680
|
)
|
$
|
(183
|
)
|
|||||||
|
Adjustments to reconcile net income (loss) to net cash flows from operating activities:
|
|||||||||||||||||||||||||||||||
|
Depreciation and amortization
|
—
|
|
—
|
|
—
|
|
—
|
|
2,102
|
|
—
|
|
—
|
|
2,102
|
|
|||||||||||||||
|
Noncash interest expense
|
—
|
|
—
|
|
—
|
|
25
|
|
12
|
|
—
|
|
—
|
|
37
|
|
|||||||||||||||
|
Loss on derivative instruments, net
|
—
|
|
—
|
|
—
|
|
—
|
|
7
|
|
—
|
|
—
|
|
7
|
|
|||||||||||||||
|
Deferred income taxes
|
223
|
|
—
|
|
—
|
|
—
|
|
10
|
|
—
|
|
—
|
|
233
|
|
|||||||||||||||
|
Equity in (income) losses of subsidiaries
|
(40
|
)
|
12
|
|
—
|
|
(697
|
)
|
45
|
|
—
|
|
680
|
|
—
|
|
|||||||||||||||
|
Other, net
|
—
|
|
(2
|
)
|
—
|
|
—
|
|
67
|
|
—
|
|
—
|
|
65
|
|
|||||||||||||||
|
Changes in operating assets and liabilities, net of effects from acquisitions and dispositions:
|
|||||||||||||||||||||||||||||||
|
Accounts receivable
|
—
|
|
(2
|
)
|
—
|
|
—
|
|
(49
|
)
|
—
|
|
—
|
|
(51
|
)
|
|||||||||||||||
|
Prepaid expenses and other assets
|
—
|
|
(1
|
)
|
—
|
|
—
|
|
(8
|
)
|
—
|
|
—
|
|
(9
|
)
|
|||||||||||||||
|
Accounts payable, accrued liabilities and other
|
—
|
|
41
|
|
18
|
|
—
|
|
91
|
|
8
|
|
—
|
|
158
|
|
|||||||||||||||
|
Receivables from and payables to related party
|
—
|
|
(57
|
)
|
—
|
|
(11
|
)
|
68
|
|
—
|
|
—
|
|
—
|
|
|||||||||||||||
|
Net cash flows from operating activities
|
—
|
|
(13
|
)
|
(12
|
)
|
(665
|
)
|
3,086
|
|
(37
|
)
|
—
|
|
2,359
|
|
|||||||||||||||
|
CASH FLOWS FROM INVESTING ACTIVITIES:
|
|||||||||||||||||||||||||||||||
|
Purchases of property, plant and equipment
|
—
|
|
—
|
|
—
|
|
—
|
|
(2,221
|
)
|
—
|
|
—
|
|
(2,221
|
)
|
|||||||||||||||
|
Change in accrued expenses related to capital expenditures
|
—
|
|
—
|
|
—
|
|
—
|
|
33
|
|
—
|
|
—
|
|
33
|
|
|||||||||||||||
|
Purchases of cable systems, net
|
—
|
|
—
|
|
—
|
|
—
|
|
11
|
|
—
|
|
—
|
|
11
|
|
|||||||||||||||
|
Contribution to subsidiary
|
(106
|
)
|
(600
|
)
|
—
|
|
(100
|
)
|
(71
|
)
|
—
|
|
877
|
|
—
|
|
|||||||||||||||
|
Distributions from subsidiary
|
5
|
|
30
|
|
—
|
|
1,132
|
|
—
|
|
—
|
|
(1,167
|
)
|
—
|
|
|||||||||||||||
|
Restricted cash in escrow
|
—
|
|
—
|
|
(3,598
|
)
|
—
|
|
—
|
|
(3,513
|
)
|
—
|
|
(7,111
|
)
|
|||||||||||||||
|
Other, net
|
—
|
|
(5
|
)
|
—
|
|
—
|
|
(11
|
)
|
—
|
|
—
|
|
(16
|
)
|
|||||||||||||||
|
Net cash flows from investing activities
|
(101
|
)
|
(575
|
)
|
(3,598
|
)
|
1,032
|
|
(2,259
|
)
|
(3,513
|
)
|
(290
|
)
|
(9,304
|
)
|
|||||||||||||||
|
CASH FLOWS FROM FINANCING ACTIVITIES:
|
|||||||||||||||||||||||||||||||
|
Borrowings of long-term debt
|
—
|
|
—
|
|
3,500
|
|
—
|
|
1,823
|
|
3,483
|
|
—
|
|
8,806
|
|
|||||||||||||||
|
Repayments of long-term debt
|
—
|
|
—
|
|
—
|
|
(350
|
)
|
(1,630
|
)
|
—
|
|
—
|
|
(1,980
|
)
|
|||||||||||||||
|
Borrowings (payments) loans payable - related parties
|
—
|
|
—
|
|
112
|
|
(112
|
)
|
—
|
|
—
|
|
—
|
|
—
|
|
|||||||||||||||
|
Payment for debt issuance costs
|
—
|
|
—
|
|
(2
|
)
|
—
|
|
—
|
|
(4
|
)
|
—
|
|
(6
|
)
|
|||||||||||||||
|
Purchase of treasury stock
|
(19
|
)
|
—
|
|
—
|
|
—
|
|
—
|
|
—
|
|
—
|
|
(19
|
)
|
|||||||||||||||
|
Proceeds from exercise of options and warrants
|
123
|
|
—
|
|
—
|
|
—
|
|
—
|
|
—
|
|
—
|
|
123
|
|
|||||||||||||||
|
Contributions from parent
|
—
|
|
606
|
|
—
|
|
100
|
|
100
|
|
71
|
|
(877
|
)
|
—
|
|
|||||||||||||||
|
Distributions to parent
|
—
|
|
(30
|
)
|
—
|
|
(5
|
)
|
(1,132
|
)
|
—
|
|
1,167
|
|
—
|
|
|||||||||||||||
|
Other, net
|
—
|
|
7
|
|
—
|
|
—
|
|
(4
|
)
|
—
|
|
—
|
|
3
|
|
|||||||||||||||
|
Net cash flows from financing activities
|
104
|
|
583
|
|
3,610
|
|
(367
|
)
|
(843
|
)
|
3,550
|
|
290
|
|
6,927
|
|
|||||||||||||||
|
NET INCREASE (DECREASE) IN CASH AND CASH EQUIVALENTS
|
3
|
|
(5
|
)
|
—
|
|
—
|
|
(16
|
)
|
—
|
|
—
|
|
(18
|
)
|
|||||||||||||||
|
CASH AND CASH EQUIVALENTS, beginning of period
|
—
|
|
5
|
|
—
|
|
—
|
|
16
|
|
—
|
|
—
|
|
21
|
|
|||||||||||||||
|
CASH AND CASH EQUIVALENTS, end of period
|
$
|
3
|
|
$
|
—
|
|
$
|
—
|
|
$
|
—
|
|
$
|
—
|
|
$
|
—
|
|
$
|
—
|
|
$
|
3
|
|
|||||||
F- 43
CHARTER COMMUNICATIONS, INC. AND SUBSIDIARIES
NOTES TO CONSOLIDATED FINANCIAL STATEMENTS
DECEMBER 31, 2014, 2013 AND 2012
(dollars in millions, except share or per share data or where indicated)
|
Charter Communications, Inc.
|
|||||||||||||||||||||||||||||||
|
Condensed Consolidating Statement of Cash Flows
|
|||||||||||||||||||||||||||||||
|
For the year ended December 31, 2013
|
|||||||||||||||||||||||||||||||
|
Charter
|
Intermediate Holding Companies
|
CCOH Safari
|
CCO Holdings
|
Charter Operating and Restricted Subsidiaries
|
Unrestricted Subsidiary - CCO Safari
|
Eliminations
|
Charter Consolidated
|
||||||||||||||||||||||||
|
CASH FLOWS FROM OPERATING ACTIVITIES:
|
|||||||||||||||||||||||||||||||
|
Consolidated net income (loss)
|
$
|
(183
|
)
|
$
|
(107
|
)
|
$
|
—
|
|
$
|
(114
|
)
|
$
|
678
|
|
$
|
—
|
|
$
|
(443
|
)
|
$
|
(169
|
)
|
|||||||
|
Adjustments to reconcile net income (loss) to net cash flows from operating activities:
|
|||||||||||||||||||||||||||||||
|
Depreciation and amortization
|
—
|
|
—
|
|
—
|
|
—
|
|
1,854
|
|
—
|
|
—
|
|
1,854
|
|
|||||||||||||||
|
Noncash interest expense
|
—
|
|
—
|
|
—
|
|
27
|
|
16
|
|
—
|
|
—
|
|
43
|
|
|||||||||||||||
|
Loss on extinguishment of debt
|
—
|
|
—
|
|
—
|
|
65
|
|
58
|
|
—
|
|
—
|
|
123
|
|
|||||||||||||||
|
Gain on derivative instruments, net
|
—
|
|
—
|
|
—
|
|
—
|
|
(11
|
)
|
—
|
|
—
|
|
(11
|
)
|
|||||||||||||||
|
Deferred income taxes
|
105
|
|
—
|
|
—
|
|
—
|
|
7
|
|
—
|
|
—
|
|
112
|
|
|||||||||||||||
|
Equity in (income) losses of subsidiaries
|
75
|
|
114
|
|
—
|
|
(632
|
)
|
—
|
|
—
|
|
443
|
|
—
|
|
|||||||||||||||
|
Other, net
|
—
|
|
—
|
|
—
|
|
—
|
|
82
|
|
—
|
|
—
|
|
82
|
|
|||||||||||||||
|
Changes in operating assets and liabilities, net of effects from acquisitions and dispositions:
|
|||||||||||||||||||||||||||||||
|
Accounts receivable
|
(3
|
)
|
(1
|
)
|
—
|
|
—
|
|
14
|
|
—
|
|
—
|
|
10
|
|
|||||||||||||||
|
Prepaid expenses and other assets
|
—
|
|
1
|
|
—
|
|
—
|
|
(1
|
)
|
—
|
|
—
|
|
—
|
|
|||||||||||||||
|
Accounts payable, accrued liabilities and other
|
—
|
|
(3
|
)
|
—
|
|
41
|
|
76
|
|
—
|
|
—
|
|
114
|
|
|||||||||||||||
|
Receivables from and payables to related party
|
5
|
|
(1
|
)
|
—
|
|
(10
|
)
|
6
|
|
—
|
|
—
|
|
—
|
|
|||||||||||||||
|
Net cash flows from operating activities
|
(1
|
)
|
3
|
|
—
|
|
(623
|
)
|
2,779
|
|
—
|
|
—
|
|
2,158
|
|
|||||||||||||||
|
CASH FLOWS FROM INVESTING ACTIVITIES:
|
|||||||||||||||||||||||||||||||
|
Purchases of property, plant and equipment
|
—
|
|
—
|
|
—
|
|
—
|
|
(1,825
|
)
|
—
|
|
—
|
|
(1,825
|
)
|
|||||||||||||||
|
Change in accrued expenses related to capital expenditures
|
—
|
|
—
|
|
—
|
|
—
|
|
76
|
|
—
|
|
—
|
|
76
|
|
|||||||||||||||
|
Purchases of cable systems, net
|
—
|
|
—
|
|
—
|
|
—
|
|
(676
|
)
|
—
|
|
—
|
|
(676
|
)
|
|||||||||||||||
|
Contribution to subsidiary
|
(89
|
)
|
(534
|
)
|
—
|
|
(1,022
|
)
|
—
|
|
—
|
|
1,645
|
|
—
|
|
|||||||||||||||
|
Distributions from subsidiary
|
—
|
|
6
|
|
—
|
|
630
|
|
—
|
|
—
|
|
(636
|
)
|
—
|
|
|||||||||||||||
|
Other, net
|
—
|
|
1
|
|
—
|
|
—
|
|
(19
|
)
|
—
|
|
—
|
|
(18
|
)
|
|||||||||||||||
|
Net cash flows from investing activities
|
(89
|
)
|
(527
|
)
|
—
|
|
(392
|
)
|
(2,444
|
)
|
—
|
|
1,009
|
|
(2,443
|
)
|
|||||||||||||||
|
CASH FLOWS FROM FINANCING ACTIVITIES:
|
|||||||||||||||||||||||||||||||
|
Borrowings of long-term debt
|
—
|
|
—
|
|
—
|
|
2,000
|
|
4,782
|
|
—
|
|
—
|
|
6,782
|
|
|||||||||||||||
|
Repayments of long-term debt
|
—
|
|
—
|
|
—
|
|
(955
|
)
|
(5,565
|
)
|
—
|
|
—
|
|
(6,520
|
)
|
|||||||||||||||
|
Borrowings (payments) loans payable - related parties
|
—
|
|
—
|
|
—
|
|
(93
|
)
|
93
|
|
—
|
|
—
|
|
—
|
|
|||||||||||||||
|
Payment for debt issuance costs
|
—
|
|
—
|
|
—
|
|
(25
|
)
|
(25
|
)
|
—
|
|
—
|
|
(50
|
)
|
|||||||||||||||
|
Purchase of treasury stock
|
(15
|
)
|
—
|
|
—
|
|
—
|
|
—
|
|
—
|
|
—
|
|
(15
|
)
|
|||||||||||||||
|
Proceeds from exercise of options and warrants
|
104
|
|
—
|
|
—
|
|
—
|
|
—
|
|
—
|
|
—
|
|
104
|
|
|||||||||||||||
|
Contributions from parent
|
—
|
|
534
|
|
—
|
|
89
|
|
1,022
|
|
—
|
|
(1,645
|
)
|
—
|
|
|||||||||||||||
|
Distributions to parent
|
—
|
|
(5
|
)
|
—
|
|
(1
|
)
|
(630
|
)
|
—
|
|
636
|
|
—
|
|
|||||||||||||||
|
Other, net
|
—
|
|
—
|
|
—
|
|
—
|
|
(2
|
)
|
—
|
|
—
|
|
(2
|
)
|
|||||||||||||||
|
Net cash flows from financing activities
|
89
|
|
529
|
|
—
|
|
1,015
|
|
(325
|
)
|
—
|
|
(1,009
|
)
|
299
|
|
|||||||||||||||
|
NET INCREASE (DECREASE) IN CASH AND CASH EQUIVALENTS
|
(1
|
)
|
5
|
|
—
|
|
—
|
|
10
|
|
—
|
|
—
|
|
14
|
|
|||||||||||||||
|
CASH AND CASH EQUIVALENTS, beginning of period
|
1
|
|
—
|
|
—
|
|
—
|
|
6
|
|
—
|
|
—
|
|
7
|
|
|||||||||||||||
|
CASH AND CASH EQUIVALENTS, end of period
|
$
|
—
|
|
$
|
5
|
|
$
|
—
|
|
$
|
—
|
|
$
|
16
|
|
$
|
—
|
|
$
|
—
|
|
$
|
21
|
|
|||||||
F- 44
CHARTER COMMUNICATIONS, INC. AND SUBSIDIARIES
NOTES TO CONSOLIDATED FINANCIAL STATEMENTS
DECEMBER 31, 2014, 2013 AND 2012
(dollars in millions, except share or per share data or where indicated)
|
Charter Communications, Inc.
|
|||||||||||||||||||||||||||||||
|
Condensed Consolidating Statement of Cash Flows
|
|||||||||||||||||||||||||||||||
|
For the year ended December 31, 2012
|
|||||||||||||||||||||||||||||||
|
Charter
|
Intermediate Holding Companies
|
CCOH Safari
|
CCO Holdings
|
Charter Operating and Restricted Subsidiaries
|
Unrestricted Subsidiary - CCO Safari
|
Eliminations
|
Charter Consolidated
|
||||||||||||||||||||||||
|
CASH FLOWS FROM OPERATING ACTIVITIES:
|
|||||||||||||||||||||||||||||||
|
Consolidated net income (loss)
|
$
|
(317
|
)
|
$
|
(92
|
)
|
$
|
—
|
|
$
|
(35
|
)
|
$
|
548
|
|
$
|
—
|
|
$
|
(408
|
)
|
$
|
(304
|
)
|
|||||||
|
Adjustments to reconcile net income (loss) to net cash flows from operating activities:
|
|||||||||||||||||||||||||||||||
|
Depreciation and amortization
|
—
|
|
—
|
|
—
|
|
—
|
|
1,713
|
|
—
|
|
—
|
|
1,713
|
|
|||||||||||||||
|
Noncash interest expense
|
—
|
|
(23
|
)
|
—
|
|
18
|
|
50
|
|
—
|
|
—
|
|
45
|
|
|||||||||||||||
|
(Gain) loss on extinguishment of debt
|
—
|
|
(46
|
)
|
—
|
|
—
|
|
101
|
|
—
|
|
—
|
|
55
|
|
|||||||||||||||
|
Deferred income taxes
|
252
|
|
—
|
|
—
|
|
—
|
|
(2
|
)
|
—
|
|
—
|
|
250
|
|
|||||||||||||||
|
Equity in (income) losses of subsidiaries
|
63
|
|
35
|
|
—
|
|
(506
|
)
|
—
|
|
—
|
|
408
|
|
—
|
|
|||||||||||||||
|
Other, net
|
—
|
|
—
|
|
—
|
|
—
|
|
45
|
|
—
|
|
—
|
|
45
|
|
|||||||||||||||
|
Changes in operating assets and liabilities, net of effects from acquisitions and dispositions:
|
|||||||||||||||||||||||||||||||
|
Accounts receivable
|
(1
|
)
|
1
|
|
—
|
|
—
|
|
34
|
|
—
|
|
—
|
|
34
|
|
|||||||||||||||
|
Prepaid expenses and other assets
|
2
|
|
8
|
|
—
|
|
—
|
|
(18
|
)
|
—
|
|
—
|
|
(8
|
)
|
|||||||||||||||
|
Accounts payable, accrued liabilities and other
|
—
|
|
(87
|
)
|
—
|
|
47
|
|
86
|
|
—
|
|
—
|
|
46
|
|
|||||||||||||||
|
Receivables from and payables to related party
|
(1
|
)
|
(1
|
)
|
—
|
|
(11
|
)
|
13
|
|
—
|
|
—
|
|
—
|
|
|||||||||||||||
|
Net cash flows from operating activities
|
(2
|
)
|
(205
|
)
|
—
|
|
(487
|
)
|
2,570
|
|
—
|
|
—
|
|
1,876
|
|
|||||||||||||||
|
CASH FLOWS FROM INVESTING ACTIVITIES:
|
|||||||||||||||||||||||||||||||
|
Purchases of property, plant and equipment
|
—
|
|
—
|
|
—
|
|
—
|
|
(1,745
|
)
|
—
|
|
—
|
|
(1,745
|
)
|
|||||||||||||||
|
Change in accrued expenses related to capital expenditures
|
—
|
|
—
|
|
—
|
|
—
|
|
13
|
|
—
|
|
—
|
|
13
|
|
|||||||||||||||
|
Sales of cable systems, net
|
—
|
|
—
|
|
—
|
|
—
|
|
19
|
|
—
|
|
—
|
|
19
|
|
|||||||||||||||
|
Contribution to subsidiary
|
(14
|
)
|
(71
|
)
|
—
|
|
(2,330
|
)
|
—
|
|
—
|
|
2,415
|
|
—
|
|
|||||||||||||||
|
Distributions from subsidiary
|
12
|
|
1,891
|
|
—
|
|
2,014
|
|
—
|
|
—
|
|
(3,917
|
)
|
—
|
|
|||||||||||||||
|
Other, net
|
—
|
|
—
|
|
—
|
|
—
|
|
(24
|
)
|
—
|
|
—
|
|
(24
|
)
|
|||||||||||||||
|
Net cash flows from investing activities
|
(2
|
)
|
1,820
|
|
—
|
|
(316
|
)
|
(1,737
|
)
|
—
|
|
(1,502
|
)
|
(1,737
|
)
|
|||||||||||||||
|
CASH FLOWS FROM FINANCING ACTIVITIES:
|
|||||||||||||||||||||||||||||||
|
Borrowings of long-term debt
|
—
|
|
—
|
|
—
|
|
2,984
|
|
2,846
|
|
—
|
|
—
|
|
5,830
|
|
|||||||||||||||
|
Repayments of long-term debt
|
—
|
|
(1,621
|
)
|
—
|
|
—
|
|
(4,280
|
)
|
—
|
|
—
|
|
(5,901
|
)
|
|||||||||||||||
|
Borrowings (payments) loans payable - related parties
|
—
|
|
—
|
|
—
|
|
(314
|
)
|
314
|
|
—
|
|
—
|
|
—
|
|
|||||||||||||||
|
Payment for debt issuance costs
|
—
|
|
—
|
|
—
|
|
(39
|
)
|
(14
|
)
|
—
|
|
—
|
|
(53
|
)
|
|||||||||||||||
|
Purchase of treasury stock
|
(11
|
)
|
—
|
|
—
|
|
—
|
|
—
|
|
—
|
|
—
|
|
(11
|
)
|
|||||||||||||||
|
Proceeds from exercise of options
|
15
|
|
—
|
|
—
|
|
—
|
|
—
|
|
—
|
|
—
|
|
15
|
|
|||||||||||||||
|
Contributions from parent
|
—
|
|
84
|
|
—
|
|
1
|
|
2,330
|
|
—
|
|
(2,415
|
)
|
—
|
|
|||||||||||||||
|
Distributions to parent
|
—
|
|
(72
|
)
|
—
|
|
(1,831
|
)
|
(2,014
|
)
|
—
|
|
3,917
|
|
—
|
|
|||||||||||||||
|
Other, net
|
1
|
|
(6
|
)
|
—
|
|
—
|
|
(9
|
)
|
—
|
|
—
|
|
(14
|
)
|
|||||||||||||||
|
Net cash flows from financing activities
|
5
|
|
(1,615
|
)
|
—
|
|
801
|
|
(827
|
)
|
—
|
|
1,502
|
|
(134
|
)
|
|||||||||||||||
|
NET INCREASE (DECREASE) IN CASH AND CASH EQUIVALENTS
|
1
|
|
—
|
|
—
|
|
(2
|
)
|
6
|
|
—
|
|
—
|
|
5
|
|
|||||||||||||||
|
CASH AND CASH EQUIVALENTS, beginning of period
|
—
|
|
—
|
|
—
|
|
2
|
|
—
|
|
—
|
|
—
|
|
2
|
|
|||||||||||||||
|
CASH AND CASH EQUIVALENTS, end of period
|
$
|
1
|
|
$
|
—
|
|
$
|
—
|
|
$
|
—
|
|
$
|
6
|
|
$
|
—
|
|
$
|
—
|
|
$
|
7
|
|
|||||||
F- 45
TABLE OF CONTENTS
Part IItem 1. BusinessItem 1A. Risk FactorsItem 1B. Unresolved Staff CommentsItem 2. PropertiesItem 3. Legal ProceedingsItem 4. Mine Safety DisclosuresPart IIItem 5. Market For Registrant S Common Equity, Related Stockholder Matters and Issuer Purchases Of Equity SecuritiesItem 6. Selected Financial DataItem 7. Management S Discussion and Analysis Of Financial Condition and Results Of OperationsItem 7A. Quantitative and Qualitative Disclosures About Market RiskItem 8. Financial Statements and Supplementary DataItem 9. Changes in and Disagreements with Accountants on Accounting and Financial DisclosureItem 9A. Controls and ProceduresItem 9B. Other InformationPart IIIItem 10. Directors, Executive Officers and Corporate GovernanceItem 11. Executive CompensationItem 12. Security Ownership Of Certain Beneficial Owners and Management and Related Stockholder MattersItem 13. Certain Relationships and Related Transactions, and Director IndependenceItem 14. Principal Accounting Fees and ServicesPart IVItem 15. Exhibits and Financial Statement Schedules