CHARTER COMMUNICATIONS, INC. /MO/
10-Ks and 10-Qs
|
|
|
|
|
|
|
|
|
|
|
|
|
|
|
|
|
|
|
|
|
|
|
|
|
|
|
|
|
|
|
|
|
|
|
|
|
|
|
|
|
|
|
|
|
|
|
|
|
|
|
|
|
|
|
|
UNITED STATES
SECURITIES AND EXCHANGE COMMISSION
SECURITIES AND EXCHANGE COMMISSION
Washington, D.C. 20549
______________
FORM 10-K
______________
|
(Mark One)
|
||
|
x
|
ANNUAL REPORT PURSUANT TO SECTION 13 OR 15(d) OF THE SECURITIES EXCHANGE
ACT OF 1934 |
|
|
For the fiscal year ended December 31, 2017
|
||
|
or
|
||
|
¨
|
TRANSITION REPORT PURSUANT TO SECTION 13 OR 15(d) OF THE SECURITIES
EXCHANGE ACT OF 1934 |
|
For the Transition Period From to
Commission File Number: 001-33664
Commission File Number: 001-33664

Charter Communications, Inc.
(Exact name of registrant as specified in its charter)
|
Delaware
|
84-1496755
|
|
|
(State or other jurisdiction of incorporation or organization)
|
(I.R.S. Employer Identification Number)
|
|
|
400 Atlantic Street
Stamford, Connecticut 06901
|
(203) 905-7800
|
|
|
(Address of principal executive offices including zip code)
|
(Registrant’s telephone number, including area code)
|
|
Securities registered pursuant to section 12(b) of the Act:
|
Title of each class
|
Name of Exchange which registered
|
|
|
Class A Common Stock, $.001 Par Value
|
NASDAQ Global Select Market
|
|
Securities registered pursuant to section 12(g) of the Act: None
Indicate by check mark if the registrant is a well-known seasoned issuer, as defined in Rule 405 of the Securities Act. Yes
x
No
o
Indicate by check mark if the registrant is not required to file reports pursuant to Section 13 or Section 15(d) of the Act. Yes
o
No
x
Indicate by check mark whether the registrant (1) has filed all reports required to be filed by Section 13 or 15(d) of the Securities Exchange Act of 1934 during the preceding 12 months (or for such shorter period that the registrant was required to file such reports), and (2) has been subject to such filing requirements for the past 90 days. Yes
x
No
o
Indicate by check mark whether the registrants have submitted electronically and posted on their corporate website, if any, every Interactive Data File required to be submitted and posted pursuant to Rule 405 of Regulation S-T (§232.405 of this chapter) during the preceding 12 months (or for such shorter period that the registrants were required to submit and post such files). Yes
x
No
o
Indicate by check mark if disclosure of delinquent filers pursuant to Item 405 of Regulation S-K (§ 229.405 of this chapter) is not contained herein, and will not be contained, to the best of registrant’s knowledge, in definitive proxy or information statements incorporated by reference in Part III of this Form 10-K or any amendment to this Form 10-K.
o
Indicate by check mark whether the registrant is a large accelerated filer, an accelerated filer, a non-accelerated filer, or a smaller reporting company. See definition of “large accelerated filer,” “accelerated filer,” and “smaller reporting company” in Rule 12b-2 of the Exchange Act.:
Large accelerated filer
x
Accelerated filer
o
Non-accelerated filer
o
Smaller reporting company
o
If an emerging growth company, indicate by check mark if the registrant has elected not to use the extended transition period for complying with any new or revised financial accounting standards provided pursuant to Section 13(a) of the Exchange Act.
o
Indicate by check mark whether the registrant is a shell company (as defined in Rule 12b-2 of the Act). Yes
o
No
x
The aggregate market value of the registrant of outstanding Class A common stock held by non-affiliates of the registrant at
June 30, 2017
was approximately
$68.0 billion
, computed based on the closing sale price as quoted on the NASDAQ Global Select Market on that date. For purposes of this calculation only, directors, executive officers and the principal controlling shareholders or entities controlled by such controlling shareholders of the registrant are deemed to be affiliates of the registrant.
There were
238,506,059
shares of Class A common stock outstanding as of
December 31, 2017
. There was
1
share of Class B common stock outstanding as of the same date.
Documents Incorporated By Reference
Information required by Part III is incorporated by reference from Registrant’s proxy statement or an amendment to this Annual Report on Form 10-K to be filed by April 30, 2018.
CHARTER COMMUNICATIONS, INC.
FORM 10-K — FOR THE YEAR ENDED DECEMBER 31, 2017
FORM 10-K — FOR THE YEAR ENDED DECEMBER 31, 2017
TABLE OF CONTENTS
|
Page No.
|
||||
This annual report on Form 10-K is for the year ended
December 31, 2017
. The United States Securities and Exchange Commission (“SEC”) allows us to “incorporate by reference” information that we file with the SEC, which means that we can disclose important information to you by referring you directly to those documents. Information incorporated by reference is considered to be part of this annual report. In addition, information that we file with the SEC in the future will automatically update and supersede information contained in this annual report. In this annual report, “Charter,” “we,” “us” and “our” refer to Charter Communications, Inc. and its subsidiaries.
i
CAUTIONARY STATEMENT REGARDING FORWARD-LOOKING STATEMENTS:
This annual report includes forward-looking statements within the meaning of Section 27A of the Securities Act of 1933, as amended (the “Securities Act”), and Section 21E of the Securities Exchange Act of 1934, as amended (the “Exchange Act”), regarding, among other things, our plans, strategies and prospects, both business and financial including, without limitation, the forward-looking statements set forth in Part I. Item 1. under the heading “Business” and in Part II. Item 7. under the heading “Management’s Discussion and Analysis of Financial Condition and Results of Operations” in this annual report. Although we believe that our plans, intentions and expectations reflected in or suggested by these forward-looking statements are reasonable, we cannot assure you that we will achieve or realize these plans, intentions or expectations. Forward-looking statements are inherently subject to risks, uncertainties and assumptions, including, without limitation, the factors described in Part I. Item 1A. under “Risk Factors” and in Part II. Item 7. under the heading, “Management’s Discussion and Analysis of Financial Condition and Results of Operations” in this annual report. Many of the forward-looking statements contained in this annual report may be identified by the use of forward‑looking words such as “believe,” “expect,” “anticipate,” “should,” “planned,” “will,” “may,” “intend,” “estimated,” “aim,” “on track,” “target,” “opportunity,” “tentative,” “positioning,” “designed,” “create,” “predict,” “project,” “initiatives,” “seek,” “would,” “could,” “continue,” “ongoing,” “upside,” “increases” and “potential,” among others. Important factors that could cause actual results to differ materially from the forward-looking statements we make in this annual report are set forth in this annual report and in other reports or documents that we file from time to time with the SEC, and include, but are not limited to:
•
our ability to efficiently and effectively integrate acquired operations;
|
•
|
our ability to sustain and grow revenues and cash flow from operations by offering video, Internet, voice, mobile, advertising and other services to residential and commercial customers, to adequately meet the customer experience demands in our markets and to maintain and grow our customer base, particularly in the face of increasingly aggressive competition, the need for innovation and the related capital expenditures;
|
|
•
|
the impact of competition from other market participants, including but not limited to incumbent telephone companies, direct broadcast satellite operators, wireless broadband and telephone providers, digital subscriber line (“DSL”) providers, fiber to the home providers, video provided over the Internet by (i) market participants that have not historically competed in the multichannel video business, (ii) traditional multichannel video distributors, and (iii) content providers that have historically licensed cable networks to multichannel video distributors, and providers of advertising over the Internet;
|
|
•
|
general business conditions, economic uncertainty or downturn, unemployment levels and the level of activity in the housing sector;
|
|
•
|
our ability to obtain programming at reasonable prices or to raise prices to offset, in whole or in part, the effects of higher programming costs (including retransmission consents);
|
|
•
|
our ability to develop and deploy new products and technologies including mobile products, our cloud-based user interface, Spectrum Guide
®
, and downloadable security for set-top boxes, and any other cloud-based consumer services and service platforms;
|
|
•
|
the effects of governmental regulation on our business including costs, disruptions and possible limitations on operating flexibility related to, and our ability to comply with, regulatory conditions applicable to us as a result of the Time Warner Cable Inc. and Bright House Networks, LLC Transactions;
|
|
•
|
any events that disrupt our networks, information systems or properties and impair our operating activities or our reputation;
|
|
•
|
the ability to retain and hire key personnel;
|
|
•
|
the availability and access, in general, of funds to meet our debt obligations prior to or when they become due and to fund our operations and necessary capital expenditures, either through (i) cash on hand, (ii) free cash flow, or (iii) access to the capital or credit markets; and
|
|
•
|
our ability to comply with all covenants in our indentures and credit facilities, any violation of which, if not cured in a timely manner, could trigger a default of our other obligations under cross-default provisions.
|
All forward-looking statements attributable to us or any person acting on our behalf are expressly qualified in their entirety by this cautionary statement. We are under no duty or obligation to update any of the forward-looking statements after the date of this annual report.
ii
Item 1.
Business.
Introduction
We are the second largest cable operator in the United States and a leading broadband communications services company providing video, Internet and voice services to approximately
27.2 million
residential and business customers at
December 31, 2017
. In addition, we sell video and online advertising inventory to local, regional and national advertising customers and fiber-delivered communications and managed information technology (“IT”) solutions to large enterprise customers. We also own and operate regional sports networks and local sports, news and community channels and sell security and home management services in the residential marketplace.
Our core strategy is to deliver high quality products at competitive prices, combined with outstanding service. This strategy, combined with simple, easy to understand pricing and packaging, is central to our goal of growing our customer base while also selling more services to each customer. We expect to execute this strategy by managing our operations in a consumer-friendly, efficient and cost-effective manner. Our operating strategy includes insourcing much of our customer care and field operations workforces, which results in higher quality service transactions. While an insourced operating model can increase field operations and customer care costs associated with each service transaction, the higher quality nature of insourced labor service transactions significantly reduces the volume of service transactions per customer, more than offsetting the higher investment made in each service transaction. As we reduce the number of service transactions and recurring costs per customer relationship, we effectively pass those savings on to our customers in the form of products and prices that we believe provide more value than what our competitors offer. The combination of offering competitively priced products and high quality service, allows us to increase the number of customers we serve over our fixed network and increase the number of products we sell to each customer, while at the same time reducing the number of service transactions per relationship, improving customer satisfaction and reducing churn, which results in lower costs to acquire and serve customers. We are also reducing our operating costs per customer relationship by providing customers with the ability to communicate with us through a variety of new forums that they may favor over telephonic communications. These forums include our customer website, mobile device applications, online chat and social media, which are less costly for us to provide than direct telephonic communications. Ultimately, our operating strategy enables us to offer high quality, competitively priced services profitably, while continuing to invest in new products and services.
Our principal executive offices are located at 400 Atlantic Street, Stamford, Connecticut 06901. Our telephone number is (203) 905-7800, and we have a website accessible at www.charter.com. Our Annual Reports on Form 10-K, Quarterly Reports on Form 10-Q and Current Reports on Form 8-K, and all amendments thereto, are available on our website free of charge as soon as reasonably practicable after they have been filed. The information posted on our website is not incorporated into this annual report.
The Transactions
On May 18, 2016, the transactions contemplated by the Agreement and Plan of Mergers dated as of May 23, 2015 (the “Merger Agreement”), by and among Time Warner Cable Inc. ("Legacy TWC"), Charter Communications, Inc. prior to the closing of the Merger Agreement (“Legacy Charter”), CCH I, LLC, previously a wholly owned subsidiary of Legacy Charter and certain other subsidiaries of CCH I, LLC were completed (the “TWC Transaction,” and together with the Bright House Transaction described below, the “Transactions”). As a result of the TWC Transaction, CCH I, LLC became the new public parent company that holds the operations of the combined companies and was renamed Charter Communications, Inc.
Also, on May 18, 2016, Legacy Charter and Advance/Newhouse Partnership (“A/N”), the former parent of Bright House Networks, LLC (“Legacy Bright House”), completed their previously announced transaction, pursuant to a definitive Contribution Agreement (the “Contribution Agreement”), under which Charter acquired Legacy Bright House (the “Bright House Transaction”). Pursuant to the Bright House Transaction, Charter became the owner of the membership interests in Legacy Bright House and the other assets primarily related to Legacy Bright House (other than certain excluded assets and liabilities and non-operating cash).
In connection with the TWC Transaction, Legacy Charter and Liberty Broadband completed their previously announced transactions pursuant to their investment agreement, in which Liberty Broadband purchased shares of Charter Class A common stock to partially finance the cash portion of the TWC Transaction consideration, and in connection with the Bright House Transaction, Liberty Broadband purchased shares of Charter Class A common stock (the "Liberty Transaction"). See Note 3 to the accompanying consolidated financial statements contained in “Part II. Item 8. Financial Statements and Supplementary Data,” for more information on the Transactions.
1
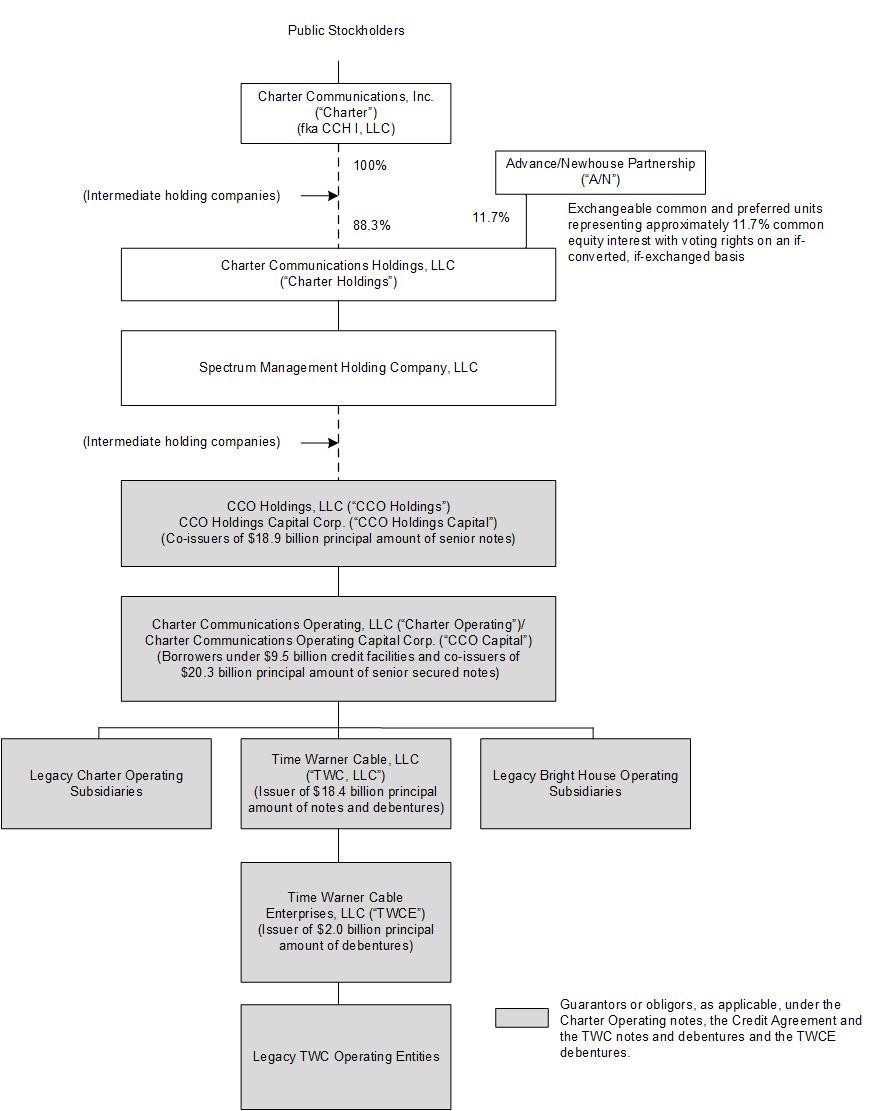
Corporate Entity Structure
The chart below sets forth our entity structure and that of our direct and indirect subsidiaries. The chart does not include all of our affiliates and subsidiaries and, in some cases, we have combined separate entities for presentation purposes. The equity ownership percentages shown below are approximations. Indebtedness amounts shown below are principal amounts as of
December 31, 2017
. See Note 9 to the accompanying consolidated financial statements contained in “Part II. Item 8. Financial Statements and Supplementary Data,” which also includes the accreted values of the indebtedness described below.
2
Products and Services
We offer our customers subscription-based video services, including video on demand (“VOD”), high definition (“HD”) television, and digital video recorder (“DVR”) service, Internet services and voice services. As of
December 31, 2017
,
74%
of our footprint was all-digital enabling us to offer more HD channels, faster Internet speeds and better video picture quality and we intend to transition the remaining portions of our Legacy TWC and Legacy Bright House footprints to all-digital. Our video, Internet, and voice services are offered to residential and commercial customers on a subscription basis, with prices and related charges based on the types of service selected, whether the services are sold as a “bundle” or on an individual basis, and the equipment necessary to receive our services. Bundled services are available to substantially all of our passings, and approximately
59%
of our customers subscribe to a bundle of services.
All customer statistics as of
December 31, 2017
include the operations of Legacy TWC, Legacy Bright House and Legacy Charter, each of which is based on individual legacy company reporting methodology. These methodologies differ and their differences may be material. Statistical reporting will be conformed over time to a single reporting methodology. The following table summarizes our customer statistics for video, Internet and voice as of
December 31, 2017
and
2016
(in thousands except per customer data and footnotes).
|
Approximate as of
|
|||||||
|
December 31,
|
|||||||
|
2017
(a)
|
2016
(a)(b)
|
||||||
|
Customer Relationships
(c)
|
|||||||
|
Residential
|
25,639
|
|
24,801
|
|
|||
|
Small and Medium Business
|
1,560
|
|
1,404
|
|
|||
|
Total Customer Relationships
|
27,199
|
|
26,205
|
|
|||
|
Residential Primary Service Units ("PSUs")
|
|||||||
|
Video
|
16,544
|
|
16,836
|
|
|||
|
Internet
|
22,545
|
|
21,374
|
|
|||
|
Voice
|
10,427
|
|
10,327
|
|
|||
|
49,516
|
|
48,537
|
|
||||
|
Monthly Residential Revenue per Residential Customer
(d)
|
$
|
109.75
|
|
$
|
109.57
|
|
|
|
Small and Medium Business PSUs
|
|||||||
|
Video
|
453
|
|
400
|
|
|||
|
Internet
|
1,358
|
|
1,219
|
|
|||
|
Voice
|
912
|
|
778
|
|
|||
|
2,723
|
|
2,397
|
|
||||
|
Monthly Small and Medium Business Revenue per Customer
(e)
|
$
|
207.36
|
|
$
|
213.87
|
|
|
|
Enterprise PSUs
(f)
|
114
|
|
97
|
|
|||
|
(a)
|
We calculate the aging of customer accounts based on the monthly billing cycle for each account. On that basis, as of
December 31, 2017
and
2016
, customers include approximately
245,800
and
208,400
customers, respectively, whose accounts were over 60 days past due, approximately
19,500
and
15,500
customers, respectively, whose accounts were over 90 days past due, and approximately
12,600
and
8,000
customers, respectively, whose accounts were over 120 days past due.
|
|
(b)
|
In the second quarter of 2017, we conformed the seasonal customer program in the Legacy Bright House footprint to our program. Prior to the plan change, Legacy Bright House customers enrolling in the seasonal plan were charged a one-time fee and counted as customer disconnects, and as new connects, when moving off the seasonal plan. Under our seasonal plan, residential customers pay a reduced monthly fee while the seasonal plan is active and remain reported as customers. Excluding the impact of customer activity related to Legacy Bright House's previous seasonal plan, residential customer relationships and video, Internet and voice PSUs at December 31, 2016 would have been higher by approximately 10,000, 8,000, 12,000 and 7,000 respectively.
|
|
(c)
|
Customer relationships include the number of customers that receive one or more levels of service, encompassing video, Internet and voice services, without regard to which service(s) such customers receive. Customers who reside in residential
|
3
multiple dwelling units (“MDUs”) and that are billed under bulk contracts are counted based on the number of billed units within each bulk MDU. Total customer relationships excludes enterprise customer relationships.
|
(d)
|
Monthly residential revenue per residential customer is calculated as total residential video, Internet and voice annual revenue divided by twelve divided by average residential customer relationships during the respective year.
|
|
(e)
|
Monthly small and medium business revenue per customer is calculated as total small and medium business annual revenue divided by twelve divided by average small and medium business customer relationships during the respective year.
|
|
(f)
|
Enterprise PSUs represent the aggregate number of fiber service offerings counting each separate service offering as an individual PSU.
|
Residential Services
Video Services
Our video customers receive a package of basic programming which, in our all-digital markets, generally includes a digital set-top box that provides an interactive electronic programming guide with parental controls, access to pay-per-view services, including VOD (available to nearly all of our passings), digital music channels and the option to view certain video services on third party devices. Customers have the option to purchase additional tiers of services including premium channels which provide original programming, commercial-free movies, sports, and other special event entertainment programming. Substantially all of our video programming is available in HD. We also offer certain video packages containing a limited number of channels via our cable television systems.
In the vast majority of our footprint, we offer VOD service which allows customers to select from approximately 35,000 titles at any time. VOD includes standard definition, HD and three dimensional (“3D”) content. VOD programming options may be accessed for free if the content is associated with a customer’s linear subscription, or for a fee on a transactional basis. VOD services are also offered on a subscription basis included in a digital tier premium channel subscription or for a monthly fee. Pay-per-view channels allow customers to pay on a per-event basis to view a single showing of a one-time special sporting event, music concert, or similar event on a commercial-free basis.
Our goal is to provide our video customers with the programming they want, when they want it, on any device. DVR service enables customers to digitally record programming and to pause and rewind live programming. Customers can also use our Spectrum TV application available on mobile devices, residential devices and on our website, to watch up to 250 channels of cable TV, view VOD programming, remotely control digital set-top boxes while in the home and to program DVRs remotely. Customers also have access to programmer authenticated applications and websites (known as TV Everywhere services) such as HBO Go
®
, Fox Now
®
, Discovery Go
®
and WatchESPN
®
.
In certain markets, we have launched Spectrum Guide
®
, a network or “cloud-based” user interface that can run on traditional set-top boxes, with a look and feel that is similar to that of the Spectrum TV App. Spectrum Guide
®
is designed to allow our customers to enjoy a state-of-the-art video experience on the majority of our set-top boxes, including accessing third-party video applications such as Netflix. The guide enables customers to find video content more easily across cable TV channels and VOD options. We plan to continue to deploy Spectrum Guide across our footprint and enhance this technology in 2018 and beyond.
Internet Services
In 2017, we completed our launch of Spectrum pricing and packaging (“SPP”) and now offer an entry level Internet download speed of at least 100 megabits per second (“Mbps”) across 99% of our footprint and 200 Mbps across 17% of our footprint, which among other things, allows several people within a single household to stream HD video content online while simultaneously using our Internet service for non-video purposes. Additionally, leveraging DOCSIS 3.1 technology, we had introduced speed offerings of 940 Mbps ("Spectrum Internet Gig") in 17% of our footprint as of December 31, 2017. Finally, we offer a security suite with our Internet services which, upon installation by customers, provides protection against computer viruses and spyware and includes parental control features.
We offer an in-home WiFi product that provides customers with high performance wireless routers to maximize their in-home wireless Internet experience. Additionally, we offer an out-of-home WiFi service (“Spectrum WiFi”) in most of our footprint to our Internet customers at designated “hot spots.” In 2018, we expect to continue to expand WiFi accessibility to our customers through our network of WiFi hotspots.
4
Voice Services
We provide voice communications services using voice over Internet protocol ("VoIP") technology to transmit digital voice signals over our network. Our voice services include unlimited local and long distance calling to the United States, Canada, Mexico and Puerto Rico, voicemail, call waiting, caller ID, call forwarding and other features and offers international calling either by the minute, or through packages of minutes per month. For customers that subscribe to both our voice and video offerings, caller ID on TV is also available in most areas.
Mobile Services
Our mobile strategy is built on the long-term vision of an integrated fixed/wireless network with differentiated products, and the ability to maximize the potential of our existing cable business. We intend to launch our Spectrum-branded mobile service in 2018 to residential customers via our mobile virtual network operator (“MVNO”) reseller agreement with Verizon Wireless. In the second phase, we plan to use our WiFi network in conjunction with additional unlicensed or licensed spectrum to improve network performance and expand capacity to offer consumers a superior wireless service. In furtherance of this second phase, we have experimental wireless licenses from the Federal Communications Commission ("FCC") that we are utilizing to test next generation wireless services in several markets around the country. We currently plan to only offer our Spectrum mobile service to residential customers subscribing to our Internet service. In the future, we may also offer mobile service to our small and medium business customers on similar terms. We believe Spectrum-branded mobile services will drive more sales of our core products, create longer customer lives and increase profitability and cash flow over time. As we launch our new mobile services, we expect an initial funding period to grow a new product as well as negative working capital impacts from the timing of device-related cash flows when we provide the handset or tablet to customers pursuant to equipment installment plans.
We are exploring working with a variety of partners and vendors in a number of operational areas within the wireless space, including: creating common operating platforms; technical standards development and harmonization; device forward and reverse logistics; and emerging wireless technology platforms. The efficiencies created are expected to provide more choice, innovative products and competitive prices for customers. We intend to consider and pursue opportunities in the mobile space which may include entering into joint ventures or partnerships with wireless or cable providers which may require significant investment. There is no assurance we will enter into such arrangements or that if we do, that they will be successful.
Commercial Services
We offer scalable broadband communications solutions for businesses and carrier organizations of all sizes, selling Internet access, data networking, fiber connectivity to cellular towers and office buildings, video entertainment services and business telephone services.
Small and Medium Business
Spectrum Business offers Internet, voice and video services to small and medium businesses over our hybrid fiber coaxial network that are similar to those that we provide to our residential customers. Spectrum Business includes a full range of video programming and entry-level Internet speeds of 100 Mbps downstream and 10 Mbps upstream. Additionally, customers can upgrade their Internet speeds to 200 or 300 Mbps downstream. Spectrum Business also includes a set of business services including web hosting, e-mail and security, and multi-line telephone services with more than 30 business features including web-based service management, that are generally not available to residential customers.
Enterprise Solutions
Spectrum Enterprise offers fiber-delivered communications and managed IT solutions to larger businesses, as well as high-capacity last-mile data connectivity services to wireless and wireline carriers, Internet Service Providers (“ISPs”) and other competitive carriers on a wholesale basis. Spectrum Enterprise's product portfolio includes fiber Internet access, voice trunking services, hosted voice, Ethernet services that privately and securely connect geographically dispersed client locations, and video solutions designed to meet the needs of hospitality, education, and health care clients. In addition, Spectrum Enterprise is beginning market field trials of an innovative Hybrid Software-Defined Wide Area Network, that enables businesses to leverage the performance of Ethernet, the ubiquity of Internet connectivity and the flexibility of a software-defined solution to solve a wide array of business communications and networking challenges. Our managed IT portfolio includes Cloud Infrastructure as a Service and Cloud Desktop as a Service, and managed hosting, application, and messaging solutions, along with other related IT and professional services. Our large serviceable footprint allows us to effectively serve business customers with multiple sites across given
5
geographic regions. These customers can benefit from obtaining advanced services from a single provider simplifying procurement and potentially reducing their costs.
Advertising Services
Our advertising sales division, Spectrum Reach
®
, offers local, regional and national businesses the opportunity to advertise in individual and multiple markets on cable television networks and digital outlets. We receive revenues from the sale of local advertising across various platforms for networks such as MTV
®
, CNN
®
and ESPN
®
. In any particular market, we typically insert local advertising on up to 60 channels. Our large footprint provides opportunities for advertising customers to address broader regional audiences from a single provider and thus reach more customers with a single transaction. Our size also provides scale to invest in new technology to create more targeted and addressable advertising capabilities.
Available advertising time is generally sold by our advertising sales force. In some markets, we have formed advertising interconnects or entered into representation agreements with other video distributors, including, among others, Verizon Communications Inc.’s (“Verizon”) fiber optic service (“FiOS”) and AT&T Inc.’s (“AT&T”) U-verse and DIRECTV platforms, under which we sell advertising on behalf of those operators. In other markets, we enter into representation agreements under which another operator in the area will sell advertising on our behalf. These arrangements enable us and our partners to deliver linear commercials across wider geographic areas, replicating the reach of local broadcast television stations to the extent possible. In addition, we enter into interconnect agreements from time to time with other cable operators, which, on behalf of a number of video operators, sells advertising time to national and regional advertisers in individual or multiple markets.
Additionally, we sell the advertising inventory of our owned and operated local sports, news and lifestyle channels, of our regional sports networks that carry Los Angeles Lakers’ basketball games and other sports programming and of SportsNet LA, a regional sports network that carries Los Angeles Dodgers’ baseball games and other sports programming.
We are in the process of deploying advanced advertising products such as our Audience App, which uses our proprietary set-top box viewership data (all anonymized and aggregated) to optimize linear inventory, and household addressability, which allows for more finite targeting, within various parts of our footprint. These new products will be distributed across more of our footprint in 2018.
Other Services
Regional Sports and News Networks
We have an agreement with the Los Angeles Lakers for rights to distribute all locally available Los Angeles Lakers’ games through 2033. We broadcast those games on our regional sports network, Spectrum SportsNet. We also manage 16 local news channels, including Spectrum News NY1, a 24-hour news channel focused on New York City, 10 local sports channels and one local lifestyle community channel, and we own
26.8%
of Sterling Entertainment Enterprises, LLC (doing business as SportsNet New York), a New York City-based regional sports network that carries New York Mets’ baseball games as well as other regional sports programming.
American Media Productions, LLC ("American Media Productions"), an unaffiliated third party, owns SportsNet LA, a regional sports network carrying the Los Angeles Dodgers’ baseball games and other sports programming. In accordance with agreements with American Media Productions, we act as the network’s exclusive affiliate and advertising sales representative and have certain branding and programming rights with respect to the network. In addition, we provide certain production and technical services to American Media Productions. The affiliate, advertising, production and programming agreements continue through 2038.
Security and Home Management
We provide security and home management services to our residential customers in certain markets. Our broadband cable system connects the customer’s in-home system to our emergency response center for traditional security, fire and medical emergency monitoring and dispatch. The service also allows customers to remotely arm or disarm their security system, monitor their home via indoor and outdoor cameras, and remotely operate key home functions, including setting and controlling lights, thermostats and door locks.
Pricing of Our Products and Services
Our revenues are principally derived from the monthly fees customers pay for the services we provide. We typically charge a one-time installation fee which is sometimes waived or discounted in certain sales channels during certain promotional periods.
6
Our SPP generally offers a standardized price for each tier of service, bundle of services, and add-on service, regardless of market and emphasizes triple play bundles of video, Internet and voice services. Our most popular and competitive services are combined in core packages at what we believe are attractive prices. We believe our approach:
|
•
|
offers simplicity for customers to understand our offers, and for our employees in service delivery;
|
|
•
|
drives our ability to package more services at the time of sale, thus increasing revenue per customer;
|
|
•
|
offers a higher quality and more value-based set of services, including faster Internet speeds, more HD channels, lower equipment fees and a more transparent pricing structure;
|
|
•
|
drives higher customer satisfaction, lower service calls and churn; and
|
|
•
|
allows for gradual price increases at the end of promotional periods.
|
Our Network Technology
and Customer Premise Equipment
Our network includes three key components: a national backbone, regional/metro networks and a “last-mile” network. Both our national backbone and regional/metro network components utilize a redundant Internet Protocol ("IP") ring/mesh architecture. The national backbone component provides connectivity from regional demarcation points to nationally centralized content, connectivity and services. The regional/metro network components provide connectivity between the regional demarcation points and headends within a specific geographic area and enable the delivery of content and services between these network components.
Our last-mile network utilizes a hybrid fiber coaxial cable (“HFC”) architecture, which combines the use of fiber optic cable with coaxial cable. In most systems, we deliver our signals via fiber optic cable from the headend to a group of nodes, and use coaxial cable to deliver the signal from individual nodes to the homes served by that node. For our fiber Internet, Ethernet, carrier wholesale, SIP and PRI Spectrum Enterprise customers, fiber optic cable is extended from individual nodes to the customer’s site. For certain new build and MDU sites, we increasingly bring fiber to the customer site. Our design standard is six strands of fiber to each node, with two strands activated and four strands reserved for spares and future services. This design standard allows these additional strands to be utilized for additional residential traffic capacity, and enterprise customer needs as they arise. We believe that this hybrid network design provides high capacity and signal quality. The design also provides two-way signal capabilities for the support of interactive services.
HFC architecture benefits include:
|
•
|
bandwidth capacity to enable traditional and two-way video and broadband services;
|
|
•
|
dedicated bandwidth for two-way services; and
|
|
•
|
signal quality and high service reliability.
|
Approximately
98%
of our estimated passings are served by systems that have bandwidth of 750 megahertz or greater as of
December 31, 2017
. This bandwidth capacity enables us to offer HD television, DOCSIS-based Internet services and voice services.
An all-digital platform enables us to offer a larger selection of HD channels, faster Internet speeds and better picture quality while providing greater plant security and enabling lower installation and disconnect service truck rolls. We are currently all-digital in
74%
of our footprint and intend to transition the remaining portions of our Legacy TWC and Legacy Bright House footprints.
We have been introducing our new set-top box, WorldBox, to consumers in certain markets. The WorldBox design has opened the set-top box market to new vendors and reduced our set-top box costs. WorldBox also includes more advanced features and functionality than older set-top boxes, including faster processing times, IP capabilities with increased speed, additional simultaneous recordings, increased DVR storage capacity, and a greater degree of flexibility for consumers to take Charter-provisioned set-top boxes with them, if and when, they move residences. We have also been introducing our new cloud-based user interface, Spectrum Guide
®
, to our video customers in certain markets. Spectrum Guide
®
improves video content search and discovery, and fully enables our on-demand offering. In addition, Spectrum Guide
®
can function on the majority of our set-top boxes, reducing costs and customer disruption to swap equipment for new functionality.
Management, Customer Operations and Marketing
Our operations are centralized, with senior executives located at several key corporate offices, responsible for coordinating and overseeing operations, including establishing company-wide strategies, policies and procedures. Sales and marketing, network operations, field operations, customer operations, engineering, advertising sales, human resources, legal, government relations, information technology and finance are all directed at the corporate level. Regional and local field operations are responsible for
7
customer premise service transactions and maintaining and constructing that portion of our network which is located outdoors. In 2018, our field operations group continues to focus on standardizing practices, processes, procedures and metrics.
We continue to focus on improving the customer experience through enhanced product offerings, reliability of services, and delivery of quality customer service. As part of our operating strategy, we are committed to investments and hiring plans that continue to insource most of our customer operations workload. In-house domestic call centers handled approximately 75% of our customer service calls and are managed centrally to ensure a consistent, high quality customer experience. Routing calls by particular call types to specific agents that only handle such call types, enables agents to become experts in addressing specific customer needs, thus creating a better customer experience. We also continue to migrate our call centers to full virtualization which allows calls to be routed across our call centers regardless of the location origin of the call, reducing call wait times, and saving costs. A new call center agent desktop interface tool, already used at Legacy Charter, is being developed for Legacy TWC and Legacy Bright House. This new desktop interface tool will enable virtualization of all call centers, regardless of legacy billing platform, and will better serve our customers.
We also provide customers with the opportunity to interact with us through a variety of forums in addition to telephonic communications, including through our customer website, mobile device applications, online chat and social media. Our customer websites and mobile applications enable customers to pay their bills, manage their accounts, order new services and utilize self-service help and support.
We sell our residential and commercial services using a national brand platform known as Spectrum®, Spectrum Business® and Spectrum Enterprise®. These brands reflect our comprehensive approach to industry-leading products, driven by speed, performance and innovation. Our marketing strategy emphasizes the sale of our bundled services through targeted direct response marketing programs to existing and potential customers, and increases awareness and the value of the Spectrum brand. Our marketing organization creates and executes marketing programs intended to grow customer relationships, increase the number of services we sell per relationship, retain existing customers and cross-sell additional products to current customers. We monitor the effectiveness of our marketing efforts, customer perception, competition, pricing, and service preferences, among other factors, in order to increase our responsiveness to our customers and to improve our sales and customer retention. The marketing organization manages the majority of the sales channels including direct sales, on-line, outbound telemarketing and stores.
Programming
We believe that offering a wide variety of video programming choices influences a customer’s decision to subscribe and retain our cable video services. We obtain basic and premium programming, usually pursuant to written contracts from a number of suppliers. Media corporation consolidation has, however, resulted in fewer suppliers and additional selling power on the part of programming suppliers. Our programming contracts are generally for a fixed period of time, usually for multiple years, and are subject to negotiated renewal. Recently, we have begun entering into agreements to co-produce original content which give us the right to provide our customers with certain exclusive content, for a period of time.
Programming is usually made available to us for a license fee, which is generally paid based on the number of customers to whom we make that programming available. Programming license fees may include “volume” discounts and financial incentives to support the launch of a channel and/or ongoing marketing support, as well as discounts for channel placement or service penetration. For home shopping channels, we typically receive a percentage of the revenue attributable to our customers’ purchases. We also offer VOD and pay per view channels of movies and events that are subject to a revenue split with the content provider.
Our programming costs have increased in excess of customary inflationary and cost-of-living type increases. We expect programming costs to continue to increase due to a variety of factors including, annual increases pursuant to our programming contracts, contract renewals with programmers and the carriage of incremental programming, including new services, higher expanded basic video penetration and VOD programming. Increases in the cost of sports programming and the amounts paid for broadcast station retransmission consent have been the largest contributors to the growth in our programming costs over the last few years. Additionally, the demands of large media companies who link carriage of their most popular networks to carriage and cost increases of their less popular networks, has limited our flexibility in creating more tailored and cost-sensitive programming packages for consumers.
Federal law allows commercial television broadcast stations to make an election between “must-carry” rights and an alternative “retransmission-consent” regime. When a station opts for retransmission-consent, we are not allowed to carry the station’s signal without that station’s permission. Continuing demands by owners of broadcast stations for cash payments at substantial increases over amounts paid in prior years in exchange for retransmission consent will increase our programming costs or require us to cease carriage of popular programming, potentially leading to a loss of customers in affected markets.
8
Over the past several years, increases in our video service rates have not fully offset the increases in our programming costs, and with the impact of increasing competition and other marketplace factors, we do not expect the increases in our video service rates to fully offset the increase in our programming costs for the foreseeable future. Although we pass along a portion of amounts paid for retransmission consent to the majority of our customers, our inability to fully pass programming cost increases on to our video customers has had, and is expected in the future to have, an adverse impact on our cash flow and operating margins associated with our video product.
In order to mitigate reductions of our operating margins due to rapidly increasing programming costs, we continue to review our pricing and programming packaging strategies.
We currently have programming contracts that have expired and others that will expire at, or before the end, of 2018. We will seek to renew these agreements on terms that we believe are favorable. There can be no assurance, however, that these agreements will be renewed on favorable or comparable terms. To the extent that we are unable to reach agreements with certain programmers on terms that we believe are reasonable, we have been, and may in the future be, forced to remove such programming channels from our line-up, which may result in a loss of customers.
Regions
We operate in geographically diverse areas which are organized in regional clusters. These regions are managed centrally on a consolidated level. Our eleven regions and the customer relationships within each region as of
December 31, 2017
are as follows (in thousands):
|
Regions
|
Total Customer Relationships
|
|
|
Carolinas
|
2,668
|
|
|
Central
|
2,870
|
|
|
Florida
|
2,389
|
|
|
Great Lakes
|
2,208
|
|
|
Northeast
|
2,970
|
|
|
Northwest
|
1,472
|
|
|
NYC
|
1,334
|
|
|
South
|
2,085
|
|
|
Southern Ohio
|
2,093
|
|
|
Texas
|
2,736
|
|
|
West
|
4,374
|
|
Competition
Residential Services
We face intense competition for residential customers, both from existing competitors and, as a result of the rapid development of new technologies, services and products, from new entrants.
Video competition
Our residential video service faces competition from direct broadcast satellite (“DBS”) service providers, which have a national footprint and compete in all of our operating areas. DBS providers offer satellite-delivered pre-packaged programming services that can be received by relatively small and inexpensive receiving dishes. DBS providers offer aggressive promotional pricing, exclusive programming (e.g., NFL Sunday Ticket) and video services that are comparable in many respects to our residential video service. Our residential video service also faces competition from companies with fiber-based networks, primarily AT&T U-verse, Frontier Communications Corporation (“Frontier”) FiOs and Verizon FiOs, which offer wireline video services in approximately 27%, 8% and 4%, respectively, of our operating areas. AT&T also owns DIRECTV, and as a combined company provides video service (via IP or satellite) and voice service (via IP or wireless) across our entire footprint, and delivers video, Internet, voice and mobile services across 45% of our passings. AT&T also announced the acquisition of Time Warner Inc. in October 2016 which is subject to regulatory approval. If approved, it is not yet clear how AT&T will use the various programming and studio assets it would acquire from Time Warner Inc. to benefit its own products on its four video platforms or what potential program access conditions, as part of any regulatory approval, might apply.
9
Our residential video service also faces growing competition from a number of other sources, including companies that deliver linear network programming, movies and television shows on demand and other video content over broadband Internet connections to televisions, computers, tablets and mobile devices. These newer categories of competitors include virtual multichannel video programming distributors (“V-MVPD”) such as DirecTV NOW, Sling TV, Playstation Vue, YouTube TV and Hulu Live, and direct to consumer products offered by programmers that have not traditionally sold programming directly to consumers, such as HBO Now, CBS All Access and Showtime Anytime. Other online video business models have also developed, including, (i) subscription video on demand (“SVOD”) services such as Netflix, Amazon Prime, and Hulu Plus, (ii) ad-supported free online video products, including YouTube and Hulu, some of which offer programming for free to consumers that we currently purchase for a fee, (iii) pay-per-view products, such as iTunes and Amazon Instant, and (iv) additional offerings from wireless providers which continue to integrate and bundle video services and mobile products. Historically, we have generally viewed SVOD online video services as complementary to our own video offering, and we have developed a cloud-based guide that is capable of incorporating video from many online video services currently offered in the marketplace. As the proliferation of online video services grows, however, services from V-MVPDs and new direct to consumer offerings, as well as piracy and password sharing, could negatively impact the growth of our video business.
Internet competition
Our residential Internet service faces competition from the phone companies’ DSL, fiber-to-the-home ("FTTH") and wireless broadband offerings, as well as from a variety of companies that offer other forms of online services, including wireless and satellite-based broadband services. AT&T, Frontier FiOs and Verizon’s FiOs are our primary FTTH competitors. Given the FTTH deployments of our competitors, launches of broadband services offering 1 gigabits per second (“Gbps”) speed have recently grown. Several competitors, including AT&T, Verizon's FiOs and Google, deliver 1 Gbps broadband speed in at least a portion of their footprints which overlap our footprint. DSL service is often offered at prices lower than our Internet services, although typically at speeds much lower than the minimum speeds we offer as part of SPP. Various wireless phone companies are now offering third and fourth generation (3G and 4G) wireless Internet services and some have announced that they intend to offer faster fifth generation (5G) services in the future. Some wireless phone companies offer unlimited data packages to customers. In addition, a growing number of commercial areas, such as retail malls, restaurants and airports, offer WiFi Internet service. Numerous local governments are also considering or actively pursuing publicly subsidized WiFi Internet access networks. These options offer alternatives to cable-based Internet access.
Voice competition
Our residential voice service competes with wireless and wireline phone providers, as well as other forms of communication, such as text messaging on cellular phones, instant messaging, social networking services, video conferencing and email. We also compete with “over-the-top” phone providers, such as Vonage, Skype, magicJack, Google Voice and Ooma, Inc., as well as companies that sell phone cards at a cost per minute for both national and international service. The increase in the number of different technologies capable of carrying voice services and the number of alternative communication options available to customers as well as the replacement of wireline services by wireless have intensified the competitive environment in which we operate our residential voice service. When launched, our mobile service will compete with other wireless providers such as Verizon, AT&T, T-Mobile US, Inc. ("T-Mobile") and Sprint Corporation ("Sprint").
Regional Competitors
In some of our operating areas, other competitors have built networks that offer video, Internet and voice services that compete with our services. For example, in certain markets, our residential video, Internet and voice services compete with Google Fiber, Cincinnati Bell Inc., Hawaiian Telcom, RCN Telecom Services, LLC, Grande Communications Networks, LLC and WideOpenWest Finance, LLC.
Additional competition
In addition to multi-channel video providers, cable systems compete with other sources of news, information and entertainment, including over-the-air television broadcast reception, live events, movie theaters and the Internet. Competition is also posed by fixed wireless and satellite master antenna television systems, or SMATV systems, serving MDUs, such as condominiums, apartment complexes, and private residential communities.
Business Services
We face intense competition across each of our business services product offerings. Our small and medium business video, Internet,
10
networking and voice services face competition from a variety of providers as described above. Our enterprise solutions also face competition from the competitors described above as well as other telecommunications carriers, such as metro and regional fiber-based carriers. We also compete with cloud, hosting and related service providers and application-service providers.
Advertising
We face intense competition for advertising revenue across many different platforms and from a wide range of local and national competitors. Advertising competition has increased and will likely continue to increase as new advertising avenues seek to attract the same advertisers. We compete for advertising revenue against, among others, local broadcast stations, national cable and broadcast networks, radio stations, print media and online advertising companies and content providers.
Security and Home Management
Our IntelligentHome service faces competition from traditional security companies, such as the ADT Corporation, service providers such as Verizon and AT&T, as well as new entrants, such as Vivint, Inc., Alarm.com, Inc. and NEST Labs, Inc.
Seasonality and Cyclicality
Our business is subject to seasonal and cyclical variations. Our results are impacted by the seasonal nature of customers receiving our cable services in college and vacation markets. Our revenue is subject to cyclical advertising patterns and changes in viewership levels. Our advertising revenue is generally higher in the second and fourth calendar quarters of each year, due in part to increases in consumer advertising in the spring and in the period leading up to and including the holiday season. U.S. advertising revenue is also cyclical, benefiting in even-numbered years from advertising related to candidates running for political office and issue-oriented advertising. Our capital expenditures and trade working capital are also subject to significant seasonality based on the timing of subscriber growth, network programs, specific projects and construction.
Regulation and Legislation
The following summary addresses the key regulatory and legislative developments affecting the cable industry and our services for both residential and commercial customers. Cable system operations are extensively regulated by the federal government (primarily the FCC), certain state governments, and many local governments. A failure to comply with these regulations could subject us to substantial penalties. Our business can be dramatically impacted by changes to the existing regulatory framework, whether triggered by legislative, administrative, or judicial rulings. Congress and the FCC have frequently revisited the subject of communications regulation and they are likely to do so again in the future. We could be materially disadvantaged in the future if we are subject to new regulations or regulatory actions that do not equally impact our key competitors. We cannot provide assurance that the already extensive regulation of our business will not be expanded in the future. In addition, we are already subject to Charter-specific conditions regarding certain business practices as a result of the FCC’s approval of the Transactions.
Video
Service
Must Carry/Retransmission Consent
There are two alternative legal methods for carriage of local broadcast television stations on cable systems. Federal “must carry” regulations require cable systems to carry local broadcast television stations upon the request of the local broadcaster. Alternatively, federal law includes “retransmission consent” regulations, by which popular commercial television stations can prohibit cable carriage unless the cable operator first negotiates for “retransmission consent,” which may be conditioned on significant payments or other concessions. Popular stations invoking “retransmission consent” have been demanding substantial compensation increases in their recent negotiations with cable operators, thereby significantly increasing our operating costs.
Additional government-mandated broadcast carriage obligations, including those related to the FCC’s newly adopted enhanced technical broadcasting option (Advanced Television Systems Committee 3.0), could disrupt existing programming commitments, interfere with our preferred use of limited channel capacity, and limit our ability to offer services that appeal to our customers and generate revenues.
Cable Equipment
In 1996, Congress enacted a statute requiring the FCC to adopt regulations designed to assure the development of an independent retail market for “navigation devices,” such as cable set-top boxes. As a result, the FCC required cable operators to make a separate offering of security modules (
i.e
., a “CableCARD”) that can be used with retail navigation devices. Some of the FCC’s rules
11
requiring support for CableCARDs were vacated by the United States Court of Appeals for the District of Columbia in 2013, and another of these rules was repealed by Congress in 2014, but the basic obligation to provide separable security for retail devices remains in place. In 2016, the FCC proposed to replace its CableCARD regime with burdensome new rules that would have required us to make disaggregated “information flows” available to set-top boxes and apps supplied by third parties. That proposal was not adopted, but various parties may continue to advocate alternative regulatory approaches to reduce consumer dependency on traditional operator provided set-top boxes. It remains uncertain whether the FCC or Congress will change the legal requirements related to our set-top boxes and what the impact of any such changes might be.
Privacy
and Information Security Regulation
The Communications Act of 1934, as amended (the “Communications Act”) limits our ability to collect, use, and disclose customers’ personally identifiable information for our video, voice, and Internet services, as well as provides requirements to safeguard such information. We are subject to additional federal, state, and local laws and regulations that impose additional restrictions on the collection, use and disclosure of consumer information. Further, the FCC, Federal Trade Commission ("FTC"), and many states regulate and restrict the marketing practices of communications service providers, including telemarketing and sending unsolicited commercial emails.
As a result of the FCC’s 2017 decision to reclassify broadband Internet access service as an “information service,” the FTC once again has the authority, pursuant to its authority to enforce against unfair or deceptive acts and practices, to protect the privacy of Internet service customers, including our use and disclosure of certain customer information. Although one court decision has raised questions regarding the extent of FTC jurisdiction over companies that offer both common carrier services as well as non-common carrier services, that decision has been stayed, pending review by the full Ninth Circuit Court of Appeals.
Our operations are also subject to federal and state laws governing information security. In the event of an information security breach, such rules may require consumer and government agency notification and may result in regulatory enforcement actions with the potential of monetary forfeitures. The FCC, the FTC and state attorneys general regularly bring enforcement actions against companies related to information security breaches and privacy violations.
Various security standards provide guidance to telecommunications companies in order to help identify and mitigate cybersecurity risk. One such standard is the voluntary framework released by the National Institute for Standards and Technologies (“NIST”) in February 2014, in cooperation with other federal agencies and owners and operators of U.S. critical infrastructure.The NIST cybersecurity framework provides a prioritized and flexible model for organizations to identify and manage cyber risks inherent to their business. It was designed to supplement, not supersede, existing cybersecurity regulations and requirements. Several government agencies have encouraged compliance with the NIST cybersecurity framework, including the FCC, which is also considering expansion of its cybersecurity guidelines or the adoption of cybersecurity requirements. NIST recently proposed draft updates to this voluntary framework and is expected to release final revisions in 2018.
After the repeal of the FCC’s 2016 privacy rules through the Congressional Review Act, many states and local authorities have considered legislative or other actions that would impose additional restrictions on our ability to collect, use and disclose certain information. Despite language in the FCC’s December 2017 decision reclassifying broadband Internet access service as an “information service,” that preempts state and local privacy regulations that conflict with federal policy, we expect these state and local efforts to regulate online privacy to continue in 2018. Additionally, several state legislatures are considering the adoption of new data security and cybersecurity legislation that could result in additional network and information security requirements for our business. There are also bills pending in both the U.S. House of Representatives and Senate that could impose new privacy and data security obligations. We cannot predict whether any of these efforts will be successful or preempted, or how new legislation and regulations, if any, would affect our business.
Pole Attachments
The Communications Act requires most utilities owning utility poles to provide cable systems with access to poles and conduits and simultaneously subjects the rates charged for this access to either federal or state regulation. In 2011 and again in 2015, the FCC amended its existing pole attachment rules to promote broadband deployment. The 2011 order allows for new penalties in certain cases involving unauthorized attachments, but generally strengthens the cable industry’s ability to access investor-owned utility poles on reasonable rates, terms, and conditions. Additionally, the 2011 order reduces the federal rate formula previously applicable to “telecommunications” attachments to closely approximate the rate formula applicable to “cable” attachments. The 2015 order continues the reconciliation of rates, effectively closing the remaining “loophole” that potentially allowed for significantly higher rates for telecommunications than for “cable” attachments in certain scenarios, and minimizing the rate consequences of any of our services if deemed “telecommunications” for pole attachment purposes. Utility pole owners have appealed the 2015 order. Neither the 2011 order nor the 2015 order directly affect the rate in states that self-regulate (rather than
12
allow the FCC to regulate pole rates), but many of those states have substantially the same rate for cable and telecommunications attachments.
Some municipalities have enacted “one-touch” make-ready pole attachment ordinances, which permit third parties to alter components of our network attached to utility poles in ways that could adversely affect our businesses. Some of these ordinances have been challenged with differing results. In 2017, the FCC initiated a rulemaking that considers amending its pole attachment rules to permit a “one-touch” make-ready-like process for the poles within its jurisdiction. If adopted, these rules could have a similar effect as the municipal one-touch make-ready ordinances and adversely affect our businesses.
Cable Rate Regulation
Federal law strictly limits the potential scope of cable rate regulation. Pursuant to federal law, all video offerings are universally exempt from rate regulation, except for a cable system’s minimum level of video programming service, referred to as “basic service,” and associated equipment. Rate regulation of basic service and associated equipment operates pursuant to a federal formula, with local governments, commonly referred to as local franchising authorities, primarily responsible for administering this regulation. The majority of our local franchising authorities have never certified to regulate basic service cable rates. In 2015, the FCC adopted an order (which was subsequently upheld on appeal) reversing its historic approach to rate regulation certifications and requiring a local franchise authority interested in regulating cable rates to first make an affirmative showing that there is no “effective competition” (as defined under federal law) in the community. Very few local franchise authorities have filed the necessary rate regulation certification, and the FCC’s 2015 order should make it more difficult for such entities to assert rate regulation in the future.
There have been calls to impose expanded rate regulation on the cable industry. Confronted with rapidly increasing cable programming costs, it is possible that Congress may adopt new constraints on the retail pricing or packaging of cable programming. Any such constraints could adversely affect our operations.
Ownership Restrictions
Federal regulation of the communications field traditionally included a host of ownership restrictions, which limited the size of certain media entities and restricted their ability to enter into competing enterprises. Through a series of legislative, regulatory, and judicial actions, most of these restrictions have been either eliminated or substantially relaxed. Changes in this regulatory area could alter the business environment in which we operate.
Access Channels
Local franchise agreements often require cable operators to set aside certain channels for public, educational, and governmental access programming. Federal law also requires cable systems to designate up to 15% of their channel capacity for commercial leased access by unaffiliated third parties, who may offer programming that our customers do not particularly desire. The FCC adopted revised rules in 2007 mandating a significant reduction in the rates that operators can charge commercial leased access users and imposing additional administrative requirements that would be burdensome on the cable industry. The effect of the FCC’s revised rules was stayed by a federal court, pending a cable industry appeal and an adverse finding by the Office of Management and Budget. Although commercial leased access activity historically has been relatively limited, increased activity in this area could further burden the channel capacity of our cable systems.
Other FCC Regulatory Matters
FCC regulations cover a variety of additional areas, including, among other things: (1) equal employment opportunity obligations; (2) customer service standards; (3) technical service standards; (4) mandatory blackouts of certain network and syndicated programming; (5) restrictions on political advertising; (6) restrictions on advertising in children’s programming; (7) licensing of systems and facilities; (8) maintenance of public files; (9) emergency alert systems; (10) inside wiring and exclusive contracts for MDU complexes; and (11) disability access, including new requirements governing video-description and closed-captioning. Each of these regulations restricts our business practices to varying degrees and may impose additional costs on our operations.
It is possible that Congress or the FCC will expand or modify its regulation of cable systems in the future, and we cannot predict at this time how that might impact our business.
Copyright
Cable systems are subject to a federal copyright compulsory license covering carriage of television and radio broadcast signals.
13
The copyright law provides copyright owners the right to audit our payments under the compulsory license, and we are currently subject to ongoing compulsory copyright audits. The possible modification or elimination of this compulsory copyright license is the subject of continuing legislative proposals and administrative review and could adversely affect our ability to obtain desired broadcast programming.
Copyright clearances for non-broadcast programming services are arranged through private negotiations. Cable operators also must obtain music rights for locally originated programming and advertising from the major music performing rights organizations. These licensing fees have been the source of litigation in the past, and we cannot predict with certainty whether license fee disputes may arise in the future.
Franchise Matters
Our cable systems generally are operated pursuant to nonexclusive franchises, permits, and similar authorizations granted by a municipality or other state or local government entity in order to utilize and cross public rights-of-way. Cable franchises generally are granted for fixed terms and in many cases include monetary penalties for noncompliance and may be terminable if the franchisee fails to comply with material provisions. The specific terms and conditions of cable franchises vary significantly between jurisdictions. Cable franchises generally contain provisions governing cable operations, franchise fees, system construction, maintenance, technical performance, customer service standards, supporting and carrying public access channels, and changes in the ownership of the franchisee. A number of states subject cable systems to the jurisdiction of centralized state government agencies, such as public utility commissions. Although local franchising authorities have considerable discretion in establishing franchise terms, certain federal protections benefit cable operators. For example, federal law caps local franchise fees.
Prior to the scheduled expiration of our franchises, we generally initiate renewal proceedings with the granting authorities. The Communications Act, which is the primary federal statute regulating interstate communications, provides for an orderly franchise renewal process in which granting authorities may not unreasonably withhold renewals. In connection with the franchise renewal process, however, many governmental authorities require the cable operator to make additional costly commitments. Historically, we have been able to renew our franchises without incurring significant costs, although any particular franchise may not be renewed on commercially favorable terms or otherwise. If we fail to obtain renewals of franchises representing a significant number of our customers, it could have a material adverse effect on our consolidated financial condition, results of operations, or our liquidity. Similarly, if a local franchising authority’s consent is required for the purchase or sale of a cable system, the local franchising authority may attempt to impose more burdensome requirements as a condition for providing its consent.
The traditional cable franchising regime has undergone significant change as a result of various federal and state actions. The FCC has adopted rules that streamline entry for new competitors (particularly those affiliated with telephone companies) and reduce certain franchising burdens for these new entrants. The FCC adopted more modest relief for existing cable operators.
At the same time, a substantial number of states have adopted new franchising laws. Again, these laws were principally designed to streamline entry for new competitors, and they often provide advantages for these new entrants that are not immediately available to existing cable operators. In many instances, these franchising regimes do not apply to established cable operators until the existing franchise expires or a competitor directly enters the franchise territory.
Internet Service
In 2015, the FCC determined that broadband Internet access services, such as those we offer, were a form of “telecommunications service” under the Communications Act and, on that basis, imposed rules banning service providers from blocking access to lawful content, restricting data rates for downloading lawful content, prohibiting the attachment of non-harmful devices, giving special transmission priority to affiliates, and offering third parties the ability to pay for priority routing. The 2015 rules also imposed a “transparency” requirement,
i.e.,
an obligation to disclose all material terms and conditions of our service to consumers.
In December 2017, the FCC adopted an order repudiating its treatment of broadband as a “telecommunications service,” reclassifying broadband as an “information service,” and eliminating the 2015 rules other than the transparency requirement, which it eased in significant ways. The FCC also ruled that state regulators may not impose obligations similar to federal obligations that the FCC removed. We expect that various parties will challenge the FCC’s December 2017 ruling in court, and, we cannot predict how any such court challenges will be resolved. Moreover, it is possible that the FCC might further revise its approach to broadband Internet access in the future, or that Congress might enact legislation affecting the rules applicable to the service.
The FCC’s December 2017 ruling does not affect other regulatory obligations on broadband Internet access providers. Notably, broadband providers are obliged by the Communications Assistance for Law Enforcement Act ("CALEA") to configure their networks in a manner that facilitates the ability of law enforcement, with proper legal authorization, to obtain information about
14
our customers, including the content of their Internet communications. The FCC and Congress also are considering subjecting Internet access services to the Universal Service funding requirements. These funding requirements could impose significant new costs on our Internet service. Also, the FCC and some state regulatory commissions direct certain subsidies to telephone companies deploying broadband to areas deemed to be “unserved” or “underserved.” We have opposed such subsidies when directed to areas that we serve. Despite our efforts, future subsidies may be directed to areas served by us, which could result in subsidized competitors operating in our service territories. State and local governmental organizations have also adopted Internet-related regulations. These various governmental jurisdictions are also considering additional regulations in these and other areas, such as privacy, pricing, service and product quality, imposition of local franchise fees on Internet-related revenue and taxation. The adoption of new Internet regulations or the adaptation of existing laws to the Internet could adversely affect our business.
Aside from the FCC’s generally applicable regulations, we have made certain commitments to comply with the FCC’s order in connection with the FCC’s approval of the TWC Transaction and the Bright House Transaction (discussed below).
Voice Service
The Telecommunications Act of 1996 created a more favorable regulatory environment for us to provide telecommunications and/or competitive voice services than had previously existed. In particular, it established requirements ensuring that competitive telephone companies could interconnect their networks with those providers of traditional telecommunications services to open the market to competition. The FCC has subsequently ruled that competitive telephone companies that support VoIP services, such as those we offer our customers, are entitled to interconnection with incumbent providers of traditional telecommunications services, which ensures that our VoIP services can compete in the market. Since that time, the FCC has initiated a proceeding to determine whether such interconnection rights should extend to traditional and competitive networks utilizing IP technology, and how to encourage the transition to IP networks throughout the industry. The FCC initiated a further proceeding in 2017 to consider whether additional changes to interconnection obligations are needed, including how and where companies interconnect their networks with the networks of other providers. New rules or obligations arising from these proceedings may affect our ability to compete in the provision of voice services.
The FCC has collected extensive data from providers of point to point transport (“special access”) services, such as us, and the FCC may use that data to evaluate whether the market for such services is competitive, or whether the market should be subject to further regulation, which may increase our costs or constrain our ability to compete in this market.
Further regulatory changes are being considered that could impact our voice business and that of our primary telecommunications competitors. The FCC and state regulatory authorities are considering, for example, whether certain common carrier regulations traditionally applied to incumbent local exchange carriers should be modified or reduced, and, in some jurisdictions, the extent to which common carrier requirements should be extended to VoIP providers. The FCC has already determined that certain providers of voice services using Internet Protocol technology must comply with requirements relating to 911 emergency services (“E911”), the CALEA (the statute governing law enforcement access to and surveillance of communications), Universal Service Fund contributions, customer privacy and Customer Proprietary Network Information issues, number portability, network outage reporting, rural call completion, disability access, regulatory fees, back-up power obligations, and discontinuance of service. In March 2007, a federal appeals court affirmed the FCC’s decision concerning federal regulation of certain VoIP services, but declined to specifically find that VoIP service provided by cable companies, such as we provide, should be regulated only at the federal level. As a result, some states have begun proceedings to subject cable VoIP services to state level regulation, and at least one state has asserted jurisdiction over our VoIP services. We prevailed on a legal challenge to that state’s assertion of jurisdiction. However, the state has appealed that ruling in a case which is now pending before a federal appellate court in Minnesota. Although we have registered with, or obtained certificates or authorizations from the FCC and the state regulatory authorities in those states in which we offer competitive voice services in order to ensure the continuity of our services and to maintain needed network interconnection arrangements, it is unclear whether and how these and other ongoing regulatory matters ultimately will be resolved.
Transaction-Related Commitments
In connection with approval of the Transactions, federal and state regulators imposed a number of post-merger conditions on us including but not limited to the following.
FCC Conditions
|
•
|
Offer settlement-free Internet interconnection to any party that meets the requirements of our Interconnection Policy (available on Charter’s website) on terms generally consistent with the policy for seven years (with a possible reduction to five);
|
|
•
|
Deploy and offer high-speed broadband Internet access service to an additional two million locations over five years;
|
15
|
•
|
Refrain from charging usage-based prices or imposing data caps on any fixed mass market broadband Internet access service plans for seven years (with a possible reduction to five);
|
|
•
|
Offer 30/4 Mbps discounted broadband where technically feasible to eligible customers throughout our service area for four years from the offer’s commencement; and
|
|
•
|
Continue to provide CableCARDs to any new or existing customer upon request for use in third-party retail devices for four years and continue to support such CableCARDs for seven years (in each case, unless the FCC changes the relevant rules).
|
The FCC conditions also contain a number of compliance reporting requirements.
DOJ Conditions
The Department of Justice (“DOJ”) Order prohibits us from entering into or enforcing any agreement with a video programmer that forbids, limits or creates incentives to limit the video programmer’s provision of content to online video distributors ("OVDs"). We will not be able to avail ourself of other distributors’ most favored nation (“MFN”) provisions if they are inconsistent with this prohibition. The DOJ’s conditions are effective for seven years, although we may petition the DOJ to eliminate the conditions after five years.
State Conditions
Certain state regulators, including California, New York, Hawaii and New Jersey also imposed conditions in connection with the approval of the Transactions. These conditions include requirements related to:
|
•
|
Upgrading networks within the designated state, including upgrades to broadband speeds and conversion of all households served within California and New York to an all-digital platform;
|
|
•
|
Building out our network to households and business locations that are not currently served by cable within the designated states;
|
|
•
|
Offering LifeLine service discounts and low-income broadband to eligible households served within the applicable states;
|
|
•
|
Investing in service improvement programs and customer service enhancements and maintaining customer-facing jobs within the designated state;
|
|
•
|
Continuing to make legacy service offerings available, including allowing Legacy TWC and Legacy Bright House customers to maintain their existing service offerings for a period of three years; and
|
|
•
|
Complying with reporting requirements.
|
Employees
As of
December 31, 2017
, we had approximately 94,800 active full-time equivalent employees.
Item 1A.
Risk Factors.
Risks Related to Our Business
If we are not able to successfully complete the integration of our business with that of Legacy TWC and Legacy Bright House, the anticipated benefits of the Transactions may not be fully realized or may take longer to realize than expected. In such circumstance, we may not perform as expected and the value of Charter's Class A common stock may be adversely affected.
There can be no assurances that we can successfully complete the integration of our business with that of Legacy TWC and Legacy Bright House. We now have significantly more systems, assets, investments, businesses, customers and employees than each company did prior to the Transactions. It is possible that the integration process could result in the loss of customers, the disruption of our ongoing businesses or in unexpected integration issues, higher than expected integration costs and an overall post-completion integration process that takes longer than originally anticipated. The process of integrating Legacy TWC and Legacy Bright House with the Legacy Charter operations requires significant capital expenditures and the expansion of certain operations and operating and financial systems. Management continues to devote a significant amount of time and attention to the integration process and there is a significant degree of difficulty and management involvement inherent in that process.
Even if the new businesses are successfully integrated, it may not be possible to realize the benefits that are expected to result from the Transactions, or realize these benefits within the time frame that is expected. For example, the benefits of our pricing and packaging and converting our video product to all-digital in certain Legacy TWC and Legacy Bright House systems may not be fully realized or may take longer than anticipated, or the benefits from the Transactions may be offset by costs incurred or
16
delays in integrating the businesses and increased operating costs. If the combined company fails to realize the anticipated benefits from the Transactions, our liquidity, results of operations, financial condition and/or share price may be adversely affected. In addition, at times, the attention of certain members of our management and resources may be focused on the integration of the businesses and diverted from day-to-day business operations, which may disrupt the business of the combined company.
We operate in a very competitive business environment, which affects our ability to attract and retain customers and can adversely affect our business, operations and financial results.
The industry in which we operate is highly competitive and has become more so in recent years. In some instances, we compete against companies with fewer regulatory burdens, better access to financing, greater personnel resources, greater resources for marketing, greater and more favorable brand name recognition, and long-established relationships with regulatory authorities and customers. Increasing consolidation in the cable industry and the repeal of certain ownership rules have provided additional benefits to certain of our competitors, either through access to financing, resources, or efficiencies of scale.
Our residential video service faces competition from a number of sources, including direct broadcast satellite services, as well as other companies that deliver movies, television shows and other video programming over broadband Internet connections to TVs, computers, tablets and mobile devices. Our residential Internet service faces competition from the phone companies’ DSL, FTTH and wireless broadband offerings as well as from a variety of companies that offer other forms of online services, including wireless and satellite-based broadband services. Our residential voice service and our planned mobile service competes with wireless and wireline phone providers, as well as other forms of communication, such as text messaging on cellular phones, instant messaging, social networking services, video conferencing and email. Competition from these companies, including intensive marketing efforts with aggressive pricing, exclusive programming and increased HD broadcasting may have an adverse impact on our ability to attract and retain customers.
Overbuilds could also adversely affect our growth, financial condition, and results of operations, by creating or increasing competition. We are aware of traditional overbuild situations impacting certain of our markets, however, we are unable to predict the extent to which additional overbuild situations may occur.
Our services may not allow us to compete effectively. Competition may reduce our expected growth of future cash flows which may contribute to future impairments of our franchises and goodwill and our ability to meet cash flow requirements, including debt service requirements. For additional information regarding the competition we face, see “Business -Competition” and “-Regulation and Legislation.”
We face risks relating to competition for the leisure time and discretionary spending of audiences, which has intensified in part due to advances in technology and changes in consumer expectations and behavior.
In addition to the various competitive factors discussed above, we are subject to risks relating to increasing competition for the leisure time, shifting consumer needs and discretionary spending of consumers. We compete with all other sources of entertainment, news and information delivery, as well as a broad range of communications products and services. Technological advancements, such as new video formats and Internet streaming and downloading of programming that can be viewed on televisions, computers, smartphones and tablets, many of which have been beneficial to us, have nonetheless increased the number of entertainment and information delivery choices available to consumers and intensified the challenges posed by audience fragmentation.
Newer products and services, particularly alternative methods for the distribution, sale and viewing of content will likely continue to be developed, further increasing the number of competitors that we face. The increasing number of choices available to audiences, including low-cost or free choices, could negatively impact not only consumer demand for our products and services, but also advertisers’ willingness to purchase advertising from us. We compete for the sale of advertising revenue with television networks and stations, as well as other advertising platforms, such as radio, print and, increasingly, online media. Our failure to effectively anticipate or adapt to new technologies and changes in consumer expectations and behavior could significantly adversely affect our competitive position and our business and results of operations.
Our exposure to the economic conditions of our current and potential customers, vendors and third parties could adversely affect our cash flow, results of operations and financial condition.
We are exposed to risks associated with the economic conditions of our current and potential customers, the potential financial instability of our customers and their financial ability to purchase our products. If there were a general economic downturn, we may experience increased cancellations by our customers or unfavorable changes in the mix of products purchased, including an increase in the number of homes that replace their video service with Internet-delivered and/or over-air content, which would negatively impact our ability to attract customers, increase rates and maintain or increase revenue. In addition, providing video
17
services is an established and highly penetrated business. Our ability to gain new video subscribers is dependent to a large extent on growth in occupied housing in our service areas, which is influenced by both national and local economic conditions. Weak economic conditions may also have a negative impact on our advertising revenue. These events have adversely affected us in the past, and may adversely affect our cash flow, results of operations and financial condition if a downturn were to occur.
In addition, we are susceptible to risks associated with the potential financial instability of the vendors and third parties on which we rely to provide products and services or to which we outsource certain functions. The same economic conditions that may affect our customers, as well as volatility and disruption in the capital and credit markets, also could adversely affect vendors and third parties and lead to significant increases in prices, reduction in output or the bankruptcy of our vendors or third parties upon which we rely. Any interruption in the services provided by our vendors or by third parties could adversely affect our cash flow, results of operation and financial condition.
We face risks inherent in our commercial business.
We may encounter unforeseen difficulties as we increase the scale of our service offerings to businesses. We sell Internet access, data networking and fiber connectivity to cellular towers and office buildings, and video and business voice services to businesses and have increased our focus on growing this business. In order to grow our commercial business, we expect to continue to invest in technology, equipment and personnel focused on the commercial business. Commercial business customers often require service level agreements and generally have heightened customer expectations for reliability of services. If our efforts to build the infrastructure to scale the commercial business are not successful, the growth of our commercial services business would be limited. We depend on interconnection and related services provided by certain third parties for the growth of our commercial business. As a result, our ability to implement changes as the services grow may be limited. If we are unable to meet these service level requirements or expectations, our commercial business could be adversely affected. Finally, we expect advances in communications technology, as well as changes in the marketplace and the regulatory and legislative environment. Consequently, we are unable to predict the effect that ongoing or future developments in these areas might have on our voice and commercial businesses and operations.
Programming costs are rising at a much faster rate than wages or inflation, and we may not have the ability to reduce or moderate the growth rates of, or pass on to our customers, our increasing programming costs, which would adversely affect our cash flow and operating margins.
Video programming has been, and is expected to continue to be, our largest operating expense item. In recent years, the cable industry has experienced a rapid escalation in the cost of programming. We expect programming costs to continue to increase due to a variety of factors including amounts paid for broadcast station retransmission consent, annual increases imposed by programmers, including sports programmers, and the carriage of incremental programming, including new services and VOD programming. The inability to fully pass programming cost increases on to our customers has had, and is expected in the future to have, an adverse impact on our cash flow and operating margins associated with the video product. We have programming contracts that have expired and others that will expire at or before the end of 2018. There can be no assurance that these agreements will be renewed on favorable or comparable terms. In addition, a number of programmers have begun to sell their services through alternative distribution channels, including IP-based platforms, which are less secure than our own video distribution platforms. There is growing evidence that these less secure video distribution platforms are leading to video product theft via password sharing among consumers. Password sharing may drive down the number of customers who pay for certain programming, putting programmer revenues at risk, and which in turn may cause certain programmers to seek even higher programming fees from us. To the extent that we are unable to reach agreement with certain programmers on terms that we believe are reasonable, we have been, and may be in the future, forced to remove such programming channels from our line-up, which may result in a loss of customers. Our failure to carry programming that is attractive to our customers could adversely impact our customer levels, operations and financial results. In addition, if our Internet customers are unable to access desirable content online because content providers block or limit access by our customers as a class, our ability to gain and retain customers, especially Internet customers, may be negatively impacted.
Increased demands by owners of some broadcast stations for carriage of other services or payments to those broadcasters for retransmission consent are likely to further increase our programming costs. Federal law allows commercial television broadcast stations to make an election between “must-carry” rights and an alternative “retransmission-consent” regime. When a station opts for the retransmission consent regime, we are not allowed to carry the station’s signal without that station’s permission. In some cases, we carry stations under short-term arrangements while we attempt to negotiate new long-term retransmission agreements. If negotiations with these programmers prove unsuccessful, they could require us to cease carrying their signals, possibly for an indefinite period. Any loss of stations could make our video service less attractive to customers, which could result in less subscription and advertising revenue. In retransmission-consent negotiations, broadcasters often condition consent with respect to one station on carriage of one or more other stations or programming services in which they or their affiliates have an interest.
18
Carriage of these other services, as well as increased fees for retransmission rights, may increase our programming expenses and diminish the amount of capacity we have available to introduce new services, which could have an adverse effect on our business and financial results.
Our inability to respond to technological developments and meet customer demand for new products and services could adversely affect our ability to compete effectively.
We operate in a highly competitive, consumer-driven and rapidly changing environment. From time to time, we may pursue strategic initiatives, including, for example, our mobile strategy. Our success is, to a large extent, dependent on our ability to acquire, develop, adopt, upgrade and exploit new and existing technologies to address consumers’ changing demands and distinguish our services from those of our competitors. We may not be able to accurately predict technological trends or the success of new products and services. If we choose technologies or equipment that are less effective, cost-efficient or attractive to customers than those chosen by our competitors, if we offer services that fail to appeal to consumers, are not available at competitive prices or that do not function as expected, or we are not able to fund the expenditures necessary to keep pace with technological developments, our competitive position could deteriorate, and our business and financial results could suffer.
The ability of some of our competitors to introduce new technologies, products and services more quickly than we do may adversely affect our competitive position. Furthermore, advances in technology, decreases in the cost of existing technologies or changes in competitors’ product and service offerings may require us in the future to make additional research and development expenditures or to offer at no additional charge or at a lower price certain products and services that we currently offer to customers separately or at a premium. In addition, the uncertainty of our ability, and the costs, to obtain intellectual property rights from third parties could impact our ability to respond to technological advances in a timely and effective manner.
Our inability to maintain and expand our upgraded systems and provide advanced services such as a state of the art user interface in a timely manner, or to anticipate the demands of the marketplace, could materially adversely affect our ability to attract and retain customers. In addition, as we launch our new mobile services using virtual network operator rights from a third party, we expect an initial funding period to grow a new product as well as negative working capital impacts from the timing of device-related cash flows when we provide the handset or tablet pursuant to equipment installation plans. Consequently, our growth, financial condition and results of operations could suffer materially.
We depend on third party service providers, suppliers and licensors; thus, if we are unable to procure the necessary services, equipment, software or licenses on reasonable terms and on a timely basis, our ability to offer services could be impaired, and our growth, operations, business, financial results and financial condition could be materially adversely affected.
We depend on a limited number of third party service providers, suppliers and licensors to supply some of the services, hardware, software and operational support necessary to provide some of our services. Some of our hardware, software and operational support vendors, and service providers represent our sole source of supply or have, either through contract or as a result of intellectual property rights, a position of some exclusivity. If any of these parties breaches or terminates its agreement with us or otherwise fails to perform its obligations in a timely manner, demand exceeds these vendors’ capacity, they experience operating or financial difficulties, they significantly increase the amount we pay for necessary products or services, or they cease production of any necessary product due to lack of demand, profitability or a change in ownership or are otherwise unable to provide the equipment or services we need in a timely manner, at our specifications and at reasonable prices, our ability to provide some services might be materially adversely affected, or the need to procure or develop alternative sources of the affected materials or services might delay our ability to serve our customers. In addition, the existence of only a limited number of vendors of key technologies can lead to less product innovation and higher costs. These events could materially and adversely affect our ability to retain and attract customers and our operations, business, financial results and financial condition.
Our cable systems have historically been restricted to using one of two proprietary conditional access security systems, which we believe has limited the number of manufacturers producing set-top boxes for such systems. As an alternative, we developed a new conditional access security system which can be downloaded into set-top boxes with features we specify that could be provided by a variety of manufacturers. We refer to our specified set-top box as our Worldbox. Additionally, we are developing technology to allow our two current proprietary conditional access security systems to be software downloadable into our Worldbox. In order to realize the broadest benefits of our Worldbox technology, we must now complete the support for the downloadable proprietary conditional access security systems within the Worldbox. We cannot provide assurances that this implementation will ultimately be successful or completed in the expected timeframe or at the expected budget.
19
Our business may be adversely affected if we cannot continue to license or enforce the intellectual property rights on which our business depends.
We rely on patent, copyright, trademark and trade secret laws and licenses and other agreements with our employees, customers, suppliers and other parties to establish and maintain our intellectual property rights in technology and the products and services used in our operations. Also, because of the rapid pace of technological change, we both develop our own technologies, products and services and rely on technologies developed or licensed by third parties. However, any of our intellectual property rights could be challenged or invalidated, or such intellectual property rights may not be sufficient to permit us to take advantage of current industry trends or otherwise to provide competitive advantages, which could result in costly redesign efforts, discontinuance of certain product or service offerings or other competitive harm. We may not be able to obtain or continue to obtain licenses from these third parties on reasonable terms, if at all. In addition, claims of intellectual property infringement could require us to enter into royalty or licensing agreements on unfavorable terms, incur substantial monetary liability or be enjoined preliminarily or permanently from further use of the intellectual property in question, which could require us to change our business practices or offerings and limit our ability to compete effectively. Even unsuccessful claims can be time-consuming and costly to defend and may divert management’s attention and resources away from our business. In recent years, the number of intellectual property infringement claims has been increasing in the communications and entertainment industries, and, with increasing frequency, we are party to litigation alleging that certain of our services or technologies infringe the intellectual property rights of others.
Various events could disrupt our networks, information systems or properties and could impair our operating activities and negatively impact our reputation and financial results.
Network and information systems technologies are critical to our operating activities, both for our internal uses, such as network management and supplying services to our customers, including customer service operations and programming delivery. Network or information system shutdowns or other service disruptions caused by events such as computer hacking, dissemination of computer viruses, worms and other destructive or disruptive software, “cyber attacks,” process breakdowns, denial of service attacks and other malicious activity pose increasing risks. Both unsuccessful and successful “cyber attacks” on companies have continued to increase in frequency, scope and potential harm in recent years. While we develop and maintain systems seeking to prevent systems-related events and security breaches from occurring, the development and maintenance of these systems is costly and requires ongoing monitoring and updating as techniques used in such attacks become more sophisticated and change frequently. We, and the third parties on which we rely, may be unable to anticipate these techniques or implement adequate preventive measures. While from time to time attempts have been made to access our network, these attempts have not as yet resulted in any material release of information, degradation or disruption to our network and information systems.
Our network and information systems are also vulnerable to damage or interruption from power outages, telecommunications failures, accidents, natural disasters (including extreme weather arising from short-term or any long-term changes in weather patterns), terrorist attacks and similar events. Further, the impacts associated with extreme weather or long-term changes in weather patterns, such as rising sea levels or increased and intensified storm activity, may cause increased business interruptions or may require the relocation of some of our facilities. Our system redundancy may be ineffective or inadequate, and our disaster recovery planning may not be sufficient for all eventualities.
Any of these events, if directed at, or experienced by, us or technologies upon which we depend, could have adverse consequences on our network, our customers and our business, including degradation of service, service disruption, excessive call volume to call centers, and damage to our or our customers’ equipment and data. Large expenditures may be necessary to repair or replace damaged property, networks or information systems or to protect them from similar events in the future. Moreover, the amount and scope of insurance that we maintain against losses resulting from any such events or security breaches may not be sufficient to cover our losses or otherwise adequately compensate us for any disruptions to our business that may result. Any such significant service disruption could result in damage to our reputation and credibility, customer dissatisfaction and ultimately a loss of customers or revenue. Any significant loss of customers or revenue, or significant increase in costs of serving those customers, could adversely affect our growth, financial condition and results of operations.
Furthermore, our operating activities could be subject to risks caused by misappropriation, misuse, leakage, falsification or accidental release or loss of information maintained in our information technology systems and networks and those of our third-party vendors, including customer, personnel and vendor data. We provide certain confidential, proprietary and personal information to third parties in connection with our business, and there is a risk that this information may be compromised.
As a result of the increasing awareness concerning the importance of safeguarding personal information, the potential misuse of such information and legislation that has been adopted or is being considered regarding the protection, privacy and security of personal information, information-related risks are increasing, particularly for businesses like ours that process, store and transmit large amount of data, including personal information for our customers. We could be exposed to significant costs if such risks
20
were to materialize, and such events could damage our reputation, credibility and business and have a negative impact on our revenue. We could be subject to regulatory actions and claims made by consumers in private litigations involving privacy issues related to consumer data collection and use practices. We also could be required to expend significant capital and other resources to remedy any such security breach.
The risk described above may be increased during the period in which we are integrating our people, processes and systems as a result of the Transactions.
For tax purposes, Charter could experience a deemed ownership change in the future that could limit its ability to use its tax loss carryforwards.
Charter had approximately
$10.9 billion
of federal tax net operating loss carryforwards resulting in a gross deferred tax asset of approximately
$2.3 billion
as of
December 31, 2017
. These losses resulted from the operations of Charter Communications Holdings Company, LLC ("Charter Holdco") and its subsidiaries and from loss carryforwards received as a result of the TWC Transaction. Federal tax net operating loss carryforwards expire in the years 2018 through 2035. In addition, Charter had state tax net operating loss carryforwards resulting in a gross deferred tax asset (net of federal tax benefit) of approximately
$359 million
as of
December 31, 2017
. State tax net operating loss carryforwards generally expire in the years 2018 through 2037.
In the past, Charter has experienced ownership changes as defined in Section 382 of the Internal Revenue Code of 1986, as amended (the “Code”). In general, an ownership change occurs whenever the percentage of the stock of a corporation owned, directly or indirectly, by 5-percent stockholders (within the meaning of Section 382 of the Code) increases by more than 50 percentage points over the lowest percentage of the stock of such corporation owned, directly or indirectly, by such 5-percent stockholders at any time over the preceding three years. As a result, Charter is subject to an annual limitation on the use of its loss carryforwards which existed at November 30, 2009 for the first ownership change, those that existed at May 1, 2013 for the second ownership change, and those created at May 18, 2016 for the third ownership change. The limitation on Charter's ability to use its loss carryforwards, in conjunction with the loss carryforward expiration provisions, could reduce Charter's ability to use a portion of its loss carryforwards to offset future taxable income, which could result in Charter being required to make material cash tax payments. Charter's ability to make such income tax payments, if any, will depend at such time on its liquidity or its ability to raise additional capital, and/or on receipt of payments or distributions from Charter Holdco and its subsidiaries.
If Charter were to experience additional ownership changes in the future (as a result of purchases and sales of stock by its 5-percent stockholders, new issuances or redemptions of our stock, certain acquisitions of its stock and issuances, redemptions, sales or other dispositions or acquisitions of interests in its 5-percent stockholders), Charter's ability to use its loss carryforwards could become subject to further limitations.
If Legacy
TWC’s Separation Transactions (as defined below), including the Distribution (as defined below), do not qualify as tax-free, either as a result of actions taken or not taken by Legacy TWC or as a result of the failure of certain representations by Legacy TWC to be true, Legacy TWC has agreed to indemnify Time Warner Inc. for its taxes resulting from such disqualification, which would be significant.
As part of Legacy TWC’s separation from Time Warner Inc. (“Time Warner”) in March 2009 (the “Separation”), Time Warner received a private letter ruling from the Internal Revenue Service ("IRS") and Time Warner and Legacy TWC received opinions of tax counsel confirming that the transactions undertaken in connection with the Separation, including the transfer by a subsidiary of Time Warner of its 12.43% non-voting common stock interest in TW NY to Legacy TWC in exchange for 80 million newly issued shares of Legacy TWC’s Class A common stock, Legacy TWC’s payment of a special cash dividend to holders of Legacy TWC’s outstanding Class A and Class B common stock, the conversion of each share of Legacy TWC’s outstanding Class A and Class B common stock into one share of Legacy TWC common stock, and the pro-rata dividend of all shares of Legacy TWC common stock held by Time Warner to holders of record of Time Warner’s common stock (the “Distribution” and, together with all of the transactions, the “Separation Transactions”), should generally qualify as tax-free to Time Warner and its stockholders for U.S. federal income tax purposes. The ruling and opinions rely on certain facts, assumptions, representations and undertakings from Time Warner and Legacy TWC regarding the past and future conduct of the companies’ businesses and other matters. If any of these facts, assumptions, representations or undertakings are incorrect or not otherwise satisfied, Time Warner and its stockholders may not be able to rely on the ruling or the opinions and could be subject to significant tax liabilities. Notwithstanding the private letter ruling and opinions, the IRS could determine on audit that the Separation Transactions should be treated as taxable transactions if it determines that any of these facts, assumptions, representations or undertakings are not correct or have been violated, or for other reasons, including as a result of significant changes in the stock ownership of Time Warner or Legacy TWC after the Distribution.
21
Under the tax sharing agreement among Time Warner and Legacy TWC, Legacy TWC generally would be required to indemnify Time Warner against its taxes resulting from the failure of any of the Separation Transactions to qualify as tax-free as a result of (i) certain actions or failures to act by Legacy TWC or (ii) the failure of certain representations made by Legacy TWC to be true. In addition, even if Legacy TWC bears no contractual responsibility for taxes related to a failure of the Separation Transactions to qualify for their intended tax treatment, Treasury regulation section 1.1502-6 imposes on Legacy TWC several liability for all Time Warner federal income tax obligations relating to the period during which Legacy TWC was a member of the Time Warner federal consolidated tax group, including the date of the Separation Transactions. Similar provisions may apply under foreign, state or local law. Absent Legacy TWC causing the Separation Transactions to not qualify as tax-free, Time Warner has indemnified Legacy TWC against such several liability arising from a failure of the Separation Transactions to qualify for their intended tax treatment.
If we are unable to retain key employees, our ability to manage our business could be adversely affected.
Our operational results have depended, and our future results will depend, upon the retention and continued performance of our management team. Our ability to retain and hire new key employees for management positions could be impacted adversely by the competitive environment for management talent in the broadband communications industry. The loss of the services of key members of management and the inability or delay in hiring new key employees could adversely affect our ability to manage our business and our future operational and financial results.
Risks Related to Our Indebtedness
We have a significant amount of debt and may incur significant additional debt, including secured debt, in the future, which could adversely affect our financial health and our ability to react to changes in our business.
We have a significant amount of debt and may (subject to applicable restrictions in our debt instruments) incur additional debt in the future. As of
December 31, 2017
, our total principal amount of debt was approximately
$69.0 billion
.
Our significant amount of debt could have consequences, such as:
|
•
|
impact our ability to raise additional capital at reasonable rates, or at all;
|
|
•
|
make us vulnerable to interest rate increases, in part because approximately
14%
of our borrowings as of
December 31, 2017
were, and may continue to be, subject to variable rates of interest;
|
|
•
|
expose us to increased interest expense to the extent we refinance existing debt with higher cost debt;
|
|
•
|
require us to dedicate a significant portion of our cash flow from operating activities to make payments on our debt, reducing our funds available for working capital, capital expenditures, and other general corporate expenses;
|
|
•
|
limit our flexibility in planning for, or reacting to, changes in our business, the cable and telecommunications industries, and the economy at large;
|
|
•
|
place us at a disadvantage compared to our competitors that have proportionately less debt; and
|
|
•
|
adversely affect our relationship with customers and suppliers.
|
If current debt amounts increase, our business results are lower than expected, or credit rating agencies downgrade our debt limiting our access to investment grade markets, the related risks that we now face will intensify.
The agreements and instruments governing our debt contain restrictions and limitations that could significantly affect our ability to operate our business, as well as significantly affect our liquidity.
Our credit facilities and the indentures governing our debt contain a number of significant covenants that could adversely affect our ability to operate our business, our liquidity, and our results of operations. These covenants restrict, among other things, our and our subsidiaries’ ability to:
|
•
|
incur additional debt;
|
|
•
|
repurchase or redeem equity interests and debt;
|
|
•
|
issue equity;
|
|
•
|
make certain investments or acquisitions;
|
|
•
|
pay dividends or make other distributions;
|
|
•
|
dispose of assets or merge;
|
|
•
|
enter into related party transactions; and
|
|
•
|
grant liens and pledge assets.
|
22
Additionally, the Charter Operating credit facilities require Charter Operating to comply with a maximum total leverage covenant and a maximum first lien leverage covenant. The breach of any covenants or obligations in our indentures or credit facilities, not otherwise waived or amended, could result in a default under the applicable debt obligations and could trigger acceleration of those obligations, which in turn could trigger cross defaults under other agreements governing our long-term indebtedness. In addition, the secured lenders under our notes and the Charter Operating credit facilities could foreclose on their collateral, which includes equity interests in our subsidiaries, and exercise other rights of secured creditors.
Risks Related to Ownership Position of Liberty Broadband Corporation and Advance/Newhouse Partnership
Liberty Broadband and A/N have governance rights that give them influence over corporate transactions and other matters.
Liberty Broadband currently owns a significant amount of Charter Class A common stock and is entitled to certain governance rights with respect to Charter. A/N currently owns Charter Class A common stock and a significant amount of membership interests in our subsidiary Charter Holdings that are convertible into Charter Class A common stock and is entitled to certain governance rights with respect to Charter. Members of the Charter board of directors include directors who are also officers and directors of Liberty Broadband and directors who are current or former officers and directors of A/N. Dr. John Malone is the Chairman of Liberty Broadband, and Mr. Greg Maffei is the president and chief executive officer of Liberty Broadband. Steven Miron is the Chief Executive Officer of A/N and Michael Newhouse is an officer or director of several of A/N’s affiliates. As of
December 31, 2017
, Liberty Broadband beneficially held approximately approximately 21% of Charter’s Class A common stock (including shares owned by Liberty Interactive over which Liberty Broadband holds an irrevocable voting proxy) and A/N beneficially held approximately approximately 13% of Charter’s Class A common stock, in each case assuming the conversion of the membership interests held by A/N. Pursuant to the stockholders agreement between Liberty Broadband, A/N and Charter, Liberty Broadband currently has the right to designate up to three directors as nominees for Charter’s board of directors and A/N currently has the right to designate up to two directors as nominees for Charter’s board of directors with one designated director to be appointed to each of the audit committee, the nominating and corporate governance committee, the compensation and benefits committee and the Finance Committee, in each case provided that each maintains certain specified voting or equity ownership thresholds and each nominee meets certain applicable requirements or qualifications.
In connection with the TWC Transaction, Liberty Broadband and Liberty Interactive entered into a proxy and right of first refusal agreement, pursuant to which Liberty Interactive granted Liberty Broadband an irrevocable proxy to vote all Charter Class A common stock owned beneficially or of record by Liberty Interactive, with certain exceptions. In addition, at the closing of the Bright House Transaction, A/N and Liberty Broadband entered into a proxy agreement pursuant to which A/N granted to Liberty Broadband a 5-year irrevocable proxy (which we refer to as the “A/N proxy”) to vote, subject to certain exceptions, that number of shares of Charter Class A common stock and Charter Class B common stock, in each case held by A/N (such shares are referred to as the “proxy shares”), that will result in Liberty Broadband having voting power in Charter equal to 25.01% of the outstanding voting power of Charter, provided, that the voting power of the proxy shares is capped at 7.0% of the outstanding voting power of Charter. Therefore, giving effect to the Liberty Interactive proxy and the A/N proxy and the voting cap contained in the stockholders agreement, Liberty Broadband has 25.01% of the outstanding voting power in Charter. The stockholders agreement and Charter’s amended and restated certificate of incorporation fixes the size of the board at 13 directors. Liberty Broadband and A/N are required to vote (subject to the applicable voting cap) their respective shares of Charter Class A common stock and Charter Class B common stock for the director nominees nominated by the nominating and corporate governance committee of the board of directors, including the respective designees of Liberty Broadband and A/N, and against any other nominees, except that, with respect to the unaffiliated directors, Liberty Broadband and A/N must instead vote in the same proportion as the voting securities are voted by stockholders other than A/N and Liberty Broadband or any group which includes any of them are voted, if doing so would cause a different outcome with respect to the unaffiliated directors. As a result of their rights under the stockholders agreement and their significant equity and voting stakes in Charter, Liberty Broadband and/or A/N, who may have interests different from those of other stockholders, will be able to exercise substantial influence over certain matters relating to the governance of Charter, including the approval of significant corporate actions, such as mergers and other business combination transactions.
23
The stockholders agreement provides A/N and Liberty Broadband with preemptive rights with respect to issuances of Charter equity in connection with certain transactions, and in the event that A/N or Liberty Broadband exercises these rights, holders of Charter Class A common stock may experience further dilution.
The stockholders agreement provides that A/N and Liberty Broadband will have certain contractual preemptive rights over issuances of Charter equity securities in connection with capital raising transactions, merger and acquisition transactions, and in certain other circumstances. Holders of Charter Class A common stock will not be entitled to similar preemptive rights with respect to such transactions. As a result, if Liberty Broadband and/or A/N elect to exercise their preemptive rights, (i) these parties would not experience the dilution experienced by the other holders of Charter Class A common stock, and (ii) such other holders of Charter Class A common stock may experience further dilution of their interest in Charter upon such exercise.
Risks Related to Regulatory and Legislative Matters
Our business is subject to extensive governmental legislation and regulation, which could adversely affect our business.
Regulation of the cable industry has increased cable operators’ operational and administrative expenses and limited their revenues. Cable operators are subject to various laws and regulations including those covering the following:
|
•
|
the provision of high-speed Internet service, including transparency rules;
|
|
•
|
the provision of voice communications;
|
|
•
|
cable franchise renewals and transfers;
|
|
•
|
the provisioning and marketing of cable equipment and compatibility with new digital technologies;
|
|
•
|
customer and employee privacy and data security;
|
|
•
|
limited rate regulation of video service;
|
|
•
|
copyright royalties for retransmitting broadcast signals;
|
|
•
|
when a cable system must carry a particular broadcast station and when it must first obtain retransmission consent to carry a broadcast station;
|
|
•
|
the provision of channel capacity to unaffiliated commercial leased access programmers;
|
|
•
|
limitations on our ability to enter into exclusive agreements with multiple dwelling unit complexes and control our inside wiring;
|
|
•
|
equal employment opportunity, emergency alert systems, disability access, technical standards, marketing practices, customer service, and consumer protection; and
|
|
•
|
approval for mergers and acquisitions often accompanied by the imposition of restrictions and requirements on an applicant’s business in order to secure approval of the proposed transaction.
|
Legislators and regulators at all levels of government frequently consider changing, and sometimes do change, existing statutes, rules, regulations, or interpretations thereof, or prescribe new ones. Any future legislative, judicial, regulatory or administrative actions may increase our costs or impose additional restrictions on our businesses.
As a result of the closing of the Transactions, our businesses are subject to the conditions set forth in the FCC Order and the DOJ Consent Decree and those imposed by state utility commissions and local franchise authorities, and there can be no assurance that these conditions will not have an adverse effect on our businesses and results of operations.
In connection with the Transactions, the FCC Order, the DOJ Consent Decree, and the approvals from state utility commissions and local franchise authorities incorporated numerous commitments and voluntary conditions made by the parties and imposed numerous conditions on our businesses relating to the operation of our business and other matters. Among other things, (i) we are not permitted to charge usage-based prices or impose data caps and are prohibited from charging interconnection fees for qualifying parties; (ii) we are prohibited from entering into or enforcing any agreement with a programmer that forbids, limits or creates incentives to limit the programmer’s provision of content to OVD and cannot retaliate against programmers for licensing to OVDs; (iii) we are not able to avail ourself of other distributors’ MFN provisions if they are inconsistent with this prohibition; (iv) we must undertake a number of actions designed to promote diversity; (v) we appointed an independent compliance monitor and comply with a broad array of reporting requirements; and (vi) we must satisfy various other conditions relating to our Internet services, including building out an additional two million locations with access to a high-speed connection of at least 60 megabits per second, and implementing a reduced price high-speed Internet program for low income families. These and other conditions and commitments relating to the Transactions are of varying duration, ranging from three to seven years. In light of the breadth and duration of the conditions and potential changes in market conditions during the time the conditions and commitments are in effect, there can be no assurance that our compliance, and ability to comply, with the conditions will not have a material adverse effect on our business or results of operations.
24
Changes to existing statutes, rules, regulations, or interpretations thereof, or adoption of new ones, could have an adverse effect on our business.
There are ongoing efforts to amend or expand the federal, state, and local regulation of some of the services offered over our cable systems, which may compound the regulatory risks we already face. For example, with respect to our retail broadband Internet access service, the FCC has reclassified the service twice in the last few years, with the first change adding regulatory obligations and the second change largely removing those new regulatory obligations. These changes reflect a lack of regulatory certainty in this business area, which may continue as a result of litigation, as well as future legislative or administrative changes.
Other potential legislative and regulatory changes could adversely impact our business by increasing our costs and competition and limiting our ability to offer services in a manner that that would maximize our revenue potential. These changes could include, for example, the adoption of new privacy restrictions on our collection, use and disclosure of certain customer information, new data security and cybersecurity mandates that could result in additional network and information security requirements for our business, new restraints on our discretion over programming decisions, including the provision of public, educational and governmental access programming and unaffiliated, commercial leased access programming, new restrictions on the rates we charge for video programming and the marketing of that video programming, changes to the cable industry’s compulsory copyright license to carry broadcast signals, new requirements to assure the availability of navigation devices (such as set-top boxes) from third party providers, new Universal Service Fund obligations on our provision of Internet service that would add to the cost of that service; increases in government-administered broadband subsidies to rural areas that could result in subsidized overbuilding of our more rural facilities, and changes in the regulatory framework for VoIP phone service, including the scope of regulatory obligations associated with our VoIP service and our ability to interconnect our VoIP service with incumbent providers of traditional telecommunications service.
If any of these pending laws and regulations are enacted, they could affect our operations and require significant expenditures. We cannot predict future developments in these areas, and we are already subject to Charter-specific conditions regarding certain Internet practices as a result of the FCC’s approval of the Transactions, but any changes to the regulatory framework for our video, Internet or VoIP services could have a negative impact on our business and results of operations.
It remains uncertain what rule changes, if any, will ultimately be adopted by Congress and the FCC and what operating or financial impact any such rules might have on us, including on our programming agreements, customer privacy and the user experience. In addition, the FCC’s Enforcement Bureau has been actively investigating certain industry practices of various companies and imposing forfeitures for alleged regulatory violations.
Our cable system franchises are subject to non-renewal or termination and are non-exclusive. The failure to renew a franchise or the grant of additional franchises in one or more key markets could adversely affect our business.
Our cable systems generally operate pursuant to franchises, permits, and similar authorizations issued by a state or local governmental authority controlling the public rights-of-way. Many franchises establish comprehensive facilities and service requirements, as well as specific customer service standards and monetary penalties for non-compliance. In many cases, franchises are terminable if the franchisee fails to comply with significant provisions set forth in the franchise agreement governing system operations. Franchises are generally granted for fixed terms and must be periodically renewed. Franchising authorities may resist granting a renewal if either past performance or the prospective operating proposal is considered inadequate. Franchise authorities often demand concessions or other commitments as a condition to renewal. In some instances, local franchises have not been renewed at expiration, and we have operated and are operating under either temporary operating agreements or without a franchise while negotiating renewal terms with the local franchising authorities.
We cannot assure you that we will be able to comply with all significant provisions of our franchise agreements and certain of our franchisers have from time to time alleged that we have not complied with these agreements. Additionally, although historically we have renewed our franchises without incurring significant costs, we cannot assure you that we will be able to renew, or to renew as favorably, our franchises in the future. A termination of or a sustained failure to renew a franchise in one or more key markets could adversely affect our business in the affected geographic area.
Our cable system franchises are non-exclusive. Consequently, local and state franchising authorities can grant additional franchises to competitors in the same geographic area or operate their own cable systems. In some cases, local government entities and municipal utilities may legally compete with us on more favorable terms. Potential competitors (like Google) have recently pursued and obtained local franchises that are more favorable than the incumbent operator’s franchise.
Tax legislation and administrative initiatives or challenges to our tax and fee positions could adversely affect our results of operations and financial condition.
25
We operate cable systems in locations throughout the United States and, as a result, we are subject to the tax laws and regulations of federal, state and local governments. From time to time, various legislative and/or administrative initiatives may be proposed that could adversely affect our tax positions. There can be no assurance that our effective tax rate or tax payments will not be adversely affected by these initiatives. Certain states and localities have imposed or are considering imposing new or additional taxes or fees on our services or changing the methodologies or base on which certain fees and taxes are computed. Potential changes include additional taxes or fees on our services which could impact our customers, changes to income tax sourcing rules and other changes to general business taxes, central/unit-level assessment of property taxes and other matters that could increase our income, franchise, sales, use and/or property tax liabilities. For example, some local franchising authorities are seeking to impose franchise fee assessments on our broadband Internet access service, and more may do so in the future. If they do so, and challenges to such assessments are unsuccessful, it could adversely impact our costs. In addition, federal, state and local tax laws and regulations are extremely complex and subject to varying interpretations. There can be no assurance that our tax positions will not be challenged by relevant tax authorities or that we would be successful in any such challenge.
Item 1B.
Unresolved Staff Comments
.
None.
Item 2.
Properties.
Our principal physical assets consist of cable distribution plant and equipment, including signal receiving, encoding and decoding devices, headend reception facilities, distribution systems, and customer premise equipment for each of our cable systems.
Our cable plant and related equipment are generally attached to utility poles under pole rental agreements with local public utilities and telephone companies, and in certain locations are buried in underground ducts or trenches. We own or lease real property for signal reception sites, and own our service vehicles.
We generally lease space for business offices. Our headend and tower locations are located on owned or leased parcels of land, and we generally own the towers on which our equipment is located.
The physical components of our cable systems require maintenance as well as periodic upgrades to support the new services and products we introduce. See “Item 1. Business – Our Network Technology and Customer Premise Equipment.” We believe that our properties are generally in good operating condition and are suitable for our business operations.
Item 3.
Legal Proceedings.
The legal proceedings information set forth in Note 20 to the accompanying consolidated financial statements contained in “Part II. Item 8. Financial Statements and Supplementary Data” in this Annual Report on Form 10-K is incorporated herein by reference.
Item 4.
Mine Safety Disclosures.
Not applicable.
26
Item 5.
Market for Registrant’s Common Equity, Related Stockholder Matters and Issuer Purchases of Equity Securities.
|
(A)
|
Market Information
|
Charter’s Class A common stock is listed on the NASDAQ Global Select Market under the symbol “CHTR.”
The following table sets forth, for the periods indicated, the range of high and low last reported sale price per share of Charter’s Class A common stock on the NASDAQ Global Select Market.
Class A Common Stock
|
High
|
Low
|
|||||||
|
2016
|
||||||||
|
First quarter
|
$
|
204.10
|
|
$
|
159.53
|
|
||
|
Second quarter
|
$
|
233.11
|
|
$
|
197.91
|
|
||
|
Third quarter
|
$
|
277.56
|
|
$
|
231.77
|
|
||
|
Fourth quarter
|
$
|
292.19
|
|
$
|
244.10
|
|
||
|
2017
|
||||||||
|
First quarter
|
$
|
333.15
|
|
$
|
285.77
|
|
||
|
Second quarter
|
$
|
353.03
|
|
$
|
313.11
|
|
||
|
Third quarter
|
$
|
402.50
|
|
$
|
328.67
|
|
||
|
Fourth quarter
|
$
|
371.09
|
|
$
|
316.29
|
|
||
|
(B)
|
Holders
|
As of
December 31, 2017
, there were approximately 14,101 holders of record of Charter’s Class A common stock and one holder of Charter's Class B common stock.
|
(C)
|
Dividends
|
Charter has not paid cash dividends on its common stock and does not intend to do so in the foreseeable future.
(D) Securities Authorized for Issuance Under Equity Compensation Plans
The following information is provided as of
December 31, 2017
with respect to equity compensation plans:
|
Plan Category
|
Number of Securities to be Issued Upon Exercise of Outstanding Options, Warrants and Rights
|
Weighted Average Exercise Price of Outstanding Warrants and Rights
|
Number of Securities Remaining Available for Future Issuance Under Equity Compensation Plans
|
|||||||||
|
Equity compensation plans approved by security holders
|
12,039,412
|
|
(1)
|
$
|
200.07
|
|
5,844,588
|
|
(1)
|
|||
|
Equity compensation plans not approved by security holders
|
—
|
|
$
|
—
|
|
—
|
|
|||||
|
TOTAL
|
12,039,412
|
|
(1)
|
5,844,588
|
|
(1)
|
||||||
|
(1)
|
This total does not include 9,517 shares issued pursuant to restricted stock grants made under our 2009 Stock Incentive Plan, which are subject to vesting based on continued employment and market conditions.
|
27
For information regarding securities issued under our equity compensation plans, see Note 16 to our accompanying consolidated financial statements contained in “Part II. Item 8. Financial Statements and Supplementary Data.”
(E) Performance Graph
The graph below shows the cumulative total return on Charter’s Class A common stock for the period from December 31, 2012 through
December 31, 2017
, in comparison to the cumulative total return on Standard & Poor’s 500 Index and a peer group consisting of the national cable operators that are most comparable to us in terms of size and nature of operations. The Company’s 2017 peer group consists of Verizon, Comcast, AT&T, T-Mobile, Sprint, Dish Network Corporation, Time Warner Inc., Viacom, Inc., CenturyLink, Inc., The Walt Disney Company, Liberty Global Plc, Cisco Systems, Inc., 21
st
Century Fox, Inc., BCE Inc. and CBS Corporation. The 2017 peer group was created as a result of merger and acquisition activity that impacted our 2016 peer group index, which had consisted of Comcast and Legacy TWC, as well as to match the peer group utilized by our Compensation and Benefits Committee. The results shown assume that $100 was invested on December 31, 2012 and that all dividends were reinvested. These indices are included for comparative purposes only and do not reflect whether it is management’s opinion that such indices are an appropriate measure of the relative performance of the stock involved, nor are they intended to forecast or be indicative of future performance of Charter’s Class A common stock.
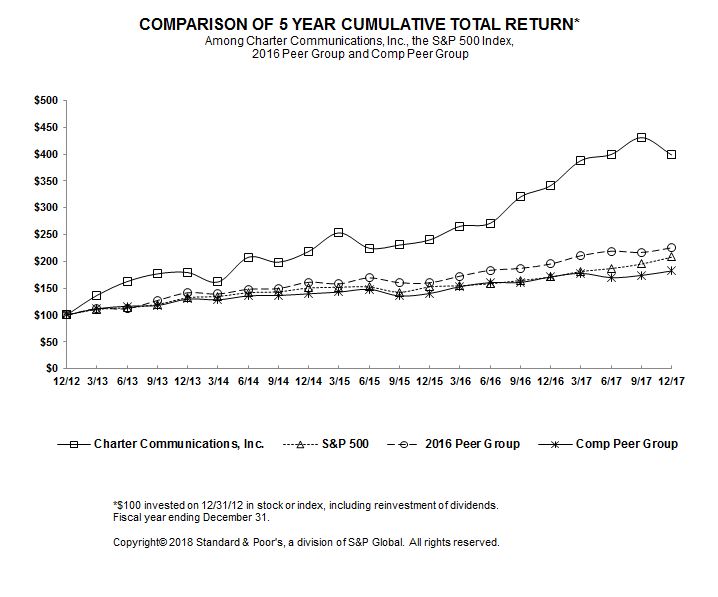
(F) Recent Sales of Unregistered Securities
During
2017
, there were no unregistered sales of securities of the registrant.
28
(G)
Purchases of Equity Securities by the Issuer
The following table presents Charter’s purchases of equity securities completed during the fourth quarter of
2017
(dollars in millions, except per share data).
|
Period
|
Total Number of Shares Purchased
(1)
|
Average Price Paid per Share
|
Total Number of Shares Purchased as Part of Publicly Announced Plans or Programs
(2)
|
Approximate Dollar Value of Shares that May Yet Be Purchased Under the Plans or Programs
(2)
|
|||
|
October 1 - 31, 2017
|
6,756,815
|
$
|
353.40
|
|
6,748,900
|
|
$2,566
|
|
November 1 - 30, 2017
|
3,506,402
|
$
|
335.97
|
|
3,495,881
|
|
$1,425
|
|
December 1 - 31, 2017
|
1,198,216
|
$
|
336.03
|
|
1,190,300
|
|
$1,083
|
|
(1)
|
Includes 7,915, 10,521 and 7,916 shares withheld from employees for the payment of taxes and exercise costs upon the exercise of stock options or vesting of other equity awards for the months of October, November and December 2017, respectively.
|
|
(2)
|
During the
three
months ended
December 31, 2017
, Charter purchased approximately
11.4 million
shares of its Class A common stock for approximately
$4.0 billion
. As of
December 31, 2017
, Charter had remaining board authority to purchase an additional
$1.1 billion
of Charter’s Class A common stock and/or Charter Holdings common units. Charter Holdings purchased
2.1 million
Charter Holdings common units from A/N at an average price per unit of
$354.18
, or
$743 million
during the
three
months ended
December 31, 2017
. In addition to open market purchases including pursuant to Rule 10b5-1 plans adopted from time to time, Charter may also buy shares of Charter Class A common stock, from time to time, pursuant to private transactions outside of its Rule 10b5-1 plan and any such repurchases would also trigger the repurchases from A/N pursuant to and to the extent provided in the Letter Agreement (defined below). See "Part II. Item 7. Management's Discussion and Analysis of Financial Condition and Results of Operations — Liquidity and Capital Resources."
|
Item 6.
Selected Financial Data
.
The following table presents selected consolidated financial data for the periods indicated (dollars in millions, except per share data):
|
Years Ended December 31,
|
|||||||||||||||||||
|
2017
|
2016
|
2015
|
2014
|
2013
|
|||||||||||||||
|
Statement of Operations Data:
|
|||||||||||||||||||
|
Revenues
|
$
|
41,581
|
|
$
|
29,003
|
|
$
|
9,754
|
|
$
|
9,108
|
|
$
|
8,155
|
|
||||
|
Income from operations (a)
|
$
|
4,106
|
|
$
|
2,456
|
|
$
|
1,114
|
|
$
|
971
|
|
$
|
909
|
|
||||
|
Interest expense, net
|
$
|
3,090
|
|
$
|
2,499
|
|
$
|
1,306
|
|
$
|
911
|
|
$
|
846
|
|
||||
|
Income (loss)
before income taxes
|
$
|
1,028
|
|
$
|
820
|
|
$
|
(331
|
)
|
$
|
53
|
|
$
|
(49
|
)
|
||||
|
Net income (loss) attributable to Charter shareholders
|
$
|
9,895
|
|
$
|
3,522
|
|
$
|
(271
|
)
|
$
|
(183
|
)
|
$
|
(169
|
)
|
||||
|
Income (loss) per common share, basic
|
$
|
38.55
|
|
$
|
17.05
|
|
$
|
(2.68
|
)
|
$
|
(1.88
|
)
|
$
|
(1.83
|
)
|
||||
|
Income (loss) per common share, diluted
|
$
|
34.09
|
|
$
|
15.94
|
|
$
|
(2.68
|
)
|
$
|
(1.88
|
)
|
$
|
(1.83
|
)
|
||||
|
Weighted average shares outstanding, basic (b)
|
256,720,715
|
|
206,539,100
|
|
101,152,647
|
|
97,991,915
|
|
92,169,292
|
|
|||||||||
|
Weighted average shares outstanding, diluted (b)
|
296,703,956
|
|
234,791,439
|
|
101,152,647
|
|
97,991,915
|
|
92,169,292
|
|
|||||||||
|
Balance Sheet Data (end of period):
|
|||||||||||||||||||
|
Investment in cable properties
|
$
|
142,712
|
|
$
|
144,396
|
|
$
|
16,375
|
|
$
|
16,652
|
|
$
|
16,556
|
|
||||
|
Total assets
|
$
|
146,623
|
|
$
|
149,067
|
|
$
|
39,316
|
|
$
|
24,388
|
|
$
|
17,129
|
|
||||
|
Total debt
|
$
|
70,231
|
|
$
|
61,747
|
|
$
|
35,723
|
|
$
|
20,887
|
|
$
|
14,031
|
|
||||
|
Total shareholders’ equity (deficit)
|
$
|
47,531
|
|
$
|
50,366
|
|
$
|
(46
|
)
|
$
|
146
|
|
$
|
151
|
|
||||
|
Other Financial Data:
|
|||||||||||||||||||
|
Ratio of earnings to fixed charges (c)
|
1.33
|
|
1.33
|
|
N/A
|
|
1.06
|
|
N/A
|
|
|||||||||
|
Deficiency of earnings to cover fixed charges (c)
|
N/A
|
|
N/A
|
|
$
|
331
|
|
N/A
|
|
$
|
49
|
|
|||||||
29
|
(a)
|
The year ended December 31, 2016 has been restated to reflect the adoption of Accounting Standards Update (“ASU”) No. 2017-07,
Improving the Presentation of Net Periodic Pension Cost and Net Periodic Postretirement Benefit Cost
("ASU 2017-07"). See Note 22 to our accompanying consolidated financial statements contained in “Part II. Item 8. Financial Statements and Supplementary Data.”
|
|
(b)
|
Weighted average number of shares outstanding for the years ended December 31, 2015, 2014 and 2013 have been recast to reflect the application of the Parent Merger Exchange Ratio (as defined in the Merger Agreement). See Note 3 to our accompanying consolidated financial statements contained in “Part II. Item 8. Financial Statements and Supplementary Data.”
|
|
(c)
|
Earnings include income (loss) before non-controlling interest and income taxes plus fixed charges. Fixed charges consist of interest expense and an estimated interest component of rent expense.
|
Comparability of the above information from year to year is affected by acquisitions and dispositions completed by us, including the Transactions. See “Part I. Item 1. Business” for a discussion regarding the Transactions.
Item 7.
Management’s Discussion and Analysis of Financial Condition and Results of Operations.
Reference is made to “Part I. Item 1A. Risk Factors” and “Cautionary Statement Regarding Forward-Looking Statements,” which describe important factors that could cause actual results to differ from expectations and non-historical information contained herein. In addition, the following discussion should be read in conjunction with the audited consolidated financial statements and accompanying notes thereto of Charter included in “Part II. Item 8. Financial Statements and Supplementary Data.”
Overview
We are the second largest cable operator in the United States and a leading broadband communications services company providing video, Internet and voice services to approximately
27.2 million
residential and business customers at
December 31, 2017
. In addition, we sell video and online advertising inventory to local, regional and national advertising customers and fiber-delivered communications and managed IT solutions to large enterprise customers. We also own and operate regional sports networks and local sports, news and community channels and sell security and home management services in the residential marketplace. See “Part I. Item 1. Business — Products and Services” for further description of these services, including customer statistics for different services.
In the first half of 2017, we completed the roll-out of SPP to Legacy TWC and Legacy Bright House markets simplifying our offers and improving our packaging of products, allowing us to deliver more value to new and existing customers. As of
December 31, 2017
, approximately 60% of our residential customers are in an SPP package. In the second half of 2017, we began converting the remaining Legacy TWC and Legacy Bright House analog markets to an all-digital platform enabling us to deliver more HD channels and higher Internet speeds. The bulk of this all-digital initiative will take place in 2018. Our corporate organization, as well as our marketing, sales and product development departments, are centralized. Field operations are managed through eleven regional areas, each designed to represent a combination of designated marketing areas. In 2017, we began migrating Legacy TWC and Legacy Bright House customer care centers to Legacy Charter's model of using virtualized, U.S.-based in-house call centers. We are focused on deploying superior products and service with minimal service disruptions as we integrate our information technology and network operations. We intend to continue to insource the Legacy TWC and Legacy Bright House workforces in our call centers and in our field operations which we expect to lead to lower customer churn and longer customer lifetimes.
Our integration activities will continue in 2018 with the expectation that by 2019 we will have substantially integrated the practices and systems of Legacy Charter, Legacy TWC and Legacy Bright House. In 2018, we will also launch our mobile product. As a result of growth costs for a new product line and implementing our operating strategy across Legacy TWC and Legacy Bright House, we cannot be certain that we will be able to grow revenues or maintain our margins at recent historical rates.
30
The Company realized revenue, Adjusted EBITDA and income from operations during the periods presented as follows (in millions; all percentages are calculated using whole numbers. Minor differences may exist due to rounding).
|
Years ended December 31,
|
Growth
|
||||||||||||||||
|
2017
|
2016
|
2015
|
2017 over 2016
|
2016 over 2015
|
|||||||||||||
|
Actual
|
|||||||||||||||||
|
Revenues
|
$
|
41,581
|
|
$
|
29,003
|
|
$
|
9,754
|
|
43.4
|
%
|
197.3
|
%
|
||||
|
Adjusted EBITDA
|
$
|
15,301
|
|
$
|
10,592
|
|
$
|
3,406
|
|
44.5
|
%
|
211.0
|
%
|
||||
|
Income from operations
|
$
|
4,106
|
|
$
|
2,456
|
|
$
|
1,114
|
|
67.2
|
%
|
120.5
|
%
|
||||
|
Pro Forma
|
|||||||||||||||||
|
Revenues
|
$
|
41,581
|
|
$
|
40,023
|
|
$
|
37,394
|
|
3.9
|
%
|
7.0
|
%
|
||||
|
Adjusted EBITDA
|
$
|
15,301
|
|
$
|
14,464
|
|
$
|
13,004
|
|
5.8
|
%
|
11.2
|
%
|
||||
|
Income from operations
(a)
|
$
|
4,106
|
|
$
|
3,886
|
|
$
|
3,323
|
|
5.7
|
%
|
16.9
|
%
|
||||
|
(a)
|
Income from operations for the year ended December 31, 2016 has been reduced from what was previously reported by $899 million to reflect the adoption of pension accounting guidance, and on a pro forma basis, income from operations for the years ended December 31, 2016 and 2015 have been reduced from what was previously reported by $915 million and $73 million, respectively
.
For more information, see Note 22 to the accompanying consolidated financial statements contained in “Part II. Item 8. Financial Statements and Supplementary Data.”
|
Adjusted EBITDA is defined as consolidated net income (loss) plus net interest expense, income taxes, depreciation and amortization, stock compensation expense, loss on extinguishment of debt, (gain) loss on financial instruments, net, other pension benefits, other (income) expense, net and other operating (income) expenses, such as merger and restructuring costs, special charges and gain (loss) on sale or retirement of assets. See “—Use of Adjusted EBITDA and Free Cash Flow” for further information on Adjusted EBITDA and free cash flow.
Growth in total revenue, Adjusted EBITDA and income from operations was primarily due to the Transactions. On a pro forma basis, assuming the Transactions occurred as of January 1, 2015, total revenue growth was primarily due to growth in our Internet and commercial businesses. Revenue growth during 2017 was offset by lower advertising sales revenue due to a decrease in political and local advertising and an early contract termination benefit at Legacy TWC and Legacy Bright House in 2016. In addition to the items noted above, Adjusted EBITDA growth on a pro forma basis was affected by increases in programming costs and, in 2017, offset by decreases in costs to service customers and other operating costs and expenses. Income from operations on a pro forma basis was additionally affected by increases in depreciation and amortization as well as changes in merger and restructuring costs.
Approximately 91%, 90% and 91% of our revenues for years ended
December 31, 2017
,
2016
and
2015
, respectively, are attributable to monthly subscription fees charged to customers for our video, Internet, voice and commercial services provided by our cable systems. Generally, these customer subscriptions may be discontinued by the customer at any time subject to a fee for certain commercial customers. The remaining 9%, 10% and 9% of revenue for fiscal years
2017
,
2016
and
2015
, respectively, is derived primarily from advertising revenues, franchise and other regulatory fee revenues (which are collected by us but then paid to local authorities), VOD and pay-per-view programming, installation, processing fees or reconnection fees charged to customers to commence or reinstate service, revenue from regional sports and news channels and commissions related to the sale of merchandise by home shopping services.
We incurred the following transition costs in connection with the Transactions (in millions).
|
Years ended December 31,
|
|||||||||||
|
2017
|
2016
|
2015
|
|||||||||
|
Operating expenses
|
$
|
124
|
|
$
|
156
|
|
$
|
72
|
|
||
|
Other operating expenses
|
$
|
351
|
|
$
|
970
|
|
$
|
70
|
|
||
|
Interest expense
|
$
|
—
|
|
$
|
390
|
|
$
|
521
|
|
||
|
Capital expenditures
|
$
|
489
|
|
$
|
460
|
|
$
|
115
|
|
||
31
Amounts included in transition operating expenses and transition capital expenditures represent incremental costs incurred to integrate the Legacy TWC and Legacy Bright House operations and to bring the three companies’ systems and processes into a uniform operating structure. Costs are incremental and would not be incurred absent the integration. Other operating expenses associated with the Transactions represent merger and restructuring costs and include advisory, legal and accounting fees, employee retention costs, employee termination costs and other exit costs. Interest expense associated with the Transactions represents interest incurred on the CCO Safari II, CCO Safari III and CCOH Safari notes issued in advance of the closing of the Transactions, the proceeds of which were held in escrow to finance the Transactions.
Critical Accounting Policies and Estimates
Certain of our accounting policies require our management to make difficult, subjective and/or complex judgments. Management has discussed these policies with the Audit Committee of Charter’s board of directors, and the Audit Committee has reviewed the following disclosure. We consider the following policies to be the most critical in understanding the estimates, assumptions and judgments that are involved in preparing our financial statements, and the uncertainties that could affect our results of operations, financial condition and cash flows:
|
•
|
Property, plant and equipment
|
|
•
|
Capitalization of labor and overhead costs
|
|
•
|
Valuation and impairment of property, plant and equipment
|
|
•
|
Useful lives of property, plant and equipment
|
|
•
|
Intangible assets
|
|
•
|
Valuation and impairment of franchises
|
|
•
|
Valuation and impairment of goodwill
|
|
•
|
Valuation, impairment and amortization of customer relationships
|
|
•
|
Income taxes
|
|
•
|
Litigation
|
|
•
|
Programming agreements
|
|
•
|
Pension plans
|
In addition, there are other items within our financial statements that require estimates or judgment that are not deemed critical, such as the allowance for doubtful accounts and valuations of our financial instruments, but changes in estimates or judgment in these other items could also have a material impact on our financial statements.
Property, plant and equipment
The cable industry is capital intensive, and a large portion of our resources are spent on capital activities associated with extending, rebuilding, and upgrading our cable network. As of
December 31, 2017
and
2016
, the net carrying amount of our property, plant and equipment (consisting primarily of cable distribution systems) was approximately
$33.9 billion
(representing
23%
of total assets) and
$33.0 billion
(representing
22%
of total assets), respectively. Total capital expenditures for the years ended
December 31, 2017
,
2016
and
2015
were approximately
$8.7 billion
,
$5.3 billion
and
$1.8 billion
, respectively.
Capitalization of labor and overhead costs.
Costs associated with network construction or upgrades, initial placement of the customer drop to the dwelling and the initial placement of outlets within a dwelling along with the costs associated with the initial deployment of customer premise equipment necessary to provide video, Internet or voice services, are capitalized. Costs capitalized include materials, direct labor and certain indirect costs. These indirect costs are associated with the activities of personnel who assist in installation activities, and consist of compensation and overhead costs associated with these support functions. While our capitalization is based on specific activities, once capitalized, we track these costs on a composite basis by fixed asset category at the cable system level, and not on a specific asset basis. For assets that are sold or retired, we remove the estimated applicable cost and accumulated depreciation. The costs of disconnecting service and removing customer premise equipment from a dwelling and the costs to reconnect a customer drop or to redeploy previously installed customer premise equipment are charged to operating expense as incurred. Costs for repairs and maintenance are charged to operating expense as incurred, while plant and equipment replacement, including replacement of certain components, betterments, and replacement of cable drops and outlets, are capitalized.
We make judgments regarding the installation and construction activities to be capitalized. We capitalize direct labor and overhead using standards developed from actual costs and applicable operational data. We calculate standards annually (or more frequently if circumstances dictate) for items such as the labor rates, overhead rates, and the actual amount of time required to perform a capitalizable activity. For example, the standard amounts of time required to perform capitalizable activities are based on studies of the time required to perform such activities. Overhead rates are established based on an analysis of the nature of costs incurred
32
in support of capitalizable activities, and a determination of the portion of costs that is directly attributable to capitalizable activities. The impact of changes that resulted from these studies were not material in the periods presented.
Labor costs directly associated with capital projects are capitalized. Capitalizable activities performed in connection with installations include such activities as:
|
•
|
dispatching a “truck roll” to the customer’s dwelling or business for service connection or placement of new equipment;
|
|
•
|
verification of serviceability to the customer’s dwelling or business (i.e., determining whether the customer’s dwelling is capable of receiving service by our cable network);
|
|
•
|
customer premise activities performed by in-house field technicians and third-party contractors in connection with the installation, replacement and betterment of equipment and materials to enable video, Internet or voice services; and
|
|
•
|
verifying the integrity of the customer’s network connection by initiating test signals downstream from the headend to the customer premise equipment, as well as testing signal levels at the utility pole or pedestal.
|
Judgment is required to determine the extent to which overhead costs incurred result from specific capital activities, and therefore should be capitalized. The primary costs that are included in the determination of the overhead rate are (i) employee benefits and payroll taxes associated with capitalized direct labor, (ii) direct variable costs associated with capitalizable activities, (iii) the cost of support personnel, such as care personnel and dispatchers, who assist with capitalizable installation activities, and (iv) indirect costs directly attributable to capitalizable activities.
While we believe our existing capitalization policies are appropriate, a significant change in the nature or extent of our system activities could affect management’s judgment about the extent to which we should capitalize direct labor or overhead in the future. We monitor the appropriateness of our capitalization policies, and perform updates to our internal studies on an ongoing basis to determine whether facts or circumstances warrant a change to our capitalization policies. We capitalized direct labor and overhead of $1.7 billion, $991 million and $420 million, respectively, for the years ended
December 31, 2017
,
2016
and
2015
.
Valuation and impairment of property, plant and equipment.
We evaluate the recoverability of our property, plant and equipment upon the occurrence of events or changes in circumstances indicating that the carrying amount of an asset may not be recoverable. Such events or changes in circumstances could include such factors as the impairment of our indefinite life assets, changes in technological advances, fluctuations in the fair value of such assets, adverse changes in relationships with local franchise authorities, adverse changes in market conditions, or a deterioration of current or expected future operating results. A long-lived asset is deemed impaired when the carrying amount of the asset exceeds the projected undiscounted future cash flows associated with the asset. No impairments of long-lived assets to be held and used were recorded in the years ended
December 31, 2017
,
2016
and
2015
.
We utilize the cost approach as the primary method used to establish fair value for our property, plant and equipment in connection with business combinations. The cost approach considers the amount required to replace an asset by constructing or purchasing a new asset with similar utility, then adjusts the value in consideration of physical depreciation and functional and economic obsolescence as of the valuation date. The cost approach relies on management’s assumptions regarding current material and labor costs required to rebuild and repurchase significant components of our property, plant and equipment along with assumptions regarding the age and estimated remaining useful lives of our property, plant and equipment.
Useful lives of property, plant and equipment.
We evaluate the appropriateness of estimated useful lives assigned to our property, plant and equipment, based on annual analysis of such useful lives, and revise such lives to the extent warranted by changing facts and circumstances. Any changes in estimated useful lives as a result of this analysis are reflected prospectively beginning in the period in which the study is completed. Our analysis of useful lives in
2017
did not indicate any significant changes in useful lives. The effect of a one-year decrease in the weighted average remaining useful life of our property, plant and equipment as of
December 31, 2017
would be an increase in annual depreciation expense of approximately $943 million. The effect of a one-year increase in the weighted average remaining useful life of our property, plant and equipment as of
December 31, 2017
would be a decrease in annual depreciation expense of approximately $1.4 billion.
33
Depreciation expense related to property, plant and equipment totaled
$7.8 billion
,
$5.0 billion
and
$1.9 billion
for the years ended
December 31, 2017
,
2016
and
2015
, respectively, representing approximately
21%
,
19%
and
21%
of costs and expenses, respectively. Depreciation is recorded using the straight-line composite method over management’s estimate of the useful lives of the related assets as listed below:
|
Cable distribution systems
|
8-20 years
|
|
Customer premise equipment and installations
|
3-8 years
|
|
Vehicles and equipment
|
4-9 years
|
|
Buildings and improvements
|
15-40 years
|
|
Furniture, fixtures and equipment
|
7-10 years
|
Intangible assets
Valuation and impairment of franchises.
The net carrying value of franchises as of
December 31, 2017
and
2016
was approximately
$67.3 billion
(representing
46%
of total assets) and
$67.3 billion
(representing
45%
of total assets), respectively. For more information and a complete discussion of how we value and test franchise assets for impairment, see Note 6 to the accompanying consolidated financial statements contained in “Part II. Item 8. Financial Statements and Supplementary Data.”
We perform an impairment assessment of franchise assets annually or more frequently as warranted by events or changes in circumstances. We performed a qualitative assessment in
2017
. Our assessment included consideration of a fair value appraisal performed for tax purposes in the beginning of 2017 as of a December 31, 2016 valuation date (the "Appraisal") along with a multitude of factors that affect the fair value of our franchise assets. Examples of such factors include environmental and competitive changes within our operating footprint, actual and projected operating performance, the consistency of our operating margins, equity and debt market trends, including changes in our market capitalization, and changes in our regulatory and political landscape, among other factors. Based on our assessment, we concluded that it was more likely than not that the estimated fair values of our franchise assets equals or exceeds their carrying values and that a quantitative impairment test is not required.
The Appraisal indicated that the fair value of our franchise assets exceeded carrying value by more than 40% in the aggregate. At our unit of accounting level for franchise asset impairment testing, the amount by which fair value exceeded carrying value varied based on the extent to which the unit of accounting was comprised of operations acquired in 2016. For units of accounting comprised entirely or substantially of newly-acquired operations, the Appraisal fair value exceeded carrying value by a range of 16% to 46% due to the recency of the Transactions, while fair value for units of accounting comprised of at least 25% Legacy Charter operations, exceeded carrying value by a range of 29% to 264%.
Valuation and impairment of goodwill.
The net carrying value of goodwill as of
December 31, 2017
and
2016
was approximately
$29.6 billion
(representing
20%
of total assets) and
$29.5 billion
(representing
20%
of total assets), respectively. For more information and a complete discussion on how we test goodwill for impairment, see Note 6 to the accompanying consolidated financial statements contained in “Part II. Item 8. Financial Statements and Supplementary Data.” We perform our impairment assessment of goodwill annually as of November 30. As with our franchise impairment testing, we elected to perform a qualitative assessment of goodwill in
2017
which included the fair value appraisal and other factors described above. Based on the Appraisal, we determined that the fair value of our goodwill exceeded carrying value by approximately 53%. Given the completion of the assessment and absence of significant adverse changes in factors impacting our fair value estimates, we concluded that it is more likely than not that our goodwill is not impaired.
Valuation, impairment and amortization of customer relationships.
The net carrying value of customer relationships as of
December 31, 2017
and
2016
was approximately
$12.0 billion
(representing
8%
of total assets) and
$14.6 billion
(representing
10%
of total assets), respectively. Amortization expense related to customer relationships for the years ended
December 31, 2017
,
2016
and
2015
was approximately $2.7 billion, $1.9 billion and $249 million, respectively. No impairment of customer relationships was recorded in the years ended
December 31, 2017
,
2016
and
2015
. For more information and a complete discussion on our valuation methodology and amortization method, see Note 6 to the accompanying consolidated financial statements contained in “Part II. Item 8. Financial Statements and Supplementary Data.”
Income taxes
As of
December 31, 2017
, Charter had approximately
$10.9 billion
of federal tax net operating loss carryforwards resulting in a gross deferred tax asset of approximately
$2.3 billion
. These losses resulted from the operations of Charter Holdco and its subsidiaries and from loss carryforwards received as a result of the TWC Transaction. Federal tax net operating loss carryforwards
34
expire in the years 2018 through 2035. In addition, as of
December 31, 2017
, Charter had state tax net operating loss carryforwards, resulting in a gross deferred tax asset (net of federal tax benefit) of approximately
$359 million
. State tax net operating loss carryforwards generally expire in the years 2018 through 2037. Such tax loss carryforwards can accumulate and be used to offset Charter’s future taxable income. As of
December 31, 2017
, all of Charter's federal tax loss carryforwards are subject to Section 382 and other restrictions. Pursuant to these restrictions, Charter estimates that approximately
$8.7 billion
in 2018,
$654 million
in 2019 and an additional
$226 million
annually over each of the next five years of federal tax loss carryforwards, should become unrestricted and available for Charter’s use. An additional
$415 million
is currently subject to a valuation allowance. Charter’s state tax loss carryforwards are subject to similar but varying restrictions.
Income tax benefit for the year ended December 31, 2017 was recognized primarily as a result of the enactment of the Tax Cuts & Jobs Act (“Tax Reform”) in December 2017. Among other things, the primary provisions of Tax Reform impacting us are the reductions to the U.S. corporate income tax rate from 35% to 21% and temporary 100% bonus depreciation for certain assets. The change in tax law required us to remeasure existing net deferred tax liabilities using the lower rate in the period of enactment resulting in an income tax benefit of approximately $9.3 billion to reflect these changes in the year ended December 31, 2017. We have reported provisional amounts for the income tax effects of Tax Reform for which the accounting is incomplete but a reasonable estimate could be determined. There were no specific impacts of Tax Reform that could not be reasonably estimated which we accounted for under prior tax law. Based on a continued analysis of the estimates and further guidance on the application of the law, it is anticipated that additional revisions may occur throughout the allowable measurement period. Overall, the changes due to Tax Reform will favorably affect income tax expense on future U.S. earnings.
In assessing the realizability of deferred tax assets, management considers whether it is more likely than not that some portion or all of the deferred tax assets will be realized. In evaluating the need for a valuation allowance, management takes into account various factors, including the expected level of future taxable income, available tax planning strategies and reversals of existing taxable temporary differences. Due to Legacy Charter’s history of losses, Legacy Charter was historically unable to assume future taxable income in its analysis and accordingly valuation allowances were established against the deferred tax assets, net of deferred tax liabilities, from definite-lived assets for book accounting purposes. However, as a result of the TWC Transaction in 2016, deferred tax liabilities resulting from the acquisition accounting increased significantly and future taxable income that will result from the reversal of existing temporary differences for which deferred tax liabilities are recognized, is sufficient to conclude it is more likely than not that we will realize substantially all of our deferred tax assets. As a result, in 2016 Charter reversed approximately $3.3 billion of its valuation allowance and recognized a corresponding income tax benefit in the consolidated statements of operations for the year ended December 31, 2016. Approximately
$87 million
of valuation allowance associated with federal tax net operating loss carryforwards and approximately
$50 million
of valuation allowance associated with state tax loss carryforwards and other miscellaneous deferred tax assets remains on the
December 31, 2017
consolidated balance sheet.
In determining our tax provision for financial reporting purposes, we establish a reserve for uncertain tax positions unless such positions are determined to be “more likely than not” of being sustained upon examination, based on their technical merits. In evaluating whether a tax position has met the more-likely-than-not recognition threshold, we presume the position will be examined by the appropriate taxing authority that has full knowledge of all relevant information. A tax position that meets the more-likely-than-not recognition threshold is measured to determine the amount of benefit to be recognized in our financial statements. The tax position is measured as the largest amount of benefit that has a greater than 50% likelihood of being realized when the position is ultimately resolved. There is considerable judgment involved in determining whether positions taken on the tax return are “more likely than not” of being sustained. We adjust our uncertain tax reserve estimates periodically because of ongoing examinations by, and settlements with, the various taxing authorities, as well as changes in tax laws, regulations and interpretations.
No tax years for Charter, Charter Holdings or Charter Holdco for income tax purposes, are currently under examination by the IRS. Charter and Charter Holdings' 2016 and 2017 tax years remain open for examination and assessment. Legacy Charter’s tax years ending 2014 through the short period return dated May 17, 2016 remain subject to examination and assessment. Years prior to 2014 remain open solely for purposes of examination of Legacy Charter’s loss and credit carryforwards. The IRS is currently examining Legacy TWC’s income tax returns for 2011 through 2014. Legacy TWC’s tax year 2015 remains subject to examination and assessment. Prior to Legacy TWC’s separation from Time Warner Inc. (“Time Warner”) in March 2009 (the “Separation”), Legacy TWC was included in the consolidated U.S. federal and certain state income tax returns of Time Warner. The IRS is currently examining Time Warner’s 2008 through 2010 income tax returns. Time Warner’s income tax returns for 2005 to 2007, which are periods prior to the Separation, were settled with the exception of an immaterial item that has been referred to the IRS Appeals Division. We do not anticipate that these examinations will have a material impact on our consolidated financial position or results of operations. In addition, we are also subject to ongoing examinations of our tax returns by state and local tax authorities for various periods. Activity related to these state and local examinations did not have a material impact on our consolidated financial position or results of operations during the year ended December 31, 2017, nor do we anticipate a material impact in the future.
35
Litigation
Legal contingencies have a high degree of uncertainty. When a loss from a contingency becomes estimable and probable, a reserve is established. The reserve reflects management’s best estimate of the probable cost of ultimate resolution of the matter and is revised as facts and circumstances change. A reserve is released when a matter is ultimately brought to closure or the statute of limitations lapses. We have established reserves for certain matters. Although these matters are not expected individually to have a material adverse effect on our consolidated financial condition, results of operations or liquidity, such matters could have, in the aggregate, a material adverse effect on our consolidated financial condition, results of operations or liquidity.
Programming agreements
We exercise judgment in estimating programming expense associated with certain video programming contracts. Our policy is to record video programming costs based on the substance of our contractual agreements with our programming vendors, which are generally multi-year agreements that provide for us to make payments to the programming vendors at agreed upon market rates based on the number of customers to which we provide the programming service. If a programming contract expires prior to the parties’ entry into a new agreement and we continue to distribute the service, we estimate the programming costs during the period there is no contract in place. In doing so, we consider the previous contractual rates, inflation and the status of the negotiations in determining our estimates. When the programming contract terms are finalized, an adjustment to programming expense is recorded, if necessary, to reflect the terms of the new contract. We also make estimates in the recognition of programming expense related to other items including the allocation of consideration exchanged between the parties among the various items in multiple-element transactions.
Judgment is also involved when we enter into agreements that result in us receiving cash consideration from the programming vendor, usually in the form of advertising sales, channel positioning fees, launch support or marketing support. In these situations, we must determine based upon facts and circumstances if such cash consideration should be recorded as revenue, a reduction in programming expense or a reduction in another expense category (e.g., marketing).
Pension plans
We sponsor two qualified defined benefit pension plans, the TWC Pension Plan and the TWC Union Pension Plan (collectively, the “TWC Pension Plans”), that provide pension benefits to a majority of Legacy TWC employees. We also provide a nonqualified defined benefit pension plan for certain employees under the TWC Excess Pension Plan. As of
December 31, 2017
, the accumulated benefit obligation and fair value of plan assets for the TWC Pension Plans was
$3.6 billion
and
$3.3 billion
, respectively, and the net underfunded liability of the TWC Pension Plans was recorded as a
$1 million
noncurrent asset,
$5 million
current liability and
$292 million
long-term liability. As of
December 31, 2016
, the accumulated benefit obligation and fair value of plan assets for the TWC Pension Plans was
$3.3 billion
and
$2.9 billion
, respectively, and the net underfunded liability of the TWC Pension Plans was recorded as a
$1 million
noncurrent asset,
$6 million
current liability and
$309 million
long-term liability.
Pension benefits are based on formulas that reflect the employees’ years of service and compensation during their employment period. Actuarial gains or losses are changes in the amount of either the benefit obligation or the fair value of plan assets resulting from experience different from that assumed or from changes in assumptions. We have elected to follow a mark-to-market pension accounting policy for recording the actuarial gains or losses annually during the fourth quarter, or earlier if a remeasurement event occurs during an interim period. We use a December 31 measurement date for our pension plans.
We recognized net periodic pension benefits of
$1 million
and
$813 million
in
2017
and
2016
, respectively. Net periodic pension benefit or expense is determined using certain assumptions, including the expected long-term rate of return on plan assets, discount rate and mortality assumptions. We determined the discount rate used to compute pension expense based on the yield of a large population of high-quality corporate bonds with cash flows sufficient in timing and amount to settle projected future defined benefit payments. In developing the expected long-term rate of return on assets, we considered the current pension portfolio’s composition, past average rate of earnings, and our asset allocation targets. We used a discount rate of
4.20%
from January 1, 2017 to September 30, 2017 and
3.88%
from October 1, 2017 to December 31, 2017 to compute
2017
pension expense. A decrease in the discount rate of 25 basis points would result in a $173 million increase in our pension plan benefit obligation as of
December 31, 2017
and net periodic pension expense recognized in
2017
under our mark-to-market accounting policy. Our expected long-term rate of return on plan assets used to compute
2017
pension expense was
6.50%
. A decrease in the expected long-term rate of return of 25 basis points, from
6.50%
to 6.25%, while holding all other assumptions constant, would result in an increase in our 2018 net periodic pension expense of approximately $8 million. See Note 21 to the accompanying consolidated financial statements contained in “Part II. Item 8. Financial Statements and Supplementary Data” for additional discussion on these assumptions.
36
Results of Operations
The following table sets forth the consolidated statements of operations for the periods presented (dollars in millions, except per share data):
|
Year Ended December 31,
|
|||||||||||
|
2017
|
2016
|
2015
|
|||||||||
|
Revenues
|
$
|
41,581
|
|
$
|
29,003
|
|
$
|
9,754
|
|
||
|
Costs and Expenses:
|
|||||||||||
|
Operating costs and expenses (exclusive of items shown separately below)
|
26,541
|
|
18,655
|
|
6,426
|
|
|||||
|
Depreciation and amortization
|
10,588
|
|
6,907
|
|
2,125
|
|
|||||
|
Other operating expenses, net
|
346
|
|
985
|
|
89
|
|
|||||
|
37,475
|
|
26,547
|
|
8,640
|
|
||||||
|
Income from operations
|
4,106
|
|
2,456
|
|
1,114
|
|
|||||
|
Other Expenses:
|
|||||||||||
|
Interest expense, net
|
(3,090
|
)
|
(2,499
|
)
|
(1,306
|
)
|
|||||
|
Loss on extinguishment of debt
|
(40
|
)
|
(111
|
)
|
(128
|
)
|
|||||
|
Gain (loss) on financial instruments, net
|
69
|
|
89
|
|
(4
|
)
|
|||||
|
Other pension benefits
|
1
|
|
899
|
|
—
|
|
|||||
|
Other expense, net
|
(18
|
)
|
(14
|
)
|
(7
|
)
|
|||||
|
(3,078
|
)
|
(1,636
|
)
|
(1,445
|
)
|
||||||
|
Income (loss) before income taxes
|
1,028
|
|
820
|
|
(331
|
)
|
|||||
|
Income tax benefit
|
9,087
|
|
2,925
|
|
60
|
|
|||||
|
Consolidated net income (loss)
|
10,115
|
|
3,745
|
|
(271
|
)
|
|||||
|
Less: Net income attributable to noncontrolling interests
|
(220
|
)
|
(223
|
)
|
—
|
|
|||||
|
Net income (loss) attributable to Charter shareholders
|
$
|
9,895
|
|
$
|
3,522
|
|
$
|
(271
|
)
|
||
|
EARNINGS (LOSS) PER COMMON SHARE ATTRIBUTABLE TO CHARTER SHAREHOLDERS:
|
|||||||||||
|
Basic
|
$
|
38.55
|
|
$
|
17.05
|
|
$
|
(2.68
|
)
|
||
|
Diluted
|
$
|
34.09
|
|
$
|
15.94
|
|
$
|
(2.68
|
)
|
||
|
Weighted average common shares outstanding, basic
|
256,720,715
|
|
206,539,100
|
|
101,152,647
|
|
|||||
|
Weighted average common shares outstanding, diluted
|
296,703,956
|
|
234,791,439
|
|
101,152,647
|
|
|||||
Revenues.
Total revenues grew
$12.6 billion
or
43.4%
in the year ended
December 31, 2017
as compared to
2016
and grew
$19.2 billion
or
197.3%
in the year ended
December 31, 2016
as compared to
2015
. Revenue growth primarily reflects the Transactions and increases in the number of residential Internet and commercial business customers, price adjustments as well as growth in expanded basic video penetration offset by a decrease in limited basic video customers. The Transactions increased revenues for the years ended
2017
and 2016 as compared to the corresponding prior periods by approximately $11.4 billion and $18.6 billion, respectively. On a pro forma basis, assuming the Transactions occurred as of January 1, 2015, total revenue growth was
3.9%
and 7.0% for the years ended
December 31, 2017
and 2016 as compared to the corresponding prior periods.
37
Revenues by service offering were as follows (dollars in millions; all percentages are calculated using whole numbers. Minor differences may exist due to rounding):
|
Years ended December 31,
|
Years ended December 31,
|
||||||||||||||||||||||||||||||||||
|
Actual
|
Pro Forma
|
||||||||||||||||||||||||||||||||||
|
2017
|
2016
|
2015
|
2017 vs. 2016 Growth
|
2016 vs. 2015 Growth
|
2017
|
2016
|
2015
|
2017 vs. 2016 Growth
|
2016 vs. 2015 Growth
|
||||||||||||||||||||||||||
|
Video
|
$
|
16,641
|
|
$
|
11,967
|
|
$
|
4,587
|
|
39.1
|
%
|
160.9
|
%
|
$
|
16,641
|
|
$
|
16,390
|
|
$
|
16,029
|
|
1.5
|
%
|
2.3
|
%
|
|||||||||
|
Internet
|
14,105
|
|
9,272
|
|
3,003
|
|
52.1
|
%
|
208.7
|
%
|
14,105
|
|
12,688
|
|
11,295
|
|
11.2
|
%
|
12.3
|
%
|
|||||||||||||||
|
Voice
|
2,542
|
|
2005
|
|
539
|
|
26.8
|
%
|
272.2
|
%
|
2,542
|
|
2,905
|
|
2,842
|
|
(12.5
|
)%
|
2.2
|
%
|
|||||||||||||||
|
Residential revenue
|
33,288
|
|
23,244
|
|
8,129
|
|
43.2
|
%
|
185.9
|
%
|
33,288
|
|
31,983
|
|
30,166
|
|
4.1
|
%
|
6.0
|
%
|
|||||||||||||||
|
Small and medium business
|
3,686
|
|
2,480
|
|
764
|
|
48.6
|
%
|
224.7
|
%
|
3,686
|
|
3,409
|
|
3,009
|
|
8.1
|
%
|
13.3
|
%
|
|||||||||||||||
|
Enterprise
|
2,210
|
|
1,429
|
|
363
|
|
54.7
|
%
|
293.0
|
%
|
2,210
|
|
2,025
|
|
1,818
|
|
9.1
|
%
|
11.4
|
%
|
|||||||||||||||
|
Commercial revenue
|
5,896
|
|
3,909
|
|
1,127
|
|
50.8
|
%
|
246.7
|
%
|
5,896
|
|
5,434
|
|
4,827
|
|
8.5
|
%
|
12.6
|
%
|
|||||||||||||||
|
Advertising sales
|
1,510
|
|
1235
|
|
309
|
|
22.3
|
%
|
300.3
|
%
|
1,510
|
|
1,696
|
|
1,524
|
|
(10.9
|
)%
|
11.3
|
%
|
|||||||||||||||
|
Other
|
887
|
|
615
|
|
189
|
|
44.1
|
%
|
225.0
|
%
|
887
|
|
910
|
|
877
|
|
(2.6
|
)%
|
4.0
|
%
|
|||||||||||||||
|
$
|
41,581
|
|
$
|
29,003
|
|
$
|
9,754
|
|
43.4
|
%
|
197.3
|
%
|
$
|
41,581
|
|
$
|
40,023
|
|
$
|
37,394
|
|
3.9
|
%
|
7.0
|
%
|
||||||||||
Video revenues consist primarily of revenues from basic and digital video services provided to our residential customers, as well as franchise fees, equipment and video installation revenue. Residential video customers decreased by
292,000
in
2017
and, excluding the impacts of the Transactions, increased by 42,000 in
2016
. The increases in video revenues are attributable to the following (dollars in millions):
|
2017 compared to 2016
|
2016 compared to 2015
|
||||||
|
Bundle revenue allocation and price adjustments
|
$
|
383
|
|
$
|
103
|
|
|
|
Increase (decrease) in VOD and pay-per-view
|
35
|
|
(22
|
)
|
|||
|
Increase (decrease) in average basic video customers
|
(179
|
)
|
35
|
|
|||
|
TWC Transaction
|
3,806
|
|
6,263
|
|
|||
|
Bright House Transaction
|
629
|
|
1,001
|
|
|||
|
$
|
4,674
|
|
$
|
7,380
|
|
||
On a pro forma basis, assuming the Transactions occurred as of January 1, 2015, residential video customers decreased by 226,000 in 2016 and the increases in video revenues is attributable to the following (dollars in millions):
|
2017 compared to 2016
|
2016 compared to 2015
|
||||||
|
Bundle revenue allocation and price adjustments
|
$
|
513
|
|
$
|
498
|
|
|
|
Increase (decrease) in VOD and pay-per-view
|
32
|
|
(69
|
)
|
|||
|
Decrease in average basic video customers
|
(294
|
)
|
(68
|
)
|
|||
|
$
|
251
|
|
$
|
361
|
|
||
38
Residential Internet customers grew by
1,171,000
in
2017
and, excluding the impacts of the Transactions, grew by 461,000 customers in
2016
. The increases in Internet revenues from our residential customers are attributable to the following (dollars in millions):
|
2017 compared to 2016
|
2016 compared to 2015
|
||||||
|
Increase in average residential Internet customers
|
$
|
599
|
|
$
|
284
|
|
|
|
Price adjustments, bundle revenue allocation and service level changes
|
395
|
|
62
|
|
|||
|
TWC Transaction
|
3,268
|
|
5,063
|
|
|||
|
Bright House Transaction
|
571
|
|
860
|
|
|||
|
$
|
4,833
|
|
$
|
6,269
|
|
||
On a pro forma basis, assuming the Transactions occurred as of January 1, 2015, residential Internet customers increased by 1,463,000 in
2016
and the increases in Internet revenues is attributable to the following (dollars in millions):
|
2017 compared to 2016
|
2016 compared to 2015
|
||||||
|
Increase in average residential Internet customers
|
$
|
818
|
|
$
|
957
|
|
|
|
Price adjustments, bundle revenue allocation and service level changes
|
599
|
|
436
|
|
|||
|
$
|
1,417
|
|
$
|
1,393
|
|
||
Residential voice customers grew by
100,000
in
2017
and, excluding the impacts of the Transactions, grew by 95,000 customers in
2016
. The increases in voice revenues from our residential customers is attributable to the following (dollars in millions):
|
2017 compared to 2016
|
2016 compared to 2015
|
||||||
|
Increase in average residential voice customers
|
$
|
27
|
|
$
|
28
|
|
|
|
Bundle revenue allocation and price adjustments
|
(319
|
)
|
(18
|
)
|
|||
|
TWC Transaction
|
707
|
|
1,247
|
|
|||
|
Bright House Transaction
|
122
|
|
209
|
|
|||
|
$
|
537
|
|
$
|
1,466
|
|
||
On a pro forma basis, assuming the Transactions occurred as of January 1, 2015, residential voice customers increased by 368,000 in
2016
and the increase in voice revenues is attributable to the following (dollars in millions):
|
2017 compared to 2016
|
2016 compared to 2015
|
||||||
|
Increase in average residential voice customers
|
$
|
49
|
|
$
|
229
|
|
|
|
Price adjustments and bundle revenue allocation
|
(412
|
)
|
(166
|
)
|
|||
|
$
|
(363
|
)
|
$
|
63
|
|
||
39
Small and medium business PSUs increased by
326,000
in
2017
and, excluding the impacts of the Transactions, increased by 128,000 in
2016
. The increases in small and medium business commercial revenues are attributable to the following (dollars in millions):
|
2017 compared to 2016
|
2016 compared to 2015
|
||||||
|
Increase in small and medium business customers
|
$
|
295
|
|
$
|
127
|
|
|
|
Price adjustments related to SPP
|
(118
|
)
|
(38
|
)
|
|||
|
TWC Transaction
|
890
|
|
1,408
|
|
|||
|
Bright House Transaction
|
139
|
|
219
|
|
|||
|
$
|
1,206
|
|
$
|
1,716
|
|
||
On a pro forma basis, assuming the Transactions occurred as of January 1, 2015, small and medium business PSUs increased by 291,000 in
2016
and the increases in small and medium business commercial revenues is attributable to the following (dollars in millions):
|
2017 compared to 2016
|
2016 compared to 2015
|
||||||
|
Increase in small and medium business customers
|
$
|
393
|
|
$
|
359
|
|
|
|
Price adjustments related to SPP
|
(116
|
)
|
41
|
|
|||
|
$
|
277
|
|
$
|
400
|
|
||
Enterprise PSUs increased by
17,000
in
2017
and, excluding the impacts of the Transactions, increased by 6,000 in
2016
. On a pro forma basis, assuming the Transactions occurred as of January 1, 2015, enterprise PSUs increased by 16,000 in
2016
. The Transactions increased enterprise commercial revenues for years ended
2017
and
2016
as compared to the corresponding prior periods by approximately $655 million and $1.0 billion, respectively. On a pro forma basis, assuming the Transactions occurred as of January 1, 2015, enterprise commercial revenues increased
$185 million
and $207 million during the years ended
2017
and
2016
, respectively, as compared to the corresponding prior periods primarily due to growth in customers.
Advertising sales revenues consist primarily of revenues from commercial advertising customers, programmers and other vendors, as well as local cable and advertising on regional sports and news channels. Advertising sales revenues increased in
2017
and
2016
primarily due to the Transactions. The Transactions increased advertising sales revenues for the years ended
2017
and
2016
as compared to the corresponding prior periods by $425 million and $898 million, respectively. On a pro forma basis, assuming the Transactions occurred as of January 1, 2015, advertising sales revenues decreased
$186 million
and increased $172 million during the years ended
2017
and
2016
, respectively, as compared to the corresponding prior periods primarily due to political advertising.
Other revenues consist of revenue from regional sports and news channels (excluding intercompany charges or advertising sales on those channels), home shopping, late payment fees, wire maintenance fees and other miscellaneous revenues. The increase in
2017
and
2016
was primarily due to the Transactions. The Transactions increased other revenues for the years ended
2017
and
2016
as compared to the corresponding prior periods by $255 million and $429 million, respectively. On a pro forma basis, assuming the Transactions occurred as of January 1, 2015, other revenues decreased
$23 million
and increased $33 million during the years ended
2017
and
2016
, respectively, as compared to the corresponding prior periods primarily due to a settlement incurred in 2016 related to an early contract termination at Legacy TWC and Legacy Bright House.
40
Operating costs and expenses
.
The increases in our operating costs and expenses are attributable to the following (dollars in millions):
|
2017 compared to 2016
|
2016 compared to 2015
|
||||||
|
Programming
|
$
|
3,562
|
|
$
|
4,356
|
|
|
|
Regulatory, connectivity and produced content
|
597
|
|
1,032
|
|
|||
|
Costs to service customers
|
2,126
|
|
3,774
|
|
|||
|
Marketing
|
713
|
|
1,078
|
|
|||
|
Transition costs
|
(32
|
)
|
84
|
|
|||
|
Other
|
920
|
|
1,905
|
|
|||
|
$
|
7,886
|
|
$
|
12,229
|
|
||
Programming costs were approximately
$10.6 billion
,
$7.0 billion
and
$2.7 billion
, representing
40%
,
38%
and
42%
of operating costs and expenses for each of the years ended
December 31, 2017
,
2016
and
2015
, respectively. The increase in operating costs and expenses for the years ended
2017
and
2016
as compared to the corresponding prior periods was primarily due to the Transactions.
The increase in other expense is attributable to the following (dollars in millions):
|
2017 compared to 2016
|
2016 compared to 2015
|
||||||
|
Enterprise
|
$
|
245
|
|
$
|
383
|
|
|
|
Advertising sales expense
|
244
|
|
405
|
|
|||
|
Corporate costs
|
207
|
|
607
|
|
|||
|
Property tax and insurance
|
109
|
|
198
|
|
|||
|
Stock compensation expense
|
17
|
|
166
|
|
|||
|
Other
|
98
|
|
146
|
|
|||
|
$
|
920
|
|
$
|
1,905
|
|
||
The increases in other expense for the years ended
2017
and
2016
as compared to the corresponding prior periods were primarily due to the Transactions.
On a pro forma basis, assuming the Transactions occurred as of January 1, 2015, increases in our operating costs and expenses, exclusive of items shown separately in the consolidated statements of operations, are attributable to the following (dollars in millions):
|
2017 compared to 2016
|
2016 compared to 2015
|
||||||
|
Programming
|
$
|
982
|
|
$
|
661
|
|
|
|
Regulatory, connectivity and produced content
|
(29
|
)
|
28
|
|
|||
|
Costs to service customers
|
(144
|
)
|
72
|
|
|||
|
Marketing
|
52
|
|
59
|
|
|||
|
Transition costs
|
(32
|
)
|
84
|
|
|||
|
Other
|
(142
|
)
|
314
|
|
|||
|
$
|
687
|
|
$
|
1,218
|
|
||
On a pro forma basis, assuming the Transactions occurred as of January 1, 2015, programming costs were approximately
$9.6 billion
and $9.0 billion, representing
37%
and 36% of total operating costs and expenses for the years ended
December 31, 2016
and 2015, respectively.
41
Programming costs consist primarily of costs paid to programmers for basic, digital, premium, VOD, and pay-per-view programming. The increase in programming costs on a pro forma basis, assuming the Transactions occurred as of January 1, 2015, is primarily a result of contractual rate adjustments, including renewals and increases in amounts paid for retransmission consents, higher expanded basic video package customers and higher pay-per-view events offset by synergies as a result of the Transactions. We expect programming expenses will continue to increase due to a variety of factors, including annual increases imposed by programmers with additional selling power as a result of media consolidation, increased demands by owners of broadcast stations for payment for retransmission consent or linking carriage of other services to retransmission consent, and additional programming, particularly new services. We have been unable to fully pass these increases on to our customers nor do we expect to be able to do so in the future without a potential loss of customers.
Costs to service customers decreased
$144 million
during 2017 as compared to 2016, on a pro forma basis, assuming the Transactions occurred as of January 1, 2015, primarily due to benefits from combining Legacy TWC and Legacy Bright House into Charter, including lower employee benefit and maintenance costs, higher labor and material capitalization with increases in placement of new customer equipment and improved productivity.
On a pro forma basis, assuming the Transactions occurred as of January 1, 2015, the change in other expense is attributable to the following (dollars in millions):
|
2017 compared to 2016
|
2016 compared to 2015
|
||||||
|
Corporate costs
|
$
|
(157
|
)
|
$
|
114
|
|
|
|
Stock compensation expense
|
(34
|
)
|
49
|
|
|||
|
Property, tax and insurance
|
(21
|
)
|
—
|
|
|||
|
Advertising sales expense
|
37
|
|
100
|
|
|||
|
Enterprise
|
25
|
|
42
|
|
|||
|
Other
|
8
|
|
9
|
|
|||
|
$
|
(142
|
)
|
$
|
314
|
|
||
Corporate costs and stock compensation expense decreased in
2017
as compared to 2016 primarily as a result of lower headcount as a result of integration synergies.
The increase in corporate costs during 2016 as compared to 2015 relates primarily to increases in the number of employees including increases in engineering and IT. The increase in advertising sales expense relates primarily to higher advertising sales revenue. Stock compensation expense increased during 2016 as compared to 2015 primarily due to increases in headcount and the value of equity issued.
Depreciation and amortization.
Depreciation and amortization expense increased by
$3.7 billion
and
$4.8 billion
in
2017
and
2016
as compared to the corresponding prior periods primarily as a result of additional depreciation and amortization related to the Transactions, inclusive of the incremental amounts as a result of the higher fair values recorded in acquisition accounting and, in 2017, higher capital expenditures.
Other operating expenses, net.
The changes in other operating expenses, net are attributable to the following (dollars in millions):
|
2017 compared to 2016
|
2016 compared to 2015
|
||||||
|
Merger and restructuring costs
|
$
|
(619
|
)
|
$
|
900
|
|
|
|
Special charges, net
|
(38
|
)
|
2
|
|
|||
|
(Gain) loss on sale of assets, net
|
18
|
|
(6
|
)
|
|||
|
$
|
(639
|
)
|
$
|
896
|
|
||
The changes in merger and restructuring costs is primarily due to approximately $262 million of contingent financing and advisory transaction fees paid at the closing of the Transactions in 2016 as well as approximately $279 million and $611 million of employee retention and employee termination costs incurred during
2017
and
2016
, respectively.
For more information, see Note 15 to the accompanying consolidated financial statements contained in “Part II. Item 8. Financial Statements and Supplementary Data.”
42
Interest expense, net.
Net interest expense increased by
$591 million
in
2017
from
2016
and by
$1.2 billion
in
2016
from
2015
. The increase in 2017 as compared to 2016 is primarily due to an increase in weighted average debt outstanding of $11.7 billion primarily as a result of the issuance of notes in 2017 for general corporate purposes including stock buybacks. Interest expense associated with debt assumed from Legacy TWC also increased interest expense during the year ended
December 31, 2017
compared to the corresponding period in
2016
by approximately $336 million. The increase in 2016 as compared to 2015 is primarily due to an increase of $463 million of interest expense associated with the debt incurred to fund the Transactions and $604 million associated with debt assumed from Legacy TWC.
Loss on extinguishment of debt.
Loss on extinguishment of debt of
$40 million
,
$111 million
and
$128 million
for the years ended
December 31, 2017
,
2016
and
2015
primarily represents losses recognized as a result of the repurchase of CCO Holdings notes and amendments to Charter Operating's credit facilities. For more information, see Note 9 to the accompanying consolidated financial statements contained in “Part II. Item 8. Financial Statements and Supplementary Data.”
Gain (loss) on financial instruments, net.
Gains and losses on financial instruments are recognized due to changes in the fair value of our interest rate and our cross currency derivative instruments, and the foreign currency remeasurement of the fixed-rate British pound sterling denominated notes (the “Sterling Notes”) into U.S. dollars. For more information, see Note 12 to the accompanying consolidated financial statements contained in “Part II. Item 8. Financial Statements and Supplementary Data.”
Other pension benefits.
Other pension benefits decreased by
$898 million
during 2017 compared to 2016 and increased
$899 million
during 2016 compared to 2015 primarily due to the pension curtailment gain of $675 million and remeasurement gain of $195 million recognized in 2016 as opposed to remeasurement losses of
$55 million
recognized in 2017. For more information, see Note 21 to the accompanying consolidated financial statements contained in “Part II. Item 8. Financial Statements and Supplementary Data.”
Other expense, net.
Other expense, net primarily represents equity losses on our equity-method investments. For more information, see Note 7 to the accompanying consolidated financial statements contained in “Part II. Item 8. Financial Statements and Supplementary Data.”
Income tax benefit.
We recognized income tax benefit of
$9.1 billion
,
$2.9 billion
and
$60 million
for the years ended
December 31, 2017
, 2016 and 2015, respectively. The income tax benefit for the year ended
December 31, 2017
was recognized primarily through the enactment of Tax Reform which resulted in an income tax benefit of approximately
$9.3 billion
as well as by approximately
$88 million
due to the recognition of excess tax benefits resulting from share based compensation as a component of the provision for income taxes following the prospective application of accounting guidance related to employee-share based payments (see Note 22 to the accompanying consolidated financial statements contained in “Part II. Item 8. Financial Statements and Supplementary Data.”)
.
Income tax benefit for the year ended
December 31, 2016
was the result of a reduction of substantially all of Legacy Charter's preexisting valuation allowance associated with its deferred tax assets of approximately $3.3 billion as certain of the deferred tax liabilities that were assumed in connection with the closing of the TWC Transaction will reverse and provide a source of future taxable income.
The income tax benefit in 2015 was primarily due to the deemed liquidation of Charter Holdco solely for federal and state income tax purposes, resulting in a $187 million deferred income tax benefit offset by income tax expense primarily through increases in deferred tax liabilities. For more information, see Note 17 to the accompanying consolidated financial statements contained in “Part II. Item 8. Financial Statements and Supplementary Data.”
Net income attributable to noncontrolling interest.
Net income attributable to noncontrolling interest for financial reporting purposes represents A/N’s portion of Charter Holdings’ net income based on its effective common unit ownership interest of approximately 10% and on the preferred dividend of $150 million and $93 million for the years ended
December 31, 2017
and 2016, respectively. For more information, see Note 11 to the accompanying consolidated financial statements contained in “Part II. Item 8. Financial Statements and Supplementary Data.”
Net income (loss) attributable to Charter shareholders.
Net income attributable to Charter shareholders was
$9.9 billion
and
$3.5 billion
for the years ended
December 31, 2017
and
2016
, respectively, and net loss attributable to Charter shareholders was
$271 million
for the year ended
December 31, 2015
primarily as a result of the factors described above. On a pro forma basis, assuming the Transactions occurred as of January 1, 2015, net income attributable to Charter shareholders was $1.1 billion and $159 million for the years ended
December 31, 2016
and
2015
, respectively.
43
Use of Adjusted EBITDA
and Free Cash Flow
We use certain measures that are not defined by U.S. generally accepted accounting principles (“GAAP”) to evaluate various aspects of our business. Adjusted EBITDA and free cash flow are non-GAAP financial measures and should be considered in addition to, not as a substitute for, consolidated net income (loss) and net cash flows from operating activities reported in accordance with GAAP. These terms, as defined by us, may not be comparable to similarly titled measures used by other companies. Adjusted EBITDA and free cash flow are reconciled to consolidated net income (loss) and net cash flows from operating activities, respectively, below.
Adjusted EBITDA eliminates the significant non-cash depreciation and amortization expense that results from the capital-intensive nature of our businesses as well as other non-cash or special items, and is unaffected by our capital structure or investment activities. However, this measure is limited in that it does not reflect the periodic costs of certain capitalized tangible and intangible assets used in generating revenues and our cash cost of financing. These costs are evaluated through other financial measures.
Free cash flow is defined as net cash flows from operating activities, less capital expenditures and changes in accrued expenses related to capital expenditures.
Management and Charter’s board of directors use Adjusted EBITDA and free cash flow to assess our performance and our ability to service our debt, fund operations and make additional investments with internally generated funds. In addition, Adjusted EBITDA generally correlates to the leverage ratio calculation under our credit facilities or outstanding notes to determine compliance with the covenants contained in the facilities and notes (all such documents have been previously filed with the SEC). For the purpose of calculating compliance with leverage covenants, we use Adjusted EBITDA, as presented, excluding certain expenses paid by our operating subsidiaries to other Charter entities. Our debt covenants refer to these expenses as management fees, which fees were in the amount of
$1.1 billion
,
$930 million
and
$322 million
for the years ended
December 31, 2017
,
2016
and
2015
, respectively.
|
Years ended December 31,
|
|||||||||||
|
2017
|
2016
|
2015
|
|||||||||
|
Actual
|
|||||||||||
|
Consolidated net income (loss)
|
$
|
10,115
|
|
$
|
3,745
|
|
$
|
(271
|
)
|
||
|
Plus: Interest expense, net
|
3,090
|
|
2,499
|
|
1,306
|
|
|||||
|
Income tax benefit
|
(9,087
|
)
|
(2,925
|
)
|
(60
|
)
|
|||||
|
Depreciation and amortization
|
10,588
|
|
6,907
|
|
2,125
|
|
|||||
|
Stock compensation expense
|
261
|
|
244
|
|
78
|
|
|||||
|
Loss on extinguishment of debt
|
40
|
|
111
|
|
128
|
|
|||||
|
(Gain) loss on financial instruments, net
|
(69
|
)
|
(89
|
)
|
4
|
|
|||||
|
Other pension benefits
|
(1
|
)
|
(899
|
)
|
—
|
|
|||||
|
Other, net
|
364
|
|
999
|
|
96
|
|
|||||
|
Adjusted EBITDA
|
$
|
15,301
|
|
$
|
10,592
|
|
$
|
3,406
|
|
||
|
Net cash flows from operating activities
|
$
|
11,954
|
|
$
|
8,041
|
|
$
|
2,359
|
|
||
|
Less: Purchases of property, plant and equipment
|
(8,681
|
)
|
(5,325
|
)
|
(1,840
|
)
|
|||||
|
Change in accrued expenses related to capital expenditures
|
820
|
|
603
|
|
28
|
|
|||||
|
Free cash flow
|
$
|
4,093
|
|
$
|
3,319
|
|
$
|
547
|
|
||
44
|
Year Ended December 31,
|
|||||||
|
2016
|
2015
|
||||||
|
Pro Forma
|
|||||||
|
Consolidated net income
|
$
|
1,399
|
|
$
|
338
|
|
|
|
Plus: Interest expense, net
|
2,883
|
|
2,968
|
|
|||
|
Income tax expense
|
498
|
|
102
|
|
|||
|
Depreciation and amortization
|
9,555
|
|
9,348
|
|
|||
|
Stock compensation expense
|
295
|
|
246
|
|
|||
|
Loss on extinguishment of debt
|
111
|
|
128
|
|
|||
|
(Gain) loss on financial instruments, net
|
(89
|
)
|
4
|
|
|||
|
Other pension benefits
|
(915
|
)
|
(73
|
)
|
|||
|
Other, net
|
727
|
|
(57
|
)
|
|||
|
Adjusted EBITDA
|
$
|
14,464
|
|
$
|
13,004
|
|
|
Liquidity and Capital Resources
Overview
We have significant amounts of debt. The principal amount of our debt as of
December 31, 2017
was
$69.0 billion
, consisting of
$9.5 billion
of credit facility debt,
$40.6 billion
of investment grade senior secured notes and
$18.9 billion
of high-yield senior unsecured notes. Our business requires significant cash to fund principal and interest payments on our debt.
Our projected cash needs and projected sources of liquidity depend upon, among other things, our actual results, and the timing and amount of our expenditures. As we launch our new mobile services, we expect an initial funding period to grow a new product as well as negative working capital impacts from the timing of device-related cash flows when we provide the handset or tablet to customers pursuant to equipment installment plans. Free cash flow was
$4.1 billion
,
$3.3 billion
and
$547 million
for the years ended
December 31, 2017
,
2016
and
2015
, respectively. As of
December 31, 2017
, the amount available under our credit facilities was approximately
$3.6 billion
and cash on hand was approximately
$621 million
. We expect to utilize free cash flow, cash on hand and availability under our credit facilities as well as future refinancing transactions to further extend the maturities of our obligations. The timing and terms of any refinancing transactions will be subject to market conditions among other considerations. Additionally, we may, from time to time, and depending on market conditions and other factors, use cash on hand and the proceeds from securities offerings or other borrowings to retire our debt through open market purchases, privately negotiated purchases, tender offers or redemption provisions. We believe we have sufficient liquidity from cash on hand, free cash flow and Charter Operating’s revolving credit facility as well as access to the capital markets to fund our projected cash needs.
We continue to evaluate the deployment of our cash on hand and anticipated future free cash flow including to invest in our business growth and other strategic opportunities, including mergers and acquisitions as well as stock repurchases and dividends. Our target leverage remains at 4 to 4.5 times, and up to 3.5 times at the Charter Operating level. Our leverage ratio was 4.5 as of
December 31, 2017
. We may increase the total amount of our indebtedness to maintain leverage within our target leverage range. During the years ended
December 31, 2017
and
2016
, we purchased approximately
33.4 million
and
5.1 million
shares, respectively, of Charter Class A common stock for approximately
$11.6 billion
and
$1.3 billion
, respectively. As of
December 31, 2017
, Charter had remaining board authority to purchase an additional
$1.1 billion
of Charter’s Class A common stock and/or Charter Holdings common units. Charter is not obligated to acquire any particular amount of common stock, and the timing of any purchases that may occur cannot be predicted and will largely depend on market conditions and other potential uses of capital. Purchases may include open market purchases, tender offers or negotiated transactions.
As possible acquisitions, swaps or dispositions arise, we actively review them against our objectives including, among other considerations, improving the operational efficiency, clustering, product development or technology capabilities of our business and achieving appropriate return targets, and we may participate to the extent we believe these possibilities present attractive opportunities. However, there can be no assurance that we will actually complete any acquisitions, dispositions or system swaps, or that any such transactions will be material to our operations or results.
In December 2016, Charter and A/N entered into a letter agreement (the "Letter Agreement") that requires A/N to sell to Charter or to Charter Holdings, on a monthly basis, a number of shares of Charter Class A common stock or Charter Holdings common units that represents a pro rata participation by A/N and its affiliates in any repurchases of shares of Charter Class A common stock from persons other than A/N effected by Charter during the immediately preceding calendar month, at a purchase price equal to
45
the average price paid by Charter for the shares repurchased from persons other than A/N during such immediately preceding calendar month. A/N and Charter both have the right to terminate or suspend the pro rata repurchase arrangement on a prospective basis once Charter or Charter Holdings have repurchased shares of Class A common stock or Charter Holdings common units from A/N and its affiliates for an aggregate purchase price of
$537 million
, which threshold has been met. On December 21, 2017, Charter and A/N entered into an amendment to the Letter Agreement resetting the aggregate purchase price to
$400 million
. Charter Holdings purchased from A/N
4.8 million
and
0.8 million
Charter Holdings common units at an average price per unit of
$347.03
and
$289.83
, or
$1.7 billion
and
$218 million
during the years ended
December 31, 2017
and
2016
, respectively.
Free Cash Flow
Free cash flow increased
$774 million
and
$2.8 billion
during the years ended
December 31, 2017
and
2016
compared to the corresponding prior periods, respectively, due to the following.
|
2017 compared to 2016
|
2016 compared to 2015
|
||||||
|
Increase in Adjusted EBITDA
|
$
|
4,709
|
|
$
|
7,186
|
|
|
|
Increase in capital expenditures
|
(3,356
|
)
|
(3,485
|
)
|
|||
|
Changes in working capital, excluding change in accrued interest, net of effects from acquisitions
|
(361
|
)
|
1,387
|
|
|||
|
Increase in cash paid for interest, net
|
(761
|
)
|
(1,602
|
)
|
|||
|
(Increase) decrease in merger and restructuring costs
|
420
|
|
(652
|
)
|
|||
|
Other, net
|
123
|
|
(62
|
)
|
|||
|
$
|
774
|
|
$
|
2,772
|
|
||
Contractual Obligations
The following table summarizes our payment obligations as of
December 31, 2017
under our long-term debt and certain other contractual obligations and commitments (dollars in millions.)
|
Payments by Period
|
|||||||||||||||||||||
|
Total
|
Less than 1 year
|
1-3 years
|
3-5 years
|
More than 5 years
|
|||||||||||||||||
|
Long-Term Debt Principal Payments
(a)
|
$
|
69,003
|
|
$
|
2,207
|
|
$
|
7,164
|
|
$
|
6,864
|
|
$
|
52,768
|
|
||||||
|
Long-Term Debt Interest Payments
(b)
|
44,013
|
|
3,762
|
|
6,850
|
|
6,315
|
|
27,086
|
|
|||||||||||
|
Capital and Operating Lease Obligations
(c)
|
1,512
|
|
286
|
|
434
|
|
297
|
|
495
|
|
|||||||||||
|
Programming Minimum Commitments
(d)
|
164
|
|
103
|
|
61
|
|
—
|
|
—
|
|
|||||||||||
|
Other
(e)
|
13,626
|
|
1,917
|
|
1,870
|
|
1,152
|
|
8,687
|
|
|||||||||||
|
$
|
128,318
|
|
$
|
8,275
|
|
$
|
16,379
|
|
$
|
14,628
|
|
$
|
89,036
|
|
|||||||
|
(a)
|
The table presents maturities of long-term debt outstanding as of
December 31, 2017
. Refer to Notes 9 and 20 to our accompanying consolidated financial statements contained in “Part II. Item 8. Financial Statements and Supplementary Data” for a description of our long-term debt and other contractual obligations and commitments.
|
|
(b)
|
Interest payments on variable debt are estimated using amounts outstanding at
December 31, 2017
and the average implied forward London Interbank Offering Rate (“LIBOR”) rates applicable for the quarter during the interest rate reset based on the yield curve in effect at
December 31, 2017
. Actual interest payments will differ based on actual LIBOR rates and actual amounts outstanding for applicable periods.
|
|
(c)
|
We lease certain facilities and equipment under noncancelable capital and operating leases. Capital lease obligations represented
$123 million
of total capital and operating lease obligations as of
December 31, 2017
. Leases and rental costs charged to expense for the years ended
December 31, 2017
,
2016
and
2015
, were
$321 million
,
$215 million
and
$49 million
, respectively.
|
|
(d)
|
We pay programming fees under multi-year contracts typically based on a flat fee per customer, which may be fixed for the term, or may in some cases escalate over the term. Programming costs included in the accompanying statement of operations were approximately
$10.6 billion
,
$7.0 billion
and
$2.7 billion
, for the years ended
December 31, 2017
,
2016
and
2015
, respectively. Certain of our programming agreements are based on a flat fee per month or have guaranteed
|
46
minimum payments. The table sets forth the aggregate guaranteed minimum commitments under our programming contracts.
|
(e)
|
“Other” represents other guaranteed minimum commitments, including rights negotiated directly with content owners for distribution on company-owned channels or networks, commitments related to our role as an advertising and distribution sales agent for third party-owned channels or networks, commitments to our customer premise equipment vendors and contractual obligations related to third-party network augmentation.
|
The following items are not included in the contractual obligations table because the obligations are not fixed and/or determinable due to various factors discussed below. However, we incur these costs as part of our operations:
|
•
|
We rent utility poles used in our operations. Generally, pole rentals are cancelable on short notice, but we anticipate that such rentals will recur. Rent expense incurred for pole rental attachments for the years ended
December 31, 2017
,
2016
and
2015
was
$167 million
,
$115 million
and
$53 million
, respectively.
|
|
•
|
We pay franchise fees under multi-year franchise agreements based on a percentage of revenues generated from video service per year. We also pay other franchise related costs, such as public education grants, under multi-year agreements. Franchise fees and other franchise-related costs included in the accompanying statement of operations were
$705 million
,
$534 million
and
$212 million
for the years ended
December 31, 2017
,
2016
and
2015
, respectively.
|
|
•
|
We have
$291 million
in letters of credit, of which
$137 million
is secured under the Charter Operating credit facility, primarily to our various casualty carriers as collateral for reimbursement of workers' compensation, auto liability and general liability claims.
|
|
•
|
Minimum pension funding requirements have not been presented in the table above as such amounts have not been determined beyond
2017
. We made no cash contributions to the qualified pension plans in
2017
; however, we are permitted to make discretionary cash contributions to the qualified pension plans in
2018
. For the nonqualified pension plan, we contributed
$18 million
during
2017
and will continue to make contributions in
2018
to the extent benefits are paid.
|
See "Part I. Item 1. Business — Transaction-Related Commitments" for a listing of commitments as a result of the Transactions.
Historical Operating, Investing, and Financing Activities
Cash and Cash Equivalents.
We held
$621 million
and
$1.5 billion
in cash and cash equivalents as of
December 31, 2017
and
2016
, respectively.
Operating Activities.
Net cash provided by operating activities increased
$3.9 billion
during the year ended
December 31, 2017
compared to the year ended
December 31, 2016
, primarily due to an increase in Adjusted EBITDA of
$4.7 billion
offset by an increase in cash paid for interest, net of $761 million as a result of the Transactions and long-term debt issued for general corporate purposes including stock buybacks.
Net cash provided by operating activities increased
$5.7 billion
during the year ended
December 31, 2016
compared to the year ended
December 31, 2015
, primarily due to an increase in Adjusted EBITDA of
$7.2 billion
offset by an increase in cash paid for interest, net of $1.6 billion primarily as a result of the Transactions.
Investing Activities.
Net cash used in investing activities for the years ended
December 31, 2017
,
2016
and
2015
, was
$8.1 billion
,
$11.3 billion
and
$17.0 billion
, respectively. The changes in cash used were primarily due to the acquisition of Legacy TWC and Legacy Bright House in 2016 as well as increases in capital expenditures as a result of the Transactions.
Financing Activities.
Net cash used in financing activities increased
$9.5 billion
during the year ended
December 31, 2017
compared to the year ended
December 31, 2016
primarily due to increases in the purchase of treasury stock and noncontrolling interest as well as a decrease in equity issued offset by an increase in borrowings of long-term debt exceeding repayments.
Net cash provided in financing activities decreased
$9.9 billion
during the year ended
December 31, 2016
compared to the year ended
December 31, 2015
primarily due to a decrease in borrowings of long-term debt exceeding repayments as well as increases in the purchase of treasury stock and noncontrolling interest offset by an increase in equity issued for the acquisition of Legacy TWC and Legacy Bright House in 2016.
Capital Expenditures
We have significant ongoing capital expenditure requirements. Capital expenditures were
$8.7 billion
,
$5.3 billion
and
$1.8 billion
for the years ended
December 31, 2017
,
2016
and
2015
, respectively. The increase was driven by the Transactions. On a pro forma basis, assuming the Transactions occurred as of January 1, 2015, the increase during 2017 as compared to 2016 was driven
47
by higher CPE purchases for SPP, our all-digital initiative and early inventory purchases to operationally stage 2018 activity, higher support capital investments and line extensions. See the table below for more details.
The actual amount of our capital expenditures in 2018 will depend on a number of factors, including our all-digital transition in the Legacy TWC and Legacy Bright House markets, further spend related to product development and growth rates of both our residential and commercial businesses.
Our capital expenditures are funded primarily from cash flows from operating activities and borrowings on our credit facility. In addition, our accrued liabilities related to capital expenditures increased by
$820 million
,
$603 million
and
$28 million
for the years ended
December 31, 2017
,
2016
and
2015
, respectively.
The following tables present our major capital expenditures categories on an actual and pro forma basis, assuming the Transactions occurred as of January 1, 2015, in accordance with National Cable and Telecommunications Association (“NCTA”) disclosure guidelines for the years ended
December 31, 2017
,
2016
and
2015
. The disclosure is intended to provide more consistency in the reporting of capital expenditures among peer companies in the cable industry. These disclosure guidelines are not required disclosures under GAAP, nor do they impact our accounting for capital expenditures under GAAP (dollars in millions):
|
Year ended December 31,
|
|||||||||||
|
2017
|
2016
|
2015
|
|||||||||
|
Actual
|
|||||||||||
|
Customer premise equipment
(a)
|
$
|
3,385
|
|
$
|
1,864
|
|
$
|
582
|
|
||
|
Scalable infrastructure
(b)
|
2,007
|
|
1,390
|
|
523
|
|
|||||
|
Line extensions
(c)
|
1,176
|
|
721
|
|
194
|
|
|||||
|
Upgrade/rebuild
(d)
|
572
|
|
456
|
|
128
|
|
|||||
|
Support capital
(e)
|
1,541
|
|
894
|
|
413
|
|
|||||
|
Total capital expenditures
|
$
|
8,681
|
|
$
|
5,325
|
|
$
|
1,840
|
|
||
|
Capital expenditures included in total related to:
|
|||||||||||
|
Commercial services
|
$
|
1,298
|
|
$
|
824
|
|
$
|
260
|
|
||
|
Transition
(f)
|
$
|
489
|
|
$
|
460
|
|
$
|
115
|
|
||
|
Year ended December 31,
|
|||||||
|
2016
|
2015
|
||||||
|
Pro Forma
|
|||||||
|
Customer premise equipment
(a)
|
$
|
2,761
|
|
$
|
2,650
|
|
|
|
Scalable infrastructure
(b)
|
2,009
|
|
1,702
|
|
|||
|
Line extensions
(c)
|
1,005
|
|
977
|
|
|||
|
Upgrade/rebuild
(d)
|
610
|
|
594
|
|
|||
|
Support capital
(e)
|
1,160
|
|
1,046
|
|
|||
|
Total capital expenditures
|
$
|
7,545
|
|
$
|
6,969
|
|
|
|
(a)
|
Customer premise equipment includes costs incurred at the customer residence to secure new customers and revenue generating units. It also includes customer installation costs and customer premise equipment (e.g., set-top boxes and cable modems).
|
|
(b)
|
Scalable infrastructure includes costs not related to customer premise equipment, to secure growth of new customers and revenue generating units, or provide service enhancements (e.g., headend equipment).
|
|
(c)
|
Line extensions include network costs associated with entering new service areas (e.g., fiber/coaxial cable, amplifiers, electronic equipment, make-ready and design engineering).
|
|
(d)
|
Upgrade/rebuild includes costs to modify or replace existing fiber/coaxial cable networks, including betterments.
|
|
(e)
|
Support capital includes costs associated with the replacement or enhancement of non-network assets due to technological and physical obsolescence (e.g., non-network equipment, land, buildings and vehicles).
|
|
(f)
|
Transition represents incremental costs incurred to integrate the Legacy TWC and Legacy Bright House operations and to bring the three companies’ systems and processes into a uniform operating structure.
|
48
Debt
As of
December 31, 2017
, the accreted value of our total debt was approximately
$70.2 billion
, as summarized below (dollars in millions):
|
December 31, 2017
|
|||||||||||
|
Principal Amount
|
Accreted Value
(a)
|
Interest Payment Dates
|
Maturity Date
(b)
|
||||||||
|
CCO Holdings, LLC:
|
|||||||||||
|
5.250% senior notes due 2021
|
$
|
500
|
|
$
|
497
|
|
3/15 & 9/15
|
3/15/2021
|
|||
|
5.250% senior notes due 2022
|
1,250
|
|
1,235
|
|
3/30 & 9/30
|
9/30/2022
|
|||||
|
5.125% senior notes due 2023
|
1,000
|
|
993
|
|
2/15 & 8/15
|
2/15/2023
|
|||||
|
4.000% senior notes due 2023
|
500
|
|
495
|
|
3/1 & 9/1
|
3/1/2023
|
|||||
|
5.125% senior notes due 2023
|
1,150
|
|
1,143
|
|
5/1 & 11/1
|
5/1/2023
|
|||||
|
5.750% senior notes due 2023
|
500
|
|
496
|
|
3/1 & 9/1
|
9/1/2023
|
|||||
|
5.750% senior notes due 2024
|
1,000
|
|
992
|
|
1/15 & 7/15
|
1/15/2024
|
|||||
|
5.875% senior notes due 2024
|
1,700
|
|
1,687
|
|
4/1 & 10/1
|
4/1/2024
|
|||||
|
5.375% senior notes due 2025
|
750
|
|
745
|
|
5/1 & 11/1
|
5/1/2025
|
|||||
|
5.750% senior notes due 2026
|
2,500
|
|
2,464
|
|
2/15 & 8/15
|
2/15/2026
|
|||||
|
5.500% senior notes due 2026
|
1,500
|
|
1,489
|
|
5/1 & 11/1
|
5/1/2026
|
|||||
|
5.875% senior notes due 2027
|
800
|
|
794
|
|
5/1 & 11/1
|
5/1/2027
|
|||||
|
5.125% senior notes due 2027
|
3,250
|
|
3,216
|
|
5/1 & 11/1
|
5/1/2027
|
|||||
|
5.000% senior notes due 2028
|
2,500
|
|
2,462
|
|
2/1 & 8/1
|
2/1/2028
|
|||||
|
Charter Communications Operating, LLC:
|
|||||||||||
|
3.579% senior notes due 2020
|
2,000
|
|
1,988
|
|
1/23 & 7/23
|
7/23/2020
|
|||||
|
4.464% senior notes due 2022
|
3,000
|
|
2,977
|
|
1/23 & 7/23
|
7/23/2022
|
|||||
|
4.908% senior notes due 2025
|
4,500
|
|
4,462
|
|
1/23 & 7/23
|
7/23/2025
|
|||||
|
3.750% senior notes due 2028
|
1,000
|
|
985
|
|
2/15 & 8/15
|
2/15/2028
|
|||||
|
4.200% senior notes due 2028
|
1,250
|
|
1,238
|
|
3/15 & 9/15
|
3/15/2028
|
|||||
|
6.384% senior notes due 2035
|
2,000
|
|
1,981
|
|
4/23 & 10/23
|
10/23/2035
|
|||||
|
6.484% senior notes due 2045
|
3,500
|
|
3,466
|
|
4/23 & 10/23
|
10/23/2045
|
|||||
|
5.375% senior notes due 2047
|
2,500
|
|
2,506
|
|
5/1 & 11/1
|
5/1/2047
|
|||||
|
6.834% senior notes due 2055
|
500
|
|
495
|
|
4/23 & 10/23
|
10/23/2055
|
|||||
|
Credit facilities
|
9,479
|
|
9,387
|
|
Varies
|
||||||
|
Time Warner Cable, LLC:
|
|||||||||||
|
6.750% senior notes due 2018
|
2,000
|
|
2,045
|
|
1/1 & 7/1
|
7/1/2018
|
|||||
|
8.750% senior notes due 2019
|
1,250
|
|
1,337
|
|
2/14 & 8/14
|
2/14/2019
|
|||||
|
8.250% senior notes due 2019
|
2,000
|
|
2,148
|
|
4/1 & 10/1
|
4/1/2019
|
|||||
|
5.000% senior notes due 2020
|
1,500
|
|
1,579
|
|
2/1 & 8/1
|
2/1/2020
|
|||||
|
4.125% senior notes due 2021
|
700
|
|
730
|
|
2/15 & 8/15
|
2/15/2021
|
|||||
|
4.000% senior notes due 2021
|
1,000
|
|
1,045
|
|
3/1 & 9/1
|
9/1/2021
|
|||||
|
5.750% sterling senior notes due 2031
(c)
|
845
|
|
912
|
|
6/2
|
6/2/2031
|
|||||
|
6.550% senior debentures due 2037
|
1,500
|
|
1,686
|
|
5/1 & 11/1
|
5/1/2037
|
|||||
|
7.300% senior debentures due 2038
|
1,500
|
|
1,788
|
|
1/1 & 7/1
|
7/1/2038
|
|||||
|
6.750% senior debentures due 2039
|
1,500
|
|
1,724
|
|
6/15 & 12/15
|
6/15/2039
|
|||||
|
5.875% senior debentures due 2040
|
1,200
|
|
1,258
|
|
5/15 & 11/15
|
11/15/2040
|
|||||
|
5.500% senior debentures due 2041
|
1,250
|
|
1,258
|
|
3/1 & 9/1
|
9/1/2041
|
|||||
|
5.250% sterling senior notes due 2042
(d)
|
879
|
|
847
|
|
7/15
|
7/15/2042
|
|||||
|
4.500% senior debentures due 2042
|
1,250
|
|
1,137
|
|
3/15 & 9/15
|
9/15/2042
|
|||||
|
Time Warner Cable Enterprises LLC:
|
|||||||||||
|
8.375% senior debentures due 2023
|
1,000
|
|
1,232
|
|
3/15 & 9/15
|
3/15/2023
|
|||||
|
8.375% senior debentures due 2033
|
1,000
|
|
1,312
|
|
7/15 & 1/15
|
7/15/2033
|
|||||
|
$
|
69,003
|
|
$
|
70,231
|
|
||||||
49
|
(a)
|
The accreted values presented in the table above represent the principal amount of the debt less the original issue discount at the time of sale, deferred financing costs, and, in regards to the Legacy TWC debt assumed, fair value premium adjustments as a result of applying acquisition accounting plus the accretion of those amounts to the balance sheet date. However, the amount that is currently payable if the debt becomes immediately due is equal to the principal amount of the debt. In regards to the Sterling Notes, the principal amount of the debt and any premium or discount is remeasured into US dollars as of each balance sheet date. We have availability under our credit facilities of approximately
$3.6 billion
as of
December 31, 2017
.
|
|
(b)
|
In general, the obligors have the right to redeem all of the notes set forth in the above table in whole or in part at their option, beginning at various times prior to their stated maturity dates, subject to certain conditions, upon the payment of the outstanding principal amount (plus a specified redemption premium) and all accrued and unpaid interest.
|
|
(c)
|
Principal amount includes
£625 million
valued at
$845 million
as of
December 31, 2017
using the exchange rate as of
December 31, 2017
.
|
|
(d)
|
Principal amount includes
£650 million
valued at
$879 million
as of
December 31, 2017
using the exchange rate as of
December 31, 2017
.
|
See Note 9 to the accompanying consolidated financial statements contained in “Part II. Item 8. Financial Statements and Supplementary Data” for further details regarding our outstanding debt and other financing arrangements, including certain information about maturities, covenants and restrictions related to such debt and financing arrangements. The agreements and instruments governing our debt and financing arrangements are complicated and you should consult such agreements and instruments which are filed with the SEC for more detailed information.
At
December 31, 2017
, Charter Operating had a consolidated leverage ratio of approximately 3.0 to 1.0 and a consolidated first lien leverage ratio of 2.9 to 1.0. Both ratios are in compliance with the ratios required by the Charter Operating credit facilities of 5.0 to 1.0 consolidated leverage ratio and 4.0 to 1.0 consolidated first lien leverage ratio. A failure by Charter Operating to maintain the financial covenants would result in an event of default under the Charter Operating credit facilities and the debt of CCO Holdings. See “Part I. Item 1A. Risk Factors — The agreements and instruments governing our debt contain restrictions and limitations that could significantly affect our ability to operate our business, as well as significantly affect our liquidity.”
Recently Issued Accounting Standards
See Note 22 to the accompanying consolidated financial statements contained in “Part II. Item 8. Financial Statements and Supplementary Data” for a discussion of recently issued accounting standards.
Item 7A.
Quantitative and Qualitative Disclosures About Market Risk.
We use derivative instruments to manage interest rate risk on variable debt and foreign exchange risk on the Sterling Notes, and do not hold or issue derivative instruments for speculative trading purposes.
Cross-currency derivative instruments are used to effectively convert £1.275 billion aggregate principal amount of fixed-rate British pound sterling denominated debt, including annual interest payments and the payment of principal at maturity, to fixed-rate U.S. dollar denominated debt. The cross-currency derivative instruments have maturities of June 2031 and July 2042. We are required to post collateral on the cross-currency derivative instruments when such instruments are in a liability position. In May 2016, we entered into a collateral holiday agreement for 80% of both the 2031 and 2042 cross-currency swaps, which eliminates the requirement to post collateral for three years. The fair value of our cross-currency derivatives included in other long-term liabilities on our consolidated balance sheets was
$25 million
and
$251 million
as of
December 31, 2017
and
2016
, respectively. For more information, see Note 12 to the accompanying consolidated financial statements contained in “Part II. Item 8. Financial Statements and Supplementary Data.”
As of
December 31, 2017
and
2016
, the weighted average interest rate on the credit facility debt was approximately 3.4% and 2.9%, respectively, and the weighted average interest rate on the senior notes was approximately 5.7% and 5.9%, respectively, resulting in a blended weighted average interest rate of 5.4% and 5.4%, respectively. The interest rate on approximately
86%
and
87%
of the total principal amount of our debt was effectively fixed, including the effects of our interest rate swap agreements, as of
December 31, 2017
and
2016
, respectively. All of our interest rate derivatives were expired as of December 31, 2017.
50
The table set forth below summarizes the fair values and contract terms of financial instruments subject to interest rate risk maintained by us as of
December 31, 2017
(dollars in millions):
|
2018
|
2019
|
2020
|
2021
|
2022
|
Thereafter
|
Total
|
Fair Value
|
|||||||||||||||||||||||||
|
Debt:
|
||||||||||||||||||||||||||||||||
|
Fixed Rate
|
$
|
2,000
|
|
$
|
3,250
|
|
$
|
3,500
|
|
$
|
2,200
|
|
$
|
4,250
|
|
$
|
44,324
|
|
$
|
59,524
|
|
$
|
63,443
|
|
||||||||
|
Average Interest Rate
|
6.75
|
%
|
8.44
|
%
|
4.19
|
%
|
4.32
|
%
|
4.70
|
%
|
5.70
|
%
|
5.67
|
%
|
||||||||||||||||||
|
Variable Rate
|
$
|
207
|
|
$
|
207
|
|
$
|
207
|
|
$
|
207
|
|
$
|
207
|
|
$
|
8,444
|
|
$
|
9,479
|
|
$
|
9,440
|
|
||||||||
|
Average Interest Rate
|
3.60
|
%
|
3.90
|
%
|
3.98
|
%
|
4.01
|
%
|
4.05
|
%
|
4.39
|
%
|
4.34
|
%
|
||||||||||||||||||
Interest rates on variable-rate debt are estimated using the average implied forward LIBOR for the year of maturity based on the yield curve in effect at
December 31, 2017
including applicable bank spread.
Item 8.
Financial Statements and Supplementary Data.
Our consolidated financial statements, the related notes thereto, and the reports of independent accountants are included in this annual report beginning on page F-1.
Item 9.
Changes in and Disagreements with Accountants on Accounting and Financial Disclosure.
None.
Item 9A.
Controls and Procedures.
Conclusion Regarding the Effectiveness of Disclosure Controls and Procedures
As of the end of the period covered by this report, under the supervision and with the participation of our management, including our Chief Executive Officer and Chief Financial Officer, we have evaluated the effectiveness of the design and operation of disclosure controls and procedures with respect to the information generated for use in this annual report. The evaluation was based upon reports and certifications provided by a number of executives. Based on, and as of the date of that evaluation, our Chief Executive Officer and Chief Financial Officer concluded that the disclosure controls and procedures were effective to provide reasonable assurances that information required to be disclosed in the reports we file or submit under the Securities Exchange Act of 1934 is recorded, processed, summarized and reported within the time periods specified in the SEC’s rules and forms.
In designing and evaluating the disclosure controls and procedures, our management recognized that any controls and procedures, no matter how well designed and operated, can provide only reasonable, not absolute, assurance of achieving the desired control objectives, and management necessarily was required to apply its judgment in evaluating the cost-benefit relationship of possible controls and procedures. Based upon the above evaluation, we believe that our controls provide such reasonable assurances.
During the quarter ended
December 31, 2017
, there was no change in our internal control over financial reporting that has materially affected, or is reasonably likely to materially affect, our internal control over financial reporting.
Management’s Report on Internal Control Over Financial Reporting
Our management is responsible for establishing and maintaining adequate internal control over financial reporting (as defined in Rule 13a-15(f) under the Exchange Act) for the Company. Our internal control system was designed to provide reasonable assurance to our management and board of directors regarding the preparation and fair presentation of published financial statements.
Management has assessed the effectiveness of our internal control over financial reporting as of
December 31, 2017
. In making this assessment, we used the criteria set forth by the Committee of Sponsoring Organizations of the Treadway Commission (“COSO”) in
Internal Control — Integrated Framework
(2013)
.
Based on management’s assessment utilizing these criteria we believe that, as of
December 31, 2017
, our internal control over financial reporting was effective
.
51
Our independent auditors, KPMG LLP, have audited our internal control over financial reporting as stated in their report on page F-2.
Item 9B.
Other Information.
None.
52
Item 10.
Directors, Executive Officers and Corporate Governance.
The information required by Item 10 will be included in Charter’s 2018 Proxy Statement (the “Proxy Statement”) under the headings “Election of Class A Directors,” “Section 16(a) Beneficial Ownership Reporting Requirements,” and “Code of Ethics,” or in amendment to this Annual Report on Form 10-K and is incorporated herein by reference.
Item 11.
Executive Compensation.
The information required by Item 11 will be included in the Proxy Statement under the headings “Executive Compensation,” “Election of Class A Directors – Director Compensation” and “Compensation Discussion and Analysis,” or in an amendment to this Annual Report on Form 10-K and is incorporated herein by reference. Information contained in the Proxy Statement or an amendment to this Annual Report on Form 10-K
under the caption “Report of Compensation and Benefits Committee” is furnished and not deemed filed with the SEC.
Item 12.
Security Ownership of Certain Beneficial Owners and Management and Related Stockholder Matters.
The information required by Item 12 will be included in the Proxy Statement under the heading “Security Ownership of Certain Beneficial Owners and Management” or in amendment to this Annual Report on Form 10-K and is incorporated herein by reference.
Item 13.
Certain Relationships and Related Transactions, and Director Independence.
The information required by Item 13 will be included in the Proxy Statement under the heading “Certain Relationships and Related Transactions” and “Election of Class A Directors” or in amendment to this Annual Report on Form 10-K and is incorporated herein by reference.
Item 14.
Principal Accounting Fees and Services
.
The information required by Item 14 will be included in the Proxy Statement under the heading “Accounting Matters” or in amendment to this Annual Report on Form 10-K and is incorporated herein by reference.
53
Item 15.
Exhibits and Financial Statement Schedules.
|
(a)
|
The following documents are filed as part of this annual report:
|
|
(1)
|
Financial Statements.
|
A listing of the financial statements, notes and reports of independent public accountants required by "Part II. Item 8. Financial Statements and Supplementary Data" begins on page F-1 of this annual report.
|
(2)
|
Financial Statement Schedules.
|
No financial statement schedules are required to be filed by Items 8 and 15(c) because they are not required or are not applicable, or the required information is set forth in the applicable financial statements or notes thereto.
|
(3)
|
The index to the exhibits begins on page E-1 of this annual report.
|
54
SIGNATURES
Pursuant to the requirements of Section 13 or 15(d) of the Securities Exchange Act of 1934, Charter Communications, Inc. has duly caused this annual report to be signed on its behalf by the undersigned, thereunto duly authorized.
|
CHARTER COMMUNICATIONS, INC.,
|
||||
|
Registrant
|
||||
|
By:
|
/s/ Thomas M. Rutledge
|
|||
|
Thomas M. Rutledge
|
||||
|
Chairman and Chief Executive Officer
|
||||
|
Date: February 2, 2018
|
||||
S- 1
POWER OF ATTORNEY
KNOW ALL MEN BY THESE PRESENTS, that each person whose signature appears below constitutes and appoints Richard R. Dykhouse and Kevin D. Howard, and each of them (with full power to each of them to act alone), his or her true and lawful attorney-in-fact and agent, with full power of substitution and resubstitution, for him or her and in his or her name, place and stead, in any and all capacities, to sign on his or her behalf individually and in each capacity stated below any and all amendments (including post-effective amendments) to this annual report, and to file the same, with all exhibits thereto and other documents in connection therewith, with the Securities and Exchange Commission, granting unto said attorneys-in-fact and agents, and each of them, full power and authority to do and perform each and every act and thing requisite and necessary to be done in and about the premises, as fully to all intents and purposes as he or she might or could do in person, hereby ratifying and confirming all that said attorneys-in-fact and agents and either of them, or their substitutes, may lawfully do or cause to be done by virtue hereof.
Pursuant to the requirements of the Securities Exchange Act of 1934, this report has been signed below by the following persons on behalf of Charter Communications, Inc. and in the capacities and on the dates indicated.
|
Signature
|
Title
|
Date
|
|
/s/ Thomas M. Rutledge
Thomas M. Rutledge |
Chairman, Chief Executive Officer, Director
(Principal Executive Officer) |
February 2, 2018
|
|
/s/ Christopher L. Winfrey
Christopher L. Winfrey |
Chief Financial Officer (Principal Financial Officer)
|
February 2, 2018
|
|
/s/ Kevin D. Howard
Kevin D. Howard |
Senior Vice President – Finance, Controller and Chief Accounting Officer (Principal Accounting Officer)
|
February 2, 2018
|
|
/s/ Eric L. Zinterhofer
Eric L. Zinterhofer |
Director
|
February 2, 2018
|
|
/s/ W. Lance Conn
W. Lance Conn |
Director
|
February 2, 2018
|
|
/s/ Kim C. Goodman
Kim C. Goodman |
Director
|
February 2, 2018
|
|
/s/ Craig A. Jacobson
Craig A. Jacobson |
Director
|
February 2, 2018
|
|
/s/ Gregory Maffei
Gregory Maffei |
Director
|
February 2, 2018
|
|
/s/ John C. Malone
John C. Malone |
Director
|
February 2, 2018
|
|
/s/ John D. Markley, Jr.
John D. Markley, Jr. |
Director
|
February 2, 2018
|
|
/s/ David C. Merritt
David C. Merritt |
Director
|
February 2, 2018
|
|
/s/ Steven Miron
Steven Miron |
Director
|
February 2, 2018
|
|
/s/ Balan Nair
Balan Nair |
Director
|
February 2, 2018
|
|
/s/ Michael Newhouse
Michael Newhouse |
Director
|
February 2, 2018
|
|
/s/ Mauricio Ramos
Mauricio Ramos |
Director
|
February 2, 2018
|
S- 2
Exhibit Index
Exhibits are listed by numbers corresponding to the Exhibit Table of Item 601 in Regulation S-K.
|
Exhibit
|
Description
|
|
|
2.1
|
||
|
2.2
|
||
|
3.1
|
||
|
3.2
|
||
|
4.1(a)
|
||
|
4.1(b)
|
||
|
10.1
|
||
|
10.2
|
||
|
10.3
|
||
|
10.4
|
||
|
10.5
|
||
|
10.6
|
||
|
10.7
|
||
|
10.8
|
||
E- 1
|
10.9
|
||
|
10.10
|
||
|
10.11
|
||
|
10.12
|
||
|
10.13
|
||
|
10.14
|
||
|
10.15
|
||
|
10.16
|
||
|
10.17
|
||
|
10.18
|
||
|
10.19
|
||
|
10.20
|
||
|
10.21
|
||
E- 2
|
10.22
|
||
|
10.23
|
||
|
10.24
|
||
|
10.25
|
||
|
10.26
|
||
|
10.27
|
||
|
10.28
|
||
|
10.29
|
||
|
10.30
|
||
|
10.31
|
||
|
10.32
|
||
|
10.33
|
||
|
10.34
|
||
E- 3
|
10.35
|
||
|
10.36
|
||
|
10.37
|
||
|
10.38
|
||
|
10.39
|
||
|
10.40
|
||
|
10.41
|
||
|
10.42
|
||
|
10.43
|
||
|
10.44
|
||
|
10.45
|
||
|
10.46
|
Indenture, dated as of April 30, 1992 (the “TWCE Indenture”), as amended by the First Supplemental Indenture, dated as of June 30, 1992, among Time Warner Entertainment Company, L.P. (“TWE”), Time Warner Companies, Inc. (“TWCI”), certain of TWCI’s subsidiaries that are parties thereto and The Bank of New York, as Trustee (incorporated herein by reference to Exhibits 10(g) and 10(h) to TWCI’s current report on Form 8-K dated June 26, 1992 and filed with the SEC on July 15, 1992 (File No. 1-8637)). (P)
|
|
|
10.47
|
Second Supplemental Indenture to the TWCE Indenture, dated as of December 9, 1992, among TWE, TWCI, certain of TWCI’s subsidiaries that are parties thereto and The Bank of New York, as Trustee (incorporated herein by reference to Exhibit 4.2 to Amendment No. 1 to TWE’s Registration Statement on Form S-4 dated and filed with the SEC on October 25, 1993 (Registration No. 33-67688) (the “TWE October 25, 1993 Registration Statement”)). (P)
|
|
E- 4
|
10.48
|
Third Supplemental Indenture to the TWCE Indenture, dated as of October 12, 1993, among TWE, TWCI, certain of TWCI’s subsidiaries that are parties thereto and The Bank of New York, as Trustee (incorporated herein by reference to Exhibit 4.3 to the TWE October 25, 1993 Registration Statement). (P)
|
|
|
10.49
|
Fourth Supplemental Indenture to the TWCE Indenture, dated as of March 29, 1994, among TWE, TWCI, certain of TWCI’s subsidiaries that are parties thereto and The Bank of New York, as Trustee (incorporated herein by reference to Exhibit 4.4 to TWE’s Annual Report on Form 10-K for the year ended December 31, 1993 and filed with the SEC on March 30, 1994 (File No. 1-12878)). (P)
|
|
|
10.5
|
Fifth Supplemental Indenture to the TWCE Indenture, dated as of December 28, 1994, among TWE, TWCI, certain of TWCI’s subsidiaries that are parties thereto and The Bank of New York, as Trustee (incorporated herein by reference to Exhibit 4.5 to TWE’s Annual Report on Form 10-K for the year ended December 31, 1994 and filed with the SEC on March 30, 1995 (File No. 1-12878)). (P)
|
|
|
10.51
|
||
|
10.52
|
||
|
10.53
|
||
|
10.54
|
||
|
10.55
|
||
|
10.56
|
||
|
10.57
|
||
|
10.58
|
||
|
10.59
|
||
|
10.60
|
||
|
10.61
|
||
|
10.62
|
||
E- 5
|
10.63
|
||
|
10.64
|
||
|
10.65
|
||
|
10.66
|
||
|
10.67
|
||
|
10.68
|
||
|
10.69
|
||
|
10.70
|
||
|
10.71
|
||
|
10.72
|
||
|
10.73
|
||
|
10.74
|
||
|
10.75
|
||
|
10.76
|
||
|
10.77
|
||
|
10.78
|
||
|
10.79
|
||
|
10.80
|
||
|
10.81
|
||
|
10.82
|
||
|
10.83
|
||
|
10.84(a)
|
||
E- 6
|
10.84(b)
|
||
|
10.84(c)
|
||
|
10.84(d)
|
||
|
10.85
|
||
|
10.86
|
||
|
10.87
|
||
|
10.88
|
||
|
10.89
|
||
|
10.90
|
||
|
10.91
|
||
|
10.92
|
||
|
10.93
|
||
|
10.94
|
||
|
10.95
|
||
|
10.96+
|
||
|
10.97+
|
||
E- 7
|
10.98+
|
||
|
10.99+
|
||
|
10.100+
|
||
|
10.101+
|
||
|
10.102+
|
||
|
10.103+
|
||
|
10.104+
|
||
|
10.105+
|
||
|
10.106+
|
||
|
10.107+
|
||
|
10.108+
|
||
|
10.109(a)+
|
||
|
10.109(b)+
|
||
|
10.109(c)+
|
||
|
10.110(a)+
|
||
|
10.110(b)+
|
||
|
10.110(c)+
|
||
|
10.111+
|
||
|
10.112+
|
||
|
10.113+
|
||
|
10.114+
|
||
E- 8
|
10.115+
|
||
|
10.116+
|
||
|
10.117+
|
||
|
10.118+
|
||
|
10.119+
|
||
|
10.120+
|
||
|
10.121+
|
||
|
10.122
|
||
|
10.123
|
||
|
12.1*
|
||
|
21.1*
|
||
|
23.1*
|
||
|
31.1*
|
||
|
31.2*
|
||
|
32.1*
|
||
|
32.2*
|
||
|
101
|
The following financial information from the Annual Report of Charter Communications, Inc. on Form 10-K for the year ended December 31, 2017, filed with the SEC on February 2, 2018, formatted in eXtensible Business Reporting Language: (i) Consolidated Balance Sheets, (ii) Consolidated Statements of Operations, (iii) Consolidated Statements of Comprehensive Income (Loss), (iv) Consolidated Statements of Changes in Shareholders’ Equity (Deficit), (v) Consolidated Statements of Cash Flows, and (vi) Notes to Consolidated Financial Statements.
|
|
_____________
* Filed herewith.
+
Management compensatory plan or arrangement
E- 9
INDEX TO FINANCIAL STATEMENTS
|
Page
|
|
|
Audited Financial Statements
|
|
F- 1
Report of Independent Registered Public Accounting Firm
To the Shareholders and Board of Directors
Charter Communications, Inc.:
Opinions on the Consolidated Financial Statements and Internal Control Over Financial Reporting
We have audited the accompanying consolidated balance sheets of Charter Communications, Inc. and subsidiaries (the “Company”) as of December 31, 2017 and 2016, the related consolidated statements of operations, comprehensive income (loss), changes in shareholders’ equity (deficit), and cash flows for each of the years in the three-year period ended December 31, 2017, and the related notes (collectively, the “consolidated financial statements”). We also have audited the Company’s internal control over financial reporting as of December 31, 2017, based on criteria established in
Internal Control - Integrated Framework
(2013)
issued by the Committee of Sponsoring Organizations of the Treadway Commission.
In our opinion, the consolidated financial statements referred to above present fairly, in all material respects, the financial position of the Company as of December 31, 2017 and 2016, and the results of its operations and its cash flows for each of the years in the three-year period ended December 31, 2017, in conformity with U.S. generally accepted accounting principles. Also in our opinion, the Company maintained, in all material respects, effective internal control over financial reporting as of December 31, 2017, based on criteria established in
Internal Control - Integrated Framework (2013)
issued by the Committee of Sponsoring Organizations of the Treadway Commission.
Basis for Opinion
The Company’s management is responsible for these consolidated financial statements, for maintaining effective internal control over financial reporting, and for its assessment of the effectiveness of internal control over financial reporting, included in the accompanying Management’s Report on Internal Control Over Financial Reporting. Our responsibility is to express an opinion on the Company’s consolidated financial statements and an opinion on the Company’s internal control over financial reporting based on our audits. We are a public accounting firm registered with the Public Company Accounting Oversight Board (United States) (“PCAOB”) and are required to be independent with respect to the Company in accordance with the U.S. federal securities laws and the applicable rules and regulations of the Securities and Exchange Commission and the PCAOB.
We conducted our audits in accordance with the standards of the PCAOB. Those standards require that we plan and perform the audits to obtain reasonable assurance about whether the consolidated financial statements are free of material misstatement, whether due to error or fraud, and whether effective internal control over financial reporting was maintained in all material respects.
Our audits of the consolidated financial statements included performing procedures to assess the risks of material misstatement of the consolidated financial statements, whether due to error or fraud, and performing procedures that respond to those risks. Such procedures included examining, on a test basis, evidence regarding the amounts and disclosures in the consolidated financial statements. Our audits also included evaluating the accounting principles used and significant estimates made by management, as well as evaluating the overall presentation of the consolidated financial statements. Our audit of internal control over financial reporting included obtaining an understanding of internal control over financial reporting, assessing the risk that a material weakness exists, and testing and evaluating the design and operating effectiveness of internal control based on the assessed risk. Our audits also included performing such other procedures as we considered necessary in the circumstances. We believe that our audits provide a reasonable basis for our opinions.
Definition and Limitations of Internal Control Over Financial Reporting
A company’s internal control over financial reporting is a process designed to provide reasonable assurance regarding the reliability of financial reporting and the preparation of financial statements for external purposes in accordance with generally accepted accounting principles. A company’s internal control over financial reporting includes those policies and procedures that (1) pertain to the maintenance of records that, in reasonable detail, accurately and fairly reflect the transactions and dispositions of the assets of the company; (2) provide reasonable assurance that transactions are recorded as necessary to permit preparation of financial statements in accordance with generally accepted accounting principles, and that receipts and expenditures of the company are being made only in accordance with authorizations of management and directors of the company; and (3) provide reasonable
F- 2
assurance regarding prevention or timely detection of unauthorized acquisition, use, or disposition of the company’s assets that could have a material effect on the financial statements.
Because of its inherent limitations, internal control over financial reporting may not prevent or detect misstatements. Also, projections of any evaluation of effectiveness to future periods are subject to the risk that controls may become inadequate because of changes in conditions, or that the degree of compliance with the policies or procedures may deteriorate.
(signed) KPMG LLP
We have served as the Company’s auditor since 2002.
St. Louis, Missouri
February 1, 2018
F- 3
CHARTER COMMUNICATIONS, INC. AND SUBSIDIARIES
CONSOLIDATED BALANCE SHEETS
(dollars in millions, except share data)
CONSOLIDATED BALANCE SHEETS
(dollars in millions, except share data)
|
December 31,
|
|||||||
|
2017
|
2016
|
||||||
|
ASSETS
|
|||||||
|
CURRENT ASSETS:
|
|||||||
|
Cash and cash equivalents
|
$
|
621
|
|
$
|
1,535
|
|
|
|
Accounts receivable, less allowance for doubtful accounts of
|
|||||||
|
$113 and $124, respectively
|
1,635
|
|
1,432
|
|
|||
|
Prepaid expenses and other current assets
|
299
|
|
333
|
|
|||
|
Total current assets
|
2,555
|
|
3,300
|
|
|||
|
INVESTMENT IN CABLE PROPERTIES:
|
|||||||
|
Property, plant and equipment, net of accumulated
|
|||||||
|
depreciation of $18,077 and $11,103, respectively
|
33,888
|
|
32,963
|
|
|||
|
Customer relationships, net
|
11,951
|
|
14,608
|
|
|||
|
Franchises
|
67,319
|
|
67,316
|
|
|||
|
Goodwill
|
29,554
|
|
29,509
|
|
|||
|
Total investment in cable properties, net
|
142,712
|
|
144,396
|
|
|||
|
OTHER NONCURRENT ASSETS
|
1,356
|
|
1,371
|
|
|||
|
Total assets
|
$
|
146,623
|
|
$
|
149,067
|
|
|
|
LIABILITIES AND SHAREHOLDERS’ EQUITY
|
|||||||
|
CURRENT LIABILITIES:
|
|||||||
|
Accounts payable and accrued liabilities
|
$
|
9,045
|
|
$
|
7,544
|
|
|
|
Current portion of long-term debt
|
2,045
|
|
2,028
|
|
|||
|
Total current liabilities
|
11,090
|
|
9,572
|
|
|||
|
LONG-TERM DEBT
|
68,186
|
|
59,719
|
|
|||
|
DEFERRED INCOME TAXES
|
17,314
|
|
26,665
|
|
|||
|
OTHER LONG-TERM LIABILITIES
|
2,502
|
|
2,745
|
|
|||
|
SHAREHOLDERS’ EQUITY:
|
|||||||
|
Class A common stock; $.001 par value; 900 million shares authorized;
|
|||||||
|
238,506,059 and 268,897,792 shares issued and outstanding, respectively
|
—
|
|
—
|
|
|||
|
Class B common stock; $.001 par value; 1,000 shares authorized;
|
|||||||
|
1 share issued and outstanding
|
—
|
|
—
|
|
|||
|
Preferred stock; $.001 par value; 250 million shares authorized;
|
|||||||
|
no shares issued and outstanding
|
—
|
|
—
|
|
|||
|
Additional paid-in capital
|
35,253
|
|
39,413
|
|
|||
|
Retained earnings
|
3,832
|
|
733
|
|
|||
|
Accumulated other comprehensive loss
|
(1
|
)
|
(7
|
)
|
|||
|
Total Charter shareholders’ equity
|
39,084
|
|
40,139
|
|
|||
|
Noncontrolling interests
|
8,447
|
|
10,227
|
|
|||
|
Total shareholders’ equity
|
47,531
|
|
50,366
|
|
|||
|
Total liabilities and shareholders’ equity
|
$
|
146,623
|
|
$
|
149,067
|
|
|
The accompanying notes are an integral part of these consolidated financial statements.
F- 4
CHARTER COMMUNICATIONS, INC. AND SUBSIDIARIES
CONSOLIDATED STATEMENTS OF OPERATIONS
(dollars in millions, except per share and share data)
CONSOLIDATED STATEMENTS OF OPERATIONS
(dollars in millions, except per share and share data)
|
Year Ended December 31,
|
|||||||||||
|
2017
|
2016
|
2015
|
|||||||||
|
REVENUES
|
$
|
41,581
|
|
$
|
29,003
|
|
$
|
9,754
|
|
||
|
COSTS AND EXPENSES:
|
|||||||||||
|
Operating costs and expenses (exclusive of items shown separately below)
|
26,541
|
|
18,655
|
|
6,426
|
|
|||||
|
Depreciation and amortization
|
10,588
|
|
6,907
|
|
2,125
|
|
|||||
|
Other operating expenses, net
|
346
|
|
985
|
|
89
|
|
|||||
|
37,475
|
|
26,547
|
|
8,640
|
|
||||||
|
Income from operations
|
4,106
|
|
2,456
|
|
1,114
|
|
|||||
|
OTHER EXPENSES:
|
|||||||||||
|
Interest expense, net
|
(3,090
|
)
|
(2,499
|
)
|
(1,306
|
)
|
|||||
|
Loss on extinguishment of debt
|
(40
|
)
|
(111
|
)
|
(128
|
)
|
|||||
|
Gain (loss) on financial instruments, net
|
69
|
|
89
|
|
(4
|
)
|
|||||
|
Other pension benefits
|
1
|
|
899
|
|
—
|
|
|||||
|
Other expense, net
|
(18
|
)
|
(14
|
)
|
(7
|
)
|
|||||
|
(3,078
|
)
|
(1,636
|
)
|
(1,445
|
)
|
||||||
|
Income (loss) before income taxes
|
1,028
|
|
820
|
|
(331
|
)
|
|||||
|
Income tax benefit
|
9,087
|
|
2,925
|
|
60
|
|
|||||
|
Consolidated net income (loss)
|
10,115
|
|
3,745
|
|
(271
|
)
|
|||||
|
Less: Net income attributable to noncontrolling interests
|
(220
|
)
|
(223
|
)
|
—
|
|
|||||
|
Net income (loss) attributable to Charter shareholders
|
$
|
9,895
|
|
$
|
3,522
|
|
$
|
(271
|
)
|
||
|
EARNINGS (LOSS) PER COMMON SHARE ATTRIBUTABLE TO CHARTER SHAREHOLDERS:
|
|||||||||||
|
Basic
|
$
|
38.55
|
|
$
|
17.05
|
|
$
|
(2.68
|
)
|
||
|
Diluted
|
$
|
34.09
|
|
$
|
15.94
|
|
$
|
(2.68
|
)
|
||
|
WEIGHTED AVERAGE COMMON SHARES OUTSTANDING:
|
|||||||||||
|
Basic
|
256,720,715
|
|
206,539,100
|
|
101,152,647
|
|
|||||
|
Diluted
|
296,703,956
|
|
234,791,439
|
|
101,152,647
|
|
|||||
The accompanying notes are an integral part of these consolidated financial statements.
F- 5
CHARTER COMMUNICATIONS, INC. AND SUBSIDIARIES
CONSOLIDATED STATEMENTS OF COMPREHENSIVE INCOME (LOSS)
(dollars in millions)
|
Year Ended December 31,
|
|||||||||||
|
2017
|
2016
|
2015
|
|||||||||
|
Consolidated net income (loss)
|
$
|
10,115
|
|
$
|
3,745
|
|
$
|
(271
|
)
|
||
|
Net impact of interest rate derivative instruments
|
5
|
|
8
|
|
9
|
|
|||||
|
Foreign currency translation adjustment
|
1
|
|
(2
|
)
|
—
|
|
|||||
|
Consolidated comprehensive income (loss)
|
10,121
|
|
3,751
|
|
(262
|
)
|
|||||
|
Less: Comprehensive income attributable to noncontrolling interests
|
(220
|
)
|
(223
|
)
|
—
|
|
|||||
|
Comprehensive income (loss) attributable to Charter shareholders
|
$
|
9,901
|
|
$
|
3,528
|
|
$
|
(262
|
)
|
||
The accompanying notes are an integral part of these consolidated financial statements.
F- 6
CHARTER COMMUNICATIONS, INC. AND SUBSIDIARIES
CONSOLIDATED STATEMENTS OF CHANGES IN SHAREHOLDERS’ EQUITY (DEFICIT)
CONSOLIDATED STATEMENTS OF CHANGES IN SHAREHOLDERS’ EQUITY (DEFICIT)
(dollars in millions)
|
Class A Common Stock
|
Class B Common Stock
|
Additional Paid-in Capital
|
Retained Earnings (Accumulated Deficit)
|
Accumulated Other Comprehensive Loss
|
Total Charter Shareholders’ Equity (Deficit)
|
Non-controlling Interests
|
Total Shareholders’ Equity (Deficit)
|
|||||||||||||||||
|
BALANCE, December 31, 2014
|
$
|
—
|
|
$
|
—
|
|
$
|
1,930
|
|
$
|
(1,762
|
)
|
$
|
(22
|
)
|
$
|
146
|
|
$
|
—
|
|
$
|
146
|
|
|
Consolidated net loss
|
—
|
|
—
|
|
—
|
|
(271
|
)
|
—
|
|
(271
|
)
|
—
|
|
(271
|
)
|
||||||||
|
Stock compensation expense
|
—
|
|
—
|
|
78
|
|
—
|
|
—
|
|
78
|
|
—
|
|
78
|
|
||||||||
|
Exercise of stock options
|
—
|
|
—
|
|
30
|
|
—
|
|
—
|
|
30
|
|
—
|
|
30
|
|
||||||||
|
Changes in accumulated other comprehensive loss, net
|
—
|
|
—
|
|
—
|
|
—
|
|
9
|
|
9
|
|
—
|
|
9
|
|
||||||||
|
Purchases and retirement of treasury stock
|
—
|
|
—
|
|
(10
|
)
|
(28
|
)
|
—
|
|
(38
|
)
|
—
|
|
(38
|
)
|
||||||||
|
BALANCE, December 31, 2015
|
—
|
|
—
|
|
2,028
|
|
(2,061
|
)
|
(13
|
)
|
(46
|
)
|
—
|
|
(46
|
)
|
||||||||
|
Consolidated net income
|
—
|
|
—
|
|
—
|
|
3,522
|
|
—
|
|
3,522
|
|
223
|
|
3,745
|
|
||||||||
|
Stock compensation expense
|
—
|
|
—
|
|
244
|
|
—
|
|
—
|
|
244
|
|
—
|
|
244
|
|
||||||||
|
Accelerated vesting of equity awards
|
—
|
|
—
|
|
248
|
|
—
|
|
—
|
|
248
|
|
—
|
|
248
|
|
||||||||
|
Settlement of restricted stock units
|
—
|
|
—
|
|
(59
|
)
|
—
|
|
—
|
|
(59
|
)
|
—
|
|
(59
|
)
|
||||||||
|
Exercise of stock options
|
—
|
|
—
|
|
86
|
|
—
|
|
—
|
|
86
|
|
—
|
|
86
|
|
||||||||
|
Changes in accumulated other comprehensive loss, net
|
—
|
|
—
|
|
—
|
|
—
|
|
6
|
|
6
|
|
—
|
|
6
|
|
||||||||
|
Purchases and retirement of treasury stock
|
—
|
|
—
|
|
(834
|
)
|
(728
|
)
|
—
|
|
(1,562
|
)
|
—
|
|
(1,562
|
)
|
||||||||
|
Issuance of shares to Liberty Broadband for cash
|
—
|
|
—
|
|
5,000
|
|
—
|
|
—
|
|
5,000
|
|
—
|
|
5,000
|
|
||||||||
|
Converted TWC awards in the TWC Transaction
|
—
|
|
—
|
|
514
|
|
—
|
|
—
|
|
514
|
|
—
|
|
514
|
|
||||||||
|
Issuance of shares in TWC Transaction
|
—
|
|
—
|
|
32,164
|
|
—
|
|
—
|
|
32,164
|
|
—
|
|
32,164
|
|
||||||||
|
Issuance of subsidiary equity in Bright House Transaction
|
—
|
|
—
|
|
—
|
|
—
|
|
—
|
|
—
|
|
10,134
|
|
10,134
|
|
||||||||
|
Partnership formation and change in ownership, net of tax
|
—
|
|
—
|
|
(364
|
)
|
—
|
|
—
|
|
(364
|
)
|
589
|
|
225
|
|
||||||||
|
Purchase of noncontrolling interest, net of tax
|
—
|
|
—
|
|
(19
|
)
|
—
|
|
—
|
|
(19
|
)
|
(187
|
)
|
(206
|
)
|
||||||||
|
Exchange of Charter Holdings units held by A/N, net of tax and TRA effects
|
—
|
|
—
|
|
405
|
|
—
|
|
—
|
|
405
|
|
(460
|
)
|
(55
|
)
|
||||||||
|
Distributions to noncontrolling interest
|
—
|
|
—
|
|
—
|
|
—
|
|
—
|
|
—
|
|
(96
|
)
|
(96
|
)
|
||||||||
|
Noncontrolling interests assumed in acquisitions
|
—
|
|
—
|
|
—
|
|
—
|
|
—
|
|
—
|
|
24
|
|
24
|
|
||||||||
|
BALANCE, December 31, 2016
|
—
|
|
—
|
|
39,413
|
|
733
|
|
(7
|
)
|
40,139
|
|
10,227
|
|
50,366
|
|
||||||||
|
Consolidated net income
|
—
|
|
—
|
|
—
|
|
9,895
|
|
—
|
|
9,895
|
|
220
|
|
10,115
|
|
||||||||
|
Stock compensation expense
|
—
|
|
—
|
|
261
|
|
—
|
|
—
|
|
261
|
|
—
|
|
261
|
|
||||||||
|
Accelerated vesting of equity awards
|
—
|
|
—
|
|
49
|
|
—
|
|
—
|
|
49
|
|
—
|
|
49
|
|
||||||||
|
Exercise of stock options
|
—
|
|
—
|
|
116
|
|
—
|
|
—
|
|
116
|
|
—
|
|
116
|
|
||||||||
|
Changes in accumulated other comprehensive loss, net
|
—
|
|
—
|
|
—
|
|
—
|
|
6
|
|
6
|
|
—
|
|
6
|
|
||||||||
|
Cumulative effect of accounting change
|
—
|
|
—
|
|
9
|
|
131
|
|
—
|
|
140
|
|
—
|
|
140
|
|
||||||||
|
Purchases and retirement of treasury stock
|
—
|
|
—
|
|
(4,788
|
)
|
(6,927
|
)
|
—
|
|
(11,715
|
)
|
—
|
|
(11,715
|
)
|
||||||||
|
Purchase of noncontrolling interest, net of tax
|
—
|
|
—
|
|
(295
|
)
|
—
|
|
—
|
|
(295
|
)
|
(1,187
|
)
|
(1,482
|
)
|
||||||||
|
Exchange of Charter Holdings units held by A/N, net of tax and TRA effects
|
—
|
|
—
|
|
265
|
|
—
|
|
—
|
|
265
|
|
(298
|
)
|
(33
|
)
|
||||||||
|
Change in noncontrolling interest ownership, net of tax
|
—
|
|
—
|
|
223
|
|
—
|
|
—
|
|
223
|
|
(362
|
)
|
(139
|
)
|
||||||||
|
Distributions to noncontrolling interest
|
—
|
|
—
|
|
—
|
|
—
|
|
—
|
|
—
|
|
(153
|
)
|
(153
|
)
|
||||||||
|
BALANCE, December 31, 2017
|
$
|
—
|
|
$
|
—
|
|
$
|
35,253
|
|
$
|
3,832
|
|
$
|
(1
|
)
|
$
|
39,084
|
|
$
|
8,447
|
|
$
|
47,531
|
|
The accompanying notes are an integral part of these consolidated financial statements.
F- 7
CHARTER COMMUNICATIONS, INC. AND SUBSIDIARIES
CONSOLIDATED STATEMENTS OF CASH FLOWS
(dollars in millions)
(dollars in millions)
|
Year Ended December 31,
|
|||||||||||
|
2017
|
2016
|
2015
|
|||||||||
|
CASH FLOWS FROM OPERATING ACTIVITIES:
|
|||||||||||
|
Consolidated net income (loss)
|
$
|
10,115
|
|
$
|
3,745
|
|
$
|
(271
|
)
|
||
|
Adjustments to reconcile consolidated net income (loss) to net cash flows from operating activities:
|
|||||||||||
|
Depreciation and amortization
|
10,588
|
|
6,907
|
|
2,125
|
|
|||||
|
Stock compensation expense
|
261
|
|
244
|
|
78
|
|
|||||
|
Accelerated vesting of equity awards
|
49
|
|
248
|
|
—
|
|
|||||
|
Noncash interest (income) expense
|
(370
|
)
|
(256
|
)
|
28
|
|
|||||
|
Other pension benefits
|
(1
|
)
|
(899
|
)
|
—
|
|
|||||
|
Loss on extinguishment of debt
|
40
|
|
111
|
|
128
|
|
|||||
|
(Gain) loss on financial instruments, net
|
(69
|
)
|
(89
|
)
|
4
|
|
|||||
|
Deferred income taxes
|
(9,116
|
)
|
(2,958
|
)
|
(65
|
)
|
|||||
|
Other, net
|
16
|
|
8
|
|
11
|
|
|||||
|
Changes in operating assets and liabilities, net of effects from acquisitions and dispositions:
|
|||||||||||
|
Accounts receivable
|
(84
|
)
|
(160
|
)
|
5
|
|
|||||
|
Prepaid expenses and other assets
|
76
|
|
111
|
|
(3
|
)
|
|||||
|
Accounts payable, accrued liabilities and other
|
449
|
|
1,029
|
|
319
|
|
|||||
|
Net cash flows from operating activities
|
11,954
|
|
8,041
|
|
2,359
|
|
|||||
|
CASH FLOWS FROM INVESTING ACTIVITIES:
|
|||||||||||
|
Purchases of property, plant and equipment
|
(8,681
|
)
|
(5,325
|
)
|
(1,840
|
)
|
|||||
|
Change in accrued expenses related to capital expenditures
|
820
|
|
603
|
|
28
|
|
|||||
|
Purchases of cable systems, net
|
(9
|
)
|
(28,810
|
)
|
—
|
|
|||||
|
Change in restricted cash and cash equivalents
|
—
|
|
22,264
|
|
(15,153
|
)
|
|||||
|
Real estate investments through variable interest entities
|
(105
|
)
|
—
|
|
—
|
|
|||||
|
Other, net
|
(123
|
)
|
(22
|
)
|
(67
|
)
|
|||||
|
Net cash flows from investing activities
|
(8,098
|
)
|
(11,290
|
)
|
(17,032
|
)
|
|||||
|
CASH FLOWS FROM FINANCING ACTIVITIES:
|
|||||||||||
|
Borrowings of long-term debt
|
25,276
|
|
12,344
|
|
26,045
|
|
|||||
|
Repayments of long-term debt
|
(16,507
|
)
|
(10,521
|
)
|
(11,326
|
)
|
|||||
|
Payments for debt issuance costs
|
(111
|
)
|
(284
|
)
|
(36
|
)
|
|||||
|
Issuance of equity
|
—
|
|
5,000
|
|
—
|
|
|||||
|
Purchase of treasury stock
|
(11,715
|
)
|
(1,562
|
)
|
(38
|
)
|
|||||
|
Proceeds from exercise of stock options and warrants
|
116
|
|
86
|
|
30
|
|
|||||
|
Settlement of restricted stock units
|
—
|
|
(59
|
)
|
—
|
|
|||||
|
Purchase of noncontrolling interest
|
(1,665
|
)
|
(218
|
)
|
—
|
|
|||||
|
Distributions to noncontrolling interest
|
(153
|
)
|
(96
|
)
|
—
|
|
|||||
|
Proceeds from termination of interest rate derivatives
|
—
|
|
88
|
|
—
|
|
|||||
|
Other, net
|
(11
|
)
|
1
|
|
—
|
|
|||||
|
Net cash flows from financing activities
|
(4,770
|
)
|
4,779
|
|
14,675
|
|
|||||
|
NET INCREASE (DECREASE) IN CASH AND CASH EQUIVALENTS
|
(914
|
)
|
1,530
|
|
2
|
|
|||||
|
CASH AND CASH EQUIVALENTS, beginning of period
|
1,535
|
|
5
|
|
3
|
|
|||||
|
CASH AND CASH EQUIVALENTS, end of period
|
$
|
621
|
|
$
|
1,535
|
|
$
|
5
|
|
||
|
CASH PAID FOR INTEREST
|
$
|
3,421
|
|
$
|
2,685
|
|
$
|
1,064
|
|
||
|
CASH PAID FOR TAXES
|
$
|
41
|
|
$
|
63
|
|
$
|
3
|
|
||
The accompanying notes are an integral part of these consolidated financial statements.
F- 8
CHARTER COMMUNICATIONS, INC. AND SUBSIDIARIES
NOTES TO CONSOLIDATED FINANCIAL STATEMENTS
DECEMBER 31, 2017, 2016 AND 2015
(dollars in millions, except share or per share data or where indicated)
1. Organization and Basis of Presentation
Organization
Charter Communications, Inc. (together with its controlled subsidiaries, “Charter,” or the “Company”) is the second largest cable operator in the United States and a leading broadband communications company providing video, Internet and voice services to residential and business customers. In addition, the Company sells video and online advertising inventory to local, regional and national advertising customers and fiber-delivered communications and managed information technology solutions to larger enterprise customers. The Company also owns and operates regional sports networks and local sports, news and lifestyle channels and sells security and home management services to the residential marketplace.
Charter is a holding company whose principal asset is a controlling equity interest in Charter Communications Holdings, LLC (“Charter Holdings”), an indirect owner of Charter Communications Operating, LLC (“Charter Operating”) under which substantially all of the operations reside. All significant intercompany accounts and transactions among consolidated entities have been eliminated.
Basis of Presentation
The accompanying consolidated financial statements have been prepared in accordance with U.S. generally accepted accounting principles (“GAAP”) and the rules and regulations of the Securities and Exchange Commission (the “SEC”).
The preparation of financial statements in conformity with GAAP requires management to make estimates and assumptions that affect the reported amounts of assets and liabilities and disclosure of contingent assets and liabilities at the date of the financial statements and the reported amounts of revenues and expenses during the reporting period. Areas involving significant judgments and estimates include capitalization of labor and overhead costs; depreciation and amortization costs; purchase accounting valuations of assets and liabilities including, but not limited to, property, plant and equipment, intangibles and goodwill; pension benefits; income taxes; contingencies and programming expense. Actual results could differ from those estimates.
Certain prior period amounts have been reclassified to conform with the 2017 presentation.
2. Summary of Significant Accounting Policies
Consolidation
The accompanying consolidated financial statements include the accounts of Charter and all entities in which Charter has a controlling interest, including variable interest entities where Charter is the primary beneficiary. The Company consolidates based upon evaluation of the Company’s power, through voting rights or similar rights, to direct the activities of another entity that most significantly impact the entity’s economic performance; its obligation to absorb the expected losses of the entity; and its right to receive the expected residual returns of the entity. Charter controls and consolidates Charter Holdings. The noncontrolling interest on the Company’s balance sheet primarily represents Advance/Newhouse Partnership's (“A/N's”) minority equity interests in Charter Holdings. See Note 11. All significant inter-company accounts and transactions among consolidated entities have been eliminated in consolidation.
Cash and Cash Equivalents
The Company considers all highly liquid investments with original maturities of three months or less to be cash equivalents. These investments are carried at cost, which approximates market value. Cash and cash equivalents consist primarily of money market funds.
Property, Plant and Equipment
Additions to property, plant and equipment are recorded at cost, including all material, labor and certain indirect costs associated with the construction of cable transmission and distribution facilities. While the Company’s capitalization is based on specific activities, once capitalized, costs are tracked on a composite basis by fixed asset category at the cable system level and not on a
F- 9
CHARTER COMMUNICATIONS, INC. AND SUBSIDIARIES
NOTES TO CONSOLIDATED FINANCIAL STATEMENTS
DECEMBER 31, 2017, 2016 AND 2015
(dollars in millions, except share or per share data or where indicated)
specific asset basis. For assets that are sold or retired, the estimated historical cost and related accumulated depreciation is removed. Costs associated with the initial placement of the customer drop to the dwelling and the initial placement of outlets within a dwelling along with the costs associated with the initial deployment of customer premise equipment necessary to provide video, Internet or voice services are capitalized. Costs capitalized include materials, direct labor and certain indirect costs. Indirect costs are associated with the activities of the Company’s personnel who assist in installation activities and consist of compensation and other costs associated with these support functions. Indirect costs primarily include employee benefits and payroll taxes, vehicle and occupancy costs, and the costs of sales and dispatch personnel associated with capitalizable activities. The costs of disconnecting service and removing customer premise equipment from a dwelling and the costs to reconnect a customer drop or to redeploy previously installed customer premise equipment are charged to operating expense as incurred. Costs for repairs and maintenance are charged to operating expense as incurred, while plant and equipment replacement, including replacement of certain components, betterments, including replacement of cable drops and outlets, are capitalized.
Depreciation is recorded using the straight-line composite method over management’s estimate of the useful lives of the related assets as follows:
|
Cable distribution systems
|
8-20 years
|
|
|
Customer premise equipment and installations
|
3-8 years
|
|
|
Vehicles and equipment
|
4-9 years
|
|
|
Buildings and improvements
|
15-40 years
|
|
|
Furniture, fixtures and equipment
|
7-10 years
|
|
Asset Retirement Obligations
Certain of the Company’s franchise agreements and leases contain provisions requiring the Company to restore facilities or remove equipment in the event that the franchise or lease agreement is not renewed. The Company expects to continually renew its franchise agreements and therefore cannot reasonably estimate any liabilities associated with such agreements. A remote possibility exists that franchise agreements could be terminated unexpectedly, which could result in the Company incurring significant expense in complying with restoration or removal provisions. The Company does not have any significant liabilities related to asset retirements recorded in its consolidated financial statements.
Valuation of Long-Lived Assets
The Company evaluates the recoverability of long-lived assets (e.g., property, plant and equipment and finite-lived intangible assets) to be held and used when events or changes in circumstances indicate that the carrying amount of an asset may not be recoverable. Such events or changes in circumstances could include such factors as impairment of the Company’s indefinite life assets, changes in technological advances, fluctuations in the fair value of such assets, adverse changes in relationships with local franchise authorities, adverse changes in market conditions or a deterioration of current or expected future operating results. If a review indicates that the carrying value of such asset is not recoverable from estimated undiscounted cash flows, the carrying value of such asset is reduced to its estimated fair value. While the Company believes that its estimates of future cash flows are reasonable, different assumptions regarding such cash flows could materially affect its evaluations of asset recoverability.
No
impairments of long-lived assets to be held and used were recorded in
2017
,
2016
and
2015
.
Other Noncurrent Assets
Other noncurrent assets primarily include investments, trademarks, right-of-entry costs and other intangible assets. The Company accounts for its investments in less than majority owned investees under either the equity or cost method. The Company applies the equity method to investments when it has the ability to exercise significant influence over the operating and financial policies of the investee. The Company’s share of the investee’s earnings (losses) is included in other expense, net in the consolidated statements of operations. The Company monitors its investments for indicators that a decrease in investment value has occurred that is other than temporary. If it has been determined that an investment has sustained an other than temporary decline in value, the investment is written down to fair value with a charge to earnings. Investments acquired are measured at fair value utilizing the acquisition method of accounting. The difference between the fair value and the amount of underlying equity in net assets for most equity method investments is due to previously unrecognized intangible assets at the investee. These amounts are amortized as a component of equity earnings (losses), recorded within other expense, net over the estimated useful life of the asset. Trademarks
F- 10
CHARTER COMMUNICATIONS, INC. AND SUBSIDIARIES
NOTES TO CONSOLIDATED FINANCIAL STATEMENTS
DECEMBER 31, 2017, 2016 AND 2015
(dollars in millions, except share or per share data or where indicated)
have been determined to have an indefinite life and are tested annually for impairment. Right-of-entry costs represent upfront costs incurred related to agreements entered into with multiple dwelling units (“MDUs”) including landlords, real estate companies or owners to gain access to a building in order to market and service customers who reside in the building. Right-of-entry costs are deferred and amortized to amortization expense over the term of the agreement.
Revenue Recognition
Revenues from residential and commercial video, Internet and voice services are recognized when the related services are provided. Advertising sales are recognized at estimated realizable values in the period that the advertisements are broadcast. In some cases, the Company coordinates the advertising sales efforts of other cable operators in a certain market and remits amounts received from customers less an agreed-upon percentage to such cable operator. For those arrangements in which the Company acts as a principal, the Company records the revenues earned from the advertising customer on a gross basis and the amount remitted to the cable operator as an operating expense.
Fees imposed on the Company by various governmental authorities are passed through on a monthly basis to the Company’s customers and are periodically remitted to authorities. Fees of
$961 million
,
$711 million
and
$255 million
for the years ended
December 31, 2017
,
2016
and
2015
, respectively, are reported in video, voice and commercial revenues, on a gross basis with a corresponding operating expense because the Company is acting as a principal
.
Other taxes, such as sales taxes imposed on the Company’s customers, collected and remitted to state and local authorities, are recorded on a net basis because the Company is acting as an agent in such situation.
The Company’s revenues by product line are as follows:
|
Year Ended December 31,
|
|||||||||||
|
2017
|
2016
|
2015
|
|||||||||
|
Video
|
$
|
16,641
|
|
$
|
11,967
|
|
$
|
4,587
|
|
||
|
Internet
|
14,105
|
|
9,272
|
|
3,003
|
|
|||||
|
Voice
|
2,542
|
|
2,005
|
|
539
|
|
|||||
|
Residential revenue
|
33,288
|
|
23,244
|
|
8,129
|
|
|||||
|
Small and medium business
|
3,686
|
|
2,480
|
|
764
|
|
|||||
|
Enterprise
|
2,210
|
|
1,429
|
|
363
|
|
|||||
|
Commercial revenue
|
5,896
|
|
3,909
|
|
1,127
|
|
|||||
|
Advertising sales
|
1,510
|
|
1,235
|
|
309
|
|
|||||
|
Other
|
887
|
|
615
|
|
189
|
|
|||||
|
$
|
41,581
|
|
$
|
29,003
|
|
$
|
9,754
|
|
|||
Programming Costs
The Company has various contracts to obtain video programming from vendors whose compensation is typically based on a flat fee per customer. The cost of the right to exhibit network programming under such arrangements is recorded in operating expenses in the month the programming is available for exhibition. Programming costs are paid each month based on calculations performed by the Company and are subject to periodic audits performed by the programmers. Certain programming contracts contain cash and non-cash consideration from the programmers. If consideration received does not relate to a separate product or service, the Company recognizes the consideration on a straight-line basis over the life of the programming agreement as a reduction of programming expense. Programming costs included in the statements of operations were
$10.6 billion
,
$7.0 billion
and
$2.7 billion
for the years ended
December 31, 2017
,
2016
and
2015
, respectively.
F- 11
CHARTER COMMUNICATIONS, INC. AND SUBSIDIARIES
NOTES TO CONSOLIDATED FINANCIAL STATEMENTS
DECEMBER 31, 2017, 2016 AND 2015
(dollars in millions, except share or per share data or where indicated)
Advertising Costs
Advertising costs associated with marketing the Company’s products and services are generally expensed as costs are incurred.
Multiple-Element Transactions
In the normal course of business, the Company enters into multiple-element transactions where it is simultaneously both a customer and a vendor with the same counterparty or in which it purchases multiple products and/or services, or settles outstanding items contemporaneous with the purchase of a product or service from a single counterparty. Transactions, although negotiated contemporaneously, may be documented in one or more contracts. The Company’s policy for accounting for each transaction negotiated contemporaneously is to record each element of the transaction based on the respective estimated fair values of the products or services purchased and the products or services sold. In determining the fair value of the respective elements, the Company refers to quoted market prices (where available), historical transactions or comparable cash transactions. Cash consideration received from a vendor is recorded as a reduction in the price of the vendor’s product unless (i) the consideration is for the reimbursement of a specific, incremental, identifiable cost incurred, in which case the cash consideration received would be recorded as a reduction in such cost (e.g., marketing costs), or (ii) an identifiable benefit in exchange for the consideration is provided, in which case revenue would be recognized for this element.
Stock-Based Compensation
Restricted stock, restricted stock units, stock options as well as equity awards with market conditions are measured at the grant date fair value and amortized to stock compensation expense over the requisite service period. The fair value of options is estimated on the date of grant using the Black-Scholes option-pricing model and the fair value of equity awards with market conditions is estimated on the date of grant using Monte Carlo simulations. The grant date weighted average assumptions used during the years ended
December 31, 2017
,
2016
and
2015
, respectively, were: risk-free interest rate of
1.8%
,
1.7%
and
1.5%
; expected volatility of
25.0%
,
25.4%
and
34.7%
; and expected lives of
4.6
years,
1.3
years and
6.5
years. Weighted average assumptions for 2016 include the assumptions used for the converted TWC awards (see Note 16). The Company’s volatility assumptions represent management’s best estimate and were based on historical volatility of Legacy Charter and Legacy TWC. See Note 3. Expected lives were estimated using historical exercise data. The valuations assume no dividends are paid.
Pension Plans
The Company sponsors the TWC Pension Plan, TWC Union Pension Plan and TWC Excess Pension Plan (as defined in Note 21). Pension benefits are based on formulas that reflect the employees’ years of service and compensation during their employment period. Actuarial gains or losses are changes in the amount of either the benefit obligation or the fair value of plan assets resulting from experience different from that assumed or from changes in assumptions. The Company has elected to follow a mark-to-market pension accounting policy for recording the actuarial gains or losses annually during the fourth quarter, or earlier if a remeasurement event occurs during an interim period.
Income Taxes
The Company recognizes deferred tax assets and liabilities for temporary differences between the financial reporting basis and the tax basis of the Company’s assets and liabilities and expected benefits of utilizing loss carryforwards. Since substantially all the Company’s operations are held through its partnership interest in Charter Holdings, the primary deferred tax component recorded in the consolidated balance sheet relates to the excess financial reporting outside basis, excluding amounts attributable to nondeductible goodwill, over Charter’s tax basis in its investment in the partnership. Valuation allowances are established when management determines that it is more likely than not that some portion or the entire deferred tax asset will not be realized. The impact on deferred taxes of changes in tax rates and tax law, if any, applied to the years during which temporary differences are expected to be settled, are reflected in the consolidated financial statements in the period of enactment. In determining the Company’s tax provision for financial reporting purposes, the Company establishes a reserve for uncertain tax positions unless such positions are determined to be “more likely than not” of being sustained upon examination, based on their technical merits. There is considerable judgment involved in making such a determination. Interest and penalties are recognized on uncertain income tax positions as part of the income tax provision. See Note 17.
F- 12
CHARTER COMMUNICATIONS, INC. AND SUBSIDIARIES
NOTES TO CONSOLIDATED FINANCIAL STATEMENTS
DECEMBER 31, 2017, 2016 AND 2015
(dollars in millions, except share or per share data or where indicated)
Segments
The Company’s operations are managed and reported to its Chief Executive Officer (“CEO”), the Company’s chief operating decision maker, on a consolidated basis. The CEO assesses performance and allocates resources based on the consolidated results of operations. Under this organizational and reporting structure, the Company has
one
reportable segment, cable services.
3. Mergers and Acquisitions
The Transactions
On May 18, 2016, the transactions contemplated by the Agreement and Plan of Mergers dated as of May 23, 2015 (the “Merger Agreement”), by and among Time Warner Cable Inc. (“Legacy TWC”), Charter Communications, Inc. prior to the closing of the Merger Agreement (“Legacy Charter”), CCH I, LLC, previously a wholly owned subsidiary of Legacy Charter and certain other subsidiaries of CCH I, LLC were completed (the “TWC Transaction,” and together with the Bright House Transaction described below, the “Transactions”). As a result of the TWC Transaction, CCH I, LLC became the new public parent company that holds the operations of the combined companies and was renamed Charter Communications, Inc. As of the date of completion of the Transactions, the total value of the TWC Transaction was approximately
$85 billion
, including cash, equity and Legacy TWC assumed debt.
Also, on May 18, 2016, Legacy Charter and A/N, the former parent of Bright House Networks, LLC (“Legacy Bright House”), completed their previously announced transaction, pursuant to a definitive Contribution Agreement (the “Contribution Agreement”), under which Charter acquired Legacy Bright House (the “Bright House Transaction”) for approximately
$12.2 billion
consisting of cash and convertible preferred units of Charter Holdings and common units of Charter Holdings. Pursuant to the Bright House Transaction, Charter became the owner of the membership interests in Legacy Bright House and the other assets primarily related to Legacy Bright House (other than certain excluded assets and liabilities and non-operating cash).
In connection with the TWC Transaction, Liberty Broadband purchased shares of Charter Class A common stock to partially finance the cash portion of the TWC Transaction consideration, and in connection with the Bright House Transaction, Liberty Broadband purchased shares of Charter Class A common stock (the “Liberty Transaction”).
Acquisition Accounting
Charter applied acquisition accounting to the Transactions. The total purchase price was allocated to the identifiable tangible and intangible assets acquired and the liabilities assumed based on their estimated fair values. The fair values were primarily based on third-party valuations using assumptions developed by management and other information compiled by management including, but not limited to, future expected cash flows. The excess of the purchase price over those fair values was recorded as goodwill.
F- 13
CHARTER COMMUNICATIONS, INC. AND SUBSIDIARIES
NOTES TO CONSOLIDATED FINANCIAL STATEMENTS
DECEMBER 31, 2017, 2016 AND 2015
(dollars in millions, except share or per share data or where indicated)
The tables below present the final allocation of the purchase price to the assets acquired and liabilities assumed in the Transactions.
TWC Allocation of Purchase Price
|
Cash and cash equivalents
|
$
|
1,058
|
|
|
Current assets
|
1,417
|
|
|
|
Property, plant and equipment
|
21,413
|
|
|
|
Customer relationships
|
13,460
|
|
|
|
Franchises
|
54,085
|
|
|
|
Goodwill
|
28,337
|
|
|
|
Other noncurrent assets
|
1,040
|
|
|
|
Accounts payable and accrued liabilities
|
(4,107
|
)
|
|
|
Debt
|
(24,900
|
)
|
|
|
Deferred income taxes
|
(28,120
|
)
|
|
|
Other long-term liabilities
|
(3,162
|
)
|
|
|
Noncontrolling interests
|
(4
|
)
|
|
|
$
|
60,517
|
|
|
Subsequent to December 31, 2016 and through the end of the measurement period, the Company made adjustments to the fair value of certain assets acquired and liabilities assumed in the TWC Transaction, including a decrease to working capital of
$73 million
and a decrease of
$28 million
to deferred income tax liabilities, resulting in a net increase of
$45 million
to goodwill.
Bright House Allocation of Purchase Price
|
Current assets
|
$
|
131
|
|
|
Property, plant and equipment
|
2,884
|
|
|
|
Customer relationships
|
2,150
|
|
|
|
Franchises
|
7,225
|
|
|
|
Goodwill
|
44
|
|
|
|
Other noncurrent assets
|
86
|
|
|
|
Accounts payable and accrued liabilities
|
(330
|
)
|
|
|
Other long-term liabilities
|
(12
|
)
|
|
|
Noncontrolling interests
|
(22
|
)
|
|
|
$
|
12,156
|
|
|
F- 14
CHARTER COMMUNICATIONS, INC. AND SUBSIDIARIES
NOTES TO CONSOLIDATED FINANCIAL STATEMENTS
DECEMBER 31, 2017, 2016 AND 2015
(dollars in millions, except share or per share data or where indicated)
Selected Pro Forma Financial Information
The following unaudited pro forma financial information of the Company is based on the historical consolidated financial statements of Legacy Charter, Legacy TWC and Legacy Bright House and is intended to provide information about how the Transactions and related financing may have affected the Company’s historical consolidated financial statements if they had closed as of January 1, 2015. The pro forma financial information below is based on available information and assumptions that the Company believes are reasonable. The pro forma financial information is for illustrative and informational purposes only and is not intended to represent or be indicative of what the Company’s financial condition or results of operations would have been had the transactions described above occurred on the date indicated. The pro forma financial information also should not be considered representative of the Company’s future financial condition or results of operations.
|
Year Ended December 31,
|
|||||||
|
2016
|
2015
|
||||||
|
Revenues
|
$
|
40,023
|
|
$
|
37,394
|
|
|
|
Net income attributable to Charter shareholders
|
$
|
1,070
|
|
$
|
159
|
|
|
|
Earnings per common share attributable to Charter shareholders:
|
|||||||
|
Basic
|
$
|
3.97
|
|
$
|
0.59
|
|
|
|
Diluted
|
$
|
3.91
|
|
$
|
0.58
|
|
|
4. Allowance for Doubtful Accounts
Activity in the allowance for doubtful accounts is summarized as follows for the years presented:
|
Year Ended December 31,
|
|||||||||||
|
2017
|
2016
|
2015
|
|||||||||
|
Balance, beginning of period
|
$
|
124
|
|
$
|
21
|
|
$
|
22
|
|
||
|
Charged to expense
|
469
|
|
328
|
|
135
|
|
|||||
|
Uncollected balances written off, net of recoveries
|
(480
|
)
|
(225
|
)
|
(136
|
)
|
|||||
|
Balance, end of period
|
$
|
113
|
|
$
|
124
|
|
$
|
21
|
|
||
5. Property, Plant and Equipment
Property, plant and equipment consists of the following as of
December 31, 2017
and
2016
:
|
December 31,
|
||||||||
|
2017
|
2016
|
|||||||
|
Cable distribution systems
|
$
|
26,104
|
|
$
|
23,317
|
|
||
|
Customer premise equipment and installations
|
15,909
|
|
12,867
|
|
||||
|
Vehicles and equipment
|
1,501
|
|
1,212
|
|
||||
|
Buildings and improvements
|
3,901
|
|
3,426
|
|
||||
|
Furniture, fixtures and equipment
|
4,550
|
|
3,244
|
|
||||
|
51,965
|
|
44,066
|
|
|||||
|
Less: accumulated depreciation
|
(18,077
|
)
|
(11,103
|
)
|
||||
|
$
|
33,888
|
|
$
|
32,963
|
|
|||
The Company periodically evaluates the estimated useful lives used to depreciate its assets and the estimated amount of assets that will be abandoned or have minimal use in the future. A significant change in assumptions about the extent or timing of future asset retirements, or in the Company’s use of new technology and upgrade programs, could materially affect future depreciation expense.
F- 15
CHARTER COMMUNICATIONS, INC. AND SUBSIDIARIES
NOTES TO CONSOLIDATED FINANCIAL STATEMENTS
DECEMBER 31, 2017, 2016 AND 2015
(dollars in millions, except share or per share data or where indicated)
Depreciation expense for the years ended
December 31, 2017
,
2016
and
2015
was
$7.8 billion
,
$5.0 billion
, and
$1.9 billion
, respectively.
6. Franchises, Goodwill and Other Intangible Assets
Franchise rights represent the value attributed to agreements or authorizations with local and state authorities that allow access to homes in cable service areas. For valuation purposes, they are defined as the future economic benefits of the right to solicit and service potential customers (customer marketing rights), and the right to deploy and market new services to potential customers (service marketing rights).
Management estimates the fair value of franchise rights at the date of acquisition and determines if the franchise has a finite life or an indefinite life. The Company has concluded that all of its franchises qualify for indefinite life treatment given that there are no legal, regulatory, contractual, competitive, economic or other factors which limit the period over which these rights will contribute to the Company's cash flows. The Company reassesses this determination periodically or whenever events or substantive changes in circumstances occur.
All franchises are tested for impairment annually or more frequently as warranted by events or changes in circumstances. Franchise assets are aggregated into essentially inseparable units of accounting to conduct valuations. The units of accounting generally represent geographical clustering of the Company's cable systems into groups. The Company assesses qualitative factors to determine whether the existence of events or circumstances leads to a determination that it is more likely than not that an indefinite lived intangible asset has been impaired. If, after this optional qualitative assessment, the Company determines that it is not more likely than not that an indefinite lived intangible asset has been impaired, then no further quantitative testing is necessary. In completing the qualitative impairment testing, the Company evaluates a multitude of factors that affect the fair value of our franchise assets. Examples of such factors include environmental and competitive changes within our operating footprint, actual and projected operating performance, the consistency of our operating margins, equity and debt market trends, including changes in our market capitalization, and changes in our regulatory and political landscape, among other factors. The Company performed a qualitative assessment in 2017, which also included consideration of a fair value appraisal performed for tax purposes in the beginning of 2017 as of a December 31, 2016 valuation date (the "Appraisal"). After consideration of the qualitative factors in 2017, including the results of the Appraisal, the Company concluded that it is more likely than not that the fair value of the franchise assets in each unit of accounting exceeds the carrying value of such assets and therefore did not perform a quantitative analysis at the assessment date. Periodically, the Company will elect to perform a quantitative analysis for impairment testing. If the Company elects or is required to perform a quantitative analysis to test its franchise assets for impairment, the methodology described below is utilized.
If a quantitative analysis is performed, the estimated fair value of franchises is determined utilizing an income approach model based on the present value of the estimated discrete future cash flows attributable to each of the intangible assets identified assuming a discount rate. The fair value of franchises is determined based on estimated discrete discounted future cash flows using assumptions consistent with internal forecasts. The franchise after-tax cash flow is calculated as the after-tax cash flow generated by the potential customers obtained. The sum of the present value of the franchises’ after-tax cash flow in years 1 through 10 and the continuing value of the after-tax cash flow beyond year 10 yields the fair value of the franchises.
This approach makes use of unobservable factors such as projected revenues, expenses, capital expenditures, customer trends, and a discount rate applied to the estimated cash flows. The determination of the franchise discount rate is derived from the Company’s weighted average cost of capital, which uses a market participant’s cost of equity and after-tax cost of debt and reflects the risks inherent in the cash flows. The Company estimates discounted future cash flows using reasonable and appropriate assumptions including among others, penetration rates for video, Internet, and voice; revenue growth rates; operating margins; and capital expenditures. The assumptions are based on the Company’s and its peers’ historical operating performance adjusted for current and expected competitive and economic factors surrounding the cable industry. The estimates and assumptions made in the Company’s valuations are inherently subject to significant uncertainties, many of which are beyond its control, and there is no assurance that these results can be achieved. The primary assumptions for which there is a reasonable possibility of the occurrence of a variation that would significantly affect the measurement value include the assumptions regarding revenue growth, programming expense growth rates, the amount and timing of capital expenditures, actual customer trends and the discount rate utilized.
F- 16
CHARTER COMMUNICATIONS, INC. AND SUBSIDIARIES
NOTES TO CONSOLIDATED FINANCIAL STATEMENTS
DECEMBER 31, 2017, 2016 AND 2015
(dollars in millions, except share or per share data or where indicated)
The fair value of goodwill is determined using both an income approach and market approach. The Company’s income approach model used for its goodwill valuation is consistent with that used for its franchise valuation noted above except that cash flows from the entire business enterprise are used for the goodwill valuation. The Company’s market approach model estimates the fair value of the reporting unit based on market prices in actual precedent transactions of similar businesses and market valuations of guideline public companies. Goodwill is tested for impairment as of November 30 of each year
,
or more frequently as warranted by events or changes in circumstances. Accounting guidance also permits an optional qualitative assessment for goodwill to determine whether it is more likely than not that the carrying value of a reporting unit exceeds its fair value. If, after this qualitative assessment, the Company determines that it is not more likely than not that the fair value of a reporting unit is less than its carrying amount then no further quantitative testing would be necessary. If the Company elects or is required to perform the two-step test under the accounting guidance, the first step involves a comparison of the estimated fair value of the reporting unit to its carrying amount. If the estimated fair value of the reporting unit exceeds its carrying amount, goodwill of the reporting unit is not considered impaired and the second step of the goodwill impairment is not necessary. If the carrying amount of a reporting unit exceeds its estimated fair value, then the second step of the goodwill impairment test must be performed, and a comparison of the implied fair value of the reporting unit’s goodwill is compared to its carrying amount to determine the amount of impairment, if any. As with the Company’s franchise impairment testing, in
2017
the Company elected to perform a qualitative goodwill impairment assessment, which incorporated the results of the Appraisal and consideration of the same qualitative factors relevant to the Company's franchise impairment testing. As a result of that assessment, the Company concluded that goodwill is not impaired.
Customer relationships are recorded at fair value as of the date acquired less accumulated amortization. Customer relationships, for valuation purposes, represent the value of the business relationship with existing customers, and are calculated by projecting the discrete future after-tax cash flows from these customers, including the right to deploy and market additional services to these customers. The present value of these after-tax cash flows yields the fair value of the customer relationships. The use of different valuation assumptions or definitions of franchises or customer relationships, such as our inclusion of the value of selling additional services to our current customers within customer relationships versus franchises, could significantly impact our valuations and any resulting impairment. Customer relationships are amortized on an accelerated sum of years’ digits method over useful lives of
8
-
15
years based on the period over which current customers are expected to generate cash flows. The Company periodically evaluates the remaining useful lives of its customer relationships to determine whether events or circumstances warrant revision to the remaining periods of amortization. Customer relationships are evaluated for impairment upon the occurrence of events or changes in circumstances indicating that the carrying amount of an asset may not be recoverable. Customer relationships are deemed impaired when the carrying value exceeds the projected undiscounted future cash flows associated with the customer relationships. No impairment of customer relationships was recorded in the years ended
December 31, 2017
,
2016
or
2015
.
The fair value of trademarks is determined using the relief-from-royalty method, a variation of the income approach, which applies a fair royalty rate to estimated revenue derived under the Company’s trademarks. The fair value of the intangible is estimated to be the present value of the royalty saved because the Company owns the trademarks. Royalty rates are estimated based on a review of market royalty rates in the communications and entertainment industries. As the Company expects to continue to use each trademark indefinitely, trademarks have been assigned an indefinite life and are tested annually for impairment using either a qualitative analysis or quantitative analysis as elected by management. As with the Company’s franchise impairment testing, in
2017
the Company elected to perform a qualitative trademark impairment assessment and concluded that trademarks are not impaired.
F- 17
CHARTER COMMUNICATIONS, INC. AND SUBSIDIARIES
NOTES TO CONSOLIDATED FINANCIAL STATEMENTS
DECEMBER 31, 2017, 2016 AND 2015
(dollars in millions, except share or per share data or where indicated)
As of
December 31, 2017
and
2016
, indefinite-lived and finite-lived intangible assets are presented in the following table:
|
December 31,
|
||||||||||||||||||||||||
|
2017
|
2016
|
|||||||||||||||||||||||
|
Gross Carrying Amount
|
Accumulated Amortization
|
Net Carrying Amount
|
Gross Carrying Amount
|
Accumulated Amortization
|
Net Carrying Amount
|
|||||||||||||||||||
|
Indefinite-lived intangible assets:
|
||||||||||||||||||||||||
|
Franchises
|
$
|
67,319
|
|
$
|
—
|
|
$
|
67,319
|
|
$
|
67,316
|
|
$
|
—
|
|
$
|
67,316
|
|
||||||
|
Goodwill
|
29,554
|
|
—
|
|
29,554
|
|
29,509
|
|
—
|
|
29,509
|
|
||||||||||||
|
Trademarks
|
159
|
|
—
|
|
159
|
|
159
|
|
—
|
|
159
|
|
||||||||||||
|
Other intangible assets
|
—
|
|
—
|
|
—
|
|
4
|
|
—
|
|
4
|
|
||||||||||||
|
$
|
97,032
|
|
$
|
—
|
|
$
|
97,032
|
|
$
|
96,988
|
|
$
|
—
|
|
$
|
96,988
|
|
|||||||
|
Finite-lived intangible assets:
|
||||||||||||||||||||||||
|
Customer relationships
|
$
|
18,229
|
|
$
|
(6,278
|
)
|
$
|
11,951
|
|
$
|
18,226
|
|
$
|
(3,618
|
)
|
$
|
14,608
|
|
||||||
|
Other intangible assets
|
731
|
|
(201
|
)
|
530
|
|
615
|
|
(128
|
)
|
487
|
|
||||||||||||
|
$
|
18,960
|
|
$
|
(6,479
|
)
|
$
|
12,481
|
|
$
|
18,841
|
|
$
|
(3,746
|
)
|
$
|
15,095
|
|
|||||||
Other intangible assets consist primarily of right-of-entry costs. Amortization expense related to customer relationships and other intangible assets for the years ended
December 31, 2017
,
2016
and
2015
was
$2.7 billion
,
$1.9 billion
and
$271 million
, respectively.
The Company expects amortization expense on its finite-lived intangible assets will be as follows.
|
2018
|
$
|
2,478
|
|
|
|
2019
|
2,195
|
|
||
|
2020
|
1,903
|
|
||
|
2021
|
1,619
|
|
||
|
2022
|
1,342
|
|
||
|
Thereafter
|
2,944
|
|
||
|
$
|
12,481
|
|
||
Actual amortization expense in future periods could differ from these estimates as a result of new intangible asset acquisitions or divestitures, changes in useful lives, impairments, adoption of new accounting standards and other relevant factors.
7. Investments
Investments consisted of the following as of
December 31, 2017
and
2016
:
|
December 31,
|
||||||||
|
2017
|
2016
|
|||||||
|
Equity-method investments
|
482
|
|
519
|
|
||||
|
Other investments
|
15
|
|
11
|
|
||||
|
Total investments
|
$
|
497
|
|
$
|
530
|
|
||
The Company's investments include Active Video Networks ("AVN" -
35.0%
owned) Sterling Entertainment Enterprises, LLC (“Sterling” - d/b/a SportsNet New York -
26.8%
owned), MLB Network, LLC (“MLB Network” -
6.4%
owned), iN Demand L.L.C. (“iN Demand” -
39.5%
owned) and National Cable Communications LLC (“NCC” -
20.0%
owned), among other less significant equity-method and cost-method investments. Sterling and MLB Network are primarily engaged in the development
F- 18
CHARTER COMMUNICATIONS, INC. AND SUBSIDIARIES
NOTES TO CONSOLIDATED FINANCIAL STATEMENTS
DECEMBER 31, 2017, 2016 AND 2015
(dollars in millions, except share or per share data or where indicated)
of sports programming services. iN Demand provides programming on a video on demand, pay-per-view and subscription basis. NCC represents multi-video program distributors to advertisers.
The Company's equity-method investments balances reflected in the table above includes differences between the acquisition date fair value of certain investments acquired and the underlying equity in the net assets of the investee, referred to as a basis difference. This basis difference is amortized as a component of equity earnings. The remaining unamortized basis difference was
$407 million
and
$436 million
as of
December 31, 2017
and
2016
, respectively.
The Company applies the equity method of accounting to these and other less significant equity-method investments, all of which are recorded in other noncurrent assets in the consolidated balance sheets as of
December 31, 2017
and
2016
. For the years ended
December 31, 2017
,
2016
and
2015
, net losses from equity-method investments were
$18 million
,
$14 million
and
$7 million
, respectively, which were recorded in other expense, net in the consolidated statements of operations.
Real estate investments through variable interest entities ("VIEs") on the consolidated statement of cash flows for the year ended December 31, 2017 represents the acquisition of a defaulted mortgage loan issued to a single-asset, special purpose entity real estate lessor (the "SPE"). As the Company has determined the SPE is a VIE of which it is the primary beneficiary, the Company has consolidated the assets and liabilities of the SPE in its consolidated balance sheet as of December 31, 2017, which are primarily composed of the building securing the mortgage loan.
8. Accounts Payable and Accrued Liabilities
Accounts payable and accrued liabilities consist of the following as of
December 31, 2017
and
2016
:
|
December 31,
|
|||||||
|
2017
|
2016
|
||||||
|
Accounts payable – trade
|
$
|
740
|
|
$
|
454
|
|
|
|
Deferred revenue
|
395
|
|
352
|
|
|||
|
Accrued liabilities:
|
|||||||
|
Programming costs
|
1,907
|
|
1,783
|
|
|||
|
Compensation
|
1,109
|
|
1,111
|
|
|||
|
Capital expenditures
|
1,935
|
|
1,107
|
|
|||
|
Interest
|
1,054
|
|
958
|
|
|||
|
Taxes and regulatory fees
|
556
|
|
538
|
|
|||
|
Property and casualty
|
408
|
|
394
|
|
|||
|
Other
|
941
|
|
847
|
|
|||
|
$
|
9,045
|
|
$
|
7,544
|
|
||
Long-term debt consists of the following as of
December 31, 2017
and
2016
:
|
December 31,
|
|||||||||||||||
|
2017
|
2016
|
||||||||||||||
|
Principal Amount
|
Accreted Value
|
Principal Amount
|
Accreted Value
|
||||||||||||
|
CCO Holdings, LLC:
|
|||||||||||||||
|
5.250% senior notes due March 15, 2021
|
$
|
500
|
|
$
|
497
|
|
$
|
500
|
|
$
|
496
|
|
|||
|
6.625% senior notes due January 31, 2022
|
—
|
|
—
|
|
750
|
|
741
|
|
|||||||
|
5.250% senior notes due September 30, 2022
|
1,250
|
|
1,235
|
|
1,250
|
|
1,232
|
|
|||||||
|
5.125% senior notes due February 15, 2023
|
1,000
|
|
993
|
|
1,000
|
|
992
|
|
|||||||
F- 19
CHARTER COMMUNICATIONS, INC. AND SUBSIDIARIES
NOTES TO CONSOLIDATED FINANCIAL STATEMENTS
DECEMBER 31, 2017, 2016 AND 2015
(dollars in millions, except share or per share data or where indicated)
|
4.000% senior notes due March 1, 2023
|
500
|
|
495
|
|
—
|
|
—
|
|
|||||||
|
5.125% senior notes due May 1, 2023
|
1,150
|
|
1,143
|
|
1,150
|
|
1,141
|
|
|||||||
|
5.750% senior notes due September 1, 2023
|
500
|
|
496
|
|
500
|
|
496
|
|
|||||||
|
5.750% senior notes due January 15, 2024
|
1,000
|
|
992
|
|
1,000
|
|
991
|
|
|||||||
|
5.875% senior notes due April 1, 2024
|
1,700
|
|
1,687
|
|
1,700
|
|
1,685
|
|
|||||||
|
5.375% senior notes due May 1, 2025
|
750
|
|
745
|
|
750
|
|
744
|
|
|||||||
|
5.750% senior notes due February 15, 2026
|
2,500
|
|
2,464
|
|
2,500
|
|
2,460
|
|
|||||||
|
5.500% senior notes due May 1, 2026
|
1,500
|
|
1,489
|
|
1,500
|
|
1,487
|
|
|||||||
|
5.875% senior notes due May 1, 2027
|
800
|
|
794
|
|
800
|
|
794
|
|
|||||||
|
5.125% senior notes due May 1, 2027
|
3,250
|
|
3,216
|
|
—
|
|
—
|
|
|||||||
|
5.000% senior notes due February 1, 2028
|
2,500
|
|
2,462
|
|
—
|
|
—
|
|
|||||||
|
Charter Communications Operating, LLC:
|
|||||||||||||||
|
3.579% senior notes due July 23, 2020
|
2,000
|
|
1,988
|
|
2,000
|
|
1,983
|
|
|||||||
|
4.464% senior notes due July 23, 2022
|
3,000
|
|
2,977
|
|
3,000
|
|
2,973
|
|
|||||||
|
4.908% senior notes due July 23, 2025
|
4,500
|
|
4,462
|
|
4,500
|
|
4,458
|
|
|||||||
|
3.750% senior notes due February 15, 2028
|
1,000
|
|
985
|
|
—
|
|
—
|
|
|||||||
|
4.200% senior notes due March 15, 2028
|
1,250
|
|
1,238
|
|
—
|
|
—
|
|
|||||||
|
6.384% senior notes due October 23, 2035
|
2,000
|
|
1,981
|
|
2,000
|
|
1,980
|
|
|||||||
|
6.484% senior notes due October 23, 2045
|
3,500
|
|
3,466
|
|
3,500
|
|
3,466
|
|
|||||||
|
5.375% senior notes due May 1, 2047
|
2,500
|
|
2,506
|
|
—
|
|
—
|
|
|||||||
|
6.834% senior notes due October 23, 2055
|
500
|
|
495
|
|
500
|
|
495
|
|
|||||||
|
Credit facilities
|
9,479
|
|
9,387
|
|
8,916
|
|
8,814
|
|
|||||||
|
Time Warner Cable, LLC:
|
|||||||||||||||
|
5.850% senior notes due May 1, 2017
|
—
|
|
—
|
|
2,000
|
|
2,028
|
|
|||||||
|
6.750% senior notes due July 1, 2018
|
2,000
|
|
2,045
|
|
2,000
|
|
2,135
|
|
|||||||
|
8.750% senior notes due February 14, 2019
|
1,250
|
|
1,337
|
|
1,250
|
|
1,412
|
|
|||||||
|
8.250% senior notes due April 1, 2019
|
2,000
|
|
2,148
|
|
2,000
|
|
2,264
|
|
|||||||
|
5.000% senior notes due February 1, 2020
|
1,500
|
|
1,579
|
|
1,500
|
|
1,615
|
|
|||||||
|
4.125% senior notes due February 15, 2021
|
700
|
|
730
|
|
700
|
|
739
|
|
|||||||
|
4.000% senior notes due September 1, 2021
|
1,000
|
|
1,045
|
|
1,000
|
|
1,056
|
|
|||||||
|
5.750% sterling senior notes due June 2, 2031
(a)
|
845
|
|
912
|
|
770
|
|
834
|
|
|||||||
|
6.550% senior debentures due May 1, 2037
|
1,500
|
|
1,686
|
|
1,500
|
|
1,691
|
|
|||||||
|
7.300% senior debentures due July 1, 2038
|
1,500
|
|
1,788
|
|
1,500
|
|
1,795
|
|
|||||||
|
6.750% senior debentures due June 15, 2039
|
1,500
|
|
1,724
|
|
1,500
|
|
1,730
|
|
|||||||
|
5.875% senior debentures due November 15, 2040
|
1,200
|
|
1,258
|
|
1,200
|
|
1,259
|
|
|||||||
|
5.500% senior debentures due September 1, 2041
|
1,250
|
|
1,258
|
|
1,250
|
|
1,258
|
|
|||||||
|
5.250% sterling senior notes due July 15, 2042
(b)
|
879
|
|
847
|
|
800
|
|
771
|
|
|||||||
|
4.500% senior debentures due September 15, 2042
|
1,250
|
|
1,137
|
|
1,250
|
|
1,135
|
|
|||||||
|
Time Warner Cable Enterprises LLC:
|
|||||||||||||||
|
8.375% senior debentures due March 15, 2023
|
1,000
|
|
1,232
|
|
1,000
|
|
1,273
|
|
|||||||
|
8.375% senior debentures due July 15, 2033
|
1,000
|
|
1,312
|
|
1,000
|
|
1,324
|
|
|||||||
|
Total debt
|
69,003
|
|
70,231
|
|
60,036
|
|
61,747
|
|
|||||||
|
Less current portion:
|
|||||||||||||||
|
5.850% senior notes due May 1, 2017
|
—
|
|
—
|
|
(2,000
|
)
|
(2,028
|
)
|
|||||||
|
6.750% senior notes due July 1, 2018
|
(2,000
|
)
|
(2,045
|
)
|
—
|
|
—
|
|
|||||||
|
Long-term debt
|
$
|
67,003
|
|
$
|
68,186
|
|
$
|
58,036
|
|
$
|
59,719
|
|
|||
F- 20
CHARTER COMMUNICATIONS, INC. AND SUBSIDIARIES
NOTES TO CONSOLIDATED FINANCIAL STATEMENTS
DECEMBER 31, 2017, 2016 AND 2015
(dollars in millions, except share or per share data or where indicated)
|
(a)
|
Principal amount includes
£625 million
valued at
$845 million
and
$770 million
as of
December 31, 2017
and
December 31, 2016
, respectively, using the exchange rate at that date.
|
|
(b)
|
Principal amount includes
£650 million
valued at
$879 million
and
$800 million
as of
December 31, 2017
and
December 31, 2016
, respectively, using the exchange rate at that date.
|
The accreted values presented in the table above represent the principal amount of the debt less the original issue discount at the time of sale, deferred financing costs, and, in regards to the Legacy TWC debt assumed, fair value premium adjustments as a result of applying acquisition accounting plus the accretion of those amounts to the balance sheet date. However, the amount that is currently payable if the debt becomes immediately due is equal to the principal amount of the debt. In regards to the fixed-rate British pound sterling denominated notes (the “Sterling Notes”), the principal amount of the debt and any premium or discount is remeasured into US dollars as of each balance sheet date. See Note 12. The Company has availability under the Charter Operating credit facilities of approximately
$3.6 billion
as of
December 31, 2017
.
During 2015, CCO Holdings and CCO Holdings Capital closed on transactions in which they issued
$2.7 billion
aggregate principal amount of senior unsecured notes with varying maturities and interest rates. The net proceeds were used to repurchase
$2.5 billion
of various series of senior unsecured notes, as well as for general corporate purposes. These debt repurchases resulted in a loss on extinguishment of debt of
$123 million
for the year ended December 31, 2015. The Company also recorded a loss on extinguishment of debt of approximately
$5 million
for the year ended December 31, 2015 as a result of the repayment of debt upon termination of the proposed transactions with Comcast Corporation.
During 2016, CCO Holdings and CCO Holdings Capital closed on transactions in which they issued
$3.2 billion
aggregate principal amount of senior unsecured notes with varying maturities and interest rates. The net proceeds were used to repurchase
$2.9 billion
of various series of senior unsecured notes, as well as for general corporate purposes. These debt repurchases resulted in a loss on extinguishment of debt of
$110 million
for the year ended December 31, 2016.
During 2016, Charter Operating entered into an amendment to its Amended and Restated Credit Agreement dated May 18, 2016 (the “Credit Agreement”) decreasing the applicable LIBOR margin, eliminating the LIBOR floor and extending the maturities on certain term loans. The Company recorded a loss on extinguishment of debt of
$1 million
for the year ended
December 31, 2016
related to these transactions.
During 2017, CCO Holdings and CCO Holdings Capital closed on transactions in which they issued
$6.25 billion
aggregate principal amount of senior unsecured notes with varying maturities and interest rates. The net proceeds were used to fund buybacks of Charter Class A common stock or Charter Holdings common units, repurchase
$2.75 billion
of various series of senior secured and unsecured notes, as well as for general corporate purposes. These debt repurchases resulted in a loss on extinguishment of debt of
$34 million
for the year ended December 31, 2017.
During 2017, Charter Operating and Charter Communications Operating Capital Corp. closed on transactions in which they issued
$4.75 billion
aggregate principal amount of senior secured notes with varying maturities and interest rates. The net proceeds were used to fund buybacks of Charter Class A common stock or Charter Holdings common units, as well as for general corporate purposes.
During 2017, Charter Operating also entered into amendments to its Credit Agreement decreasing the applicable LIBOR margins, eliminating the LIBOR floor, increasing the capacity of the revolving loan, extending the maturities and repaying the E, F, H and I term loans with the issuance of a new term B loan. The Company recorded a loss on extinguishment of debt of
$6 million
for the year ended
December 31, 2017
related to these transactions. See "Charter Operating Credit Facilities" below for details on the Company's term loans as of
December 31, 2017
.
CCO Holdings Notes
The CCO Holdings notes are senior debt obligations of CCO Holdings and CCO Holdings Capital and rank equally with all other current and future unsecured, unsubordinated obligations of CCO Holdings and CCO Holdings Capital. They are structurally subordinated to all obligations of subsidiaries of CCO Holdings.
F- 21
CHARTER COMMUNICATIONS, INC. AND SUBSIDIARIES
NOTES TO CONSOLIDATED FINANCIAL STATEMENTS
DECEMBER 31, 2017, 2016 AND 2015
(dollars in millions, except share or per share data or where indicated)
CCO Holdings may redeem some or all of the CCO Holdings notes at any time at a premium. The optional redemption price declines to
100%
of the respective series’ principal amount, plus accrued and unpaid interest, if any, on or after varying dates in 2019 through 2025.
In addition, at any time prior to varying dates in 2018 through 2020, CCO Holdings may redeem up to
40%
of the aggregate principal amount of certain notes at a premium plus accrued and unpaid interest to the redemption date, with the net cash proceeds of one or more equity offerings (as defined in the indenture); provided that certain conditions are met. In the event of specified change of control events, CCO Holdings must offer to purchase the outstanding CCO Holdings notes from the holders at a purchase price equal to
101%
of the total principal amount of the notes, plus any accrued and unpaid interest.
High-Yield Restrictive Covenants; Limitation on Indebtedness.
The indentures governing the CCO Holdings notes contain certain covenants that restrict the ability of CCO Holdings, CCO Holdings Capital and all of their restricted subsidiaries to:
|
•
|
incur additional debt;
|
|
•
|
pay dividends on equity or repurchase equity;
|
|
•
|
make investments;
|
|
•
|
sell all or substantially all of their assets or merge with or into other companies;
|
|
•
|
sell assets;
|
|
•
|
in the case of restricted subsidiaries, create or permit to exist dividend or payment restrictions with respect to CCO Holdings, guarantee their parent companies debt, or issue specified equity interests;
|
|
•
|
engage in certain transactions with affiliates; and
|
|
•
|
grant liens.
|
The above limitations in certain circumstances regarding incurrence of debt, payment of dividends and making investments contained in the indentures of CCO Holdings permit CCO Holdings and its restricted subsidiaries to perform the above, so long as, after giving pro forma effect to the above, the leverage ratio would be below a specified level for the issuer. The leverage ratio under the indentures is
6.0
to
1.0
.
Charter Operating Notes
The Charter Operating notes are guaranteed by CCO Holdings and substantially all of the operating subsidiaries of Charter Operating. In addition, the Charter Operating notes are secured by a perfected first priority security interest in substantially all of the assets of Charter Operating to the extent such liens can be perfected under the Uniform Commercial Code by the filing of a financing statement and the liens rank equally with the liens on the collateral securing obligations under the Charter Operating credit facilities. Charter Operating may redeem some or all of the Charter Operating notes at any time at a premium.
The Charter Operating notes are subject to the terms and conditions of the indenture governing the Charter Operating notes. The Charter Operating notes contain customary representations and warranties and affirmative covenants with limited negative covenants. The Charter Operating indenture also contains customary events of default.
Charter Operating Credit Facilities
The Charter Operating credit facilities have an outstanding principal amount of
$9.5 billion
at
December 31, 2017
as follows:
|
•
|
term loan A-2 with a remaining principal amount of
$2.9 billion
, which is repayable in quarterly installments and aggregating
$144 million
in each loan year, with the remaining balance due at final maturity on March 31, 2023. Pricing on term loan A-2 is LIBOR plus
1.50%
;
|
|
•
|
term loan B with a remaining principal amount of approximately
$6.4 billion
, which is repayable in equal quarterly installments and aggregating
$64 million
in each loan year, with the remaining balance due at final maturity on April 30, 2025. Pricing on term loan B is LIBOR plus
2.00%
; and
|
|
•
|
revolving loan with an outstanding balance of
$254 million
at
December 31, 2017
and allowing for borrowings of up to
$4.0 billion
, maturing on March 31, 2023. Pricing on the revolving loan is LIBOR plus
1.50%
with a commitment fee of
|
F- 22
CHARTER COMMUNICATIONS, INC. AND SUBSIDIARIES
NOTES TO CONSOLIDATED FINANCIAL STATEMENTS
DECEMBER 31, 2017, 2016 AND 2015
(dollars in millions, except share or per share data or where indicated)
0.30%
. As of
December 31, 2017
,
$137 million
of the revolving loan was utilized to collateralize a like principal amount of letters of credit out of
$291 million
of letters of credit issued on the Company’s behalf.
Amounts outstanding under the Charter Operating credit facilities bear interest, at Charter Operating’s election, at a base rate or LIBOR (
1.56%
and
0.77%
as of
December 31, 2017
and
December 31, 2016
, respectively), as defined, plus an applicable margin.
The Charter Operating credit facilities also allow us to enter into incremental term loans in the future, with amortization as set forth in the notices establishing such term loans. Although the Charter Operating credit facilities allow for the incurrence of a certain amount of incremental term loans subject to pro forma compliance with its financial maintenance covenants, no assurance can be given that the Company could obtain additional incremental term loans in the future if Charter Operating sought to do so or what amount of incremental term loans would be allowable at any given time under the terms of the Charter Operating credit facilities.
The obligations of Charter Operating under the Charter Operating credit facilities are guaranteed by CCO Holdings and substantially all of the operating subsidiaries of Charter Operating. The obligations are also secured by (i) a lien on substantially all of the assets of Charter Operating and its subsidiaries, to the extent such lien can be perfected under the Uniform Commercial Code by the filing of a financing statement, and (ii) a pledge by CCO Holdings of the equity interests owned by it in any of Charter Operating’s subsidiaries, as well as intercompany obligations owing to it by any of such entities.
Restrictive Covenants
The Charter Operating credit facilities contain representations and warranties, and affirmative and negative covenants customary for financings of this type. The financial covenants measure performance against standards set for leverage to be tested as of the end of each quarter. The Charter Operating credit facilities contain provisions requiring mandatory loan prepayments under specific circumstances, including in connection with certain sales of assets, so long as the proceeds have not been reinvested in the business. Additionally, the Charter Operating credit facilities provisions contain an allowance for restricted payments with certain limitations. The Charter Operating credit facilities permit Charter Operating and its subsidiaries to make distributions to pay interest on the currently outstanding subordinated and parent company indebtedness, provided that, among other things, no default has occurred and is continuing under the Charter Operating credit facilities. The Charter Operating credit facilities also contain customary events of default.
TWC, LLC Senior Notes and Debentures
The TWC, LLC senior notes and debentures are guaranteed by CCO Holdings and substantially all of the operating subsidiaries of Charter Operating and rank equally with the liens on the collateral securing obligations under the Charter Operating notes and credit facilities. Interest on each series of TWC, LLC senior notes and debentures is payable semi-annually (with the exception of the Sterling Notes, which is payable annually) in arrears.
The TWC, LLC indenture contains customary covenants relating to restrictions on the ability of TWC, LLC or any material subsidiary to create liens and on the ability of TWC, LLC and Time Warner Cable Enterprises LLC ("TWCE") to consolidate, merge or convey or transfer substantially all of their assets. The TWC, LLC indenture also contains customary events of default.
The TWC, LLC senior notes and debentures may be redeemed in whole or in part at any time at TWC, LLC’s option at a redemption price equal to the greater of (i) all of the applicable principal amount being redeemed and (ii) the sum of the present values of the remaining scheduled payments on the applicable TWC, LLC senior notes and debentures discounted to the redemption date on a semi-annual basis (with the exception of the Sterling Notes, which are on an annual basis), at a comparable government bond rate plus a designated number of basis points as further described in the indenture and the applicable note or debenture, plus, in each case, accrued but unpaid interest to, but not including, the redemption date.
The Company may offer to redeem all, but not less than all, of the Sterling Notes in the event of certain changes in the tax laws of the U.S. (or any taxing authority in the U.S.). This redemption would be at a redemption price equal to
100%
of the principal amount, together with accrued and unpaid interest on the Sterling Notes to, but not including, the redemption date.
F- 23
CHARTER COMMUNICATIONS, INC. AND SUBSIDIARIES
NOTES TO CONSOLIDATED FINANCIAL STATEMENTS
DECEMBER 31, 2017, 2016 AND 2015
(dollars in millions, except share or per share data or where indicated)
TWCE Senior Debentures
The TWCE senior debentures are guaranteed by CCO Holdings, substantially all of the operating subsidiaries of Charter Operating and TWC, LLC and rank equally with the liens on the collateral securing obligations under the Charter Operating notes and credit facilities. Interest on each series of TWCE senior debentures is payable semi-annually in arrears. The TWCE senior debentures are not redeemable before maturity.
The TWCE indenture contains customary covenants relating to restrictions on the ability of TWCE or any material subsidiary to create liens and on the ability of TWC, LLC and TWCE to consolidate, merge or convey or transfer substantially all of their assets. The TWCE indenture also contains customary events of default.
Limitations on Distributions
Distributions by the Company’s subsidiaries to a parent company for payment of principal on parent company notes are restricted under the indentures and credit facilities discussed above, unless there is no default under the applicable indenture and credit facilities, and unless each applicable subsidiary’s leverage ratio test is met at the time of such distribution. As of
December 31, 2017
, there was no default under any of these indentures or credit facilities and each subsidiary met its applicable leverage ratio tests based on
December 31, 2017
financial results. There can be no assurance that they will satisfy these tests at the time of the contemplated distribution. Distributions by Charter Operating for payment of principal on parent company notes are further restricted by the covenants in its credit facilities.
However, without regard to leverage, during any calendar year or any portion thereof during which the borrower is a flow-through entity for tax purposes, and so long as no event of default exists, the borrower may make distributions to the equity interests of the borrower in an amount sufficient to make permitted tax payments.
In addition to the limitation on distributions under the various indentures, distributions by the Company’s subsidiaries may be limited by applicable law, including the Delaware Limited Liability Company Act, under which the Company’s subsidiaries may make distributions if they have “surplus” as defined in the act.
Liquidity and Future Principal Payments
The Company continues to have significant amounts of debt, and its business requires significant cash to fund principal and interest payments on its debt, capital expenditures and ongoing operations. As set forth below, the Company has significant future principal payments. The Company continues to monitor the capital markets, and it expects to undertake refinancing transactions and utilize free cash flow and cash on hand to further extend or reduce the maturities of its principal obligations. The timing and terms of any refinancing transactions will be subject to market conditions.
Based upon outstanding indebtedness as of
December 31, 2017
, the amortization of term loans, and the maturity dates for all senior and subordinated notes, total future principal payments on the total borrowings under all debt agreements are as follows:
|
Year
|
Amount
|
|||
|
2018
|
$
|
2,207
|
|
|
|
2019
|
3,457
|
|
||
|
2020
|
3,707
|
|
||
|
2021
|
2,407
|
|
||
|
2022
|
4,457
|
|
||
|
Thereafter
|
52,768
|
|
||
|
$
|
69,003
|
|
||
F- 24
CHARTER COMMUNICATIONS, INC. AND SUBSIDIARIES
NOTES TO CONSOLIDATED FINANCIAL STATEMENTS
DECEMBER 31, 2017, 2016 AND 2015
(dollars in millions, except share or per share data or where indicated)
10. Common Stock
Charter’s Class A common stock and Class B common stock are identical except with respect to certain voting, transfer and conversion rights. Holders of Class A common stock are entitled to
one
vote per share. Charter’s Class B common stock represents the share issued to A/N in connection with the Bright House Transaction. One share of Charter’s Class B common stock has a number of votes reflecting the voting power of the Charter Holdings common units and Charter Holdings convertible preferred units held by A/N as of the applicable record date on an if-converted, if-exchanged basis, and is generally intended to reflect A/N’s economic interests in Charter Holdings.
The following table summarizes our shares outstanding for the three years ended
December 31, 2017
:
|
Class A Common Stock
|
Class B Common Stock
|
|||||
|
BALANCE, December 31, 2014
|
111,999,687
|
|
—
|
|
||
|
Exercise of stock options
|
579,173
|
|
—
|
|
||
|
Restricted stock issuances, net of cancellations
|
6,920
|
|
—
|
|
||
|
Restricted stock unit vesting
|
98,831
|
|
—
|
|
||
|
Purchase of treasury stock
|
(245,783
|
)
|
—
|
|
||
|
BALANCE, December 31, 2015
|
112,438,828
|
|
—
|
|
||
|
Reorganization of common stock
|
(10,771,404
|
)
|
—
|
|
||
|
Issuance of shares in TWC Transaction
|
143,012,155
|
|
—
|
|
||
|
Issuance of shares to Liberty Broadband for cash
|
25,631,339
|
|
—
|
|
||
|
Issuance of share to A/N in Bright House Transaction
|
—
|
|
1
|
|
||
|
Exchange of Charter Holdings units held by A/N (see Note 11)
|
1,852,832
|
|
—
|
|
||
|
Exercise of stock options
|
1,014,664
|
|
—
|
|
||
|
Restricted stock issuances, net of cancellations
|
9,811
|
|
—
|
|
||
|
Restricted stock unit vesting
|
1,738,792
|
|
—
|
|
||
|
Purchase of treasury stock
|
(6,029,225
|
)
|
—
|
|
||
|
BALANCE, December 31, 2016
|
268,897,792
|
|
1
|
|
||
|
Exchange of Charter Holdings units held by A/N (see Note 11)
|
1,263,497
|
|
—
|
|
||
|
Exercise of stock options
|
1,044,526
|
|
—
|
|
||
|
Restricted stock issuances, net of cancellations
|
9,517
|
|
—
|
|
||
|
Restricted stock unit vesting
|
1,159,083
|
|
—
|
|
||
|
Purchase of treasury stock
|
(33,868,356
|
)
|
—
|
|
||
|
BALANCE, December 31, 2017
|
238,506,059
|
|
1
|
|
||
The shares outstanding balances shown above as of and prior to December 31, 2015 represent historical shares outstanding of Legacy Charter before applying the Parent Merger Exchange Ratio (as defined in the Merger Agreement). The
10.8 million
shares associated with the reorganization of Charter Class A common stock represents the reduction to Legacy Charter Class A common shares outstanding as of the acquisition date as a result of applying the Parent Merger Exchange Ratio.
F- 25
CHARTER COMMUNICATIONS, INC. AND SUBSIDIARIES
NOTES TO CONSOLIDATED FINANCIAL STATEMENTS
DECEMBER 31, 2017, 2016 AND 2015
(dollars in millions, except share or per share data or where indicated)
Share Repurchases
The following represents the Company's purchase of Charter Class A common stock and the effect on the consolidated statements of cash flows during the years ended
December 31, 2017
,
2016
and
2015
.
|
Year Ended December 31,
|
||||||||||||||||||||
|
2017
|
2016
|
2015
|
||||||||||||||||||
|
Shares
|
$
|
Shares
|
$
|
Shares
|
$
|
|||||||||||||||
|
Share buybacks
|
33,375,878
|
|
$
|
11,570
|
|
5,070,656
|
|
$
|
1,346
|
|
—
|
|
$
|
—
|
|
|||||
|
Income tax withholding
|
447,455
|
|
145
|
|
908,066
|
|
216
|
|
177,696
|
|
38
|
|
||||||||
|
Exercise cost
|
45,023
|
|
50,503
|
|
44,541
|
|
||||||||||||||
|
33,868,356
|
|
$
|
11,715
|
|
6,029,225
|
|
$
|
1,562
|
|
222,237
|
|
$
|
38
|
|
||||||
As of
December 31, 2017
, Charter had remaining board authority to purchase an additional
$1.1 billion
of Charter’s Class A common stock and/or Charter Holdings common units. See Note 19. The Company also withholds shares of its Class A common stock in payment of income tax withholding owed by employees upon vesting of equity awards as well as exercise costs owed by employees upon exercise of stock options.
At the end of each fiscal year, Charter’s board of directors approved the retirement of the then currently outstanding treasury stock and those shares were retired as of
December 31, 2017
and
2016
. The Company accounts for treasury stock using the cost method and includes treasury stock as a component of total shareholders’ equity. Upon retirement, these treasury shares are allocated between additional paid-in capital and accumulated deficit based on the cost of original issue included in additional paid-in capital.
11. Noncontrolling Interests
Noncontrolling interests represents consolidated subsidiaries of which the Company owns less than
100%
. The Company is a holding company whose principal asset is a controlling equity interest in Charter Holdings, the indirect owner of the Company’s cable systems. Noncontrolling interests on the Company’s balance sheet primarily includes A/N’s equity interests in Charter Holdings, which is comprised of a common ownership interest and a convertible preferred ownership interest.
As of
December 31, 2017
, A/N held
22.3 million
Charter Holdings common units which are exchangeable at any time into either Charter Class A common stock on a one-for-one basis, or, at Charter’s option, cash, based on the then current market price of Charter Class A common stock. Net income (loss) of Charter Holdings attributable to A/N’s common noncontrolling interest for financial reporting purposes is based on the weighted average effective common ownership interest of approximately
9%
and
10%
and was
$69 million
and
$129 million
for the years ended
December 31, 2017
and
2016
, respectively. Charter Holdings distributed
$3 million
to A/N as a pro rata tax distribution on its common units during the years ended
December 31, 2017
and
2016
.
Pursuant to the letter agreement discussed in Note 19, Charter Holdings purchased
4.8 million
Charter Holdings common units from A/N, at a price per unit of
$347.03
, or
$1.7 billion
during the year ended
December 31, 2017
, and
0.8 million
Charter Holdings common units, at a price per unit of
$289.83
, or
$218 million
during the year ended
December 31, 2016
. The common units purchased during the year ended
December 31, 2017
are reflected as a reduction in noncontrolling interest based on net carrying value of approximately
$1.2 billion
with the remaining
$478 million
recorded as reduction of additional paid-in-capital, net of
$183 million
of deferred income taxes. The common units purchased during the year ended
December 31, 2016
are reflected as a reduction in noncontrolling interest based on net carrying value of approximately
$187 million
with the remaining
$31 million
recorded as reduction of additional paid-in-capital, net of
$12 million
of deferred income taxes.
In December 2017 and 2016, A/N exchanged
1.3 million
and
1.9 million
Charter Holdings common units, respectively, held by A/N for shares of Charter Class A common stock for an aggregate purchase price of
$400 million
and
$537 million
, respectively, pursuant to the letter agreement discussed in Note 19. The common units exchanged had a net carrying value in noncontrolling interest of approximately
$298 million
and
$460 million
as of
December 31, 2017
and
2016
, respectively. The exchange of A/N common units resulted in a step-up in the tax-basis of the assets of Charter Holdings which is further discussed in Note 17.
F- 26
CHARTER COMMUNICATIONS, INC. AND SUBSIDIARIES
NOTES TO CONSOLIDATED FINANCIAL STATEMENTS
DECEMBER 31, 2017, 2016 AND 2015
(dollars in millions, except share or per share data or where indicated)
As of
December 31, 2017
, A/N also held
25 million
Charter Holdings convertible preferred units with a face amount of
$2.5 billion
that pays a
6%
annual preferred dividend. The
6%
annual preferred dividend is paid quarterly in cash, if and when declared, provided that, if dividends are suspended at any time, the dividends will accrue until they are paid. Net income (loss) of Charter Holdings attributable to the preferred noncontrolling interest for financial reporting purposes is based on the preferred dividend which was
$150 million
and
$93 million
for the years ended
December 31, 2017
and
2016
, respectively. Each convertible preferred unit is convertible into either
0.37334
of a Charter Holdings common unit (if then held by A/N) or
0.37334
of a share of Charter Class A common stock (if then held by a third party), representing a conversion price of
$267.85
per unit, based on a conversion feature as defined in the Limited Liability Company Agreement of Charter Holdings. After May 18, 2021, Charter may redeem the convertible preferred units if the price of Charter Class A common stock exceeds
130%
of the conversion price. These Charter Holdings common and convertible preferred units held by A/N are recorded in noncontrolling interests as permanent equity in the consolidated balance sheet.
The common units and convertible preferred units issued to A/N as consideration for the Bright House Transaction were initially measured at their fair value of
$7.0 billion
and
$3.2 billion
, respectively, in accordance with acquisition accounting. However, upon formation of Charter Holdings and subsequent to the acquisition, the carrying amounts of the controlling and noncontrolling interests were adjusted to reflect the relative effective common ownership interest in Charter Holdings. In addition to the common units purchased and exchanged with A/N as noted above, other changes in Charter Holdings' ownership resulted in an increase to noncontrolling interest of approximately
$589 million
and a corresponding decrease to additional paid-in capital of
$589 million
, net of
$225 million
of deferred income taxes, for the year ended
December 31, 2016
. Noncontrolling interest and additional paid-in-capital were also adjusted during the year ended
December 31, 2017
due to the changes in Charter Holdings' ownership. These adjustments resulted in a decrease to noncontrolling interest of approximately
$362 million
and a corresponding increase to additional paid-in-capital of
$362 million
, net of
$139 million
of deferred income taxes, for the year ended
December 31, 2017
.
12. Accounting for Derivative Instruments and Hedging Activities
The Company uses derivative instruments to manage interest rate risk on variable debt and foreign exchange risk on the Sterling Notes, and does not hold or issue derivative instruments for speculative trading purposes.
Cross-currency derivative instruments are used to effectively convert
£1.275 billion
aggregate principal amount of fixed-rate British pound sterling denominated debt, including annual interest payments and the payment of principal at maturity, to fixed-rate U.S. dollar denominated debt. The cross-currency swaps have maturities of June 2031 and July 2042. The Company is required to post collateral on the cross-currency derivative instruments when the derivative contracts are in a liability position. In May 2016, the Company entered into a collateral holiday agreement for
80%
of both the 2031 and 2042 cross-currency swaps, which eliminates the requirement to post collateral for
three
years. The fair value of the Company's cross-currency derivatives included in other long-term liabilities on the Company's consolidated balance sheets was
$25 million
and
$251 million
as of
December 31, 2017
and
2016
, respectively.
The Company’s derivative instruments are not designated as hedges and are marked to fair value each period, with the impact recorded as a gain or loss on financial instruments, net in the consolidated statements of operations. While these derivative instruments are not designated as cash flow hedges for accounting purposes, management continues to believe such instruments are correlated with the respective debt, thus managing associated risk.
F- 27
CHARTER COMMUNICATIONS, INC. AND SUBSIDIARIES
NOTES TO CONSOLIDATED FINANCIAL STATEMENTS
DECEMBER 31, 2017, 2016 AND 2015
(dollars in millions, except share or per share data or where indicated)
The effect of financial instruments on the consolidated statements of operations is presented in the table below.
|
Year Ended December 31,
|
|||||||||||
|
2017
|
2016
|
2015
|
|||||||||
|
Gain (Loss) on Financial Instruments, Net:
|
|||||||||||
|
Change in fair value of interest rate derivative instruments
|
$
|
5
|
|
$
|
8
|
|
$
|
5
|
|
||
|
Change in fair value of cross-currency derivative instruments
|
226
|
|
(179
|
)
|
—
|
|
|||||
|
Foreign currency remeasurement of Sterling Notes to U.S. dollars
|
(157
|
)
|
279
|
|
—
|
|
|||||
|
Loss on termination of interest rate derivative instruments
|
—
|
|
(11
|
)
|
—
|
|
|||||
|
Loss reclassified from accumulated other comprehensive loss due to discontinuance of hedge accounting
|
(5
|
)
|
(8
|
)
|
(9
|
)
|
|||||
|
$
|
69
|
|
$
|
89
|
|
$
|
(4
|
)
|
|||
Upon closing of the TWC Transaction, the Company acquired interest rate derivative instrument assets which were terminated and settled with their respective counterparties in the second quarter of 2016 with an
$88 million
cash payment to the Company. The termination resulted in an
$11 million
loss for the year ended
December 31, 2016
which was recorded in gain (loss) on financial instruments, net in the consolidated statements of operations. All of the Company's interest rate derivatives were expired as of December 31, 2017.
13. Fair Value Measurements
The accounting guidance
establishes a three-level hierarchy for disclosure of fair value measurements, based upon the transparency of inputs to the valuation of an asset or liability as of the measurement date, as follows:
|
•
|
Level 1 – inputs to the valuation methodology are quoted prices (unadjusted) for identical assets or liabilities in active markets.
|
|
•
|
Level 2 – inputs to the valuation methodology include quoted prices for similar assets and liabilities in active markets, and inputs that are observable for the asset or liability, either directly or indirectly, for substantially the full term of the financial instrument.
|
|
•
|
Level 3 – inputs to the valuation methodology are unobservable and significant to the fair value measurement.
|
Financial Assets and Liabilities
The Company has estimated the fair value of its financial instruments as of
December 31, 2017
and
2016
using available market information or other appropriate valuation methodologies. Considerable judgment, however, is required in interpreting market data to develop the estimates of fair value. Accordingly, the estimates presented in the accompanying consolidated financial statements are not necessarily indicative of the amounts the Company would realize in a current market exchange.
The carrying amounts of cash and cash equivalents, receivables, payables and other current assets and liabilities approximate fair value because of the short maturity of those instruments.
A portion of the Company’s cash and cash equivalents as of
December 31, 2017
and
2016
were invested in money market funds. The money market funds are valued at the closing price reported by the fund sponsor from an actively traded exchange which approximates fair value. The money market funds potentially subject the Company to concentration of credit risk. The amount invested within any one financial instrument did not exceed
$300 million
and
$250 million
as of
December 31, 2017
and
2016
, respectively. As of
December 31, 2017
and
2016
, there were no significant concentrations of financial instruments in a single investee, industry or geographic location.
F- 28
CHARTER COMMUNICATIONS, INC. AND SUBSIDIARIES
NOTES TO CONSOLIDATED FINANCIAL STATEMENTS
DECEMBER 31, 2017, 2016 AND 2015
(dollars in millions, except share or per share data or where indicated)
The Company’s financial instruments that are accounted for at fair value on a recurring basis as of
December 31, 2017
and
2016
are presented in the table below.
|
December 31,
|
|||||||||||||||
|
2017
|
2016
|
||||||||||||||
|
Level 1
|
Level 2
|
Level 1
|
Level 2
|
||||||||||||
|
Assets
|
|||||||||||||||
|
Money market funds
|
$
|
291
|
|
$
|
—
|
|
$
|
1,205
|
|
$
|
—
|
|
|||
|
Liabilities
|
|||||||||||||||
|
Cross-currency derivative instruments
|
$
|
—
|
|
$
|
25
|
|
$
|
—
|
|
$
|
251
|
|
|||
A summary of the carrying value and fair value of the Company’s debt at
December 31, 2017
and
2016
is as follows:
|
December 31,
|
|||||||||||||||
|
2017
|
2016
|
||||||||||||||
|
Carrying Value
|
Fair Value
|
Carrying Value
|
Fair Value
|
||||||||||||
|
Debt
|
|||||||||||||||
|
Senior notes and debentures
|
$
|
60,844
|
|
$
|
63,443
|
|
$
|
52,933
|
|
$
|
55,203
|
|
|||
|
Credit facilities
|
$
|
9,387
|
|
$
|
9,440
|
|
$
|
8,814
|
|
$
|
8,943
|
|
|||
The estimated fair value of the Company’s senior notes and debentures as of
December 31, 2017
and
2016
is based on quoted market prices in active markets and is classified within Level 1 of the valuation hierarchy, while the estimated fair value of the Company’s credit facilities is based on quoted market prices in inactive markets and is classified within Level 2.
Non-financial Assets and Liabilities
The Company’s nonfinancial assets such as equity-method investments, franchises, property, plant, and equipment, and other intangible assets are not measured at fair value on a recurring basis; however, they are subject to fair value adjustments in certain circumstances, such as upon a business combination and when there is evidence that an impairment may exist.
No
impairments were recorded in
2017
,
2016
and
2015
.
14. Operating Costs and Expenses
Operating costs and expenses, exclusive of items shown separately in the consolidated statements of operations, consist of the following for the periods presented:
|
Year Ended December 31,
|
|||||||||||
|
2017
|
2016
|
2015
|
|||||||||
|
Programming
|
$
|
10,596
|
|
$
|
7,034
|
|
$
|
2,678
|
|
||
|
Regulatory, connectivity and produced content
|
2,064
|
|
1,467
|
|
435
|
|
|||||
|
Costs to service customers
|
7,780
|
|
5,654
|
|
1,880
|
|
|||||
|
Marketing
|
2,420
|
|
1,707
|
|
629
|
|
|||||
|
Transition costs
|
124
|
|
156
|
|
72
|
|
|||||
|
Other
|
3,557
|
|
2,637
|
|
732
|
|
|||||
|
$
|
26,541
|
|
$
|
18,655
|
|
$
|
6,426
|
|
|||
Programming costs consist primarily of costs paid to programmers for basic, premium, digital, video on demand, and pay-per-view programming. Regulatory, connectivity and produced content costs represent payments to franchise and regulatory authorities,
F- 29
CHARTER COMMUNICATIONS, INC. AND SUBSIDIARIES
NOTES TO CONSOLIDATED FINANCIAL STATEMENTS
DECEMBER 31, 2017, 2016 AND 2015
(dollars in millions, except share or per share data or where indicated)
costs directly related to providing video, Internet and voice services as well as payments for sports, local and news content produced by the Company. Included in regulatory, connectivity and produced content costs is content acquisition costs for the Los Angeles Lakers’ basketball games and Los Angeles Dodgers’ baseball games which are recorded as games are exhibited over the applicable season. Costs to service customers include costs related to field operations, network operations and customer care for the Company’s residential and small and medium business customers, including internal and third-party labor for installations, service and repairs, maintenance, bad debt expense, billing and collection, occupancy and vehicle costs. Marketing costs represent the costs of marketing to current and potential commercial and residential customers including labor costs. Transition costs represent incremental costs incurred to integrate the TWC and Bright House operations and to increase the scale of the Company’s business as a result of the Transactions. See Note 3. Other includes corporate overhead, advertising sales expenses, indirect costs associated with the Company’s enterprise business customers and regional sports and news networks, property tax and insurance expense and stock compensation expense, among others.
15. Other Operating Expenses, Net
Other operating expenses, net consist of the following for the years presented:
|
Year Ended December 31,
|
|||||||||||
|
2017
|
2016
|
2015
|
|||||||||
|
Merger and restructuring costs
|
$
|
351
|
|
$
|
970
|
|
$
|
70
|
|
||
|
Special charges, net
|
(21
|
)
|
17
|
|
15
|
|
|||||
|
(Gain) loss on sale of assets, net
|
16
|
|
(2
|
)
|
4
|
|
|||||
|
$
|
346
|
|
$
|
985
|
|
$
|
89
|
|
|||
Merger and restructuring costs
Merger and restructuring costs represent costs incurred in connection with merger and acquisition transactions and related restructuring, such as advisory, legal and accounting fees, employee retention costs, employee termination costs related to the Transactions and other exit costs. The Company expects to incur additional merger and restructuring costs in connection with the Transactions. Changes in accruals for merger and restructuring costs from January 1, 2016 through
December 31, 2017
are presented below:
|
Employee Retention Costs
|
Employee Termination Costs
|
Transaction and Advisory Costs
|
Other Costs
|
Total
|
|||||||||||||||
|
Liability, December 31, 2015
|
$
|
—
|
|
$
|
—
|
|
$
|
33
|
|
$
|
—
|
|
$
|
33
|
|
||||
|
Liability assumed in the Transactions
|
80
|
|
9
|
|
3
|
|
—
|
|
92
|
|
|||||||||
|
Costs incurred
|
26
|
|
337
|
|
318
|
|
41
|
|
722
|
|
|||||||||
|
Cash paid
|
(99
|
)
|
(102
|
)
|
(329
|
)
|
(41
|
)
|
(571
|
)
|
|||||||||
|
Remaining liability, December 31, 2016
|
7
|
|
244
|
|
25
|
|
—
|
|
276
|
|
|||||||||
|
Costs incurred
|
4
|
|
226
|
|
4
|
|
68
|
|
302
|
|
|||||||||
|
Cash paid
|
(10
|
)
|
(298
|
)
|
(12
|
)
|
(60
|
)
|
(380
|
)
|
|||||||||
|
Remaining liability, December 31, 2017
|
$
|
1
|
|
$
|
172
|
|
$
|
17
|
|
$
|
8
|
|
$
|
198
|
|
||||
In addition to the costs indicated above, the Company recorded
$49 million
and
$248 million
of expense related to accelerated vesting of equity awards of terminated employees for the years ended
December 31, 2017
and
2016
, respectively.
Special charges, net
Special charges, net primarily includes employee termination costs not related to the Transactions and net amounts of litigation settlements. In 2017, special charges, net also includes a
$101 million
benefit related to the remeasurement of the TRA liability
F- 30
CHARTER COMMUNICATIONS, INC. AND SUBSIDIARIES
NOTES TO CONSOLIDATED FINANCIAL STATEMENTS
DECEMBER 31, 2017, 2016 AND 2015
(dollars in millions, except share or per share data or where indicated)
as a result of the enactment of the Tax Cuts & Jobs Act (“Tax Reform”) in December 2017 (see Note 17) offset by an
$83 million
charge related to the Company's withdrawal liability from a multiemployer pension plan.
(Gain) loss on sale of assets, net
(Gain) loss on sale of assets, net represents the net (gain) loss recognized on the sales and disposals of fixed assets and cable systems.
16.
Stock Compensation Plans
Charter’s 2009 Stock Incentive Plan provides for grants of nonqualified stock options, incentive stock options, stock appreciation rights, dividend equivalent rights, performance units and performance shares, share awards, phantom stock, restricted stock units and restricted stock. Directors, officers and other employees of the Company and its subsidiaries, as well as others performing consulting services for the Company, are eligible for grants under the 2009 Stock Incentive Plan. The 2009 Stock Incentive Plan allows for the issuance of up to
21 million
shares of Charter Class A common stock (or units convertible into Charter Class A common stock).
At the closing of the TWC Transaction, Legacy TWC employee equity awards were converted into Charter Class A common stock equity awards on the same terms and conditions as were applicable under the Legacy TWC equity awards, except that the number of shares covered by each award and the option exercise prices were adjusted for the Stock Award Exchange Ratio (as defined in the Merger Agreement) such that the intrinsic value of the converted TWC awards was approximately equal to that of the original awards at the closing of the Transactions. The converted TWC awards continue to be subject to the terms of the Legacy TWC equity plans. The Parent Merger Exchange Ratio was also applied to outstanding Legacy Charter equity awards and option exercise prices; however, the terms of the equity awards did not change as a result of the Transactions.
Charter Stock options and restricted stock units cliff vest upon the
three
year anniversary of each grant. Certain stock options and restricted stock units vest based on achievement of stock price hurdles. Stock options generally expire
ten
years from the grant date and restricted stock units have no voting rights. Restricted stock generally vests
one
year from the date of grant. Legacy TWC restricted stock units that were converted into Charter restricted stock units generally vest
50%
on each of the third and fourth anniversary of the grant date.
As of
December 31, 2017
, total unrecognized compensation remaining to be recognized in future periods totaled
$211 million
for stock options,
$1 million
for restricted stock and
$173 million
for restricted stock units and the weighted average period over which they are expected to be recognized is
3
years for stock options,
4
months for restricted stock and
2
years for restricted stock units. The Company recorded
$261 million
,
$244 million
and
$78 million
of stock compensation expense for the years ended
December 31, 2017
,
2016
and
2015
, respectively, which is included in operating costs and expenses. The Company also recorded
$49 million
and
$248 million
of expense for the years ended
December 31, 2017
and
2016
, respectively, related to accelerated vesting of equity awards of terminated employees which is recorded in merger and restructuring costs.
F- 31
CHARTER COMMUNICATIONS, INC. AND SUBSIDIARIES
NOTES TO CONSOLIDATED FINANCIAL STATEMENTS
DECEMBER 31, 2017, 2016 AND 2015
(dollars in millions, except share or per share data or where indicated)
A summary of the activity for the Company’s stock options (after applying the Parent Merger Exchange Ratio) for the years ended
December 31, 2017
,
2016
and
2015
, is as follows (shares in thousands, except per share data):
|
Year Ended December 31,
|
|||||||||||||||||||||||||||||||||||
|
2017
|
2016
|
2015
|
|||||||||||||||||||||||||||||||||
|
Shares
|
Weighted Average Exercise Price
|
Aggregate Intrinsic Value
|
Shares
|
Weighted Average Exercise Price
|
Aggregate Intrinsic Value
|
Shares
|
Weighted Average Exercise Price
|
Aggregate Intrinsic Value
|
|||||||||||||||||||||||||||
|
Outstanding, beginning of period
|
9,592
|
|
$
|
181.39
|
|
3,923
|
|
$
|
122.03
|
|
3,336
|
|
$
|
95.42
|
|
||||||||||||||||||||
|
Granted
|
1,175
|
|
$
|
302.87
|
|
5,999
|
|
$
|
218.91
|
|
1,176
|
|
$
|
177.14
|
|
||||||||||||||||||||
|
Converted TWC awards
|
—
|
|
$
|
—
|
|
839
|
|
$
|
86.46
|
|
—
|
|
$
|
—
|
|
||||||||||||||||||||
|
Exercised
|
(1,044
|
)
|
$
|
124.32
|
|
$
|
219
|
|
(1,015
|
)
|
$
|
96.33
|
|
$
|
146
|
|
(524
|
)
|
$
|
72.27
|
|
$
|
68
|
|
|||||||||||
|
Canceled
|
(74
|
)
|
$
|
251.63
|
|
(154
|
)
|
$
|
173.98
|
|
(65
|
)
|
$
|
155.23
|
|
||||||||||||||||||||
|
Outstanding, end of period
|
9,649
|
|
$
|
201.83
|
|
$
|
1,295
|
|
9,592
|
|
$
|
181.39
|
|
3,923
|
|
$
|
122.03
|
|
|||||||||||||||||
|
Weighted average remaining contractual life
|
8
|
|
years
|
8
|
|
years
|
7
|
|
years
|
||||||||||||||||||||||||||
|
Options exercisable, end of period
|
1,734
|
|
$
|
90.56
|
|
$
|
425
|
|
1,665
|
|
$
|
71.71
|
|
1,224
|
|
$
|
61.88
|
|
|||||||||||||||||
|
Options expected to vest, end of period
|
7,915
|
|
$
|
226.20
|
|
$
|
869
|
|
|||||||||||||||||||||||||||
|
Weighted average fair value of options granted
|
$
|
73.67
|
|
$
|
47.42
|
|
$
|
66.20
|
|
||||||||||||||||||||||||||
A summary of the activity for the Company’s restricted stock (after applying the Parent Merger Exchange Ratio) for the years ended
December 31, 2017
,
2016
and
2015
, is as follows (shares in thousands, except per share data):
|
Year Ended December 31,
|
||||||||||||||||||||
|
2017
|
2016
|
2015
|
||||||||||||||||||
|
Shares
|
Weighted Average Grant Price
|
Shares
|
Weighted Average Grant Price
|
Shares
|
Weighted Average Grant Price
|
|||||||||||||||
|
Outstanding, beginning of period
|
10
|
|
$
|
231.81
|
|
197
|
|
$
|
65.79
|
|
390
|
|
$
|
63.30
|
|
|||||
|
Granted
|
10
|
|
$
|
343.10
|
|
10
|
|
$
|
231.83
|
|
6
|
|
$
|
201.34
|
|
|||||
|
Vested
|
(10
|
)
|
$
|
231.81
|
|
(197
|
)
|
$
|
65.79
|
|
(199
|
)
|
$
|
65.16
|
|
|||||
|
Canceled
|
—
|
|
$
|
—
|
|
—
|
|
$
|
—
|
|
—
|
|
$
|
—
|
|
|||||
|
Outstanding, end of period
|
10
|
|
$
|
343.10
|
|
10
|
|
$
|
231.81
|
|
197
|
|
$
|
65.79
|
|
|||||
F- 32
CHARTER COMMUNICATIONS, INC. AND SUBSIDIARIES
NOTES TO CONSOLIDATED FINANCIAL STATEMENTS
DECEMBER 31, 2017, 2016 AND 2015
(dollars in millions, except share or per share data or where indicated)
A summary of the activity for the Company’s restricted stock units (after applying the Parent Merger Exchange Ratio) for the years ended
December 31, 2017
,
2016
and
2015
, is as follows (shares in thousands, except per share data):
|
Year Ended December 31,
|
||||||||||||||||||||
|
2017
|
2016
|
2015
|
||||||||||||||||||
|
Shares
|
Weighted Average Grant Price
|
Shares
|
Weighted Average Grant Price
|
Shares
|
Weighted Average Grant Price
|
|||||||||||||||
|
Outstanding, beginning of period
|
3,313
|
|
$
|
192.41
|
|
337
|
|
$
|
150.96
|
|
294
|
|
$
|
115.01
|
|
|||||
|
Granted
|
285
|
|
$
|
302.76
|
|
895
|
|
$
|
213.09
|
|
148
|
|
$
|
179.17
|
|
|||||
|
Converted TWC awards
|
—
|
|
$
|
—
|
|
4,162
|
|
$
|
224.90
|
|
—
|
|
$
|
—
|
|
|||||
|
Vested
|
(1,159
|
)
|
$
|
216.21
|
|
(1,739
|
)
|
$
|
219.60
|
|
(90
|
)
|
$
|
78.65
|
|
|||||
|
Canceled
|
(48
|
)
|
$
|
234.99
|
|
(342
|
)
|
$
|
219.91
|
|
(15
|
)
|
$
|
155.43
|
|
|||||
|
Outstanding, end of period
|
2,391
|
|
$
|
192.96
|
|
3,313
|
|
$
|
192.41
|
|
337
|
|
$
|
150.96
|
|
|||||
17. Income Taxes
Substantially all of the Company’s operations are held through Charter Holdings and its direct and indirect subsidiaries. Charter Holdings and the majority of its subsidiaries are generally limited liability companies that are not subject to income tax. However, certain of these limited liability companies are subject to state income tax. In addition, the subsidiaries that are corporations are subject to income tax. Generally, the taxable income, gains, losses, deductions and credits of Charter Holdings are passed through to its members, Charter and A/N. Charter is responsible for its share of taxable income or loss of Charter Holdings allocated to it in accordance with the Charter Holdings Limited Liability Company Agreement ("LLC Agreement") and partnership tax rules and regulations. As a result, Charter's primary deferred tax component recorded in the consolidated balance sheets relates to its excess financial reporting outside basis, excluding amounts attributable to nondeductible goodwill, over Charter's tax basis in the investment in Charter Holdings.
Charter Holdings, the indirect owner of the Company’s cable systems, generally allocates its taxable income, gains, losses, deductions and credits proportionately according to the members’ respective ownership interests, except for special allocations required under Section 704(c) of the Internal Revenue Code and the Treasury Regulations (“Section 704(c)”). Pursuant to Section 704(c) and the LLC Agreement, each item of income, gain, loss and deduction with respect to any property contributed to the capital of the partnership shall, solely for tax purposes, be allocated among the members so as to take into account any variation between the adjusted basis of such property to the partnership for U.S. federal income tax purposes and its initial gross asset value using the “traditional method” as described in the Treasury Regulations.
F- 33
CHARTER COMMUNICATIONS, INC. AND SUBSIDIARIES
NOTES TO CONSOLIDATED FINANCIAL STATEMENTS
DECEMBER 31, 2017, 2016 AND 2015
(dollars in millions, except share or per share data or where indicated)
Income Tax Benefit
For the years ended
December 31, 2017
,
2016
, and
2015
, the Company recorded deferred income tax benefit as shown below. The tax provision in future periods will vary based on current and future temporary differences, as well as future operating results.
|
Year Ended December 31,
|
||||||||||||
|
2017
|
2016
|
2015
|
||||||||||
|
Current expense:
|
||||||||||||
|
Federal income taxes
|
$
|
(4
|
)
|
$
|
(4
|
)
|
$
|
(1
|
)
|
|||
|
State income taxes
|
(25
|
)
|
(29
|
)
|
(4
|
)
|
||||||
|
Current income tax expense
|
(29
|
)
|
(33
|
)
|
(5
|
)
|
||||||
|
Deferred benefit:
|
||||||||||||
|
Federal income taxes
|
9,082
|
|
2,549
|
|
53
|
|
||||||
|
State income taxes
|
34
|
|
409
|
|
12
|
|
||||||
|
Deferred income tax benefit
|
9,116
|
|
2,958
|
|
65
|
|
||||||
|
Income tax benefit
|
$
|
9,087
|
|
$
|
2,925
|
|
$
|
60
|
|
|||
Income tax benefit for the year ended December 31, 2017 was recognized primarily as a result of the enactment of Tax Reform in December 2017. Among other things, the primary provisions of Tax Reform impacting us are the reductions to the U.S. corporate income tax rate from
35%
to
21%
and temporary
100%
bonus depreciation for certain assets. The change in tax law required the Company to remeasure existing net deferred tax liabilities using the lower rate in the period of enactment resulting in an income tax benefit of approximately
$9.3 billion
to reflect these changes in the year ended December 31, 2017. The Company has reported provisional amounts for the income tax effects of Tax Reform for which the accounting is incomplete but a reasonable estimate could be determined. There were no specific impacts of Tax Reform that could not be reasonably estimated which the Company accounted for under prior tax law. Based on a continued analysis of the estimates and further guidance on the application of the law, it is anticipated that additional revisions may occur throughout the allowable measurement period. Overall, the changes due to Tax Reform will favorably affect income tax expense on future U.S. earnings. Income tax benefit for the year ended
December 31, 2017
was also increased by approximately
$88 million
due to the recognition of excess tax benefits resulting from share based compensation as a component of the provision for income taxes following the prospective application of Accounting Standards Update (“ASU”) No. 2016-09,
Improvements to Employee Share-Based Payment Accounting
(“ASU 2016-09”) on January 1, 2017
.
See Note 22.
Income tax benefit for the year ended
December 31, 2016
was recognized primarily through the reversal of approximately
$3.3 billion
of valuation allowance (see further discussion below), net of tax effect of permanent differences, a decrease to the anticipated blended state rate applied to Legacy Charter deferred tax balances as a result of the Transactions, a change in a state tax law, and prior to the closing of the Transactions, increases (decreases) in deferred tax liabilities related to Charter’s franchises which are characterized as indefinite-lived for book financial reporting purposes.
Prior to July 2, 2015, Charter Communications Holding Company, LLC ("Charter Holdco") was treated as a partnership for tax purposes. Effective on July 2, 2015, Charter elected to treat two of its wholly owned subsidiaries as disregarded entities for federal and state income tax purposes (the “Election”). The subsidiaries that made the Election were two of the three partners in Charter Holdco. This Election resulted in a deemed liquidation of Charter Holdco into Charter solely for federal and state income tax purposes, and resulted in a net increase of
$638 million
to the tax basis of Charter Holdco’s amortizable and depreciable assets. After the Election, all taxable income, gains, losses, deductions and credits of Charter Holdco and its indirect limited liability company subsidiaries were treated as income of Charter. In addition, the indirect subsidiaries of Charter Holdco that are corporations joined the Charter consolidated group. The impact of the Election to the Charter income tax provision, net of valuation allowance, was
$187 million
of income tax benefit recorded as a discrete tax event during the year ended December 31, 2015.
F- 34
CHARTER COMMUNICATIONS, INC. AND SUBSIDIARIES
NOTES TO CONSOLIDATED FINANCIAL STATEMENTS
DECEMBER 31, 2017, 2016 AND 2015
(dollars in millions, except share or per share data or where indicated)
The Company’s effective tax rate differs from that derived by applying the applicable federal income tax rate of
35%
for the years ended
December 31, 2017
,
2016
, and
2015
, respectively, as follows:
|
Year Ended December 31,
|
||||||||||||
|
2017
|
2016
|
2015
|
||||||||||
|
Statutory federal income taxes
|
$
|
(360
|
)
|
$
|
(288
|
)
|
$
|
116
|
|
|||
|
Statutory state income taxes, net
|
(34
|
)
|
(36
|
)
|
(4
|
)
|
||||||
|
Nondeductible expenses
|
(21
|
)
|
(62
|
)
|
(12
|
)
|
||||||
|
Net income attributable to noncontrolling interest
|
84
|
|
78
|
|
—
|
|
||||||
|
Change in valuation allowance
|
14
|
|
3,171
|
|
(250
|
)
|
||||||
|
Excess stock compensation
|
88
|
|
—
|
|
—
|
|
||||||
|
Organizational restructuring
|
—
|
|
—
|
|
187
|
|
||||||
|
Federal tax credits
|
21
|
|
16
|
|
18
|
|
||||||
|
Tax rate changes
|
9,293
|
|
65
|
|
4
|
|
||||||
|
Other
|
2
|
|
(19
|
)
|
1
|
|
||||||
|
Income tax benefit
|
$
|
9,087
|
|
$
|
2,925
|
|
$
|
60
|
|
|||
The change in the valuation allowance above differs from the change between the beginning and ending valuation allowance below due to a change in certain deferred tax assets and the corresponding establishment of a valuation allowance which results in no impact to the consolidated statements of operations.
Deferred Tax Assets (Liabilities)
The tax effects of these temporary differences that give rise to significant portions of the deferred tax assets and deferred tax liabilities at
December 31, 2017
and
2016
are presented below.
|
December 31,
|
||||||||
|
2017
|
2016
|
|||||||
|
Deferred tax assets:
|
||||||||
|
Loss carryforwards
|
$
|
2,657
|
|
$
|
4,127
|
|
||
|
Accrued and other
|
287
|
|
243
|
|
||||
|
Total gross deferred tax assets
|
2,944
|
|
4,370
|
|
||||
|
Less: valuation allowance
|
(137
|
)
|
(200
|
)
|
||||
|
Deferred tax assets
|
$
|
2,807
|
|
$
|
4,170
|
|
||
|
Deferred tax liabilities:
|
||||||||
|
Investment in partnership
|
$
|
(20,107
|
)
|
$
|
(30,832
|
)
|
||
|
Accrued and other
|
(14
|
)
|
(3
|
)
|
||||
|
Deferred tax liabilities
|
(20,121
|
)
|
(30,835
|
)
|
||||
|
Net deferred tax liabilities
|
$
|
(17,314
|
)
|
$
|
(26,665
|
)
|
||
The deferred tax liabilities on the investment in partnership above includes approximately
$32 million
and
$25 million
net deferred tax liabilities relating to certain indirect subsidiaries that file separate state income tax returns at
December 31, 2017
and
2016
, respectively.
Valuation Allowance
In assessing the realizability of deferred tax assets, management considers whether it is more likely than not that some portion or all of the deferred tax assets will be realized. In evaluating the need for a valuation allowance, management takes into account various factors, including the expected level of future taxable income, available tax planning strategies and reversals of existing
F- 35
CHARTER COMMUNICATIONS, INC. AND SUBSIDIARIES
NOTES TO CONSOLIDATED FINANCIAL STATEMENTS
DECEMBER 31, 2017, 2016 AND 2015
(dollars in millions, except share or per share data or where indicated)
taxable temporary differences. Due to Legacy Charter’s history of losses, Legacy Charter was historically unable to assume future taxable income in its analysis and accordingly valuation allowances were established against the deferred tax assets, net of deferred tax liabilities, from definite-lived assets for book accounting purposes. However, as a result of the TWC Transaction, deferred tax liabilities resulting from the book fair value adjustment increased significantly and future taxable income that will result from the reversal of existing temporary differences for which deferred tax liabilities are recognized, is sufficient to conclude it is more likely than not that the Company will realize substantially all of its deferred tax assets. As a result, Charter reversed approximately
$3.3 billion
of its valuation allowance and recognized a corresponding income tax benefit in the consolidated statements of operations for the year ended December 31, 2016. As of
December 31, 2017
and 2016, approximately
$87 million
and
$145 million
, respectively, of the valuation allowance is associated with federal tax net operating loss carryforwards acquired in the TWC Transaction and approximately
$50 million
and
$55 million
, respectively, of the valuation allowance is associated with state tax loss carryforwards and tax credits.
Net Operating Loss Carryforwards
As of
December 31, 2017
, Charter had approximately
$10.9 billion
of federal tax net operating loss carryforwards resulting in a gross deferred tax asset of approximately
$2.3 billion
. Federal tax net operating loss carryforwards expire in the years 2018 through 2035. These losses resulted from the operations of Charter Holdco and its subsidiaries. In addition, as of
December 31, 2017
, Charter had state tax net operating loss carryforwards, resulting in a gross deferred tax asset (net of federal tax benefit) of approximately
$359 million
. State tax net operating loss carryforwards generally expire in the years 2018 through 2037.
Upon closing of the TWC Transaction, Charter experienced a third “ownership change” as defined in Section 382 of the Internal Revenue Code; resulting in a third set of limitations on Charter’s use of its existing federal and state net operating losses, capital losses, and tax credit carryforwards. Both the first ownership change limitations that applied as a result of Legacy Charter’s emergence from bankruptcy in 2009 and second ownership change limitations that applied as a result of Liberty Media Corporation’s purchase in 2013 of a
27%
beneficial interest in Legacy Charter will also continue to apply. As of
December 31, 2017
, all of Charter's federal tax loss carryforwards are subject to Section 382 and other restrictions. Pursuant to these restrictions, Charter estimates that approximately
$8.7 billion
in 2018,
$654 million
in 2019 and an additional
$226 million
annually over each of the next five years of federal tax loss carryforwards should become unrestricted and available for Charter’s use. An additional
$415 million
is currently subject to a valuation allowance. Since the limitation amounts accumulate for future use to the extent they are not utilized in any given year, Charter believes its loss carryforwards should become fully available to offset future taxable income. Charter’s state loss carryforwards are subject to similar, but varying, limitations on their future use. If Charter was to experience another “ownership change” in the future, its ability to use its loss carryforwards could be subject to further limitations.
Tax Receivable Agreement
Under the LLC Agreement, A/N has rights to: (1) convert at any time some or all of its preferred units in Charter Holdings for common units in Charter Holdings, and (2) exchange at any time some or all of its common units in Charter Holdings for Charter’s Class A common stock or cash, at Charter’s option. Pursuant to a Tax Receivable Agreement ("TRA") between Charter and A/N, Charter must pay to A/N
50%
of the tax benefit when realized by Charter from the step-up in tax basis resulting from any future exchange or sale of the preferred and common units. Charter did not record a liability for this obligation as of the acquisition date since the tax benefit is dependent on uncertain future events that are outside of Charter’s control, such as the timing of a conversion or exchange. A future exchange or sale is not based on a fixed and determinable date and the exchange or sale is not certain to occur. If all of A/N's partnership units were to be exchanged or sold in the future, the undiscounted value of the obligation is currently estimated to be in the range of
zero
to
$3 billion
depending on measurement of the tax step-up in the future and Charter’s ability to realize the tax benefit in the periods following the exchange or sale. Factors impacting these calculations include, but are not limited to, the fair value of the equity at the time of the exchange and the effective tax rates when the benefits are realized.
In connection with the Letter Agreement between Charter and A/N (see Note 19) whereby
1.3 million
and
1.9 million
Charter Holdings common units held by A/N during the year ended
December 31, 2017
and
2016
, respectively, were exchanged for shares of Charter Class A common stock for an aggregate purchase price of
$400 million
and
$537 million
, respectively, an immediate step-up of
$487 million
and
$580 million
, respectively, in the tax basis of the assets of Charter Holdings occurred. As it relates to the exchange and tax step-up, a net deferred tax asset of approximately
$85 million
and
$82 million
, respectively, was recorded and a resulting TRA liability owed to A/N of
$118 million
and
$137 million
, respectively, which, as a transaction with a shareholder, was recorded directly to additional paid in capital, net of tax during the year ended December 31, 2017 and 2016. The TRA liability is recorded on an iterative, undiscounted basis. The TRA liability was remeasured as a result of the enactment of Tax Reform
F- 36
CHARTER COMMUNICATIONS, INC. AND SUBSIDIARIES
NOTES TO CONSOLIDATED FINANCIAL STATEMENTS
DECEMBER 31, 2017, 2016 AND 2015
(dollars in millions, except share or per share data or where indicated)
resulting in a
$101 million
benefit recorded to other operating expenses, net. See Note 15. Following such remeasurement, the TRA liability of
$154 million
is reflected in other long-term liabilities on the consolidated balance sheets as of
December 31, 2017
and
2016
.
Uncertain Tax Positions
In connection with the TWC Transaction, the Company assumed
$181 million
of gross unrecognized tax benefits, exclusive of interest and penalties, which are recorded within other long-term liabilities. The net amount of the unrecognized tax benefits recorded as of December 31, 2017 that could impact the effective tax rate is
$171 million
. The Company has determined that it is reasonably possible that its existing reserve for uncertain tax positions as of
December 31, 2017
could decrease by approximately
$58 million
during the year ended December 31, 2018 related to various ongoing audits, settlement discussions and expiration of statute of limitations with various state and local agencies; however, various events could cause the Company’s current expectations to change in the future. These uncertain tax positions, if ever recognized in the financial statements, would be recorded in the consolidated statements of operations as part of the income tax provision. A reconciliation of the beginning and ending amount of unrecognized tax benefits, exclusive of interest and penalties, included in other long-term liabilities on the accompanying consolidated balance sheets of the Company is as follows:
|
BALANCE, December 31, 2015
|
$
|
5
|
|
|
Additions on prior year tax positions
|
1
|
|
|
|
Additions on current year tax positions
|
7
|
|
|
|
Additions on tax positions assumed in the TWC Transaction
|
181
|
|
|
|
Reductions on settlements and expirations with taxing authorities
|
(22
|
)
|
|
|
BALANCE, December 31, 2016
|
$
|
172
|
|
|
Additions on prior year tax positions
|
1
|
|
|
|
Additions on current year tax positions
|
12
|
|
|
|
Reductions on settlements and expirations with taxing authorities
|
(21
|
)
|
|
|
BALANCE, December 31, 2017
|
$
|
164
|
|
The Company recognizes interest and penalties accrued on uncertain income tax positions as part of the income tax provision. Interest and penalties included in other long-term liabilities on the accompanying consolidated balance sheets of the Company were
$39 million
and
$34 million
as of
December 31, 2017
and 2016, respectively.
No tax years for Charter, Charter Holdings, or Charter Communications Holding Company, LLC for income tax purposes, are currently under examination by the Internal Revenue Service ("IRS"). Charter and Charter Holdings' 2016 and 2017 tax years remain open for examination and assessment. Legacy Charter’s tax years ending 2014 through the short period return dated May 17, 2016 remain subject to examination and assessment. Years prior to 2014 remain open solely for purposes of examination of Legacy Charter’s loss and credit carryforwards. The IRS is currently examining Legacy TWC’s income tax returns for 2011 through 2014. Legacy TWC’s tax year 2015 remains subject to examination and assessment. Prior to Legacy TWC’s separation from Time Warner Inc. (“Time Warner”) in March 2009 (the “Separation”), Legacy TWC was included in the consolidated U.S. federal and certain state income tax returns of Time Warner. The IRS is currently examining Time Warner’s 2008 through 2010 income tax returns. Time Warner’s income tax returns for 2005 to 2007, which are periods prior to the Separation, were settled with the exception of an immaterial item that has been referred to the IRS Appeals Division. The Company does not anticipate that these examinations will have a material impact on the Company’s consolidated financial position or results of operations. In addition, the Company is also subject to ongoing examinations of the Company’s tax returns by state and local tax authorities for various periods. Activity related to these state and local examinations did not have a material impact on the Company’s consolidated financial position or results of operations during the
year
ended
December 31, 2017
, nor does the Company anticipate a material impact in the future.
18. Earnings (Loss) Per Share
Basic earnings (loss) per common share is computed by dividing net income (loss) attributable to Charter shareholders by the
F- 37
CHARTER COMMUNICATIONS, INC. AND SUBSIDIARIES
NOTES TO CONSOLIDATED FINANCIAL STATEMENTS
DECEMBER 31, 2017, 2016 AND 2015
(dollars in millions, except share or per share data or where indicated)
weighted average number of shares of common stock outstanding during the period. Diluted earnings per common share considers the impact of potentially dilutive securities using the treasury stock and if-converted methods and is based on the weighted average number of shares used for the basic earnings per share calculation, adjusted for the dilutive effect of stock options, restricted stock, restricted stock units, equity awards with market conditions and Charter Holdings convertible preferred units and common units. Basic loss per common share equaled diluted loss per common share for the year ended December 31, 2015 because the Company incurred a net loss during those periods. The following is the computation of diluted earnings per common share for the years presented.
|
Year Ended December 31,
|
|||||||
|
2017
|
2016
|
||||||
|
Numerator:
|
|||||||
|
Net income attributable to Charter shareholders
|
$
|
9,895
|
|
$
|
3,522
|
|
|
|
Effect of dilutive securities:
|
|||||||
|
Charter Holdings common units
|
69
|
|
129
|
|
|||
|
Charter Holdings convertible preferred units
|
150
|
|
93
|
|
|||
|
Net income attributable to Charter shareholders after assumed conversions
|
$
|
10,114
|
|
$
|
3,744
|
|
|
|
Denominator:
|
|||||||
|
Weighted average common shares outstanding, basic
|
256,720,715
|
|
206,539,100
|
|
|||
|
Effect of dilutive securities:
|
|||||||
|
Assumed exercise or issuance of shares relating to stock plans
|
4,012,145
|
|
3,088,871
|
|
|||
|
Weighted average Charter Holdings common units
|
26,637,596
|
|
19,333,227
|
|
|||
|
Weighted average Charter Holdings convertible preferred units
|
9,333,500
|
|
5,830,241
|
|
|||
|
Weighted average common shares outstanding, diluted
|
296,703,956
|
|
234,791,439
|
|
|||
|
Basic earnings per common share attributable to Charter shareholders
|
$
|
38.55
|
|
$
|
17.05
|
|
|
|
Diluted earnings per common share attributable to Charter shareholders
|
$
|
34.09
|
|
$
|
15.94
|
|
|
19. Related Party Transactions
The following sets forth certain transactions in which the Company and the directors, executive officers, and affiliates of the Company are involved or, in the case of the management arrangements, subsidiaries that are debt issuers that pay certain of their parent companies for services.
Charter is a party to management arrangements with Spectrum Management Holding Company, LLC ("Spectrum Management") and certain of their subsidiaries. Under these agreements, Charter, Spectrum Management and Charter Holdco provide management services for the cable systems owned or operated by their subsidiaries. Costs associated with providing these services are charged directly to the Company’s operating subsidiaries. All other costs incurred on behalf of Charter’s operating subsidiaries are considered a part of the management fee. These costs are recorded as a component of operating costs and expenses, in the accompanying consolidated financial statements. The management fee charged to the Company’s operating subsidiaries approximated the expenses incurred by Spectrum Management, Charter Holdco and Charter on behalf of the Company’s operating subsidiaries in
2017
,
2016
and
2015
.
Liberty Broadband and A/N
On May 23, 2015, in connection with the execution of the Merger Agreement and the amendment of the Contribution Agreement, Charter entered into the Amended and Restated Stockholders Agreement with Liberty Broadband, A/N and Legacy Charter (the “Stockholders Agreement”) and the LLC Agreement with Liberty Broadband and A/N. As of the closing of the Merger Agreement and the Contribution Agreement on May 18, 2016, the Stockholders Agreement replaced Legacy Charter’s existing stockholders agreement with Liberty Broadband, dated September 29, 2014, and superseded the amended and restated stockholders agreement among Legacy Charter, Charter, Liberty Broadband and A/N, dated March 31, 2015.
F- 38
CHARTER COMMUNICATIONS, INC. AND SUBSIDIARIES
NOTES TO CONSOLIDATED FINANCIAL STATEMENTS
DECEMBER 31, 2017, 2016 AND 2015
(dollars in millions, except share or per share data or where indicated)
Under the terms of the Stockholders Agreement, the number of Charter’s directors is fixed at 13, and includes its CEO. Upon the closing of the Bright House Transaction, two designees selected by A/N became members of the board of directors of Charter and three designees selected by Liberty Broadband continued as members of the board of directors of Charter. The remaining eight directors are not affiliated with either A/N or Liberty Broadband. Each of A/N and Liberty Broadband is entitled to nominate at least one director to each of the committees of Charter’s board of directors, subject to applicable stock exchange listing rules and certain specified voting or equity ownership thresholds for each of A/N and Liberty Broadband, and provided that the Nominating and Corporate Governance Committee and the Compensation and Benefit Committee each have at least a majority of directors independent from A/N, Liberty Broadband and the Company (referred to as the “unaffiliated directors”). Each of the Nominating and Corporate Governance Committee and the Compensation and Benefits Committee is currently comprised of three unaffiliated directors and one designee of each of A/N and Liberty Broadband. A/N and Liberty Broadband also have certain other committee designation and other governance rights. Upon the closing of the Bright House Transaction, Mr. Thomas Rutledge, the Company’s CEO, became the chairman of the board of Charter.
In December 2016, Charter and A/N entered into a letter agreement (the "Letter Agreement") that requires A/N to sell to Charter or to Charter Holdings, on a monthly basis, a number of shares of Charter Class A common stock or Charter Holdings common units that represents a pro rata participation by A/N and its affiliates in any repurchases of shares of Charter Class A common stock from persons other than A/N effected by Charter during the immediately preceding calendar month, at a purchase price equal to the average price paid by Charter for the shares repurchased from persons other than A/N during such immediately preceding calendar month. A/N and Charter both have the right to terminate or suspend the pro rata repurchase arrangement on a prospective basis once Charter or Charter Holdings have repurchased shares of Class A common stock or Charter Holdings common units from A/N and its affiliates for an aggregate purchase price of
$537 million
, which threshold has been met. On December 21, 2017, Charter and A/N entered into an amendment to the Letter Agreement resetting the aggregate purchase price to
$400 million
. See Note 11. Pursuant to the TRA between Charter and A/N, Charter must pay to A/N
50%
of the tax benefit when realized by Charter from the step-up in tax basis resulting from any future exchange or sale of the preferred and common units. See Note 17 for more information.
The Company is aware that Dr. John Malone may be deemed to have a
39.2%
voting interest in Liberty Interactive and is Chairman of the board of directors, an executive officer position, of Liberty Interactive. Liberty Interactive wholly owns HSN, Inc. (“HSN”) and QVC, Inc. (“QVC”). The Company has programming relationships with HSN and QVC which pre-date the transaction with Liberty Media Corporation. For the years ended
December 31, 2017
,
2016
and
2015
, the Company recorded revenue in aggregate of approximately
$77 million
,
$53 million
and
$17 million
, respectively, from HSN and QVC as part of channel carriage fees and revenue sharing arrangements for home shopping sales made to customers in the Company’s footprint.
Dr. Malone and Mr. Steven Miron, each a member of Charter’s board of directors, also serve on the board of directors of Discovery Communications, Inc., (“Discovery”). The Company is aware that Dr. Malone owns
93.6%
of the series B common stock of Discovery,
6%
of the series C common stock of Discovery and has a
28.1%
voting interest in Discovery for the election of directors. The Company is aware that Advance/Newhouse Programming Partnership (“A/N PP”), an affiliate of A/N and in which Mr. Miron is the CEO, owns
100%
of the Series A preferred stock of Discovery and
100%
of the Series C preferred stock of Discovery and has a
31.1%
voting interest for the election of directors. A/N PP has the right to appoint three directors out of a total of eleven directors to Discovery’s board to be elected by the holders of Discovery’s Series A preferred stock. In addition, Dr. Malone is a member of the board of directors of Lions Gate Entertainment Corp. ("Lions Gate," parent company of Starz, Inc.) and owns approximately
5.5%
in the aggregate of the common stock of Lions Gate and has
7.9%
of the voting power, pursuant to his ownership of Lions Gate Class A voting shares. The Company purchases programming from both Discovery and Lions Gate pursuant to agreements entered into prior to Dr. Malone and Mr. Miron joining Charter’s board of directors. Based on publicly available information, the Company does not believe that either Discovery or Lions Gate would currently be considered related parties. The amounts paid in the aggregate to Discovery and Lions Gate represent less than
3%
of total operating costs and expenses for the years ended
December 31, 2017
,
2016
and
2015
.
Equity Investments
The Company has agreements with certain equity-method investees (see Note 7) pursuant to which the Company has made or received related party transaction payments. The Company recorded payments to equity-method investees totaling
$317 million
,
$171 million
and
$28 million
during the years ended
December 31, 2017
,
2016
and
2015
, respectively. The Company recorded advertising revenues from transactions with equity-method investees totaling
$9 million
and
$7 million
during the years ended
F- 39
CHARTER COMMUNICATIONS, INC. AND SUBSIDIARIES
NOTES TO CONSOLIDATED FINANCIAL STATEMENTS
DECEMBER 31, 2017, 2016 AND 2015
(dollars in millions, except share or per share data or where indicated)
December 31, 2017
and
2016
, respectively. There were no advertising revenues received in 2015.
20. Commitments and Contingencies
Commitments
The following table summarizes the Company’s payment obligations as of
December 31, 2017
for its contractual obligations.
|
Total
|
2018
|
2019
|
2020
|
2021
|
2022
|
Thereafter
|
|||||||||||||||||||||
|
Capital and Operating Lease Obligations
(a)
|
$
|
1,512
|
|
$
|
286
|
|
$
|
235
|
|
$
|
199
|
|
$
|
165
|
|
$
|
132
|
|
$
|
495
|
|
||||||
|
Programming Minimum Commitments
(b)
|
164
|
|
103
|
|
39
|
|
22
|
|
—
|
|
—
|
|
—
|
|
|||||||||||||
|
Other
(c)
|
13,626
|
|
1,917
|
|
1,031
|
|
839
|
|
653
|
|
499
|
|
8,687
|
|
|||||||||||||
|
$
|
15,302
|
|
$
|
2,306
|
|
$
|
1,305
|
|
$
|
1,060
|
|
$
|
818
|
|
$
|
631
|
|
$
|
9,182
|
|
|||||||
|
(a)
|
The Company leases certain facilities and equipment under non-cancelable capital and operating leases. Capital lease obligations represented
$123 million
of total capital and operating lease obligations as of
December 31, 2017
. Leases and rental costs charged to expense for the years ended
December 31, 2017
,
2016
and
2015
were
$321 million
,
$215 million
,
$49 million
, respectively.
|
|
(b)
|
The Company pays programming fees under multi-year contracts ranging from
three
to
ten
years, typically based on a flat fee per customer, which may be fixed for the term, or may in some cases escalate over the term. Programming costs included in the statement of operations were
$10.6 billion
,
$7.0 billion
and
$2.7 billion
for the years ended
December 31, 2017
,
2016
and
2015
respectively. Certain of the Company’s programming agreements are based on a flat fee per month or have guaranteed minimum payments. The table sets forth the aggregate guaranteed minimum commitments under the Company’s programming contracts.
|
|
(c)
|
“Other” represents other guaranteed minimum commitments, including rights negotiated directly with content owners for distribution on company-owned channels or networks, commitments related to our role as an advertising and distribution sales agent for third party-owned channels or networks, commitments to our customer premise equipment vendors and contractual obligations related to third-party network augmentation.
|
The following items are not included in the contractual obligation table due to various factors discussed below. However, the Company incurs these costs as part of its operations:
|
•
|
The Company rents utility poles used in its operations. Generally, pole rentals are cancelable on short notice, but the Company anticipates that such rentals will recur. Rent expense incurred for pole rental attachments for the years ended
December 31, 2017
,
2016
and
2015
was
$167 million
,
$115 million
and
$53 million
, respectively.
|
|
•
|
The Company pays franchise fees under multi-year franchise agreements based on a percentage of revenues generated from video service per year. The Company also pays other franchise related costs, such as public education grants, under multi-year agreements. Franchise fees and other franchise-related costs included in the accompanying statement of operations were
$705 million
,
$534 million
and
$212 million
for the years ended
December 31, 2017
,
2016
and
2015
respectively.
|
|
•
|
The Company has
$291 million
in letters of credit, of which
$137 million
is secured under the Charter Operating credit facility, primarily to its various casualty carriers as collateral for reimbursement of workers' compensation, auto liability and general liability claims.
|
|
•
|
Minimum pension funding requirements have not been presented in the table above as such amounts have not been determined beyond
2017
. The Company made no cash contributions to the qualified pension plans in
2017
; however, the Company is permitted to make discretionary cash contributions to the qualified pension plans in
2018
. For the nonqualified pension plan, the Company contributed
$18 million
during
2017
and will continue to make contributions in
2018
to the extent benefits are paid.
|
Legal Proceedings
In August 2015, a purported stockholder of Charter, Matthew Sciabacucchi, filed a lawsuit in the Delaware Court of Chancery, on behalf of a putative class of Charter stockholders, challenging the transactions between Charter, TWC, A/N, and Liberty Broadband announced by Charter on May 26, 2015. The lawsuit names as defendants Liberty Broadband, Legacy Charter, the board of directors of Charter, and Charter. Plaintiff alleges that the Liberty Transactions improperly benefit Liberty Broadband at
F- 40
CHARTER COMMUNICATIONS, INC. AND SUBSIDIARIES
NOTES TO CONSOLIDATED FINANCIAL STATEMENTS
DECEMBER 31, 2017, 2016 AND 2015
(dollars in millions, except share or per share data or where indicated)
the expense of other Charter shareholders. Charter filed a motion to dismiss this litigation. The Court of Chancery has not yet made a final ruling on the motion to dismiss. Charter denies any liability, believes that it has substantial defenses, and intends to vigorously defend this suit. Although Charter is unable to predict the outcome of this lawsuit, it does not expect the outcome will have a material effect on its operations, financial condition or cash flows.
The California Attorney General and the Alameda County, California District Attorney are investigating whether certain of Legacy Charter’s waste disposal policies, procedures and practices are in violation of the California Business and Professions Code and the California Health and Safety Code. That investigation was commenced in January 2014. A similar investigation involving Legacy TWC was initiated in February 2012. Charter is cooperating with these investigations. While the Company is unable to predict the outcome of these investigations, it does not expect that the outcome will have a material effect on its operations, financial condition, or cash flows.
On December 19, 2011, Sprint Communications Company L.P. (“Sprint”) filed a complaint in the U.S. District Court for the District of Kansas alleging that Legacy TWC infringed certain U.S. patents purportedly relating to Voice over Internet Protocol (“VoIP”) services. A trial began on February 13, 2017. On March 3, 2017 the jury returned a verdict of
$140 million
against Legacy TWC and further concluded that Legacy TWC had willfully infringed Sprint’s patents. The court subsequently declined to enhance the damage award as a result of the purported willful infringement and awarded Sprint an additional
$6 million
, representing pre-judgment interest on the damages award. The Company has appealed the case to the United States Court of Appeals for the Federal Circuit. In addition to its appeal, the Company continues to pursue indemnity from one of its vendors. The impact of the verdict was reflected in the measurement period adjustments to net current liabilities as described in Note 3. The Company does not expect that the outcome of this litigation will have a material adverse effect on its operations or financial condition. The ultimate outcome of this litigation or the pursuit of indemnity against the Company’s vendor cannot be predicted.
Subsequently, on December 2, 2017, Sprint filed suit against Charter in the United States District Court for the District of Delaware. The new suit alleges infringement of 15 patents related to the Company's provision of voice services (ten of which were already asserted against Legacy TWC in the matter described above). Charter is investigating the allegations and will vigorously defend this case. While the Company is unable to predict the outcome of its investigations, it does not expect that this litigation will have a material effect on its operations, financial condition, or cash flows.
On October 23, 2015, the New York Office of the Attorney General (the “NY AG”) began an investigation of Legacy TWC's advertised Internet speeds and other Internet product advertising. On February 1, 2017, the NY AG filed suit in the Supreme Court for the State of New York alleging that Legacy TWC's advertising of Internet speeds was false and misleading. The suit seeks restitution and injunctive relief. The Company has moved to dismiss the NY AG’s complaint and the Company intends to defend itself vigorously. Although no assurances can be made that such defenses would ultimately be successful, the Company does not expect that the outcome of this litigation will have a material adverse effect on its operations, financial condition or cash flows.
The Company is a defendant or co-defendant in several additional lawsuits involving alleged infringement of various patents relating to various aspects of its businesses. Other industry participants are also defendants in certain of these cases. In the event that a court ultimately determines that the Company infringes on any intellectual property rights, the Company may be subject to substantial damages and/or an injunction that could require the Company or its vendors to modify certain products and services the Company offers to its subscribers, as well as negotiate royalty or license agreements with respect to the patents at issue. While the Company believes the lawsuits are without merit and intends to defend the actions vigorously, no assurance can be given that any adverse outcome would not be material to the Company’s consolidated financial condition, results of operations, or liquidity. The Company cannot predict the outcome of any such claims nor can it reasonably estimate a range of possible loss.
The Company is party to lawsuits, claims and regulatory inquiries that arise in the ordinary course of conducting its business. The ultimate outcome of these other legal matters pending against the Company cannot be predicted, and although such lawsuits and claims are not expected individually to have a material adverse effect on the Company’s consolidated financial condition, results of operations or liquidity, such lawsuits could have, in the aggregate, a material adverse effect on the Company’s consolidated financial condition, results of operations or liquidity. Whether or not the Company ultimately prevails in any particular lawsuit or claim, litigation can be time consuming and costly and injure the Company’s reputation.
F- 41
CHARTER COMMUNICATIONS, INC. AND SUBSIDIARIES
NOTES TO CONSOLIDATED FINANCIAL STATEMENTS
DECEMBER 31, 2017, 2016 AND 2015
(dollars in millions, except share or per share data or where indicated)
21. Employee Benefit Plans
Pension Plans
The Company sponsors two qualified defined benefit pension plans, the TWC Pension Plan and the TWC Union Pension Plan, that provide pension benefits to a majority of Legacy TWC employees. The Company also provides a nonqualified defined benefit pension plan for certain employees under the TWC Excess Pension Plan.
Changes in the projected benefit obligation, fair value of plan assets and funded status of the pension plans from January 1 through December 31 are presented below:
|
2017
|
2016
|
||||||
|
Projected benefit obligation at beginning of year
|
$
|
3,260
|
|
$
|
—
|
|
|
|
Benefit obligation assumed in the TWC Transaction
|
—
|
|
4,009
|
|
|||
|
Service cost
|
—
|
|
86
|
|
|||
|
Interest cost
|
133
|
|
87
|
|
|||
|
Curtailment amendment
|
—
|
|
(675
|
)
|
|||
|
Actuarial (gain) loss
|
406
|
|
(149
|
)
|
|||
|
Settlement
|
(185
|
)
|
—
|
|
|||
|
Benefits paid
|
(45
|
)
|
(98
|
)
|
|||
|
Projected benefit obligation at end of year
|
$
|
3,569
|
|
$
|
3,260
|
|
|
|
Accumulated benefit obligation at end of year
|
$
|
3,569
|
|
$
|
3,260
|
|
|
|
Fair value of plan assets at beginning of year
|
$
|
2,946
|
|
$
|
—
|
|
|
|
Fair value of plan assets acquired in the TWC Transaction
|
—
|
|
2,877
|
|
|||
|
Actual return on plan assets
|
539
|
|
162
|
|
|||
|
Employer contributions
|
18
|
|
5
|
|
|||
|
Settlement
|
(185
|
)
|
—
|
|
|||
|
Benefits paid
|
(45
|
)
|
(98
|
)
|
|||
|
Fair value of plan assets at end of year
|
$
|
3,273
|
|
$
|
2,946
|
|
|
|
Funded status
|
$
|
(296
|
)
|
$
|
(314
|
)
|
|
The projected benefit obligation, accumulated benefit obligation and fair value of plan assets for the qualified pension plans and the nonqualified pension plan as of
December 31, 2017
and
2016
consisted of the following:
|
Qualified Pension Plans
|
Nonqualified Pension Plan
|
||||||||||||||
|
December 31,
|
December 31,
|
||||||||||||||
|
2017
|
2016
|
2017
|
2016
|
||||||||||||
|
Projected benefit obligation
|
$
|
3,528
|
|
$
|
3,204
|
|
$
|
41
|
|
$
|
56
|
|
|||
|
Accumulated benefit obligation
|
$
|
3,528
|
|
$
|
3,204
|
|
$
|
41
|
|
$
|
56
|
|
|||
|
Fair value of plan assets
|
$
|
3,273
|
|
$
|
2,946
|
|
$
|
—
|
|
$
|
—
|
|
|||
F- 42
CHARTER COMMUNICATIONS, INC. AND SUBSIDIARIES
NOTES TO CONSOLIDATED FINANCIAL STATEMENTS
DECEMBER 31, 2017, 2016 AND 2015
(dollars in millions, except share or per share data or where indicated)
Pretax amounts recognized in the consolidated balance sheet as of
December 31, 2017
and
2016
consisted of the following:
|
December 31,
|
|||||||
|
2017
|
2016
|
||||||
|
Noncurrent asset
|
$
|
1
|
|
$
|
1
|
|
|
|
Current liability
|
(5
|
)
|
(6
|
)
|
|||
|
Long-term liability
|
(292
|
)
|
(309
|
)
|
|||
|
Net amounts recognized in consolidated balance sheet
|
$
|
(296
|
)
|
$
|
(314
|
)
|
|
The components of net periodic benefit costs for the years ended
December 31, 2017
and
2016
consisted of the following:
|
Year Ended December 31,
|
|||||||
|
2017
|
2016
|
||||||
|
Service cost
|
$
|
—
|
|
$
|
86
|
|
|
|
Interest cost
|
133
|
|
87
|
|
|||
|
Expected return on plan assets
|
(189
|
)
|
(116
|
)
|
|||
|
Pension curtailment gain
|
—
|
|
(675
|
)
|
|||
|
Remeasurement (gain) loss
|
55
|
|
(195
|
)
|
|||
|
Net periodic pension (benefit) cost
|
$
|
(1
|
)
|
$
|
(813
|
)
|
|
During the year ended December 31, 2017, lump-sum distributions to qualified and nonqualified pension plan participants exceeded the estimated annual interest cost of the plans resulting in a settlement for accounting purposes. As a result, the pension liability and pension asset values were reassessed as of September 30, 2017 utilizing remeasurement date assumptions in accordance with the Company's mark-to-market pension accounting policy to record gains and losses in the period in which a remeasurement event occurs. The
$55 million
remeasurement loss recorded during the year ended December 31, 2017 was primarily driven by the adoption of the revised lump sum conversion mortality tables published by the IRS effective January 1, 2018 and the effects of a decrease of the discount rate from
4.20%
at December 31, 2016 to
3.68%
at December 31, 2017, partially offset by an actuarial gain on pension asset actual returns. Approximately
$30 million
of the remeasurement loss was recorded for the interim remeasurement event as of September 30, 2017 and
$25 million
was recorded for the annual remeasurement as of December 31, 2017.
The
$195 million
remeasurement gain recorded during the year ended December 31, 2016 was primarily driven by the effects of an increase of the discount rate from
3.99%
at the closing date of the TWC Transaction to
4.20%
at December 31, 2016 and a gain to record pension assets at December 31, 2016 fair values.
The discount rates used to determine benefit obligations as of
December 31, 2017
and
2016
were
3.68%
and
4.20%
, respectively. The Company utilized the RP 2015/MP2015 mortality tables published by the Society of Actuaries to measure the benefit obligations as of
December 31, 2017
and
2016
.
Weighted average assumptions used to determine net periodic benefit costs for the years ended
December 31, 2017
and
2016
consisted of the following:
|
Year ended December 31,
|
|||||
|
2017
|
2016
|
||||
|
Expected long-term rate of return on plan assets
|
6.50
|
%
|
6.50
|
%
|
|
|
Discount rate
(a)
|
3.88
|
%
|
3.72
|
%
|
|
|
Rate of compensation increase
(b)
|
—
|
%
|
—
|
%
|
|
F- 43
CHARTER COMMUNICATIONS, INC. AND SUBSIDIARIES
NOTES TO CONSOLIDATED FINANCIAL STATEMENTS
DECEMBER 31, 2017, 2016 AND 2015
(dollars in millions, except share or per share data or where indicated)
|
(a)
|
The discount rate used to determine net periodic pension benefit was
4.20%
from January 1, 2017 through remeasurement date (September 30, 2017), and was
3.88%
from remeasurement date through December 31, 2017. The discount rate used to determine net periodic pension benefit was
3.99%
from the closing date of the TWC Transaction through remeasurement date (June 30, 2016), and was
3.72%
from remeasurement date through December 31, 2016.
|
|
(b)
|
The rate of compensation increase used to determine net periodic pension benefit was
4.25%
from the closing date of the TWC Transaction through remeasurement date (June 30, 2016), and
0%
thereafter. See “Pension Plan Curtailment Amendment” below for further discussion.
|
In developing the expected long-term rate of return on plan assets, the Company considered the pension portfolio’s composition, past average rate of earnings and the Company’s future asset allocation targets. The weighted average expected long-term rate of return on plan assets and discount rate used to determine net periodic pension benefit for the year ended December 31, 2018 are expected to be
6.50%
and
3.68%
, respectively. The Company determined the discount rates used to determine benefit obligations and net periodic pension benefit based on the yield of a large population of high quality corporate bonds with cash flows sufficient in timing and amount to settle projected future defined benefit payments.
Pension Plan Curtailment Amendment
Following the closing of the TWC Transaction, Charter amended the pension plans to freeze future benefit accruals to current active plan participants as of August 31, 2016. Effective September 1, 2016, no future compensation increases or future service will be credited to participants of the pension plans and new hires are not eligible to participate in the plans. Upon announcement and approval of the plan amendment, the assumptions underlying the pension liability and pension asset values were reassessed utilizing remeasurement date assumptions in accordance with Charter’s mark-to-market pension accounting policy to record gains and losses in the period in which a remeasurement event occurs. The
$675 million
curtailment gain recorded during the year ended December 31, 2016 was primarily driven by the reduction of the compensation rate assumption to
0%
in accordance with the terms of the plan amendment, reflecting the pension liability at its accumulated benefit obligation instead of its projected benefit obligation at the remeasurement date.
Pension Plan Assets
The assets of the qualified pension plans are held in a master trust in which the qualified pension plans are the only participating plans (the “Master Trust”). The investment policy for the qualified pension plans is to manage the assets of the Master Trust with the objective to provide for pension liabilities to be met, maintaining retirement income security for the participants of the plans and their beneficiaries. The investment portfolio is a mix of pooled funds invested in fixed income and equity securities with the objective of matching plan liability performance, diversifying risk and achieving a target investment return. The pension plan’s Investment Committee establishes risk mitigation policies and regularly monitors investment performance, investment allocation policies, and the execution of these strategies. The Investment Committee engages a third-party investment firm with responsibility of executing the directives of the Investment Committee, monitoring the performance of individual investment managers of the Master Trust, and making adjustments and changes within defined parameters when necessary. On a periodic basis, the Investment Committee conducts a broad strategic review of its portfolio construction and investment allocation policies. Neither the Company, the Investment Committee, nor the third-party investment firm manages any assets internally or directly utilizes derivative instruments or hedging; however, the investment mandate of some investment managers allows the use of derivatives as components of their standard portfolio management strategies. Pension assets are managed in a balanced portfolio comprised of two major components: a return-seeking portion and a liability-matching portion. The expected role of return-seeking investments is to achieve a reasonable long-term growth of pension assets with a prudent level of risk using asset diversity in order to balance return and volatility, while the role of liability-matching investments is to provide a partial economic hedge against liability performance associated with changes in interest rates.
F- 44
CHARTER COMMUNICATIONS, INC. AND SUBSIDIARIES
NOTES TO CONSOLIDATED FINANCIAL STATEMENTS
DECEMBER 31, 2017, 2016 AND 2015
(dollars in millions, except share or per share data or where indicated)
The Company adopted an investment strategy referred to as a de-risking glide path to increase the fixed income allocation as the funded status of the qualified pension plans improves. As the qualified pension plans reach set funded status milestones, the assets will be rebalanced to shift more assets from equity to fixed income. Based on the progress with this strategy, the target investment allocation for pension fund assets is permitted to vary within specified ranges subject to Investment Committee approval for return-seeking securities and liability-matching securities. The target and actual investment allocation of the qualified pension plans by asset category as of
December 31, 2017
and
2016
consisted of the following:
|
Actual Allocation
|
||||||||
|
Target
|
December 31,
|
|||||||
|
Allocation
|
2017
|
2016
|
||||||
|
Return-seeking securities
|
75.0
|
%
|
73.1
|
%
|
64.4
|
%
|
||
|
Liability-matching securities
|
25.0
|
%
|
26.7
|
%
|
35.4
|
%
|
||
|
Other investments
|
—
|
%
|
0.2
|
%
|
0.2
|
%
|
||
The following table sets forth the investment assets of the qualified pension plans, which exclude accrued investment income and investments with a fair value measured at net asset value per share as a practical expedient, by level within the fair value hierarchy as of
December 31, 2017
:
|
December 31, 2017
|
|||||||||||||||
|
Fair Value
|
Level 1
|
Level 2
|
Level 3
|
||||||||||||
|
Cash
|
$
|
3
|
|
$
|
3
|
|
$
|
—
|
|
$
|
—
|
|
|||
|
Commingled equity funds
(a)
|
2,368
|
|
—
|
|
2,368
|
|
—
|
|
|||||||
|
Corporate debt securities
(b)
|
1
|
|
—
|
|
1
|
|
—
|
|
|||||||
|
Commingled bond funds
(a)
|
795
|
|
—
|
|
795
|
|
—
|
|
|||||||
|
Collective trust funds
(c)
|
68
|
|
—
|
|
68
|
|
—
|
|
|||||||
|
Total investment assets
|
3,235
|
|
$
|
3
|
|
$
|
3,232
|
|
$
|
—
|
|
||||
|
Accrued investment income and other receivables
(d)
|
34
|
|
|||||||||||||
|
Investments measured at net asset value
(e)
|
4
|
|
|||||||||||||
|
Fair value of plan assets
|
$
|
3,273
|
|
||||||||||||
|
(a)
|
Commingled funds primarily include global equity index, corporate bond, and U.S. treasury securities. The funds are valued using the net asset value provided by the administrator of the fund. The fair value of each fund is based on the fair value of securities in the portfolio, which represents the amount that the fund might reasonably expect to receive for the securities upon a sale, less liabilities, and then divided by the number of units outstanding. These funds are valued using observable inputs on either a daily or weekly basis and the resulting value serves as a basis for current transactions.
|
|
(b)
|
Corporate debt securities are valued based on observable prices from the new issue market, benchmark quotes, secondary trading and dealer quotes. An option adjusted spread model is incorporated to adjust spreads of issues that have early redemption features and final spreads are added to the U.S. Treasury curve.
|
|
(c)
|
Collective trust funds primarily consist of short-term investment strategies comprised of instruments issued or fully guaranteed by the U.S. government and/or its agencies and are valued using the net asset value provided by the administrator of the fund. The net asset value is based on the readily determinable value of the underlying assets owned by the fund, less liabilities, and then divided by the number of units outstanding.
|
|
(d)
|
Accrued investment income includes dividends and interest receivable.
|
|
(e)
|
Certain investments that are measured at fair value using the net asset value per share (or its equivalent) practical expedient have not been classified in the fair value hierarchy. These investments primarily consist of hedge funds, which includes hard to value or illiquid securities. The fair value of each fund is based on the fair value of assets in the portfolio, which represents the amount that the fund might reasonably expect to receive for the assets upon a sale, less liabilities, and then divided by the number of units outstanding. Certain hedge funds report net asset value per share on a quarter lag. Shares of the funds are not redeemable and the underlying assets are anticipated to be liquidated and distributed to investors in the near term. There are
|
F- 45
CHARTER COMMUNICATIONS, INC. AND SUBSIDIARIES
NOTES TO CONSOLIDATED FINANCIAL STATEMENTS
DECEMBER 31, 2017, 2016 AND 2015
(dollars in millions, except share or per share data or where indicated)
no material unfunded commitments with respect to these investments. The fair value amounts presented in this table are intended to permit the reconciliation of the fair value hierarchy to the total fair value of plan assets discussed throughout this footnote.
The following table sets forth the investment assets of the qualified pension plans, which exclude accrued investment income and other receivables, accrued liabilities, and investments with a fair value measured at net asset value per share as a practical expedient, by level within the fair value hierarchy as of
December 31, 2016
:
|
December 31, 2016
|
|||||||||||||||
|
Fair Value
|
Level 1
|
Level 2
|
Level 3
|
||||||||||||
|
Cash
|
$
|
2
|
|
$
|
2
|
|
$
|
—
|
|
$
|
—
|
|
|||
|
Common stocks:
|
—
|
|
|||||||||||||
|
Domestic
(a)
|
1,065
|
|
1,065
|
|
—
|
|
—
|
|
|||||||
|
International
(a)
|
391
|
|
391
|
|
—
|
|
—
|
|
|||||||
|
Commingled equity funds
(b)
|
348
|
|
—
|
|
348
|
|
—
|
|
|||||||
|
Other equity securities
(c)
|
3
|
|
3
|
|
—
|
|
—
|
|
|||||||
|
Corporate debt securities
(d)
|
394
|
|
—
|
|
394
|
|
—
|
|
|||||||
|
Commingled bond funds
(b)
|
273
|
|
—
|
|
273
|
|
—
|
|
|||||||
|
U.S. Treasury debt securities
(a)
|
260
|
|
260
|
|
—
|
|
—
|
|
|||||||
|
Collective trust funds
(e)
|
75
|
|
—
|
|
75
|
|
—
|
|
|||||||
|
U.S. government agency asset-backed debt securities
(f)
|
53
|
|
—
|
|
53
|
|
—
|
|
|||||||
|
Corporate asset-backed debt securities
(g)
|
2
|
|
—
|
|
2
|
|
—
|
|
|||||||
|
Other fixed-income securities
(h)
|
89
|
|
—
|
|
89
|
|
—
|
|
|||||||
|
Total investment assets
|
2,955
|
|
$
|
1,721
|
|
$
|
1,234
|
|
$
|
—
|
|
||||
|
Accrued investment income and other receivables
(i)
|
107
|
|
|||||||||||||
|
Accrued liabilities
(i)
|
(120
|
)
|
|||||||||||||
|
Investments measured at net asset value
(j)
|
4
|
|
|||||||||||||
|
Fair value of plan assets
|
$
|
2,946
|
|
||||||||||||
|
(a)
|
Common stocks, mutual funds and U.S. Treasury debt securities are valued at the closing price reported on the active market on which the individual securities are traded. No single industry comprised a significant portion of common stock held by the qualified pension plan as of
December 31, 2016
.
|
|
(b)
|
Commingled equity funds and commingled bond funds are valued using the net asset value provided by the administrator of the fund. The fair value of each fund is based on the fair value of securities in the portfolio, which represents the amount that the fund might reasonably expect to receive for the securities upon a sale, less liabilities, and then divided by the number of units outstanding. These funds are valued using observable inputs on either a daily or weekly basis and the resulting value serves as a basis for current transactions.
|
|
(c)
|
Other equity securities consist of preferred stocks, which are valued at the closing price reported on the active market on which the individual securities are traded.
|
|
(d)
|
Corporate debt securities are valued based on observable prices from the new issue market, benchmark quotes, secondary trading and dealer quotes. An option adjusted spread model is incorporated to adjust spreads of issues that have early redemption features and final spreads are added to the U.S. Treasury curve.
|
|
(e)
|
Collective trust funds primarily consist of short-term investment strategies comprised of instruments issued or fully guaranteed by the U.S. government and/or its agencies and are valued using the net asset value provided by the administrator of the fund. The net asset value is based on the readily determinable value of the underlying assets owned by the fund, less liabilities, and then divided by the number of units outstanding.
|
|
(f)
|
U.S. government agency asset-backed debt securities consist of pass-through mortgage-backed securities issued by the Federal Home Loan Mortgage Corporation and the Federal National Mortgage Association valued using available trade information, dealer quotes, market indices and research reports, spreads, bids and offers.
|
F- 46
CHARTER COMMUNICATIONS, INC. AND SUBSIDIARIES
NOTES TO CONSOLIDATED FINANCIAL STATEMENTS
DECEMBER 31, 2017, 2016 AND 2015
(dollars in millions, except share or per share data or where indicated)
|
(g)
|
Corporate asset-backed debt securities primarily consist of pass-through mortgage-backed securities issued by U.S. and foreign corporations valued using available trade information, dealer quotes, market indices and research reports, spreads, bids and offers.
|
|
(h)
|
Other fixed-income securities consist of foreign government debt securities, municipal bonds and U.S. government agency debt securities, which are valued based on observable prices from the new issue market, benchmark quotes, secondary trading and dealer quotes. An option adjusted spread model is incorporated to adjust spreads of issues that have early redemption features and final spreads are added to the U.S. Treasury curve.
|
|
(i)
|
Accrued investment income and other receivables includes amounts receivable under foreign exchange contracts of
$70 million
as of
December 31, 2016
. Accrued liabilities includes amounts accrued under foreign exchange contracts of
$71 million
as of
December 31, 2016
. The fair value of the assets and liabilities associated with these foreign exchange contracts are presented on a gross basis and are valued using the exchange rates in effect for the applicable currencies as of the valuation date (a Level 1 fair value measurement).
|
|
(j)
|
Certain investments that are measured at fair value using the net asset value per share (or its equivalent) practical expedient have not been classified in the fair value hierarchy. These investments primarily consist of hedge funds valued utilizing net asset value provided by the administrator of the fund, which is based on the value of the underlying assets owned by the fund, less liabilities, and then divided by the number of units outstanding. Shares of the fund are not redeemable and the underlying assets are anticipated to be liquidated and distributed to investors in the near term. There are no material unfunded commitments with respect to these investments. The fair value amounts presented in this table are intended to permit the reconciliation of the fair value hierarchy to the total fair value of plan assets discussed throughout this footnote.
|
Pension Plan Contributions
The Company made no cash contributions to the qualified pension plans during the years ended
December 31, 2017
and
2016
; however, the Company may make discretionary cash contributions to the qualified pension plans in the future. Such contributions will be dependent on a variety of factors, including current and expected interest rates, asset performance, the funded status of the qualified pension plans and management’s judgment. For the nonqualified unfunded pension plan, the Company will continue to make contributions during 2018 to the extent benefits are paid.
Benefit payments for the pension plans are expected to be
$186 million
in
2018
,
$188 million
in
2019
,
$191 million
in
2020
,
$192 million
in
2021
,
$193 million
in
2022
and
$944 million
in 2023 to 2027.
Multiemployer Plans
The Company contributes to a number of multiemployer plans under the terms of collective-bargaining agreements that cover its union-represented employees. Such multiemployer plans provide medical, pension and retirement savings benefits to active employees and retirees. The Company made contributions to multiemployer plans of
$18 million
and
$31 million
for the years ended
December 31, 2017
and
2016
, respectively.
The risks of participating in multiemployer pension plans are different from single-employer pension plans in the following aspects: (a) assets contributed to a multiemployer pension plan by one employer may be used to provide benefits to employees of other participating employers, (b) if a participating employer stops contributing to the multiemployer pension plan, the unfunded obligations of the plan may be borne by the remaining participating employers and (c) if the Company chooses to stop participating in any of the multiemployer pension plans, it may be required to pay those plans an amount based on the underfunded status of the plan, referred to as a withdrawal liability. The Company records withdrawal liabilities as other long-term liabilities in the consolidated balance sheets. As of December 31, 2017, other long-term liabilities includes approximately
$83 million
related to the Company's withdrawal from a multiemployer pension plan.
The multiemployer pension plans to which the Company has contributed each received a Pension Protection Act “green” zone status in 2016. The zone status is based on the most recent information the Company received from the plan and is certified by the plan’s actuary. Among other factors, plans in the green zone are at least 80% funded.
Defined Contribution Benefit Plans
The Company’s employees may participate in the Charter Communications, Inc. 401(k) Plan (the “401(k) Plan”). Employees that qualify for participation can contribute up to
50%
of their salary, on a pre-tax basis, subject to a maximum contribution limit as
F- 47
CHARTER COMMUNICATIONS, INC. AND SUBSIDIARIES
NOTES TO CONSOLIDATED FINANCIAL STATEMENTS
DECEMBER 31, 2017, 2016 AND 2015
(dollars in millions, except share or per share data or where indicated)
determined by the Internal Revenue Service. The Company’s matching contribution is discretionary and is equal to
100%
of the amount of the salary reduction the participant elects to defer (up to
6%
of the participant’s eligible compensation), excluding any catch-up contributions and is paid by the Company on a per pay period basis. The Company made contributions to the 401(k) plan totaling
$274 million
,
$147 million
and
$23 million
for the years ended
December 31, 2017
,
2016
and
2015
, respectively.
For employees who are not eligible to participate in the Company’s long-term incentive plan and who are not covered by a collective bargaining agreement, the Company offers a contribution to the new Retirement Accumulation Plan ("RAP"), equal to
3%
of eligible pay. The Company made contributions to the RAP totaling
$139 million
and
$48 million
for the years ended
December 31, 2017
and
2016
, respectively.
22. Recently Issued Accounting Standards
Accounting Standards Adopted January 1, 2017
In March 2016, the Financial Accounting Standards Board (“FASB”) issued ASU No. 2016-09,
Improvements to Employee Share-Based Payment Accounting
, which includes multiple provisions intended to simplify various aspects of the accounting for share-based payments. The new standard (1) requires all excess tax benefits and deficiencies to be recognized as income tax expense or benefit in the income statement in the period in which they occur regardless of whether the benefit reduces taxes payable in the current period, (2) requires classification of excess tax benefits as an operating activity on the statements of cash flows, (3) allows an entity to make an entity-wide accounting policy election to either estimate the number of awards that are expected to vest or account for forfeitures when they occur and (4) causes the threshold under which employee share-based awards partially settled in cash can qualify for equity classification to increase to the maximum statutory tax rates in the applicable jurisdiction. The new standard generally requires a modified retrospective transition through a cumulative-effect adjustment as of the beginning of the period of adoption, with certain provisions requiring either a prospective or retrospective transition. The Company adopted ASU 2016-09 on January 1, 2017. Upon adoption of ASU 2016-09, the Company recognized excess tax benefits in deferred tax assets that were previously not recognized in a cumulative-effect adjustment to retained earnings. The Company will prospectively record a deferred tax benefit or expense associated with the difference between book and tax for stock compensation expense. On January 1, 2017, the Company also established an accounting policy election to assume zero forfeitures for stock award grants and account for forfeitures when they occur which prospectively impacts stock compensation expense. The total impact to shareholders' equity was a
$131 million
increase to retained earnings, a
$9 million
increase to additional paid-in capital and a
$140 million
decrease to net deferred tax liabilities.
In March 2017, the FASB issued ASU No. 2017-07,
Improving the Presentation of Net Periodic Pension Cost and Net Periodic Postretirement Benefit Cost
("ASU 2017-07"), which requires employers to report the service cost component of net periodic pension cost in the same line item as other compensation costs arising from services rendered during the period. The standard also requires the other components of net periodic cost be presented in the income statement separately from the service cost component and outside of a subtotal of income from operations. ASU 2017-07 will be effective for annual periods beginning after December 15, 2017, and early adoption is permitted. The new standard requires retrospective application and allows a practical expedient that permits an employer to use the amounts disclosed in its pension plan footnote for the prior comparative periods as the estimation basis for applying the retrospective presentation. The Company early adopted ASU 2017-07 on January 1, 2017 and utilized the practical expedient to estimate the impact on the prior comparative period information presented in interim and annual financial statements. The Company previously recorded service cost with other compensation costs in operating costs and expenses in the consolidated statements of operations, and recorded other pension costs (benefits), in other operating expenses, net. Adoption of the standard results in the reclassification of other pension costs (benefits) to other expenses, net (non-operating). Adopting the standard reduced 2016 income from operations presented for comparative purposes in the 2017 annual financial statements by
$899 million
with a corresponding decrease to other expenses of
$899 million
, with no impact to net income. ASU 2017-07 does not impact the consolidated balance sheets or statements of cash flows.
Accounting Standards Adopted January 1, 2018
In May 2014, the FASB issued ASU No. 2014-09,
Revenue from Contracts with Customers
(“ASU 2014-09”), which is a comprehensive revenue recognition standard that will supersede nearly all existing revenue recognition guidance under U.S. GAAP. The new standard provides a single principles-based, five-step model to be applied to all contracts with customers, which steps are to (1) identify the contract(s) with the customer, (2) identify the performance obligations in the contract, (3) determine the transaction price, (4) allocate the transaction price to the performance obligations in the contract and (5) recognize revenue when
F- 48
CHARTER COMMUNICATIONS, INC. AND SUBSIDIARIES
NOTES TO CONSOLIDATED FINANCIAL STATEMENTS
DECEMBER 31, 2017, 2016 AND 2015
(dollars in millions, except share or per share data or where indicated)
each performance obligation is satisfied. Charter adopted ASU 2014-09 as of the January 1, 2018 using the modified retrospective transition method with a cumulative-effect adjustment to equity as will be fully presented in the Company’s Quarterly Report on Form 10-Q for the three months ended March 31, 2018. The adoption of the new standard did not have a material impact on the Company’s financial position or results of operation. Previously reported results will not be restated under this transition method. The Company has implemented new processes and internal controls to enable the preparation of financial information on adoption. The adoption results in the deferral of residential installation revenues and enterprise commission expenses over a period of time instead of recognized immediately and the reclassification to operating costs and expenses the amortization of up-front fees paid to market and serve customers who reside in residential MDUs instead of amortized as an intangible to depreciation and amortization expense. The adoption of ASU 2014-09 will also result in additional disclosures around nature and timing of the Company’s performance obligations, deferred revenue contract liabilities, deferred contract cost assets, as well as significant judgments and practical expedients used by the Company in applying the five-step revenue model.
In August 2016, the FASB issued ASU No. 2016-15,
Statement of Cash Flows (Topic 230): Classification of Certain Cash Receipts and Cash Payments
(“ASU 2016-15”), which clarifies how entities should classify cash receipts and cash payments related to eight specific cash flow matters on the statement of cash flows, with the objective of reducing existing diversity in practice. The Company adopted ASU 2016-15 on January 1, 2018. The adoption of ASU 2016-15 did not have a material impact to the Company’s consolidated financial statements.
In November 2016, the FASB issued ASU No. 2016-18,
Statement of Cash Flows (Topic 230): Restricted Cash
(“ASU 2016-18”) which requires that amounts generally described as restricted cash to be included with cash and cash equivalents when reconciling the beginning-of-period and end-of-period total amounts shown on the statement of cash flows. ASU 2016-18 does not provide a definition of restricted cash or restricted cash equivalents. The Company adopted ASU 2016-18 on January 1, 2018. The new guidance will only be applicable to amounts described by the Company as restricted cash. The Company currently does not have amounts described as restricted cash; however, the Company's consolidated statement of cash flows for the year ended December 31, 2016 will be recast to present
$22.3 billion
of restricted cash as beginning of period cash and cash equivalents.
In May 2017, the FASB issued ASU No. 2017-09,
Scope of Modification Accounting
("ASU 2017-09"), which amends the scope of modification accounting for share-based payment arrangements. The ASU provides guidance on the types of changes to the terms or conditions of share-based payment awards to which an entity would be required to apply modification accounting. ASU 2017-09 is applied prospectively to awards modified on or after the effective date. The Company adopted ASU 2017-09 on January 1, 2018. The adoption of ASU 2017-09 did not have a material impact to the Company’s consolidated financial statements.
Accounting Standards Not Yet Adopted
In February 2016, the FASB issued ASU No. 2016-02,
Leases
(“ASU 2016-02”), which requires lessees to recognize almost all leases on their balance sheet as a right-of-use asset and a lease liability. Lessees are allowed to account for short-term leases (i.e., leases with a term of 12 months or less) off-balance sheet, consistent with current operating lease accounting. For income statement purposes, the FASB retained a dual model, requiring leases to be classified as either operating or finance. Classification will be based on criteria that are largely similar to those applied in current lease accounting, but without explicit bright lines. ASU 2016-02 will be effective for interim and annual periods beginning after December 15, 2018 (January 1, 2019 for the Company). The new standard currently requires a modified retrospective transition through a cumulative-effect adjustment as of the beginning of the earliest period presented in the financial statements, although an option for transition relief to not restate or make required disclosures under the new standard in comparative periods in the period of adoption was recently exposed by the FASB for public comment. The Company is currently in the process of evaluating the impact that the adoption of ASU 2016-02 will have on its consolidated financial statements including identifying the population of leases, evaluating technology solutions and collecting lease data. The Company expects its leases designated as operating leases in Note 20 will be reported on the consolidated balance sheets upon adoption. The Company is currently evaluating the impact to its consolidated financial statements as it relates to other embedded lease arrangements of the business.
In January 2017, the FASB issued ASU No. 2017-04,
Simplifying the Test for Goodwill Impairment
(“ASU 2017-04”), which eliminates step two from the goodwill impairment test. Under the new standard, to the extent the carrying amount of a reporting unit exceeds the fair value, the Company will record an impairment charge equal to the difference. The impairment charge recognized should not exceed the total amount of goodwill allocated to the reporting unit. ASU 2017-04 will be effective for interim and annual periods beginning after December 15, 2019 (January 1, 2020 for the Company). Early adoption is permitted for interim or
F- 49
CHARTER COMMUNICATIONS, INC. AND SUBSIDIARIES
NOTES TO CONSOLIDATED FINANCIAL STATEMENTS
DECEMBER 31, 2017, 2016 AND 2015
(dollars in millions, except share or per share data or where indicated)
annual goodwill impairment tests performed after January 1, 2017. The Company is currently in the process of evaluating the impact that the adoption of ASU 2017-04 will have on its consolidated financial statements.
23. Unaudited Quarterly Financial Data
The following table presents quarterly data for the periods presented in the consolidated statement of operations:
|
Year Ended December 31, 2017
|
|||||||||||||||
|
First
Quarter
|
Second Quarter
|
Third
Quarter
|
Fourth Quarter
|
||||||||||||
|
Revenues
|
$
|
10,164
|
|
$
|
10,357
|
|
$
|
10,458
|
|
$
|
10,602
|
|
|||
|
Income from operations
|
$
|
941
|
|
$
|
1,052
|
|
$
|
909
|
|
$
|
1,204
|
|
|||
|
Net income attributable to Charter shareholders
|
$
|
155
|
|
$
|
139
|
|
$
|
48
|
|
$
|
9,553
|
|
|||
|
Earnings per common share attributable to Charter shareholders:
|
|||||||||||||||
|
Basic
|
$
|
0.58
|
|
$
|
0.53
|
|
$
|
0.19
|
|
$
|
39.66
|
|
|||
|
Diluted
|
$
|
0.57
|
|
$
|
0.52
|
|
$
|
0.19
|
|
$
|
34.56
|
|
|||
|
Weighted average common share outstanding:
|
|||||||||||||||
|
Basic
|
269,004,817
|
|
263,460,911
|
|
253,923,805
|
|
240,833,636
|
|
|||||||
|
Diluted
|
273,199,509
|
|
267,309,261
|
|
258,341,851
|
|
278,257,245
|
|
|||||||
|
Year Ended December 31, 2016
|
|||||||||||||||
|
First
Quarter
|
Second Quarter
|
Third
Quarter
|
Fourth Quarter
|
||||||||||||
|
Revenues
|
$
|
2,530
|
|
$
|
6,161
|
|
$
|
10,037
|
|
$
|
10,275
|
|
|||
|
Income from operations
|
$
|
302
|
|
$
|
170
|
|
$
|
911
|
|
$
|
1,073
|
|
|||
|
Net income (loss) attributable to Charter shareholders
|
$
|
(188
|
)
|
$
|
3,067
|
|
$
|
189
|
|
$
|
454
|
|
|||
|
Earnings (loss) per common share attributable to Charter shareholders:
|
|||||||||||||||
|
Basic
|
$
|
(1.86
|
)
|
$
|
16.73
|
|
$
|
0.70
|
|
$
|
1.69
|
|
|||
|
Diluted
|
$
|
(1.86
|
)
|
$
|
15.17
|
|
$
|
0.69
|
|
$
|
1.67
|
|
|||
|
Weighted average common share outstanding:
|
|||||||||||||||
|
Basic
|
101,552,093
|
|
183,362,776
|
|
271,263,259
|
|
268,584,368
|
|
|||||||
|
Diluted
|
101,552,093
|
|
205,214,266
|
|
275,373,202
|
|
272,624,270
|
|
|||||||
24.
Consolidating Schedules
Each of Charter Operating, TWC, LLC, TWCE, CCO Holdings and certain subsidiaries jointly, severally, fully and unconditionally guarantee the outstanding debt securities of the others (other than the CCO Holdings notes) on an unsecured senior basis and the condensed consolidating financial information has been prepared and presented pursuant to SEC Regulation S-X Rule 3-10,
Financial Statements of Guarantors and Issuers of Guaranteed Securities Registered or Being Registered.
Certain Charter Operating subsidiaries that are regulated telephone entities only become guarantor subsidiaries upon approval by regulators. This information is not intended to present the financial position, results of operations and cash flows of the individual companies or groups of companies in accordance with generally accepted accounting principles.
The "Intermediate Holding Companies" column includes the assets and liabilities of the captive insurance company, a company wholly-owned by Charter outside of Charter Holdings and not one of the holding companies that directly or indirectly own Charter
F- 50
CHARTER COMMUNICATIONS, INC. AND SUBSIDIARIES
NOTES TO CONSOLIDATED FINANCIAL STATEMENTS
DECEMBER 31, 2017, 2016 AND 2015
(dollars in millions, except share or per share data or where indicated)
Holdings. The “Charter Operating and Restricted Subsidiaries” column is presented to comply with the terms of the Credit Agreement.
The “Safari Escrow Entities” column included in the condensed consolidating financial statements for the year ended December 31, 2015 consists of CCOH Safari, CCO Safari II and CCO Safari III. CCOH Safari, CCO Safari II and CCO Safari III issued the CCOH Safari notes, CCO Safari II notes and the CCO Safari III credit facilities, respectively. Upon closing of the TWC Transaction, the CCOH Safari notes became obligations of CCO Holdings and CCO Holdings Capital and the CCO Safari II notes and CCO Safari III credit facilities became obligations of Charter Operating and Charter Communications Operating Capital Corp. CCOH Safari merged into CCO Holdings and CCO Safari II and CCO Safari III merged into Charter Operating.
The “Unrestricted Subsidiary” column included in the condensed consolidating financial statements for the year ended December 31, 2015 consists of CCO Safari which was a non-recourse subsidiary under the Credit Agreement and held the CCO Safari Term G Loans that were repaid in April 2015.
Condensed consolidating financial statements as of
December 31, 2017
and
2016
and for the years ended
December 31, 2017
,
2016
and
2015
follow.
F- 51
CHARTER COMMUNICATIONS, INC. AND SUBSIDIARIES
NOTES TO CONSOLIDATED FINANCIAL STATEMENTS
DECEMBER 31, 2017, 2016 AND 2015
(dollars in millions, except share or per share data or where indicated)
|
Charter Communications, Inc.
|
|||||||||||||||||||||||
|
|
|||||||||||||||||||||||
|
As of December 31, 2017
|
|||||||||||||||||||||||
|
Non-Guarantor Subsidiaries
|
Guarantor Subsidiaries
|
||||||||||||||||||||||
|
Charter
|
Intermediate Holding Companies
|
CCO Holdings
|
Charter Operating and Restricted Subsidiaries
|
Eliminations
|
Charter Consolidated
|
||||||||||||||||||
|
ASSETS
|
|||||||||||||||||||||||
|
CURRENT ASSETS:
|
|||||||||||||||||||||||
|
Cash and cash equivalents
|
$
|
—
|
|
$
|
291
|
|
$
|
—
|
|
$
|
330
|
|
$
|
—
|
|
$
|
621
|
|
|||||
|
Accounts receivable, net
|
—
|
|
24
|
|
—
|
|
1,611
|
|
—
|
|
1,635
|
|
|||||||||||
|
Receivables from related party
|
22
|
|
613
|
|
55
|
|
—
|
|
(690
|
)
|
—
|
|
|||||||||||
|
Prepaid expenses and other current assets
|
22
|
|
34
|
|
—
|
|
243
|
|
—
|
|
299
|
|
|||||||||||
|
Total current assets
|
44
|
|
962
|
|
55
|
|
2,184
|
|
(690
|
)
|
2,555
|
|
|||||||||||
|
INVESTMENT IN CABLE PROPERTIES:
|
|||||||||||||||||||||||
|
Property, plant and equipment, net
|
—
|
|
336
|
|
—
|
|
33,552
|
|
—
|
|
33,888
|
|
|||||||||||
|
Customer relationships, net
|
—
|
|
—
|
|
—
|
|
11,951
|
|
—
|
|
11,951
|
|
|||||||||||
|
Franchises
|
—
|
|
—
|
|
—
|
|
67,319
|
|
—
|
|
67,319
|
|
|||||||||||
|
Goodwill
|
—
|
|
—
|
|
—
|
|
29,554
|
|
—
|
|
29,554
|
|
|||||||||||
|
Total investment in cable properties, net
|
—
|
|
336
|
|
—
|
|
142,376
|
|
—
|
|
142,712
|
|
|||||||||||
|
INVESTMENT IN SUBSIDIARIES
|
56,263
|
|
63,558
|
|
81,980
|
|
—
|
|
(201,801
|
)
|
—
|
|
|||||||||||
|
LOANS RECEIVABLE – RELATED PARTY
|
233
|
|
655
|
|
511
|
|
—
|
|
(1,399
|
)
|
—
|
|
|||||||||||
|
OTHER NONCURRENT ASSETS
|
—
|
|
223
|
|
—
|
|
1,133
|
|
—
|
|
1,356
|
|
|||||||||||
|
Total assets
|
$
|
56,540
|
|
$
|
65,734
|
|
$
|
82,546
|
|
$
|
145,693
|
|
$
|
(203,890
|
)
|
$
|
146,623
|
|
|||||
|
LIABILITIES AND SHAREHOLDERS’/MEMBER’S EQUITY
|
|||||||||||||||||||||||
|
CURRENT LIABILITIES:
|
|||||||||||||||||||||||
|
Accounts payable and accrued liabilities
|
$
|
4
|
|
$
|
900
|
|
$
|
280
|
|
$
|
7,861
|
|
$
|
—
|
|
$
|
9,045
|
|
|||||
|
Payables to related party
|
—
|
|
—
|
|
—
|
|
690
|
|
(690
|
)
|
—
|
|
|||||||||||
|
Current portion of long-term debt
|
—
|
|
—
|
|
—
|
|
2,045
|
|
—
|
|
2,045
|
|
|||||||||||
|
Total current liabilities
|
4
|
|
900
|
|
280
|
|
10,596
|
|
(690
|
)
|
11,090
|
|
|||||||||||
|
LONG-TERM DEBT
|
—
|
|
—
|
|
18,708
|
|
49,478
|
|
—
|
|
68,186
|
|
|||||||||||
|
LOANS PAYABLE – RELATED PARTY
|
—
|
|
—
|
|
—
|
|
1,399
|
|
(1,399
|
)
|
—
|
|
|||||||||||
|
DEFERRED INCOME TAXES
|
17,268
|
|
14
|
|
—
|
|
32
|
|
—
|
|
17,314
|
|
|||||||||||
|
OTHER LONG-TERM LIABILITIES
|
184
|
|
134
|
|
—
|
|
2,184
|
|
—
|
|
2,502
|
|
|||||||||||
|
SHAREHOLDERS’/MEMBER’S EQUITY
|
|||||||||||||||||||||||
|
Controlling interest
|
39,084
|
|
56,263
|
|
63,558
|
|
81,980
|
|
(201,801
|
)
|
39,084
|
|
|||||||||||
|
Noncontrolling interests
|
—
|
|
8,423
|
|
—
|
|
24
|
|
—
|
|
8,447
|
|
|||||||||||
|
Total shareholders’/member’s equity
|
39,084
|
|
64,686
|
|
63,558
|
|
82,004
|
|
(201,801
|
)
|
47,531
|
|
|||||||||||
|
Total liabilities and shareholders’/member’s equity
|
$
|
56,540
|
|
$
|
65,734
|
|
$
|
82,546
|
|
$
|
145,693
|
|
$
|
(203,890
|
)
|
$
|
146,623
|
|
|||||
F- 52
CHARTER COMMUNICATIONS, INC. AND SUBSIDIARIES
NOTES TO CONSOLIDATED FINANCIAL STATEMENTS
DECEMBER 31, 2017, 2016 AND 2015
(dollars in millions, except share or per share data or where indicated)
|
Charter Communications, Inc.
|
|||||||||||||||||||||||
|
Condensed Consolidating Balance Sheet
|
|||||||||||||||||||||||
|
As of December 31, 2016
|
|||||||||||||||||||||||
|
Non-Guarantor Subsidiaries
|
Guarantor Subsidiaries
|
||||||||||||||||||||||
|
Charter
|
Intermediate Holding Companies
|
CCO Holdings
|
Charter Operating and Restricted Subsidiaries
|
Eliminations
|
Charter Consolidated
|
||||||||||||||||||
|
ASSETS
|
|||||||||||||||||||||||
|
CURRENT ASSETS:
|
|||||||||||||||||||||||
|
Cash and cash equivalents
|
$
|
57
|
|
$
|
154
|
|
$
|
—
|
|
$
|
1,324
|
|
$
|
—
|
|
$
|
1,535
|
|
|||||
|
Accounts receivable, net
|
34
|
|
11
|
|
—
|
|
1,387
|
|
—
|
|
1,432
|
|
|||||||||||
|
Receivables from related party
|
170
|
|
451
|
|
62
|
|
—
|
|
(683
|
)
|
—
|
|
|||||||||||
|
Prepaid expenses and other current assets
|
—
|
|
33
|
|
—
|
|
300
|
|
—
|
|
333
|
|
|||||||||||
|
Total current assets
|
261
|
|
649
|
|
62
|
|
3,011
|
|
(683
|
)
|
3,300
|
|
|||||||||||
|
INVESTMENT IN CABLE PROPERTIES:
|
|||||||||||||||||||||||
|
Property, plant and equipment, net
|
—
|
|
245
|
|
—
|
|
32,718
|
|
—
|
|
32,963
|
|
|||||||||||
|
Customer relationships, net
|
—
|
|
—
|
|
—
|
|
14,608
|
|
—
|
|
14,608
|
|
|||||||||||
|
Franchises
|
—
|
|
—
|
|
—
|
|
67,316
|
|
—
|
|
67,316
|
|
|||||||||||
|
Goodwill
|
—
|
|
—
|
|
—
|
|
29,509
|
|
—
|
|
29,509
|
|
|||||||||||
|
Total investment in cable properties, net
|
—
|
|
245
|
|
—
|
|
144,151
|
|
—
|
|
144,396
|
|
|||||||||||
|
INVESTMENT IN SUBSIDIARIES
|
66,692
|
|
75,838
|
|
88,760
|
|
—
|
|
(231,290
|
)
|
—
|
|
|||||||||||
|
LOANS RECEIVABLE – RELATED PARTY
|
—
|
|
640
|
|
494
|
|
—
|
|
(1,134
|
)
|
—
|
|
|||||||||||
|
OTHER NONCURRENT ASSETS
|
—
|
|
214
|
|
—
|
|
1,157
|
|
—
|
|
1,371
|
|
|||||||||||
|
Total assets
|
$
|
66,953
|
|
$
|
77,586
|
|
$
|
89,316
|
|
$
|
148,319
|
|
$
|
(233,107
|
)
|
$
|
149,067
|
|
|||||
|
LIABILITIES AND SHAREHOLDERS’/MEMBER’S EQUITY
|
|||||||||||||||||||||||
|
CURRENT LIABILITIES:
|
|||||||||||||||||||||||
|
Accounts payable and accrued liabilities
|
$
|
22
|
|
$
|
625
|
|
$
|
219
|
|
$
|
6,678
|
|
$
|
—
|
|
$
|
7,544
|
|
|||||
|
Payables to related party
|
—
|
|
—
|
|
—
|
|
683
|
|
(683
|
)
|
—
|
|
|||||||||||
|
Current portion of long-term debt
|
—
|
|
—
|
|
—
|
|
2,028
|
|
—
|
|
2,028
|
|
|||||||||||
|
Total current liabilities
|
22
|
|
625
|
|
219
|
|
9,389
|
|
(683
|
)
|
9,572
|
|
|||||||||||
|
LONG-TERM DEBT
|
—
|
|
—
|
|
13,259
|
|
46,460
|
|
—
|
|
59,719
|
|
|||||||||||
|
LOANS PAYABLE – RELATED PARTY
|
—
|
|
—
|
|
—
|
|
1,134
|
|
(1,134
|
)
|
—
|
|
|||||||||||
|
DEFERRED INCOME TAXES
|
26,637
|
|
3
|
|
—
|
|
25
|
|
—
|
|
26,665
|
|
|||||||||||
|
OTHER LONG-TERM LIABILITIES
|
155
|
|
64
|
|
—
|
|
2,526
|
|
—
|
|
2,745
|
|
|||||||||||
|
SHAREHOLDERS’/MEMBER’S EQUITY
|
|||||||||||||||||||||||
|
Controlling interest
|
40,139
|
|
66,692
|
|
75,838
|
|
88,760
|
|
(231,290
|
)
|
40,139
|
|
|||||||||||
|
Noncontrolling interests
|
—
|
|
10,202
|
|
—
|
|
25
|
|
—
|
|
10,227
|
|
|||||||||||
|
Total shareholders’/member’s equity
|
40,139
|
|
76,894
|
|
75,838
|
|
88,785
|
|
(231,290
|
)
|
50,366
|
|
|||||||||||
|
Total liabilities and shareholders’/member’s equity
|
$
|
66,953
|
|
$
|
77,586
|
|
$
|
89,316
|
|
$
|
148,319
|
|
$
|
(233,107
|
)
|
$
|
149,067
|
|
|||||
F- 53
CHARTER COMMUNICATIONS, INC. AND SUBSIDIARIES
NOTES TO CONSOLIDATED FINANCIAL STATEMENTS
DECEMBER 31, 2017, 2016 AND 2015
(dollars in millions, except share or per share data or where indicated)
|
Charter Communications, Inc.
|
|||||||||||||||||||||||
|
|
|||||||||||||||||||||||
|
For the year ended December 31, 2017
|
|||||||||||||||||||||||
|
Non-Guarantor Subsidiaries
|
Guarantor Subsidiaries
|
||||||||||||||||||||||
|
Charter
|
Intermediate Holding Companies
|
CCO Holdings
|
Charter Operating and Restricted Subsidiaries
|
Eliminations
|
Charter Consolidated
|
||||||||||||||||||
|
REVENUES
|
$
|
90
|
|
$
|
1,186
|
|
$
|
—
|
|
$
|
41,578
|
|
$
|
(1,273
|
)
|
$
|
41,581
|
|
|||||
|
COSTS AND EXPENSES:
|
|||||||||||||||||||||||
|
Operating costs and expenses (exclusive of items shown separately below)
|
90
|
|
1,164
|
|
—
|
|
26,560
|
|
(1,273
|
)
|
26,541
|
|
|||||||||||
|
Depreciation and amortization
|
—
|
|
9
|
|
—
|
|
10,579
|
|
—
|
|
10,588
|
|
|||||||||||
|
Other operating (income) expenses, net
|
(101
|
)
|
3
|
|
—
|
|
444
|
|
—
|
|
346
|
|
|||||||||||
|
(11
|
)
|
1,176
|
|
—
|
|
37,583
|
|
(1,273
|
)
|
37,475
|
|
||||||||||||
|
Income from operations
|
101
|
|
10
|
|
—
|
|
3,995
|
|
—
|
|
4,106
|
|
|||||||||||
|
OTHER INCOME (EXPENSES):
|
|||||||||||||||||||||||
|
Interest income (expense), net
|
5
|
|
20
|
|
(883
|
)
|
(2,232
|
)
|
—
|
|
(3,090
|
)
|
|||||||||||
|
Loss on extinguishment of debt
|
—
|
|
—
|
|
(34
|
)
|
(6
|
)
|
—
|
|
(40
|
)
|
|||||||||||
|
Gain on financial instruments, net
|
—
|
|
—
|
|
—
|
|
69
|
|
—
|
|
69
|
|
|||||||||||
|
Other pension benefits
|
—
|
|
—
|
|
—
|
|
1
|
|
—
|
|
1
|
|
|||||||||||
|
Other expense, net
|
—
|
|
(14
|
)
|
—
|
|
(4
|
)
|
—
|
|
(18
|
)
|
|||||||||||
|
Equity in income of subsidiaries
|
680
|
|
882
|
|
1,799
|
|
—
|
|
(3,361
|
)
|
—
|
|
|||||||||||
|
685
|
|
888
|
|
882
|
|
(2,172
|
)
|
(3,361
|
)
|
(3,078
|
)
|
||||||||||||
|
Income before income taxes
|
786
|
|
898
|
|
882
|
|
1,823
|
|
(3,361
|
)
|
1,028
|
|
|||||||||||
|
INCOME TAX BENEFIT (EXPENSE)
|
9,109
|
|
1
|
|
—
|
|
(23
|
)
|
—
|
|
9,087
|
|
|||||||||||
|
Consolidated net income
|
9,895
|
|
899
|
|
882
|
|
1,800
|
|
(3,361
|
)
|
10,115
|
|
|||||||||||
|
Less: Net income – noncontrolling interests
|
—
|
|
(219
|
)
|
—
|
|
(1
|
)
|
—
|
|
(220
|
)
|
|||||||||||
|
Net income
|
$
|
9,895
|
|
$
|
680
|
|
$
|
882
|
|
$
|
1,799
|
|
$
|
(3,361
|
)
|
$
|
9,895
|
|
|||||
F- 54
CHARTER COMMUNICATIONS, INC. AND SUBSIDIARIES
NOTES TO CONSOLIDATED FINANCIAL STATEMENTS
DECEMBER 31, 2017, 2016 AND 2015
(dollars in millions, except share or per share data or where indicated)
|
Charter Communications, Inc.
|
|||||||||||||||||||||||||||
|
Condensed Consolidating Statement of Operations
|
|||||||||||||||||||||||||||
|
For the year ended December 31, 2016
|
|||||||||||||||||||||||||||
|
Non-Guarantor Subsidiaries
|
Guarantor Subsidiaries
|
||||||||||||||||||||||||||
|
Charter
|
Intermediate Holding Companies
|
Safari Escrow Entities
|
CCO Holdings
|
Charter Operating and Restricted Subsidiaries
|
Eliminations
|
Charter Consolidated
|
|||||||||||||||||||||
|
REVENUES
|
$
|
251
|
|
$
|
1,004
|
|
$
|
—
|
|
$
|
—
|
|
$
|
29,003
|
|
$
|
(1,255
|
)
|
$
|
29,003
|
|
||||||
|
COSTS AND EXPENSES:
|
|||||||||||||||||||||||||||
|
Operating costs and expenses (exclusive of items shown separately below)
|
251
|
|
989
|
|
—
|
|
—
|
|
18,670
|
|
(1,255
|
)
|
18,655
|
|
|||||||||||||
|
Depreciation and amortization
|
—
|
|
5
|
|
—
|
|
—
|
|
6,902
|
|
—
|
|
6,907
|
|
|||||||||||||
|
Other operating expenses, net
|
262
|
|
1
|
|
—
|
|
—
|
|
722
|
|
—
|
|
985
|
|
|||||||||||||
|
513
|
|
995
|
|
—
|
|
—
|
|
26,294
|
|
(1,255
|
)
|
26,547
|
|
||||||||||||||
|
Income (loss) from operations
|
(262
|
)
|
9
|
|
—
|
|
—
|
|
2,709
|
|
—
|
|
2,456
|
|
|||||||||||||
|
OTHER INCOME (EXPENSES):
|
|||||||||||||||||||||||||||
|
Interest income (expense), net
|
—
|
|
14
|
|
(390
|
)
|
(727
|
)
|
(1,396
|
)
|
—
|
|
(2,499
|
)
|
|||||||||||||
|
Loss on extinguishment of debt
|
—
|
|
—
|
|
—
|
|
(110
|
)
|
(1
|
)
|
—
|
|
(111
|
)
|
|||||||||||||
|
Gain on financial instruments, net
|
—
|
|
—
|
|
—
|
|
—
|
|
89
|
|
—
|
|
89
|
|
|||||||||||||
|
Other pension benefits
|
—
|
|
—
|
|
—
|
|
—
|
|
899
|
|
—
|
|
899
|
|
|||||||||||||
|
Other expense, net
|
—
|
|
(11
|
)
|
—
|
|
—
|
|
(3
|
)
|
—
|
|
(14
|
)
|
|||||||||||||
|
Equity in income of subsidiaries
|
851
|
|
1,066
|
|
—
|
|
2,293
|
|
—
|
|
(4,210
|
)
|
—
|
|
|||||||||||||
|
851
|
|
1,069
|
|
(390
|
)
|
1,456
|
|
(412
|
)
|
(4,210
|
)
|
(1,636
|
)
|
||||||||||||||
|
Income (loss) before income taxes
|
589
|
|
1,078
|
|
(390
|
)
|
1,456
|
|
2,297
|
|
(4,210
|
)
|
820
|
|
|||||||||||||
|
INCOME TAX BENEFIT (EXPENSE)
|
2,933
|
|
(5
|
)
|
—
|
|
—
|
|
(3
|
)
|
—
|
|
2,925
|
|
|||||||||||||
|
Consolidated net income (loss)
|
3,522
|
|
1,073
|
|
(390
|
)
|
1,456
|
|
2,294
|
|
(4,210
|
)
|
3,745
|
|
|||||||||||||
|
Less: Net income – noncontrolling interest
|
—
|
|
(222
|
)
|
—
|
|
—
|
|
(1
|
)
|
—
|
|
(223
|
)
|
|||||||||||||
|
Net income (loss)
|
$
|
3,522
|
|
$
|
851
|
|
$
|
(390
|
)
|
$
|
1,456
|
|
$
|
2,293
|
|
$
|
(4,210
|
)
|
$
|
3,522
|
|
||||||
F- 55
CHARTER COMMUNICATIONS, INC. AND SUBSIDIARIES
NOTES TO CONSOLIDATED FINANCIAL STATEMENTS
DECEMBER 31, 2017, 2016 AND 2015
(dollars in millions, except share or per share data or where indicated)
|
Charter Communications, Inc.
|
|||||||||||||||||||||||||||||||
|
Condensed Consolidating Statement of Operations
|
|||||||||||||||||||||||||||||||
|
For the year ended December 31, 2015
|
|||||||||||||||||||||||||||||||
|
Non-Guarantor Subsidiaries
|
Guarantor Subsidiaries
|
||||||||||||||||||||||||||||||
|
Charter
|
Intermediate Holding Companies
|
Safari Escrow Entities
|
CCO Holdings
|
Charter Operating and Restricted Subsidiaries
|
Unrestricted Subsidiary
|
Eliminations
|
Charter Consolidated
|
||||||||||||||||||||||||
|
REVENUES
|
$
|
25
|
|
$
|
299
|
|
$
|
—
|
|
$
|
—
|
|
$
|
9,754
|
|
$
|
—
|
|
$
|
(324
|
)
|
$
|
9,754
|
|
|||||||
|
COSTS AND EXPENSES:
|
|||||||||||||||||||||||||||||||
|
Operating costs and expenses (exclusive of items shown separately below)
|
25
|
|
299
|
|
—
|
|
—
|
|
6,426
|
|
—
|
|
(324
|
)
|
6,426
|
|
|||||||||||||||
|
Depreciation and amortization
|
—
|
|
—
|
|
—
|
|
—
|
|
2,125
|
|
—
|
|
—
|
|
2,125
|
|
|||||||||||||||
|
Other operating expenses, net
|
—
|
|
—
|
|
—
|
|
—
|
|
89
|
|
—
|
|
—
|
|
89
|
|
|||||||||||||||
|
25
|
|
299
|
|
—
|
|
—
|
|
8,640
|
|
—
|
|
(324
|
)
|
8,640
|
|
||||||||||||||||
|
Income from operations
|
—
|
|
—
|
|
—
|
|
—
|
|
1,114
|
|
—
|
|
—
|
|
1,114
|
|
|||||||||||||||
|
OTHER INCOME (EXPENSES):
|
|||||||||||||||||||||||||||||||
|
Interest income (expense), net
|
—
|
|
8
|
|
(474
|
)
|
(642
|
)
|
(151
|
)
|
(47
|
)
|
—
|
|
(1,306
|
)
|
|||||||||||||||
|
Loss on extinguishment of debt
|
—
|
|
—
|
|
(2
|
)
|
(123
|
)
|
—
|
|
(3
|
)
|
—
|
|
(128
|
)
|
|||||||||||||||
|
Loss on financial instruments, net
|
—
|
|
—
|
|
—
|
|
—
|
|
(4
|
)
|
—
|
|
—
|
|
(4
|
)
|
|||||||||||||||
|
Other expense, net
|
—
|
|
(7
|
)
|
—
|
|
—
|
|
—
|
|
—
|
|
—
|
|
(7
|
)
|
|||||||||||||||
|
Equity in income (loss) of subsidiaries
|
(121
|
)
|
(168
|
)
|
—
|
|
1,073
|
|
(50
|
)
|
—
|
|
(734
|
)
|
—
|
|
|||||||||||||||
|
(121
|
)
|
(167
|
)
|
(476
|
)
|
308
|
|
(205
|
)
|
(50
|
)
|
(734
|
)
|
(1,445
|
)
|
||||||||||||||||
|
Income (loss) before income taxes
|
(121
|
)
|
(167
|
)
|
(476
|
)
|
308
|
|
909
|
|
(50
|
)
|
(734
|
)
|
(331
|
)
|
|||||||||||||||
|
INCOME TAX BENEFIT (EXPENSE)
|
(150
|
)
|
—
|
|
—
|
|
—
|
|
210
|
|
—
|
|
—
|
|
60
|
|
|||||||||||||||
|
Consolidated net income (loss)
|
(271
|
)
|
(167
|
)
|
(476
|
)
|
308
|
|
1,119
|
|
(50
|
)
|
(734
|
)
|
(271
|
)
|
|||||||||||||||
|
Less: Net (income) loss – noncontrolling interest
|
—
|
|
46
|
|
—
|
|
—
|
|
(46
|
)
|
—
|
|
—
|
|
—
|
|
|||||||||||||||
|
Net income (loss)
|
$
|
(271
|
)
|
$
|
(121
|
)
|
$
|
(476
|
)
|
$
|
308
|
|
$
|
1,073
|
|
$
|
(50
|
)
|
$
|
(734
|
)
|
$
|
(271
|
)
|
|||||||
F- 56
CHARTER COMMUNICATIONS, INC. AND SUBSIDIARIES
NOTES TO CONSOLIDATED FINANCIAL STATEMENTS
DECEMBER 31, 2017, 2016 AND 2015
(dollars in millions, except share or per share data or where indicated)
|
Charter Communications, Inc.
|
|||||||||||||||||||||||
|
Condensed Consolidating Statement of Comprehensive Income
|
|||||||||||||||||||||||
|
For the year ended December 31, 2017
|
|||||||||||||||||||||||
|
Non-Guarantor Subsidiaries
|
Guarantor Subsidiaries
|
||||||||||||||||||||||
|
Charter
|
Intermediate Holding Companies
|
CCO Holdings
|
Charter Operating and Restricted Subsidiaries
|
Eliminations
|
Charter Consolidated
|
||||||||||||||||||
|
Consolidated net income
|
$
|
9,895
|
|
$
|
899
|
|
$
|
882
|
|
$
|
1,800
|
|
$
|
(3,361
|
)
|
$
|
10,115
|
|
|||||
|
Net impact of interest rate derivative instruments
|
5
|
|
5
|
|
5
|
|
5
|
|
(15
|
)
|
5
|
|
|||||||||||
|
Foreign currency translation adjustment
|
1
|
|
1
|
|
1
|
|
1
|
|
(3
|
)
|
1
|
|
|||||||||||
|
Consolidated comprehensive income
|
9,901
|
|
905
|
|
888
|
|
1,806
|
|
(3,379
|
)
|
10,121
|
|
|||||||||||
|
Less: Comprehensive income attributable to noncontrolling interests
|
—
|
|
(219
|
)
|
—
|
|
(1
|
)
|
—
|
|
(220
|
)
|
|||||||||||
|
Comprehensive income
|
$
|
9,901
|
|
$
|
686
|
|
$
|
888
|
|
$
|
1,805
|
|
$
|
(3,379
|
)
|
$
|
9,901
|
|
|||||
|
Charter Communications, Inc.
|
|||||||||||||||||||||||||||
|
Condensed Consolidating Statement of Comprehensive Income (Loss)
|
|||||||||||||||||||||||||||
|
For the year ended December 31, 2016
|
|||||||||||||||||||||||||||
|
Non-Guarantor Subsidiaries
|
Guarantor Subsidiaries
|
||||||||||||||||||||||||||
|
Charter
|
Intermediate Holding Companies
|
Safari Escrow Entities
|
CCO Holdings
|
Charter Operating and Restricted Subsidiaries
|
Eliminations
|
Charter Consolidated
|
|||||||||||||||||||||
|
Consolidated net income (loss)
|
$
|
3,522
|
|
$
|
1,073
|
|
$
|
(390
|
)
|
$
|
1,456
|
|
$
|
2,294
|
|
$
|
(4,210
|
)
|
$
|
3,745
|
|
||||||
|
Net impact of interest rate derivative instruments
|
8
|
|
8
|
|
—
|
|
8
|
|
8
|
|
(24
|
)
|
8
|
|
|||||||||||||
|
Foreign currency translation adjustment
|
(2
|
)
|
(2
|
)
|
—
|
|
(2
|
)
|
(2
|
)
|
6
|
|
(2
|
)
|
|||||||||||||
|
Consolidated comprehensive income (loss)
|
3,528
|
|
1,079
|
|
(390
|
)
|
1,462
|
|
2,300
|
|
(4,228
|
)
|
3,751
|
|
|||||||||||||
|
Less: Comprehensive income attributable to noncontrolling interests
|
—
|
|
(222
|
)
|
—
|
|
—
|
|
(1
|
)
|
—
|
|
(223
|
)
|
|||||||||||||
|
Comprehensive income (loss)
|
$
|
3,528
|
|
$
|
857
|
|
$
|
(390
|
)
|
$
|
1,462
|
|
$
|
2,299
|
|
$
|
(4,228
|
)
|
$
|
3,528
|
|
||||||
|
Charter Communications, Inc.
|
|||||||||||||||||||||||||||||||
|
Condensed Consolidating Statement of Comprehensive Income (Loss)
|
|||||||||||||||||||||||||||||||
|
For the year ended December 31, 2015
|
|||||||||||||||||||||||||||||||
|
Non-Guarantor Subsidiaries
|
Guarantor Subsidiaries
|
||||||||||||||||||||||||||||||
|
Charter
|
Intermediate Holding Companies
|
Safari Escrow Entities
|
CCO Holdings
|
Charter Operating and Restricted Subsidiaries
|
Unrestricted Subsidiary
|
Eliminations
|
Charter Consolidated
|
||||||||||||||||||||||||
|
Consolidated net income (loss)
|
$
|
(271
|
)
|
$
|
(167
|
)
|
$
|
(476
|
)
|
$
|
308
|
|
$
|
1,119
|
|
$
|
(50
|
)
|
$
|
(734
|
)
|
$
|
(271
|
)
|
|||||||
|
Net impact of interest rate derivative instruments
|
9
|
|
9
|
|
—
|
|
9
|
|
9
|
|
—
|
|
(27
|
)
|
9
|
|
|||||||||||||||
|
Consolidated comprehensive income (loss)
|
(262
|
)
|
(158
|
)
|
(476
|
)
|
317
|
|
1,128
|
|
(50
|
)
|
(761
|
)
|
(262
|
)
|
|||||||||||||||
|
Less: Comprehensive (income) loss attributable to noncontrolling interests
|
—
|
|
46
|
|
—
|
|
—
|
|
(46
|
)
|
—
|
|
—
|
|
—
|
|
|||||||||||||||
|
Comprehensive income (loss)
|
$
|
(262
|
)
|
$
|
(112
|
)
|
$
|
(476
|
)
|
$
|
317
|
|
$
|
1,082
|
|
$
|
(50
|
)
|
$
|
(761
|
)
|
$
|
(262
|
)
|
|||||||
F- 57
CHARTER COMMUNICATIONS, INC. AND SUBSIDIARIES
NOTES TO CONSOLIDATED FINANCIAL STATEMENTS
DECEMBER 31, 2017, 2016 AND 2015
(dollars in millions, except share or per share data or where indicated)
|
Charter Communications, Inc.
|
|||||||||||||||||||||||
|
Condensed Consolidating Statement of Cash Flows
|
|||||||||||||||||||||||
|
For the year ended December 31, 2017
|
|||||||||||||||||||||||
|
+
|
|||||||||||||||||||||||
|
Non-Guarantor Subsidiaries
|
Guarantor Subsidiaries
|
||||||||||||||||||||||
|
Charter
|
Intermediate Holding Companies
|
CCO Holdings
|
Charter Operating and Restricted Subsidiaries
|
Eliminations
|
Charter Consolidated
|
||||||||||||||||||
|
NET CASH FLOWS FROM OPERATING ACTIVITIES
|
$
|
159
|
|
$
|
187
|
|
$
|
(814
|
)
|
$
|
12,422
|
|
$
|
—
|
|
$
|
11,954
|
|
|||||
|
CASH FLOWS FROM INVESTING ACTIVITIES:
|
|||||||||||||||||||||||
|
Purchases of property, plant and equipment
|
—
|
|
—
|
|
—
|
|
(8,681
|
)
|
—
|
|
(8,681
|
)
|
|||||||||||
|
Change in accrued expenses related to capital expenditures
|
—
|
|
—
|
|
—
|
|
820
|
|
—
|
|
820
|
|
|||||||||||
|
Purchases of cable systems, net
|
—
|
|
—
|
|
—
|
|
(9
|
)
|
—
|
|
(9
|
)
|
|||||||||||
|
Real estate investments through variable interest entities
|
—
|
|
(105
|
)
|
—
|
|
—
|
|
—
|
|
(105
|
)
|
|||||||||||
|
Contribution to subsidiaries
|
(115
|
)
|
—
|
|
(693
|
)
|
—
|
|
808
|
|
—
|
|
|||||||||||
|
Distributions from subsidiaries
|
11,732
|
|
13,488
|
|
9,598
|
|
—
|
|
(34,818
|
)
|
—
|
|
|||||||||||
|
Other, net
|
—
|
|
—
|
|
—
|
|
(123
|
)
|
—
|
|
(123
|
)
|
|||||||||||
|
Net cash flows from investing activities
|
11,617
|
|
13,383
|
|
8,905
|
|
(7,993
|
)
|
(34,010
|
)
|
(8,098
|
)
|
|||||||||||
|
CASH FLOWS FROM FINANCING ACTIVITIES:
|
|||||||||||||||||||||||
|
Borrowings of long-term debt
|
—
|
|
—
|
|
6,231
|
|
19,045
|
|
—
|
|
25,276
|
|
|||||||||||
|
Repayments of long-term debt
|
—
|
|
—
|
|
(775
|
)
|
(15,732
|
)
|
—
|
|
(16,507
|
)
|
|||||||||||
|
Borrowings (repayments) loans payable - related parties
|
(234
|
)
|
—
|
|
—
|
|
234
|
|
—
|
|
—
|
|
|||||||||||
|
Payment for debt issuance costs
|
—
|
|
—
|
|
(59
|
)
|
(52
|
)
|
—
|
|
(111
|
)
|
|||||||||||
|
Purchase of treasury stock
|
(11,715
|
)
|
—
|
|
—
|
|
—
|
|
—
|
|
(11,715
|
)
|
|||||||||||
|
Proceeds from exercise of stock options
|
116
|
|
—
|
|
—
|
|
—
|
|
—
|
|
116
|
|
|||||||||||
|
Purchase of noncontrolling interest
|
—
|
|
(1,665
|
)
|
—
|
|
—
|
|
—
|
|
(1,665
|
)
|
|||||||||||
|
Distributions to noncontrolling interest
|
—
|
|
(151
|
)
|
—
|
|
(2
|
)
|
—
|
|
(153
|
)
|
|||||||||||
|
Contributions from parent
|
—
|
|
115
|
|
—
|
|
693
|
|
(808
|
)
|
—
|
|
|||||||||||
|
Distributions to parent
|
—
|
|
(11,732
|
)
|
(13,488
|
)
|
(9,598
|
)
|
34,818
|
|
—
|
|
|||||||||||
|
Other, net
|
—
|
|
—
|
|
—
|
|
(11
|
)
|
—
|
|
(11
|
)
|
|||||||||||
|
Net cash flows from financing activities
|
(11,833
|
)
|
(13,433
|
)
|
(8,091
|
)
|
(5,423
|
)
|
34,010
|
|
(4,770
|
)
|
|||||||||||
|
NET INCREASE (DECREASE) IN CASH AND CASH EQUIVALENTS
|
(57
|
)
|
137
|
|
—
|
|
(994
|
)
|
—
|
|
(914
|
)
|
|||||||||||
|
CASH AND CASH EQUIVALENTS, beginning of period
|
57
|
|
154
|
|
—
|
|
1,324
|
|
—
|
|
1,535
|
|
|||||||||||
|
CASH AND CASH EQUIVALENTS, end of period
|
$
|
—
|
|
$
|
291
|
|
$
|
—
|
|
$
|
330
|
|
$
|
—
|
|
$
|
621
|
|
|||||
F- 58
CHARTER COMMUNICATIONS, INC. AND SUBSIDIARIES
NOTES TO CONSOLIDATED FINANCIAL STATEMENTS
DECEMBER 31, 2017, 2016 AND 2015
(dollars in millions, except share or per share data or where indicated)
|
Charter Communications, Inc.
|
|||||||||||||||||||||||||||
|
Condensed Consolidating Statement of Cash Flows
|
|||||||||||||||||||||||||||
|
For the year ended December 31, 2016
|
|||||||||||||||||||||||||||
|
Non-Guarantor Subsidiaries
|
Guarantor Subsidiaries
|
||||||||||||||||||||||||||
|
Charter
|
Intermediate Holding Companies
|
Safari Escrow Entities
|
CCO Holdings
|
Charter Operating and Restricted Subsidiaries
|
Eliminations
|
Charter Consolidated
|
|||||||||||||||||||||
|
NET CASH FLOWS FROM OPERATING ACTIVITIES
|
$
|
(225
|
)
|
$
|
(36
|
)
|
$
|
(463
|
)
|
$
|
(711
|
)
|
$
|
9,476
|
|
$
|
—
|
|
$
|
8,041
|
|
||||||
|
CASH FLOWS FROM INVESTING ACTIVITIES:
|
|||||||||||||||||||||||||||
|
Purchases of property, plant and equipment
|
—
|
|
—
|
|
—
|
|
—
|
|
(5,325
|
)
|
—
|
|
(5,325
|
)
|
|||||||||||||
|
Change in accrued expenses related to capital expenditures
|
—
|
|
—
|
|
—
|
|
—
|
|
603
|
|
—
|
|
603
|
|
|||||||||||||
|
Purchases of cable systems, net
|
(26,781
|
)
|
(2,022
|
)
|
—
|
|
—
|
|
(7
|
)
|
—
|
|
(28,810
|
)
|
|||||||||||||
|
Contribution to subsidiaries
|
(1,013
|
)
|
(478
|
)
|
—
|
|
(437
|
)
|
—
|
|
1,928
|
|
—
|
|
|||||||||||||
|
Distributions from subsidiaries
|
24,552
|
|
26,899
|
|
—
|
|
5,096
|
|
—
|
|
(56,547
|
)
|
—
|
|
|||||||||||||
|
Change in restricted cash and cash equivalents
|
—
|
|
—
|
|
22,264
|
|
—
|
|
—
|
|
—
|
|
22,264
|
|
|||||||||||||
|
Other, net
|
—
|
|
—
|
|
—
|
|
—
|
|
(22
|
)
|
—
|
|
(22
|
)
|
|||||||||||||
|
Net cash flows from investing activities
|
(3,242
|
)
|
24,399
|
|
22,264
|
|
4,659
|
|
(4,751
|
)
|
(54,619
|
)
|
(11,290
|
)
|
|||||||||||||
|
CASH FLOWS FROM FINANCING ACTIVITIES:
|
|||||||||||||||||||||||||||
|
Borrowings of long-term debt
|
—
|
|
—
|
|
—
|
|
3,201
|
|
9,143
|
|
—
|
|
12,344
|
|
|||||||||||||
|
Repayments of long-term debt
|
—
|
|
—
|
|
—
|
|
(2,937
|
)
|
(7,584
|
)
|
—
|
|
(10,521
|
)
|
|||||||||||||
|
Borrowings (repayments) loans payable - related parties
|
—
|
|
(300
|
)
|
553
|
|
(71
|
)
|
(182
|
)
|
—
|
|
—
|
|
|||||||||||||
|
Payment for debt issuance costs
|
—
|
|
—
|
|
—
|
|
(73
|
)
|
(211
|
)
|
—
|
|
(284
|
)
|
|||||||||||||
|
Issuance of equity
|
5,000
|
|
—
|
|
—
|
|
—
|
|
—
|
|
—
|
|
5,000
|
|
|||||||||||||
|
Purchase of treasury stock
|
(1,562
|
)
|
—
|
|
—
|
|
—
|
|
—
|
|
—
|
|
(1,562
|
)
|
|||||||||||||
|
Proceeds from exercise of stock options
|
86
|
|
—
|
|
—
|
|
—
|
|
—
|
|
—
|
|
86
|
|
|||||||||||||
|
Settlement of restricted stock units
|
—
|
|
(59
|
)
|
—
|
|
—
|
|
—
|
|
—
|
|
(59
|
)
|
|||||||||||||
|
Purchase of noncontrolling interest
|
—
|
|
(218
|
)
|
—
|
|
—
|
|
—
|
|
—
|
|
(218
|
)
|
|||||||||||||
|
Distributions to noncontrolling interest
|
—
|
|
(96
|
)
|
—
|
|
—
|
|
—
|
|
—
|
|
(96
|
)
|
|||||||||||||
|
Proceeds from termination of interest rate derivatives
|
—
|
|
—
|
|
—
|
|
—
|
|
88
|
|
—
|
|
88
|
|
|||||||||||||
|
Contributions from parent
|
—
|
|
1,013
|
|
—
|
|
478
|
|
437
|
|
(1,928
|
)
|
—
|
|
|||||||||||||
|
Distributions to parent
|
—
|
|
(24,552
|
)
|
(22,353
|
)
|
(4,546
|
)
|
(5,096
|
)
|
56,547
|
|
—
|
|
|||||||||||||
|
Other, net
|
—
|
|
3
|
|
(1
|
)
|
—
|
|
(1
|
)
|
—
|
|
1
|
|
|||||||||||||
|
Net cash flows from financing activities
|
3,524
|
|
(24,209
|
)
|
(21,801
|
)
|
(3,948
|
)
|
(3,406
|
)
|
54,619
|
|
4,779
|
|
|||||||||||||
|
NET INCREASE IN CASH AND CASH EQUIVALENTS
|
57
|
|
154
|
|
—
|
|
—
|
|
1,319
|
|
—
|
|
1,530
|
|
|||||||||||||
|
CASH AND CASH EQUIVALENTS, beginning of period
|
—
|
|
—
|
|
—
|
|
—
|
|
5
|
|
—
|
|
5
|
|
|||||||||||||
|
CASH AND CASH EQUIVALENTS, end of period
|
$
|
57
|
|
$
|
154
|
|
$
|
—
|
|
$
|
—
|
|
$
|
1,324
|
|
$
|
—
|
|
$
|
1,535
|
|
||||||
F- 59
CHARTER COMMUNICATIONS, INC. AND SUBSIDIARIES
NOTES TO CONSOLIDATED FINANCIAL STATEMENTS
DECEMBER 31, 2017, 2016 AND 2015
(dollars in millions, except share or per share data or where indicated)
|
Charter Communications, Inc.
|
|||||||||||||||||||||||||||||||
|
Condensed Consolidating Statement of Cash Flows
|
|||||||||||||||||||||||||||||||
|
For the year ended December 31, 2015
|
|||||||||||||||||||||||||||||||
|
Non-Guarantor Subsidiaries
|
Guarantor Subsidiaries
|
||||||||||||||||||||||||||||||
|
Charter
|
Intermediate Holding Companies
|
Safari Escrow Entities
|
CCO Holdings
|
Charter Operating and Restricted Subsidiaries
|
Unrestricted Subsidiary
|
Eliminations
|
Charter Consolidated
|
||||||||||||||||||||||||
|
NET CASH FLOWS FROM OPERATING ACTIVITIES:
|
$
|
(1
|
)
|
$
|
(5
|
)
|
$
|
(192
|
)
|
$
|
(663
|
)
|
$
|
3,275
|
|
$
|
(55
|
)
|
$
|
—
|
|
$
|
2,359
|
|
|||||||
|
CASH FLOWS FROM INVESTING ACTIVITIES:
|
|||||||||||||||||||||||||||||||
|
Purchases of property, plant and equipment
|
—
|
|
—
|
|
—
|
|
—
|
|
(1,840
|
)
|
—
|
|
—
|
|
(1,840
|
)
|
|||||||||||||||
|
Change in accrued expenses related to capital expenditures
|
—
|
|
—
|
|
—
|
|
—
|
|
28
|
|
—
|
|
—
|
|
28
|
|
|||||||||||||||
|
Contribution to subsidiaries
|
(20
|
)
|
(90
|
)
|
—
|
|
(46
|
)
|
(24
|
)
|
—
|
|
180
|
|
—
|
|
|||||||||||||||
|
Distributions from subsidiaries
|
26
|
|
376
|
|
—
|
|
715
|
|
—
|
|
—
|
|
(1,117
|
)
|
—
|
|
|||||||||||||||
|
Change in restricted cash and cash equivalents
|
—
|
|
—
|
|
(18,667
|
)
|
—
|
|
—
|
|
3,514
|
|
—
|
|
(15,153
|
)
|
|||||||||||||||
|
Other, net
|
—
|
|
(55
|
)
|
—
|
|
—
|
|
(12
|
)
|
—
|
|
—
|
|
(67
|
)
|
|||||||||||||||
|
Net cash flows from investing activities
|
6
|
|
231
|
|
(18,667
|
)
|
669
|
|
(1,848
|
)
|
3,514
|
|
(937
|
)
|
(17,032
|
)
|
|||||||||||||||
|
CASH FLOWS FROM FINANCING ACTIVITIES:
|
|||||||||||||||||||||||||||||||
|
Borrowings of long-term debt
|
—
|
|
—
|
|
21,790
|
|
2,700
|
|
1,555
|
|
—
|
|
—
|
|
26,045
|
|
|||||||||||||||
|
Repayments of long-term debt
|
—
|
|
—
|
|
(3,500
|
)
|
(2,598
|
)
|
(1,745
|
)
|
(3,483
|
)
|
—
|
|
(11,326
|
)
|
|||||||||||||||
|
Borrowings (repayments) loans payable - related parties
|
—
|
|
—
|
|
581
|
|
(18
|
)
|
(563
|
)
|
—
|
|
—
|
|
—
|
|
|||||||||||||||
|
Payment for debt issuance costs
|
—
|
|
—
|
|
(12
|
)
|
(24
|
)
|
—
|
|
—
|
|
—
|
|
(36
|
)
|
|||||||||||||||
|
Purchase of treasury stock
|
(38
|
)
|
—
|
|
—
|
|
—
|
|
—
|
|
—
|
|
—
|
|
(38
|
)
|
|||||||||||||||
|
Proceeds from exercise of options and warrants
|
30
|
|
—
|
|
—
|
|
—
|
|
—
|
|
—
|
|
—
|
|
30
|
|
|||||||||||||||
|
Contributions from parent
|
—
|
|
95
|
|
—
|
|
15
|
|
46
|
|
24
|
|
(180
|
)
|
—
|
|
|||||||||||||||
|
Distributions to parent
|
—
|
|
(321
|
)
|
—
|
|
(81
|
)
|
(715
|
)
|
—
|
|
1,117
|
|
—
|
|
|||||||||||||||
|
Net cash flows from financing activities
|
(8
|
)
|
(226
|
)
|
18,859
|
|
(6
|
)
|
(1,422
|
)
|
(3,459
|
)
|
937
|
|
14,675
|
|
|||||||||||||||
|
NET INCREASE (DECREASE) IN CASH AND CASH EQUIVALENTS
|
(3
|
)
|
—
|
|
—
|
|
—
|
|
5
|
|
—
|
|
—
|
|
2
|
|
|||||||||||||||
|
CASH AND CASH EQUIVALENTS, beginning of period
|
3
|
|
—
|
|
—
|
|
—
|
|
—
|
|
—
|
|
—
|
|
3
|
|
|||||||||||||||
|
CASH AND CASH EQUIVALENTS, end of period
|
$
|
—
|
|
$
|
—
|
|
$
|
—
|
|
$
|
—
|
|
$
|
5
|
|
$
|
—
|
|
$
|
—
|
|
$
|
5
|
|
|||||||
F- 60
TABLE OF CONTENTS
Part IItem 1. BusinessItem 1A. Risk FactorsItem 1B. Unresolved Staff CommentsItem 2. PropertiesItem 3. Legal ProceedingsItem 4. Mine Safety DisclosuresPart IIItem 5. Market For Registrant S Common Equity, Related Stockholder Matters and Issuer Purchases Of Equity SecuritiesItem 6. Selected Financial DataItem 7. Management S Discussion and Analysis Of Financial Condition and Results Of OperationsItem 7A. Quantitative and Qualitative Disclosures About Market RiskItem 8. Financial Statements and Supplementary DataItem 9. Changes in and Disagreements with Accountants on Accounting and Financial DisclosureItem 9A. Controls and ProceduresItem 9B. Other InformationPart IIIItem 10. Directors, Executive Officers and Corporate GovernanceItem 11. Executive CompensationItem 12. Security Ownership Of Certain Beneficial Owners and Management and Related Stockholder MattersItem 13. Certain Relationships and Related Transactions, and Director IndependenceItem 14. Principal Accounting Fees and ServicesPart IVItem 15. Exhibits and Financial Statement Schedules