CITIZENS, INC.
10-Ks and 10-Qs
|
|
|
|
|
|
|
|
|
|
|
|
|
|
|
|
|
|
|
|
|
|
|
|
|
|
|
|
|
|
|
|
|
|
|
|
|
|
|
|
|
|
|
|
|
|
|
|
|
|
|
|
|
|
|
|
|
|
|
UNITED STATES
SECURITIES AND EXCHANGE COMMISSION
WASHINGTON D.C. 20549
FORM 10-K
ANNUAL REPORT PURSUANT TO SECTION 13 OR 15(D) OF THE
SECURITIES EXCHANGE ACT OF 1934
For the fiscal year ended
December 31, 2016
Commission File Number:
000-16509
CITIZENS, INC.
(
Exact Name of Registrant as Specified in Its Charter
)
|
Colorado
|
84-0755371
|
|
|
(State or other jurisdiction of incorporation or organization)
|
(I.R.S. Employer Identification No.)
|
|
|
400 East Anderson Lane, Austin, TX
|
78752
|
|
|
(Address of principal executive offices)
|
(Zip Code)
|
|
(512) 837-7100
(Registrant's telephone number, including area code)
Securities registered pursuant to Section 12(b) of the Act:
|
Title of Each Class
|
Name of Each Exchange on Which Registered
|
|
|
Class A Common Stock
|
New York Stock Exchange
|
|
Securities registered pursuant to Section 12(g) of the Act:
None
(Title of class)
Indicate by check mark if the registrant is a well-known seasoned issuer, as defined in Rule 405 of the Securities Act.
o
Yes
ý
No
Indicate by check mark if the registrant is not required to file reports pursuant to Section 13 or Section 15(d) of the Act.
o
Yes
ý
No
Indicate by check mark whether the registrant (1) has filed all reports required to be filed by Section 13 or 15(d) of the Securities Exchange Act of 1934 during the preceding 12 months (or for such shorter period that the registrant was required to file such reports), and (2) has been subject to such filing requirements for the past 90 days.
ý
Yes
o
No
Indicate by check mark whether the registrant has submitted electronically and posted on its corporate Web site, if any, every Interactive Data File required to be submitted and posted pursuant to Rule 405 of Regulation S-T (§232.405 of this chapter) during the preceding 12 months (or for such shorter period that the registrant was required to submit and post such files).
ý
Yes
o
No
Indicate by check mark if disclosure of delinquent filers pursuant to Item 405 of Regulation S-K (§229.405) is not contained herein, and will not be contained, to the best of registrant's knowledge in definitive proxy or information statements incorporated by reference in Part III of this Form 10-K or any amendment to this Form 10-K).
ý
Indicate by check mark whether the registrant is a large accelerated filer, an accelerated filer, a non-accelerated filer, or a smaller reporting company.
Large accelerated filer
o
Accelerated filer
ý
Non-accelerated filer
o
Smaller reporting company
o
Indicate by check mark whether the registrant is a shell company (as defined in Rule 12b-2 of the Act).
o
Yes
ý
No
As of
June 30, 2016
, the aggregate market value of the Class A common stock held by non-affiliates of the registrant was approximately
$348,812,199
.
Number of shares of common stock outstanding as of
April 19, 2017
.
Class A:
49,080,114
Class B:
1,001,714
DOCUMENTS INCORPORATED BY REFERENCE
Part III of this Report incorporates by reference certain portions of the definitive proxy materials to be delivered to stockholders in connection with the
2017
Annual Meeting of Shareholders.
THIS PAGE INTENTIONALLY LEFT BLANK

TABLE OF CONTENTS
|
PART I
|
|
Page
|
|
Item 1.
|
||
|
Item 1A.
|
||
|
Item 1B.
|
||
|
Item 2.
|
||
|
Item 3.
|
||
|
Item 4.
|
||
|
PART II
|
|
|
|
Item 5.
|
||
|
Item 6.
|
||
|
Item 7.
|
||
|
Item 7A.
|
||
|
Item 8.
|
||
|
Item 9.
|
||
|
Item 9A.
|
||
|
Item 9B.
|
||
|
PART III
|
|
|
|
Item 10.
|
||
|
Item 11.
|
||
|
Item 12.
|
||
|
Item 13.
|
||
|
Item 14.
|
||
|
PART IV
|
|
|
|
Item 15.
|
||
|
|
|
|
|
|
||
FORWARD-LOOKING STATEMENTS
Certain statements contained in this Annual Report on Form 10-K are not statements of historical fact and constitute forward-looking statements within the meaning of the federal securities laws, including, without limitation, statements specifically identified as forward-looking statements within this document. Many of these statements contain risk factors as well. In addition, certain statements in future filings by the Company with the Securities and Exchange Commission, in press releases, and in oral and written statements made by us or with the approval of the Company, which are not statements of historical fact, constitute forward-looking statements. Examples of forward-looking statements include, but are not limited to: (i) projections of revenues, income or loss, earnings or loss per share, the payment or non-payment of dividends, capital structure, and other financial items, (ii) statements of our plans and objectives by our management or Board of Directors, including those relating to products or services, (iii) statements of future economic performance and (iv) statements of assumptions underlying such statements. Words such as "believes," "anticipates," "assumes," "estimates," "plans," "projects," "could," "expects," "intends," "targeted," "may," "will" and similar expressions are intended to identify forward-looking statements, but are not the exclusive means of identifying such statements.
Forward-looking statements are subject to known and unknown risks, uncertainties and other factors that may cause actual results to differ materially from those contemplated by the forward-looking statements. Factors that could cause the Company's future results to differ materially from expected results include, but are not limited to:
|
•
|
Changes in the application, interpretation or enforcement of foreign insurance laws that impact our business, which derives the majority of its revenues from residents of foreign countries;
|
|
•
|
Potential changes in amounts reserved for in connection with the noncompliance of a portion of our insurance policies with Sections 7702 under the Internal Revenue Code, the failure of certain annuity contracts to qualify under Section 72(s) of the Internal Revenue Code and the anticipated timing of our filings with the IRS to address these matters;
|
|
•
|
Changes in foreign and U.S. general economic, market, and political conditions, including the performance of financial markets and interest rates;
|
|
•
|
Changes in consumer behavior or regulatory oversight, which may affect the Company's ability to sell its products and retain business;
|
|
•
|
The timely development of and acceptance of new products of the Company and perceived overall value of these products and services by existing and potential customers;
|
|
•
|
Fluctuations in experience regarding current mortality, morbidity, persistency and interest rates relative to expected amounts used in pricing the Company's products;
|
|
•
|
The performance of our investment portfolio, which may be adversely affected by changes in interest rates, adverse developments and ratings of issuers whose debt securities we may hold, and other adverse macroeconomic events;
|
|
•
|
Results of litigation we may be involved in;
|
|
•
|
Changes in assumptions related to deferred acquisition costs and the value of any businesses we may acquire;
|
|
•
|
Regulatory, accounting or tax changes that may affect the cost of, or the demand for, the Company's products or services;
|
|
•
|
Our concentration of business from persons residing in Latin America and the Pacific Rim;
|
|
•
|
Changes in tax laws;
|
|
•
|
Effects of acquisitions and restructuring, including possible difficulties in integrating and realizing the projected results of acquisitions;
|
|
•
|
Changes in statutory or U.S. Generally Accepted Accounting Principles ("U.S. GAAP"), policies or practices;
|
|
•
|
Changes in leadership among our board and senior management team.
|
|
•
|
Our success at managing risks involved in the foregoing; and
|
|
•
|
The risk factors discussed in "Part 1.-Item 1A- Risk Factors" of this report.
|
Such forward-looking statements speak only as of the date on which such statements are made, and the Company undertakes no obligation to update any forward-looking statement to reflect events or circumstances after the date on which such statement is made.
We make available, free of charge, through our Internet website (http://www.citizensinc.com), our Annual Report on Form 10-K, Quarterly Reports on Form 10-Q, Current Reports on Form 8-K, Section 16 Reports filed by officers and directors, news releases, and, if applicable, amendments to those reports filed or furnished pursuant to Section 13(a) or 15(d) of the Securities Exchange Act of 1934, as soon as reasonably practicable after we electronically file such reports with, or furnish such reports to, the Securities and Exchange Commission. We are not including any of the information contained on our website as part of, or incorporating it by reference into, this Annual Report on Form 10-K.
1
CITIZENS, INC. AND CONSOLIDATED SUBSIDIARIES
Item 1
. BUSINESS
Overview
Citizens, Inc. (“Citizens” or the "Company") is an insurance holding company incorporated in Colorado serving the life insurance needs of individuals in the United States since 1969 and internationally since 1975. Through our insurance subsidiaries, we pursue a strategy of offering traditional insurance products in niche markets where we believe we are able to achieve competitive advantages. We had approximately
$1.6 billion
of assets at December 31,
2016
and approximately
$4.5 billion
of insurance in force. Our core insurance operations include issuing and servicing:
|
•
|
U.S. Dollar-denominated ordinary whole life insurance and endowment policies predominantly sold to foreign residents, located principally in Latin America and the Pacific Rim, through independent marketing consultants;
|
|
•
|
ordinary whole life insurance policies to middle income households concentrated in the Midwest, Mountain West and southern United States through independent marketing consultants; and
|
|
•
|
final expense and limited liability property policies to middle and lower income households in Louisiana, Mississippi and Arkansas through employee and independent agents in our home service distribution channel and funeral homes.
|
We were formed in 1969 by our founder, Harold E. Riley. Prior to our formation, Mr. Riley had many years of experience in the international and domestic life insurance business. Historically, our Company has experienced growth through acquisitions in the domestic market and through organic market expansion in the international market. We strive to generate bottom line returns using knowledge of our niche markets and our well-established distribution channels.
Our business has grown, both internationally and domestically, in recent years, though our profitability has declined. From 2012 through
2016
, revenues rose 21% from
$202.8 million
in
2012
to
$245.4 million
in
2016
. During that same period, our assets grew 35% from
$1,171.8 million
to
$1,583.7 million
. During this same period, our net income declined 61% from
$4.9 million
to
$2.0 million
, primarily as a result of other than temporary impairments ("OTTI"), expense related to an additional tax liability contingency and higher consulting and legal costs as we proactively addressed the tax liability contingency and undertook an assessment of our business model and strategies. See Item 6. "Selected Financial Data" and Item 7. "Management's Discussion and Analysis of Financial Condition and Results of Operations" in this Report.
Recent Board of Directors and Officer Changes
See Strategic Initiatives below for initiatives that the Company, its Board of Directors (the “Board”) and the executive management team initiated in 2016 and will continue to pursue in 2017.
On June 8, 2016, the Board appointed independent Board member Dr. Robert Sloan, as non-executive Chairman. Dr. Sloan succeeded Rick Riley who became Chairman of the Board in June 2015. Kay Osbourn, Citizens’ President at that time and former Chief Financial Officer, was also unanimously appointed by the Board as interim CEO.
On June 24, 2016, Rick Riley announced his retirement as a Citizens, Inc. employee and his resignation from the Board.
On July 14, 2016, independent director Dr. Terry Maness was elected Chairman of the Audit Committee (the “Audit Committee”) of the Board by the other members of the Audit Committee, succeeding Tim Timmerman who resigned as a director and Chairman of the Audit Committee.
On November 7, 2016, the Company's Board unanimously appointed Geoff Kolander as Chief Executive Officer. Mr. Kolander, joined Citizens in 2006 as General Counsel and most recently had served as Chief Legal Officer and head of Corporate Strategy. The Board also confirmed that Kay Osbourn would continue to serve as the Company's President.
On February 1, 2017, the Company announced the appointment of Terry Festervand, as Chief Operating Officer.
On February 22, 2017, the Company announced the appointment of Gerald W. Shields to fill the open Board seat vacated by former Chairman and Chief Executive Officer Rick D. Riley. Mr. Shields joins the Board with over 37 years of technology experience, including significant life insurance experience as the Senior Vice President and Chief Information Officer of AFLAC, Inc., a leading provider of supplemental insurance. During the last five years, Mr. Shields has served as Director of the IT practice at RE
2
CITIZENS, INC. AND CONSOLIDATED SUBSIDIARIES
Nolan, a management-consulting firm that caters to the insurance, health care, technology, and banking industries. He also currently serves as the Chief Information Officer of FirstCare Health Plans, a provider of comprehensive health care services to health maintenance organization (HMO) subscribers that also owns Southwest Life & Health Insurance Company which offers the FirstCare PPO and life insurance products. Mr. Shields brings to the Board expertise in technology, cybersecurity and insurance operating systems, having significant experience directing these areas throughout his career.
On February 27, 2017, the Company announced the appointment of Frank Keating as a director. Governor Keating is a partner at the law firm of Holland & Knight, LLP. Governor Keating has held significant leadership positions in both the public and private sectors. In addition to serving as Governor of Oklahoma, his career included serving as CEO of the American Bankers Association and prior to that President and CEO of the American Council of Life Insurers, the trade association for the life insurance and retirement security industry. He also has served as Assistant Secretary of the Treasury and Associate Attorney General under President Ronald Reagan. He was later General Counsel and Acting Deputy Secretary for the Department of Housing and Urban Development (HUD) under President George H.W. Bush. During his tenure at the Treasury Department and HUD, he worked on significant issues affecting the banking, insurance and the financial services industries. His law enforcement career included serving as the U.S. Attorney for the Northern District of Oklahoma and as an FBI agent.
Strategic Initiatives
The Company's Board of Directors and new executive management team are assessing the Company's domestic and international business models and business strategies with the assistance and support of external consultants and advisors. Specifically, we are evaluating the Company's international business model and considering potential options, the current economic and regulatory environment and sustainable business objectives. Incorporated in our business model review are analyses of (1) new products and our profitability; (2) a potential restructuring of our international business and operations; (3) potential upgrades to our technology systems and operations with a strategic focus on our future business needs and cyber risk; and (4) potential additions to our executive management structure, personnel needs and further compensation incentives.
A prolonged low interest rate period has required us to revisit the benefits and dividends included under many policies offered internationally. In many cases, policyholders stand to benefit from significantly higher guarantees and dividends under our policies than the financial markets might otherwise offer. As such, the Company cut discretionary dividends on existing policies in 2016 and created new policies sold internationally to better reflect the prolonged low interest rate environment that we face.
The Company reviews its investment strategies on a quarterly basis for premiums received in order to augment its rate of return. By combining more conservative interest rate features in our insurance policies with a more diversified investment strategy to improve returns on our investment portfolio, we intend to grow bottom line returns to shareholders. There is risk that these changes will result in lower demand for new policies, or that the financial markets will make our investment strategy more difficult. Despite the risks, the Company believes that such strategies are in the best interest of our shareholders.
The following pages describe the operations of our three business segments: Life Insurance, Home Service and Other Non-Insurance Enterprises. Revenues derived from any single customer did not exceed 10% of consolidated revenues in any of the last three years. For more information about the financial performance of our business segments, see “Note 8 - Segment and Other Operating Information” of the "Notes to Consolidated Financial Statements."
Life Insurance
Our Life Insurance segment issues ordinary whole life insurance in the United States and in U.S. Dollar-denominated amounts to foreign residents. These contracts are designed to provide a fixed amount of insurance coverage over the life of the insured and can utilize rider benefits to provide additional increasing or decreasing coverage and annuity benefits to enhance accumulations. Additionally, endowment contracts are issued by the Company, which are principally accumulation contracts that incorporate an element of life insurance protection. For the majority of our business, we retain the first $100,000 of risk on any one life, reinsuring the remainder of the risk. We operate this segment through our subsidiaries: CICA Life Insurance Company of America ("CICA") and Citizens National Life Insurance Company ("CNLIC").
3
CITIZENS, INC. AND CONSOLIDATED SUBSIDIARIES
International Sales
We focus our sales of U.S. Dollar-denominated ordinary whole life insurance and endowment policies to residents in Latin America and the Pacific Rim. As of
December 31, 2016
, we had insurance policies in force in approximately 30 countries, including Venezuela, Colombia, Taiwan, Ecuador and Brazil as our top producing countries. In
2016
, international direct premiums comprised approximately 73% of our total direct premiums, and exceeded 10% of our premiums for each of the last three years. We have participated in the foreign marketplace since 1975. We believe positive attributes of our international insurance business include:
|
•
|
larger face amount policies typically issued when compared to our U.S. operations, which results in lower administrative costs per unit of coverage;
|
|
•
|
premiums typically paid annually rather than monthly or quarterly, which saves us administrative expenses, accelerates cash flow and results in lower policy lapse rates than premiums with more frequently scheduled payments; and
|
|
•
|
persistency experience and mortality rates that are comparable to our U.S. policies.
|
We have implemented several policies and procedures to limit the risks of asset and premium loss relating to our international business. Approvals for policy issuance are made in our Austin, Texas office and policies are issued and delivered to the independent consultants, who deliver the policies to the insureds. We have no offices, employees or assets outside of the United States. Insurance policy applications and premium payments are submitted by the independent consultants or customers to us, and we review the applications in our home offices in Austin, Texas. Premiums are paid in U.S. Dollars by check, wire or credit card. The policies we issue contain limitations on benefits for certain causes of death, such as homicide. We have also developed disciplined underwriting criteria, which include medical reviews of applicants as well as background and reference checks. In addition, we have a claims policy that requires investigation of substantially all death claims. Furthermore, we perform background reviews and reference checks of prospective independent marketing firms and consultants.
Our independent marketing firms and consultants specialize in marketing life insurance products and generally have several years of insurance marketing experience. We maintain contracts with the independent marketing firms pursuant to which they provide recruitment, training and supervision of their managers and associates in the service and placement of our products; however, all associates of these firms also contract directly with us as independent contractors and receive their compensation directly from us. Accordingly, should an arrangement between any independent marketing firm and us be terminated for any reason, we expect that we would seek to continue with the existing marketing arrangements with the associates of these firms. Our agreements with independent marketing firms and consultants typically provide that they are independent contractors responsible for their own operation expenses and are the representative of the prospective insured. In addition, the marketing firms guarantee any debts of their associates to us. The marketing firms receive commissions on all new and renewal policies serviced or placed by them or their associates. All of these contracts provide that the independent marketing firms and consultants are aware of and responsible for compliance with local laws.
International Products
We offer several ordinary whole life insurance and endowment products designed to meet the needs of our non-U.S. policyowners. These policies have been structured to provide:
|
•
|
U.S. Dollar-denominated cash values that accumulate to a policyholder during his or her lifetime;
|
|
•
|
premium rates that are competitive with or better than most foreign local companies;
|
|
•
|
a hedge against local currency inflation;
|
|
•
|
protection against devaluation of foreign currency;
|
|
•
|
capital investment in a more secure economic environment (i.e., the United States); and
|
|
•
|
lifetime income guarantees for an insured or for surviving beneficiaries.
|
Our international products have living benefit features. Every policy contains guaranteed cash values and is participating (i.e., provides for cash dividends as apportioned by the board of directors). Once a policyowner pays the annual premium and the policy is issued, the owner becomes entitled to a cash dividend as well as an annual guaranteed endowment, if elected. The policyowner has several options with regard to the dividend and annual guaranteed endowments, including the right to assign policy values to the Citizens, Inc. Stock Investment Plan, registered under the Securities Act of 1933 (the "Securities Act"), and administered in the United States by Computershare, our plan administrator and transfer agent.
4
CITIZENS, INC. AND CONSOLIDATED SUBSIDIARIES
International Competition
The life insurance business is highly competitive. We compete with a large number of stock and mutual life insurance companies internationally and domestically, as well as with financial institutions that offer insurance products. There are more than 800 life insurance companies in the United States, some of which also provide insurance to foreign residents.
We face competition primarily from companies formed and operated in the country in which the insureds reside, from companies that operate in the same manner as we do and from companies that are foreign to the countries in which policies are sold, but issue insurance policies denominated in the local currency of those countries. A substantial number of companies may be deemed to have a competitive advantage over us due to their significantly greater financial resources, histories of successful operations and larger marketing forces.
Because premiums on our international policies are paid in U.S. Dollars, and we pay claims and benefits in U.S. Dollars, we provide a product that is different from the products offered by foreign-domiciled companies. We believe our international policies are usually acquired by individuals in the upper middle class in their countries and those with significant net worth and earnings that place them in the upper income brackets of their respective countries. The policies sold by our foreign competitors are generally offered broadly and are priced using the mortality of the entire population of the geographic region. Our mortality charges are therefore typically lower, which provides a competitive advantage. Additionally, the assets backing the reserves for our foreign competitors' policies must be substantially invested in their respective countries and, therefore, are exposed to the inflationary risks and social or economic crises that have been more common in these foreign countries.
Domestic Sales
In
2016
, domestic direct premiums comprised approximately 27% of our total direct premiums. The majority of our domestic inforce business results from blocks of business of insurance companies we have acquired over the past 18 years. Our acquisition transition strategy focuses on the introduction of our cash accumulation ordinary whole life products to independent agents associated with companies we have acquired, while continuing to service the needs of acquired policyholders.
In the Mountain West, Midwest and the southern United States, we seek to serve middle-income households through the sale of cash accumulation ordinary whole life insurance products. Our distribution strategy is through independent agents. Over the past few years, new product sales have been modest while existing policies have been running off at a greater pace compressing the block of insurance in force.
Domestic Life Insurance Products
Our domestic life insurance products focus primarily on living needs and provide benefits focused toward accumulating money for the policyowner. The features of our domestic life insurance products include:
|
•
|
cash accumulation/living benefits;
|
|
•
|
tax-deferred interest earnings;
|
|
•
|
guaranteed lifetime income options;
|
|
•
|
monthly income for surviving family members;
|
|
•
|
accidental death benefit coverage options; and
|
|
•
|
an option to waive premium payments in the event of disability.
|
Our life insurance products are principally designed to address the insured's concern about outliving his or her monthly income, while at the same time providing death benefits. The primary purpose of our product portfolio is to help the insured create capital for needs such as retirement income, children's higher education funds, business opportunities, emergencies and health care needs.
Domestic Competition
The U.S. life insurance industry is a mature industry that, in recent years, has experienced little to no growth. Competition is intense because the life insurance industry is consolidating, with larger, more efficient and more effective organizations emerging from consolidation.
Many domestic life insurance companies have significantly greater financial, marketing forces and other resources, longer business histories and more diversified lines of insurance products than we do. We also face competition from companies marketing in
5
CITIZENS, INC. AND CONSOLIDATED SUBSIDIARIES
person as well as with direct mail and Internet sales campaigns. Although we may be at a competitive disadvantage to these entities, we believe our premium rates and policy features are generally competitive with those of other life insurance companies selling similar types of ordinary whole life insurance.
As of January 1, 2017, we have discontinued sales of all of our domestic life insurance products that are not compliant with Section 7702 of the Internal Revenue Code. Sales of these domestic life insurance products are not material to premium income. We are currently developing compliant products to be sold in the domestic market.
Domestic Home Service Insurance
Our domestic Home Service segment operates in this market through our subsidiaries Security Plan Life Insurance Company ("SPLIC"), Magnolia Guaranty Life Insurance Company ("MGLIC") and Security Plan Fire Insurance Company ("SPFIC"), and focuses on the life insurance needs of the middle and lower income markets, primarily in Louisiana, Mississippi and Arkansas. Our policies are sold and serviced through a home service marketing distribution system of approximately
333
employee-agents who work on a route system and through over
286
funeral homes and independent agents to sell policies, collect premiums and service policyholders. To a lesser extent, our Home Service segment sells limited-liability, named peril property policies covering dwelling and contents. In
2016
, our Home Service segment comprised 24%, or $47.5 million of our total direct premiums.
Home Service Products and Competition
Our home service insurance products consist primarily of small face amount ordinary whole life and pre-need policies, which are designed to fund final expenses for the insured, primarily consisting of funeral and burial costs. The average life insurance policy face amount issued was approximately
$6,600
in
2016
; therefore, the underwriting performed on these applications is limited. Our property coverages are limited to
$30,000
maximum coverage on any one dwelling and contents, while content-only coverage and dwelling-only coverage is limited to
$20,000
. We face competition in Louisiana, Mississippi and Arkansas from other companies specializing in home service distribution of insurance. We seek to compete based upon our emphasis on personal service to our customers. We intend to continue premium growth within this segment via direct sales and acquisitions.
Other Non-Insurance Enterprises
Other Non-insurance Enterprises includes Computing Technology, Inc., which provides data processing services to the Company, and Insurance Investors, Inc., which provides aviation transportation to the Company, though the Company-owned airplane is not being used and is for sale. This segment also includes the results of Citizens, Inc., the parent Company.
Operations and Technology
Our administrative operations principally serve our life insurance segment and are conducted primarily at our executive offices in Austin, Texas through approximately
134
administrative, operating and underwriting personnel. Our Home Service operations are conducted to a large degree from our district offices in Louisiana, Arkansas and Mississippi, as well as our service center in Donaldsonville, Louisiana. At our executive offices, we also perform policy design, marketing oversight, underwriting, accounting and reporting, actuarial, customer service, claims processing, administrative and investing activities.
We have a single integrated system for our entire Company, which is a centrally-controlled, mainframe-based administrative system. Functions of our policy administrative system include policy set up, administration, billing and collections, commission calculation, valuation, automated data edits, storage backup, image management and other related functions. Each company we acquire is ultimately converted onto our administrative system. This system has been in place for more than 30 years and has been updated on an ongoing basis, as technology has evolved.
We are currently reviewing technology options to transition from our legacy administration system to an upgraded, modernized technology platform that will service our needs into the future. On February 1, 2017, we went live with a modernized claims system. We are also currently converting our actuarial valuation from a third party service provider to an actuarial valuation modeling software system purchased from a vendor.
Enterprise Risk Management
The Company has an enterprise risk management function (“ERM”) that is charged with providing analyses of the Company’s risks on an individual and aggregated basis and with ensuring that the Company’s risks remain within its risk appetite and tolerances.
6
CITIZENS, INC. AND CONSOLIDATED SUBSIDIARIES
The Company's focus on ERM strengthens its risk management culture and discipline. The mission of ERM is to support the Company in achieving its strategic priorities by:
|
•
|
Providing a comprehensive view of the risks facing the Company, including risk concentrations and correlations;
|
|
•
|
Helping management define the Company’s overall capacity and appetite for risk by evaluating the risk return profile of the business relative to the Company’s strategic intent and financial underpinning;
|
|
•
|
Assisting management in setting specific risk tolerances and limits that are measurable, actionable, and comply with the Company’s overall risk philosophy;
|
|
•
|
Communicating and monitoring the Company’s risk exposures relative to set limits and recommending, or implementing as appropriate, mitigating strategies; and
|
|
•
|
Providing insight to assist in growing the businesses and achieving optimal risk-adjusted returns within established guidelines.
|
Enterprise Risk Management Structure and Governance
Effective risk oversight is an important priority for the Company’s Board of Directors and senior management team. While it is the job of the CEO and senior management to assess and manage the Company’ risk exposure through ERM, in accordance with NYSE requirements, the Audit Committee of the Board of Directors is charged with discussing guidelines and policies to govern the process by which ERM is handled. The Audit Committee periodically discusses the Company’s major financial risk exposures and the steps management has taken to monitor and control such exposures.
The categories of risk exposures assessed and managed by senior management include, but are not limited to:
|
•
|
Market risk, including credit, interest rate, equity market, and foreign exchange;
|
|
•
|
Liquidity and capital requirements of the Company;
|
|
•
|
Insurance risks, including those arising out of catastrophes and acts of terrorism;
|
|
•
|
International business risks;
|
|
•
|
Legal and regulatory compliance risks;
|
|
•
|
Cybersecurity risk; and
|
|
•
|
Any other risk that poses a material threat to the strategic viability of the Company.
|
In addition to the Audit Committee, the Compensation Committee considers the risks and rewards that may be implicated by our executive compensation philosophy and programs, and the Nominating and Corporate Governance Committee oversees the Company’s governance practices, director succession and committee composition and leadership to manage risks associated with corporate governance. Although risk oversight is conducted primarily through committees of the Board, the full Board has retained responsibility for general oversight of risks. The Board satisfies this responsibility through full reports by each committee chair regarding the committees’ considerations and actions, as well as through regular reports directly from officers responsible for oversight of particular risks within the Company.
Regulation
Our U.S. insurance operations are subject to a wide variety of laws and regulations. State insurance laws establish supervisory agencies with broad regulatory authority to regulate most aspects of our U.S. insurance businesses, and our insurance subsidiaries are regulated by the insurance departments of each state in which they are licensed. In addition, U.S. laws, such as the USA Patriot Act of 2001, the Foreign Corrupt Practices Act (“FCPA”), the Gramm-Leach-Bliley Act of 1999, the International Money Laundering Abatement and Financial Anti-Terrorism Act of 2001, the Sarbanes-Oxley Act of 2002 and the Dodd-Frank Wall Street Reform and Consumer Protection Act ("the Dodd-Frank Act"), are examples of U.S. regulations that affect our business. We are subject to comprehensive regulations under the USA Patriot Act and the Bank Secrecy Act with respect to money laundering, as well as federal regulations regarding privacy and confidentiality. Our insurance products and thus our businesses also are affected by U.S. federal, state and local tax laws. The Dodd-Frank Act focuses on financial reform and has resulted in changes to the regulation of institutions operating in the financial services industry, including the Company. Its requirements include streamlining the state-based regulation of reinsurance and non-admitted insurance (also known as surplus lines insurance, which is property or casualty insurance written by a company that is not licensed to sell policies of insurance in a given state) and establishing a new Federal Insurance Office within the U.S. Department of the Treasury with powers over all lines of insurance except health insurance, certain long-term care insurance and crop insurance. The Federal Insurance Office is authorized to, among other things, gather data and information to monitor aspects of the insurance industry, identify issues in the regulation of insurers about insurance matters and preempt state insurance measures under certain circumstances. The Dodd-Frank Act calls for numerous studies and
7
CITIZENS, INC. AND CONSOLIDATED SUBSIDIARIES
significant rulemaking across numerous federal agencies, some of which has been implemented. The rulemaking process going forward may change with the new presidential administration. We are currently unable to determine the ultimate impact of the Dodd-Frank Act on our business, results of operations, liquidity and capital resources.
The purpose of the laws and regulations that affect our insurance business is primarily to protect our insureds and not our stockholders. Many of the laws and regulations to which we are subject are regularly re-examined, and existing or future laws and regulations may become more restrictive or otherwise adversely affect our operations. In addition, insurance regulatory authorities (including state law enforcement agencies and attorneys general) periodically make inquiries and regularly conduct examinations regarding compliance by us and our subsidiaries with insurance, and other laws and regulations regarding the conduct of our insurance businesses. We cooperate with such inquiries and examinations and take corrective action when warranted.
Our insurance subsidiaries are collectively licensed to transact business in
32
states. We have insurance subsidiaries domiciled in the states of Colorado, Louisiana, Mississippi and Texas. Our U.S. insurance subsidiaries are licensed and regulated in all U.S. jurisdictions in which they conduct insurance business. The extent of this regulation varies, but most jurisdictions have laws and regulations based upon the National Association of Insurance Commissioners (“NAIC”) model rules governing the financial condition of insurers, including standards of solvency, types and concentration of investments, establishment and maintenance of reserves, credit for reinsurance and requirements of capital adequacy, and the business conduct of insurers, including marketing and sales practices and claims handling. In addition, statutes and regulations usually require the licensing of insurers and their agents, the approval of policy forms and related materials and the approval of rates for certain types of insurance products.
All U.S. jurisdictions in which our U.S. insurance subsidiaries conduct insurance business have enacted legislation that requires each U.S. insurance company in a holding company system, except captive insurance companies, to register with the insurance regulatory authority of its jurisdiction of domicile and to furnish that regulatory authority financial and other information concerning the operations of, and the interrelationships and transactions among, companies within its holding company system that may materially affect the operations, management or financial condition of the insurers within the system. These laws and regulations also regulate transactions between insurance companies and their parents and affiliates. Generally, these laws and regulations require that all transactions within a holding company system between an insurer and its affiliates be fair and reasonable and that the insurer's statutory capital and surplus following any transaction with an affiliate be both reasonable in relation to its outstanding liabilities and adequate to its financial needs. Statutory surplus is the excess of admitted assets over the sum of statutory liabilities and capital. For certain types of agreements and transactions between an insurer and its affiliates, these laws and regulations require prior notification to, and non-disapproval or approval by, the insurance regulatory authority of the insurer's jurisdiction of domicile.
Generally, all foreign countries in which we offer insurance products require a license or other authority to conduct insurance business in that country. Some of these countries also require that local regulatory authorities approve the terms of any insurance product sold to residents of that country. We have never qualified to do business in any foreign country and have never submitted our insurance policies issued to residents of foreign countries for approval by any foreign or domestic insurance regulatory agency. We sell our policies to residents of foreign countries using foreign independent marketing firms and independent consultants, and we rely on our independent consultants to comply with laws applicable to them in marketing our insurance products in their respective countries. We have undertaken a comprehensive compliance review of risks associated with the potential application of foreign laws to our sales of insurance policies in foreign countries. The application of foreign laws to our sales of insurance policies in foreign countries varies by country. There is a lack of uniform regulation, lack of clarity in certain regulations and lack of legal precedent in addressing circumstances similar to ours. The preliminary results of our compliance review have confirmed the previously disclosed risks related to foreign insurance laws associated with our current business model, at least in certain jurisdictions, as described in detail in “Item 1A - Risk Factors - Risks Relating to our Business.” Depending on the ultimate outcome of our ongoing compliance review, we may explore alternatives to our current business model in one or more jurisdictions, including withdrawing from a particular market. We cannot assure you that any of these laws, regulations, or application of them by foreign regulatory authorities, or any change in our business model, will not have a material adverse effect on our ability to market our products through our independent marketing consultants and, in turn, on our results of operations and financial condition.
The payment of dividends or other distributions to us by our insurance subsidiaries is regulated by the insurance laws and regulations of their respective states of domicile. The laws and regulations of some of these jurisdictions also prohibit an insurer from declaring or paying a dividend except out of its earned surplus or require the insurer to obtain regulatory approval before it may do so. In addition, insurance regulators may prohibit the payment of ordinary dividends or other payments by our insurance subsidiaries to us (such as a payment under a tax sharing agreement or for employee or other services) if they determine such payment could be adverse to policyholders or insurance contract holders of the subsidiary.
8
CITIZENS, INC. AND CONSOLIDATED SUBSIDIARIES
The laws and regulations of the jurisdictions in which our U.S. insurance subsidiaries are domiciled require that a controlling party obtain the approval of the insurance commissioner of the insurance company's jurisdiction of domicile prior to acquiring control of the insurer and may delay, deter or prevent a transaction our shareholders might consider desirable.
Risk-based capital ("RBC") requirements are imposed on life and property and casualty insurance companies. The NAIC has established minimum capital requirements in the form of RBC. RBC factors the type of business written by an insurance company, the quality of its assets, and various other aspects of an insurance company's business to develop a minimum level of capital called "authorized control level risk-based capital" and compares this level to adjusted statutory capital that includes capital and surplus as reported under statutory accounting principles, plus certain investment reserves. Should the ratio of adjusted statutory capital to control level risk-based capital fall below 200%, a series of actions by the affected company would begin.
Potential Changes in Regulation
Government actions under the new presidential administration and congress could significantly impact the regulations to which we are subject. As part of a comprehensive reform of financial services regulation known as the Dodd-Frank Act, Congress established an office within the federal government to collect information about the insurance industry, recommend standards, and represent the United States in dealing with foreign insurance regulators. There can be no assurances under the new presidential administration that the Dodd-Frank Act will remain intact in part or in whole and as such, we cannot predict the impact that potential changes could have on the insurance industry and the Company.
Item 1A.
RISK FACTORS
Investing in our Company involves certain risks.
Set forth below are certain risks with respect to our Company. Readers should carefully review these risks, together with the other information contained in this report. The risks and uncertainties we have described in this report are not the only ones we face. Additional risks and uncertainties not presently known to us, or that we currently deem not material, may also adversely affect our business. Any of the risks discussed in this report or that are presently unknown or not material, if they were to actually occur, could result in a significant adverse impact on our business, operating results, prospects or financial condition. References in the risk factors below to "we," "us," "our," "Citizens" and like terms relate to Citizens, Inc. and its subsidiaries on a U.S. GAAP consolidated financial statement basis, unless specifically identified otherwise. We operate our subsidiaries as separate and distinct entities with respect to corporate formalities.
Risks Relating to Our Business
The majority of our sales derive from residents of foreign countries and are subject to risks associated with political instability, currency control laws and foreign insurance laws. A significant loss of sales in these foreign markets could have a material adverse effect on our results of operations and financial condition.
The majority of our direct premiums, approximately 73% in 2016, are from foreign countries, primarily those in Latin America and the Pacific Rim. These sales are made through independent consultants who are located in these foreign countries. Many of these countries have a history of political instability, including regime changes, political uprisings, currency fluctuations and anti-democratic or anti-U.S. policies. There is a risk that political instability in these countries could have a material adverse effect on the ability of people living in these countries to purchase our insurance policies or our ability to sell our policies in those countries through our independent consultants or otherwise. Our Company’s future sales and financial results depend upon avoiding significant regulatory restraints on receiving insurance policy applications and premiums from, and issuing insurance policies to, residents outside of the United States.
Currency control laws or other currency exchange restrictions in foreign countries could materially adversely affect our revenues by imposing restrictions on asset transfers outside of a country where our insureds reside. Difficulties in transferring funds from or converting currencies to U.S. dollars in certain countries could prevent our insureds in those countries from purchasing or paying premiums on our policies. There can be no assurance that such restrictions will not be imposed and that our revenues, results of operations and financial condition will not be materially adversely affected if they do occur.
We also face risks associated with the application of foreign laws to our sales of policies to residents in foreign countries. Generally, all foreign countries in which we offer insurance products require a license or other authority to conduct insurance business in that country. Some of these countries also require that local regulatory authorities approve the terms of any insurance product sold to residents of that country. We have never sought to qualify to do business in any foreign country and have never submitted the insurance policies that we issue to residents of foreign countries for approval by any foreign or domestic insurance regulatory
9
CITIZENS, INC. AND CONSOLIDATED SUBSIDIARIES
agency. Traditionally, we have sought to address risks associated with the potential application of foreign laws to our sales of insurance policies in our foreign markets by, among other things, not locating any of our offices or assets in foreign countries, selling policies only through independent consultants rather than our own employees, requiring that all applications for insurance be submitted to and accepted only in our offices in the U.S., and requiring that policy premiums be paid to us only in U.S. Dollars. We rely on our independent consultants to comply with laws applicable to them in marketing our insurance products in their respective countries.
We have undertaken a comprehensive compliance review of risks associated with the potential application of foreign laws to our sales of insurance policies in foreign countries. The application of foreign laws to our sales of insurance policies in foreign countries varies by country. There is a lack of uniform regulation, lack of clarity in certain regulations and lack of legal precedent addressing circumstances similar to ours. The preliminary results of our compliance review have confirmed the previously disclosed risks related to foreign insurance laws associated with our current business model, at least in certain foreign countries. There are risks that a foreign government could determine under its existing laws that its residents may not purchase life insurance from us unless we become qualified to do business in that country or unless our policies purchased by its residents receive prior approval from its insurance regulators. There also is a risk that foreign regulators may become more aggressive in enforcing any perceived violations of their laws and seek to impose monetary fines, criminal penalties, and/or order us to cease our sales in that jurisdiction. There is no assurance that, if a foreign country were to deem our sales of policies in that country to require that we qualify to do business in that country or submit our policies for approval by that country’s regulatory authorities, we would be able to, or would conclude that it is advisable to, comply with those requirements. Any determination by a foreign country that we or our policy sales are subject to regulation under their laws, or any actions by a foreign country to enforce such laws more aggressively, could therefore have a material adverse effect on our ability to sell policies in that country and, in turn, on our results of operations and financial condition. Depending on the ultimate outcome of our compliance review, we may explore alternatives to our current business model in one or more jurisdictions, including withdrawing from a particular market.
Any disruption to the marketing and sale of our policies to residents of a foreign country, resulting from the action of foreign regulatory authorities or otherwise, could have a material adverse effect on our results of operations and financial condition.
Our operating results and financial condition may be affected if the liabilities actually incurred differ, or if our estimates of those liabilities change, from the amounts we have reserved for in connection with the noncompliance of a portion of our life insurance policies with Section 7702 of the Internal Revenue Code and the failure of certain annuity contracts to qualify under Section 72(s) of the Internal Revenue Code.
We previously announced that we determined that a portion of the life and annuity insurance policies issued by our subsidiary insurance companies failed to qualify for the favorable U.S. federal income tax treatment afforded by Sections 7702 and 72(s) of the Internal Revenue Code ("IRC") of 1986. To the extent that these policies had unreported income build-up, we may be liable to the IRS for failure to withhold taxes or to notify policyholders of their obligation to pay taxes directly to the IRS. We have undertaken an analysis of our potential liability to the IRS arising from this matter, as well as other expenses we may incur to remediate (i.e., conform to the requirements of the IRS) certain previously issued domestic life insurance and annuity policies and to address any missed reporting for policies issued to non-U.S. citizens and have established a best estimate reserve of $
14.4
million, net of tax as of
December 31, 2016
for probable liabilities and expenses. The probability weighted range of financial estimates relative to this issue is
$7.5 million
to
$44.8 million
, net of tax. This estimated range includes projected toll charges and fees payable to the IRS, as well as estimated increased payout obligations to current and former holders of non-compliant domestic life insurance policies expected to result from remediation of those policies. The amount of our liabilities and expenses depends on a number of uncertainties, including the number of prior tax years for which we may be liable to the IRS, the number of domestic life insurance policies we will be required to remediate, the methodology applicable to the calculation of taxable benefits under non-compliant policies and the amount of time and resources we will require from external advisors who are assisting us with resolving these issues. Given the range of potential outcomes and the significant variables assumed in establishing our estimates, actual amounts incurred may exceed our reserve and also could exceed the high end of our estimated range of liabilities and expenses. To the extent the amount reserved is insufficient to meet the actual amount of our liabilities and expenses, or if our estimates of those liabilities and expenses change in the future, our financial condition and results of operations may be materially adversely affected.
The Company currently expects to submit required filings with the IRS in 2017 to address all affected policies, though there can be no assurance that this process will be completed within this anticipated timeframe.
10
CITIZENS, INC. AND CONSOLIDATED SUBSIDIARIES
We face financial and capital market risks in our operations.
As an insurance holding company with significant investment exposure, we face material financial and capital markets risk in our operations. Due to the low interest rate environment in recent years, we experienced significant call activity on our fixed income portfolio that decreased our investment yields compared to prior years. We also have recorded other-than-temporary impairments in the past several years due to credit related market declines and equity market volatility.
Economic uncertainty has recently been exacerbated by the increased potential for default by one or more European sovereign debt issuers, the potential partial or complete dissolution of the Eurozone and its common currency, Brexit, potential changes in U.S. international trade policies and agreements and the negative impact of such events on global financial institutions and capital markets generally. Actions or inactions of European governments may impact these actual or perceived risks. Future actions or inactions of the United States government, including a shutdown of the federal government, could increase the actual or perceived risk that the U.S. may not ultimately pay its obligations when due and may disrupt financial markets.
Changes in market interest rates may significantly affect our profitability.
Some of our products, principally traditional whole life insurance with annuity riders, expose us to the risk that changes in interest rates will reduce our "spread," or the difference between the amounts we are required to pay under our contracts to policyholders and the rate of return we are able to earn on our investments intended to support obligations under the contracts. Our spread is an integral component of our net income.
If interest rates decrease or remain at low levels, we may be forced to reinvest proceeds from investments that have matured, prepaid, been sold, or called at lower yields, reducing our investment margin. Our fixed income bond portfolio is exposed to interest rate risk as a significant portion of the portfolio is callable. Lowering interest crediting rates can help offset decreases in investment margins on some of our products. However, our ability to lower these rates could be limited by competition or contractually guaranteed minimum rates, and may not match the timing or magnitude of changes in asset yields.
An increase in interest rates will increase the net unrealized loss position of our investment portfolio and may subject us to disintermediation risk. Disintermediation risk is the risk that in a change from a low interest rate period to a significantly higher and increasing interest rate period, policyholders may surrender their policies or make early withdrawals in order to increase their returns, requiring us to liquidate investments in an unrealized loss position (i.e. the market value less the carrying value of the investments). This risk is discussed further in the two risk factors below.
Due to the sustained low interest rate environment, we re-priced certain products at the end of 2016 that result in lower potential investment returns for our customers, which is a key pricing assumption. This price increase could result in a decrease in sales that may negatively impact our revenues and profitability.
Our investment portfolio is subject to various risks that may result in realized and unrealized investment losses. In particular, decreases in the fair value of fixed maturities may significantly reduce the value of our investments, and as a result, our financial condition may suffer.
We are subject to credit risk in our investment portfolio. Defaults by third parties in the payment or performance of their obligations under these securities could reduce our investment income and realized investment gains or result in the recognition of investment losses. The value of our investments may be materially adversely affected by increases in interest rates, downgrades in the bonds included in our portfolio and by other factors that may result in the recognition of other-than-temporary impairments. Each of these events may cause us to reduce the carrying value of our investment portfolio.
In particular, at
December 31, 2016
, fixed maturities represented
$1,128.7 million
or
92.4%
of our total investments of
$1,222.1 million
. The fair value of fixed maturities and the related investment income fluctuates depending on general economic and market conditions. The fair value of these investments generally increases or decreases in an inverse relationship with fluctuations in interest rates, while net investment income realized by us will generally increase or decrease in line with changes in market interest rates. In addition, actual net investment income and/or cash flows from investments that carry prepayment risk, such as mortgage-backed and other asset-backed securities, may differ from those anticipated at the time of investment as a result of interest rate fluctuations. An investment has prepayment risk when there is a risk that the timing of cash flows resulting from the repayment of principal might occur earlier than anticipated because of declining interest rates or later than anticipated because of rising interest rates. The impact of value fluctuations affects our consolidated financial statements, as a large portion of our fixed maturities are classified as available-for- sale, with changes in fair value reflected in our stockholders' equity (accumulated other
11
CITIZENS, INC. AND CONSOLIDATED SUBSIDIARIES
comprehensive income or loss). No similar adjustment is made for liabilities to reflect a change in interest rates. Therefore, interest rate fluctuations and economic conditions could adversely affect our stockholders' equity, total comprehensive income and/or cash flows. Although at
December 31, 2016
, approximately
97.2%
of our fixed maturities were investment grade with
78.2%
rated A or above, all of our fixed maturities are subject to credit risk. If any of the issuers of our fixed maturities suffer financial setbacks, the ratings on the fixed maturities could be downgraded (with a concurrent decrease in fair value) and, in a worst-case scenario, the issuer could default on its financial obligations. If the issuer defaults, we could have realized losses associated with the impairment of the securities.
Valuation of our investments and the determination of whether a decline in the fair value of our invested assets is other-than-temporary are based on estimates that may prove to be incorrect.
U.S. GAAP requires that when the fair value of any of our invested assets declines and the decline is deemed to be other-than-temporary, we recognize a loss in either other comprehensive income or in our statement of income based on certain criteria in the period for which the determination is made. The determination of the fair value of certain invested assets, particularly those that do not trade on a regular basis, requires an assessment of available data and the use of assumptions and estimates. Once it is determined that the fair value of an asset is below its carrying value, we must determine whether the decline in fair value is other-than-temporary, which is based on subjective factors and involves a variety of assumptions and estimates.
There are risks and uncertainties associated with determining whether declines in market value are other-than-temporary. These include significant changes in general economic conditions and business markets, trends in certain industry segments, interest rate fluctuations, rating agency actions, changes in significant accounting estimates and assumptions and legislative actions. In the case of mortgage- and asset-backed securities, there is added uncertainty as to the performance of the underlying collateral assets. To the extent that we are incorrect in our determination of the fair value of our investment securities or our determination that a decline in their value is other-than-temporary, we may realize losses that never actually materialize or may fail to recognize losses within the appropriate reporting period.
Gross unrealized losses on fixed maturity and equity securities may be realized or result in future impairments, resulting in a reduction in our net income.
Fixed maturity and equity securities classified as available-for-sale are reported at fair value. Unrealized gains and losses on available-for-sale securities are recognized as a component of other comprehensive income (loss) and are, therefore, excluded from our net income. Our total gross unrealized losses on our available-for-sale securities portfolio at
December 31, 2016
were $
9.4 million
. The accumulated change in estimated fair value of these securities is recognized in net income when the gain or loss is realized upon sale of the security or in the event that the decline in estimated fair value is determined to be other-than-temporary and an impairment charge to earnings is taken. Realized losses or impairments may have a material adverse effect on our net income in a particular quarterly or annual period.
Our actual claims losses may exceed our reserves for claims, and we may be required to establish additional reserves, which in turn may adversely impact our results of operations and financial condition.
We maintain reserves to cover our estimated exposure for claims relating to our issued insurance policies. Reserves, whether calculated under U.S. generally accepted accounting principles or statutory accounting practices prescribed by various state insurance regulators, do not represent an exact calculation of exposure, but instead represent our best estimates, generally involving actuarial projections, of what we expect claims will be based on mortality assumptions that are determined by various regulatory authorities. Many reserve assumptions are not directly quantifiable, particularly on a prospective basis. In addition, when we acquire other domestic life insurance companies, our assessment of the adequacy of acquired policy liabilities is subject to our estimates and assumptions. Reserve estimates are refined as experience develops, and adjustments to reserves are reflected in our statements of operations for the period in which such estimates are updated. Because establishing reserves is an inherently uncertain process involving estimates of future losses, future developments may require us to increase policy benefit reserves, which may have a material adverse effect on our results of operations and financial condition in the periods in which such increases occur.
Unanticipated increases in early policyholder withdrawals or surrenders could negatively impact liquidity.
A primary liquidity concern is the risk of unanticipated or extraordinary early policyholder withdrawals or surrenders. Our insurance policies include provisions, such as surrender charges, that help limit and discourage early withdrawals, and we track and manage liabilities and attempt to align our investment portfolio to maintain sufficient liquidity to support anticipated withdrawal demands. However, early withdrawal and surrender levels may differ from anticipated levels for a variety of reasons, including changes in economic conditions, changes in policyholder behavior or financial needs, changes in relationships with our independent
12
CITIZENS, INC. AND CONSOLIDATED SUBSIDIARIES
consultants, changes in our claims-paying ability, or increases in surrenders among policies that have been in force for more than fifteen years and are no longer subject to surrender charges. Any of these occurrences could adversely affect our liquidity, profitability and financial condition.
While we own a significant amount of liquid assets, a certain portion of investment assets are relatively illiquid. If we experience unanticipated early withdrawal or surrender activity, we could exhaust all other sources of liquidity and be forced to obtain additional financing or liquidate assets, perhaps on unfavorable terms. The availability of additional financing will depend on a variety of factors, such as market conditions, the availability of credit in general or more specifically in the insurance industry, the strength or weakness of the capital markets, the volume of trading activities, our credit capacity, and the perception of our long- or short-term financial prospects if we incur large realized or unrealized investment losses or if the level of business activity declines due to a market downturn. If we are forced to dispose of assets on unfavorable terms, it could have an adverse effect on our liquidity, results of operations and financial condition.
Catastrophes may adversely impact liabilities for policyholder claims and reinsurance availability.
Our insurance operations are exposed to the risk of catastrophic events. The extent of losses from a catastrophe is a function of both the total amount of insured exposure in the area affected by the event and the severity of the event. Most catastrophes are restricted to small geographic areas; however, hurricanes, earthquakes, tsunamis and man-made catastrophes may produce significant damage or loss of life in larger areas, especially those that are heavily populated. Claims resulting from catastrophic events could cause substantial volatility in our financial results for any fiscal quarter or year and could materially reduce our profitability or harm our financial condition. In addition, catastrophic events could harm the financial condition of issuers of obligations we hold in our investment portfolio, resulting in impairments to these obligations, and the financial condition of our reinsurers, thereby increasing the probability of default on reinsurance recoveries. Large-scale catastrophes may also reduce the overall level of economic activity in affected countries, which could hurt our business and the value of our investments or our ability to sell new policies.
Our life insurance operations are exposed to the risk of catastrophic mortality, such as a pandemic or other event that causes a large number of deaths, especially if concentrated in our top foreign markets. A significant pandemic could have a major impact on the global economy or the economies of particular countries or regions, including travel, trade, tourism, the health system, food supply, consumption, overall economic output and, eventually, on the financial markets. In addition, a pandemic that affected our employees, our policyholders, our independent consultants or other companies with which we do business could disrupt our business operations. The effectiveness of external parties, including governmental and non-governmental organizations, in combating the spread and severity of such a pandemic could have a material impact on the losses experienced by us. These events could cause a material adverse effect on our results of operations in any period and, depending on their severity, could also materially and adversely affect our financial condition.
We may be required to accelerate the amortization of deferred acquisition costs and the costs of customer relationships acquired, which would increase our expenses and adversely affect our results of operations and financial condition.
At
December 31, 2016
, we had
$167.8 million
of deferred policy acquisition costs, or DAC. DAC represents costs that vary with and are primarily related to the successful sale and issuance of our insurance policies and are deferred and amortized over the estimated life of the related insurance policies. These costs include commissions in excess of ultimate renewal commissions, solicitation and printing costs, sales material costs and some support costs, such as underwriting and contract and policy issuance expenses. Under U.S. GAAP, DAC is amortized to income over the lives of the underlying policies, in relation to the premium-paying period of the policies.
In addition, when we acquire a block of insurance policies, we assign a portion of the purchase price to the right to receive future net cash flows from existing insurance and investment contracts and policies. This intangible asset, called the cost of customer relationships acquired, or CCRA, represents the actuarially estimated present value of future cash flows from the acquired policies. At
December 31, 2016
, we had
$19.4 million
of CCRA. We amortize the value of this intangible asset in a manner similar to the amortization of DAC.
Our recoverability of DAC and CCRA generally depends upon anticipated profits from investments, surrender and other policy charges, mortality, morbidity, persistency and maintenance expense margins. For example, if our insurance policy lapse and surrender rates were to exceed the assumptions upon which we priced our insurance policies, or if actual persistency proves to be less than our persistency assumptions, especially in the early years of a policy, we might be required to accelerate the amortization of expenses we deferred in connection with the acquisition of the policy. We regularly review the quality of our DAC and CCRA
13
CITIZENS, INC. AND CONSOLIDATED SUBSIDIARIES
to determine if they are recoverable from future income. If these costs are not recoverable, the amount that is not recoverable is charged to expenses in the financial period in which we make this determination.
Unfavorable experience with regard to expected expenses, investment returns, surrender and other policy charges, mortality, morbidity, lapses or persistency may cause us to increase the amortization of DAC or CCRA, or both, or to record a current period expense to increase benefit reserves, any of which could have a material adverse effect on our results of operations and financial condition.
We may be required to recognize an impairment on the value of our goodwill, which would increase our expenses and materially adversely affect our results of operations and financial condition.
Goodwill represents the excess of the amount paid by us to acquire various life insurance companies over the fair value of their net assets at the date of the acquisition. Under U.S. GAAP, we test the carrying value of goodwill for impairment at least annually at the "reporting unit" level, which is either an operating segment or a business that is one level below the operating segment. Goodwill is impaired if its carrying value exceeds its implied fair value. This may occur for various reasons, including changes in actual or expected earnings or cash flows of a reporting unit, generation of earnings by a reporting unit at a lower rate than similar businesses or declines in market prices for publicly traded businesses similar to our reporting units. If any portion of our goodwill becomes impaired, we would be required to recognize the amount of the impairment as a current-period expense, which could have a material adverse effect on our results of operations and financial condition. Goodwill in our consolidated financial statements was
$17.3 million
as of
December 31, 2016
.
Due to changes in certain accounting standards issued by the Financial Accounting Standards Board (“FASB”) which become effective for the first fiscal year beginning after December 15, 2019 (subject to early adoption), all or a portion of the $4.6 million in goodwill value of our Home Services segment may become impaired. The impairment methodology within the FASB Accounting Standards Codification ("ASC") Topic 350, Intangibles-Goodwill and Other ("ASC 350") follows a quantitative two step process. In the first step of the goodwill impairment test, the fair value of a reporting unit is compared to its carrying value. If the carrying value of a reporting unit exceeds its fair value, the second step of the impairment test is performed for purposes of measuring the impairment.
In the second step, the Company performs a hypothetical purchase price allocation to measure impairment. If the hypothetical purchase price allocation of the reporting unit is lower than the goodwill value, an impairment loss is recognized in an amount equal to that difference.
Management’s determination of the fair value of each reporting unit incorporates multiple inputs including discounted cash flow calculations based on assumptions that market participants would make in valuing the reporting unit. Other assumptions can include levels of economic capital, future business growth, and earnings projections.
In 2016, the Company's Home Service Segment failed the first step and thus the second impairment step had to be performed. The Company's Home Service Segment passed step two, so the goodwill value for the Home Service Segment of $4.6 million was not impaired.
On January 26, 2017, the FASB issued Accounting Standards Update ("ASU") No. 2017-04,
Simplifying the Test for Goodwill Impairment.
An entity will no longer perform a hypothetical purchase price allocation to measure impairment, eliminating step two. Instead, impairment will be measured using the difference of the carrying amount to the fair value of the reporting unit. The ASU is effective prospectively for annual and interim periods in fiscal year beginning after December 15, 2019, but early adoption is permitted for goodwill impairment tests with measurement dates after January 1, 2017.
With the elimination of step two, there is risk that in the Home Service Segment all or a portion of the goodwill value could be impaired upon adoption of the ASU.
Our conversion to a new actuarial valuation system is not yet complete and contains known uncertainties that could result in identification of additional errors in our financial reporting.
As discussed in Note 1 - Correction of Immaterial Errors and Reclassification of Certain Amounts to the Consolidated Financial Statements, the Company is in the process of converting its actuarial valuation from a third party service provider to an actuarial valuation modeling software system purchased from a vendor. In connection with our ongoing actuarial valuation conversion, certain legacy system errors were discovered. As of December 31, 2016, the known errors have been quantified by the Company.
14
CITIZENS, INC. AND CONSOLIDATED SUBSIDIARIES
The errors in valuing DAC and future policy benefits caused the Company to understate amortization of DAC over several years and to overstate the increase in future policy benefit reserves during the same periods, resulting in an overstatement of DAC of
$0.3 million
and an overstatement of future policy benefits of
$7.9 million
at December 31, 2015. The cumulative errors have been corrected through retained earnings as of January 1, 2014, the earliest period presented, with an increase to retained earnings of
$3.4 million
.
As part of this conversion, the Company could identify additional differences that will be evaluated in future periods for financial reporting purposes. The conversion to the new system is expected to be completed in 2017.
We are a defendant in lawsuits, which may adversely affect our financial condition and detract from the time our management is able to devote to our business, and we are subject to risks related to litigation and regulatory matters.
From time to time we are, and have been, subject to a variety of legal and regulatory actions and investigations relating to our business operations, including, but not limited to:
•
disputes over insurance coverage or claims adjudication;
•
regulatory compliance with state laws, including insurance and securities regulations;
|
•
|
regulatory compliance with U.S. federal securities laws, tax, anti-money laundering, bank secrecy, anti-bribery, anti-corruption and foreign asset control laws, among others;
|
|
•
|
disputes with our independent marketing firms, independent consultants and employee-agents over compensation, termination of contracts, noncompliance with applicable laws and regulations and related claims;
|
•
disputes regarding our tax liabilities;
•
disputes relating to reinsurance and coinsurance agreements; and
•
disputes relating to businesses acquired and operated by us.
In the absence of countervailing considerations, we would expect to defend any such claims vigorously. However, in doing so, we could incur significant defense costs, including attorneys' fees, other direct litigation costs and the expenditure of substantial amounts of management time that otherwise would be devoted to our business. Further, if we suffer an adverse judgment as a result of any claim, it could have a material adverse effect on our business, results of operations and financial condition.
A number of U.S. jurisdictions have been investigating life insurer practices for compliance with unclaimed property laws. Highly publicized incidents disclosed the practice by certain companies of using data available on the U.S. Social Security Administration's Death Master File or a similar database in order to avoid paying periodic benefits under annuity contracts, but not using the same data base to determine when death benefits were owed. This asymmetric conduct by certain insurers has led a number of jurisdictions to require life insurers to use this same data to identify instances where amounts under life insurance policies and annuity contracts are payable and to locate and pay beneficiaries under such contracts. The National Conference of Insurance Legislators ("NCOIL") has adopted the Model Unclaimed Life Insurance Benefits Act ("Model Act") and several states have adopted legislation that is substantially similar to the Model Act adopted by NCOIL. The Model Act imposes new requirements on insurers to periodically compare their in force life insurance and annuity policies against the Death Master File, investigate any identified matches to confirm the death of the insured and determine whether benefits are due and attempt to locate the beneficiaries or, if no beneficiary can be located, escheat the policy benefit to the respective state government as unclaimed property. The Model Act could result in additional payments to beneficiaries, additional escheatment of funds deemed abandoned under state laws, and/or administrative penalties. It is also possible that life insurers may be subject to claims regarding their business practices as a result given the legal uncertainty in this area. However, court decisions in West Virginia and Florida have upheld the well-established insurance law principal that life insurance policies are not due and payable until the insurance company receives due proof of death, and have further held an insurance company has no duty to search the Death Master File or other databases to determine whether deaths have occurred that have not been reported to the company.
Despite the fact we have no history of the asymmetric conduct in question, we have received notices from the Louisiana Department of Treasury, the Arkansas Auditor of State and the Texas State Comptroller, indicating they intend to audit Citizens, Inc. and certain of its affiliates for compliance with unclaimed property laws. The audits may result in additional payments to beneficiaries, additional escheatment of funds deemed abandoned under state laws, administrative penalties, interest, and changes to our Company's procedures for the identification and escheatment of abandoned property. At this time, our Company is not able to estimate any of these possible amounts.
15
CITIZENS, INC. AND CONSOLIDATED SUBSIDIARIES
Reinsurers with which we do business could increase their premium rates and may not honor their obligations, leaving us liable for the reinsured coverage.
We reinsure certain risks underwritten by our various insurance subsidiaries. Market conditions beyond our control determine the availability and cost of the reinsurance protection we purchase. The high cost of reinsurance or lack of affordable coverage could adversely affect our results of operations and financial condition.
Our reinsurance facilities are generally subject to annual renewal. We may not be able to maintain our current reinsurance facilities and, even if highly desirable or necessary, we may not be able to obtain replacement reinsurance facilities in adequate amounts or at rates economic to us. If we are unable to renew our expiring facilities or to obtain new reinsurance facilities, either our net exposures would increase or, if we are unwilling or unable to bear an increase in net exposures, we may have to reduce the level of our underwriting commitments. In addition, our reinsurance facilities may be canceled for new business, pursuant to their terms, upon the occurrence of certain specified events, including a change of control of our Company (generally defined as the acquisition of 10% or more of our voting equity securities) or the failure of our insurance company subsidiaries to maintain the minimum required levels of statutory surplus. Any of these potential developments could materially adversely affect our revenues, results of operations and financial condition.
In
2016
, we reinsured
$522.8 million
of the face amount of our life insurance policies. Amounts reinsured in
2016
represented
10.5%
of the face amount of direct life insurance in force in that year. Although the cost of reinsurance is, in some cases, reflected in premium rates, under certain reinsurance agreements, the reinsurer may increase the rate it charges us for reinsurance. If our cost of reinsurance were to increase, we might not be able to recover these increased costs, and our results of operations and financial condition could be materially adversely affected. See Note 5 to the Company's Consolidated Financial Statements.
Our international and domestic markets face significant competition. If we are unable to compete effectively in our markets, our business, results of operations and profitability may be adversely affected.
Our international marketing plan focuses on making available U.S. Dollar-denominated life insurance products to individuals residing in more than 30 countries. New competition could increase the supply of available insurance, which could adversely affect our ability to price our products at attractive profitable rates and thereby adversely affect our revenues, results of operations and financial condition. Existing barriers to entry in the foreign markets we serve may not be sufficient to impede potential competitors from entering such markets. In connection with our business with foreign nationals, we experience competition primarily from the following sources, many of which have substantially greater financial, marketing and other resources than we have:
|
•
|
Foreign operated companies with U.S. Dollar-denominated policies. We face direct competition from companies that operate in the same manner as we operate in our international markets.
|
|
•
|
Companies foreign to the countries in which their policies are sold but that issue local currency policies. Another group of our competitors in the international marketplace consists of companies that are foreign to the countries in which their policies are sold but issue life insurance policies denominated in the local currencies of those countries. Local currency policies provide the benefit of assets located in the country of foreign residents, but entail risks of uncertainty due to local currency fluctuations, as well as the perceived instability and weakness of local currencies.
|
|
•
|
Locally operated companies with local currency policies. We compete with companies formed and operated in the country in which our foreign insureds reside. Generally, these companies are subject to risks of currency fluctuations, and they primarily use mortality tables based on experience of the local population as a whole. These mortality tables are typically based on significantly shorter life spans than those we use. As a result, the cost of insurance from these companies tends to be higher than ours. Although these companies typically market their policies to a broader section of the population than do our independent marketing firms and independent consultants, there can be no assurance that these companies will not endeavor to place a greater emphasis on our target market and compete more directly with us.
|
In the United States, we compete with more than 800 other life insurance companies of various sizes. The life insurance business in the United States is highly competitive, in part because it is a mature industry that, in recent years, has experienced little to no growth in life insurance sales. Many domestic life insurance companies have substantially greater financial resources, longer business histories, larger sales forces and more diversified lines of insurance coverage than we do. Competition in the United
16
CITIZENS, INC. AND CONSOLIDATED SUBSIDIARIES
States has also increased recently because the life insurance industry is consolidating, with larger, more efficient organizations emerging from the consolidation.
In addition, from time to time, companies enter and exit the markets in which we operate, thereby increasing competition at times when there are new entrants. We may lose business to competitors offering competitive products at lower prices, or for other reasons.
There can be no assurance that we will be able to compete effectively in any of our markets. If we do not, our business, results of operations and financial condition will be materially adversely affected.
Sales of our insurance products may be reduced if we are unable to (i) establish and maintain commercial relationships with independent marketing firms and independent consultants, (ii) attract and retain employee agents or (iii) develop and maintain our distribution sources.
We distribute our insurance products through several distribution channels, including independent marketing firms, independent consultants and our employee agents. These relationships are significant for both our revenues and our profits. In our life insurance segment, we depend almost exclusively on the services of independent marketing firms and independent consultants. In our home service insurance segment, we depend on employee agents whose role in our distribution process is integral to developing and maintaining relationships with policyholders. Significant competition exists among insurers in attracting and maintaining marketers of demonstrated ability. Some of our competitors may offer better compensation packages for marketing firms, independent consultants and agents and broader arrays of products and have a greater diversity of distribution resources, better brand recognition, more competitive pricing, lower cost structures and greater financial strength or claims paying ratings than we do. We compete with other insurers for marketing firms, independent consultants and employee agents primarily on the basis of our compensation and support services. Any reduction in our ability to attract and retain effective sales representatives could materially adversely affect our revenues, results of operations and financial condition.
As of January 1, 2017, we have discontinued sales of all of our domestic life insurance products that are not compliant with Section 7702 of the Internal Revenue Code. We are currently developing compliant products to be sold in the domestic market. We expect 2017 sales to decline due to lack of compliant products to sell and we are unsure of the impact this will have on our domestic distribution sources.
There may be adverse tax, legal or financial consequences if our sales representatives are determined not to be independent contractors.
Our sales representatives are independent contractors who operate their own businesses. Although we believe that we have properly classified our representatives as independent contractors, there is nevertheless a risk that the IRS, foreign agency, a court or other authority will take the different view that our sales representatives should be treated like employees. Furthermore, the tests governing the determination of whether an individual is considered to be an independent contractor or an employee are typically fact-sensitive and vary from jurisdiction to jurisdiction. Laws and regulations that govern the status and misclassification of independent sales representatives are subject to change or interpretation.
If there is a change in the manner in which our independent contractors are classified or an adverse determination with respect to some or all of our independent contractors by a court or governmental agency, we could incur significant costs in complying with such laws and regulations, including in respect of tax withholding, social security payments, government and private pension plan contributions and recordkeeping, or we may be required to modify our business model, any of which could have a material adverse effect on our business, financial condition and results of operations. In addition, there is the risk that we may be subject to significant monetary liabilities arising from fines or judgments as a result of any such actual or alleged non-compliance with applicable federal, state, local or foreign laws.
Changes among our board and senior management team, or the failure to fill key vacancies or effectively manage succession, could hinder our operations, marketing and business strategy and adversely impact our results of operations, financial condition or prospects.
Significant changes have occurred recently in our board and executive leadership, including: the retirement in 2015 of our founder, who was our initial Chairman and Chief Executive Officer; the retirement in 2016 of our founder’s son, who succeeded our founder as Chairman and Chief Executive Officer; the resignation in 2016 of a long-serving board member and Audit Committee Chairman; the appointment in 2016 of a new Chairman of the Board; the appointment in 2016 of our former Chief Legal Officer Geoffrey
17
CITIZENS, INC. AND CONSOLIDATED SUBSIDIARIES
M. Kolander as our Chief Executive Officer; and the appointments in 2017 of a new Chief Operating Officer and two new independent directors. The effectiveness of new leaders in these roles, and further transition as a result of these changes, could have a significant impact on our results of operations, financial condition and prospects. We rely on our senior executive team comprised of Chief Executive Officer Geoffrey M. Kolander (age 41), President Kay E. Osbourn (age 50) and Vice President, Chief Financial Officer and Treasurer David S. Jorgensen (age 53) to develop and execute our operating and marketing plans and strategy for expanding our business. We anticipate that their expertise will continue to be of substantial value in connection with our business and compliance strategies. The loss of the services of any of these individuals, or the failure to effectively manage succession or fill key vacancies for an extended period of time, could have a significant adverse effect on our business and prospects. Historically, our compensation philosophy focused primarily on cash compensation and excluded equity incentive compensation, employment agreements, change of control agreements or other compensation components that are common among similar publicly traded companies. While we recently entered into employment and change of control agreements with our top three executives, the agreements still provide only for cash compensation, and there is no assurance that these executives will complete the term of their employment agreements or that the Company will renew the agreements upon expiration. Our ability to retain and effectively incentivize our key executives and our ability to attract directors and new executive talent in the competitive insurance industry may be limited. Further, we do not carry key-man insurance policies on any of their lives.
We are subject to extensive governmental regulation in the United States, which is subject to change and may increase our costs of doing business, restrict the conduct of our business and negatively impact our results of operations, liquidity and financial condition.
We are subject to extensive regulation and supervision in U.S. jurisdictions where we do business, including state insurance regulations and U.S. federal securities, tax, financial services, privacy, anti-money laundering, bank secrecy, anti-corruption and foreign asset control laws. Insurance company regulation is generally designed to protect the interests of policyholders, with substantially lesser protections to shareholders of the regulated insurance companies. To that end, all the states in which we do business have insurance regulatory agencies with broad legal powers with respect to licensing companies to transact business; mandating capital and surplus requirements; regulating trade and claims practices; approving policy forms; and restricting companies' ability to enter and exit markets.
The capacity for an insurance company's growth in premiums is partially a function of its required statutory surplus. Maintaining appropriate levels of statutory surplus, as measured by statutory accounting practices prescribed or permitted by a company's state of domicile, is considered important by all state insurance regulatory authorities. Failure to maintain required levels of statutory surplus could result in increased regulatory scrutiny and enforcement action by regulatory authorities.
Most insurance regulatory authorities have broad discretion to grant, renew, suspend and revoke licenses and approvals, and could preclude or temporarily suspend us from carrying on some or all of our activities, including acquisitions of other insurance companies, require us to add capital to our insurance company subsidiaries, or fine us. If we are unable to maintain all required licenses and approvals, or if our insurance business is determined not to comply fully with the wide variety of applicable laws and regulations and their interpretations, including the USA Patriot Act, our revenues, results of operations and financial condition could be materially adversely affected.
Although the U.S. federal government historically has not regulated the insurance business, legislation proposing federal regulation of insurance has been proposed from time to time and the Dodd-Frank Act enacted in 2010 expanded the federal presence in insurance oversight. Its requirements include streamlining the state-based regulation of reinsurance and non-admitted insurance (also known as surplus lines insurance, which is property or casualty insurance written by a company that is not licensed to sell policies of insurance in a given state) and establishing a new Federal Insurance Office within the U.S. Department of the Treasury with powers over all lines of insurance except health insurance, certain long-term care insurance and crop insurance. The Federal Insurance Office is authorized to, among other things, gather data and information to monitor aspects of the insurance industry, identify issues in the regulation of insurers about insurance matters and preempt state insurance measures under certain circumstances. The Dodd-Frank Act calls for numerous studies and significant rulemaking across numerous federal agencies, some of which has been implemented. The rulemaking process going forward may change with the new presidential administration. We are currently unable to determine the ultimate impact of the Dodd-Frank Act on our business, results of operations, liquidity and capital resources.
Our failure to maintain effective information systems could adversely affect our business.
We must maintain and enhance our existing information systems and develop new information systems in order to keep pace with continuing changes in information processing technology, evolving industry and regulatory standards and changing customer
18
CITIZENS, INC. AND CONSOLIDATED SUBSIDIARIES
preferences. If we do not maintain adequate systems, we could experience adverse consequences, including products acquired through acquisition, inadequate information on which to base pricing, underwriting and reserve decisions, regulatory problems, failure to meet prompt payment obligations, increases in administrative expenses and loss of customers.
Some of our information technology systems and software are mainframe-based, legacy-type systems that require an ongoing commitment of resources to maintain current standards. Our systems utilize proprietary code requiring highly skilled personnel. Due to the unique nature of our proprietary operating environment, we could have difficulty finding personnel with the skills required to provide ongoing system maintenance and development as we seek to keep pace with changes in our products and business models, information processing technology, evolving industry and regulatory standards and policyholder needs. Our success is dependent upon, among other things, maintaining and enhancing the effectiveness of existing systems, as well as continuing to integrate, develop and enhance our information systems to support business processes in a cost-effective manner.
Our failure to maintain effective and efficient information systems, or our failure to efficiently and effectively consolidate our information systems to eliminate redundant or obsolete applications, could have a material adverse effect on our results of operations and financial condition.
Failures of disclosure controls and internal control over financial reporting could materially and adversely affect our business, financial condition and results of operations, impair our ability to timely file reports with the SEC and subject us to litigation and/or regulatory scrutiny and penalties.
We maintain disclosure controls and procedures designed to ensure that we timely report information as specified in SEC rules and regulations. We also maintain a system of internal control over financial reporting. However, these controls may not achieve, and in some cases have not achieved, their intended objectives. Control processes that involve human diligence and compliance, such as our disclosure controls and procedures and internal control over financial reporting, are subject to lapses in judgment and breakdowns. Controls that rely on models may be subject to inadequate design or inaccurate assumptions or estimates. Controls also can be circumvented by collusion or improper management override of such controls. Because of such limitations, there are risks that material misstatements due to error or fraud may not be prevented or detected, and that information may not be reported on a timely basis. The failure of our controls to be effective could have a material adverse effect on our business, financial condition, results of operations and the market for our common stock, and could subject us to litigation, regulatory scrutiny and/or penalties.
As disclosed in Part II, Item 9A of this Annual Report on Form 10-K, we have identified control deficiencies in our disclosure controls and financial reporting process that constitute material weaknesses and for which remediation is still in process as of December 31, 2016. If we fail to design effective controls, fail to remediate control deficiencies or fail to otherwise maintain effective internal controls over financial reporting in the future, such failures could result in a material misstatement of our annual or quarterly financial statements that would not be prevented or detected on a timely basis and which could cause investors to lose confidence in our financial statements, have a negative effect on the trading price of our common stock, limit our ability to obtain financing if needed or increase the cost of any financing we may obtain. In addition, these failures may negatively impact our business, financial condition and results of operations, impair our ability to timely file our periodic reports with the SEC, subject us to litigation and regulatory scrutiny and cause us to incur substantial additional costs in future periods relating to the implementation of remedial measures.
Our failure to protect confidential information and privacy could result in the unauthorized disclosure of sensitive or confidential corporate or customer information, damage to our reputation, loss of customers, fines, penalties and adverse effects on our results of operations and financial condition.
Our insurance subsidiaries are subject to privacy regulations. The actions we take to protect confidential information include among other things: monitoring our record retention plans and policies and any changes in state or federal privacy and compliance requirements; maintaining secure storage facilities for tangible records; and limiting access to electronic information in order to safeguard certain information.
In addition, the Gramm-Leach-Bliley Act requires that we deliver a notice regarding our privacy policy both at the delivery of an insurance policy and annually thereafter. Certain exceptions are allowed for sharing of information under joint marketing agreements. However, certain state laws may require us to obtain a policyholder's consent before we share information.
We have a written information security program with appropriate administrative, technical and physical safeguards to protect such confidential information. Cyber security attacks are on the rise throughout the world and while we believe we have taken reasonable steps to secure our customer information we could experience a breach of data. We closely monitor cyber attack attempts on our
19
CITIZENS, INC. AND CONSOLIDATED SUBSIDIARIES
system, and we are not aware of any material breach of our cybersecurity, administrative, technical and physical safeguards or client data. Nevertheless, it is possible a cyber attack could go undetected and that preventative actions we take to reduce this risk of cyber-incidents and protect our information may be insufficient to prevent cyber attacks or other security breaches.
If we do not comply with privacy regulations and protect confidential information, we could experience adverse consequences, including regulatory sanctions, loss of reputation, litigation exposure, disruptions to our operations or significant technical, legal and operating expenses, any of which could have a material adverse effect on our business, results of operations and financial condition.
General economic, financial market and political conditions may materially adversely affect our results of operations and financial condition.
Our results of operations and financial condition may be materially adversely affected from time to time by general economic, financial market and political conditions, both in the United States and in the foreign countries where our policyowners reside. These conditions include economic cycles such as: levels of consumer spending; levels of inflation; movements of the financial markets; availability of credit; fluctuations in interest rates, monetary policy or demographics; and legislative and competitive changes.
During periods of economic downturn, our insureds may choose not to purchase our insurance products, may terminate existing policies, permit policies to lapse or may choose to reduce the amount of coverage purchased, any of which could have a material adverse effect on our results of operations and financial condition. Also, our sales of new insurance policies might decrease.
Our insurance subsidiaries are restricted by applicable laws and regulations in the amounts of fees, dividends and other distributions they may make to us. The inability of our subsidiaries to make payments to us in sufficient amounts for us to conduct our operations could adversely affect our ability to meet our obligations or expand our business.
As a holding company, our principal asset is the stock of our subsidiaries. We rely primarily on statutorily permissible payments from our insurance company subsidiaries, principally through service agreements we have with our subsidiaries, to meet our working capital and other corporate expenses. The ability of our insurance company subsidiaries to make payments to us is subject to regulation by the states in which they are domiciled, and these payments depend primarily on approved service agreements between us and these subsidiaries and, to a lesser extent, the statutory surplus (which is the excess of assets over liabilities as determined under statutory accounting practices prescribed by an insurance company's state of domicile), future statutory earnings (which are earnings as determined in accordance with statutory accounting practices) and regulatory restrictions.
Generally, the net assets of our insurance company subsidiaries available for dividends are limited to either the lesser or greater (depending on the state of domicile) of the subsidiary's net gain from operations during the preceding year and 10% of the subsidiary's net statutory surplus as of the end of the preceding year as determined in accordance with accounting practices prescribed by insurance regulatory authorities.
Except to the extent that we are a creditor with recognized claims against our subsidiaries, claims of our subsidiaries' creditors, including policyholders, have priority with respect to the assets and earnings of the subsidiaries over the claims of our creditors and shareholders. If any of our subsidiaries becomes insolvent, liquidates or otherwise reorganizes, our creditors and shareholders will have no right to proceed in their own right against the assets of that subsidiary or to cause the liquidation, bankruptcy or winding-up of the subsidiary under applicable liquidation, bankruptcy or winding-up laws.
Adverse capital and credit market conditions may significantly affect our access to debt and equity capital and our cost of capital in seeking to expand our business.
The availability of equity and debt financing to us will depend on a variety of factors such as market conditions, the general availability of credit, the overall availability of credit to the financial services industry, our credit capacity, as well as the possibility that investors or lenders could develop a negative perception of our long- or short-term financial prospects. Disruptions, uncertainty or volatility in the capital markets may also limit our access to equity capital for us to seek to expand our business. As such, we may be forced to delay raising debt or equity capital, or bear an unattractive cost of capital, which could adversely affect our ability to seek any acquisitions and negatively impact profitability of an acquisition.
20
CITIZENS, INC. AND CONSOLIDATED SUBSIDIARIES
Unexpected losses in future reporting periods may require us to adjust the valuation allowance against our deferred tax assets.
We evaluate our deferred tax asset (“DTA”) quarterly for recoverability based on available evidence. This process involves management's judgment about assumptions, which are subject to change from period to period due to tax rate changes or variances between our projected operating performance and our actual results. Ultimately, future adjustments to the DTA valuation allowance, if any, will be determined based upon changes in the expected realization of the net deferred tax assets. The realization of the deferred tax assets depends on the existence of sufficient taxable income in either the carry back or carry forward periods under applicable tax law. Due to significant estimates utilized in establishing the valuation allowance and the potential for changes in facts and circumstances, it is reasonably possible that we may be required to record a valuation allowance in future reporting periods. Such an adjustment could have a material adverse effect on our results of operation, financial condition and capital position.
We face a greater risk of money laundering activity associated with sales derived from residents of certain foreign countries.
Some of our top international markets are in countries identified by the U.S. Department of State as jurisdictions of high risk for money laundering. As required by Bank Secrecy Act ("BSA”) regulations applicable to insurance companies, we have developed and implemented an anti-money laundering program that includes policies and procedures for complying with applicable BSA program, reporting and recordkeeping requirements and for deterring, preventing and detecting potential money laundering and other criminal activity (“BSA Program”). Based on a prior internal risk assessment, we have enhanced our BSA Program with additional controls, such as list screening software beyond sanctions screening required by the Office of Foreign Assets Control (“OFAC”), enhanced payment due diligence and transaction controls. However, there can be no assurance that these enhanced controls will entirely mitigate money laundering risk associated with these jurisdictions.
Risks Relating to Our Capital Stock
If our foreign policyholders reduced or ceased participation in our Stock Investment Plan (the “Plan”) or if a securities regulatory authority were to deem the Plan's operation contrary to securities laws, the volume of Class A common stock purchased on the open market through the Plan, and the price of our Class A common stock, could fall.
More than 95% percent of the shares of Class A common stock purchased under the Plan in
2016
were purchased by foreign holders of life insurance policies (or related brokers); the remaining 5% of the shares of Class A common stock purchased under the Plan in
2016
were purchased by approximately 2,123 participants resident in the United States. The Plan is registered with the SEC pursuant to a registration statement under the Securities Act of 1933, but is not registered under the laws of any foreign jurisdiction. If a foreign securities regulatory authority were to determine the offer and sale of our Class A common stock under the Plan were contrary to applicable laws and regulations of its jurisdiction, such authority may issue or assert a fine, penalty or cease and desist order against us in that foreign jurisdiction. There is a risk our Class A common stock price could be negatively impacted by a decrease in participation in the Plan. If fewer policyholders elect to participate in the Plan, or our international premium collections were to decrease as a result of regulatory, economic, or marketing impediments, the trading volume of our Class A common stock may decline from its present levels, the demand for our Class A common stock could be negatively impacted and the price of our Class A common stock could fall.
21
CITIZENS, INC. AND CONSOLIDATED SUBSIDIARIES
Control of our Company, through the ownership of our Class B Common Stock, may transfer from our founder to a 501(c)(3) charitable foundation established by our founder, and we cannot determine whether any change in our management, operations, or operating strategies will occur as a result of such an ownership change.
Harold E. Riley, our founder and Chairman Emeritus, is the beneficial owner of 100% of our Class B common stock, which is held in the name of the Harold E. Riley Trust ("Trust"), of which he serves as Trustee. Our Class A and Class B common stock are identical in all respects, except the Class B common stock elects a simple majority of the Board and receives one-half of any cash dividends paid, on a per share basis, to the Class A shares. Therefore, Mr. Riley controls our Company. The Class A common stock elects the remainder of the Board. The Trust documents provide that upon Mr. Riley's death, the Class B common stock will be transferred from the Trust to the Harold E. Riley Foundation, a charitable organization established under 501(c)(3) of the Internal Revenue Code (the "Foundation"). The Foundation is organized as a public support charity for the benefit of its charitable beneficiaries, Baylor University and Southwestern Baptist Theological Seminary. The Foundation is governed by 11 trustees, five of which are appointed by its sole member, Harold Riley, three of which are appointed by Baylor University and three of which are appointed by Southwestern Baptist Theological Seminary. The trustees appointed by Harold Riley include himself, Dottie Riley and Rick Riley. In addition, the Trust documents provide that Mr. Riley may at any time transfer the Class B common stock held by the Trust to the Foundation. It is unclear what, if any, changes would occur to our board, management, or corporate operating strategies as a result of different ownership of our Class B common stock. A transfer of our Class B common stock from the Trust also may trigger certain “change in control” provisions in the employment agreements of our top three executives. Under each employment agreement, a “change in control" includes, among other things (1) the transfer of at least a majority of the Company’s Class B Common Stock from the Harold E. Riley Trust to an individual other than Harold E. Riley, an entity not beneficially owned by Harold E. Riley or a trust not controlled by Harold E. Riley and (2) the exercise of a power of attorney granted by Harold E. Riley over the Company’s Class B Common Stock. Upon a termination by Citizens without cause or the executive’s voluntary termination with Good Reason, in each case other than within the ninety (90) day period prior to the consummation of a change in control or within one (1) year following a change in control, each executive is entitled to certain cash payments and benefits.
There are a substantial number of our shares of Class A common stock issued to our executive officers and directors which are eligible for future sale in the public market. The sale of these shares could cause the market price of our Class A common stock to fall.
There were 49,080,114 shares of our Class A common stock issued and outstanding as of
December 31, 2016
. Our executive officers and directors owned approximately 2,480,354 shares of our Class A common stock as of
December 31, 2016
, representing approximately 5.0% of our then outstanding Class A common stock. Almost all of these shares have been registered for public resale and generally may be sold freely. In the event of a sale of some or all of these shares or the perceived sale of these shares, the market price of our Class A common stock could fall substantially.
The price of our Class A common stock may be volatile and may be affected by market conditions beyond our control.
Our Class A common stock price has historically fluctuated and is likely to fluctuate in the future and could decline materially because of the volatility of the stock market in general, decreased participation in the Plan referred to above or a variety of other factors, many of which are beyond our control, including: quarterly or annual variations in actual or anticipated results of our operations; interest rate fluctuations; changes in financial estimates by securities analysts; competition and other factors affecting the life insurance business generally; and conditions in the U.S. and world economies.
Our international markets, and the specific manner in which we conduct our business in those jurisdictions, may be subject to negative publicity in social media or other channels, which may negatively impact the market price of our Class A common stock.
We interface with and distribute our products to residents of foreign countries that may be subject to the risks disclosed in our Item 1A. Risk Factor under the heading, “
The majority of our sales derive from residents of foreign countries and are subject to risks associated with widespread political instability, currency control laws and foreign insurance laws. A significant loss of sales in these foreign markets could have a material adverse effect on our results of operations and financial condition".
Venezuela is one such example. Accordingly, from time to time, bloggers or other social media outlets relevant to investors may focus attention on our exposure to these countries and the negative circumstances surrounding their governments, thereby subjecting us to periodic negative publicity. Negative publicity on investor blogs or through other media channels could impact trading in our stock and ultimately cause the market price of our Class A common stock to fall.
22
CITIZENS, INC. AND CONSOLIDATED SUBSIDIARIES
Our articles of incorporation and bylaws, as well as applicable state insurance laws, may discourage takeovers and business combinations that our shareholders might consider to be in their best interests.
Our articles of incorporation and bylaws, as well as various state insurance laws, may delay, deter, render more difficult or prevent a takeover attempt our shareholders might consider in their best interests. As a result, our shareholders will be prevented from receiving the benefit from any premium to the market price of our Class A common stock that may be offered by a bidder in a takeover context. Even in the absence of a takeover attempt, the existence of these provisions may adversely affect the prevailing market price of our Class A common stock if they are viewed as discouraging takeover attempts in the future.
The following provisions in our articles of incorporation and bylaws make it difficult for our Class A shareholders to replace or remove our directors and have other anti-takeover effects that may delay, deter or prevent a takeover attempt:
|
•
|
holders of shares of our Class B common stock elect a simple majority of our board of directors, and all of these shares are owned by the Harold E. Riley Trust; and
|
|
•
|
our board of directors may issue one or more series of preferred stock without the approval of our shareholders.
|
State insurance laws generally require prior approval of a change in control of an insurance company. Generally, such laws provide that control over an insurer is presumed to exist if any person, directly or indirectly, owns, controls, holds with the power to vote, or holds proxies representing 10% or more of the voting securities of the insurer. In considering an application to acquire control of an insurer, an insurance commissioner generally will consider such factors as the experience, competence and financial strength of the proposed acquirer, the integrity of the proposed acquirer's board of directors and executive officers, the proposed acquirer's plans for the management and operation of the insurer, and any anti-competitive results that may arise from the acquisition. In addition, a person seeking to acquire control of an insurance company is required in some states to make filings prior to completing an acquisition if the acquirer and the target insurance company and their affiliates have sufficiently large market shares in particular lines of insurance in those states. These state insurance requirements may delay, deter or prevent our ability to complete an acquisition.
We have never paid any cash dividends on our Class A common stock and do not anticipate doing so in the foreseeable future.
We have never paid cash dividends on our Class A common stock, as it is our policy to retain earnings for use in the operation and expansion of our business. We do not expect to pay cash dividends on our Class A common stock for the foreseeable future.
Item 1B.
UNRESOLVED STAFF COMMENTS
None.
Item 2.
PROPERTIES
We own our principal office in Austin, Texas, consisting of an 80,000 square foot office building in addition to approximately one acre of land nearby that houses storage facilities. Approximately 50,000 square feet is occupied or reserved for our operations. We also own a training facility at Lake Buchanan, Texas. In addition, we own other properties in Texas, Arkansas and Louisiana that are incidental to our operations.
Item 3.
LEGAL PROCEEDINGS
On or about March 16, 2017, Juan Gamboa filed a putative class action lawsuit against the Company and five of its current and former directors and executive officers in the United States District Court, Western District of Texas. The lawsuit alleges the defendants violated Sections 10(b) and 20(a) of the Securities Exchange Act of 1934 and Rule 10b-5 promulgated thereunder by making false and/or misleading statements, as well as failing to disclose material adverse facts about the Company’s business, operations and prospects. The complaint seeks an award of damages in an unspecified amount on behalf of a putative class consisting of persons who purchased the Company’s common stock between March 11, 2015 and March 8, 2017, inclusive. The Company believes that the lawsuit is without merit, and it intends to vigorously defend against all claims asserted. At this time, the Company is unable to reasonably estimate the outcome of this litigation.
In the normal course of business, the Company is subject to various legal and regulatory actions which are immaterial to the Company's financial statements. For more information about the risks related to litigation and regulatory actions, please see the risk factor titled “We are a defendant in lawsuits, which may adversely affect our financial condition and detract from the time
23
CITIZENS, INC. AND CONSOLIDATED SUBSIDIARIES
our management is able to devote to our business, and we are subject to risks related to litigation and regulatory matters.” in Item 1A. Risk Factors.
Item 4.
MINE SAFETY DISCLOSURES
Not applicable.
|
Item 5.
|
MARKET FOR REGISTRANT'S COMMON EQUITY, RELATED STOCKHOLDER MATTERS AND ISSUER PURCHASES OF EQUITY SECURITIES
|
Market Information
Our Class A common stock is traded on the New York Stock Exchange ("NYSE") under the symbol CIA.
Quarterly high and low closing prices per share of our Class A common stock as reported by the NYSE are shown below.
|
|
2016
|
2015
|
|||||||||
|
Quarter Ended
|
High
|
Low
|
High
|
Low
|
|||||||
|
March 31
|
7.82
|
|
6.16
|
|
7.89
|
|
6.03
|
|
|||
|
June 30
|
8.41
|
|
7.07
|
|
7.97
|
|
5.37
|
|
|||
|
September 30
|
10.92
|
|
7.41
|
|
7.52
|
|
5.96
|
|
|||
|
December 31
|
11.69
|
|
7.51
|
|
10.05
|
|
7.17
|
|
|||
Equity Security Holders
The number of stockholders on record on
April 19, 2017
was as follows:
|
•
|
Class A Common Stock -
98,946
|
|
•
|
Class B Common Stock -
1
|
We have never paid cash dividends on our Class A or B common stock and do not expect to pay cash dividends in the foreseeable future. For restrictions on our present and future ability to pay dividends, see Note 6 of the "Notes to Consolidated Financial Statements."
We did not purchase any of our equity securities during any quarter in
2014
,
2015
or
2016
.
Securities Authorized for Issuance Under Equity Compensation Plans
We do not maintain any equity compensation plans or arrangements. Thus, we do not have any securities authorized for issuance under these types of plans, nor have we issued any options, warrants or similar instruments to purchase any of our equity securities.
24
CITIZENS, INC. AND CONSOLIDATED SUBSIDIARIES
Performance Comparison
The following graph compares the change in the Company’s cumulative total stockholder return on its common stock over a five-year period. The following graph assumes a $100 investment on December 31,
2011
, and reinvestment of all dividends in each of the Company’s common shares, the New York Stock Exchange (“NYSE”) Composite and the Hemscott Group Index, a peer group of major U.S.-based insurance companies.
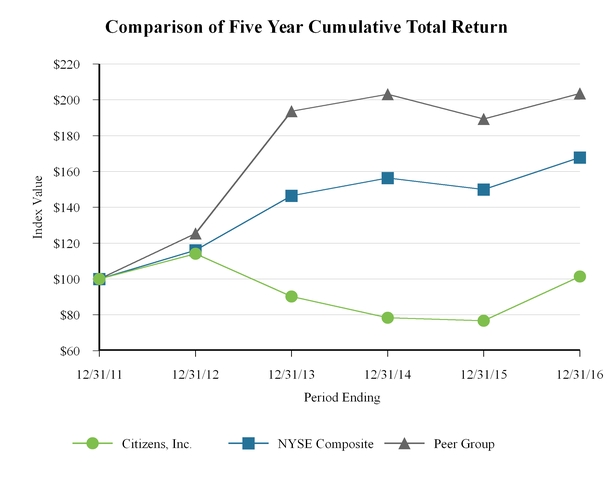
|
|
2011
|
2012
|
2013
|
2014
|
2015
|
2016
|
||||||||||||
|
Citizens, Inc.
|
$
|
100.00
|
|
114.04
|
|
90.30
|
|
78.43
|
|
76.68
|
|
101.34
|
|
|||||
|
NYSE Composite
|
$
|
100.00
|
|
115.99
|
|
146.47
|
|
156.36
|
|
149.97
|
|
167.87
|
|
|||||
|
Peer Group
|
$
|
100.00
|
|
125.36
|
|
193.59
|
|
203.13
|
|
189.31
|
|
203.48
|
|
|||||
The peer group index weights individual company returns for stock market capitalization. The companies included in the peer group index are shown in the following table.
|
American Equity Investment Life Holding
|
|
Independence Holding Co
|
|
Primerica, Inc.
|
|
Atlantic American Corp.
|
Investors Heritage Capital Corp.
|
|
Prudential Financial, Inc.
|
|
|
Aviva PLC
|
|
Kansas City Life Ins. Co.
|
|
Prudential PLC
|
|
China Life Ins Co. Limited
|
|
Lincoln National Corp.
|
|
Reinsurance Group of America, Inc.
|
|
Citizens, Inc.
|
|
Metlife, Inc.
|
|
Torchmark, Corp.
|
|
Genworth Financial, Inc.
|
|
National Western Life Ins. Co.
|
|
UTG, Inc.
|
25
CITIZENS, INC. AND CONSOLIDATED SUBSIDIARIES
Item 6.
SELECTED FINANCIAL DATA
The following table presents selected financial data of the Company. This should be read in conjunction with Item 7. "Management's Discussion and Analysis of Financial Condition and Results of Operations" and Item 8. "Financial Statements and Supplementary Data" of this Form 10-K. The 2012-2015 amounts have been adjusted for the immaterial errors described in Note 1 to the consolidated financial statements.
|
|
Years ended December 31,
|
||||||||||||||
|
|
2016
|
2015
|
2014
|
2013
|
2012
|
||||||||||
|
|
(In thousands, except per share data)
|
||||||||||||||
|
Operating items
|
|
|
|
|
|
||||||||||
|
Insurance premiums
|
$
|
197,876
|
|
194,480
|
|
188,532
|
|
176,158
|
|
169,873
|
|
||||
|
Net investment income
|
48,560
|
|
45,782
|
|
41,062
|
|
36,597
|
|
31,725
|
|
|||||
|
Realized investment gains (losses)
|
(1,985
|
)
|
(5,459
|
)
|
(19
|
)
|
(247
|
)
|
196
|
|
|||||
|
Change in fair value of warrants
|
—
|
|
—
|
|
—
|
|
—
|
|
451
|
|
|||||
|
Total revenues
|
245,406
|
|
236,268
|
|
230,225
|
|
213,636
|
|
202,759
|
|
|||||
|
Net income (loss)
|
1,969
|
|
(3,143
|
)
|
(5,970
|
)
|
5,279
|
|
4,912
|
|
|||||
|
Balance sheet data
|
|
|
|
|
|
|
|
|
|
|
|||||
|
Total assets
|
1,583,668
|
|
1,480,751
|
|
1,413,798
|
|
1,212,837
|
|
1,171,779
|
|
|||||
|
Total liabilities
|
1,334,568
|
|
1,233,825
|
|
1,151,466
|
|
963,591
|
|
905,720
|
|
|||||
|
Total stockholders' equity
|
249,100
|
|
246,926
|
|
262,332
|
|
249,246
|
|
266,059
|
|
|||||
|
Life insurance in force
|
4,497,735
|
|
4,478,202
|
|
4,662,660
|
|
4,616,128
|
|
4,976,157
|
|
|||||
|
Per share data
|
|
|
|
|
|
|
|
|
|
|
|||||
|
Book value per share
|
4.97
|
|
4.93
|
|
5.24
|
|
4.98
|
|
5.31
|
|
|||||
|
Basic and diluted earnings (losses) per Class A share
|
0.04
|
|
(0.06
|
)
|
(0.12
|
)
|
0.11
|
|
0.10
|
|
|||||
See Item 1. "Business" and Item 7. "Management's Discussion and Analysis of Financial Condition and Results of Operations," for information that may affect the comparability of the financial data contained in the above table.
26
CITIZENS, INC. AND CONSOLIDATED SUBSIDIARIES
|
Item 7.
|
MANAGEMENT'S DISCUSSION AND ANALYSIS OF FINANCIAL CONDITION AND RESULTS OF OPERATIONS
|
The following is management's discussion and analysis of the consolidated financial condition and consolidated results of operations of the Company. It is intended to be a discussion of certain key financial information regarding the Company and should be read in conjunction with the Consolidated Financial Statements and related Notes to this report on Form 10-K.
Overview
We conduct operations as an insurance holding company emphasizing ordinary life insurance and endowment products in niche markets where we believe we can achieve competitive advantages. As an insurance provider, we collect premiums on an ongoing basis to pay future benefits to our policy and contract holders. Our core operations include issuing:
|
•
|
whole life insurance;
|
|
•
|
endowments;
|
|
•
|
final expense; and
|
|
•
|
limited liability property policies.
|
The Company derives its revenues principally from 1) premiums earned for insurance coverages provided to insureds; 2) net investment income; and 3) net realized capital gains and losses.
Profitability of our insurance operations depends heavily upon the Company’s underwriting discipline, as we seek to manage exposure to loss through favorable risk selection and diversification, management of claims, use of reinsurance, sizing of our in force block, careful monitoring of our mortality and morbidity experience, and management our expense ratio, which we accomplish through economies of scale and management of acquisition costs and other underwriting expenses.
Pricing adequacy depends on a number of factors, including the ability to obtain regulatory approval for rate changes, proper evaluation of underwriting risks, the ability to project future losses based on historical loss experience adjusted for known trends, the Company’s response to competitors, and expectations about regulatory and legal developments and expense levels. The Company seeks to price our insurance policies such that insurance premiums and future net investment income earned on premiums received will cover underwriting expenses and the ultimate cost of paying claims reported on the policies and provide for a profit margin. The Company repriced its top six selling international products at the end of 2016 to increase profitability. Because the products are more expensive for potential policyholders, the Company is closely monitoring sales trends. The Company has the ability to adjust dividend scales and interest crediting rates at its discretion based on economic and other factors. The profitability of fixed annuities, riders and other “spread-based” product features depends largely on the Company’s ability to earn target spreads between earned investment rates on assets and interest credited to policyholders.
The investment return, or yield, on invested assets is an important element of the Company’s earnings since insurance products are priced with the assumption that premiums received can be invested for a period of time before benefits are paid. The majority of the Company’s invested assets have been held in fixed maturities available-for-sale and held-to-maturity securities, primarily in asset classes of corporate bonds, municipal bonds, and government obligation bonds. The interest rate environment has a significant impact on the determination of insurance contract liabilities, our investment rates and yields and our asset/liability management.
The primary investment objective for the Company is to maximize economic value, consistent with acceptable risk parameters, including the management of credit risk and interest rate sensitivity of invested assets, while generating sufficient after-tax income to meet policyholder and corporate obligations. The Company maintains a conservative investment strategy that may vary based on a variety of factors including business needs, regulatory requirements and tax considerations.
We previously announced that we determined that a portion of the life and annuity insurance policies issued by our subsidiary insurance companies failed to qualify for the favorable U.S. federal income tax treatment afforded by Sections 7702 and 72(s) of the Internal Revenue Code ("IRC") of 1986. To the extent that these policies had unreported income build-up, we may be liable to the IRS for failure to withhold taxes or to notify policyholders of their obligation to pay taxes directly to the IRS. We have undertaken an analysis of our potential liability to the IRS arising from this matter, as well as other expenses we may incur to remediate (i.e., conform to the requirements of the IRS) certain previously issued domestic life insurance and annuity policies and to address any missed reporting for policies issued to non-U.S. citizens and have established a best estimate reserve of $
14.4
27
CITIZENS, INC. AND CONSOLIDATED SUBSIDIARIES
million, net of tax as of
December 31, 2016
for probable liabilities and expenses. The probability weighted range of financial estimates relative to this issue is
$7.5 million
to
$44.8 million
, net of tax. This estimated range includes projected toll charges and fees payable to the IRS, as well as estimated increased payout obligations to current and former holders of non-compliant domestic life insurance policies expected to result from remediation of those policies. The amount of our liabilities and expenses depends on a number of uncertainties, including the number of prior tax years for which we may be liable to the IRS, the number of domestic life insurance policies we will be required to remediate, the methodology applicable to the calculation of taxable benefits under non-compliant policies and the amount of time and resources we will require from external advisors who are assisting us with resolving these issues. Given the range of potential outcomes and the significant variables assumed in establishing our estimates, actual amounts incurred may exceed our reserve and also could exceed the high end of our estimated range of liabilities and expenses. To the extent the amount reserved is insufficient to meet the actual amount of our liabilities and expenses, or if our estimates of those liabilities and expenses change in the future, our financial condition and results of operations may be materially adversely affected.
The financial data for 2015 has been restated to correct accounting for policy benefit reserves, DAC and a legal expense accrual and the financial data used for 2014 has been restated to correct accounting for policy benefit reserves and DAC. See Note 1, Correction of Immaterial Errors and Reclassifications of Certain Amounts in the notes to the consolidated financial statements.
Current Financial Highlights
Our
2016
financial results are driven by our historical business management model and traditional life insurance product sales. Although interest rates have risen recently, the historically low interest rate environment continues to impact our results and our industry as investment yields are an integral component of our business operations.
|
•
|
Our assets grew
$103 million
in
2016
and totaled
$1.6 billion
as of
December 31, 2016
.
|
|
•
|
Total stockholders' equity
increased
from
$246.9 million
at
December 31, 2015
, to
$249.1 million
at
December 31, 2016
due to our net income and net unrealized gains on available-for-sale securities in
2016
.
|
|
•
|
Insurance premiums rose
1.7%
and
3.2%
in
2016
and
2015
, respectively, primarily from our life insurance segment, which increased
$3.4 million
from
2015
.
|
|
•
|
Net investment income increased
6.1%
and
11.5%
for
2016
and
2015
, respectively, primarily due to an increase in the investment asset balances in
2016
compared to the prior year and an increase in yields in
2015
. The average yield on the consolidated investment portfolio has changed from a yield of
4.21%
in
2014
up to
4.38%
in
2015
and declining to a yield of
4.28%
in
2016
, as investment rates available have remained low in the sustained low interest rate environment.
|
|
•
|
Realized net investment losses resulted from other-than-temporary impairments ("OTTI") on investment securities which were recorded totaling
$4.3 million
and
$5.4 million
, in
2016
and
2015
, respectively, and are reported as realized losses. The OTTI in 2016 was somewhat offset by realized investment gains on sales of fixed maturity securities in our available-for-sale portfolio and sales of equity securities.
|
|
•
|
During
2016
, claims and surrenders expense increased
3.2%
from the comparable period in
2015
, primarily due to an increase in surrender benefits and matured endowments in the life segment compared to the
2015
levels.
|
|
•
|
Policyholders' dividends decreased
36.4%
in
2016
compared to
2015
, due to the dividend rate actions taken by us at the end of
2015
to improve our product profitability.
|
|
•
|
General expenses increased slightly and remained at relatively high levels due to the tax compliance issue noted above relating to product qualification under IRC section 7702 and 72(s) and remediation costs that have been identified, as well as increased consulting costs for actuarial, tax, and legal assistance.
|
|
•
|
Amortization of deferred policy acquisition expenses increased from
$23.4 million
at
December 31, 2015
to
$28.5 million
at
December 31, 2016
primarily due to the higher surrender activity.
|
28
CITIZENS, INC. AND CONSOLIDATED SUBSIDIARIES
Life Insurance
. For over thirty-seven years, CICA and its predecessors have accepted policy applications from foreign nationals for U.S. Dollar-denominated ordinary whole life insurance and endowment policies. We make our insurance products available using third-party marketing organizations and independent marketing consultants.
Endowment product sales have been on the rise and represented approximately
77.1%
of new sales in the life segment in
2016
. The Company currently offers a fifteen and twenty year endowment and our top selling endowment is a product that matures at age sixty-five. The Company repriced its top six selling international products at the end of 2016 to increase profitability.
Through the domestic market of our Life Insurance segment, we provide ordinary whole life, credit life insurance, and final expense policies to middle and lower income families and individuals in certain markets in the mountain west, mid-west and southern U.S. The majority of our domestic revenues are generated by the policies of domestic life insurance companies we have acquired since 1987.
Home Service Insurance
. We provide final expense ordinary and industrial life insurance to middle and lower income individuals in Louisiana, Mississippi and Arkansas. Our policies in this segment are sold and serviced through a home service marketing distribution system utilizing employee-agents who work on a route system to collect premiums and service policyholders, and through networks of funeral homes that collect premiums and provide personal policyholder service.
Premiums in this segment increased slightly in
2016
compared to
2015
, as renewal premiums increased while first year premiums decreased slightly as the Home Service business is a mature business. This is the same trend we saw in
2015
compared to
2014
.
Economic and Insurance Industry Developments
Significant economic issues impacting our business and industry currently and into the future are discussed below.
|
•
|
Slow increases in the interest rate environment will limit increases in profit margins for insurers. We have been impacted by the historically low interest rate environment over the past several years as our fixed income investment portfolio, primarily invested in callable securities, has been reinvested at lower yields. The Company’s conservative investment strategy has not changed but we have focused new purchases into holding of state, municipalities, essential service and corporate issuers compared to our historical investment in U.S. government holdings. Our investment earnings also impact the reserve and Deferred Acquisition Costs (“DAC”) balances, as assumptions are used in the development of the balances. Due to the recent decline in investment yields on our portfolio, our projection of long-term investment returns has declined. This has resulted in increasing the reserves on policies issued in the current year, as well as reducing the DAC asset.
|
|
•
|
As an increasing percentage of the world population reaches retirement age, we believe we will benefit from increased demand for living benefit products rather than death products, as customers will require cash accumulation to pay expenses to meet their lifetime income needs. Our ordinary life products are designed to accumulate cash values to provide for living expenses in a policy owner's later years, while continuously providing a death benefit.
|
|
•
|
We believe there is a trend toward consolidation of domestic life insurance companies, due to significant losses incurred by the life insurance industry as a result of the credit crisis and related economic pressures, as well as increasing costs of regulatory compliance for domestic life insurance companies. We believe this trend should benefit our acquisition strategy as more complementary acquisition candidates may become available for us to consider.
|
|
•
|
Many of the events and trends affecting the life insurance industry have had an impact on the life reinsurance industry. These events have led to a decline in the availability of reinsurance. While we currently cede a limited amount of our primary insurance business to reinsurers, we may find it difficult to obtain reinsurance in the future, forcing us to seek reinsurers who are more expensive to us. If we cannot obtain affordable reinsurance coverage, either our net exposures will increase or we will have to reduce our underwriting commitments.
|
|
•
|
While our management has extensive experience in writing life insurance policies for foreign residents, changes to foreign laws and regulations and their related application and enforcement, along with currency controls affecting our foreign resident insureds could adversely impact our revenues, results of operations and financial condition.
|
29
CITIZENS, INC. AND CONSOLIDATED SUBSIDIARIES
Acquisition History - Last Five Years
On March 7, 2014, the Company acquired Magnolia Guaranty Life Insurance Company ("MGLIC") in the amount of $5.2 million. MGLIC is a Mississippi domiciled company that began writing business in 1992 and issues primarily industrial life policies through independent funeral homes in the state of Mississippi. We recorded $0.1 million of goodwill as a result of this transaction. MGLIC is reported in our home service segment.
Consolidated Results of Operations
A discussion of consolidated results is presented below, followed by a discussion of Segment Operations and financial results by segment.
Revenues
Insurance revenues are primarily generated from premium revenues and investment income. In addition, realized gains and losses on investment holdings can significantly impact revenues from year to year.
|
|
Years Ended December 31,
|
||||||||
|
|
2016
|
2015
|
2014
|
||||||
|
|
(In thousands)
|
||||||||
|
Revenues:
|
|
|
|
||||||
|
Premiums:
|
|
|
|
||||||
|
Life insurance
|
$
|
191,254
|
|
187,686
|
|
181,857
|
|
||
|
Accident and health insurance
|
1,546
|
|
1,599
|
|
1,557
|
|
|||
|
Property insurance
|
5,076
|
|
5,195
|
|
5,118
|
|
|||
|
Net investment income
|
48,560
|
|
45,782
|
|
41,062
|
|
|||
|
Realized investment losses, net
|
(1,985
|
)
|
(5,459
|
)
|
(19
|
)
|
|||
|
Other income
|
955
|
|
1,465
|
|
650
|
|
|||
|
Total revenues
|
$
|
245,406
|
|
236,268
|
|
230,225
|
|
||
Premium Income
. Premium income derived from life, accident and health, and property insurance sales,
increased
1.7%
during
2016
. The increase resulted primarily from renewal premiums, which increased
2.7%
and
5.1%
in the life segment for
2016
and
2015
and totaled
$168.3 million
,
$164.4 million
and
$157.8 million
on the consolidated level in
2016
,
2015
and
2014
, respectively. New sales, termed as first year premiums, decreased
0.5%
and
2.7%
, and increased
13.2%
in the life segment in
2016
,
2015
and
2014
, respectively.
Endowment sales represent a significant portion of new business sales internationally with the 20-year endowment and endowment to age 65 as our top products. In addition, most of our life insurance policies contain a policy loan provision, which allows the policyholder to use cash value within a policy to pay premiums. The policy loan asset balance
increased
10.8%
and
11.4%
in
2016
and
2015
, year over year.
Net Investment Income
. Net investment income increased to
$48.6 million
in
2016
compared to
$45.8 million
in
2015
, as we experienced higher average invested assets as a result of investment of new premium revenue. Our yield on average invested assets decreased 10 basis points from
2015
to
2016
as it has been difficult to find investments in higher yielding securities with high credit quality.
30
CITIZENS, INC. AND CONSOLIDATED SUBSIDIARIES
Net investment income performance is summarized as follows.
|
|
Years Ended December 31,
|
||||||||
|
|
2016
|
2015
|
2014
|
||||||
|
|
(In thousands, except for %)
|
||||||||
|
Net investment income
|
$
|
48,560
|
|
45,782
|
|
41,062
|
|
||
|
Average invested assets, at amortized cost
|
1,133,705
|
|
1,045,736
|
|
976,079
|
|
|||
|
Yield on average invested assets
|
4.28
|
%
|
4.38
|
%
|
4.21
|
%
|
|||
We have traditionally invested in fixed maturity securities with a large percent held in callable issues. The sustained low interest rate environment of the past several years is holding down yields. While U.S. Treasury interest rates have risen recently after a fairly significant decline during 2016, yields on high quality corporate and municipal securities have been slower to rise. The interest rate direction is uncertain but as market interest rates begin to rise, our call risk will diminish, resulting in our fixed securities maturing at the stated maturity dates and our portfolio yield will rise more slowly over time, as new money investments would be made at higher rates.
Investment income from fixed maturity securities accounted for approximately
87.0%
of total investment income for the year ended
December 31, 2016
. We have increased our investment purchases of corporate and municipal securities over the past several years, with no focus on any particular industry sectors in these security categories, but rather a focus on higher yielding securities. In addition, we currently have
$17.1 million
invested in equity securities related to bond and stock mutual funds as these securities offer a competitive yield with a shorter duration. However, we have reduced our holdings over the last several years due to higher earnings volatility and RBC charges.
|
|
Years Ended December 31,
|
||||||||
|
|
2016
|
2015
|
2014
|
||||||
|
|
(In thousands)
|
||||||||
|
Gross investment income:
|
|
|
|
||||||
|
Fixed maturity securities
|
$
|
43,637
|
|
39,570
|
|
36,670
|
|
||
|
Equity securities
|
851
|
|
2,909
|
|
1,986
|
|
|||
|
Mortgage loans
|
24
|
|
36
|
|
42
|
|
|||
|
Policy loans
|
5,277
|
|
4,614
|
|
4,172
|
|
|||
|
Long-term investments
|
305
|
|
247
|
|
287
|
|
|||
|
Other
|
89
|
|
53
|
|
45
|
|
|||
|
Total investment income
|
50,183
|
|
47,429
|
|
43,202
|
|
|||
|
Less investment expenses
|
(1,623
|
)
|
(1,647
|
)
|
(2,140
|
)
|
|||
|
Net investment income
|
$
|
48,560
|
|
45,782
|
|
41,062
|
|
||
Investment income from fixed maturity investments increased in
2016
due to an increase in the portfolio from new money investment purchases as noted above relative to the fixed maturity portfolio. In addition, the increase in the policy loans asset balance, which represents policyholders utilizing their accumulated policy cash value, contributed to the increase to investment income. Investment income from equity securities has declined as we have reduced our holdings as discussed above.
Realized Losses on Investments
. Net realized investment losses resulted from OTTI on both fixed maturity and equity securities totaling
$4.3 million
and
$5.4 million
, in
2016
and
2015
. The OTTI in 2016 was somewhat offset by realized investment gains on sales of fixed maturity securities in our available-for-sale portfolio and sales of equity securities.
31
CITIZENS, INC. AND CONSOLIDATED SUBSIDIARIES
Realized investment gains (losses) are as follows.
|
|
Years Ended December 31,
|
||||||||
|
|
2016
|
2015
|
2014
|
||||||
|
|
(In thousands)
|
||||||||
|
Realized investment gains (losses):
|
|
|
|
||||||
|
Sales, calls and maturities
|
|
|
|
||||||
|
Fixed maturities
|
$
|
2,024
|
|
(111
|
)
|
359
|
|
||
|
Equity securities
|
303
|
|
37
|
|
49
|
|
|||
|
Net realized investment gains (losses)
|
2,327
|
|
(74
|
)
|
408
|
|
|||
|
Other-than-temporary impairments ("OTTI"):
|
|
|
|
|
|
|
|||
|
Fixed maturities
|
(3,970
|
)
|
(2,998
|
)
|
—
|
|
|||
|
Equity securities
|
(342
|
)
|
(2,387
|
)
|
(427
|
)
|
|||
|
Realized losses on OTTI
|
(4,312
|
)
|
(5,385
|
)
|
(427
|
)
|
|||
|
Net realized investment losses
|
$
|
(1,985
|
)
|
(5,459
|
)
|
(19
|
)
|
||
Benefits and Expenses
|
|
Years Ended December 31,
|
||||||||
|
|
2016
|
2015
|
2014
|
||||||
|
|
(In thousands)
|
||||||||
|
Benefits and expenses:
|
|
|
|
||||||
|
Insurance benefits paid or provided:
|
|
|
|
||||||
|
Claims and surrenders
|
$
|
81,367
|
|
78,879
|
|
68,269
|
|
||
|
Increase in future policy benefit reserves
|
75,881
|
|
77,060
|
|
81,998
|
|
|||
|
Policyholders' dividends
|
6,832
|
|
10,747
|
|
10,102
|
|
|||
|
Total insurance benefits paid or provided
|
164,080
|
|
166,686
|
|
160,369
|
|
|||
|
Commissions
|
44,641
|
|
43,625
|
|
44,021
|
|
|||
|
Other general expenses
|
33,356
|
|
33,287
|
|
36,591
|
|
|||
|
Capitalization of deferred policy acquisition costs
|
(32,732
|
)
|
(31,104
|
)
|
(32,071
|
)
|
|||
|
Amortization of deferred policy acquisition costs
|
28,515
|
|
23,400
|
|
21,083
|
|
|||
|
Amortization of cost of customer relationships acquired
|
2,063
|
|
2,317
|
|
2,182
|
|
|||
|
Total benefits and expenses
|
$
|
239,923
|
|
238,211
|
|
232,175
|
|
||
32
CITIZENS, INC. AND CONSOLIDATED SUBSIDIARIES
Claims and Surrenders.
As noted in the table below, claims, benefits and surrenders
increased
from
$78.9 million
in
2015
to
$81.4 million
in
2016
.
|
|
Years Ended December 31,
|
||||||||
|
|
2016
|
2015
|
2014
|
||||||
|
|
(In thousands)
|
||||||||
|
Death claims
|
$
|
23,104
|
|
24,638
|
|
22,452
|
|
||
|
Surrender expenses
|
33,686
|
|
31,682
|
|
24,321
|
|
|||
|
Endowment benefits
|
16,173
|
|
16,273
|
|
16,534
|
|
|||
|
Matured endowments
|
3,392
|
|
1,773
|
|
944
|
|
|||
|
Property claims
|
1,941
|
|
1,689
|
|
1,535
|
|
|||
|
Accident and health benefits
|
462
|
|
388
|
|
520
|
|
|||
|
Other policy benefits
|
2,609
|
|
2,436
|
|
1,963
|
|
|||
|
Total claims and surrenders
|
$
|
81,367
|
|
78,879
|
|
68,269
|
|
||
|
•
|
The Company monitors death claims based upon expectations. These values may routinely fluctuate from year to year. We did experience several higher value claims in the life segment in the first quarter of
2015
.
|
|
•
|
Policy surrenders increased
6.3%
in
2016
from
2015
and
30.3%
from
2014
to
2015
, or
0.7%
and
0.7%
of direct ordinary whole life insurance inforce for
2016
and
2015
, respectively. The increase in surrender expense is primarily related to our international business and is expected to increase over time due to the aging of this block of business. A significant portion of surrenders relates to policies that have been in force over fifteen years and no longer have a surrender charge associated with them. Total direct insurance inforce reported in
2016
was
$5.0 billion
compared to
$5.0 billion
in
2015
and
$4.9 billion
2014
.
|
|
•
|
Endowment benefits decreased slightly in
2016
compared to
2015
amounts. We have a series of international policies that carry an immediate endowment benefit of an amount selected by the policy owner. These benefits have been popular in the Pacific Rim and Latin America, where the Company has experienced increased interest in our guaranteed products in recent years. Annual guaranteed endowments are factored into the premium and, as such, the increase or decrease is expected to have little impact on expected profitability.
|
|
•
|
Matured endowments increased in each of the last two years and we expect this trend to continue as this block of business increases, persists and policies begin to reach maturity.
|
|
•
|
Property claims increased
15%
to approximately
$1.9 million
in
2016
compared with the amount reported for
2015
due to a slight increase in weather related claims.
|
|
•
|
Other policy benefits resulted primarily from interest paid on premium deposits and policy benefit accumulations and increased as these policy liabilities also increased.
|
Reserves
. The change in future policy benefit reserves has
decreased
in
2016
by
1.5%
and in
2015
by
6.0%
, primarily due to higher surrenders in each year. Changes in future policy benefit reserves are largely driven by policyholder activity (e.g. premiums, surrenders, etc.)
Policyholder Dividends
. The Company issues long duration participating policies to foreign residents that are expected to pay dividends to policyholders based upon actual experience. Initially, policyholder dividend scales are factored into the guaranteed premiums at the time the product is developed, based on expected future experience and desired profit goals. As actual and expected experience develops over time, it can become necessary to adjust dividends, as we did at the end of
2015
, in order to maintain our original expected level of long term product profitability. Policyholders' dividends decreased
36.4%
in
2016
compared to
2015
, due to the dividend rate actions that we took at the end of
2015
.
33
CITIZENS, INC. AND CONSOLIDATED SUBSIDIARIES
Commissions
. Commission expense fluctuates in a direct relationship to new and renewal insurance premiums and has
increased
2.3%
in
2016
compared to
2015
as first year premium revenues, on which higher commission rates are paid, remained relatively flat while renewal premiums were up
2.7%
.
Other General Expenses
. Total general expenses
increased
0.2%
on a consolidated basis in
2016
due primarily to increased legal, consulting and audit fees related to our tax compliance issue and business strategies review, as well as higher salaries, bonuses and related employee benefits paid to top executives.
Total general expenses
decreased
9.0%
on a consolidated basis in
2015
due primarily to the tax compliance issue we recognized in 2014 resulting in $10.2 million additional expense in 2014 for our best estimate liability. In 2015, we recorded an additional $3.4 million of expense related to this tax compliance issue.
We perform an expense study on an annual basis, utilizing an enterprise-wide time study, and we adjust cost allocations among entities as needed based upon this review. Any allocation changes are reflected in the segment operations, but do not impact total expenses.
Deferred Policy Acquisition Costs
. Capitalized deferred policy acquisition costs ("DAC") were
$32.7 million
,
$31.1 million
and
$32.1 million
in
2016
,
2015
and
2014
. These costs will vary based upon successful efforts related to newly issued policies and renewal business. Significantly lower amounts are capitalized related to renewal business in correlation with the lower commissions paid on that business compared to first year business which have higher commission rates. In addition, the prolonged low interest rate environment impacted the assumptions used in the development of the DAC asset for new policies issued.
Amortization of DAC totaled
$28.5 million
,
$23.4 million
and
$21.1 million
in
2016
,
2015
and
2014
primarily due to the higher surrender activity, including early duration elections to convert to reduced paid up ("RPU") or extended term insurance ("ETI") in 2016. There are higher deferred acquisition costs associated with early duration conversions to RPU or ETI, which, when converted, increases amortization expense. Amortization of deferred policy acquisition costs is impacted by persistency and the higher level of surrenders is impacting our amortization.
Federal Income Tax
. Federal income tax expense (benefit) was
$3.5 million
,
$1.2 million
and
$4.0 million
in
2016
,
2015
and
2014
, respectively, resulting in effective tax rates of
64.1%
,
(61.8)%
and
(206.2)%
, respectively. The significant changes in rates noted are the result of the tax compliance issue we identified in 2014 which impacted our effective tax rates in each year as these costs are not deductible for tax. Additionally, the Company recorded a tax expense in each year for an uncertain tax position that is affecting the tax rates. Differences between our effective tax rate and the statutory tax rate result from income and expense items that are treated differently for financial reporting and tax purposes.
Segment Operations
Our business is comprised of three operating business segments, as detailed below.
|
•
|
Life Insurance
|
|
•
|
Home Service Insurance
|
|
•
|
Other Non-insurance Enterprises
|
Our insurance operations are the primary focus of the Company, as those segments generate the majority of our income. The amount of insurance, number of policies, and average face amounts of policies issued during the periods indicated are shown below.
|
|
Years Ended December 31,
|
||||||||||||||||||||
|
|
2016
|
2015
|
|||||||||||||||||||
|
|
Amount of
Insurance
Issued
|
Number of
Policies
Issued
|
Average Policy
Face Amount
Issued
|
Amount of
Insurance
Issued
|
Number of
Policies
Issued
|
Average Policy
Face Amount
Issued
|
|||||||||||||||
|
Life
|
$
|
389,125,834
|
|
6,632
|
|
$
|
58,674
|
|
$
|
372,272,014
|
|
6,616
|
|
$
|
56,268
|
|
|||||
|
Home Service
|
178,485,493
|
|
26,847
|
|
6,648
|
|
185,551,760
|
|
27,876
|
|
6,656
|
|
|||||||||
34
CITIZENS, INC. AND CONSOLIDATED SUBSIDIARIES
These segments are reported in accordance with U.S. GAAP. The Company evaluates profit and loss performance based on net income before federal income taxes.
|
|
Income (Loss) Before Federal Income Taxes
|
||||||||
|
|
Years Ended December 31,
|
||||||||
|
|
2016
|
2015
|
2014
|
||||||
|
|
(In thousands)
|
||||||||
|
Life Insurance
|
$
|
5,391
|
|
(4,772
|
)
|
(4,077
|
)
|
||
|
Home Service Insurance
|
2,339
|
|
4,538
|
|
2,870
|
|
|||
|
Other Non-Insurance Enterprises
|
(2,247
|
)
|
(1,709
|
)
|
(743
|
)
|
|||
|
Total
|
$
|
5,483
|
|
(1,943
|
)
|
(1,950
|
)
|
||
Life Insurance
Our Life Insurance segment primarily issues ordinary whole life insurance and endowment policies in U.S. Dollar-denominated amounts to foreign residents in approximately
30
countries through approximately
1,525
independent marketing consultants, and domestically through over
60
independent marketing firms and consultants throughout the United States.
|
|
Years Ended December 31,
|
||||||||
|
|
2016
|
2015
|
2014
|
||||||
|
|
(In thousands)
|
||||||||
|
Revenue:
|
|
|
|
||||||
|
Premiums
|
$
|
151,195
|
|
147,832
|
|
142,358
|
|
||
|
Net investment income
|
33,350
|
|
30,206
|
|
26,454
|
|
|||
|
Realized investment losses, net
|
(1,685
|
)
|
(3,873
|
)
|
(182
|
)
|
|||
|
Other income
|
882
|
|
1,008
|
|
504
|
|
|||
|
Total revenue
|
183,742
|
|
175,173
|
|
169,134
|
|
|||
|
Benefits and expenses:
|
|
|
|
|
|
|
|||
|
Insurance benefits paid or provided:
|
|
|
|
|
|
|
|||
|
Claims and surrenders
|
58,440
|
|
55,912
|
|
46,021
|
|
|||
|
Increase in future policy benefit reserves
|
71,373
|
|
73,259
|
|
76,858
|
|
|||
|
Policyholders' dividends
|
6,774
|
|
10,695
|
|
10,045
|
|
|||
|
Total insurance benefits paid or provided
|
136,587
|
|
139,866
|
|
132,924
|
|
|||
|
Commissions
|
29,235
|
|
28,336
|
|
28,863
|
|
|||
|
Other general expenses
|
14,284
|
|
16,345
|
|
19,274
|
|
|||
|
Capitalization of deferred policy acquisition costs
|
(26,742
|
)
|
(25,268
|
)
|
(26,242
|
)
|
|||
|
Amortization of deferred policy acquisition costs
|
24,428
|
|
20,025
|
|
17,778
|
|
|||
|
Amortization of cost of customer relationships acquired
|
559
|
|
641
|
|
614
|
|
|||
|
Total benefits and expenses
|
178,351
|
|
179,945
|
|
173,211
|
|
|||
|
Income (loss) before federal income tax expense
|
$
|
5,391
|
|
(4,772
|
)
|
(4,077
|
)
|
||
Premiums
. Premium revenues increased for
2016
compared to
2015
and
2014
, due to higher international renewal premiums, which have experienced strong persistency as this block of insurance ages. First year premiums decreased slightly in the current year, which we believe is due to cutting dividend rates to make our products more profitable, but which appeared to have less of an impact that we anticipated. Sales from Colombia, Taiwan and Brazil represented the majority of the premium increase.
35
CITIZENS, INC. AND CONSOLIDATED SUBSIDIARIES
Life Insurance premium breakout is detailed below.
|
|
Years Ended December 31,
|
||||||||
|
|
2016
|
2015
|
2014
|
||||||
|
|
(In thousands)
|
||||||||
|
Premiums:
|
|
|
|
||||||
|
First year
|
$
|
21,434
|
|
21,541
|
|
22,142
|
|
||
|
Renewal
|
129,762
|
|
126,291
|
|
120,216
|
|
|||
|
Total premium
|
$
|
151,196
|
|
147,832
|
|
142,358
|
|
||
Endowment sales represent a significant portion of new business sales internationally, as these products continue to exceed our whole life sales in the current markets. In addition, most of our life insurance policies contain a policy loan provision, which allows the policyholder to use cash value of a policy to pay premiums. The policy loan asset balance increased
10.8%
year over year.
The following table sets forth, by country, our direct premiums from our international life insurance business for the periods indicated. Our international business and premium collections could be impacted by future changes relative to laws, regulations or economic events in the countries from which we accept applications.
|
|
Years ended December 31,
|
|||||||||||||||||||
|
|
2016
|
2015
|
2014
|
|||||||||||||||||
|
|
(In thousands, except for %)
|
|||||||||||||||||||
|
Country
|
|
|
|
|
|
|
||||||||||||||
|
Venezuela
|
$
|
31,107
|
|
21.2
|
%
|
$
|
31,948
|
|
22.4
|
%
|
$
|
31,175
|
|
22.8
|
%
|
|||||
|
Colombia
|
29,643
|
|
20.2
|
|
27,589
|
|
19.3
|
|
27,472
|
|
20.1
|
|
||||||||
|
Taiwan
|
18,590
|
|
12.7
|
|
18,031
|
|
12.6
|
|
16,686
|
|
12.2
|
|
||||||||
|
Ecuador
|
15,456
|
|
10.5
|
|
15,527
|
|
10.9
|
|
15,364
|
|
11.2
|
|
||||||||
|
Brazil
|
9,856
|
|
6.7
|
|
8,960
|
|
6.3
|
|
1,703
|
|
1.2
|
|
||||||||
|
Other Non-U.S.
|
41,992
|
|
28.7
|
|
40,529
|
|
28.5
|
|
44,574
|
|
32.5
|
|
||||||||
|
Total
|
$
|
146,644
|
|
100.0
|
%
|
$
|
142,584
|
|
100.0
|
%
|
$
|
136,974
|
|
100.0
|
%
|
|||||
We continue to report strong first year and renewal premiums in our top producing countries as noted above, however this business is dependent on our clients having access to U.S. dollars. Our international business and premium collections could be impacted by our inability to comply with current or future foreign laws or regulations applicable to the Company or our independent consultants in the countries from which we accept applications as well as by marketing or operational changes made by the Company to comply with those laws or regulations. Our international business may also be affected by economic or other events in foreign countries in which our policies are marketed. Venezuela, for example, is continuing to experience civil unrest due to local demonstrations against crime, corruption and soaring inflation. See "Item 1A. Risk Factors" on pages 10 and 17 for additional information.
36
CITIZENS, INC. AND CONSOLIDATED SUBSIDIARIES
The following table sets forth our direct premiums by state from our domestic business for the periods indicated.
|
|
Years ended December 31,
|
|||||||||||||||||||
|
|
2016
|
2015
|
2014
|
|||||||||||||||||
|
|
(In thousands, except for %)
|
|||||||||||||||||||
|
State
|
|
|
|
|
|
|
||||||||||||||
|
Texas
|
$
|
2,236
|
|
32.5
|
%
|
$
|
2,460
|
|
34.2
|
%
|
$
|
2,630
|
|
36.1
|
%
|
|||||
|
Indiana
|
1,211
|
|
17.6
|
|
1,372
|
|
19.1
|
|
1,363
|
|
18.7
|
|
||||||||
|
Florida
|
708
|
|
10.3
|
|
685
|
|
9.5
|
|
687
|
|
9.4
|
|
||||||||
|
Missouri
|
457
|
|
6.6
|
|
452
|
|
6.3
|
|
467
|
|
6.4
|
|
||||||||
|
Kentucky
|
391
|
|
5.7
|
|
443
|
|
6.2
|
|
467
|
|
6.4
|
|
||||||||
|
Other States
|
1,887
|
|
27.3
|
|
1,783
|
|
24.7
|
|
1,678
|
|
23.0
|
|
||||||||
|
Total
|
$
|
6,890
|
|
100.0
|
%
|
$
|
7,195
|
|
100.0
|
%
|
$
|
7,292
|
|
100.0
|
%
|
|||||
We believe that our domestic business has been declining because our domestic business, unlike our international business, does not have a dedicated marketing team. Moreover, a number of domestic life insurance companies we acquired had blocks of accident and health insurance policies which we did not consider to be a core part of our business and which we have ceded, in large part, to an unaffiliated insurance company under a coinsurance agreement.
Net Investment Income
. Net investment income has increased due to continued growth in average invested assets even though the annual yield has decreased 13 basis points in this segment from
2015
, as discussed in the Consolidated Results of Operations above.
|
|
For the Years Ended December 31,
|
||||||||
|
|
2016
|
2015
|
2014
|
||||||
|
|
(In thousands, except for %)
|
||||||||
|
Net investment income
|
$
|
33,350
|
|
30,206
|
|
26,454
|
|
||
|
Average invested assets, at amortized cost
|
779,592
|
|
684,590
|
|
623,498
|
|
|||
|
Annualized yield on average invested assets
|
4.28
|
%
|
4.41
|
%
|
4.24
|
%
|
|||
Realized Investment Losses, Net
. In
2016
and
2015
, the Company recognized losses on other-than-temporary impairments totaling $2.3 million and $3.8 million, respectively, related to bond and mutual fund holdings. Realized losses of $0.2 million in
2014
were recognized due to the write-down and sale of mutual fund holdings.
Claims and Surrenders
. A breakout of claims and surrender benefits is detailed below.
|
|
For the Years Ended December 31,
|
||||||||
|
|
2016
|
2015
|
2014
|
||||||
|
|
(In thousands)
|
||||||||
|
Death claims
|
$
|
5,886
|
|
6,843
|
|
5,461
|
|
||
|
Surrender expenses
|
30,502
|
|
28,767
|
|
21,265
|
|
|||
|
Endowment benefits
|
16,160
|
|
16,256
|
|
16,506
|
|
|||
|
Matured endowments
|
2,937
|
|
1,304
|
|
565
|
|
|||
|
Accident and health benefits
|
365
|
|
325
|
|
287
|
|
|||
|
Other policy benefits
|
2,590
|
|
2,417
|
|
1,937
|
|
|||
|
Total claims and surrenders
|
$
|
58,440
|
|
55,912
|
|
46,021
|
|
||
37
CITIZENS, INC. AND CONSOLIDATED SUBSIDIARIES
|
•
|
Death claims expense decreased 14.0% in
2016
compared to
2015
and increased 25.3% in
2015
compared to
2014
. No unusual trends have been noted in our claims experience, except we did experience several higher value claims in the first quarter of
2015
, which drove the
2015
increase. Mortality experience is closely monitored by the Company as a key performance indicator and these amounts were within expected levels.
|
|
•
|
We noted increases in surrender expense over the last several years which is primarily related to our international business and is expected to increase over time due to the aging of this block of business. The majority of policy surrender benefits paid is attributable to our international business and historically was related to policies that have been in force over fifteen years, when surrender charges are no longer applicable. However, in 2016 the increased surrender activity is also in the earlier durations (years 1-15), which still have surrender charges. We are seeing various reasons for individuals surrendering their policies, including the sustained slow world-wide economy, individuals simply needing their money and former independent consultants moving business to other insurance carriers.
|
|
•
|
Endowment benefit expense results from the election by policyholders of a product feature that provides an annual benefit. This is a fixed benefit over the life of the contract, and this expense will increase with new sales and improved persistency.
|
|
•
|
Matured endowments increased in each of the last two years and we expect this trend to continue as this block of business increases, persists and policies begin to reach maturity.
|
|
•
|
Other policy benefits resulted primarily from interest paid on premium deposits and policy benefit accumulations and increased as these policy liabilities also increased.
|
Increase in Future Policy Benefit Reserves
. Policy benefit reserves in
2016
decreased compared to the same period in
2015
, primarily as a result of the higher surrenders and slightly lower new sales as noted above.
Endowment sales totaled approximately
$16.5 million
,
$16.4 million
and
$16.1 million
, representing approximately
77.0%
,
76.1%
and
72.7%
of total new first year premiums in
2016
,
2015
, and
2014
, respectively.
Policyholder Dividends
. Policyholders' dividends decreased 36.7% in
2016
compared to
2015
, due to the dividend rate actions taken by us at the end of
2015
to improve our product profitability. The Company issues long duration participating policies to foreign residents that are expected to pay dividends to policyholders based upon actual experience. The life company boards approve any dividends on an annual basis and may change the dividend rates as needed for business purposes. Policyholder dividends are factored into the premiums at the time the product is developed and therefore have no impact on expected profitability.
Capitalization and Amortization of Deferred Policy Acquisition Costs
. Capitalized costs increased, as commission-related costs have increased in the current year compared to
2015
. Amortization of DAC
increased
in the current year by
22.0%
from
2015
as we experienced increased surrender activity in the current year, including early duration elections to convert to reduced paid up ("RPU") or extended term insurance ("ETI") in 2016. There are higher deferred acquisition costs associated with early duration conversions to RPU or ETI, which, when converted, increases amortization expense. Amortization of deferred policy acquisition costs is impacted by persistency and the higher level of surrenders is impacting our amortization.
Commissions
. Commission expense increase or decrease is directly related to the increase or decrease in premiums. First year policy premiums pay a higher commission rate than renewal policy premiums.
Other General Expenses
. The expenses are allocated by segment, based upon an annual expense study performed by the Company. Other general expenses decreased 12% to
$14.3 million
in
2016
compared to
$16.3 million
in
2015
, driven in part by reduced expenses related to the IRC tax compliance issue for life and annuity insurance remediation expense, which totaled $1.9 million in 2016, compared with $4.4 million in 2015, somewhat offset by higher expenses related to actuarial, tax, audit and legal services related to tax compliance and business analysis initiatives. In
2014
, amounts are higher by $7.9 million as compared to
2013
. This increase is due to the estimated remediation costs of $8.3 million associated with the tax compliance issue we identified.
38
CITIZENS, INC. AND CONSOLIDATED SUBSIDIARIES
Home Service Insurance
Our Home Service Insurance segment provides pre-need and final expense ordinary life insurance and annuities to middle and lower income individuals primarily in Louisiana, Mississippi and Arkansas. Our policies in this segment are sold and serviced through funeral homes and a home service marketing distribution system utilizing over
730
employees and independent agents.
|
|
Years Ended December 31,
|
||||||||
|
|
2016
|
2015
|
2014
|
||||||
|
|
(In thousands)
|
||||||||
|
Revenue:
|
|
|
|
||||||
|
Premiums
|
$
|
46,681
|
|
46,648
|
|
46,174
|
|
||
|
Net investment income
|
13,705
|
|
14,063
|
|
13,234
|
|
|||
|
Realized investment gains (losses), net
|
(300
|
)
|
(1,586
|
)
|
116
|
|
|||
|
Other income
|
5
|
|
86
|
|
29
|
|
|||
|
Total revenue
|
60,091
|
|
59,211
|
|
59,553
|
|
|||
|
Benefits and expenses:
|
|
|
|
|
|
|
|||
|
Insurance benefits paid or provided:
|
|
|
|
|
|||||
|
Claims and surrenders
|
22,927
|
|
22,967
|
|
22,248
|
|
|||
|
Increase in future policy benefit reserves
|
4,508
|
|
3,801
|
|
5,140
|
|
|||
|
Policyholders' dividends
|
58
|
|
52
|
|
57
|
|
|||
|
Total insurance benefits paid or provided
|
27,493
|
|
26,820
|
|
27,445
|
|
|||
|
Commissions
|
15,406
|
|
15,289
|
|
15,158
|
|
|||
|
Other general expenses
|
15,252
|
|
13,349
|
|
15,036
|
|
|||
|
Capitalization of deferred policy acquisition costs
|
(5,990
|
)
|
(5,836
|
)
|
(5,829
|
)
|
|||
|
Amortization of deferred policy acquisition costs
|
4,087
|
|
3,375
|
|
3,305
|
|
|||
|
Amortization of cost of customer relationships acquired
|
1,504
|
|
1,676
|
|
1,568
|
|
|||
|
Total benefits and expenses
|
57,752
|
|
54,673
|
|
56,683
|
|
|||
|
Income before federal income tax expense
|
$
|
2,339
|
|
4,538
|
|
2,870
|
|
||
In March of 2014, we completed the acquisition of MGLIC which is a wholly owned subsidiary of SPLIC. MGLIC is licensed in Mississippi and customarily sells policies through independent funeral homes. As part of the conversion process and transitioning policy administration to our computer system, we identified some operational challenges that we are working to improve related to our business processes. The risk profile of this business is higher than the debit based agent collections since the funeral home is the agent and beneficiary to the claims in many cases. We have incorporated policyholder direct mail and contact within the MGLIC operations to help mitigate risks. Our Mississippi clients have experienced enhanced support from the affiliated companies and operational benefits.
Premiums
. The premiums in this segment increased slightly in
2016
compared to
2015
, as renewal premiums increased while first year premiums decreased slightly as the Home Service business is a mature business. This is the same trend we saw in
2015
compared to
2014
.
39
CITIZENS, INC. AND CONSOLIDATED SUBSIDIARIES
The following table sets forth our direct premiums by state for the periods indicated.
|
|
Years ended December 31,
|
|||||||||||||||||||
|
|
2016
|
2015
|
2014
|
|||||||||||||||||
|
|
(In thousands)
|
|||||||||||||||||||
|
State
|
|
|
|
|
|
|
||||||||||||||
|
Louisiana
|
$
|
42,605
|
|
89.6
|
%
|
$
|
42,537
|
|
89.4
|
%
|
$
|
42,057
|
|
89.2
|
%
|
|||||
|
Mississippi
|
2,450
|
|
5.2
|
|
2,564
|
|
5.4
|
|
2,631
|
|
5.6
|
|
||||||||
|
Arkansas
|
1,602
|
|
3.4
|
|
1,585
|
|
3.3
|
|
1,652
|
|
3.5
|
|
||||||||
|
Other States
|
883
|
|
1.8
|
|
871
|
|
1.9
|
|
832
|
|
1.7
|
|
||||||||
|
Total
|
$
|
47,540
|
|
100.0
|
%
|
$
|
47,557
|
|
100.0
|
%
|
$
|
47,172
|
|
100.0
|
%
|
|||||
Direct premiums have remained relatively flat due to the maturity of this business.
Net Investment Income
. Net investment income decreased in
2016
as our average invested assets decreased as did the overall portfolio yield by 2 basis points from
2015
. MGLIC investment income included 10 months, for the period of ownership during 2014.
Net investment income for our home service insurance segment is summarized as follows:
|
|
For the Years Ended December 31,
|
||||||||
|
|
2016
|
2015
|
2014
|
||||||
|
|
(In thousands, except for %)
|
||||||||
|
Net investment income
|
$
|
13,705
|
|
14,063
|
|
13,234
|
|
||
|
Average invested assets, at amortized cost
|
294,132
|
|
300,174
|
|
296,355
|
|
|||
|
Annualized yield on average invested assets
|
4.66
|
%
|
4.68
|
%
|
4.52
|
%
|
|||
Realized Investment Gains (Losses), Net
. In
2016
and
2015
, the Company recognized losses on other-than-temporary impairments totaling $2.0 million and $1.6 million, respectively, related to bond and mutual fund holdings. In 2014, we recorded net gains of $0.1 million resulting from gains from calls and sales related to bonds of $0.2 million less an OTTI adjustment on mutual funds of $0.1 million.
40
CITIZENS, INC. AND CONSOLIDATED SUBSIDIARIES
Claims and Surrenders
. A breakout of claims and surrender benefits is detailed below.
|
|
For the Years Ended December 31,
|
||||||||
|
|
2016
|
2015
|
2014
|
||||||
|
|
(In thousands)
|
||||||||
|
Death claims
|
$
|
17,218
|
|
17,794
|
|
16,991
|
|
||
|
Surrender expenses
|
3,184
|
|
2,915
|
|
3,056
|
|
|||
|
Endowment benefits
|
13
|
|
17
|
|
28
|
|
|||
|
Matured endowments
|
455
|
|
469
|
|
379
|
|
|||
|
Property claims
|
1,941
|
|
1,689
|
|
1,535
|
|
|||
|
Accident and health benefits
|
98
|
|
63
|
|
233
|
|
|||
|
Other policy benefits
|
18
|
|
19
|
|
26
|
|
|||
|
Total claims and surrenders
|
$
|
22,927
|
|
22,966
|
|
22,248
|
|
||
|
•
|
Death claims expense decreased in
2016
compared to
2015
, after increasing in
2015
from
2014
. Death claims can fluctuate from year to year. Mortality experience is closely monitored by the Company as a key performance indicator and these amounts were within expected levels.
|
|
•
|
Surrender expenses are consistent with expectations for the current economic conditions.
|
|
•
|
Property claims
increased
in both
2016
and
2015
related to reported weather claims. The large increase in 2016 was primarily due to tornado activity in Louisiana earlier in the year and high winds that accompanied the severe flooding in Louisiana.
|
Increase in Future Policy Benefit Reserves
. The change in reserves includes estimated reserve changes related to the IRC 7702 tax compliance issue of a decrease of $0.5 million and $0.5 million in
2016
and
2015
, respectively. These reserves decreased in both periods due to a more refined estimate. Reserves increased $1.4 million in
2014
related to the tax compliance issue. Absent the change in reserves related to the IRC tax issue, the change in reserves between the periods was minimal, as premiums were relatively flat and lapse experience was comparable for all three periods presented.
Commissions
. Commission expense was comparable for all three periods presented based upon premiums collected.
Other General Expenses
. These expenses are allocated by segment based upon an annual expense study performed by the Company. The
2016
expenses related to the IRC tax compliance issue for life and annuity insurance remediation expense remained flat compared to the 2015 expense, while in 2015 the expense decreased $1.7 million due to further refinement of our estimates. Both
2016
and
2015
include higher expenses related to actuarial, tax, audit and legal services related to tax compliance and business analysis initiatives, although those costs are even greater in
2016
than in
2015
.
Capitalization and Amortization of Deferred Policy Acquisition Costs ("DAC")
. DAC capitalization is directly correlated to fluctuations in first year commissions. Amortization of DAC was relatively level, between
2015
and
2014
, but increased by 21.1% in
2016
from
2015
. This increase was primarily due to an increase in surrenders and the impact of updated annual GAAP assumptions. We monitor lapse rates as a key component of our insurance operations.
Other Non-Insurance Enterprises
This segment represents the administrative support entities to the insurance operations whose revenues are primarily intercompany and have been eliminated in consolidation under GAAP, which typically results in a segment loss.
Investments
Financial stability and the prevention of capital erosion are important investment considerations for the Company. A primary investment goal is the conservation of assets due to the long-term nature of a significant portion of our liabilities. The administration
41
CITIZENS, INC. AND CONSOLIDATED SUBSIDIARIES
of our investment portfolios is handled internally, pursuant to board-approved investment guidelines, with all trading activity approved by a committee of each entity’s respective board of directors. The guidelines used require that securities are of high quality and investment grade. State insurance statutes prescribe the quality and percentage of the various types of investments that may be made by insurance companies and generally permit investment in qualified state, municipal, federal and foreign government obligations, high quality corporate bonds, preferred and common stock, mortgage loans and real estate within certain specified percentages. The assets selected are generally intended to mature in accordance with the average maturity of the insurance products and to provide the cash flow for our insurance company subsidiaries to meet their respective policyholder obligations. Due to the prolonged low interest rate environment, we have intentionally shortened the duration of our asset portfolio to capitalize on new investment purchases as interest rates rise. As rates rise, we plan to extend assets durations and increase investment yields.
The following table shows the carrying value of our investments by investment category and cash and cash equivalents, and the percentage of each to total invested assets.
|
|
December 31, 2016
|
December 31, 2015
|
|||||||||||
|
|
Carrying
Value
|
% of Total
Carrying Value
|
Carrying
Value
|
% of Total
Carrying Value
|
|||||||||
|
(In thousands)
|
(In thousands)
|
||||||||||||
|
Fixed maturity securities:
|
|
|
|
|
|||||||||
|
U.S. Treasury and U.S. Government-sponsored enterprises
|
$
|
22,695
|
|
1.8
|
%
|
$
|
35,382
|
|
3.0
|
%
|
|||
|
Corporate
|
306,134
|
|
24.3
|
|
237,248
|
|
20.3
|
|
|||||
|
Municipal bonds (2)
|
797,240
|
|
63.4
|
|
719,825
|
|
61.5
|
|
|||||
|
Mortgage-backed (1)
|
2,477
|
|
0.2
|
|
3,015
|
|
0.2
|
|
|||||
|
Foreign governments
|
126
|
|
—
|
|
131
|
|
—
|
|
|||||
|
Total fixed maturity securities
|
1,128,672
|
|
89.7
|
|
995,601
|
|
85.0
|
|
|||||
|
Short-term investments
|
508
|
|
—
|
|
251
|
|
—
|
|
|||||
|
Cash and cash equivalents
|
35,510
|
|
2.8
|
|
82,827
|
|
7.1
|
|
|||||
|
Other investments:
|
|
|
|
|
|||||||||
|
Policy loans
|
66,672
|
|
5.3
|
|
60,166
|
|
5.1
|
|
|||||
|
Equity securities
|
18,159
|
|
1.5
|
|
23,438
|
|
2.0
|
|
|||||
|
Mortgage loans
|
232
|
|
—
|
|
594
|
|
0.1
|
|
|||||
|
Real estate and other long-term investments
|
7,896
|
|
0.7
|
|
8,031
|
|
0.7
|
|
|||||
|
Total cash, cash equivalents and investments
|
$
|
1,257,649
|
|
100.0
|
%
|
$
|
1,170,908
|
|
100.0
|
%
|
|||
(1) Includes
$2.2 million
and
$2.6 million
of U.S. Government agencies and government-sponsored enterprise for the years ended December 31,
2016
and
2015
, respectively.
(2) Includes
$273.4 million
and
$273.1 million
of securities guaranteed by third parties for the years ended
December 31, 2016
and
2015
, respectively.
The current year decline in U.S. government-sponsored securities is due to call activity from this sector and reinvestment into fixed maturity corporate and municipal bond categories. The Company has increased investments in municipals primarily related to Build America taxable bonds, essential services and corporate issuer holdings in various industry sectors.
At
December 31, 2016
, investments in fixed maturity and equity securities were
91.2%
of our total cash, cash equivalents and investments. All of our fixed maturities were classified as either available-for-sale or held-to-maturity securities at
December 31, 2016
and
2015
. We had no fixed maturity or equity securities that were classified as trading securities at
December 31, 2016
or
2015
.
42
CITIZENS, INC. AND CONSOLIDATED SUBSIDIARIES
As previously discussed, our investment portfolios have been impacted significantly by the low interest rate environment over the past several years. The following table shows investment yields by segment operations as of December 31 for each year presented.
|
|
Business Segment
|
||||||||
|
Year
|
Life
Insurance
|
Home
Service
|
Consolidated
|
||||||
|
2016
|
4.28
|
%
|
4.66
|
%
|
4.28
|
%
|
|||
|
2015
|
4.41
|
%
|
4.68
|
%
|
4.38
|
%
|
|||
|
2014
|
4.24
|
%
|
4.52
|
%
|
4.21
|
%
|
|||
Yields on investment assets vary between segment operations due to different portfolio mixes and durations in the segments. The life segment previously invested more in U.S. Government securities, however over the past few years it has invested in municipal and corporate issuers and is now more similar to the home service segment which has had concentrations primarily in the municipal and corporate sectors.
Credit ratings reported for the periods indicated are assigned by a Nationally Recognized Statistical Rating Organization ("NRSRO") such as Moody’s Investors Service, Standard & Poor’s and Fitch Ratings. A credit rating assigned by a NRSRO is a quality based rating, with AAA representing the highest quality and D the lowest, with BBB and above being considered investment grade. In addition, the Company may use credit ratings of the National Association of Insurance Commissioners ("NAIC") Securities Valuation Office ("SVO") as assigned, if there is no NRSRO rating. Securities rated by the SVO are grouped in the equivalent NRSRO category as stated by the SVO and securities that are not rated by a NRSRO are included in the "other" category.
The following table shows the distribution of the credit ratings of our portfolio of fixed maturity securities by carrying value.
|
|
December 31, 2016
|
December 31, 2015
|
|||||||||||
|
|
Carrying
Value
|
% of Total
Carrying Value
|
Carrying
Value
|
% of Total
Carrying Value
|
|||||||||
|
(In thousands)
|
(In thousands)
|
||||||||||||
|
AAA
|
$
|
88,853
|
|
7.9
|
%
|
$
|
76,026
|
|
7.6
|
%
|
|||
|
AA
|
554,211
|
|
49.1
|
|
497,781
|
|
50.0
|
|
|||||
|
A
|
238,350
|
|
21.2
|
|
247,381
|
|
24.9
|
|
|||||
|
BBB
|
215,499
|
|
19.1
|
|
148,656
|
|
14.9
|
|
|||||
|
BB and other
|
31,759
|
|
2.7
|
|
25,757
|
|
2.6
|
|
|||||
|
Totals
|
$
|
1,128,672
|
|
100.0
|
%
|
$
|
995,601
|
|
100.0
|
%
|
|||
The Company made new investments in higher-grade municipals and corporate bonds. Non-investment grade securities are the result of downgrades of issuers or securities acquired during acquisitions of companies, as the Company does not purchase below investment grade securities.
As of
December 31, 2016
, the Company held municipal securities that include third party guarantees. Detailed below is a presentation by NRSRO rating of our municipal holdings by funding type.
43
CITIZENS, INC. AND CONSOLIDATED SUBSIDIARIES
Municipals shown including third party guarantees
|
|
December 31, 2016
|
||||||||||||||||||||||||||
|
|
General Obligation
|
Special Revenue
|
Other
|
Total
|
% Based on
Amortized
Cost
|
||||||||||||||||||||||
|
Fair
Value
|
Amortized
Cost
|
Fair
Value
|
Amortized
Cost
|
Fair
Value
|
Amortized
Cost
|
Fair
Value
|
Amortized
Cost
|
||||||||||||||||||||
|
|
(In thousands, except percentages)
|
||||||||||||||||||||||||||
|
AAA
|
$
|
60,942
|
|
59,272
|
|
25,755
|
|
25,123
|
|
—
|
|
—
|
|
86,697
|
|
84,395
|
|
10.7
|
%
|
||||||||
|
AA
|
179,993
|
|
176,295
|
|
297,510
|
|
290,604
|
|
26,119
|
|
25,530
|
|
503,622
|
|
492,429
|
|
62.5
|
|
|||||||||
|
A
|
20,053
|
|
19,837
|
|
135,657
|
|
132,437
|
|
10,952
|
|
10,438
|
|
166,662
|
|
162,712
|
|
20.7
|
|
|||||||||
|
BBB
|
7,777
|
|
8,297
|
|
30,274
|
|
29,655
|
|
2,008
|
|
2,019
|
|
40,059
|
|
39,971
|
|
5.1
|
|
|||||||||
|
BB and other
|
3,265
|
|
4,262
|
|
2,251
|
|
3,476
|
|
—
|
|
—
|
|
5,516
|
|
7,738
|
|
1.0
|
|
|||||||||
|
Total
|
$
|
272,030
|
|
267,963
|
|
491,447
|
|
481,295
|
|
39,079
|
|
37,987
|
|
802,556
|
|
787,245
|
|
100.0
|
%
|
||||||||
Municipals shown excluding third party guarantees
|
|
December 31, 2016
|
||||||||||||||||||||||||||
|
|
General Obligation
|
Special Revenue
|
Other
|
Total
|
% Based on
Amortized
Cost
|
||||||||||||||||||||||
|
Fair
Value
|
Amortized
Cost
|
Fair
Value
|
Amortized
Cost
|
Fair
Value
|
Amortized
Cost
|
Fair
Value
|
Amortized
Cost
|
||||||||||||||||||||
|
|
(In thousands, except percentages)
|
||||||||||||||||||||||||||
|
AAA
|
$
|
34,225
|
|
34,213
|
|
4,365
|
|
4,362
|
|
—
|
|
—
|
|
38,590
|
|
38,575
|
|
4.9
|
%
|
||||||||
|
AA
|
138,666
|
|
135,382
|
|
249,254
|
|
243,217
|
|
20,396
|
|
19,734
|
|
408,316
|
|
398,333
|
|
50.7
|
|
|||||||||
|
A
|
37,062
|
|
35,955
|
|
151,152
|
|
147,651
|
|
9,859
|
|
9,381
|
|
198,073
|
|
192,987
|
|
24.5
|
|
|||||||||
|
BBB
|
14,139
|
|
14,465
|
|
26,258
|
|
25,257
|
|
—
|
|
—
|
|
40,397
|
|
39,722
|
|
5.0
|
|
|||||||||
|
BB and other
|
47,938
|
|
47,948
|
|
60,418
|
|
60,808
|
|
8,824
|
|
8,872
|
|
117,180
|
|
117,628
|
|
14.9
|
|
|||||||||
|
Total
|
$
|
272,030
|
|
267,963
|
|
491,447
|
|
481,295
|
|
39,079
|
|
37,987
|
|
802,556
|
|
787,245
|
|
100.0
|
%
|
||||||||
The Company held investments in special revenue bonds that were greater than 10% of fair value based upon activity as of
December 31, 2016
, as shown in the table below.
|
Bond Issue Activity
|
Fair
Value
|
Amortized Cost
|
% of Total Fair Value
|
|||||||
|
(In thousands)
|
||||||||||
|
Education
|
$
|
120,578
|
|
117,479
|
|
15.02
|
%
|
|||
|
Utilities
|
171,103
|
|
166,283
|
|
21.32
|
%
|
||||
44
CITIZENS, INC. AND CONSOLIDATED SUBSIDIARIES
The tables below represent the Company’s detailed exposure of municipal holdings in Louisiana, Texas and Florida, which comprise the most significant state concentrations of the total municipal portfolio as of
December 31, 2016
.
|
December 31, 2016
|
||||||||||||||||||||||||
|
|
General Obligation
|
Special Revenue
|
Other
|
Total
|
||||||||||||||||||||
|
Fair
Value
|
Amortized
Cost
|
Fair
Value
|
Amortized
Cost
|
Fair
Value
|
Amortized
Cost
|
Fair
Value
|
Amortized
Cost
|
|||||||||||||||||
|
|
(In thousands)
|
|||||||||||||||||||||||
|
Louisiana securities including third party guarantees
|
|
|
|
|
|
|
|
|
||||||||||||||||
|
AA
|
$
|
8,590
|
|
8,563
|
|
19,068
|
|
18,309
|
|
—
|
|
—
|
|
27,658
|
|
26,872
|
|
|||||||
|
A
|
5,308
|
|
5,147
|
|
5,679
|
|
5,640
|
|
—
|
|
—
|
|
10,987
|
|
10,787
|
|
||||||||
|
BBB
|
—
|
|
—
|
|
375
|
|
379
|
|
—
|
|
—
|
|
375
|
|
379
|
|
||||||||
|
BB and other
|
—
|
|
—
|
|
363
|
|
357
|
|
—
|
|
—
|
|
363
|
|
357
|
|
||||||||
|
Total
|
$
|
13,898
|
|
13,710
|
|
25,485
|
|
24,685
|
|
—
|
|
—
|
|
39,383
|
|
38,395
|
|
|||||||
|
Louisiana securities excluding third party guarantees
|
|
|
|
|
|
|
|
|
|
|
|
|
|
|
|
|
||||||||
|
AA
|
$
|
11,182
|
|
11,003
|
|
17,168
|
|
16,634
|
|
—
|
|
—
|
|
28,350
|
|
27,637
|
|
|||||||
|
A
|
2,207
|
|
2,182
|
|
4,813
|
|
4,709
|
|
—
|
|
—
|
|
7,020
|
|
6,891
|
|
||||||||
|
BBB
|
—
|
|
—
|
|
1,105
|
|
1,042
|
|
—
|
|
—
|
|
1,105
|
|
1,042
|
|
||||||||
|
BB and other
|
509
|
|
525
|
|
2,399
|
|
2,300
|
|
—
|
|
—
|
|
2,908
|
|
2,825
|
|
||||||||
|
Total
|
$
|
13,898
|
|
13,710
|
|
25,485
|
|
24,685
|
|
—
|
|
—
|
|
39,383
|
|
38,395
|
|
|||||||
The Company invests in municipal securities of issuers in the state of Louisiana and receives a credit that reduces its premium tax liability in that state. At
December 31, 2016
, total holdings of municipal securities in Louisiana represented
4.9%
of all municipal holdings based upon fair value.
45
CITIZENS, INC. AND CONSOLIDATED SUBSIDIARIES
The Company also holds
23.8%
of its municipal holdings in Texas issuers.
|
December 31, 2016
|
||||||||||||||||||
|
|
General Obligation
|
Special Revenue
|
Total
|
|||||||||||||||
|
Fair
Value
|
Amortized
Cost
|
Fair
Value
|
Amortized
Cost
|
Fair
Value
|
Amortized
Cost
|
|||||||||||||
|
|
(In thousands)
|
|||||||||||||||||
|
Texas securities including third party guarantees
|
|
|
|
|
|
|
||||||||||||
|
AAA
|
$
|
58,867
|
|
57,248
|
|
15,738
|
|
15,257
|
|
74,605
|
|
72,505
|
|
|||||
|
AA
|
57,964
|
|
57,238
|
|
31,762
|
|
31,052
|
|
89,726
|
|
88,290
|
|
||||||
|
A
|
1,200
|
|
1,203
|
|
16,830
|
|
16,245
|
|
18,030
|
|
17,448
|
|
||||||
|
BBB
|
—
|
|
—
|
|
7,311
|
|
6,755
|
|
7,311
|
|
6,755
|
|
||||||
|
BB and other
|
532
|
|
532
|
|
875
|
|
2,106
|
|
1,407
|
|
2,638
|
|
||||||
|
Total
|
$
|
118,563
|
|
116,221
|
|
72,516
|
|
71,415
|
|
191,079
|
|
187,636
|
|
|||||
|
Texas securities excluding third party guarantees
|
|
|
|
|
|
|
|
|
|
|
|
|
||||||
|
AAA
|
$
|
33,241
|
|
33,223
|
|
1,526
|
|
1,525
|
|
34,767
|
|
34,748
|
|
|||||
|
AA
|
61,728
|
|
59,814
|
|
35,139
|
|
34,169
|
|
96,867
|
|
93,983
|
|
||||||
|
A
|
6,282
|
|
6,146
|
|
21,008
|
|
20,225
|
|
27,290
|
|
26,371
|
|
||||||
|
BBB
|
2,809
|
|
2,726
|
|
7,867
|
|
7,308
|
|
10,676
|
|
10,034
|
|
||||||
|
BB and other
|
14,503
|
|
14,312
|
|
6,976
|
|
8,188
|
|
21,479
|
|
22,500
|
|
||||||
|
Total
|
$
|
118,563
|
|
116,221
|
|
72,516
|
|
71,415
|
|
191,079
|
|
187,636
|
|
|||||
46
CITIZENS, INC. AND CONSOLIDATED SUBSIDIARIES
The Company also holds
11.4%
of its municipal holdings in Florida issuers.
|
December 31, 2016
|
||||||||||||||||||||||||
|
General Obligation
|
Special Revenue
|
Other
|
Total
|
|||||||||||||||||||||
|
Fair
Value |
Amortized
Cost |
Fair
Value |
Amortized
Cost |
Fair
Value |
Amortized
Cost |
Fair
Value |
Amortized
Cost |
|||||||||||||||||
|
(In thousands)
|
||||||||||||||||||||||||
|
Florida securities including third party guarantees
|
||||||||||||||||||||||||
|
AAA
|
$
|
539
|
|
519
|
|
3,790
|
|
3,637
|
|
—
|
|
—
|
|
4,329
|
|
4,156
|
|
|||||||
|
AA
|
—
|
|
—
|
|
58,497
|
|
57,630
|
|
3,869
|
|
3,914
|
|
62,366
|
|
61,544
|
|
||||||||
|
A
|
—
|
|
—
|
|
13,281
|
|
12,926
|
|
10,952
|
|
10,438
|
|
24,233
|
|
23,364
|
|
||||||||
|
BB and other
|
—
|
|
—
|
|
486
|
|
481
|
|
—
|
|
—
|
|
486
|
|
481
|
|
||||||||
|
Total
|
$
|
539
|
|
519
|
|
76,054
|
|
74,674
|
|
14,821
|
|
14,352
|
|
91,414
|
|
89,545
|
|
|||||||
|
Florida securities excluding third party guarantees
|
||||||||||||||||||||||||
|
AA
|
$
|
539
|
|
519
|
|
40,547
|
|
39,871
|
|
3,322
|
|
3,363
|
|
44,408
|
|
43,753
|
|
|||||||
|
A
|
—
|
|
—
|
|
30,401
|
|
29,765
|
|
9,859
|
|
9,381
|
|
40,260
|
|
39,146
|
|
||||||||
|
BB and other
|
—
|
|
—
|
|
4,042
|
|
3,992
|
|
—
|
|
—
|
|
4,042
|
|
3,992
|
|
||||||||
|
Total
|
$
|
539
|
|
519
|
|
76,054
|
|
74,674
|
|
14,821
|
|
14,352
|
|
91,414
|
|
89,545
|
|
|||||||
There were no other states or individual issuer holdings that represented or exceeded 10% of the total municipal portfolio as of
December 31, 2016
.
Impairment Considerations Related to Investments in Fixed Maturity and Equity Securities
We evaluate the carrying value of our fixed maturity and equity securities at least quarterly.
The Company monitors all debt and equity securities on an on-going basis relative to changes in credit ratings, market prices, earnings trends and financial performance, in addition to specific region or industry reviews. The assessment of whether impairments have occurred is based on a case-by-case evaluation of underlying reasons for the decline in fair value. The Company determines other-than-temporary impairment (“OTTI”) by reviewing all relevant evidence related to the specific security issuer as well as the Company's intent to sell the security, or if it is more likely than not that the Company would be required to sell a security before recovery of its amortized cost.
When an OTTI has occurred, the amount of the OTTI recognized in earnings depends on whether the Company intends to sell the security or more likely than not will be required to sell the security before recovery of its amortized cost basis. If the Company intends to sell the security or more likely than not will be required to sell the security before recovery of its amortized cost basis, an OTTI is recognized in earnings equal to the entire difference between the investment's cost and its fair value at the balance sheet date. If the Company does not intend to sell the security and it is not more likely than not that the Company is required to sell the security before recovery of its amortized cost basis, the OTTI will be separated into the following: a) the amount representing the credit loss; and b) the amount related to all other factors. The amount of the total OTTI related to the credit loss is recognized in earnings. The amount of the total OTTI related to other factors is recognized in other comprehensive income, net of applicable taxes. The previous amortized cost basis less the OTTI recognized in earnings becomes the new amortized cost basis of the investment. The new amortized cost is not adjusted for subsequent recoveries in fair value.
47
CITIZENS, INC. AND CONSOLIDATED SUBSIDIARIES
In
2016
and
2015
, the Company recognized losses on other-than-temporary impairments totaling
$4.3 million
and
$5.4 million
, respectively, related to bond and mutual fund holdings. In 2014, impairments of $0.4 million were recorded as a result of our OTTI analysis. Based upon our analysis of whether declines in fair value below cost are temporary or other-than-temporary, management believes that our investments in fixed maturity investments at
December 31, 2016
were not impaired, and no additional other-than-temporary losses need to be recorded. Information on realized gains and losses by category, including OTTI, is set forth in our consolidated financial statements, Note 2 - Investments, in the "Notes to the Consolidated Financial Statements."
Gross unrealized losses on fixed maturities available-for-sale amounted to
$9.2 million
as of
December 31, 2016
and
$7.9 million
as of
December 31, 2015
. This increase in gross unrealized losses was due to an increase in the interest rate environment in the fourth quarter of
2016
, following a fairly significant drop in rates during the first three quarters of
2016
. There were
$0.1 million
and
$0.6 million
of gross unrealized losses on equity securities as of
December 31, 2016
and
2015
. Information on unrealized gains and losses by category is set forth in our consolidated financial statements, Note 2 - Investments, in the "Notes to the Consolidated Financial Statements."
Reinsurance
As is customary among insurance companies, our insurance company subsidiaries reinsure with other companies portions of the life insurance risks they underwrite. A primary purpose of reinsurance agreements is to enable an insurance company to reduce the amount of risk on any particular life and, by reinsuring the amount exceeding the maximum amount the insurance company is willing to retain, to insure individuals in amounts larger than it could without such agreements. Even though a portion of the risk may be reinsured, our insurance company subsidiaries remain liable to perform all the obligations imposed by the policies issued by them and could be liable if their reinsurers were unable to meet their obligations under the reinsurance agreements.
We believe we have established appropriate reinsurance coverage based upon our net retained insured liabilities compared to our surplus.
The effect of reinsurance on premiums is as follows.
|
|
For the Years Ended December 31,
|
||||||||
|
|
2016
|
2015
|
2014
|
||||||
|
|
(In thousands)
|
||||||||
|
Direct premiums
|
$
|
201,074
|
|
197,337
|
|
191,438
|
|
||
|
Reinsurance assumed
|
151
|
|
353
|
|
421
|
|
|||
|
Reinsurance ceded
|
(3,349
|
)
|
(3,210
|
)
|
(3,327
|
)
|
|||
|
Net premiums
|
$
|
197,876
|
|
194,480
|
|
188,532
|
|
||
Our insurance subsidiaries monitor the solvency of their reinsurers in seeking to minimize the risk of loss in the event of default by a reinsurer. The primary reinsurers of our insurance subsidiaries are large, well-capitalized entities.
The effect of reinsurance on life insurance in force is as follows.
|
|
For the Years Ended December 31,
|
||||||||
|
|
2016
|
2015
|
2014
|
||||||
|
|
(In millions)
|
||||||||
|
Direct written life insurance inforce
|
$
|
4,998
|
|
4,958
|
|
4,911
|
|
||
|
Reinsurance assumed
|
23
|
|
37
|
|
269
|
|
|||
|
Reinsurance ceded
|
(523
|
)
|
(517
|
)
|
(517
|
)
|
|||
|
Net life insurance inforce
|
$
|
4,498
|
|
4,478
|
|
4,663
|
|
||
Virtually all of the Company's non-credit accident and health insurance has been reinsured and is administered by Unified Life Insurance Company, an unaffiliated party. The reinsurance recoverables under this agreement are collateralized by assets held in a trust for the benefit of the reinsured policies.
48
CITIZENS, INC. AND CONSOLIDATED SUBSIDIARIES
The Company monitors the credit ratings of our life and property reinsurers. The ratings by A.M. Best Company range from B+ (Good) to A+ (Superior).
SPFIC has first and second event catastrophe reinsurance coverage of $10.0 million per event and a retention level of $500,000 per event. Thus, the first $500,000 of incurred claims and any claims in excess of $10.0 million are SPFIC's responsibility. The reinsurance premium for first event catastrophe reinsurance was
$828,000
,
$873,000
and
$967,000
in
2016
,
2015
and
2014
, respectively.
Liquidity and Capital Resources
Liquidity refers to a company's ability to generate sufficient cash flows to meet the needs of its operations. Liquidity is managed on insurance operations to ensure stable and reliable sources of cash flows to meet obligations and is provided by a variety of sources.
Our liquidity requirements are met primarily by funds provided from operations. Premium deposits and revenues, investment income and investment maturities are the primary sources of funds, while investment purchases, policy benefits, and operating expenses are the primary uses of funds. We historically have not had to liquidate investments to provide cash flow, and there were no liquidity issues in
2016
or
2015
. Our investments consist of
72.1%
of marketable debt securities and
1.5%
of equity securities classified as available-for-sale that could be readily converted to cash for liquidity needs.
A primary liquidity concern is the risk of an extraordinary level of early policyholder withdrawals. We include provisions within our insurance policies, such as surrender charges, that help limit and discourage early withdrawals. Since these contractual withdrawals, as well as the level of surrenders experienced, have been largely consistent with our assumptions in asset liability management, our associated cash outflows have, historically, not had an adverse impact on our overall liquidity. Individual life insurance policies are less susceptible to withdrawal than annuity reserves and deposit liabilities because policyholders may incur surrender charges and undergo a new underwriting process in order to obtain a new insurance policy. Cash flow projections and cash flow tests under various market interest rate scenarios are also performed annually to assist in evaluating liquidity needs and adequacy. We currently anticipate that available liquidity sources and future cash flows will be adequate to meet our needs for funds.
Cash flows from our insurance operations historically have been sufficient to meet current needs. Cash flows from operating activities were
$102.3 million
,
$87.2 million
and
$97.9 million
for the years ended
December 31, 2016
,
2015
and
2014
, respectively. We have traditionally also had significant cash flows from both scheduled and unscheduled fixed maturity security calls, maturities, redemptions, and prepayments, which totaled
$70.4 million
,
$95.6 million
and
$71.4 million
in
2016
,
2015
and
2014
. These cash flows, for the most part, are reinvested in fixed income securities. Net cash outflows from investment activity totaled
$152.1 million
,
$58.0 million
and
$104.0 million
for the years ended
December 31, 2016
,
2015
and
2014
, respectively. The outflows from investing activities for the year ended
December 31, 2016
, primarily related to the investment of excess cash and cash equivalents generated from operations during
2016
, in addition to the investment of excess cash held at the end of 2015. The Company's cash flows from financing activities were
$2.5 million
in
2016
,
$3.0 million
in
2015
and
$2.1 million
in
2014
.
See "Parent Company Liquidity and Capital Resources" below for a discussion of additional Parent Company liquidity.
In 2015, we determined that a portion of the life insurance and annuity policies issued by our subsidiary insurance companies failed to qualify for the favorable U.S. federal income tax treatment afforded by Sections 7702 and 72(s) of the Internal Revenue Code ("IRC") of 1986. As a result, we have established a liability reserve of $
14.4
million, net of tax for probable liabilities and expenses associated with this tax compliance matter, which represents management’s best estimate and we have disclosed an estimated range related to probable liabilities and expenses of
$7.5 million
to
$44.8 million
, net of tax. This estimate and range includes projected toll charges and fees payable to the IRS, as well as estimated increased payout obligations to current and former holders of non-compliant domestic life insurance policies expected to result from remediation of those policies. The amount of our liabilities and expenses depends on a number of uncertainties, including the number of prior tax years for which we may be liable to the IRS, the number of domestic life insurance policies we will be required to remediate, and the methodology applicable to the calculation of taxable benefits under non-compliant policies. Given the range of potential outcomes and the significant variables assumed in establishing our estimates, actual amounts incurred may exceed our reserve and also could exceed the high end of our estimated range of liabilities and expenses.
49
CITIZENS, INC. AND CONSOLIDATED SUBSIDIARIES
This tax compliance issue impacts our policyholders and their tax liabilities relative to these products that fail 7702 and 72(s) for those that will not be remediated. The exposure related to future sales or products in force is unknown at this time. Policyholders could decide to surrender their policies due to this issue which would subsequently result in higher cash outflows due to an increase in surrender activity.
The NAIC has established minimum capital requirements in the form of RBC. RBC considers the type of business written by an insurance company, the quality of its assets, and various other aspects of an insurance company's business to develop a minimum level of capital called "Authorized Control Level Risk-based Capital" and compares this level to an adjusted statutory capital that includes capital and surplus as reported under statutory accounting principles, plus certain investment reserves. Should the ratio of adjusted statutory capital to control level risk-based capital fall below 200%, a series of remedial actions by the affected company would be required.
At
December 31, 2016
, all of our insurance subsidiaries were above the required minimum RBC levels.
On November 1, 2016, SPLIC paid a $20.0 million extraordinary dividend to its parent, CICA. The dividend had no impact on the consolidated financial statements of the Company and will be used by CICA for general corporate purposes. The dividend was approved by the Louisiana Department of Insurance, SPLIC’s state of domicile. SPLIC’s risk-based capital after the dividend remains is in excess of minimum capital requirements.
In the second quarter of 2016, Citizens, Inc. purchased Class A Common shares from CTI with an approximate fair value of $0.8 million.
Contractual Obligations and Off-balance Sheet Arrangements
We have committed to the following contractual obligations as of
December 31, 2016
, with the payments due by the period indicated below:
|
Contractual Obligation
|
Total
|
Less than 1
Year
|
1 to 3 Years
|
3 to 5 Years
|
More than 5
Years
|
|||||||||||
|
|
(In thousands)
|
|||||||||||||||
|
Operating leases
|
$
|
1,255
|
|
481
|
|
553
|
|
221
|
|
—
|
|
|||||
|
Future policy benefit reserves:
|
|
|
||||||||||||||
|
Life insurance
|
1,060,906
|
|
389
|
|
2,185
|
|
21,422
|
|
1,036,910
|
|
||||||
|
Annuities
|
69,578
|
|
33,286
|
|
14,919
|
|
6,432
|
|
14,941
|
|
||||||
|
Accident and health
|
1,022
|
|
1,022
|
|
—
|
|
|
|
—
|
|
||||||
|
Total future policy benefit reserves
|
1,131,506
|
|
34,697
|
|
17,104
|
|
27,854
|
|
1,051,851
|
|
||||||
|
Policy claims payable:
|
|
|
|
|
|
|
|
|
|
|
||||||
|
Life insurance
|
8,830
|
|
8,830
|
|
—
|
|
—
|
|
—
|
|
||||||
|
Accident and health
|
208
|
|
208
|
|
—
|
|
—
|
|
—
|
|
||||||
|
Casualty
|
500
|
|
391
|
|
109
|
|
—
|
|
—
|
|
||||||
|
Total policy claims payable
|
9,538
|
|
9,429
|
|
109
|
|
—
|
|
—
|
|
||||||
|
Total purchase obligations
|
—
|
|
—
|
|
—
|
|
—
|
|
—
|
|
||||||
|
Total contractual obligations
|
$
|
1,142,299
|
|
44,607
|
|
17,766
|
|
28,075
|
|
1,051,851
|
|
|||||
The payments related to the future policy benefits and policy claims payable reflected in the table above have been projected utilizing assumptions based upon our historical experience and anticipated future experience.
The Company does not have off-balance sheet arrangements at
December 31, 2016
and, therefore, does not expect any future effects on the Company's financial condition related to any such arrangements. We do not utilize special purpose entities as investment vehicles, nor are there any such entities in which we have an investment that engages in speculative activities of any nature, and we do not use such investments to hedge our investment positions.
50
CITIZENS, INC. AND CONSOLIDATED SUBSIDIARIES
Parent Company Liquidity and Capital Resources
Citizens is a holding company and has had minimal operations of its own. Our assets consist of the capital stock of our subsidiaries, cash, fixed income securities, mutual funds and investment real estate. Our cash flows depend primarily upon the availability of statutorily permissible payments, primarily payments under management agreements from our two primary life insurance subsidiaries, CICA and SPLIC. The ability to make payments is limited by applicable laws and regulations of Colorado, CICA's state of domicile, and Louisiana, SPLIC's state of domicile, which subject insurance operations to significant regulatory restrictions. These laws and regulations require, among other things, that these insurance subsidiaries maintain minimum solvency requirements and limit the amount of dividends these subsidiaries can pay to the holding company. We historically have not relied upon dividends from subsidiaries for our cash flow needs. However, CICA and SPLIC both dividend available funds from time to time in relation to new acquisition target strategies.
As of
December 31, 2016
, Citizens had fixed maturities available for sale of
$51.4 million
and cash of
$14.7 million
, which represents additional liquidity for future acquisitions, liquidity support for the life insurance companies and for general corporate purposes.
Additionally, a substantial portion of our international policyholders invest their policy cash dividends and benefits in our Class A common stock through our Stock Investment Plan (the “Plan”). Once a policyholder elects to participate in the Plan, their policy benefits can be used to purchase Citizens Class A common stock through the Plan in the open market. In addition, our existing holders of Class A common stock, our employees and our independent consultants are eligible to participate in the Plan. If fewer policyholders elect to participate in the Plan, or if our international premium collections were to decrease as a result of regulatory or marketing impediments, the trading volume of our Class A common stock may decline from its present levels.
Critical Accounting Policies
The preparation of financial statements in accordance with GAAP requires management to make estimates and assumptions that affect reported amounts and related disclosures. Management considers an accounting estimate to be critical if: (1) it requires assumptions to be made that were uncertain at the time the estimate was made; and (2) changes in the estimate, or different estimates that could have been selected, could have a material effect on our consolidated results of operations or financial condition. While we believe that our estimates, assumptions and judgments are reasonable, they are based on information presently available. Actual results may differ significantly. Additionally, changes in our assumptions, estimates or assessments as a result of unforeseen events or otherwise could have a material impact on our financial position or results of operations.
Management has discussed the development and selection of its critical accounting estimates with the Audit Committee of the Board of Directors, and the Audit Committee has reviewed the disclosure presented below relating to them. See Footnote No. 1, “Summary of Significant Accounting Policies,” of the Notes to our Financial Statements for further information on our critical accounting policies.
Our critical accounting policies are as follows:
Policy Liabilities
Future policy benefit reserves have been computed by the net level premium method with assumptions as to investment yields, dividends on participating business, mortality and withdrawals based upon our experience. The preparation of financial statements requires management to make estimates and assumptions that affect the reported amount of policy liabilities and the increase in future policy benefit reserves. Management's judgments and estimates for future policy benefit reserves provide for possible unfavorable deviation.
We continue to use the original assumptions (including a provision for the risk of adverse deviation) in subsequent periods to determine the changes in the liability for future policy benefits (the "lock-in concept”) unless a premium deficiency exists. Management monitors these assumptions and has determined that a premium deficiency did not exist as of
December 31, 2016
. Management believes that our policy liabilities and increase in future policy benefit reserves as of the years ended
December 31, 2016
,
2015
and
2014
are based upon assumptions, including a provision for the risk of adverse deviation, that do not warrant revision.
51
CITIZENS, INC. AND CONSOLIDATED SUBSIDIARIES
Deferred Policy Acquisition Costs
Acquisition costs, consisting of commissions and policy issuance, underwriting and agency expenses that relate to and vary with the successful production of new business, are deferred. These deferred policy acquisition costs are amortized primarily over the premium-paying period of the policies, using the same assumptions as were used in computing liabilities for future policy benefits.
We utilize the factor method to determine the amount of costs to be capitalized and the ending asset balance. The factor method is based on the ratio of premium revenue recognized for the policies in force at the end of each reporting period compared to the premium revenue recognized for policies in force at the beginning of the reporting period. The factor method ensures that policies which lapsed or surrendered during the reporting period are no longer included in the deferred policy acquisition costs calculation. The factor method limits the amount of deferred costs to its estimated realizable value, provided actual experience is comparable to that contemplated in the factors.
Inherent in the capitalization and amortization of deferred policy acquisition costs are certain management judgments about what acquisition costs are deferred, the ending asset balance and the annual amortization. Approximately
94.0%
of our capitalized deferred acquisition costs are attributed to first year excess commissions. The remaining
6.0%
are attributed to costs that vary with and are directly related to the successful acquisition of new insurance business. Those costs generally include costs related to the production, underwriting and issuance of new business.
DAC is subject to recoverability testing at the time of policy issuance and loss recognition testing on an annual basis, or when an event occurs that might require loss recognition testing. If loss recognition or impairment is necessary, DAC would be written off to the extent that anticipated future premiums and investment income is insufficient to cover expect future policy benefits and expenses. Loss recognition testing that considers, among other things, actual experience and projected future experience calculates the available premium (gross premium less the benefit and expense portion of premium) for the next
50
years. The available premium per policy and the deferred policy acquisition costs per policy are then calculated. The deferred policy acquisition costs are then evaluated for recoverability using best estimate assumptions. Management believes that our deferred policy acquisition costs and related amortization for the years ended
December 31, 2016
,
2015
and
2014
limits the amount of deferred costs to its estimated realizable value. This belief is based upon the analysis performed on capitalized expenses that vary with and are directly related to the acquisition of new and renewal insurance business, utilization of the factor method and recoverability testing at the time of policy issuance and the annual loss recognition testing.
Cost of Customer Relationships Acquired
Cost of Customer Relationships Acquired ("CCRA") is established when we purchase a block of insurance. CCRA is amortized primarily over the emerging profit of the related policies using the same assumptions as were used in computing liabilities for future policy benefits. We utilize various methods to determine the amount of the ending asset balance, including a static model and a dynamic model. Inherent in the amortization of CCRA are certain management judgments about the ending asset balance and the annual amortization. The assumptions used are based upon interest, mortality and lapses at the time of purchase.
A recoverability test that considers, among other things, actual experience and projected future experience is performed at least annually. These annual recoverability tests initially calculate the available premium (gross premium less benefit and expense portion of premium) for the next 50 years. The CCRA is then evaluated for recoverability utilizing best estimate assumptions. Management believes our CCRA and related amortization is recoverable for the years ended
December 31, 2016
,
2015
and
2014
. This belief is based upon the analysis performed on estimated future results of the block and our annual recoverability testing.
Goodwill
Current accounting guidance requires that goodwill balances be reviewed for impairment at least annually or more frequently if events occur or circumstances change that would indicate that a triggering event has occurred. A reporting unit is defined as an operating segment on one level below an operating segment. Most of the Company's reporting units, for which goodwill has been allocated, are equivalent to the Company's operating segment, as there is no discrete financial information reviewed and analyzed by management for the separate components of the segment or all of the components of the segment have similar economic characteristics.
The goodwill impairment test follows a multi-step process as defined under current accounting guidance. An initial review may be performed whereby the assessment is based upon qualitative factors before performing the first test step. In the first step, the
52
CITIZENS, INC. AND CONSOLIDATED SUBSIDIARIES
fair value of a reporting unit is compared to its carrying value. If the carrying value of a reporting unit exceeds its fair value, the second step of the impairment test is performed for purposes of measuring the impairment. In the second step, the fair value of the reporting unit is allocated to all of the assets and liabilities of the reporting unit to determine an implied goodwill value. If the carrying amount of the reporting unit goodwill exceeds the implied goodwill value, an impairment loss is recognized in an amount equal to that excess.
Management’s determination of the fair value of each reporting unit incorporates multiple inputs including discounted cash flow calculations based on assumptions that market participants would make in valuing the reporting unit. Other assumptions can include levels of economic capital, future business growth, and earnings projections.
Valuation of Investments in Fixed Maturity and Equity Securities
The evaluation of securities for impairments is a quantitative and qualitative process, which is subject to risks and uncertainties and is intended to determine whether declines in the fair value of investments should be recognized in current period earnings. The risks and uncertainties include changes in general economic conditions, the issuer's financial condition or future prospects, the effects of changes in interest rates or credit spreads and the expected recovery period.
Based upon current accounting guidance, investment securities must be classified as held-to-maturity, available-for-sale or trading. Management determines the appropriate classification at the time of purchase. The classification of securities is significant since it directly impacts the accounting for unrealized gains and losses on securities. Fixed maturity securities are classified as held-to-maturity and carried at amortized cost when management has the positive intent and the Company has the ability to hold the securities to maturity. Securities not classified as held-to-maturity are classified as available-for-sale and are carried at fair value, with the unrealized holding gains and losses, net of tax, reported in other comprehensive income and do not affect earnings until realized.
The Company evaluates all securities on a quarterly basis, and more frequently when economic conditions warrant additional evaluations, for determining if an OTTI exists pursuant to the accounting guidelines. In evaluating the possible impairment of securities, consideration is given to the length of time and the extent to which the fair value has been less than cost, the financial conditions and near-term prospects of the issuer, and the ability and intent of the Company to retain its investment in the issuer for a period of time sufficient to allow for any anticipated recovery in fair value. In analyzing an issuer's financial condition, the Company may consider whether the securities are issued by the Federal government or its agencies, by government-sponsored agencies, or whether downgrades by bond rating agencies have occurred, and reviews of the issuer's financial condition.
If management determines that an investment experienced an OTTI, management must then determine the amount of OTTI to be recognized in earnings. If management does not intend to sell the security and it is more likely than not that the Company will not be required to sell the security before recovery of its amortized cost basis less any current period loss, the OTTI will be separated into the amount representing the credit loss and the amount related to all other factors. The amount of OTTI related to the credit loss is determined based on the present value of cash flows expected to be collected and is recognized in earnings. The amount of OTTI related to other factors will be recognized in other comprehensive income, net of applicable taxes. The previous amortized cost basis less the OTTI recognized in earnings will become the new amortized cost basis of the investment. If management intends to sell the security or more likely than not will be required to sell the security before recovery of its amortized cost basis less any current period credit loss, the OTTI will be recognized in earnings equal to the entire difference between the investment's amortized cost basis and its fair value at the balance sheet date. Any recoveries related to the value of these securities are recorded as an unrealized gain (as other comprehensive income (loss) in shareholders' equity) and not recognized in income until the security is ultimately sold.
The Company from time to time may dispose of an impaired security in response to asset/liability management decisions, future market movements, business plan changes, or if the net proceeds can be reinvested at a rate of return that is expected to recover the loss within a reasonable period of time.
Premium Revenue and Related Expenses
Premiums on life and accident and health policies are reported as earned when due or, for short duration contracts, over the contract period on a pro rata basis. Benefits and expenses are associated with earned premiums so as to result in recognition of profits over the estimated life of the contracts. This matching is accomplished by means of provisions for future benefits and the capitalization and amortization of deferred policy acquisition costs.
53
CITIZENS, INC. AND CONSOLIDATED SUBSIDIARIES
Annuities are accounted for in a manner consistent with accounting for interest bearing financial instruments. Our primary annuity products do not include fees or other such charges.
Tax Accounting
A deferred tax asset or deferred tax liability is recorded only if a determination is made that it is more-likely-than-not that the tax treatment on which the deferred tax item depends will be sustained in the event of an audit. These determinations inherently involve management's judgment. In addition, the Company must record a tax valuation allowance with respect to deferred tax assets if it is more-likely-than-not that the tax benefit will not be realized. This valuation allowance is in essence a contra account to the deferred tax asset. Management must determine the portion of the deferred tax asset and resulting tax benefit that may not be realized based upon judgment of expected outcomes. Due to significant estimates utilized in establishing the valuation allowance and the potential for changes in facts and circumstances, it is reasonably possible that we will be required to record a valuation allowance in future reporting periods. Such a charge could have a material adverse effect on our results of operations, financial condition and capital position.
Contingencies
An estimated loss from a contingency is accrued and charged to results of operations only if both of the following conditions are met:
|
1.
|
Information available prior to the issuance of the financial statements indicates that it is
probable
(virtual certainty is not required) that an asset has been impaired or a liability incurred as of the date of the financial statements; and
|
|
2.
|
The amount of the loss can be reasonably estimated.
|
Reasonable estimation of a possible loss does not require estimating a single amount of the loss. It requires that a loss be accrued if it can be estimated within a range. If an amount within the range is a better estimate than any other amount within the range, that amount is accrued. If no amount within the range is a better estimate than any other amount, the minimum amount in the range is accrued.
A gain contingency is an uncertain situation that will be resolved in the future, possibly resulting in a gain. We do not allow the recognition of a gain contingency prior to settlement of the underlying event. If we were to have a gain contingency, we would disclose it in the notes to the financial statements.
Recent Accounting Pronouncements
See Item 8. Financial Statements and Supplementary Data, Notes to Consolidated Financial Statements, Note 1. Accounting Pronouncements.
54
CITIZENS, INC. AND CONSOLIDATED SUBSIDIARIES
|
Item 7A.
|
QUANTITATIVE AND QUALITATIVE DISCLOSURES ABOUT MARKET RISK
|
General
The nature of our business exposes us to market risk relative to our invested assets and policy liabilities. Market risk is the risk of loss that may occur when changes in interest rates and public equity prices adversely affect the value of our invested assets. Interest rate risk is our primary market risk exposure. Substantial and sustained increases and decreases in market interest rates can affect the fair value of our investments. The fair value of our fixed maturity portfolio generally increases when interest rates decrease and decreases when interest rates increase.
The following table summarizes net unrealized gains and losses as of the dates indicated.
|
|
December 31, 2016
|
December 31, 2015
|
||||||||||||||||
|
|
Amortized
Cost
|
Fair
Value
|
Net
Unrealized
Gains
(Losses)
|
Amortized
Cost
|
Fair
Value
|
Net
Unrealized
Gains
(Losses)
|
||||||||||||
|
|
(In thousands)
|
|||||||||||||||||
|
Fixed maturities, available-for-sale
|
$
|
860,473
|
|
881,668
|
|
21,195
|
|
714,137
|
|
735,648
|
|
21,511
|
|
|||||
|
Fixed maturities, held-to-maturity
|
247,004
|
|
252,545
|
|
5,541
|
|
259,953
|
|
264,966
|
|
5,013
|
|
||||||
|
Total fixed maturities
|
$
|
1,107,477
|
|
1,134,213
|
|
26,736
|
|
974,090
|
|
1,000,614
|
|
26,524
|
|
|||||
|
Total equity securities
|
$
|
17,765
|
|
18,159
|
|
394
|
|
23,727
|
|
23,438
|
|
(289
|
)
|
|||||
Market Risk Related to Interest Rates
Our exposure to interest rate changes results from our significant holdings of fixed maturity investments, policy loans and mortgage loans on real estate, all of which comprised over
95.0%
of our cash and investment portfolio as of
December 31, 2016
. These investments are mainly exposed to changes in U.S. Treasury rates. Our fixed maturities investments include U.S. Government-sponsored enterprises, U.S. Government bonds, securities issued by government agencies, state and municipal bonds, and corporate bonds. Approximately
70.8%
of the fixed maturities we owned at market value on
December 31, 2016
are state and political subdivisions which are primarily municipal holdings. These holdings are diversified over several states though approximately 40% of our state and municipal securities are concentrated in three states - Texas, Florida and Louisiana.
Changes in interest rates typically have a sizable effect on the fair value of our debt and equities securities. The interest rate of the ten-year U.S. Treasury bond increased to
2.45%
at
December 31, 2016
, from
2.27%
at
December 31, 2015
. Net unrealized gains on fixed maturity securities totaled
$26.7 million
at
December 31, 2016
, compared to
$26.5 million
at
December 31, 2015
, remaining fairly level as bond interest rates have generally lagged the rise in the U.S. Treasury rates.
55
CITIZENS, INC. AND CONSOLIDATED SUBSIDIARIES
To manage interest risk, we perform periodic projections of asset and liability cash flows to evaluate the potential sensitivity of our investments and liabilities. We assess interest rate sensitivity on an annual basis with respect to our fixed maturities investments using hypothetical test scenarios that assume either upward or downward shifts in the prevailing interest rates. The Company performed an analysis of fair value changes using assumed 100 basis point upward shifts in interest rates, noting that the fair value of our fixed maturity investment portfolio of
$1,134.2 million
would
decrease
approximately
$56.9 million
to a fair value of
$1,077.3 million
upon a 100 basis point increase. The following table shows the effects on the fair values of our fixed maturity investments based upon these scenarios.
|
|
Fair Values of Fixed Maturity Investments
Changes in Interest Rates in Basis Points
|
|||||||||||
|
0
|
+100
|
+200
|
+300
|
|||||||||
|
|
(In thousands)
|
|||||||||||
|
Assumed fair value
|
$
|
1,134,212
|
|
1,077,316
|
|
1,022,114
|
|
963,322
|
|
|||
While the test scenarios are for illustrative purposes only and do not reflect our expectations regarding future interest rates or the performance of fixed-income markets, it is a near-term change that illustrates the potential impact of such events. Due to the composition of our book of insurance business, we believe it is unlikely we would encounter large surrender activity due to an interest rate increase that would force us to dispose of our fixed maturities at a loss.
Our fixed maturity portfolio is exposed to call risk as a significant portion of the current holdings are callable. A decreasing interest rate environment can result in increased call activity as experienced over the past several years, and an increasing rate environment will likely result in securities being paid at their stated maturity.
There are no fixed maturities or other investments that we classify as trading instruments. Approximately
77.7%
of fixed maturities were held in available-for-sale and
22.3%
in held-to-maturity based upon fair value at
December 31, 2016
. At
December 31, 2016
and
2015
, we had no investments in derivative instruments, subprime loans or CDOs (collateralized debt obligations).
Market Risk Related to Equity Prices
Changes in the level or volatility of equity prices affect the value of equity securities we hold as investments. Our equity investments portfolio represented
1.5%
of our total investments at
December 31, 2016
, with
94.4%
invested in diversified equity and bond mutual funds.
|
Item 8.
|
FINANCIAL STATEMENTS AND SUPPLEMENTARY DATA
|
Reference is made to the financial statements, the notes thereto, and the report of our independent registered public accounting firm, as listed on the table of contents.
All other schedules have been omitted as the required information is inapplicable or the information required is presented in the financial statements or the notes thereto filed elsewhere herein.
|
Item 9.
|
CHANGES IN AND DISAGREEMENTS WITH ACCOUNTANTS ON ACCOUNTING AND FINANCIAL DISCLOSURE
|
None.
56
CITIZENS, INC. AND CONSOLIDATED SUBSIDIARIES
|
Item 9A.
|
CONTROLS AND PROCEDURES
|
(a) Evaluation of Disclosure Controls and Procedures
We have established disclosure controls and procedures to ensure, among other things, material information relating to our Company, including its consolidated subsidiaries, is communicated to senior management, including our officers who certify our financial reports, and to the Board of Directors to allow for timely decisions regarding required disclosure.
Our Chief Executive Officer ("CEO") and our Chief Financial Officer ("CFO") are responsible for establishing and maintaining our disclosure controls and procedures (as defined in Rules 13a-15(e) and 15d-15(e) under the Securities Exchange Act of 1934, as amended (the "Exchange Act")). Based upon an evaluation at the end of the period, the Chief Executive Officer and Chief Financial Officer concluded that, in light of the material weaknesses described below, our disclosure controls and procedures were not effective as of the end of the period covered by this annual report.
(b) Management Report on Internal Control over Financial Reporting
Management of our Company is responsible for establishing and maintaining adequate internal control over financial reporting. Management assessed the effectiveness of internal control over financial reporting based on criteria established in
Internal Control — Integrated Framework (2013)
issued by the Committee of Sponsoring Organizations of the Treadway Commission ("COSO"). Based on this assessment, management has concluded that our internal control over financial reporting as of
December 31, 2016
was not effective due to the material weaknesses described below.
A material weakness is a deficiency, or combination of deficiencies, in internal control over financial reporting, such that there is a reasonable possibility that a material misstatement of our annual or interim financial statements will not be prevented or detected on a timely basis. Management has identified the following deficiencies that it believes constituted material weaknesses in our internal control over financial reporting as of December 31, 2016:
|
•
|
Management determined that the Company had ineffective data validation and management review controls over key spreadsheets and system-generated reports. These reports included data and information utilized in the preparation of financial statements and disclosures. We determined that several control deficiencies that exist aggregated to a material weakness related to the design and operating effectiveness of our controls to ensure that key spreadsheets and system-generated reports were properly reviewed for completeness and accuracy. In addition, certain management review controls were not performed at a sufficiently precise level to identify errors that may result in a material misstatement of the financial statements.
|
|
•
|
The Company outsourced to third party service providers the valuation of certain insurance reserves and the computation of income taxes. Management has concluded that the Company’s data validation controls over data provided to and received from third party service providers and management review controls were not designed with appropriate levels of precision or sensitivity to ensure that a material misstatement would be prevented or detected in a timely manner.
|
|
•
|
Management determined that a material weakness exists due to a lack of appropriate internal staff competency and expertise related to complex tax and actuarial computations. This lack of competency impacted the precision, depth and timeliness of management review controls in these areas, resulting in the possibility that a material misstatement in these computations may not have been prevented or detected in a timely manner.
|
Our independent registered public accounting firm, Ernst & Young LLP, has issued an attestation report on the effectiveness of our internal control over financial reporting. The report is included in item 9A(c) of this annual report.
57
CITIZENS, INC. AND CONSOLIDATED SUBSIDIARIES
(c)
Attestation Report of Independent Registered Public Accounting Firm
Report of Independent Registered Public Accounting Firm
The Board of Directors and Shareholders of Citizens, Inc. and subsidiaries:
We have audited Citizens, Inc. and subsidiaries’ internal control over financial reporting as of December 31, 2016, based on criteria established in Internal Control-Integrated Framework issued by the Committee of Sponsoring Organizations of the Treadway Commission (2013 framework) (the COSO criteria). Citizens, Inc. and subsidiaries’ management is responsible for maintaining effective internal control over financial reporting, and for its assessment of the effectiveness of internal control over financial reporting included in the accompanying “Management Report on Internal Control over Financial Reporting”. Our responsibility is to express an opinion on the company’s internal control over financial reporting based on our audit.
We conducted our audit in accordance with the standards of the Public Company Accounting Oversight Board (United States). Those standards require that we plan and perform the audit to obtain reasonable assurance about whether effective internal control over financial reporting was maintained in all material respects. Our audit included obtaining an understanding of internal control over financial reporting, assessing the risk that a material weakness exists, testing and evaluating the design and operating effectiveness of internal control based on the assessed risk, and performing such other procedures as we considered necessary in the circumstances. We believe that our audit provides a reasonable basis for our opinion.
A company’s internal control over financial reporting is a process designed to provide reasonable assurance regarding the reliability of financial reporting and the preparation of financial statements for external purposes in accordance with generally accepted accounting principles. A company’s internal control over financial reporting includes those policies and procedures that (1) pertain to the maintenance of records that, in reasonable detail, accurately and fairly reflect the transactions and dispositions of the assets of the company; (2) provide reasonable assurance that transactions are recorded as necessary to permit preparation of financial statements in accordance with generally accepted accounting principles, and that receipts and expenditures of the company are being made only in accordance with authorizations of management and directors of the company; and (3) provide reasonable assurance regarding prevention or timely detection of unauthorized acquisition, use, or disposition of the company’s assets that could have a material effect on the financial statements.
Because of its inherent limitations, internal control over financial reporting may not prevent or detect misstatements. Also, projections of any evaluation of effectiveness to future periods are subject to the risk that controls may become inadequate because of changes in conditions, or that the degree of compliance with the policies or procedures may deteriorate.
A material weakness is a deficiency, or combination of deficiencies, in internal control over financial reporting, such that there is a reasonable possibility that a material misstatement of the company’s annual or interim financial statements will not be prevented or detected on a timely basis. The following material weaknesses have been identified and included in management’s assessment:
•
Ineffective data validation and management review controls
•
Ineffective supervision of third-party service organizations
•
Ineffective staff competency and expertise
We also have audited, in accordance with the standards of the Public Company Accounting Oversight Board (United States), the 2016 consolidated financial statements of Citizens, Inc. and subsidiaries. These material weaknesses were considered in determining the nature, timing and extent of audit tests applied in our audit of the 2016 financial statements, and this report does not affect our report dated
April 27, 2017
, which expressed an unqualified opinion on those financial statements.
In our opinion, because of the effect of the material weakness described above on the achievement of the objectives of the control criteria, Citizens, Inc. and subsidiaries has not maintained effective internal control over financial reporting as of
December 31, 2016
, based on the COSO criteria.
/s/ Ernst & Young LLP
San Antonio, Texas
April 27, 2017
58
CITIZENS, INC. AND CONSOLIDATED SUBSIDIARIES
(d) Changes in Internal Control over Financial Reporting
With the exception of the remediation efforts described below, there were no other changes in the Company’s internal control over financial reporting during the annual period covered by this report that have materially affected, or are reasonably likely to materially affect, the Company’s internal control over financial reporting.
During 2016, management identified an ineffective control design related to our information technology ("IT") change management process resulting in a material weakness. Management learned that unauthorized programming changes could be put into the IT production environment and would possibly not be detected, due to a design deficiency in established monitoring controls. As of December 31, 2016, the material weakness was fully remediated by implementing a new IT change management control process.
We also have initiated the following remediation efforts to address the identified material weaknesses described above and to enhance our overall financial control environment, though these efforts cannot be considered fully remediated until the applicable remedial controls operate for a sufficient period of time and management has concluded, through testing, that these controls are operating effectively:
|
•
|
Management intends to expand and enhance control procedures during 2017, in all process areas, related to data validation and management review controls.
|
|
•
|
Management intends to assess effectiveness of current third party service provider relationships during 2017 and increase the precision and sensitivity of data validation controls over data provided to and received from third party service providers.
|
|
•
|
Management is planning to add additional high level resources to both the Actuarial and Financial Reporting functions during 2017 to increase expertise and develop a more effective review process in these areas.
|
Management believes the foregoing remedial efforts will effectively remediate the identified material weaknesses but may make further changes deemed appropriate as they implement and monitor the effectiveness of these and other processes, procedures and controls. If not remediated, these control deficiencies could result in material misstatements to the Company’s financial statements.
Item 9B.
OTHER INFORMATION
None
The information in this Part III indicated below is incorporated by reference from our definitive proxy statement pursuant to General Instruction G(3) of Form 10-K. We plan to file our definitive proxy statement within 120 days after December 31, 2016.
Item 10.
DIRECTORS, EXECUTIVE OFFICERS AND CORPORATE GOVERNANCE
Item 10 of this report incorporates by reference the information in our definitive proxy statement under the headings “Election of Directors,” “Executive Officers,” “Section 16(a) Beneficial Ownership Reporting Compliance,” “Code of Ethics,” “Shareholder Proposals” and “Audit Committee.”
Item 11.
EXECUTIVE COMPENSATION
Item 11 of this report incorporates by reference the information in our definitive proxy statement under the headings “Compensation,” “Governance” and “Compensation Committee Report.”
Item 12.
SECURITY OWNERSHIP OF CERTAIN BENEFICIAL OWNERS AND MANAGEMENT AND RELATED STOCKHOLDER MATTERS
Item 12 of this report incorporates by reference the information in our definitive proxy statement under the headings “Securities Authorized for Issuance under Equity Compensation Plans,” and “Control of the Company.”
59
CITIZENS, INC. AND CONSOLIDATED SUBSIDIARIES
Item 13.
CERTAIN RELATIONSHIPS AND RELATED TRANSACTIONS, AND DIRECTOR INDEPENDENCE
Item 13 of this report incorporates by reference the information in our definitive proxy statement under the headings “Control of the Company” and “Governance.”
Item 14.
PRINCIPAL ACCOUNTING FEES AND SERVICES
Item 14 of this report incorporates by reference the information in our definitive proxy statement under the heading “Principal Accounting Fees and Services.”
Item 15.
EXHIBITS, FINANCIAL STATEMENT SCHEDULES
|
(a)
|
(1) and (2) Filings as Part of this Report
|
The financial statements and schedules listed on the following index to financial statements and financial statement schedules are filed under Item 8 as part of this Form 10-K.
|
(b)
|
(3) Exhibits – See the Exhibit Index
|
|
Index to Consolidated Financial Statements and Financial Statement Schedules
|
Page
Reference
|
|
Report of independent registered public accounting firm
|
|
|
Consolidated statements of financial position at December 31, 2016 and 2015
|
|
|
Consolidated statements of comprehensive income (loss) - years ended December 31, 2016, 2015 and 2014
|
|
|
Consolidated statements of stockholders' equity - years ended December 31, 2016, 2015 and 2014
|
|
|
Consolidated statements of cash flows - years ended December 31, 2016, 2015 and 2014
|
|
|
Notes to consolidated financial statements
|
|
|
Schedule II – Condensed Financial Information of Registrant
|
|
|
Schedule III – Supplementary Insurance Information
|
|
|
Schedule IV – Reinsurance
|
|
All other schedules have been omitted because the required information is inapplicable or the information required is presented in the financial statements or the notes thereto filed elsewhere herein.
60
CITIZENS, INC. AND CONSOLIDATED SUBSIDIARIES
Report of Independent Registered Public Accounting Firm
To the Board of Directors and Shareholders of Citizens, Inc.:
We have audited the accompanying consolidated statements of financial position of Citizens, Inc. and subsidiaries as of December 31, 2016 and 2015, and the related consolidated statements of operations and comprehensive income (loss), stockholders' equity and cash flows for each of the three years in the period ended December 31, 2016. Our audits also included the financial statement schedules listed in the Index at Item 15(a). These financial statements and schedules are the responsibility of the Company's management. Our responsibility is to express an opinion on these financial statements and schedules based on our audits.
We conducted our audits in accordance with the standards of the Public Company Accounting Oversight Board (United States). Those standards require that we plan and perform the audit to obtain reasonable assurance about whether the financial statements are free of material misstatement. An audit includes examining, on a test basis, evidence supporting the amounts and disclosures in the financial statements. An audit also includes assessing the accounting principles used and significant estimates made by management, as well as evaluating the overall financial statement presentation. We believe that our audits provide a reasonable basis for our opinion.
In our opinion, the financial statements referred to above present fairly, in all material respects, the consolidated financial position of Citizens, Inc. and subsidiaries at December 31, 2016 and 2015, and the consolidated results of their operations and their cash flows for each of the three years in the period ended December 31, 2016, in conformity with U.S. generally accepted accounting principles. Also, in our opinion, the related financial statement schedules, when considered in relation to the basic financial statements taken as a whole, presents fairly in all material respects the information set forth therein.
We also have audited, in accordance with the standards of the Public Company Accounting Oversight Board (United States), Citizens Inc.’s internal control over financial reporting as of December 31, 2016, based on criteria established in Internal Control-Integrated Framework issued by the Committee of Sponsoring Organizations of the Treadway Commission (2013 framework) and our report dated
April 27, 2017
expressed an adverse opinion thereon.
/s/ Ernst & Young LLP
San Antonio, Texas
April 27, 2017
61
CITIZENS, INC. AND CONSOLIDATED SUBSIDIARIES
|
Consolidated Statements of Financial Position
December 31,
(In thousands)
|
|||||||
|
Assets
|
2016
|
2015
|
|||||
|
Investments:
|
|
||||||
|
Fixed maturities available-for-sale, at fair value (cost: $860,473 and $714,137 in 2016 and 2015, respectively)
|
$
|
881,668
|
|
735,648
|
|
||
|
Fixed maturities held-to-maturity, at amortized cost (fair value: $252,545 and $264,966 in 2016 and 2015, respectively)
|
247,004
|
|
259,953
|
|
|||
|
Equity securities available-for-sale, at fair value (cost: $17,765 and $23,727 in 2016 and 2015, respectively)
|
18,159
|
|
23,438
|
|
|||
|
Mortgage loans on real estate
|
232
|
|
594
|
|
|||
|
Policy loans
|
66,672
|
|
60,166
|
|
|||
|
Real estate held for investment (less $1,083 and $1,721 accumulated depreciation in 2016 and 2015, respectively)
|
5,919
|
|
7,956
|
|
|||
|
Real estate held for sale (less $1,008 accumulated depreciation in 2016)
|
1,939
|
|
—
|
|
|||
|
Other long-term investments
|
38
|
|
75
|
|
|||
|
Short-term investments
|
508
|
|
251
|
|
|||
|
Total investments
|
1,222,139
|
|
1,088,081
|
|
|||
|
Cash and cash equivalents
|
35,510
|
|
82,827
|
|
|||
|
Accrued investment income
|
17,903
|
|
15,406
|
|
|||
|
Reinsurance recoverable
|
3,862
|
|
4,166
|
|
|||
|
Deferred policy acquisition costs
|
167,790
|
|
163,692
|
|
|||
|
Cost of customer relationships acquired
|
19,415
|
|
21,585
|
|
|||
|
Goodwill
|
17,255
|
|
17,255
|
|
|||
|
Other intangible assets
|
966
|
|
971
|
|
|||
|
Deferred tax asset
|
76,869
|
|
67,145
|
|
|||
|
Property and equipment, net
|
7,890
|
|
6,338
|
|
|||
|
Due premiums, net (less $1,600 and $1,490 allowance for doubtful accounts in 2016 and 2015, respectively)
|
12,852
|
|
11,819
|
|
|||
|
Prepaid expenses
|
299
|
|
162
|
|
|||
|
Other assets
|
918
|
|
1,304
|
|
|||
|
Total assets
|
$
|
1,583,668
|
|
1,480,751
|
|
||
|
See accompanying notes to consolidated financial statements.
|
(Continued)
|
62
CITIZENS, INC. AND CONSOLIDATED SUBSIDIARIES
|
Consolidated Statements of Financial Position
December 31, Continued
(In thousands, except share amounts)
|
|||||||
|
Liabilities and Stockholders' Equity
|
2016
|
2015
|
|||||
|
Liabilities:
|
|
||||||
|
Policy liabilities:
|
|
|
|||||
|
Future policy benefit reserves:
|
|
|
|||||
|
Life insurance
|
$
|
1,059,722
|
|
987,373
|
|
||
|
Annuities
|
69,578
|
|
64,933
|
|
|||
|
Accident and health
|
1,022
|
|
1,118
|
|
|||
|
Dividend accumulations
|
20,897
|
|
18,465
|
|
|||
|
Premiums paid in advance
|
48,198
|
|
43,220
|
|
|||
|
Policy claims payable
|
9,538
|
|
9,653
|
|
|||
|
Other policyholders' funds
|
7,744
|
|
7,518
|
|
|||
|
Total policy liabilities
|
1,216,699
|
|
1,132,280
|
|
|||
|
Commissions payable
|
3,540
|
|
2,757
|
|
|||
|
Current federal income tax payable
|
81,270
|
|
71,982
|
|
|||
|
Payable for securities in process of settlement
|
3,061
|
|
2,457
|
|
|||
|
Other liabilities
|
29,998
|
|
24,349
|
|
|||
|
Total liabilities
|
1,334,568
|
|
1,233,825
|
|
|||
|
Commitments and contingencies (Notes 5 and 8)
|
|
|
|
|
|||
|
Stockholders' equity:
|
|
|
|
|
|||
|
Common stock:
|
|
|
|
|
|||
|
Class A, no par value, 100,000,000 shares authorized 52,215,852 shares issued and outstanding 2016 and 2015, including shares in treasury of 3,135,738 in 2016 and 2015
|
259,383
|
|
259,383
|
|
|||
|
Class B, no par value, 2,000,000 shares authorized, 1,001,714 shares issued and outstanding in 2016 and 2015
|
3,184
|
|
3,184
|
|
|||
|
Accumulated deficit
|
(16,248
|
)
|
(18,217
|
)
|
|||
|
Accumulated other comprehensive income:
|
|
|
|||||
|
Unrealized gains on securities, net of tax
|
13,792
|
|
13,587
|
|
|||
|
Treasury stock, at cost
|
(11,011
|
)
|
(11,011
|
)
|
|||
|
Total stockholders' equity
|
249,100
|
|
246,926
|
|
|||
|
Total liabilities and stockholders' equity
|
$
|
1,583,668
|
|
1,480,751
|
|
||
See accompanying notes to consolidated financial statements.
63
CITIZENS, INC. AND CONSOLIDATED SUBSIDIARIES
|
Years ended December 31,
(In thousands, except share amounts)
|
|||||||||||||||||||
|
|
2016
|
2015
|
2014
|
||||||||||||||||
|
Revenues:
|
|||||||||||||||||||
|
Premiums:
|
|
|
|||||||||||||||||
|
Life insurance
|
$
|
191,254
|
|
187,686
|
|
181,857
|
|
||||||||||||
|
Accident and health insurance
|
1,546
|
|
1,599
|
|
1,557
|
|
|||||||||||||
|
Property insurance
|
5,076
|
|
5,195
|
|
5,118
|
|
|||||||||||||
|
Net investment income
|
48,560
|
|
45,782
|
|
41,062
|
|
|||||||||||||
|
Realized investment losses, net
|
(1,985
|
)
|
(5,459
|
)
|
(19
|
)
|
|||||||||||||
|
Other income
|
955
|
|
1,465
|
|
650
|
|
|||||||||||||
|
Total revenues
|
245,406
|
|
236,268
|
|
230,225
|
|
|||||||||||||
|
Benefits and expenses:
|
|
|
|
|
|||||||||||||||
|
Insurance benefits paid or provided:
|
|
|
|
|
|||||||||||||||
|
Claims and surrenders
|
81,367
|
|
78,879
|
|
68,269
|
|
|||||||||||||
|
Increase in future policy benefit reserves
|
75,881
|
|
77,060
|
|
81,998
|
|
|||||||||||||
|
Policyholders' dividends
|
6,832
|
|
10,747
|
|
10,102
|
|
|||||||||||||
|
Total insurance benefits paid or provided
|
164,080
|
|
166,686
|
|
160,369
|
|
|||||||||||||
|
Commissions
|
44,641
|
|
43,625
|
|
44,021
|
|
|||||||||||||
|
Other general expenses
|
33,356
|
|
33,287
|
|
36,591
|
|
|||||||||||||
|
Capitalization of deferred policy acquisition costs
|
(32,732
|
)
|
(31,104
|
)
|
(32,071
|
)
|
|||||||||||||
|
Amortization of deferred policy acquisition costs
|
28,515
|
|
23,400
|
|
21,083
|
|
|||||||||||||
|
Amortization of cost of customer relationships acquired
|
2,063
|
|
2,317
|
|
2,182
|
|
|||||||||||||
|
Total benefits and expenses
|
239,923
|
|
238,211
|
|
232,175
|
|
|||||||||||||
|
Income (loss) before federal income tax expense
|
5,483
|
|
(1,943
|
)
|
(1,950
|
)
|
|||||||||||||
|
Federal income tax expense
|
3,514
|
|
1,200
|
|
4,020
|
|
|||||||||||||
|
Net income (loss)
|
1,969
|
|
(3,143
|
)
|
(5,970
|
)
|
|||||||||||||
|
Per Share Amounts:
|
|
|
|
|
|||||||||||||||
|
Basic and diluted earnings (losses) per share of Class A common stock
|
$
|
0.04
|
|
(0.06
|
)
|
(0.12
|
)
|
||||||||||||
|
Basic and diluted earnings (losses) per share of Class B common stock
|
0.02
|
|
(0.03
|
)
|
(0.06
|
)
|
|||||||||||||
|
Other comprehensive income (loss):
|
|||||||||||||||||||
|
Unrealized gains (losses) on available-for-sale securities:
|
|||||||||||||||||||
|
Unrealized holding gains (losses) arising during period
|
(1,659
|
)
|
(24,217
|
)
|
29,328
|
|
|||||||||||||
|
Reclassification adjustment for losses included in net income
|
1,974
|
|
5,415
|
|
20
|
|
|||||||||||||
|
Unrealized gains (losses) on available-for-sale securities, net
|
315
|
|
(18,802
|
)
|
29,348
|
|
|||||||||||||
|
Income tax expense (benefit) on unrealized gains (losses) on available-for-sale securities
|
110
|
|
(6,539
|
)
|
10,293
|
|
|||||||||||||
|
Other comprehensive income (loss)
|
205
|
|
(12,263
|
)
|
19,055
|
|
|||||||||||||
|
Total comprehensive income (loss)
|
$
|
2,174
|
|
(15,406
|
)
|
13,085
|
|
||||||||||||
See accompanying notes to consolidated financial statements
64
CITIZENS, INC. AND CONSOLIDATED SUBSIDIARIES
|
Consolidated Statements of Stockholders' Equity
|
||||||||||||||||||
|
For the Years Ended December 31, 2016, 2015, 2014
|
||||||||||||||||||
|
(In thousands)
|
||||||||||||||||||
|
|
Common Stock
|
Accumulated
deficit
|
Accumulated
other
comprehensive
income (loss)
|
Treasury
stock
|
Total
Stockholders'
equity
|
|||||||||||||
|
|
Class A
|
Class B
|
||||||||||||||||
|
Balance at December 31, 2013
|
$
|
259,383
|
|
3,184
|
|
(12,542
|
)
|
6,795
|
|
(11,011
|
)
|
245,809
|
|
|||||
|
Cumulative effect of correction of prior years errors - Note 1
|
—
|
|
—
|
|
3,438
|
|
—
|
|
—
|
|
3,438
|
|
||||||
|
Balance at January 1, 2014, as adjusted
|
259,383
|
|
3,184
|
|
(9,104
|
)
|
6,795
|
|
(11,011
|
)
|
249,247
|
|
||||||
|
Comprehensive income:
|
|
|
|
|
|
|
|
|
|
|
|
|
||||||
|
Net loss
|
—
|
|
—
|
|
(5,970
|
)
|
—
|
|
—
|
|
(5,970
|
)
|
||||||
|
Unrealized investment gains, net
|
—
|
|
—
|
|
—
|
|
19,055
|
|
—
|
|
19,055
|
|
||||||
|
Total comprehensive income
|
—
|
|
—
|
|
(5,970
|
)
|
19,055
|
|
—
|
|
13,085
|
|
||||||
|
Balance at December 31, 2014, as adjusted
|
259,383
|
|
3,184
|
|
(15,074
|
)
|
25,850
|
|
(11,011
|
)
|
262,332
|
|
||||||
|
Comprehensive loss:
|
|
|
|
|
|
|
|
|
|
|
|
|
||||||
|
Net loss
|
—
|
|
—
|
|
(3,143
|
)
|
—
|
|
—
|
|
(3,143
|
)
|
||||||
|
Unrealized investment losses, net
|
—
|
|
—
|
|
—
|
|
(12,263
|
)
|
—
|
|
(12,263
|
)
|
||||||
|
Total comprehensive loss
|
—
|
|
—
|
|
(3,143
|
)
|
(12,263
|
)
|
—
|
|
(15,406
|
)
|
||||||
|
Balance at December 31, 2015, as adjusted
|
259,383
|
|
3,184
|
|
(18,217
|
)
|
13,587
|
|
(11,011
|
)
|
246,926
|
|
||||||
|
Comprehensive income:
|
|
|
|
|
|
|
|
|
|
|
|
|
||||||
|
Net income
|
—
|
|
—
|
|
1,969
|
|
—
|
|
—
|
|
1,969
|
|
||||||
|
Unrealized investment gains, net
|
—
|
|
—
|
|
—
|
|
205
|
|
—
|
|
205
|
|
||||||
|
Total comprehensive income
|
—
|
|
—
|
|
1,969
|
|
205
|
|
—
|
|
2,174
|
|
||||||
|
Balance at December 31, 2016
|
$
|
259,383
|
|
3,184
|
|
(16,248
|
)
|
13,792
|
|
(11,011
|
)
|
249,100
|
|
|||||
|
Consolidated Statements of Stockholders' Equity, Continued
Years Ended December 31, 2016, 2015, 2014
(In thousands)
|
||||||||
|
A summary of the number of shares of common stock of Class A, Class B and treasury stock issued is as follows:
|
||||||||
|
|
Common Stock
|
Treasury
|
||||||
|
|
Class A
|
Class B
|
Stock
|
|||||
|
Balance at December 31, 2014
|
52,216
|
|
1,002
|
|
(3,136
|
)
|
||
|
Balance at December 31, 2015
|
52,216
|
|
1,002
|
|
(3,136
|
)
|
||
|
Balance at December 31, 2016
|
52,216
|
|
1,002
|
|
(3,136
|
)
|
||
See accompanying notes to consolidated financial statements.
65
CITIZENS, INC. AND CONSOLIDATED SUBSIDIARIES
|
Years Ended December 31,
(In thousands)
|
|||||||||
|
|
2016
|
2015
|
2014
|
||||||
|
Cash flows from operating activities:
|
|
||||||||
|
Net income (loss)
|
$
|
1,969
|
|
(3,143
|
)
|
(5,970
|
)
|
||
|
Adjustments to reconcile net income to net cash provided by operating activities:
|
|
|
|
|
|
|
|||
|
Net realized losses on investments and other assets
|
1,985
|
|
5,459
|
|
19
|
|
|||
|
Net deferred policy acquisition costs
|
(4,217
|
)
|
(7,704
|
)
|
(10,988
|
)
|
|||
|
Amortization of cost of customer relationships acquired
|
2,063
|
|
2,317
|
|
2,182
|
|
|||
|
Depreciation
|
806
|
|
779
|
|
1,116
|
|
|||
|
Amortization of premiums and discounts on investments
|
14,676
|
|
12,021
|
|
9,738
|
|
|||
|
Deferred federal income tax benefit
|
(9,834
|
)
|
3,515
|
|
(78,880
|
)
|
|||
|
Change in:
|
|
|
|
|
|
|
|||
|
Accrued investment income
|
(2,497
|
)
|
(1,949
|
)
|
(1,110
|
)
|
|||
|
Reinsurance recoverable
|
304
|
|
259
|
|
(31
|
)
|
|||
|
Due premiums
|
(1,033
|
)
|
(1,042
|
)
|
432
|
|
|||
|
Future policy benefit reserves
|
74,583
|
|
76,901
|
|
81,918
|
|
|||
|
Other policyholders' liabilities
|
7,521
|
|
6,059
|
|
8,840
|
|
|||
|
Federal income tax payable
|
9,287
|
|
(6,837
|
)
|
78,207
|
|
|||
|
Commissions payable and other liabilities
|
6,434
|
|
617
|
|
13,003
|
|
|||
|
Other, net
|
224
|
|
(99
|
)
|
(542
|
)
|
|||
|
Net cash provided by operating activities
|
102,271
|
|
87,153
|
|
97,934
|
|
|||
|
Cash flows from investing activities:
|
|
|
|
|
|
|
|||
|
Sale of fixed maturities, available-for-sale
|
20,638
|
|
—
|
|
3,074
|
|
|||
|
Maturities and calls of fixed maturities, available-for-sale
|
56,032
|
|
75,231
|
|
50,405
|
|
|||
|
Maturities and calls of fixed maturities, held-to-maturity
|
14,405
|
|
20,395
|
|
20,991
|
|
|||
|
Purchase of fixed maturities, available-for-sale
|
(234,964
|
)
|
(134,126
|
)
|
(128,906
|
)
|
|||
|
Purchase of fixed maturities, held-to-maturity
|
(5,507
|
)
|
(55,360
|
)
|
(18,032
|
)
|
|||
|
Sale of equity securities, available-for-sale
|
5,100
|
|
43,163
|
|
15,029
|
|
|||
|
Calls of equity securities, available-for-sale
|
822
|
|
150
|
|
200
|
|
|||
|
Purchase of equity securities, available-for-sale
|
—
|
|
(602
|
)
|
(36,297
|
)
|
|||
|
Principal payments on mortgage loans
|
362
|
|
34
|
|
43
|
|
|||
|
Increase in policy loans, net
|
(6,506
|
)
|
(6,134
|
)
|
(5,164
|
)
|
|||
|
Sale of other long-term investments
|
37
|
|
60
|
|
2
|
|
|||
|
Purchase of other long-term investments and real estate
|
(75
|
)
|
—
|
|
(4
|
)
|
|||
|
Purchase of property and equipment
|
(2,214
|
)
|
(590
|
)
|
(481
|
)
|
|||
|
Sale of property and equipment
|
59
|
|
—
|
|
—
|
|
|||
|
Maturity of short-term investments
|
256
|
|
—
|
|
—
|
|
|||
|
Purchase of short-term investments
|
(522
|
)
|
(255
|
)
|
—
|
|
|||
|
Cash used in acquisition, net
|
—
|
|
—
|
|
(4,810
|
)
|
|||
|
Net cash used in investing activities
|
(152,077
|
)
|
(58,034
|
)
|
(103,950
|
)
|
|||
66
CITIZENS, INC. AND CONSOLIDATED SUBSIDIARIES
|
Consolidated Statements of Cash Flows
Years Ended December 31, Continued
(In thousands)
|
|||||||||
|
|
2016
|
2015
|
2014
|
||||||
|
|
|||||||||
|
Cash flows from financing activities:
|
|
||||||||
|
Annuity deposits
|
$
|
8,673
|
|
8,103
|
|
7,243
|
|
||
|
Annuity withdrawals
|
(6,184
|
)
|
(5,103
|
)
|
(5,112
|
)
|
|||
|
Net cash provided by financing activities
|
2,489
|
|
3,000
|
|
2,131
|
|
|||
|
Net increase (decrease) in cash and cash equivalents
|
(47,317
|
)
|
32,119
|
|
(3,885
|
)
|
|||
|
Cash and cash equivalents at beginning of year
|
82,827
|
|
50,708
|
|
54,593
|
|
|||
|
Cash and cash equivalents at end of year
|
$
|
35,510
|
|
82,827
|
|
50,708
|
|
||
|
Supplemental Disclosure of Operating Activities:
|
|
|
|
|
|
|
|||
|
Cash paid during the year for income taxes
|
$
|
4,061
|
|
4,522
|
|
4,670
|
|
||
Supplemental Disclosure of Non-Cash Investing Activities:
None
Supplemental Disclosures of Non-Cash Financing Activities:
None.
See accompanying notes to consolidated financial statements.
67
CITIZENS, INC. AND CONSOLIDATED SUBSIDIARIES
Notes to Consolidated Financial Statements
Note 1:
Summary of Significant Accounting Policies
Basis of Presentation and Consolidation
The accompanying consolidated financial statements of Citizens, Inc. and its wholly-owned subsidiaries have been prepared in conformity with U.S. generally accepted accounting principles ("U.S. GAAP").
The consolidated financial statements include the accounts and operations of Citizens, Inc. ("Citizens"), a Colorado corporation, and its wholly-owned subsidiaries, CICA Life Insurance Company of America ("CICA"), Citizens National Life Insurance Company ("CNLIC"), Security Plan Life Insurance Company ("SPLIC"), Security Plan Fire Insurance Company ("SPFIC"), Magnolia Guaranty Life Insurance Company ("MGLIC"), Computing Technology, Inc. ("CTI"), and Insurance Investors, Inc. ("III"). All significant inter-company accounts and transactions have been eliminated. Citizens and its wholly-owned subsidiaries are collectively referred to as "the Company", "we," or "our."
In accordance with our purchase agreement dated October 7, 2013, we finalized the MGLIC stock acquisition on
March 7, 2014
for approximately
$5.2 million
in cash consideration. The assets recorded as of acquisition were
$12.0 million
, liabilities of $
6.8 million
and stockholders equity of
$5.2 million
. We recorded goodwill of
$0.1 million
related to this purchase. This entity is reported as part of our home service segment and is a wholly owned subsidiary of SPLIC.
We provide primarily life insurance and endowments, as well as a small amount of health insurance policies, through four of our subsidiaries - CICA, SPLIC, MGLIC and CNLIC. CICA and CNLIC issue ordinary whole-life policies, burial insurance, pre-need policies, and accident and health related policies throughout the Midwest and southern United States. CICA also issues ordinary whole-life and endowment policies to non-U.S. residents. SPLIC and MGLIC offer final expense and industrial life insurance in Louisiana, Arkansas and Mississippi, and SPFIC, a wholly-owned subsidiary of SPLIC, writes a limited amount of property insurance in Louisiana. CTI provides data processing systems and services, as well as furniture and equipment, to the Company. III provides aviation transportation to the Company.
Correction of Immaterial Errors and Reclassification of Certain Amounts
Correction of Immaterial Errors
In the course of preparing its consolidated financial statements for the year ended December 31, 2016, the Company identified immaterial errors in its previously filed financial statements. The errors were in the Company’s accounting for DAC and future policy benefits in the life insurance segment and several other immaterial errors in our other two segments.
Two
of the errors were discovered in connection with the Company’s ongoing conversion of its actuarial valuation from a third party service provider to an actuarial valuation modeling software system purchased from a vendor. The errors in valuing DAC and future policy benefits caused the Company to understate amortization of DAC over several years and to overstate the increase in future policy benefit reserves during the same periods, resulting in an overstatement of DAC of
$0.3 million
and an overstatement of future policy benefits of
$7.9 million
at December 31, 2015. There were several other immaterial errors that resulted in negligible impact at December 31, 2015 and 2014. The cumulative errors have been corrected via restatement with a net increase of
$3.4 million
to retained earnings as of January 1, 2014, the earliest period presented. Correcting the errors resulted in a reduction in the Company’s net losses of
$436,000
in 2015 and
$535,000
in 2014.
The Company assessed the materiality of these errors on its previously reported annual financial statements in accordance with SEC Staff Accounting Bulletin ("SAB") No. 99,
Materiality
, and SAB No. 108,
Considering the Effects of Prior Year Misstatements when Quantifying Misstatements in Current Year Financial Statements
and determined that the errors were immaterial to each of the previously reported periods. However, the Company determined that the adjustment to correct the error, if recorded in 2016 operating results, would materially misstate the 2016 financial statements. Accordingly, we are correcting the errors by restating the prior period information, and therefore have revised the Consolidated Statement of Financial Position as of December 31, 2015, the Consolidated Statements of Operations and Comprehensive Income (Loss), the Consolidated Statements of Stockholders’ Equity and the Consolidated Statements of Cash Flows for the years ended December 31, 2015 and 2014.
The line item effects of these immaterial error corrections are detailed below.
68
CITIZENS, INC. AND CONSOLIDATED SUBSIDIARIES
Notes to Consolidated Financial Statements, Continued
|
2015
|
As
Reported
|
Restatement
|
As
Adjusted
|
||||||
|
(In thousands)
|
|||||||||
|
Consolidated Statements of Financial Position
|
|||||||||
|
Deferred policy acquisition costs
|
$
|
165,362
|
|
(1,670
|
)
|
163,692
|
|
||
|
Deferred tax asset
|
68,764
|
|
(1,619
|
)
|
67,145
|
|
|||
|
Total assets
|
1,484,040
|
|
(3,289
|
)
|
1,480,751
|
|
|||
|
Liabilities:
|
|||||||||
|
Future policy benefit reserves:
|
|||||||||
|
Life insurance
|
$
|
995,972
|
|
(8,599
|
)
|
987,373
|
|
||
|
Total policy liabilities
|
1,140,879
|
|
(8,599
|
)
|
1,132,280
|
|
|||
|
Current federal income tax payable
|
71,225
|
|
757
|
|
71,982
|
|
|||
|
Other liabilities
|
24,205
|
|
144
|
|
24,349
|
|
|||
|
Total liabilities
|
1,241,523
|
|
(7,698
|
)
|
1,233,825
|
|
|||
|
Accumulated deficit
|
(22,626
|
)
|
4,409
|
|
(18,217
|
)
|
|||
|
Total stockholders' equity
|
242,517
|
|
4,409
|
|
246,926
|
|
|||
|
Total liabilities and stockholders' equity
|
1,484,040
|
|
(3,289
|
)
|
1,480,751
|
|
|||
|
Consolidated Statements of Operations and Comprehensive Income (Loss)
|
|||||||||
|
Increase in future policy benefit reserves
|
$
|
77,929
|
|
(869
|
)
|
77,060
|
|
||
|
Total insurance benefits paid or provided
|
167,555
|
|
(869
|
)
|
166,686
|
|
|||
|
Other general expenses
|
33,143
|
|
144
|
|
33,287
|
|
|||
|
Amortization of deferred policy acquisition costs
|
23,339
|
|
61
|
|
23,400
|
|
|||
|
Total benefits and expenses
|
238,875
|
|
(664
|
)
|
238,211
|
|
|||
|
Income (loss) before federal income tax expense
|
(2,607
|
)
|
664
|
|
(1,943
|
)
|
|||
|
Federal income tax expense
|
972
|
|
228
|
|
1,200
|
|
|||
|
Net income (loss)
|
(3,579
|
)
|
436
|
|
(3,143
|
)
|
|||
|
Basic and diluted earnings (losses) per share of Class A common stock
|
(0.07
|
)
|
0.01
|
|
(0.06
|
)
|
|||
|
Basic and diluted earnings (losses) per share of Class B common stock
|
(0.04
|
)
|
0.01
|
|
(0.03
|
)
|
|||
|
Comprehensive income (loss)
|
(15,842
|
)
|
436
|
|
(15,406
|
)
|
|||
|
Consolidated Statements of Stockholders' Equity
|
|||||||||
|
Balance at December 31, 2014
|
$
|
258,359
|
|
3,973
|
|
262,332
|
|
||
|
Net income (loss)
|
(3,579
|
)
|
436
|
|
(3,143
|
)
|
|||
|
Balance at December 31, 2015
|
242,517
|
|
4,409
|
|
246,926
|
|
|||
|
Consolidated Statements of Cash Flows
|
|||||||||
|
Net income (loss)
|
$
|
(3,579
|
)
|
436
|
|
(3,143
|
)
|
||
|
Net deferred policy acquisition costs
|
(7,765
|
)
|
61
|
|
(7,704
|
)
|
|||
|
Deferred federal income tax benefit
|
4,043
|
|
(528
|
)
|
3,515
|
|
|||
|
Future policy benefit reserves
|
77,770
|
|
(869
|
)
|
76,901
|
|
|||
|
Commission payable and other liabilities
|
473
|
|
144
|
|
617
|
|
|||
|
Federal income tax payable
|
(7,593
|
)
|
756
|
|
(6,837
|
)
|
|||
|
Net cash provided by operating activities
|
87,153
|
|
—
|
|
87,153
|
|
|||
69
CITIZENS, INC. AND CONSOLIDATED SUBSIDIARIES
Notes to Consolidated Financial Statements, Continued
|
2014
|
As Reported
|
Restatement
|
As Adjusted
|
||||||
|
(In thousands)
|
|||||||||
|
Consolidated Statements of Operations and Comprehensive Income (Loss)
|
|||||||||
|
Increase in future policy benefit reserves
|
$
|
82,847
|
|
(849
|
)
|
81,998
|
|
||
|
Total insurance benefits paid or provided
|
161,218
|
|
(849
|
)
|
160,369
|
|
|||
|
Amortization of deferred policy acquisition costs
|
21,064
|
|
19
|
|
21,083
|
|
|||
|
Total benefits and expenses
|
233,005
|
|
(830
|
)
|
232,175
|
|
|||
|
Income (loss) before federal income tax expense
|
(2,780
|
)
|
830
|
|
(1,950
|
)
|
|||
|
Federal income tax expense
|
3,725
|
|
295
|
|
4,020
|
|
|||
|
Net income (loss)
|
(6,505
|
)
|
535
|
|
(5,970
|
)
|
|||
|
Basic and diluted earnings (losses) per share of Class A common stock
|
(0.13
|
)
|
0.01
|
|
(0.12
|
)
|
|||
|
Basic and diluted earnings (losses) per share of Class B common stock
|
(0.07
|
)
|
0.01
|
|
(0.06
|
)
|
|||
|
Comprehensive income
|
12,550
|
|
535
|
|
13,085
|
|
|||
|
Consolidated Statements of Stockholders' Equity
|
|||||||||
|
Balance at December 31, 2013
|
$
|
245,809
|
|
3,438
|
|
249,247
|
|
||
|
Net income (loss)
|
(6,505
|
)
|
535
|
|
(5,970
|
)
|
|||
|
Balance at December 31, 2014
|
258,359
|
|
3,973
|
|
262,332
|
|
|||
|
Consolidated Statements of Cash Flows
|
|||||||||
|
Net income (loss)
|
$
|
(6,505
|
)
|
535
|
|
(5,970
|
)
|
||
|
Net deferred policy acquisition costs
|
(11,007
|
)
|
19
|
|
(10,988
|
)
|
|||
|
Deferred federal income tax benefit
|
(79,175
|
)
|
295
|
|
(78,880
|
)
|
|||
|
Future policy benefit reserves
|
82,767
|
|
(849
|
)
|
81,918
|
|
|||
|
Net cash provided by operating activities
|
97,934
|
|
—
|
|
97,934
|
|
|||
See Note 13 - Quarterly Financial Information (Unaudited) for additional information regarding our unaudited quarterly financial information for the year ended December 31, 2015, which information reflects the corrections above.
Reclassifications
Certain amounts presented in prior years have been reclassified to conform to the current presentation. No individual amounts were material.
70
CITIZENS, INC. AND CONSOLIDATED SUBSIDIARIES
Notes to Consolidated Financial Statements, Continued
Significant Accounting Policies
Investments
Investment securities are classified as held-to-maturity, available-for-sale or trading. Management determines the appropriate classification at the time of purchase. The classification of securities is significant since it directly impacts the accounting for unrealized gains and losses on securities. Fixed maturity securities are classified as held-to-maturity and carried at amortized cost when management has the positive intent and the Company has the ability to hold the securities to maturity. Securities not classified as held-to-maturity are classified as available-for-sale and are carried at fair value, with the unrealized holding gains and losses, net of tax, reported in other comprehensive income and do not affect earnings until realized. Fixed maturities consist primarily of bonds classified as available-for-sale or held-to-maturity. The Company does not classify any fixed maturities as trading. Equity securities (including non-redeemable preferred stock) are considered available-for-sale and are reported at fair value.
Unrealized gains (losses) of equity securities and fixed maturities held as available-for-sale is shown as a separate component of stockholders' equity, net of tax, and is a separate component of comprehensive income.
The Company evaluates all securities on a quarterly basis, and more frequently when economic conditions warrant additional evaluations, for determining if an other-than-temporary impairment ("OTTI") exists pursuant to the accounting guidelines. In evaluating the possible impairment of securities, consideration is given to the length of time and the extent to which the fair value has been less than cost, the financial conditions and near-term prospects of the issuer, and the ability and intent of the Company to retain its investment in the issuer for a period of time sufficient to allow for any anticipated recovery in fair value. In analyzing an issuer’s financial condition, the Company may consider whether the securities are issued by the Federal government or its agencies, by government-sponsored agencies, or whether downgrades by bond rating agencies have occurred, and reviews of the issuer’s financial condition.
If management determines that an investment experienced an OTTI, management must then determine the amount of OTTI to be recognized in earnings. If management does not intend to sell the security and it is more likely than not that the Company will not be required to sell the security before recovery of its amortized cost basis less any current period loss, the OTTI will be separated into the amount representing the credit loss and the amount related to all other factors. The amount of OTTI related to the credit loss is determined based on the present value of cash flows expected to be collected and is recognized in earnings. The amount of OTTI related to other factors will be recognized in other comprehensive income, net of applicable taxes. The previous amortized cost basis less the OTTI recognized in earnings will become the new amortized cost basis of the investment. If management intends to sell the security or more likely than not will be required to sell the security before recovery of its amortized cost basis less any current period credit loss, the OTTI will be recognized in earnings equal to the entire difference between the investment's amortized cost basis and its fair value at the balance sheet date. Any recoveries related to the value of these securities are recorded as an unrealized gain (as other comprehensive income (loss) in stockholders' equity) and not recognized in income until the security is ultimately sold.
The Company from time to time may dispose of an impaired security in response to asset/liability management decisions, future market movements, business plan changes, or if the net proceeds can be reinvested at a rate of return that is expected to recover the loss within a reasonable period of time.
Mortgage loans on real estate and policy loans are reported at unpaid principal balances.
Real estate and other long-term investments consist primarily of land and buildings that are recorded at depreciated cost. If the fair value of the real estate is less than the carrying value, an impairment loss is recognized and charged to earnings.
Real estate held for sale represents a building we own in Little Rock, Arkansas in which we are a lessor. The building was sold subsequent to December 31, 2016. See Subsequent Events note.
Premiums and discounts are amortized or accreted over the life of the related security as an adjustment to yield using the effective interest method. Dividend and interest income is recognized when earned. Realized gains and losses are included in earnings and are derived using the specific identification method for determining the cost of securities sold.
71
CITIZENS, INC. AND CONSOLIDATED SUBSIDIARIES
Notes to Consolidated Financial Statements, Continued
The Company had cash equivalents, fixed maturities and equity securities with an aggregate fair value of
$10.0 million
and
$10.2 million
at
December 31, 2016
and
2015
, respectively, on deposit with various state regulatory authorities to fulfill statutory requirements.
Premium Revenue and Related Expenses
Premiums on life policies are recognized as earned when due. Due premiums on the balance sheet are net of allowances. Accident and health policies are recognized as revenue over the contract period on a pro rata basis. Benefits and expenses are associated with earned premiums so as to result in the recognition of profits over the estimated lives of the contracts. This matching is accomplished by means of a provision for future policy benefits and the capitalization and amortization of deferred policy acquisition costs.
Annuity policies, primarily flexible premium fixed annuity products, are accounted for in a manner consistent with accounting for interest bearing financial instruments. Premium receipts are not reported as revenue, rather as deposit liabilities to annuity contracts. The annuity products issued do not include fees or other such charges.
Deferred Policy Acquisition Costs
Acquisition costs, consisting of commissions and policy issuance, underwriting and agent convention expenses that are directly related to and vary with the successful production of new and renewal business, have been deferred. These deferred amounts, referred to as deferred policy acquisition costs ("DAC"), are recorded as an asset on the balance sheet and amortized to income in a systematic manner, based on related contract revenues or gross profits as appropriate.
Traditional life insurance and accident and health insurance acquisition costs are being amortized over the premium-paying period of the related policies using assumptions consistent with those used in computing future policy benefit liabilities. For universal life type contracts and investment contracts that include significant surrender charges or that yield significant revenues from sources other than the investment contract holders' funds, the deferred contract acquisition cost amortization is matched to the recognition of gross profit. The effect on the DAC asset that would result from realization of unrealized gains or losses is recognized with an offset to accumulated other comprehensive income in consolidated stockholders' equity. If an internal replacement of insurance or investment contract modification substantially changes a contract as defined in current accounting guidance, then the DAC is written off immediately through income and any new deferrable costs associated with the new replacement are deferred. If a contract modification does not substantially change the contract, the DAC amortization on the original contract will continue and any acquisition costs associated with the related modification are immediately expensed.
We utilize the factor method to determine the amount of costs to be capitalized and the ending asset balance. The factor method is based on the ratio of premium revenue recognized for the policies in force at the end of each reporting period compared to the premium revenue recognized for policies in force at the beginning of the reporting period. The factor method ensures that policies lapsed or surrendered during the reporting period are no longer included in the deferred policy acquisition costs calculation. The factor method limits the amount of deferred costs to its estimated realizable value, provided actual experience is comparable to that contemplated in the factors.
Inherent in the capitalization and amortization of deferred policy acquisition costs are certain management judgments about what acquisition costs are deferred, the ending asset balance and the annual amortization. Approximately
94%
of our capitalized deferred acquisition costs are attributed to first year and renewal excess commissions. The remaining
6%
are attributed to costs that vary with and are directly related to the successful acquisition of new insurance business. Those costs generally include costs related to the production, underwriting and issuance of new business.
DAC is subject to recoverability testing at the time of policy issuance and loss recognition testing on an annual basis, or when an event occurs that might require loss recognition testing. If loss recognition or impairment is necessary, DAC would be written off to the extent that anticipated future premiums and investment income is insufficient to cover expect future policy benefits and expenses. Loss recognition testing that considers, among other things, actual experience and projected future experience calculates the available premium (gross premium less the benefit and expense portion of premium) for the next
50
years. The available premium per policy and the deferred policy acquisition costs per policy are then calculated. The deferred policy acquisition costs are then evaluated for recoverability using best estimate assumptions. Management believes that our deferred policy acquisition costs and related amortization for the years ended
December 31, 2016
,
2015
and
2014
limits the amount of deferred costs to its estimated realizable value. This belief is
72
CITIZENS, INC. AND CONSOLIDATED SUBSIDIARIES
Notes to Consolidated Financial Statements, Continued
based upon the analysis performed on capitalized expenses that vary with and are directly related to the acquisition of new and renewal insurance business, utilization of the factor method and recoverability testing at the time of policy issuance and the annual loss recognition testing.
The components of deferred acquisition costs from year to year are summarized as follows:
|
|
For the Years Ended December 31,
|
||||||||
|
|
2016
|
2015
|
2014
|
||||||
|
(As adjusted)
|
(As adjusted)
|
||||||||
|
|
(In thousands)
|
||||||||
|
Balance at beginning of period
|
$
|
163,692
|
|
155,859
|
|
145,101
|
|
||
|
Capitalized
|
32,732
|
|
31,104
|
|
32,071
|
|
|||
|
Amortized
|
(28,515
|
)
|
(23,400
|
)
|
(21,083
|
)
|
|||
|
Effects of unrealized (gains) losses
|
(119
|
)
|
129
|
|
(230
|
)
|
|||
|
Balance at end of period
|
$
|
167,790
|
|
163,692
|
|
155,859
|
|
||
Cost of Customer Relationships Acquired
Cost of customer relationships acquired ("CCRA") is established when we purchase a block of insurance. CCRA is amortized primarily over the emerging profit of the related policies using the same assumptions as were used in computing liabilities for future policy benefits. Inherent in the amortization of CCRA are certain management judgments about the ending asset balance and the annual amortization. The assumptions used are based upon interest, mortality and lapses at the time of purchase.
A recoverability test that considers, among other things, actual experience and projected future experience is performed at least annually. These annual recoverability tests initially calculate the available premium (gross premium less the benefit and expense portion of premium) for the next
50
years. The CCRA is then evaluated utilizing reasonable assumptions. Management believes that our CCRA and related amortization is recoverable for the years ended
December 31, 2016
,
2015
and
2014
. This belief is based upon the analysis performed on estimated future results of the block and our annual recoverability testing.
73
CITIZENS, INC. AND CONSOLIDATED SUBSIDIARIES
Notes to Consolidated Financial Statements, Continued
Cost of customer relationships acquired relative to purchased blocks of insurance is summarized as follows:
|
|
For the Years Ended December 31,
|
||||||||
|
|
2016
|
2015
|
2014
|
||||||
|
|
(In thousands)
|
||||||||
|
Balance at beginning of period
|
$
|
21,585
|
|
23,542
|
|
23,374
|
|
||
|
Acquisitions
|
—
|
|
—
|
|
2,762
|
|
|||
|
Amortization
|
(2,063
|
)
|
(2,317
|
)
|
(2,182
|
)
|
|||
|
Change in effects of unrealized (gains) losses on CCRA
|
(107
|
)
|
360
|
|
(412
|
)
|
|||
|
Balance at end of period
|
$
|
19,415
|
|
21,585
|
|
23,542
|
|
||
Estimated amortization of cost of customer relationship acquired in each of the next
five
years and thereafter is as follows. Actual future amortization will differ from these estimates due to variances from estimated future withdrawal assumptions.
|
|
Amount
|
||
|
|
(In thousands)
|
||
|
Year:
|
|
||
|
2017
|
$
|
1,791
|
|
|
2018
|
1,658
|
|
|
|
2019
|
1,495
|
|
|
|
2020
|
1,349
|
|
|
|
2021
|
1,220
|
|
|
|
Thereafter
|
12,461
|
|
|
|
|
19,974
|
|
|
|
Effects of unrealized (gains) losses on CCRA
|
(559
|
)
|
|
|
Total
|
$
|
19,415
|
|
The value of CCRA in our various acquisitions, which is included in cost of customer relationships acquired in the accompanying consolidated financial statements, was determined based on the present value of future profits discounted at annual rates ranging from
3.7%
to
8.5%
.
Future Policy Benefits and Expenses
Future policy benefit reserves for traditional life insurance and accident and health insurance contract benefits and expenses are computed using a net level premium method, with assumptions as to investment yields, dividends on participating business, mortality and withdrawals based upon our experience, modified as necessary to reflect anticipated trends and to include provisions for possible unfavorable deviations.
The accrued account balance for non-traditional life insurance and investment contracts is computed as deposits net of withdrawals made by the contract holder, plus amounts credited based on contract specifications, less contract fees and charges assessed, plus any additional interest. Annuity interest crediting rates range from
3.0%
to
5.5%
annually. Benefits and expenses are charged against the account balance to recognize costs as incurred over the estimated lives of the contracts. Expenses include interest credited to contract account balances and benefits paid in excess of contract account balances.
Unpaid claims on accident and health and specialty property insurance policies represent the estimated liability for benefit expenses, both reported but not paid and incurred but not reported to the Company. The liability for incurred but not reported claims includes estimates for additional claim amounts due related to reported claims. Liabilities for unpaid
74
CITIZENS, INC. AND CONSOLIDATED SUBSIDIARIES
Notes to Consolidated Financial Statements, Continued
claims are estimated using individual case basis valuations and statistical analysis. Those estimates are subject to the effects of trends in claim severity and frequency.
Anticipated investment income is not considered in determining whether a premium deficiency exists with respect to short-duration contracts. Premium deposits accrue interest at rates ranging from
3.0%
to
8.25%
per annum. The cost of insurance is included in the premium when collected and interest is credited annually to deposit accounts.
The development of liabilities for future policy benefits requires management to make estimates and assumptions regarding mortality, morbidity, lapse, expense, and investment experience. These estimates are based primarily on historical experience and future expectations of mortality, morbidity, expense, persistency, and investment assumptions. Actual results could differ materially from estimates. We monitor actual experience and revise assumptions as necessary.
Goodwill and Other Intangible Assets
Goodwill is the difference between the purchase price in a business combination and the fair value of assets and liabilities acquired, and is not amortized. Other intangible assets include various state insurance licenses, which have been determined to have indefinite useful lives and, therefore, are not amortized. Both goodwill and other intangible assets with indefinite useful lives are subject to annual impairment analysis.
The goodwill impairment test uses a two-step process as set forth under current accounting guidance. In the first step, the fair value of a reporting unit is compared to its carrying value. If the carrying value of a reporting unit exceeds its fair value, the second step of the impairment test is performed for purposes of measuring the impairment. In the second step, the fair value of projected new business is compared to the carrying value of goodwill. A requirement of this method is that the inforce must pass loss recognition testing. If the carrying amount of the reporting unit goodwill exceeds the fair value of projected new business, an impairment loss is recognized in an amount equal to that excess.
Management’s determination of the fair value of each reporting unit incorporates multiple inputs including discounted cash flow calculations based on assumptions that market participants would make in valuing the reporting unit. Other assumptions can include levels of economic capital, future business growth, and earnings projections.
As of
December 31, 2016
, the Company had goodwill of
$12.6 million
allocated to the Life Insurance segment and
$4.6 million
allocated to the Home Service Insurance segment. The Company completes its annual goodwill assessment for the individual reporting units within the Life Insurance segment and Home Service Insurance segment as of December 31 each year. There was
no
impairment of goodwill in
2016
,
2015
or
2014
.
Goodwill is summarized as follows:
|
|
Net Amount
|
|||
|
|
(In thousands)
|
|||
|
Balance at January 1, 2015 and 2016
|
$
|
17,255
|
|
|
|
Acquisition
|
—
|
|
||
|
Adjustments
|
—
|
|
||
|
Balance at December 31, 2016
|
$
|
17,255
|
|
|
Participating Policies
At
December 31, 2016
and
2015
, participating business approximated
62.2%
and
61.3%
of direct life insurance in force, respectively.
Future policy benefits on participating policies are estimated based on net level premium reserves for death and endowment policy benefits with interest rates ranging from
3.0%
to
9.0%
, and the cash surrender values described in such contracts. The scaling rate used for the
2016
portfolio ranged between
3.19%
for
1
year and then going up to
4.45%
over
20
years and remaining there for the duration. Earnings and dividends on participating policies are allocated based on policies in force.
75
CITIZENS, INC. AND CONSOLIDATED SUBSIDIARIES
Notes to Consolidated Financial Statements, Continued
Policyholder dividends are determined based on the discretion of the Board of Directors of the policy issuing subsidiary. Policyholder dividends are accrued over the premium paying periods of the insurance contract.
Earnings Per Share
Basic earnings per share are computed by dividing income available to common stockholders by the weighted average number of shares of common stock outstanding during each period. Diluted earnings per share are computed under the if-converted method for convertible securities and the treasury stock method for warrants, giving effect to all potential dilutive common stock, including options, warrants and convertible/redeemable preferred stock. The basic and diluted earnings per share of Class B common stock are one half the earnings per share of the Class A common stock.
The following table sets forth the computation of basic and diluted earnings per share.
|
|
Years Ended December 31,
|
|||||||||
|
|
2016
|
2015
|
2014
|
|||||||
|
(As adjusted)
|
(As adjusted)
|
|||||||||
|
|
(In thousands, except per share amounts)
|
|||||||||
|
Basic and diluted earnings per share:
|
|
|
|
|||||||
|
Numerator:
|
|
|
|
|||||||
|
Net income (loss)
|
$
|
1,969
|
|
(3,143
|
)
|
(5,970
|
)
|
|||
|
Net income (loss) allocated to Class A common stock
|
$
|
1,949
|
|
(3,112
|
)
|
(5,910
|
)
|
|||
|
Net income (loss) allocated to Class B common stock
|
20
|
|
(31
|
)
|
(60
|
)
|
||||
|
Net income (loss)
|
$
|
1,969
|
|
(3,143
|
)
|
(5,970
|
)
|
|||
|
Denominator:
|
|
|
|
|
|
|
||||
|
Weighted average shares of Class A outstanding - basic and diluted
|
49,080
|
|
49,080
|
|
49,080
|
|
||||
|
Weighted average shares of Class B outstanding - basic and diluted
|
1,002
|
|
1,002
|
|
1,002
|
|
||||
|
Total weighted average shares outstanding - basic and diluted
|
50,082
|
|
50,082
|
|
50,082
|
|
||||
|
Basic and diluted earnings (losses) per share of Class A common stock
|
$
|
0.04
|
|
(0.06
|
)
|
(0.12
|
)
|
|||
|
Basic and diluted earnings (losses) per share of Class B common stock
|
0.02
|
|
(0.03
|
)
|
(0.06
|
)
|
||||
Income Taxes
Deferred tax assets and liabilities are recognized for the estimated future tax consequences attributable to differences between the financial statement carrying amounts of existing assets and liabilities and their respective tax bases. Deferred tax assets and liabilities are measured using enacted tax rates in effect for the year in which those temporary differences are expected to be recovered.
A deferred tax asset is recorded only if a determination is made that it is more-likely-than-not that the tax treatment on which the deferred tax asset depends will be sustained in the event of an audit. These determinations inherently involve management's judgment. In addition, the Company must record a tax valuation allowance with respect to deferred tax assets if it is more-likely-than-not that the tax benefit will not be realized. This valuation allowance is in essence a contra account to the deferred tax asset. Management must determine the portion of the deferred tax asset and resulting tax benefit that may not be realized based upon judgment of expected outcomes.
76
CITIZENS, INC. AND CONSOLIDATED SUBSIDIARIES
Notes to Consolidated Financial Statements, Continued
Property and Equipment
Property and equipment, including leasehold improvements, are carried at cost less accumulated depreciation. Depreciation of property and equipment is computed using the straight-line method over the useful lives of the assets, ranging from
three
to
thirty
years. We amortize leasehold improvements over the shorter of the related lease term or the estimated life of the improvements. The Company has
no
capital leases.
The following is a summary of property and equipment.
|
|
December 31,
|
|||||
|
|
2016
|
2015
|
||||
|
|
(In thousands)
|
|||||
|
Property and equipment:
|
|
|
||||
|
Home office, land and buildings
|
$
|
10,051
|
|
9,970
|
|
|
|
Furniture and equipment
|
2,994
|
|
2,531
|
|
||
|
Electronic data processing equipment and computer software
|
6,914
|
|
5,244
|
|
||
|
Automobiles and marine assets
|
175
|
|
293
|
|
||
|
Airplane
|
3,356
|
|
3,356
|
|
||
|
Total property and equipment
|
23,490
|
|
21,394
|
|
||
|
Accumulated depreciation
|
(15,600
|
)
|
(15,056
|
)
|
||
|
Balance at end of period
|
$
|
7,890
|
|
6,338
|
|
|
Reinsurance Recoverable
Reinsurance recoverable includes expected reimbursements for policyholder claim amounts in excess of the Company's retention, as well as profit sharing and experience refund accruals. Reinsurance recoverable is reduced for estimated uncollectible amounts, if any.
Reinsurance premiums, benefits and expenses are accounted for on a basis consistent with those used in accounting for the original policies issued and the terms of the reinsurance contracts. The cost of reinsurance related to long duration contracts is accounted for over the life of the underlying reinsured policies using assumptions consistent with those used to account for the underlying policies. The cost of reinsurance related to short duration contracts is accounted for over the coverage period. Profit-sharing and similar adjustable provisions are accrued based on the experience of the underlying policies.
Contingencies
An estimated loss from a contingency is accrued and charged to results of operations only if both of the following conditions are met:
|
1.
|
Information available prior to the issuance of the financial statements indicates that it is
probable
(virtual certainty is not required) that an asset has been impaired or a liability incurred as of the date of the financial statements; and
|
|
2.
|
The amount of the loss can be reasonably estimated.
|
Reasonable estimation of a possible loss does not require estimating a single amount of the loss. It requires that a loss be accrued if it can be estimated within a range. If an amount within the range is a better estimate than any other amount within the range, that amount is accrued. If no amount within the range is a better estimate than any other amount, the minimum amount in the range is accrued.
A gain contingency is an uncertain situation that will be resolved in the future, possibly resulting in a gain. We do not allow the recognition of a gain contingency prior to settlement of the underlying event. If we were to have a material gain contingency, we would disclose it in the notes to the financial statements.
77
CITIZENS, INC. AND CONSOLIDATED SUBSIDIARIES
Notes to Consolidated Financial Statements, Continued
Cash Equivalents
The Company considers cash equivalents as all securities whose duration does not exceed 90 days at the date of acquisition.
Short-term Investments
The Company considers investments maturing within one year at acquisition as short-term. These securities are carried at amortized cost, which approximates market value.
Use of Estimates
The preparation of financial statements in conformity with U.S. GAAP requires management to make estimates and assumptions that affect the reported amounts of assets and liabilities and disclosure of contingent assets and liabilities at the date of the financial statements and the reported amounts of revenues and expenses during the reporting period. Actual results could differ materially from these estimates.
Accounting Pronouncements
Accounting Standards Recently Adopted
On May 21, 2015, the FASB issued ASU 2015-09,
Disclosures about Short-Duration Contracts
, addressing enhanced disclosure requirements for insurers relating to short-duration insurance contract claims and the unpaid claims liability rollforward for long and short-duration contracts. The disclosures are intended to provide users of financial statements with more transparent information about an insurance entity’s initial claim estimates and subsequent adjustments to those estimates, the methodologies and judgments used to estimate claims, and the timing, frequency, and severity of claims. The new disclosures required the accumulation and reporting of new and different groupings of claims data than previously reported. For public business entities, the new guidance is effective for annual reporting periods beginning after December 15, 2015. See Note 4, Policy Liabilities and Short Duration Contracts below for the new disclosures.
Accounting Standards Not Yet Adopted
In May 2014, the Financial Accounting Standards Board ("FASB") Accounting Standards Update ("ASU") No. 2014-09,
Revenue from Contracts with Customers (Topic 606),
which supersedes the revenue recognition requirements in ASC 605, Revenue Recognition. The core principle of ASU 2014-09 is that an entity should recognize revenue to depict the transfer of promised goods or services to customers in an amount that reflects the consideration to which the entity expects to be entitled in exchange for those goods or services. The guidance provides a five-step process to achieve that core principle. ASU 2014-09 requires disclosures enabling users of financial statements to understand the nature, amount, timing and uncertainty of revenue and cash flows arising from contracts with customers. Additionally, qualitative and quantitative disclosures are required about contracts with customers, significant judgments and changes in judgments, and assets recognized from the costs to obtain or fulfill a contract. ASU 2014-09 is effective for annual reporting periods beginning after December 15, 2017, including interim periods within that reporting period, using one of two retrospective application methods. Early application is not permitted. We are currently evaluating the effect the guidance will have on our consolidated financial statements. We do not expect that any portion of our revenue will be effected by the new standard, primarily as the new guidance does not apply to revenue from insurance contracts. Our ongoing evaluation process includes identifying contracts that are in the scope of the standard and documenting our accounting for these contracts.
The FASB’s new lease accounting standard, ASU 2016-02,
Leases (Topic 842)
, was issued on February 25, 2016. The ASU will require organizations that lease assets, referred to as “lessees”, to recognize on the balance sheet the assets and liabilities for the rights and obligations created by those leases. The ASU also will require disclosures to help investors and other financial statement users better understand the amount, timing, and uncertainty of cash flows arising from leases. These disclosures include qualitative and quantitative requirements, providing additional information about the amounts recorded in the financial statements. The accounting by organizations that own the assets leased by the lessee, also known as lessor accounting, will remain largely unchanged from current GAAP. However, the ASU contains some targeted improvements that are intended to align, where necessary, lessor accounting with the lessee accounting model and with the updated revenue recognition guidance issued in 2014. The ASU on leases will take effect for public companies
78
CITIZENS, INC. AND CONSOLIDATED SUBSIDIARIES
Notes to Consolidated Financial Statements, Continued
for fiscal years, and interim periods within those fiscal years, beginning after December 15, 2018. The Company is assessing the impact of this new standard.
In June 2016, the FASB issued ASU 2016-13,
Financial Instruments-Credit Losses (Topic 326)
, with the main objective to provide financial statement users with more decision-useful information about the expected credit losses on financial instruments and other commitments to extend credit held by a reporting entity at each reporting date. The amendments in this ASU require a financial asset (or a group of financial assets) measured at amortized cost basis to be presented at the net amount expected to be collected. The allowance for credit losses is a valuation account that is deducted from the amortized cost basis of the financial asset(s) to present the net carrying value at the amount expected to be collected on the financial asset. The income statement reflects the measurement of credit losses for newly recognized financial assets, as well as the expected increases or decreases of expected credit losses that have taken place during the period. Credit losses on available-for-sale debt securities should be measured in a manner similar to current GAAP; however the credit losses are recorded through an allowance for credit losses rather than as a write-down. This approach is an improvement to current GAAP because an entity will be able to record reversals of credit losses (in situations in which the estimate of credit losses declines) in current period net income, which in turn should align the income statement recognition of credit losses with the reporting period in which changes occur. Current GAAP prohibits reflecting those improvements in current-period earnings. For public business entities, the amendments in this ASU are effective for fiscal years beginning after December 15, 2019, including interim periods within those fiscal years. The Company is evaluating the impact this guidance will have on our consolidated financial statements.
On January 26, 2017, the FASB issued Accounting Standards Update ("ASU") No. 2017-04,
Simplifying the Test for Goodwill Impairmen
t. An entity will no longer perform a hypothetical purchase price allocation to measure impairment, eliminating step 2 of the goodwill impairment test. Instead, impairment will be measured using the difference of the carrying amount to the fair value of the reporting unit. The ASU is effective prospectively for annual and interim periods in fiscal year beginning after December 15, 2019, but early adoption is permitted for goodwill impairment tests with measurement dates after January 1, 2017.
Regulatory Reform
Health Care Reform
The Affordable Care Act was passed by the U.S. Congress in 2010. The Company has considered its medical and dental plans provided for employees and agents. While the Company will incur additional costs associated with the implementation of this Act, it does not believe these costs or ongoing costs associated with this Act will have a material impact to the consolidated financial statements. The Company does not provide a separate prescription drug plan to its retirees. In addition, the Company does not sell any medical insurance or prescription drug coverage. The Company will continue to assess the information contained in this Act as additional guidance becomes available and as additional implications are understood or clarified. In addition, the Company is monitoring the impact that the new presidential administration and congress will have on this Act.
Financial Reform
The Dodd-Frank Wall Street Reform and Consumer Protection Act (“the Dodd-Frank Act”) includes a provision to establish a Federal Insurance Office with the primary purpose of collecting information to better understand insurance issues at the federal level and to monitor the extent to which traditional underserved communities and consumers, minorities and low and moderate income persons have access to affordable insurance products. The Dodd-Frank Act also contains provisions affecting financial institutions, credit rating agencies and other commercial and consumer businesses. The Company is monitoring the impact that the new presidential administration and congress will have on this Act.
79
CITIZENS, INC. AND CONSOLIDATED SUBSIDIARIES
Notes to Consolidated Financial Statements, Continued
Note 2:
Investments
The Company invests primarily in fixed maturity securities, which totaled
89.7%
of total investments and cash and cash equivalents at
December 31, 2016
. Holdings in high quality fixed maturity securities rated A or higher by Standard & Poor's, Inc. totaled
78.2%
of investment holdings in this category, reflecting the conservative investment philosophy of the Company.
|
|
December 31, 2016
|
December 31, 2015
|
|||||||||
|
|
Carrying
Value
|
% of Total
Carrying Value
|
Carrying
Value
|
% of Total
Carrying Value
|
|||||||
|
(In thousands)
|
(In thousands)
|
||||||||||
|
Fixed maturity securities
|
$
|
1,128,672
|
|
89.7
|
$
|
995,601
|
|
85.0
|
|||
|
Equity securities
|
18,159
|
|
1.6
|
23,438
|
|
2.0
|
|||||
|
Mortgage loans
|
232
|
|
—
|
594
|
|
0.1
|
|||||
|
Policy loans
|
66,672
|
|
5.3
|
60,166
|
|
5.1
|
|||||
|
Real estate and other long-term investments
|
7,896
|
|
0.6
|
8,031
|
|
0.7
|
|||||
|
Short-term investments
|
508
|
|
—
|
251
|
|
—
|
|||||
|
Cash and cash equivalents
|
35,510
|
|
2.8
|
82,827
|
|
7.1
|
|||||
|
Total cash, cash equivalents and investments
|
$
|
1,257,649
|
|
100.0
|
$
|
1,170,908
|
|
100.0
|
|||
80
CITIZENS, INC. AND CONSOLIDATED SUBSIDIARIES
Notes to Consolidated Financial Statements, Continued
The cost, gross unrealized gains and losses and fair value of investments in fixed maturities and equity securities, as of
December 31, 2016
and
2015
, are as follows.
|
|
December 31, 2016
|
|||||||||||
|
|
Cost or
Amortized
Cost
|
Gross
Unrealized
Gains
|
Gross
Unrealized
Losses
|
Fair
Value
|
||||||||
|
|
(In thousands)
|
|||||||||||
|
Fixed maturities:
|
|
|
|
|
||||||||
|
Available-for-sale securities:
|
|
|
|
|
||||||||
|
U.S. Treasury securities
|
$
|
9,929
|
|
2,261
|
|
—
|
|
12,190
|
|
|||
|
U.S. Government-sponsored enterprises
|
7,639
|
|
863
|
|
—
|
|
8,502
|
|
||||
|
States and political subdivisions
|
563,279
|
|
15,017
|
|
5,022
|
|
573,274
|
|
||||
|
Foreign governments
|
103
|
|
23
|
|
—
|
|
126
|
|
||||
|
Corporate
|
277,226
|
|
12,095
|
|
4,222
|
|
285,099
|
|
||||
|
Commercial mortgage-backed
|
50
|
|
1
|
|
—
|
|
51
|
|
||||
|
Residential mortgage-backed
|
2,247
|
|
181
|
|
2
|
|
2,426
|
|
||||
|
Total available-for-sale securities
|
860,473
|
|
30,441
|
|
9,246
|
|
881,668
|
|
||||
|
Held-to-maturity securities:
|
|
|
|
|
|
|
|
|
||||
|
U.S. Government-sponsored enterprises
|
2,003
|
|
28
|
|
—
|
|
2,031
|
|
||||
|
States and political subdivisions
|
223,966
|
|
6,916
|
|
1,599
|
|
229,283
|
|
||||
|
Corporate
|
21,035
|
|
888
|
|
692
|
|
21,231
|
|
||||
|
Total held-to-maturity securities
|
247,004
|
|
7,832
|
|
2,291
|
|
252,545
|
|
||||
|
Total fixed maturity securities
|
$
|
1,107,477
|
|
38,273
|
|
11,537
|
|
1,134,213
|
|
|||
|
Equity securities:
|
|
|
|
|
|
|
|
|
||||
|
Stock mutual funds
|
$
|
2,867
|
|
79
|
|
—
|
|
2,946
|
|
|||
|
Bond mutual funds
|
14,040
|
|
265
|
|
108
|
|
14,197
|
|
||||
|
Common stock
|
39
|
|
3
|
|
17
|
|
25
|
|
||||
|
Redeemable preferred stock
|
819
|
|
174
|
|
2
|
|
991
|
|
||||
|
Total equity securities
|
$
|
17,765
|
|
521
|
|
127
|
|
18,159
|
|
|||
81
CITIZENS, INC. AND CONSOLIDATED SUBSIDIARIES
Notes to Consolidated Financial Statements, Continued
|
|
December 31, 2015
|
|||||||||||
|
|
Cost or
Amortized
Cost
|
Gross
Unrealized
Gains
|
Gross
Unrealized
Losses
|
Fair
Value
|
||||||||
|
|
(In thousands)
|
|||||||||||
|
Fixed maturities:
|
|
|
|
|
||||||||
|
Available-for-sale securities:
|
|
|
|
|
||||||||
|
U.S. Treasury securities
|
$
|
9,995
|
|
2,597
|
|
—
|
|
12,592
|
|
|||
|
U.S. Government-sponsored enterprises
|
19,676
|
|
1,104
|
|
—
|
|
20,780
|
|
||||
|
States and political subdivisions
|
470,319
|
|
15,815
|
|
3,085
|
|
483,049
|
|
||||
|
Foreign governments
|
104
|
|
27
|
|
—
|
|
131
|
|
||||
|
Corporate
|
211,245
|
|
9,683
|
|
4,847
|
|
216,081
|
|
||||
|
Commercial mortgage-backed
|
140
|
|
5
|
|
—
|
|
145
|
|
||||
|
Residential mortgage-backed
|
2,658
|
|
214
|
|
2
|
|
2,870
|
|
||||
|
Total available-for-sale securities
|
714,137
|
|
29,445
|
|
7,934
|
|
735,648
|
|
||||
|
Held-to-maturity securities:
|
|
|
|
|
|
|
|
|
||||
|
U.S. Government-sponsored enterprises
|
2,010
|
|
110
|
|
—
|
|
2,120
|
|
||||
|
States and political subdivisions
|
236,776
|
|
6,756
|
|
883
|
|
242,649
|
|
||||
|
Corporate
|
21,167
|
|
530
|
|
1,500
|
|
20,197
|
|
||||
|
Total held-to-maturity securities
|
259,953
|
|
7,396
|
|
2,383
|
|
264,966
|
|
||||
|
Total fixed maturity securities
|
$
|
974,090
|
|
36,841
|
|
10,317
|
|
1,000,614
|
|
|||
|
Equity securities:
|
|
|
|
|
|
|
|
|
||||
|
Stock mutual funds
|
$
|
3,270
|
|
—
|
|
237
|
|
3,033
|
|
|||
|
Bond mutual funds
|
18,798
|
|
55
|
|
349
|
|
18,504
|
|
||||
|
Common stock
|
65
|
|
—
|
|
22
|
|
43
|
|
||||
|
Redeemable preferred stock
|
1,594
|
|
266
|
|
2
|
|
1,858
|
|
||||
|
Total equity securities
|
$
|
23,727
|
|
321
|
|
610
|
|
23,438
|
|
|||
82
CITIZENS, INC. AND CONSOLIDATED SUBSIDIARIES
Notes to Consolidated Financial Statements, Continued
For investments of available-for-sale fixed maturities that have unrealized losses as of
December 31, 2016
, the cost, gross unrealized losses that have been in a continuous unrealized loss position for less than 12 months, gross unrealized losses that have been in a continuous unrealized loss position for 12 months or longer and fair value are as follows.
|
|
December 31, 2016
|
||||||||||||||||||||||||||
|
|
Less than 12 months
|
Greater than 12 months
|
Total
|
||||||||||||||||||||||||
|
|
Fair
Value
|
Unrealized
Losses
|
# of
Securities
|
Fair
Value
|
Unrealized
Losses
|
# of
Securities
|
Fair
Value
|
Unrealized
Losses
|
# of
Securities
|
||||||||||||||||||
|
|
(In thousands, except for # of securities)
|
||||||||||||||||||||||||||
|
Fixed maturities:
|
|
|
|
|
|
|
|
|
|
||||||||||||||||||
|
Available-for-sale securities:
|
|
|
|
|
|
|
|
|
|
||||||||||||||||||
|
States and political subdivisions
|
$
|
202,788
|
|
3,513
|
|
184
|
|
8,018
|
|
1,509
|
|
8
|
|
210,806
|
|
5,022
|
|
192
|
|
||||||||
|
Corporate
|
91,527
|
|
3,578
|
|
70
|
|
6,102
|
|
644
|
|
8
|
|
97,629
|
|
4,222
|
|
78
|
|
|||||||||
|
Residential mortgage-backed
|
116
|
|
1
|
|
4
|
|
105
|
|
1
|
|
2
|
|
221
|
|
2
|
|
6
|
|
|||||||||
|
Total available-for-sale securities
|
294,431
|
|
7,092
|
|
258
|
|
14,225
|
|
2,154
|
|
18
|
|
308,656
|
|
9,246
|
|
276
|
|
|||||||||
|
Held-to-maturity securities:
|
|
|
|
|
|
|
|
|
|
|
|
|
|
|
|
|
|
|
|||||||||
|
States and political subdivisions
|
$
|
43,659
|
|
1,562
|
|
47
|
|
509
|
|
37
|
|
1
|
|
44,168
|
|
1,599
|
|
48
|
|
||||||||
|
Corporate
|
3,587
|
|
12
|
|
3
|
|
2,171
|
|
680
|
|
2
|
|
5,758
|
|
692
|
|
5
|
|
|||||||||
|
Total held-to-maturity securities
|
47,246
|
|
1,574
|
|
50
|
|
2,680
|
|
717
|
|
3
|
|
49,926
|
|
2,291
|
|
53
|
|
|||||||||
|
Total fixed maturities
|
$
|
341,677
|
|
8,666
|
|
308
|
|
16,905
|
|
2,871
|
|
21
|
|
358,582
|
|
11,537
|
|
329
|
|
||||||||
|
Equity securities:
|
|
|
|
|
|
|
|
|
|
|
|
|
|
|
|
|
|
|
|||||||||
|
Stock mutual funds
|
$
|
—
|
|
—
|
|
—
|
|
—
|
|
—
|
|
—
|
|
—
|
|
—
|
|
—
|
|
||||||||
|
Bond mutual funds
|
10,160
|
|
108
|
|
2
|
|
—
|
|
—
|
|
—
|
|
10,160
|
|
108
|
|
2
|
|
|||||||||
|
Redeemable preferred stock
|
201
|
|
2
|
|
2
|
|
—
|
|
—
|
|
—
|
|
201
|
|
2
|
|
2
|
|
|||||||||
|
Common stocks
|
—
|
|
—
|
|
—
|
|
—
|
|
17
|
|
1
|
|
—
|
|
17
|
|
1
|
|
|||||||||
|
Total equities
|
$
|
10,361
|
|
110
|
|
4
|
|
—
|
|
17
|
|
1
|
|
10,361
|
|
127
|
|
5
|
|
||||||||
The available-for-sale fixed maturities in a gross unrealized loss position for more than 12 months is primarily related to rises in interest rates which results in lower market prices on fixed maturity securities that have lower coupons than the current market rate. This is interest rate risk and is not a signal of impairment. Management has completed its assessment of other-than-temporary impairment of these securities. Based on our evaluation of the credit worthiness of the issuers and because we do not intend to sell the investments, nor is it likely that we would be required to sell these investments before recovery of their amortized cost bases, which may be maturity, none of the unrealized losses are considered to be other-than-temporary.
We monitor all debt and equity securities on an on-going basis relative to changes in credit ratings, market prices, earnings trends and financial performance, in addition to specific region or industry reviews. Our impairment review, in accordance with current guidance, is performed by the Company at each reporting date and management uses its best judgment to decide if impairment is other-than-temporary. We determine other-than-temporary impairment by reviewing relevant evidence related to the specific security issuer, as well as our intent to sell the security or whether we more likely than not will be required to sell the security before its anticipated recovery. All securities with a market price below par were segregated and reviewed as of
December 31, 2016
based upon the items above for impairment.
83
CITIZENS, INC. AND CONSOLIDATED SUBSIDIARIES
Notes to Consolidated Financial Statements, Continued
For investments of available-for-sale fixed maturities and equity securities that have unrealized losses as of
December 31, 2015
, the cost, gross unrealized losses that have been in a continuous unrealized loss position for less than 12 months, gross unrealized losses that have been in a continuous unrealized loss position for 12 months or longer and fair value are as follows.
|
|
December 31, 2015
|
||||||||||||||||||||||||||
|
|
Less than 12 months
|
Greater than 12 months
|
Total
|
||||||||||||||||||||||||
|
|
Fair
Value
|
Unrealized
Losses
|
# of
Securities
|
Fair
Value
|
Unrealized
Losses
|
# of
Securities
|
Fair
Value
|
Unrealized
Losses
|
# of
Securities
|
||||||||||||||||||
|
|
(In thousands, except for # of securities)
|
||||||||||||||||||||||||||
|
Fixed maturities:
|
|
|
|
|
|
|
|
|
|
||||||||||||||||||
|
Available-for-sale securities:
|
|
|
|
|
|
|
|
|
|
||||||||||||||||||
|
States and political subdivisions
|
$
|
136,862
|
|
1,474
|
|
129
|
|
12,633
|
|
1,611
|
|
12
|
|
149,495
|
|
3,085
|
|
141
|
|
||||||||
|
Corporate
|
70,081
|
|
4,330
|
|
69
|
|
3,308
|
|
517
|
|
3
|
|
73,389
|
|
4,847
|
|
72
|
|
|||||||||
|
Residential mortgage-backed
|
57
|
|
1
|
|
2
|
|
133
|
|
1
|
|
3
|
|
190
|
|
2
|
|
5
|
|
|||||||||
|
Total available-for-sale securities
|
207,000
|
|
5,805
|
|
200
|
|
16,074
|
|
2,129
|
|
18
|
|
223,074
|
|
7,934
|
|
218
|
|
|||||||||
|
Held-to-maturity securities:
|
|
|
|
|
|
|
|
|
|
|
|
|
|
|
|
|
|
|
|||||||||
|
States and political subdivisions
|
$
|
74,628
|
|
774
|
|
59
|
|
2,404
|
|
109
|
|
5
|
|
77,032
|
|
883
|
|
64
|
|
||||||||
|
Corporate
|
4,585
|
|
641
|
|
4
|
|
2,160
|
|
859
|
|
2
|
|
6,745
|
|
1,500
|
|
6
|
|
|||||||||
|
Total held-to-maturity securities
|
79,213
|
|
1,415
|
|
63
|
|
4,564
|
|
968
|
|
7
|
|
83,777
|
|
2,383
|
|
70
|
|
|||||||||
|
Total fixed maturities
|
$
|
286,213
|
|
7,220
|
|
263
|
|
20,638
|
|
3,097
|
|
25
|
|
306,851
|
|
10,317
|
|
288
|
|
||||||||
|
Equity securities:
|
|
|
|
|
|
|
|
|
|
|
|
|
|
|
|
|
|
|
|||||||||
|
Stock mutual funds
|
$
|
3,030
|
|
237
|
|
4
|
|
2
|
|
—
|
|
1
|
|
3,032
|
|
237
|
|
5
|
|
||||||||
|
Bond mutual funds
|
10,158
|
|
318
|
|
2
|
|
108
|
|
31
|
|
1
|
|
10,266
|
|
349
|
|
3
|
|
|||||||||
|
Redeemable preferred stock
|
101
|
|
1
|
|
1
|
|
1
|
|
1
|
|
1
|
|
102
|
|
2
|
|
2
|
|
|||||||||
|
Common stocks
|
22
|
|
1
|
|
2
|
|
21
|
|
21
|
|
2
|
|
43
|
|
22
|
|
4
|
|
|||||||||
|
Total equities
|
$
|
13,311
|
|
557
|
|
9
|
|
132
|
|
53
|
|
5
|
|
13,443
|
|
610
|
|
14
|
|
||||||||
84
CITIZENS, INC. AND CONSOLIDATED SUBSIDIARIES
Notes to Consolidated Financial Statements, Continued
The amortized cost and fair value of fixed maturities at
December 31, 2016
by contractual maturity are shown below. Actual maturities may differ from contractual maturities because borrowers may have the right to call or prepay obligations with or without call or prepayment penalties. Securities not due at a single maturity date have been reflected based upon the final stated maturity.
|
|
Cost or
Amortized Cost
|
Fair Value
|
||||
|
|
(In thousands)
|
|||||
|
Available-for-sale securities:
|
|
|
||||
|
Due in one year or less
|
$
|
46,129
|
|
46,698
|
|
|
|
Due after one year through five years
|
103,680
|
|
106,407
|
|
||
|
Due after five years through ten years
|
120,915
|
|
127,697
|
|
||
|
Due after ten years
|
589,749
|
|
600,866
|
|
||
|
Total available-for-sale securities
|
860,473
|
|
881,668
|
|
||
|
Held-to-maturity securities:
|
|
|
|
|
||
|
Due in one year or less
|
2,972
|
|
2,991
|
|
||
|
Due after one year through five years
|
58,138
|
|
59,873
|
|
||
|
Due after five years through ten years
|
43,320
|
|
44,568
|
|
||
|
Due after ten years
|
142,574
|
|
145,113
|
|
||
|
Total held-to-maturity securities
|
247,004
|
|
252,545
|
|
||
|
Total fixed maturities
|
$
|
1,107,477
|
|
1,134,213
|
|
|
The Company had
no
investments in any one entity which exceeded 10% of stockholders' equity at
December 31, 2016
. In addition, there were
no
investments that were non-income producing for the year ended
December 31, 2016
.
Major categories of net investment income are summarized as follows:
|
|
Years ended December 31,
|
||||||||
|
|
2016
|
2015
|
2014
|
||||||
|
|
(In thousands)
|
||||||||
|
Investment income on:
|
|
|
|
||||||
|
Fixed maturities
|
$
|
43,637
|
|
39,570
|
|
36,670
|
|
||
|
Equity securities
|
851
|
|
2,909
|
|
1,986
|
|
|||
|
Mortgage loans on real estate
|
24
|
|
36
|
|
42
|
|
|||
|
Policy loans
|
5,277
|
|
4,614
|
|
4,172
|
|
|||
|
Long-term investments
|
305
|
|
247
|
|
287
|
|
|||
|
Other
|
89
|
|
53
|
|
45
|
|
|||
|
Total investment income
|
50,183
|
|
47,429
|
|
43,202
|
|
|||
|
Investment expenses
|
(1,623
|
)
|
(1,647
|
)
|
(2,140
|
)
|
|||
|
Net investment income
|
$
|
48,560
|
|
45,782
|
|
41,062
|
|
||
85
CITIZENS, INC. AND CONSOLIDATED SUBSIDIARIES
Notes to Consolidated Financial Statements, Continued
Proceeds and gross realized gains and losses from sales of fixed maturities available-for-sale for
2016
,
2015
and
2014
are summarized as follows:
|
|
Years ended December 31,
|
||||||||
|
|
2016
|
2015
|
2014
|
||||||
|
|
(In thousands)
|
||||||||
|
Proceeds
|
$
|
20,638
|
|
—
|
|
3,074
|
|
||
|
Gross realized gains
|
$
|
1,487
|
|
—
|
|
235
|
|
||
|
Gross realized losses
|
$
|
—
|
|
—
|
|
—
|
|
||
In 2016, SPLIC sold
eleven
bonds from their available-for-sale portfolio to generate funds to pay the extraordinary dividend to CICA. These sales produced proceeds of
$20.6 million
and realized gains of
$1.5 million
. In 2015, there were
no
sales of fixed maturities available-for-sale. In 2014,
two
bonds were sold for a gain related to potential impending credit issues. There were
no
securities sold from the held-to-maturity portfolio in
2016
,
2015
or
2014
.
Proceeds and gross realized gains and losses from sales of equity securities for
2016
,
2015
and
2014
are summarized as follows:
|
|
Years ended December 31,
|
||||||||
|
|
2016
|
2015
|
2014
|
||||||
|
|
(In thousands)
|
||||||||
|
Proceeds
|
$
|
5,100
|
|
43,163
|
|
15,029
|
|
||
|
Gross realized gains
|
$
|
291
|
|
634
|
|
118
|
|
||
|
Gross realized losses
|
$
|
35
|
|
599
|
|
169
|
|
||
In
2016
, the Company sold
five
equity and bond mutual funds, some of which had been previously impaired, that resulted in a net gain of
$256,000
to eliminate the risk-based-capital charge associated with equity securities. All mutual funds are considered common stocks for regulatory accounting purposes and the RBC charge for stocks is extremely high. In
2015
,
six
equity and bond mutual funds were sold that resulted in a net gain of
$35,000
due to regulatory accounting considerations. During
2014
,
three
equity and bond mutual funds were sold resulting in a net loss of
$51,000
due to circumstances that arose based on the current environment and due to the fact that they were shorter duration funds.
Realized investment gains (losses) are as follows:
|
|
Years ended December 31,
|
||||||||
|
|
2016
|
2015
|
2014
|
||||||
|
|
(In thousands)
|
||||||||
|
Realized investment gains (losses):
|
|
|
|
||||||
|
Sales, calls and maturities:
|
|
|
|
||||||
|
Fixed maturities
|
$
|
2,024
|
|
(111
|
)
|
359
|
|
||
|
Equity securities
|
303
|
|
37
|
|
49
|
|
|||
|
Net realized gains (losses)
|
2,327
|
|
(74
|
)
|
408
|
|
|||
|
Other-than-temporary impairments ("OTTI")
|
|
|
|
|
|||||
|
Fixed maturities
|
(3,970
|
)
|
(2,998
|
)
|
—
|
|
|||
|
Equity securities
|
(342
|
)
|
(2,387
|
)
|
(427
|
)
|
|||
|
Realized loss on OTTI
|
(4,312
|
)
|
(5,385
|
)
|
(427
|
)
|
|||
|
Net realized investment losses
|
$
|
(1,985
|
)
|
(5,459
|
)
|
(19
|
)
|
||
86
CITIZENS, INC. AND CONSOLIDATED SUBSIDIARIES
Notes to Consolidated Financial Statements, Continued
We recorded OTTI write-downs in
2016
of
$4.3 million
related to
four
equity and bond mutual funds and
two
bond issuers due to credit quality issues that arose in the current year.
The Company had realized losses of
$12,000
,
$111,000
and
$525
from calls of fixed maturities in
2016
,
2015
and
2014
, respectively.
Note 3:
Fair Value Measurements
Fair value is the price that would be received to sell an asset or paid to transfer a liability in an orderly transaction between market participants at the measurement date. We hold fixed maturity and equity securities that are carried at fair value.
Fair value measurements are generally based upon observable and unobservable inputs. Observable inputs reflect market data obtained from independent sources, while unobservable inputs reflect our view of market assumptions in the absence of observable market information. We utilize valuation techniques that maximize the use of observable inputs and minimize the use of unobservable inputs. All assets and liabilities carried at fair value are required to be classified and disclosed in one of the following three categories:
|
•
|
Level 1 - Quoted prices for identical instruments in active markets.
|
|
•
|
Level 2 - Quoted prices for similar instruments in active markets; quoted prices for identical or similar instruments in markets that are not active and model-derived valuations whose inputs or whose significant value drivers are observable.
|
|
•
|
Level 3 - Instruments whose significant value drivers are unobservable.
|
Level 1 primarily consists of financial instruments whose value is based on quoted market prices such as U.S. Treasury securities, publicly traded mutual fund investments and individual stocks.
Level 2 includes those financial instruments that are valued by independent pricing services or broker quotes. These models are primarily industry-standard models that consider various inputs, such as interest rates, credit spreads and foreign exchange rates for the underlying financial instruments. All significant inputs are observable, or derived from observable information in the marketplace or are supported by observable levels at which transactions are executed in the marketplace. Financial instruments in this category primarily include corporate fixed maturity securities, U.S. Government-sponsored enterprise securities, municipal securities and certain mortgage and asset-backed securities.
Level 3 is comprised of financial instruments whose fair value is estimated based on non-binding broker prices utilizing significant inputs not based on, or corroborated by, readily available market information. This category consists of
two
private placement mortgage-backed securities where we cannot corroborate the significant valuation inputs with market observable data.
87
CITIZENS, INC. AND CONSOLIDATED SUBSIDIARIES
Notes to Consolidated Financial Statements, Continued
The following table sets forth our assets and liabilities that are measured at fair value on a recurring basis as of the date indicated.
|
|
December 31, 2016
|
|||||||||||
|
Available-for-sale investments
|
Level 1
|
Level 2
|
Level 3
|
Total
Fair Value
|
||||||||
|
|
(In thousands)
|
|||||||||||
|
Financial assets:
|
|
|
|
|
||||||||
|
Fixed maturities:
|
|
|
|
|
||||||||
|
U.S. Treasury and U.S. Government-sponsored enterprises
|
$
|
12,190
|
|
8,502
|
|
—
|
|
20,692
|
|
|||
|
States and political subdivisions
|
—
|
|
573,274
|
|
—
|
|
573,274
|
|
||||
|
Corporate
|
—
|
|
285,099
|
|
—
|
|
285,099
|
|
||||
|
Commercial mortgage-backed
|
—
|
|
—
|
|
51
|
|
51
|
|
||||
|
Residential mortgage-backed
|
—
|
|
2,426
|
|
—
|
|
2,426
|
|
||||
|
Foreign governments
|
—
|
|
126
|
|
—
|
|
126
|
|
||||
|
Total fixed maturities
|
12,190
|
|
869,427
|
|
51
|
|
881,668
|
|
||||
|
Equity securities:
|
|
|
|
|
|
|
|
|
||||
|
Stock mutual funds
|
2,946
|
|
—
|
|
—
|
|
2,946
|
|
||||
|
Bond mutual funds
|
14,197
|
|
—
|
|
—
|
|
14,197
|
|
||||
|
Common stock
|
25
|
|
—
|
|
—
|
|
25
|
|
||||
|
Redeemable preferred stock
|
991
|
|
—
|
|
—
|
|
991
|
|
||||
|
Total equity securities
|
18,159
|
|
—
|
|
—
|
|
18,159
|
|
||||
|
Total financial assets
|
$
|
30,349
|
|
869,427
|
|
51
|
|
899,827
|
|
|||
|
|
|
|||||||||||
88
CITIZENS, INC. AND CONSOLIDATED SUBSIDIARIES
Notes to Consolidated Financial Statements, Continued
|
|
December 31, 2015
|
|||||||||||
|
Available-for-sale investments
|
Level 1
|
Level 2
|
Level 3
|
Total
Fair Value
|
||||||||
|
|
(In thousands)
|
|||||||||||
|
Financial assets:
|
|
|
|
|
||||||||
|
Fixed maturities:
|
|
|
|
|
||||||||
|
U.S. Treasury and U.S. Government-sponsored enterprises
|
$
|
12,592
|
|
20,780
|
|
—
|
|
33,372
|
|
|||
|
States and political subdivisions
|
—
|
|
483,049
|
|
—
|
|
483,049
|
|
||||
|
Corporate
|
—
|
|
216,081
|
|
—
|
|
216,081
|
|
||||
|
Commercial mortgage-backed
|
—
|
|
—
|
|
145
|
|
145
|
|
||||
|
Residential mortgage-backed
|
—
|
|
2,870
|
|
—
|
|
2,870
|
|
||||
|
Foreign governments
|
—
|
|
131
|
|
—
|
|
131
|
|
||||
|
Total fixed maturities
|
12,592
|
|
722,911
|
|
145
|
|
735,648
|
|
||||
|
Equity securities:
|
|
|
|
|
|
|
|
|
||||
|
Stock mutual funds
|
3,033
|
|
—
|
|
—
|
|
3,033
|
|
||||
|
Bond mutual funds
|
18,504
|
|
—
|
|
—
|
|
18,504
|
|
||||
|
Common stock
|
43
|
|
—
|
|
—
|
|
43
|
|
||||
|
Redeemable preferred stock
|
1,858
|
|
—
|
|
—
|
|
1,858
|
|
||||
|
Total equity securities
|
23,438
|
|
—
|
|
—
|
|
23,438
|
|
||||
|
Total financial assets
|
$
|
36,030
|
|
722,911
|
|
145
|
|
759,086
|
|
|||
Financial Instruments Valuation
Fixed maturity securities, available-for-sale
. At
December 31, 2016
, the fixed maturities, valued using a third-party pricing source, totaled
$869.4 million
for Level 2 assets and comprised
96.6%
of total reported fair value. Fair values for Level 3 assets are based upon unadjusted broker quotes that are non-binding. The Level 1 and Level 2 valuations are reviewed and validated quarterly through random testing by comparisons to separate pricing models, other third party pricing services, and back tested to recent trades. In addition, we obtain information relative to the third party pricing models and review model parameters for reasonableness. For the period ended
December 31, 2016
, there were
no
material changes to the valuation methods or assumptions used to determine fair values, and
no
broker or third party prices were changed from the values received.
There were
no
transfers made between Level 1 and 2 securities at December 31,
2016
or
2015
.
Equity securities, available-for-sale
. Fair values of these securities are based upon quoted market price and are classified as Level 1 assets.
89
CITIZENS, INC. AND CONSOLIDATED SUBSIDIARIES
Notes to Consolidated Financial Statements, Continued
The following table presents additional information about fixed maturity securities measured at fair value on a recurring basis and for which we have utilized significant unobservable (Level 3) inputs to determine fair value:
|
|
December 31,
|
|||||
|
|
2016
|
2015
|
||||
|
|
(In thousands)
|
|||||
|
Beginning Balance at January 1,
|
$
|
145
|
|
231
|
|
|
|
Total realized and unrealized gains (losses)
|
|
|
||||
|
Included in net income
|
—
|
|
—
|
|
||
|
Included in other comprehensive income
|
(4
|
)
|
(2
|
)
|
||
|
Principal paydowns
|
(90
|
)
|
(84
|
)
|
||
|
Transfer in and (out) of Level 3
|
—
|
|
—
|
|
||
|
Ending Balance at December 31,
|
$
|
51
|
|
145
|
|
|
We review the fair value hierarchy classifications each reporting period. Changes in the observability of the valuation attributes may result in a reclassification of certain financial assets. Such reclassifications, if any, are reported as transfers in and out of Level 3 at the beginning fair value for the reporting period in which the changes occur.
Financial Instruments not Carried at Fair Value
Estimates of fair values are made at a specific point in time, based on relevant market prices and information about the financial instrument. The estimated fair values of financial instruments presented below are not necessarily indicative of the amounts the Company might realize in actual market transactions. The carrying amount and fair value for the financial assets and liabilities on the consolidated balance sheets at each year-end were as follows:
|
|
December 31, 2016
|
December 31, 2015
|
||||||||||
|
|
Carrying
Value
|
Fair
Value
|
Carrying
Value
|
Fair
Value
|
||||||||
|
|
(In thousands)
|
(In thousands)
|
||||||||||
|
Financial assets:
|
|
|
|
|
||||||||
|
Fixed maturities, held-to-maturity
|
$
|
247,004
|
|
252,545
|
|
259,953
|
|
264,966
|
|
|||
|
Mortgage loans
|
232
|
|
269
|
|
594
|
|
617
|
|
||||
|
Policy loans
|
66,672
|
|
66,672
|
|
60,166
|
|
60,166
|
|
||||
|
Short-term investments
|
508
|
|
508
|
|
251
|
|
251
|
|
||||
|
Cash and cash equivalents
|
35,510
|
|
35,510
|
|
82,827
|
|
82,827
|
|
||||
|
Financial liabilities:
|
|
|
|
|
|
|
|
|
||||
|
Annuities - investment contracts
|
$
|
50,952
|
|
52,173
|
|
47,222
|
|
46,905
|
|
|||
Fair values for fixed income securities, which are characterized as Level 2 assets in the fair value hierarchy, are based on quoted market prices for the same or similar securities. In cases where quoted market prices are not available, fair values are based on estimates using present value or other assumptions, including the discount rate and estimates of future cash flows.
Mortgage loans are secured principally by residential properties and commercial properties. Weighted average interest rates for these loans were approximately
6.8%
and
6.2%
per year, as of
December 31, 2016
and
2015
, respectively, with maturities ranging from
3
to
26
years. Management estimated the fair value using an annual interest rate of
6.25%
at
December 31, 2016
and
2015
. Our mortgage loans are considered Level 3 assets in the fair value hierarchy.
Policy loans have a weighted average annual interest rate of
7.7%
as of
December 31, 2016
and
2015
, respectively, and have no specified maturity dates. The aggregate fair value of policy loans approximates the carrying value reflected on
90
CITIZENS, INC. AND CONSOLIDATED SUBSIDIARIES
Notes to Consolidated Financial Statements, Continued
the consolidated balance sheet. These loans typically carry an interest rate that is tied to the crediting rate applied to the related policy and contract reserves. Policy loans are an integral part of the life insurance policies that we have in force and cannot be valued separately and are not marketable. Therefore, the fair value approximates the carrying value and policy loans are considered Level 3 assets in the fair value hierarchy.
The fair value of short-term investments approximate carrying value due to their short-term nature. Our short-term investments are considered Level 2 assets in the fair value hierarchy.
The fair value of cash and cash equivalents approximate carrying value and are characterized as Level 1 assets in the fair value hierarchy.
The fair value of the Company's liabilities under annuity contract policies, which are considered Level 3 assets, was estimated at
December 31, 2016
using discounted cash flows based upon a swap rate curve with interest rates ranging from
1.28%
to
3.77%
based upon swap rates adjusted for various risk adjustments. The fair value of liabilities under all insurance contracts are taken into consideration in the overall management of interest rate risk, which seeks to minimize exposure to changing interest rates through the matching of investment maturities with amounts due under insurance contracts.
Note 4:
Policy Liabilities and Short Duration Contracts
Various assumptions used to determine the future policy benefit reserves of life insurance include the following: a) valuation interest rates from
2.5%
to
6.75%
per year; b) mortality assumptions are from the 1955 to 1960, 1965 to 1970, 1975 to 1980 and 2001 Select and Ultimate mortality tables; and c) withdrawals are based primarily on actual historical termination rates.
The following table presents information on changes in the liability for life, accident and health and property policy and contract claims for the years ended
December 31, 2016
,
2015
and
2014
.
|
|
Years ended December 31,
|
||||||||
|
|
2016
|
2015
|
2014
|
||||||
|
|
(In thousands)
|
||||||||
|
Policy claims payable at January 1
|
$
|
9,653
|
|
9,560
|
|
9,488
|
|
||
|
Less: reinsurance recoverable
|
543
|
|
950
|
|
686
|
|
|||
|
Net balance at January 1
|
9,110
|
|
8,610
|
|
8,802
|
|
|||
|
Acquisition of MGLIC
|
—
|
|
—
|
|
40
|
|
|||
|
Add claims incurred, related to:
|
|
|
|
|
|
|
|||
|
Current year
|
26,000
|
|
26,911
|
|
24,541
|
|
|||
|
Prior years
|
(493
|
)
|
(197
|
)
|
(33
|
)
|
|||
|
|
25,507
|
|
26,714
|
|
24,508
|
|
|||
|
Deduct claims paid, related to:
|
|
|
|
|
|
|
|||
|
Current year
|
18,681
|
|
19,584
|
|
17,691
|
|
|||
|
Prior years
|
6,805
|
|
6,630
|
|
7,049
|
|
|||
|
|
25,486
|
|
26,214
|
|
24,740
|
|
|||
|
Net balance December 31
|
9,131
|
|
9,110
|
|
8,610
|
|
|||
|
Plus: reinsurance recoverable
|
407
|
|
543
|
|
950
|
|
|||
|
Policy claims payable, December 31
|
$
|
9,538
|
|
9,653
|
|
9,560
|
|
||
The Company experienced favorable development in
2016
of
$493,000
and favorable development in
2015
of
$197,000
. No unusual claims or trends have been noted.
91
CITIZENS, INC. AND CONSOLIDATED SUBSIDIARIES
Notes to Consolidated Financial Statements, Continued
Short Duration Contracts
The Company's short duration contracts consist of credit life and credit disability in the Life segment and property insurance in the Home Service segment. The credit insurance lines are an immaterial part of short duration contracts so the following disclosures cover only the property insurance line of business in the Home Service segment.
Special Property Insurance (Allied and Fire)
The following table presents incurred claims development as of December 31, 2016, net of reinsurance, as well as cumulative claim frequency and the total of incurred-but-not-reported liabilities plus expected development on reported claims included within the net incurred claims amounts. This information is presented for the last five years as these claims rarely pay out over a longer period of time. Claims data for 2012 through 2015 is supplementary information to the consolidated financial statements and is unaudited.
|
As of December 31, 2016
|
|||||||||||||||||||||||||||
|
Incurred Claims and Allocated Claim Adjustment Expenses, Net of Reinsurance
|
Total of Incurred-but-Not-Reported Liabilities Plus Expected Development on Reported Claims
|
Cumulative Number of Reported Claims
|
|||||||||||||||||||||||||
|
Years ended December 31,
|
|||||||||||||||||||||||||||
|
Accident Year
|
2012
|
2013
|
2014
|
2015
|
2016
|
||||||||||||||||||||||
|
(In thousands)
|
(Unaudited)
|
||||||||||||||||||||||||||
|
2012
|
$
|
2,511
|
|
$
|
2,445
|
|
$
|
2,448
|
|
$
|
2,440
|
|
$
|
2,440
|
|
$
|
—
|
|
898
|
|
|||||||
|
2013
|
2,058
|
|
1,977
|
|
1,970
|
|
1,964
|
|
—
|
|
328
|
|
|||||||||||||||
|
2014
|
1,744
|
|
1,650
|
|
1,575
|
|
—
|
|
254
|
|
|||||||||||||||||
|
2015
|
1,777
|
|
1,731
|
|
10
|
|
356
|
|
|||||||||||||||||||
|
2016
|
2,071
|
|
175
|
|
463
|
|
|||||||||||||||||||||
|
Total
|
$
|
9,781
|
|
||||||||||||||||||||||||
The following table presents paid claims development as of December 31, 2016, net of reinsurance. Claims data for 2012 through 2015 are unaudited.
|
Cumulative Paid Claims and Allocated Claim Adjustment Expenses,
Net of Reinsurance
|
||||||||||||||||||||
|
Years ended December 31,
|
||||||||||||||||||||
|
Accident Year
|
2012
|
2013
|
2014
|
2015
|
2016
|
|||||||||||||||
|
(In thousands)
|
(Unaudited)
|
|||||||||||||||||||
|
2012
|
$
|
2,144
|
|
$
|
2,428
|
|
$
|
2,440
|
|
$
|
2,440
|
|
$
|
2,440
|
|
|||||
|
2013
|
1,751
|
|
1,964
|
|
1,964
|
|
1,964
|
|
||||||||||||
|
2014
|
1,361
|
|
1,556
|
|
1,560
|
|
||||||||||||||
|
2015
|
1,410
|
|
1,637
|
|
||||||||||||||||
|
2016
|
1,680
|
|
||||||||||||||||||
|
Total
|
9,281
|
|
||||||||||||||||||
|
All outstanding liabilities before 2012, net of reinsurance
|
—
|
|
||||||||||||||||||
|
Liabilities for claims and claim adjustment expenses, net of reinsurance
|
$
|
500
|
|
|||||||||||||||||
92
CITIZENS, INC. AND CONSOLIDATED SUBSIDIARIES
Notes to Consolidated Financial Statements, Continued
The reconciliation of the net incurred and paid claims development tables to the liability for claims and claim adjustment expenses in the consolidated statement of financial position is as follows.
|
|
Year Ended December 31,
|
||
|
|
2016
|
||
|
|
(In thousands)
|
||
|
Net outstanding liabilities
|
|
|
|
|
Special property
|
$
|
500
|
|
|
Other short-duration insurance lines
|
43
|
|
|
|
Liabilities for unpaid claims and claim adjustment expenses, net of reinsurance
|
543
|
|
|
|
|
|
||
|
Reinsurance recoverable on unpaid claims
|
|||
|
Special property
|
—
|
|
|
|
Other insurance lines
|
340
|
|
|
|
Total reinsurance recoverable on unpaid claims
|
340
|
|
|
|
Insurance lines other than short duration
|
8,655
|
|
|
|
|
|
|
|
|
Total gross liability for unpaid claims and claim adjustment expenses
|
$
|
9,538
|
|
The following is supplementary information to the consolidated financial statements about average historical claims duration as of December 31, 2016.
|
Average Annual Percentage Payout of Incurred Claims by Age, Net of Reinsurance (Unaudited)
|
|||||||||||||||
|
Years
|
1
|
2
|
3
|
4
|
5
|
||||||||||
|
Special Property
|
85.25
|
%
|
12.00
|
%
|
0.16
|
%
|
—
|
%
|
—
|
%
|
|||||
Note 5:
Reinsurance
In the normal course of business, the Company reinsures portions of certain policies that we underwrite to limit disproportionate risks. During
2016
and
2015
, we retained varying amounts of individual insurance up to a maximum retention of
$100,000
on any life. The Company also reinsures
100%
of our accidental death benefit rider coverage. Catastrophe reinsurance is in place for our property policies. In
2016
and
2015
, this reinsurance provided
$10,000,000
of coverage above a
$500,000
deductible. Our health insurance policies are substantially all reinsured on a
100%
coinsurance basis. We remain contingently liable to the extent that the reinsuring companies cannot meet their obligations under these reinsurance treaties.
Our amounts recoverable from reinsurers represent receivables from and reserves ceded to reinsurers. We obtain reinsurance from multiple reinsurers, and we monitor concentration as well as financial strength ratings of our principal reinsurers. The ratings by A.M. Best Company range from B+ (Good) to A+ (Superior). To protect our position, we have established and funded a trust to cover the contingent liabilities related to accident and health reinsurance ceded to Unified Life Insurance Company, which represents
$51,000
of the
$3.9 million
of reinsurance recoverable at
December 31, 2016
.
93
CITIZENS, INC. AND CONSOLIDATED SUBSIDIARIES
Notes to Consolidated Financial Statements, Continued
Assumed and ceded life reinsurance activity as of
December 31, 2016
and
2015
is summarized as follows:
|
|
At December 31,
|
|||||
|
|
2016
|
2015
|
||||
|
|
(In thousands)
|
|||||
|
Aggregate assumed life insurance in force
|
$
|
22,915
|
|
36,766
|
|
|
|
Aggregate ceded life insurance in force
|
$
|
(522,821
|
)
|
(516,933
|
)
|
|
|
Net life insurance in force
|
$
|
4,497,735
|
|
4,478,202
|
|
|
The Company's reinsurance recoveries on ceded reinsurance were
$3.9 million
in
2016
and
$4.2 million
in
2015
. Premiums, claims and surrenders assumed and ceded for all lines of business for these years are summarized as follows:
|
|
Years ended December 31,
|
||||||||
|
|
2016
|
2015
|
2014
|
||||||
|
|
(In thousands)
|
||||||||
|
Premiums from short-duration contracts:
|
|
|
|
||||||
|
Direct
|
$
|
6,927
|
|
7,223
|
|
7,209
|
|
||
|
Assumed
|
—
|
|
—
|
|
—
|
|
|||
|
Ceded
|
(828
|
)
|
(873
|
)
|
(967
|
)
|
|||
|
Net premiums earned
|
6,099
|
|
6,350
|
|
6,242
|
|
|||
|
Premiums from long-duration contracts:
|
|
|
|
|
|
|
|||
|
Direct
|
194,147
|
|
190,114
|
|
184,229
|
|
|||
|
Assumed
|
151
|
|
353
|
|
421
|
|
|||
|
Ceded
|
(2,521
|
)
|
(2,337
|
)
|
(2,360
|
)
|
|||
|
Net premiums earned
|
191,777
|
|
188,130
|
|
182,290
|
|
|||
|
Total premiums earned
|
$
|
197,876
|
|
194,480
|
|
188,532
|
|
||
|
Claims and surrenders assumed
|
$
|
237
|
|
414
|
|
466
|
|
||
|
Claims and surrenders ceded
|
$
|
(877
|
)
|
(1,013
|
)
|
(1,108
|
)
|
||
SPFIC has catastrophe reinsurance that covers the first event in excess of a
$500,000
deductible up to
$10.0 million
. In consideration for a reinstatement premium, second event coverage is provided in excess of a
$500,000
deductible up to
$10.0 million
. The annual premium was approximately
$0.8 million
in
2016
,
$0.9 million
in
2015
and
$1.0 million
in
2014
.
Note 6:
Stockholders' Equity and Restrictions
The
two
classes of our common stock are equal in all respects, except (a) each Class A share receives twice the cash dividends paid on a per share basis to the Class B common stock; and (b) the Class B common stock elects a simple majority of the Board of Directors of Citizens and the Class A common stock elects the remaining directors.
94
CITIZENS, INC. AND CONSOLIDATED SUBSIDIARIES
Notes to Consolidated Financial Statements, Continued
The table below shows the combined total of all of our insurance subsidiaries' capital and surplus and net income (loss) for life insurance operations and property insurance operations, although these amounts are not all available as dividends to Citizens, Inc., because only CICA is directly owned by Citizens, Inc. All other subsidiaries are owned by CICA.
|
|
Years ended December 31,
|
|||||
|
|
2016
|
2015
|
||||
|
Combined Statutory Stockholders' Equity
|
(In thousands)
|
|||||
|
|
||||||
|
Life insurance operations
|
$
|
28,009
|
|
28,624
|
|
|
|
Property insurance operations
|
6,863
|
|
6,462
|
|
||
|
Total statutory equity
|
$
|
34,872
|
|
35,086
|
|
|
The 2015 surplus amounts have been corrected.
|
|
Years ended December 31,
|
||||||||
|
|
2016
|
2015
|
2014
|
||||||
|
Combined Statutory Net Income (Loss)
|
(In thousands)
|
||||||||
|
Life insurance operations
|
$
|
11,987
|
|
(7,972
|
)
|
(5,821
|
)
|
||
|
Property insurance operations
|
401
|
|
607
|
|
749
|
|
|||
|
Total statutory net income (loss)
|
$
|
12,388
|
|
(7,365
|
)
|
(5,072
|
)
|
||
Generally, the net assets of the insurance subsidiaries available for transfer to their immediate parent are limited to the greater of the subsidiary net gain from operations during the preceding year or
10%
of the subsidiary net statutory surplus as of the end of the preceding year as determined in accordance with accounting practices prescribed or permitted by insurance regulatory authorities. Under these practices, total surplus at
December 31, 2016
was
$31.7 million
and net gain from operations was
$16.5 million
for CICA. Based upon statutory net gain from operations and surplus of CICA as of and for the year ended
December 31, 2016
, a dividend of approximately
$3.2 million
could be paid to the Company without prior regulatory approval in
2017
. Payments of dividends in excess of such amounts would generally require approval by regulatory authorities.
CICA, CNLIC, SPLIC, MGLIC and SPFIC have calculated their risk based capital ("RBC") in accordance with the National Association of Insurance Commissioners' Model Rule and the RBC rules as adopted by their respective states of domicile. All insurance subsidiaries exceeded RBC minimum levels at
December 31, 2016
.
On June 10, 2016, the National Association of Insurance Commissioners (“NAIC”) Executive Committee and Plenary voted to adopt a recommendation for January 1, 2017 as the operative date for the implementation of Principles-Based Reserves (“PBR”) as a national standard for life insurance products. Although this NAIC standard does not change the reserving requirements under U.S. GAAP, it can be significant for many life insurers. PBR replaces the current formulaic approach to determining policy reserves with an approach that more closely reflects the risks of highly complex products. Companies will be expected to develop “right-sized” reserves that better align with their specific product features, their observed actuarial experience, and their overall risk management procedures. There is a three-year transition period where PBR is optional until PBR becomes required on January 1, 2020. The Company is assessing the impact that this standard will have on its statutory reserving and capital and surplus.
Note 7:
Commitments and Contingencies
Qualification of Life Products
As of December 31, 2014, we determined that a portion of the life insurance policies issued by our subsidiary insurance companies failed to qualify for the favorable U.S. federal income tax treatment afforded by Sections 7702 of the Internal Revenue Code ("IRC") of 1986. This tax code section allows for qualifying products sold to clients to have favorable tax treatment such as the product's inside build up is not taxable. Because these policies were sold with the intention that
95
CITIZENS, INC. AND CONSOLIDATED SUBSIDIARIES
Notes to Consolidated Financial Statements, Continued
they would qualify for this favorable tax treatment, holders of these policies and CICA may now be subject to additional tax liabilities. The policies at issue were sold most substantially to non-U.S. citizens residing abroad and to a lesser extent domestically. Based upon a review of the options available to the Company, we have determined we will not remediate our endowments and endowment-like products under IRC 7702 we have sold to non-U.S. citizens. We do intend to remediate the domestic products we have sold to U.S. citizens. In addition, as part of our continuing review, we determined in July 2015 that certain annuity contracts do not contain qualifying language under IRC 72(s) as intended that would have provided for favorable tax treatment of the annuities. This issue affects both our domestic and international contract holders. The Company has continued to refine the understanding of the tax failures as previously reported by preparing an individual policy calculation and has reflected the related exposure for the current reporting period as noted below. Failure of these policies to qualify under IRC Sections 7702 and 72(s) has resulted in additional liabilities and expenses as described below. The products have been and continue to be appropriately reported under U.S. GAAP for financial reporting.
The failure of these policies to qualify under Sections 7702 and 72(s) results in an estimated liability as of
December 31, 2016
of
$14.4
million, after tax, related to projected IRS toll charges and fees of
$14.1
million as well as claims liability for past claims and reserves increases to bring policies into compliance totaling
$0.3
million. The estimated liability at
December 31, 2016
is down
$0.2 million
from the estimated liability at December 31, 2015 of
$14.6 million
, after tax, due to a continued refinement of our estimate and additional accrued interest charges. The probability weighted range of financial estimates relative to this issue is
$7.5 million
to
$44.8 million
, after tax. This estimated range includes projected toll charges and fees payable to the IRS, as well as estimated increased payout obligations to current and former holders of non-compliant domestic life insurance policies expected to result from remediation of those policies. The estimated liability and the estimated range will be updated as we continue to refine our estimates. The amount of our liabilities and expenses depends on a number of uncertainties, including the number of prior tax years for which we may be liable to the IRS, the number of domestic life insurance policies we will be required to remediate, and the methodology applicable to the calculation of taxable benefits under non-compliant policies. Given the range of potential outcomes and the significant variables assumed in establishing our estimates, actual amounts incurred may exceed our reserve and also could exceed the high end of our estimated range of liabilities and expenses. To the extent the amount reserved by the Company is insufficient to meet the actual amount of our liability and expenses, or if our estimates of those liabilities and expenses change in the future, our financial condition and results of operations may be materially adversely affected. Management believes that based upon current information we have recorded the best estimate liability to date.
Accruals for loss contingencies are recorded when it is probable that a liability has been incurred and the amount can be reasonably estimated. The process of determining our best estimate and the estimated range was a complex undertaking including insight from external consultants and involved management’s judgment based upon a variety of factors known at the time. We recorded additional general expenses of
$1.9 million
in
2016
related to our 7702 and 72(s) issues. Additional costs will be incurred in
2017
associated with these issues and we believe these costs will range from
$1.0 million
to
$2.0 million
, but due to the uncertainty of actions we cannot reasonably estimate these costs with any reliability. Actual amounts incurred may exceed this estimate and will be recorded as they become probable and can be reasonably estimated.
Litigation
From time to time we are subject to legal and regulatory actions relating to our business. We defend all claims vigorously. As a result, we incur defense costs, including attorneys' fees, other direct litigation costs and the expenditure of management time that otherwise would be devoted to our business. If we suffer an adverse judgment as a result of litigation claims, it could have a material adverse effect on our business, results of operations and financial condition.
Compliance
Some of our top international markets are in countries identified by the U.S. Department of State as jurisdictions of high risk for money laundering. As required by Bank Secrecy Act (“BSA”) regulations applicable to insurance companies, we have developed and implemented an anti-money laundering program that includes policies and procedures for complying with applicable BSA program, reporting and recordkeeping requirements and for deterring, preventing and detecting potential money laundering and other criminal activity (“BSA Program”). Based on a prior internal risk assessment, we have enhanced our BSA Program with additional controls, such as list screening software beyond sanctions screening required by the Office of Foreign Assets Control (“OFAC”), enhanced payment due diligence and transaction controls.
96
CITIZENS, INC. AND CONSOLIDATED SUBSIDIARIES
Notes to Consolidated Financial Statements, Continued
Unclaimed Property Contingencies
The Company has been informed by the Louisiana Department of Treasury, Arkansas Auditor of State and the Texas State Comptroller, that they authorized an audit of Citizens, Inc. and its affiliates for compliance with unclaimed property laws. This audit is being conducted by Verus Financial LLC on behalf of the states.
The external audit may result in additional payments to beneficiaries, additional escheatment of funds deemed abandoned under state laws, administrative penalties, interest, and changes to the Company's procedures for the identification and escheatment of abandoned property. The Company believes additional escheatment of funds in Arkansas or Texas will not be material to our financial condition or results of operations. However, additional escheatment of funds in Louisiana, which may subsequently be deemed abandoned under the Louisiana Department of Treasury’s audit, could be substantial for SPLIC if the Louisiana Department of Treasury chooses to disregard recent unclaimed property litigation in favor of the insurance industry. At this time, the Company is not able to estimate any of these possible amounts.
We have the following operating lease commitments as of
December 31, 2016
with the payments due by the periods indicated below.
|
|
Lease Commitments
|
||
|
|
(In thousands)
|
||
|
Less than 1 year
|
$
|
481
|
|
|
1 year to 3 years
|
553
|
|
|
|
3 years to 5 years
|
221
|
|
|
|
More than 5 years
|
—
|
|
|
|
Total
|
$
|
1,255
|
|
Operating lease expense was
$0.6 million
for the year ended
December 31, 2016
, and
$0.6 million
for both periods ended
2015
and
2014
.
97
CITIZENS, INC. AND CONSOLIDATED SUBSIDIARIES
Notes to Consolidated Financial Statements, Continued
Note 8:
Segment and Other Operating Information
The Company has
three
reportable segments: Life Insurance, Home Service Insurance and Other Non-Insurance Enterprises. The accounting policies of the segments are in accordance with U.S. GAAP and are the same as those described in the summary of significant account policies. We evaluate profit and loss performance based on U.S. GAAP net income before federal income taxes for our three reportable segments.
The Company has no reportable differences between segments and consolidated operations.
|
|
Year ended December 31, 2016
|
|||||||||||
|
|
Life
Insurance
|
Home
Service
|
Other
Non-Insurance
Enterprises
|
Consolidated
|
||||||||
|
|
(In thousands)
|
|||||||||||
|
Revenues:
|
|
|
|
|
||||||||
|
Premiums
|
$
|
151,195
|
|
46,681
|
|
—
|
|
197,876
|
|
|||
|
Net investment income
|
33,350
|
|
13,705
|
|
1,505
|
|
48,560
|
|
||||
|
Realized investment losses, net
|
(1,685
|
)
|
(300
|
)
|
—
|
|
(1,985
|
)
|
||||
|
Other income
|
882
|
|
5
|
|
68
|
|
955
|
|
||||
|
Total revenue
|
183,742
|
|
60,091
|
|
1,573
|
|
245,406
|
|
||||
|
Benefits and expenses:
|
|
|
|
|
|
|
|
|
||||
|
Insurance benefits paid or provided:
|
|
|
|
|
|
|
|
|
||||
|
Claims and surrenders
|
58,440
|
|
22,927
|
|
—
|
|
81,367
|
|
||||
|
Increase in future policy benefit reserves
|
71,373
|
|
4,508
|
|
—
|
|
75,881
|
|
||||
|
Policyholders' dividends
|
6,774
|
|
58
|
|
—
|
|
6,832
|
|
||||
|
Total insurance benefits paid or provided
|
136,587
|
|
27,493
|
|
—
|
|
164,080
|
|
||||
|
Commissions
|
29,235
|
|
15,406
|
|
—
|
|
44,641
|
|
||||
|
Other general expenses
|
14,284
|
|
15,252
|
|
3,820
|
|
33,356
|
|
||||
|
Capitalization of deferred policy acquisition costs
|
(26,742
|
)
|
(5,990
|
)
|
—
|
|
(32,732
|
)
|
||||
|
Amortization of deferred policy acquisition costs
|
24,428
|
|
4,087
|
|
—
|
|
28,515
|
|
||||
|
Amortization of cost of customer relationships acquired
|
559
|
|
1,504
|
|
—
|
|
2,063
|
|
||||
|
Total benefits and expenses
|
178,351
|
|
57,752
|
|
3,820
|
|
239,923
|
|
||||
|
Income (loss) before income tax expense
|
$
|
5,391
|
|
2,339
|
|
(2,247
|
)
|
5,483
|
|
|||
98
CITIZENS, INC. AND CONSOLIDATED SUBSIDIARIES
Notes to Consolidated Financial Statements, Continued
|
|
Year ended December 31, 2015 (a)
|
|||||||||||
|
|
Life
Insurance
|
Home
Service
|
Other
Non-Insurance
Enterprises
|
Consolidated
|
||||||||
|
|
(In thousands)
|
|||||||||||
|
Revenues:
|
|
|
|
|
||||||||
|
Premiums
|
$
|
147,832
|
|
46,648
|
|
—
|
|
194,480
|
|
|||
|
Net investment income
|
30,206
|
|
14,063
|
|
1,513
|
|
45,782
|
|
||||
|
Realized investment losses, net
|
(3,873
|
)
|
(1,586
|
)
|
—
|
|
(5,459
|
)
|
||||
|
Other income
|
1,008
|
|
86
|
|
371
|
|
1,465
|
|
||||
|
Total revenue
|
175,173
|
|
59,211
|
|
1,884
|
|
236,268
|
|
||||
|
Benefits and expenses:
|
|
|
|
|
|
|
|
|
||||
|
Insurance benefits paid or provided:
|
|
|
|
|
|
|
|
|
||||
|
Claims and surrenders
|
55,912
|
|
22,967
|
|
—
|
|
78,879
|
|
||||
|
Increase in future policy benefit reserves
|
73,259
|
|
3,801
|
|
—
|
|
77,060
|
|
||||
|
Policyholders' dividends
|
10,695
|
|
52
|
|
—
|
|
10,747
|
|
||||
|
Total insurance benefits paid or provided
|
139,866
|
|
26,820
|
|
—
|
|
166,686
|
|
||||
|
Commissions
|
28,336
|
|
15,289
|
|
—
|
|
43,625
|
|
||||
|
Other general expenses
|
16,345
|
|
13,349
|
|
3,593
|
|
33,287
|
|
||||
|
Capitalization of deferred policy acquisition costs
|
(25,268
|
)
|
(5,836
|
)
|
—
|
|
(31,104
|
)
|
||||
|
Amortization of deferred policy acquisition costs
|
20,025
|
|
3,375
|
|
—
|
|
23,400
|
|
||||
|
Amortization of cost of customer relationships acquired
|
641
|
|
1,676
|
|
—
|
|
2,317
|
|
||||
|
Total benefits and expenses
|
179,945
|
|
54,673
|
|
3,593
|
|
238,211
|
|
||||
|
Income (loss) before income tax expense
|
$
|
(4,772
|
)
|
4,538
|
|
(1,709
|
)
|
(1,943
|
)
|
|||
(a) Certain previously reported information has been corrected to reflect immaterial corrections to the financial statements. For more information, refer to Note 1.
99
CITIZENS, INC. AND CONSOLIDATED SUBSIDIARIES
Notes to Consolidated Financial Statements, Continued
|
Year ended December 31, 2014 (a)
|
||||||||||||
|
|
Life
Insurance
|
Home
Service
|
Other
Non-Insurance
Enterprises
|
Consolidated
|
||||||||
|
|
(In thousands)
|
|||||||||||
|
Revenues:
|
|
|
|
|
||||||||
|
Premiums
|
$
|
142,358
|
|
46,174
|
|
—
|
|
188,532
|
|
|||
|
Net investment income
|
26,454
|
|
13,234
|
|
1,374
|
|
41,062
|
|
||||
|
Realized investment gains (losses), net
|
(182
|
)
|
116
|
|
47
|
|
(19
|
)
|
||||
|
Other income
|
504
|
|
29
|
|
117
|
|
650
|
|
||||
|
Total revenue
|
169,134
|
|
59,553
|
|
1,538
|
|
230,225
|
|
||||
|
Benefits and expenses:
|
|
|
|
|
|
|
|
|
||||
|
Insurance benefits paid or provided:
|
|
|
|
|
|
|
|
|
||||
|
Claims and surrenders
|
46,021
|
|
22,248
|
|
—
|
|
68,269
|
|
||||
|
Increase in future policy benefit reserves
|
76,858
|
|
5,140
|
|
—
|
|
81,998
|
|
||||
|
Policyholders' dividends
|
10,045
|
|
57
|
|
—
|
|
10,102
|
|
||||
|
Total insurance benefits paid or provided
|
132,924
|
|
27,445
|
|
—
|
|
160,369
|
|
||||
|
Commissions
|
28,863
|
|
15,158
|
|
—
|
|
44,021
|
|
||||
|
Other general expenses
|
19,274
|
|
15,036
|
|
2,281
|
|
36,591
|
|
||||
|
Capitalization of deferred policy acquisition costs
|
(26,242
|
)
|
(5,829
|
)
|
—
|
|
(32,071
|
)
|
||||
|
Amortization of deferred policy acquisition costs
|
17,778
|
|
3,305
|
|
—
|
|
21,083
|
|
||||
|
Amortization of cost of customer relationships acquired
|
614
|
|
1,568
|
|
—
|
|
2,182
|
|
||||
|
Total benefits and expenses
|
173,211
|
|
56,683
|
|
2,281
|
|
232,175
|
|
||||
|
Income (loss) before income tax expense
|
$
|
(4,077
|
)
|
2,870
|
|
(743
|
)
|
(1,950
|
)
|
|||
(a) Certain previously reported information has been corrected to reflect immaterial corrections to the financial statements. For more information, refer to Note 1.
The table below summarizes assets by segment.
|
|
December 31,
|
|||||
|
|
2016
|
2015
|
||||
|
|
(In thousands)
|
|||||
|
Assets:
|
|
|
||||
|
Life Insurance
|
$
|
1,130,288
|
|
1,011,487
|
|
|
|
Home Service Insurance
|
374,986
|
|
389,478
|
|
||
|
Other Non-Insurance Enterprises
|
78,394
|
|
79,786
|
|
||
|
Total assets
|
$
|
1,583,668
|
|
1,480,751
|
|
|
100
CITIZENS, INC. AND CONSOLIDATED SUBSIDIARIES
Notes to Consolidated Financial Statements, Continued
Major categories of earned premiums are summarized as follows:
|
|
Years ended December 31,
|
||||||||
|
|
2016
|
2015
|
2014
|
||||||
|
|
(In thousands)
|
||||||||
|
Premium income:
|
|
|
|
||||||
|
Ordinary life
|
$
|
191,226
|
|
187,479
|
|
181,596
|
|
||
|
Group life
|
28
|
|
207
|
|
261
|
|
|||
|
Accident and health
|
1,546
|
|
1,599
|
|
1,557
|
|
|||
|
Property
|
5,076
|
|
5,195
|
|
5,118
|
|
|||
|
Total premium income
|
$
|
197,876
|
|
194,480
|
|
188,532
|
|
||
Geographic Information
The following table sets forth the Company's annual total of earned premiums from geographic area for the years indicated:
|
|
Years ended December 31,
|
||||||||
|
|
2016
|
2015
|
2014
|
||||||
|
|
(In thousands)
|
||||||||
|
Area:
|
|
|
|
||||||
|
United States
|
$
|
54,430
|
|
54,753
|
|
54,464
|
|
||
|
Venezuela
|
31,107
|
|
31,948
|
|
31,175
|
|
|||
|
Colombia
|
29,643
|
|
27,589
|
|
27,472
|
|
|||
|
Taiwan
|
18,590
|
|
18,031
|
|
16,686
|
|
|||
|
Ecuador
|
15,456
|
|
15,527
|
|
15,364
|
|
|||
|
Brazil
|
9,856
|
|
8,960
|
|
8,517
|
|
|||
|
Other foreign countries
|
41,992
|
|
40,529
|
|
37,760
|
|
|||
|
Net reinsurance
|
(3,198
|
)
|
(2,857
|
)
|
(2,906
|
)
|
|||
|
Total
|
$
|
197,876
|
|
194,480
|
|
188,532
|
|
||
Note 9:
Income Taxes
Our federal income tax expense was
$3.5 million
,
$1.2 million
and
$4.0 million
in
2016
,
2015
and
2014
, respectively. This represents effective tax rates of
64.1%
,
(61.8)%
and
(206.2)%
, respectively. The high effective rate in 2016 was primarily due to the effect of our uncertain tax position and the nondeductible costs to remediate our tax compliance issues. The 2014 impact is the result of costs to remediate the tax compliance issue we identified in early 2015 which impacted the 2014 effective tax rate negatively by approximately
$3.5
million due to approximately $
10.0
million of these costs not being deductible for tax. Additionally, after further refinement of these amounts in 2015 plus the effects of toll charges for the IRC Section 72(s) tax compliance issue identified in the second quarter of 2015, an additional $
3.3
million of nondeductible toll charges were recorded in 2015, which negatively impacted the 2015 tax rate by $
1.2
million.
The Company holds
no
valuation allowance in other comprehensive income at
December 31, 2016
or
2015
.
101
CITIZENS, INC. AND CONSOLIDATED SUBSIDIARIES
Notes to Consolidated Financial Statements, Continued
The table below summarizes the changes in the valuation allowance.
|
|
Deferred Tax
Liability
|
Other
Comprehensive
Income
|
Goodwill
|
Income Tax
Expense
(Benefit)
|
||||||||
|
|
(In thousands)
|
|||||||||||
|
Balance at December 31, 2013
|
$
|
—
|
|
(63
|
)
|
1,058
|
|
(995
|
)
|
|||
|
Release of valuation allowance in 2014
|
—
|
|
21
|
|
—
|
|
(21
|
)
|
||||
|
Balance at December 31, 2014
|
—
|
|
(42
|
)
|
1,058
|
|
(1,016
|
)
|
||||
|
Release of valuation allowance in 2015
|
—
|
|
42
|
|
—
|
|
(42
|
)
|
||||
|
Balance at December 31, 2015
|
—
|
|
—
|
|
1,058
|
|
(1,058
|
)
|
||||
|
Release of valuation allowance in 2016
|
—
|
|
—
|
|
—
|
|
—
|
|
||||
|
Balance at December 31, 2016
|
$
|
—
|
|
—
|
|
1,058
|
|
(1,058
|
)
|
|||
A reconciliation of federal income tax expense computed by applying the federal income tax rate of
35%
in
2016
,
2015
and
2014
to income (loss) before federal income tax expense is as follows:
|
|
Years Ended December 31,
|
|||||||||||||||||||
|
|
2016
|
2015 (a)
|
2014 (a)
|
|||||||||||||||||
|
Amount
|
%
|
Amount
|
%
|
Amount
|
%
|
|||||||||||||||
|
|
(In thousands)
|
|||||||||||||||||||
|
Expected tax expense (benefit)
|
$
|
1,919
|
|
35.0
|
%
|
$
|
(680
|
)
|
35.0
|
%
|
$
|
(682
|
)
|
35.0
|
%
|
|||||
|
Release of valuation allowance previously held in other comprehensive income
|
—
|
|
—
|
|
(42
|
)
|
2.2
|
|
(21
|
)
|
1.1
|
|
||||||||
|
Taxable stock sales
|
263
|
|
4.8
|
|
—
|
|
—
|
|
—
|
|
—
|
|
||||||||
|
Tax-exempt interest and dividends-received deduction
|
(553
|
)
|
(10.1
|
)
|
(746
|
)
|
38.4
|
|
(862
|
)
|
44.2
|
|
||||||||
|
Adjustment of prior year taxes
|
29
|
|
0.5
|
|
(317
|
)
|
16.3
|
|
1
|
|
(0.1
|
)
|
||||||||
|
Effect of graduated rates
|
(57
|
)
|
(1.0
|
)
|
(71
|
)
|
3.7
|
|
(89
|
)
|
4.6
|
|
||||||||
|
Effect of uncertain tax position
|
1,672
|
|
30.5
|
|
1,890
|
|
(97.3
|
)
|
2,136
|
|
(109.5
|
)
|
||||||||
|
Nondeductible costs to remediate tax compliance issue
|
241
|
|
4.4
|
|
1,152
|
|
(59.3
|
)
|
3,514
|
|
(180.2
|
)
|
||||||||
|
Other
|
—
|
|
—
|
|
14
|
|
(0.8
|
)
|
23
|
|
(1.3
|
)
|
||||||||
|
Total income tax expense
|
$
|
3,514
|
|
64.1
|
%
|
$
|
1,200
|
|
(61.8
|
)%
|
$
|
4,020
|
|
(206.2
|
)%
|
|||||
(a) Certain previously reported information has been corrected to reflect immaterial corrections to the financial statements. For more information, refer to Note 1.
102
CITIZENS, INC. AND CONSOLIDATED SUBSIDIARIES
Notes to Consolidated Financial Statements, Continued
Income tax expense consists of:
|
|
Years Ended December 31,
|
||||||||
|
|
2016
|
2015 (a)
|
2014 (a)
|
||||||
|
|
(In thousands)
|
||||||||
|
Current
|
$
|
13,348
|
|
(2,315
|
)
|
82,900
|
|
||
|
Deferred
|
(9,834
|
)
|
3,515
|
|
(78,880
|
)
|
|||
|
Total income tax expense
|
$
|
3,514
|
|
1,200
|
|
4,020
|
|
||
(a) Certain previously reported information has been corrected to reflect immaterial corrections to the financial statements. For more information, refer to Note 1.
Deferred tax expense is comprised of
$9.8 million
deferred tax expense less
$0
tax benefit released from OCI.
The components of deferred federal income taxes are as follows:
|
|
December 31,
|
|||||
|
|
2016
|
2015 (a)
|
||||
|
|
(In thousands)
|
|||||
|
Deferred tax assets:
|
|
|
||||
|
Future policy benefit reserves
|
$
|
123,101
|
|
116,246
|
|
|
|
Net operating and capital loss carryforwards
|
—
|
|
583
|
|
||
|
Accrued expenses
|
104
|
|
121
|
|
||
|
Investments
|
6,803
|
|
3,848
|
|
||
|
State income tax credits
|
119
|
|
123
|
|
||
|
Other
|
56
|
|
165
|
|
||
|
Total gross deferred tax assets
|
130,183
|
|
121,086
|
|
||
|
Deferred tax liabilities:
|
|
|
|
|
||
|
Deferred policy acquisition costs, cost of customer relationships acquired and intangible assets
|
(44,709
|
)
|
(45,417
|
)
|
||
|
Unrealized gains on investments available-for-sale
|
(7,556
|
)
|
(7,428
|
)
|
||
|
Accrued policyholder dividends
|
(815
|
)
|
(984
|
)
|
||
|
Other
|
(234
|
)
|
(112
|
)
|
||
|
Total gross deferred tax liabilities
|
(53,314
|
)
|
(53,941
|
)
|
||
|
Net deferred tax asset
|
$
|
76,869
|
|
67,145
|
|
|
(a) Certain previously reported information has been corrected to reflect immaterial corrections to the financial statements. For more information, refer to Note 1.
103
CITIZENS, INC. AND CONSOLIDATED SUBSIDIARIES
Notes to Consolidated Financial Statements, Continued
A summary of the changes in the components of deferred federal and state income taxes is as follows:
|
|
December 31,
|
|||||
|
|
2016
|
2015 (a)
|
||||
|
|
(In thousands)
|
|||||
|
Deferred federal and state income taxes:
|
|
|
||||
|
Balance January 1,
|
$
|
67,145
|
|
64,122
|
|
|
|
Deferred tax benefit
|
9,834
|
|
(3,557
|
)
|
||
|
Investments available-for-sale
|
(128
|
)
|
6,695
|
|
||
|
Effects of unrealized gains on DAC, CCRA and reserves
|
18
|
|
(115
|
)
|
||
|
Balance December 31,
|
$
|
76,869
|
|
67,145
|
|
|
(a) Certain previously reported information has been corrected to reflect immaterial corrections to the financial statements. For more information, refer to Note 1.
The Company and our subsidiaries had
no
net operating losses at
December 31, 2016
. At
December 31, 2016
and
2015
, we determined that as a result of our taxable income in carryback periods, tax planning strategies, and the expected reversal of existing deferred tax liabilities, it was more likely than not that the deferred tax assets would be realized.
The Company and our subsidiaries had
no
capital loss carry-forwards at
December 31, 2016
.
The Company recognizes only the impact of tax positions that, based on their technical merits, are more likely than not to be sustained upon an audit by the taxing authority.
A reconciliation of unrecognized tax benefits is as follows:
|
|
Years ended December 31,
|
||||||||
|
|
2016
|
2015
|
2014
|
||||||
|
|
(In thousands)
|
||||||||
|
Balance at January 1,
|
$
|
78,079
|
|
81,459
|
|
1,539
|
|
||
|
Additions based on tax positions related to the current year
|
3,546
|
|
3,608
|
|
10,132
|
|
|||
|
Additions for tax positions of prior years
|
4,706
|
|
1,570
|
|
71,327
|
|
|||
|
Reductions for tax positions of prior years
|
(569
|
)
|
(8,558
|
)
|
(1,539
|
)
|
|||
|
Balance December 31,
|
$
|
85,762
|
|
78,079
|
|
81,459
|
|
||
This unrecognized tax benefit is reported net in current federal income tax payable in the Consolidated Statements of Financial Position. Included in these amounts is
$5.7 million
and
$3.5 million
of interest expense with respect to unrecognized tax benefit as of
December 31, 2016
and
2015
, respectively.
None of the Company’s unrecognized tax benefits at
December 31, 2016
would affect the effective tax rate if recognized. The Company does not believe there is a reasonable possibility the total amount of uncertain tax benefits will significantly increase or decrease in the next twelve months.
The Company’s practice is to recognize interest and penalties related to income tax matters in income tax expense. In the Consolidated Statements of Comprehensive Income (Loss), the amount of interest expense recorded was
$2.2 million
,
$0.4 million
and
$3.1 million
for the years ended
December 31, 2016
,
2015
and
2014
, respectively.
104
CITIZENS, INC. AND CONSOLIDATED SUBSIDIARIES
Notes to Consolidated Financial Statements, Continued
The Company's Federal income tax return is filed on a consolidated basis with the following entities:
Citizens, Inc.
CICA Life Insurance Company of America
Security Plan Life Insurance Company
Security Plan Fire Insurance Company
Computing Technology, Inc.
Insurance Investors, Inc.
Citizens National Life Insurance Company
Magnolia Guaranty Life Insurance Company files its Federal income tax return on a stand-alone basis as it is not eligible to join the consolidated group until 2020.
The method of allocation among companies is subject to a written tax sharing agreement, approved by the Board of Directors, whereby allocation is made primarily on a separate return basis with current credit for any net operating losses or other items utilized in the consolidated tax return. Intercompany tax balances are settled quarterly.
The Company and our subsidiaries file income tax returns in the U.S. Federal jurisdiction and various U.S. states. None of our subsidiaries are subject to examination by U.S. tax authorities for years prior to 2012.
105
CITIZENS, INC. AND CONSOLIDATED SUBSIDIARIES
Notes to Consolidated Financial Statements, Continued
Note 10:
Other Comprehensive Income (Loss)
The changes in the components of other comprehensive income (loss) are reported net of the effects of income taxes of
35%
in
2016
,
2015
and
2014
, as indicated below.
|
|
Amount
|
Tax Effect
|
Amount
|
||||||
|
|
(In thousands)
|
||||||||
|
Year ended December 31, 2016
|
|
|
|
||||||
|
Unrealized gains (losses) on securities:
|
|
|
|
||||||
|
Unrealized holding gains (losses) arising during the period
|
$
|
(1,608
|
)
|
563
|
|
(1,045
|
)
|
||
|
Reclassification adjustment for (gains) losses included in net income
(1)
|
1,974
|
|
(691
|
)
|
1,283
|
|
|||
|
Effects on DAC and CCRA
|
(51
|
)
|
18
|
|
(33
|
)
|
|||
|
Other comprehensive income (loss)
|
$
|
315
|
|
(110
|
)
|
205
|
|
||
|
Year ended December 31, 2015
|
|
|
|
|
|
|
|||
|
Unrealized gains (losses) on securities:
|
|
|
|
|
|
|
|||
|
Unrealized holding gains (losses) arising during the period
|
$
|
(24,545
|
)
|
8,591
|
|
(15,954
|
)
|
||
|
Reclassification adjustment for (gains) losses included in net income
|
5,415
|
|
(1,895
|
)
|
3,520
|
|
|||
|
Effects on DAC and CCRA
|
328
|
|
(115
|
)
|
213
|
|
|||
|
Change in tax valuation allowance
|
—
|
|
(42
|
)
|
(42
|
)
|
|||
|
Other comprehensive income (loss)
|
$
|
(18,802
|
)
|
6,539
|
|
(12,263
|
)
|
||
|
Year ended December 31, 2014
|
|
|
|
|
|
|
|||
|
Unrealized gains (losses) on securities:
|
|
|
|
|
|
|
|||
|
Unrealized holding gains (losses) arising during the period
|
$
|
29,643
|
|
(10,375
|
)
|
19,268
|
|
||
|
Reclassification adjustment for (gains) losses included in net income
|
20
|
|
(7
|
)
|
13
|
|
|||
|
Effects on DAC and CCRA
|
(315
|
)
|
110
|
|
(205
|
)
|
|||
|
Change in tax valuation allowance
|
—
|
|
(21
|
)
|
(21
|
)
|
|||
|
Other comprehensive income (loss)
|
$
|
29,348
|
|
(10,293
|
)
|
19,055
|
|
||
(1) Reclassification adjustment included in Realized investment losses, net in the Consolidated Statements of Comprehensive Income (Loss)
Note 11:
Benefit Plans
The Company sponsors a defined contribution profit-sharing plan. Employees with one year of service can participate. Contributions are made at the discretion of the Board of Directors and are subject to a tiered vesting schedule. There were
no
employer contributions to the plan in
2016
or
2015
and
$1.0 million
was contributed in
2014
. The plan does not permit employee contributions.
The Company introduced a new employer-sponsored 401(k) plan to all eligible employees, effective March 1, 2016. This is an additional benefit offered to employees, which supplements the defined contribution profit-sharing plan which was already in existence. Employees with one year of service can participate in the new plan. Contributions are made by employees and the Company provides a matching contribution based upon the employee's level of contribution. The Company's expense related to the new 401(k) plan was
$0.5
million in 2016. On the effective date, the Company's defined contribution profit-sharing plan was merged into the 401(k) plan and it become the Citizens, Inc. 401(k) Retirement and Profit Sharing Plan. Although merged, the profit sharing plan remains a separate and distinct employee benefit for eligible employees.
The Company is primarily self-insured for employee health benefits. The Company records its self-insurance liability based on claims filed and an estimate of claims incurred but not yet reported. There is stop-loss coverage for amounts
106
CITIZENS, INC. AND CONSOLIDATED SUBSIDIARIES
Notes to Consolidated Financial Statements, Continued
in excess of
$100,000
per individual per year. If more claims are made than were estimated or if the costs of actual claims increase beyond what was anticipated, reserves recorded may not be sufficient and additional accruals may be required in future periods.
Note 12:
Related Party Transactions
Citizens, Inc. purchased Class A common shares during
2015
that were held by a subsidiary at market value as of the transaction date, which approximated
$0.8 million
. This transaction was eliminated for financial reporting purposes in accordance with consolidation accounting, but generated a tax expense for the year ended
December 31, 2015
totaling approximately
$0.3 million
.
In
2016
, SPLIC paid a dividend to CICA in the amount of
$20.0 million
.
Note 13:
Quarterly Financial Information (Unaudited)
The following table contains selected unaudited financial data for each quarter.
|
Fourth
Quarter
|
Third
Quarter (a)
|
Second
Quarter (a)
|
First
Quarter (a)
|
|||||||||
|
|
(In thousands, except per share amounts)
|
|||||||||||
|
2016
|
|
|
|
|
||||||||
|
Revenues
|
$
|
67,903
|
|
61,741
|
|
61,237
|
|
54,525
|
|
|||
|
Benefits and expenses
|
68,277
|
|
57,134
|
|
58,678
|
|
55,834
|
|
||||
|
Federal income tax expense (benefit)
|
(490
|
)
|
1,845
|
|
1,077
|
|
1,082
|
|
||||
|
Net income (loss)
|
116
|
|
2,762
|
|
1,482
|
|
(2,391
|
)
|
||||
|
Net income (loss) available to common shareholders
|
116
|
|
2,762
|
|
1,482
|
|
(2,391
|
)
|
||||
|
Basic earnings (losses) per share of Class A common stock
|
—
|
|
0.06
|
|
0.03
|
|
(0.05
|
)
|
||||
|
Basic earnings (losses) per share of Class B common stock
|
—
|
|
0.03
|
|
0.01
|
|
(0.02
|
)
|
||||
|
Diluted earnings (losses) per share of Class A common stock
|
—
|
|
0.06
|
|
0.03
|
|
(0.05
|
)
|
||||
|
Diluted earnings (losses) per share of Class B common stock
|
—
|
|
0.03
|
|
0.01
|
|
(0.02
|
)
|
||||
(a) Certain previously reported information has been corrected to reflect immaterial corrections to the financial statements. For more information, refer to Note 1.
107
CITIZENS, INC. AND CONSOLIDATED SUBSIDIARIES
Notes to Consolidated Financial Statements, Continued
|
Fourth
Quarter (a)
|
Third
Quarter (a)
|
Second
Quarter (a)
|
First
Quarter (a)
|
|||||||||
|
|
(In thousands, except per share amounts)
|
|||||||||||
|
2015
|
|
|
|
|
||||||||
|
Revenues
|
$
|
62,205
|
|
58,124
|
|
60,079
|
|
55,860
|
|
|||
|
Benefits and expenses
|
64,193
|
|
58,039
|
|
60,693
|
|
55,286
|
|
||||
|
Federal income tax expense (benefit)
|
208
|
|
(165
|
)
|
1,153
|
|
2
|
|
||||
|
Net income (loss)
|
(2,197
|
)
|
250
|
|
(1,767
|
)
|
572
|
|
||||
|
Net income (loss) available to common shareholders
|
(2,197
|
)
|
250
|
|
(1,767
|
)
|
572
|
|
||||
|
Basic earnings (losses) per share of Class A common stock
|
(0.04
|
)
|
0.01
|
|
(0.04
|
)
|
0.01
|
|
||||
|
Basic earnings (losses) per share of Class B common stock
|
(0.02
|
)
|
—
|
|
(0.02
|
)
|
0.01
|
|
||||
|
Diluted earnings (losses) per share of Class A common stock
|
(0.04
|
)
|
0.01
|
|
(0.04
|
)
|
0.01
|
|
||||
|
Diluted earnings (losses) per share of Class B common stock
|
(0.02
|
)
|
—
|
|
(0.02
|
)
|
0.01
|
|
||||
(a) Certain previously reported information has been corrected to reflect immaterial corrections to the financial statements. For more information, refer to Note 1.
Note 14:
Subsequent Events
We have evaluated for subsequent events as defined by the accounting guidance through the date of financial statement issuance.
On February 15, 2017, the Company sold its Markham building in Little Rock, Arkansas for a gross sales price of
$3.25
million, resulting in a gain on sale of
$1.0
million.
On or about March 16, 2017, Juan Gamboa filed a putative class action lawsuit against the Company and five of its current and former directors and executive officers in the United States District Court, Western District of Texas. The lawsuit alleges the defendants violated Sections 10(b) and 20(a) of the Securities Exchange Act of 1934 and Rule 10b-5 promulgated thereunder by making false and/or misleading statements, as well as failing to disclose material adverse facts about the Company’s business, operations and prospects. The complaint seeks an award of damages in an unspecified amount on behalf of a putative class consisting of persons who purchased the Company’s common stock between March 11, 2015 and March 8, 2017, inclusive. The Company believes that the lawsuit is without merit, and it intends to vigorously defend against all claims asserted. At this time, the Company is unable to reasonably estimate the outcome of this litigation.
108
|
Schedule II
Condensed Financial Information of Registrant
CITIZENS, INC. (Parent Company)
|
||||||
|
|
At December 31,
|
|||||
|
|
2016
|
2015 (a)
|
||||
|
|
(In thousands)
|
|||||
|
Assets
|
|
|
||||
|
Investment in subsidiaries
(1)
|
$
|
173,877
|
|
171,038
|
|
|
|
Fixed maturities available-for-sale, at fair value
|
51,028
|
|
54,208
|
|
||
|
Fixed maturities held-to-maturity, at amortized cost
|
357
|
|
364
|
|
||
|
Equity securities available-for-sale, at fair value
|
1,030
|
|
979
|
|
||
|
Mortgage loans on real estate
|
—
|
|
341
|
|
||
|
Real estate and other long-term investments
|
5,920
|
|
6,021
|
|
||
|
Short-term investments
|
508
|
|
—
|
|
||
|
Cash
|
14,673
|
|
15,756
|
|
||
|
Accrued investment income
|
757
|
|
791
|
|
||
|
Accounts receivable from subsidiaries
(1)
|
2,658
|
|
2,958
|
|
||
|
Property and equipment
|
746
|
|
95
|
|
||
|
Other assets
|
237
|
|
84
|
|
||
|
Total assets
|
$
|
251,791
|
|
252,635
|
|
|
|
Liabilities and Stockholders' Equity
|
|
|
|
|
||
|
Liabilities:
|
|
|
|
|
||
|
Accrued expense and other liabilities
|
$
|
2,691
|
|
5,709
|
|
|
|
Total liabilities
|
$
|
2,691
|
|
5,709
|
|
|
|
Stockholders' equity:
|
|
|
|
|
||
|
Common stock:
|
|
|
|
|
||
|
Class A
|
$
|
259,383
|
|
259,383
|
|
|
|
Class B
|
3,184
|
|
3,184
|
|
||
|
Accumulated retained deficit
|
(16,248
|
)
|
(18,217
|
)
|
||
|
Unrealized investment gains on securities held by parent and subsidiaries, net of tax
|
13,792
|
|
13,587
|
|
||
|
Treasury stock
|
(11,011
|
)
|
(11,011
|
)
|
||
|
Total stockholders' equity
|
249,100
|
|
246,926
|
|
||
|
Total liabilities and stockholders' equity
|
$
|
251,791
|
|
252,635
|
|
|
(1)
Eliminated in consolidation.
(a) Certain previously reported information has been corrected to reflect immaterial corrections to the financial statements. For more information, refer to Note 1.
See accompanying report of independent registered public accounting firm.
109
|
Schedule II, Continued
Condensed Financial Information of Registrant
CITIZENS, INC. (Parent Company)
Statements of Operations
|
|||||||||
|
|
Years Ended December 31,
|
||||||||
|
|
2016
|
2015 (a)
|
2014 (a)
|
||||||
|
|
(In thousands)
|
||||||||
|
Revenues:
|
|
|
|
||||||
|
Management service fees
(1)
|
$
|
33,748
|
|
31,328
|
|
27,497
|
|
||
|
Investment income
|
1,491
|
|
1,499
|
|
1,361
|
|
|||
|
Other
|
49
|
|
58
|
|
1
|
|
|||
|
Realized investment gains, net
|
—
|
|
—
|
|
46
|
|
|||
|
Total revenues
|
35,288
|
|
32,885
|
|
28,905
|
|
|||
|
Expenses:
|
|
|
|
|
|
|
|||
|
General
|
33,807
|
|
29,609
|
|
25,572
|
|
|||
|
Taxes, licenses and fees
|
996
|
|
918
|
|
902
|
|
|||
|
Federal income tax expense (benefit)
|
(196
|
)
|
523
|
|
558
|
|
|||
|
Total expenses
|
34,607
|
|
31,050
|
|
27,032
|
|
|||
|
Income before equity in income of consolidated subsidiaries
|
681
|
|
1,835
|
|
1,873
|
|
|||
|
Equity in loss of consolidated subsidiaries
|
1,288
|
|
(4,978
|
)
|
(7,843
|
)
|
|||
|
Net income (loss)
|
$
|
1,969
|
|
(3,143
|
)
|
(5,970
|
)
|
||
(1)
Eliminated in consolidation.
(a) Certain previously reported information has been corrected to reflect immaterial corrections to the financial statements. For more information, refer to Note 1.
See accompanying report of independent registered public accounting firm.
110
|
Schedule II, Continued
Condensed Financial Information of Registrant
CITIZENS, INC. (Parent Company)
Statements of Cash Flows
|
|||||||||
|
|
Years Ended December 31,
|
||||||||
|
|
2016
|
2015 (a)
|
2014 (a)
|
||||||
|
|
(In thousands)
|
||||||||
|
Cash flows from operating activities:
|
|
|
|
||||||
|
Net income (loss)
|
$
|
1,969
|
|
(3,143
|
)
|
(5,970
|
)
|
||
|
Adjustments to reconcile net income to net cash provided by operating activities:
|
|
|
|
|
|
|
|||
|
Realized investment losses (gains), net
|
—
|
|
—
|
|
(46
|
)
|
|||
|
Equity in loss of consolidated subsidiaries
|
(1,288
|
)
|
4,978
|
|
7,843
|
|
|||
|
Accrued expenses and other liabilities
|
(3,018
|
)
|
483
|
|
(29
|
)
|
|||
|
Amortization of premiums and discounts on investments
|
911
|
|
984
|
|
789
|
|
|||
|
Depreciation
|
162
|
|
155
|
|
169
|
|
|||
|
Accrued investment income
|
35
|
|
(14
|
)
|
(148
|
)
|
|||
|
Decrease (increase) in receivable from subsidiaries and other assets
|
300
|
|
(627
|
)
|
69
|
|
|||
|
Other, net
|
149
|
|
110
|
|
(471
|
)
|
|||
|
Net cash provided by (used in) operating activities
|
(780
|
)
|
2,926
|
|
2,206
|
|
|||
|
Cash flows from investing activities:
|
|
|
|
|
|
|
|||
|
Purchase of fixed maturities, held-to-maturity
|
—
|
|
—
|
|
—
|
|
|||
|
Purchase of fixed maturities, available-for-sale
|
(6,615
|
)
|
(4,559
|
)
|
(11,949
|
)
|
|||
|
Maturities of fixed maturities, available-for-sale
|
8,015
|
|
2,645
|
|
2,271
|
|
|||
|
Purchase of equity securities, available-for-sale
|
—
|
|
—
|
|
—
|
|
|||
|
Sale of other long-term investments and property and equipment
|
371
|
|
16
|
|
—
|
|
|||
|
Purchase of other long-term investments and property and equipment
|
(740
|
)
|
(88
|
)
|
—
|
|
|||
|
Purchase of short-term investments
|
(522
|
)
|
—
|
|
—
|
|
|||
|
Net cash provided by (used in) investment activities
|
509
|
|
(1,986
|
)
|
(9,678
|
)
|
|||
|
Cash flows from financing activities:
|
|
|
|
|
|
|
|||
|
Dividend from subsidiary
|
—
|
|
—
|
|
5,250
|
|
|||
|
Purchase of the Company's stock from affiliates
|
(812
|
)
|
—
|
|
—
|
|
|||
|
Net cash provided by (used in) financing activities
|
(812
|
)
|
—
|
|
5,250
|
|
|||
|
Net increase (decrease) in cash
|
(1,083
|
)
|
940
|
|
(2,222
|
)
|
|||
|
Cash at beginning of year
|
15,756
|
|
14,816
|
|
17,038
|
|
|||
|
Cash at end of year
|
$
|
14,673
|
|
15,756
|
|
14,816
|
|
||
(a) Certain previously reported information has been corrected to reflect immaterial corrections to the financial statements. For more information, refer to Note 1.
See accompanying report of independent registered public accounting firm.
111
|
Schedule III
Supplementary Insurance Information
|
||||||
|
|
At December 31,
|
|||||
|
|
2016
|
2015 (a)
|
||||
|
|
(In thousands)
|
|||||
|
Deferred policy acquisition cost:
|
|
|
||||
|
Life Insurance
|
$
|
132,704
|
|
130,389
|
|
|
|
Home Service Insurance
|
35,086
|
|
33,303
|
|
||
|
Other Non-Insurance Enterprises
|
—
|
|
—
|
|
||
|
Total consolidated deferred policy acquisition costs
|
$
|
167,790
|
|
163,692
|
|
|
|
Future policy benefit reserves and policy claims payable:
|
|
|
|
|
||
|
Life Insurance
|
$
|
871,136
|
|
798,534
|
|
|
|
Home Service Insurance
|
268,724
|
|
264,543
|
|
||
|
Other Non-Insurance Enterprises
|
—
|
|
—
|
|
||
|
Total consolidated future policy benefit reserves and policy claims payable
|
$
|
1,139,860
|
|
1,063,077
|
|
|
|
Unearned premiums:
|
|
|
|
|
||
|
Life Insurance
|
$
|
915
|
|
959
|
|
|
|
Home Service Insurance
|
239
|
|
247
|
|
||
|
Other Non-Insurance Enterprises
|
—
|
|
—
|
|
||
|
Total consolidated unearned premiums
|
$
|
1,154
|
|
1,206
|
|
|
|
Other policy claims and benefits payable:
|
|
|
|
|
||
|
Life Insurance
|
$
|
73,860
|
|
66,222
|
|
|
|
Home Service Insurance
|
1,825
|
|
1,775
|
|
||
|
Other Non-Insurance Enterprises
|
—
|
|
—
|
|
||
|
Total consolidated other policy claims and benefits payable
|
$
|
75,685
|
|
67,997
|
|
|
(a) Certain previously reported information has been corrected to reflect immaterial corrections to the financial statements. For more information, refer to Note 1.
See accompanying report of independent registered public accounting firm.
112
For the Company's short duration premiums (property), written premium is not materially different from earned premium, therefore only earned premiums are detailed in Schedule IV.
|
Schedule IV
Reinsurance
|
|||||||||||||||
|
Direct
Amount
|
Ceded to
Other
Companies
|
Assumed
From Other
Companies
|
Net Amount
|
% of
Amount
Assumed to
Net
|
|||||||||||
|
|
(In thousands)
|
||||||||||||||
|
Year ended December 31, 2016
|
|
|
|
|
|
||||||||||
|
Life insurance in force
|
$
|
4,997,641
|
|
522,821
|
|
22,915
|
|
4,497,735
|
|
0.5
|
%
|
||||
|
Premiums:
|
|
|
|
|
|
|
|
|
|
|
|||||
|
Life insurance
|
193,604
|
|
2,501
|
|
151
|
|
191,254
|
|
|
|
|||||
|
Accident and health insurance
|
1,566
|
|
20
|
|
—
|
|
1,546
|
|
|
|
|||||
|
Property insurance
|
5,904
|
|
828
|
|
—
|
|
5,076
|
|
|
|
|||||
|
Total premiums
|
$
|
201,074
|
|
3,349
|
|
151
|
|
197,876
|
|
0.1
|
%
|
||||
|
Year ended December 31, 2015
|
|
|
|
|
|
|
|
|
|
|
|||||
|
Life insurance in force
|
$
|
4,958,369
|
|
516,933
|
|
36,766
|
|
4,478,202
|
|
0.8
|
%
|
||||
|
Premiums:
|
|
|
|
|
|
|
|
|
|
|
|||||
|
Life insurance
|
189,644
|
|
2,311
|
|
353
|
|
187,686
|
|
|
|
|||||
|
Accident and health insurance
|
1,625
|
|
26
|
|
—
|
|
1,599
|
|
|
|
|||||
|
Property insurance
|
6,068
|
|
873
|
|
—
|
|
5,195
|
|
|
|
|||||
|
Total premiums
|
$
|
197,337
|
|
3,210
|
|
353
|
|
194,480
|
|
0.2
|
%
|
||||
|
Year ended December 31, 2014
|
|
|
|
|
|
|
|
|
|
|
|||||
|
Life insurance in force
|
$
|
4,910,662
|
|
516,643
|
|
268,641
|
|
4,662,660
|
|
5.8
|
%
|
||||
|
Premiums:
|
|
|
|
|
|
|
|
|
|
|
|||||
|
Life insurance
|
183,764
|
|
2,328
|
|
421
|
|
181,857
|
|
|
|
|||||
|
Accident and health insurance
|
1,589
|
|
32
|
|
—
|
|
1,557
|
|
|
|
|||||
|
Property insurance
|
6,085
|
|
967
|
|
—
|
|
5,118
|
|
|
|
|||||
|
Total premiums
|
$
|
191,438
|
|
3,327
|
|
421
|
|
188,532
|
|
0.2
|
%
|
||||
See accompanying report of independent registered public accounting firm.
113
SIGNATURES
Pursuant to the requirements of Section 13 or 15(d) of the Securities Exchange Act of 1934, the Registrant has duly caused this report to be signed on its behalf by the undersigned, hereunto duly authorized.
|
|
CITIZENS, INC.
|
|
||
|
|
|
|
||
|
Date:
|
April 27, 2017
|
By:
|
/s/ Geoffrey M. Kolander
|
|
|
Geoffrey M. Kolander,
Chief Executive Officer
|
||||
|
|
||||
|
By:
|
/s/ David S. Jorgensen
|
|||
|
David S. Jorgensen, Vice President, Chief Financial Officer and Treasurer
|
||||
|
|
|
|||
Pursuant to the requirements of the Securities Exchange Act of 1934, this report has been signed below by the following persons on behalf of the Registrant and in the capacities and on the dates indicated.
KNOW ALL PERSONS BY THESE PRESENTS, that each person whose signature appears below hereby constitutes and appoints Geoffrey M. Kolander, as his or her attorney-in-fact and agent, with full power of substitution, for him or her in any and all capacities, hereby giving and granting to said attorney-in-fact and agent full power and authority to do and perform all and every act and thing whatsoever requisite and necessary to be done in and about the premises as fully, to all intents and purposes, as he might or could do if personally present at the doing thereof, hereby ratifying and confirming all that said attorney-in-fact and agent may or shall lawfully do, or cause to be done, in connection with the proposed filing by Citizens, Inc., with the Securities and Exchange Commission, under the provisions of the Securities Exchange Act of 1934, as amended, of an annual report on Form 10-K for the fiscal year ended
December 31, 2016
, including but not limited to, such full power and authority to do the following: (i) execute and file such annual report; (ii) execute and file any amendment or amendments thereto; (iii) receive and respond to comments from the Securities and Exchange Commission related in any way to such annual report or any amendment or amendments thereto; and (iv) execute and deliver any and all certificates, instruments or other documents related to the matters enumerated above, as the attorney-in-fact in his sole discretion deems appropriate.
Dated:
April 27, 2017
|
/s/ Harold E. Riley
|
|
/s/ Robert B. Sloan, Jr.
|
|
Harold E. Riley, Chairman Emeritus
|
|
Dr. Robert B. Sloan, Jr., Chairman
|
|
|
|
|
|
/s/ E. Dean Gage
|
|
/s/ Grant G. Teaff
|
|
Dr. E. Dean Gage, Director
|
|
Grant G. Teaff, Director
|
|
|
|
|
|
/s/ Terry S. Maness
|
|
/s/ Gerald W. Shields
|
|
Dr. Terry S. Maness, Director
|
|
Gerald W. Shields, Director
|
|
|
|
|
|
/s/ Dottie S. Riley
|
|
/s/ Frank A. Keating
|
|
Dottie S. Riley, Director
|
|
Frank A. Keating, Director
|
|
|
|
|
|
/s/ Steven F. Shelton
|
|
|
|
Steven F. Shelton, Director
|
|
|
114
EXHIBITS
|
Exhibit No.
|
The following exhibits are filed herewith:
|
|
|
|
|
|
|
3.1
|
Restated and Amended Articles of Incorporation (a)
|
|
|
3.2
|
Second Amended and Restated Bylaws dated June 7, 2016 (b)
|
|
|
4.1
|
Amendment to State Series A-1 and A-2 Senior Convertible Preferred Stock (c)
|
|
|
|
|
|
|
10.1†
|
Employment Agreement, dated as of January 16, 2017, by and between Citizens, Inc. and Geoffrey M. Kolander (d)
|
|
|
10.2†
|
Employment Agreement, dated as of January 16, 2017, by and between Citizens, Inc. and Kay E. Osbourn (e)
|
|
|
10.3†
|
Employment Agreement, dated as of January 16, 2017, by and between Citizens, Inc. and David S. Jorgensen (f)
|
|
|
11
|
Statement re: Computation of per share earnings (see financial statements)
|
|
|
|
|
|
|
21
|
Subsidiaries of the Registrant*
|
|
|
|
|
|
|
23
|
Consent of Independent Registered Public Accounting Firm - Ernst & Young LLP*
|
|
|
|
|
|
|
24
|
Power of Attorney (g)
|
|
|
|
|
|
|
31.1
|
Certification of Chief Executive Officer pursuant to Section 302 of the Sarbanes-Oxley Act*
|
|
|
|
|
|
|
31.2
|
Certification of Chief Financial Officer pursuant to Section 302 of the Sarbanes-Oxley Act*
|
|
|
|
|
|
|
32.1
|
Certification of Chief Executive Officer pursuant to Section 906 of the Sarbanes-Oxley Act*
|
|
|
|
|
|
|
32.2
|
Certification of Chief Financial Officer pursuant to Section 906 of the Sarbanes-Oxley Act*
|
|
|
101.INS
|
XBRL Instance Document
|
|
|
101.SCH
|
XBRL Taxonomy Extension Schema
|
|
|
101.CAL
|
XBRL Taxonomy Extension Calculation Linkbase
|
|
|
101.DEF
|
XBRL Taxonomy Extension Definition Linkbase
|
|
|
101.LAB
|
XBRL Taxonomy Extension Label Linkbase
|
|
|
101.PRE
|
XBRL Taxonomy Extension Presentation Linkbase
|
|
|
†
|
Indicates a management contract or compensatory plan or arrangement.
|
|
*
|
Filed herewith.
|
|
(a)
|
Filed on March 15, 2004 with the Registrant's Annual Report on Form 10-K for the Year Ended December 31, 2003 as Exhibit 3.1, and incorporated herein by reference.
|
|
(b)
|
Filed on June 10, 2016 with the Registrants' Current Report on Form 8-K as Exhibit 3.2 and incorporated herein by reference.
|
115
|
(c)
|
Filed on July 15, 2004, with the Registrant's Current Report on Form 8-K as Exhibit 4.1, and incorporated herein by reference.
|
|
(d)
|
Filed on January 17, 2017 with the Registrant's Current Report on Form 8-K as Exhibit 10.1, and incorporated herein by reference.
|
|
(e)
|
Filed on January 17, 2017 with the Registrant's Current Report on Form 8-K as Exhibit 10.2, and incorporated herein by reference.
|
|
(f)
|
Filed on January 17, 2017 with the Registrant's Current Report on Form 8-K as Exhibit 10.3, and incorporated herein by reference.
|
|
(g)
|
The Power of Attorney is incorporated in the signature page enclosed herein.
|
116
TABLE OF CONTENTS
Part IItem 1 . BusinessItem 1A. Risk FactorsItem 1B. Unresolved Staff CommentsItem 2. PropertiesItem 3. Legal ProceedingsItem 4. Mine Safety DisclosuresPart IIItem 5. Market For Registrant's Common Equity, Related Stockholder Matters and Issuer Purchases Of Equity SecuritiesItem 6. Selected Financial DataItem 7. Management's Discussion and Analysis Of Financial Condition and Results Of OperationsItem 7A. Quantitative and Qualitative Disclosures About Market RiskItem 8. Financial Statements and Supplementary DataItem 9. Changes in and Disagreements with Accountants on Accounting and Financial DisclosureItem 9A. Controls and ProceduresItem 9B. Other InformationPart IIIItem 10. Directors, Executive Officers and Corporate GovernanceItem 11. Executive CompensationItem 12. Security Ownership Of Certain Beneficial Owners and Management and Related Stockholder MattersItem 13. Certain Relationships and Related Transactions, and Director IndependenceItem 14. Principal Accounting Fees and ServicesPart IVItem 15. Exhibits, Financial Statement SchedulesNote 1: Summary Of Significant Accounting PoliciesNote 2: InvestmentsNote 3: Fair Value MeasurementsNote 4: Policy Liabilities and Short Duration ContractsNote 5: ReinsuranceNote 6: Stockholders' Equity and RestrictionsNote 7: Commitments and ContingenciesNote 8: Segment and Other Operating InformationNote 9: Income TaxesNote 10: Other Comprehensive Income (loss)Note 11: Benefit PlansNote 12: Related Party TransactionsNote 13: Quarterly Financial Information (unaudited)Note 14: Subsequent Events