CITIZENS, INC.
10-Ks and 10-Qs
|
|
|
|
|
|
|
|
|
|
|
|
|
|
|
|
|
|
|
|
|
|
|
|
|
|
|
|
|
|
|
|
|
|
|
|
|
|
|
|
|
|
|
|
|
|
|
|
|
|
|
|
|
|
|
|
|
|
|
UNITED STATES
SECURITIES AND EXCHANGE COMMISSION
WASHINGTON D.C. 20549
FORM 10-K
ANNUAL REPORT PURSUANT TO SECTION 13 OR 15(D) OF THE SECURITIES EXCHANGE ACT OF 1934
For the fiscal year ended
December 31, 2019
COMMISSION FILE NUMBER:
000-16509

CITIZENS, INC.
(
Exact name of registrant as specified in its charter
)
|
Colorado
|
84-0755371
|
|
|
(State or other jurisdiction of incorporation or organization)
|
(I.R.S. employer identification no.)
|
|
|
14231 Tandem Blvd, 2nd Floor; Austin, Texas
|
78728
|
|
|
(Address of principal executive offices)
|
(Zip code)
|
|
(512) 837-7100
(Registrant's telephone number, including area code)
|
Securities registered pursuant to Section 12(b) of the Act
|
||
|
Class A Common Stock
|
CIA
|
New York Stock Exchange
|
|
(Title of each class)
|
(Trading symbol(s))
|
(Name of each exchange on which registered)
|
Securities registered pursuant to Section 12(g) of the Act
None
(Title of class)
Indicate by check mark if the registrant is a well-known seasoned issuer, as defined in Rule 405 of the Securities Act.
o
Yes
ý
No
Indicate by check mark if the registrant is not required to file reports pursuant to Section 13 or Section 15(d) of the Act.
o
Yes
ý
No
Indicate by check mark whether the registrant (1) has filed all reports required to be filed by Section 13 or 15(d) of the Securities Exchange Act of 1934 during the preceding 12 months (or for such shorter period that the registrant was required to file such reports), and (2) has been subject to such filing requirements for the past 90 days.
ý
Yes
o
No
Indicate by check mark whether the registrant has submitted electronically every Interactive Data File required to be submitted pursuant to Rule 405 of Regulation S-T (§232.405 of this chapter) during the preceding 12 months (or for such shorter period that the registrant was required to submit such files).
ý
Yes
o
No
Indicate by check mark whether the registrant is a large accelerated filer, an accelerated filer, a non-accelerated filer, a smaller reporting company or an emerging growth company. See definitions of "large accelerated filer," "accelerated filer," "smaller reporting company," and "emerging growth company" in Rule 12b-2 of the Exchange Act
|
Large accelerated
filer o |
Accelerated
filer ý |
Non-accelerated
filer o |
Smaller reporting
company o |
Emerging growth
company o |
|
If an emerging growth company, indicate by check mark if the registrant has elected not to use the extended transition period for complying with any new or revised financial accounting standards provided pursuant to Section 13(a) of the Exchange Act.
o
Indicate by check mark whether the registrant is a shell company (as defined in Rule 12b-2 of the Act).
o
Yes
ý
No
As of
June 30, 2019
, the aggregate market value of the Class A common stock held by non-affiliates of the registrant was approximately
$357,975,962
.
Number of shares of common stock outstanding as of
March 4, 2020
.
Class A:
49,341,062
Class B:
1,001,714
DOCUMENTS INCORPORATED BY REFERENCE
Part III of this Report incorporates by reference certain portions of the definitive proxy materials to be delivered to stockholders in connection with the
2020
Annual Meeting of Shareholders (the "2020 Proxy Statement"). The 2020 Proxy Statement will be filed with the Securities and Exchange Commission within 120 days after the end of the fiscal year to which this report relates.
THIS PAGE INTENTIONALLY LEFT BLANK
TABLE OF CONTENTS
|
Page
|
||
|
PART I
|
|
|
|
Item 1.
|
||
|
Item 1A.
|
||
|
Item 1B.
|
||
|
Item 2.
|
||
|
Item 3.
|
||
|
Item 4.
|
||
|
PART II
|
|
|
|
Item 5.
|
||
|
Item 6.
|
||
|
Item 7.
|
||
|
Item 7A.
|
||
|
Item 8.
|
||
|
Item 9.
|
||
|
Item 9A.
|
||
|
Item 9B.
|
||
|
PART III
|
|
|
|
Item 10.
|
||
|
Item 11.
|
||
|
Item 12.
|
||
|
Item 13.
|
||
|
Item 14.
|
||
|
PART IV
|
|
|
|
Item 15.
|
||
|
|
|
|
|
|
||
FORWARD-LOOKING STATEMENTS
This Annual Report on Form 10-K (“Form 10-K”) contains forward-looking statements, within the meaning of the Private Securities Litigation Reform Act of 1995, that involve risks and uncertainties. Many of the forward-looking statements are located in Part II, Item 7 of this Form 10-K under the heading “Management’s Discussion and Analysis of Financial Condition and Results of Operations.” Forward-looking statements provide current expectations of future events based on certain assumptions and include any statement that does not directly relate to any historical or current fact. Forward-looking statements can also be identified by words such as “future,” “anticipates,” “believes,” “estimates,” “expects,” “intends,” “plans,” “predicts,” “will,” “would,” “could,” “can,” “may,” and similar terms. Forward-looking statements are not guarantees of future performance and the Company’s actual results may differ significantly from the results discussed in the forward-looking statements. Factors that might cause such differences include, but are not limited to, those discussed in Part I, Item 1A of this Form 10-K under the heading “Risk Factors,” which are incorporated herein by reference. The Company assumes no obligation to revise or update any forward-looking statements for any reason, except as required by law.
The U.S. Securities and Exchange Commission ("SEC") maintains a website that contains reports, proxy and information statements, and other information regarding issuers, including the Company, that file electronically with the SEC. The public can obtain any documents that the Company files with the SEC at http://www.sec.gov. We also make available, free of charge, through our Internet website (http://www.citizensinc.com), our Annual Report on Form 10-K, Quarterly Reports on Form 10-Q, Current Reports on Form 8-K, Section 16 Reports filed by officers and directors, news releases, and, if applicable, amendments to those reports filed or furnished pursuant to Section 13(a) or 15(d) of the Securities Exchange Act of 1934, as soon as reasonably practicable after we electronically file such reports with, or furnish such reports to, the SEC. We are not including any of the information contained on our website as part of, or incorporating it by reference into, this Annual Report on Form 10-K.
December 31, 2019 | 10-K
1
PART I
Item 1.
BUSINESS
OVERVIEW
Citizens, Inc. ("Citizens" or the "Company") is an insurance holding company incorporated in Colorado serving the life insurance needs of individuals in the United States since 1969 and internationally since 1975. Through our insurance subsidiaries, we pursue a strategy of offering traditional insurance products in niche markets where we believe we are able to achieve competitive advantages. We had approximately
$1.7 billion
of assets at December 31,
2019
and approximately
$4.2 billion
of insurance in force. Our core insurance operations include:
|
•
|
U.S. dollar-denominated ordinary whole life insurance and endowment policies predominantly sold to foreign residents, located principally in Latin America and the Pacific Rim, through independent marketing consultants;
|
|
•
|
ordinary whole life insurance policies to middle income households concentrated in the Midwest, Mountain West and southern United States through independent marketing consultants; and
|
|
•
|
final expense and limited liability property policies to middle and lower income households in Louisiana, Mississippi and Arkansas through employee and independent agents in our home service distribution channel and funeral homes.
|
STRATEGIC INITIATIVES
We are implementing our enduring value customer-centric growth strategy, in cooperation with our Board of Directors. In doing so, we are focused on our core strengths, as we strategically realign our Life and Home Service Insurance segments. We anticipate significant transformation with an emphasis on people, processes and technology. In our current operational environment, change is seen as a positive and is now taking root in our culture, creating the best atmosphere for value creation and value capture for all our stakeholders.
As a result of the Company’s continued strategic review of its technology systems, we converted the ordinary whole life policies of Security Plan Life Insurance Company ("SPLIC") to a new actuarial valuation software solution that provides enhanced modeling capabilities as of July 1, 2019. This system conversion, which impacted the Home Service Insurance segment, resulted in changes in estimates due to refinements reflected as a decrease in policyholder benefit reserves of $2.3 million and a decrease in deferred acquisition costs of $1.4 million, before tax as of and for the year ended December 31, 2019.
The Company reviews its investment strategies routinely to monitor the portfolio's rate of return as compared to the product features in our insurance policies and strive to maximize returns on our investment portfolio within our conservative investment guidelines. The Company is looking for opportunities in other asset classes to increase our yields while maintaining a prudent risk profile.
The following pages describe the operations of our two business segments: Life Insurance and Home Service Insurance. CICA Life Insurance Company of America ("CICA"), CICA Life Ltd. ("CICA Ltd.") and Citizens National Life Insurance Company ("CNLIC") constitute the Life Insurance segment, and Security Plan Life Insurance Company ("SPLIC"), Security Plan Fire Insurance Company ("SPFIC") and Magnolia Guaranty Life Insurance Company ("MGLIC") constitute the Home Service Insurance segment. In addition to the Life Insurance and Home Service Insurance segments, the Company also has other non-insurance operations ("Other Non-Insurance Enterprises") which primarily include the Company's IT and Corporate-support functions.
Citizens had over 400 employees as of December 31,
2019
, over half of which worked in the Home Service Segment.
Revenues derived from any single customer did not exceed 10% of consolidated revenues in any of the last three years. For more information about the financial performance of our business segments, see
Note 8. Segment and Other Operating Information
of the notes to our consolidated financial statements.
December 31, 2019 | 10-K
2
LIFE INSURANCE
Our Life Insurance segment issues U.S. Dollar-denominated endowment contracts internationally, which are principally accumulation contracts that incorporate an element of life insurance protection, and ordinary whole life insurance in U.S. Dollar-denominated amounts sold to foreign residents. These contracts are designed to provide a fixed amount of insurance coverage over the life of the insured and may utilize rider benefits to provide additional coverage and annuity benefits to enhance accumulations. For the majority of our business, we retain the first $0.1 million of risk on any one life, reinsuring the remainder of the risk. Historically we have operated this segment through our CICA and CNLIC insurance subsidiaries. Since July 1, 2018, we operate the novated international business in this segment through CICA Ltd. We operate our domestic business in this segment through CICA and CNLIC.
INTERNATIONAL SALES
We focus our sales of U.S. Dollar-denominated ordinary whole life insurance and endowment policies to residents in Latin America and the Pacific Rim. We have participated in the foreign marketplace since 1975. We believe positive attributes of our international insurance business typically include:
|
•
|
larger face amount policies issued when compared to our U.S. operations, which results in lower underwriting and administrative costs per unit of coverage;
|
|
•
|
premiums paid annually rather than monthly or quarterly, which reduces our administrative expenses, accelerates cash flow and results in lower policy lapse rates than premiums with more frequently scheduled payments; and
|
|
•
|
persistency experience and mortality rates that are comparable to U.S. policies.
|
As of
December 31, 2019
, we had insurance policies in force in almost
20
countries, including
Colombia
,
Venezuela
,
Taiwan
,
Ecuador
and
Argentina
as our top producing countries. International direct premiums comprised approximately
96%
of total direct premiums in the Life Insurance segment and
71%
of our total direct premiums in
2019
.
Our independent marketing firms and consultants specialize in marketing life insurance products and generally have several years of insurance marketing experience. We maintain contracts with the independent marketing firms pursuant to which they provide recruitment, training and supervision of their managers and associates in the service and placement of our products. However, all associates of these firms also contract directly with us as independent contractors and receive their compensation directly from us. Accordingly, should an arrangement between any independent marketing firm and us be terminated for any reason, we expect we would seek to continue the existing marketing arrangements with the associates of these firms. Our agreements with independent marketing firms and consultants typically provide that they are independent contractors responsible for their own operational expenses and are the representative of the prospective insured. In addition, the marketing firms guarantee any debts of their associates to us. The marketing firms receive commissions on all new and renewal policies serviced or placed by them or their associates. All of these contracts provide that the independent marketing firms and consultants are aware of and responsible for compliance with local laws.
INTERNATIONAL PRODUCTS
We offer several ordinary whole life insurance and endowment products designed to meet the needs of our non-U.S. policyowners. These policies have been structured to provide:
|
•
|
U.S. Dollar-denominated cash values that accumulate, beginning in the first policy year, to a policyholder during his or her lifetime;
|
|
•
|
premium rates that are competitive with most foreign local companies;
|
|
•
|
a hedge against local currency inflation;
|
|
•
|
protection against devaluation of foreign currency;
|
|
•
|
capital investment in a more secure economic environment (i.e., the U.S.); and
|
|
•
|
lifetime income guarantees for an insured or for surviving beneficiaries.
|
Our international products have living benefit features. Most policies contain guaranteed cash values and are participating (i.e., provide for cash dividends as apportioned by the Board). Once a policyowner pays the annual premium and the policy is issued, the owner becomes entitled to policy cash dividends as well as annual premium
December 31, 2019 | 10-K
3
benefits if the annual premium benefit was elected.
According to the policy language, the policyowner has several options with regard to the policy dividends and annual premium benefits, which include, among other things, electing to receive cash, crediting such amounts towards the payment of premiums on the policy, leaving such amounts on deposit with the Company to accumulate at a defined interest rate or assigning them to a third-party.
Under the "assigned to a third-party" provision, the Company has historically allowed policyowners, after receiving a copy of the Citizens, Inc. Stock Investment Plan (the "CISIP") prospectus and acknowledging their understanding of the risks of investing in Citizens Class A common stock, the right to assign policy values outside of the policy to the CISIP, which is administered in the United States by Computershare Trust Company, N.A., our plan administrator and an affiliate of Computershare, Inc., our transfer agent. The CISIP is a direct stock purchase plan available to policyowners, shareholders, our employees and directors, independent consultants, and other potential investors through the Computershare website. The Company has registered the shares of Class A common stock issuable to participants under the CISIP on a registration statement under the Securities Act of 1933, as amended (the "Securities Act") that is on file with the SEC. Computershare administers the CISIP in accordance with the terms and conditions of the CISIP, which is available on the Computershare website and as part of the Company’s registration statement on file with the SEC.
In 2019, the Company repriced products sold internationally in response to the continued low interest rate environment in order to increase profits in our international markets. We also expect to expand distribution and will issue newly enhanced products in 2020.
INTERNATIONAL COMPETITION
The life insurance business is highly competitive. We compete with a number of stock and mutual life insurance companies internationally and domestically, as well as with financial institutions that offer insurance products.
We face competition primarily from companies formed and operated in the country in which the insureds reside, from companies that operate in the same manner as we do and from companies that are foreign to the countries in which policies are sold, but issue insurance policies denominated in the local currency of those countries. Some companies may be deemed to have a competitive advantage over us due to their significantly greater financial resources, histories of successful operations and larger marketing forces.
Because premiums on our international policies are paid in U.S. dollars, and we pay claims and benefits in U.S. dollars, we provide life insurance solutions that we believe are different from and superior to those offered by foreign-domiciled companies. We believe our international policies are usually acquired by individuals in the upper middle class in their respective countries and those with significant net worth and earnings that place them in the upper income brackets of their respective countries. The policies sold by our foreign competitors are generally offered broadly and are priced using the mortality of the entire population of the geographic region. Our mortality charges are typically lower due to our customer demographics, which provides a competitive advantage. Additionally, the assets backing the reserves for our foreign competitors' policies must be substantially invested in their respective countries and, therefore, are exposed to the inflationary risks and social or economic crises that have been more common in these foreign countries.
DOMESTIC SALES
In
2019
, domestic direct premiums comprised approximately
4%
of total direct premiums in the Life Insurance segment and
3%
of our total direct premiums overall. The majority of our domestic inforce business results from blocks of business of insurance companies we have acquired over the years. We discontinued new sales of our non-Home Service domestic ordinary whole life insurance and endowment products beginning January 1, 2017. Under the direction of our President and Chief Executive Officer and Chief Marketing Officer, we are evaluating our domestic strategy.
December 31, 2019 | 10-K
4
DOMESTIC LIFE INSURANCE PRODUCTS
Our domestic life insurance products have historically focused primarily on living needs and provided benefits focused toward accumulating financial benefits for the policyowner. The features of our domestic life insurance products include:
|
•
|
cash accumulation/living benefits;
|
|
•
|
tax-deferred interest earnings;
|
|
•
|
guaranteed lifetime income options;
|
|
•
|
monthly income for surviving family members;
|
|
•
|
accidental death benefit coverage options; and
|
|
•
|
an option to waive premium payments in the event of disability.
|
Our life insurance products have historically been designed to address the insured's concern about outliving his or her monthly income, while at the same time providing death benefits. The primary purpose of our current product portfolio is to help the insured create capital for needs such as retirement income, children's higher education, business opportunities, emergencies and health care needs. In addition, our insurance products offer financial benefits like savings protection and immediate funds in event of the insureds death.
HOME SERVICE INSURANCE
Our domestic Home Service Insurance segment operates through our subsidiaries SPLIC, MGLIC and SPFIC, and focuses on the life insurance needs of the middle and lower income markets, primarily in Louisiana, Mississippi and Arkansas. Our policies are sold and serviced through a home service marketing distribution system of
223
employee-agents who work on a route system and through over
221
funeral homes and independent agents who sell policies, collect premiums and service policyholders. To a lesser extent, our Home Service Insurance segment sells limited liability, named peril property policies covering dwelling and contents. In
2019
, our Home Service Insurance segment comprised
25%
of our total direct premiums.
HOME SERVICE PRODUCTS AND COMPETITION
Our Home Service Insurance products consist primarily of small face amount ordinary whole life and pre-need policies, which are designed to fund final expenses for the insured, primarily funeral and burial costs. The average life insurance policy face amount issued in
2019
was approximately
$7,200
. Due to the lower risk associated with small face amount polices, the underwriting performed on these applications is limited. Our property coverages are limited to
$30,000
maximum coverage on any one dwelling and contents, while content-only coverage and dwelling-only coverage is limited to
$20,000
. We face competition in Louisiana, Mississippi and Arkansas from other companies specializing in home service insurance. We seek to compete based upon our emphasis on personal service to our customers. We intend to continue premium growth within this segment via direct sales.
OTHER NON-INSURANCE ENTERPRISES
Other Non-Insurance Enterprises includes the results of the parent company, Citizens, Inc., and Computing Technology, Inc., which provides data processing services to the Company.
OPERATIONS AND TECHNOLOGY
Our administrative operations principally serve our Life Insurance segment and are conducted primarily at our executive offices in Austin, Texas through
103
administrative, operating and underwriting personnel. Our Home Service business is conducted, to a large degree, from our district offices in Louisiana, Arkansas and Mississippi, as well as our service center in Donaldsonville, Louisiana. At our executive offices, we also perform policy design, marketing oversight, underwriting, accounting and reporting, actuarial, customer service, claims processing, administrative and investing activities. At our Bermuda office, we have
3
personnel that perform underwriting, policy issuance and claims processing related to CICA Ltd.'s international policies.
We have a single integrated information technology system for our entire Company, which is a centrally-controlled, mainframe-based administrative system. Functions of our policy administrative system include policy set-up, administration, billing and collections, commission calculation, valuation, automated data edits, storage backup, image
December 31, 2019 | 10-K
5
management and other related functions. Each company we acquire has been converted onto our administrative system. This system has been in place for more than 30 years and has been updated on an ongoing basis as technology has evolved.
We are currently reviewing technology options to transition from our legacy administration system to an upgraded, modernized technology platform that will service our policy administration needs into the future. We have outsourced the operations and maintenance of our legacy system that manages the administration and accounting of our current block of insurance contracts to a third-party provider.
ENTERPRISE RISK MANAGEMENT
The Company has an enterprise risk management function ("ERM") that analyzes the Company’s risks on an individual and aggregated basis and is responsible for ensuring that the Company’s risks remain within its risk appetite and tolerances as determined by management with oversight from the Audit Committee. The Company's focus on ERM strengthens its risk management culture and discipline. The mission of ERM is to support the Company in achieving its strategic priorities by:
|
•
|
providing a comprehensive view of the risks facing the Company, including risk concentrations and correlations;
|
|
•
|
helping management define the Company’s overall capacity and appetite for risk by evaluating the risk return profile of the business relative to the Company’s strategic intent and financial underpinning;
|
|
•
|
assisting management in setting specific risk tolerances and limits that are measurable, actionable, and comply with the Company’s overall risk philosophy;
|
|
•
|
communicating and monitoring the Company’s risk exposures relative to set limits and recommending, or implementing as appropriate, mitigating strategies; and
|
|
•
|
providing insight to assist in growing the businesses and achieving optimal risk-adjusted returns within established guidelines.
|
ENTERPRISE RISK MANAGEMENT STRUCTURE AND GOVERNANCE
Effective risk oversight is an important priority for the Company’s Board and senior management team. While it is the job of the President and Chief Executive Officer and senior management to assess and manage the Company’s risk exposure through ERM, the Audit Committee of the Board is charged with discussing guidelines and policies to govern the process by which ERM is handled. The Audit Committee periodically discusses the Company’s major financial risk exposures and the steps management has taken to monitor and control such exposures.
The four broad categories of risk exposures assessed and managed by senior management include, but are not limited to:
|
•
|
Strategic risk, including international business risks;
|
|
•
|
Insurance risk, including those arising out of catastrophes and acts of terrorism;
|
|
•
|
Financial risk, including market, credit and liquidity risks; and
|
|
•
|
Operational risk, including cybersecurity risk and legal and regulatory compliance risks.
|
In addition, any other risk that poses a material threat to the operational and/or strategic viability of the Company is immediately reviewed and assessed.
In addition to the Audit Committee, the Compensation Committee considers the risks that may be presented by our executive compensation philosophy and programs, and the Nominating and Corporate Governance Committee oversees the Company’s governance practices, director succession and committee composition and leadership to manage risks associated with corporate governance. Although risk oversight is conducted primarily through committees of the Board, the full Board has retained responsibility for general oversight of risks. The Board satisfies this responsibility through full reports by each committee chair regarding the committees’ considerations and actions, as well as through regular reports directly from officers responsible for oversight of particular risks within the Company.
December 31, 2019 | 10-K
6
REGULATION
Our insurance subsidiaries are subject to regulation and supervision by the U.S. states and Bermuda.
U.S. REGULATION
Our U.S. insurance operations are subject to a wide variety of laws and regulations. State insurance laws establish supervisory agencies with broad regulatory authority to regulate most aspects of our U.S. insurance businesses, and our insurance subsidiaries are regulated by the insurance departments of each state in which they are licensed. In addition, U.S. laws, such as the USA Patriot Act of 2001, the Foreign Corrupt Practices Act ("FCPA"), the Gramm-Leach-Bliley Act of 1999, the International Money Laundering Abatement and Financial Anti-Terrorism Act of 2001, the Sarbanes-Oxley Act of 2002, the Dodd-Frank Wall Street Reform and Consumer Protection Act (the "Dodd-Frank Act") and the Tax Cuts and Jobs Act, are examples of U.S. regulations that affect our business. We are subject to comprehensive regulations under the USA Patriot Act and the U.S. Bank Secrecy Act ("BSA") with respect to money laundering, as well as federal regulations regarding privacy and confidentiality. Our insurance products and thus our businesses also are affected by U.S. federal, state and local tax laws.
The purpose of the laws and regulations that affect our insurance business is primarily to protect our insureds and not our stockholders. Many of the laws and regulations to which we are subject are regularly re-examined, and existing or future laws and regulations may become more restrictive or otherwise adversely affect our operations. In addition, insurance regulatory authorities (including state law enforcement agencies and attorneys general) periodically make inquiries and regularly conduct examinations regarding compliance by us and our subsidiaries with insurance, and other laws and regulations regarding the conduct of our insurance businesses. It is our practice to fully and consistently cooperate with such inquiries and examinations and take corrective action when warranted.
Our U.S. insurance subsidiaries are collectively licensed to transact business in
31
states and in the District of Columbia. We have insurance subsidiaries domiciled in the states of Colorado, Louisiana, Mississippi and Texas. Our U.S. insurance subsidiaries are licensed and regulated in all U.S. jurisdictions in which they conduct insurance business. The extent of this regulation varies, but most jurisdictions have laws and regulations based upon the National Association of Insurance Commissioners ("NAIC") model rules governing the financial condition of insurers, including standards of solvency, types and concentration of investments, establishment and maintenance of reserves, credit for reinsurance and requirements of capital adequacy, and the business conduct of insurers, including marketing and sales practices and claims handling. In addition, statutes and regulations usually require the licensing of insurers and their agents, the approval of policy forms and related materials and the approval of rates for certain types of insurance products.
All U.S. jurisdictions in which our U.S. insurance subsidiaries conduct insurance business have enacted legislation that requires each U.S. insurance company in a holding company system, except captive insurance companies, to register with the insurance regulatory authority of its jurisdiction of domicile and to furnish that regulatory authority with financial and other information concerning the operations of, and the interrelationships and transactions among, companies within its holding company system that may materially affect the operations, management or financial condition of the insurers within the system. These laws and regulations also regulate transactions between insurance companies and their parents and affiliates. Generally, these laws and regulations require that all transactions within a holding company system between an insurer and its affiliates be fair and reasonable and that the insurer's statutory capital and surplus following any transaction with an affiliate be both reasonable in relation to its outstanding liabilities and adequate to its financial needs. For certain types of agreements and transactions between an insurer and its affiliates, these laws and regulations require prior notification to, and non-disapproval or approval by, the insurance regulatory authority of the insurer's jurisdiction of domicile.
The payment of dividends or other distributions to us by our insurance subsidiaries is regulated by the insurance laws and regulations of their respective state or jurisdiction of domicile. The laws and regulations of some of these jurisdictions also prohibit an insurer from declaring or paying a dividend except out of its earned surplus or require the insurer to obtain regulatory approval before it may do so. In addition, insurance regulators may prohibit the payment of ordinary dividends or other payments by our insurance subsidiaries to us (such as a payment under a tax sharing agreement or for employee or other services) if they determine such payment could be adverse to policyholders or insurance contract holders of the subsidiary.
December 31, 2019 | 10-K
7
The laws and regulations of the jurisdictions in which our U.S. insurance subsidiaries are domiciled require that a controlling party obtain the approval of the insurance commissioner of the insurance company's jurisdiction of domicile prior to acquiring control of the insurer and may delay, deter or prevent a transaction our shareholders might consider desirable.
Risk-based capital ("RBC") requirements are imposed on life and property and casualty insurance companies. The NAIC has established minimum capital requirements in the form of RBC. RBC requirements weight the type of business underwritten by an insurance company, the quality of its assets, and various other aspects of an insurance company's business to develop a minimum level of capital called "authorized control level risk-based capital" and compares this level to adjusted statutory capital that includes capital and surplus as reported under statutory accounting principles, plus certain investment reserves. Should the ratio of adjusted statutory capital to control level risk-based capital fall below 200%, a series of actions would be required by the affected company, including submitting a capital plan to the Department of Insurance in the insurance company's state of domicile.
INTERNATIONAL REGULATION
CICA Ltd., our Bermuda domiciled subsidiary, is subject to regulation and supervision by the Bermuda Monetary Authority (the "BMA") and compliance with all applicable Bermuda law and Bermuda insurance statutes and regulations, including but not limited to Bermuda’s Insurance Act 1978 (the "Insurance Act").
CICA Ltd., which is incorporated to conduct long-term business, is registered as a Class E insurer, which is the license class for long-term insurers and reinsurers with total assets of more than $500 million that are not registrable as a single-parent or multi-owner long-term captive insurer or reinsurer. CICA Ltd. is not licensed to conduct any business other than an insurance business. The Insurance Act regulates the insurance business of CICA Ltd. and provides that no person may conduct any insurance business in or within Bermuda unless registered as an insurer under the Insurance Act by the BMA.
The Insurance Act imposes solvency and liquidity standards as well as auditing and reporting requirements and confers on the BMA powers to supervise, investigate and intervene in the affairs of insurance companies. Certain requirements of the Insurance Act include: the filing of annual statutory financial returns; the filing of annual U.S. GAAP financial statements; the filing of an annual capital and solvency return; the delivery of a declaration of compliance; compliance with minimum enhanced capital requirements; compliance with the BMA’s Insurance Code of Conduct; compliance with minimum solvency margins; limitations on dividends and distributions that CICA Ltd. may make to Citizens, Inc., its parent company; preparation of an annual Financial Condition Report providing details of measures governing the business operations, corporate governance framework, solvency and financial performance; preparation of an assessment of an insurer's own risk and solvency requirements, referred to as a Commercial Insurer’s Solvency Self-Assessment; the establishment and maintenance of a head and principal office in Bermuda (with certain officers, a principal representative and a director to reside in Bermuda); appointment of an independent auditor; appointment of an actuary approved by the BMA; and compliance with restrictions on certain changes in control of regulated insurers.
Bermuda’s regulatory regime provides a risk-based capital model, termed the Bermuda Solvency Capital Requirement (“BSCR”), as a tool to assist the BMA both in measuring risk and in determining appropriate levels of capitalization. The BSCR employs a standard mathematical model that correlates the risk underwritten by Bermuda insurers to their capital. The BSCR framework applies a standard measurement format to the risk associated with an insurer's assets, liabilities and premiums, including a formula to take into account catastrophe risk exposure. The BMA established risk-based regulatory capital adequacy and solvency margin requirements for Bermuda insurers mandate that a Bermuda domiciled subsidiary’s Enhanced Capital Requirement ("ECR") be calculated by either (a) BSCR, or (b) an internal capital model which the BMA has approved for use for this purpose. CICA Ltd. uses the BSCR in calculating its solvency requirements. The Economic Balance Sheet (“EBS") framework is embedded as part of the BSCR and forms the basis of our ECR.
In order to minimize the risk of a shortfall in capital arising from an unexpected adverse deviation, and to facilitate the implementation of a risk-based capital approach, the BMA has established a threshold capital level (termed the Target Capital Level ("TCL")), set at 120% of ECR, that serves as an early warning tool for the BMA. Failure to maintain statutory capital at least equal to the TCL would likely result in increased BMA regulatory oversight.
December 31, 2019 | 10-K
8
Bermuda law distinguishes between those companies that are at least 60% owned and controlled by Bermudians, which are "local companies", and those which are owned and controlled by non-Bermudians, which are "exempted companies". Exempted companies may be resident in Bermuda and conduct business from Bermuda in connection with transactions and activities which are external to Bermuda or with other exempted companies, and exempted companies must obtain a license to conduct business activities within Bermuda from the Minister of Finance of Bermuda. Generally, it is not permitted without a special license granted by the Minister of Finance of Bermuda to insure Bermuda domestic risks or risks of persons of, in or based in Bermuda.
In December 2018, the Economic Substance Act (the "ES Act") came into force. The ES Act, as amended, and the regulations promulgated thereunder (collectively, "ES Law"), apply to any "relevant entity" that conducts any "relevant activity" in a "relevant financial period". Under the provisions of the ES Law, a relevant entity that conducts a relevant activity must satisfy the economic substance requirements under the ES Law (the "ES Requirements") in relation to the relevant activity and where a relevant entity is conducting more than one relevant activity, it must meet the ES Requirements with respect to each relevant activity that it conducts. A relevant entity complies with the ES Requirements if: (a) the relevant entity is managed and directed from Bermuda; (b) the core income-generating activities are undertaken in Bermuda with respect to each relevant activity; (c) the relevant entity maintains adequate physical presence in Bermuda; (d) there are adequate full-time employees in Bermuda with suitable qualifications; and (e) there is adequate operating expenditure incurred in Bermuda in relation to each relevant activity.
Under the ES Law, insurance and holding entities are each defined as a "relevant activity". CICA Ltd. will be required to demonstrate compliance with the ES Requirements by filing an annual economic substance declaration with the Registrar of Companies in Bermuda no later than six months after the last day of the relevant financial period. Companies that conduct insurance as a relevant activity are deemed to comply with the ES Requirements, with respect to their insurance business, if they comply with the existing regulatory requirements under the Insurance Act 1978 and the corporate governance provisions of the Companies Act 1981. CICA Ltd. is in compliance with these requirements.
Generally, all foreign countries in which we offer insurance products require a license or other authority to conduct insurance business in that country. Some of these countries also require that local regulatory authorities approve the terms of any insurance product sold to residents of that country. We have never qualified to do business in any foreign country or jurisdiction, except with respect to Bermuda, where CICA Ltd. is domiciled, and have never submitted our insurance policies issued to residents of foreign countries for approval by any foreign or domestic insurance regulatory agency. We sell our policies to residents of foreign countries using foreign independent marketing firms and independent consultants, and we rely on our independent consultants to comply with laws applicable to them in marketing our insurance products in their respective countries. We have undertaken a comprehensive compliance review of risks associated with the potential application of foreign laws to our sales of insurance policies in foreign countries. The application of foreign laws to our sales of insurance policies in foreign countries varies by country. There is a lack of uniform regulation, lack of clarity in certain regulations and lack of legal precedent in addressing circumstances similar to ours. Our compliance review has confirmed the previously disclosed risks related to foreign insurance laws associated with our current business model, at least in certain jurisdictions, as described in detail in
Item 1A. Risk Factors
- "Risks Relating to our Business". We are exploring alternatives to our current business model in one or more jurisdictions.
Item 1A.
RISK FACTORS
The following discussion of risk factors contains forward-looking statements. These risk factors may be important to understanding other statements in this report. The following information should be read in conjunction with
Part II, Item 7. Management’s Discussion and Analysis of Financial Condition and Results of Operations
, the
Consolidated Financial Statements
and accompanying notes in
Part II, Item 8. Financial Statements and Supplementary Data
of this report.
The business, financial condition and operating results of the Company can be affected by a number of factors, whether currently known or unknown, including but not limited to those described below, any one or more of which could, directly or indirectly, cause the Company’s actual financial condition and operating results to vary materially from past, or from anticipated future, financial condition and operating results. Any of these factors, in whole or in part, could materially and adversely affect the Company’s business, financial condition, operating results and stock price.
Because of the following factors, as well as other factors affecting the Company’s financial condition and operating results, past financial performance should not be considered to be a reliable indicator of future performance, and investors should not use historical trends to anticipate results or trends in future periods.
December 31, 2019 | 10-K
9
Our sales to residents of foreign countries expose us to additional risks. A significant loss of sales in these foreign markets could have a material adverse effect on our results of operations and financial condition.
A substantial majority of our direct premiums, approximately
71%
at December 31,
2019
, are from foreign countries, primarily those in Latin America and the Pacific Rim. These sales are made through independent consultants who are located in these foreign countries.
Our Company’s sales and financial results depend upon avoiding significant regulatory restraints on receiving insurance policy applications and premiums from, and issuing insurance policies to, policyholders outside of the United States. Currency control laws, other currency exchange restrictions or tax laws in foreign countries could materially adversely affect our revenues by imposing restrictions or additional fees, costs or taxes on asset transfers outside of a country where our policyowners reside. Difficulties in transferring funds from or converting currencies to U.S. dollars in certain countries or any increase in fees, costs or taxes associated therewith could prevent our policyowners in those countries from purchasing or paying premiums on our policies and/or make our products less attractive to such policyowners. As such, existing or future laws and regulations, and the manner in which they are interpreted or applied, may become more restrictive or otherwise adversely affect our operations.
Importantly we also face risks associated with the application of foreign laws to our sales of insurance policies to residents in foreign countries. Generally, all foreign countries in which we offer insurance products, through our network of independent consultants, require a license or other authority to conduct insurance business in that country. Some of these countries also require that local regulatory authorities approve the terms of any insurance product sold to residents of that country. We have never sought to qualify to do business in any foreign country or jurisdiction, except Bermuda, in which CICA Ltd. is domiciled, and have never submitted the insurance policies that we issue to residents of foreign countries for approval by any foreign or domestic insurance regulatory agency. Traditionally, we have sought to mitigate risks associated with the potential application of foreign laws to our sales of insurance policies in our foreign markets by, among other things, not locating any of our offices or assets in foreign countries or jurisdictions, selling policies only through independent consultants rather than our own employees, requiring that all applications for insurance be submitted to and accepted only in our offices in the U.S. or, following the novation of our international policies to CICA Ltd. in Bermuda effective July 1, 2018, in our offices in Bermuda, and requiring that policy premiums be paid to us only in U.S. dollars. We rely on our independent consultants to comply with laws applicable to them in marketing our insurance products in their respective countries. There is no assurance that the precautionary measures, practices and policies mentioned above will partially or entirely mitigate the risk associated with the potential application of foreign laws to our sales of insurance policies in our foreign markets. From time to time, insurance regulators in the foreign countries in which we operate have sought to exercise regulatory authority over the Company, including through the imposition of fines. Although the Company believes that these foreign regulators do not have jurisdiction over the Company and that any actions, including fines, would be unenforceable against the Company, the threat of regulatory action could otherwise absorb Company time and resources away from its business operations. The Company may determine that the risks associated with a particular market and its regulatory environment outweigh the benefits of conducting further business in that market.
We have undertaken a comprehensive compliance review of risks associated with the potential application of foreign laws to our sales of insurance policies in foreign countries. The application of foreign laws to our sales of insurance policies in foreign countries varies by country. There is a lack of uniform regulation and lack of clarity in certain regulations. Our compliance review has confirmed the previously disclosed risks related to foreign insurance laws associated with our current business model, at least in certain foreign countries.
There are risks that a foreign government could determine under its existing laws that its residents may not purchase life insurance from us unless we become qualified to do business in that country or unless our policies purchased by its residents receive prior approval from its insurance regulators. There also is a risk that a foreign government will enact additional legislation that may render our existing insurance products either illegal or less attractive to potential customers. There is the further risk that regulators may become more aggressive in enforcing any perceived violations of their laws and seek to impose monetary fines, criminal penalties, and/or order us to cease our sales in that jurisdiction. There is no assurance that, if a foreign country were to deem our sales of policies in that country to require that we qualify to do business in that country or submit our policies for approval by that country’s regulatory authorities, we would be able to, or would conclude that it is advisable to, comply with those requirements. Any determination by a foreign country that we or our policy sales are subject to regulation under their laws, or any actions by a foreign country
December 31, 2019 | 10-K
10
to enforce such laws more aggressively, could therefore have a material adverse effect on our ability to sell policies in that country and, in turn, on our results of operations and financial condition. We are exploring alternatives to our current business model in one or more jurisdictions.
Any disruption to the marketing and sale of our policies to residents of foreign countries, resulting from the actions of foreign regulatory authorities, the withdrawal from Brazil or other markets, the implementation of new Bermuda regulatory obligations or otherwise, could have a material adverse effect on our business, results of operations and financial condition.
Many of the countries that we operate in have a history of political instability, including regime changes, political uprisings, currency fluctuations and anti-democratic or anti-U.S. policies. The ability of people living in these countries to purchase and continue to make premium payments on our insurance policies and our ability to sell our policies in those countries through our independent consultants or otherwise may be adversely affected by political instability. Given the nature of our products, in an economic environment characterized by higher unemployment, lower personal income and reduced consumer spending, new product sales may be adversely affected. During such periods, we may also experience higher claims incidence, longer claims duration, increase in policy lapses and/or increase in surrenders, any of which could have a material adverse effect on our results of operations or financial condition. In addition, the imposition of U.S. sanctions against foreign countries where our policyholders reside could make it difficult for us to continue to issue new policies and receive premiums from policyholders in those countries.
Catastrophes may adversely impact liabilities for policyholder claims and reinsurance availability and disrupt our operations.
Our insurance operations are exposed to the risk of catastrophic events. The extent of losses from a catastrophe is a function of both the total amount of insured exposure in the area affected by the event and the severity of the event. Most catastrophes are restricted to small geographic areas; however, hurricanes, earthquakes, tsunamis and man-made catastrophes may produce significant damage or loss of life in larger areas, especially those that are heavily populated. Claims resulting from catastrophic events could cause substantial volatility in our financial results for any fiscal quarter or year and could materially reduce our profitability or harm our financial condition. In addition, catastrophic events could harm the financial condition of issuers of obligations we hold in our investment portfolio, resulting in impairments to these investments, and the financial condition of our reinsurers, thereby increasing the probability of default on reinsurance recoveries. Large-scale catastrophes may also reduce the overall level of economic activity in affected countries, which could hurt our business and the value of our investments or our ability to sell new policies.
Our life insurance operations are exposed to the risk of catastrophic mortality, such as a pandemic or other event that causes a large number of deaths, especially if concentrated in our top foreign markets. A significant pandemic or public health crisis could have a major impact on the global economy or the economies of particular countries or regions, including travel, trade, tourism, the health system, food supply, consumer consumption and behavior, overall economic output and, eventually, on the financial markets. In addition, a pandemic or public health crisis, including the occurrence of a contagious disease or illness, that affected our employees, our policyholders, our independent consultants or other companies with which we do business could disrupt our business operations. For example, the recent outbreak of the novel coronavirus COVID-19 in China could adversely affect our operations and our ability to sell new policies in the Pacific Rim
, and if the virus continues to spread, could adversely affect our operations and sales in other geographic regions.
At this point, the extent to which the novel coronavirus COVID-19 may impact our results is uncertain. The effectiveness of external parties, including governmental and non-governmental organizations, in combating the spread and severity of such a pandemic could have a material impact on the losses experienced by us. These events could cause a material adverse effect on our results of operations in any period and, depending on their severity, could also materially and adversely affect our financial condition.
Our financial condition and results of operations may be affected if the liabilities actually incurred differ, or if our estimates of those liabilities change, from the amounts we have reserved for in connection with missed tax reporting or noncompliance of some of our products with the Internal Revenue Code.
We have previously reported that a portion of the life insurance policies issued by our subsidiary insurance companies failed to qualify for the favorable U.S. federal income tax treatment afforded by Sections 7702/72(s) of the Internal Revenue Code ("IRC") of 1986. We
have determined the structure of our policies sold to non-U.S. persons, which were novated to CICA Ltd. effective July 1, 2018, may have inadvertently generated U.S. source income over time,
December 31, 2019 | 10-K
11
which caused tax withholding and information reporting requirements for the Company under Chapters 3 and 4 of the IRC.
Accruals for loss contingencies are recorded when it is probable that a liability has been incurred and the amount can be reasonably estimated. The process of determining our best estimate and the estimated range for probable liabilities and expenses related to these tax issues was a complex undertaking including insight from external consultants and involved management’s judgment based upon a variety of factors known at the time. The amount of our liabilities and expenses depends on a number of uncertainties, including the number of prior tax years for which we may be liable to the IRS and the methodology applicable to the calculation of the tax liabilities for policies
.
Given the range of potential outcomes and the significant variables assumed in establishing our estimates, actual amounts incurred may exceed our reserve and could exceed the high end of our estimated range of liabilities and expenses. To the extent the amount reserved by the Company is insufficient to meet the actual amount of our liabilities and expenses, or if our estimates of those liabilities and expenses change in the future, our financial condition and results of operations may be materially adversely affected. See
Note 7. Commitment and Contingencies
in the notes to our consolidated financial statements for further discussion of such tax issues.
CICA Ltd. is subject to extensive supervision and regulation by the Bermuda Monetary Authority and the Ministry of Finance of Bermuda (“MOF”). Failure to comply with regulation by the BMA and the MOF may increase our costs of doing business, restrict the conduct of our business and negatively impact our financial position or results of operations.
CICA Ltd. was registered in Bermuda under the Insurance Act 1978 as a Class E insurer in February 2018 and is now subject to the provisions of the Insurance Act and the rules and regulations promulgated thereunder. We have limited experience with regulation by the BMA and the MOF, including compliance with common reporting standard regulations imposed by the Organization for Economic Co-Operation and Development, administered by the MOF, the jurisdiction's competent authority. Failure to comply with laws and regulations in Bermuda could subject us to monetary penalties imposed by the BMA and the MOF, increased regulatory supervision, unanticipated costs associated with remedying such failure or other claims, harm to our reputation and interruption of our operations, which may have a material adverse impact on our financial position or results of operations.
Sustained periods of low interest rates in the long-term investment market may adversely affect our reported net investment income and the discount rates used in reserving for our insurance products, which may adversely affect our results of operations or financial condition.
Declines in interest rates and/or the continuance of the current level of low interest rates and yields on fixed maturity investments may cause the rates of return on our investment portfolio to decrease more than expected, leading to lower net investment income than assumed in the pricing and reserving for our insurance products. An interest or discount rate is used in calculating reserves for our insurance products. We set our reserve discount rate assumptions based on our current and expected future investment yield for assets supporting the reserves, considering current and expected future market conditions. If the discount rate assumed in our reserve calculations is higher than our future investment returns, our invested assets will not earn enough investment income to support our future benefit payments. In that case, the reserves may eventually be insufficient, resulting in the need to increase our reserves and/or increase our capital contributions to our insurance subsidiaries, either of which could have a material adverse effect on our results of operations or financial condition.
Changes in market interest rates may significantly affect our profitability
.
We are exposed to significant capital market risk related to changes in interest rates. Our investment performance, including yields and realization of gains and losses, may vary depending on economic and market conditions. Substantial and sustained changes, up or down, in market interest rate levels can materially affect the profitability of our products.
If interest rates decrease or remain at low levels, we may be forced to reinvest proceeds from investments that have matured, prepaid, been sold, or called at lower yields, reducing our investment margin. We have experienced significant call activity on our fixed maturity portfolio over the years due to the low interest rate environment. Our fixed maturity bond portfolio is exposed to interest rate risk as approximately
51%
of the portfolio is callable as of December 31, 2019, with
17%
that could be called within the next year. If subject to increased call activity, the Company would have to reinvest the resulting investment portfolio cash proceeds from calls as well as from maturities in lower yielding
December 31, 2019 | 10-K
12
instruments, further reducing our investment income.
Some of our products, principally traditional whole life insurance with annuity riders, expose us to the risk that changes in interest rates will reduce our "spread," or the difference between the amounts we are required to pay under our contracts to policyholders and the rate of return we are able to earn on our investments intended to support obligations under the contracts. As a key component of profitability, a narrowing of our “spread” may have a material adverse effect on our results of operations or financial condition. Lowering our interest crediting rates can help offset decreases in investment margins on some of our products. However, our ability to lower these rates could be limited by competition or contractually guaranteed minimum rates and may not match the timing or magnitude of changes in asset yields.
An increase in interest rates will decrease the net unrealized gain position of our investment portfolio and may subject us to disintermediation risk. Disintermediation risk is the risk that in a change from a low interest rate period to a significantly higher and increasing interest rate period, policyholders may surrender their policies or make early withdrawals to increase their returns, requiring us to liquidate investments in an unrealized loss position (i.e. the market value less the carrying value of the investments).
Our investment portfolio is subject to various risks that may result in realized investment losses. In particular, decreases in the fair value of fixed maturities may significantly reduce the value of our investments, and as a result, our financial condition may suffer.
We are subject to credit risk in our investment portfolio. Defaults by third parties in the payment or performance of their obligations under these securities could reduce our investment income and realized investment gains or result in the recognition of investment losses. The value of our investments may be materially adversely affected by increases in interest rates, downgrades in the bonds included in our portfolio and by other factors that may result in the recognition of other-than-temporary impairments. Each of these events may cause us to reduce the carrying value of our investment portfolio.
In particular, at
December 31, 2019
, fixed maturities represented
$1.4 billion
or
93.1%
of our total investments of
$1.5 billion
. The fair value of fixed maturities and the related investment income fluctuates depending on general economic and market conditions. The fair value of these investments generally increases or decreases in an inverse relationship with fluctuations in interest rates, while net investment income realized by us will generally increase or decrease in line with changes in market interest rates. In addition, actual net investment income and/or cash flows from investments that carry prepayment risk, such as mortgage-backed and other asset-backed securities, may differ from those anticipated at the time of investment as a result of interest rate fluctuations. An investment has prepayment risk when there is a risk that the timing of cash flows resulting from the repayment of principal might occur earlier than anticipated because of declining interest rates or later than anticipated because of rising interest rates. The impact of value fluctuations affects our consolidated financial statements, as all of our fixed maturities are classified as available-for-sale, with changes in fair value reflected in our stockholders' equity (accumulated other comprehensive income or loss). No similar adjustment is made for liabilities to reflect a change in interest rates. Therefore, interest rate fluctuations and economic conditions could adversely affect our stockholders' equity, total comprehensive income and/or cash flows. Although at
December 31, 2019
, approximately
98.8%
of our fixed maturities were investment grade with
69.3%
rated A or above, all of our fixed maturities are subject to credit risk. If any of the issuers of our fixed maturities suffer financial setbacks, the ratings on the fixed maturities could be downgraded (with a concurrent decrease in fair value) and, in a worst-case scenario, the issuer could default on its financial obligations. If the issuer defaults, we could have realized losses associated with the impairment of the securities.
The determination of valuation and impairments of our investments include estimations and assumptions that are subjective and prone to differing interpretations and could materially impact our results of operations or financial condition
.
The Company makes assumptions regarding the fair value and expected performance of its fixed maturity securities and other investments. Valuations may include inputs and assumptions that are less observable or require greater estimation, particularly during periods of market disruption, resulting in values which may be less than the value at which the investments may ultimately be sold. Further, rapidly changing and/or unprecedented credit and equity market conditions could materially impact the valuation of investments as reported in our consolidated financial statements, and the period to period changes in value could vary significantly. Decreases in value may have a material adverse effect on our results of operations or financial condition.
December 31, 2019 | 10-K
13
The decision of whether to record an other-than-temporary impairment is determined by our assessment of the financial condition and prospects of a particular issuer, projections of future cash flows and recoverability as well as our ability and intent to hold the securities to recovery or maturity. We evaluate our investment portfolio for impairments. There can be no assurance that we have accurately assessed the level of impairments taken. Additional impairments may need to be taken in the future, and historical trends may not be indicative of future impairments. Any event reducing the value of our securities other than on a temporary basis may have a material adverse effect on our business, results of operations, or financial condition.
Our actual claims losses may exceed our reserves for claims, and we may be required to establish additional reserves, which in turn may adversely impact our results of operations and financial condition.
We maintain reserves to cover our estimated exposure for claims relating to our issued insurance policies. Reserves do not represent an exact calculation of exposure, but instead represent our best estimates using actuarial and statistical procedures. Reserve estimates are refined as experience develops, and adjustments to reserves are reflected in our statements of operations for the period in which such estimates are updated. Because establishing reserves is an inherently uncertain process involving estimates of future losses, future developments may require us to increase policy benefit reserves, which may have a material adverse effect on our results of operations and financial condition in the periods in which such increases occur.
Unanticipated increases in early policyholder withdrawals or surrenders or elections by policyholders to receive lump sum payouts at maturity could negatively impact liquidity.
A primary liquidity concern is the risk of unanticipated or extraordinary early policyholder withdrawals or surrenders. Our insurance policies include provisions, such as surrender charges, that help limit and discourage early withdrawals, and we track and manage liabilities and align our investment portfolio to maintain sufficient liquidity to support anticipated withdrawal demands. However, early withdrawal and surrender levels may differ from anticipated levels for a variety of reasons, including changes in economic conditions, changes in policyholder behavior or financial needs, changes in relationships with our independent consultants, changes in our claims-paying ability, or increases in surrenders among policies that have been inforce for more than fifteen years and are no longer subject to surrender charges.
In addition, we face potential liquidity risks if policyholders with mature policies elect to receive lump sum distributions at greater levels than anticipated. Our whole life and endowment products provide the policyholder with alternatives once the policy matures. The policyholder can choose to take a lump sum payout or leave the money on deposit at interest with the Company. The Company has a significant amount of endowment products, with older contracts sold historically that will begin reaching their maturities over the next several years and policyholder election behavior is not known. It is uncertain how policyholders will react in response to these maturities. If a large number of policyholders elect lump sum distributions, the Company could be exposed to liquidity risk in years of high maturities. Any of these occurrences could adversely affect our liquidity, profitability and financial condition.
While we own a significant amount of liquid assets, a certain portion of investment assets are relatively illiquid. If we experience unanticipated early withdrawal or surrender activity, we could exhaust all other sources of liquidity and be forced to obtain additional financing or liquidate assets, perhaps on unfavorable terms. The availability of additional financing will depend on a variety of factors, such as market conditions, the availability of credit in general or more specifically in the insurance industry, the strength or weakness of the capital markets, the volume of trading activities, our credit capacity, and the perception of our long- or short-term financial prospects if we incur large realized or unrealized investment losses or if the level of business activity declines due to a market downturn. If we are forced to dispose of assets on unfavorable terms, it could have an adverse effect on our liquidity, results of operations and financial condition.
We may be required to accelerate the amortization of deferred acquisition costs and the costs of insurance acquired, which would increase our expenses and adversely affect our results of operations and financial condition.
At
December 31, 2019
, we had
$149.2 million
of deferred policy acquisition costs, or DAC. DAC represents costs that vary with and are directly related to the successful sale and issuance of our insurance policies and are deferred and amortized over the estimated life of the related insurance policies. These costs include commissions in excess of ultimate renewal commissions, solicitation and printing costs, sales material costs and some support costs, such as
December 31, 2019 | 10-K
14
underwriting and contract and policy issuance expenses. Under U.S. GAAP for our type of insurance products, DAC is amortized over the premium-paying period of the policies.
In addition, when we acquire a block of insurance policies, we assign a portion of the purchase price to the right to receive future net cash flows from existing insurance and investment contracts and policies. This intangible asset, called the cost of insurance acquired, or COIA, represents the actuarially estimated present value of future cash flows from the acquired policies. At
December 31, 2019
, we had
$13.5 million
of COIA. We amortize the value of this intangible asset in a manner similar to the amortization of DAC.
The amortization of DAC and COIA is subject to acceleration and generally depends upon anticipated profits from investments, surrender and other policy charges, mortality, morbidity, persistency and maintenance expense margins. For example, if our insurance policies lapse and surrender rates were to exceed the assumptions upon which we priced our insurance policies, or if actual persistency proves to be less than our persistency assumptions, especially in the early years of a policy, we might be required to accelerate the amortization of expenses we deferred in connection with the acquisition of the policy. We regularly review the quality of our DAC and COIA to determine if they are recoverable from future income. If these costs are not recoverable, the amount that is not recoverable is charged to expenses in the financial period in which we make this determination.
Unfavorable experience with regard to expected expenses, investment returns, surrender and other policy charges, mortality, morbidity, lapses or persistency may cause us to increase the amortization of DAC or COIA, or both, or to record a current period expense to increase benefit reserves, any of which could have a material adverse effect on our results of operations and financial condition.
We may be required to recognize an impairment on the value of our goodwill, which would increase our expenses and materially adversely affect our results of operations and financial condition.
Goodwill represents the excess of the amount paid by us to acquire various life insurance companies over the fair value of their net assets at the date of the acquisition. Under U.S. GAAP, we test the carrying value of goodwill for impairment at least annually at the "reporting unit" level, which is either an operating segment or a business that is one level below the operating segment. Goodwill is impaired if its carrying value exceeds its implied fair value. This may occur for various reasons, including changes in actual or expected earnings or cash flows of a reporting unit, generation of earnings by a reporting unit at a lower rate than similar businesses or declines in market prices for publicly traded businesses similar to our reporting units. If any portion of our goodwill becomes impaired, we would be required to recognize the amount of the impairment as a current-period expense, which could have a material adverse effect on our results of operations and financial condition. Goodwill in our consolidated financial statements related to our Life Insurance segment was
$12.6
million as of
December 31, 2019
.
Management’s determination of the fair value of each reporting unit incorporates multiple inputs including qualitative and quantitative factors such as discounted cash flow calculations based on assumptions that market participants would make in valuing the reporting unit. Other assumptions can include levels of economic capital, future business growth, and earnings projections and trends.
Litigation and regulatory actions and investigations are common in our businesses and may result in financial losses and/or harm to our reputation.
From time to time we are, and have been, subject to a variety of legal and regulatory actions and investigations relating to our business operations. We are, and in the future may be, parties in various litigation matters. An adverse outcome in one or more of these actions, investigations or litigation matters may, depending on the nature, scope and amount of the ruling, materially and adversely affect our results of operations or financial condition, encourage other litigation, and limit our ability to write new business, particularly if the adverse outcomes negatively impact our reputation.
In the absence of countervailing considerations, we would expect to defend any such actions, investigations or litigation matters vigorously. However, in doing so, we could incur significant defense costs, including attorneys' fees, other direct litigation costs and the expenditure of substantial amounts of management time that otherwise would be devoted to our business. Further, if we suffer an adverse judgment as a result of any claim, it could have a material adverse effect on our business, results of operations and financial condition.
December 31, 2019 | 10-K
15
Reinsurance may not be available or affordable, or reinsurers may be unwilling or unable to meet their obligations under our reinsurance contracts, which may adversely affect our results of operations or financial condition.
As part of our overall risk management and capital management strategies, we purchase reinsurance for certain risks underwritten by our various insurance subsidiaries
.
Market conditions beyond our control determine the availability and cost of reinsurance. Any decrease in the amount of reinsurance will increase our risk of loss and may impact the level of capital requirements for our insurance subsidiaries, and any increase in the cost of reinsurance will, absent a decrease in the amount of reinsurance, reduce our results of operations. Accordingly, we may be forced to incur additional expenses for reinsurance or may be unable to obtain sufficient reinsurance on acceptable terms, which may adversely affect our ability to write future business, result in the assumption of more risk with respect to the policies we issue, and increase our capital requirements. The collectability of our reinsurance recoverable is primarily a function of the solvency of the individual reinsurers. We cannot provide assurance that our reinsurers will pay the reinsurance recoverable owed to us or that they will pay these recoverables on a timely basis. The insolvency of a reinsurer or the inability or unwillingness of a reinsurer to comply with the terms of a reinsurance contract may have an adverse effect on our results of operations or financial condition.
Our international markets face significant competition. If we are unable to compete effectively in our markets, our business, results of operations and profitability may be adversely affected.
Our international marketing plan focuses on offering U.S. dollar-denominated life insurance products to individuals residing in foreign countries. We experience considerable competition primarily from the following sources, many of which have substantially greater financial, marketing and other resources than we have:
|
•
|
Foreign operated companies with U.S. dollar-denominated policies. We face direct competition from companies that operate in the same manner as we operate in our international markets, including from a company recently formed by some of our former employees and independent consultants.
|
|
•
|
Foreign operated companies with locally operated subsidiaries that offer both local jurisdiction-regulated products in local currency and off-shore U.S. dollar-denominated policies. This arrangement creates competition in that the U.S. dollar-denominated policies are offered in conjunction with high-need local insurance policies such as health insurance.
|
|
•
|
Locally operated companies with local currency policies. We compete with companies formed and operated in the country in which our foreign insureds reside.
|
In addition, from time to time, companies enter and exit the markets in which we operate, thereby increasing competition at times when there are new entrants. We may lose business to competitors offering competitive products at lower prices, or for other reasons.
There can be no assurance that we will be able to compete effectively in any of our markets. If we do not, our business, results of operations and financial condition will be materially adversely affected.
Sales of our insurance products could decline if we are unable to (i) establish and maintain commercial relationships with independent marketing firms and independent consultants, (ii) attract and retain employee agents or (iii) develop and maintain our distribution sources.
We distribute our insurance products through several distribution channels, including independent marketing firms, independent consultants and our employee agents. In our Life Insurance segment, we depend almost exclusively on the services of independent marketing firms and independent consultants. In our Home Service Insurance segment, we depend on employee agents whose role in our distribution process is integral to developing and maintaining relationships with policyholders. Significant competition exists among insurers in attracting and maintaining marketers of demonstrated ability. Some of our competitors may offer better compensation packages for marketing firms, independent consultants and agents and broader arrays of products and have a greater diversity of distribution resources, better brand recognition, more competitive pricing, lower cost structures and greater financial strength or claims paying ratings than we do. We compete with other insurers for marketing firms, independent consultants and employee agents primarily on the basis of our compensation, products and support services. Any reduction in our ability to attract and retain effective sales representatives could materially adversely affect our revenues, results of operations and financial condition. Modifications in our international business model could include withdrawal from
December 31, 2019 | 10-K
16
certain markets that may have an adverse impact on our ability to attract and retain effective sales representatives.
There may be adverse tax, legal or financial consequences if our sales representatives are determined not to be independent contractors.
Our international sales representatives are independent contractors who operate their own businesses. Although we believe that we have properly classified our representatives as independent contractors, there is nevertheless a risk that the IRS, a foreign agency, a court or other authority will take the different view that our sales representatives should be treated like employees. Furthermore, the tests governing the determination of whether an individual is considered to be an independent contractor or an employee are typically fact-sensitive and vary from jurisdiction to jurisdiction. Laws and regulations that govern the status and misclassification of independent sales representatives are subject to change or interpretation.
If there is a change in the manner in which our independent contractors are classified or an adverse determination with respect to some or all of our independent contractors by a court or governmental agency, we could incur significant costs in complying with such laws and regulations, including in respect of tax withholding, social security payments, government and private pension plan contributions and recordkeeping, or we may be required to modify our business model, any of which could have a material adverse effect on our business, financial condition and results of operations. In addition, there is the risk that we may be subject to significant monetary liabilities arising from fines or judgments as a result of any such actual or alleged non-compliance with applicable federal, state, local or foreign laws.
We and our domestic insurance subsidiaries are subject to extensive governmental regulation in the U.S., which is subject to change and may increase our costs of doing business, restrict the conduct of our business, increase capital requirements for our insurance subsidiaries and negatively impact our results of operations, liquidity and financial condition.
We and our domestic insurance subsidiaries are subject to extensive regulation and supervision in U.S. jurisdictions where we do business, including state insurance regulations and U.S. federal securities, tax, financial services, privacy, anti-money laundering, bank secrecy, anti-corruption and foreign asset control laws. Insurance company regulation is generally designed to protect the interests of policyholders, with substantially lesser protections to shareholders of the regulated insurance companies. To that end, all the U.S. states in which we do business have insurance regulatory agencies with broad legal powers with respect to licensing companies to transact business; mandating capital and surplus requirements; regulating trade and claims practices; approving policy forms; restricting companies' ability to enter and exit markets; and restricting or prohibiting the payment of dividends by our subsidiaries to us.
The capacity for an insurance company's growth in premiums is partially a function of its required statutory surplus. Maintaining appropriate levels of statutory surplus, as measured by statutory accounting practices prescribed or permitted by a company's state of domicile, is considered important by all U.S. state insurance regulatory authorities. Failure to maintain required levels of statutory surplus could result in increased regulatory scrutiny and enforcement action by regulatory authorities.
Most U.S. insurance regulatory authorities have broad discretion to grant, renew, suspend and revoke licenses and approvals, and could preclude or temporarily suspend us from carrying on some or all of our activities, including acquisitions of other insurance companies, require us to add capital to our insurance company subsidiaries, or fine us. If we are unable to maintain all required licenses and approvals, or if our insurance business is determined not to comply fully with the wide variety of applicable laws and regulations and their interpretations, including the USA Patriot Act, our revenues, results of operations and financial condition could be materially adversely affected.
Our failure to maintain effective information systems could adversely affect our business.
We must maintain and enhance our existing information systems and develop and integrate new information systems to keep pace with continuing changes in information processing technology, evolving industry and regulatory standards and changing customer preferences in a cost-effective manner. If we do not maintain adequate systems, we could experience adverse consequences, including products acquired through acquisition, inadequate information on which to base pricing, underwriting and reserve decisions, regulatory problems, failure to meet prompt payment obligations, increases in administrative expenses and loss of customers. We must also effectively consolidate our information systems to eliminate redundant or obsolete applications. Our failure to maintain effective and efficient information
December 31, 2019 | 10-K
17
systems, or our failure to consolidate our existing systems could have a material adverse effect on our results of operations and financial condition.
Some of our information technology systems and software are mainframe-based, legacy-type systems that require an ongoing commitment of resources to maintain current standards. Our systems utilize proprietary code requiring highly skilled personnel. Due to the unique nature of our proprietary operating environment, we could have difficulty finding personnel with the skills required to provide ongoing system maintenance and development as we seek to keep pace with changes in our products and business models, information processing technology, evolving industry and regulatory standards and policyholder needs.
We are continuously evaluating and enhancing systems and creating new systems and processes as our business depends on our ability to maintain and improve our technology. Due to the complexity and interconnectedness of our systems and processes, these changes, as well as changes designed to update and enhance our protective measures to address new threats, increase the risk of a system or process failure or the creation of a gap in our security measures. Any such failure or gap could adversely affect our business operations and results of operations.
A cyber attack or other security breach could disrupt our operations, result in the unauthorized disclosure or loss of confidential data, damage our reputation or relationships, and expose us to significant financial and legal liability, which may adversely affect our business, results of operations, or financial condition.
We store confidential information about our business and our policyholders, independent marketing firms, independent consultants and employee-agents and others on our information technology systems, including proprietary and personally identifiable information. As part of our normal business operations, we use this information and engage third-party providers, including outsourcing, cloud computing, and other business partners, that store, access, process, and transmit such information on our behalf. We devote significant resources and employ security measures to help protect our information technology systems and confidential information, and we have programs in place to detect, contain, and respond to information security incidents. However, because the techniques used to obtain unauthorized access, disable or degrade service, or sabotage systems change frequently and may be difficult to detect for long periods of time, we and our third-party providers may be unable to anticipate these techniques or implement adequate preventative measures. In addition, hardware, software, or applications we develop or procure from third parties or through open source solutions may contain defects in design or manufacture or other problems that could unexpectedly compromise our information security. Unauthorized parties, whether within or outside our company, may disrupt or gain access to our systems, or those of third parties with whom we do business, through human error, misfeasance, fraud, trickery, or other forms of deceit, including break-ins, use of stolen credentials, social engineering, phishing, or other cyber attacks, computer viruses, malicious codes, and similar means of unauthorized and destructive tampering.
We and our third-party providers experience information security incidents from time to time. There is no assurance that our security systems and measures will be able to prevent, mitigate, or remediate future incidents. A successful penetration or circumvention of the security of our information technology systems, or those of third parties with whom we do business, could cause serious negative consequences for us, including significant disruption of our operations, unauthorized disclosure or loss of confidential information, harm to our brand or reputation, loss of customers and revenues, violations of privacy and other laws, and exposure to litigation, monetary damages, regulatory enforcement proceedings, fines, and potentially criminal proceedings and penalties. If we are unaware of the incident for some time after it occurs, our exposure could increase. In addition, the costs to address or remediate systems disruptions or security threats or vulnerabilities, whether before or after an incident, could be significant. As we continue to build our digital capabilities and focus on enhancing the customer experience, the amount of information that we retain and share with third parties is likely to grow, increasing the cost to prevent data security breaches and the cost and potential consequences of such breaches. An information technology systems failure could also interfere with our ability to comply with financial reporting and other regulatory requirements, exposing us to potential disciplinary action by regulators.
Although we have insurance against some cyber risks and attacks, we may be subject to litigation and financial losses that exceed our policy limits, are subject to deductibles or are not covered under any of our current insurance policies.
December 31, 2019 | 10-K
18
Changes in accounting standards may adversely affect our reported results of operations and financial condition.
Our consolidated financial statements are subject to the application of GAAP in the U.S. and in Bermuda which are periodically revised and/or expanded. Accordingly, we are required to adopt new or revised accounting standards issued by recognized authoritative bodies, including the FASB, the BMA and the NAIC. Future accounting standards we adopt, including the FASB’s accounting standard update related to long-duration insurance contracts, will change current accounting and disclosure requirements applicable to our consolidated financial statements. Such changes may have a material effect on our reported results of operations or financial condition. In addition, the required adoption of new accounting standards may result in significant incremental costs associated with initial implementation and ongoing compliance. See
Note 1. Summary of Significant Accounting Policies
in the notes to our consolidated financial statements contained herein for additional information regarding accounting updates.
Our risk management program may leave us exposed to unidentified or unanticipated risk, which could negatively affect our business.
We have devoted significant resources to develop our enterprise risk management program, which has the objective of managing risks to which the Company is exposed. There are, however, inherent limitations to risk management strategies because there may exist, or develop in the future, risks that we have not appropriately anticipated or identified. For instance, as our business changes and the markets in which we operate evolve, our risk management framework may not advance at the same pace as those changes. As a result, there is a risk that new products or new business strategies may present risks that are not appropriately identified, monitored or managed. If our risk management framework is ineffective, the Company may suffer unexpected losses and could be materially adversely affected.
The failure of our business recovery and incident management processes to resume our business operations in the event of a catastrophe, cyber attack, or other event could adversely affect our profitability, results of operations, or financial condition.
In the event of a disaster such as a catastrophe, an epidemic, a cyber attack, cyber security breach or other information technology systems failure, a terrorist attack, or war, unanticipated problems with our disaster recovery systems could have a material adverse impact on our ability to conduct business and on our results of operations and financial condition, particularly if those problems affect our information technology systems and destroy valuable data or result in a significant failure of our internal control environment. In addition, in the event that a significant number of our employees were unavailable in the event of a disaster, our ability to effectively conduct business could be severely compromised.
The failure of our information technology and/or disaster recovery systems for any reason could cause significant interruptions or malfunctions in our or our customers’ operations and result in the loss, theft, or failure to maintain the security, confidentiality or privacy of sensitive data, including personal information relating to our customers. Such a failure could harm our reputation, subject us to regulatory sanctions, legal claims, and increased expenses, and lead to a loss of customers and revenues.
We depend on the ability of our insurance subsidiaries to make payments to us in sufficient amounts for us to conduct our operations. Our insurance subsidiaries are restricted by applicable laws and regulations in the amounts of payments they may make to us and their ability to transfer funds to us may be impaired by adverse financial results or a change in capital requirements. Accordingly, internal sources of capital and liquidity may not always be sufficient. If we need to seek external capital, adverse market conditions may affect our access to capital or our cost of capital.
As a holding company, our principal asset is the stock of our subsidiaries. We rely primarily on statutorily permissible payments from our insurance company subsidiaries, principally through service agreements we have with our subsidiaries, to meet our working capital and other corporate expenses. The ability of our insurance company subsidiaries to make payments to us is subject to regulation by the states and jurisdictions in which they are domiciled, and these payments depend primarily on approved service agreements between us and these subsidiaries and, to a lesser extent, the statutory surplus (which is the excess of assets over liabilities as determined under statutory accounting practices prescribed by an insurance company's state of domicile), future statutory earnings (which are earnings as determined in accordance with statutory accounting practices) and regulatory restrictions.
December 31, 2019 | 10-K
19
Except to the extent that we are a creditor with recognized claims against our subsidiaries, claims of our subsidiaries' creditors, including policyholders, have priority with respect to the assets and earnings of the subsidiaries over the claims of our creditors and shareholders. If any of our subsidiaries becomes insolvent, liquidates or otherwise reorganizes, our creditors and shareholders will have no right to proceed in their own right against the assets of that subsidiary or to cause the liquidation, bankruptcy or winding-up of the subsidiary under applicable liquidation, bankruptcy or winding-up laws.
Additionally, any change in demand for our insurance subsidiaries’ products or an increase in the incidence of new claims or the duration of existing claims could negatively impact their cash flows from operations. Deterioration in the credit market, which could delay our and our insurance subsidiaries’ ability to sell positions in certain fixed maturity securities in a timely manner, could also negatively impact our and our insurance subsidiaries’ cash flows. Regulatory changes such as those discussed herein in this Item 1A may impose higher capital or reserve requirements on our insurance subsidiaries and/or implement other requirements which could unfavorably affect our liquidity. Without sufficient liquidity, our ability to maintain and grow our operations would be limited. If our internal sources of liquidity prove to be insufficient, we may be unable to successfully obtain additional financing and capital on favorable terms, or at all, which may adversely affect us.
If our financial results are unfavorable, we may need to increase our capital in order to satisfy regulatory requirements. Maintaining appropriate levels of statutory surplus is considered important not only by us but by insurance regulatory authorities in the U.S. and Bermuda. Failure to maintain certain levels of statutory surplus could result in increased regulatory scrutiny or action by regulatory authorities. Need for additional capital may limit a subsidiary's ability to distribute funds to our holding companies.
Obtaining financing for even a small amount of capital could be challenging in unfavorable market conditions and during periods of economic uncertainty. The markets may exert downward pressure on availability of liquidity and credit capacity for certain issuers. The availability of financing will depend on a variety of factors such as market conditions, the general availability of credit, the overall availability of credit to the financial services industry, and the possibility that customers or lenders could develop a negative perception of our financial prospects. Similarly, our access to funds may be impaired if regulatory authorities take negative actions against us. Raising capital in unfavorable market conditions could increase our interest expense or negatively impact our shareholders through increased dilution of their common stock in the Company.
Unexpected losses in future reporting periods may require us to record a valuation allowance against our deferred tax assets.
We evaluate our deferred tax asset ("DTA") quarterly for recoverability based on available evidence. This process involves management's judgment about assumptions, which are subject to change from period to period due to tax rate changes or variances between our projected operating performance and our actual results. Ultimately, future adjustments to the DTA valuation allowance, if any, will be determined based upon changes in the expected realization of the net deferred tax assets. The realization of the deferred tax assets depends on the existence of sufficient taxable income in either the carry back or carry forward periods under applicable tax law. Due to significant estimates utilized in establishing the valuation allowance and the potential for changes in facts and circumstances, it is reasonably possible that we may be required to record a valuation allowance in future reporting periods. Such an adjustment could have a material adverse effect on our results of operation, financial condition and capital position.
We face a greater risk of money laundering activity associated with sales derived from residents of certain foreign countries
.
Some of our top international markets are in countries identified by the U.S. Department of State as jurisdictions of high risk for money laundering. As required by the U.S. Bank Secrecy Act regulations, the Bermuda Proceeds of Crime Act 1997 and the Proceeds of Crime (Anti-Money Laundering and Anti-Terrorist Financing) Regulations 2008 applicable to insurance companies, we have developed and implemented an anti-money laundering, anti-terrorist financing and sanctions program (“AML/ATF and Sanctions Program”) that includes policies, procedures, controls, independent testing, reporting and recordkeeping requirements for deterring, preventing and detecting potential money laundering, terrorist financing, fraud and other criminal activity in order to comply with U.S. and Bermuda laws. We have an enhanced AML/ATF and Sanctions Program with additional controls, such as watch-list screening beyond sanctions screening
December 31, 2019 | 10-K
20
required by the U.S. Office of Foreign Assets Control ("OFAC") and the Financial Sanctions Implementation Unit of Bermuda, enhanced payment due diligence and transaction controls. However, there can be no assurance that these enhanced controls will entirely mitigate money laundering risk associated with these jurisdictions.
Events that damage our reputation may adversely affect our business, results of operations, or financial condition.
There are many events which may harm our reputation, including, but not limited to, those discussed in this Item 1A regarding regulatory investigations, legal proceedings, cyber or other information security incidents and disputes with our independent consultants.
In addition, as an insurance company, we are paid to accept certain risks. Those who conduct our business, including executive officers and members of management, and to some extent, independent consultants, do so in part by making decisions that involve exposing us to risk. These include decisions such as maintaining effective underwriting and pricing discipline, maintaining effective claim management and customer service performance, managing our investment portfolio, delivering effective technology solutions, complying with established sales practices, executing our capital management strategy, exiting a line of business and/or pursuing strategic growth initiatives, and other decisions. Although we have a risk management framework and employ controls and procedures designed to monitor business decisions and prevent us from taking excessive risks or unintentionally failing to comply with internal policies and practices such that errors occur, there can be no assurance that these controls and procedures will be effective. If our employees and independent consultants take excessive risks and/or fail to comply with internal policies and practices, the impact of those events may damage our market position and reputation.
Depending on the severity of the damage to our reputation, we may be unable to effectively compete for new products or retain our existing business, which could adversely affect our results of operations or financial condition. Damage to our reputation may also hinder our ability to raise new capital and/or increase our cost of capital.
If our foreign policyholders reduced or ceased participation in our Citizens, Inc. Stock Investment Plan (the "CISIP") or if a securities regulatory authority were to deem the CISIP's operation contrary to securities laws, the volume of Class A common stock purchased on the open market through the CISIP, and the price of our Class A common stock, could fall.
At
December 31, 2019
, more than 97% of the shares of our Class A common stock purchased under the CISIP in
2019
were purchased by foreign holders of life insurance policies (or related brokers), with the remaining 3% of the shares of Class A common stock purchased by participants residing in the United States. The CISIP is registered with the SEC pursuant to a registration statement under the Securities Act of 1933, but is not registered under the laws of any foreign jurisdiction. If a foreign securities regulatory authority were to determine the offer and sale of our Class A common stock under the CISIP were contrary to applicable laws and regulations of its jurisdiction, such authority may issue or assert a fine, penalty or cease and desist order against us in that foreign jurisdiction. There is a risk our Class A common stock price could be negatively impacted by a decrease in participation in the CISIP. If fewer policyholders elect to participate in the Plan, or our international premium collections were to decrease as a result of regulatory, economic, or marketing impediments, the trading volume of our Class A common stock may decline from its present levels, the demand for our Class A common stock could be negatively impacted and the price of our Class A common stock could fall.
Due to required regulatory approval for acquisition of control of a regulated U.S. domestic insurance company, control of our Company, through the ownership of our Class B common stock, has not yet transferred from our founder's trust to a 501(c)(3) charitable foundation established by our founder, and we cannot determine whether or when any change in our management, operations, or operating strategies will occur.
Harold E. Riley, our founder, was the beneficial owner of 100% of our Class B common stock, which was held in the name of the Harold E. Riley Trust ("Trust"), of which he had served as Trustee until his death in September 2017. Our Class A and Class B common stock are identical in all respects, except the Class B common stock elects a simple majority of the Board and receives one-half of any cash dividends paid, on a per share basis, to the Class A common stock. The Class A common stock elects the remainder of the Board. The Trust documents provided that upon Mr. Riley's death, the Class B common stock would transfer from the Trust to the Harold E. Riley Foundation, a charitable organization established under 501(c)(3) of the Internal Revenue Code (the "Foundation").
December 31, 2019 | 10-K
21
To date, we understand that the estate process related to the Class B common stock is not complete, and the required state insurance regulatory approvals for change of control to occur have not been received. Therefore, the Trust, of which Mr. Riley's estate is the trustee, currently remains the holder of record of the Class B common stock. The Foundation and the Estate of Harold E. Riley are proceeding independent of the Company to obtain regulatory approval from the Colorado Division of Insurance, the Texas Department of Insurance, the Louisiana Department of Insurance and the Mississippi Department of Insurance through the requisite Form A approval process. The Company does not know if or when regulatory approvals of the transfer ultimately will be granted. If such approvals are obtained from the departments of insurance of the aforementioned states above, the Company will record the transfer of the controlling Class B common stock from the Trust to the Foundation in the Company's shareholder records.
The Foundation is organized as a public support charity for the benefit of its charitable beneficiaries, Baylor University and Southwestern Baptist Theological Seminary, and is governed by a board of trustees. It is unclear what, if any, change may occur to our Board, management, or corporate operating strategies as a result of ownership of our Class B common stock by the Foundation.
If and when the Foundation becomes the record holder of the Class B common stock, the first of two prongs of certain "change in control" provisions in the employment agreement of our President and Chief Executive Officer, Geoffrey Kolander, will be triggered. Under Mr. Kolander's employment agreement effective January 1, 2019, a "change in control" includes, among other things (1) the regulatory approval of the transfer of the Class B common stock from the Trust to any individual, entity or group, other than regulatory approval of a transaction wherein the Company is the first to repurchase the Class B common stock directly from the Trust or the Foundation and (2) the exercise of a power of attorney granted by Harold E. Riley over the Company's Class B common stock by the Trust or the Foundation. If Mr. Kolander terminates his employment for any reason, or his employment is terminated by the Company without cause, in each case, within eighteen (18) months of a change in control, Mr. Kolander would be entitled to receive certain cash payments and benefits.
Our articles of incorporation and bylaws, as well as applicable U.S. state insurance laws, may discourage takeovers and business combinations that our shareholders might consider to be in their best interests.
Our articles of incorporation and bylaws, as well as various state insurance laws, may delay, deter, render more difficult or prevent a takeover attempt our shareholders might consider in their best interests. As a result, our shareholders will be prevented from receiving the benefit from any premium to the market price of our Class A common stock that may be offered by a bidder in a takeover context. Even in the absence of a takeover attempt, the existence of these provisions may adversely affect the prevailing market price of our Class A common stock if they are viewed as discouraging takeover attempts in the future.
The following provisions in our articles of incorporation and bylaws make it difficult for our Class A shareholders to replace or remove our directors and have other anti-takeover effects that may delay, deter or prevent a takeover attempt:
|
•
|
holders of shares of our Class B common stock elect a simple majority of our Board, and all of these shares are held by the Trust until such time that the Foundation receives regulatory approval for acquisition of the Class B common stock and becomes holder of record; and
|
|
•
|
our Board may issue one or more series of preferred stock without the approval of our shareholders.
|
U.S. state insurance laws generally require prior approval of a change in control of an insurance company. Generally, such laws provide that control over an insurer is presumed to exist if any person, directly or indirectly, owns, controls, holds with the power to vote, or holds proxies representing 10% or more of the voting securities of the insurer. In considering an application to acquire control of an insurer, an insurance commissioner generally will consider such factors as the experience, competence and financial strength of the proposed acquirer, the integrity of the proposed acquirer's board of directors and executive officers, the proposed acquirer's plans for the management and operation of the insurer, and any anti-competitive results that may arise from the acquisition. In addition, a person seeking to acquire control of an insurance company is required in some states to make filings prior to completing an acquisition if the acquirer and the target insurance company and their affiliates have sufficiently large market shares in particular lines of insurance in those states. These state insurance requirements may delay, deter or prevent our ability to complete an acquisition.
December 31, 2019 | 10-K
22
Competition for employees is intense and the Company may not be able to attract and retain highly skilled people needed to support its business.
The Company’s operational success depends upon its ability to attract and retain qualified personnel. The market for qualified personnel is extremely competitive and loss of services of one or more of the Company’s key personnel could have a material adverse effect on the Company’s operations due to their skills, unique knowledge of our business, industry experience and the potential difficulty of finding qualified replacements. The Company's employees, other than the Chief Executive Officer, are not subject to employee contracts. Sales in our lines of business and our results of operations and financial condition could be materially adversely affected if the Company is unsuccessful in attracting and retaining qualified individuals or its recruiting and retention costs increase significantly.
Item 1B.
UNRESOLVED STAFF COMMENTS
None.
Item 2.
PROPERTIES
We lease our principal office in Austin, Texas to service all business entities and operations. We lease space for our office in Bermuda related to CICA Ltd. and in Louisiana, Arkansas and Mississippi related to our Home Service Insurance operations. We also own properties in Louisiana related to our Home Service Insurance operations and in Buchanan Dam, Texas used for our general business operations. On February 15, 2019, we sold an owned building located at 400 East Anderson Lane and a nearby property in Austin, Texas to a third-party. Following the sales, we no longer own any property in Austin. We have listed our property in Buchanan Dam for sale.
Item 3.
LEGAL PROCEEDINGS
There are no material pending legal proceedings in which we or any of our subsidiaries is a party or in which any of our or their property is the subject, except as set forth below.
On November 7, 2018, Citizens, CICA Ltd. and CICA filed a lawsuit in the District Court of Travis County, Texas (the “District Court”) against (i) Randall Riley (“Riley”), a former Citizens executive and son of Citizens’ founder Harold E. Riley, (ii) Citizens American Life, LLC and Citizens American Life, Inc. (collectively, “CALI”), copycat companies formed by Riley and (iii) Alexis Enrique Delgado, Carlos Nalsen Landa, Enrique Pinzon Ruiz, Johan Emilio Mikuski Silva and Esperanza Peralta de Delgado (collectively, the “Los Raudales Defendants,” and together with Riley and CALI, collectively the “Defendants”), former independent consultants of Citizens, for unfair competition, misappropriation of Citizens’ trade secrets, tortious interference with Citizens’ existing contracts with its independent consultants and, with respect to the Los Raudales Defendants, breach of their independent consultant contracts with Citizens. The lawsuit sought (i) a declaration that Citizens had grounds to terminate the Los Raudales Defendants for cause under the independent consultant contracts and the Los Raudales Defendants are not entitled to future commissions under such contracts, (ii) injunctive relief, (iii) damages and (iv) attorneys’ fees and costs. Among other things, the suit alleges that Riley formed CALI and misappropriated trade secrets during the time he was employed by Citizens, in violation of his contractual and other duties to Citizens, and that the Los Raudales defendants breached their independent consultant contracts with Citizens by inducing or attempting to induce other independent consultants to terminate or reduce service to Citizens and disclosing confidential information.
On January 25, 2019, the Defendants filed a motion to dismiss certain claims alleged in the suit, and on April 11, 2019, the District Court denied the Defendants’ motion in its entirety. On May 29, 2019, Citizens, CICA Ltd. and CICA filed a motion for a preliminary injunction to bar the Defendants from continuing to engage in unfair competition and misappropriation of Citizens’ trade secrets and tortious interference with Citizens’ existing contracts with its independent consultants. A hearing for the preliminary injunction was held on August 12, 2019. On August 13, 2019, the District Court denied the application for a temporary injunction, and on August 19, 2019, Citizens, CICA Ltd. and CICA filed a notice of appeal in the Third Court of Appeals in Austin, Texas with respect to the District Court’s August 13, 2019 decision. That interlocutory appeal remains pending.
On September 10, 2019, Citizens, CICA Ltd. and CICA filed an amended complaint and added additional defendants to the lawsuit, including (i) Michael P. Buchweitz, Jonathan M. Pollio, Jeffrey J. Wood and Steven A. Rekedal, former
December 31, 2019 | 10-K
23
Citizens executives and employees and, in the case of Steven A. Rekedal, a former Citizens independent consultant, (ii) First Trinity Financial Corporation, and Trinity American, Inc. (collectively, “First Trinity”) and International Marketing Group S.A., LLC, entities that have founded a business on the exploitation of Citizens’ trade secrets and goodwill, and (iii) Gregg E. Zahn, a First Trinity executive. The amended complaint asserted additional claims for breach of contract, conspiracy and unjust enrichment. The lawsuit is currently in discovery and is expected to proceed to trial in the fourth quarter of 2020.
While it is not possible at this time to predict with any degree of certainty the ultimate outcome of the appeal of the District Court’s denial of the preliminary injunction or this litigation, Citizens believes it has a basis for an injunctive relief and intends to vigorously pursue its action against the Defendants and seek appropriate compensation and any other remedies to which it may be entitled.
From time to time, we may be subject to other legal and regulatory actions relating to our business. We may incur defense costs, including attorneys' fees, and other direct litigation costs associated with defending any claims. If we suffer an adverse judgment as a result of litigation claims, it could have a material adverse effect on our business, results of operations and financial condition.
Item 4.
MINE SAFETY DISCLOSURES
Not applicable.
December 31, 2019 | 10-K
24
PART II
|
Item 5.
|
MARKET FOR REGISTRANT'S COMMON EQUITY, RELATED STOCKHOLDER MATTERS AND ISSUER PURCHASES OF EQUITY SECURITIES
|
Our Class A common stock is traded on the New York Stock Exchange ("NYSE") under the symbol CIA. All of our Class B common stock is owned by the Trust; therefore, there is no public trading market for our Class B common stock.
The number of stockholders of record as of
March 4, 2020
was as follows:
|
•
|
Class A Common Stock -
92,019
|
|
•
|
Class B Common Stock -
1
|
We have never paid cash dividends on our Class A or B common stock and do not expect to pay cash dividends in the foreseeable future, as it is our policy to retain earnings for use in the operation and expansion of our business.
We did not purchase any of our equity securities during
2017
,
2018
or
2019
.
SECURITIES AUTHORIZED FOR ISSUANCE UNDER EQUITY COMPENSATION PLANS
The following table sets forth information regarding securities authorized for issuance under our equity compensation plan, the Citizens, Inc. Omnibus Incentive Plan as of December 31,
2019
. See
Note 11. Stock Compensation
in the notes to our consolidated financial statements for additional information regarding our Omnibus Incentive Plan.
|
Plan Category
|
Number of securities to be issued upon exercise of outstanding options, warrants and rights
|
Weighted-average exercise price of outstanding options, warrants and rights
|
Number of securities remaining for future issuance under equity compensation plans
|
|||||||
|
Equity compensation plans approved by security holders
|
274,652
|
|
$
|
7.09
|
|
2,850,859
|
|
|||
|
Equity compensation plans not approved by security holders
|
—
|
|
—
|
|
—
|
|
||||
|
Total
|
274,652
|
|
$
|
7.09
|
|
2,850,859
|
|
|||
December 31, 2019 | 10-K
25
PERFORMANCE COMPARISON
The following graph compares the change in the Company’s cumulative total stockholder return on its Class A common stock over a five-year period. The following graph assumes a $100 investment on December 31,
2014
, and reinvestment of all dividends in each of the Company’s common stock, the NYSE Composite, the NASDAQ Insurance Index and major U.S.-based insurance companies within the industry. Note that historical stock price performance is not necessarily indicative of future stock price performance.
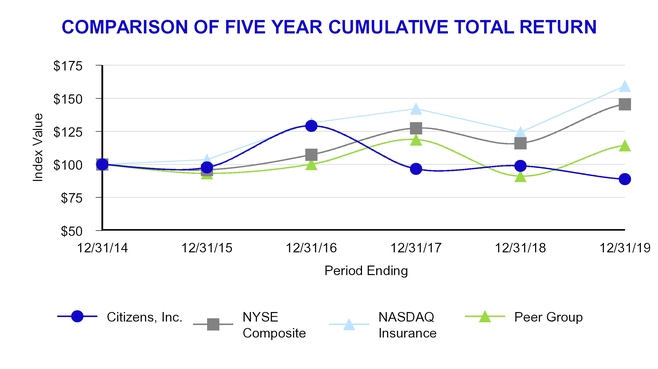
|
|
2014
|
2015
|
2016
|
2017
|
2018
|
2019
|
||||||||||||
|
Citizens, Inc.
|
$
|
100.00
|
|
97.76
|
|
129.21
|
|
96.71
|
|
98.95
|
|
88.82
|
|
|||||
|
NYSE Composite
|
$
|
100.00
|
|
95.91
|
|
107.36
|
|
127.46
|
|
116.06
|
|
145.66
|
|
|||||
|
NASDAQ Insurance
|
$
|
100.00
|
|
103.67
|
|
131.44
|
|
142.11
|
|
124.42
|
|
159.41
|
|
|||||
|
Peer Group
|
$
|
100.00
|
|
93.20
|
|
100.17
|
|
118.80
|
|
91.15
|
|
114.47
|
|
|||||
The peer group index weights individual company returns for stock market capitalization. The companies included in the peer group index are shown in the following table.
|
American Equity Investment Life Holding Co.
|
|
Atlantic American Corp.
|
|
Aviva Plc.
|
|
China Life Insurance Company Ltd.
|
|
Citizens, Inc.
|
|
Genworth Financial, Inc
|
|
Globe Life, Inc.
|
|
Independence Holding Co.
|
|
Kansas City Life Insurance Co.
|
|
Lincoln National Corp.
|
|
MetLife, Inc.
|
|
National Western Life Group, Inc.
|
|
Primerica, Inc.
|
|
Prudential Financial, Inc.
|
|
Prudential Plc
|
|
Reinsurance Group of America, Inc.
|
|
UTG, Inc.
|
December 31, 2019 | 10-K
26
Item 6.
SELECTED FINANCIAL DATA
The following table presents selected financial data of the Company. The information presented below is not necessarily indicative of results of future operations and should be read in conjunction with
Item 7. Management's Discussion and Analysis of Financial Condition and Results of Operations
and
Item 8. Financial Statements and Supplementary Data
of this Form 10-K to fully understand the factors that may affect the comparability of the information presented below.
|
Years ended December 31,
(In thousands, except per share data) |
2019
|
2018
|
2017
|
2016
|
2015
|
||||||||||
|
|
|||||||||||||||
|
Operating items
|
|
|
|
|
|
||||||||||
|
Insurance premiums
|
$
|
184,347
|
|
187,860
|
|
197,720
|
|
197,876
|
|
194,480
|
|
||||
|
Net investment income
|
59,531
|
|
54,205
|
|
53,146
|
|
48,560
|
|
45,782
|
|
|||||
|
Realized investment gains (losses)
|
5,249
|
|
108
|
|
518
|
|
(1,985
|
)
|
(5,459
|
)
|
|||||
|
Total revenues
|
250,545
|
|
244,006
|
|
252,627
|
|
245,406
|
|
236,268
|
|
|||||
|
Net income (loss) before federal income taxes
|
5,745
|
|
2,002
|
|
(2,986
|
)
|
5,483
|
|
(1,943
|
)
|
|||||
|
Net income (loss)
|
(1,370
|
)
|
(11,062
|
)
|
(38,127
|
)
|
1,969
|
|
(3,143
|
)
|
|||||
|
Balance sheet data
|
|||||||||||||||
|
Total assets
|
1,744,936
|
|
1,615,561
|
|
1,644,453
|
|
1,583,668
|
|
1,480,751
|
|
|||||
|
Total liabilities
|
1,485,100
|
|
1,427,828
|
|
1,420,940
|
|
1,334,568
|
|
1,233,825
|
|
|||||
|
Total stockholders' equity
|
259,836
|
|
187,733
|
|
223,513
|
|
249,100
|
|
246,926
|
|
|||||
|
Life insurance in force
|
4,246,781
|
|
4,350,538
|
|
4,469,735
|
|
4,497,735
|
|
4,478,202
|
|
|||||
|
Per share data
|
|
|
|
|
|
|
|
|
|
|
|||||
|
Book value per share
|
5.17
|
|
3.75
|
|
4.46
|
|
4.97
|
|
4.93
|
|
|||||
|
Basic and diluted income (loss) per Class A share
|
(0.03
|
)
|
(0.22
|
)
|
(0.77
|
)
|
0.04
|
|
(0.06
|
)
|
|||||
December 31, 2019 | 10-K
27
|
Item 7.
|
MANAGEMENT'S DISCUSSION AND ANALYSIS OF FINANCIAL CONDITION AND RESULTS OF OPERATIONS
|
This section and other parts of this Annual Report on Form 10-K (“Form 10-K”) contain forward-looking statements, within the meaning of the Private Securities Litigation Reform Act of 1995, that involve risks and uncertainties. Forward-looking statements provide current expectations of future events based on certain assumptions and include any statement that does not directly relate to any historical or current fact. Forward-looking statements can also be identified by words such as “future,” “anticipates,” “believes,” “estimates,” “expects,” “intends,” “plans,” “predicts,” “will,” “would,” “could,” “can,” “may,” and similar terms. Forward-looking statements are not guarantees of future performance and the Company’s actual results may differ significantly from the results discussed in the forward-looking statements. Factors that might cause such differences include, but are not limited to, those discussed in Part I, Item 1A of this Form 10-K under the heading “Risk Factors,” which are incorporated herein by reference. The following discussion should be read in conjunction with the consolidated financial statements and accompanying notes included in Part II, Item 8 of this Annual Report on Form 10-K. The Company assumes no obligation to revise or update any forward-looking statements for any reason, except as required by law.
This section of this Annual Report on Form 10-K generally discusses 2019 and 2018 items and year-to-year comparisons between 2019 and 2018. Discussions of 2017 items and year-to-year comparisons between 2018 and 2017 that are not included in this Form 10-K can be found in “Management’s Discussion and Analysis of Financial Condition and Results of Operations” in Part II, Item 7 of the Company’s Annual Report on Form 10-K for the fiscal year ended December 31, 2018.
OVERVIEW
We conduct operations as an insurance holding company emphasizing ordinary life insurance and endowment products in niche markets where we believe we can achieve competitive advantages. As an insurance provider, we collect premiums on an ongoing basis to pay future benefits to our policy and contract holders. Our core operations include issuing:
|
•
|
whole life insurance;
|
|
•
|
endowments;
|
|
•
|
final expense; and
|
|
•
|
limited liability property policies.
|
The Company derives its revenues principally from: (1) premiums earned for insurance coverages provided to insureds; (2) net investment income; and (3) net realized capital gains and losses.
Profitability of our insurance operations depends heavily upon the Company’s underwriting discipline, as we seek to manage exposure to loss through:
|
•
|
favorable risk selection and diversification;
|
|
•
|
management of claims;
|
|
•
|
use of reinsurance;
|
|
•
|
sizing of our in force block;
|
|
•
|
careful monitoring of our mortality and morbidity experience; and
|
|
•
|
management of our expense ratio, which we accomplish through economies of scale and management of acquisition costs and other underwriting expenses.
|
Pricing adequacy depends on a number of factors, including the ability to obtain regulatory approval for rate changes if applicable, proper evaluation of underwriting risks, the ability to project future losses based on historical loss experience adjusted for known trends, the Company’s response to competitors, and expectations about regulatory and legal developments and expense levels. The Company seeks to price our insurance policies such that insurance premiums and future net investment income earned on premiums received will cover underwriting expenses and the ultimate cost of paying claims reported on the policies and provide for a profit margin. The Company has the ability to adjust dividend scales and interest crediting rates at its discretion based on economic and other factors. The profitability
December 31, 2019 | 10-K
28
of fixed annuities, riders and other "spread-based" product features depends largely on the Company’s ability to earn target spreads between earned investment rates on assets and interest credited to policyholders.
The investment return, or yield, on invested assets is an important element of the Company’s earnings since insurance products are priced with the assumption that premiums received can be invested for a period of time before benefits are paid. Most of the Company’s invested assets have been held in fixed maturity available-for-sale securities, primarily in asset classes of corporate bonds, municipal bonds, and government obligation bonds. The interest rate environment has a significant impact on the determination of insurance contract liabilities, our investment rates and yields, and our asset/liability management.
The primary investment objective for the Company is to maximize economic value, consistent with acceptable risk parameters, including the management of credit risk and interest rate sensitivity of invested assets, while generating sufficient after-tax income to meet policyholder and corporate obligations. The Company maintains a prudent investment strategy that may vary based on a variety of factors including business needs, regulatory requirements and tax considerations.
We have previously reported that a portion of the life insurance policies issued by our subsidiary insurance companies failed to qualify for the favorable U.S. federal income tax treatment afforded by Sections 7702 and 72(s) of the Internal Revenue Code ("IRC") of 1986. Further, we have determined that the structure of our policies sold to non-U.S. persons, which were novated to CICA Ltd. effective July 1, 2018, may have inadvertently generated U.S. source income over time, which caused tax withholding and information reporting requirements for the Company under Chapters 3 and 4 of the IRC. We have incurred significant costs in the evaluation process of this issue as we have engaged legal, tax and actuarial consultants to assist us in this review and remediation. In December 2019, the Company submitted corrected withholding tax returns to the IRS in order to establish the tax liability amount for failing to withhold tax and report the U.S. source income generated by the novated policies
.
With the continued uncertainty that remains
,
including the acceptance of the submitted withholding tax returns, IRS review of our submission, and future negotiations
,
our estimated liability as of December 31, 2019 was approximately $10.0 million, after tax, related to projected agreement with the IRS
.
The probability weighted range of financial estimates relative to this issue is $7.4 million to $52.5 million, net of tax. The amount of our liabilities and expenses depends on a number of uncertainties, including the number of prior tax years for which we may be liable to the IRS, the number of domestic life insurance policies we will be required to remediate, the methodology applicable to the calculation of taxable benefits under non-compliant policies and the amount of time and resources we will require from external advisors who are assisting us with resolving these issues. Given the range of potential outcomes and the significant variables assumed in establishing our estimates, actual amounts incurred may exceed our reserve and also could exceed the high end of our estimated range of liabilities and expenses.
On May 17, 2017, we submitted an offer to enter into Closing Agreements with the IRS covering certain CICA and CNLIC domestic life insurance policies (the "Closing Agreements"), which was accepted by the IRS on June 7, 2019. Pursuant to the Closing Agreements, CICA and CNLIC agreed to pay the IRS $123,779 and $4,118, respectively, by August 6, 2019, and follow the corrective steps for the policies outlined in the Closing Agreements by September 5, 2019. These payments were made to the IRS on July 12, 2019.
See
Note 7. Commitments and Contingencies
in the notes to our consolidated financial statements for more information.
CURRENT FINANCIAL HIGHLIGHTS
|
•
|
Our total assets
grew
8.0%
, or
$129 million
, from
2018
to
2019
and totaled
$1.7 billion
as of
December 31, 2019
.
|
|
•
|
Total stockholders' equity
increased
38.4%
from
$187.7 million
at
December 31, 2018
, to
$259.8 million
at
December 31, 2019
primarily due to a change in net unrealized gains on available-for-sale securities after taxes of
$71.8 million
in
2019
as market interest rates decreased from
2018
levels.
|
|
•
|
Insurance premiums
declined
1.9%
in
2019
compared to
2018
, totaling
$184.3 million
and
$187.9 million
, respectively. The decline was driven by fewer renewal premiums in our Life Insurance segment, partially offset by an increase in first year premiums in that segment as we realized growth in 2019 following investment in our sales and marketing activities and increased sales of higher average premium policies. First year premiums in our Life Insurance segment increased
2.1%
in
2019
compared
|
December 31, 2019 | 10-K
29
to
2018
. Insurance premiums declined
6.3%
in
2018
compared to
2017
, driven by fewer renewal and first year premiums in our Life Insurance segment.
|
•
|
Net investment income increased
9.8%
in
2019
compared to
2018
, totaling
$59.5 million
and
$54.2 million
, respectively. The increase was driven by a growing asset base derived from cash flows from our insurance operations, improvements in cash management, and a strategic focus on achieving greater yields while maintaining a prudent risk profile for our investment portfolio. The average yield on the consolidated investment portfolio was an annualized rate of
4.36%
for
2019
compared to
4.17%
for
2018
.
|
|
•
|
A realized gain of $2.0 million was recorded during 2019 related to the redemption of two fixed maturity securities by the issuers at a price above par. An impairment loss of
$3.1 million
was recorded during the second quarter of 2019 in our Other Non-Insurance Enterprises segment related to our Citizens Academy training facility located near Austin, Texas. This investment was reclassified from real estate held for investment to held for sale. Additionally, a realized gain of $5.5 million was recorded in the first quarter of 2019 related to the sale of our former corporate headquarters in Austin, Texas.
|
|
•
|
Claims and surrenders expense
increased
17.3%
for
2019
compared to
2018
and increased
9.9%
for
2018
compared to
2017
. For both periods, these increases were primarily due to an increase in surrender benefits and matured endowments in the Life Insurance segment, which were within expected levels.
|
|
•
|
The change in future policy benefit reserves
decreased
13.0%
in
2019
compared to
2018
and
36.9%
in
2018
compared to
2017
. The conversion to a new actuarial valuation system impacted the change in reserves in both years. The conversion resulted in a decrease in future policy benefit reserves of $11.9 million in 2018 and $2.4 million in 2019. Changes in surrender and maturity activity also impacted this line item in both periods.
|
|
•
|
General expenses
increased
1.7%
in
2019
compared to
2018
, driven primarily by increased costs relating to higher long-term incentive compensation offsetting reduced audit fees. In addition, general expenses decreased by $2.2 million in 2018 compared to 2017, primarily due to a change in our tax compliance best estimate liability from the estimate at year end 2017.
|
|
•
|
Capitalization of deferred policy acquisition costs decreased
1.9%
in
2019
compared to
2018
and
22.1%
in
2018
compared to
2017
. These capitalized costs are directly related to first year premium production and we experienced declines in first year premiums of
0.7%
in
2019
and
25.7%
in
2018
. Amortization of deferred policy acquisition costs
decreased
17.4%
in
2019
compared to
2018
and
increased
15.3%
in
2018
compared to
2017
. The conversion to a new actuarial valuation system increased amortization costs in
2018
by $3.7 million.
|
Life Insurance.
For almost forty years, CICA and its predecessors had accepted policy applications from foreign nationals for U.S. dollar-denominated ordinary whole life insurance and endowment policies. We completed a novation of all of the international policies issued by CICA to CICA Ltd., effective July 1, 2018. We make our insurance products available using third-party marketing organizations and independent marketing consultants.
Endowment product sales have been the primary driver of sales in this segment. The Company has noted that the twenty year endowment is our top selling product, followed by an endowment product that matures at age sixty-five. The Company repriced its top six selling international products as of the beginning of 2017 and introduced minimum guaranteed rates and current crediting rates in these products to allow for adjustments relative to market interest rates as needed.
Through the domestic market of our Life Insurance segment, we collect renewal premiums on ordinary whole life, credit life insurance, and final expense policies issued to middle and lower income families and individuals in certain markets in the mountain west, midwest and southern U.S. We stopped issuing new domestic ordinary whole life and endowment life insurance policies in 2017. The majority of our domestic revenues are generated by the policies of domestic life insurance companies we have acquired since 1987.
Home Service Insurance.
We provide final expense ordinary and industrial life insurance to middle and lower income individuals in Louisiana, Mississippi and Arkansas. Our policies in this segment are sold and serviced through a home service marketing distribution system utilizing employee-agents who work on a route system to collect premiums and service policyholders, and through networks of funeral homes that collect premiums and provide personal policyholder service.
December 31, 2019 | 10-K
30
ECONOMIC AND INSURANCE INDUSTRY DEVELOPMENTS
Significant economic issues impacting our business and industry currently and into the future are discussed below.
|
•
|
The low interest rate environment continues to limit increases in profit margins for insurers. We have been impacted by the historically low interest rate environment over the past several years as our fixed maturity investment portfolio, primarily invested in callable securities, has generally been reinvested at lower yields. Although the Company’s prudent investment strategy has not changed, the Company has made new investments in securities of state, municipalities, essential services and corporate issuers as well as focused on identifying investment opportunities in other asset classes such as private equity to increase our yields while maintaining a prudent risk profile for our overall portfolio. Our investment earnings also impact the reserve and deferred policy acquisition costs ("DAC") balances, as assumptions are used in the development of the balances.
|
|
•
|
As an increasing percentage of the world population reaches retirement age, we believe we will benefit from increased demand for living benefit products rather than death benefit products, as customers will require cash accumulation to pay expenses to meet their lifetime income needs. Our ordinary life products are designed to accumulate cash values to provide for living expenses in a policy owner's later years, while continuously providing a death benefit.
|
|
•
|
Many of the events and trends affecting the life insurance industry have had an impact on the life reinsurance industry. These events have led to a decline in the availability of reinsurance. While we currently cede a limited amount of our primary insurance business to reinsurers, we may find it difficult to obtain reinsurance in the future, forcing us to seek reinsurers who are more expensive to us. If we cannot obtain affordable reinsurance coverage, either our net exposures will increase or we will have to reduce our underwriting commitments.
|
|
•
|
Innovation and digital development strategies will be implemented in various industries including the insurance industry in the coming years which could significantly impact our business. It will be critical that we embrace these changes for the benefit of our policyholders, agents and stockholders.
|
|
•
|
While our management has extensive experience in writing life insurance policies for foreign residents, changes to foreign laws and regulations and their related application and enforcement, along with currency controls affecting our foreign resident insureds, could adversely impact our revenues, results of operations and financial condition.
|
CONSOLIDATED RESULTS OF OPERATIONS
A discussion of consolidated results is presented below, followed by a discussion of segment operations and financial results by segment.
December 31, 2019 | 10-K
31
REVENUES
Insurance revenues are primarily generated from premium revenues and investment income. In addition, realized gains and losses on investment holdings can significantly impact revenues from year to year.
|
Years ended December 31,
(In thousands) |
2019
|
2018
|
2017
|
||||||
|
Revenues:
|
|
|
|
||||||
|
Premiums:
|
|
|
|
||||||
|
Life insurance
|
$
|
178,351
|
|
181,825
|
|
191,342
|
|
||
|
Accident and health insurance
|
1,383
|
|
1,218
|
|
1,392
|
|
|||
|
Property insurance
|
4,613
|
|
4,817
|
|
4,986
|
|
|||
|
Net investment income
|
59,531
|
|
54,205
|
|
53,146
|
|
|||
|
Realized investment gains
|
5,249
|
|
108
|
|
518
|
|
|||
|
Other income
|
1,418
|
|
1,833
|
|
1,243
|
|
|||
|
Total revenues
|
$
|
250,545
|
|
244,006
|
|
252,627
|
|
||
Premium Income.
Premium income derived from life, accident and health, and property insurance sales
decreased
1.9%
during
2019
compared to
2018
and
decreased
5.0%
during
2018
compared to
2017
. The decrease in 2019 was driven primarily by a decline in renewal premiums in our Life insurance segment and was partially offset by an increase in first year premiums in that segment. The decrease in 2018 was primarily due to a decline in first year and renewal premiums in our Life insurance segment. See details on the distribution of premiums below and further discussion within Segment Operations.
|
Years ended December 31,
(In thousands) |
2019
|
2018
|
2017
|
||||||
|
Premiums:
|
|
|
|
||||||
|
First year
|
$
|
17,508
|
|
17,639
|
|
23,726
|
|
||
|
Renewal
|
166,839
|
|
170,221
|
|
173,994
|
|
|||
|
Total premiums
|
$
|
184,347
|
|
187,860
|
|
197,720
|
|
||
Endowment sales represent a significant portion of new business sales internationally with the 20-year endowment and endowment to age 65 representing our top products. In addition, most of our life insurance policies contain a policy loan provision, which allows the policyholder to use cash value within a policy to pay premiums. The policy loan asset balance
increased
1.5%
in
2019
and
9.6%
in
2018
and remains in line with historical levels when compared to policy benefit liabilities.
Net Investment Income.
Net investment income increased
9.8%
to
$59.5 million
in
2019
compared to
$54.2 million
in
2018
, despite a decline in overall market yields. The annualized yield increased by nineteen basis points in
2019
compared to
2018
. We have been successful in achieving higher yields while maintaining a prudent risk profile for our portfolio in
2019
despite facing an increasingly challenging investment environment. During the fourth quarter of 2018, we repositioned our portfolio into more diversified holdings and maturities as part of our investment management strategy to improve our portfolio credit quality. In doing so, we increased our purchases of investment grade securities while reducing our municipal holdings. While these purchases improved the overall credit rating of our portfolio, these securities generally have lower yields. In addition, net investment income and the annualized yield on our portfolio were lower during 2018 due to the need to maintain sufficient cash balances to fund our Bermuda novation as previously noted.
December 31, 2019 | 10-K
32
Net investment income performance is summarized as follows.
|
Years ended December 31,
(In thousands, except for %) |
2019
|
2018
|
2017
|
||||||
|
Net investment income
|
$
|
59,531
|
|
54,205
|
|
53,146
|
|
||
|
Average invested assets, at amortized cost
|
1,365,036
|
|
1,300,755
|
|
1,233,580
|
|
|||
|
Yield on average invested assets
|
4.36
|
%
|
4.17
|
%
|
4.31
|
%
|
|||
We have traditionally invested in fixed maturity securities with a large percentage held in callable issues. In the latter part of 2018, we began a process of repositioning our portfolio into more diversified holdings and maturities as part of our investment management strategy. The sustained low interest rate environment of the past several years has required that we manage a challenging balance of continuing to invest in quality issuers, while attempting to increase our portfolio yield. As part of the ongoing process of managing our portfolio and optimizing performance, we are continuing to identify and consider new asset classes.
Investment income from fixed maturity securities accounted for approximately
87.8%
of total investment income for the year ended
December 31, 2019
as compared to
87.0%
for
2018
.
|
Years ended December 31,
(In thousands) |
2019
|
2018
|
2017
|
||||||
|
Gross investment income:
|
|
|
|
||||||
|
Fixed maturity securities
|
$
|
53,860
|
|
49,126
|
|
48,164
|
|
||
|
Equity securities
|
662
|
|
722
|
|
708
|
|
|||
|
Policy loans
|
6,451
|
|
6,210
|
|
5,735
|
|
|||
|
Long-term investments
|
13
|
|
15
|
|
87
|
|
|||
|
Other
|
374
|
|
409
|
|
68
|
|
|||
|
Total investment income
|
61,360
|
|
56,482
|
|
54,762
|
|
|||
|
Less investment expenses
|
(1,829
|
)
|
(2,277
|
)
|
(1,616
|
)
|
|||
|
Net investment income
|
$
|
59,531
|
|
54,205
|
|
53,146
|
|
||
Investment income from fixed maturity securities increased
9.6%
in
2019
and
2.0%
in
2018
. We continue to adjust our investment management strategy to increase our investment yields while maintaining a prudent risk profile. In addition, the increase in the policy loans asset balance, which represents policyholders utilizing their accumulated policy cash value to pay for premiums, contributed to the increase in investment income for
2019
.
December 31, 2019 | 10-K
33
Realized Gains (Losses) on Investments.
Realized investment gains and losses are as follows:
|
Years ended December 31,
(In thousands) |
2019
|
2018
|
2017
|
||||||
|
Realized investment gains (losses):
|
|
|
|
||||||
|
Sales, calls and maturities:
|
|
|
|
||||||
|
Fixed maturities
|
$
|
1,927
|
|
1,792
|
|
(506
|
)
|
||
|
Equity securities
|
—
|
|
—
|
|
121
|
|
|||
|
Real estate
|
5,513
|
|
—
|
|
1,110
|
|
|||
|
Property and equipment
|
(48
|
)
|
(80
|
)
|
—
|
|
|||
|
Realized investment gains
|
7,392
|
|
1,712
|
|
725
|
|
|||
|
Change in fair value of equity securities
|
962
|
|
(828
|
)
|
—
|
|
|||
|
Other-than-temporary impairments ("OTTI"):
|
|
|
|
|
|
|
|||
|
Fixed maturities
|
—
|
|
(776
|
)
|
—
|
|
|||
|
Equity securities
|
—
|
|
—
|
|
(207
|
)
|
|||
|
Real estate held for sale
|
(3,105
|
)
|
—
|
|
—
|
|
|||
|
Realized losses on OTTI
|
(3,105
|
)
|
(776
|
)
|
(207
|
)
|
|||
|
Net realized investment gains
|
$
|
5,249
|
|
108
|
|
518
|
|
||
In
2019
, we recognized a gain of
$1.9 million
related to the redemption of two fixed maturity securities. We also recorded a realized gain of $5.5 million relating to the sale of our former corporate headquarters. In addition, we recorded realized gains of
$1.0 million
during
2019
related to fair value changes in our equity securities owned at December 31,
2019
. Finally, an impairment loss of
$3.1 million
was recorded in connection with classifying our Citizens Academy training facility located near Austin, Texas as real estate held for sale. In 2018, realized gains of
$1.8 million
and realized losses of
$0.8 million
were recorded related to our fixed maturity and equity portfolios, respectively, along with investment losses recorded from OTTI of
$0.8 million
relating to fixed maturity securities that we did not intend to hold until recovery in value.
BENEFITS AND EXPENSES
|
Years ended December 31,
(In thousands) |
2019
|
2018
|
2017
|
||||||
|
Benefits and expenses:
|
|
|
|
||||||
|
Insurance benefits paid or provided:
|
|
|
|
||||||
|
Claims and surrenders
|
$
|
106,827
|
|
91,103
|
|
82,905
|
|
||
|
Increase in future policy benefit reserves
|
41,712
|
|
47,947
|
|
76,029
|
|
|||
|
Policyholders' dividends
|
6,040
|
|
6,362
|
|
6,268
|
|
|||
|
Total insurance benefits paid or provided
|
154,579
|
|
145,412
|
|
165,202
|
|
|||
|
Commissions
|
34,222
|
|
34,962
|
|
41,324
|
|
|||
|
Other general expenses
|
48,440
|
|
47,632
|
|
46,388
|
|
|||
|
Capitalization of deferred policy acquisition costs
|
(22,255
|
)
|
(22,695
|
)
|
(29,120
|
)
|
|||
|
Amortization of deferred policy acquisition costs
|
28,268
|
|
34,235
|
|
29,690
|
|
|||
|
Amortization of cost of insurance acquired
|
1,546
|
|
2,458
|
|
2,129
|
|
|||
|
Total benefits and expenses
|
$
|
244,800
|
|
242,004
|
|
255,613
|
|
||
December 31, 2019 | 10-K
34
Claims and Surrenders.
As noted in the table below, claims and surrenders
increased
17.3%
from
$91.1 million
in
2018
to
$106.8 million
in
2019
.

|
Years ended December 31,
(In thousands) |
2019
|
2018
|
2017
|
||||||
|
Claims and Surrenders:
|
|||||||||
|
Death claims
|
$
|
25,100
|
|
22,598
|
|
22,773
|
|
||
|
Surrender expenses
|
49,293
|
|
41,176
|
|
37,192
|
|
|||
|
Endowment benefits
|
12,247
|
|
13,341
|
|
15,134
|
|
|||
|
Matured endowments
|
15,147
|
|
9,088
|
|
2,882
|
|
|||
|
Property claims
|
1,563
|
|
1,648
|
|
1,744
|
|
|||
|
Accident and health benefits
|
232
|
|
260
|
|
310
|
|
|||
|
Other policy benefits
|
3,245
|
|
2,992
|
|
2,870
|
|
|||
|
Total claims and surrenders
|
$
|
106,827
|
|
91,103
|
|
82,905
|
|
||
|
•
|
Death claims
increased
11.1%
in
2019
and
declined
0.8%
in
2018
. The increase in
2019
was driven primarily by higher average paid death benefit amounts. The Company monitors death claims based upon expectations, and we reinsure for losses in excess of a threshold level. These values may routinely fluctuate from year to year.
|
|
•
|
Policy surrenders increased
19.7%
in
2019
and
10.7%
in
2018
. Surrenders represented less than
1.0%
of total direct ordinary whole life insurance in force of
$4.7 billion
as of December 31,
2019
. The increase in surrender expense is primarily related to our international business. A significant portion of surrenders relates to policies that have been in force over fifteen years and no longer have associated surrender charges.
|
|
•
|
Matured endowments increased
66.7%
in
2019
after tripling in 2018. These increases were anticipated based upon the dates of when our policy endowment contracts were sold and their expected maturities as set forth in their contracts.
|
Increase in Future Policy Benefit Reserves.
The change in future policy benefit reserves
decreased
13.0%
in
2019
and
36.9%
in
2018
. For both years, the decline was due in part to changes in actuarial valuation estimates associated with the conversion to the new actuarial valuation system. These changes resulted in a decrease in reserves of $2.4 million in 2019 and $11.9 million in 2018. The remaining changes in future policy benefit reserves were largely driven by policyholder activity (e.g. premiums, surrenders, etc.). See
Note 1. Summary of Accounting Policies
in the notes
December 31, 2019 | 10-K
35
to our consolidated financial statements for a discussion of the conversion to our new actuarial system and the impact on our reserves.
Policyholder Dividends.
The Company issues long duration participating policies in our Life Insurance segment to foreign residents that are expected to pay dividends based upon actual experience. Initially, policyholder dividend scales are factored into the guaranteed premiums at the time the product is developed, based on expected future experience and desired profit goals. As actual and expected experience develops over time, it can become necessary to adjust dividends in order to maintain long term product profitability. Policyholders' dividends have remained relatively stable at
$6.0 million
,
$6.4 million
and
$6.3 million
in
2019
,
2018
, and
2017
, respectively.
Commissions.
Commission expense for
2019
and
2018
fluctuated directly in relation to the decrease in first year and renewal premiums in both years.
Other General Expenses.
Total general expenses
increased
1.7%
in
2019
compared to
2018
due primarily to higher long-term incentive compensation expenses in 2019, partially offset by reduced audit fees. General expenses
increased
2.7%
in
2018
, due primarily to additional audit fees related to the 2017 audit, higher legal and consulting fees and higher salaries, partially offset by a decrease in our tax compliance best estimate liability.
We perform an expense study on an annual basis, utilizing an enterprise-wide time study, and we adjust cost allocations among entities as needed based upon this review. Any allocation changes are reflected in the segment operations, but do not impact total expenses.
Capitalization of DAC.
Capitalized DAC was
$22.3 million
,
$22.7 million
and
$29.1 million
in
2019
,
2018
and
2017
, respectively. Decreases in capitalized amounts are in line with the decreases noted in sales activity. These costs will vary based upon successful efforts related to newly issued policies and renewal business. Significantly lower amounts are capitalized related to renewal business in correlation with the lower commissions paid on that business compared to first year business which has higher commission rates.
Amortization of DAC.
Amortization of DAC totaled
$28.3 million
,
$34.2 million
and
$29.7 million
in
2019
,
2018
and
2017
, respectively. Year over year changes resulted primarily from the new actuarial system conversion increasing amortization by $3.7 million in 2018 and higher surrender activity, including early duration elections to convert existing policies to reduced paid up ("RPU") or extended term insurance ("ETI") status in
2019
and
2018
. There is higher DAC associated with early duration conversions to RPU or ETI, which increases amortization expense. Amortization of DAC is also impacted by persistency and the level of surrenders.
Amortization of Cost of Insurance Acquired ("COIA").
Amortization of COIA
decreased
in
2019
compared to
2018
due primarily to an update in our Home Service Insurance segment expected earned rate assumptions used within annuity models that resulted in a write-down of approximately
$0.7 million
in 2018.
Federal Income Tax.
Federal income tax expense was
$7.1 million
,
$13.1 million
and
$35.1 million
in
2019
,
2018
and
2017
, respectively, resulting in effective tax rates of
126.0%
,
652.6%
and
(1,176.9)%
, respectively. Subsequent to the novation, the operations of CICA Ltd. are subject to Subpart F of the IRC and, therefore, is included in Citizens taxable income. The Subpart F income inclusion generated $18.4 million of federal income tax expense in 2018 which was largely driven by the impact of the novation transaction, as compared to $5.9 million in 2019. The increase in tax from Subpart F income was partially offset in 2018 and 2019 by foreign income tax rate differential of $8.1 million and $1.6 million, respectively. The significant change in effective tax rate noted in
2017
is the result of the Tax Cuts and Jobs Act of 2017 (the "Tax Act") enacted at the end of
2017
which resulted in $35.7 million of income tax due to the remeasurement of deferred tax assets. Differences between our effective tax rate and the statutory tax rate result from income and expense items that are treated differently for financial reporting and tax purposes. Refer to
Note 9. Income Taxes
in the notes to our consolidated financial statements for further discussion.
December 31, 2019 | 10-K
36
SEGMENT OPERATIONS
Our business is comprised of two operating business segments, as detailed below.
|
•
|
Life Insurance
|
|
•
|
Home Service Insurance
|
Our insurance operations are the primary focus of the Company, as those operations generate most of our income. The amount of insurance, number of policies issued, and average face amounts of policies issued during the periods indicated are shown below.
|
Years Ended December 31,
|
2019
|
2018
|
|||||||||||||||||||
|
|
Amount of
Insurance
Issued
|
Number of
Policies
Issued
|
Average Policy Face Amount Issued
|
Amount of
Insurance
Issued
|
Number of
Policies
Issued
|
Average Policy Face Amount Issued
|
|||||||||||||||
|
Life Insurance
|
$
|
233,503,780
|
|
3,456
|
|
$
|
67,565
|
|
$
|
231,142,212
|
|
3,786
|
|
$
|
61,052
|
|
|||||
|
Home Service Insurance
|
158,758,921
|
|
22,148
|
|
7,168
|
|
171,188,227
|
|
24,308
|
|
7,042
|
|
|||||||||
The number of policies issued decreased
8.7%
and
8.9%
for the Life Insurance and Home Service Insurance segments in
2019
and
2018
, respectively. The decline in the number of new business applications in our Life Insurance segment is driven by ceasing sales in Brazil and terminating agreements with several independent consultants in Latin America who did not align with our vision, values and culture. Excluding these two factors, the number of policies issued by our international business increased during 2018 and 2019 as we invested heavily in our sales and marketing activities and achieved better alignment with our independent consultants on vision, value and strategy. While the number of policies issued has declined in the Life Insurance and Home Service Insurance segments during 2019, the average face amount issued has increased, resulting in overall premium income not declining at the same rate as policy issuances.
These segments are reported in accordance with U.S. GAAP. The Company evaluates profit and loss performance based on net income before federal income taxes.
|
Years ended December 31,
(In thousands) |
2019
|
2018
|
2017
|
||||||
|
Income (Loss) Before Federal Income Taxes:
|
|||||||||
|
Segments:
|
|||||||||
|
Life Insurance
|
$
|
11,795
|
|
12,085
|
|
5,394
|
|
||
|
Home Service Insurance
|
1,181
|
|
(2,496
|
)
|
(5,599
|
)
|
|||
|
Total Segments
|
12,976
|
|
9,589
|
|
(205
|
)
|
|||
|
Other Non-Insurance Enterprises
|
(7,231
|
)
|
(7,587
|
)
|
(2,781
|
)
|
|||
|
Total income (loss) before federal income taxes
|
$
|
5,745
|
|
2,002
|
|
(2,986
|
)
|
||
December 31, 2019 | 10-K
37
LIFE INSURANCE
Our Life Insurance segment primarily issues ordinary whole life insurance and endowment policies in U.S. dollar-denominated amounts to foreign residents in more than
20
countries through approximately
1,000
independent marketing consultants.
|
Years ended December 31,
(In thousands) |
2019
|
2018
|
2017
|
||||||
|
Revenue:
|
|
|
|
||||||
|
Premiums
|
$
|
137,666
|
|
141,146
|
|
150,708
|
|
||
|
Net investment income
|
44,779
|
|
39,985
|
|
38,578
|
|
|||
|
Realized investment gains (losses), net
|
6,795
|
|
358
|
|
(461
|
)
|
|||
|
Other income
|
1,412
|
|
1,833
|
|
1,061
|
|
|||
|
Total revenue
|
190,652
|
|
183,322
|
|
189,886
|
|
|||
|
Benefits and expenses:
|
|
|
|
|
|
|
|||
|
Insurance benefits paid or provided:
|
|
|
|
|
|
|
|||
|
Claims and surrenders
|
82,964
|
|
69,149
|
|
60,393
|
|
|||
|
Increase in future policy benefit reserves
|
39,873
|
|
43,671
|
|
70,783
|
|
|||
|
Policyholders' dividends
|
6,004
|
|
6,316
|
|
6,226
|
|
|||
|
Total insurance benefits paid or provided
|
128,841
|
|
119,136
|
|
137,402
|
|
|||
|
Commissions
|
20,128
|
|
20,079
|
|
25,760
|
|
|||
|
Other general expenses
|
23,012
|
|
18,718
|
|
18,597
|
|
|||
|
Capitalization of deferred policy acquisition costs
|
(17,448
|
)
|
(17,194
|
)
|
(23,157
|
)
|
|||
|
Amortization of deferred policy acquisition costs
|
23,832
|
|
29,915
|
|
25,295
|
|
|||
|
Amortization of cost of insurance acquired
|
492
|
|
583
|
|
595
|
|
|||
|
Total benefits and expenses
|
178,857
|
|
171,237
|
|
184,492
|
|
|||
|
Income before income tax expense
|
$
|
11,795
|
|
12,085
|
|
5,394
|
|
||
Premiums.
Premium revenues decreased by
2.5%
in
2019
compared to
2018
as first year premiums increased
2.1%
, while renewal premiums declined by
2.9%
. We have invested heavily in our sales and marketing activities in 2019 and achieved better alignment with our independent consultants on vision, value, and strategy. The increase in first year premiums is also partly due to the Company's focus on selling higher average premium policies. Since the first quarter of 2019, we have experienced progressive improvement in our new business production for our international business. For 2018, premiums decreased
6.3%
as we experienced declines in both first year and renewal premiums.
Life Insurance premium breakout is detailed below.
|
Years ended December 31,
(In thousands) |
2019
|
2018
|
2017
|
||||||
|
Premiums:
|
|
|
|
||||||
|
First year
|
$
|
11,692
|
|
11,451
|
|
17,403
|
|
||
|
Renewal
|
125,974
|
|
129,695
|
|
133,305
|
|
|||
|
Total premium
|
$
|
137,666
|
|
141,146
|
|
150,708
|
|
||
The Company has taken actions over the past few years to pursue long-term stability that may have negatively impacted sales levels, including reducing discretionary dividends on existing international policies in response to the sustained low interest environment. In addition, in 2017, the Company introduced a set of repriced products in response to the continued low interest rate environment. These measures resulted in more expensive policies for our customers and
December 31, 2019 | 10-K
38
likely negatively impacted our new sales. Also, in April 2018, in connection with the review of our international business model, we discontinued accepting new life insurance applications from Brazilian citizens or residents. Brazil had been one of our top premium-producing countries in our international life insurance business for the past several years. Finally, Venezuela, which has historically been one of our more critical markets, has experienced prolonged economic and social turmoil, which has negatively impacted our sales in the country, decreasing approximately 10% in both
2019
and
2018
.
Endowment sales represent a significant portion of our new business sales internationally and totaled approximately
$9.3 million
,
$10.4 million
and
$13.3 million
, representing approximately
79.5%
,
90.8%
and
76.4%
of total first year premiums in
2019
,
2018
, and
2017
, respectively.
Most of our life insurance policies contain a policy loan provision, which allows the policyholder to use the accumulated cash value of a policy to pay premiums. These accumulated cash values can also be taken as a cash loan from the policy at the request of the policyholder and are secured by the policy values. The policy loan asset balance increased
1.3%
from
2018
to
2019
and remains at the same approximate ratio to life reserves as noted in prior years.
The following table sets forth, by country, our direct premiums from our international life insurance business for the periods indicated.
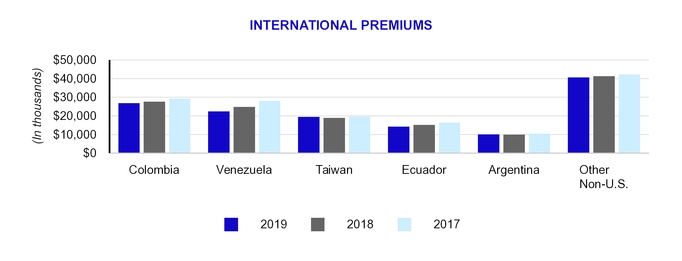
|
Years ended December 31,
(In thousands, except for %) |
2019
|
2018
|
2017
|
|||||||||||||||||
|
Country:
|
|
|
|
|
|
|
||||||||||||||
|
Colombia
|
$
|
26,768
|
|
20.1
|
%
|
$
|
27,605
|
|
20.0
|
%
|
$
|
29,200
|
|
20.0
|
%
|
|||||
|
Venezuela
|
22,353
|
|
16.8
|
|
24,783
|
|
18.0
|
|
27,997
|
|
19.2
|
|
||||||||
|
Taiwan
|
19,403
|
|
14.6
|
|
18,888
|
|
13.7
|
|
19,535
|
|
13.4
|
|
||||||||
|
Ecuador
|
14,198
|
|
10.6
|
|
15,187
|
|
11.0
|
|
16,440
|
|
11.3
|
|
||||||||
|
Argentina
|
10,069
|
|
7.6
|
|
9,953
|
|
7.2
|
|
10,534
|
|
7.2
|
|
||||||||
|
Other Non-U.S.
|
40,562
|
|
30.3
|
|
41,309
|
|
30.1
|
|
42,268
|
|
28.9
|
|
||||||||
|
Total
|
$
|
133,353
|
|
100.0
|
%
|
$
|
137,725
|
|
100.0
|
%
|
$
|
145,974
|
|
100.0
|
%
|
|||||
Sales from
Colombia
,
Venezuela
and
Taiwan
represented the majority of the new business premiums in
2019
,
2018
and
2017
. Overall, three of our top five countries listed above experienced a decline in premium levels from
2018
to
2019
, with Venezuela leading the decline. While overall premiums declined in 2019 compared to 2018 due to a decrease in renewal premiums, first year premiums increased during the period. Our international business and premiums could be impacted by our inability to comply with current or future foreign laws or regulations applicable to the Company or our independent consultants in the countries where we accept applications. In addition, marketing or operational changes made by the Company to comply with those laws or regulations may adversely impact our
December 31, 2019 | 10-K
39
financial performance. Our international business may also be affected by our ongoing strategic review of our business model and by economic or other events in foreign countries in which our policies are marketed.
The following table sets forth our direct premiums by state from our domestic business for the periods indicated.
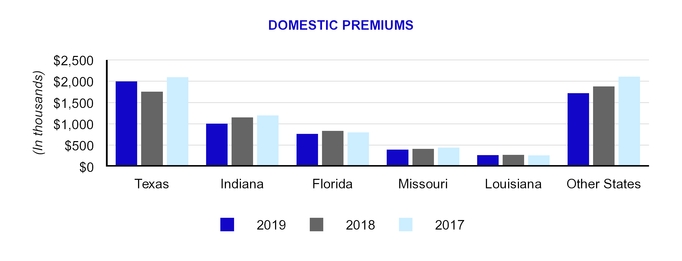
|
Years ended December 31,
(In thousands, except for %) |
2019
|
2018
|
2017
|
|||||||||||||||||
|
State
|
|
|
|
|
|
|
||||||||||||||
|
Texas
|
$
|
1,994
|
|
32.4
|
%
|
$
|
1,753
|
|
27.8
|
%
|
$
|
2,096
|
|
30.3
|
%
|
|||||
|
Indiana
|
1,008
|
|
16.4
|
|
1,150
|
|
18.2
|
|
1,198
|
|
17.3
|
|
||||||||
|
Florida
|
768
|
|
12.5
|
|
834
|
|
13.2
|
|
802
|
|
11.6
|
|
||||||||
|
Missouri
|
395
|
|
6.4
|
|
414
|
|
6.6
|
|
444
|
|
6.4
|
|
||||||||
|
Louisiana
|
270
|
|
4.4
|
|
272
|
|
4.3
|
|
260
|
|
3.8
|
|
||||||||
|
Other States
|
1,719
|
|
27.9
|
|
1,879
|
|
29.9
|
|
2,109
|
|
30.6
|
|
||||||||
|
Total premiums
|
$
|
6,154
|
|
100.0
|
%
|
$
|
6,302
|
|
100.0
|
%
|
$
|
6,909
|
|
100.0
|
%
|
|||||
We discontinued new sales of domestic ordinary whole life and endowment life insurance products within our Life Insurance segment in 2017 while we evaluate our domestic life strategy; therefore, the majority of the premium recorded in
2017
,
2018
and
2019
is related to renewal business. The increase in premiums in Texas from 2019 to 2018 is due to increased accident and health sales.
Net Investment Income.
Net investment income increased
12.0%
in 2019 compared to
2018
due to continued growth in average invested assets, improvements in cash management, and a strategic focus on increasing portfolio yields in a prudent manner. Despite facing a difficult investment environment in 2019, our strong focus on the execution of our investment strategy to increase yield drove an
increase
in portfolio yield of
24
basis points in this segment compared to
2018
. Both net investment income and portfolio yield were negatively impacted in 2018 by the need to maintain sufficient cash balances to fund our Bermuda novation, as noted previously. See the
Investments
section below for more detailed information on our investments.
|
Years ended December 31,
(In thousands, except for %) |
2019
|
2018
|
2017
|
||||||
|
Net investment income
|
$
|
44,779
|
|
39,985
|
|
38,578
|
|
||
|
Average invested assets, at amortized cost
|
1,016,055
|
|
958,135
|
|
890,705
|
|
|||
|
Annualized yield on average invested assets
|
4.41
|
%
|
4.17
|
%
|
4.33
|
%
|
|||
December 31, 2019 | 10-K
40
Realized Investment Losses, Net.
The realized gains for
2019
were primarily due to a $5.5 million realized gain from the sale of our former corporate headquarters in Austin, Texas. We also recorded a $1.3 million gain on fixed maturity redemptions above par. In 2018, we recognized losses on other-than-temporary impairments totaling $0.5 million in our fixed maturity portfolio for this segment.
Claims and Surrenders.
A breakout of claims and surrender benefits is detailed below.
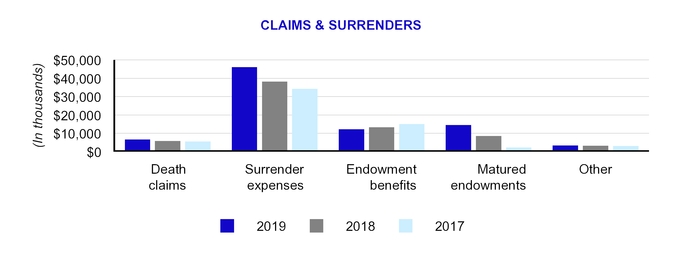
|
Years ended December 31,
(In thousands) |
2019
|
2018
|
2017
|
||||||
|
Claims and Surrenders:
|
|||||||||
|
Death claims
|
$
|
6,710
|
|
5,880
|
|
5,530
|
|
||
|
Surrender expenses
|
46,062
|
|
38,187
|
|
34,275
|
|
|||
|
Endowment benefits
|
12,233
|
|
13,329
|
|
15,117
|
|
|||
|
Matured endowments
|
14,601
|
|
8,548
|
|
2,364
|
|
|||
|
Accident and health benefits
|
128
|
|
229
|
|
253
|
|
|||
|
Other policy benefits
|
3,230
|
|
2,976
|
|
2,854
|
|
|||
|
Total claims and surrenders
|
$
|
82,964
|
|
69,149
|
|
60,393
|
|
||
|
•
|
Death claims expense
increased
14.1%
in
2019
compared to
2018
and
6.3%
in
2018
compared to
2017
. The increase in 2019 was driven primarily by higher average paid death benefit amounts. While death claim amounts are subject to variation from period to period, they are monitored closely by the Company.
|
|
•
|
We noted increases in surrender expense over the last several years, which is primarily related to activity in Colombia and Venezuela and is expected to increase over time due to the aging of this block of business and the larger distribution of in force business in these two top countries. Most of our policy surrender benefits paid are attributable to our international business and are related to policies that have been in force over fifteen years, when surrender charges are no longer assessed.
|
|
•
|
Endowment benefit expense primarily results from the election by policyholders of a product feature providing an annual guaranteed benefit. This is a fixed benefit over the life of the contract, and thus this expense will vary with new sales and the persistency of the business.
|
|
•
|
Matured endowments increased
70.8%
in
2019
compared to
2018
after
increasing
261.6%
in
2018
compared to
2017
. We anticipate this trend will continue as previous endowments products sold reach their stated maturity.
|
|
•
|
Other policy benefits relate primarily to interest paid on premium deposits and policy benefit accumulations.
|
December 31, 2019 | 10-K
41
Increase in Future Policy Benefit Reserves.
Changes in policy benefit reserves were lower in 2019 compared to 2018 due to the impact of increased surrender and maturity activity and lower premiums compared to 2018. The conversion to a new actuarial valuation system resulted in a decrease in reserves of $11.9 million in 2018 compared to 2017. The conversion to a new actuarial valuation system in 2018 helped offset the impact of increased surrender and maturity activity and lower premiums compared to 2017.
Policyholder Dividends.
Policyholders' dividends
decreased
4.9%
and
increased
1.4%
in
2019
and
2018
, respectively. Policyholders’ dividends are impacted by changes in persistency and production. The Company issues long duration participating policies to foreign residents that are expected to pay dividends to policyholders based upon actual experience. The boards of our life insurance companies approve any dividends on an annual basis and may change the dividend rates as needed for business purposes.
Commissions.
Commission expenses
increased
0.2%
from
2018
to
2019
in line with the
increase
in first year premiums. Commission expense increases or decreases are directly related to increases or decreases in premiums. First year policy premiums pay a higher commission rate than renewal policy premiums.
Other General Expenses.
Expenses increased
22.9%
to
$23.0 million
in
2019
compared to
2018
and
0.7%
to
$18.7 million
in
2018
compared to
2017
. The increase in expense in 2019 was due in part to the reduction in the 7702 tax compliance estimated costs recorded in 2018, which resulted in lower expenses during 2018. We also had lower audit fees which were offset by additional costs related to salaries, bonuses and other compensation in 2019. Expenses are allocated by segment, based upon an annual expense study performed by the Company.
Capitalization and Amortization of DAC.
Capitalized costs fluctuate in direct relation to commissions. Capitalized costs
increased
in
2019
compared to
2018
as commission-related costs
increased
due to higher first year sales levels. Amortization of DAC
decreased
by
20.3%
in
2019
compared to
2018
, as amortization costs in 2018 were increased by $3.7 million due to the impact of the conversion to a new actuarial valuation system. Amortization costs fluctuate with changes in first year premium activity, surrenders, and persistency. As previously described, persistency is closely monitored by the Company. We have experienced increased surrender activity in 2019 and 2018, including early duration elections to convert to reduced paid-up policies or extended term insurance as compared to 2017. There is higher DAC associated with early duration conversions to reduced paid-up policies or extended term insurance, which, when converted, increases amortization expense.
December 31, 2019 | 10-K
42
HOME SERVICE INSURANCE
Our Home Service Insurance segment provides pre-need and final expense ordinary life insurance and annuities to middle and lower income individuals primarily in Louisiana, Mississippi and Arkansas. Our policies in this segment are sold and serviced through a home service marketing distribution system and through funeral homes utilizing over
444
employees and independent agents.
|
Years ended December 31,
(In thousands) |
2019
|
2018
|
2017
|
||||||
|
Revenue:
|
|
|
|
||||||
|
Premiums
|
$
|
46,681
|
|
46,714
|
|
47,012
|
|
||
|
Net investment income
|
13,058
|
|
13,125
|
|
13,132
|
|
|||
|
Realized investment gains (losses), net
|
1,470
|
|
(46
|
)
|
979
|
|
|||
|
Other income (loss)
|
4
|
|
(1
|
)
|
3
|
|
|||
|
Total revenue
|
61,213
|
|
59,792
|
|
61,126
|
|
|||
|
Benefits and expenses:
|
|
|
|
|
|
|
|||
|
Insurance benefits paid or provided:
|
|
|
|
|
|||||
|
Claims and surrenders
|
23,863
|
|
21,954
|
|
22,512
|
|
|||
|
Increase in future policy benefit reserves
|
1,839
|
|
4,276
|
|
5,246
|
|
|||
|
Policyholders' dividends
|
36
|
|
46
|
|
42
|
|
|||
|
Total insurance benefits paid or provided
|
25,738
|
|
26,276
|
|
27,800
|
|
|||
|
Commissions
|
14,094
|
|
14,883
|
|
15,564
|
|
|||
|
Other general expenses
|
19,517
|
|
20,435
|
|
23,395
|
|
|||
|
Capitalization of deferred policy acquisition costs
|
(4,807
|
)
|
(5,501
|
)
|
(5,963
|
)
|
|||
|
Amortization of deferred policy acquisition costs
|
4,436
|
|
4,320
|
|
4,395
|
|
|||
|
Amortization of cost of insurance acquired
|
1,054
|
|
1,875
|
|
1,534
|
|
|||
|
Total benefits and expenses
|
60,032
|
|
62,288
|
|
66,725
|
|
|||
|
Income (loss) before income tax expense
|
$
|
1,181
|
|
(2,496
|
)
|
(5,599
|
)
|
||
Premiums.
The premiums in this segment remained relatively flat in
2019
compared to
2018
and
2017
.
The following table sets forth our direct premiums by state for the periods indicated.
|
Years ended December 31,
(In thousands, except for %) |
2019
|
2018
|
2017
|
|||||||||||||||||
|
State
|
|
|
|
|
|
|
||||||||||||||
|
Louisiana
|
$
|
42,867
|
|
90.2
|
%
|
$
|
42,898
|
|
90.2
|
%
|
$
|
42,837
|
|
89.6
|
%
|
|||||
|
Mississippi
|
2,037
|
|
4.3
|
|
2,105
|
|
4.4
|
|
2,369
|
|
5.0
|
|
||||||||
|
Arkansas
|
1,660
|
|
3.5
|
|
1,675
|
|
3.5
|
|
1,716
|
|
3.6
|
|
||||||||
|
Other States
|
938
|
|
2.0
|
|
857
|
|
1.9
|
|
906
|
|
1.8
|
|
||||||||
|
Total premiums
|
$
|
47,502
|
|
100.0
|
%
|
$
|
47,535
|
|
100.0
|
%
|
$
|
47,828
|
|
100.0
|
%
|
|||||
Net Investment Income.
Net investment income decreased slightly in
2019
as a fall in yields and an increase in investment expenses offset a slight increase in average invested assets. As previously described, it has been challenging to find attractive yields in the current low interest rate environment. See
Investments
below for more detailed information on our investments.
December 31, 2019 | 10-K
43
Net investment income yield for our Home Service Insurance segment is summarized as follows:
|
Years ended December 31,
(In thousands, except for %) |
2019
|
2018
|
2017
|
||||||
|
Net investment income
|
$
|
13,058
|
|
13,125
|
|
13,132
|
|
||
|
Average invested assets, at amortized cost
|
293,497
|
|
290,443
|
|
289,634
|
|
|||
|
Annualized yield on average invested assets
|
4.45
|
%
|
4.52
|
%
|
4.53
|
%
|
|||
Realized Investment Gains (Losses), Net.
Realized net gains for 2019 were primarily related to equity securities fair value adjustments of $0.8 million, as financial markets generally performed well during 2019. In addition, we recognized a gain of $0.7 million in 2019 related to fixed maturity redemptions above par value.
Claims and Surrenders.
A breakout of claims and surrender benefits is detailed below.
|
Years ended December 31,
(In thousands) |
2019
|
2018
|
2017
|
||||||
|
Claims and Surrenders:
|
|||||||||
|
Death claims
|
$
|
18,390
|
|
16,718
|
|
17,243
|
|
||
|
Surrender expenses
|
3,231
|
|
2,988
|
|
2,917
|
|
|||
|
Endowment benefits
|
14
|
|
12
|
|
17
|
|
|||
|
Matured endowments
|
546
|
|
541
|
|
518
|
|
|||
|
Property claims
|
1,563
|
|
1,648
|
|
1,744
|
|
|||
|
Accident and health benefits
|
104
|
|
31
|
|
56
|
|
|||
|
Other policy benefits
|
15
|
|
16
|
|
17
|
|
|||
|
Total claims and surrenders
|
$
|
23,863
|
|
21,954
|
|
22,512
|
|
||
|
•
|
Death claims expense
increased
10.0%
in
2019
compared to
2018
after declining in 2018. Death claims can fluctuate from year to year. In 2019, we experienced higher average paid death benefit amounts. Mortality experience is closely monitored by the Company as a key performance indicator and these amounts were within expected levels.
|
|
•
|
Surrender expenses increased in 2019, but were within anticipated ranges based on management expectations.
|
|
•
|
Property claims
decreased
in
2019
compared to
2018
, and in 2018 compared to 2017, as we experienced relatively favorable weather in
2019
and
2018
.
|
Increase in Future Policy Benefit Reserves.
The decrease in change in reserves is primarily due to changes in actuarial valuation estimates associated with the conversion to the new actuarial valuation system in 2019 that resulted in a decrease in reserves of $2.4 million compared to 2018.
Commissions.
Commission expense decreased in
2019
and
2018
, which was in line with the premium levels and was consistent for all three periods presented based upon fluctuations in premiums collected.
Other General Expenses.
Expenses
decreased
4.5%
in
2019
and
12.7%
in
2018
compared to prior periods. Expenses for 2019 were lower as a decline in audit fees which offset higher salaries, bonuses and other compensation. Expenses are allocated by segment, based upon an annual expense study performed by the Company. Expenses in 2017 were higher due to the impairment of our Home Service Insurance goodwill, which resulted in an increase in expenses of
$4.6 million
.
Capitalization and Amortization of DAC.
DAC capitalization declined in
2019
as it is directly correlated to fluctuations in first year commissions. Amortization of DAC was relatively flat in
2019
and
2018
.
December 31, 2019 | 10-K
44
Amortization of Cost of Insurance Acquired.
Amortization decreased in 2019 mainly due to an annual review and true up performed in the first quarter of 2019. Amortization increased in 2018 compared to 2017 due to an update in our assumptions that resulted in an adjustment of approximately
$0.7 million
.
OTHER NON-INSURANCE OPERATIONS
This operating unit represents the administrative support entities to the insurance operations whose revenues are primarily intercompany and have been eliminated in consolidation under U.S. GAAP, which typically results in a segment loss. Losses reported for 2019 were impacted by the impairment of the Citizens Academy training facility property. In 2018, higher expenses included long-term compensation and increased audit fees as discussed in the segment analysis.
INVESTMENTS
The administration of our investment portfolios is handled by our management and, since May 2018, a third-party investment manager, pursuant to Board-approved investment guidelines, with all trading activity approved by each board of Citizens and its insurance subsidiaries. The guidelines used require that fixed maturities, both government and corporate, are investment grade and comprise a majority of the investment portfolio. State insurance statutes prescribe the quality and percentage of the various types of investments that may be made by insurance companies and generally permit investment in qualified state, municipal, federal and foreign government obligations, high quality corporate bonds, preferred and common stock, mortgage loans and real estate within certain specified percentages. The assets are intended to mature in accordance with the average maturity of the insurance products and to provide the cash flow for our insurance company subsidiaries to meet their respective policyholder obligations.
The following table shows the carrying value of our investments by investment category and cash and cash equivalents, and the percentage of each to total invested assets.
|
Years ended December 31,
(In thousands, except for %) |
2019
|
%
|
2018
|
%
|
|||||||||
|
Cash, Cash Equivalents and Investments:
|
|||||||||||||
|
Fixed maturity securities:
|
|
|
|
|
|||||||||
|
U.S. Treasury and U.S. Government-sponsored enterprises
|
$
|
15,878
|
|
1.0
|
%
|
$
|
15,554
|
|
1.1
|
%
|
|||
|
Corporate
|
650,088
|
|
42.6
|
|
381,796
|
|
27.5
|
|
|||||
|
Municipal bonds
(1)
|
536,284
|
|
35.1
|
|
720,115
|
|
52.0
|
|
|||||
|
Mortgage-backed
(2)
|
131,387
|
|
8.6
|
|
108,698
|
|
7.8
|
|
|||||
|
Asset-backed
|
44,203
|
|
2.9
|
|
4,757
|
|
0.3
|
|
|||||
|
Foreign governments
|
119
|
|
—
|
|
119
|
|
—
|
|
|||||
|
Total fixed maturity securities
|
1,377,959
|
|
90.2
|
|
1,231,039
|
|
88.7
|
|
|||||
|
Short-term investments
|
1,301
|
|
0.1
|
|
7,865
|
|
0.6
|
|
|||||
|
Cash and cash equivalents
|
46,205
|
|
3.0
|
|
45,492
|
|
3.3
|
|
|||||
|
Other investments:
|
|
|
|
|
|||||||||
|
Policy loans
|
82,005
|
|
5.4
|
|
80,825
|
|
5.8
|
|
|||||
|
Equity securities
|
16,033
|
|
1.1
|
|
15,068
|
|
1.1
|
|
|||||
|
Real estate and other long-term investments
|
2,956
|
|
0.2
|
|
7,409
|
|
0.5
|
|
|||||
|
Total cash, cash equivalents and investments
|
$
|
1,526,459
|
|
100.0
|
%
|
$
|
1,387,698
|
|
100.0
|
%
|
|||
(1)
Includes
$188.1 million
and
$220.6 million
of securities guaranteed by third parties for the years ended
December 31, 2019
and
2018
, respectively.
(2)
Includes
$130.1 million
and
$108.5 million
of U.S. Government agencies and government-sponsored enterprises for the years ended December 31,
2019
and
2018
, respectively.
December 31, 2019 | 10-K
45
The Company significantly increased investments in mortgage-backed securities in the latter part of 2018, which now represent
8.6%
of our cash, cash equivalents, and investment portfolio as of
December 31, 2019
. We also began a process of repositioning our portfolio into more diversified holdings and maturities as part of our investment management strategy in the latter part of 2018. The Company has also decreased its exposure to the municipal bond market, which now represents
35.1%
of the investment portfolio in
2019
compared to
52.0%
in
2018
.
At
December 31, 2019
, investments in fixed maturity and equity securities were
91.3%
of our total cash, cash equivalents and investments. All of our fixed maturities were classified as available-for-sale securities at
December 31, 2019
and
2018
. We had no fixed maturity or equity securities that were classified as trading securities at
December 31, 2019
or
2018
.
The following table shows annualized investment yields by segment operations as of December 31 for each year presented.
|
Year
|
Life
Insurance
|
Home
Service Insurance
|
Consolidated
|
||||||
|
2019
|
4.41
|
%
|
4.45
|
%
|
4.36
|
%
|
|||
|
2018
|
4.17
|
%
|
4.52
|
%
|
4.17
|
%
|
|||
|
2017
|
4.33
|
%
|
4.53
|
%
|
4.31
|
%
|
|||
Yields on investment assets vary between segment operations due to different portfolio mixes and durations in the segments. Our annualized yield on average invested assets on the consolidated level
increased
19
basis points in
2019
compared to
2018
, primarily driven by the Life Insurance segment and maintaining sufficient cash balances in 2018 to fund our Bermuda novation.
The annualized yield decreased in 2018 compared to 2017 due to the decrease in investment income as make-whole calls declined compared to prior years. These calls resulted in $0.7 million of additional net income in 2017, all of which related to the Life Insurance segment, providing additional net income in 2017. A make-whole call provision in the bond instruments allows the borrower to pay off the debt early and, in doing so, incur make-whole premiums. This option was elected by borrowers on some of our bond issues as noted.
Credit ratings reported for the periods indicated are assigned by a Nationally Recognized Statistical Rating Organization ("NRSRO") such as Moody’s Investors Service, Standard & Poor’s and Fitch Ratings. A credit rating assigned by a NRSRO is a quality based rating, with AAA representing the highest quality and D the lowest, with BBB and above being considered investment grade. In addition, the Company may use credit ratings of the NAIC Securities Valuation Office ("SVO") as assigned, if there is no NRSRO rating. Securities rated by the SVO are grouped in the equivalent NRSRO category as stated by the SVO, and securities that are not rated by a NRSRO are included in the "other" category.
The following table shows the distribution of the credit ratings of our portfolio of fixed maturity securities by carrying value.
|
December 31,
(In thousands, except for %) |
2019
|
%
|
2018
|
%
|
|||||||||
|
AAA
|
$
|
56,977
|
|
4.1
|
%
|
$
|
96,333
|
|
7.8
|
%
|
|||
|
AA
|
513,190
|
|
37.2
|
|
551,978
|
|
44.8
|
|
|||||
|
A
|
385,345
|
|
28.0
|
|
281,553
|
|
22.9
|
|
|||||
|
BBB
|
406,515
|
|
29.5
|
|
277,584
|
|
22.6
|
|
|||||
|
BB and other
|
15,932
|
|
1.2
|
|
23,591
|
|
1.9
|
|
|||||
|
Totals
|
$
|
1,377,959
|
|
100.0
|
%
|
$
|
1,231,039
|
|
100.0
|
%
|
|||
December 31, 2019 | 10-K
46
The Company made new investments in investment grade bonds during
2019
. Non-investment grade securities are the result of downgrades of issuers or securities acquired during acquisitions of companies, as the Company does not purchase below investment grade securities.
As of
December 31, 2019
, the Company held municipal fixed maturity securities that include third-party guarantees. Detailed below is a presentation by NRSRO rating of our municipal holdings by funding type.
|
|
December 31, 2019
|
||||||||||||||||||||||||||
|
|
General Obligation
|
Special Revenue
|
Other
|
Total
|
% Based on
Amortized
Cost
|
||||||||||||||||||||||
|
(In thousands, except for %)
|
Fair
Value
|
Amortized
Cost
|
Fair
Value
|
Amortized
Cost
|
Fair
Value
|
Amortized
Cost
|
Fair
Value
|
Amortized
Cost
|
|||||||||||||||||||
|
Municipal fixed maturity securities shown including third-party guarantees
|
|||||||||||||||||||||||||||
|
AAA
|
$
|
35,080
|
|
34,215
|
|
12,358
|
|
11,997
|
|
—
|
|
—
|
|
47,438
|
|
46,212
|
|
9.0
|
%
|
||||||||
|
AA
|
108,974
|
|
104,867
|
|
172,614
|
|
166,983
|
|
16,519
|
|
15,268
|
|
298,107
|
|
287,118
|
|
56.1
|
|
|||||||||
|
A
|
21,121
|
|
20,109
|
|
126,979
|
|
117,614
|
|
7,677
|
|
7,099
|
|
155,777
|
|
144,822
|
|
28.3
|
|
|||||||||
|
BBB
|
5,377
|
|
5,265
|
|
17,039
|
|
16,550
|
|
1,544
|
|
1,450
|
|
23,960
|
|
23,265
|
|
4.5
|
|
|||||||||
|
BB and other
|
5,789
|
|
5,684
|
|
5,213
|
|
5,138
|
|
—
|
|
—
|
|
11,002
|
|
10,822
|
|
2.1
|
|
|||||||||
|
Total
|
$
|
176,341
|
|
170,140
|
|
334,203
|
|
318,282
|
|
25,740
|
|
23,817
|
|
536,284
|
|
512,239
|
|
100.0
|
%
|
||||||||
|
Municipal fixed maturity securities shown excluding third-party guarantees
|
|||||||||||||||||||||||||||
|
AAA
|
$
|
10,041
|
|
9,900
|
|
523
|
|
516
|
|
—
|
|
—
|
|
10,564
|
|
10,416
|
|
2.0
|
%
|
||||||||
|
AA
|
86,323
|
|
84,493
|
|
101,670
|
|
98,789
|
|
10,664
|
|
9,662
|
|
198,657
|
|
192,944
|
|
37.7
|
|
|||||||||
|
A
|
38,804
|
|
37,134
|
|
159,557
|
|
148,883
|
|
10,556
|
|
9,825
|
|
208,917
|
|
195,842
|
|
38.2
|
|
|||||||||
|
BBB
|
10,605
|
|
10,112
|
|
33,164
|
|
32,301
|
|
—
|
|
—
|
|
43,769
|
|
42,413
|
|
8.3
|
|
|||||||||
|
BB and other
|
30,568
|
|
28,501
|
|
39,289
|
|
37,793
|
|
4,520
|
|
4,330
|
|
74,377
|
|
70,624
|
|
13.8
|
|
|||||||||
|
Total
|
$
|
176,341
|
|
170,140
|
|
334,203
|
|
318,282
|
|
25,740
|
|
23,817
|
|
536,284
|
|
512,239
|
|
100.0
|
%
|
||||||||
The table below shows the categories in which the Company held investments in special revenue bonds that were greater than 10% of fair value based upon the Company's portfolio of fixed maturity securities at
December 31, 2019
.
|
(In thousands, except for %)
|
Fair
Value
|
Amortized Cost
|
% of Total Fair Value
|
|||||||
|
Utilities
|
$
|
118,564
|
|
112,070
|
|
22.1
|
%
|
|||
|
Education
|
87,200
|
|
82,563
|
|
16.3
|
%
|
||||
December 31, 2019 | 10-K
47
The table below represents the Company’s detailed exposure to municipal holdings in Texas, which comprises the most significant state concentration of the total municipal fixed maturity portfolio as of
December 31, 2019
.
The Company holds
19.4%
of its municipal holdings in Texas issuers as of
December 31, 2019
.
|
|
General Obligation
|
Special Revenue
|
Total
|
|||||||||||||||
|
(In thousands)
|
Fair
Value
|
Amortized
Cost
|
Fair
Value
|
Amortized
Cost
|
Fair
Value
|
Amortized
Cost
|
||||||||||||
|
Texas securities including third-party guarantees
|
|
|
|
|
|
|||||||||||||
|
AAA
|
$
|
34,090
|
|
33,290
|
|
9,445
|
|
9,097
|
|
43,535
|
|
42,387
|
|
|||||
|
AA
|
26,232
|
|
25,766
|
|
21,955
|
|
21,219
|
|
48,187
|
|
46,985
|
|
||||||
|
A
|
—
|
|
—
|
|
7,182
|
|
6,531
|
|
7,182
|
|
6,531
|
|
||||||
|
BBB
|
—
|
|
—
|
|
4,274
|
|
4,260
|
|
4,274
|
|
4,260
|
|
||||||
|
BB and other
|
710
|
|
709
|
|
263
|
|
266
|
|
973
|
|
975
|
|
||||||
|
Total
|
$
|
61,032
|
|
59,765
|
|
43,119
|
|
41,373
|
|
104,151
|
|
101,138
|
|
|||||
|
Texas securities excluding third-party guarantees
|
|
|
|
|
|
|||||||||||||
|
AAA
|
$
|
9,622
|
|
9,485
|
|
—
|
|
—
|
|
9,622
|
|
9,485
|
|
|||||
|
AA
|
42,375
|
|
41,532
|
|
19,751
|
|
19,348
|
|
62,126
|
|
60,880
|
|
||||||
|
A
|
6,079
|
|
5,882
|
|
13,006
|
|
11,947
|
|
19,085
|
|
17,829
|
|
||||||
|
BBB
|
1,222
|
|
1,156
|
|
4,832
|
|
4,792
|
|
6,054
|
|
5,948
|
|
||||||
|
BB and other
|
1,734
|
|
1,710
|
|
5,530
|
|
5,286
|
|
7,264
|
|
6,996
|
|
||||||
|
Total
|
$
|
61,032
|
|
59,765
|
|
43,119
|
|
41,373
|
|
104,151
|
|
101,138
|
|
|||||
There were no other states or individual issuer holdings that represented or exceeded 10% of the total municipal portfolio as of
December 31, 2019
.
IMPAIRMENT CONSIDERATIONS RELATED TO INVESTMENTS IN FIXED MATURITY AND EQUITY SECURITIES
We evaluate the carrying value of our fixed maturity securities at least quarterly. We measure our equity securities at fair value through the income statement so there is no need to assess these securities for impairment.
The Company monitors all debt securities on an on-going basis relative to changes in credit ratings, market prices, earnings trends and financial performance, in addition to specific region or industry reviews. The assessment of whether impairments have occurred is based on a case-by-case evaluation of underlying reasons for the decline in fair value. The Company determines OTTI by reviewing all relevant evidence related to the specific security issuer as well as the Company's intent to sell the security, or if it is more likely than not that the Company would be required to sell a security before recovery of its amortized cost.
When an OTTI has occurred, the amount of the OTTI recognized in earnings depends on whether the Company intends to sell the security or more likely than not will be required to sell the security before recovery of its amortized cost basis. If the Company intends to sell the security or more likely than not will be required to sell the security before recovery of its amortized cost basis, an OTTI is recognized in earnings equal to the entire difference between the investment's cost and its fair value at the consolidated financial statement date. If the Company does not intend to sell the security and it is not more likely than not that the Company is required to sell the security before recovery of its amortized cost basis, the OTTI will be separated into the following: (a) the amount representing the credit loss; and (b) the amount related to all other factors. The amount of the total OTTI related to the credit loss is recognized in earnings. The amount of the total OTTI related to other factors is recognized in other comprehensive income, net of applicable taxes. The previous amortized cost basis less the OTTI recognized in earnings becomes the new amortized cost basis of the investment. The new amortized cost is not adjusted for subsequent recoveries in fair value.
December 31, 2019 | 10-K
48
The Company recorded no OTTI losses on securities in
2019
and recorded losses of
$0.8 million
in
2018
related to fixed maturity bond and equity securities holdings. Based upon our analysis of whether declines in fair value below cost are temporary or other-than-temporary, management believes that our investments in fixed maturity investments at
December 31, 2019
were not impaired, and no additional other-than-temporary losses were recorded.
Gross unrealized losses on fixed maturities available-for-sale amounted to
$1.6 million
as of
December 31, 2019
and
$11.3 million
as of
December 31, 2018
. This
decrease
in gross unrealized losses during
2019
was a result of a
decrease
in the interest rate environment.
Information on both unrealized and realized gains and losses by category, including OTTI, is set forth in
Note 2. Investments
of the notes to our consolidated financial statements.
REINSURANCE
As is customary among insurance companies, our insurance company subsidiaries reinsure, with other companies, portions of the life insurance risks they underwrite. A primary purpose of reinsurance agreements is to enable an insurance company to reduce the amount of risk by reinsuring the amount exceeding the maximum amount the insurance company is willing to retain. Even though a portion of the risk may be reinsured, our insurance company subsidiaries remain liable to perform all the obligations imposed by the policies issued by them and could be liable if their reinsurers were unable to meet their obligations under the reinsurance agreements.
We believe we have established appropriate reinsurance coverage based upon our net retained insured liabilities compared to our surplus.
The effect of reinsurance on premiums is as follows.
|
Years ended December 31,
(In thousands) |
2019
|
2018
|
2017
|
||||||
|
Direct premiums
|
$
|
187,009
|
|
191,561
|
|
200,711
|
|
||
|
Reinsurance assumed
|
99
|
|
99
|
|
142
|
|
|||
|
Reinsurance ceded
|
(2,761
|
)
|
(3,800
|
)
|
(3,133
|
)
|
|||
|
Net premiums
|
$
|
184,347
|
|
187,860
|
|
197,720
|
|
||
Our insurance subsidiaries monitor the solvency of their reinsurers in seeking to minimize the risk of loss in the event of default by a reinsurer. The primary reinsurers of our insurance subsidiaries are large, well-capitalized entities.
The effect of reinsurance on life insurance in force is as follows.
|
Years ended December 31,
(In millions) |
2019
|
2018
|
2017
|
||||||
|
Direct written life insurance inforce
|
$
|
4,729
|
|
4,836
|
|
4,968
|
|
||
|
Reinsurance assumed
|
5
|
|
5
|
|
6
|
|
|||
|
Reinsurance ceded
|
(487
|
)
|
(490
|
)
|
(504
|
)
|
|||
|
Net life insurance inforce
|
$
|
4,247
|
|
4,351
|
|
4,470
|
|
||
Virtually all of the Company's non-credit accident and health insurance has been reinsured and is administered by Unified Life Insurance Company, an unaffiliated party.
The Company monitors the credit ratings of our life and property reinsurers. The ratings by A.M. Best Company range from B+ (Good) to A+ (Superior).
SPFIC has first and second event catastrophe reinsurance coverage of $10.0 million per event and a retention level of $0.5 million per event. Thus, the first $0.5 million of incurred claims and any claims in excess of $10.0 million are
December 31, 2019 | 10-K
49
SPFIC's responsibility. The reinsurance premium for first event catastrophe reinsurance was
$0.8 million
in
2019
,
2018
and
2017
, respectively.
LIQUIDITY AND CAPITAL RESOURCES
Liquidity refers to a company's ability to generate sufficient cash flows to meet the needs of its operations. Liquidity is managed through insurance operations to ensure stable and reliable sources of cash flows are available to meet obligations and is provided by a variety of sources.
Our liquidity requirements are met primarily by funds provided from operations. Premium deposits and revenues, investment income and investment maturities are the primary sources of funds, while investment purchases, policy benefits, and operating expenses are the primary uses of funds. Historically, we have not had to liquidate investments to provide cash flow, and there were no liquidity issues in
2019
or
2018
. At
December 31, 2019
, our investments consist of
93.1%
marketable debt securities classified as available-for-sale and
1.1%
of equity securities that could be readily converted to cash for liquidity needs.
A primary liquidity concern is the risk of an extraordinary level of early policyholder withdrawals. We include provisions within our insurance policies, such as surrender charges, that help limit and discourage early withdrawals. Since these contractual withdrawals, as well as the level of surrenders experienced, have been largely consistent with our assumptions in asset liability management, our associated cash outflows historically have not had an adverse impact on our overall liquidity. Individual life insurance policies are less susceptible to withdrawal than annuity reserves and deposit liabilities because policyholders may incur surrender charges and may need to undergo a new underwriting process in order to obtain a new insurance policy. Cash flow projections and cash flow tests under various market interest rate scenarios are also performed annually to assist in evaluating liquidity needs and adequacy.
Our whole life and endowment products provide the policyholder with alternatives once the policy matures. The policyholder can choose to take a lump sum payout or leave the money on deposit at interest with the Company. As of
December 31, 2019
, the Company has a significant amount of endowment products representing approximately
41.0%
of total insurance in force. Approximately 10% of the endowments in force will mature in the next five years. Policyholder election behavior is unknown, but if policyholders elect lump sum distributions, the Company could be exposed to liquidity risk in years of high maturities. Meeting these distributions could require the Company to sell securities at inopportune times to pay policyholder withdrawals. Alternatively, if the policyholder were to leave the money on deposit with the Company at interest, our profitability could be impacted if the product guaranteed rate is higher than the current market rate we can earn on our investments. We currently anticipate that available liquidity sources and future cash flows will be adequate to meet our needs for funds, but we will monitor closely our policyholder behavior patterns.
Our fixed maturity bond portfolio is exposed to interest rate risk as approximately
51%
of the portfolio is callable as of December 31, 2019, with
17%
that could be called within the next year. If subject to increased call activity, the Company would have to reinvest the resulting investment portfolio cash proceeds from calls as well as from maturities in lower yielding instruments, further reducing our investment income.
Our profitability could be negatively impacted depending on the market rates at the time of reinvestment. This could result in a decrease in the spread between our policy liability crediting rates and our investment earned rates. This could also negatively impact our liquidity.
Cash flows from our insurance operations historically have been sufficient to meet current needs. Cash flows from operating activities were
$72.2 million
,
$84.6 million
and
$93.0 million
for the years ended
December 31, 2019
,
2018
and
2017
, respectively. Operating cash flow declined in
2019
, due primarily to the decrease in premium revenues and higher policyholder benefits paid in
2019
. We have traditionally also had significant cash flows from both scheduled and unscheduled fixed maturity security calls, maturities, redemptions, and prepayments, which totaled
$181.6 million
,
$86.6 million
and
$84.0 million
in
2019
,
2018
and
2017
, respectively. These cash flows, for the most part, are reinvested in fixed maturity securities. Net cash outflows from investment activity totaled
$69.3 million
,
$85.1 million
and
$85.0 million
for the years ended
December 31, 2019
,
2018
and
2017
, respectively. The outflows from investing activities for the year ended
December 31, 2019
, were primarily related to the investment of excess cash and cash equivalents generated from operations during
2019
and
2018
. The Company's cash outflows from financing activities were
$2.2 million
,
$0.1 million
and cash inflows of
$2.5 million
in
2019
,
2018
and
2017
, respectively.
See
Parent Company Liquidity and Capital Resources
below for a discussion of additional Parent Company liquidity.
December 31, 2019 | 10-K
50
We have established a liability of
$10.0 million
, net of tax, for probable liabilities and expenses associated with a tax compliance matter as of
December 31, 2019
as described in
Note 7. Commitments and Contingencies
in the notes to our consolidated financial statements, which represents management’s best estimate. We have disclosed an estimated range related to probable liabilities and expenses of
$7.4 million
to
$52.5 million
, net of tax. This estimate and range include projected settlement amounts payable to the IRS, as well as estimated increased payout obligations to current and former holders of non-compliant domestic life insurance policies expected to result from remediation of those policies. The amount of our liabilities and expenses depends on a number of uncertainties, including the number of prior tax years for which we may be liable to the IRS, the number of domestic life insurance policies we will be required to remediate, and the methodology applicable to the calculation of the tax liabilities for policies. Given the range of potential outcomes and the significant variables assumed in establishing our estimates, actual amounts incurred may exceed our reserve and exceed the high end of our estimated range of liabilities and expenses.
The NAIC has established minimum capital requirements in the form of Risk-based capital ("RBC"). RBC considers the type of business written by an insurance company, the quality of its assets, and various other aspects of an insurance company's business to develop a minimum level of capital called "Authorized Control Level Risk-based Capital". This level of capital is then compared to an adjusted statutory capital that includes capital and surplus as reported under statutory accounting principles, plus certain investment reserves. Should the ratio of adjusted statutory capital to control level risk-based capital fall below 200%, a series of remedial actions by the affected company would be required. We have a parental guarantee between Citizens, Inc. and CICA to maintain an RBC level above 350%.
The Bermuda Monetary Authority
("BMA") established risk-based regulatory capital adequacy and solvency margin requirements for Bermuda insurers that mandate that a Bermuda domiciled subsidiary’s Enhanced Capital Requirement ("ECR") be calculated by either (a) Bermuda Solvency Capital Requirement ("BSCR"), or (b) an internal capital model that the BMA has approved for use for this purpose. CICA Ltd., Citizens, Inc.'s wholly-owned subsidiary domiciled in Bermuda, uses the BSCR in calculating its solvency requirements. The Economic Balance Sheet (“EBS”) framework is embedded as part of the BSCR and forms the basis of its ECR.
In order to minimize the risk of a shortfall in capital arising from an unexpected adverse deviation and in moving towards the implementation of a risk-based capital approach, the BMA has established a threshold capital level (termed the Target Capital Level ("TCL")), set at 120 percent of ECR, that serves as an early warning tool for the BMA. Failure to maintain statutory capital at least equal to the TCL would likely result in increased BMA regulatory oversight.
At
December 31, 2019
, all our insurance subsidiaries were above the required minimum RBC or TCL levels.
December 31, 2019 | 10-K
51
CONTRACTUAL OBLIGATIONS AND OFF-BALANCE SHEET ARRANGEMENTS
We have committed to the following contractual obligations as of
December 31, 2019
, with the payments due by the period indicated below:
|
(In thousands)
|
Total
|
Less than 1
Year
|
1 to 3 Years
|
3 to 5 Years
|
More than 5
Years
|
|||||||||||
|
Contractual Obligations:
|
||||||||||||||||
|
Investment commitments
|
$
|
40,000
|
|
20,000
|
|
20,000
|
|
—
|
|
—
|
|
|||||
|
Operating leases
|
1,152
|
|
946
|
|
206
|
|
—
|
|
—
|
|
||||||
|
Future policy benefit reserves:
|
|
|
||||||||||||||
|
Life insurance
|
1,218,757
|
|
24,002
|
|
57,659
|
|
96,023
|
|
1,041,073
|
|
||||||
|
Annuities
|
76,380
|
|
4
|
|
4
|
|
6
|
|
76,366
|
|
||||||
|
Accident and health
|
1,031
|
|
123
|
|
607
|
|
41
|
|
260
|
|
||||||
|
Dividend accumulations
|
29,211
|
|
—
|
|
—
|
|
—
|
|
29,211
|
|
||||||
|
Premiums paid in advance
|
43,102
|
|
1,080
|
|
2,578
|
|
4,348
|
|
35,096
|
|
||||||
|
Other policyholder funds
|
18,192
|
|
—
|
|
—
|
|
—
|
|
18,192
|
|
||||||
|
Total policy liabilities
|
1,386,673
|
|
25,209
|
|
60,848
|
|
100,418
|
|
1,200,198
|
|
||||||
|
Policy claims payable:
|
|
|
|
|
|
|
|
|
|
|
||||||
|
Life insurance
|
7,509
|
|
7,509
|
|
—
|
|
—
|
|
—
|
|
||||||
|
Accident and health
|
114
|
|
114
|
|
—
|
|
—
|
|
—
|
|
||||||
|
Casualty
|
436
|
|
436
|
|
—
|
|
—
|
|
—
|
|
||||||
|
Total policy claims payable
|
8,059
|
|
8,059
|
|
—
|
|
—
|
|
—
|
|
||||||
|
Total contractual obligations
|
$
|
1,435,884
|
|
54,214
|
|
81,054
|
|
100,418
|
|
1,200,198
|
|
|||||
The payments related to the future policy benefits and policy claims payable reflected in the table above have been projected utilizing assumptions based upon our historical experience and anticipated future experience. Payments of amounts related to annuity, dividend and other policyholder funds left on deposit are projected based on assumptions of policyholder withdrawal activity. Because the exact timing and amount of the ultimate policyholder fund obligation is subject to significant uncertainty, we have reflected the obligation at the amount of the liability presented on the consolidated balance sheet in the more than five year category.
The Company’s principal executive office is temporarily located at 14231 Tandem Boulevard, Second Floor, Austin, Texas.
In January 2019, the Company entered into a long-term lease agreement with an unrelated party for our new principal executive office. The building in which we have leased office space is under construction and is expected to be completed in 2020. The long-term lease will commence after construction of the building is complete and has a 121-month term. Payments under the new long-term lease agreement will average approximately $112,340 per month.
The Company does not have off-balance sheet arrangements at
December 31, 2019
and does not expect any future effects on the Company's financial condition related to any such arrangements. We do not utilize special purpose entities as investment vehicles, nor are there any such entities in which we have an investment that engages in speculative activities of any nature, and we do not use such investments to hedge our investment positions.
December 31, 2019 | 10-K
52
PARENT COMPANY LIQUIDITY AND CAPITAL RESOURCES
Citizens is a holding company and has minimal operations of its own. Our assets consist of the capital stock of our subsidiaries, cash, fixed maturity securities, mutual funds and investment real estate. Our cash flows depend primarily upon the availability of statutorily permissible payments, primarily payments under management agreements from our life insurance subsidiaries. The ability to make payments is limited by applicable laws and regulations of Bermuda and U.S. states of domicile, which subject insurance operations to significant regulatory restrictions. These laws and regulations require, among other things, that these insurance subsidiaries maintain minimum solvency requirements and limit the amount of dividends these subsidiaries can pay to the holding company. We historically have not relied upon dividends from subsidiaries for our cash flow needs. However, our subsidiaries have made dividend payments of available funds from time to time in relation to business strategies.
As of
December 31, 2019
, Citizens had fixed maturities available-for-sale of
$50.5 million
and cash of
$10.8 million
, which represents additional liquidity for future acquisitions, liquidity support for the life insurance companies and for general corporate purposes.
Additionally, a substantial portion of our international policyholders invest their policy cash dividends and benefits in our Class A common stock through our Citizens, Inc. Stock Investment Plan (the "CISIP"). Once a policyholder elects to participate in the CISIP, their policy benefits can be used to purchase Citizens Class A common stock through the CISIP in the open market, or, at our option, directly from us from newly issued or treasury shares. In addition, our existing holders of Class A common stock, employees, directors and independent consultants are eligible to participate in the CISIP. If fewer policyholders elect to participate in the CISIP, or if our international premium collections were to decrease as a result of regulatory or marketing impediments, the trading volume of our Class A common stock may decline from its present levels.
CRITICAL ACCOUNTING POLICIES
The preparation of consolidated financial statements in accordance with U.S. GAAP requires management to make estimates and assumptions that affect reported amounts and related disclosures. Management considers an accounting estimate to be critical if: (1) it requires assumptions to be made that were uncertain at the time the estimate was made; and (2) changes in the estimate, or different estimates that could have been selected, could have a material effect on our consolidated results of operations or financial condition. While we believe that our estimates, assumptions and judgments are reasonable, they are based on information presently available. Changes in our assumptions, estimates or assessments as a result of unforeseen events or otherwise could have a material impact on our financial position or results of operations.
Management has discussed the development and selection of its critical accounting estimates with the Audit Committee of the Board of Directors, and the Audit Committee has reviewed the disclosure presented below relating to them. See
Note 1. Summary of Significant Accounting Policies
in the notes to our consolidated financial statements for further information on our critical accounting policies.
Our critical accounting policies are as follows.
VALUATION OF INVESTMENTS IN FIXED MATURITY AND EQUITY SECURITIES
Based upon current accounting guidance, investment securities must be classified as held-to-maturity, available-for-sale or trading. Management determines the appropriate classification at the time of purchase. The classification of securities is significant since it directly impacts the accounting for unrealized gains and losses on securities. Fixed maturity securities are classified as held-to-maturity and carried at amortized cost when management has the positive intent and the Company has the ability to hold the securities to maturity. Securities not classified as held-to-maturity are classified as available-for-sale and are carried at fair value, with the unrealized holding gains and losses, net of tax, reported in other comprehensive income and do not affect earnings until realized. The Company currently does not hold any fixed maturity securities classified as held-to-maturity.
The evaluation of securities for impairments is a quantitative and qualitative process, which is subject to risks and uncertainties and is intended to determine whether declines in the fair value of investments should be recognized in current period earnings. The risks and uncertainties include changes in general economic conditions, the issuer's
December 31, 2019 | 10-K
53
financial condition or future prospects, the effects of changes in interest rates or credit spreads and the expected recovery period.
The Company evaluates all securities on a quarterly basis, and more frequently when economic conditions warrant additional evaluations, for determining if an OTTI exists pursuant to the accounting guidelines. In evaluating the possible impairment of securities, consideration is given to the length of time and the extent to which the fair value has been less than cost, the financial conditions and near-term prospects of the issuer, and the ability and intent of the Company to retain its investment in the issuer for a period of time sufficient to allow for any anticipated recovery in fair value. In analyzing an issuer's financial condition, the Company may consider whether the securities are issued by the Federal government or its agencies, by government-sponsored agencies, or whether downgrades by bond rating agencies have occurred, and reviews of the issuer's financial condition.
If management determines that an investment experienced an OTTI, management must then determine the amount of OTTI to be recognized in earnings. If management does not intend to sell the security and it is more likely than not that the Company will not be required to sell the security before recovery of its amortized cost basis less any current period loss, the OTTI will be separated into the amount representing the credit loss and the amount related to all other factors. The amount of OTTI related to the credit loss is determined based on the present value of cash flows expected to be collected and is recognized in earnings. The amount of OTTI related to other factors will be recognized in other comprehensive income, net of applicable taxes. The previous amortized cost basis less the OTTI recognized in earnings will become the new amortized cost basis of the investment. If management intends to sell the security or more likely than not will be required to sell the security before recovery of its amortized cost basis less any current period credit loss, the OTTI will be recognized in earnings equal to the entire difference between the investment's amortized cost basis and its fair value at the consolidated financial statement date. Any recoveries related to the value of these securities are recorded as an unrealized gain (as other comprehensive income (loss) in shareholders' equity) and not recognized in income until the security is ultimately sold.
The Company from time to time may dispose of an impaired security in response to asset/liability management decisions, future market movements, business plan changes, or if the net proceeds can be reinvested at a rate of return that is expected to recover the loss within a reasonable period of time.
DEFERRED POLICY ACQUISITION COSTS
Acquisition costs, consisting of commissions and policy issuance, underwriting and agent convention expenses that are directly related to and vary with the successful production of new business are deferred. These deferred amounts, referred to as deferred policy acquisition costs ("DAC"), are recorded as an asset on the consolidated balance sheets and amortized to income in a systematic manner, based on related contract revenues or gross profits as appropriate.
Traditional life insurance and accident and health insurance acquisition costs are amortized over the premium-paying period of the related policies using assumptions consistent with those used in computing future policy benefit liabilities. For universal life type contracts and investment contracts that include significant surrender charges or that yield significant revenues from sources other than the investment contract holders' funds, the deferred contract acquisition cost amortization is matched to the recognition of gross profit. The effect on the DAC asset that would result from realization of unrealized gains or losses is recognized with an offset to accumulated other comprehensive income in consolidated stockholders' equity. If an internal replacement of insurance or investment contract modification substantially changes a contract as defined in current accounting guidance, then the DAC is written off immediately through income and any new deferrable costs associated with the new replacement are deferred. If a contract modification does not substantially change the contract, the DAC amortization on the original contract will continue and any acquisition costs associated with the related modification are immediately expensed.
The ending DAC asset balance is calculated at a seriatim level for policies in force at the end of each reporting period based on the remaining unamortized asset. The assumptions used to calculate DAC are set when a policy is issued and do not change with changes in actual experience, unless a loss recognition event occurs. The seriatim method ensures that policies lapsed or surrendered during the reporting period are no longer included in the DAC calculation. This method limits the amount of deferred costs to its estimated realizable value, provided actual experience is comparable to that contemplated in the locked-in assumptions.
December 31, 2019 | 10-K
54
Inherent in the capitalization and amortization of DAC are certain management judgments about what acquisition costs are deferred, the ending asset balance and the annual amortization. Approximately
93.6%
of our capitalized DAC are attributed to first year and renewal excess commissions. The remaining
6.4%
are attributed to other costs that vary with and are directly related to the successful acquisition of new insurance business. Those costs generally include costs related to the production, underwriting and issuance of new business.
DAC is subject to recoverability testing at the time of policy issuance and loss recognition testing on an annual basis, or when an event occurs that might require loss recognition testing. If loss recognition or impairment is necessary, DAC would be written off to the extent that anticipated future premiums and investment income is insufficient to cover expected future policy benefits and expenses. Loss recognition testing considers, among other things, actual experience and projected future experience and calculates the available premium (gross premium less the benefit and expense portion of premium) for the next
50
years. DAC is evaluated for recoverability using best estimate assumptions. Based on the results of DAC recoverability testing and loss recognition testing, management believes that our DAC and related amortization for the years ended
December 31, 2019
,
2018
and
2017
limits the amount of deferred costs to its estimated realizable value.
COST OF INSURANCE ACQUIRED
Cost of Insurance Acquired ("COIA") is established when we purchase a block of insurance. COIA is amortized over the emerging profit of the related policies using the same assumptions as were used in computing liabilities for future policy benefits. Inherent in the amortization of COIA are certain management judgments about the ending asset balance and the annual amortization. The key assumptions used are based upon interest, mortality and lapses at the time of purchase.
A recoverability test that considers, among other things, actual experience and projected future experience is performed at least annually. These annual recoverability tests are based initially on an estimate of the available premium (gross premium less the benefit and expense portion of premium) for the next 50 years. Management believes that our COIA is recoverable for the years ended
December 31, 2019
and
2018
. This belief is based upon the analysis performed on estimated future results of the block and our annual recoverability testing.
GOODWILL
Current accounting guidance requires that goodwill balances be reviewed for impairment at least annually or more frequently if events occur or circumstances change that would indicate a triggering event has occurred. A reporting unit is defined as an operating segment or one level below an operating segment. The Company's reporting units, for which goodwill has been allocated, are equivalent to the Company's operating segment, as there is no discrete financial information reviewed and analyzed by management for the separate components of the segment or all of the components of the segment have similar economic characteristics.
Goodwill is tested for impairment on an annual basis or more frequently if indicators of potential impairment exist. The goodwill testing requires us to compare the estimated fair value of a reporting unit to its carrying value. If the carrying value of the reporting unit is lower than its estimated fair value, no further evaluation is required. If the carrying value of the reporting unit exceeds its estimated fair value, an impairment charge is recorded for that excess, limited to the total amount of goodwill allocated to that reporting unit. We have the option of performing an assessment of certain qualitative factors to determine if it is more likely than not that the fair value of a reporting unit is less than its carrying value or proceeding directly to a quantitative impairment test. Management’s determination of the fair value of each reporting unit under the accounting guidance incorporates multiple inputs including discounted cash flow calculations based on assumptions that market participants would make in valuing the reporting unit. Other assumptions can include levels of economic capital, future business growth, and earnings projections.
We elected to early adopt the FASB's issued Accounting Standards Update ("ASU") No. 2017-04,
Simplifying the Test for Goodwill Impairmen
t as of December 31, 2017.
Management’s determination of the fair value of each reporting unit incorporates multiple inputs including discounted cash flow calculations based on assumptions that market participants would make in valuing the reporting unit. Other assumptions can include levels of economic capital, future business growth, and earnings projections.
December 31, 2019 | 10-K
55
POLICY LIABILITIES
Future policy benefit reserves have been computed using the net level premium method with assumptions as to investment yields, dividends on participating business, mortality and withdrawals based upon our experience. The preparation of consolidated financial statements requires management to make estimates and assumptions that affect the reported amount of policy liabilities and the increase in future policy benefit reserves. Management's judgments and estimates for future policy benefit reserves provide for possible adverse deviation.
We continue to use the original assumptions (including a provision for the risk of adverse deviation) in subsequent periods to determine the changes in the liability for future policy benefits (the "lock-in concept”) unless a premium deficiency exists. Management monitors these assumptions and has determined that a premium deficiency did not exist as of
December 31, 2019
. Management believes that our policy liabilities and increase in future policy benefit reserves as of the years ended
December 31, 2019
,
2018
and
2017
are based upon assumptions, including a provision for the risk of adverse deviation, that do not warrant revision. Annually, the Company completes experience studies with respect to mortality, lapse, interest and expenses. The results of these studies are used for current year reserve adequacy testing, which includes loss recognition, goodwill, and establishing benefit liabilities and DAC for the following year's new issues.
CONTINGENCIES
An estimated loss from a contingency is accrued and charged to results of operations only if both of the following conditions are met:
|
1.
|
Information available prior to the issuance of the financial statements indicates that it is probable
(virtual certainty is not required) that an asset has been impaired or a liability incurred as of the date of the financial statements; and
|
|
2.
|
The amount of the loss can be reasonably estimated.
|
Reasonable estimation of a possible loss does not require estimating a single amount of the loss. It requires that a loss be accrued if it can be estimated within a range. If an amount within the range is a better estimate than any other amount within the range, that amount is accrued. If no amount within the range is a better estimate than any other amount, the minimum amount in the range is accrued.
A gain contingency is an uncertain situation that will be resolved in the future, possibly resulting in a gain. We do not allow the recognition of a gain contingency prior to settlement of the underlying event. If we were to have a gain contingency, we would disclose it in the notes to our consolidated financial statements.
PREMIUM REVENUE AND RELATED EXPENSES
Premiums on life and accident and health policies are reported as earned when due or, for short duration contracts, over the contract period on a pro rata basis. Benefits and expenses are associated with earned premiums and occur throughout the estimated life of the contracts. This matching is accomplished by means of provisions for future benefits and the capitalization and amortization of DAC.
Annuities are accounted for in a manner consistent with accounting for interest bearing financial instruments. Our primary annuity products do not include fees or other such charges.
TAX ACCOUNTING
Deferred tax assets and liabilities are recognized for the estimated future tax consequences attributable to differences between the financial statement carrying amounts of existing assets and liabilities and their respective tax bases. Deferred tax assets and liabilities are measured using enacted tax rates in effect for the year in which those temporary differences are expected to be recovered or settled. The effect on deferred tax assets and liabilities of a change in tax rates is recognized in net income in the period in which the change is enacted. Given the enactment of the Tax Act on December 22, 2017, we re-measured our deferred tax assets and deferred tax liabilities to the new corporate tax rate of 21%, which resulted in a $35.7 million tax expense in 2017. CICA Ltd., a wholly-owned subsidiary of Citizens, is considered a controlled foreign corporation for federal tax purposes. As a result, the insurance activity of CICA Ltd.
December 31, 2019 | 10-K
56
is subject to Subpart F of the IRC and is included in Citizens taxable income on its US federal income tax return and due to the 0% enacted tax rate in Bermuda there are no deferred taxes recorded for CICA Ltd.'s temporary differences.
RECENT ACCOUNTING PRONOUNCEMENTS
See
Item 8. Financial Statements and Supplementary Data
and "Accounting Pronouncements" in
Note 1. Accounting Pronouncements
in the notes to our consolidated financial statements.
|
Item 7A.
|
QUANTITATIVE AND QUALITATIVE DISCLOSURES ABOUT MARKET RISK
|
GENERAL
The nature of our business exposes us to market risk relative to our invested assets and policy liabilities. Market risk is the risk of loss that may occur when changes in interest rates and public equity prices adversely affect the value of our invested assets. Interest rate risk is our primary market risk exposure. Substantial and sustained increases or decreases in market interest rates can affect the fair value of our investments. The fair value of our fixed maturity portfolio generally increases when interest rates decrease and decreases when interest rates increase.
The following table summarizes net unrealized gains and losses as of the dates indicated.
|
|
December 31, 2019
|
December 31, 2018
|
||||||||||||||||
|
(In thousands)
|
Amortized
Cost |
Fair
Value |
Net Unrealized Gains
|
Amortized
Cost |
Fair
Value |
Net Unrealized Gains
|
||||||||||||
|
Total fixed maturities
|
$
|
1,293,853
|
|
1,377,959
|
|
84,106
|
|
1,223,747
|
|
1,231,039
|
|
7,292
|
|
|||||
|
Total equity securities
|
$
|
15,055
|
|
16,033
|
|
978
|
|
15,055
|
|
15,068
|
|
13
|
|
|||||
MARKET RISK RELATED TO INTEREST RATES
Our exposure to interest rate changes results from our significant holdings of fixed maturity investments and policy loans, both of which comprised over
95.6%
of our cash and investment portfolio as of
December 31, 2019
. These investments are mainly exposed to changes in U.S. Treasury rates. Our fixed maturities investments include bonds issued by U.S. Government-sponsored enterprises, U.S. Government bonds, securities issued by government agencies, state and municipal bonds, corporate bonds and other asset-backed securities.
38.9%
of the fixed maturities at market value at
December 31, 2019
were classified as state and political subdivisions, which are primarily municipal holdings. These holdings are diversified over several states with
19.4%
of our state and municipal securities concentrated in Texas.
Changes in interest rates typically have a sizable effect on the fair value of our debt and equities securities. The interest rate of the ten-year U.S. Treasury bond decreased to
1.92%
at
December 31, 2019
, from
2.69%
at
December 31, 2018
. Net unrealized gains on fixed maturity securities totaled
$84.1 million
at
December 31, 2019
, compared to
$7.3 million
at
December 31, 2018
, based upon bond interest rates in relation to the U.S. ten-year Treasury yield.
December 31, 2019 | 10-K
57
To manage interest risk, we perform periodic projections of asset and liability cash flows to evaluate the potential sensitivity of our investments and liabilities. We assess interest rate sensitivity on an annual basis with respect to our fixed maturities investments using hypothetical test scenarios that assume either upward or downward shifts in the prevailing interest rates. The Company performed an analysis of fair value changes using assumed 100 basis point shifts in interest rates, noting that the fair value of our fixed maturity investment portfolio of
$1.4 billion
would
decrease
by approximately
$72.2 million
to a fair value of
$1.3 billion
upon a 100 basis point increase. The following table shows the effects on the fair values of our fixed maturity investments based upon these scenarios.
|
|
Fair Values of Fixed Maturity Investments
|
||||||||||||||
|
(In thousands)
|
-100
|
0
|
+100
|
+200
|
+300
|
||||||||||
|
Assumed fair value
|
$
|
1,494,140
|
|
1,377,959
|
|
1,305,784
|
|
1,225,151
|
|
1,056,226
|
|
||||
While the test scenarios are for illustrative purposes only and do not reflect our expectations regarding future interest rates or the performance of fixed-income markets, it is a near-term change that illustrates the potential impact of such events. Due to the composition of our book of insurance business, we believe it is unlikely we would encounter large surrender activity due to an interest rate increase that would force us to dispose of our fixed maturities at a loss.
Our fixed maturity portfolio is exposed to call risk as a significant portion of the current holdings are callable. A decreasing interest rate environment can result in increased call activity as experienced over the past several years, and an increasing rate environment will likely result in securities being paid at their stated maturity.
There are no fixed maturities or other investments that we classify as trading instruments. All of fixed maturities were classified as available-for-sale based upon fair value at
December 31, 2019
. At
December 31, 2019
and
2018
, we had no investments in derivative instruments or subprime loans.
MARKET RISKS RELATED TO EQUITY PRICES
Changes in the level or volatility of equity prices affect the value of equity securities we hold as investments. Our equity investments portfolio represented
1.1%
of our total investments at
December 31, 2019
, with
97.2%
invested in diversified equity and bond mutual funds.
|
Item 8.
|
FINANCIAL STATEMENTS AND SUPPLEMENTARY DATA
|
Reference is made to the consolidated financial statements, the notes thereto, and the report of our independent registered public accounting firm, as listed on the table of contents.
All other schedules have been omitted as the required information is inapplicable or the information required is presented in the financial statements or the notes thereto filed elsewhere herein.
|
Item 9.
|
CHANGES IN AND DISAGREEMENTS WITH ACCOUNTANTS ON ACCOUNTING AND FINANCIAL DISCLOSURE
|
None.
|
Item 9A.
|
CONTROLS AND PROCEDURES
|
(a) EVALUATION OF DISCLOSURE CONTROLS AND PROCEDURES
We maintain disclosure controls and procedures (as defined in Rules 13a-15(e) and 15d-15(e) under the Securities Exchange Act of 1934, as amended (the "Exchange Act")) that are designed to ensure that information required to be disclosed in our reports filed or submitted under the Exchange Act is recorded, processed, summarized and reported within the time periods specified in the SEC’s rules and forms, and that such information is accumulated and
December 31, 2019 | 10-K
58
communicated to our management, including our principal executive officer and principal financial officer, to allow timely decisions regarding required disclosures.
Our management, including our principal executive officer and principal financial officer, evaluated the effectiveness of our disclosure controls and procedures pursuant to Rules 13a-15(e) and 15d-15(e) under the Exchange Act as of December 31, 2019, the end of the period covered by this Annual Report on Form 10-K. Based on such evaluation, our principal executive officer and principal financial officer concluded that our disclosure controls and procedures were effective at a reasonable assurance level as of December 31, 2019.
(b) MANAGEMENT REPORT ON INTERNAL CONTROL OVER FINANCIAL REPORTING
Management is responsible for establishing and maintaining adequate internal control over financial reporting as defined in Rules 13a-15(f) and 15d-15(f) of the Exchange Act. The Company’s internal control over financial reporting is designed to provide reasonable assurance regarding the reliability of financial reporting and the preparation of financial statements for external purposes in accordance with U.S. GAAP.
Because of its inherent limitations, internal control over financial reporting may not prevent or detect misstatements. Also, projections of any evaluation of effectiveness to future periods are subject to the risk that controls may become inadequate because of changes in conditions, or that the degree of compliance with the policies or procedures may deteriorate.
Management evaluated the design and operating effectiveness of internal control over financial reporting based on criteria established in
Internal Control - Integrated Framework (2013)
issued by the Committee of Sponsoring Organizations of the Treadway Commission ("COSO"). Based on this evaluation, management concluded that our internal control over financial reporting as of December 31, 2019 was effective.
Deloitte & Touche LLP, an independent registered public accounting firm, audited the effectiveness of our internal control over financial reporting as of December 31, 2019. Their attestation report is included in Item 9A(c) of this Annual Report.
December 31, 2019 | 10-K
59
(c) ATTESTATION REPORT OF INDEPENDENT REGISTERED PUBLIC ACCOUNTING FIRM
Report of Independent Registered Public Accounting Firm
To the Stockholders and the Board of Directors of Citizens, Inc.
Opinion on Internal Control over Financial Reporting
We have audited the internal control over financial reporting of Citizens, Inc. and consolidated subsidiaries (the "Company") as of December 31, 2019, based on criteria established in
Internal Control - Integrated Framework (2013)
issued by the Committee of Sponsoring Organizations of the Treadway Commission (COSO). In our opinion, the Company maintained, in all material respects, effective internal control over financial reporting as of December 31, 2019, based on criteria established in
Internal Control - Integrated Framework (2013)
issued by COSO.
We have also audited, in accordance with the standards of the Public Company Accounting Oversight Board (United States) (PCAOB), the consolidated financial statements as of and for the year ended December 31, 2019, of the Company and our report dated
March 11, 2020
, expressed an unqualified opinion on those consolidated financial statements.
Basis for Opinion
The Company’s management is responsible for maintaining effective internal control over financial reporting and for its assessment of the effectiveness of internal control over financial reporting, included in the accompanying Management Report on Internal Control over Financial Reporting. Our responsibility is to express an opinion on the Company’s internal control over financial reporting based on our audit. We are a public accounting firm registered with the PCAOB and are required to be independent with respect to the Company in accordance with the U.S. federal securities laws and the applicable rules and regulations of the Securities and Exchange Commission and the PCAOB.
We conducted our audit in accordance with the standards of the PCAOB. Those standards require that we plan and perform the audit to obtain reasonable assurance about whether effective internal control over financial reporting was maintained in all material respects. Our audit included obtaining an understanding of internal control over financial reporting, assessing the risk that a material weakness exists, testing and evaluating the design and operating effectiveness of internal control based on the assessed risk, and performing such other procedures as we considered necessary in the circumstances. We believe that our audit provides a reasonable basis for our opinion.
Definition and Limitations of Internal Control over Financial Reporting
A company’s internal control over financial reporting is a process designed to provide reasonable assurance regarding the reliability of financial reporting and the preparation of financial statements for external purposes in accordance with generally accepted accounting principles. A company’s internal control over financial reporting includes those policies and procedures that (1) pertain to the maintenance of records that, in reasonable detail, accurately and fairly reflect the transactions and dispositions of the assets of the company; (2) provide reasonable assurance that transactions are recorded as necessary to permit preparation of financial statements in accordance with generally accepted accounting principles, and that receipts and expenditures of the company are being made only in accordance with authorizations of management and directors of the company; and (3) provide reasonable assurance regarding prevention or timely detection of unauthorized acquisition, use, or disposition of the company’s assets that could have a material effect on the financial statements.
Because of its inherent limitations, internal control over financial reporting may not prevent or detect misstatements. Also, projections of any evaluation of effectiveness to future periods are subject to the risk that controls may become inadequate because of changes in conditions, or that the degree of compliance with the policies or procedures may deteriorate.
/s/ DELOITTE & TOUCHE LLP
Austin, Texas
March 11, 2020
December 31, 2019 | 10-K
60
(d) CHANGES IN INTERNAL CONTROL OVER FINANCIAL REPORTING
There were no changes in our internal control over financial reporting during the quarter ended December 31, 2019 that have materially affected, or are reasonably likely to materially affect, our internal control over financial reporting, except as described below.
As disclosed in our Annual Report on
Form 10-K
for the year ended December 31, 2018, management identified a material weakness in our internal control over financial reporting as of December 31, 2018 related to ineffectively designing and maintaining controls to analyze and account for significant and unusual transactions.
A material weakness, as defined in Rule 12b-2 of the Exchange Act, is a deficiency, or combination of deficiencies, in internal control over financial reporting, such that there is a reasonable possibility that a material misstatement of our annual or interim financial statements will not be prevented or detected on a timely basis.
During 2019, management, with oversight from our principal executive officer and principal financial officer, established policies and procedures to identify significant and unusual transactions, assess related risks, evaluate technical accounting implications, and document and communicate any significant and unusual transactions. We have designed and implemented controls to identify such transactions and review sufficiently detailed analysis to evaluate the accounting treatment for significant and unusual transactions on a timely basis.
Item 9B.
OTHER INFORMATION
None.
PART III
The information in this Part III indicated below is incorporated by reference from other sections of this Annual Report on Form 10-K or from our definitive proxy statement pursuant to General Instruction G(3) of Form 10-K. We plan to file our definitive proxy statement for our
2020
annual meeting of shareholders within 120 days after
December 31, 2019
.
Item 10.
DIRECTORS, EXECUTIVE OFFICERS AND CORPORATE GOVERNANCE
Item 10 of this Annual Report on Form 10-K incorporates by reference the information in the sections entitled "Corporate Governance," "Audit Matters," "Directors" and "Executive Officers" in our Proxy Statement.
Item 11.
EXECUTIVE COMPENSATION
Item 11 of this Annual Report on Form 10-K incorporates by reference the information in the sections entitled "Directors - Director Compensation," "Executive Compensation" and "Corporate Governance - Compensation Committee Interlocks and Insider Participation" in our Proxy Statement.
Item 12.
SECURITY OWNERSHIP OF CERTAIN BENEFICIAL OWNERS AND MANAGEMENT AND RELATED STOCKHOLDER MATTERS
Item 12 of this Annual Report on Form 10-K incorporates by reference the information in the sections entitled "Control of the Company and Share Ownership - Security Ownership of Directors and Management" and "Control of the Company and Share Ownership - Security Ownership of Certain Beneficial Owners" in our Proxy Statement and the information in this Annual Report on Form 10-K under the heading "Item 5 - Market for Registrant’s Common Equity, Related Stockholder Matters and Issuer Purchases of Equity Securities - Securities Authorized for Issuance under Equity Compensation Plans."
December 31, 2019 | 10-K
61
Item 13.
CERTAIN RELATIONSHIPS AND RELATED TRANSACTIONS, AND DIRECTOR INDEPENDENCE
Item 13 of this Annual Report on Form 10-K incorporates by reference the information in the sections entitled "Corporate Governance - Director Independence" and "Corporate Governance - Certain Relationships and Related Party Transactions" in our Proxy Statement.
Item 14.
PRINCIPAL ACCOUNTING FEES AND SERVICES
Item 14 of this Annual Report on Form 10-K incorporates by reference the information in the section entitled "Audit Matters" in our Proxy Statement.
December 31, 2019 | 10-K
62
PART IV
Item 15.
EXHIBITS, FINANCIAL STATEMENT SCHEDULES
|
(a)
|
Documents filed as part of this Report
|
(1) and (2) Financial Statements and Schedules
The financial statements and schedules listed on the following index to financial statements and financial statement schedules are filed under
Item 8
as part of this Form 10-K.
|
Index to Consolidated Financial Statements and Financial Statement Schedules
|
Page
Reference
|
|
Report of Independent Registered Public Accounting Firm
|
|
|
Consolidated Balance Sheets at December 31, 2019 and 2018
|
|
|
Consolidated Statements of Operations and Comprehensive Income (Loss) - years ended December 31, 2019, 2018 and 2017
|
|
|
Consolidated Statements of Stockholders' Equity - years ended December 31, 2019, 2018 and 2017
|
|
|
Consolidated Statements of Cash Flows - years ended December 31, 2019, 2018 and 2017
|
|
|
Notes to Consolidated Financial Statements
|
|
|
Schedule II – Condensed Financial Information of Registrant
|
|
|
Schedule III – Consolidated Supplementary Insurance Information
|
|
|
Schedule IV – Consolidated Statement of Reinsurance
|
|
All other schedules have been omitted because the required information is inapplicable or the information required is presented in the consolidated financial statements or the notes thereto filed elsewhere herein.
(3) Exhibits
See the Index of
Exhibits
.
December 31, 2019 | 10-K
63
Report of Independent Registered Public Accounting Firm
To the Stockholders and the Board of Directors of Citizens, Inc.
Opinion on the Consolidated Financial Statements
We have audited the accompanying consolidated balance sheets of Citizens, Inc. and consolidated subsidiaries (the “Company”) as of December 31, 2019 and 2018, the related consolidated statements of operations and comprehensive income (loss), stockholders’ equity, and cash flows, for each of the three years in the period ended December 31, 2019, and the related notes and the schedules listed in the Index at Item 15(b) (collectively referred to as the “consolidated financial statements”). In our opinion, the consolidated financial statements present fairly, in all material respects, the financial position of the Company as of December 31, 2019 and 2018, and the results of its operations and its cash flows for each of the three years in the period ended December 31, 2019, in conformity with accounting principles generally accepted in the United States of America.
We have also audited, in accordance with the standards of the Public Company Accounting Oversight Board (United States) (PCAOB), the Company’s internal control over financial reporting as of December 31, 2019, based on criteria established in
Internal Control - Integrated Framework (2013)
issued by the Committee of Sponsoring Organizations of the Treadway Commission and our report dated March 11, 2020, expressed an unqualified opinion on the Company’s internal control over financial reporting.
Basis for Opinion
These consolidated financial statements are the responsibility of the Company’s management. Our responsibility is to express an opinion on the Company’s consolidated financial statements based on our audits. We are a public accounting firm registered with the PCAOB and are required to be independent with respect to the Company in accordance with the U.S. federal securities laws and the applicable rules and regulations of the Securities and Exchange Commission and the PCAOB.
We conducted our audits in accordance with the standards of the PCAOB. Those standards require that we plan and perform the audit to obtain reasonable assurance about whether the consolidated financial statements are free of material misstatement, whether due to error or fraud. Our audits included performing procedures to assess the risks of material misstatement of the consolidated financial statements, whether due to error or fraud, and performing procedures that respond to those risks. Such procedures included examining, on a test basis, evidence regarding the amounts and disclosures in the consolidated financial statements. Our audits also included evaluating the accounting principles used and significant estimates made by management, as well as evaluating the overall presentation of the consolidated financial statements. We believe that our audits provide a reasonable basis for our opinion.
/s/ DELOITTE & TOUCHE LLP
Austin, Texas
March 11, 2020
We have served as the Company’s auditor since 2017.
December 31, 2019 | 10-K
64
|
CITIZENS, INC. AND CONSOLIDATED SUBSIDIARIES
Consolidated Balance Sheets
|
|||||||
|
December 31,
(In thousands) |
2019
|
2018
|
|||||
|
Assets
|
|||||||
|
Investments:
|
|
||||||
|
Fixed maturities available-for-sale, at fair value (amortized cost: $1,293,853 and $1,223,747 in 2019 and 2018, respectively)
|
$
|
1,377,959
|
|
1,231,039
|
|
||
|
Equity securities, at fair value
|
16,033
|
|
15,068
|
|
|||
|
Policy loans
|
82,005
|
|
80,825
|
|
|||
|
Real estate held for investment (less $1,284 accumulated depreciation in 2018)
|
—
|
|
5,718
|
|
|||
|
Real estate held for sale (less $1,325 and $4,411 accumulated depreciation in 2019 and 2018, respectively)
|
2,571
|
|
1,483
|
|
|||
|
Other long-term investments
|
385
|
|
208
|
|
|||
|
Short-term investments
|
1,301
|
|
7,865
|
|
|||
|
Total investments
|
1,480,254
|
|
1,342,206
|
|
|||
|
Cash and cash equivalents
|
46,205
|
|
45,492
|
|
|||
|
Accrued investment income
|
17,453
|
|
18,467
|
|
|||
|
Reinsurance recoverable
|
3,696
|
|
3,664
|
|
|||
|
Deferred policy acquisition costs
|
149,249
|
|
155,747
|
|
|||
|
Cost of insurance acquired
|
13,455
|
|
15,225
|
|
|||
|
Goodwill and other intangible assets
|
13,575
|
|
13,580
|
|
|||
|
Property and equipment, net
|
5,904
|
|
5,943
|
|
|||
|
Due premiums
|
12,656
|
|
13,325
|
|
|||
|
Other assets
|
2,489
|
|
1,912
|
|
|||
|
Total assets
|
$
|
1,744,936
|
|
1,615,561
|
|
||
See accompanying Notes to Consolidated Financial Statements.
December 31, 2019 | 10-K
65
|
CITIZENS, INC. AND CONSOLIDATED SUBSIDIARIES
Consolidated Balance Sheets
|
|||||||
|
December 31, continued
(In thousands) |
2019
|
2018
|
|||||
|
Liabilities and Stockholders' Equity
|
|||||||
|
Liabilities:
|
|
||||||
|
Policy liabilities:
|
|
|
|||||
|
Future policy benefit reserves:
|
|
|
|||||
|
Life insurance
|
$
|
1,218,757
|
|
1,179,946
|
|
||
|
Annuities
|
76,380
|
|
76,377
|
|
|||
|
Accident and health
|
1,031
|
|
944
|
|
|||
|
Dividend accumulations
|
29,211
|
|
26,250
|
|
|||
|
Premiums paid in advance
|
43,102
|
|
48,553
|
|
|||
|
Policy claims payable
|
8,059
|
|
7,614
|
|
|||
|
Other policyholders' funds
|
18,192
|
|
10,760
|
|
|||
|
Total policy liabilities
|
1,394,732
|
|
1,350,444
|
|
|||
|
Commissions payable
|
2,514
|
|
1,901
|
|
|||
|
Deferred federal income tax liability, net
|
12,428
|
|
5,709
|
|
|||
|
Current federal income tax payable
|
44,622
|
|
41,281
|
|
|||
|
Other liabilities
|
30,804
|
|
28,493
|
|
|||
|
Total liabilities
|
1,485,100
|
|
1,427,828
|
|
|||
|
Commitments and contingencies (Notes 5 and 7)
|
|
|
|
|
|||
|
Stockholders' Equity:
|
|
|
|
|
|||
|
Common stock:
|
|
|
|
|
|||
|
Class A, no par value, 100,000,000 shares authorized, 52,364,993 and 52,215,852 shares issued and outstanding in 2019 and 2018, respectively, including shares in treasury of 3,135,738 in 2019 and 2018
|
261,515
|
|
259,793
|
|
|||
|
Class B, no par value, 2,000,000 shares authorized, 1,001,714 shares issued and outstanding in 2019 and 2018
|
3,184
|
|
3,184
|
|
|||
|
Accumulated deficit
|
(70,969
|
)
|
(69,599
|
)
|
|||
|
Accumulated other comprehensive income:
|
|
|
|||||
|
Net unrealized gains on debt securities, net of tax
|
77,117
|
|
5,366
|
|
|||
|
Treasury stock, at cost
|
(11,011
|
)
|
(11,011
|
)
|
|||
|
Total stockholders' equity
|
259,836
|
|
187,733
|
|
|||
|
Total liabilities and stockholders' equity
|
$
|
1,744,936
|
|
1,615,561
|
|
||
See accompanying Notes to Consolidated Financial Statements.
December 31, 2019 | 10-K
66
|
CITIZENS, INC. AND CONSOLIDATED SUBSIDIARIES
Consolidated Statements of Operations and Comprehensive Income (Loss)
|
||||||||||
|
Years Ended December 31,
(In thousands, except share amounts) |
2019
|
2018
|
2017
|
|||||||
|
Revenues:
|
||||||||||
|
Premiums
|
||||||||||
|
Life insurance
|
$
|
178,351
|
|
181,825
|
|
191,342
|
|
|||
|
Accident and health insurance
|
1,383
|
|
1,218
|
|
1,392
|
|
||||
|
Property insurance
|
4,613
|
|
4,817
|
|
4,986
|
|
||||
|
Net investment income
|
59,531
|
|
54,205
|
|
53,146
|
|
||||
|
Realized investment gains, net
|
5,249
|
|
108
|
|
518
|
|
||||
|
Other income
|
1,418
|
|
1,833
|
|
1,243
|
|
||||
|
Total revenues
|
250,545
|
|
244,006
|
|
252,627
|
|
||||
|
Benefits and Expenses:
|
|
|
|
|
||||||
|
Insurance benefits paid or provided:
|
|
|
|
|
||||||
|
Claims and surrenders
|
106,827
|
|
91,103
|
|
82,905
|
|
||||
|
Increase in future policy benefit reserves
|
41,712
|
|
47,947
|
|
76,029
|
|
||||
|
Policyholders' dividends
|
6,040
|
|
6,362
|
|
6,268
|
|
||||
|
Total insurance benefits paid or provided
|
154,579
|
|
145,412
|
|
165,202
|
|
||||
|
Commissions
|
34,222
|
|
34,962
|
|
41,324
|
|
||||
|
Other general expenses
|
48,440
|
|
47,632
|
|
46,388
|
|
||||
|
Capitalization of deferred policy acquisition costs
|
(22,255
|
)
|
(22,695
|
)
|
(29,120
|
)
|
||||
|
Amortization of deferred policy acquisition costs
|
28,268
|
|
34,235
|
|
29,690
|
|
||||
|
Amortization of cost of insurance acquired
|
1,546
|
|
2,458
|
|
2,129
|
|
||||
|
Total benefits and expenses
|
244,800
|
|
242,004
|
|
255,613
|
|
||||
|
Income (loss) before federal income tax
|
5,745
|
|
2,002
|
|
(2,986
|
)
|
||||
|
Federal income tax expense
|
7,115
|
|
13,064
|
|
35,141
|
|
||||
|
Net loss
|
(1,370
|
)
|
(11,062
|
)
|
(38,127
|
)
|
||||
|
Per Share Amounts:
|
|
|
|
|
||||||
|
Basic and diluted loss per share of Class A common stock
|
$
|
(0.03
|
)
|
(0.22
|
)
|
(0.77
|
)
|
|||
|
Basic and diluted loss per share of Class B common stock
|
(0.01
|
)
|
(0.11
|
)
|
(0.38
|
)
|
||||
|
Other Comprehensive Income (Loss):
|
||||||||||
|
Unrealized gains (losses) on debt securities:
|
||||||||||
|
Unrealized holding gains (losses) arising during period
|
78,825
|
|
(30,639
|
)
|
17,666
|
|
||||
|
Reclassification adjustment for losses (gains) included in net income
|
(1,927
|
)
|
(953
|
)
|
546
|
|
||||
|
Unrealized gains (losses) on debt securities, net
|
76,898
|
|
(31,592
|
)
|
18,212
|
|
||||
|
Income tax expense (benefit) on unrealized gains (losses) on debt securities
|
5,147
|
|
(6,464
|
)
|
5,672
|
|
||||
|
Other comprehensive income (loss)
|
71,751
|
|
(25,128
|
)
|
12,540
|
|
||||
|
Total comprehensive income (loss)
|
$
|
70,381
|
|
(36,190
|
)
|
(25,587
|
)
|
|||
See accompanying Notes to Consolidated Financial Statements.
December 31, 2019 | 10-K
67
|
CITIZENS, INC. AND CONSOLIDATED SUBSIDIARIES
Consolidated Statements of Stockholders' Equity
|
||||||||||||||||||
|
|
Common Stock
|
Accumulated
deficit
|
Accumulated
other
comprehensive
income (loss)
|
Treasury
stock
|
Total
Stock-holders'
equity
|
|||||||||||||
|
(In thousands)
|
Class A
|
Class B
|
||||||||||||||||
|
Balance at December 31, 2016
|
$
|
259,383
|
|
3,184
|
|
(16,248
|
)
|
13,792
|
|
(11,011
|
)
|
249,100
|
|
|||||
|
Comprehensive income (loss)
|
|
|
|
|
|
|
|
|
|
|
|
|
||||||
|
Net loss
|
—
|
|
—
|
|
(38,127
|
)
|
—
|
|
—
|
|
(38,127
|
)
|
||||||
|
Unrealized investment gains, net
|
—
|
|
—
|
|
—
|
|
12,540
|
|
—
|
|
12,540
|
|
||||||
|
Total comprehensive income (loss)
|
—
|
|
—
|
|
(38,127
|
)
|
12,540
|
|
—
|
|
(25,587
|
)
|
||||||
|
Balance at December 31, 2017
|
259,383
|
|
3,184
|
|
(54,375
|
)
|
26,332
|
|
(11,011
|
)
|
223,513
|
|
||||||
|
Accounting standards adopted January 1, 2018
(1)
|
—
|
|
—
|
|
(4,162
|
)
|
4,162
|
|
—
|
|
—
|
|
||||||
|
Balance at January 1, 2018
|
259,383
|
|
3,184
|
|
(58,537
|
)
|
30,494
|
|
(11,011
|
)
|
223,513
|
|
||||||
|
Comprehensive loss
|
|
|
|
|
|
|
|
|
|
|
|
|
||||||
|
Net loss
|
—
|
|
—
|
|
(11,062
|
)
|
—
|
|
—
|
|
(11,062
|
)
|
||||||
|
Unrealized investment losses, net
|
—
|
|
—
|
|
—
|
|
(28,498
|
)
|
—
|
|
(28,498
|
)
|
||||||
|
Unrealized gain from held-to-maturity securities transferred to available-for-sale, net
|
—
|
|
—
|
|
—
|
|
3,370
|
|
—
|
|
3,370
|
|
||||||
|
Total comprehensive loss
|
—
|
|
—
|
|
(11,062
|
)
|
(25,128
|
)
|
—
|
|
(36,190
|
)
|
||||||
|
Stock-based compensation
|
410
|
|
—
|
|
—
|
|
—
|
|
—
|
|
410
|
|
||||||
|
Balance at December 31, 2018
|
259,793
|
|
3,184
|
|
(69,599
|
)
|
5,366
|
|
(11,011
|
)
|
187,733
|
|
||||||
|
Comprehensive income (loss)
|
|
|
|
|
|
|
|
|
|
|
|
|
||||||
|
Net loss
|
—
|
|
—
|
|
(1,370
|
)
|
—
|
|
—
|
|
(1,370
|
)
|
||||||
|
Unrealized investment gains, net
|
—
|
|
—
|
|
—
|
|
71,751
|
|
—
|
|
71,751
|
|
||||||
|
Total comprehensive income (loss)
|
—
|
|
—
|
|
(1,370
|
)
|
71,751
|
|
—
|
|
70,381
|
|
||||||
|
Stock-based compensation
|
1,722
|
|
—
|
|
—
|
|
—
|
|
—
|
|
1,722
|
|
||||||
|
Balance at December 31, 2019
|
$
|
261,515
|
|
3,184
|
|
(70,969
|
)
|
77,117
|
|
(11,011
|
)
|
259,836
|
|
|||||
(1)
See Note 1 in the Notes to Consolidated Financial Statements for more details.
See accompanying Notes to Consolidated Financial Statements.
December 31, 2019 | 10-K
68
|
CITIZENS, INC. AND CONSOLIDATED SUBSIDIARIES
Consolidated Statements of Cash Flows
|
|||||||||
|
Years Ended December 31,
(In thousands) |
2019
|
2018
|
2017
|
||||||
|
Cash flows from operating activities:
|
|
||||||||
|
Net loss
|
$
|
(1,370
|
)
|
(11,062
|
)
|
(38,127
|
)
|
||
|
Adjustments to reconcile net loss to net cash provided by operating activities:
|
|
|
|
|
|
|
|||
|
Realized investment gains on sale of investments and other assets
|
(5,249
|
)
|
(108
|
)
|
(518
|
)
|
|||
|
Net deferred policy acquisition costs
|
6,013
|
|
11,540
|
|
570
|
|
|||
|
Amortization of cost of insurance acquired
|
1,546
|
|
2,458
|
|
2,129
|
|
|||
|
Depreciation
|
1,677
|
|
1,451
|
|
1,065
|
|
|||
|
Amortization of premiums and discounts on investments
|
12,859
|
|
16,998
|
|
16,606
|
|
|||
|
Stock-based compensation
|
2,099
|
|
410
|
|
—
|
|
|||
|
Deferred federal income tax expense
|
1,573
|
|
62,633
|
|
20,687
|
|
|||
|
Impairment of goodwill
|
—
|
|
—
|
|
4,631
|
|
|||
|
Change in:
|
|
|
|
|
|
|
|||
|
Accrued investment income
|
1,014
|
|
595
|
|
(1,159
|
)
|
|||
|
Reinsurance recoverable
|
(32
|
)
|
51
|
|
147
|
|
|||
|
Due premiums
|
669
|
|
(560
|
)
|
87
|
|
|||
|
Future policy benefit reserves
|
41,479
|
|
48,496
|
|
75,920
|
|
|||
|
Other policyholders' liabilities
|
5,387
|
|
940
|
|
5,860
|
|
|||
|
Federal income tax payable
|
3,341
|
|
(52,079
|
)
|
11,808
|
|
|||
|
Commissions payable and other liabilities
|
2,924
|
|
3,609
|
|
(6,753
|
)
|
|||
|
Other, net
|
(1,707
|
)
|
(752
|
)
|
59
|
|
|||
|
Net cash provided by operating activities
|
72,223
|
|
84,620
|
|
93,012
|
|
|||
|
Cash flows from investing activities:
|
|
|
|
|
|
|
|||
|
Sales of fixed maturities, available-for-sale
|
66,900
|
|
38,823
|
|
1,077
|
|
|||
|
Maturities and calls of fixed maturities, available-for-sale
|
181,618
|
|
65,906
|
|
74,902
|
|
|||
|
Maturities and calls of fixed maturities, held-to-maturity
|
—
|
|
20,699
|
|
9,095
|
|
|||
|
Purchases of fixed maturities, available-for-sale
|
(329,627
|
)
|
(195,001
|
)
|
(167,699
|
)
|
|||
|
(Increase) decrease in equity securities
|
—
|
|
(9
|
)
|
2,390
|
|
|||
|
Principal payments on mortgage loans
|
9
|
|
9
|
|
37
|
|
|||
|
Increase in policy loans, net
|
(1,180
|
)
|
(7,090
|
)
|
(7,063
|
)
|
|||
|
Sales of other long-term investments and real estate
|
6,983
|
|
14
|
|
3,041
|
|
|||
|
Purchases of other long-term investments and real estate
|
(187
|
)
|
—
|
|
—
|
|
|||
|
Purchases of property and equipment
|
(511
|
)
|
(724
|
)
|
(1,326
|
)
|
|||
|
Sales of property and equipment
|
16
|
|
89
|
|
41
|
|
|||
|
Maturities of short-term investments
|
9,090
|
|
—
|
|
500
|
|
|||
|
Purchases of short-term investments
|
(2,456
|
)
|
(7,850
|
)
|
—
|
|
|||
|
Net cash used in investing activities
|
(69,345
|
)
|
(85,134
|
)
|
(85,005
|
)
|
|||
|
See accompanying Notes to Consolidated Financial Statements.
|
|||||||||
December 31, 2019 | 10-K
69
|
CITIZENS, INC. AND CONSOLIDATED SUBSIDIARIES
Consolidated Statements of Cash Flows, Continued
|
|||||||||
|
Years Ended December 31,
(In thousands) |
2019
|
2018
|
2017
|
||||||
|
|
|||||||||
|
Cash flows from financing activities:
|
|
||||||||
|
Annuity deposits
|
$
|
6,717
|
|
7,265
|
|
9,346
|
|
||
|
Annuity withdrawals
|
(8,505
|
)
|
(7,323
|
)
|
(6,799
|
)
|
|||
|
Other
|
(377
|
)
|
—
|
|
—
|
|
|||
|
Net cash provided by (used in) financing activities
|
(2,165
|
)
|
(58
|
)
|
2,547
|
|
|||
|
Net increase (decrease) in cash and cash equivalents
|
713
|
|
(572
|
)
|
10,554
|
|
|||
|
Cash and cash equivalents at beginning of year
|
45,492
|
|
46,064
|
|
35,510
|
|
|||
|
Cash and cash equivalents at end of year
|
$
|
46,205
|
|
45,492
|
|
46,064
|
|
||
|
Supplemental Disclosure of Operating Activities:
|
|
|
|
|
|
|
|||
|
Cash paid during the year for income taxes
|
$
|
2,200
|
|
2,510
|
|
2,675
|
|
||
SUPPLEMENTAL DISCLOSURE OF NONCASH INVESTING AND FINANCING ACTIVITIES:
During
2019
,
2018
and
2017
, various fixed maturity issuers exchanged securities with book values of
$16.8 million
,
$2.5 million
and
$4.8 million
, respectively, for securities of equal value.
See accompanying Notes to Consolidated Financial Statements.
December 31, 2019 | 10-K
70
(1)
SUMMARY OF SIGNIFICANT ACCOUNTING POLICIES
BASIS OF PRESENTATION AND CONSOLIDATION
The accompanying consolidated financial statements of Citizens, Inc. and its wholly-owned subsidiaries have been prepared in conformity with U.S. generally accepted accounting principles ("U.S. GAAP").
The consolidated financial statements include the accounts and operations of Citizens, Inc. ("Citizens"), a Colorado corporation, and its wholly-owned subsidiaries, CICA Life Insurance Company of America ("CICA"), CICA Life Ltd. ("CICA Ltd."), Citizens National Life Insurance Company ("CNLIC"), Security Plan Life Insurance Company ("SPLIC"), Security Plan Fire Insurance Company ("SPFIC"), Magnolia Guaranty Life Insurance Company ("MGLIC"), and Computing Technology, Inc. ("CTI"). All significant inter-company accounts and transactions have been eliminated. Citizens and its wholly-owned subsidiaries are collectively referred to as "the Company," "we," or "our."
Our Life Insurance segment operates through CICA Ltd., CICA and CNLIC. CICA Ltd. issues U.S. Dollar-denominated endowment contracts internationally, which are principally accumulation contracts that incorporate an element of life insurance protection and ordinary whole life insurance in U.S. Dollar-denominated amounts sold to foreign residents. These contracts are designed to provide a fixed amount of insurance coverage over the life of the insured and may utilize rider benefits to provide additional increasing or decreasing coverage and annuity benefits to enhance accumulations. Our domestic life insurance business, which operates through CICA and CNLIC, primarily focused on living needs and provided benefits toward accumulating financial benefits for the policyowners throughout the Midwest and southern U.S. until they ceased most domestic sales beginning January 1, 2017.
Our Home Service Insurance segment operates through our subsidiaries SPLIC, MGLIC and SPFIC, and focuses on the life insurance needs of the middle and lower income markets, primarily in Louisiana, Mississippi and Arkansas. Our products in this segment consist primarily of small face amount ordinary whole life and pre-need policies, which are designed to fund final expenses for the insured, primarily consisting of funeral and burial costs as well as limited liability, named peril property policies covering dwelling and contents.
SIGNIFICANT ACCOUNTING POLICIES
INVESTMENTS
Investment securities are classified as held-to-maturity, available-for-sale or trading. Management determines the appropriate classification at the time of purchase. The classification of securities is significant since it directly impacts the accounting for unrealized gains and losses on securities. Fixed maturity securities are classified as held-to-maturity and carried at amortized cost when management has the positive intent and the Company has the ability to hold the securities to maturity. Securities not classified as held-to-maturity are classified as available-for-sale and are carried at fair value, with the unrealized holding gains and losses, net of tax, reported in other comprehensive income and are not reported in earnings until realized. Fixed maturities consist primarily of bonds classified as available-for-sale or held-to-maturity. The Company does not classify any fixed maturities as trading and beginning September 30, 2018, the Company no longer classifies any fixed maturities as held-to-maturity. Equity securities are measured at fair value beginning January 1, 2018, with the change in fair value recorded through net income. Prior to 2018, changes in equity security fair values were a component of accumulated other comprehensive income.
Unrealized gains (losses) of fixed maturities held as available-for-sale is shown as a separate component of stockholders' equity, net of tax, and is a separate component of comprehensive income.
The Company evaluates all securities on a quarterly basis, and more frequently when economic conditions warrant additional evaluations, in determining if an other-than-temporary impairment ("OTTI") exists pursuant to the accounting guidelines. In evaluating the possible impairment of securities, consideration is given to the length of time and the extent to which the fair value has been less than amortized cost, the financial conditions and near-term prospects of the issuer, and the ability and intent of the Company to retain its investment in the issuer for a period of time sufficient to allow for any anticipated recovery in fair value. In analyzing an issuer’s financial condition, the Company may consider whether the securities are issued by the Federal government or its agencies, by government-sponsored
December 31, 2019 | 10-K
71
agencies, or whether downgrades by bond rating agencies have occurred, and reviews of the issuer’s financial condition.
Premiums and discounts are amortized or accreted over the life of the related security as an adjustment to yield using the effective interest method. Dividend and interest income is recognized when earned. Realized gains and losses are included in earnings and are derived using the specific identification method for determining the cost of securities sold.
If management determines that an investment experienced an OTTI, management must then determine the amount of OTTI to be recognized in earnings. If management does not intend to sell the security and it is more likely than not that the Company will not be required to sell the security before recovery of its amortized cost basis less any current period loss, the OTTI will be separated into the amount representing the credit loss and the amount related to all other factors. The amount of OTTI related to the credit loss is determined based on the present value of cash flows expected to be collected and is recognized in earnings. The amount of OTTI related to other factors will be recognized in other comprehensive income, net of applicable taxes. The previous amortized cost basis less the OTTI recognized in earnings will become the new amortized cost basis of the investment. If management intends to sell the security or more likely than not will be required to sell the security before recovery of its amortized cost basis less any current period credit loss, the OTTI will be recognized in earnings equal to the entire difference between the investment's amortized cost basis and its fair value at the consolidated financial statement date. Any recoveries related to the value of these securities are recorded as an unrealized gain (as other comprehensive income (loss) in stockholders' equity) and not recognized in income until the security is ultimately sold.
The Company from time to time may dispose of an impaired security in response to asset/liability management decisions, future market movements, business plan changes, or if the net proceeds can be reinvested at a rate of return that is expected to recover the loss within a reasonable period of time.
Policy loans are reported at unpaid principal balances.
Real estate held for investment consists primarily of land and buildings that are recorded at depreciated cost. If the fair value of the real estate is less than the carrying value, an impairment loss is recognized and charged to earnings.
Real estate held for sale at December 31, 2019 consisted of the Citizens Academy training facility located near Austin, Texas and at December 31, 2018 consisted of the Company's previous home office location which was sold during 2019.
Other long-term investments consists primarily of Federal Home Loan Bank ("FHLB") common stock and mortgage loans. Mortgage loans on real estate are reported at unpaid principal balances.
The Company had cash equivalents and fixed maturities with an aggregate fair value of
$9.6 million
and
$9.5 million
at
December 31, 2019
and
2018
, respectively, on deposit with various state regulatory authorities to fulfill statutory requirements.
CASH EQUIVALENTS
The Company considers cash equivalents as all securities whose duration does not exceed 90 days at the date of acquisition.
SHORT-TERM INVESTMENTS
The Company considers investments maturing within one year at acquisition as short-term. These securities are carried at fair value.
December 31, 2019 | 10-K
72
REINSURANCE RECOVERABLE
Reinsurance recoverable includes expected reimbursements for policyholder claim amounts in excess of the Company's retention, as well as profit sharing and experience refund accruals. Reinsurance recoverable is reduced for estimated uncollectible amounts, if any.
Reinsurance premiums, benefits and expenses are accounted for on a basis consistent with those used in accounting for the original policies issued and the terms of the reinsurance contracts. The cost of reinsurance related to long duration contracts is accounted for over the life of the underlying reinsured policies using assumptions consistent with those used to account for the underlying policies. The cost of reinsurance related to short duration contracts is accounted for over the coverage period. Profit-sharing and similar adjustable provisions are accrued based on the experience of the underlying policies.
DEFERRED POLICY ACQUISITION COSTS
Acquisition costs, consisting of commissions and policy issuance, underwriting and agent convention expenses that are directly related to and vary with the successful production of new business are deferred. These deferred amounts, referred to as deferred policy acquisition costs ("DAC"), are recorded as an asset on the consolidated balance sheets and amortized to income in a systematic manner, based on related contract revenues or gross profits as appropriate.
Traditional life insurance and accident and health insurance acquisition costs are amortized over the premium-paying period of the related policies using assumptions consistent with those used in computing future policy benefit liabilities. For universal life type contracts and investment contracts that include significant surrender charges or that yield significant revenues from sources other than the investment contract holders' funds, the deferred contract acquisition cost amortization is matched to the recognition of gross profit. The effect on the DAC asset that would result from realization of unrealized gains or losses is recognized with an offset to accumulated other comprehensive income in consolidated stockholders' equity. If an internal replacement of insurance or investment contract modification substantially changes a contract as defined in current accounting guidance, then the DAC is written off immediately through income and any new deferrable costs associated with the new replacement are deferred. If a contract modification does not substantially change the contract, the DAC amortization on the original contract will continue and any acquisition costs associated with the related modification are immediately expensed.
The ending DAC asset balance is calculated at a seriatim level for policies in force at the end of each reporting period based on the remaining unamortized asset. The assumptions used to calculate DAC are set when a policy is issued and do not change with changes in actual experience, unless a loss recognition event occurs. The seriatim method ensures that policies lapsed or surrendered during the reporting period are no longer included in the DAC calculation. This method limits the amount of deferred costs to its estimated realizable value, provided actual experience is comparable to that contemplated in the locked-in assumptions.
Inherent in the capitalization and amortization of DAC are certain management judgments about what acquisition costs are deferred, the ending asset balance and the annual amortization. Approximately
93.6%
of our capitalized DAC are attributed to first year and renewal excess commissions. The remaining
6.4%
are attributed to costs that vary with and are directly related to the successful acquisition of new insurance business. Those costs generally include costs related to the production, underwriting and issuance of new business.
DAC is subject to recoverability testing at the time of policy issuance and loss recognition testing on an annual basis, or when an event occurs that might require loss recognition testing. If loss recognition or impairment is necessary, DAC would be written off to the extent that anticipated future premiums and investment income is insufficient to cover expected future policy benefits and expenses. Loss recognition testing that considers, among other things, actual experience and projected future experience calculates the available premium (gross premium less the benefit and expense portion of premium) for the next
50
years. DAC is evaluated for recoverability using best estimate assumptions. Based on the results of DAC recoverability testing and loss recognition testing, management believes that our DAC as of the years ended
December 31, 2019
and
2018
limits the amount of deferred costs to its estimated recoverable value.
December 31, 2019 | 10-K
73
The components of DAC from year to year are summarized as follows:
|
Years ended December 31,
(In thousands) |
2019
|
2018
|
2017
|
||||||
|
Balance at beginning of period
|
$
|
155,747
|
|
167,063
|
|
167,790
|
|
||
|
Capitalization of deferred policy acquisition costs
|
22,255
|
|
22,695
|
|
29,120
|
|
|||
|
Amortization of deferred policy acquisition costs
|
(28,268
|
)
|
(34,235
|
)
|
(29,690
|
)
|
|||
|
Effects of unrealized (gains) losses
|
(485
|
)
|
224
|
|
(157
|
)
|
|||
|
Balance at end of period
|
$
|
149,249
|
|
155,747
|
|
167,063
|
|
||
We converted to a new actuarial valuation software solution that provided enhanced modeling capabilities for the ordinary whole life policies of SPLIC as of July 1, 2019 and the ordinary whole life and endowment policies of CICA and CICA Ltd. as of July 1, 2018. The total impact of these system conversions, which impacted both the Home Service Insurance and Life Insurance segments, reflect changes in actuarial valuation estimates associated with the conversion. The impact is reflected in the accompanying consolidated financial statements and summarized in the table below.
|
(In thousands)
|
2019
|
2018
|
|||||
|
Increase (Decrease)
|
|||||||
|
Consolidated Balance Sheets
|
|||||||
|
DAC
|
$
|
(1,396
|
)
|
(4,339
|
)
|
||
|
Future policy benefit reserves:
|
|||||||
|
Life insurance
|
(2,299
|
)
|
(10,197
|
)
|
|||
|
Consolidated Statements of Operations and Comprehensive Income (Loss)
|
|||||||
|
Decrease in future policy benefit reserves
|
(2,299
|
)
|
(10,197
|
)
|
|||
|
Amortization of deferred policy acquisition costs
|
1,396
|
|
4,339
|
|
|||
|
Income before federal income tax
|
903
|
|
5,858
|
|
|||
|
Federal income tax expense
|
190
|
|
1,230
|
|
|||
|
Net income
|
$
|
713
|
|
4,628
|
|
||
COST OF INSURANCE ACQUIRED
Cost of insurance acquired ("COIA") is established when we purchase a block of insurance. COIA is amortized over the emerging profit of the related policies using the same assumptions as were used in computing liabilities for future policy benefits. Inherent in the amortization of COIA are certain management judgments used in the estimation of the ending asset balance and the annual amortization. The key assumptions used in management's estimates are based upon interest, mortality and lapses at the time of purchase.
A recoverability test that considers, among other things, actual experience and projected future experience is performed at least annually. These annual recoverability tests are based initially on an estimate of the available premium (gross premium less the benefit and expense portion of premium) for the next
50
years. Management believes that our COIA is recoverable for the years ended
December 31, 2019
and
2018
. This belief is based upon the analysis performed on estimated future results of the block and our annual recoverability testing.
December 31, 2019 | 10-K
74
COIA relative to purchased blocks of insurance is summarized as follows:
|
Years ended December 31,
(In thousands) |
2019
|
2018
|
2017
|
||||||
|
Balance at beginning of period
|
$
|
15,225
|
|
17,499
|
|
19,415
|
|
||
|
Amortization
|
(1,546
|
)
|
(2,458
|
)
|
(2,129
|
)
|
|||
|
Change in effects of unrealized (gains) losses on COIA
|
(224
|
)
|
184
|
|
213
|
|
|||
|
Balance at end of period
|
$
|
13,455
|
|
15,225
|
|
17,499
|
|
||
Estimated amortization of COIA in each of the next
five
years and thereafter is as follows. Actual future amortization will differ from these estimates due to variances from estimated future withdrawal assumptions.
|
(In thousands)
|
Amount
|
||
|
Cost of Insurance Acquired:
|
|||
|
Year:
|
|||
|
2020
|
$
|
1,237
|
|
|
2021
|
1,112
|
|
|
|
2022
|
1,003
|
|
|
|
2023
|
908
|
|
|
|
2024
|
822
|
|
|
|
Thereafter
|
8,759
|
|
|
|
13,841
|
|
||
|
Effects of unrealized (gains) losses on COIA
|
(386
|
)
|
|
|
Total cost of insurance acquired
|
$
|
13,455
|
|
The value of COIA resulting from our various acquisitions was determined based on the present value of future profits discounted at annual rates ranging from
3.7%
to
8.5%
.
GOODWILL AND OTHER INTANGIBLE ASSETS
Goodwill is the difference between the purchase price in a business combination and the fair value of assets and liabilities acquired and is not amortized. Other intangible assets include various state insurance licenses, which have been determined to have indefinite useful lives and, therefore, are not amortized. Both goodwill and other intangible assets with indefinite useful lives are subject to annual impairment analysis.
Goodwill is tested for impairment on an annual basis or more frequently if indicators of potential impairment exist. The goodwill testing requires us to compare the estimated fair value of a reporting unit to its carrying value. If the carrying value of the reporting unit is lower than its estimated fair value, no further evaluation is required. If the carrying value of the reporting unit exceeds its estimated fair value, an impairment charge is recorded for that excess, limited to the total amount of goodwill allocated to that reporting unit. We have the option of performing an assessment of certain qualitative factors to determine if it is more likely than not that the fair value of a reporting unit is less than its carrying value or proceeding directly to a quantitative impairment test. We elected to apply the quantitative assessment for the goodwill in our reporting units within each of our operating segments as of
December 31, 2019
and
2017
. We assessed the assumptions used in the
2017
goodwill analysis considering then current circumstances and completed a qualitative review in
2018
.
Management’s determination of the fair value of each reporting unit under the accounting guidance incorporates multiple inputs including discounted cash flow calculations based on assumptions that market participants would make in valuing
December 31, 2019 | 10-K
75
the reporting unit. Other assumptions can include levels of economic capital, future business growth, and earnings projections.
As of
December 31, 2019
, the Company had
$12.6 million
of goodwill allocated to the Life Insurance segment. In 2017, we recorded an impairment of
$4.6 million
in our Home Service Insurance segment. There was
no
impairment of goodwill in
2019
and
2018
related to our segments. Goodwill is summarized as follows:
|
Years ended December 31,
(In thousands) |
2019
|
2018
|
2017
|
||||||
|
Life Insurance Segment:
|
|||||||||
|
Balance at January 1,
|
$
|
12,624
|
|
12,624
|
|
12,624
|
|
||
|
Impairment
|
—
|
|
—
|
|
—
|
|
|||
|
Balance at December 31,
|
$
|
12,624
|
|
12,624
|
|
12,624
|
|
||
|
Home Service Insurance Segment:
|
|||||||||
|
Balance at January 1,
|
$
|
—
|
|
—
|
|
4,631
|
|
||
|
Impairment
|
—
|
|
—
|
|
4,631
|
|
|||
|
Balance at December 31,
|
$
|
—
|
|
—
|
|
—
|
|
||
|
Total Segments:
|
|||||||||
|
Balance at January 1,
|
$
|
12,624
|
|
12,624
|
|
17,255
|
|
||
|
Impairment
|
—
|
|
—
|
|
4,631
|
|
|||
|
Balance at December 31,
|
$
|
12,624
|
|
12,624
|
|
12,624
|
|
||
PROPERTY AND EQUIPMENT
Property and equipment are carried at cost less accumulated depreciation. Depreciation of property and equipment is computed using the straight-line method over the useful lives of the assets, ranging from
three
to
thirty
years.
The following is a summary of property and equipment.
|
December 31,
(In thousands) |
2019
|
2018
|
||||
|
Property and equipment:
|
|
|
||||
|
Home office, land and buildings
|
$
|
4,136
|
|
4,136
|
|
|
|
Furniture and equipment
|
881
|
|
963
|
|
||
|
Electronic data processing equipment and computer software
|
8,215
|
|
7,710
|
|
||
|
Automobiles
|
91
|
|
91
|
|
||
|
Real estate and equipment leases (See Note 7)
|
1,136
|
|
—
|
|
||
|
Total property and equipment
|
14,459
|
|
12,900
|
|
||
|
Accumulated depreciation
|
(8,555
|
)
|
(6,957
|
)
|
||
|
Total property and equipment
|
$
|
5,904
|
|
5,943
|
|
|
FUTURE POLICY BENEFITS AND EXPENSES
Future policy benefit reserves for traditional life insurance are established based on methods and underlying assumptions in accordance with U.S. GAAP and applicable actuarial standards. Assumptions as to investment yields,
December 31, 2019 | 10-K
76
expenses, mortality and lapses are based upon our experience, modified as necessary to reflect anticipated trends and to include provisions for possible adverse deviations.
The accrued account balance for non-traditional life insurance and investment contracts is computed as deposits net of withdrawals made by the contract holder, plus amounts credited based on contract specifications, less contract fees and charges assessed, plus any additional interest. Annuity interest crediting rates range from
2.5%
to
5.5%
annually. Benefits and expenses are charged against the account balance to recognize costs as incurred over the estimated lives of the contracts. Expenses include interest credited to contract account balances and benefits paid in excess of contract account balances.
Unpaid claims on accident and health and specialty property insurance policies represent the estimated liability for benefit expenses, both reported but not paid and incurred but not reported to the Company. The liability for incurred but not reported claims includes estimates for additional claim amounts due related to reported claims. Liabilities for unpaid claims are estimated using individual case basis valuations and statistical analysis. Those estimates are subject to the effects of trends in claim severity and frequency.
Anticipated investment income is not considered in determining whether a premium deficiency exists with respect to short-duration contracts. Premium deposits accrue interest at rates ranging from
2.5%
to
6.0%
per annum. The cost of insurance is included in the premium when collected and interest is credited annually to deposit accounts.
The development of liabilities for future policy benefits requires management to make estimates and assumptions regarding mortality, persistency, expense, and investment experience based on historical experience and future expectations of those assumptions. Actual results could differ materially from estimates.
An additional provision is made on most products to allow for possible adverse deviation from the assumptions assumed.
We monitor actual experience and revise assumptions as necessary.
PARTICIPATING POLICIES
At
December 31, 2019
and
2018
, participating business approximated
62.2%
and
62.5%
of direct life insurance in force, respectively.
Future policy benefits on participating policies are estimated based on net level premium reserves for death and endowment policy benefits with interest rates ranging from
3.2%
to
9.0%
, and the cash surrender values described in such contracts. The scaling rate used for the
2019
portfolio ranged between
3.59%
for
1
year and then going up to
4.18%
over
20
years and remaining there for the duration. Earnings and dividends on participating policies are allocated based on policies in force.
Policyholder dividends are determined based on the discretion of the Board of the policy issuing subsidiary. Policyholder dividends are accrued over the premium paying periods of the insurance contract.
CONTINGENCIES
An estimated loss from a contingency is accrued and charged to results of operations only if both of the following conditions are met:
|
1.
|
Information available prior to the issuance of the consolidated financial statements indicates that it is probable
(virtual certainty is not required) that an asset has been impaired or a liability incurred as of the date of the consolidated financial statements; and
|
|
2.
|
The amount of the loss can be reasonably estimated.
|
Reasonable estimation of a possible loss does not require estimating a single amount of the loss. It requires that a loss be accrued if it can be estimated within a range. If an amount within the range is a better estimate than any other amount within the range, that amount is accrued. If no amount within the range is a better estimate than any other amount, the minimum amount in the range is accrued.
December 31, 2019 | 10-K
77
A gain contingency is an uncertain situation that will be resolved in the future, possibly resulting in a gain. We do not allow the recognition of a gain contingency prior to settlement of the underlying event. If we were to have a material gain contingency, we would disclose it in the notes to the consolidated financial statements.
PREMIUM REVENUE AND RELATED EXPENSES
Premiums on life policies are recognized as earned when due. Premiums paid in advance on the consolidated balance sheets are held on deposit and accrue interest at rates ranging from
2.5%
to
6.0%
until such time as the premiums become due. Premiums on accident and health policies are recognized as revenue over the contract period on a pro rata basis. Benefits and expenses are associated with earned premiums so as to result in the recognition of profits over the estimated lives of the contracts. This matching is accomplished by means of a provision for future policy benefits and the capitalization and amortization of deferred policy acquisition costs.
Annuity policies, primarily flexible premium fixed annuity products, are accounted for in a manner consistent with accounting for interest bearing financial instruments. Premium receipts are not reported as revenue, rather as deposit liabilities to annuity contracts. The annuity products issued do not include fees or other such charges.
INCOME TAXES
Deferred tax assets and liabilities are recognized for the estimated future tax consequences attributable to differences between the financial statement carrying amounts of existing assets and liabilities and their respective tax bases. Deferred tax assets and liabilities are measured using enacted tax rates in effect for the year in which those temporary differences are expected to be recovered.
A deferred tax asset is recorded only if a determination is made that it is more-likely-than-not that the tax treatment on which the deferred tax asset depends will be sustained in the event of an audit. These determinations inherently involve management's judgment. In addition, the Company must record a tax valuation allowance with respect to deferred tax assets if it is more-likely-than-not that the tax benefit will not be realized.
EARNINGS PER SHARE
Basic earnings per share are computed by dividing income available to common stockholders by the weighted average number of shares of common stock outstanding during each period. Diluted earnings per share are computed under the if-converted method for convertible securities and the treasury stock method for warrants, giving effect to all potential dilutive common stock, including options, warrants and convertible/redeemable preferred stock.
The basic and diluted earnings per share of Class B common stock are one half the earnings per share of the Class A common stock.
USE OF ESTIMATES
The preparation of consolidated financial statements in conformity with U.S. GAAP requires management to make estimates and assumptions that affect the reported amounts of assets and liabilities and disclosure of contingent assets and liabilities at the date of the consolidated financial statements and the reported amounts of revenues and expenses during the reporting period. Actual results could differ materially from these estimates.
RECLASSIFICATIONS
Certain amounts presented in prior years have been reclassified to conform to the current presentation. No individual amounts were material.
ACCOUNTING PRONOUNCEMENTS
ACCOUNTING STANDARDS RECENTLY ADOPTED
In January 2016, the Financial Accounting Standards Board ("FASB") released Accounting Standards Update ("ASU") No. 2016-01,
Recognition and Measurement of Financial Assets and Financial Liabilities
. This ASU requires equity investments, except those accounted for under the equity method of accounting, that have readily determinable fair
December 31, 2019 | 10-K
78
values to be measured at fair value with any changes in fair value recognized in net income. Equity securities that do not have readily determinable fair values may be measured at estimated fair value or cost less impairment, if any, adjusted for subsequent observable price changes, with changes in the carrying value recognized in net income. A qualitative assessment for impairment is required for equity investments without readily determinable fair values. The updated guidance also eliminates the requirement to disclose the method and significant assumptions used to estimate the fair value of financial instruments measured at amortized cost on the consolidated financial statements. The Company adopted the updated guidance effective January 1, 2018. The adoption of this guidance resulted in the recognition of
$0.6 million
of net after-tax unrealized gains on equity investments as a cumulative effect adjustment that decreased retained deficit as of January 1, 2018 and decreased AOCI by the same amount. The Company elected to report changes in the fair value of equity investments in realized investment gains (losses), net. At December 31, 2017, equity investments were classified as available-for-sale on the Company's consolidated financial statements. However, upon adoption, the updated guidance eliminated the available-for-sale consolidated financial statement classification for equity investments.
In February 2016, the FASB issued ASU 2016-02,
Leases (Topic 842)
. This ASU requires organizations that lease assets, referred to as "lessees," to recognize on the consolidated balance sheets the rights and obligations created by those leases. The ASU also requires disclosures to help investors and other financial statement users better understand the amount, timing, and uncertainty of cash flows arising from leases. These disclosures include qualitative and quantitative requirements, providing additional information about the amounts recorded in the consolidated financial statements. The ASU on leases became effective for public companies for fiscal years, and interim periods within those fiscal years, beginning after December 15, 2018.
The Company has several lease agreements, such as its corporate home office and several district office locations related to our Home Service Insurance segment. The Company adopted this standard effective January 1, 2019 and recognizes these lease agreements on the consolidated balance sheets as a right-of-use asset and a corresponding lease liability. The adoption of this ASU did not have a material impact on our consolidated financial statements. See
Note
7. Commitments and Contingencies
for further discussion.
In March 2017, the FASB issued ASU No. 2017-08,
Receivables-Nonrefundable Fees and Other Costs (Subtopic 310-20).
The amendments in this ASU shorten the amortization period for certain callable debt securities held at a premium. Specifically, the amendments require the premium to be amortized to the earliest call date. The amendments do not require an accounting change for securities held at a discount; the discount continues to be amortized to maturity. The Company has a large portfolio of callable debt securities purchased at a premium. As such, the Company had already been amortizing the premium to the earliest call date (yield to worst), thus adoption of this guidance as of January 1, 2019 did not have a material impact on our consolidated financial statements. For public business entities, the amendments in this ASU were effective for fiscal years, and interim periods within those fiscal years, beginning after December 15, 2018.
In February 2018, the FASB issued ASU No. 2018-02,
Reclassification of Certain Tax Effects from Accumulated Other Comprehensive Income
. This ASU allows a reclassification from accumulated other comprehensive income ("AOCI") to retained earnings of the stranded tax effects that occurred due to the enactment of the Tax Cuts and Jobs Act of 2017 (the "Tax Act"). The updated guidance was effective for reporting periods beginning after December 15, 2018 and is to be applied retrospectively to each period in which there are items impacted by the Tax Act remaining in AOCI or at the beginning of the period of adoption. The Company adopted the updated guidance effective January 1, 2018 and elected to reclassify the income tax effects of the Tax Act from AOCI to accumulated deficit as of January 1, 2018. This reclassification resulted in an increase in accumulated deficit of
$4.7 million
as of January 1, 2018 and an increase in AOCI by the same amount. The Company’s accounting policy for the release of stranded tax effects in AOCI is on an aggregate portfolio basis.
In June 2018, the FASB issued ASU No. 2018-07,
Compensation-Stock Compensation (Topic 718), Improvements to Nonemployee Share-Based Payment Accounting.
This ASU is intended to simplify aspects of share-based compensation issued to non-employees by making the guidance consistent with the accounting for employee share-based compensation. This ASU was effective for annual periods beginning after December 15, 2018 and interim periods within those annual periods, with early adoption permitted. We adopted the provisions of this ASU as of January 1, 2019. This guidance did not have a material impact on our consolidated financial statements.
December 31, 2019 | 10-K
79
In August 2018, the FASB issued ASU No. 2018-13,
Disclosure Framework-Changes to the Disclosure Requirements for Fair Value Measurement
. This ASU eliminates, adds and modifies certain disclosure requirements for fair value measurements. Among the changes, entities will no longer be required to disclose the amount of and reasons for transfers between Level 1 and Level 2 of the fair value hierarchy, but will be required to disclose the range and weighted average used to develop significant unobservable inputs for Level 3 fair value measurements. This ASU was effective for interim and annual reporting periods beginning after December 15, 2019; however, early adoption was permitted. We elected to adopt the provisions of this ASU as of December 31, 2019. This guidance did not have a material impact on our consolidated financial statements.
ACCOUNTING STANDARDS NOT YET ADOPTED
In June 2016, the FASB issued ASU No. 2016-13,
Financial Instruments-Credit Losses (Topic 326)
, with the main objective to provide financial statement users with more decision-useful information about the expected credit losses on financial instruments and other commitments to extend credit held by a reporting entity at each reporting date. The ASU requires a financial asset (or a group of financial assets) measured at amortized cost basis to be presented at the net amount expected to be collected. The allowance for credit losses is a valuation account that is deducted from the amortized cost basis of the financial asset(s) to present the net carrying value at the amount expected to be collected on the financial asset. The income statement reflects the measurement of credit losses for newly recognized financial assets, as well as the increases or decreases of expected credit losses that have taken place during the period. Credit losses on available-for-sale debt securities should be measured in a manner similar to current U.S. GAAP; however, the credit losses are recorded through an allowance for credit losses rather than as a write-down. This approach is an improvement to current U.S. GAAP because an entity will be able to record reversals of credit losses (in situations in which the estimate of credit losses declines) in current period net income, which in turn should align the income statement recognition of credit losses with the reporting period in which changes occur. Current U.S. GAAP prohibits reflecting those improvements in current-period earnings. For public business entities, the amendments in this ASU will be effective for fiscal years beginning after December 15, 2019, including interim periods within those fiscal years. The Company has evaluated the impact this guidance will have on our consolidated financial statements, including but not limited to our available-for-sale securities, reinsurance recoverable and amounts due from agents, and concluded the impact is immaterial.
In August 2018, the FASB issued ASU No. 2018-12,
Financial Services-Insurance (Topic 944): Targeted Improvements to the Accounting for Long-Duration Contracts.
This ASU amends four key areas of the accounting and impacts disclosures for long-duration insurance and investment contracts:
|
•
|
Requires updated assumptions for liability measurement.
Assumptions used to measure the liability for traditional insurance contracts, which are typically determined at contract inception, will now be reviewed at least annually, and, if there is a change, updated, with the effect recorded in net income;
|
|
•
|
Standardizes the liability discount rate.
The liability discount rate will be a market-observable discount rate (upper-medium grade fixed-income instrument yield), with the effect of rate changes recorded in other comprehensive income;
|
|
•
|
Provides greater consistency in measurement of market risk benefits.
The two previous measurement models have been reduced to one measurement model (fair value), resulting in greater uniformity across similar market-based benefits and better alignment with the fair value measurement of derivatives used to hedge capital market risk;
|
|
•
|
Simplifies amortization of DAC.
Previous earnings-based amortization methods have been replaced with a more level amortization basis; and
|
|
•
|
Requires enhanced disclosures.
The new disclosures include rollforwards and information about significant assumptions and the effects of changes in those assumptions.
|
For calendar-year public companies, the changes will be effective on January 1, 2022. The Company is evaluating the impact of this new guidance, and it is expected to have a material impact on our consolidated financial statements.
In September 2018, the FASB issued ASU No. 2018-15,
Customer’s Accounting for Implementation Costs Incurred in a Cloud Computing Arrangement That Is a Service Contract
. This ASU requires an entity in a cloud computing arrangement (i.e., hosting arrangement) that is a service contract to follow the internal-use software guidance in ASC
December 31, 2019 | 10-K
80
350-40 to determine which implementation costs to capitalize as assets or expense as incurred. Capitalized implementation costs should be presented in the same line item on the consolidated financial statements as amounts prepaid for the hosted service, if any (generally as an "other asset"). The capitalized costs will be amortized over the term of the hosting arrangement, with the amortization expense being presented in the same income statement line item as the fees paid for the hosted service. This ASU will be effective for interim and annual reporting periods beginning after December 15, 2019; early adoption is permitted. We will adopt this ASU prospectively and concluded the impact is immaterial.
No other new accounting pronouncement issued or effective during the year had, or is expected to have, a material impact on our consolidated financial statements.
(2)
INVESTMENTS
The Company invests primarily in fixed maturity securities, which totaled
90.2%
of total cash, cash equivalents and investments at
December 31, 2019
.
|
Carrying Value as of December 31,
(In thousands, except for %)
|
2019
|
%
|
2018
|
%
|
|||||||
|
Cash, Cash Equivalents and Investments:
|
|||||||||||
|
Fixed maturity securities
|
$
|
1,377,959
|
|
90.2
|
$
|
1,231,039
|
|
88.7
|
|||
|
Equity securities
|
16,033
|
|
1.1
|
15,068
|
|
1.1
|
|||||
|
Policy loans
|
82,005
|
|
5.4
|
80,825
|
|
5.8
|
|||||
|
Real estate and other long-term investments
|
2,956
|
|
0.2
|
7,409
|
|
0.5
|
|||||
|
Short-term investments
|
1,301
|
|
0.1
|
7,865
|
|
0.6
|
|||||
|
Cash and cash equivalents
|
46,205
|
|
3.0
|
45,492
|
|
3.3
|
|||||
|
Total cash, cash equivalents and investments
|
$
|
1,526,459
|
|
100.0
|
$
|
1,387,698
|
|
100.0
|
|||
We are a member of the Federal Home Loan Bank (“FHLB”) of Dallas and such membership requires members to own stock in the FHLB. Our FHLB stock is carried at amortized cost, which approximates fair value and is included in other long-term investments.
The amortized cost, gross unrealized gains and losses and fair value of investments in fixed maturities as of
December 31, 2019
and
2018
are as follows.
|
December 31, 2019
(In thousands) |
Amortized
Cost
|
Gross
Unrealized
Gains
|
Gross
Unrealized
Losses
|
Fair
Value
|
||||||||
|
Fixed Maturities:
|
|
|
|
|
||||||||
|
Available-for-sale securities:
|
|
|
|
|
||||||||
|
U.S. Treasury securities
|
$
|
9,709
|
|
1,638
|
|
—
|
|
11,347
|
|
|||
|
U.S. Government-sponsored enterprises
|
3,516
|
|
1,015
|
|
—
|
|
4,531
|
|
||||
|
States and political subdivisions
|
512,239
|
|
24,285
|
|
240
|
|
536,284
|
|
||||
|
Corporate
|
604,750
|
|
46,472
|
|
1,134
|
|
650,088
|
|
||||
|
Commercial mortgage-backed
|
1,105
|
|
—
|
|
5
|
|
1,100
|
|
||||
|
Residential mortgage-backed
|
118,130
|
|
12,223
|
|
66
|
|
130,287
|
|
||||
|
Asset-backed
|
44,302
|
|
11
|
|
110
|
|
44,203
|
|
||||
|
Foreign governments
|
102
|
|
17
|
|
—
|
|
119
|
|
||||
|
Total fixed maturity securities
|
$
|
1,293,853
|
|
85,661
|
|
1,555
|
|
1,377,959
|
|
|||
December 31, 2019 | 10-K
81
We reclassified all of our fixed maturity holdings that were previously classified as held-to-maturity to available-for-sale based upon our intent and investment strategy as of September 30, 2018. The net carrying value of the fixed maturities held-to-maturity reclassified as available-for-sale amounted to
$209.7 million
.
|
December 31, 2018
(In thousands) |
Amortized
Cost
|
Gross
Unrealized
Gains
|
Gross
Unrealized
Losses
|
Fair
Value
|
||||||||
|
Fixed Maturities:
|
|
|
|
|
||||||||
|
Available-for-sale securities:
|
|
|
|
|
||||||||
|
U.S. Treasury securities
|
$
|
9,864
|
|
1,410
|
|
—
|
|
11,274
|
|
|||
|
U.S. Government-sponsored enterprises
|
3,540
|
|
740
|
|
—
|
|
4,280
|
|
||||
|
States and political subdivisions
|
713,991
|
|
7,614
|
|
1,490
|
|
720,115
|
|
||||
|
Corporate
|
384,817
|
|
6,725
|
|
9,746
|
|
381,796
|
|
||||
|
Commercial mortgage-backed
|
39,694
|
|
386
|
|
66
|
|
40,014
|
|
||||
|
Residential mortgage-backed
|
66,960
|
|
1,726
|
|
2
|
|
68,684
|
|
||||
|
Asset-backed
|
4,764
|
|
1
|
|
8
|
|
4,757
|
|
||||
|
Foreign governments
|
117
|
|
2
|
|
—
|
|
119
|
|
||||
|
Total fixed maturity securities
|
$
|
1,223,747
|
|
18,604
|
|
11,312
|
|
1,231,039
|
|
|||
Most of the Company's equity securities are diversified stock and bond mutual funds.
|
Fair Value as of December 31,
(In thousands)
|
2019
|
2018
|
||||
|
Equity Securities:
|
|
|||||
|
Stock mutual funds
|
$
|
3,274
|
|
2,906
|
|
|
|
Bond mutual funds
|
12,311
|
|
11,774
|
|
||
|
Common stock
|
134
|
|
94
|
|
||
|
Non-redeemable preferred stock
|
314
|
|
294
|
|
||
|
Total equity securities
|
$
|
16,033
|
|
15,068
|
|
|
December 31, 2019 | 10-K
82
For fixed maturity security investments that have unrealized losses as of
December 31, 2019
, the gross unrealized losses that have been in a continuous unrealized loss position for less than 12 months, gross unrealized losses that have been in a continuous unrealized loss position for 12 months or longer and fair value are as follows.
|
December 31, 2019
|
Less than 12 months
|
Greater than 12 months
|
Total
|
||||||||||||||||||||||||
|
(In thousands, except for # of securities)
|
Fair
Value
|
Unrealized
Losses
|
# of
Securities
|
Fair
Value
|
Unrealized
Losses
|
# of
Securities
|
Fair
Value
|
Unrealized
Losses
|
# of
Securities
|
||||||||||||||||||
|
Fixed Maturities:
|
|
|
|
|
|
|
|
|
|
||||||||||||||||||
|
Available-for-sale securities:
|
|
|
|
|
|
|
|
|
|
||||||||||||||||||
|
States and political subdivisions
|
$
|
24,064
|
|
163
|
|
24
|
|
1,961
|
|
77
|
|
6
|
|
26,025
|
|
240
|
|
30
|
|
||||||||
|
Corporate
|
62,897
|
|
918
|
|
69
|
|
3,669
|
|
216
|
|
5
|
|
66,566
|
|
1,134
|
|
74
|
|
|||||||||
|
Commercial mortgage-backed
|
1,100
|
|
5
|
|
2
|
|
—
|
|
—
|
|
—
|
|
1,100
|
|
5
|
|
2
|
|
|||||||||
|
Residential mortgage-backed
|
1,656
|
|
65
|
|
11
|
|
91
|
|
1
|
|
3
|
|
1,747
|
|
66
|
|
14
|
|
|||||||||
|
Asset-backed
|
36,039
|
|
110
|
|
27
|
|
—
|
|
—
|
|
—
|
|
36,039
|
|
110
|
|
27
|
|
|||||||||
|
Total fixed maturity securities
|
$
|
125,756
|
|
1,261
|
|
133
|
|
5,721
|
|
294
|
|
14
|
|
131,477
|
|
1,555
|
|
147
|
|
||||||||
The Company does not consider securities to be other-than-temporarily impaired when the market decline is attributable to factors such as market volatility, liquidity, spread widening and credit quality when it is anticipated that a recovery of all amounts due under the contractual terms of the security will occur. Based on our evaluation of the credit worthiness of the issuers and because we do not intend to sell the investments, nor is it likely that we would be required to sell these investments before recovery of their amortized cost bases, which may be maturity, none of the unrealized losses are considered to be other-than-temporary.
We monitor all debt securities on an on-going basis relative to changes in credit ratings, market prices, earnings trends and financial performance, in addition to specific region or industry reviews. The assessment of whether OTTI has occurred is based on a case-by-case evaluation of underlying reasons for the decline in fair value. The Company determines OTTI by reviewing relevant evidence related to the specific security issuer as well as our intent to sell the security, or if it is more likely than not that we would be required to sell a security before recovery of its amortized cost. All securities with a market price below par were segregated and reviewed as of
December 31, 2019
based upon the items above for impairment.
December 31, 2019 | 10-K
83
For fixed maturity investments that have unrealized losses as of
December 31, 2018
, the gross unrealized losses that have been in a continuous unrealized loss position for less than 12 months, gross unrealized losses that have been in a continuous unrealized loss position for 12 months or longer and fair value are as follows.
|
December 31, 2018
|
Less than 12 months
|
Greater than 12 months
|
Total
|
||||||||||||||||||||||||
|
(In thousands, except for # of securities)
|
Fair
Value
|
Unrealized
Losses
|
# of
Securities
|
Fair
Value
|
Unrealized
Losses
|
# of
Securities
|
Fair
Value
|
Unrealized
Losses
|
# of
Securities
|
||||||||||||||||||
|
Fixed Maturities:
|
|
|
|
|
|
|
|
|
|
||||||||||||||||||
|
Available-for-sale securities:
|
|
|
|
|
|
|
|
|
|
||||||||||||||||||
|
States and political subdivisions
|
$
|
227,132
|
|
883
|
|
233
|
|
33,891
|
|
607
|
|
46
|
|
261,023
|
|
1,490
|
|
279
|
|
||||||||
|
Corporate
|
230,030
|
|
8,770
|
|
191
|
|
9,936
|
|
976
|
|
8
|
|
239,966
|
|
9,746
|
|
199
|
|
|||||||||
|
Commercial mortgage-backed
|
14,992
|
|
66
|
|
11
|
|
—
|
|
—
|
|
—
|
|
14,992
|
|
66
|
|
11
|
|
|||||||||
|
Residential mortgage-backed
|
18
|
|
—
|
|
3
|
|
98
|
|
2
|
|
4
|
|
116
|
|
2
|
|
7
|
|
|||||||||
|
Asset-backed
|
3,747
|
|
8
|
|
4
|
|
—
|
|
—
|
|
—
|
|
3,747
|
|
8
|
|
4
|
|
|||||||||
|
Total fixed maturity securities
|
$
|
475,919
|
|
9,727
|
|
442
|
|
43,925
|
|
1,585
|
|
58
|
|
519,844
|
|
11,312
|
|
500
|
|
||||||||
The amortized cost and fair value of fixed maturities at
December 31, 2019
by contractual maturity are shown in the table below. Actual maturities may differ from contractual maturities because borrowers may have the right to call or prepay obligations with or without call or prepayment penalties. Securities not due at a single maturity date have been reflected based upon the final stated maturity.
|
(In thousands)
|
Amortized Cost
|
Fair Value
|
||||
|
Fixed maturities:
|
|
|
||||
|
Due in one year or less
|
$
|
122,544
|
|
123,391
|
|
|
|
Due after one year through five years
|
106,106
|
|
111,107
|
|
||
|
Due after five years through ten years
|
215,718
|
|
230,069
|
|
||
|
Due after ten years
|
849,485
|
|
913,392
|
|
||
|
Total fixed maturities
|
$
|
1,293,853
|
|
1,377,959
|
|
|
The Company had
no
investments in any one entity which exceeded 10% of stockholders' equity at
December 31, 2019
or
2018
. In addition, there were
no
investments that were non-income producing for the years ended
December 31, 2019
or
2018
.
December 31, 2019 | 10-K
84
Major categories of net investment income are summarized as follows:
|
Years ended December 31,
(In thousands) |
2019
|
2018
|
2017
|
||||||
|
Gross investment income:
|
|
|
|
||||||
|
Fixed maturities
|
$
|
53,860
|
|
49,126
|
|
48,164
|
|
||
|
Equity securities
|
662
|
|
722
|
|
708
|
|
|||
|
Policy loans
|
6,451
|
|
6,210
|
|
5,735
|
|
|||
|
Other long-term investments
|
13
|
|
15
|
|
87
|
|
|||
|
Other
|
374
|
|
409
|
|
68
|
|
|||
|
Total investment income
|
61,360
|
|
56,482
|
|
54,762
|
|
|||
|
Investment expenses
|
(1,829
|
)
|
(2,277
|
)
|
(1,616
|
)
|
|||
|
Net investment income
|
$
|
59,531
|
|
54,205
|
|
53,146
|
|
||
Proceeds and gross realized gains and losses from sales of available-for-sale fixed maturity securities for
2019
,
2018
and
2017
are summarized as follows:
|
Years ended December 31,
(In thousands) |
2019
|
2018
|
2017
|
||||||
|
Proceeds
|
$
|
66,900
|
|
38,823
|
|
1,077
|
|
||
|
Gross realized gains
|
$
|
2,538
|
|
1,301
|
|
19
|
|
||
|
Gross realized losses
|
$
|
973
|
|
653
|
|
16
|
|
||
We sold
68
and
41
fixed maturity securities from our available-for-sale portfolio in
2019
and
2018
, respectively, as part of a repositioning strategy recommended by our asset manager. There were
no
securities sold from the held-to-maturity portfolio in
2018
or
2017
.
Proceeds and gross realized gains and losses from sales of equity securities for
2019
,
2018
and
2017
are summarized as follows:
|
Years ended December 31,
(In thousands) |
2019
|
2018
|
2017
|
||||||
|
Proceeds
|
$
|
—
|
|
—
|
|
1,940
|
|
||
|
Gross realized gains
|
$
|
—
|
|
—
|
|
—
|
|
||
|
Gross realized losses
|
$
|
—
|
|
—
|
|
30
|
|
||
December 31, 2019 | 10-K
85
Realized investment gains (losses) are as follows:
|
Years ended December 31,
(In thousands) |
2019
|
2018
|
2017
|
||||||
|
Realized investment gains (losses):
|
|
|
|
||||||
|
Sales, calls and maturities:
|
|
|
|
||||||
|
Fixed maturities
|
$
|
1,927
|
|
1,792
|
|
(506
|
)
|
||
|
Equity securities
|
—
|
|
—
|
|
121
|
|
|||
|
Real estate
|
5,513
|
|
—
|
|
1,110
|
|
|||
|
Property and equipment
|
(48
|
)
|
(80
|
)
|
—
|
|
|||
|
Realized investment gains
|
7,392
|
|
1,712
|
|
725
|
|
|||
|
Change in fair value of equity securities
|
962
|
|
(828
|
)
|
—
|
|
|||
|
Other-than-temporary impairments ("OTTI")
|
|
|
|
|
|||||
|
Fixed maturities
|
—
|
|
(776
|
)
|
—
|
|
|||
|
Equity securities
|
—
|
|
—
|
|
(207
|
)
|
|||
|
Real estate held for sale
|
(3,105
|
)
|
—
|
|
—
|
|
|||
|
Realized loss on OTTI
|
(3,105
|
)
|
(776
|
)
|
(207
|
)
|
|||
|
Net realized investment gains (losses)
|
$
|
5,249
|
|
108
|
|
518
|
|
||
During 2019, the Company sold its former corporate office in Austin, Texas for a gross sale price of
$7.5 million
, resulting in a gain on the sale of
$5.5 million
. The building was owned by CICA and was in our Life Insurance segment.
An impairment loss of
$3.1 million
was recorded in 2019 in our Other Non-Insurance Enterprises segment in connection with reclassifying our Citizens Academy training facility located near Austin, Texas as real estate held for sale. This facility is no longer being used by the Company and is being actively marketed for sale.
During 2017, the Company sold its Markham building in Little Rock, Arkansas for a gross sales price of
$3.25 million
, resulting in a gain on sale of
$1.1 million
in our Home Service Insurance segment.
(3)
FAIR VALUE MEASUREMENTS
Fair value is the price that would be received to sell an asset or paid to transfer a liability in an orderly transaction between market participants at the measurement date. We hold available-for-sale fixed maturity securities, which are carried at fair value. We also report our equity securities at fair value with changes reported through the consolidated statements of operations and comprehensive income (loss).
Fair value measurements are generally based upon observable and unobservable inputs. Observable inputs reflect market data obtained from independent sources, while unobservable inputs reflect our view of market assumptions in the absence of observable market information. We utilize valuation techniques that maximize the use of observable inputs and minimize the use of unobservable inputs. All assets and liabilities carried at fair value are required to be classified and disclosed in one of the following three categories:
|
•
|
Level 1 - Quoted prices for identical instruments in active markets.
|
|
•
|
Level 2 - Quoted prices for similar instruments in active markets; quoted prices for identical or similar instruments in markets that are not active and model-derived valuations whose inputs or whose significant value drivers are observable.
|
|
•
|
Level 3 - Instruments whose significant value drivers are unobservable.
|
Level 1 primarily consists of financial instruments whose value is based on quoted market prices such as U.S. Treasury securities and actively traded mutual fund and stock investments.
December 31, 2019 | 10-K
86
Level 2 includes those financial instruments that are valued by independent pricing services or broker quotes. These models are primarily industry-standard models that consider various inputs, such as interest rates, credit spreads and foreign exchange rates for the underlying financial instruments. All significant inputs are observable, or derived from observable information in the marketplace or are supported by observable levels at which transactions are executed in the marketplace. Financial instruments in this category primarily include corporate securities, U.S. Government-sponsored enterprise securities, municipal securities and certain mortgage and asset-backed securities.
Level 3 is comprised of financial instruments whose fair value is estimated based on non-binding broker prices utilizing significant inputs not based on or corroborated by readily available market information. Real estate held for sale is included in this category. There were
no
securities in this category as of or during the years ended
December 31, 2019
and
2018
.
The following tables set forth our assets that are measured at fair value on a recurring basis as of the dates indicated.
|
December 31, 2019
(In thousands) |
Level 1
|
Level 2
|
Level 3
|
Total
Fair Value
|
||||||||
|
Financial assets:
|
||||||||||||
|
Fixed maturities available-for-sale:
|
|
|
|
|
||||||||
|
U.S. Treasury and U.S. Government-sponsored enterprises
|
$
|
11,348
|
|
4,530
|
|
—
|
|
15,878
|
|
|||
|
States and political subdivisions
|
—
|
|
536,284
|
|
—
|
|
536,284
|
|
||||
|
Corporate
|
52
|
|
650,036
|
|
—
|
|
650,088
|
|
||||
|
Commercial mortgage-backed
|
—
|
|
1,100
|
|
—
|
|
1,100
|
|
||||
|
Residential mortgage-backed
|
—
|
|
130,287
|
|
—
|
|
130,287
|
|
||||
|
Asset-backed
|
—
|
|
44,203
|
|
—
|
|
44,203
|
|
||||
|
Foreign governments
|
—
|
|
119
|
|
—
|
|
119
|
|
||||
|
Total fixed maturities available-for-sale
|
11,400
|
|
1,366,559
|
|
—
|
|
1,377,959
|
|
||||
|
Equity securities:
|
|
|
|
|
|
|
|
|
||||
|
Stock mutual funds
|
3,274
|
|
—
|
|
—
|
|
3,274
|
|
||||
|
Bond mutual funds
|
12,311
|
|
—
|
|
—
|
|
12,311
|
|
||||
|
Common stock
|
134
|
|
—
|
|
—
|
|
134
|
|
||||
|
Non-redeemable preferred stock
|
314
|
|
—
|
|
—
|
|
314
|
|
||||
|
Total equity securities
|
16,033
|
|
—
|
|
—
|
|
16,033
|
|
||||
|
Total financial assets
|
$
|
27,433
|
|
|
1,366,559
|
|
—
|
|
1,393,992
|
|
||
December 31, 2019 | 10-K
87
|
December 31, 2018
(In thousands) |
Level 1
|
Level 2
|
Level 3
|
Total
Fair Value
|
||||||||
|
Financial assets:
|
|
|
|
|
||||||||
|
Fixed maturities available-for-sale:
|
|
|
|
|
||||||||
|
U.S. Treasury and U.S. Government-sponsored enterprises
|
$
|
11,274
|
|
4,280
|
|
—
|
|
15,554
|
|
|||
|
States and political subdivisions
|
—
|
|
720,115
|
|
—
|
|
720,115
|
|
||||
|
Corporate
|
47
|
|
381,749
|
|
—
|
|
381,796
|
|
||||
|
Commercial mortgage-backed
|
—
|
|
40,014
|
|
—
|
|
40,014
|
|
||||
|
Residential mortgage-backed
|
—
|
|
68,684
|
|
—
|
|
68,684
|
|
||||
|
Asset-backed
|
—
|
|
4,757
|
|
—
|
|
4,757
|
|
||||
|
Foreign governments
|
—
|
|
119
|
|
—
|
|
119
|
|
||||
|
Total fixed maturities
|
11,321
|
|
1,219,718
|
|
—
|
|
1,231,039
|
|
||||
|
Equity securities:
|
|
|
|
|
|
|
|
|
||||
|
Stock mutual funds
|
2,906
|
|
—
|
|
—
|
|
2,906
|
|
||||
|
Bond mutual funds
|
11,774
|
|
—
|
|
—
|
|
11,774
|
|
||||
|
Common stock
|
94
|
|
—
|
|
—
|
|
94
|
|
||||
|
Non-redeemable preferred stock
|
294
|
|
—
|
|
—
|
|
294
|
|
||||
|
Total equity securities
|
15,068
|
|
—
|
|
—
|
|
15,068
|
|
||||
|
Total financial assets
|
$
|
26,389
|
|
1,219,718
|
|
—
|
|
1,246,107
|
|
|||
FINANCIAL INSTRUMENTS VALUATION
Fixed maturity securities, available-for-sale.
At
December 31, 2019
, the fixed maturities, valued using a third-party pricing source, totaled
$1.4 billion
for Level 2 assets and comprised
98.0%
of total reported fair value. Fair values for Level 3 assets are based upon unadjusted broker quotes that are non-binding. The Level 1 and Level 2 valuations are reviewed and updated quarterly through random testing by comparisons to separate pricing models, other third-party pricing services, and back tested to recent trades. In addition, we obtain information annually relative to the third-party pricing models and review model parameters for reasonableness. For the period ended
December 31, 2019
, there were
no
material changes to the valuation methods or assumptions used to determine fair values, and
no
broker or third-party prices were changed from the values received.
Equity securities.
Fair values of these securities are provided by a third-party pricing service and based upon quoted market price and are classified as Level 1 assets.
We review the fair value hierarchy classifications each reporting period. Changes in the observability of the valuation attributes may result in a reclassification of certain financial assets. Such reclassifications, if any, are reported as transfers in and out of Level 3 at the beginning fair value for the reporting period in which the changes occur. There were
no
transfers in or out of Level 3 during the years ended
December 31, 2019
and
2018
.
December 31, 2019 | 10-K
88
FINANCIAL INSTRUMENTS NOT CARRIED AT FAIR VALUE
Estimates of fair values are made at a specific point in time, based on relevant market prices and information about the financial instruments. The estimated fair values of financial instruments presented below are not necessarily indicative of the amounts the Company might realize in actual market transactions. The carrying amount and fair value for the financial assets and liabilities on the consolidated financial statements not otherwise disclosed for the periods indicated were as follows:
|
|
December 31, 2019
|
December 31, 2018
|
||||||||||
|
(In thousands)
|
Carrying
Value
|
Fair
Value
|
Carrying
Value
|
Fair
Value
|
||||||||
|
Financial assets:
|
|
|
|
|
||||||||
|
Policy loans
|
$
|
82,005
|
|
82,005
|
|
80,825
|
|
80,825
|
|
|||
|
Mortgage loans
|
177
|
|
210
|
|
186
|
|
222
|
|
||||
|
Short-term investments
|
1,301
|
|
1,301
|
|
7,865
|
|
7,865
|
|
||||
|
Cash and cash equivalents
|
46,205
|
|
46,205
|
|
45,492
|
|
45,492
|
|
||||
|
Financial liabilities:
|
|
|
|
|
|
|
|
|
||||
|
Annuities - investment contracts
|
$
|
56,878
|
|
60,667
|
|
56,658
|
|
55,977
|
|
|||
Policy loans.
Policy loans had a weighted average annual interest rate of
7.7%
at both
December 31, 2019
and
2018
and no specified maturity dates. The aggregate fair value of policy loans approximates the carrying value reflected on the consolidated financial statements. These loans typically carry an interest rate that corresponds to the crediting rate applied to the related policy and contract reserves. Policy loans are an integral part of the life insurance policies we have in force; therefore, they cannot be valued separately and are not marketable. As a result, the fair value of policy loans approximates the carrying value and policy loans are considered Level 3 assets in the fair value hierarchy.
Mortgage loans.
Other long-term investments include mortgage loans, which are secured principally by residential properties. Weighted average interest rates for these loans were approximately
6.4%
and
6.6%
per year as of
December 31, 2019
and
2018
, respectively, with maturities ranging from
19
to
23
years. Management estimated the fair value using an annual interest rate of
6.25%
at both
December 31, 2019
and
2018
. Our mortgage loans are considered Level 3 assets in the fair value hierarchy.
The following table summarizes the carrying amounts of other long-term investments not carried at fair market value.
|
December 31, 2019
|
Carrying
Value
|
||
|
(in thousands)
|
|||
|
Other long-term investments:
|
|||
|
FHLB common stock
|
$
|
187
|
|
|
Mortgage loans
|
177
|
|
|
|
All other investments
|
21
|
|
|
|
Total other long-term investments
|
$
|
385
|
|
Other.
The fair value of short-term investments and cash and cash equivalents approximate carrying value and are characterized as Level 1 assets in the fair value hierarchy.
Annuity liabilities.
The fair value of the Company's liabilities under annuity contract policies, which are considered Level 3 instruments, was estimated at
December 31, 2019
and
2018
using discounted cash flows based upon spot rates ranging from
1.67%
to
3.02%
and
2.70%
to
3.8%
, respectively, based upon swap rates adjusted for various risk adjustments. The fair value of liabilities under all insurance contracts are taken into consideration in the overall
December 31, 2019 | 10-K
89
management of interest rate risk, which seeks to minimize exposure to changing interest rates through the matching of investment maturities with amounts due under insurance contracts.
(4)
POLICY LIABILITIES AND SHORT DURATION CONTRACTS
Various assumptions used to determine the future policy benefit reserves of life insurance include valuation interest rates, mortality assumptions and withdrawals.
The following table presents information on changes in the liability for life, accident and health and property policy and contract claims for the years ended
December 31, 2019
,
2018
and
2017
.
|
Years ended December 31,
(In thousands) |
2019
|
2018
|
2017
|
||||||
|
Policy claims payable:
|
|||||||||
|
Balance at January 1
|
$
|
7,614
|
|
8,610
|
|
9,538
|
|
||
|
Less: reinsurance recoverable
|
511
|
|
367
|
|
407
|
|
|||
|
Net balance at January 1
|
7,103
|
|
8,243
|
|
9,131
|
|
|||
|
Add claims incurred, related to:
|
|
|
|
|
|
|
|||
|
Current year
|
26,816
|
|
24,793
|
|
25,036
|
|
|||
|
Prior years
|
543
|
|
(197
|
)
|
(209
|
)
|
|||
|
|
27,359
|
|
24,596
|
|
24,827
|
|
|||
|
Deduct claims paid, related to:
|
|
|
|
|
|
|
|||
|
Current year
|
20,629
|
|
18,933
|
|
18,037
|
|
|||
|
Prior years
|
6,570
|
|
6,803
|
|
7,678
|
|
|||
|
|
27,199
|
|
25,736
|
|
25,715
|
|
|||
|
Net balance December 31
|
7,263
|
|
7,103
|
|
8,243
|
|
|||
|
Plus: reinsurance recoverable
|
796
|
|
511
|
|
367
|
|
|||
|
Balance at December 31
|
$
|
8,059
|
|
7,614
|
|
8,610
|
|
||
The Company experienced
unfavorable
development in
2019
of
$0.5 million
and
favorable
development of
$0.2 million
in
2018
and
2017
. No unusual claims or trends have been noted.
(5)
REINSURANCE
In the normal course of business, the Company reinsures portions of certain policies that we underwrite to limit disproportionate risks. During
2019
and
2018
, we retained varying amounts of individual insurance up to a maximum retention of
$100,000
on any life. The Company also reinsures
100%
of our accidental death benefit rider coverage. Catastrophe reinsurance is in place for our property policies. In
2019
and
2018
, this reinsurance provided
$10.0 million
of coverage above a
$500,000
deductible. Our health insurance policies are substantially all reinsured on a
100%
coinsurance basis. We remain contingently liable to the extent that the reinsuring companies cannot meet their obligations under these reinsurance treaties.
Our amounts recoverable from reinsurers represent receivables from and reserves ceded to reinsurers. We obtain reinsurance from multiple reinsurers, and we monitor concentration as well as financial strength ratings of our principal reinsurers. The ratings by A.M. Best Company range from B+ (Good) to A+ (Superior).
December 31, 2019 | 10-K
90
Assumed and ceded life reinsurance activity as of
December 31, 2019
and
2018
is summarized as follows:
|
December 31,
(In thousands) |
2019
|
2018
|
||||
|
Aggregate assumed life insurance in force
|
$
|
4,892
|
|
5,202
|
|
|
|
Aggregate ceded life insurance in force
|
$
|
486,937
|
|
490,295
|
|
|
|
Net life insurance in force
|
$
|
4,246,781
|
|
4,350,538
|
|
|
The Company's reinsurance recoverable on ceded reinsurance was
$3.7 million
in
2019
and
2018
. Premiums, claims and surrenders assumed and ceded for all lines of business for these years are summarized as follows:
|
Years ended December 31,
(In thousands) |
2019
|
2018
|
2017
|
||||||
|
Premiums from short-duration contracts:
|
|
|
|
||||||
|
Direct
|
$
|
6,804
|
|
6,840
|
|
6,933
|
|
||
|
Assumed
|
—
|
|
—
|
|
—
|
|
|||
|
Ceded
|
(808
|
)
|
(804
|
)
|
(781
|
)
|
|||
|
Net premiums earned
|
5,996
|
|
6,036
|
|
6,152
|
|
|||
|
Premiums from long-duration contracts:
|
|
|
|
|
|
|
|||
|
Direct
|
180,205
|
|
184,721
|
|
193,778
|
|
|||
|
Assumed
|
99
|
|
99
|
|
142
|
|
|||
|
Ceded
|
(1,953
|
)
|
(2,996
|
)
|
(2,352
|
)
|
|||
|
Net premiums earned
|
178,351
|
|
181,824
|
|
191,568
|
|
|||
|
Total premiums earned
|
$
|
184,347
|
|
187,860
|
|
197,720
|
|
||
|
Claims and surrenders assumed
|
$
|
141
|
|
159
|
|
247
|
|
||
|
Claims and surrenders ceded
|
$
|
(940
|
)
|
(705
|
)
|
(946
|
)
|
||
SPFIC has catastrophe reinsurance that covers the first event in excess of a
$0.5 million
deductible up to
$10.0 million
. In consideration for a reinstatement premium, second event coverage is provided in excess of a
$0.5 million
deductible up to
$10.0 million
. The annual premium was approximately
$0.8 million
in
2019
,
2018
and
2017
.
(6)
STOCKHOLDERS' EQUITY AND RESTRICTIONS
STOCK
The
two
classes of our common stock are equal in all respects, except (a) each Class A share is entitled to receive twice the cash dividends paid on a per share basis to the Class B common stock, if any; and (b) the Class B common stock has the exclusive right to elect a simple majority of the Board of Directors of Citizens and the Class A common stock elects the remaining directors.
December 31, 2019 | 10-K
91
A summary of the change in number of shares of Class A and Class B common stock and treasury stock issued is as follows:
|
(In thousands)
|
Common Stock
|
Treasury
|
||||||
|
Class A
|
Class B
|
Stock
|
||||||
|
Balance at December 31, 2016
|
52,216
|
|
1,002
|
|
(3,136
|
)
|
||
|
Change
|
—
|
|
—
|
|
—
|
|
||
|
Balance at December 31, 2017
|
52,216
|
|
1,002
|
|
(3,136
|
)
|
||
|
Change
|
—
|
|
—
|
|
—
|
|
||
|
Balance at December 31, 2018
|
52,216
|
|
1,002
|
|
(3,136
|
)
|
||
|
Change
|
149
|
|
—
|
|
—
|
|
||
|
Balance at December 31, 2019
|
52,365
|
|
1,002
|
|
(3,136
|
)
|
||
EARNINGS PER SHARE
The following table sets forth the computation of basic and diluted earnings per share.
|
Years ended December 31,
(In thousands, except per share amounts) |
2019
|
2018
|
2017
|
|||||||
|
Basic and diluted earnings per share:
|
|
|
|
|||||||
|
Numerator:
|
|
|
|
|||||||
|
Net loss
|
$
|
(1,370
|
)
|
(11,062
|
)
|
(38,127
|
)
|
|||
|
Net loss allocated to Class A common stock
|
$
|
(1,356
|
)
|
(10,950
|
)
|
(37,742
|
)
|
|||
|
Net loss allocated to Class B common stock
|
(14
|
)
|
(112
|
)
|
(385
|
)
|
||||
|
Net loss
|
$
|
(1,370
|
)
|
(11,062
|
)
|
(38,127
|
)
|
|||
|
Denominator:
|
|
|
|
|
|
|
||||
|
Weighted average shares of Class A outstanding - basic
|
49,214
|
|
49,080
|
|
49,080
|
|
||||
|
Weighted average shares of Class A outstanding - diluted
|
49,347
|
|
49,139
|
|
49,080
|
|
||||
|
Weighted average shares of Class B outstanding - basic and diluted
|
1,002
|
|
1,002
|
|
1,002
|
|
||||
|
Total weighted average shares outstanding - basic
|
50,216
|
|
50,082
|
|
50,082
|
|
||||
|
Total weighted average shares outstanding - diluted
|
50,349
|
|
50,141
|
|
50,082
|
|
||||
|
Basic and diluted loss per share of Class A common stock
|
$
|
(0.03
|
)
|
(0.22
|
)
|
(0.77
|
)
|
|||
|
Basic and diluted loss per share of Class B common stock
|
(0.01
|
)
|
(0.11
|
)
|
(0.38
|
)
|
||||
December 31, 2019 | 10-K
92
CAPITAL AND SURPLUS
The table below shows the combined total of all of our domestic insurance subsidiaries' capital and surplus and net income (loss) for life insurance operations and property insurance operations, although these amounts are not all available as dividends to Citizens because only CICA is directly owned by Citizens. All other subsidiaries are owned by CICA.
|
Years ended December 31,
(In thousands) |
2019
|
2018
|
||||
|
Combined statutory stockholders' equity
|
||||||
|
Life insurance operations
|
$
|
40,932
|
|
47,274
|
|
|
|
Property insurance operations
|
6,298
|
|
6,753
|
|
||
|
Total combined statutory stockholders' equity
|
$
|
47,230
|
|
54,027
|
|
|
|
Years ended December 31,
(In thousands) |
2019
|
2018
|
2017
|
||||||
|
Combined statutory net income (loss)
|
|||||||||
|
Life insurance operations
|
$
|
(1,200
|
)
|
17,872
|
|
4,179
|
|
||
|
Property insurance operations
|
(451
|
)
|
(269
|
)
|
152
|
|
|||
|
Total combined statutory net income (loss)
|
$
|
(1,651
|
)
|
17,603
|
|
4,331
|
|
||
Generally, the net assets of the domestic insurance subsidiaries available for transfer to their immediate parent are limited to the lesser of the subsidiary's net gain from operations during the preceding year or
10%
of the subsidiary's net statutory surplus as of the end of the preceding year as determined in accordance with accounting practices prescribed or permitted by insurance regulatory authorities. Under these practices, total surplus at
December 31, 2019
was
$37.8 million
and net loss from operations was
$0.7 million
for CICA. Based upon statutory net loss from operations and surplus of CICA as of and for the year ended
December 31, 2019
,
no
dividend could be paid to the Company without prior regulatory approval in
2020
. Payments of dividends in excess of such amounts would generally require approval by regulatory authorities.
CICA, CNLIC, SPLIC, MGLIC and SPFIC have calculated their risk-based capital ("RBC") in accordance with the National Association of Insurance Commissioners' ("NAIC") Model Rule and the RBC rules as adopted by their respective states of domicile. All insurance subsidiaries exceeded RBC minimum levels at
December 31, 2019
.
Under the Bermuda Insurance Act 1978, an insurer is prohibited from declaring or paying a dividend if it is in breach of its Enhanced Capital Requirement (“ECR”) or Minimum Margin of Solvency (“MMS”) or if the declaration or payment of such dividend would cause such a breach. Where an insurer fails to meet its MMS on the last day of any financial year, it is prohibited from declaring or paying any dividends during the next financial year without the approval of the Bermuda Monetary Authority (the “BMA”). Insurers are also prohibited from paying a dividend in an amount exceeding
25%
of the prior year’s total statutory capital and surplus, unless at least two members of the board of directors and its principal representative sign and submit to the BMA an affidavit attesting that a dividend in excess of this amount would not cause such insurer to fail to meet its relevant margins. In certain instances, the insurer would also be required to provide prior notice to the BMA in advance of the payment of dividends.
In the event that such an affidavit is submitted to the BMA in accordance with the Bermuda Insurance Act, and further subject to CICA Ltd. meeting its MMS and ECR requirements, CICA Ltd. would be permitted to distribute a dividend not exceeding
25%
of its prior year's total statutory capital and surplus. Distributions in excess of this amount require the approval of the BMA. Further, CICA Ltd. must obtain the BMA’s prior approval before reducing its total statutory capital as shown in its previous financial year statutory balance sheet by
15%
or more. CICA Ltd. is also prohibited from declaring or paying any dividends unless the value of its long-term business assets exceeds its long-term business liabilities, as certified by its approved actuary, by the amount of the dividend and at least the MMS. These restrictions
December 31, 2019 | 10-K
93
on declaring or paying dividends and distributions under the Bermuda Insurance Act of 1978 are in addition to those under Bermuda’s Companies Act 1981 which apply to all Bermuda companies. Based upon these rules, CICA Ltd. can pay a dividend of
$4.5 million
without prior regulatory approval in 2020. CICA Ltd.'s
2019
and
2018
net income was
$7.6 million
and
$9.1 million
, respectively. CICA Ltd.'s
2019
and
2018
capital and surplus was
$94.3 million
and
$34.3 million
, respectively.
The BMA established risk-based regulatory capital adequacy and solvency margin requirements for Bermuda insurers that mandate that a Bermuda-domiciled subsidiary’s ECR be calculated by either: (a) Bermuda Solvency Capital Requirement ("BSCR"); or (b) an internal capital model that the BMA has approved for use for this purpose. CICA Ltd. uses the BSCR in calculating its solvency requirements. The Economic Balance Sheet ("EBS") framework is embedded as part of the BSCR and forms the basis of its ECR. CICA Ltd. held capital in excess of the BSCR requirements at
December 31, 2019
.
On June 10, 2016, the NAIC Executive Committee and Plenary voted to adopt a recommendation for January 1, 2017 as the operative date for the implementation of Principles-Based Reserves (“PBR”) as a national standard for life insurance products. Although this NAIC standard does not change the reserving requirements under U.S. GAAP, it can be significant for many life insurers. PBR replaces the current formulaic approach to determining policy reserves with an approach that more closely reflects the risks of highly complex products. Companies will be expected to develop “right-sized” reserves that better align with their specific product features, their observed actuarial experience, and their overall risk management procedures. PBR is required effective January 1, 2020. The Company expects to file a request for PBR exemption with the various state Departments of Insurance since all of our domestic insurance subsidiaries met the small company exemption outlined in the NAIC Valuation Manual, VM-20, for principle-based reserving.
(7)
COMMITMENT AND CONTINGENCIES
QUALIFICATIONS OF LIFE PRODUCTS
We have previously reported that a portion of the life insurance policies issued by our subsidiary insurance companies failed to qualify for the favorable U.S. federal income tax treatment afforded by Sections 7702 and 72(s) of the Internal Revenue Code ("IRC") of 1986.
Further, we
have determined the structure of our policies sold to non-U.S. persons, which were novated to CICA Ltd. effective July 1, 2018, may have inadvertently generated U.S. source income over time, which caused tax withholding and information reporting requirements for the Company under Chapters 3 and 4 of the IRC.
For the novated policies sold to non-U.S. persons, we expect to settle any liabilities with the Internal Revenue Service ("IRS") related to tax withholding and information reporting failures.
The Company has continued to refine its estimate of the tax, penalty and interest exposure and expenses related to these tax issues, as described below for the current reporting period. The products have been and continue to be appropriately reported as life insurance under U.S. GAAP for financial reporting.
In December 2019, the Company submitted corrected withholding tax returns to the IRS in order to establish the tax liability amount for failing to withhold tax and report the U.S. source income generated by the novated policies to remediate the noncompliance matter described above
.
With the continued uncertainty that remains
,
including the acceptance of the submitted withholding tax returns, IRS review of our submission, and future negotiations
,
our estimated liability was approximately
$10.0 million
, after tax, as of December 31,
2019
and
December 31, 2018
related to projected agreement with the IRS
.
The probability weighted range of financial estimates relative to this issue is
$7.4 million
to
$52.5 million
, after tax. This estimated range includes projected taxes and interest and penalties payable to the IRS, as well as estimated increased payout obligations to current holders of non-compliant domestic life insurance policies expected to result from remediation of those policies.
Accruals for loss contingencies are recorded when it is probable that a liability has been incurred and the amount can be reasonably estimated. The process of determining our best estimate and the estimated range was a complex undertaking including insight from external consultants and involved management’s judgment based upon a variety of factors known at the time. The amount of our liabilities and expenses depends on a number of uncertainties, including the number of prior tax years for which we may be liable to the IRS and the methodology applicable to the calculation of the tax liabilities for policies. Given the range of potential outcomes and the significant variables assumed in establishing our estimates, actual amounts incurred may exceed our reserve and could exceed the high end of our
December 31, 2019 | 10-K
94
estimated range of liabilities and expenses. To the extent the amount reserved by the Company is insufficient to meet the actual amount of our liabilities and expenses, or if our estimates of those liabilities and expenses change in the future, our financial condition and results of operations may be materially adversely affected. Management believes that based upon current information, we have recorded the best estimate liability to date.
On May 17, 2017, we submitted an offer to enter into Closing Agreements with the IRS covering certain CICA and CNLIC domestic life insurance policies (the "Closing Agreements"), which was accepted by the IRS on June 7, 2019. Pursuant to the Closing Agreements, CICA and CNLIC agreed to pay the IRS $123,779 and $4,118, respectively, by August 6, 2019, and follow the corrective steps for the policies outlined in the Closing Agreements by September 5, 2019. These payments were made to the IRS on July 12, 2019.
For certain life insurance policies that failed to satisfy the requirements of the cash value accumulation test of Section 7702 ("CVAT") of the IRC, we agreed to amend such policies retroactively to their original dates of issue by adding an endorsement (which provides that the death benefit of such policies will not be less than the amount of life insurance necessary to maintain CVAT compliance). For the life insurance policies that failed to satisfy the premium requirements of the guideline premium test of Section 7702 of the IRC, we agreed as needed to refund each policyholder the amount of premiums paid that exceeded the guideline premium limitation plus interest thereon. We completed these corrective steps prior to September 5, 2019, the deadline set forth in the Closing Agreements.
LITIGATION AND REGULATORY ACTIONS
On November 7, 2018, Citizens, CICA Ltd. and CICA filed a lawsuit in the District Court of Travis County, Texas (the “District Court”) against (i) Randall Riley (“Riley”), a former Citizens executive and son of Citizens’ founder Harold E. Riley, (ii) Citizens American Life, LLC and Citizens American Life, Inc. (collectively, “CALI”), copycat companies formed by Riley and (iii) Alexis Enrique Delgado, Carlos Nalsen Landa, Enrique Pinzon Ruiz, Johan Emilio Mikuski Silva and Esperanza Peralta de Delgado (collectively, the “Los Raudales Defendants,” and together with Riley and CALI, collectively the “Defendants”), former independent consultants of Citizens, for unfair competition, misappropriation of Citizens’ trade secrets, tortious interference with Citizens’ existing contracts with its independent consultants and, with respect to the Los Raudales Defendants, breach of their independent consultant contracts with Citizens. The lawsuit sought (i) a declaration that Citizens had grounds to terminate the Los Raudales Defendants for cause under the independent consultant contracts and the Los Raudales Defendants are not entitled to future commissions under such contracts, (ii) injunctive relief, (iii) damages and (iv) attorneys’ fees and costs. Among other things, the suit alleges that Riley formed CALI and misappropriated trade secrets during the time he was employed by Citizens, in violation of his contractual and other duties to Citizens, and that the Los Raudales defendants breached their independent consultant contracts with Citizens by inducing or attempting to induce other independent consultants to terminate or reduce service to Citizens and disclosing confidential information.
On January 25, 2019, the Defendants filed a motion to dismiss certain claims alleged in the suit, and on April 11, 2019, the District Court denied the Defendants’ motion in its entirety. On May 29, 2019, Citizens, CICA Ltd. and CICA filed a motion for a preliminary injunction to bar the Defendants from continuing to engage in unfair competition and misappropriation of Citizens’ trade secrets and tortious interference with Citizens’ existing contracts with its independent consultants. A hearing for the preliminary injunction was held on August 12, 2019. On August 13, 2019, the District Court denied the application for a temporary injunction, and on August 19, 2019, Citizens, CICA Ltd. and CICA filed a notice of appeal in the Third Court of Appeals in Austin, Texas with respect to the District Court’s August 13, 2019 decision.
On September 10, 2019, Citizens, CICA Ltd. and CICA filed an amended complaint and added additional defendants to the lawsuit, including (i) Michael P. Buchweitz, Jonathan M. Pollio, Jeffrey J. Wood and Steven A. Rekedal, former Citizens executives and employees and, in the case of Steven A. Rekedal, a former Citizens independent consultant, (ii) First Trinity Financial Corporation, and Trinity American, Inc. (collectively, “First Trinity”) and International Marketing Group S.A., LLC, entities that have founded a business on the exploitation of Citizens’ trade secrets and goodwill, and (iii) Gregg E. Zahn, a First Trinity executive. The amended complaint asserted additional claims for breach of contract, conspiracy and unjust enrichment. The lawsuit is currently in discovery and is expected to proceed to trial in the fourth quarter of 2020.
While it is not possible at this time to predict with any degree of certainty the ultimate outcome of the appeal of the District Court’s denial of the preliminary injunction or this litigation, Citizens believes it has a basis for an injunctive
December 31, 2019 | 10-K
95
relief and intends to vigorously pursue its action against the Defendants and seek appropriate compensation and any other remedies to which it may be entitled.
From time to time we are subject to legal and regulatory actions relating to our business. We defend all claims vigorously. As a result, we incur defense costs, including attorneys' fees, other direct litigation costs and the expenditure of management time that otherwise would be devoted to our business. If we suffer an adverse judgment as a result of litigation claims, it could have a material adverse effect on our business, results of operations and financial condition.
CONTRACTUAL OBLIGATIONS
Effective January 1, 2019, the Company adopted the new lease accounting guidance in ASU No. 2016-02,
Leases (Topic 842)
. We also elected the package of practical expedients, which among other things, does not require reassessment of lease classification. As a result of the adoption of the new lease accounting guidance, the Company recognized on January 1, 2019 a lease liability of
$1.8 million
discounted using an incremental borrowing rate of
4.76%
and a right-of-use asset of
$1.8 million
. There was
$1.2 million
of undiscounted lease liability remaining as of
December 31, 2019
. The Company uses its estimated incremental borrowing rate, which is derived from information available at lease commencement date, in determining present value of lease payments.
The Company leases home office space in Austin, Texas for Citizens and in Bermuda for CICA Ltd. as well as several district office locations related to our Home Service Insurance segment across Louisiana, Mississippi and Arkansas, which are classified as operating leases. Certain operating leases include renewal options that extend the lease term. The exercise of lease renewal options is at our sole discretion when it is reasonably certain
that we will exercise such option
. Leases with an initial term of 12 months or less are immaterial to the consolidated financial statements and are recognized as lease expense on a straight-line basis over the lease term and not recorded on the consolidated financial statements.
The table below summarizes the number of weighted-average years remaining in our lease liabilities.
|
Lease Term
|
December 31, 2019
|
|
|
Weighted-average remaining lease term (years)
|
||
|
Operating leases
|
1.1
|
|
Maturities of our remaining lease liabilities as of
December 31, 2019
are as follows.
|
(In thousands)
|
Operating Lease Payments
(a)
|
|||
|
Maturity of lease liabilities
|
||||
|
2020
|
$
|
946
|
|
|
|
2021
|
174
|
|
||
|
2022
|
32
|
|
||
|
2023
|
—
|
|
||
|
2024
|
—
|
|
||
|
After 2024
|
—
|
|
||
|
Total lease payments
|
1,152
|
|
||
|
Interest expense
|
(22
|
)
|
||
|
Present value of lease liabilities
|
$
|
1,130
|
|
|
We recorded the lease right-of-use asset in Other Assets and the lease liability in Other Liabilities. Cash payments related to lease liabilities were
$1.6 million
for the year ended
December 31, 2019
and were reported in operating cash flows.
December 31, 2019 | 10-K
96
In January 2019, the Company entered into a long-term lease agreement with an unrelated party for its new home office in Austin, Texas. The building in which we have leased office space is under construction and is expected to be completed in 2020.
The long-term lease will commence after construction of the building is complete and has a 121-month term, and therefore is not included in the tables above. Payments under the new long-term lease agreement will average approximately $0.1 million per month.
The Company does not engage in lease agreements among related parties.
As of
December 31, 2019
, CICA Ltd. is committed to fund investments up to
$40 million
related to a private equity fund.
(8)
SEGMENT AND OTHER OPERATING INFORMATION
The Company has
two
reportable segments: Life Insurance and Home Service Insurance.
Our Life Insurance segment issues U.S. Dollar-denominated endowment contracts internationally, which are principally accumulation contracts that incorporate an element of life insurance protection and ordinary whole life insurance in U.S. Dollar-denominated amounts sold to foreign residents. These contracts are designed to provide a fixed amount of insurance coverage over the life of the insured and may utilize rider benefits to provide additional coverage and annuity benefits to enhance accumulations. We operate our domestic business in this segment through CICA, CICA Ltd. and CNLIC.
Our domestic Home Service Insurance segment operates through our subsidiaries SPLIC, MGLIC and SPFIC, and focuses on the life insurance needs of the middle and lower income markets, primarily in Louisiana, Mississippi and Arkansas. Our policies are sold and serviced through a home service marketing distribution system of
223
employee-agents who work on a route system and through over
221
funeral homes and independent agents who sell policies, collect premiums and service policyholders. To a lesser extent, our Home Service Insurance segment sells limited liability, named peril property policies covering dwelling and contents.
The Life Insurance and Home Service Insurance portions of the Company constitute separate businesses. In addition to the Life Insurance and Home Service Insurance business, the Company also operates other non-insurance ("Other Non-Insurance Enterprises") portions of the Company, which primarily includes the Company’s IT and Corporate-support functions, which is included in the table presentation below to properly reconcile the segment information with the consolidated financial statements of the Company.
The accounting policies of the segments are in accordance with U.S. GAAP and are the same as those described in the summary of significant accounting policies. We evaluate profit and loss performance based on U.S. GAAP net income before federal income taxes for our reportable segments.
December 31, 2019 | 10-K
97
The Company's Other Non-insurance operations are the only difference between segments and reported consolidated operations.
|
Year ended December 31, 2019
(In thousands)
|
Life
Insurance |
Home
Service Insurance |
Other
Non-Insurance Enterprises |
Consolidated
|
||||||||
|
Revenues:
|
|
|
|
|
||||||||
|
Premiums
|
||||||||||||
|
Life insurance
|
$
|
136,941
|
|
41,410
|
|
—
|
|
178,351
|
|
|||
|
Accident and health insurance
|
725
|
|
658
|
|
—
|
|
1,383
|
|
||||
|
Property insurance
|
—
|
|
4,613
|
|
—
|
|
4,613
|
|
||||
|
Net investment income
|
44,779
|
|
13,058
|
|
1,694
|
|
59,531
|
|
||||
|
Realized investment gains (losses), net
|
6,795
|
|
1,470
|
|
(3,016
|
)
|
5,249
|
|
||||
|
Other income
|
1,412
|
|
4
|
|
2
|
|
1,418
|
|
||||
|
Total revenue
|
190,652
|
|
61,213
|
|
(1,320
|
)
|
250,545
|
|
||||
|
Benefits and expenses:
|
|
|
|
|
|
|
|
|
||||
|
Insurance benefits paid or provided:
|
|
|
|
|
|
|
|
|
||||
|
Claims and surrenders
|
82,964
|
|
23,863
|
|
—
|
|
106,827
|
|
||||
|
Increase in future policy benefit reserves
|
39,873
|
|
1,839
|
|
—
|
|
41,712
|
|
||||
|
Policyholders' dividends
|
6,004
|
|
36
|
|
—
|
|
6,040
|
|
||||
|
Total insurance benefits paid or provided
|
128,841
|
|
25,738
|
|
—
|
|
154,579
|
|
||||
|
Commissions
|
20,128
|
|
14,094
|
|
—
|
|
34,222
|
|
||||
|
Other general expenses
|
23,012
|
|
19,517
|
|
5,911
|
|
48,440
|
|
||||
|
Capitalization of deferred policy acquisition costs
|
(17,448
|
)
|
(4,807
|
)
|
—
|
|
(22,255
|
)
|
||||
|
Amortization of deferred policy acquisition costs
|
23,832
|
|
4,436
|
|
—
|
|
28,268
|
|
||||
|
Amortization of cost of insurance acquired
|
492
|
|
1,054
|
|
—
|
|
1,546
|
|
||||
|
Total benefits and expenses
|
178,857
|
|
60,032
|
|
5,911
|
|
244,800
|
|
||||
|
Income (loss) before income tax expense
|
$
|
11,795
|
|
1,181
|
|
(7,231
|
)
|
5,745
|
|
|||
December 31, 2019 | 10-K
98
|
Year ended December 31, 2018
(In thousands)
|
Life
Insurance |
Home
Service Insurance |
Other
Non-Insurance Enterprises |
Consolidated
|
||||||||
|
Revenues:
|
|
|
|
|
||||||||
|
Premiums
|
||||||||||||
|
Life insurance
|
$
|
140,566
|
|
41,259
|
|
—
|
|
181,825
|
|
|||
|
Accident and health insurance
|
580
|
|
638
|
|
—
|
|
1,218
|
|
||||
|
Property insurance
|
—
|
|
4,817
|
|
—
|
|
4,817
|
|
||||
|
Net investment income
|
39,985
|
|
13,125
|
|
1,095
|
|
54,205
|
|
||||
|
Realized investment gains (losses), net
|
358
|
|
(46
|
)
|
(204
|
)
|
108
|
|
||||
|
Other income (loss)
|
1,833
|
|
(1
|
)
|
1
|
|
1,833
|
|
||||
|
Total revenue
|
183,322
|
|
59,792
|
|
892
|
|
244,006
|
|
||||
|
Benefits and expenses:
|
|
|
|
|
|
|
|
|
||||
|
Insurance benefits paid or provided:
|
|
|
|
|
|
|
|
|
||||
|
Claims and surrenders
|
69,149
|
|
21,954
|
|
—
|
|
91,103
|
|
||||
|
Increase in future policy benefit reserves
|
43,671
|
|
4,276
|
|
—
|
|
47,947
|
|
||||
|
Policyholders' dividends
|
6,316
|
|
46
|
|
—
|
|
6,362
|
|
||||
|
Total insurance benefits paid or provided
|
119,136
|
|
26,276
|
|
—
|
|
145,412
|
|
||||
|
Commissions
|
20,079
|
|
14,883
|
|
—
|
|
34,962
|
|
||||
|
Other general expenses
|
18,718
|
|
20,435
|
|
8,479
|
|
47,632
|
|
||||
|
Capitalization of deferred policy acquisition costs
|
(17,194
|
)
|
(5,501
|
)
|
—
|
|
(22,695
|
)
|
||||
|
Amortization of deferred policy acquisition costs
|
29,915
|
|
4,320
|
|
—
|
|
34,235
|
|
||||
|
Amortization of cost of insurance acquired
|
583
|
|
1,875
|
|
—
|
|
2,458
|
|
||||
|
Total benefits and expenses
|
171,237
|
|
62,288
|
|
8,479
|
|
242,004
|
|
||||
|
Income (loss) before income tax expense
|
$
|
12,085
|
|
(2,496
|
)
|
(7,587
|
)
|
2,002
|
|
|||
December 31, 2019 | 10-K
99
|
Year ended December 31, 2017
(In thousands)
|
Life
Insurance |
Home
Service Insurance |
Other
Non-Insurance Enterprises |
Consolidated
|
||||||||
|
Revenues:
|
|
|
|
|
||||||||
|
Premiums
|
|
|
|
|
|
|
|
|
||||
|
Life insurance
|
$
|
149,957
|
|
41,385
|
|
—
|
|
191,342
|
|
|||
|
Accident and health insurance
|
751
|
|
641
|
|
—
|
|
1,392
|
|
||||
|
Property insurance
|
—
|
|
4,986
|
|
—
|
|
4,986
|
|
||||
|
Net investment income
|
38,578
|
|
13,132
|
|
1,436
|
|
53,146
|
|
||||
|
Realized investment gains (losses), net
|
(461
|
)
|
979
|
|
—
|
|
518
|
|
||||
|
Other income
|
1,061
|
|
3
|
|
179
|
|
1,243
|
|
||||
|
Total revenue
|
189,886
|
|
61,126
|
|
1,615
|
|
252,627
|
|
||||
|
Benefits and expenses:
|
|
|
|
|
|
|
|
|
||||
|
Insurance benefits paid or provided:
|
|
|
|
|
|
|
|
|
||||
|
Claims and surrenders
|
60,393
|
|
22,512
|
|
—
|
|
82,905
|
|
||||
|
Increase in future policy benefit reserves
|
70,783
|
|
5,246
|
|
—
|
|
76,029
|
|
||||
|
Policyholders' dividends
|
6,226
|
|
42
|
|
—
|
|
6,268
|
|
||||
|
Total insurance benefits paid or provided
|
137,402
|
|
27,800
|
|
—
|
|
165,202
|
|
||||
|
Commissions
|
25,760
|
|
15,564
|
|
—
|
|
41,324
|
|
||||
|
Other general expenses
|
18,597
|
|
23,395
|
|
4,396
|
|
46,388
|
|
||||
|
Capitalization of deferred policy acquisition costs
|
(23,157
|
)
|
(5,963
|
)
|
—
|
|
(29,120
|
)
|
||||
|
Amortization of deferred policy acquisition costs
|
25,295
|
|
4,395
|
|
—
|
|
29,690
|
|
||||
|
Amortization of cost of insurance acquired
|
595
|
|
1,534
|
|
—
|
|
2,129
|
|
||||
|
Total benefits and expenses
|
184,492
|
|
66,725
|
|
4,396
|
|
255,613
|
|
||||
|
Income (loss) before income tax expense
|
$
|
5,394
|
|
(5,599
|
)
|
(2,781
|
)
|
(2,986
|
)
|
|||
The table below summarizes assets by segment.
|
December 31,
(In thousands) |
2019
|
2018
|
||||
|
Assets:
|
|
|
||||
|
Life Insurance
|
$
|
1,284,844
|
|
1,174,769
|
|
|
|
Home Service Insurance
|
391,366
|
|
369,563
|
|
||
|
Other Non-Insurance Operations
|
68,726
|
|
71,229
|
|
||
|
Total assets
|
$
|
1,744,936
|
|
1,615,561
|
|
|
December 31, 2019 | 10-K
100
GEOGRAPHIC INFORMATION
The following table sets forth the Company's annual total of earned premiums from geographic area for the years indicated:
|
Years ended December 31,
(In thousands) |
2019
|
2018
|
2017
|
||||||
|
Area:
|
|
|
|
||||||
|
United States
|
$
|
53,656
|
|
53,836
|
|
54,737
|
|
||
|
Colombia
|
26,768
|
|
27,605
|
|
29,200
|
|
|||
|
Venezuela
|
22,353
|
|
24,783
|
|
27,997
|
|
|||
|
Taiwan
|
19,403
|
|
18,888
|
|
19,535
|
|
|||
|
Ecuador
|
14,198
|
|
15,187
|
|
16,440
|
|
|||
|
Argentina
|
10,069
|
|
9,960
|
|
10,534
|
|
|||
|
Other foreign countries
|
40,562
|
|
41,302
|
|
42,268
|
|
|||
|
Net reinsurance
|
(2,662
|
)
|
(3,701
|
)
|
(2,991
|
)
|
|||
|
Total premiums
|
$
|
184,347
|
|
187,860
|
|
197,720
|
|
||
(9)
INCOME TAXES
Beginning in 2018, the statutory tax rate is
21%
. Due to the reduced statutory tax rate under the Tax Cuts and Jobs Act ("Tax Act"), we were required to remeasure our deferred tax assets and liabilities using the lower rate at December 22, 2017, the date of enactment. This re-measurement resulted in a reduction of net deferred tax assets of
$35.7 million
, which includes a
$4.7 million
benefit related to deferred taxes previously recognized in accumulated other comprehensive income. In accordance with the SEC's Staff Accounting Bulletin No. 118 ("SAB 118"), the Company recorded provisional amounts related to the impacts of the Tax Act as of December 31, 2017, including but not limited to the change in corporate tax rate and immediate expensing of certain capital assets. During 2018, the provisional amounts were adjusted and finalized during the measurement period allowed by SAB 118 and had an immaterial impact on the 2018 income tax expense.
CICA Ltd., a wholly-owned subsidiary of Citizens, is considered a controlled foreign corporation for federal income tax purposes. As a result, the insurance activity of CICA Ltd. is subject to Subpart F of the IRC and is included in Citizens’ taxable income and due to the
0%
enacted tax rate in Bermuda there are no deferred taxes recorded for CICA Ltd.'s temporary differences. For the years ended
December 31, 2019
and
2018
, the Subpart F income inclusion generated
$5.9 million
and
$18.4 million
of federal income tax expense, respectively. The December 31,
2018
Subpart F income inclusion was largely driven by the impact of the novation transaction. The novation transaction also resulted in somewhat offsetting adjustments to the current tax liability for CICA, notably an increased amortization of DAC under Section 848 of the IRC, a reduction of premium income and a release of the
$50.8 million
uncertain tax position related to tax reserves on product qualification issues.
Our federal income tax expense was
$7.1 million
,
$13.1 million
and
$35.1 million
in
2019
,
2018
and
2017
, respectively. This represents effective tax rates of
126.0%
,
652.6%
and
(1,176.9)%
, respectively. The high positive rate in 2018 was primarily due to the large Subpart F income inclusion following the novation transaction. The high negative effective tax rate in 2017 was primarily related to remeasurement of deferred income taxes under the Tax Act reform which went into effect on December 22, 2017.
December 31, 2019 | 10-K
101
A reconciliation of federal income tax expense computed by applying the federal income tax rate of
21%
in
2019
and
2018
and
35%
in
2017
to income (loss) before federal income tax is as follows:
|
Years ended December 31,
(In thousands, except for %) |
2019
|
%
|
2018
|
%
|
2017
|
%
|
||||||||||||||
|
Expected tax expense (benefit)
|
$
|
1,186
|
|
21.0
|
%
|
$
|
420
|
|
21.0
|
%
|
$
|
(1,045
|
)
|
35.0
|
%
|
|||||
|
Foreign income tax rate differential
|
(1,562
|
)
|
(27.7
|
)
|
(8,133
|
)
|
(406.3
|
)
|
—
|
|
—
|
|
||||||||
|
Tax-exempt interest and dividends-received deduction
|
(145
|
)
|
(2.6
|
)
|
(227
|
)
|
(11.3
|
)
|
(360
|
)
|
12.1
|
|
||||||||
|
Adjustment of prior year taxes
|
(99
|
)
|
(1.8
|
)
|
113
|
|
5.6
|
|
68
|
|
(2.3
|
)
|
||||||||
|
Effect of graduated rates
|
—
|
|
—
|
|
—
|
|
—
|
|
(140
|
)
|
4.7
|
|
||||||||
|
Effect of uncertain tax position
|
1,148
|
|
20.3
|
|
2,612
|
|
130.5
|
|
(355
|
)
|
11.9
|
|
||||||||
|
Nondeductible costs to remediate tax compliance issue
|
(27
|
)
|
(0.5
|
)
|
(366
|
)
|
(18.3
|
)
|
(384
|
)
|
12.9
|
|
||||||||
|
162(m) compensation limitation
|
480
|
|
8.5
|
|
53
|
|
2.6
|
|
—
|
|
—
|
|
||||||||
|
Subpart F income
|
5,853
|
|
103.6
|
|
18,403
|
|
919.2
|
|
—
|
|
—
|
|
||||||||
|
Tax reform re-measurement
|
—
|
|
—
|
|
68
|
|
3.4
|
|
35,718
|
|
(1,196.2
|
)
|
||||||||
|
Goodwill impairment
|
—
|
|
—
|
|
—
|
|
—
|
|
1,621
|
|
(54.3
|
)
|
||||||||
|
Other
|
281
|
|
5.2
|
|
121
|
|
6.2
|
|
18
|
|
(0.7
|
)
|
||||||||
|
Total federal income tax expense
|
$
|
7,115
|
|
126.0
|
%
|
$
|
13,064
|
|
652.6
|
%
|
$
|
35,141
|
|
(1,176.9
|
)%
|
|||||
Income tax expense consists of:
|
Years ended December 31,
(In thousands) |
2019
|
2018
|
2017
|
||||||
|
Current
|
$
|
5,542
|
|
(49,569
|
)
|
14,454
|
|
||
|
Deferred
|
1,573
|
|
62,633
|
|
20,687
|
|
|||
|
Total income tax expense
|
$
|
7,115
|
|
13,064
|
|
35,141
|
|
||
December 31, 2019 | 10-K
102
The components of deferred federal income taxes are as follows:
|
December 31,
(In thousands) |
2019
|
2018
|
||||
|
Deferred tax assets:
|
|
|
||||
|
Future policy benefit reserves
|
$
|
2,641
|
|
2,795
|
|
|
|
Net operating and capital loss carryforwards
|
230
|
|
191
|
|
||
|
Investments
|
702
|
|
1,841
|
|
||
|
Deferred intercompany loss
|
3,539
|
|
5,190
|
|
||
|
Lease liability
|
238
|
|
—
|
|
||
|
Other
|
700
|
|
339
|
|
||
|
Total gross deferred tax assets
|
8,050
|
|
10,356
|
|
||
|
Deferred tax liabilities:
|
|
|
|
|
||
|
DAC, COIA and intangible assets
|
(8,417
|
)
|
(8,745
|
)
|
||
|
Unrealized gains on investments available-for-sale
|
(7,300
|
)
|
(1,968
|
)
|
||
|
Tax reserves transition liability
|
(4,483
|
)
|
(4,864
|
)
|
||
|
Right of use lease asset
|
(238
|
)
|
—
|
|
||
|
Other
|
(40
|
)
|
(488
|
)
|
||
|
Total gross deferred tax liabilities
|
(20,478
|
)
|
(16,065
|
)
|
||
|
Net deferred tax liability
|
$
|
(12,428
|
)
|
(5,709
|
)
|
|
A summary of the changes in the components of deferred federal and state income taxes is as follows:
|
December 31,
(In thousands) |
2019
|
2018
|
||||
|
Deferred federal and state income taxes:
|
|
|
||||
|
Balance January 1,
|
$
|
(5,709
|
)
|
50,797
|
|
|
|
Deferred tax benefit
|
(1,573
|
)
|
(62,633
|
)
|
||
|
Investments available-for-sale
|
(5,129
|
)
|
6,153
|
|
||
|
Effects of unrealized gains on DAC, COIA and reserves
|
(17
|
)
|
(26
|
)
|
||
|
Balance December 31,
|
$
|
(12,428
|
)
|
(5,709
|
)
|
|
MGLIC, an entity that is not eligible to join the Company's consolidated tax return until 2020, had a
$1.1
million net operating loss carryforward at
December 31, 2019
, which will begin expiring in
2036
.
The Company and our subsidiaries had
no
capital loss carryforwards at
December 31, 2019
, except MGLIC had a
$21,000
capital loss carryforward at December 31, 2019, which will begin expiring in
2023
.
At
December 31, 2019
and
2018
, we determined that as a result of our taxable capital gain income in carryback periods, the expected reversal of existing deferred tax liabilities, and tax planning strategies, it was more likely than not that the deferred tax assets would be realized. Thus, the Company holds no valuation allowance in operations or other comprehensive income at
December 31, 2019
and
2018
.
The Company recognizes only the impact of tax positions that, based on their technical merits, are more likely than not to be sustained upon an audit by the taxing authority.
December 31, 2019 | 10-K
103
A reconciliation of unrecognized tax benefits is as follows:
|
Years ended December 31,
(In thousands) |
2019
|
2018
|
2017
|
||||||
|
Balance at January 1,
|
$
|
44,841
|
|
95,831
|
|
85,762
|
|
||
|
Additions based on tax positions related to the current year
|
—
|
|
—
|
|
7,384
|
|
|||
|
Additions for tax positions of prior years
|
1,148
|
|
2,268
|
|
2,685
|
|
|||
|
Reductions for tax positions of prior years
|
—
|
|
(53,258
|
)
|
—
|
|
|||
|
Balance December 31,
|
$
|
45,989
|
|
44,841
|
|
95,831
|
|
||
This unrecognized tax benefit is reported net in current federal income tax payable in the consolidated balance sheets. Included in these amounts is
$9.9 million
,
$8.8 million
and
$6.5 million
of interest expense with respect to unrecognized tax benefit as of
December 31, 2019
,
2018
and
2017
, respectively.
The Company’s unrecognized tax benefits at
December 31, 2019
would affect the effective tax rate if recognized. The Company does not believe there is a reasonable possibility the total amount of uncertain tax benefits will significantly increase or decrease in the next twelve months.
The Company’s practice is to recognize interest and penalties related to income tax matters in income tax expense. In the consolidated statements of operations and comprehensive income (loss), the amount of interest expense recorded was
$1.1 million
,
$2.3 million
and
$0.8 million
for the years ended
December 31, 2019
,
2018
and
2017
, respectively.
The Company's Federal income tax return is filed on a consolidated basis with the following entities:
Citizens, Inc.
CICA Life Insurance Company of America
Security Plan Life Insurance Company
Security Plan Fire Insurance Company
Computing Technology, Inc.
Citizens National Life Insurance Company
MGLIC files its Federal income tax return on a stand-alone basis as it is not eligible to join the consolidated group until
2020
. CICA Ltd. is subject to separate tax reporting.
The method of allocation among companies is subject to a written tax sharing agreement, approved by the Board of Directors, whereby allocation is made primarily on a separate return basis pursuant to the wait-and-see method. Under this method, consolidated group members are not given current credit or refunds for net operating losses until taxable income on a separate return basis is generated. Intercompany tax balances are settled quarterly.
The Company and our subsidiaries file income tax returns in the U.S. Federal jurisdiction and various U.S. states. None of our subsidiaries are subject to examination by U.S. tax authorities for years prior to
2016
.
December 31, 2019 | 10-K
104
(10)
OTHER COMPREHENSIVE INCOME (LOSS)
The changes in the components of other comprehensive income (loss) are reported net of the effects of income taxes of
21%
in
2019
and
2018
due to the reduced statutory tax rate under the Tax Act, and
35%
in
2017
, as indicated below.
|
(In thousands)
|
Amount
|
Tax Effect
|
Total
|
||||||
|
Year ended December 31, 2019
|
|
|
|
||||||
|
Unrealized gains (losses):
|
|
|
|
||||||
|
Unrealized holding gains (losses) arising during the period
|
$
|
78,744
|
|
(5,535
|
)
|
73,209
|
|
||
|
Reclassification adjustment for (gains) losses included in net income
|
(1,927
|
)
|
405
|
|
(1,522
|
)
|
|||
|
Effects on DAC and COIA
|
81
|
|
(17
|
)
|
64
|
|
|||
|
Other comprehensive income (loss)
|
$
|
76,898
|
|
(5,147
|
)
|
71,751
|
|
||
|
Year ended December 31, 2018
|
|
|
|
|
|
|
|||
|
Unrealized gains (losses):
|
|
|
|
|
|
|
|||
|
Unrealized holding gains (losses) arising during the period
|
$
|
(34,357
|
)
|
6,520
|
|
(27,837
|
)
|
||
|
Reclassification adjustment for (gains) losses included in net income
|
(953
|
)
|
200
|
|
(753
|
)
|
|||
|
Unrealized gain from held-to-maturity transferred to available-for-sale
|
3,588
|
|
(218
|
)
|
3,370
|
|
|||
|
Effects on DAC and COIA
|
130
|
|
(38
|
)
|
92
|
|
|||
|
Other comprehensive income (loss)
|
$
|
(31,592
|
)
|
6,464
|
|
(25,128
|
)
|
||
|
Year ended December 31, 2017
|
|
|
|
|
|
|
|||
|
Unrealized gains (losses):
|
|
|
|
|
|
|
|||
|
Unrealized holding gains (losses) arising during the period
|
$
|
17,374
|
|
(5,379
|
)
|
11,995
|
|
||
|
Reclassification adjustment for (gains) losses included in net income
|
546
|
|
(191
|
)
|
355
|
|
|||
|
Effects on DAC and COIA
|
292
|
|
(102
|
)
|
190
|
|
|||
|
Other comprehensive income (loss)
|
$
|
18,212
|
|
(5,672
|
)
|
12,540
|
|
||
(11)
STOCK COMPENSATION
In January 2018 and January 2019, the Company's Board of Directors approved awards of restricted stock units under the Citizens, Inc. Omnibus Incentive Plan for non-employee directors and the executive management team. Vesting of the units is subject to the recipient’s continued service or employment with the Company through the applicable vesting date, which is one year for directors and two years for employees. In addition, the Board also approved equity grants for other employees with a delegation to the President and Chief Executive Officer to determine the participant and values to be awarded. There are
three million
shares that may be granted under the plan.
December 31, 2019 | 10-K
105
The following table provides a rollforward of restricted stock activity:
|
Restricted Stock Units
|
Units
|
Weighted Average Exercise Price
|
Weighted Average Remaining Contractual Life
|
Aggregate Fair Value
(1)
|
||||||||
|
(In thousands)
|
(In years)
|
(In thousands)
|
||||||||||
|
Outstanding at December 31, 2018
|
119
|
|
$
|
7.19
|
|
1.32
|
$
|
854
|
|
|||
|
Granted
|
446
|
|
7.20
|
|
3,212
|
|
||||||
|
Less:
|
||||||||||||
|
Vested
|
201
|
|
7.36
|
|
1,479
|
|
||||||
|
Forfeited
|
89
|
|
7.17
|
|
640
|
|
||||||
|
Outstanding at December 31, 2019
|
275
|
|
$
|
7.09
|
|
0.50
|
$
|
1,947
|
|
|||
(1)
Fair value per share of restricted stock units was equal to Grant Date fair value per share, which was calculated based on the closing price of the Company's Class A common stock on the NYSE on the grant date, in accordance with ASC Topic 718.
As of
December 31, 2019
, we recognized
$2.2 million
of expense, while
$1.0 million
was unrecognized and is expected to be amortized up to
1.10 years
.
Restricted stock unit awards give the participant the right to receive common stock in the future, subject to certain restrictions and a risk of forfeiture. Forfeitures are recognized in the period they occur. Compensation expense of
$2.1 million
and
$0.4 million
was recognized as of
December 31, 2019
and
2018
, respectively, related to these awards.
(12)
BENEFIT PLANS
The Company sponsors a defined contribution retirement plan. The plan was initially established as the Citizens, Inc. Profit Sharing Plan and was restated as the Citizens, Inc. 401(k) Retirement and Profit Sharing Plan effective March 1, 2016. There have been no profit sharing contributions since 2014.
On January 1, 2019, the 401(k) plan was amended to allow employees who have completed three months of service to participate in the plan. Prior to that date, a year of service was required before participation. Contributions are made by employees and the Company provides a matching contribution based upon the employee's level of contribution. The Company's expense was
$0.8 million
,
$0.7 million
and
$0.7 million
in
2019
,
2018
and
2017
, respectively.
The Company is primarily self-insured for employee health benefits. The Company records its self-insurance liability based on an estimate of claims incurred but not yet reported. There is stop-loss coverage for amounts in excess of
$120,000
per individual per year. If more claims are made than were estimated or if the costs of actual claims increase beyond what was anticipated, reserves recorded may not be sufficient and additional accruals may be required in future periods.
(13)
RELATED PARTY TRANSACTIONS
The Company has various routine related party transactions in conjunction with our holding company structure, such as a management service agreement related to costs incurred, a tax sharing agreement between entities, and inter-company dividends and capital contributions. A reinsurance assumption and novation transaction was completed effective July 1, 2018 between CICA and CICA Ltd. to transfer the international policies from CICA to CICA Ltd., the newly formed Bermuda entity.
As part of this transaction, the Company agreed to infuse capital into CICA as required by the Colorado Department of Insurance to keep CICA's risk-based capital above 350% in any future calendar year-end periods.
There were no other changes related to these relationships during the year ended
December 31, 2019
.
December 31, 2019 | 10-K
106
(14)
QUARTERLY FINANCIAL INFORMATION
(Unaudited)
The following table contains selected unaudited financial data for each quarter.
|
(In thousands, except per share amounts)
|
Fourth
Quarter
|
Third
Quarter
|
Second
Quarter
|
First
Quarter
|
||||||||
|
2019
|
|
|
|
|
||||||||
|
Revenues
|
$
|
69,806
|
|
61,467
|
|
56,866
|
|
62,406
|
|
|||
|
Benefits and expenses
|
64,878
|
|
59,335
|
|
60,189
|
|
60,398
|
|
||||
|
Federal income tax expense (benefit)
|
(23
|
)
|
86
|
|
1,242
|
|
5,810
|
|
||||
|
Net income (loss)
|
4,951
|
|
2,046
|
|
(4,565
|
)
|
(3,802
|
)
|
||||
|
Net income (loss) available to common shareholders
|
4,951
|
|
2,046
|
|
(4,565
|
)
|
(3,802
|
)
|
||||
|
Basic & Diluted earnings (losses) per share of Class A common stock
|
0.10
|
|
0.04
|
|
(0.09
|
)
|
(0.08
|
)
|
||||
|
Basic & Diluted earnings (losses) per share of Class B common stock
|
0.05
|
|
0.02
|
|
(0.04
|
)
|
(0.04
|
)
|
||||
|
(In thousands, except per share amounts)
|
Fourth
Quarter
|
Third
Quarter
(a)
|
Second
Quarter
|
First
Quarter
|
||||||||
|
2018
|
|
|
|
|
||||||||
|
Revenues
|
$
|
65,570
|
|
61,161
|
|
59,842
|
|
57,433
|
|
|||
|
Benefits and expenses
|
67,598
|
|
55,599
|
|
63,953
|
|
54,854
|
|
||||
|
Federal income tax expense (benefit)
|
(596
|
)
|
12,671
|
|
(1,553
|
)
|
2,542
|
|
||||
|
Net income (loss)
|
(1,432
|
)
|
(7,109
|
)
|
(2,558
|
)
|
37
|
|
||||
|
Net income (loss) available to common shareholders
|
(1,432
|
)
|
(7,109
|
)
|
(2,558
|
)
|
37
|
|
||||
|
Basic & Diluted earnings (losses) per share of Class A common stock
|
(0.03
|
)
|
(0.14
|
)
|
(0.05
|
)
|
—
|
|
||||
|
Basic & Diluted earnings (losses) per share of Class B common stock
|
(0.01
|
)
|
(0.07
|
)
|
(0.03
|
)
|
—
|
|
||||
(a)
On July 1, 2018, the Company novated all of the international policies issued by CICA to CICA Ltd., a newly established Bermuda entity that began operations in July 2018. While this novation transaction has been eliminated in consolidation of affiliated entities, there are tax effects reflected in the consolidated financial statements as a result of the transaction being executed between our subsidiaries that reside in different tax jurisdictions. CICA Ltd. is considered a controlled foreign corporation for federal tax purposes. As a result, the insurance activity of CICA Ltd. is subject to Subpart F of the IRC and is included in Citizens’s taxable income which generated
$18.4 million
of federal income tax expense in 2018. In addition, as of July 1, 2018, we implemented a new actuarial valuation software solution that provides enhanced reporting and modeling capabilities for ordinary whole life and endowment policies of CICA and CICA Ltd., which are included in the Life Insurance segment. The impact of this system conversion resulted in changes in estimates due to refinements based upon our accounting analysis of the circumstances and reflected as a decrease in reserves of
$10.2 million
and a decrease in DAC of
$4.3 million
, before tax.
(15)
SUBSEQUENT EVENTS
We have evaluated for subsequent events as defined by the accounting guidance through the date of financial statement issuance and have no subsequent events to disclose.
December 31, 2019 | 10-K
107
|
Schedule II
Condensed Financial Information of Registrant
CITIZENS, INC. (Parent Company)
Balance Sheets
|
||||||
|
December 31,
(In thousands)
|
2019
|
2018
|
||||
|
|
||||||
|
Assets
|
|
|
||||
|
Investment in subsidiaries
(1)
|
$
|
191,869
|
|
123,245
|
|
|
|
Fixed maturities available-for-sale, at fair value
|
50,491
|
|
41,705
|
|
||
|
Equity securities, at fair value
|
1,167
|
|
1,035
|
|
||
|
Real estate held for sale
|
2,571
|
|
5,718
|
|
||
|
Short-term investments
|
1,301
|
|
7,865
|
|
||
|
Cash
|
10,829
|
|
11,768
|
|
||
|
Accrued investment income
|
535
|
|
530
|
|
||
|
Accounts receivable from subsidiaries
(1)
|
4,770
|
|
5,871
|
|
||
|
Property and equipment, net
|
817
|
|
425
|
|
||
|
Other assets
|
552
|
|
305
|
|
||
|
Total assets
|
$
|
264,902
|
|
198,467
|
|
|
|
Liabilities and Stockholders' Equity
|
|
|
|
|
||
|
Liabilities:
|
|
|
|
|
||
|
Accrued expense and other liabilities
|
$
|
5,066
|
|
10,734
|
|
|
|
Total liabilities
|
$
|
5,066
|
|
10,734
|
|
|
|
Stockholders' equity:
|
|
|
|
|
||
|
Common stock:
|
|
|
|
|
||
|
Class A
|
$
|
261,515
|
|
259,793
|
|
|
|
Class B
|
3,184
|
|
3,184
|
|
||
|
Accumulated deficit
|
(70,969
|
)
|
(69,599
|
)
|
||
|
Unrealized investment gains on securities held by parent and subsidiaries, net of tax
|
77,117
|
|
5,366
|
|
||
|
Treasury stock
|
(11,011
|
)
|
(11,011
|
)
|
||
|
Total stockholders' equity
|
259,836
|
|
187,733
|
|
||
|
Total liabilities and stockholders' equity
|
$
|
264,902
|
|
198,467
|
|
|
(1)
Eliminated in consolidation.
Note to Schedule II
:
Citizens, Inc.'s investments in consolidated subsidiaries are stated at cost plus equity in undistributed income of consolidated subsidiaries. The Company includes in its Statement of Operations dividends from its subsidiaries and equity in undistributed income (loss) of consolidated subsidiaries, which represents the net income (loss) of each of its wholly-owned subsidiaries.
December 31, 2019 | 10-K
108
|
Schedule II, Continued
Condensed Financial Information of Registrant
CITIZENS, INC. (Parent Company)
Statements of Operations and Comprehensive Income (Loss)
|
|||||||||
|
Years ended December 31,
(In thousands) |
2019
|
2018
|
2017
|
||||||
|
Comprehensive income (loss):
|
|||||||||
|
Revenues:
|
|
|
|
||||||
|
Management service fees
(1)
|
$
|
43,694
|
|
43,323
|
|
42,367
|
|
||
|
Investment income
|
1,685
|
|
1,086
|
|
1,282
|
|
|||
|
Other
|
2
|
|
1
|
|
80
|
|
|||
|
Realized investment losses
|
(3,013
|
)
|
(196
|
)
|
—
|
|
|||
|
Total revenues
|
42,368
|
|
44,214
|
|
43,729
|
|
|||
|
Expenses:
|
|
|
|
|
|
|
|||
|
General expenses
|
46,020
|
|
44,009
|
|
41,680
|
|
|||
|
Taxes, licenses and fees
|
146
|
|
761
|
|
1,203
|
|
|||
|
Total expenses
|
46,166
|
|
44,770
|
|
42,883
|
|
|||
|
Income (loss) before federal income tax expense (benefit) and equity in loss of consolidated subsidiaries
|
(3,798
|
)
|
(556
|
)
|
846
|
|
|||
|
Federal income tax expense (benefit)
|
(4,491
|
)
|
(185
|
)
|
228
|
|
|||
|
Income (loss) before equity in income of consolidated subsidiaries
|
693
|
|
(371
|
)
|
618
|
|
|||
|
Equity in loss of consolidated subsidiaries
|
(2,063
|
)
|
(10,691
|
)
|
(38,745
|
)
|
|||
|
Net loss
|
(1,370
|
)
|
(11,062
|
)
|
(38,127
|
)
|
|||
|
Other comprehensive income (loss)
|
71,751
|
|
(25,128
|
)
|
12,540
|
|
|||
|
Total comprehensive income (loss)
|
$
|
70,381
|
|
(36,190
|
)
|
(25,587
|
)
|
||
(1)
Eliminated in consolidation.
Note to Schedule II
:
Citizens, Inc.'s investments in consolidated subsidiaries are stated at cost plus equity in undistributed income of consolidated subsidiaries. The Company includes in its Statement of Operations and Comprehensive Income (Loss) dividends from its subsidiaries and equity in undistributed income (loss) of consolidated subsidiaries, which represents the net income (loss) of each of its wholly-owned subsidiaries.
December 31, 2019 | 10-K
109
|
Schedule II, Continued
Condensed Financial Information of Registrant
CITIZENS, INC. (Parent Company)
Statements of Cash Flows
|
|||||||||
|
Years ended December 31,
(In thousands) |
2019
|
2018
|
2017
|
||||||
|
Cash flows from operating activities:
|
|
|
|
||||||
|
Net loss
|
$
|
(1,370
|
)
|
(11,062
|
)
|
(38,127
|
)
|
||
|
Adjustments to reconcile net income (loss) to net cash provided by operating activities:
|
|
|
|
|
|
|
|||
|
Realized investment losses, net
|
3,013
|
|
196
|
|
—
|
|
|||
|
Equity in loss of consolidated subsidiaries
|
2,063
|
|
10,691
|
|
38,745
|
|
|||
|
Change in accrued expenses and other liabilities
|
(6,530
|
)
|
(2,036
|
)
|
4,370
|
|
|||
|
Amortization of premiums and discounts on investments
|
496
|
|
567
|
|
714
|
|
|||
|
Depreciation
|
267
|
|
356
|
|
319
|
|
|||
|
Change in accrued investment income
|
(5
|
)
|
(46
|
)
|
181
|
|
|||
|
Stock-based compensation
|
2,099
|
|
—
|
|
—
|
|
|||
|
Decrease (increase) in receivable from subsidiaries and other assets
|
1,101
|
|
382
|
|
(2,901
|
)
|
|||
|
Other, net
|
(248
|
)
|
22
|
|
(102
|
)
|
|||
|
Net cash provided by (used in) operating activities
|
886
|
|
(930
|
)
|
3,199
|
|
|||
|
Cash flows from investing activities:
|
|
|
|
|
|
|
|||
|
Purchases of fixed maturities, available-for-sale
|
(12,970
|
)
|
(11,871
|
)
|
—
|
|
|||
|
Maturities of fixed maturities, available-for-sale
|
691
|
|
7,160
|
|
10,986
|
|
|||
|
Sales of fixed maturities, available-for-sale
|
4,268
|
|
1,366
|
|
—
|
|
|||
|
Sales of other long-term investments and property and equipment
|
14
|
|
103
|
|
3
|
|
|||
|
Purchases of other long-term investments and property and equipment
|
(85
|
)
|
(60
|
)
|
(261
|
)
|
|||
|
Purchases of short-term investments
|
(2,456
|
)
|
(7,850
|
)
|
—
|
|
|||
|
Maturities of short-term investments
|
9,090
|
|
—
|
|
500
|
|
|||
|
Capital contribution to subsidiary
|
—
|
|
—
|
|
(5,250
|
)
|
|||
|
Net cash provided by (used in) investing activities
|
(1,448
|
)
|
(11,152
|
)
|
5,978
|
|
|||
|
Cash flows from financing activities:
|
|
|
|
|
|
|
|||
|
Other
|
(377
|
)
|
—
|
|
—
|
|
|||
|
Net cash used in financing activities
|
(377
|
)
|
—
|
|
—
|
|
|||
|
Net increase (decrease) in cash
|
(939
|
)
|
(12,082
|
)
|
9,177
|
|
|||
|
Cash at beginning of year
|
11,768
|
|
23,850
|
|
14,673
|
|
|||
|
Cash at end of year
|
$
|
10,829
|
|
11,768
|
|
23,850
|
|
||
Note to Schedule II
:
Citizens, Inc.'s investments in consolidated subsidiaries are stated at cost plus equity in undistributed income of consolidated subsidiaries. The Company includes in its Statement of Operations dividends from its subsidiaries and equity in undistributed income (loss) of consolidated subsidiaries, which represents the net income (loss) of each of its wholly-owned subsidiaries.
December 31, 2019 | 10-K
110
|
Schedule III
Consolidated Supplementary Insurance Information
|
||||||
|
Years ended December 31,
(In thousands) |
2019
|
2018
|
||||
|
Deferred policy acquisition costs:
|
|
|
||||
|
Life Insurance
|
$
|
111,461
|
|
117,845
|
|
|
|
Home Service Insurance
|
37,788
|
|
37,902
|
|
||
|
Total consolidated deferred policy acquisition costs
|
$
|
149,249
|
|
155,747
|
|
|
|
Future policy benefit reserves and policy claims payable:
|
|
|
|
|
||
|
Life Insurance
|
$
|
1,025,128
|
|
987,086
|
|
|
|
Home Service Insurance
|
279,099
|
|
277,795
|
|
||
|
Total consolidated future policy benefit reserves and policy claims payable
|
$
|
1,304,227
|
|
1,264,881
|
|
|
|
Unearned premiums:
|
|
|
|
|
||
|
Life Insurance
|
$
|
1,145
|
|
914
|
|
|
|
Home Service Insurance
|
224
|
|
231
|
|
||
|
Total consolidated unearned premiums
|
$
|
1,369
|
|
1,145
|
|
|
|
Other policy claims and benefits payable:
|
|
|
|
|
||
|
Life Insurance
|
$
|
87,359
|
|
82,641
|
|
|
|
Home Service Insurance
|
1,777
|
|
1,777
|
|
||
|
Total consolidated other policy claims and benefits payable
|
$
|
89,136
|
|
84,418
|
|
|
December 31, 2019 | 10-K
111
For the Company's short duration premiums (property), written premium is not materially different from earned premium, therefore only earned premiums are detailed in Schedule IV.
|
Schedule IV
Consolidated Statement of Reinsurance
|
|||||||||||||||
|
(In thousands)
|
Direct
Amount
|
Ceded to
Other
Companies
|
Assumed
From Other
Companies
|
Net Amount
|
% of
Amount
Assumed to
Net
|
||||||||||
|
Year ended December 31, 2019
|
|
|
|
|
|
||||||||||
|
Life insurance in force
|
$
|
4,728,826
|
|
486,937
|
|
4,892
|
|
4,246,781
|
|
0.1
|
%
|
||||
|
Premiums:
|
|
|
|
|
|
|
|
|
|
|
|||||
|
Life insurance
|
180,204
|
|
1,952
|
|
99
|
|
178,351
|
|
|
|
|||||
|
Accident and health insurance
|
1,400
|
|
17
|
|
—
|
|
1,383
|
|
|
|
|||||
|
Property insurance
|
5,405
|
|
792
|
|
—
|
|
4,613
|
|
|
|
|||||
|
Total premiums
|
$
|
187,009
|
|
2,761
|
|
99
|
|
184,347
|
|
0.1
|
%
|
||||
|
Year ended December 31, 2018
|
|
|
|
|
|
|
|
|
|
|
|||||
|
Life insurance in force
|
$
|
4,835,631
|
|
490,295
|
|
5,202
|
|
4,350,538
|
|
0.1
|
%
|
||||
|
Premiums:
|
|
|
|
|
|
|
|
|
|
|
|||||
|
Life insurance
|
184,722
|
|
2,996
|
|
99
|
|
181,825
|
|
|
|
|||||
|
Accident and health insurance
|
1,232
|
|
14
|
|
—
|
|
1,218
|
|
|
|
|||||
|
Property insurance
|
5,607
|
|
790
|
|
—
|
|
4,817
|
|
|
|
|||||
|
Total premiums
|
$
|
191,561
|
|
3,800
|
|
99
|
|
187,860
|
|
0.1
|
%
|
||||
|
Year ended December 31, 2017
|
|
|
|
|
|
|
|
|
|
|
|||||
|
Life insurance in force
|
$
|
4,967,856
|
|
503,685
|
|
5,564
|
|
4,469,735
|
|
0.1
|
%
|
||||
|
Premiums:
|
|
|
|
|
|
|
|
|
|
|
|||||
|
Life insurance
|
193,534
|
|
2,334
|
|
142
|
|
191,342
|
|
|
|
|||||
|
Accident and health insurance
|
1,410
|
|
18
|
|
—
|
|
1,392
|
|
|
|
|||||
|
Property insurance
|
5,767
|
|
781
|
|
—
|
|
4,986
|
|
|
|
|||||
|
Total premiums
|
$
|
200,711
|
|
3,133
|
|
142
|
|
197,720
|
|
0.1
|
%
|
||||
December 31, 2019 | 10-K
112
EXHIBITS
|
Exhibit No.
|
The following exhibits are filed herewith:
|
|
|
|
|
|
|
|
|
|
|
|
|
|
|
24
|
Power of Attorney (included on signature page enclosed herein)
|
|
|
|
|
|
|
|
|
|
|
|
|
|
|
|
|
|
|
101.INS
|
XBRL Instance Document
|
|
|
101.SCH
|
XBRL Taxonomy Extension Schema
|
|
|
101.CAL
|
XBRL Taxonomy Extension Calculation Linkbase
|
|
|
101.DEF
|
XBRL Taxonomy Extension Definition Linkbase
|
|
|
101.LAB
|
XBRL Taxonomy Extension Label Linkbase
|
|
|
101.PRE
|
XBRL Taxonomy Extension Presentation Linkbase
|
|
|
†
|
Indicates management contract or compensatory plan or arrangement.
|
|
*
|
Filed herewith.
|
December 31, 2019 | 10-K
113
SIGNATURES
Pursuant to the requirements of Section 13 or 15(d) of the Securities Exchange Act of 1934, the Registrant has duly caused this report to be signed on its behalf by the undersigned, hereunto duly authorized.
|
|
CITIZENS, INC.
|
|
||
|
|
|
|
||
|
Date:
|
March 11, 2020
|
By:
|
/s/ Geoffrey M. Kolander
|
|
|
Geoffrey M. Kolander,
|
||||
|
President, Chief Executive Officer and Director
|
||||
|
(Principal Executive Officer)
|
||||
|
|
||||
|
By:
|
/s/ Jeffery P. Conklin
|
|||
|
Jeffery P. Conklin,
|
||||
|
Vice President, Chief Financial Officer and Treasurer
|
||||
|
|
(Principal Financial and Accounting Officer)
|
|
||
POWER OF ATTORNEY
KNOW ALL PERSONS BY THESE PRESENTS, that each person whose signature appears below constitutes and appoints Geoffrey M. Kolander and James A. Eliasberg, jointly and severally, his or her attorneys-in-fact, each with the power of substitution, for him or her in any and all capacities, to sign any amendments to this Annual Report on Form 10-K, and to file the same, with exhibits thereto and other documents in connection therewith, with the Securities and Exchange Commission, hereby ratifying and confirming all that each of said attorneys-in-fact, or his substitute or substitutes, may do or cause to be done by virtue hereof.
Pursuant to the requirements of the Securities Exchange Act of 1934, this report has been signed below by the following persons on behalf of the registrant and in the capacities indicated and on
March 11, 2020
.
Dated:
March 11, 2020
|
/s/ Christopher W. Claus
|
/s/ Dr. Terry S. Maness
|
|
|
Christopher W. Claus, Director
|
Dr. Terry S. Maness, Director
|
|
|
|
|
|
|
/s/ Jerry D. Davis Jr.
|
/s/ Gerald W. Shields
|
|
|
Jerry D. Davis, Jr., Chairman of the Board and Director
|
Gerald W. Shields, Vice Chairman of the Board and Director
|
|
|
|
|
|
|
/s/ Dr. E. Dean Gage
|
/s/ Dr. Robert B. Sloan, Jr.
|
|
|
Dr. E. Dean Gage, Director
|
Dr. Robert B. Sloan, Jr., Director
|
|
|
|
|
|
|
/s/ Francis A. Keating II
|
|
/s/ Constance K. Weaver
|
|
Francis A. Keating II, Director
|
|
Constance K. Weaver, Director
|
|
|
|
|
|
/s/ Geoffrey M. Kolander
|
|
|
|
Geoffrey M. Kolander, President, Chief Executive Officer and Director
|
|
|
December 31, 2019 | 10-K
114
TABLE OF CONTENTS
Part IItem 1. BusinessItem 1A. Risk FactorsNote 7. Commitment and ContingenciesItem 1B. Unresolved Staff CommentsItem 2. PropertiesItem 3. Legal ProceedingsItem 4. Mine Safety DisclosuresPart IIItem 5. Market For Registrant's Common Equity, Related Stockholder Matters and Issuer Purchases Of Equity SecuritiesItem 6. Selected Financial DataItem 7. Management's Discussion and Analysis Of Financial Condition and Results Of OperationsItem 7A. Quantitative and Qualitative Disclosures About Market RiskItem 8. Financial Statements and Supplementary DataItem 9. Changes in and Disagreements with Accountants on Accounting and Financial DisclosureItem 9A. Controls and ProceduresItem 9B. Other InformationPart IIIItem 10. Directors, Executive Officers and Corporate GovernanceItem 11. Executive CompensationItem 12. Security Ownership Of Certain Beneficial Owners and Management and Related Stockholder MattersItem 13. Certain Relationships and Related Transactions, and Director IndependenceItem 14. Principal Accounting Fees and ServicesPart IVItem 15. Exhibits, Financial Statement Schedules