CITIZENS, INC.
10-Ks and 10-Qs
|
|
|
|
|
|
|
|
|
|
|
|
|
|
|
|
|
|
|
|
|
|
|
|
|
|
|
|
|
|
|
|
|
|
|
|
|
|
|
|
|
|
|
|
|
|
|
|
|
|
|
|
|
|
|
|
|
|
|
UNITED STATES
SECURITIES AND EXCHANGE COMMISSION
WASHINGTON, D.C. 20549
FORM 10-Q
x
QUARTERLY REPORT PURSUANT TO SECTION 13 OR 15(d) OF THE SECURITIES EXCHANGE ACT OF 1934
For the Quarterly Period Ended
June 30, 2019
OR
o
TRANSITION REPORT PURSUANT TO SECTION 13 OR 15(d) OF THE SECURITIES EXCHANGE ACT OF 1934
For the Transition Period from to
COMMISSION FILE NUMBER: 000-16509

|
CITIZENS, INC.
|
|
(Exact name of registrant as specified in its charter)
|
|
Colorado
|
84-0755371
|
|
(State or other jurisdiction of incorporation or organization)
|
(I.R.S. Employer Identification No.)
|
|
|
|
|
2900 Esperanza Crossing, 2nd Floor
|
|
|
Austin, Texas
|
78758
|
|
(Address of principal executive offices)
|
(Zip Code)
|
|
(512) 837-7100
|
N/A
|
|
(Registrant's telephone number, including area code:)
|
(Former name, former address and former fiscal year,
if changed since last report:)
|
|
Securities registered pursuant to Section 12(b) of the Act
|
||
|
Class A Common Stock
|
CIA
|
New York Stock Exchange
|
|
(Title of Each Class)
|
(Trading Symbol(s))
|
(Name of Each Exchange on Which Registered)
|
|
Indicate by check mark whether the registrant: (1) has filed all reports required to be filed by Section 13 or 15(d) of the Securities Exchange Act of 1934 during the preceding 12 months (or for such shorter period that the registrant was required to file such reports), and (2) has been subject to such filing requirements for the past 90 days.
x
Yes
o
No
|
|||||
|
Indicate by check mark whether the registrant has submitted electronically every Interactive Data File required to be submitted pursuant to Rule 405 of Regulation S-T (§232.405 of this chapter) during the preceding 12 months (or for such shorter period that the registrant was required to submit such files).
x
Yes
o
No
|
|||||
|
Indicate by check mark whether the registrant is a large accelerated filer, an accelerated filer, a non-accelerated filer, a smaller reporting company or an emerging growth company. See the definitions of "large accelerated filer," "accelerated filer," "smaller reporting company" and "emerging growth company" in Rule 12b-2 of the Exchange Act:
|
|||||
|
Large accelerated
filer
o
|
Accelerated
filer
x
|
Non-accelerated
filer
o
|
Smaller reporting
company
o
|
Emerging growth
company
o
|
|
|
If an emerging growth company, indicate by check mark if the registrant has elected not to use the extended transition period for complying with any new or revised financial accounting standards provided pursuant to Section 13(a) of the Exchange Act.
o
|
|||||
|
Indicate by check mark whether the registrant is a shell company (as defined in Rule 12b-2 of the Exchange Act).
o
Yes
x
No
|
|||||
As of
August 2, 2019
, the Registrant had
52,364,993
shares of Class A common stock, no par value, outstanding and
1,001,714
shares of Class B common stock, no par value, outstanding.
THIS PAGE INTENTIONALLY LEFT BLANK
TABLE OF CONTENTS
|
Page Number
|
|||
|
Part I. FINANCIAL INFORMATION
|
|||
|
|
Item 1.
|
|
|
|
|
|
|
|
|
|
|
||
|
|
|
|
|
|
|
|
||
|
|
|
|
|
|
|
|
||
|
|
|
|
|
|
|
|
||
|
|
|
|
|
|
|
Item 2.
|
||
|
|
|
|
|
|
|
Item 3.
|
||
|
|
|
|
|
|
|
Item 4.
|
||
|
|
|
|
|
|
Part II. OTHER INFORMATION
|
|
||
|
|
|
|
|
|
|
Item 1.
|
||
|
|
|
|
|
|
Item 1A.
|
|||
|
|
Item 2.
|
||
|
|
|
|
|
|
|
Item 3.
|
||
|
|
|
|
|
|
|
Item 4.
|
||
|
|
|
|
|
|
|
Item 5.
|
||
|
|
|
|
|
|
|
Item 6.
|
||
June 30, 2019 Form 10-Q
1
PART I. FINANCIAL INFORMATION
Item 1.
FINANCIAL STATEMENTS
|
CITIZENS, INC. AND CONSOLIDATED SUBSIDIARIES
Consolidated Statements of Financial Position
|
||||||
|
(In thousands)
|
June 30, 2019
|
December 31, 2018
|
||||
|
Assets
|
(Unaudited)
|
|||||
|
Investments:
|
|
|
||||
|
Fixed maturities available-for-sale, at fair value (cost: $1,274,085 and $1,223,747 in 2019 and 2018, respectively)
|
$
|
1,341,339
|
|
1,231,039
|
|
|
|
Equity securities, at fair value
|
15,827
|
|
15,068
|
|
||
|
Mortgage loans on real estate
|
182
|
|
186
|
|
||
|
Policy loans
|
81,545
|
|
80,825
|
|
||
|
Real estate held for investment (less $1,284 accumulated depreciation in 2018)
|
—
|
|
5,718
|
|
||
|
Real estate held-for-sale (less $1,325 and $4,411 accumulated depreciation in 2019 and 2018, respectively)
|
2,571
|
|
1,483
|
|
||
|
Other long-term investments
|
22
|
|
22
|
|
||
|
Short-term investments
|
2,455
|
|
7,865
|
|
||
|
Total investments
|
1,443,941
|
|
1,342,206
|
|
||
|
Cash and cash equivalents
|
34,568
|
|
45,492
|
|
||
|
Accrued investment income
|
18,920
|
|
18,467
|
|
||
|
Reinsurance recoverable
|
3,456
|
|
3,664
|
|
||
|
Deferred policy acquisition costs
|
152,313
|
|
155,747
|
|
||
|
Cost of customer relationships acquired
|
14,169
|
|
15,225
|
|
||
|
Goodwill
|
12,624
|
|
12,624
|
|
||
|
Other intangible assets
|
954
|
|
956
|
|
||
|
Property and equipment, net
|
7,147
|
|
5,943
|
|
||
|
Due premiums, net (less $1,607 and $1,990 allowance for doubtful accounts in 2019 and 2018, respectively)
|
10,557
|
|
13,325
|
|
||
|
Prepaid expenses
|
1,472
|
|
284
|
|
||
|
Other assets
|
2,039
|
|
1,628
|
|
||
|
Total assets
|
$
|
1,702,160
|
|
1,615,561
|
|
|
See accompanying Notes to Consolidated Financial Statements.
June 30, 2019 Form 10-Q
2
|
CITIZENS, INC. AND CONSOLIDATED SUBSIDIARIES
Consolidated Statements of Financial Position, Continued
|
||||||
|
(In thousands, except share amounts)
|
June 30, 2019
|
December 31, 2018
|
||||
|
Liabilities and Stockholders' Equity
|
(Unaudited)
|
|||||
|
Liabilities:
|
|
|
||||
|
Policy liabilities:
|
|
|
||||
|
Future policy benefit reserves:
|
|
|
||||
|
Life insurance
|
$
|
1,200,277
|
|
1,179,946
|
|
|
|
Annuities
|
76,302
|
|
76,377
|
|
||
|
Accident and health
|
970
|
|
944
|
|
||
|
Dividend accumulations
|
27,668
|
|
26,250
|
|
||
|
Premiums paid in advance
|
43,795
|
|
48,553
|
|
||
|
Policy claims payable
|
7,747
|
|
7,614
|
|
||
|
Other policyholders' funds
|
15,655
|
|
10,760
|
|
||
|
Total policy liabilities
|
1,372,414
|
|
1,350,444
|
|
||
|
Commissions payable
|
2,191
|
|
1,901
|
|
||
|
Current federal income tax payable
|
48,426
|
|
41,281
|
|
||
|
Deferred federal income tax payable
|
9,803
|
|
5,709
|
|
||
|
Payable for securities in process of settlement
|
4,975
|
|
—
|
|
||
|
Other liabilities
|
27,919
|
|
28,493
|
|
||
|
Total liabilities
|
1,465,728
|
|
1,427,828
|
|
||
|
Commitments and contingencies (
Note 7
)
|
|
|
|
|
||
|
Stockholders' equity:
|
|
|
|
|
||
|
Class A, no par value, 100,000,000 shares authorized, 52,364,993 and 52,215,852 shares issued and outstanding in 2019 and 2018, respectively, including shares in treasury of 3,135,738 in 2019 and 2018
|
261,003
|
|
259,793
|
|
||
|
Class B, no par value, 2,000,000 shares authorized, 1,001,714 shares issued and outstanding in 2019 and 2018
|
3,184
|
|
3,184
|
|
||
|
Accumulated deficit
|
(77,966
|
)
|
(69,599
|
)
|
||
|
Accumulated other comprehensive income:
|
|
|
|
|
||
|
Net unrealized gains on securities, net of tax
|
61,222
|
|
5,366
|
|
||
|
Treasury stock, at cost
|
(11,011
|
)
|
(11,011
|
)
|
||
|
Total stockholders' equity
|
236,432
|
|
187,733
|
|
||
|
Total liabilities and stockholders' equity
|
$
|
1,702,160
|
|
1,615,561
|
|
|
See accompanying Notes to Consolidated Financial Statements.
June 30, 2019 Form 10-Q
3
|
CITIZENS, INC. AND CONSOLIDATED SUBSIDIARIES
Consolidated Statements of Comprehensive Income
(Unaudited)
|
||||||
|
Three Months Ended June 30,
(In thousands, except per share data) |
2019
|
2018
|
||||
|
Revenues:
|
|
|||||
|
Premiums:
|
|
|
||||
|
Life insurance
|
$
|
42,313
|
|
44,631
|
|
|
|
Accident and health insurance
|
345
|
|
301
|
|
||
|
Property insurance
|
1,146
|
|
1,198
|
|
||
|
Net investment income
|
15,315
|
|
13,811
|
|
||
|
Realized investment losses, net
|
(2,869
|
)
|
(178
|
)
|
||
|
Other income
|
616
|
|
79
|
|
||
|
Total revenues
|
56,866
|
|
59,842
|
|
||
|
Benefits and Expenses:
|
|
|
|
|
||
|
Insurance benefits paid or provided:
|
|
|
|
|
||
|
Claims and surrenders
|
27,024
|
|
20,617
|
|
||
|
Increase in future policy benefit reserves
|
9,472
|
|
16,555
|
|
||
|
Policyholders' dividends
|
1,423
|
|
1,614
|
|
||
|
Total insurance benefits paid or provided
|
37,919
|
|
38,786
|
|
||
|
Commissions
|
8,384
|
|
8,669
|
|
||
|
Other general expenses
|
11,949
|
|
14,466
|
|
||
|
Capitalization of deferred policy acquisition costs
|
(5,412
|
)
|
(5,640
|
)
|
||
|
Amortization of deferred policy acquisition costs
|
6,931
|
|
7,200
|
|
||
|
Amortization of cost of customer relationships acquired
|
418
|
|
472
|
|
||
|
Total benefits and expenses
|
60,189
|
|
63,953
|
|
||
|
Income before federal income tax
|
(3,323
|
)
|
(4,111
|
)
|
||
|
Federal income tax expense (benefit)
|
1,242
|
|
(1,553
|
)
|
||
|
Net loss
|
(4,565
|
)
|
(2,558
|
)
|
||
|
Per Share Amounts:
|
|
|
|
|
||
|
Basic and diluted losses per share of Class A common stock
|
(0.09
|
)
|
(0.05
|
)
|
||
|
Basic and diluted losses per share of Class B common stock
|
(0.04
|
)
|
(0.03
|
)
|
||
|
Other Comprehensive Income (Loss):
|
|
|
|
|
||
|
Unrealized gains (losses) on available-for-sale debt securities:
|
|
|
|
|
||
|
Unrealized holding gains (losses) arising during period
|
31,220
|
|
(12,329
|
)
|
||
|
Reclassification adjustment for losses (gains) included in net income
|
(81
|
)
|
87
|
|
||
|
Unrealized gains (losses) on available-for-sale debt securities, net
|
31,139
|
|
(12,242
|
)
|
||
|
Income tax expense (benefit) on unrealized gains (losses) on available-for-sale debt securities
|
2,163
|
|
(2,571
|
)
|
||
|
Other comprehensive income (loss)
|
28,976
|
|
(9,671
|
)
|
||
|
Total comprehensive income (loss)
|
$
|
24,411
|
|
(12,229
|
)
|
|
See accompanying Notes to Consolidated Financial Statements.
June 30, 2019 Form 10-Q
4
|
CITIZENS, INC. AND CONSOLIDATED SUBSIDIARIES
Consolidated Statements of Comprehensive Income
(Unaudited)
|
||||||
|
Six Months Ended June 30,
(In thousands, except per share data) |
2019
|
2018
|
||||
|
Revenues:
|
|
|||||
|
Premiums:
|
|
|
||||
|
Life insurance
|
$
|
83,293
|
|
87,160
|
|
|
|
Accident and health insurance
|
668
|
|
592
|
|
||
|
Property insurance
|
2,307
|
|
2,407
|
|
||
|
Net investment income
|
29,111
|
|
27,582
|
|
||
|
Realized investment gains (losses), net
|
3,092
|
|
(753
|
)
|
||
|
Other income
|
801
|
|
287
|
|
||
|
Total revenues
|
119,272
|
|
117,275
|
|
||
|
Benefits and Expenses:
|
|
|
|
|
||
|
Insurance benefits paid or provided:
|
|
|
|
|
||
|
Claims and surrenders
|
50,057
|
|
41,768
|
|
||
|
Increase in future policy benefit reserves
|
21,771
|
|
31,163
|
|
||
|
Policyholders' dividends
|
2,605
|
|
2,921
|
|
||
|
Total insurance benefits paid or provided
|
74,433
|
|
75,852
|
|
||
|
Commissions
|
16,268
|
|
17,628
|
|
||
|
Other general expenses
|
26,081
|
|
20,973
|
|
||
|
Capitalization of deferred policy acquisition costs
|
(10,240
|
)
|
(11,603
|
)
|
||
|
Amortization of deferred policy acquisition costs
|
13,208
|
|
14,806
|
|
||
|
Amortization of cost of customer relationships acquired
|
837
|
|
1,151
|
|
||
|
Total benefits and expenses
|
120,587
|
|
118,807
|
|
||
|
Income before federal income tax
|
(1,315
|
)
|
(1,532
|
)
|
||
|
Federal income tax expense
|
7,052
|
|
989
|
|
||
|
Net loss
|
(8,367
|
)
|
(2,521
|
)
|
||
|
Per Share Amounts:
|
|
|
|
|
||
|
Basic and diluted losses per share of Class A common stock
|
(0.17
|
)
|
(0.05
|
)
|
||
|
Basic and diluted losses per share of Class B common stock
|
(0.08
|
)
|
(0.03
|
)
|
||
|
Other Comprehensive Income (Loss):
|
|
|
|
|
||
|
Unrealized gains (losses) on available-for-sale debt securities:
|
|
|
|
|
||
|
Unrealized holding gains (losses) arising during period
|
60,021
|
|
(30,427
|
)
|
||
|
Reclassification adjustment for losses included in net income
|
23
|
|
346
|
|
||
|
Unrealized gains (losses) on available-for-sale debt securities, net
|
60,044
|
|
(30,081
|
)
|
||
|
Income tax expense (benefit) on unrealized gains (losses) on available-for-sale debt securities
|
4,188
|
|
(6,306
|
)
|
||
|
Other comprehensive income (loss)
|
55,856
|
|
(23,775
|
)
|
||
|
Total comprehensive income (loss)
|
$
|
47,489
|
|
(26,296
|
)
|
|
See accompanying Notes to Consolidated Financial Statements.
June 30, 2019 Form 10-Q
5
|
CITIZENS, INC. AND CONSOLIDATED SUBSIDIARIES
|
||||||||||||||||||
|
Consolidated Statements of Stockholders' Equity
|
||||||||||||||||||
|
(Unaudited)
|
||||||||||||||||||
|
|
Common Stock
|
Accumulated
deficit |
Accumulated other comprehensive income (loss)
|
Treasury
stock |
Total
Stock-holders' equity |
|||||||||||||
|
(In thousands)
|
Class A
|
Class B
|
||||||||||||||||
|
Balance at December 31, 2018
|
$
|
259,793
|
|
3,184
|
|
(69,599
|
)
|
5,366
|
|
(11,011
|
)
|
187,733
|
|
|||||
|
Comprehensive income:
|
||||||||||||||||||
|
Net loss
|
—
|
|
—
|
|
(3,802
|
)
|
—
|
|
—
|
|
(3,802
|
)
|
||||||
|
Unrealized investment gains, net
|
—
|
|
—
|
|
—
|
|
26,880
|
|
—
|
|
26,880
|
|
||||||
|
Total comprehensive income
|
—
|
|
—
|
|
(3,802
|
)
|
26,880
|
|
—
|
|
23,078
|
|
||||||
|
Stock-based compensation
|
1,083
|
|
—
|
|
—
|
|
—
|
|
—
|
|
1,083
|
|
||||||
|
Balance at March 31, 2019
|
260,876
|
|
3,184
|
|
(73,401
|
)
|
32,246
|
|
(11,011
|
)
|
211,894
|
|
||||||
|
Comprehensive income:
|
|
|
|
|
|
|
|
|
|
|
|
|
||||||
|
Net loss
|
—
|
|
—
|
|
(4,565
|
)
|
—
|
|
—
|
|
(4,565
|
)
|
||||||
|
Unrealized investment gains, net
|
—
|
|
—
|
|
—
|
|
28,976
|
|
—
|
|
28,976
|
|
||||||
|
Total comprehensive income
|
—
|
|
—
|
|
(4,565
|
)
|
28,976
|
|
—
|
|
24,411
|
|
||||||
|
Stock-based compensation
|
127
|
|
—
|
|
—
|
|
—
|
|
—
|
|
127
|
|
||||||
|
Balance at June 30, 2019
|
$
|
261,003
|
|
3,184
|
|
(77,966
|
)
|
61,222
|
|
(11,011
|
)
|
236,432
|
|
|||||
|
Balance at December 31, 2017
|
$
|
259,383
|
|
3,184
|
|
(54,375
|
)
|
26,332
|
|
(11,011
|
)
|
223,513
|
|
|||||
|
Accounting standards adopted January 1, 2018
|
—
|
|
—
|
|
(4,162
|
)
|
4,162
|
|
—
|
|
—
|
|
||||||
|
Balance at January 1, 2018
|
259,383
|
|
3,184
|
|
(58,537
|
)
|
30,494
|
|
(11,011
|
)
|
223,513
|
|
||||||
|
Comprehensive loss:
|
||||||||||||||||||
|
Net income
|
—
|
|
—
|
|
37
|
|
—
|
|
—
|
|
37
|
|
||||||
|
Unrealized investment losses, net
|
—
|
|
—
|
|
—
|
|
(14,104
|
)
|
—
|
|
(14,104
|
)
|
||||||
|
Total comprehensive loss
|
—
|
|
—
|
|
37
|
|
(14,104
|
)
|
—
|
|
(14,067
|
)
|
||||||
|
Balance at March 31, 2018
|
259,383
|
|
3,184
|
|
(58,500
|
)
|
|
16,390
|
|
(11,011
|
)
|
209,446
|
|
|||||
|
Comprehensive loss:
|
|
|
|
|
|
|
|
|
|
|
|
|
||||||
|
Net loss
|
—
|
|
—
|
|
(2,558
|
)
|
—
|
|
—
|
|
(2,558
|
)
|
||||||
|
Unrealized investment losses, net
|
—
|
|
—
|
|
—
|
|
(9,671
|
)
|
—
|
|
(9,671
|
)
|
||||||
|
Total comprehensive loss
|
—
|
|
—
|
|
(2,558
|
)
|
(9,671
|
)
|
—
|
|
(12,229
|
)
|
||||||
|
Stock-based compensation
|
213
|
|
—
|
|
—
|
|
—
|
|
—
|
|
213
|
|
||||||
|
Balance at June 30, 2018
|
$
|
259,596
|
|
3,184
|
|
(61,058
|
)
|
6,719
|
|
(11,011
|
)
|
197,430
|
|
|||||
See accompanying Notes to Consolidated Financial Statements.
June 30, 2019 Form 10-Q
6
|
CITIZENS, INC. AND CONSOLIDATED SUBSIDIARIES
Consolidated Statements of Cash Flows
(Unaudited)
|
||||||
|
Six Months Ended June 30,
(In thousands) |
2019
|
2018
|
||||
|
Cash flows from operating activities:
|
|
|||||
|
Net income (loss)
|
$
|
(8,367
|
)
|
(2,521
|
)
|
|
|
Adjustments to reconcile net income (loss) to net cash provided by operating activities:
|
|
|
|
|
||
|
Realized (gains) losses on sale of investments and other assets
|
(3,092
|
)
|
753
|
|
||
|
Net deferred policy acquisition costs
|
2,968
|
|
3,203
|
|
||
|
Amortization of cost of customer relationships acquired
|
837
|
|
1,151
|
|
||
|
Depreciation
|
848
|
|
708
|
|
||
|
Amortization of premiums and discounts on investments
|
7,288
|
|
8,332
|
|
||
|
Stock-based compensation
|
1,587
|
|
213
|
|
||
|
Deferred federal income tax benefit
|
(94
|
)
|
(2,869
|
)
|
||
|
Change in:
|
|
|
|
|
||
|
Accrued investment income
|
(453
|
)
|
(179
|
)
|
||
|
Reinsurance recoverable
|
208
|
|
(256
|
)
|
||
|
Due premiums
|
2,768
|
|
974
|
|
||
|
Future policy benefit reserves
|
21,629
|
|
31,665
|
|
||
|
Other policyholders' liabilities
|
1,688
|
|
4,420
|
|
||
|
Federal income tax payable
|
7,146
|
|
3,858
|
|
||
|
Commissions payable and other liabilities
|
(284
|
)
|
(6,062
|
)
|
||
|
Other, net
|
(3,271
|
)
|
(1,404
|
)
|
||
|
Net cash provided by operating activities
|
31,406
|
|
41,986
|
|
||
|
Cash flows from investing activities:
|
|
|
|
|
||
|
Purchase of fixed maturities, available-for-sale
|
(111,729
|
)
|
(76,003
|
)
|
||
|
Sale of fixed maturities, available-for-sale
|
10,414
|
|
—
|
|
||
|
Maturities and calls of fixed maturities, available-for-sale
|
48,568
|
|
37,646
|
|
||
|
Maturities and calls of fixed maturities, held-to-maturity
|
—
|
|
17,549
|
|
||
|
Purchase of equity securities
|
—
|
|
(9
|
)
|
||
|
Principal payments on mortgage loans
|
4
|
|
5
|
|
||
|
Increase in policy loans, net
|
(721
|
)
|
(3,842
|
)
|
||
|
Sale of other long-term investments and real estate
|
6,996
|
|
1
|
|
||
|
Purchase of property and equipment
|
(388
|
)
|
(211
|
)
|
||
|
Maturity of short-term investments
|
7,940
|
|
—
|
|
||
|
Purchase of short-term investments
|
(2,455
|
)
|
—
|
|
||
|
Net cash used in investing activities
|
(41,371
|
)
|
(24,864
|
)
|
||
|
See accompanying Notes to Consolidated Financial Statements.
|
||||||
June 30, 2019 Form 10-Q
7
|
CITIZENS, INC. AND CONSOLIDATED SUBSIDIARIES
Consolidated Statements of Cash Flows, Continued
(Unaudited)
|
||||||
|
Six Months Ended June 30,
(In thousands) |
2019
|
2018
|
||||
|
Cash flows from financing activities:
|
|
|
|
|
||
|
Annuity deposits
|
$
|
3,053
|
|
3,605
|
|
|
|
Annuity withdrawals
|
(3,635
|
)
|
(3,458
|
)
|
||
|
Other
|
(377
|
)
|
—
|
|
||
|
Net cash provided by (used in) financing activities
|
(959
|
)
|
147
|
|
||
|
Net increase (decrease) in cash and cash equivalents
|
(10,924
|
)
|
17,269
|
|
||
|
Cash and cash equivalents at beginning of year
|
45,492
|
|
46,064
|
|
||
|
Cash and cash equivalents at end of period
|
$
|
34,568
|
|
63,333
|
|
|
SUPPLEMENTAL DISCLOSURES OF NONCASH INVESTING AND FINANCING ACTIVITIES:
During the
six
months ended
June 30, 2019
and
2018
, various fixed maturity issuers exchanged securities with book values of
$11.9 million
and
$2.5 million
, respectively, for securities of equal value.
The Company had net unsettled security trades of
$5.0 million
at
June 30, 2019
and
$0
at
June 30, 2018
.
See accompanying Notes to Consolidated Financial Statements.
June 30, 2019 Form 10-Q
8
(1)
FINANCIAL STATEMENTS
BASIS OF PRESENTATION AND CONSOLIDATION
The consolidated financial statements include the accounts and operations of Citizens, Inc. ("Citizens"), a Colorado corporation, and its wholly-owned subsidiaries, CICA Life Insurance Company of America ("CICA"), CICA Life Ltd. ("CICA Ltd."), Citizens National Life Insurance Company ("CNLIC"), Security Plan Life Insurance Company ("SPLIC"), Security Plan Fire Insurance Company ("SPFIC"), Magnolia Guaranty Life Insurance Company ("MGLIC") and Computing Technology, Inc. ("CTI"). All significant inter-company accounts and interactions have been eliminated. Citizens and its wholly-owned subsidiaries are collectively referred to as the "Company", "we", "us" or "our".
The consolidated statements of financial position as of
June 30, 2019
, the consolidated statements of comprehensive income and stockholders' equity for the
three and six
months ended
June 30, 2019
and
June 30, 2018
and the consolidated statements of cash flows for the
six
months ended
June 30, 2019
and
June 30, 2018
have been prepared by the Company without audit. In the opinion of management, all normal and recurring adjustments to present fairly the financial position, results of operations, and changes in cash flows at
June 30, 2019
and for comparative periods have been made. The consolidated financial statements have been prepared in accordance with United States Generally Accepted Accounting Principles ("U.S. GAAP") for interim financial information and with the instructions to Form 10-Q adopted by the Securities and Exchange Commission ("SEC"). Accordingly, the consolidated financial statements do not include all the information and footnotes required for complete financial statements and should be read in conjunction with the Company’s consolidated financial statements and notes thereto included in our Annual Report on
Form 10-K
for the year ended
December 31, 2018
. Operating results for the interim periods disclosed herein are not necessarily indicative of the results that may be expected for a full year or any future period.
We provide primarily life insurance and a small amount of health insurance policies through our insurance subsidiaries - CICA, CICA Ltd., SPLIC, MGLIC and CNLIC. CICA Ltd. primarily issues endowment and ordinary whole-life policies to non-U.S. residents. SPLIC offers final expense and home service life insurance in Louisiana, Arkansas and Mississippi, and SPFIC, a wholly-owned subsidiary of SPLIC, writes a limited amount of property insurance in Louisiana. MGLIC provides industrial life policies through independent funeral homes in Mississippi.
CTI provides data processing systems and services to the Company.
USE OF ESTIMATES
The preparation of consolidated financial statements in conformity with U.S. GAAP requires management to make estimates and assumptions that affect the reported amounts of assets and liabilities and the disclosure of contingent assets and liabilities at the date of the consolidated financial statements and the reported amounts of revenues and expenses during the reporting period. Actual results could differ from those estimates.
Significant estimates include those used in the evaluation of other-than-temporary impairments on debt and equity securities, actuarially determined assets and liabilities and assumptions, tests of goodwill impairment, valuation allowance on deferred tax assets, valuation of uncertain tax positions and contingencies relating to litigation and regulatory matters. Certain of these estimates are particularly sensitive to market conditions, and deterioration and/or volatility in the worldwide debt or equity markets could have a material impact on the consolidated financial statements.
SIGNIFICANT ACCOUNTING POLICIES
For a description of significant accounting policies, see Note 1. Summary of Significant Accounting Policies in the notes to our consolidated financial statements included in our Annual Report on
Form 10-K
for the year ended
December 31, 2018
, which should be read in conjunction with these accompanying consolidated financial statements.
June 30, 2019 Form 10-Q
9
(2)
ACCOUNTING PRONOUNCEMENTS
ACCOUNTING STANDARDS RECENTLY ADOPTED
In February 2016, the Financial Accounting Standards Board ("FASB") issued Accounting Standards Update ("ASU") 2016-02,
Leases (Topic 842)
. The ASU requires organizations that lease assets, referred to as "lessees," to recognize on the consolidated statement of financial position the rights and obligations created by those leases. The ASU also requires disclosures to help investors and other financial statement users better understand the amount, timing, and uncertainty of cash flows arising from leases. These disclosures include qualitative and quantitative requirements, providing additional information about the amounts recorded in the consolidated financial statements. The ASU on leases became effective for public companies for fiscal years, and interim periods within those fiscal years, beginning after December 15, 2018.
The Company has several lease agreements, such as district office locations related to our Home Service Insurance segment. The Company adopted this standard effective January 1, 2019 and recognizes these lease agreements on the consolidated statements of financial position as a right-of-use asset and a corresponding lease liability. See
Note 9. Leases
for further discussion.
In March 2017, the FASB issued ASU No. 2017-08,
Receivables-Nonrefundable Fees and Other Costs (Subtopic 310-20).
The amendments in this ASU shorten the amortization period for certain callable debt securities held at a premium. Specifically, the amendments require the premium to be amortized to the earliest call date. The amendments do not require an accounting change for securities held at a discount; the discount continues to be amortized to maturity. The Company has a large portfolio of callable debt securities purchased at a premium. As such, the Company had already been amortizing the premium to the earliest call date (yield to worst), thus this guidance did not have a material impact on our consolidated financial statements. For public business entities, the amendments in this ASU are effective for fiscal years, and interim periods within those fiscal years, beginning after December 15, 2018.
In June 2018, the FASB issued ASU No. 2018-07,
Compensation - Stock Compensation (Topic 718), Improvements to Nonemployee Share-Based Payment Accounting.
This ASU is intended to simplify aspects of share-based compensation issued to non-employees by making the guidance consistent with the accounting for employee share-based compensation. This ASU is effective for annual periods beginning after December 15, 2018 and interim periods within those annual periods, with early adoption permitted. We adopted the provisions of this ASU in the first quarter of 2019. This guidance did not have a material impact on our consolidated financial statements.
ACCOUNTING STANDARDS NOT YET ADOPTED
In June 2016, the FASB issued ASU No. 2016-13,
Financial Instruments-Credit Losses (Topic 326)
, with the main objective to provide financial statement users with more decision-useful information about the expected credit losses on financial instruments and other commitments to extend credit held by a reporting entity at each reporting date. The ASU requires a financial asset (or a group of financial assets) measured at amortized cost basis to be presented at the net amount expected to be collected. The allowance for credit losses is a valuation account that is deducted from the amortized cost basis of the financial asset(s) to present the net carrying value at the amount expected to be collected on the financial asset. The income statement reflects the measurement of credit losses for newly recognized financial assets, as well as the expected increases or decreases of expected credit losses that have taken place during the period. Credit losses on available-for-sale debt securities should be measured in a manner similar to current U.S. GAAP; however, the credit losses are recorded through an allowance for credit losses rather than as a write-down. This approach is an improvement to current U.S. GAAP because an entity will be able to record reversals of credit losses (in situations in which the estimate of credit losses declines) in current period net income, which in turn should align the income statement recognition of credit losses with the reporting period in which changes occur. Current U.S. GAAP prohibits reflecting those improvements in current-period earnings. For public business entities, the amendments in this ASU will be effective for fiscal years beginning after December 15, 2019, including interim periods within those fiscal years. The Company is evaluating the impact this guidance will have on our consolidated financial statements. This guidance could have a material impact on the Company's consolidated financial statements.
June 30, 2019 Form 10-Q
10
In August 2018, the FASB issued ASU No. 2018-12,
Financial Services-Insurance (Topic 944): Targeted Improvements to the Accounting for Long-Duration Contracts.
This ASU amends four key areas of the accounting and impacts disclosures for long-duration insurance and investment contracts:
|
•
|
Requires updated assumptions for liability measurement.
Assumptions used to measure the liability for traditional insurance contracts, which are typically determined at contract inception, will now be reviewed at least annually, and, if there is a change, updated, with the effect recorded in net income;
|
|
•
|
Standardizes the liability discount rate.
The liability discount rate will be a market-observable discount rate (upper-medium grade fixed-income instrument yield), with the effect of rate changes recorded in other comprehensive income;
|
|
•
|
Provides greater consistency in measurement of market risk benefits.
The two previous measurement models have been reduced to one measurement model (fair value), resulting in greater uniformity across similar market-based benefits and better alignment with the fair value measurement of derivatives used to hedge capital market risk;
|
|
•
|
Simplifies amortization of deferred acquisition costs.
Previous earnings-based amortization methods have been replaced with a more level amortization basis; and
|
|
•
|
Requires enhanced disclosures.
The new disclosures include rollforwards and information about significant assumptions and the effects of changes in those assumptions.
|
For calendar-year public companies, the changes will be effective on January 1, 2021. In July 2019, the FASB tentatively agreed to defer the original effective date by one year. If finalized, the new guidance will be effective for annual and interim reporting periods beginning January 1, 2022. The Company is evaluating the impact this guidance will have on our consolidated financial statements. This new guidance is expected to have a material impact on our consolidated financial statements.
In August 2018, the FASB issued ASU No. 2018-13,
Disclosure Framework - Changes to the Disclosure Requirements for Fair Value Measurement
. This ASU eliminates, adds and modifies certain disclosure requirements for fair value measurements. Among the changes, entities will no longer be required to disclose the amount of and reasons for transfers between Level 1 and Level 2 of the fair value hierarchy, but will be required to disclose the range and weighted average used to develop significant unobservable inputs for Level 3 fair value measurements. This ASU will be effective for interim and annual reporting periods beginning after December 15, 2019; however, early adoption is permitted. Entities are also allowed to elect early adoption of the eliminated or modified disclosure requirements and delay adoption of the new disclosure requirements until their effective date. As this ASU only revises disclosure requirements, it is not expected to have a material impact on the Company’s consolidated financial statements.
In September 2018, the FASB issued ASU No. 2018-15,
Customer’s Accounting for Implementation Costs Incurred in a Cloud Computing Arrangement That Is a Service Contract
. This ASU requires an entity in a cloud computing arrangement (i.e., hosting arrangement) that is a service contract to follow the internal-use software guidance in ASC 350-40 to determine which implementation costs to capitalize as assets or expense as incurred. Capitalized implementation costs should be presented in the same line item on the balance sheet as amounts prepaid for the hosted service, if any (generally as an "other asset"). The capitalized costs will be amortized over the term of the hosting arrangement, with the amortization expense being presented in the same income statement line item as the fees paid for the hosted service. This ASU will be effective for interim and annual reporting periods beginning after December 15, 2019; early adoption is permitted. We are evaluating the impact of this guidance on our limited cloud computing arrangements and our consolidated financial statements.
No other new accounting pronouncement issued or effective during the year had, or is expected to have, a material impact on our consolidated financial statements.
(3)
SEGMENT INFORMATION
The Company has
two
reportable segments: Life Insurance and Home Service Insurance. The Life Insurance and
June 30, 2019 Form 10-Q
11
Home Service Insurance portions of the Company constitute separate businesses. CICA, CICA Ltd. and CNLIC constitute the Life Insurance segment, and SPLIC, SPFIC and MGLIC constitute the Home Service Insurance segment. In addition to the Life Insurance and Home Service Insurance business, the Company also operates other non-insurance ("Other Non-Insurance Enterprises") portions of the Company, which primarily include the Company's IT and Corporate-support functions, and are included in the tables presented below to properly reconcile the segment information with the consolidated financial statements of the Company.
The accounting policies of the segments and Other Non-Insurance Enterprises are presented in accordance with U.S. GAAP and are the same as those used in the preparation of the consolidated financial statements. The Company evaluates profit and loss performance based on U.S. GAAP income before federal income taxes for its
two
reportable segments.
The Company's Other Non-Insurance Enterprises are the only reportable difference between segments and consolidated operations.
|
Life Insurance
|
Home Service
|
Non-Insurance Enterprises
|
Consolidated
|
|||||||||
|
Three Months Ended June 30, 2019
|
||||||||||||
|
(In thousands)
|
||||||||||||
|
Revenues:
|
|
|
|
|
||||||||
|
Premiums
|
$
|
32,140
|
|
11,664
|
|
—
|
|
43,804
|
|
|||
|
Net investment income
|
11,612
|
|
3,325
|
|
378
|
|
15,315
|
|
||||
|
Realized investment gains (losses), net
|
68
|
|
152
|
|
(3,089
|
)
|
(2,869
|
)
|
||||
|
Other income
|
614
|
|
1
|
|
1
|
|
616
|
|
||||
|
Total revenue
|
44,434
|
|
15,142
|
|
(2,710
|
)
|
56,866
|
|
||||
|
Benefits and expenses:
|
|
|
|
|
|
|
||||||
|
Insurance benefits paid or provided:
|
|
|
|
|
|
|
|
|
||||
|
Claims and surrenders
|
21,316
|
|
5,708
|
|
—
|
|
27,024
|
|
||||
|
Increase in future policy benefit reserves
|
8,519
|
|
953
|
|
—
|
|
9,472
|
|
||||
|
Policyholders' dividends
|
1,413
|
|
10
|
|
—
|
|
1,423
|
|
||||
|
Total insurance benefits paid or provided
|
31,248
|
|
6,671
|
|
—
|
|
37,919
|
|
||||
|
Commissions
|
4,676
|
|
3,708
|
|
—
|
|
8,384
|
|
||||
|
Other general expenses
|
6,458
|
|
5,332
|
|
159
|
|
11,949
|
|
||||
|
Capitalization of deferred policy acquisition costs
|
(4,020
|
)
|
(1,392
|
)
|
—
|
|
(5,412
|
)
|
||||
|
Amortization of deferred policy acquisition costs
|
6,053
|
|
878
|
|
—
|
|
6,931
|
|
||||
|
Amortization of cost of customer relationships acquired
|
138
|
|
280
|
|
—
|
|
418
|
|
||||
|
Total benefits and expenses
|
44,553
|
|
15,477
|
|
159
|
|
60,189
|
|
||||
|
Loss before income tax expense
|
$
|
(119
|
)
|
(335
|
)
|
(2,869
|
)
|
(3,323
|
)
|
|||
June 30, 2019 Form 10-Q
12
|
Life Insurance
|
Home Service
|
Non-Insurance Enterprises
|
Consolidated
|
|||||||||
|
Six Months Ended June 30, 2019
|
||||||||||||
|
(In thousands)
|
||||||||||||
|
|
||||||||||||
|
Revenues:
|
|
|
|
|
||||||||
|
Premiums
|
$
|
63,054
|
|
23,214
|
|
—
|
|
86,268
|
|
|||
|
Net investment income
|
21,781
|
|
6,411
|
|
919
|
|
29,111
|
|
||||
|
Realized investment gains (losses), net
|
5,525
|
|
636
|
|
(3,069
|
)
|
3,092
|
|
||||
|
Other income
|
797
|
|
2
|
|
2
|
|
801
|
|
||||
|
Total revenue
|
91,157
|
|
30,263
|
|
(2,148
|
)
|
119,272
|
|
||||
|
Benefits and expenses:
|
|
|
|
|
|
|
||||||
|
Insurance benefits paid or provided:
|
|
|
|
|
|
|
|
|
||||
|
Claims and surrenders
|
38,478
|
|
11,579
|
|
—
|
|
50,057
|
|
||||
|
Increase in future policy benefit reserves
|
19,832
|
|
1,939
|
|
—
|
|
21,771
|
|
||||
|
Policyholders' dividends
|
2,585
|
|
20
|
|
—
|
|
2,605
|
|
||||
|
Total insurance benefits paid or provided
|
60,895
|
|
13,538
|
|
—
|
|
74,433
|
|
||||
|
Commissions
|
9,049
|
|
7,219
|
|
—
|
|
16,268
|
|
||||
|
Other general expenses
|
12,663
|
|
10,402
|
|
3,016
|
|
26,081
|
|
||||
|
Capitalization of deferred policy acquisition costs
|
(7,722
|
)
|
(2,518
|
)
|
—
|
|
(10,240
|
)
|
||||
|
Amortization of deferred policy acquisition costs
|
11,494
|
|
1,714
|
|
—
|
|
13,208
|
|
||||
|
Amortization of cost of customer relationships acquired
|
260
|
|
577
|
|
—
|
|
837
|
|
||||
|
Total benefits and expenses
|
86,639
|
|
30,932
|
|
3,016
|
|
120,587
|
|
||||
|
Income (loss) before federal income tax expense
|
$
|
4,518
|
|
(669
|
)
|
(5,164
|
)
|
(1,315
|
)
|
|||
June 30, 2019 Form 10-Q
13
|
Life Insurance
|
Home Service
|
Non-Insurance Enterprises
|
Consolidated
|
|||||||||
|
Three Months Ended June 30, 2018
|
||||||||||||
|
(In thousands)
|
||||||||||||
|
|
||||||||||||
|
Revenues:
|
|
|
|
|
||||||||
|
Premiums
|
$
|
34,393
|
|
11,737
|
|
—
|
|
46,130
|
|
|||
|
Net investment income
|
10,139
|
|
3,316
|
|
356
|
|
13,811
|
|
||||
|
Realized investment losses, net
|
(24
|
)
|
(151
|
)
|
(3
|
)
|
(178
|
)
|
||||
|
Other income
|
79
|
|
—
|
|
—
|
|
79
|
|
||||
|
Total revenue
|
44,587
|
|
14,902
|
|
353
|
|
59,842
|
|
||||
|
Benefits and expenses:
|
|
|
|
|
|
|
|
|
||||
|
Insurance benefits paid or provided:
|
|
|
|
|
|
|
|
|
||||
|
Claims and surrenders
|
15,019
|
|
5,598
|
|
—
|
|
20,617
|
|
||||
|
Increase in future policy benefit reserves
|
15,383
|
|
1,172
|
|
—
|
|
16,555
|
|
||||
|
Policyholders' dividends
|
1,605
|
|
9
|
|
—
|
|
1,614
|
|
||||
|
Total insurance benefits paid or provided
|
32,007
|
|
6,779
|
|
—
|
|
38,786
|
|
||||
|
Commissions
|
4,777
|
|
3,892
|
|
—
|
|
8,669
|
|
||||
|
Other general expenses
|
6,908
|
|
5,392
|
|
2,166
|
|
14,466
|
|
||||
|
Capitalization of deferred policy acquisition costs
|
(4,150
|
)
|
(1,490
|
)
|
—
|
|
(5,640
|
)
|
||||
|
Amortization of deferred policy acquisition costs
|
6,240
|
|
960
|
|
—
|
|
7,200
|
|
||||
|
Amortization of cost of customer relationships acquired
|
132
|
|
340
|
|
—
|
|
472
|
|
||||
|
Total benefits and expenses
|
45,914
|
|
15,873
|
|
2,166
|
|
63,953
|
|
||||
|
Loss before income tax expense
|
$
|
(1,327
|
)
|
(971
|
)
|
(1,813
|
)
|
(4,111
|
)
|
|||
June 30, 2019 Form 10-Q
14
|
Life Insurance
|
Home Service
|
Non-Insurance Enterprises
|
Consolidated
|
|||||||||
|
Six Months Ended June 30, 2018
|
||||||||||||
|
(In thousands)
|
||||||||||||
|
|
||||||||||||
|
Revenues:
|
|
|
|
|
||||||||
|
Premiums
|
$
|
66,753
|
|
23,406
|
|
—
|
|
90,159
|
|
|||
|
Net investment income
|
20,269
|
|
6,618
|
|
695
|
|
27,582
|
|
||||
|
Realized investment losses, net
|
(209
|
)
|
(503
|
)
|
(41
|
)
|
(753
|
)
|
||||
|
Other income (loss)
|
288
|
|
(1
|
)
|
—
|
|
287
|
|
||||
|
Total revenue
|
87,101
|
|
29,520
|
|
654
|
|
117,275
|
|
||||
|
Benefits and expenses:
|
|
|
|
|
|
|
|
|
||||
|
Insurance benefits paid or provided:
|
|
|
|
|
|
|
|
|
||||
|
Claims and surrenders
|
30,310
|
|
11,458
|
|
—
|
|
41,768
|
|
||||
|
Increase in future policy benefit reserves
|
28,965
|
|
2,198
|
|
—
|
|
31,163
|
|
||||
|
Policyholders' dividends
|
2,902
|
|
19
|
|
—
|
|
2,921
|
|
||||
|
Total insurance benefits paid or provided
|
62,177
|
|
13,675
|
|
—
|
|
75,852
|
|
||||
|
Commissions
|
10,005
|
|
7,623
|
|
—
|
|
17,628
|
|
||||
|
Other general expenses
(1)
|
6,024
|
|
10,936
|
|
4,013
|
|
20,973
|
|
||||
|
Capitalization of deferred policy acquisition costs
|
(8,790
|
)
|
(2,813
|
)
|
—
|
|
(11,603
|
)
|
||||
|
Amortization of deferred policy acquisition costs
|
12,780
|
|
2,026
|
|
—
|
|
14,806
|
|
||||
|
Amortization of cost of customer relationships acquired
|
284
|
|
867
|
|
—
|
|
1,151
|
|
||||
|
Total benefits and expenses
|
82,480
|
|
32,314
|
|
4,013
|
|
118,807
|
|
||||
|
Income (loss) before federal income tax expense
|
$
|
4,621
|
|
(2,794
|
)
|
(3,359
|
)
|
(1,532
|
)
|
|||
June 30, 2019 Form 10-Q
15
(4)
EARNINGS PER SHARE
The following tables set forth the computation of basic and diluted earnings per share.
|
Three Months Ended June 30,
|
2019
|
2018
|
||||
|
(In thousands, except per share amounts)
|
||||||
|
Basic and diluted earnings per share:
|
|
|
||||
|
Numerator:
|
|
|
||||
|
Net loss
|
$
|
(4,565
|
)
|
(2,558
|
)
|
|
|
Net loss allocated to Class A common stock
|
$
|
(4,519
|
)
|
(2,532
|
)
|
|
|
Net loss allocated to Class B common stock
|
(46
|
)
|
(26
|
)
|
||
|
Net loss
|
$
|
(4,565
|
)
|
(2,558
|
)
|
|
|
Denominator:
|
|
|
||||
|
Weighted average shares of Class A outstanding - basic
|
49,229
|
|
49,080
|
|
||
|
Weighted average shares of Class A outstanding - diluted
|
49,280
|
|
49,109
|
|
||
|
Weighted average shares of Class B outstanding - basic and diluted
|
1,002
|
|
1,002
|
|
||
|
Basic and diluted loss per share of Class A common stock
|
$
|
(0.09
|
)
|
(0.05
|
)
|
|
|
Basic and diluted loss per share of Class B common stock
|
(0.04
|
)
|
(0.03
|
)
|
||
|
Six Months Ended June 30,
|
2019
|
2018
|
||||
|
(In thousands, except per share amounts)
|
||||||
|
|
||||||
|
Basic and diluted earnings per share:
|
||||||
|
Numerator:
|
||||||
|
Net loss
|
$
|
(8,367
|
)
|
(2,521
|
)
|
|
|
Net loss allocated to Class A common stock
|
$
|
(8,283
|
)
|
(2,496
|
)
|
|
|
Net loss allocated to Class B common stock
|
(84
|
)
|
(25
|
)
|
||
|
Net loss
|
$
|
(8,367
|
)
|
(2,521
|
)
|
|
|
Denominator:
|
||||||
|
Weighted average shares of Class A outstanding - basic
|
49,229
|
|
49,080
|
|
||
|
Weighted average shares of Class A outstanding - diluted
|
49,280
|
|
49,109
|
|
||
|
Weighted average shares of Class B outstanding - basic and diluted
|
1,002
|
|
1,002
|
|
||
|
Basic and diluted loss per share of Class A common stock
|
$
|
(0.17
|
)
|
(0.05
|
)
|
|
|
Basic and diluted loss per share of Class B common stock
|
(0.08
|
)
|
(0.03
|
)
|
||
June 30, 2019 Form 10-Q
16
(5)
INVESTMENTS
The Company invests primarily in fixed maturity securities, which totaled
90.7%
of total cash, cash equivalents and investments at
June 30, 2019
. The Company's cash, cash equivalents and investments are listed below.
|
Carrying Value
(In thousands, except for %)
|
June 30, 2019
|
December 31, 2018
|
|||||||||||
|
Amount
|
%
|
Amount
|
%
|
||||||||||
|
Fixed maturity securities
|
$
|
1,341,339
|
|
90.7
|
%
|
$
|
1,231,039
|
|
88.7
|
%
|
|||
|
Equity securities
|
15,827
|
|
1.1
|
%
|
15,068
|
|
1.1
|
%
|
|||||
|
Mortgage loans
|
182
|
|
—
|
%
|
186
|
|
—
|
%
|
|||||
|
Policy loans
|
81,545
|
|
5.5
|
%
|
80,825
|
|
5.8
|
%
|
|||||
|
Real estate and other long-term investments
|
2,593
|
|
0.2
|
%
|
7,223
|
|
0.5
|
%
|
|||||
|
Short-term investments
|
2,455
|
|
0.2
|
%
|
7,865
|
|
0.6
|
%
|
|||||
|
Cash and cash equivalents
|
34,568
|
|
2.3
|
%
|
45,492
|
|
3.3
|
%
|
|||||
|
Total cash, cash equivalents and investments
|
$
|
1,478,509
|
|
100.0
|
%
|
$
|
1,387,698
|
|
100.0
|
%
|
|||
The following tables represent the cost or amortized cost, gross unrealized gains and losses and fair value of fixed maturities as of the dates indicated.
|
Cost or
Amortized
Cost
|
Gross
Unrealized
Gains
|
Gross
Unrealized
Losses
|
Fair
Value
|
|||||||||
|
June 30, 2019
|
||||||||||||
|
(In thousands)
|
||||||||||||
|
Fixed maturities:
|
|
|
|
|
||||||||
|
Available-for-sale:
|
|
|
|
|
||||||||
|
U.S. Treasury securities
|
$
|
9,749
|
|
1,733
|
|
—
|
|
11,482
|
|
|||
|
U.S. Government-sponsored enterprises
|
3,528
|
|
1,015
|
|
—
|
|
4,543
|
|
||||
|
States and political subdivisions
|
651,598
|
|
25,193
|
|
351
|
|
676,440
|
|
||||
|
Corporate
|
481,406
|
|
30,533
|
|
2,171
|
|
509,768
|
|
||||
|
Commercial mortgage-backed
|
1,109
|
|
2
|
|
—
|
|
1,111
|
|
||||
|
Residential mortgage-backed
|
116,364
|
|
11,280
|
|
2
|
|
127,642
|
|
||||
|
Asset-backed
|
10,229
|
|
5
|
|
1
|
|
10,233
|
|
||||
|
Foreign governments
|
102
|
|
18
|
|
—
|
|
120
|
|
||||
|
Total fixed maturities
|
$
|
1,274,085
|
|
69,779
|
|
2,525
|
|
1,341,339
|
|
|||
June 30, 2019 Form 10-Q
17
|
Cost or
Amortized
Cost
|
Gross
Unrealized
Gains
|
Gross
Unrealized
Losses
|
Fair
Value
|
|||||||||
|
December 31, 2018
|
||||||||||||
|
(In thousands)
|
||||||||||||
|
|
||||||||||||
|
Fixed maturities:
|
|
|
|
|
||||||||
|
Available-for-sale securities:
|
|
|
|
|
||||||||
|
U.S. Treasury securities
|
$
|
9,864
|
|
1,410
|
|
—
|
|
11,274
|
|
|||
|
U.S. Government-sponsored enterprises
|
3,540
|
|
740
|
|
—
|
|
4,280
|
|
||||
|
States and political subdivisions
|
713,991
|
|
7,614
|
|
1,490
|
|
720,115
|
|
||||
|
Corporate
|
384,817
|
|
6,725
|
|
9,746
|
|
381,796
|
|
||||
|
Commercial mortgage-backed
|
39,694
|
|
386
|
|
66
|
|
40,014
|
|
||||
|
Residential mortgage-backed
|
66,960
|
|
1,726
|
|
2
|
|
68,684
|
|
||||
|
Asset-backed
|
4,764
|
|
|
1
|
|
|
8
|
|
|
4,757
|
|
|
|
Foreign governments
|
117
|
|
2
|
|
—
|
|
119
|
|
||||
|
Total fixed maturities
|
$
|
1,223,747
|
|
18,604
|
|
11,312
|
|
1,231,039
|
|
|||
Most of the Company's equity securities are diversified stock and bond mutual funds.
|
Fair Value
(In thousands)
|
June 30, 2019
|
December 31, 2018
|
||||
|
Equity securities:
|
|
|||||
|
Stock mutual funds
|
$
|
3,142
|
|
2,906
|
|
|
|
Bond mutual funds
|
12,255
|
|
11,774
|
|
||
|
Common stock
|
120
|
|
94
|
|
||
|
Non-redeemable preferred stock
|
310
|
|
294
|
|
||
|
Total equity securities
|
$
|
15,827
|
|
15,068
|
|
|
VALUATION OF INVESTMENTS
Available-for-sale securities are reported in the consolidated financial statements at fair value. Equity securities are measured at fair value with the change in fair value recorded through net income. The Company recognized net realized gains of
$155,000
and
$757,000
on equity securities held for the
three and six
months ended
June 30, 2019
and losses of
$86,000
and
$388,000
for the same periods ended
June 30, 2018
, respectively. An impairment loss of
$3.1 million
was recorded during the
second
quarter of
2019
related to our Citizens Academy training facility property located near Austin, Texas. It was determined during the quarter that the property met the held-for-sale criteria. As a result, this investment was reclassified from real estate held for investment to real estate held-for-sale. This resulted in an impairment loss of
$3.1 million
as the carrying amount of the property was written down to the net realizable value. This investment is considered a Level 3 asset in the fair value hierarchy.
The Company monitors all debt securities on an on-going basis relative to changes in credit ratings, market prices, earnings trends and financial performance, in addition to specific region or industry reviews. The assessment of whether other-than-temporary impairments ("OTTI") have occurred is based on a case-by-case evaluation of underlying reasons for the decline in fair value. The Company determines OTTI by reviewing relevant evidence related to the specific security issuer as well as the Company's intent to sell the security, or if it is more likely than not that the Company would be required to sell a security before recovery of its amortized cost.
When an OTTI has occurred, the amount of the OTTI recognized in earnings depends on whether the Company intends to sell the security or more likely than not will be required to sell the security before recovery of its amortized cost
June 30, 2019 Form 10-Q
18
basis. If the Company intends to sell the security or it is more likely that the Company will be required to sell the security before recovery of its amortized cost basis, the OTTI is recognized in earnings equal to the entire difference between the investment's amortized cost and its fair value at the balance sheet date. If the Company does not intend to sell the security and it is more likely than not that the Company will not be required to sell the security before recovery of its amortized cost basis, the OTTI is separated into the following: (a) the amount representing the credit loss; and (b) the amount related to all other factors. The amount of the total OTTI related to the credit loss is recognized in earnings. The amount of the total OTTI related to other factors is recognized in other comprehensive income, net of applicable taxes. The previous amortized cost basis less the OTTI recognized in earnings becomes the new amortized cost basis of the investment. The new amortized cost basis is not adjusted for subsequent recoveries in fair value.
The Company evaluates whether a credit impairment exists for fixed maturity securities by considering primarily the following factors: (a) changes in the financial condition of the security's underlying collateral; (b) whether the issuer is current on contractually obligated interest and principal payments; (c) changes in the financial condition, credit rating and near-term prospects of the issuer; (d) the length of time to which the fair value has been less than the amortized cost of the security; and (e) the payment structure of the security. The Company's best estimate of expected future cash flows used to determine the credit loss amount is a quantitative and qualitative process. Quantitative review includes information received from third party sources such as financial statements, pricing and rating changes, liquidity and other statistical information. Qualitative factors include judgments related to business strategies, economic impacts on the issuer and overall judgment related to estimates and industry factors. The Company's best estimate of future cash flows involves assumptions including, but not limited to, various performance indicators, such as historical and projected default and recovery rates, credit ratings, and current delinquency rates. These assumptions require the use of significant management judgment and include the probability of issuer default and estimates regarding timing and amount of expected recoveries, which may include estimating the underlying collateral value. In addition, projections of expected future debt security cash flows may change based upon new information regarding the performance of the issuer.
No
fixed maturity investment impairments were recognized for the
three and six
months ended
June 30, 2019
or the three months ended
June 30,
2018
. OTTI of
$225,000
was recognized on
one
fixed maturity security issuer for the
six
months ended
June 30,
2018
.
The following tables present the fair values and gross unrealized losses of fixed maturity securities that have remained in a continuous unrealized loss position for the periods indicated.
|
June 30, 2019
|
Less than 12 months
|
Greater than 12 months
|
Total
|
||||||||||||||||
|
(In thousands, except for # of securities)
|
Fair
Value
|
Unrealized
Losses
|
# of
Securities
|
Fair
Value
|
Unrealized
Losses
|
# of
Securities |
Fair
Value
|
Unrealized
Losses
|
# of
Securities |
||||||||||
|
|
|||||||||||||||||||
|
Fixed maturities:
|
|
|
|
|
|
|
|
|
|
||||||||||
|
Available-for-sale securities:
|
|
|
|
|
|
|
|
|
|
||||||||||
|
States and political subdivisions
|
$
|
44,983
|
|
198
|
|
39
|
|
24,021
|
|
153
|
|
33
|
|
69,004
|
|
351
|
|
72
|
|
|
Corporate
|
57,128
|
|
1,868
|
|
39
|
|
10,304
|
|
303
|
|
12
|
|
67,432
|
|
2,171
|
|
51
|
|
|
|
Residential mortgage-backed
|
—
|
|
—
|
|
—
|
|
94
|
|
2
|
|
4
|
|
94
|
|
2
|
|
4
|
|
|
|
Asset-backed
|
1,345
|
|
1
|
|
2
|
|
—
|
|
—
|
|
—
|
|
1,345
|
|
1
|
|
2
|
|
|
|
Total fixed maturities
|
$
|
103,456
|
|
2,067
|
|
80
|
|
34,419
|
|
458
|
|
49
|
|
137,875
|
|
2,525
|
|
129
|
|
June 30, 2019 Form 10-Q
19
|
December 31, 2018
|
Less than 12 months
|
Greater than 12 months
|
Total
|
||||||||||||||||
|
(In thousands, except for # of securities)
|
Fair
Value
|
Unrealized
Losses
|
# of
Securities |
Fair
Value |
Unrealized
Losses |
# of
Securities |
Fair
Value |
Unrealized
Losses |
# of
Securities |
||||||||||
|
|
|||||||||||||||||||
|
Fixed maturities:
|
|
|
|
|
|
|
|
|
|
||||||||||
|
Available-for-sale securities:
|
|
|
|
|
|
|
|
|
|
||||||||||
|
States and political subdivisions
|
$
|
227,132
|
|
883
|
|
233
|
|
33,891
|
|
607
|
|
46
|
|
261,023
|
|
1,490
|
|
279
|
|
|
Corporate
|
230,030
|
|
8,770
|
|
191
|
|
9,936
|
|
976
|
|
8
|
|
239,966
|
|
9,746
|
|
199
|
|
|
|
Commercial mortgage-backed
|
14,992
|
|
66
|
|
11
|
|
—
|
|
—
|
|
—
|
|
14,992
|
|
66
|
|
11
|
|
|
|
Residential mortgage-backed
|
18
|
|
—
|
|
3
|
|
98
|
|
2
|
|
4
|
|
116
|
|
2
|
|
7
|
|
|
|
Asset-backed
|
3,747
|
|
8
|
|
4
|
|
—
|
|
—
|
|
—
|
|
3,747
|
|
8
|
|
4
|
|
|
|
Total fixed maturities
|
$
|
475,919
|
|
9,727
|
|
442
|
|
43,925
|
|
1,585
|
|
58
|
|
519,844
|
|
11,312
|
|
500
|
|
We have reviewed the securities in an unrealized loss position for the periods ended
June 30, 2019
and
December 31, 2018
and determined that
no
OTTI exists that have not been recognized based on our evaluation of the credit worthiness of the issuers and the fact that we do not intend to sell the investments nor is it likely that we will be required to sell the securities before recovery of their amortized cost bases which may be maturity. We continue to monitor all securities on an on-going basis and future information may become available which could result in other-than-temporary impairments being recorded.
The amortized cost and fair value of fixed maturity securities at
June 30, 2019
by contractual maturity are shown in the table below. Actual maturities may differ from contractual maturities because borrowers may have the right to call or prepay obligations with or without call or prepayment penalties. Securities not due at a single maturity date have been reflected based upon final stated maturity.
|
June 30, 2019
|
Amortized
Cost |
Fair
Value |
||||
|
(In thousands)
|
||||||
|
Fixed maturity securities:
|
|
|
||||
|
Due in one year or less
|
$
|
102,787
|
|
103,200
|
|
|
|
Due after one year through five years
|
131,248
|
|
136,348
|
|
||
|
Due after five years through ten years
|
214,674
|
|
226,791
|
|
||
|
Due after ten years
|
825,376
|
|
875,000
|
|
||
|
Total fixed maturity securities
|
$
|
1,274,085
|
|
1,341,339
|
|
|
June 30, 2019 Form 10-Q
20
The Company uses the specific identification method of the individual security to determine the cost basis used in the calculation of realized gains and losses related to security sales.
|
|
Fixed Maturities, Available-for-Sale
|
Equity Securities
|
||||||||||||||||||
|
|
Three Months Ended
|
Six Months Ended
|
Three Months Ended
|
Six Months Ended
|
||||||||||||||||
|
June 30,
|
June 30,
|
June 30,
|
June 30,
|
|||||||||||||||||
|
(In thousands)
|
2019
|
2018
|
2019
|
2018
|
2019
|
2018
|
2019
|
2018
|
||||||||||||
|
Proceeds
|
$
|
2,755
|
|
—
|
|
10,414
|
|
—
|
|
—
|
|
—
|
|
—
|
|
—
|
|
|||
|
Gross realized gains
|
$
|
107
|
|
—
|
|
109
|
|
—
|
|
—
|
|
—
|
|
—
|
|
—
|
|
|||
|
Gross realized losses
|
$
|
182
|
|
—
|
|
365
|
|
—
|
|
—
|
|
—
|
|
—
|
|
—
|
|
|||
There were sales of
ten
and
twenty
available-for-sale fixed maturity securities for the
three and six
months ended
June 30, 2019
, respectively.
No
available-for-sale fixed maturity securities were sold during the
three and six
months ended
June 30, 2018
.
No
equity securities were sold during the
three and six
months ended
June 30, 2019
and
2018
.
(6)
FAIR VALUE MEASUREMENTS
Fair value is the price that would be received to sell an asset or paid to transfer a liability in an orderly transaction between market participants at the measurement date. We hold available-for-sale fixed maturity securities, which are carried at fair value. We also report our equity securities at fair value with changes in fair value reported through the consolidated statements of comprehensive income.
Fair value measurements are generally based upon observable and unobservable inputs. Observable inputs reflect market data obtained from independent sources, while unobservable inputs reflect our view of market assumptions in the absence of observable market information. We utilize valuation techniques that maximize the use of observable inputs and minimize the use of unobservable inputs. All assets and liabilities carried at fair value are required to be classified and disclosed in one of the following three categories:
|
•
|
Level 1 - Quoted prices for identical instruments in active markets.
|
|
•
|
Level 2 - Quoted prices for similar instruments in active markets; quoted prices for identical or similar instruments in markets that are not active; and model-derived valuations whose inputs or whose significant value drivers are observable.
|
|
•
|
Level 3 - Instruments whose significant value drivers are unobservable.
|
Level 1 primarily consists of financial instruments whose value is based on quoted market prices such as U.S. Treasury securities and actively traded mutual fund and stock investments.
Level 2 includes those financial instruments that are valued by independent pricing services or broker quotes. These models are primarily industry-standard models that consider various inputs, such as interest rates, credit spreads and foreign exchange rates for the underlying financial instruments. All significant inputs are observable or derived from observable information in the marketplace or are supported by observable levels at which transactions are executed in the marketplace. Financial instruments in this category primarily include corporate securities, U.S. Government-sponsored enterprise securities, municipal securities and certain mortgage and asset-backed securities.
Level 3 is comprised of financial instruments whose fair value is estimated based on non-binding broker prices utilizing significant inputs not based on or corroborated by readily available market information. There were
no
securities in this category at
June 30, 2019
.
June 30, 2019 Form 10-Q
21
The following tables set forth our assets that are measured at fair value on a recurring basis as of the dates indicated.
|
June 30, 2019
|
Level 1
|
Level 2
|
Level 3
|
Total
Fair Value
|
||||||||
|
(In thousands)
|
||||||||||||
|
Financial Assets
|
||||||||||||
|
Fixed maturities available-for-sale
|
|
|
|
|
||||||||
|
U.S. Treasury and U.S. Government-sponsored enterprises
|
$
|
11,482
|
|
4,543
|
|
—
|
|
16,025
|
|
|||
|
States and political subdivisions
|
—
|
|
676,440
|
|
—
|
|
676,440
|
|
||||
|
Corporate
|
50
|
|
509,718
|
|
—
|
|
509,768
|
|
||||
|
Commercial mortgage-backed
|
—
|
|
1,111
|
|
—
|
|
1,111
|
|
||||
|
Residential mortgage-backed
|
—
|
|
127,642
|
|
—
|
|
127,642
|
|
||||
|
Asset-backed
|
—
|
|
10,233
|
|
—
|
|
10,233
|
|
||||
|
Foreign governments
|
—
|
|
120
|
|
—
|
|
120
|
|
||||
|
Total fixed maturities available-for-sale
|
11,532
|
|
1,329,807
|
|
—
|
|
1,341,339
|
|
||||
|
Equity securities
|
|
|
|
|
|
|
|
|
||||
|
Stock mutual funds
|
3,142
|
|
—
|
|
—
|
|
3,142
|
|
||||
|
Bond mutual funds
|
12,255
|
|
—
|
|
—
|
|
12,255
|
|
||||
|
Common stock
|
120
|
|
—
|
|
—
|
|
120
|
|
||||
|
Non-redeemable preferred stock
|
310
|
|
—
|
|
—
|
|
310
|
|
||||
|
Total equity securities
|
15,827
|
|
—
|
|
—
|
|
15,827
|
|
||||
|
Total financial assets
|
$
|
27,359
|
|
1,329,807
|
|
—
|
|
1,357,166
|
|
|||
June 30, 2019 Form 10-Q
22
|
December 31, 2018
|
Level 1
|
Level 2
|
Level 3
|
Total
Fair Value
|
||||||||
|
(In thousands)
|
||||||||||||
|
Financial Assets
|
||||||||||||
|
Fixed maturities available-for-sale
|
|
|
|
|
||||||||
|
U.S. Treasury and U.S. Government-sponsored enterprises
|
$
|
11,274
|
|
4,280
|
|
—
|
|
15,554
|
|
|||
|
States and political subdivisions
|
—
|
|
720,115
|
|
—
|
|
720,115
|
|
||||
|
Corporate
|
47
|
|
381,749
|
|
—
|
|
381,796
|
|
||||
|
Commercial mortgage-backed
|
—
|
|
40,014
|
|
—
|
|
40,014
|
|
||||
|
Residential mortgage-backed
|
—
|
|
68,684
|
|
—
|
|
68,684
|
|
||||
|
Asset-backed
|
—
|
|
4,757
|
|
—
|
|
4,757
|
|
||||
|
Foreign governments
|
—
|
|
119
|
|
—
|
|
119
|
|
||||
|
Total fixed maturities available-for-sale
|
11,321
|
|
1,219,718
|
|
—
|
|
1,231,039
|
|
||||
|
Equity securities
|
|
|
|
|
|
|
|
|
||||
|
Stock mutual funds
|
2,906
|
|
—
|
|
—
|
|
2,906
|
|
||||
|
Bond mutual funds
|
11,774
|
|
—
|
|
—
|
|
11,774
|
|
||||
|
Common stock
|
94
|
|
—
|
|
—
|
|
94
|
|
||||
|
Non-redeemable preferred stock
|
294
|
|
—
|
|
—
|
|
294
|
|
||||
|
Total equity securities
|
15,068
|
|
—
|
|
—
|
|
15,068
|
|
||||
|
Total financial assets
|
$
|
26,389
|
|
1,219,718
|
|
—
|
|
1,246,107
|
|
|||
FINANCIAL INSTRUMENTS VALUATION
FINANCIAL INSTRUMENTS CARRIED AT FAIR VALUE
Fixed maturity securities, available-for-sale.
At
June 30, 2019
, our fixed maturity securities, valued using a third-party pricing source, totaled
$1.3 billion
for Level 2 assets and comprised
98.0%
of total reported fair value of our financial assets. The Level 1 and Level 2 valuations are reviewed and updated quarterly through random testing by comparisons to separate pricing models, other third-party pricing services, and back tested to recent trades. In addition, we obtain information annually relative to the third-party pricing models and review model parameters for reasonableness. There were
no
Level 3 assets at
June 30, 2019
. For the
six
months ended
June 30, 2019
, there were
no
material changes to the valuation methods or assumptions used to determine fair values, and
no
broker or third-party prices were changed from the values received. There were
no
transfers between Levels 1 and 2 securities during the
six
months ended
June 30, 2019
.
Equity securities.
Our equity securities are classified as Level 1 assets as their fair values are based upon quoted market prices.
We review the fair value hierarchy classifications each reporting period. Changes in the observability of the valuation attributes may result in a reclassification of certain financial assets. Such reclassifications are reported as transfers in and out of Level 3 at the beginning fair value for the reporting period in which the changes occur. There were
no
transfers in or out of Level 3 during the
six
months ended
June 30, 2019
.
June 30, 2019 Form 10-Q
23
FINANCIAL INSTRUMENTS NOT CARRIED AT FAIR VALUE
Estimates of fair values are made at a specific point in time, based on relevant market prices and information about the financial instruments. The estimated fair values of financial instruments presented below are not necessarily indicative of the amounts the Company might realize in actual market transactions.
The carrying amount and fair value for the financial assets and liabilities on the consolidated balance sheets not otherwise disclosed for the periods indicated are as follows:
|
|
June 30, 2019
|
December 31, 2018
|
||||||||||
|
(In thousands)
|
Carrying Value
|
Fair Value
|
Carrying Value
|
Fair Value
|
||||||||
|
Financial Assets:
|
|
|
|
|
||||||||
|
Mortgage loans
|
$
|
182
|
|
220
|
|
186
|
|
222
|
|
|||
|
Policy loans
|
81,545
|
|
81,545
|
|
80,825
|
|
80,825
|
|
||||
|
Short-term investments
|
2,455
|
|
2,455
|
|
7,865
|
|
7,865
|
|
||||
|
Cash and cash equivalents
|
34,568
|
|
34,568
|
|
45,492
|
|
45,492
|
|
||||
|
Financial Liabilities:
|
|
|
|
|
|
|
|
|
||||
|
Annuity - investment contracts
|
57,069
|
|
60,339
|
|
56,658
|
|
55,977
|
|
||||
Mortgage loans.
Mortgage loans are secured principally by residential properties. Weighted average interest rates for these loans were approximately
6.6%
at
June 30, 2019
and
December 31, 2018
. At
June 30, 2019
, maturities ranged from
19
to
23
years. Management estimated the fair value using an annual interest rate of
6.25%
at
June 30, 2019
. Our mortgage loans are considered Level 3 assets in the fair value hierarchy.
Policy loans.
Policy loans had a weighted average annual interest rate of
7.7%
at
June 30, 2019
and
December 31, 2018
, and
no
specified maturity dates. The aggregate fair value of policy loans approximates the carrying value reflected on the consolidated balance sheets. These loans typically carry an interest rate that corresponds to the crediting rate applied to the related policy and contract reserves. Policy loans are an integral part of the life insurance policies we have inforce, cannot be valued separately and are not marketable. Therefore, the fair value of policy loans approximates the carrying value and policy loans are considered Level 3 assets in the fair value hierarchy.
Other.
The fair value of short-term investments and cash and cash equivalents approximate carrying value and are characterized as Level 1 assets in the fair value hierarchy.
Annuity liabilities.
The fair value of the Company's liabilities under annuity contract policies, which are considered Level 3 assets, was estimated at
June 30, 2019
using discounted cash flows based upon spot rates ranging from
2.06%
to
3.28%
adjusted for various risk adjustments. The fair value of liabilities under all insurance contracts are taken into consideration in the overall management of interest rate risk, which seeks to minimize exposure to changing interest rates through the matching of investment maturities with amounts due under insurance contracts.
(7)
COMMITMENTS AND CONTINGENCIES
QUALIFICATION OF LIFE PRODUCTS
We have previously reported that a portion of the life insurance policies issued by our subsidiary insurance companies failed to qualify for the favorable U.S. federal income tax treatment afforded by Section 7702 of the Internal Revenue Code ("IRC") of 1986. Further, we have determined that the structure of our policies sold to non-U.S. citizens, which were novated to CICA Ltd. effective July 1, 2018, may have inadvertently generated U.S. source income over time. Based upon a review of the options available to address these issues, we are in the process of remediating domestic
June 30, 2019 Form 10-Q
24
life and annuity policies to U.S. citizens to comply with the IRC. For the novated policies sold to non-U.S. citizens, we expect to settle any past liabilities with the Internal Revenue Service ("IRS"). The Company has continued to refine its estimate of the exposure and expenses related to these tax issues, as described below for the current reporting period. The products have been and continue to be appropriately reported as life insurance under U.S. GAAP for financial reporting.
These tax issues result in an estimated liability as of
June 30, 2019
of
$10.0 million
, after tax, related to projected IRS settlement amounts of
$9.1 million
and reserve increases totaling
$0.9 million
to bring policies into compliance. The probability weighted range of financial estimates relative to this issue is
$6.0 million
to
$52.5 million
, after tax. This estimated range includes projected taxes and interest and penalties payable to the IRS, as well as estimated increased payout obligations to current holders of non-compliant domestic life insurance policies expected to result from remediation of those policies. The estimated liability and the estimated range will be updated as we continue to refine our estimates.
The amount of our liabilities and expenses depends on a number of uncertainties, including the number of prior tax years for which we may be liable to the IRS and the methodology applicable to the calculation of the tax liabilities for policies. Given the range of potential outcomes and the significant variables assumed in establishing our estimates, actual amounts incurred may exceed our reserve and could exceed the high end of our estimated range of liabilities and expenses. To the extent the amount reserved by the Company is insufficient to meet the actual amount of our liabilities and expenses, or if our estimates of those liabilities and expenses change in the future, our financial condition and results of operations may be materially adversely affected. Management believes that based upon current information we have recorded the best estimate liability to date.
Accruals for loss contingencies are recorded when it is probable that a liability has been incurred and the amount can be reasonably estimated. The process of determining our best estimate and the estimated range was a complex undertaking including insight from external consultants and involved management’s judgment based upon a variety of factors known at the time. We expect to incur additional costs ranging from
$0.6 million
to
$0.9 million
related to performing this analysis, but due to the uncertainty of actions, we cannot reasonably estimate these costs with any reliability. Actual amounts incurred may exceed this estimate and will be recorded as they become probable and can be reasonably estimated.
On May 17, 2017, we submitted an offer to enter into Closing Agreements with the IRS covering certain CICA and CNLIC domestic life insurance policies (the "Closing Agreements"), which was accepted by the IRS on June 7, 2019. Pursuant to the Closing Agreements, CICA and CNLIC agreed to pay the IRS $123,779 and $4,118, respectively, by August 6, 2019, and follow the corrective steps for the policies outlined in the Closing Agreements by September 5, 2019. These payments were made to the IRS on July 12, 2019.
For certain life insurance policies that failed to satisfy the requirements of the cash value accumulation test of Section 7702 ("CVAT") of the IRC, we agreed to amend such policies retroactively to their original dates of issue by adding an endorsement (which provides that the death benefit of such policies will not be less than the amount of life insurance necessary to maintain CVAT compliance). For the life insurance
policies
that failed to satisfy the premium requirements of the guideline premium test of Section 7702 of the IRC, we agreed as needed to refund each policyholder the amount of premiums paid that exceeded the guideline premium limitation plus interest thereon. We expect to complete these corrective steps by September 5, 2019, the deadline set forth in the Closing Agreements.
LITIGATION AND REGULATORY ACTIONS
From time to time we are subject to legal and regulatory actions relating to our business. We may incur defense costs, including attorneys' fees, and other direct litigation costs associated with defending claims. If we suffer an adverse judgment as a result of litigation claims, it could have a material adverse effect on our business, results of operations and financial condition.
June 30, 2019 Form 10-Q
25
(8)
INCOME TAXES
Our provision for income taxes may not have the customary relationship of taxes to income. A reconciliation between the U.S. corporate income tax rate and the effective income tax rate is as follows:
|
Six Months Ended June 30,
|
2019
|
2018
|
|||||||||||
|
(In thousands, except for %)
|
Amount
|
%
|
Amount
|
%
|
|||||||||
|
Federal income tax expense:
|
|||||||||||||
|
Expected tax expense (benefit)
|
$
|
(276
|
)
|
21.0
|
%
|
$
|
(322
|
)
|
21.0
|
%
|
|||
|
Foreign income tax rate differential
|
(111
|
)
|
8.4
|
%
|
—
|
|
—
|
%
|
|||||
|
Annualized effective tax rate adjustment
|
3,264
|
|
(248.2
|
)%
|
974
|
|
(63.6
|
)%
|
|||||
|
Effect of uncertain tax position
|
2,416
|
|
(183.7
|
)%
|
1,664
|
|
(108.6
|
)%
|
|||||
|
Nondeductible costs to remediate tax compliance issue
|
—
|
|
—
|
%
|
(1,267
|
)
|
82.7
|
%
|
|||||
|
CICA Ltd. Subpart F income
|
1,595
|
|
(121.4
|
)%
|
—
|
|
—
|
%
|
|||||
|
Other
|
164
|
|
(12.4
|
)%
|
(60
|
)
|
3.9
|
%
|
|||||
|
Total federal income tax expense
|
$
|
7,052
|
|
(536.3
|
)%
|
$
|
989
|
|
(64.6
|
)%
|
|||
A reconciliation of federal income tax expense above is computed by applying the federal income tax rate of
21%
in 2019 and 2018 to income before federal income tax expense.
CICA Ltd., a wholly owned subsidiary of Citizens, is considered a controlled foreign corporation for federal tax purposes. As a result, the insurance activity of CICA Ltd. is subject to Subpart F of the IRC and is included in Citizens’ taxable income. As of June 30, 2019, the Subpart F income inclusion generated
$1.6 million
of federal income tax expense.
Income tax expense consists of:
|
Six Months Ended June 30,
|
2019
|
2018
|
||||
|
(In thousands)
|
||||||
|
Federal income tax expense:
|
||||||
|
Current
|
$
|
7,146
|
|
3,858
|
|
|
|
Deferred
|
(94
|
)
|
(2,869
|
)
|
||
|
Total federal income tax expense
|
$
|
7,052
|
|
989
|
|
|
June 30, 2019 Form 10-Q
26
The components of deferred federal income taxes are as follows:
|
Net Deferred Tax Asset (Liability)
(In thousands)
|
June 30, 2019
|
December 31, 2018
|
||||
|
Deferred tax assets:
|
|
|
||||
|
Future policy benefit reserves
|
$
|
2,634
|
|
2,795
|
|
|
|
Net operating and capital loss carryforwards
|
193
|
|
191
|
|
||
|
Accrued expenses
|
13
|
|
30
|
|
||
|
Investments
|
1,890
|
|
1,841
|
|
||
|
Deferred intercompany loss
|
4,896
|
|
5,190
|
|
||
|
Other
|
748
|
|
309
|
|
||
|
Total gross deferred tax assets
|
10,374
|
|
10,356
|
|
||
|
Deferred tax liabilities:
|
|
|
||||
|
Deferred policy acquisition costs, cost of customer relationships acquired and intangible assets
|
(8,703
|
)
|
(8,745
|
)
|
||
|
Unrealized gains on investments available-for-sale
|
(6,299
|
)
|
(1,968
|
)
|
||
|
Tax reserves transition liability
|
(4,517
|
)
|
(4,864
|
)
|
||
|
Other
|
(658
|
)
|
(488
|
)
|
||
|
Total gross deferred tax liabilities
|
(20,177
|
)
|
(16,065
|
)
|
||
|
Net deferred tax liability
|
$
|
(9,803
|
)
|
(5,709
|
)
|
|
(9)
LEASES
Effective January 1, 2019, the Company adopted the new lease accounting guidance in Accounting Standards Update No. 2016-02,
Leases (Topic 842)
("ASC No. 842"). We also elected the package of practical expedients, which among other things, does not require reassessment of lease classification. As a result of the adoption of the new lease accounting guidance, the Company recognized on January 1, 2019 a lease liability of
$1.8 million
discounted using an incremental borrowing rate of
4.76%
and a right-of-use asset of
$1.8 million
. There was
$1.7 million
of undiscounted lease liability remaining as of
June 30, 2019
. The Company uses its estimated incremental borrowing rate, which is derived from information available at lease commencement date, in determining present value of lease payments.
The Company leases home office space in Austin, Texas for Citizens and in Bermuda for CICA Ltd. as well as several district office locations related to our Home Service Insurance segment across Louisiana, Mississippi and Arkansas, which are classified as operating leases. Certain operating leases include renewal options that extend the lease term. The exercise of lease renewal options is at our sole discretion when it is reasonably certain
that we will exercise such option
. Leases with an initial term of 12 months or less are immaterial to the consolidated financial statements and are recognized as lease expense on a straight-line basis over the lease term and not recorded on the consolidated balance sheet.
The table below summarizes the number of weighted-average years remaining in our lease liabilities.
|
Lease Term
|
June 30, 2019
|
|
|
Weighted-average remaining lease term (years)
|
||
|
Operating leases
|
1.6
|
|
June 30, 2019 Form 10-Q
27
Maturities of our remaining lease liabilities as of
June 30, 2019
are as follows.
|
(In thousands)
|
Operating Lease Payments
(a)
|
|||
|
Maturity of Lease Liabilities
|
||||
|
2019
|
$
|
539
|
|
|
|
2020
|
975
|
|
||
|
2021
|
187
|
|
||
|
2022
|
32
|
|
||
|
2023
|
—
|
|
||
|
After 2023
|
—
|
|
||
|
Total lease payments
|
1,733
|
|
||
|
Interest expense
|
(64
|
)
|
||
|
Present value of lease liabilities
|
$
|
1,669
|
|
|
(a)
Operating lease payments exclude
$13.5 million
of legally binding minimum lease payments for leases signed but not yet commenced.
We recorded the lease right-of-use asset in Other Assets and the lease liability in Other Liabilities. Cash payments related to lease liabilities were
$0.6 million
and
$1.1 million
for the
three and six
months ended
June 30, 2019
, respectively, and were reported in operating cash flows.
In January 2019, the Company entered into a long-term lease agreement with an unrelated party for its new home office in Austin, Texas. The building in which we have leased office space is under construction and is expected to be completed in 2020.
The long-term lease will commence after construction of the building is complete and has a 121-month term, and therefore is not included in the tables above. Payments under the new long-term lease agreement will average approximately $112,340 per month. To bridge the gap between the expiration date of the current lease that expires in August 2019 and the lease commencement date of the new long-term lease, the Company entered into a lease with an unrelated party for a temporary transitional home office. The transitional lease will commence on August 15, 2019 and end on September 30, 2020. Payments under this lease will be $72,400 per month.
The Company does not engage in lease agreements among related parties.
(10)
RELATED PARTY TRANSACTIONS
The Company has various routine related party transactions in conjunction with our holding company structure, such as a management service agreement related to costs incurred, a tax sharing agreement between entities, and inter-company dividends and capital contributions. There were
no
other changes related to these relationships during the
six
months ended
June 30, 2019
. See our Annual Report on
Form 10-K
for the year ended
December 31, 2018
for a comprehensive discussion of related party transactions.
June 30, 2019 Form 10-Q
28
Item 2.
MANAGEMENT'S DISCUSSION AND ANALYSIS OF FINANCIAL CONDITION AND RESULTS OF OPERATIONS
FORWARD-LOOKING STATEMENTS
Certain statements contained in this report are not statements of historical fact and constitute forward-looking statements within the meaning of the federal securities laws, including, without limitation, statements specifically identified as forward-looking statements within this document. Many of these statements contain risk factors as well. In addition, certain statements in future filings by the Company with the Securities and Exchange Commission ("SEC"), in press releases, and in oral and written statements made by or with the approval of the Company, which are not statements of historical fact, constitute forward-looking statements. Examples of forward-looking statements include, but are not limited to: (i) projections of revenues, income or loss, earnings or loss per share, the payment or non-payment of dividends, capital structure, and other financial items, (ii) statements of our plans and objectives by our management or Board of Directors, including those relating to products or services, (iii) statements of future economic performance and (iv) statements of assumptions underlying such statements. Words such as "believes," "anticipates," "assumes," "estimates," "plans," "projects," "could," "expects," "intends," "targeted," "may," "will" and similar expressions are intended to identify forward-looking statements, but are not the exclusive means of identifying such statements.
Forward-looking statements are subject to known and unknown risks, uncertainties and other factors that may cause actual results to differ materially from those contemplated by the forward-looking statements. Factors that could cause the Company's future results to differ materially from expected results include, but are not limited to:
|
•
|
Changes in the application, interpretation or enforcement of foreign insurance laws that impact our business, which derives the substantial majority of its revenues from residents of foreign countries;
|
|
•
|
Potential changes in amounts reserved for in connection with intended proposals for settlement with the IRS related to tax withholding and product compliance matters for international policies issued by CICA Ltd.;
|
|
•
|
The transition of our international business to a new Bermuda-based entity, the regulatory oversight of our international business by the Bermuda Monetary Authority and potential shifts in policyholder behavior arising from these changes;
|
|
•
|
Changes in foreign and U.S. general economic, market, and political conditions, including the performance of financial markets and interest rates;
|
|
•
|
Changes in consumer behavior or regulatory oversight, which may affect our ability to sell our products and retain business;
|
|
•
|
The timely development of and acceptance of our new products and the perceived overall value of these products and services by existing and potential customers;
|
|
•
|
Fluctuations in experience regarding current mortality, morbidity, persistency and interest rates relative to expected amounts used in pricing our products;
|
|
•
|
The performance of our investment portfolio, which may be adversely affected by changes in interest rates, adverse developments and ratings of issuers whose debt securities we may hold, and other adverse macroeconomic events;
|
|
•
|
Results of litigation we may be involved in;
|
|
•
|
Changes in assumptions related to deferred acquisition costs and the value of any businesses we may acquire;
|
|
•
|
Regulatory, accounting or tax changes that may affect the cost of, or the demand for, our products or services;
|
|
•
|
Our concentration of business from persons residing in Latin America and the Pacific Rim;
|
|
•
|
Changes in tax laws;
|
|
•
|
Our ability to maintain effective information systems;
|
June 30, 2019 Form 10-Q
29
|
•
|
Changes in statutory or United States Generally Accepted Accounting Principles ("U.S. GAAP"), policies or practices;
|
|
•
|
Changes in leadership among our board and senior management team;
|
|
•
|
Our success at managing risks involved in the foregoing; and
|
|
•
|
The risk factors disclosed in
Part II, Item 1A.
of this Form 10-Q and our Quarterly Report on
Form 10-Q for the quarter ended March 31, 2019
, and in Part I. Item 1A. of our Annual Report on
Form 10-K
for the year ended December 31, 2018.
|
Such forward-looking statements speak only as of the date on which such statements are made, and the Company undertakes no obligation to update any forward-looking statement to reflect events or circumstances after the date on which such statement is made.
The SEC maintains a website that contains reports, proxy and information statements, and other information regarding issuers, including the Company, that file electronically with the SEC. The public can obtain any documents that the Company files with the SEC at http://www.sec.gov. We also make available, free of charge, through our Internet website (http://www.citizensinc.com), our Annual Report on Form 10-K, Quarterly Reports on Form 10-Q, Current Reports on Form 8-K, Section 16 Reports filed by officers and directors, news releases, and, if applicable, amendments to those reports filed or furnished pursuant to Section 13(a) or 15(d) of the Securities Exchange Act of 1934, as soon as reasonably practicable after we electronically file such reports with, or furnish such reports to, the Securities and Exchange Commission. We are not including any of the information contained on our website as part of, or incorporating it by reference into, this report.
OVERVIEW
Citizens, Inc. ("Citizens" or the "Company") is an insurance holding company incorporated in Colorado serving the life insurance needs of individuals in the U.S. since 1969 and internationally since 1975. Through our insurance subsidiaries, we pursue a strategy of offering traditional insurance products in niche markets where we believe we can achieve competitive advantages. As of
June 30, 2019
, we had approximately
$1.7 billion
of total assets and approximately $
4.8 billion
of insurance inforce. Our core insurance operations include issuing and servicing:
|
•
|
U.S. dollar-denominated ordinary whole life insurance and endowment policies predominantly to foreign residents, located principally in Latin America and the Pacific Rim through independent marketing consultants;
|
|
•
|
ordinary whole life insurance policies to middle income households concentrated in the Midwest, Mountain West and southern U.S. through independent marketing consultants; and
|
|
•
|
final expense and limited liability property policies to middle and lower income households in Louisiana, Arkansas and Mississippi through employee and independent agents in our home service distribution channel and funeral homes.
|
We were formed in 1969 and historically, our Company has experienced growth through acquisitions in the domestic market and organic market expansion in the international market. We strive to generate bottom line returns using knowledge of our niche markets and our well-established distribution channels.
STRATEGIC INITIATIVES
The Company remains committed to cultivating enduring value for its key stakeholders through the execution of a customer-centric growth strategy.
In 2017, the Company's executive management team, in cooperation with its Board of Directors, began a strategic realignment of its Life and Home Service Insurance segments. Specifically, we focused on (1) product enhancements and increasing our product profitability; (2) modernization of our IT operations with an emphasis on digitization, our future business needs and cyber risk; (3) effectively operating our international life insurance business in Bermuda through CICA Ltd.; and (4) assessing and optimizing our investment portfolio. To date, our strategic realignment within
June 30, 2019 Form 10-Q
30
the Company's Life Insurance segment is largely complete, and a leadership transition within the Company’s Home Service Insurance segment is underway.
Carrying that momentum forward, in 2019, we identified three areas of strategic focus for cultivating value:
|
1.
|
We are focused on building a foundation of operational excellence, as our high impact and values-based culture takes root.
|
|
2.
|
We are focused on growth initiatives within the markets in which we operate, as we set targets for growing premium revenues and implementing growth strategies.
|
|
3.
|
We are focused on new capabilities that will create business opportunities aligned with our essential purpose.
|
As we seek to optimize value for the Company, its customers and its collaborators, we believe our efforts will put the Company on a stronger financial footing and drive sustainable growth.
CURRENT FINANCIAL HIGHLIGHTS
Financial highlights for the
second
quarter and
six
months ended
June 30, 2019
compared to the same periods in
2018
were:
|
•
|
Insurance premiums declined
5.0%
for the
second
quarter of
2019
compared to the same period in
2018
, totaling
$43.8 million
and
$46.1 million
, respectively. The decline was driven by fewer renewal premiums in our Life Insurance segment. First year premiums in our Life Insurance segment, excluding Brazil, a country we exited in April 2018, increased slightly. For the six months ended June 30, 2019, insurance premiums declined
4.3%
, totaling
$86.3 million
, compared to
$90.2 million
for the same period in 2018. The decline was driven by fewer first year and renewal premiums in our Life Insurance segment.
|
|
•
|
Net investment income increased
10.9%
for the
second
quarter of
2019
compared to the same period of
2018
, totaling
$15.3 million
and
$13.8 million
, respectively. The increase was driven by a growing asset base derived from cash flows from our insurance operations, improvements in cash management, and a strategic focus on achieving greater yields while maintaining a prudent risk profile for our investment portfolio. Net investment income was lower during the second quarter of 2018 due to the need to maintain sufficient cash balances to fund our Bermuda novation that occurred in July 2018. As these funds were not available for investment, we experienced lower overall portfolio yields and net investment income. The average yield on the consolidated portfolio as of the
six
months ended
June 30, 2019
was an annualized rate of
4.30%
compared to
4.33%
for the same period in
2018
.
|
|
•
|
An impairment loss of
$3.1 million
was recorded during the
second
quarter of
2019
in our Other Non-Insurance enterprises related to our Citizens Academy training facility located near Austin, Texas. This investment was reclassified from real estate held for investment to held-for-sale. A realized gain of $5.5 million was recorded in the first quarter of 2019 related to the sale of our former corporate headquarters in Austin, Texas. We also recorded realized gains of
$757,000
during the first
six
months of
2019
related to fair value changes in our equity securities owned at
June 30, 2019
and realized losses of
$23,000
related to dispositions of securities from our fixed maturity securities portfolio during the same period. OTTI of $225,000 was recorded for the six months ended June 30, 2018 related to a single issuer and we recorded equity losses of $388,000 during the same period.
|
|
•
|
Claims and surrenders expense
increased
31.1%
for the
second
quarter of
2019
and
19.8%
for the
six
months ended
June 30, 2019
compared to the same periods in
2018
. The increase was driven primarily by an increase in surrender benefits and matured endowments in the Life Insurance segment, which were within expected levels.
|
|
•
|
General expenses
decreased
17.4%
for the
second
quarter of
2019
and
increased
24.4%
for the
six
months ended
June 30, 2019
compared to the same periods in
2018
. For both the
second
quarter and the
six
months ended in
June 30, 2019
, we had reduced audit and legal fees, partially offset by increased costs relating to higher executive compensation, compared to the same periods in
2018
. In addition, general expenses increased by $1.8 million for the second quarter of 2018 and reduced
|
June 30, 2019 Form 10-Q
31
by $5.4 million for the six months ended June 30, 2018 due to a change in our 7702/72(s) tax compliance best estimate liability from the estimate at year end 2017.
OUR OPERATING SEGMENTS
Our business is comprised of two operating business segments, as detailed below.
|
•
|
Life Insurance
|
|
•
|
Home Service Insurance
|
Our insurance operations are the primary focus of the Company, as those operations generate most of our income. See the discussion under
Segment Operations
below for detailed analysis. The amount of insurance, number of policies, and average face amounts of ordinary life policies issued during the periods indicated are shown below.
|
Six Months Ended June 30,
|
2019
|
2018
|
|||||||||||||||||||
|
|
Amount of
Insurance Issued |
Number of
Policies Issued |
Average Policy
Face Amount Issued |
Amount of
Insurance Issued |
Number of
Policies Issued |
Average Policy
Face Amount Issued |
|||||||||||||||
|
Life Insurance
|
$
|
100,095,500
|
|
1,481
|
|
$
|
67,586
|
|
$
|
113,258,180
|
|
1,934
|
|
$
|
58,562
|
|
|||||
|
Home Service Insurance
|
84,521,648
|
|
11,674
|
|
7,240
|
|
92,505,865
|
|
13,041
|
|
7,093
|
|
|||||||||
The number of policies issued decreased
23.4%
and
10.5%
for the Life and Home Service Insurance segments, respectively, for the
six
months ended
June 30, 2019
compared to the same period in
2018
. The decline in new business applications in our Life Insurance segment is driven by ceasing sales in Brazil and terminating agreements with several independent consultants in Latin America that did not align with our vision, values and culture. Excluding these two factors, the number of policies issued by our International business has been flat for the period. While the number of policies issued has declined in the Life and Home Service Insurance segments during 2019, the average face amount issued has increased, resulting in overall premium income not declining at the same rate as policy issuances.
June 30, 2019 Form 10-Q
32
CONSOLIDATED RESULTS OF OPERATIONS
A discussion of consolidated results is presented below, followed by a discussion of segment operations and financial results by segment.
REVENUES
Revenues are generated primarily by insurance premiums and investment income on invested assets.
|
|
Three Months Ended
|
Six Months Ended
|
||||||||||
|
June 30,
|
June 30,
|
|||||||||||
|
(In thousands)
|
2019
|
2018
|
2019
|
2018
|
||||||||
|
Revenues:
|
|
|
|
|
||||||||
|
Premiums:
|
|
|
|
|
||||||||
|
Life insurance
|
$
|
42,313
|
|
44,631
|
|
83,293
|
|
87,160
|
|
|||
|
Accident and health insurance
|
345
|
|
301
|
|
668
|
|
592
|
|
||||
|
Property insurance
|
1,146
|
|
1,198
|
|
2,307
|
|
2,407
|
|
||||
|
Net investment income
|
15,315
|
|
13,811
|
|
29,111
|
|
27,582
|
|
||||
|
Realized investment gains (losses), net
|
(2,869
|
)
|
(178
|
)
|
3,092
|
|
(753
|
)
|
||||
|
Other income
|
616
|
|
79
|
|
801
|
|
287
|
|
||||
|
Total revenues
|
$
|
56,866
|
|
59,842
|
|
119,272
|
|
117,275
|
|
|||
Premium Income.
Premium income derived from life, accident and health, and property insurance sales
decreased
5.0%
for the
second
quarter of
2019
and
4.3%
for
six
months ended
June 30, 2019
compared to the same periods in
2018
. The decrease is driven primarily by a decline in first year and renewal premiums in our Life Insurance segment. However, excluding sales from Brazil, a country we exited in April 2018, first year premiums increased slightly in the in the
second
quarter of
2019
compared to the same period in
2018
. See the detail distribution of premiums within
Segment Operations
discussed below.
Net Investment Income.
Net investment income performance is summarized as follows.
|
|
June 30,
|
December 31,
|
June 30,
|
||||||
|
(In thousands, except for %)
|
2019
|
2018
|
2018
|
||||||
|
|
|
||||||||
|
Net investment income, annualized
|
$
|
58,222
|
|
54,205
|
|
55,164
|
|
||
|
Average invested assets, at amortized cost
|
1,355,408
|
|
1,300,755
|
|
1,274,313
|
|
|||
|
Annualized yield on average invested assets
|
4.30
|
%
|
4.17
|
%
|
4.33
|
%
|
|||
The annualized yield slightly declined during the first
six
months of 2019 compared to the same period in 2018. We have traditionally invested in fixed maturity securities with a large percentage held in callable issues. In the fourth quarter of 2018, we began the process of repositioning our portfolio into more diversified holdings and maturities as part of our investment management strategy. We increased our purchases of AA rated mortgage backed securities while reducing our municipal holdings. While these securities generally have a higher rating than our municipal holdings, average yields are lower. In addition, as a substantial proportion of our fixed maturity investments continue to be called, we have faced challenges in finding investments with comparable yields in the continued low interest rate environment.
June 30, 2019 Form 10-Q
33
Investment income from debt securities accounted for approximately
87.6%
of total investment income for the
six
months ended
June 30, 2019
.
|
|
Three Months Ended
|
Six Months Ended
|
||||||||||
|
June 30,
|
June 30,
|
|||||||||||
|
(In thousands)
|
2019
|
2018
|
2019
|
2018
|
||||||||
|
|
||||||||||||
|
Gross investment income:
|
|
|
|
|
||||||||
|
Fixed maturity securities
|
$
|
13,747
|
|
12,557
|
|
26,261
|
|
24,981
|
|
|||
|
Equity securities
|
168
|
|
168
|
|
325
|
|
328
|
|
||||
|
Mortgage loans
|
3
|
|
3
|
|
6
|
|
6
|
|
||||
|
Policy loans
|
1,600
|
|
1,521
|
|
3,201
|
|
3,056
|
|
||||
|
Long-term investments
|
—
|
|
—
|
|
1
|
|
—
|
|
||||
|
Other investment income
|
159
|
|
60
|
|
183
|
|
90
|
|
||||
|
Total investment income
|
15,677
|
|
14,309
|
|
29,977
|
|
28,461
|
|
||||
|
Investment expenses
|
(362
|
)
|
(498
|
)
|
(866
|
)
|
(879
|
)
|
||||
|
Net investment income
|
$
|
15,315
|
|
13,811
|
|
29,111
|
|
27,582
|
|
|||
Fixed maturity securities income
increased
9.5%
for the
second
quarter of
2019
and
5.1%
for
six
months ended
June 30, 2019
, compared to the same periods in 2018. We continue to adjust our investment management strategy to increase our investment yields while maintaining a prudent risk profile. In addition, the
increase
in policy loans, which represents policyholders utilizing their accumulated policy cash value to pay for premiums, contributed to the
increase
in investment income.
Realized Investment Gains (Losses), Net.
An impairment loss of
$3.1 million
was recorded for the
second
quarter of
2019
in connection with classifying the Citizens Academy training facility near Austin, Texas as real estate held-for-sale. We also recorded a realized gain of $5.5 million in the first quarter of 2019 relating to the sale of our former corporate headquarters. We also recorded realized gains of $757,000 due to fair value changes related to equity securities still owned at June 30, 2019.
June 30, 2019 Form 10-Q
34
BENEFITS AND EXPENSES
|
|
Three Months Ended
|
Six Months Ended
|
||||||||||
|
June 30,
|
June 30,
|
|||||||||||
|
(In thousands)
|
2019
|
2018
|
2019
|
2018
|
||||||||
|
|
||||||||||||
|
Benefits and expenses:
|
|
|
|
|
||||||||
|
Insurance benefits paid or provided:
|
|
|
|
|
||||||||
|
Claims and surrenders
|
$
|
27,024
|
|
20,617
|
|
50,057
|
|
41,768
|
|
|||
|
Increase in future policy benefit reserves
|
9,472
|
|
16,555
|
|
21,771
|
|
31,163
|
|
||||
|
Policyholders' dividends
|
1,423
|
|
1,614
|
|
2,605
|
|
2,921
|
|
||||
|
Total insurance benefits paid or provided
|
37,919
|
|
38,786
|
|
74,433
|
|
75,852
|
|
||||
|
Commissions
|
8,384
|
|
8,669
|
|
16,268
|
|
17,628
|
|
||||
|
Other general expenses
|
11,949
|
|
14,466
|
|
26,081
|
|
20,973
|
|
||||
|
Capitalization of deferred policy acquisition costs
|
(5,412
|
)
|
(5,640
|
)
|
(10,240
|
)
|
(11,603
|
)
|
||||
|
Amortization of deferred policy acquisition costs
|
6,931
|
|
7,200
|
|
13,208
|
|
14,806
|
|
||||
|
Amortization of cost of customer relationships acquired
|
418
|
|
472
|
|
837
|
|
1,151
|
|
||||
|
Total benefits and expenses
|
$
|
60,189
|
|
63,953
|
|
120,587
|
|
118,807
|
|
|||
Claims and Surrenders.
A detail of claims and surrender benefits is provided below.
|
|
Three Months Ended
|
Six Months Ended
|
||||||||||
|
June 30,
|
June 30,
|
|||||||||||
|
(In thousands)
|
2019
|
2018
|
2019
|
2018
|
||||||||
|
|
||||||||||||
|
Claims and Surrenders:
|
||||||||||||
|
Death claims
|
$
|
5,943
|
|
5,528
|
|
12,430
|
|
11,711
|
|
|||
|
Surrender benefits
|
13,426
|
|
9,375
|
|
23,165
|
|
18,534
|
|
||||
|
Endowments
|
2,991
|
|
3,314
|
|
6,067
|
|
6,506
|
|
||||
|
Matured endowments
|
3,684
|
|
1,206
|
|
6,365
|
|
2,630
|
|
||||
|
Property claims
|
272
|
|
429
|
|
490
|
|
814
|
|
||||
|
Accident and health benefits
|
58
|
|
33
|
|
116
|
|
114
|
|
||||
|
Other policy benefits
|
650
|
|
732
|
|
1,424
|
|
1,459
|
|
||||
|
Total claims and surrenders
|
$
|
27,024
|
|
20,617
|
|
50,057
|
|
41,768
|
|
|||
|
•
|
Death claims
increased
7.5%
for the
second
quarter of
2019
and
6.1%
for the
six
months ended
June 30, 2019
compared to the same periods in
2018
. Mortality experience is closely monitored by the Company and the activity is within expected levels.
|
|
•
|
Surrenders
increased
43.2%
for the
second
quarter of
2019
and
25.0%
for the
six
months ended
June 30, 2019
compared to the same periods in
2018
. Surrenders represented
0.5%
of direct ordinary whole life insurance in force for the
six
months ended
June 30, 2019
. The increase in surrender expense is primarily related to our international business and were within expected levels. A significant portion of surrenders relate to policies that have been in force over fifteen years and no longer have associated surrender charges. Total direct insurance in force as of
June 30, 2019
was
$4.8 billion
, a slight decrease from
2018
.
|
|
•
|
Matured endowments increased
205.5%
for the
second
quarter of
2019
and
142.0%
for the
six
months ended
June 30, 2019
compared to the same periods in
2018
. We anticipated this increase based upon
|
June 30, 2019 Form 10-Q
35
the dates of when our policy endowment contracts were sold and their expected maturities as set forth in the contracts.
Increase in Future Policy Benefit Reserves.
The change in future policy benefit reserves
decreased
42.8%
for the
second
quarter of
2019
and
decreased
30.1%
for the
six
months ended
June 30, 2019
compared to the same periods in
2018
primarily due to increased surrenders and maturities from our international business.
Policyholders' Dividends.
Policyholders' dividends declined slightly for the
second
quarter and the
six
months ended
June 30, 2019
compared to the same periods in
2018
. This decrease was due to changes in persistency and production.
Commissions.
Commission expense for the
second
quarter and the
six
months ended
June 30, 2019
fluctuated directly in relation to the
decrease
in first year and renewal premiums compared to premium levels for the same periods in
2018
.
Other General Expenses.
Expenses declined
17.4%
in the
second
quarter of
2019
compared to the same period in
2018
due to a decrease in audit and legal fees and our 7702/72(s) tax compliance best estimate liability. We have continued to refine our estimated liability related to these matters. The decrease was offset by additional costs relating to higher executive compensation. Expenses for the six months ended June 30, 2019 increased
24.4%
compared to the same period in 2018 as expenses during the 2018 period were reduced by $5.4 million from the reduction in our 7702/72(s) liability estimate. We also had additional costs related to salaries, bonuses and other compensation paid to executive officers, partially offset by lower Audit and legal fees, during the six months ended June 30, 2019 compared to the same period in 2018.
Capitalization and Amortization of Deferred Policy Acquisition Costs.
Costs capitalized include certain commissions, policy issuance costs, and underwriting and agency expenses that relate to successful sales efforts for insurance contracts. Capitalized costs
decreased
during the
second
quarter and the
six
months ended
June 30, 2019
compared to the same periods in
2018
as we experienced a decline in first year premium production in these periods. Commissions paid on renewal premiums are significantly lower than those paid on first year business. The decline in production also resulted in lower amortization during the
second
quarter and
six
months ended
June 30, 2019
compared to the same periods in 2018. Amortization of deferred policy acquisition costs is also impacted by persistency and may fluctuate from quarter to quarter.
Federal Income Tax.
Tax expense increased as our effective tax rate was
(536.3)%
for the
six
months ended
June 30, 2019
as compared to
(64.6)%
for the same period in
2018
. For the six months ended June 30, 2019, the Company's tax rate was impacted by differences between our effective tax rate and the statutory tax rate resulting from income and expense items that are treated differently for financial reporting and tax purposes as well as impacts from our uncertain tax position. In addition, CICA Ltd., a wholly owned subsidiary of Citizens, is considered a controlled foreign corporation for federal tax purposes and CICA Ltd.'s activity gives rise to taxable income in the U.S. as Subpart F Income. As of
June 30, 2019
, the Subpart F income inclusion generated
$1.6 million
of federal income tax expense, which impacted the current tax rate. See
Note 8. Income Taxes
in the notes to our consolidated financial statements.
June 30, 2019 Form 10-Q
36
SEGMENT OPERATIONS
The Company has two reportable segments: Life Insurance and Home Service Insurance. These segments are reported in accordance with U.S. GAAP. The Company also operates other non-insurance portions of the Company, which primarily include the Company's IT and Corporate-support functions, which are included in the table presented below to properly reconcile the segment information with the consolidated financial statements of the Company. The Company evaluates profit and loss performance of its segments based on income (loss) before federal income taxes. The following table shows income (loss) before federal income taxes by segments during the periods indicated.
|
|
Three Months Ended
|
Six Months Ended
|
||||||||||
|
June 30,
|
June 30,
|
|||||||||||
|
(In thousands)
|
2019
|
2018
|
2019
|
2018
|
||||||||
|
Segments:
|
||||||||||||
|
Life Insurance
|
$
|
(119
|
)
|
(1,327
|
)
|
4,518
|
|
4,621
|
|
|||
|
Home Service Insurance
|
(335
|
)
|
(971
|
)
|
(669
|
)
|
(2,794
|
)
|
||||
|
Total segments
|
(454
|
)
|
(2,298
|
)
|
3,849
|
|
1,827
|
|
||||
|
Other Non-Insurance enterprises
|
(2,869
|
)
|
(1,813
|
)
|
(5,164
|
)
|
(3,359
|
)
|
||||
|
Loss before federal income tax expense
|
$
|
(3,323
|
)
|
(4,111
|
)
|
(1,315
|
)
|
(1,532
|
)
|
|||
LIFE INSURANCE
Our Life Insurance segment issues ordinary whole life insurance in the U.S. and in U.S. Dollar-denominated amounts to foreign residents. These contracts are designed to provide a fixed amount of insurance coverage over the life of the insured and can utilize rider benefits to provide additional increasing or decreasing coverage and annuity benefits to enhance accumulations. Additionally, endowment contracts are issued by the Company, which are principally accumulation contracts that incorporate an element of life insurance protection. For the majority of our business, we retain the first $100,000 of risk on any one life, reinsuring the remainder of the risk. Historically, we have operated this segment through our CICA and CNLIC insurance subsidiaries. Since July 1, 2018, we have operated the international business in this segment through CICA Ltd.
INTERNATIONAL SALES
We focus our sales of U.S. Dollar-denominated ordinary whole life insurance and endowment policies to residents in Latin America and the Pacific Rim. We have participated in the foreign marketplace since 1975. We believe positive attributes of our international insurance business include:
|
•
|
larger face amount policies typically issued when compared to our U.S. operations, which results in lower underwriting and administrative costs per unit of coverage;
|
|
•
|
premiums typically paid annually rather than monthly or quarterly, which reduces our administrative expenses, accelerates cash flow and results in lower policy lapse rates than premiums with more frequently scheduled payments; and
|
|
•
|
persistency experience and mortality rates that are comparable to U.S. policies.
|
June 30, 2019 Form 10-Q
37
INTERNATIONAL PRODUCTS
We offer several ordinary whole life insurance and endowment products designed to meet the needs of our non-U.S. policyholders. These policies have been structured to provide:
|
•
|
U.S. Dollar-denominated cash values that accumulate, beginning in the first policy year, to a policyholder during his or her lifetime;
|
|
•
|
premium rates that are competitive with most foreign local companies;
|
|
•
|
a hedge against local currency inflation;
|
|
•
|
protection against devaluation of foreign currency;
|
|
•
|
capital investment in a more secure economic environment (i.e., the U.S.); and
|
|
•
|
lifetime income guarantees for an insured or for surviving beneficiaries.
|
Our international products have living benefit features. Most policies contain guaranteed cash values and are participating (i.e., provides for cash dividends as apportioned by the board of directors). Once a policyholder pays the annual premium and the policy is issued, the owner becomes entitled to policy cash dividends as well as annual premium benefits, if the annual premium benefit was elected. According to the policy language, the policyholder has several options with regard to the policy dividends and annual premium benefits. Any annual policy cash dividend may, at the option of the policyholder and provided the value of a dividend is not encumbered by a policy loan, be applied under one of the following options: (1) paid in cash to the policy owner; (2) credited toward payment of premiums on the policy; (3) left with the Company to accumulate at a defined interest rate; (4) applied to increase the amount of insurance benefit by purchase of paid-up additions to the policy; or (5) be assigned to a third party. If the policy is encumbered by a loan, only option 3 will apply to secure the outstanding loan. Similarly, all annual premium benefits credited to the policy may, at the option of the policyholder and provided the policy is not encumbered by a policy loan, be applied under one of the following options: (1) paid in cash to the policy owner; (2) credited toward payment of premiums on the policy; (3) left with the Company to accumulate at an annually company declared interest rate; or (4) be assigned to a third party. Likewise, if the policy is encumbered by a loan, only option (3) will apply to secure the outstanding loan. Under the "assigned to a third party" provision, the Company has historically allowed policyholders, after receiving a copy of the Citizens, Inc. Stock Investment Plan (the "CISIP") prospectus and acknowledging their understanding of the risks of investing in Citizens Class A common stock, the right to assign policy values outside of the policy to the CISIP, which is administered in the U.S. by Computershare Trust Company, N.A., our plan administrator and an affiliate of Computershare Inc., our transfer agent. The CISIP is a direct stock purchase plan available to policyholders, shareholders, our employees and directors, independent consultants, and other potential investors through the Computershare website. The Company has registered the shares of Class A common stock issuable to participants under the CISIP on a registration statement under the Securities Act of 1933, as amended (the "Securities Act") that is on file with the Securities and Exchange Commission. Computershare administers the CISIP in accordance with the terms and conditions of the CISIP, which is available on the Computershare website and as part of the Company’s registration statement on file with the Securities and Exchange Commission.
June 30, 2019 Form 10-Q
38
The following table sets forth, by country, our direct premiums from the top five premium producing countries in our international life insurance business for the
six
months ended
June 30, 2019
and
2018
as indicated below.
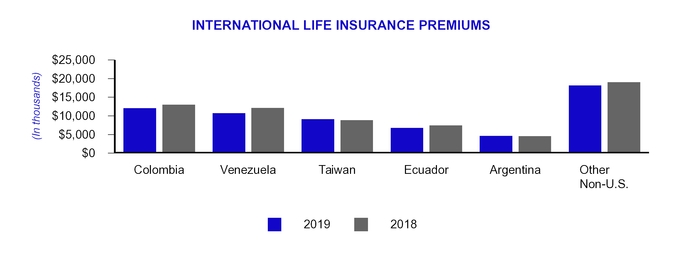
|
|
Three Months Ended
|
Six Months Ended
|
||||||||||
|
June 30,
|
June 30,
|
|||||||||||
|
(In thousands)
|
2019
|
2018
|
2019
|
2018
|
||||||||
|
Country:
|
|
|
|
|
||||||||
|
Colombia
|
$
|
6,142
|
|
6,973
|
|
12,102
|
|
13,026
|
|
|||
|
Venezuela
|
5,426
|
|
6,113
|
|
10,731
|
|
12,154
|
|
||||
|
Taiwan
|
4,346
|
|
4,087
|
|
9,111
|
|
8,879
|
|
||||
|
Ecuador
|
3,575
|
|
3,798
|
|
6,813
|
|
7,462
|
|
||||
|
Argentina
|
2,679
|
|
2,607
|
|
4,660
|
|
4,579
|
|
||||
|
Other Non-U.S.
|
9,698
|
|
8,330
|
|
18,175
|
|
19,020
|
|
||||
|
Total
|
$
|
31,866
|
|
31,908
|
|
61,592
|
|
65,120
|
|
|||
We reported declines in premiums during the
second
quarter and the
six
months ended
June 30, 2019
compared to the same periods in
2018
and we continue to monitor key indicators in these markets. This business is dependent on our clients having access to U.S. dollars. Our international business may also be affected by our ongoing strategic review of our business model and by economic or other events in foreign countries in which our policies are marketed. In April 2018, in connection with our review of our international business model, we discontinued accepting life insurance applications from Brazilian citizens or residents. Brazil had traditionally been one of our top five premium-producing countries in our international life insurance business for the past several years. We recorded premiums from the Brazilian portion of our business of
$3.9 million
, or
6.3%
of total international premiums, as of
June 30, 2019
and
$4.5 million
, or
7.0%
of total international premiums, as of
June 30, 2018
. We also terminated agreements with several independent consultants in Latin America who did not align with our vision, values, and culture.
Direct premiums from Venezuela have declined as Venezuela continues to experience widespread public demonstrations against crime, corruption, soaring inflation and poor utility infrastructure, and we expect that overall premiums from Venezuela will continue to decline if the deteriorating political and economic environment and infrastructure continue to adversely impact our ability to make sales and collect premiums. Our international business and premium collections also could be impacted by our inability to comply with current or future foreign laws or regulations applicable to the Company or our independent consultants in the countries from which we accept applications and by marketing or operational changes made by the Company to comply with those laws or regulations. See the risk factors disclosed in
Part II, Item 1A.
of this Form 10-Q and our Quarterly Report on
Form 10-Q for the quarter ended March
June 30, 2019 Form 10-Q
39
31, 2019
, and in Part I. Item 1A. of our Annual Report on
Form 10-K
for the year ended December 31, 2018 for additional information.
DOMESTIC SALES
Most of our domestic inforce business results from blocks of business of insurance companies we have acquired over the past 20 years. We discontinued new sales of our non-home service domestic products beginning January 1, 2017.
The following table sets forth our direct premiums by state for the top five premium producing U.S. states for the
six
months ended
June 30, 2019
and
2018
as indicated below.

|
|
Three Months Ended
|
Six Months Ended
|
||||||||||
|
June 30,
|
June 30,
|
|||||||||||
|
(In thousands)
|
2019
|
2018
|
2019
|
2018
|
||||||||
|
State:
|
|
|
|
|
||||||||
|
Texas
|
$
|
489
|
|
428
|
|
929
|
|
818
|
|
|||
|
Indiana
|
278
|
|
309
|
|
518
|
|
587
|
|
||||
|
Florida
|
117
|
|
172
|
|
245
|
|
318
|
|
||||
|
Missouri
|
86
|
|
106
|
|
189
|
|
208
|
|
||||
|
Louisiana
|
56
|
|
60
|
|
115
|
|
122
|
|
||||
|
Other States
|
498
|
|
509
|
|
850
|
|
936
|
|
||||
|
Total
|
$
|
1,524
|
|
1,584
|
|
2,846
|
|
2,989
|
|
|||
We report premiums based upon the current residence of our policyholders. A number of domestic life insurance companies we acquired had blocks of accident and health insurance policies, which we did not consider to be a core part of our business. We have ceded the majority of our accident and health insurance business to an unaffiliated insurance company under a coinsurance agreement.
June 30, 2019 Form 10-Q
40
The results of operations for the Life Insurance segment for the periods indicated are as follows.
|
|
Three Months Ended
|
Six Months Ended
|
||||||||||
|
June 30,
|
June 30,
|
|||||||||||
|
(In thousands)
|
2019
|
2018
|
2019
|
2018
|
||||||||
|
Revenue:
|
|
|
|
|
||||||||
|
Premiums
|
$
|
32,140
|
|
34,393
|
|
63,054
|
|
66,753
|
|
|||
|
Net investment income
|
11,612
|
|
10,139
|
|
21,781
|
|
20,269
|
|
||||
|
Realized investment gains (losses), net
|
68
|
|
(24
|
)
|
5,525
|
|
(209
|
)
|
||||
|
Other income
|
614
|
|
79
|
|
797
|
|
288
|
|
||||
|
Total revenue
|
44,434
|
|
44,587
|
|
91,157
|
|
87,101
|
|
||||
|
Benefits and expenses:
|
||||||||||||
|
Insurance benefits paid or provided:
|
||||||||||||
|
Claims and surrenders
|
21,316
|
|
15,019
|
|
38,478
|
|
30,310
|
|
||||
|
Increase in future policy benefit reserves
|
8,519
|
|
15,383
|
|
19,832
|
|
28,965
|
|
||||
|
Policyholders' dividends
|
1,413
|
|
1,605
|
|
2,585
|
|
2,902
|
|
||||
|
Total insurance benefits paid or provided
|
31,248
|
|
32,007
|
|
60,895
|
|
62,177
|
|
||||
|
Commissions
|
4,676
|
|
4,777
|
|
9,049
|
|
10,005
|
|
||||
|
Other general expenses
|
6,458
|
|
6,908
|
|
12,663
|
|
6,024
|
|
||||
|
Capitalization of deferred policy acquisition costs
|
(4,020
|
)
|
(4,150
|
)
|
(7,722
|
)
|
(8,790
|
)
|
||||
|
Amortization of deferred policy acquisition costs
|
6,053
|
|
6,240
|
|
11,494
|
|
12,780
|
|
||||
|
Amortization of cost of customer relationships acquired
|
138
|
|
132
|
|
260
|
|
284
|
|
||||
|
Total benefits and expenses
|
44,553
|
|
45,914
|
|
86,639
|
|
82,480
|
|
||||
|
Income (loss) before federal income tax expense
|
$
|
(119
|
)
|
(1,327
|
)
|
4,518
|
|
4,621
|
|
|||
Premiums.
Premium revenues
decreased
6.6%
for the
second
quarter of
2019
compared to the same period in 2018 due primarily to a decrease in renewal international business. First year premiums, excluding Brazil, a country we exited in April 2018, increased slightly during the
second
quarter of
2019
compared to the same period in
2018
. For the
six
months ended
June 30, 2019
, premium revenues
declined
5.5%
compared to the same period in
2018
due primarily to a decrease in both first year and renewal international business. First year premium revenues declined for the
second
quarter and the
six
months months ended
June 30, 2019
as we experienced a decline in applications received from Venezuela and other countries to a lesser extent. We believe that the decline in new business is driven by several factors, including the political instability in Venezuela, ceasing sales in Brazil, and slower acceptance of the new product set that was repriced and submitted to the market beginning in 2017. Sales internationally have continued to be driven by our endowment to age sixty-five and twenty-year endowment products which have been the top performers for the last several years.
June 30, 2019 Form 10-Q
41
Life insurance premium breakout is detailed below.
|
|
Three Months Ended
|
Six Months Ended
|
||||||||||
|
June 30,
|
June 30,
|
|||||||||||
|
(In thousands)
|
2019
|
2018
|
2019
|
2018
|
||||||||
|
Premiums:
|
|
|
|
|
||||||||
|
First year
|
$
|
2,673
|
|
2,700
|
|
4,947
|
|
5,774
|
|
|||
|
Renewal
|
29,467
|
|
31,693
|
|
58,107
|
|
60,979
|
|
||||
|
Total premiums
|
$
|
32,140
|
|
34,393
|
|
63,054
|
|
66,753
|
|
|||
Net Investment Income
. Net investment income increased primarily due to the growth in average invested assets.
|
|
Six Months Ended
|
Year Ended
|
Six Months Ended
|
||||||
|
June 30,
|
December 31,
|
June 30,
|
|||||||
|
(In thousands, except for %)
|
2019
|
2018
|
2018
|
||||||
|
Net investment income, annualized
|
$
|
43,562
|
|
39,985
|
|
40,538
|
|
||
|
Average invested assets, at amortized cost
|
1,008,256
|
|
958,135
|
|
939,754
|
|
|||
|
Annualized yield on average invested assets
|
4.32
|
%
|
4.17
|
%
|
4.31
|
%
|
|||
The annualized yield in the
second
quarter of
2019
has increased slightly compared to the second quarter of 2018. We are continually adjusting our investment management strategy to identify opportunities to improve our yields while maintaining risk discipline. This continues to be a challenge in the current low interest rate environment.
Realized Investment Gains (Losses), Net.
We recorded realized gains of $68,000 in the
second
quarter of
2019
and
$5.5 million
for the first six months of 2019. The realized gains for the six month period were primarily due to a $5.5 million realized gain from the sale of our former corporate headquarters in Austin, Texas. In addition, we recognized gains of $22,000 due to equity securities fair value adjustments during the first six months of 2019. We also recorded realized investment losses for the six months ended June 30, 2018 that were primarily due to an additional impairment of one single issuer which totaled $150,000.
Claims and Surrenders.
These amounts fluctuate from period to period but were within anticipated ranges based upon management's expectations. The following table represents the amount of claims and surrenders incurred within the Life Insurance segment for the
six
months ended
June 30, 2019
compared to the same period in
2018
.
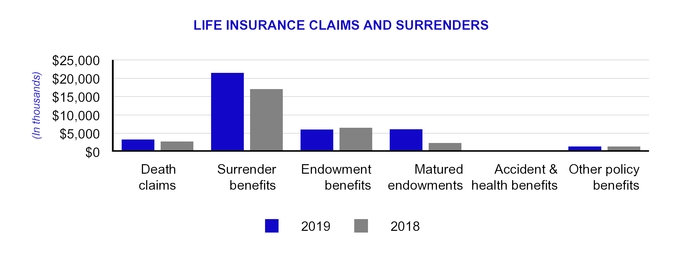
June 30, 2019 Form 10-Q
42
|
|
Three Months Ended
|
Six Months Ended
|
||||||||||
|
June 30,
|
June 30,
|
|||||||||||
|
(In thousands)
|
2019
|
2018
|
2019
|
2018
|
||||||||
|
Claims and Surrenders:
|
||||||||||||
|
Death claims
|
$
|
1,502
|
|
1,216
|
|
3,350
|
|
2,815
|
|
|||
|
Surrender benefits
|
12,612
|
|
8,656
|
|
21,487
|
|
17,080
|
|
||||
|
Endowment benefits
|
2,988
|
|
3,311
|
|
6,062
|
|
6,500
|
|
||||
|
Matured endowments
|
3,529
|
|
1,065
|
|
6,087
|
|
2,367
|
|
||||
|
Accident and health benefits
|
38
|
|
43
|
|
76
|
|
97
|
|
||||
|
Other policy benefits
|
647
|
|
728
|
|
1,416
|
|
1,451
|
|
||||
|
Total claims and surrenders
|
$
|
21,316
|
|
15,019
|
|
38,478
|
|
30,310
|
|
|||
|
•
|
Death claims expense was unfavorable for the
second
quarter and the
six
months ended
June 30, 2019
compared with the same periods in
2018
. Mortality experience is closely monitored by the Company as a key performance indicator and these amounts were within expected levels.
|
|
•
|
Surrenders increased
45.7%
for the
second
quarter of
2019
and
25.8%
for the
six
months ended
June 30, 2019
compared to the same periods in
2018
. As we have a mature book of business, the majority of policy surrender benefits paid are for policies in the later durations of their terms, after the surrender charges have been reduced or have ended.
|
|
•
|
Endowment benefit expense primarily results from the election by policyholders of a product feature providing an annual guaranteed benefit. This is a fixed benefit over the life of the contract, thus this expense will vary with new sales and persistency of the business.
|
|
•
|
Matured endowments increased
231.4%
for the
second
quarter of
2019
and
157.2%
for the
six
months ended
June 30, 2019
compared to the same periods in
2018
, as a large number of our endowment contracts reached maturity in the current period. We anticipate this trend will continue as endowments products sold reach their stated maturities.
|
|
•
|
Other policy benefits resulted primarily from interest paid on premium deposits and policy benefit accumulations.
|
Increase in Future Policy Benefit Reserves.
The
decrease
in policy benefit reserves for the
second
quarter and
six
months ended
June 30, 2019
, compared to the same periods in
2018
, was due primarily to the decline in new premium income and increase in surrender and maturity activity in the current period as described above.
Policyholders' Dividends.
Policyholders' dividends were lower for both the
second
quarter and the
six
months ended
June 30, 2019
compared to the same periods in 2018. The decrease was due to changes in persistency and production.
Commissions.
Commission expense
decreased
slightly for the
second
quarter and decreased to a greater extent for the
six
months ended
June 30, 2019
compared to the same periods in
2018
. This expense fluctuates directly with new premium revenues as commission rates paid are higher on first year premium sales.
Other General Expenses.
Expenses increased for the
second
quarter and the
six
months ended
June 30, 2019
compared to the same periods in
2018
. The increase for the
six
months ending
June 30, 2019
primarily relates to the reduction in the 7702 tax compliance estimated costs recorded in the first quarter of 2018. We also had additional costs related to salaries, bonuses and other compensation paid to executive officers in the
second
quarter and the
six
months ended
June 30, 2019
compared to the same periods in
2018
. Audit and legal fees were lower during both periods compared to the prior year.
June 30, 2019 Form 10-Q
43
Capitalization of Deferred Policy Acquisition Costs.
Capitalized costs fluctuate in direct relation to commissions,
decreasing
for the
second
quarter and the
six
months ended
June 30, 2019
, based upon first year and renewal premiums and commissions paid compared to the same periods in
2018
.
Amortization of Deferred Policy Acquisition Costs.
Amortization costs fluctuate with changes in first year premium activity, surrenders, and persistency in general. As previously described, persistency is monitored closely by the Company.
HOME SERVICE INSURANCE
We operate in the Home Service insurance market through our subsidiaries Security Plan Life Insurance Company ("SPLIC"), Magnolia Guaranty Life Insurance Company ("MGLIC") and Security Plan Fire Insurance Company ("SPFIC"), and focus on the life insurance needs of the middle and lower income markets, primarily in Louisiana, Mississippi and Arkansas. Our policies are sold and serviced through a home service marketing distribution system of employee-agents who work full time on a debit route system and through funeral homes that sell policies, collect premiums and service policyholders.
The following table sets forth our direct premiums by state for the periods indicated.
|
|
Three Months Ended
|
Six Months Ended
|
||||||||||
|
June 30,
|
June 30,
|
|||||||||||
|
(In thousands)
|
2019
|
2018
|
2019
|
2018
|
||||||||
|
State:
|
|
|
|
|
||||||||
|
Louisiana
|
$
|
10,666
|
|
10,749
|
|
21,309
|
|
21,419
|
|
|||
|
Mississippi
|
532
|
|
524
|
|
1,038
|
|
1,091
|
|
||||
|
Arkansas
|
437
|
|
443
|
|
824
|
|
859
|
|
||||
|
Other States
|
232
|
|
223
|
|
459
|
|
454
|
|
||||
|
Total
|
$
|
11,867
|
|
11,939
|
|
23,630
|
|
23,823
|
|
|||
HOME SERVICE INSURANCE PRODUCTS
Our Home Service Insurance products consist primarily of small face amount ordinary whole life and pre-need policies, which are designed to fund final expenses for the insured, primarily consisting of funeral and burial costs. To a much lesser extent, our Home Service Insurance segment sells limited-liability, named-peril property policies covering dwellings and contents. We provide $30,000 maximum coverage on any one dwelling and contents, while content only coverage and dwelling only coverage is limited to $20,000, respectively.
We provide final expense ordinary life insurance and annuity products primarily to middle and lower income individuals in Louisiana, Mississippi and Arkansas.
June 30, 2019 Form 10-Q
44
The results of operations for the Home Service Insurance segment for the periods indicated are as follows.
|
|
Three Months Ended
|
Six Months Ended
|
||||||||||
|
June 30,
|
June 30,
|
|||||||||||
|
(In thousands)
|
2019
|
2018
|
2019
|
2018
|
||||||||
|
Revenue:
|
|
|
|
|
||||||||
|
Premiums
|
$
|
11,664
|
|
11,737
|
|
23,214
|
|
23,406
|
|
|||
|
Net investment income
|
3,325
|
|
3,316
|
|
6,411
|
|
6,618
|
|
||||
|
Realized investment gains (losses), net
|
152
|
|
(151
|
)
|
636
|
|
(503
|
)
|
||||
|
Other income (loss)
|
1
|
|
—
|
|
2
|
|
(1
|
)
|
||||
|
Total revenue
|
15,142
|
|
14,902
|
|
30,263
|
|
29,520
|
|
||||
|
Benefits and expenses:
|
||||||||||||
|
Insurance benefits paid or provided:
|
||||||||||||
|
Claims and surrenders
|
5,708
|
|
5,598
|
|
11,579
|
|
11,458
|
|
||||
|
Increase in future policy benefit reserves
|
953
|
|
1,172
|
|
1,939
|
|
2,198
|
|
||||
|
Policyholders' dividends
|
10
|
|
9
|
|
20
|
|
19
|
|
||||
|
Total insurance benefits paid or provided
|
6,671
|
|
6,779
|
|
13,538
|
|
13,675
|
|
||||
|
Commissions
|
3,708
|
|
3,892
|
|
7,219
|
|
7,623
|
|
||||
|
Other general expenses
|
5,332
|
|
5,392
|
|
10,402
|
|
10,936
|
|
||||
|
Capitalization of deferred policy acquisition costs
|
(1,392
|
)
|
(1,490
|
)
|
(2,518
|
)
|
(2,813
|
)
|
||||
|
Amortization of deferred policy acquisition costs
|
878
|
|
960
|
|
1,714
|
|
2,026
|
|
||||
|
Amortization of cost of customer relationships acquired
|
280
|
|
340
|
|
577
|
|
867
|
|
||||
|
Total benefits and expenses
|
15,477
|
|
15,873
|
|
30,932
|
|
32,314
|
|
||||
|
Loss before federal income tax expense
|
$
|
(335
|
)
|
(971
|
)
|
(669
|
)
|
(2,794
|
)
|
|||
Premiums.
Premiums were down slightly for the
second
quarter and the
six
months ended
June 30, 2019
compared to the same periods in
2018
.
Net Investment Income.
Net investment income for our Home Service Insurance segment declined slightly during the
second
quarter and the
six
months ending
June 30, 2019
compared to the same periods in 2018 as a fall in yields and an increase in investment expenses offset a slight increase in average invested assets. As previously described, it has been challenging to find attractive yields in the current low interest rate environment. Net investment income yield for our Home Service segment is summarized below.
|
|
Six Months Ended
|
Year Ended
|
Six Months Ended
|
||||||
|
June 30,
|
December 31,
|
June 30,
|
|||||||
|
(In thousands, except for %)
|
2019
|
2018
|
2018
|
||||||
|
|
|||||||||
|
Net investment income, annualized
|
$
|
13,027
|
|
13,125
|
|
13,236
|
|
||
|
Average invested assets, at amortized cost
|
292,042
|
|
290,443
|
|
287,119
|
|
|||
|
Annualized yield on average invested assets
|
4.46
|
%
|
4.52
|
%
|
4.61
|
%
|
|||
Realized Investment Gains (Losses), Net.
Realized net gains for the
six
months ended
June 30, 2019
were primarily related to equity securities fair value adjustments of
$656,000
, as financial markets performed well during the first
six
June 30, 2019 Form 10-Q
45
months of
2019
. We recorded losses of $339,000 due to fair value changes related to equity securities and an additional impairment on one fixed maturity security issuer totaling $75,000 for the
six
months ended
June 30, 2018
.
Claims and Surrenders.
These amounts fluctuate from period to period but were within anticipated ranges based upon management's expectations.
|
|
Three Months Ended
|
Six Months Ended
|
||||||||||
|
June 30,
|
June 30,
|
|||||||||||
|
(In thousands)
|
2019
|
2018
|
2019
|
2018
|
||||||||
|
Claims and Surrenders:
|
||||||||||||
|
Death claims
|
$
|
4,441
|
|
4,312
|
|
9,080
|
|
8,896
|
|
|||
|
Surrender benefits
|
814
|
|
719
|
|
1,678
|
|
1,454
|
|
||||
|
Endowment benefits
|
2
|
|
3
|
|
4
|
|
6
|
|
||||
|
Matured endowments
|
155
|
|
141
|
|
278
|
|
263
|
|
||||
|
Property claims
|
272
|
|
429
|
|
490
|
|
814
|
|
||||
|
Accident and health benefits
|
20
|
|
(10
|
)
|
40
|
|
17
|
|
||||
|
Other policy benefits
|
4
|
|
4
|
|
9
|
|
8
|
|
||||
|
Total claims and surrenders
|
$
|
5,708
|
|
5,598
|
|
11,579
|
|
11,458
|
|
|||
|
•
|
Death claims expense fluctuates based upon reported claims. We experienced a small
increase
in reported claims in the
second
quarter and the
six
months ended
June 30, 2019
compared to the same periods in
2018
. Mortality experience is closely monitored by the Company as a key performance indicator and amounts were within expected levels.
|
|
•
|
Surrender benefits
increased
for the
second
quarter and the
six
months ended
June 30, 2019
, but were within anticipated ranges based on management expectations.
|
|
•
|
Property claims decreased for the
second
quarter and the
six
months ended
June 30, 2019
, as we experienced favorable weather-related claim activity in
2019
compared to the same periods in
2018
.
|
Increase in Future Policy Benefit Reserves.
The change in future policy benefit reserves for the
second
quarter and the
six
months ended
June 30, 2019
was consistent with sales and surrender activity compared to the same periods in
2018
.
Commissions.
Commission expense
decreased
for the
second
quarter and the
six
months ended
June 30, 2019
compared to the same periods in
2018
, consistent with premium collection levels. In addition, management initiated a change in commission policy in 2018 that has resulted in generally lower commission payouts.
Other General Expenses.
Expenses are allocated by segment based upon an annual expense study performed by the Company. Expenses declined for the
second
quarter and the
six
months ended
June 30, 2019
, compared to the same periods in
2018
, due primarily to lower audit fees related to the 2018 audit incurred in the first quarter of 2019, compared to 2017 audit fees incurred in the first quarter of 2018.
Capitalization of Deferred Policy Acquisition Costs ("DAC").
Capitalized costs
decreased
for the
second
quarter and the
six
months ended
June 30, 2019
compared to the same periods in
2018
. DAC capitalization is directly correlated to fluctuations in new business and commissions.
Amortization of Deferred Policy Acquisition Costs.
Amortization for the
second
quarter and the
six
months ended
June 30, 2019
declined
compared to the same periods in
2018
due to lower first year production and commissions in the current quarter.
June 30, 2019 Form 10-Q
46
Amortization of Cost of Customer Relationships Acquired.
Amortization decreased for the
second
quarter and the
six
months ended
June 30, 2019
compared to the same periods in
2018
, mainly due to an annual review and true up performed in the first quarter of 2019.
OTHER NON-INSURANCE ENTERPRISES
This represents the administrative support entities to the insurance operations whose revenues are primarily intercompany and have been eliminated in consolidation under GAAP. The losses reported for the
second
quarter and the
six
months ended
June 30, 2019
are the primary source of revenue.
INVESTMENTS
The administration of our investment portfolios is handled by our management and a third-party investment manager pursuant to board-approved investment guidelines, with all trading activity approved by a committee of each entity's respective boards of directors. The guidelines used require that fixed maturities, both government and corporate, are investment grade and comprise a majority of the investment portfolio. State insurance statutes prescribe the quality and percentage of the various types of investments that may be made by insurance companies and generally permit investment in qualified state, municipal, federal and foreign government obligations, high quality corporate bonds, preferred and common stock, mortgage loans and real estate within certain specified percentages. The assets are intended to mature in accordance with the average maturity of the insurance products and provide the cash flow for our insurance company subsidiaries to meet their respective policyholder obligations.
The following table shows the carrying value of our investments by investment category and cash and cash equivalents, and the percentage of each to total invested cash, cash equivalents and investments.
|
Carrying Value
|
June 30, 2019
|
December 31, 2018
|
|||||||||||
|
(In thousands, except for %)
|
Amount
|
%
|
Amount
|
%
|
|||||||||
|
Fixed maturity securities:
|
|
|
|
|
|||||||||
|
U.S. Treasury and U.S. Government-sponsored enterprises
|
$
|
16,025
|
|
1.1
|
%
|
$
|
15,554
|
|
1.1
|
%
|
|||
|
States and political subdivisions
|
676,440
|
|
45.7
|
%
|
720,115
|
|
52.0
|
%
|
|||||
|
Corporate
|
509,768
|
|
34.5
|
%
|
381,796
|
|
27.5
|
%
|
|||||
|
Mortgage-backed
(1)
|
128,753
|
|
8.7
|
%
|
108,698
|
|
7.8
|
%
|
|||||
|
Asset-backed
|
10,233
|
|
0.7
|
%
|
4,757
|
|
0.3
|
%
|
|||||
|
Foreign governments
|
120
|
|
—
|
%
|
119
|
|
—
|
%
|
|||||
|
Total fixed maturity securities
|
1,341,339
|
|
90.7
|
%
|
1,231,039
|
|
88.7
|
%
|
|||||
|
Short-term investments
|
2,455
|
|
0.2
|
%
|
7,865
|
|
0.6
|
%
|
|||||
|
Cash and cash equivalents
|
34,568
|
|
2.3
|
%
|
45,492
|
|
3.3
|
%
|
|||||
|
Other investments:
|
|
|
|
|
|
|
|
|
|||||
|
Policy loans
|
81,545
|
|
5.5
|
%
|
80,825
|
|
5.8
|
%
|
|||||
|
Equity securities
|
15,827
|
|
1.1
|
%
|
15,068
|
|
1.1
|
%
|
|||||
|
Mortgage loans
|
182
|
|
—
|
%
|
186
|
|
—
|
%
|
|||||
|
Real estate and other long-term investments
|
2,593
|
|
0.2
|
%
|
7,223
|
|
0.5
|
%
|
|||||
|
Total cash, cash equivalents and investments
|
$
|
1,478,509
|
|
100.0
|
%
|
$
|
1,387,698
|
|
100.0
|
%
|
|||
(1)
Includes
$127.5 million
and $
108.5 million
of U.S. Government-sponsored enterprises at
June 30, 2019
and
December 31, 2018
, respectively.
June 30, 2019 Form 10-Q
47
Cash and cash equivalents
decreased
as of
June 30, 2019
due to timing of cash inflows and investments of cash into marketable securities.
The following table sets forth the distribution of the credit ratings of our portfolio of fixed maturity securities by carrying value as of
June 30, 2019
and
December 31, 2018
.
|
Carrying Value
|
June 30, 2019
|
December 31, 2018
|
|||||||||||
|
(In thousands, except for %)
|
Amount
|
%
|
Amount
|
%
|
|||||||||
|
AAA
|
$
|
95,449
|
|
7.1
|
%
|
$
|
96,333
|
|
7.8
|
%
|
|||
|
AA
|
544,444
|
|
40.6
|
%
|
551,978
|
|
44.8
|
%
|
|||||
|
A
|
328,407
|
|
24.5
|
%
|
281,553
|
|
22.9
|
%
|
|||||
|
BBB
|
352,955
|
|
26.3
|
%
|
277,584
|
|
22.6
|
%
|
|||||
|
BB and other
|
20,084
|
|
1.5
|
%
|
23,591
|
|
1.9
|
%
|
|||||
|
Totals
|
$
|
1,341,339
|
|
100.0
|
%
|
$
|
1,231,039
|
|
100.0
|
%
|
|||
Credit ratings reported for the periods indicated are assigned by a Nationally Recognized Statistical Rating Organization ("NRSRO") such as Moody’s Investors Service, Standard & Poor’s or Fitch Ratings. A credit rating assigned by an NRSRO is a quality based rating, with AAA representing the highest quality and D the lowest, with BBB and above being considered investment grade. In addition, the Company may use credit ratings of the National Association of Insurance Commissioners ("NAIC") Securities Valuation Office ("SVO") as assigned, if there is no NRSRO rating. Securities rated by the SVO are grouped in the equivalent NRSRO category as stated by the SVO and securities that are not rated by an NRSRO are included in the "other" category.
The Company has no direct sovereign European debt exposure as of
June 30, 2019
.
As of
June 30, 2019
, the Company held municipal securities that include third party guarantees. Detailed below is a presentation by NRSRO rating of our municipal holdings by funding type.
|
June 30, 2019
|
General Obligation
|
Special Revenue
|
Other
|
Total
|
% Based on Amortized
Cost |
||||||||||||||||||||||
|
(In thousands, except for %)
|
Fair
Value |
Amortized
Cost |
Fair
Value |
Amortized
Cost |
Fair
Value |
Amortized
Cost |
Fair
Value |
Amortized
Cost |
|||||||||||||||||||
|
Municipal securities including third party guarantees
|
|||||||||||||||||||||||||||
|
AAA
|
$
|
55,743
|
|
54,713
|
|
31,206
|
|
30,795
|
|
—
|
|
—
|
|
86,949
|
|
85,508
|
|
13.1
|
%
|
||||||||
|
AA
|
141,574
|
|
137,217
|
|
217,130
|
|
210,868
|
|
23,292
|
|
21,992
|
|
381,996
|
|
370,077
|
|
56.8
|
%
|
|||||||||
|
A
|
24,026
|
|
23,162
|
|
137,215
|
|
128,024
|
|
10,793
|
|
10,192
|
|
172,034
|
|
161,378
|
|
24.8
|
%
|
|||||||||
|
BBB
|
5,965
|
|
5,899
|
|
18,741
|
|
18,118
|
|
1,488
|
|
1,450
|
|
26,194
|
|
25,467
|
|
3.9
|
%
|
|||||||||
|
BB and other
|
5,744
|
|
5,707
|
|
3,523
|
|
3,461
|
|
—
|
|
—
|
|
9,267
|
|
9,168
|
|
1.4
|
%
|
|||||||||
|
Total
|
$
|
233,052
|
|
226,698
|
|
407,815
|
|
391,266
|
|
35,573
|
|
33,634
|
|
676,440
|
|
651,598
|
|
100.0
|
%
|
||||||||
|
Municipal securities excluding third party guarantees
|
|||||||||||||||||||||||||||
|
AAA
|
$
|
21,645
|
|
21,487
|
|
10,232
|
|
10,231
|
|
—
|
|
—
|
|
31,877
|
|
31,718
|
|
4.9
|
%
|
||||||||
|
AA
|
116,397
|
|
114,044
|
|
151,366
|
|
148,047
|
|
16,320
|
|
15,263
|
|
284,083
|
|
277,354
|
|
42.5
|
%
|
|||||||||
|
A
|
50,620
|
|
49,177
|
|
168,703
|
|
158,109
|
|
13,644
|
|
12,918
|
|
232,967
|
|
220,204
|
|
33.8
|
%
|
|||||||||
|
BBB
|
11,178
|
|
10,751
|
|
33,927
|
|
32,829
|
|
—
|
|
—
|
|
45,105
|
|
43,580
|
|
6.7
|
%
|
|||||||||
|
BB and other
|
33,212
|
|
31,239
|
|
43,587
|
|
42,050
|
|
5,609
|
|
5,453
|
|
82,408
|
|
78,742
|
|
12.1
|
%
|
|||||||||
|
Total
|
$
|
233,052
|
|
226,698
|
|
407,815
|
|
391,266
|
|
35,573
|
|
33,634
|
|
676,440
|
|
651,598
|
|
100.0
|
%
|
||||||||
June 30, 2019 Form 10-Q
48
The Company held investments in special revenue bonds that had a greater than 10% exposure based upon activity as noted in the table below.
|
(In thousands)
|
Fair
Value
|
Amortized
Cost |
% of Total
Fair Value |
||||||
|
|
|
||||||||
|
Utilities
|
$
|
145,065
|
|
138,189
|
|
21.5
|
%
|
||
|
Education
|
98,874
|
|
94,102
|
|
14.6
|
%
|
|||
|
General Obligations
|
72,137
|
|
69,827
|
|
10.7
|
%
|
|||
The Company's exposure to municipal holdings is spread across many states, with Texas and Florida as the two states with the largest municipal holdings as of
June 30, 2019
. The Company holds
21.6%
of its municipal security holdings in Texas issuers and
13.0%
in Florida issuers based on fair value. There were no other states or individual issuer holdings that represented or exceeded 10% of the total municipal portfolio as of
June 30, 2019
.
The tables below represent the exposure the Company holds in these two states.
|
June 30, 2019
|
General Obligation
|
Special Revenue
|
Other
|
Total
|
||||||||||||||||||||
|
(In thousands)
|
Fair
Value |
Amortized
Cost |
Fair
Value |
Amortized
Cost |
Fair
Value |
Amortized
Cost |
Fair
Value |
Amortized
Cost |
||||||||||||||||
|
Texas securities including third party guarantees
|
|
|
|
|
|
|
|
|
||||||||||||||||
|
AAA
|
$
|
53,738
|
|
52,777
|
|
16,014
|
|
15,615
|
|
—
|
|
—
|
|
69,752
|
|
68,392
|
|
|||||||
|
AA
|
35,473
|
|
34,955
|
|
26,163
|
|
25,338
|
|
—
|
|
—
|
|
61,636
|
|
60,293
|
|
||||||||
|
A
|
—
|
|
—
|
|
7,139
|
|
6,545
|
|
—
|
|
—
|
|
7,139
|
|
6,545
|
|
||||||||
|
BBB
|
—
|
|
—
|
|
6,482
|
|
6,353
|
|
—
|
|
—
|
|
6,482
|
|
6,353
|
|
||||||||
|
BB and other
|
724
|
|
722
|
|
496
|
|
518
|
|
—
|
|
—
|
|
1,220
|
|
1,240
|
|
||||||||
|
Total
|
$
|
89,935
|
|
88,454
|
|
56,294
|
|
54,369
|
|
—
|
|
—
|
|
146,229
|
|
142,823
|
|
|||||||
|
Texas securities excluding third party guarantees
|
|
|
|
|
|
|
|
|
||||||||||||||||
|
AAA
|
$
|
20,213
|
|
20,062
|
|
930
|
|
930
|
|
—
|
|
—
|
|
21,143
|
|
20,992
|
|
|||||||
|
AA
|
53,092
|
|
52,097
|
|
27,732
|
|
27,179
|
|
—
|
|
—
|
|
80,824
|
|
79,276
|
|
||||||||
|
A
|
13,637
|
|
13,413
|
|
14,802
|
|
13,803
|
|
—
|
|
—
|
|
28,439
|
|
27,216
|
|
||||||||
|
BBB
|
1,229
|
|
1,157
|
|
7,041
|
|
6,889
|
|
—
|
|
—
|
|
8,270
|
|
8,046
|
|
||||||||
|
BB and other
|
1,764
|
|
1,725
|
|
5,789
|
|
5,568
|
|
—
|
|
—
|
|
7,553
|
|
7,293
|
|
||||||||
|
Total
|
$
|
89,935
|
|
88,454
|
|
56,294
|
|
54,369
|
|
—
|
|
—
|
|
146,229
|
|
142,823
|
|
|||||||
June 30, 2019 Form 10-Q
49
|
June 30, 2019
|
General Obligation
|
Special Revenue
|
Other
|
Total
|
||||||||||||||||||||
|
(In thousands)
|
Fair
Value |
Amortized
Cost |
Fair
Value |
Amortized
Cost |
Fair
Value |
Amortized
Cost |
Fair
Value |
Amortized
Cost |
||||||||||||||||
|
Florida securities including third party guarantees
|
||||||||||||||||||||||||
|
AAA
|
$
|
501
|
|
500
|
|
3,460
|
|
3,460
|
|
—
|
|
—
|
|
3,961
|
|
3,960
|
|
|||||||
|
AA
|
—
|
|
—
|
|
56,892
|
|
56,113
|
|
5,126
|
|
5,046
|
|
62,018
|
|
61,159
|
|
||||||||
|
A
|
—
|
|
—
|
|
11,636
|
|
11,469
|
|
10,555
|
|
9,966
|
|
22,191
|
|
21,435
|
|
||||||||
|
Total
|
$
|
501
|
|
500
|
|
71,988
|
|
71,042
|
|
15,681
|
|
15,012
|
|
88,170
|
|
86,554
|
|
|||||||
|
Florida securities excluding third party guarantees
|
||||||||||||||||||||||||
|
AAA
|
$
|
501
|
|
500
|
|
—
|
|
—
|
|
—
|
|
—
|
|
501
|
|
500
|
|
|||||||
|
AA
|
—
|
|
—
|
|
44,447
|
|
43,995
|
|
3,525
|
|
3,525
|
|
47,972
|
|
47,520
|
|
||||||||
|
A
|
—
|
|
—
|
|
23,275
|
|
23,006
|
|
10,556
|
|
9,967
|
|
33,831
|
|
32,973
|
|
||||||||
|
BB and other
|
—
|
|
—
|
|
4,266
|
|
4,041
|
|
1,600
|
|
1,520
|
|
5,866
|
|
5,561
|
|
||||||||
|
Total
|
$
|
501
|
|
500
|
|
71,988
|
|
71,042
|
|
15,681
|
|
15,012
|
|
88,170
|
|
86,554
|
|
|||||||
VALUATION OF INVESTMENTS
We evaluate the carrying value of our fixed maturity and equity securities at least quarterly. The Company monitors all debt and equity securities on an on-going basis relative to changes in credit ratings, market prices, earnings trends and financial performance, in addition to specific region or industry reviews. The assessment of whether other-than-temporary impairments have occurred is based on a case-by-case evaluation of underlying reasons for the decline in fair value. The Company determines other-than-temporary impairment by reviewing all relevant evidence related to the specific security issuer as well as the Company's intent to sell the security, or if it is more likely than not that the Company would be required to sell a security before recovery of its amortized cost.
When an other-than-temporary impairment has occurred, the amount of the other-than-temporary impairment recognized in earnings depends on whether the Company intends to sell the security or more likely than not will be required to sell the security before recovery of its amortized cost basis. If the Company intends to sell the security or more likely than not will be required to sell the security before recovery of its amortized cost basis, the other-than-temporary impairment is recognized in earnings equal to the entire difference between the investment's cost and its fair value at the balance sheet date. If the Company does not intend to sell the security and it is not more likely than not that the Company will be required to sell the security before recovery of its amortized cost basis, the other-than-temporary impairment is separated into the following: (a) the amount representing the credit loss; and (b) the amount related to all other factors. The amount of the total other-than-temporary impairment related to the credit loss is recognized in earnings. The amount of the total other-than-temporary impairment related to other factors is recognized in other comprehensive income, net of applicable taxes. The previous amortized cost basis less the other-than-temporary impairment recognized in earnings becomes the new amortized cost basis of the investment. The new amortized cost basis is not adjusted for subsequent recoveries in fair value.
There were no other-than-temporary impairments recorded for the
three and six
months ended
June 30, 2019
or the three months ended
June 30,
2018
. The Company recognized other-than-temporary impairments of $225,000 during the
six
months ended
June 30, 2018
.
LIQUIDITY AND CAPITAL RESOURCES
Liquidity refers to a company's ability to generate sufficient cash flows to meet the needs of its operations. Liquidity is managed on insurance operations to ensure stable and reliable sources of cash flows to meet obligations and is provided by a variety of sources.
June 30, 2019 Form 10-Q
50
Our liquidity requirements are met primarily by funds provided from operations. Premium deposits and revenues, investment income and investment maturities are the primary sources of funds, while investment purchases, policy benefits, and operating expenses are the primary uses of funds. We historically have not had to liquidate investments to provide cash flow, and there were no liquidity issues during the
six
months ended
June 30, 2019
. Our investments consist of
92.9%
of marketable debt securities classified as available-for-sale and
1.1%
of equity securities that could be readily converted to cash for liquidity needs.
A primary liquidity concern is the risk of an extraordinary level of early policyholder withdrawals. We include provisions in our insurance policies, such as surrender charges, that help limit and discourage early withdrawals. Since these contractual withdrawals, as well as the level of surrenders experienced, have been largely consistent with our assumptions in asset liability management, our associated cash outflows historically have not had an adverse impact on our overall liquidity. Individual life insurance policies are less susceptible to withdrawal than annuity reserves and deposit liabilities because policyholders may incur surrender charges and undergo a new underwriting process in order to obtain a new insurance policy. Cash flow projections and cash flow tests under various market interest rate scenarios are also performed annually to assist in evaluating liquidity needs and adequacy.
Our whole life and endowment products provide the policyholder with alternatives once the policy matures. The policyholder can choose to take a lump sum payout or leave the money on deposit at interest with the Company. The Company has a significant amount of endowment products representing over 40% of total insurance in force with older contracts sold historically that will begin reaching their maturities over the next several years and policyholder election behavior is not known. If a large number of policyholders elect lump sum distributions, the Company could be exposed to liquidity risk in years of high maturities. Meeting these distributions could require the Company to sell securities at inopportune times to pay policyholder withdrawals. Alternatively, if the policyholders were to leave the money on deposit with the Company at interest, our profitability could be negatively impacted if the product guaranteed rate is higher than the current market rate we can earn on our investments. We currently anticipate that available liquidity sources and future cash flows will be adequate to meet our needs for funds, but we will monitor closely our policyholder behavior patterns.
A large portion of our debt security investment portfolio will mature in the next several years and could be called sooner. We were subject to significant call activity beginning in 2009 due to the declining interest rate environment, which required us to reinvest in debt securities with shorter durations that are now approaching maturity. We will need to reinvest these maturing funds in the current interest rate environment. Our profitability could be negatively impacted depending on the market rates at the time of reinvestment. This could result in a decrease in our spread between our policy liability crediting rates and our investment earned rates which could also negatively impact our liquidity.
Cash flows from our insurance operations historically have been sufficient to meet current needs. Cash flows from operating activities were
$31.4 million
and
$42.0 million
for the
six
months ended
June 30, 2019
and
2018
, respectively. We have traditionally also had significant cash flows from both scheduled and unscheduled investment security maturities, redemptions, and prepayments. These cash flows, for the most part, are reinvested in fixed income securities. Net cash outflows from investing activities totaled
$41.4 million
and
$24.9 million
for the
six
months ended
June 30, 2019
and
2018
, respectively. The investing activities fluctuate from period to period due to timing of securities activities such as calls and maturities and reinvestment of those funds.
We have established an estimated liability of
$10.0 million
, net of tax, as of
June 30, 2019
for probable liabilities and expenses associated with a tax compliance matter related to the qualification of certain of our policies as described in
Note 7. Commitments and Contingencies
, which represents management’s estimate. We have disclosed an estimated range related to probable liabilities and expenses of
$6.0 million
to
$52.5 million
, net of tax. This estimated range includes projected taxes, interest and penalties payable to the IRS, as well as estimated increased payout obligations to current holders of non-compliant domestic life insurance policies expected to result from remediation of those policies. The amount of our liabilities and expenses depends on a number of uncertainties, including the number of prior tax years for which we may be liable to the IRS, and the methodology applicable to the calculation of the tax liabilities for policies. Given the range of potential outcomes and the significant variables assumed in establishing our estimates,
June 30, 2019 Form 10-Q
51
actual amounts incurred may exceed our reserve and exceed the high end of our estimated range of liabilities and expenses.
The NAIC has established minimum capital requirements in the form of risk-based capital ("RBC"). RBC considers the type of business written by an insurance company, the quality of its assets, and various other aspects of an insurance company's business to develop a minimum level of capital called "Authorized Control Level Risk-based Capital" and compares this level to an adjusted statutory capital that includes capital and surplus as reported under statutory accounting principles, plus certain investment reserves. Should the ratio of adjusted statutory capital to control level RBC fall below 200%, a series of remedial actions by the affected company would be required. We have a parental guarantee between Citizens and CICA, Citizens' wholly-owned subsidiary domiciled in Colorado, to maintain a RBC level above 350%.
The Bermuda Monetary Authority ("BMA") established risk-based regulatory capital adequacy and solvency margin requirements for Bermuda insurers that mandate that a Bermuda-domiciled subsidiary’s Enhanced Capital Requirement ("ECR") be calculated by either (a) Bermuda Solvency Capital Requirement ("BSCR"), or (b) an internal capital model that the BMA has approved for use for this purpose. CICA Ltd., Citizens' wholly-owned subsidiary domiciled in Bermuda, uses the BSCR in calculating its solvency requirements. The Economic Balance Sheet ("EBS") framework is embedded as part of the BSCR and forms the basis of its ECR.
In order to minimize the risk of a shortfall in capital arising from an unexpected adverse deviation and in moving towards the implementation of a RBC approach, the BMA has established a threshold capital level (termed the Target Capital Level ("TCL")), set at 120 percent of ECR, which serves as an early warning tool for the BMA. Failure to maintain statutory capital at least equal to the TCL would likely result in increased BMA regulatory oversight.
All U.S. insurance subsidiaries exceeded the RBC minimums at
June 30, 2019
. CICA Ltd. held capital in excess of the BSCR requirements at
June 30, 2019
.
PARENT COMPANY LIQUIDITY AND CAPITAL RESOURCES
Citizens is a holding company and has had minimal operations of its own. Our assets consist of the capital stock of our subsidiaries, cash, fixed income securities, mutual funds and real estate held-for-sale. Our cash flows depend primarily upon the availability of statutorily permissible payments, primarily payments under management agreements from our life insurance subsidiaries. The ability to make payments is limited by applicable laws and regulations of Bermuda and U.S. states of domicile, which subject insurance operations to significant regulatory restrictions. These laws and regulations require, among other things, that these insurance subsidiaries maintain minimum solvency requirements and limit the amount of dividends these subsidiaries can pay to the holding company. We historically have not relied upon dividends from subsidiaries for our cash flow needs. However, our subsidiaries have made dividend payments of available funds from time to time in relation to business strategies.
CONTRACTUAL OBLIGATIONS AND OFF-BALANCE SHEET ARRANGEMENTS
There have been no material changes in contractual obligations from those reported in the Company's Annual Report on
Form 10-K
for the year ended
December 31, 2018
. The Company does not have off-balance sheet arrangements at
June 30, 2019
. We do not utilize special purpose entities as investment vehicles, nor are there any such entities in which we have an investment that engage in speculative activities of any nature, and we do not use such investments to hedge our investment positions.
CRITICAL ACCOUNTING POLICIES
We have prepared a current assessment of our critical accounting policies and estimates in connection with preparing our interim unaudited consolidated financial statements as of and for the
three and six
months ended
June 30, 2019
and 2018. We believe that the accounting policies set forth in the notes to our consolidated financial statements and "Critical Accounting Policies and Estimates" in the Management’s Discussion and Analysis of Consolidated Financial
June 30, 2019 Form 10-Q
52
Condition and Results of Operations in our Annual Report on
Form 10-K
for the year ended December 31,
2018
continue to describe the significant judgments and estimates used in the preparation of our consolidated financial statements.
Item 3.
QUANTITATIVE AND QUALITATIVE DISCLOSURES ABOUT MARKET RISK
GENERAL
The nature of our business exposes us to market risk relative to our invested assets and policy liabilities. Market risk is the risk of loss that may occur when changes in interest rates and public equity prices adversely affect the value of our invested assets. Interest rate risk is our primary market risk exposure. Substantial and sustained increases and decreases in market interest rates can affect the fair value of our investments. The fair value of our fixed maturity securities portfolio generally increases when interest rates decrease and decreases when interest rates increase. For additional information regarding market risks to which we are subject, see Item 1. Financial Statements -
Note 5. Investments - Valuation of Investments
in the notes to our consolidated financial statements for further discussion.
The following table summarizes net unrealized gains and losses as of the dates indicated.
|
|
June 30, 2019
|
December 31, 2018
|
||||||||||||||||
|
(In thousands)
|
Amortized
Cost |
Fair
Value |
Net
Unrealized Gains |
Amortized
Cost |
Fair
Value |
Net
Unrealized Gains |
||||||||||||
|
Total fixed maturities
|
$
|
1,274,085
|
|
1,341,339
|
|
67,254
|
|
1,223,747
|
|
|
1,231,039
|
|
7,292
|
|
||||
|
Total equity securities
|
$
|
15,055
|
|
15,827
|
|
772
|
|
15,055
|
|
15,068
|
|
13
|
|
|||||
MARKET RISK RELATED TO INTEREST RATES
Our exposure to interest rate changes results from our significant holdings of fixed maturity investments, which comprised
92.9%
of our investment portfolio based on carrying value as of
June 30, 2019
. These investments are mainly exposed to changes in U.S. Treasury rates. Our fixed maturity investments include U.S. Government-sponsored enterprises, U.S. Government bonds, securities issued by government agencies, municipal bonds and corporate bonds.
To manage interest rate risk, we perform periodic projections of asset and liability cash flows to evaluate the potential sensitivity of our investments and liabilities. We assess interest rate sensitivity annually with respect to our available-for-sale fixed maturities investments using hypothetical test scenarios that assume either upward or downward shifts in the prevailing interest rates. The changes in fair values of our debt and equity securities as of
June 30, 2019
were within the expected range of this analysis.
Changes in interest rates typically have a sizable effect on the fair values of our debt and equity securities. The interest rate of the ten-year U.S. Treasury bond decreased to
2.00%
at
June 30, 2019
, from 2.69% at
December 31, 2018
. Net unrealized
gains
on fixed maturity securities totaled
$67.3 million
at
June 30, 2019
, compared to
$7.3 million
at
December 31, 2018
.
The fixed maturity securities portfolio is exposed to call risk, as a significant portion of the current bond holdings are callable. A decreasing interest rate environment can result in increased call activity, and an increasing rate environment will likely result in securities being paid at their stated maturity.
There are no fixed maturities or other investments classified as trading instruments. All of the Company's fixed maturities were held in available-for-sale at
June 30, 2019
. At
June 30, 2019
and
December 31, 2018
, we had no investments in derivative instruments, nor did we have any subprime or collateralized debt obligation risk.
June 30, 2019 Form 10-Q
53
MARKET RISK RELATED TO EQUITY PRICES
Changes in the level or volatility of equity prices affect the value of equity securities we hold as investments. Our equity investments portfolio represented
1.1%
of our total investments based upon carrying value at
June 30, 2019
, with
97.3%
invested in diversified equity and bond mutual funds. In light of our minimal ownership of equity investments, we believe that significant decreases in the equity markets would not have a material adverse impact on our total investment portfolio.
Item 4.
CONTROLS AND PROCEDURES
EVALUATION OF DISCLOSURE CONTROLS AND PROCEDURES
We maintain disclosure controls and procedures (as defined in Rules 13a-15(e) and 15d-15(e) under the Securities Exchange Act of 1934, as amended (the "Exchange Act")) that are designed to ensure that information required to be disclosed in our reports filed or submitted under the Exchange Act is recorded, processed, summarized and reported within the time periods specified in the SEC’s rules and forms, and that such information is accumulated and communicated to our management, including our principal executive officer and principal financial officer, to allow timely decisions regarding required disclosures.
Our management, including our principal executive officer and principal financial officer, evaluated the effectiveness of our disclosure controls and procedures pursuant to Rules 13a-15(e) and 15d-15(e) under the Exchange Act as of
June 30, 2019
. Based on such evaluation, our principal executive officer and principal financial officer concluded that our disclosure controls and procedures were not effective at a reasonable assurance level due to the material weakness in internal control over financial reporting that was reported in the Company's Annual Report on
Form 10-K
for the year ended December 31, 2018 ("2018 Annual Report"), which remains unremediated as of
June 30, 2019
.
CHANGES IN INTERNAL CONTROL OVER FINANCIAL REPORTING
During the
three
months ended
June 30, 2019
, there were no changes in the Company's internal control over financial reporting (as defined in rules 13a-15(f) and 15d-15(f) under the Exchange Act) that materially affected, or are reasonably likely to materially affect, our internal control over financial reporting.
REMEDIATION OF MATERIAL WEAKNESS
As previously described in Part II, Item 9A of our
2018 Annual Report
, we began implementing a remediation plan to address the material weakness in our internal control over financial reporting related to ineffectively designing and maintaining controls to analyze and account for significant and unusual transactions. The material weakness will not be considered remediated until management has designed and implemented internal controls to establish policies and procedures that clearly communicate expectations of personnel regarding significant and unusual transactions. We expect the newly designed and implemented controls to include, among other controls, the preparation and review of sufficiently detailed analysis to evaluate the accounting treatment for all potentially significant impacts of significant and unusual transactions on a timely basis, the engagement of relevant subject matter experts as necessary and the review to ensure advice is appropriately considered in the analysis and conclusions regarding the accounting treatment of significant and unusual transactions. We expect that the remediation of this material weakness will be completed by December 31, 2019.
PART II. OTHER INFORMATION
Item 1.
LEGAL PROCEEDINGS
There are no material pending legal proceedings in which we or any of our subsidiaries is a party or in which any of our or their property is the subject.
June 30, 2019 Form 10-Q
54
On November 7, 2018, Citizens, CICA Ltd. and CICA filed a lawsuit in the District Court of Travis County, Texas (the “District Court”) against (i) Randall Riley (“Riley”), a former Citizens executive and son of Citizens’ founder Harold E. Riley, (ii) Citizens American Life, LLC and Citizens American Life, Inc. (collectively, “CALI”), copycat companies formed by Riley and (iii) Alexis Enrique Delgado, Carlos Nalsen Landa, Enrique Pinzon Ruiz, Johan Emilio Mikuski Silva and Esperanza Peralta de Delgado (collectively, the “Los Raudales Defendants,” and together with Riley and CALI, collectively the “Defendants”), former independent consultants of Citizens, for unfair competition, misappropriation of Citizens’ trade secrets, tortious interference with Citizens’ existing contracts with its independent consultants and, with respect to the Los Raudales Defendants, breach of their independent consultant contracts with Citizens. The lawsuit sought (i) a declaration that Citizens had grounds to terminate the Los Raudales Defendants for cause under the independent consultant contracts and the Los Raudales Defendants are not entitled to future commissions under such contracts, (ii) injunctive relief, (iii) damages and (iv) attorneys’ fees and costs. Among other things, the suit alleges that Riley formed CALI and misappropriated trade secrets during the time he was employed by Citizens, in violation of his contractual and other duties to Citizens, and that the Los Raudales defendants breached their independent consultant contracts with Citizens by inducing or attempting to induce other independent consultants to terminate or reduce service to Citizens and disclosing confidential information.
On January 25, 2019, the Defendants filed a motion to dismiss certain claims alleged in the suit, and on April 11, 2019, the District Court denied the Defendants’ motion in its entirety. On May 29, 2019, Citizens, CICA Ltd. and CICA filed a motion for a preliminary injunction to bar the Defendants from continuing to engage in unfair competition and misappropriation of Citizens’ trade secrets and tortious interference with Citizens’ existing contracts with its independent consultants. A hearing for the preliminary injunction has been set for August 12, 2019. While it is not possible at this time to predict with any degree of certainty the ultimate outcome of this hearing or this litigation, Citizens believes it has a basis for an injunctive relief and intends to vigorously pursue its action against the Defendants and seek appropriate compensation and any other remedies to which it may be entitled.
From time to time, we may be subject to other legal and regulatory actions relating to our business. We may incur defense costs, including attorneys' fees, and other direct litigation costs associated with defending any claims. If we suffer an adverse judgment as a result of litigation claims, it could have a material adverse effect on our business, results of operations and financial condition.
Item 1A.
RISK FACTORS
There have been no material changes to the risk factors included in our Annual Report on
Form 10-K
for the year ended December 31, 2018 and in our Quarterly Report on
Form 10-Q for the quarter ended March 31, 2019
, except as discussed below.
CICA Ltd. is subject to extensive government regulation by the Bermuda Monetary Authority ("BMA") and the Ministry of Finance of Bermuda (“MOF”), which is a new regulatory regime for the Company. Failure to comply with regulation by the BMA and the MOF may increase our costs of doing business, restrict the conduct of our business and negatively impact our financial position or results of operations.
For over 40 years, the Company’s life insurance subsidiaries have been regulated in the U.S. by the state insurance departments of their states of domicile. CICA Ltd. was registered in Bermuda under the Bermuda Insurance Act 1978 (the "Insurance Act") as a Class E insurer in February 2018 and is now subject to the provisions of the Insurance Act and the rules and regulations promulgated thereunder. We have no prior experience operating in Bermuda and have limited experience with regulation by the BMA and the MOF, including complying with common reporting standard regulations imposed by the Organization for Economic Co-Operation and Development, administered by the MOF, the jurisdiction's competent authority. Failure to comply with laws and regulations in Bermuda could subject us to monetary penalties imposed by the BMA and the MOF, increased regulatory supervision, unanticipated costs associated with remedying such failure or other claims, harm to our reputation and interruption of our operations, which may have a material adverse impact on our financial position or results of operations.
June 30, 2019 Form 10-Q
55
We face a greater risk of money laundering activity associated with sales derived from residents of certain foreign countries
.
Some of our top international markets are in countries identified by the U.S. Department of State as jurisdictions of high risk for money laundering. As required by the U.S. Bank Secrecy Act ("BSA") regulations and the Bermuda Proceeds of Crime Act 1997 and the Proceeds of Crime Regulations 2008 applicable to insurance companies, we have developed and implemented an anti-money laundering, anti-terrorist financing and sanctions program (“AML/ATF and Sanctions Program”) that includes policies, procedures, controls, auditing, reporting and recordkeeping requirements for deterring, preventing and detecting potential money laundering, terrorist financing, fraud and other criminal activity in order to comply with U.S. and Bermuda laws. We have an enhanced AML/ATF and Sanctions Program with additional controls, such as watch-list screening software beyond sanctions screening required by the U.S. Office of Foreign Assets Control ("OFAC") and the Financial Sanctions Implementation Unit of Bermuda, enhanced payment due diligence and transaction controls. However, there can be no assurance that these enhanced controls will entirely mitigate money laundering risk associated with these jurisdictions.
Failures of disclosure controls and procedures and internal control over financial reporting could materially and adversely affect our business, financial condition and results of operations, impair our ability to timely file reports with the SEC and subject us to litigation and/or regulatory scrutiny and penalties.
We maintain disclosure controls and procedures designed to ensure that we timely report information as specified in SEC rules and regulations. We also maintain a system of internal control over financial reporting. However, these controls may not achieve, and in some cases have not achieved, their intended objectives. Control processes that involve human diligence and oversight, such as our disclosure controls and procedures and internal control over financial reporting, are subject to human error. Controls that rely on models may be subject to inadequate design or inaccurate assumptions or estimates. Controls also can be circumvented by improper management override of such controls. Because of such limitations, there are risks that material misstatements due to error or fraud may not be prevented or detected, and that information may not be reported on a timely basis. The failure of our controls to be effective could have a material adverse effect on our business, financial condition, results of operations and the market for our common stock, and could subject us to litigation, regulatory scrutiny and/or penalties.
As disclosed in Part II, Item 9A of our Annual Report on
Form 10-K
for the year ended December 31, 2018, we have identified a deficiency in our internal control over financial reporting that constitutes a material weakness and for which remediation is still in process as of June 30, 2019. If we fail to design effective controls, remediate control deficiencies or otherwise maintain effective internal control over financial reporting in the future, such failures could result in a material misstatement of our annual or quarterly financial statements that would not be prevented or detected on a timely basis and which could cause investors to lose confidence in our financial statements, have a negative effect on the trading price of our common stock, limit our ability to obtain financing if needed or increase the cost of any financing we may obtain. In addition, these failures may negatively impact our business, financial condition and results of operations, impair our ability to timely file our periodic reports with the SEC, subject us to litigation and regulatory scrutiny and cause us to incur substantial additional costs in future periods relating to the implementation of remedial measures.
Changes in accounting standards may adversely affect our reported results of operations and financial condition.
Our financial statements are subject to the application of GAAP in the U.S. and in Bermuda which are periodically revised and/or expanded. Accordingly, we are required to adopt new or revised accounting standards issued by recognized authoritative bodies, including the FASB, the BMA and the NAIC. Future accounting standards we adopt will change current accounting and disclosure requirements applicable to our financial statements. Such changes may have a material effect on our reported results of operations or financial condition. In addition, the required adoption of new accounting standards may result in significant incremental costs associated with initial implementation and ongoing compliance. We are still evaluating new accounting guidance (that is not yet effective for us) related to long-duration insurance contracts and the impact this guidance will have on our consolidated financial statements. Such guidance could result in increased earnings volatility and have a material impact on our reported results of operations
June 30, 2019 Form 10-Q
56
or financial condition. See
Note 1
of the notes to our consolidated financial statements contained herein for additional information regarding accounting updates.
Item 2.
UNREGISTERED SALES OF EQUITY SECURITIES AND USE OF PROCEEDS
None.
Item 3
.
DEFAULTS UPON SENIOR SECURITIES
Not applicable.
Item 4.
MINE SAFETY DISCLOSURES
Not applicable.
Item 5.
OTHER INFORMATION
None.
June 30, 2019 Form 10-Q
57
Item 6.
EXHIBITS
|
Exhibit
Number
|
The following exhibits are filed herewith:
|
|
|
101.INS
|
XBRL Instance Document*
|
|
|
101.SCH
|
XBRL Taxonomy Extension Schema*
|
|
|
101.CAL
|
XBRL Taxonomy Extension Calculation Linkbase*
|
|
|
101.DEF
|
XBRL Taxonomy Extension Definition Linkbase*
|
|
|
101.LAB
|
XBRL Taxonomy Extension Label Linkbase*
|
|
|
101.PRE
|
XBRL Taxonomy Extension Presentation Linkbase*
|
|
*
Filed herewith.
June 30, 2019 Form 10-Q
58
SIGNATURES
Pursuant to the requirements of the Securities Exchange Act of 1934, the Registrant has duly caused this report to be signed on its behalf by the undersigned thereunto duly authorized.
|
|
CITIZENS, INC.
|
||
|
|
|
||
|
|
|
|
|
|
|
By:
|
/s/ Geoffrey M. Kolander
|
|
|
|
|
Geoffrey M. Kolander
|
|
|
|
|
President and Chief Executive Officer
|
|
|
By:
|
/s/ Jeffery P. Conklin
|
||
|
|
Jeffery P. Conklin
|
||
|
Vice President, Interim Chief Financial Officer,
|
|||
|
|
|
Interim Chief Investment Officer, Chief Accounting
|
|
|
|
|
Officer and Treasurer
|
|
|
|
|
|
|
|
Date:
|
August 7, 2019
|
|
|
June 30, 2019 Form 10-Q
59
TABLE OF CONTENTS
Part I. Financial InformationItem 1. Financial StatementsItem 2. Management's Discussion and Analysis Of Financial Condition and Results Of OperationsItem 3. Quantitative and Qualitative Disclosures About Market RiskItem 4. Controls and ProceduresPart II. Other InformationItem 1. Legal ProceedingsItem 1A. Risk FactorsItem 2. Unregistered Sales Of Equity Securities and Use Of ProceedsItem 3. Defaults Upon Senior SecuritiesItem 4. Mine Safety DisclosuresItem 5. Other InformationItem 6. Exhibits