CITIZENS, INC.
10-Ks and 10-Qs
|
|
|
|
|
|
|
|
|
|
|
|
|
|
|
|
|
|
|
|
|
|
|
|
|
|
|
|
|
|
|
|
|
|
|
|
|
|
|
|
|
|
|
|
|
|
|
|
|
|
|
|
|
|
|
|
|
|
|
UNITED STATES
SECURITIES AND EXCHANGE COMMISSION
WASHINGTON, D.C. 20549
FORM
10-Q
For the Quarterly Period Ended
June 30, 2021
OR
For the Transition Period from to
COMMISSION FILE NUMBER:
000-16509

|
|
||
| (Exact name of registrant as specified in its charter) | ||
|
|
|
||||
| (State or other jurisdiction of incorporation or organization) | (I.R.S. Employer Identification No.) | ||||
(Current Address)
Registrant's telephone number, including area code:
(
512
)
837-7100
| Securities registered pursuant to Section 12(b) of the Act | ||||||||
|
|
|
|
||||||
| (Title of each class) | (Trading symbol(s)) | (Name of each exchange on which registered) | ||||||
Indicate by check mark whether the registrant: (1) has filed all reports required to be filed by Section 13 or 15(d) of the Securities Exchange Act of 1934 during the preceding 12 months (or for such shorter period that the registrant was required to file such reports), and (2) has been subject to such filing requirements for the past 90 days.
x
Yes
o
No
Indicate by check mark whether the registrant has submitted electronically every Interactive Data File required to be submitted pursuant to Rule 405 of Regulation S-T (§232.405 of this chapter) during the preceding 12 months (or for such shorter period that the registrant was required to submit such files).
x
Yes
o
No
Indicate by check mark whether the registrant is a large accelerated filer, an accelerated filer, a non-accelerated filer, a smaller reporting company or an emerging growth company. See the definitions of "large accelerated filer," "accelerated filer," "smaller reporting company" and "emerging growth company" in Rule 12b-2 of the Exchange Act:
| Large accelerated filer | ☐ |
|
☒ | Emerging growth company |
|
||||||||||||||||||
| Non-accelerated filer | ☐ | Smaller reporting company |
|
||||||||||||||||||||
If an emerging growth company, indicate by check mark if the registrant has elected not to use the extended transition period for complying with any new or revised financial accounting standards provided pursuant to Section 13(a) of the Exchange Act.
o
Indicate by check mark whether the registrant is a shell company (as defined in Rule 12b-2 of the Exchange Act).
☐
Yes
x
No
As of July 30, 2021, the Registrant had
49,630,099
shares of Class A common stock outstanding and
0
shares of Class B common stock outstanding.
THIS PAGE INTENTIONALLY LEFT BLANK

TABLE OF CONTENTS
| Page Number | |||||||||||
| Part I. FINANCIAL INFORMATION | |||||||||||
| Item 1. | |||||||||||
| Item 2. | |||||||||||
| Item 3. | |||||||||||
| Item 4. | |||||||||||
| Part II. OTHER INFORMATION | |||||||||||
| Item 1. | |||||||||||
| Item 1A. | |||||||||||
| Item 2. | |||||||||||
| Item 3. | |||||||||||
| Item 4. | |||||||||||
| Item 5. | |||||||||||
| Item 6. | |||||||||||
June 30, 2021 | 10-Q 1
PART I. FINANCIAL INFORMATION
Item 1.
FINANCIAL STATEMENTS
CITIZENS, INC. AND CONSOLIDATED SUBSIDIARIES
Consolidated Balance Sheets
| (In thousands) | June 30, 2021 | December 31, 2020 | |||||||||
| Assets | (Unaudited) | ||||||||||
| Investments: | |||||||||||
|
Fixed maturity securities available-for-sale, at fair value (amortized cost: $
|
$ |
|
|
||||||||
| Equity securities, at fair value |
|
|
|||||||||
| Policy loans |
|
|
|||||||||
| Real estate held-for-sale |
|
|
|||||||||
|
Other long-term investments (portion measured at fair value $
|
|
|
|||||||||
| Total investments |
|
|
|||||||||
| Cash and cash equivalents |
|
|
|||||||||
| Accrued investment income |
|
|
|||||||||
| Reinsurance recoverable |
|
|
|||||||||
| Deferred policy acquisition costs |
|
|
|||||||||
| Cost of insurance acquired |
|
|
|||||||||
| Goodwill and other intangible assets |
|
|
|||||||||
| Property and equipment, net |
|
|
|||||||||
| Due premiums |
|
|
|||||||||
|
Other assets (less allowance for losses of $
|
|
|
|||||||||
| Total assets | $ |
|
|
||||||||
See accompanying Notes to Consolidated Financial Statements.
June 30, 2021 | 10-Q 2
CITIZENS, INC. AND CONSOLIDATED SUBSIDIARIES
Consolidated Balance Sheets, Continued
| (In thousands, except share amounts) | June 30, 2021 | December 31, 2020 | |||||||||
| Liabilities and Stockholders' Equity | (Unaudited) | ||||||||||
| Liabilities: | |||||||||||
| Policy liabilities: | |||||||||||
| Future policy benefit reserves: | |||||||||||
| Life insurance | $ |
|
|
||||||||
| Annuities |
|
|
|||||||||
| Accident and health |
|
|
|||||||||
| Dividend accumulations |
|
|
|||||||||
| Premiums paid in advance |
|
|
|||||||||
| Policy claims payable |
|
|
|||||||||
| Other policyholders' funds |
|
|
|||||||||
| Total policy liabilities |
|
|
|||||||||
| Commissions payable |
|
|
|||||||||
| Current federal income tax payable |
|
|
|||||||||
| Deferred federal income tax payable |
|
|
|||||||||
| Payable for securities in process of settlement |
|
|
|||||||||
| Other liabilities |
|
|
|||||||||
| Total liabilities |
|
|
|||||||||
|
|
|
||||||||||
| Stockholders' Equity: | |||||||||||
| Common stock: | |||||||||||
|
Class A,
|
|
|
|||||||||
|
Class B,
|
|
|
|||||||||
| Accumulated deficit |
(
|
(
|
|||||||||
| Accumulated other comprehensive income: | |||||||||||
| Net unrealized gains (losses) on fixed maturity securities, net of tax |
|
|
|||||||||
| Treasury stock, at cost |
(
|
(
|
|||||||||
| Total stockholders' equity |
|
|
|||||||||
| Total liabilities and stockholders' equity | $ |
|
|
||||||||
See accompanying Notes to Consolidated Financial Statements.
June 30, 2021 | 10-Q 3
CITIZENS, INC. AND CONSOLIDATED SUBSIDIARIES
Consolidated Statements of Operations and Comprehensive Income (Loss)
(Unaudited)
| Three Months Ended June 30, | Six Months Ended June 30, | ||||||||||||||||||||||
|
(In thousands, except per share amounts)
|
2021 | 2020 | 2021 | 2020 | |||||||||||||||||||
| Revenues: | |||||||||||||||||||||||
| Premiums: | |||||||||||||||||||||||
| Life insurance | $ |
|
|
|
|
||||||||||||||||||
| Accident and health insurance |
|
|
|
|
|||||||||||||||||||
| Property insurance |
|
|
|
|
|||||||||||||||||||
| Net investment income |
|
|
|
|
|||||||||||||||||||
| Realized investment gains (losses), net |
|
|
|
|
|||||||||||||||||||
| Other income |
|
|
|
|
|||||||||||||||||||
| Total revenues |
|
|
|
|
|||||||||||||||||||
| Benefits and Expenses: | |||||||||||||||||||||||
| Insurance benefits paid or provided: | |||||||||||||||||||||||
| Claims and surrenders |
|
|
|
|
|||||||||||||||||||
| Increase in future policy benefit reserves |
|
|
|
|
|||||||||||||||||||
| Policyholders' dividends |
|
|
|
|
|||||||||||||||||||
| Total insurance benefits paid or provided |
|
|
|
|
|||||||||||||||||||
| Commissions |
|
|
|
|
|||||||||||||||||||
| Other general expenses |
|
|
|
|
|||||||||||||||||||
| Capitalization of deferred policy acquisition costs |
(
|
(
|
(
|
(
|
|||||||||||||||||||
| Amortization of deferred policy acquisition costs |
|
|
|
|
|||||||||||||||||||
| Amortization of cost of insurance acquired |
|
|
|
|
|||||||||||||||||||
| Total benefits and expenses |
|
|
|
|
|||||||||||||||||||
| Income (loss) before federal income tax |
|
|
|
(
|
|||||||||||||||||||
| Federal income tax expense (benefit) |
|
|
|
|
|||||||||||||||||||
| Net income (loss) |
|
(
|
|
(
|
|||||||||||||||||||
| Per Share Amounts: | |||||||||||||||||||||||
| Basic and diluted earnings (losses) per share of Class A common stock |
|
(
|
|
(
|
|||||||||||||||||||
| Basic and diluted earnings (losses) per share of Class B common stock |
|
(
|
|
(
|
|||||||||||||||||||
| Other Comprehensive Income (Loss): | |||||||||||||||||||||||
| Unrealized gains (losses) on fixed maturity securities: | |||||||||||||||||||||||
| Unrealized holding gains (losses) arising during period |
|
|
(
|
|
|||||||||||||||||||
| Reclassification adjustment for losses (gains) included in net income (loss) |
|
(
|
|
|
|||||||||||||||||||
| Unrealized gains (losses) on fixed maturity securities, net |
|
|
(
|
|
|||||||||||||||||||
| Income tax expense (benefit) on unrealized gains (losses) on fixed maturity securities |
(
|
|
|
|
|||||||||||||||||||
| Other comprehensive income (loss) |
|
|
(
|
|
|||||||||||||||||||
| Total comprehensive income (loss) | $ |
|
|
(
|
|
||||||||||||||||||
See accompanying Notes to Consolidated Financial Statements.
June 30, 2021 | 10-Q 4
CITIZENS, INC. AND CONSOLIDATED SUBSIDIARIES
Consolidated Statements of Stockholders' Equity
(Unaudited)
| Common Stock |
Accumulated
deficit |
Accumulated other
comprehensive income (loss) |
Treasury
stock |
Total
Stock-holders' equity |
|||||||||||||||||||||||||||||||
| (In thousands) | Class A | Class B | |||||||||||||||||||||||||||||||||
| Balance at December 31, 2020 | $ |
|
|
(
|
|
(
|
|
||||||||||||||||||||||||||||
| Comprehensive income (loss): | |||||||||||||||||||||||||||||||||||
| Net income (loss) |
|
|
(
|
|
|
(
|
|||||||||||||||||||||||||||||
| Unrealized investment gains (losses), net |
|
|
|
(
|
|
(
|
|||||||||||||||||||||||||||||
| Total comprehensive income (loss) |
|
|
(
|
(
|
|
(
|
|||||||||||||||||||||||||||||
| Stock-based compensation |
(
|
|
|
|
|
(
|
|||||||||||||||||||||||||||||
| Balance at March 31, 2021 |
|
|
(
|
|
(
|
|
|||||||||||||||||||||||||||||
| Comprehensive income (loss): | |||||||||||||||||||||||||||||||||||
| Net income (loss) |
|
|
|
|
|
|
|||||||||||||||||||||||||||||
| Unrealized investment gains (losses), net |
|
|
|
|
|
|
|||||||||||||||||||||||||||||
| Total comprehensive income (loss) |
|
|
|
|
|
|
|||||||||||||||||||||||||||||
| Acquisition of treasury stock |
|
|
|
|
(
|
(
|
|||||||||||||||||||||||||||||
| Stock-based compensation |
|
|
|
|
|
|
|||||||||||||||||||||||||||||
| Balance at June 30, 2021 | $ |
|
|
(
|
|
(
|
|
||||||||||||||||||||||||||||
| Balance at December 31, 2019 | $ |
|
|
(
|
|
(
|
|
||||||||||||||||||||||||||||
| Accounting standards adopted January 1, 2020 |
|
|
(
|
|
|
(
|
|||||||||||||||||||||||||||||
| Comprehensive income (loss): | |||||||||||||||||||||||||||||||||||
| Net income (loss) |
|
|
(
|
|
|
(
|
|||||||||||||||||||||||||||||
| Unrealized investment gains (losses), net |
|
|
|
(
|
|
(
|
|||||||||||||||||||||||||||||
| Total comprehensive income (loss) |
|
|
(
|
(
|
|
(
|
|||||||||||||||||||||||||||||
| Stock-based compensation |
(
|
|
|
|
|
(
|
|||||||||||||||||||||||||||||
| Balance at March 31, 2020 |
|
|
(
|
|
(
|
|
|||||||||||||||||||||||||||||
| Comprehensive income (loss): | |||||||||||||||||||||||||||||||||||
| Net income (loss) |
|
|
(
|
|
|
(
|
|||||||||||||||||||||||||||||
| Unrealized investment gains (losses), net |
|
|
|
|
|
|
|||||||||||||||||||||||||||||
| Total comprehensive income (loss) |
|
|
(
|
|
|
|
|||||||||||||||||||||||||||||
| Stock-based compensation |
|
|
|
|
|
|
|||||||||||||||||||||||||||||
| Balance at June 30, 2020 | $ |
|
|
(
|
|
(
|
|
||||||||||||||||||||||||||||
See accompanying Notes to Consolidated Financial Statements.
June 30, 2021 | 10-Q 5
CITIZENS, INC. AND CONSOLIDATED SUBSIDIARIES
Consolidated Statements of Cash Flows
(Unaudited)
|
Six Months Ended June 30,
(In thousands)
|
2021 | 2020 | |||||||||
| Cash flows from operating activities: | |||||||||||
| Net income (loss) | $ |
|
(
|
||||||||
| Adjustments to reconcile net income (loss) to net cash provided by operating activities: | |||||||||||
| Realized investment (gains) losses on sale of investments and other assets |
(
|
(
|
|||||||||
| Net deferred policy acquisition costs |
|
|
|||||||||
| Amortization of cost of insurance acquired |
|
|
|||||||||
| Depreciation |
|
|
|||||||||
| Amortization of premiums and discounts on investments |
|
|
|||||||||
| Stock-based compensation |
|
|
|||||||||
| Deferred federal income tax expense (benefit) |
(
|
(
|
|||||||||
| Change in: | |||||||||||
| Accrued investment income |
(
|
|
|||||||||
| Reinsurance recoverable |
|
|
|||||||||
| Due premiums |
|
|
|||||||||
| Future policy benefit reserves |
|
|
|||||||||
| Other policyholders' liabilities |
|
|
|||||||||
| Federal income tax payable |
|
|
|||||||||
| Commissions payable and other liabilities |
(
|
(
|
|||||||||
| Other, net |
(
|
(
|
|||||||||
| Net cash provided by (used in) operating activities |
|
|
|||||||||
| Cash flows from investing activities: | |||||||||||
| Purchases of fixed maturity securities, available-for-sale |
(
|
(
|
|||||||||
| Sales of fixed maturity securities, available-for-sale |
|
|
|||||||||
| Maturities and calls of fixed maturity securities, available-for-sale |
|
|
|||||||||
| Purchases of equity securities |
|
(
|
|||||||||
| Principal payments on mortgage loans |
|
|
|||||||||
| (Increase) decrease in policy loans, net |
|
(
|
|||||||||
| Sales of other long-term investments and real estate |
|
|
|||||||||
| Purchases of other long-term investments |
(
|
(
|
|||||||||
| Purchases of property and equipment |
(
|
(
|
|||||||||
| Maturities of short-term investments |
|
|
|||||||||
| Net cash provided by (used in) investing activities |
(
|
(
|
|||||||||
| See accompanying Notes to Consolidated Financial Statements. | |||||||||||
June 30, 2021 | 10-Q 6
| CITIZENS, INC. AND CONSOLIDATED SUBSIDIARIES | |||||||||||
| Consolidated Statements of Cash Flows, Continued | |||||||||||
| (Unaudited) | |||||||||||
|
Six Months Ended June 30,
(In thousands)
|
2021 | 2020 | |||||||||
| Cash flows from financing activities: | |||||||||||
| Annuity deposits | $ |
|
|
||||||||
| Annuity withdrawals |
(
|
(
|
|||||||||
| Acquisition of treasury stock |
(
|
|
|||||||||
| Other |
(
|
(
|
|||||||||
| Net cash provided by (used in) financing activities |
(
|
|
|||||||||
| Net increase (decrease) in cash and cash equivalents |
(
|
|
|||||||||
| Cash and cash equivalents at beginning of year |
|
|
|||||||||
| Cash and cash equivalents at end of period | $ |
|
|
||||||||
SUPPLEMENTAL DISCLOSURES OF NONCASH INVESTING AND FINANCING ACTIVITIES:
During the six months ended June 30, 2021 and 2020, various fixed maturity issuers exchanged securities with book values of $
6.4
million and $
3.1
million, respectively, for securities of equal value.
The Company had $
0.9
million net unsettled security trades at June 30, 2021 and $
1.8
million at June 30, 2020.
The Company recognized right-of-use assets of $
12.0
million in exchange for new operating lease liabilities during the six months ended June 30, 2020.
None
were recognized during the six months ended June 30, 2021.
See accompanying Notes to Consolidated Financial Statements.
June 30, 2021 | 10-Q 7
(1)
FINANCIAL STATEMENTS
BASIS OF PRESENTATION AND CONSOLIDATION
The consolidated financial statements include the accounts and operations of Citizens, Inc. ("Citizens" or the "Company"), a Colorado corporation, and its wholly-owned subsidiaries, CICA Life Insurance Company of America ("CICA"), CICA Life Ltd. ("CICA Ltd."), Citizens National Life Insurance Company ("CNLIC"), Security Plan Life Insurance Company ("SPLIC"), Security Plan Fire Insurance Company ("SPFIC"), Magnolia Guaranty Life Insurance Company ("MGLIC") and Computing Technology, Inc. ("CTI"). All significant inter-company accounts and transactions have been eliminated. Citizens and its wholly-owned subsidiaries are collectively referred to as the "Company", "we", "us" or "our".
The consolidated balance sheet as of June 30, 2021, the consolidated statements of operations and comprehensive income (loss) and stockholders' equity for the three and six months ended June 30, 2021 and June 30, 2020 and the consolidated statements of cash flows for the six months ended June 30, 2021 and June 30, 2020 have been prepared by the Company without audit and are not subject to audit. In the opinion of management, all normal and recurring adjustments to present fairly the financial position, results of operations, and changes in cash flows at June 30, 2021 and for comparative periods have been made. The consolidated financial statements have been prepared in accordance with U.S. generally accepted accounting principles ("U.S. GAAP") for interim financial information and with the instructions to Form 10-Q adopted by the Securities and Exchange Commission ("SEC"). Accordingly, the consolidated financial statements do not include all the information and footnotes required for complete financial statements and should be read in conjunction with the Company’s consolidated financial statements and notes thereto included in our Annual Report on
Form 10-K
for the year ended December 31, 2020 ("Form 10-K"). Operating results for the interim periods disclosed herein are not necessarily indicative of the results that may be expected for a full year or any future period.
Our Life Insurance segment operates through CICA Ltd., CICA and CNLIC. Our international life insurance business, which operates through CICA Ltd., issues U.S. dollar-denominated endowment contracts internationally, which are principally accumulation contracts that incorporate an element of life insurance protection and ordinary whole life insurance in U.S. dollar-denominated amounts sold to non-U.S. residents. These contracts are designed to provide a fixed amount of insurance coverage over the life of the insured and may utilize rider benefits to provide additional increasing or decreasing coverage and annuity benefits to enhance accumulations. Our domestic life insurance business, which operates through CICA and CNLIC, primarily focused on living needs and provided benefits toward accumulating financial benefits for the policyowners throughout the Midwest and southern U.S. until they ceased most domestic sales beginning January 1, 2017. We have recently developed a whole life insurance product and have begun selling this product in Florida in 2021.
Our Home Service Insurance segment operates through our subsidiaries SPLIC, MGLIC and SPFIC, and focuses on the life insurance needs of the middle- and lower-income markets, primarily in Louisiana, Mississippi and Arkansas. Our products in this segment consist primarily of small face amount ordinary whole life, industrial life and pre-need policies, which are designed to fund final expenses for the insured, primarily consisting of funeral and burial costs as well as limited liability, named peril property policies covering dwelling and contents.
CTI provides data processing systems and services to the Company.
We converted the small block of ordinary whole life policies of CNLIC from a legacy platform to our new actuarial valuation software solution which provides enhanced modeling capabilities as of April 1, 2021. The impact of this system conversion reflected in the accompanying consolidated financial statements as of and for the three and six months ended June 30, 2021 was an increase to pretax income of $
0.7
million consisting of a reduced increase in future policy benefit reserves of $
0.8
million and increased amortization of deferred policy acquisition costs of $
0.1
million.
June 30, 2021 | 10-Q 8
USE OF ESTIMATES
The preparation of consolidated financial statements in conformity with U.S. GAAP requires management to make estimates and assumptions that affect the reported amounts of assets and liabilities and the disclosure of contingent assets and liabilities at the date of the consolidated financial statements and the reported amounts of revenues and expenses during the reporting period. Actual results could differ from those estimates.
Significant estimates include those used in the evaluation of credit allowances on fixed maturity securities, actuarially determined assets and liabilities and assumptions, tests of goodwill impairment and valuation allowance on deferred tax assets. Certain of these estimates are particularly sensitive to market conditions, and deterioration and/or volatility in the worldwide debt or equity markets could have a material impact on the consolidated financial statements.
SIGNIFICANT ACCOUNTING POLICIES
For a description of our significant accounting policies, see Part IV, Item 15, Note 1. Summary of Significant Accounting Policies in the notes to our consolidated financial statements included in our
Form 10-K
, which should be read in conjunction with these accompanying consolidated financial statements.
(2)
ACCOUNTING PRONOUNCEMENTS
ACCOUNTING STANDARDS RECENTLY ADOPTED
In June 2016, the Financial Accounting Standards Board ("FASB") issued Accounting Standards Update ("ASU") No. 2016-13, Financial Instruments-Credit Losses (Topic 326), with the main objective to provide financial statement users with more decision-useful information about the expected credit losses on financial instruments and other commitments to extend credit held by a reporting entity at each reporting date. The ASU requires a financial asset (or a group of financial assets) measured at amortized cost to be presented at the net amount expected to be collected. The allowance for credit losses is a valuation account that is deducted from the amortized cost of the financial asset(s) to present the net carrying value at the amount expected to be collected on the financial asset. The income statement reflects the measurement of credit losses for newly recognized financial assets, as well as the increases or decreases of expected credit losses that have taken place during the period. Credit losses on available-for-sale ("AFS") fixed maturity securities should be measured in a manner similar to current U.S. GAAP; however, the credit losses are recorded through an allowance for credit losses rather than as a write-down. This approach is an improvement to prior U.S. GAAP because an entity will be able to record reversals of credit losses (in situations in which the estimate of credit losses declines) in current period net income, which in turn should align the income statement recognition of credit losses with the reporting period in which changes occur. Prior U.S. GAAP prohibited reflecting those improvements in current-period earnings. The Company adopted this standard effective January 1, 2020 using the modified retrospective approach. The adoption resulted in an increase in accumulated deficit of $
0.4
million related to agents' debit balance collectability.
June 30, 2021 | 10-Q 9
ACCOUNTING STANDARDS NOT YET ADOPTED
In August 2018, the FASB issued ASU No. 2018-12,
Financial Services-Insurance (Topic 944): Targeted Improvements to the Accounting for Long-Duration Contracts.
This ASU amends four key areas of the accounting and impacts disclosures for long-duration insurance and investment contracts:
•
Requires updated assumptions for liability measurement.
Assumptions used to measure the liability for traditional insurance contracts, which are typically determined at contract inception, will now be reviewed at least annually, and, if there is a change, updated, with the effect recorded in net income;
•
Standardizes the liability discount rate.
The liability discount rate will be a market-observable discount rate (upper-medium grade fixed-income instrument yield), with the effect of rate changes recorded in other comprehensive income;
•
Provides greater consistency in measurement of market risk benefits.
The two previous measurement models have been reduced to one measurement model (fair value), resulting in greater uniformity across similar market-based benefits and better alignment with the fair value measurement of derivatives used to hedge capital market risk;
•
Simplifies amortization of deferred acquisition costs ("DAC").
Previous earnings-based amortization methods have been replaced with a more level amortization basis; and
•
Requires enhanced disclosures.
The new disclosures include rollforwards and information about significant assumptions and the effects of changes in those assumptions.
For calendar-year public companies, the changes will be effective on January 1, 2023, however, early adoption is permitted. The Company is evaluating the impact of this new guidance, and it is expected to have a material impact on our consolidated financial statements.
No other new accounting pronouncement issued or effective during the year had, or is expected to have, a material impact on our consolidated financial statements.
(3)
SEGMENT INFORMATION
The Company has
two
reportable segments: Life Insurance and Home Service Insurance.
Our Life Insurance segment primarily issues endowment contracts, which are principally accumulation contracts that incorporate an element of life insurance protection and ordinary whole life insurance, to non-U.S. residents through CICA Ltd. These contracts are designed to provide a fixed amount of insurance coverage over the life of the insured and may utilize rider benefits to provide additional coverage and annuity benefits to enhance accumulations. CICA and CNLIC issued ordinary whole life, credit life and disability and accident and health related policies, throughout the Midwest and southern U.S. until they ceased most domestic sales beginning January 1, 2017. We restarted marketing domestically in Florida in 2021.
Our domestic Home Service Insurance segment operates through our subsidiaries SPLIC, MGLIC and SPFIC, and focuses on the life insurance needs of the middle- and lower-income markets, primarily in Louisiana, Mississippi and Arkansas. Our policies are sold and serviced through funeral homes and independent agents who sell policies, collect premiums and service policyholders. To a lesser extent, our Home Service Insurance segment sells limited liability, named peril property policies covering dwelling and contents.
The Company also operates other non-insurance portions of the Company ("Other Non-Insurance Enterprises"), which primarily include the Company’s IT and Corporate-support functions that are included in the tables presented.
The Company's Other Non-Insurance Enterprises are the only reportable difference between segments and consolidated operations.
June 30, 2021 | 10-Q 10
The accounting policies of the reportable segments and Other Non-Insurance Enterprises are presented in accordance with U.S. GAAP and are the same as those used in the preparation of the consolidated financial statements.
The Company evaluates profit and loss performance based on U.S. GAAP income before federal income taxes for its
two
reportable segments.
| Life Insurance | Home Service Insurance | Other Non-Insurance Enterprises | Consolidated | ||||||||||||||||||||
| Three Months Ended June 30, 2021 | |||||||||||||||||||||||
| (In thousands) | |||||||||||||||||||||||
| Revenues: | |||||||||||||||||||||||
| Premiums | $ |
|
|
|
|
||||||||||||||||||
| Net investment income |
|
|
|
|
|||||||||||||||||||
| Realized investment gains (losses), net |
|
|
|
|
|||||||||||||||||||
| Other income |
|
|
|
|
|||||||||||||||||||
| Total revenues |
|
|
|
|
|||||||||||||||||||
| Benefits and expenses: | |||||||||||||||||||||||
| Insurance benefits paid or provided: | |||||||||||||||||||||||
| Claims and surrenders |
|
|
|
|
|||||||||||||||||||
| Increase in future policy benefit reserves |
|
|
|
|
|||||||||||||||||||
| Policyholders' dividends |
|
|
|
|
|||||||||||||||||||
| Total insurance benefits paid or provided |
|
|
|
|
|||||||||||||||||||
| Commissions |
|
|
|
|
|||||||||||||||||||
| Other general expenses |
|
|
|
|
|||||||||||||||||||
| Capitalization of deferred policy acquisition costs |
(
|
(
|
|
(
|
|||||||||||||||||||
| Amortization of deferred policy acquisition costs |
|
|
|
|
|||||||||||||||||||
| Amortization of cost of insurance acquired |
|
|
|
|
|||||||||||||||||||
| Total benefits and expenses |
|
|
|
|
|||||||||||||||||||
| Income (loss) before federal income tax expense | $ |
|
|
(
|
|
||||||||||||||||||
June 30, 2021 | 10-Q 11
| Life Insurance | Home Service Insurance | Other Non-Insurance Enterprises | Consolidated | ||||||||||||||||||||
| Six Months Ended June 30, 2021 | |||||||||||||||||||||||
| (In thousands) | |||||||||||||||||||||||
| Revenues: | |||||||||||||||||||||||
| Premiums | $ |
|
|
|
|
||||||||||||||||||
| Net investment income |
|
|
|
|
|||||||||||||||||||
| Realized investment gains, net |
|
|
|
|
|||||||||||||||||||
| Other income |
|
|
|
|
|||||||||||||||||||
| Total revenues |
|
|
|
|
|||||||||||||||||||
| Benefits and expenses: | |||||||||||||||||||||||
| Insurance benefits paid or provided: | |||||||||||||||||||||||
| Claims and surrenders |
|
|
|
|
|||||||||||||||||||
| Increase in future policy benefit reserves |
|
|
|
|
|||||||||||||||||||
| Policyholders' dividends |
|
|
|
|
|||||||||||||||||||
| Total insurance benefits paid or provided |
|
|
|
|
|||||||||||||||||||
| Commissions |
|
|
|
|
|||||||||||||||||||
| Other general expenses |
|
|
|
|
|||||||||||||||||||
| Capitalization of deferred policy acquisition costs |
(
|
(
|
|
(
|
|||||||||||||||||||
| Amortization of deferred policy acquisition costs |
|
|
|
|
|||||||||||||||||||
| Amortization of cost of insurance acquired |
|
|
|
|
|||||||||||||||||||
| Total benefits and expenses |
|
|
|
|
|||||||||||||||||||
| Income (loss) before federal income tax expense | $ |
|
(
|
(
|
|
||||||||||||||||||
June 30, 2021 | 10-Q 12
| Life Insurance | Home Service Insurance | Other Non-Insurance Enterprises | Consolidated | ||||||||||||||||||||
| Three Months Ended June 30, 2020 | |||||||||||||||||||||||
| (In thousands) | |||||||||||||||||||||||
| Revenues: | |||||||||||||||||||||||
| Premiums | $ |
|
|
|
|
||||||||||||||||||
| Net investment income |
|
|
|
|
|||||||||||||||||||
| Realized investment gains (losses), net |
|
|
|
|
|||||||||||||||||||
| Other income |
|
|
|
|
|||||||||||||||||||
| Total revenues |
|
|
|
|
|||||||||||||||||||
| Benefits and expenses: | |||||||||||||||||||||||
| Insurance benefits paid or provided: | |||||||||||||||||||||||
| Claims and surrenders |
|
|
|
|
|||||||||||||||||||
| Increase in future policy benefit reserves |
|
|
|
|
|||||||||||||||||||
| Policyholders' dividends |
|
|
|
|
|||||||||||||||||||
| Total insurance benefits paid or provided |
|
|
|
|
|||||||||||||||||||
| Commissions |
|
|
|
|
|||||||||||||||||||
| Other general expenses |
|
|
|
|
|||||||||||||||||||
| Capitalization of deferred policy acquisition costs |
(
|
(
|
|
(
|
|||||||||||||||||||
| Amortization of deferred policy acquisition costs |
|
|
|
|
|||||||||||||||||||
| Amortization of cost of insurance acquired |
|
|
|
|
|||||||||||||||||||
| Total benefits and expenses |
|
|
|
|
|||||||||||||||||||
| Income (loss) before federal income tax expense | $ |
|
(
|
(
|
|
||||||||||||||||||
June 30, 2021 | 10-Q 13
| Life Insurance | Home Service Insurance | Other Non-Insurance Enterprises | Consolidated | ||||||||||||||||||||
| Six Months Ended June 30, 2020 | |||||||||||||||||||||||
| (In thousands) | |||||||||||||||||||||||
| Revenues: | |||||||||||||||||||||||
| Premiums | $ |
|
|
|
|
||||||||||||||||||
| Net investment income |
|
|
|
|
|||||||||||||||||||
| Realized investment gains (losses), net |
|
(
|
(
|
|
|||||||||||||||||||
| Other income |
|
|
|
|
|||||||||||||||||||
| Total revenues |
|
|
|
|
|||||||||||||||||||
| Benefits and expenses: | |||||||||||||||||||||||
| Insurance benefits paid or provided: | |||||||||||||||||||||||
| Claims and surrenders |
|
|
|
|
|||||||||||||||||||
| Increase in future policy benefit reserves |
|
|
|
|
|||||||||||||||||||
| Policyholders' dividends |
|
|
|
|
|||||||||||||||||||
| Total insurance benefits paid or provided |
|
|
|
|
|||||||||||||||||||
| Commissions |
|
|
|
|
|||||||||||||||||||
| Other general expenses |
|
|
|
|
|||||||||||||||||||
| Capitalization of deferred policy acquisition costs |
(
|
(
|
|
(
|
|||||||||||||||||||
| Amortization of deferred policy acquisition costs |
|
|
|
|
|||||||||||||||||||
| Amortization of cost of insurance acquired |
|
|
|
|
|||||||||||||||||||
| Total benefits and expenses |
|
|
|
|
|||||||||||||||||||
| Income (loss) before federal income tax expense | $ |
|
(
|
(
|
(
|
||||||||||||||||||
June 30, 2021 | 10-Q 14
(4)
STOCKHOLDERS' EQUITY AND RESTRICTIONS
EARNINGS PER SHARE
The following tables set forth the computation of basic and diluted earnings (loss) per share.
| Three Months Ended June 30, | 2021 | 2020 | |||||||||
| (In thousands, except per share amounts) | |||||||||||
| Basic and diluted earnings (loss) per share: | |||||||||||
| Numerator: | |||||||||||
| Net income (loss) | $ |
|
(
|
||||||||
| Net income (loss) allocated to Class A common stock | $ |
|
(
|
||||||||
| Net income (loss) allocated to Class B common stock |
|
(
|
|||||||||
| Net income (loss) | $ |
|
(
|
||||||||
| Denominator: | |||||||||||
| Weighted average shares of Class A outstanding - basic |
|
|
|||||||||
| Weighted average shares of Class A outstanding - diluted |
|
|
|||||||||
| Weighted average shares of Class B outstanding - basic and diluted |
|
|
|||||||||
| Basic and diluted earnings (loss) per share of Class A common stock | $ |
|
(
|
||||||||
| Basic and diluted earnings (loss) per share of Class B common stock |
|
(
|
|||||||||
| Six Months Ended June 30, | 2021 | 2020 | |||||||||
| (In thousands, except per share amounts) | |||||||||||
| Basic and diluted earnings (loss) per share: | |||||||||||
| Numerator: | |||||||||||
| Net income (loss) | $ |
|
(
|
||||||||
| Net income (loss) allocated to Class A common stock | $ |
|
(
|
||||||||
| Net income (loss) allocated to Class B common stock |
|
(
|
|||||||||
| Net income (loss) | $ |
|
(
|
||||||||
| Denominator: | |||||||||||
| Weighted average shares of Class A outstanding - basic |
|
|
|||||||||
| Weighted average shares of Class A outstanding - diluted |
|
|
|||||||||
| Weighted average shares of Class B outstanding - basic and diluted |
|
|
|||||||||
| Basic and diluted earnings (loss) per share of Class A common stock | $ |
|
(
|
||||||||
| Basic and diluted earnings (loss) per share of Class B common stock |
|
(
|
|||||||||
CAPITAL AND SURPLUS
Each of our regulated insurance subsidiaries is required to meet stipulated regulatory capital requirements. These include capital requirements imposed by the U.S. National Association of Insurance Commissioners ("NAIC") and the Bermuda Monetary Authority ("BMA").
All insurance subsidiaries exceeded the minimum capital requirements
at June 30, 2021.
June 30, 2021 | 10-Q 15
(5)
INVESTMENTS
The Company invests primarily in fixed maturity securities, which totaled
90.1
% of total cash and invested assets at June 30, 2021, as shown below.
|
Carrying Value
(In thousands, except for %)
|
June 30, 2021 | December 31, 2020 | |||||||||||||||||||||
| Amount | % | Amount | % | ||||||||||||||||||||
| Cash and invested assets: | |||||||||||||||||||||||
| Fixed maturity securities | $ |
|
|
% |
|
|
% | ||||||||||||||||
| Equity securities |
|
|
% |
|
|
% | |||||||||||||||||
| Policy loans |
|
|
% |
|
|
% | |||||||||||||||||
| Real estate and other long-term investments |
|
|
% |
|
|
% | |||||||||||||||||
| Cash and cash equivalents |
|
|
% |
|
|
% | |||||||||||||||||
| Total cash and invested assets | $ |
|
|
% |
|
|
% | ||||||||||||||||
The following tables represent the amortized cost, gross unrealized gains and losses and fair value of fixed maturity securities as of the dates indicated.
|
Amortized
Cost |
Gross
Unrealized Gains |
Gross
Unrealized Losses |
Fair
Value |
||||||||||||||||||||
| June 30, 2021 | |||||||||||||||||||||||
| (In thousands) | |||||||||||||||||||||||
| Fixed maturity securities: | |||||||||||||||||||||||
| Available-for-sale: | |||||||||||||||||||||||
| U.S. Treasury securities | $ |
|
|
|
|
||||||||||||||||||
| U.S. Government-sponsored enterprises |
|
|
|
|
|||||||||||||||||||
| States and political subdivisions |
|
|
|
|
|||||||||||||||||||
| Corporate: | |||||||||||||||||||||||
| Financial |
|
|
|
|
|||||||||||||||||||
| Consumer |
|
|
|
|
|||||||||||||||||||
| Energy |
|
|
|
|
|||||||||||||||||||
| All other |
|
|
|
|
|||||||||||||||||||
| Residential mortgage-backed |
|
|
|
|
|||||||||||||||||||
| Asset-backed |
|
|
|
|
|||||||||||||||||||
| Foreign governments |
|
|
|
|
|||||||||||||||||||
| Total fixed maturity securities | $ |
|
|
|
|
||||||||||||||||||
June 30, 2021 | 10-Q 16
|
Amortized
Cost |
Gross
Unrealized Gains |
Gross
Unrealized Losses |
Fair
Value |
||||||||||||||||||||
| December 31, 2020 | |||||||||||||||||||||||
| (In thousands) | |||||||||||||||||||||||
| Fixed maturity securities: | |||||||||||||||||||||||
| Available-for-sale: | |||||||||||||||||||||||
| U.S. Treasury securities | $ |
|
|
|
|
||||||||||||||||||
| U.S. Government-sponsored enterprises |
|
|
|
|
|||||||||||||||||||
| States and political subdivisions |
|
|
|
|
|||||||||||||||||||
| Corporate: | |||||||||||||||||||||||
| Financial |
|
|
|
|
|||||||||||||||||||
| Consumer |
|
|
|
|
|||||||||||||||||||
| Energy |
|
|
|
|
|||||||||||||||||||
| All other |
|
|
|
|
|||||||||||||||||||
| Commercial mortgage-backed |
|
|
|
|
|||||||||||||||||||
| Residential mortgage-backed |
|
|
|
|
|||||||||||||||||||
| Asset-backed |
|
|
|
|
|||||||||||||||||||
| Foreign governments |
|
|
|
|
|||||||||||||||||||
| Total fixed maturity securities | $ |
|
|
|
|
||||||||||||||||||
Most of the Company's equity securities are diversified stock and bond mutual funds.
|
Fair Value
(In thousands)
|
June 30, 2021 | December 31, 2020 | |||||||||
| Equity securities: | |||||||||||
| Stock mutual funds | $ |
|
|
||||||||
| Bond mutual funds |
|
|
|||||||||
| Common stock |
|
|
|||||||||
| Non-redeemable preferred stock |
|
|
|||||||||
| Non-redeemable preferred stock fund |
|
|
|||||||||
| Total equity securities | $ |
|
|
||||||||
VALUATION OF INVESTMENTS
Available-for-sale securities are reported in the consolidated financial statements at fair value. Equity securities are measured at fair value with the change in fair value recorded through net income. The Company recognized net realized gains of $
0.3
million and $
0.6
million on equity securities held for the three and six months ended June 30, 2021 and gains of $
1.3
million and $
0.2
million for the same period ended June 30, 2020.
The Company considers several factors in its review and evaluation of individual investments, using the process described in Part IV, Item 15, Note 2. Investments in the notes to the consolidated financial statements of our
Form 10-K
to determine whether a credit loss impairment exists. For the three and six months ended June 30, 2021 and 2020, the Company recorded
no
credit valuation losses on fixed maturity securities.
June 30, 2021 | 10-Q 17
The following tables present the fair values and gross unrealized losses of fixed maturity securities that are not deemed to have credit losses, aggregated by investment category and length of time that individual securities have been in a continuous loss position at June 30, 2021 and December 31, 2020.
| June 30, 2021 | Less than 12 months | Greater than 12 months | Total | ||||||||||||||||||||||||||
| (In thousands, except for # of securities) |
Fair
Value |
Unrealized
Losses |
# of
Securities |
Fair
Value |
Unrealized
Losses |
# of
Securities |
Fair
Value |
Unrealized
Losses |
# of
Securities |
||||||||||||||||||||
| Fixed maturity securities: | |||||||||||||||||||||||||||||
| Available-for-sale securities: | |||||||||||||||||||||||||||||
| U.S. Treasury securities | $ |
|
|
|
$ |
|
|
|
$ |
|
|
|
|||||||||||||||||
| States and political subdivisions |
|
|
|
|
|
|
|
|
|
||||||||||||||||||||
| Corporate: | |||||||||||||||||||||||||||||
| Financial |
|
|
|
|
|
|
|
|
|
||||||||||||||||||||
| Consumer |
|
|
|
|
|
|
|
|
|
||||||||||||||||||||
| Energy |
|
|
|
|
|
|
|
|
|
||||||||||||||||||||
| All Other |
|
|
|
|
|
|
|
|
|
||||||||||||||||||||
| Residential mortgage-backed |
|
|
|
|
|
|
|
|
|
||||||||||||||||||||
| Asset-backed |
|
|
|
|
|
|
|
|
|
||||||||||||||||||||
| Total fixed maturity securities | $ |
|
|
|
$ |
|
|
|
$ |
|
|
|
|||||||||||||||||
| December 31, 2020 | Less than 12 months | Greater than 12 months | Total | ||||||||||||||||||||||||||
| (In thousands, except for # of securities) |
Fair
Value |
Unrealized
Losses |
# of
Securities |
Fair
Value |
Unrealized
Losses |
# of
Securities |
Fair
Value |
Unrealized
Losses |
# of
Securities |
||||||||||||||||||||
| Fixed maturity securities: | |||||||||||||||||||||||||||||
| Available-for-sale securities: | |||||||||||||||||||||||||||||
| States and political subdivisions | $ |
|
|
|
$ |
|
|
|
$ |
|
|
|
|||||||||||||||||
| Corporate: | |||||||||||||||||||||||||||||
| Financial |
|
|
|
|
|
|
|
|
|
||||||||||||||||||||
| Consumer |
|
|
|
|
|
|
|
|
|
||||||||||||||||||||
| Energy |
|
|
|
|
|
|
|
|
|
||||||||||||||||||||
| All Other |
|
|
|
|
|
|
|
|
|
||||||||||||||||||||
| Commercial mortgage-backed |
|
|
|
|
|
|
|
|
|
||||||||||||||||||||
| Residential mortgage-backed |
|
|
|
|
|
|
|
|
|
||||||||||||||||||||
| Asset-backed |
|
|
|
|
|
|
|
|
|
||||||||||||||||||||
| Total fixed maturity securities | $ |
|
|
|
$ |
|
|
|
$ |
|
|
|
|||||||||||||||||
In each category of our fixed maturity securities described above, we do not intend to sell our investments and it is not more likely than not that the Company will be required to sell the investments before recovery of their amortized cost bases.
We did not recognize credit losses on securities with unrealized losses that were due to interest rate sensitivity and changes in credit spreads. We believe that fluctuations caused by movements in interest rates and credit spreads
June 30, 2021 | 10-Q 18
have little bearing on the recoverability of our investments. The fair value is expected to recover as the securities approach maturity.
The amortized cost and fair value of fixed maturity securities at June 30, 2021 by contractual maturity are shown in the table below. Actual maturities may differ from contractual maturities because borrowers may have the right to call or prepay obligations with or without call or prepayment penalties. Securities not due at a single maturity date have been reflected based upon final stated maturity.
| June 30, 2021 |
Amortized
Cost |
Fair
Value |
|||||||||
| (In thousands) | |||||||||||
| Fixed maturity securities: | |||||||||||
| Due in one year or less | $ |
|
|
||||||||
| Due after one year through five years |
|
|
|||||||||
| Due after five years through ten years |
|
|
|||||||||
| Due after ten years |
|
|
|||||||||
| Total fixed maturity securities | $ |
|
|
||||||||
The Company uses the specific identification method of the individual security to determine the cost basis used in the calculation of realized gains and losses related to security sales.
| Three Months Ended | Six Months Ended | ||||||||||||||||
| Fixed Maturity Securities, Available-for-Sale | June 30, | June 30, | |||||||||||||||
| (In thousands) | 2021 | 2020 | 2021 | 2020 | |||||||||||||
| Proceeds | $ |
|
|
|
|
||||||||||||
| Gross realized gains | $ |
|
|
|
|
||||||||||||
| Gross realized losses | $ |
|
|
|
|
||||||||||||
(6)
FAIR VALUE MEASUREMENTS
Fair value is the price that would be received to sell an asset or paid to transfer a liability in an orderly transaction between market participants at the measurement date. We hold AFS fixed maturity securities, which are carried at fair value. We also report our equity securities at fair value with changes in fair value reported through the consolidated statements of operations and comprehensive income (loss).
Fair value measurements are generally based upon observable and unobservable inputs. Observable inputs reflect market data obtained from independent sources, while unobservable inputs reflect our view of market assumptions in the absence of observable market information. We utilize valuation techniques that maximize the use of observable inputs and minimize the use of unobservable inputs. All assets and liabilities carried at fair value are required to be classified and disclosed in one of the following three categories:
•
Level 1 - Quoted prices for identical instruments in active markets.
•
Level 2 - Quoted prices for similar instruments in active markets; quoted prices for identical or similar instruments in markets that are not active; and model-derived valuations whose inputs or
June 30, 2021 | 10-Q 19
whose significant value drivers are observable.
•
Level 3 - Instruments whose significant value drivers are unobservable.
Level 1 primarily consists of financial instruments whose value is based on quoted market prices such as U.S. Treasury securities and actively traded mutual fund and stock investments.
Level 2 includes those financial instruments that are valued by independent pricing services or broker quotes. These pricing models are primarily industry-standard models that consider various inputs, such as interest rates, credit spreads and foreign exchange rates for the underlying financial instruments. All significant inputs are observable or derived from observable information in the marketplace or are supported by observable levels at which transactions are executed in the marketplace. Financial instruments in this category primarily include corporate securities, U.S. Government-sponsored enterprise securities, securities issued by states and political subdivisions and certain mortgage and asset-backed securities.
Level 3 is comprised of financial instruments whose fair value is estimated based on non-binding broker prices utilizing significant inputs not based on or corroborated by readily available market information. Real estate held-for-sale is in this category.
The following tables set forth our assets that are measured at fair value on a recurring basis as of the dates indicated.
| June 30, 2021 | Level 1 | Level 2 | Level 3 |
Total
Fair Value |
|||||||||||||||||||
| (In thousands) | |||||||||||||||||||||||
| Financial Assets | |||||||||||||||||||||||
| Fixed maturity securities available-for-sale | |||||||||||||||||||||||
| U.S. Treasury and U.S. Government-sponsored enterprises | $ |
|
|
|
|
||||||||||||||||||
| States and political subdivisions |
|
|
|
|
|||||||||||||||||||
| Corporate |
|
|
|
|
|||||||||||||||||||
| Residential mortgage-backed |
|
|
|
|
|||||||||||||||||||
| Asset-backed |
|
|
|
|
|||||||||||||||||||
| Foreign governments |
|
|
|
|
|||||||||||||||||||
| Total fixed maturity securities available-for-sale |
|
|
|
|
|||||||||||||||||||
| Equity securities | |||||||||||||||||||||||
| Stock mutual funds |
|
|
|
|
|||||||||||||||||||
| Bond mutual funds |
|
|
|
|
|||||||||||||||||||
| Common stock |
|
|
|
|
|||||||||||||||||||
| Non-redeemable preferred stock |
|
|
|
|
|||||||||||||||||||
| Non-redeemable preferred stock fund |
|
|
|
|
|||||||||||||||||||
| Total equity securities |
|
|
|
|
|||||||||||||||||||
|
Other long-term investments
(1)
|
|
|
|
|
|||||||||||||||||||
| Total financial assets | $ |
|
|
|
|
||||||||||||||||||
(1)
In accordance with Subtopic 820-10, certain investments that are measured at fair value using the net asset value per share (or its equivalent) practical expedient are not classified in the fair value hierarchy. The fair value amounts presented in this table are intended to permit reconciliation of the fair value hierarchy to the amounts presented in the consolidated balance sheet.
June 30, 2021 | 10-Q 20
| December 31, 2020 | Level 1 | Level 2 | Level 3 |
Total
Fair Value |
|||||||||||||||||||
| (In thousands) | |||||||||||||||||||||||
| Financial Assets | |||||||||||||||||||||||
| Fixed maturity securities available-for-sale | |||||||||||||||||||||||
| U.S. Treasury and U.S. Government-sponsored enterprises | $ |
|
|
|
|
||||||||||||||||||
| States and political subdivisions |
|
|
|
|
|||||||||||||||||||
| Corporate |
|
|
|
|
|||||||||||||||||||
| Commercial mortgage-backed |
|
|
|
|
|||||||||||||||||||
| Residential mortgage-backed |
|
|
|
|
|||||||||||||||||||
| Asset-backed |
|
|
|
|
|||||||||||||||||||
| Foreign governments |
|
|
|
|
|||||||||||||||||||
| Total fixed maturity securities available-for-sale |
|
|
|
|
|||||||||||||||||||
| Equity securities | |||||||||||||||||||||||
| Stock mutual funds |
|
|
|
|
|||||||||||||||||||
| Bond mutual funds |
|
|
|
|
|||||||||||||||||||
| Common stock |
|
|
|
|
|||||||||||||||||||
| Non-redeemable preferred stock |
|
|
|
|
|||||||||||||||||||
| Non-redeemable preferred stock fund |
|
|
|
|
|||||||||||||||||||
| Total equity securities |
|
|
|
|
|||||||||||||||||||
|
Other long-term investments
(1)
|
|
|
|
|
|||||||||||||||||||
| Total financial assets | $ |
|
|
|
|
||||||||||||||||||
| (1) In accordance with Subtopic 820-10, certain investments that are measured at fair value using the net asset value per share (or its equivalent) practical expedient are not classified in the fair value hierarchy. The fair value amounts presented in this table are intended to permit reconciliation of the fair value hierarchy to the amounts presented in the consolidated balance sheet. | |||||||||||||||||||||||
FINANCIAL INSTRUMENTS VALUATION
FINANCIAL INSTRUMENTS CARRIED AT FAIR VALUE
Fixed maturity securities, available-for-sale.
At June 30, 2021, our fixed maturity securities, valued using a third-party pricing source, totaled $
1.5
billion for Level 2 assets and comprised
96.1
% of total reported fair value of our financial assets. The Level 1 and Level 2 valuations are reviewed and updated quarterly through testing by comparisons to separate pricing models, other third-party pricing services, and back tested to recent trades. In addition, we obtain information annually relative to the third-party pricing models and review model parameters for reasonableness. There were
no
Level 3 assets at June 30, 2021. For the six months ended June 30, 2021, there were
no
material changes to the valuation methods or assumptions used to determine fair values, and
no
broker or third-party prices were changed from the values received.
Equity securities.
Our equity securities are classified as Level 1 assets as their fair values are based upon quoted market prices.
Limited partnerships.
The Company considers the net asset value ("NAV") to represent the value of the investment fund and is measured by the total value of assets minus the total value of liabilities. The following tables include information related to our investments in limited partnerships that calculate NAV per share. For these investments, which are measured at fair value on a recurring basis, we use the NAV per share to measure fair value. Changes in the NAV of our limited partnerships are recorded through net income. The Company recognized net realized gains
June 30, 2021 | 10-Q 21
of $
4.0
million and $
4.5
million on limited partnerships held for the three and six months ended June 30, 2021 and losses of $
0.1
million for both the three and six months ended June 30, 2020.
These investments are included in other long-term investments on the consolidated balance sheets.
| June 30, 2021 | December 31, 2020 | |||||||||||||||||||||||||
|
Fair Value
Using NAV Per Share |
Unfunded Commit-
ments |
Life
in years |
Fair Value
Using NAV Per Share |
Unfunded Commit-
ments |
Life
in years |
|||||||||||||||||||||
| (In thousands, except years) | ||||||||||||||||||||||||||
| Limited partnerships | ||||||||||||||||||||||||||
|
Middle
market |
Investments in privately-originated, performing senior secured debt primarily in North America-based companies | $ |
|
|
|
$ |
|
|
|
|||||||||||||||||
|
Term
liquidity facility |
Investments in a facility established by the U.S. Federal Reserve that provides financing to U.S. company market participants for levered asset purchases with a focus on asset-backed, commercial mortgage and collateralized loan obligation markets |
|
|
|
|
|
|
|||||||||||||||||||
| Late-stage growth | Investments in private late-stage, established companies seeking capital to accelerate growth prior to an IPO or sale |
|
|
|
|
|
|
|||||||||||||||||||
| Infrastructure | Investments in climate infrastructure assets, focusing on renewable power generation in wind and solar energy |
|
|
|
|
|
|
|||||||||||||||||||
| Total limited partnerships | $ |
|
|
$ |
|
|
||||||||||||||||||||
Our limited partnership investments are not redeemable because distributions will be received when the underlying investments of the partnerships are liquidated. The life spans indicated above may be shortened or extended at the fund manager's discretion, typically in one or two-year increments.
We initially estimate the fair value of investments in limited partnerships by reference to the transaction price. Subsequently, we obtain the fair value of these investments from net asset value information provided by the general partner or manager of the investments, the financial statements of which are audited annually. We carried $
6.2
million of limited partnerships investments at cost at December 31, 2020.
None
were carried at cost at June 30, 2021.
We review the fair value hierarchy classifications each reporting period. Changes in the observability of the valuation attributes may result in a reclassification of certain financial assets. Such reclassifications are reported as transfers in and out of Level 3 at the beginning fair value for the reporting period in which the changes occur. There were
no
transfers in or out of Level 3 during the six months ended June 30, 2021 or 2020.
FINANCIAL INSTRUMENTS NOT CARRIED AT FAIR VALUE
Estimates of fair values are made at a specific point in time, based on relevant market prices and information about the financial instruments. The fair values of financial instruments presented below are not necessarily indicative of the amounts the Company might realize in actual market transactions.
June 30, 2021 | 10-Q 22
The carrying amount and fair value for the financial assets and liabilities on the consolidated balance sheets not otherwise disclosed for the periods indicated are as follows:
| June 30, 2021 | December 31, 2020 | ||||||||||||||||||||||
| (In thousands) |
Carrying
Value |
Fair
Value |
Carrying
Value |
Fair
Value |
|||||||||||||||||||
| Financial Assets: | |||||||||||||||||||||||
| Policy loans | $ |
|
|
|
|
||||||||||||||||||
| Mortgage loans |
|
|
|
|
|||||||||||||||||||
| Cash and cash equivalents |
|
|
|
|
|||||||||||||||||||
| Financial Liabilities: | |||||||||||||||||||||||
| Annuity - investment contracts |
|
|
|
|
|||||||||||||||||||
Policy loans.
Policy loans had a weighted average annual interest rate of
7.7
% at June 30, 2021 and December 31, 2020, and no specified maturity dates. The aggregate fair value of policy loans approximates the carrying value reflected on the consolidated balance sheets. Policy loans are an integral part of the life insurance policies we have in force, cannot be valued separately and are not marketable. Therefore, the fair value of policy loans approximates the carrying value and policy loans are considered Level 3 assets in the fair value hierarchy.
Mortgage loans.
Mortgage loans are secured principally by residential properties. Weighted average interest rates for these loans were approximately
6.4
% at June 30, 2021 and December 31, 2020. At June 30, 2021, maturities ranged from
5
to
19
years. Management estimated the fair value using an annual interest rate of
6.25
% at June 30, 2021. Our mortgage loans are considered Level 3 assets in the fair value hierarchy and are included in other long-term investments on the consolidated balance sheets.
Cash and cash equivalents.
The fair value of cash and cash equivalents approximate carrying value and are characterized as Level 1 assets in the fair value hierarchy.
Annuity liabilities.
The fair value of the Company's liabilities under annuity contract policies, which are considered Level 3 liabilities, was estimated at June 30, 2021 and December 31, 2020 using discounted cash flows based upon spot rates adjusted for various risk adjustments ranging from
0.21
% to
2.55
% and
0.22
% to
2.34
%, respectively. The fair value of liabilities under all insurance contracts are taken into consideration in the overall management of interest rate risk, which seeks to minimize exposure to changing interest rates through the matching of investment maturities with amounts due under insurance contracts.
Other long-term investments.
Financial instruments included in other long-term investments are classified in various levels of the fair value hierarchy.
The following table summarizes the carrying amounts of these investments.
|
Carrying Value
(In thousands
)
|
June 30, 2021 | December 31, 2020 | |||||||||
| Other long-term investments: | |||||||||||
| Limited partnerships | $ |
|
|
||||||||
| FHLB common stock |
|
|
|||||||||
| Mortgage loans |
|
|
|||||||||
| All other investments |
|
|
|||||||||
| Total other long-term investments | $ |
|
|
||||||||
June 30, 2021 | 10-Q 23
(7)
COMMITMENTS AND CONTINGENCIES
QUALIFICATION OF LIFE PRODUCTS
We have previously reported that a portion of the life insurance policies issued by our subsidiary insurance companies failed to qualify for the favorable U.S. federal income tax treatment afforded by Sections 7702 and 72(s) of the Internal Revenue Code ("IRC") of 1986. Further, we have determined that the structure of our policies sold to non-U.S. persons, which were novated to CICA Ltd. effective
July 1, 2018
, may have inadvertently generated U.S. source income over time, which subjected the Company to certain tax withholding and information reporting requirements for the Company under Chapters 3 or 4 of the IRC. The products have been and continue to be appropriately reported as life insurance under U.S. GAAP for financial reporting.
To satisfy the Internal Revenue Service ("IRS") tax withholding and information reporting requirements for the novated policies sold to non-U.S. persons as described above, the Company submitted withholding tax returns to the IRS in December 2019, and amended returns in August 2020 and paid the associated withholding tax. The IRS processed these withholding tax returns in 2021, and the Company considers this matter closed.
LITIGATION AND REGULATORY ACTIONS
From time to time, we are subject to legal and regulatory actions relating to our business. We may incur defense costs, including attorneys' fees, and other direct litigation costs associated with defending claims. If we suffer an adverse judgment as a result of litigation claims, it could have a material adverse effect on our business, results of operations and financial condition.
CONTRACTUAL OBLIGATIONS
As of June 30, 2021, CICA Ltd. is committed to fund investments up to $
64.1
million related to limited partnerships previously described and other investments.
CREDIT FACILITY
On May 5, 2021, the Company entered into a $
20
million senior secured revolving credit facility (the “Credit Facility”) with Regions Bank ("Regions"). The Credit Facility has a three-year term, maturing on May 5, 2024, and allows the Company to borrow up to $
20
million for working capital purposes, capital expenditures and other corporate purposes.
Revolving loans may be requested by the Company in aggregate minimum principal amounts of $
0.5
million per loan. At the Company's election, the revolving loans may either bear a base rate, which is
1.75
% plus a base rate (a fluctuating rate per annum) equal to the greatest of (a) Regions' prime rate, (b) the federal funds rate plus
0.50
%, (c) the one-month LIBOR rate plus
1
%, and (d)
0.75
%; or an adjusted LIBOR rate, which is
2.75
% plus an adjusted LIBOR rate but cannot be less than
0.75
%. The Company is required to pay Regions a quarterly commitment fee of
0.375
% of the unused portion of the Credit Facility, which the Company expenses as it is incurred.
Obligations under the Credit Facility are secured by substantially all of the assets of the Company other than the equity interests in all of the regulated insurance subsidiaries, real estate owned by the Company, and other limited
June 30, 2021 | 10-Q 24
exceptions. The Credit Facility contains customary events of default and financial, affirmative and negative covenants, including but not limited to restrictions on indebtedness, liens, investments, asset dispositions and restricted payments. As of June 30, 2021, the Company had
no
t borrowed any funds against the Credit Facility and was not in violation of any covenants.
CHANGE IN CONTROL
As previously disclosed, on February 5, 2021, Citizens, Inc. (the “Company”) entered into a Purchase and Sale Agreement (the “Purchase Agreement”) with the Harold E. Riley Foundation (the “Foundation”) to purchase 100% of the Company’s Class B common stock (the “Class B Shares”) from the Foundation at an aggregate purchase price of $
9.1
million (the “Class B Transaction”).
(8)
INCOME TAXES
Our provision for income taxes may not have the customary relationship of taxes to income. CICA Ltd., a wholly owned subsidiary of Citizens, is considered a controlled foreign corporation for federal tax purposes. As a result, the insurance activity of CICA Ltd. is subject to Subpart F of the IRC and is included in Citizens’ taxable income. For the three and six months ended June 30, 2021, the Subpart F income inclusion generated $
0.6
million and $
1.0
million of federal income tax expense, respectively.
A reconciliation between the U.S. corporate income tax rate and the effective income tax rate is as follows:
| Three Months Ended June 30, | 2021 | 2020 | |||||||||||||||||||||
| (In thousands, except for %) | Amount | % | Amount | % | |||||||||||||||||||
| Federal income tax expense: | |||||||||||||||||||||||
| Expected tax expense (benefit) | $ |
|
|
% | $ |
|
|
% | |||||||||||||||
| Foreign income tax rate differential |
(
|
(
|
% |
(
|
(
|
% | |||||||||||||||||
| Tax-exempt interest and dividends-received deduction |
(
|
(
|
% |
(
|
(
|
% | |||||||||||||||||
| Annualized effective tax rate adjustment |
(
|
(
|
% |
|
|
% | |||||||||||||||||
| Adjustment of prior year taxes |
|
|
% |
(
|
(
|
% | |||||||||||||||||
| Effect of uncertain tax position |
|
|
% |
|
|
% | |||||||||||||||||
| CICA Ltd. Subpart F income |
|
|
% |
|
|
% | |||||||||||||||||
| Nondeductible officer compensation |
|
|
% |
|
|
% | |||||||||||||||||
| Other |
(
|
(
|
% |
|
|
% | |||||||||||||||||
| Total federal income tax expense (benefit) | $ |
|
|
% | $ |
|
|
% | |||||||||||||||
June 30, 2021 | 10-Q 25
| Six Months Ended June 30, | 2021 | 2020 | |||||||||||||||||||||
| (In thousands, except for %) | Amount | % | Amount | % | |||||||||||||||||||
| Federal income tax expense: | |||||||||||||||||||||||
| Expected tax expense (benefit) | $ |
|
|
% | $ |
(
|
|
% | |||||||||||||||
| Foreign income tax rate differential |
(
|
(
|
% |
(
|
|
% | |||||||||||||||||
| Tax-exempt interest and dividends-received deduction |
(
|
(
|
% |
(
|
|
% | |||||||||||||||||
| Annualized effective tax rate adjustment |
|
|
% |
|
(
|
% | |||||||||||||||||
| Adjustment of prior year taxes |
|
|
% |
(
|
|
% | |||||||||||||||||
| Effect of uncertain tax position |
|
|
% |
|
(
|
% | |||||||||||||||||
| CICA Ltd. Subpart F income |
|
|
% |
|
(
|
% | |||||||||||||||||
| Nondeductible officer compensation |
(
|
(
|
% |
|
|
% | |||||||||||||||||
| Other |
(
|
(
|
% |
|
(
|
% | |||||||||||||||||
| Total federal income tax expense (benefit) | $ |
|
|
% | $ |
|
(
|
% | |||||||||||||||
Income tax expense consists of:
| Three Months Ended | Six Months Ended | ||||||||||||||||||||||
| June 30, | June 30, | ||||||||||||||||||||||
| (In thousands) | 2021 | 2020 | 2021 | 2020 | |||||||||||||||||||
| Federal income tax expense: | |||||||||||||||||||||||
| Current | $ |
|
|
|
|
||||||||||||||||||
| Deferred |
|
|
(
|
(
|
|||||||||||||||||||
| Total federal income tax expense | $ |
|
|
|
|
||||||||||||||||||
June 30, 2021 | 10-Q 26
The components of deferred federal income taxes are as follows:
|
Net Deferred Tax Asset (Liability)
(In thousands)
|
June 30, 2021 | December 31, 2020 | |||||||||
| Deferred tax assets: | |||||||||||
| Future policy benefit reserves | $ |
|
|
||||||||
| Net operating and capital loss carryforwards |
|
|
|||||||||
| Accrued policyholder dividends and expenses |
|
|
|||||||||
| Investments |
|
|
|||||||||
| Deferred intercompany loss |
|
|
|||||||||
| Fixed assets |
|
|
|||||||||
| Lease liability |
|
|
|||||||||
| Accrued compensation |
|
|
|||||||||
| Other |
|
|
|||||||||
| Total gross deferred tax assets |
|
|
|||||||||
| Deferred tax liabilities: | |||||||||||
| Deferred policy acquisition costs, cost of insurance acquired and intangible assets |
(
|
(
|
|||||||||
| Unrealized gains on investments available-for-sale |
(
|
(
|
|||||||||
| Tax reserves transition liability |
(
|
(
|
|||||||||
| Right-of-use lease asset |
(
|
(
|
|||||||||
| Other |
(
|
(
|
|||||||||
| Total gross deferred tax liabilities |
(
|
(
|
|||||||||
| Net deferred tax liability | $ |
(
|
(
|
||||||||
(9)
OTHER COMPREHENSIVE INCOME
The changes in the components of other comprehensive income (loss) are reported net of the effects of income taxes of 21% as of the three and six months ended June 30, 2021 and 2020, as indicated below.
| Three Months Ended June 30, | 2021 | 2020 | |||||||||||||||||||||||||||||||||
| (In thousands) | Amount | Tax Effect | Total | Amount | Tax Effect | Total | |||||||||||||||||||||||||||||
| Unrealized gains (losses): | |||||||||||||||||||||||||||||||||||
| Unrealized holding gains (losses) arising during the period | $ |
|
(
|
|
|
(
|
|
||||||||||||||||||||||||||||
| Reclassification adjustment for (gains) losses included in net income |
|
(
|
|
(
|
|
(
|
|||||||||||||||||||||||||||||
| Effects on deferred policy acquisition costs |
(
|
|
(
|
(
|
|
(
|
|||||||||||||||||||||||||||||
| Effects on cost of insurance acquired |
|
(
|
|
(
|
|
(
|
|||||||||||||||||||||||||||||
| Effects on unearned revenue reserves |
|
(
|
|
|
(
|
|
|||||||||||||||||||||||||||||
| Other comprehensive income (loss) | $ |
|
|
|
|
(
|
|
||||||||||||||||||||||||||||
June 30, 2021 | 10-Q 27
| Six Months Ended June 30, | 2021 | 2020 | |||||||||||||||||||||||||||||||||
| (In thousands) | Amount | Tax Effect | Total | Amount | Tax Effect | Total | |||||||||||||||||||||||||||||
| Unrealized gains (losses): | |||||||||||||||||||||||||||||||||||
| Unrealized holding gains (losses) arising during the period | $ |
(
|
|
(
|
|
(
|
|
||||||||||||||||||||||||||||
| Reclassification adjustment for (gains) losses included in net income |
|
(
|
|
|
(
|
|
|||||||||||||||||||||||||||||
| Effects on deferred policy acquisition costs |
|
(
|
|
(
|
|
(
|
|||||||||||||||||||||||||||||
| Effects on cost of insurance acquired |
|
(
|
|
(
|
|
(
|
|||||||||||||||||||||||||||||
| Effects on unearned revenue reserves |
(
|
|
(
|
|
(
|
|
|||||||||||||||||||||||||||||
| Other comprehensive income (loss) | $ |
(
|
(
|
(
|
|
(
|
|
||||||||||||||||||||||||||||
(10)
RELATED PARTY TRANSACTIONS
(11)
SUBSEQUENT EVENTS
The Company has evaluated the impact of subsequent events as defined by the accounting guidance through the date this report was issued.
On July 30, 2021, the Company sold our Citizens Academy Training Facility located near Austin, Texas for a gross sales price of $
3.8
million, resulting in a gain on the sale of $
1.0
million. The facility was owned by Citizens and was held in our Other Non-Insurance Enterprises.
June 30, 2021 | 10-Q 28
Item 2.
MANAGEMENT'S DISCUSSION AND ANALYSIS OF FINANCIAL CONDITION AND RESULTS OF OPERATIONS
FORWARD-LOOKING STATEMENTS
This section and other parts of this Quarterly Report on Form 10-Q ("Form 10-Q") contain forward-looking statements, within the meaning of the Private Securities Litigation Reform Act of 1995, that involve risks and uncertainties. Forward-looking statements provide current expectations of future events based on certain assumptions and include any statement that does not directly relate to any historical or current fact. Forward-looking statements can also be identified by words such as “future,” “anticipates,” “believes,” “estimates,” “expects,” “intends,” “plans,” “predicts,” “will,” “would,” “could,” “can,” “may,” and similar terms. Forward-looking statements are not guarantees of future performance and the Company’s actual results may differ significantly from the results discussed in the forward-looking statements. Factors that might cause such differences include, but are not limited to, statements concerning any potential future impact of the coronavirus disease (“COVID-19”) pandemic on our business, as well as factors discussed in the "Risk Factors" contained in our Annual Report on
Form 10-K
for the year ended December 31, 2020 which are incorporated herein by reference.
The Company assumes no obligation to revise or update any forward-looking statements for any reason, except as required by law.
The following discussion should be read in conjunction with the consolidated financial statements and accompanying notes included in
Part I, Item 1
of this Form 10-Q. The Company assumes no obligation to revise or update any forward-looking statements for any reason, except as required by law.
The U.S. Securities and Exchange Commission ("SEC") maintains a website that contains reports, proxy and information statements, and other information regarding issuers, including the Company, that file electronically with the SEC. The public can obtain any documents that the Company files with the SEC at http://www.sec.gov. We also make available, free of charge, through our Internet website (http://www.citizensinc.com), our Annual Report on Form 10-K, Quarterly Reports on Form 10-Q, Current Reports on Form 8-K, Section 16 Reports filed by officers and directors, news releases, and, if applicable, amendments to those reports filed or furnished pursuant to Section 13(a) or 15(d) of the Securities Exchange Act of 1934, as soon as reasonably practicable after we electronically file such reports with, or furnish such reports to, the SEC. We are not including any of the information contained on our website as part of, or incorporating it by reference into, this Form 10-Q.
OVERVIEW
Citizens, Inc. ("Citizens" or the "Company") is an insurance holding company incorporated in Colorado serving the life insurance needs of individuals in the United States since 1969 and internationally since 1975. Through our insurance subsidiaries, we provide insurance benefits to residents in 31 U.S. states and more than 75 different countries. We pursue a strategy of offering traditional insurance products in niche markets where we believe we are able to achieve competitive advantages. We operate in two business segments:
•
Life Insurance segment - U.S. dollar-denominated ordinary whole life insurance and endowment policies predominantly sold to non-U.S. residents, located principally in Latin America and the Pacific Rim through independent marketing consultants and whole life insurance sold domestically through independent agents; and
•
Home Service Insurance segment - final expense life insurance and limited liability property insurance policies marketed to middle- and lower-income households, as well as whole life products with higher allowable face values, in Louisiana, Mississippi and Arkansas, sold through independent agents and through funeral homes.
IMPACT OF COVID-19 PANDEMIC
The impacts of COVID-19 and related economic conditions on the Company's financial results, which began to affect the Company late in the first quarter of 2020, continue to be highly uncertain and outside the Company’s control. The scope, duration and magnitude of the direct and indirect effects of COVID-19 are difficult or impossible to anticipate. As a result, it is not possible to predict its impact on the Company's results for the remainder of 2021.
June 30, 2021 | 10-Q 29
Currently, some of the most significant factors that could cause our future results to differ significantly from our prior results or forward-looking statements include:
•
decreased premium revenue due to disruption to our distribution channel and quarantines, travel limitations, business restrictions and decreased economic activity;
•
higher surrenders or lapses due to cash needs our policyholders may have due to concerns over COVID-19 economic impacts, particularly in our international business; and
•
a higher level of claims due to COVID-19 deaths.
While we believe that the COVID-19 pandemic did not materially impact our results of operations during the first six months of 2021, the Delta variant of COVID-19, which is now becoming the predominant strain of COVID-19 globally, is leading to new or reinstated lock-downs and quarantines, and higher rates of transmission and deaths, particularly in unvaccinated individuals, and may materially impact future operations.
We continue to monitor the impact of the COVID-19 pandemic on our operations.
CURRENT FINANCIAL HIGHLIGHTS
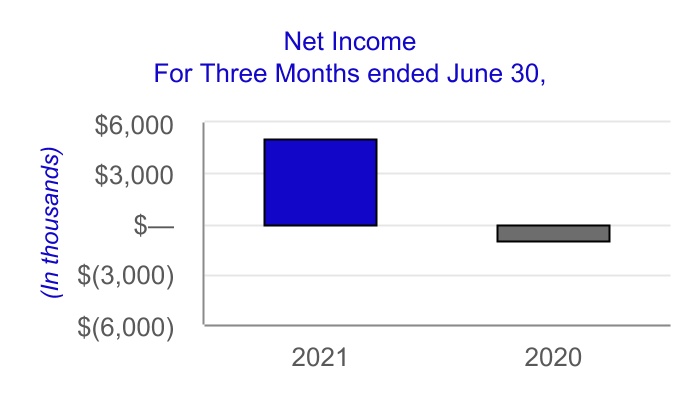
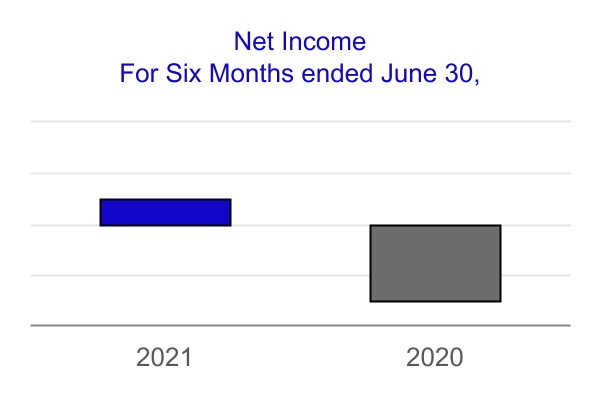
Net income increased by $6.0 million during both the three and six months ended June 30, 2021 to $5.0 million and $1.4 million, respectively, compared to the prior year periods due primarily to an increase in realized gains of $3.4 million and $5.0 million, respectively in the three and six months ended June 30, 2021. The realized gains primarily reflect changes in the fair value of our limited partnership investments during the second quarter of 2021. We did not sell these investments in the second quarter of 2021, but as discussed in
Part I, Item 1,
Note 5. Investments
, changes in fair values of our equity securities are reflected in realized gains, in addition to executed transactions that result in a gain or loss. Net income in the three months ended June 30, 2021 was also positively impacted by an increase in premiums and more favorable mortality experience in our Home Service Insurance segment as compared to the three months ended June 30, 2020, and a $0.8 million reduction to increase in future policy benefit reserves due to the conversion of a block of business to our new actuarial valuation system as described in
Part I, Item 1, Note 1. Financial Statements
.
Total benefits and expenses of $58.0 million and $116.2 million, respectively, in the three and six months ended June 30, 2021 were $0.1 million and $0.3 million higher than the respective periods in 2020. The increase was primarily due to increases in claims and surrender benefits paid in our Life Insurance segment. Death claim benefits paid in the Life Insurance Segment, increased by $0.6 million, or 48.8%, in the three months ended June 30, 2021 as compared to the 2020 period and increased by $1.6 million, or 52.7%, in the six months ended June 30, 2021 as compared to the 2020 period. The higher claim expense was a result of a higher volume of reported claims, including those COVID-19 related, in addition to an increase in the average death claim amount. We also continued to experience an increase in surrender benefits in the Life Insurance segment, which increased by 28.1% and 17.7%, respectively, in the three and six months ended June 30, 2021, as compared to the prior year periods. We believe the continued trend of higher surrenders is due primarily to the aging block of business, as the business ages, the surrender charges decrease, and to a lesser extent, global economic circumstances.
June 30, 2021 | 10-Q 30
Consolidated Revenue Highlights
Life insurance premiums and investment income are our primary sources of revenue. In the three months ended June 30, 2021 compared to the same period in 2020, total revenue increased by $5.2 million.
•
Insurance premiums increased by $1.3 million, or 3.2%, due to an increase in first year premiums in our Life Insurance segment and an increase in both first year and renewal premiums in our Home Service Insurance segments. We believe these increases were driven by our focused marketing campaigns and improved sales practices, as well as lower sales in prior year period due to COVID 19 impacts previously described.
•
Net investment income increased by $0.4 million, or 2.7%, despite a lower average portfolio yield in the current year period due to a growing base of assets.
In the six months ended June 30, 2021 as compared to the same period in 2020, total revenue increased by $5.0 million.
•
Insurance premiums declined by $1.0 million, or 1.2%. The decline was driven by our Life Insurance segment, as renewal premiums declined 6.4% to $52.0 million in the first quarter of 2021 from $55.6 million in the same period in 2020. The decrease in renewal premiums resulted primarily from a decline in our in force business in this segment, which is due in part to changes we made to our products and distribution over the last few years.
•
Net investment income increased by $0.5 million, or 1.6%, due to the growing asset base and the make-whole call redemption described below in the "Consolidated Results of Operations".
Additionally, as discussed above, realized investment gains increased by $3.4 million and $5.0 million, respectively, in the three and six months ended June 30, 2021 as compared to the prior year periods.
Other income consists primarily of policyholders in our Life Insurance segment selecting supplemental contracts upon maturity of their original policies, which has been increasing over the past few quarters.
Consolidated Benefits and Expenses Highlights
The primary use of our funds is the payment of insurance benefits for claims, surrenders and matured endowments. As discussed above, our claims and surrender benefits incurred increased by $1.5 million and $5.7 million, respectively, in the three and six months ended June 30, 2021 as compared to the same periods in the prior year; however, total insurance benefits paid or provided was essentially flat year-over-year, as the increase in claims and surrender benefits was offset by a decrease in future policy benefit reserves. Future policy benefit reserves decreased due to the decline in the in force block of business and the conversion of a block of policies to our new actuarial valuation system mentioned above.
The other primary uses of funds are the costs related to selling our insurance products (e.g., commissions, underwriting, marketing expenses) and general expenses. Costs incurred related to selling our insurance products were higher for the three and six months ended June 30, 2021 as compared to the same period in the prior year. First year sales for both our Life Insurance and Home Service Insurance segments increased substantially in the second quarter of 2021 compared to the comparable period last year, when premiums were materially impacted by the COVID-19 pandemic as disclosed previously. Commissions on our first year sales are much higher than commissions on our renewal business.
Other general expenses were slightly higher for the three and six months ended June 30, 2021 due to higher rent at our new headquarters and higher legal fees due to the various legal proceedings described in our
Form 10-K
for the year ended December 21, 2020.
June 30, 2021 | 10-Q 31
Financial Condition at June 30, 2021
•
Total investments of $1.6 billion; fixed maturity securities comprised 91.7% of total investments.
•
Total assets of $1.8 billion.
•
Total stockholders' equity of $0.3 billion.
•
$4.6 billion of direct insurance in force.
•
No debt.
•
Fully diluted earnings per share of Class A common stock of $0.03.
OUR OPERATING SEGMENTS
Our business is comprised of two operating business segments, as detailed below.
•
Life Insurance
•
Home Service Insurance
Our insurance operations are the primary focus of the Company, as these operations generate most of our income. See the discussion under
Segment Operations
below for detailed analysis. The amount of insurance, number of policies, and average face amounts of ordinary life policies issued during the periods indicated are shown below.
| Six Months Ended June 30, | 2021 | 2020 | |||||||||||||||||||||||||||||||||
|
Amount of
Insurance Issued |
Number of
Policies Issued |
Average Policy
Face Amount Issued |
Amount of
Insurance Issued |
Number of
Policies Issued |
Average Policy
Face Amount Issued |
||||||||||||||||||||||||||||||
| Life Insurance | $ | 108,680,985 | 1,803 | $ | 60,278 | $ | 84,017,811 | 1,315 | $ | 63,892 | |||||||||||||||||||||||||
| Home Service Insurance | 99,978,080 | 13,868 | 7,209 | 65,239,577 | 9,230 | 7,068 | |||||||||||||||||||||||||||||
| Total | $ | 208,659,065 | 15,671 | $ | 149,257,388 | 10,545 | |||||||||||||||||||||||||||||
Total insurance issued increased by 39.8% in the six months ended June 30, 2021, from $149.3 million in the first six months of 2020 to $208.7 million in 2021, as both our Life Insurance and Home Service Insurance segments experienced growth. We issued 15,671 new policies in the 2021 period, as compared to 10,545 new policies in the 2020 period. Our sales for the second quarter of 2020 were unusually low, especially for our Life Insurance segment due to the impact of the COVID-19 pandemic during this time.
The number of policies issued in the six months ended June 30, 2021 increased 37.1% in the Life Insurance segment from the same period in 2020. We believe the increase in the first half of 2021 was primarily due to enhancements to our business operations and sales practices to account for the impact of the COVID-19 pandemic, new sales promotions and campaigns, focused training on virtual selling and strategically prioritizing selling lower face amount policies, which typically have less stringent underwriting requirements and, in some cases, may not require the completion of medical tests, as many of our top international markets remain in quarantine due to the COVID-19 pandemic. In addition, in order to address the decreasing first year premiums we have seen in recent years in this segment, we prioritized recruiting new independent contractors in the first quarter of 2021, and we began to see the impact of these efforts through June. Although applications increased during the first six months of 2021 compared to the same period last year due to these enhancements, average policy face amount declined, as we continued to emphasize the selling of lower face amount policies, as noted above.
The number of policies issued in the six months ended June 30, 2021 increased 50.2% in the Home Service Insurance segment compared to the same period in 2020. We believe the increase in our Home Service Insurance segment was driven by the broadening of a sales campaign introduced during the third quarter of last year targeted at existing policyholders that emphasizes increased coverage as well as fewer applications received in the prior
June 30, 2021 | 10-Q 32
year period as the onset of the COVID-19 pandemic and stay-at-home orders negatively impacted our business. During the first quarter of 2021, as part of the campaign, we increased the target face amount of insurance. As a result, the overall average face amount of policies issued for the Home Service Insurance segment increased during the six months ended June 30, 2021 compared to the same period last year.
CONSOLIDATED RESULTS OF OPERATIONS
A discussion of consolidated results is presented below, followed by a discussion of segment operations and financial results by segment.
REVENUES
Our revenues are generated primarily by insurance renewal premiums and investment income on invested assets.
| Three Months Ended | Six Months Ended | ||||||||||||||||||||||
| June 30, | June 30, | ||||||||||||||||||||||
| (In thousands) | 2021 | 2020 | 2021 | 2020 | |||||||||||||||||||
| Revenues: | |||||||||||||||||||||||
| Premiums: | |||||||||||||||||||||||
| Life insurance | $ | 41,438 | 40,185 | 79,080 | 80,131 | ||||||||||||||||||
| Accident and health insurance | 291 | 248 | 634 | 509 | |||||||||||||||||||
| Property insurance | 1,097 | 1,063 | 2,144 | 2,173 | |||||||||||||||||||
| Net investment income | 15,320 | 14,915 | 30,564 | 30,084 | |||||||||||||||||||
| Realized investment gains, net | 4,859 | 1,448 | 5,151 | 142 | |||||||||||||||||||
| Other income | 553 | 482 | 1,468 | 1,024 | |||||||||||||||||||
| Total revenues | $ | 63,558 | 58,341 | 119,041 | 114,063 | ||||||||||||||||||
Premium Income.
Premium income derived from life, accident and health, and property insurance sales increased $1.3 million, or 3.2%, for the second quarter, and decreased $1.0 million, or 1.2% for the six months ended June 30, 2021 compared to the same periods in 2020. The increase in the three-month period was due to higher first year premiums in both our segments and slightly higher renewal premiums in our Home Services Insurance segment. First year premiums were negatively affected in the three and six months ended June 30, 2020 due to the impacts of the COVID-19 pandemic. Despite higher first year premiums in both our segments and slightly higher renewal premiums in our Home Services Insurance segment for the six months ended June 30, 2021, overall premiums declined due to lower renewal premiums in our Life Insurance segment. The decrease in renewal premiums in the Life Insurance segment is mainly due to a continuing decline in our in force business in this segment over the last several years as we have made changes to our products and distribution and as surrenders outpace new sales. Premium revenues continue to be negatively impacted by high levels of surrenders, which we believe are due not only to an aging block of business (i.e., maturities and surrenders of products where the surrender charges are close to expiring or have expired) and our decision to cease issuing new policies in Brazil in 2017 (where we see many policies lapsing), but also to economic circumstances in Latin America. See the detailed distribution of premiums within
Segment Operations
discussed below.
June 30, 2021 | 10-Q 33
Net Investment Income.
Our annualized net investment income performance is summarized as follows.
| June 30, | December 31, | June 30, | |||||||||||||||
| (In thousands, except for %) | 2021 | 2020 | 2020 | ||||||||||||||
| Net investment income, annualized | $ | 61,128 | 60,197 | 60,168 | |||||||||||||
| Average invested assets, at amortized cost | 1,447,241 | 1,420,129 | 1,403,295 | ||||||||||||||
| Annualized yield on average invested assets | 4.22 | % | 4.24 | % | 4.29 | % | |||||||||||
Annualized net investment income increased by $1.0 million in the six months ended June 30, 2021 as compared to the same six months of 2020 despite a lower annualized yield. The increase is due to the growing asset base and the make-whole call redemptions described below. The annualized yield decreased by seven basis points during the first six months of 2021 compared to the same period in 2020, as we continue to face a challenging investment environment for fixed maturity assets, which account for the majority of our investment portfolio. As part of the ongoing process of managing our portfolio and optimizing performance, we are continuing to identify and invest in new asset classes, including limited partnerships.
Investment income from fixed maturity securities accounted for approximately 87.5% and 87.7% of total investment income for the three and six months ended June 30, 2021, respectively.
| Three Months Ended | Six Months Ended | ||||||||||||||||||||||
| June 30, | June 30, | ||||||||||||||||||||||
| (In thousands) | 2021 | 2020 | 2021 | 2020 | |||||||||||||||||||
| Gross investment income: | |||||||||||||||||||||||
| Fixed maturity securities | $ | 13,796 | 13,512 | 27,896 | 27,380 | ||||||||||||||||||
| Equity securities | 216 | 199 | 423 | 379 | |||||||||||||||||||
| Policy loans | 1,563 | 1,629 | 3,207 | 3,252 | |||||||||||||||||||
| Long-term investments | 180 | 18 | 253 | 19 | |||||||||||||||||||
| Other investment income | 5 | 16 | 20 | 84 | |||||||||||||||||||
| Total investment income | 15,760 | 15,374 | 31,799 | 31,114 | |||||||||||||||||||
| Investment expenses | (440) | (459) | (1,235) | (1,030) | |||||||||||||||||||
| Net investment income | $ | 15,320 | 14,915 | 30,564 | 30,084 | ||||||||||||||||||
Income from fixed maturity securities income increased 2.1% and 1.9% for the three and six months ended June 30, 2021, respectively, compared to the same periods in 2020, and our total investment income increased by 2.5% and 2.2% in the same periods. However, when adjusted for two non-recurring events, a "make-whole" call redemption and early distributions from our limited partnership investments, net investment income was flat year-over-year. Investment expenses primarily reflect investment in limited partnerships.
Realized Investment Gains (Losses), Net.
We recorded realized gains of $4.5 million related to fair value changes in our investments in limited partnerships during the second quarter of this year. We also recorded realized gains of $0.3 million and $0.6 million during the three and six months ended June 30, 2021, respectively, related to fair value changes in our equity securities owned at June 30, 2021. The fair value of our equity securities owned at June 30, 2020 was negatively impacted by the onset of the COVID-19 pandemic as discussed previously.
June 30, 2021 | 10-Q 34
BENEFITS AND EXPENSES
| Three Months Ended | Six Months Ended | ||||||||||||||||||||||
| June 30, | June 30, | ||||||||||||||||||||||
| (In thousands) | 2021 | 2020 | 2021 | 2020 | |||||||||||||||||||
| Benefits and expenses: | |||||||||||||||||||||||
| Insurance benefits paid or provided: | |||||||||||||||||||||||
| Claims and surrenders | $ | 29,296 | 27,754 | 59,885 | 54,203 | ||||||||||||||||||
| Increase in future policy benefit reserves | 6,287 | 8,237 | 11,519 | 17,708 | |||||||||||||||||||
| Policyholders' dividends | 1,475 | 1,328 | 2,781 | 2,561 | |||||||||||||||||||
| Total insurance benefits paid or provided | 37,058 | 37,319 | 74,185 | 74,472 | |||||||||||||||||||
| Commissions | 8,801 | 6,714 | 16,958 | 14,567 | |||||||||||||||||||
| Other general expenses | 11,503 | 11,139 | 22,885 | 22,612 | |||||||||||||||||||
| Capitalization of deferred policy acquisition costs | (5,787) | (3,731) | (10,772) | (8,740) | |||||||||||||||||||
| Amortization of deferred policy acquisition costs | 6,074 | 6,061 | 12,257 | 12,180 | |||||||||||||||||||
| Amortization of cost of insurance acquired | 309 | 401 | 676 | 769 | |||||||||||||||||||
| Total benefits and expenses | $ | 57,958 | 57,903 | 116,189 | 115,860 | ||||||||||||||||||
Claims and Surrenders.
Death claims and surrender benefits are our primary uses of cash. As reflected in the table below, death claim and surrender benefits combined increased 13.3% and 15.0%, respectively, in the three and six months ended June 30, 2021 as compared to the same periods in 2020.
| Three Months Ended | Six Months Ended | ||||||||||||||||||||||
| June 30, | June 30, | ||||||||||||||||||||||
| (In thousands) | 2021 | 2020 | 2021 | 2020 | |||||||||||||||||||
| Claims and Surrenders: | |||||||||||||||||||||||
| Death claim benefits | $ | 6,544 | 7,046 | 15,484 | 13,635 | ||||||||||||||||||
| Surrender benefits | 13,529 | 10,675 | 26,336 | 22,730 | |||||||||||||||||||
| Endowment benefits | 2,251 | 2,619 | 4,652 | 5,358 | |||||||||||||||||||
| Matured endowment benefits | 5,662 | 6,148 | 10,784 | 9,901 | |||||||||||||||||||
| Property claims | 315 | 316 | 636 | 803 | |||||||||||||||||||
| Accident and health benefits | 43 | 61 | 102 | 114 | |||||||||||||||||||
| Other policy benefits | 952 | 889 | 1,891 | 1,662 | |||||||||||||||||||
| Total claims and surrenders | $ | 29,296 | 27,754 | 59,885 | 54,203 | ||||||||||||||||||
•
Death claim benefits decreased 7.1% and increased 13.6% for the three and six months ended June 30, 2021, respectively, compared to the same periods in 2020. Claims in our Life Insurance segment increased 48.8% during the second quarter and 52.7% during the first half of the year 2021 compared to the same periods in 2020. The increases were due to both a higher volume and a higher average amount of reported claims. Home Service Insurance segment claims decreased 19.1% and increased 2.7% for the three and six months ended June 30, 2021, respectively, as compared to the prior year periods. The increase during the first six months of the year compared to the same period last year was due primarily to COVID-19 related deaths during the first quarter of this year.
•
Surrender benefits increased 26.7% and 15.9% for the three and six months ended June 30, 2021, respectively, compared to the same periods in 2020. Surrender benefits represented less than 0.6% of total direct ordinary whole life insurance in force of $4.6 billion as of June 30, 2021. A
June 30, 2021 | 10-Q 35
significant portion of surrender benefits relates to international policies that have been in force for an extended period and have little or no associated surrender charges. In addition, we saw an unusually high number of policyholders in our Life Insurance segment who had outstanding loans on their policies select the reduced paid up insurance ("RPU") conversion option in the second quarter of this year. These loans are considered surrenders upon conversion. We believe that the higher RPU policy elections and increased surrenders are results of the continuing economic uncertainty in Latin America due to the COVID-19 pandemic.
•
Matured endowment benefits decreased 7.9% and increased 8.9% for the three and six months ended June 30, 2021, respectively, compared to the same periods in 2020. We anticipated this overall increase based upon the dates when our endowment contracts were sold and the maturity dates set forth in the contracts.
Increase in Future Policy Benefit Reserves.
The change in future policy benefit reserves decreased 23.7% and 35.0% for the three and six months ended June 30, 2021, respectively, compared to the same periods in 2020. Future policy benefit reserves decreased as our in force block of business decreased and also decreased by $0.8 million in the three months ended June 30, 2021 due to the conversion of a small block of policies to our new actuarial valuation system mentioned above.
Commissions.
Commission expenses are a cost of acquiring business, as commissions are the primary compensation paid to our independent consultants and independent agents for selling our products. First year commission rates are higher than renewal commission rates. Commissions fluctuate directly in relation to sales and were higher in the three and six months ended June 30, 2021.
Other General Expenses.
General expenses were generally consistent during the three and six months ended June 30, 2021 compared to the same periods in 2020.
Capitalization and Amortization of Deferred Policy Acquisition Costs.
Costs capitalized include certain commissions, policy issuance costs, and underwriting and agency expenses that relate to successful sales efforts for insurance contracts. Capitalized costs increased during the three and six months ended June 30, 2021 compared to the same periods in 2020 as we experienced an increase in first year premium production as previously discussed. Amortization of deferred policy acquisition costs was slightly higher during the three and six months ended June 30, 2021 compared to the same periods in the prior year. Amortization is impacted by persistency, surrenders, and new sales production and thus it may fluctuate from quarter to quarter.
Federal Income Tax.
Tax expense decreased for the three and six months ended June 30, 2021 resulting in effective tax rates of 10.4% and 49.2% compared to 334.6% and (156.7)% for the same periods in 2020, respectively. The Company's tax rate was impacted by differences between our effective tax rate and the statutory tax rate resulting from income and expense items that are treated differently for financial reporting and tax purposes. In addition, CICA Ltd., a wholly-owned Bermuda subsidiary of Citizens, is considered a controlled foreign corporation for federal tax purposes and CICA Ltd.'s activity gives rise to taxable income in the U.S. as Subpart F Income, which is treated as a permanent tax difference and therefore included in the Company's effective tax rate calculation. See
Part I, Item 1, Note 8. Income Taxes
in the notes to our consolidated financial statements herein.
SEGMENT OPERATIONS
Our business is comprised of two operating business segments, as detailed below.
•
Life Insurance
•
Home Service Insurance
These segments are reported in accordance with U.S. GAAP. The Company's Other Non-Insurance enterprises include non-insurance operations such as IT and corporate-support functions, which are included in the table
June 30, 2021 | 10-Q 36
presented below to properly reconcile the segment information with the consolidated financial statements of the Company.
The following table shows income (loss) before federal income taxes by segments during the periods indicated.
| Three Months Ended | Six Months Ended | ||||||||||||||||||||||
| June 30, | June 30, | ||||||||||||||||||||||
| (In thousands) | 2021 | 2020 | 2021 | 2020 | |||||||||||||||||||
| Income (loss) before federal income tax expense: | |||||||||||||||||||||||
| Segments: | |||||||||||||||||||||||
| Life Insurance | $ | 7,127 | 2,119 | 7,021 | 4,205 | ||||||||||||||||||
| Home Service Insurance | 538 | (26) | (220) | (2,171) | |||||||||||||||||||
| Total segments | 7,665 | 2,093 | 6,801 | 2,034 | |||||||||||||||||||
| Other Non-Insurance enterprises | (2,065) | (1,655) | (3,949) | (3,831) | |||||||||||||||||||
| Total income (loss) before federal income tax expense | $ | 5,600 | 438 | 2,852 | (1,797) | ||||||||||||||||||
LIFE INSURANCE
Our Life Insurance segment primarily operates through CICA Ltd. (a Bermuda company), which issues ordinary whole life insurance and endowment policies in U.S. Dollar-denominated amounts to non-U.S. residents in more than 75 different countries through independent marketing consultants. The whole life products are designed to provide a fixed amount of insurance coverage over the life of the insured and can include rider benefits to provide additional coverage and annuity benefits to enhance accumulations. The endowment contracts are principally accumulation contracts that incorporate an element of life insurance protection. For the majority of our business, we retain the first $0.1 million on any one life and reinsure the remainder of the risk. We operate the Life Insurance segment internationally through CICA Ltd. and domestically through our CICA and CNLIC insurance subsidiaries.
June 30, 2021 | 10-Q 37
The results of operations for the Life Insurance segment for the periods indicated are as follows:
| Three Months Ended | Six Months Ended | ||||||||||||||||||||||
| June 30, | June 30, | ||||||||||||||||||||||
| (In thousands) | 2021 | 2020 | 2021 | 2020 | |||||||||||||||||||
| Revenues: | |||||||||||||||||||||||
| Premiums | $ | 30,138 | 30,062 | 57,201 | 59,881 | ||||||||||||||||||
| Net investment income | 11,879 | 11,345 | 23,477 | 22,825 | |||||||||||||||||||
| Realized investment gains, net | 4,644 | 391 | 4,536 | 1,126 | |||||||||||||||||||
| Other income | 553 | 482 | 1,466 | 1,006 | |||||||||||||||||||
| Total revenues | 47,214 | 42,280 | 86,680 | 84,838 | |||||||||||||||||||
| Benefits and expenses: | |||||||||||||||||||||||
| Insurance benefits paid or provided: | |||||||||||||||||||||||
| Claims and surrenders | 23,531 | 20,888 | 46,801 | 41,048 | |||||||||||||||||||
| Increase in future policy benefit reserves | 4,054 | 7,384 | 7,712 | 15,530 | |||||||||||||||||||
| Policyholders' dividends | 1,466 | 1,319 | 2,762 | 2,544 | |||||||||||||||||||
| Total insurance benefits paid or provided | 29,051 | 29,591 | 57,275 | 59,122 | |||||||||||||||||||
| Commissions | 4,398 | 3,294 | 8,629 | 7,772 | |||||||||||||||||||
| Other general expenses | 5,147 | 4,446 | 10,373 | 9,394 | |||||||||||||||||||
| Capitalization of deferred policy acquisition costs | (3,816) | (2,716) | (7,377) | (6,637) | |||||||||||||||||||
| Amortization of deferred policy acquisition costs | 5,200 | 5,419 | 10,548 | 10,737 | |||||||||||||||||||
| Amortization of cost of insurance acquired | 107 | 127 | 211 | 245 | |||||||||||||||||||
| Total benefits and expenses | 40,087 | 40,161 | 79,659 | 80,633 | |||||||||||||||||||
| Income (loss) before federal income tax expense | $ | 7,127 | 2,119 | 7,021 | 4,205 | ||||||||||||||||||
As discussed above in
Current Financial Highlights
, net income increased in both the three and six months ended June 30, 2021 as compared to the same prior year periods primarily due to our realized investment gains from the increased fair value of our limited partnership investments. These gains were attributable to the Life Insurance segment.
Life Insurance segment premium breakout is detailed below.
| Three Months Ended | Six Months Ended | ||||||||||||||||||||||
| June 30, | June 30, | ||||||||||||||||||||||
| (In thousands) | 2021 | 2020 | 2021 | 2020 | |||||||||||||||||||
| Premiums: | |||||||||||||||||||||||
| First year | $ | 2,724 | 1,588 | 5,203 | 4,303 | ||||||||||||||||||
| Renewal | 27,414 | 28,474 | 51,998 | 55,578 | |||||||||||||||||||
| Total premiums | $ | 30,138 | 30,062 | 57,201 | 59,881 | ||||||||||||||||||
Premiums.
We derive most of our premium revenue in the Life Insurance segment from renewal premiums. Total premium revenues increased slightly for the three months and declined 4.5% for the six months ended June 30, 2021 compared to the same periods in 2020. While first year premiums increased in both periods in 2021, renewal
June 30, 2021 | 10-Q 38
premiums declined by 3.7% and 6.4% for the same three and six periods, respectively. See “Consolidated Results of Operations” above for a discussion regarding the increase in first year premiums and the decline in renewal premiums in this segment. First year policies issued increased by 37.1% in the six months ended June 30, 2021, but due to lower issued face amounts, first year premiums during the period rose more modestly at 20.9%. Endowment sales totaled approximately $4.5 million of first year premiums in the six months ended June 30, 2021, as compared to $2.3 million in the prior year period.
The following graph sets forth, for our top five producing countries, our direct premiums from our international life insurance business for the six months ended June 30, 2021 and 2020.
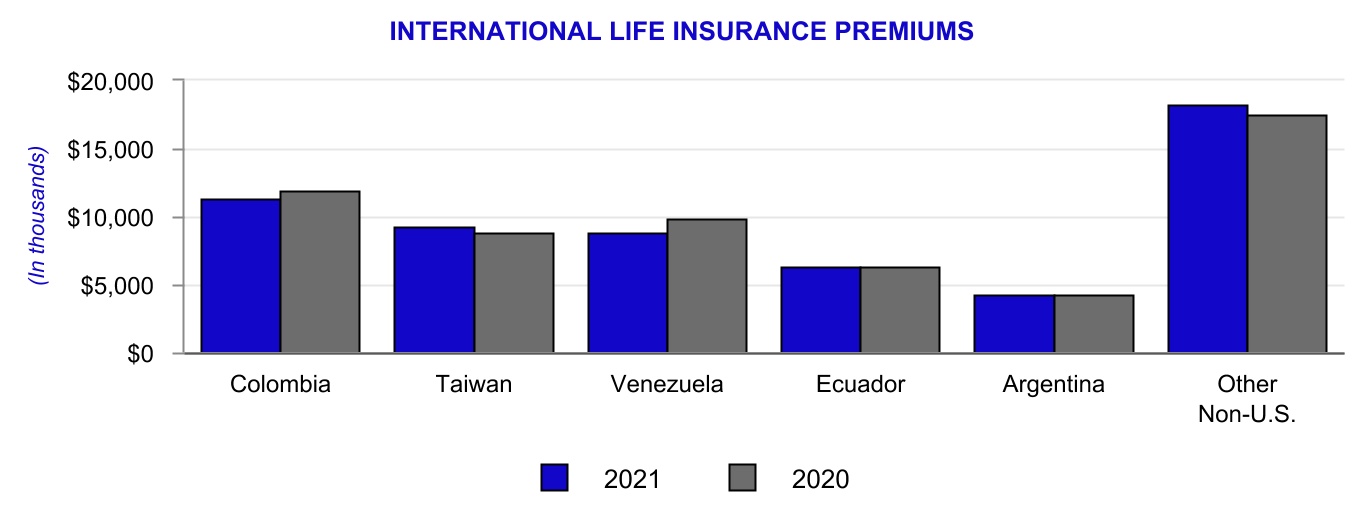
| Three Months Ended | Six Months Ended | ||||||||||||||||||||||
| June 30, | June 30, | ||||||||||||||||||||||
| (In thousands) | 2021 | 2020 | 2021 | 2020 | |||||||||||||||||||
| Country: | |||||||||||||||||||||||
| Colombia | $ | 6,023 | 5,981 | 11,267 | 11,869 | ||||||||||||||||||
| Taiwan | 4,743 | 3,882 | 9,227 | 8,856 | |||||||||||||||||||
| Venezuela | 4,496 | 4,937 | 8,864 | 9,890 | |||||||||||||||||||
| Ecuador | 3,346 | 3,227 | 6,267 | 6,338 | |||||||||||||||||||
| Argentina | 2,408 | 2,433 | 4,236 | 4,256 | |||||||||||||||||||
| Other Non-U.S. | 10,083 | 9,347 | 18,188 | 17,548 | |||||||||||||||||||
| Total | $ | 31,099 | 29,807 | 58,049 | 58,757 | ||||||||||||||||||
Sales from Colombia, Taiwan and Venezuela continued to represent the majority of the new and renewal business premiums in our international business in the three and six months ended June 30, 2021.
DOMESTIC SALES
Domestic premiums in our Life Insurance segment were $1.3 million and $2.5 million in the three and six months ended June 30, 2021, compared to $1.3 million and $2.6 million, respectively, in the prior year periods. Our domestic in force business results from blocks of business of insurance companies we have acquired over the years. We discontinued new sales of domestic ordinary whole life and endowment life insurance products within our Life Insurance segment in 2017 while we evaluated our domestic life strategy; therefore, the majority of the premium recorded is related to renewal business. We began marketing our products again domestically in early
June 30, 2021 | 10-Q 39
2021, beginning in Florida. We believe that our experience in developing and selling products in Latin America will help us expand into the large Hispanic market in the U.S.
Net Investment Income
. Annualized net investment income in our Life Insurance segment was as follows:
| June 30, | December 31, | June 30, | |||||||||||||||
| (In thousands, except for %) | 2021 | 2020 | 2020 | ||||||||||||||
| Net investment income, annualized | $ | 46,954 | 45,885 | 45,714 | |||||||||||||
| Average invested assets, at amortized cost | 1,106,589 | 1,071,792 | 1,052,500 | ||||||||||||||
| Annualized yield on average invested assets | 4.24 | % | 4.28 | % | 4.34 | % | |||||||||||
Annualized net investment income in our Life Insurance segment increased in the six months ended June 30, 2021 compared to the same period annualized in 2020 and the twelve months ended December 31, 2020, due to continued growth in average invested assets and $0.7 million in non-recurring income as noted previously. The annualized yield in the first six months of 2021 decreased compared to the same period in 2020 and from December 31, 2020 as a substantial portion of our fixed maturity investments were called or matured during the past year and we have faced challenges in finding investments with comparable yields in the continued low interest rate environment. See the Investments section below for more detailed information on our investments.
Realized Investment Gains (Losses), Net.
The realized gain for the six months ended June 30, 2021 was due to the change in estimated fair market value for our limited partnerships, as previously discussed.
Claims and Surrenders.
The following table shows the claims and surrender benefits paid within the Life Insurance segment for the six months ended June 30, 2021 compared to the same period in 2020.
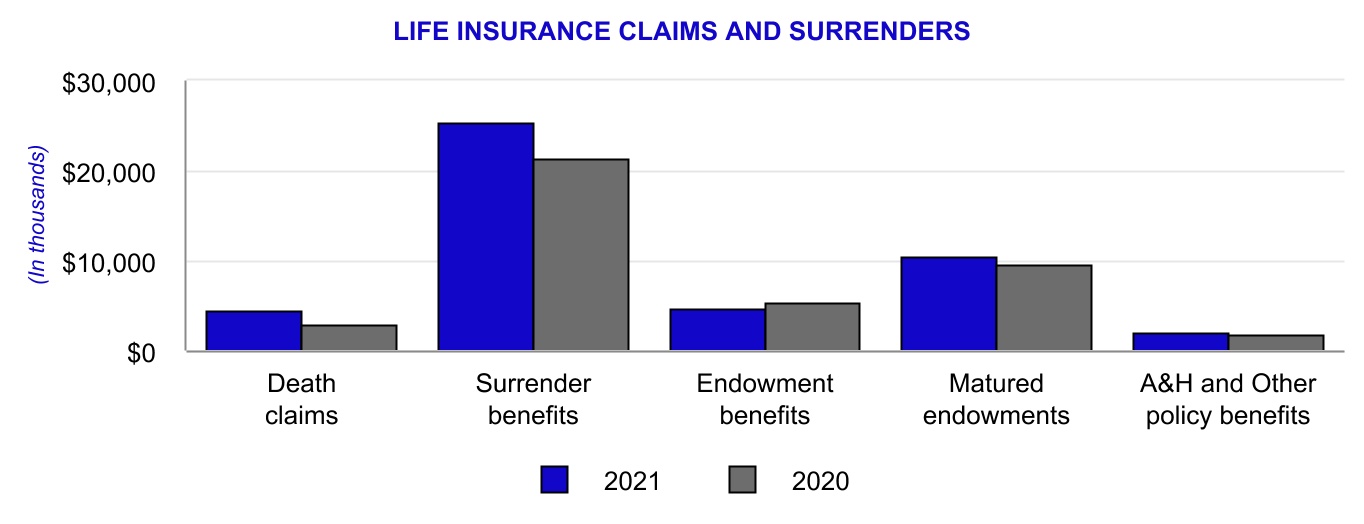
June 30, 2021 | 10-Q 40
| Three Months Ended | Six Months Ended | ||||||||||||||||||||||
| June 30, | June 30, | ||||||||||||||||||||||
| (In thousands) | 2021 | 2020 | 2021 | 2020 | |||||||||||||||||||
| Claims and Surrenders: | |||||||||||||||||||||||
| Death claim benefits | $ | 1,849 | 1,243 | 4,533 | 2,968 | ||||||||||||||||||
| Surrender benefits | 12,978 | 10,132 | 25,229 | 21,435 | |||||||||||||||||||
| Endowment benefits | 2,248 | 2,617 | 4,647 | 5,353 | |||||||||||||||||||
| Matured endowment benefits | 5,489 | 5,969 | 10,469 | 9,569 | |||||||||||||||||||
| Accident and health benefits | 18 | 41 | 39 | 68 | |||||||||||||||||||
| Other policy benefits | 949 | 886 | 1,884 | 1,655 | |||||||||||||||||||
| Total claims and surrenders | $ | 23,531 | 20,888 | 46,801 | 41,048 | ||||||||||||||||||
The majority of our claims and surrender benefits in our Life Insurance segment are related to payment of surrender and matured endowment benefits. Policy surrenders increased 28.1% and 17.7% in the three and six months ended June 30, 2021 as compared to the prior year period and matured endowment benefits decreased by 8.0% and increased 9.4%, respectively, during the same period. These expenses have been increasing over the last several years, which is expected, due in part to the aging of this block of business - a significant portion of surrenders relates to policies that have been in force and have little to no associated surrender charges and endowment products reaching their stated maturities. In addition, as discussed in
Consolidated Results of Operations
above, the COVID-19 pandemic and higher RPU policy elections by policyholders in the second quarter of this year have contributed to the higher surrenders in 2021. However, these expenses are within expected levels.
The other key component of claims and surrender benefits in the Life Insurance segment is death claim benefits, which increased 48.8% and 52.7% in the three and six months ended June 30, 2021 due to both a higher volume and a higher average amount of reported claims.
Increase in future policy benefit reserves.
The change in future policy benefit reserves decreased 45.1% and 50.3%% for the three and six months ended June 30, 2021, respectively, compared to the same periods in 2020. Future policy benefit reserves decreased as our in force block of business decreased. In addition, the change in future policy reserves for the three and six months ended June 30, 2021 was lower due to an $0.8 million adjustment for the conversion of a small block of policies to our new actuarial valuation system for our Life Insurance segment during the second quarter.
HOME SERVICE INSURANCE
We operate in the Home Service Insurance market through our subsidiaries SPLIC, MGLIC and SPFIC, and focus on the life insurance needs of the middle- and lower-income markets, primarily in Louisiana, Mississippi and Arkansas. Premium revenue of 88.7% and 89.9% in the six months ended June 30, 2021 and 2020, respectively, were from policyholders in Louisiana. Our policies have historically been sold and serviced through a home service insurance marketing distribution system of independent agents who work on a debit route system and through funeral homes that sell policies, collect premiums and service policyholders. In June 2021, we added a new whole life product to this market that has higher allowable face values.
June 30, 2021 | 10-Q 41
The results of operations for the Home Service Insurance segment for the periods indicated are as follows:
| Three Months Ended | Six Months Ended | ||||||||||||||||||||||
| June 30, | June 30, | ||||||||||||||||||||||
| (In thousands) | 2021 | 2020 | 2021 | 2020 | |||||||||||||||||||
| Revenues: | |||||||||||||||||||||||
| Premiums | $ | 12,688 | 11,434 | 24,657 | 22,932 | ||||||||||||||||||
| Net investment income | 3,243 | 3,256 | 6,588 | 6,588 | |||||||||||||||||||
| Realized investment gains (losses), net | 206 | 924 | 429 | (793) | |||||||||||||||||||
| Other income | — | — | 2 | 18 | |||||||||||||||||||
| Total revenues | 16,137 | 15,614 | 31,676 | 28,745 | |||||||||||||||||||
| Benefits and expenses: | |||||||||||||||||||||||
| Insurance benefits paid or provided: | |||||||||||||||||||||||
| Claims and surrenders | 5,765 | 6,866 | 13,084 | 13,155 | |||||||||||||||||||
| Increase in future policy benefit reserves | 2,233 | 853 | 3,807 | 2,178 | |||||||||||||||||||
| Policyholders' dividends | 9 | 9 | 19 | 17 | |||||||||||||||||||
| Total insurance benefits paid or provided | 8,007 | 7,728 | 16,910 | 15,350 | |||||||||||||||||||
| Commissions | 4,403 | 3,420 | 8,329 | 6,795 | |||||||||||||||||||
| Other general expenses | 4,084 | 4,591 | 7,878 | 8,907 | |||||||||||||||||||
| Capitalization of deferred policy acquisition costs | (1,971) | (1,015) | (3,395) | (2,103) | |||||||||||||||||||
| Amortization of deferred policy acquisition costs | 874 | 642 | 1,709 | 1,443 | |||||||||||||||||||
| Amortization of cost of insurance acquired | 202 | 274 | 465 | 524 | |||||||||||||||||||
| Total benefits and expenses | 15,599 | 15,640 | 31,896 | 30,916 | |||||||||||||||||||
| Income (loss) before federal income tax expense | $ | 538 | (26) | (220) | (2,171) | ||||||||||||||||||
Premiums.
Premiums increased by 11.0% and 7.5% in the three and six months ended June 30, 2021, respectively, compared to the same periods in 2020, with increases in both first year premiums and renewal premiums. First year premiums increased due mainly to the broadening of an automatic issue product offered to existing policyholders as discussed in
Our Operating Segments
, which contributed to a higher number of policies issued as well as a higher average face amount for policies issued during the first six months of 2021, compared to the same period last year. The 2020 period was negatively impacted by the COVID-19 pandemic. Renewal premiums increased during the six months ended June 30, 2021 primarily due to strong collection efforts by our independent agents as we believe disposable income of our insureds increased as a result of government stimulus and assistance programs related to the COVID-19 pandemic.
Net Investment Income.
Net investment income for the three and six months ended June 30, 2021 remained consistent to the same periods in 2020.
Realized Investment Gains (Losses), Net.
Changes in realized gains/losses, which reflect changes in fair values of our equity securities, were primarily due to the stock market decline and subsequent increase in the previous year due to the COVID-19 pandemic.
June 30, 2021 | 10-Q 42
Claims and Surrenders.
Claims and surrender benefits for the Home Service Insurance segment is summarized as follows:
| Three Months Ended | Six Months Ended | ||||||||||||||||||||||
| June 30, | June 30, | ||||||||||||||||||||||
| (In thousands) | 2021 | 2020 | 2021 | 2020 | |||||||||||||||||||
| Claims and Surrenders: | |||||||||||||||||||||||
| Death claim benefits | $ | 4,695 | 5,803 | 10,951 | 10,667 | ||||||||||||||||||
| Surrender benefits | 551 | 543 | 1,107 | 1,295 | |||||||||||||||||||
| Endowment benefits | 3 | 2 | 5 | 5 | |||||||||||||||||||
| Matured endowment benefits | 173 | 179 | 315 | 332 | |||||||||||||||||||
| Property claims | 315 | 316 | 636 | 803 | |||||||||||||||||||
| Accident and health benefits | 25 | 20 | 63 | 46 | |||||||||||||||||||
| Other policy benefits | 3 | 3 | 7 | 7 | |||||||||||||||||||
| Total claims and surrenders | $ | 5,765 | 6,866 | 13,084 | 13,155 | ||||||||||||||||||
The vast majority of claims and surrender benefits in our Home Service Insurance segment relate to death claim benefits. Death claim benefits decreased 19.1% and increased 2.7% in the three and six months ended June 30, 2021, respectively, compared to the 2020 periods. The increase during the first six months of the year compared to the same period last year was due primarily to COVID-19 related deaths during the first quarter of this year for reasons discussed above in “Current Financial Highlights”. Mortality experience is closely monitored by the Company as a key performance indicator and can fluctuate based on reported claims.
Increase in future policy benefit reserves.
The increase in reserves was higher during the three and six months ended June 30, 2021 compared to the same period last year is due to higher sales and better policyholder retention in 2021.
Other general expenses.
Other general expenses decreased for the three and six months ended June 30, 2021 due to changes we made to our distribution structure in the prior year.
OTHER NON-INSURANCE ENTERPRISES
| Three Months Ended | Six Months Ended | ||||||||||||||||||||||
| June 30, | June 30, | ||||||||||||||||||||||
|
(In thousands)
|
2021 | 2020 | 2021 | 2020 | |||||||||||||||||||
| Income (loss) before income tax expense | $ | (2,065) | (1,655) | (3,949) | (3,831) | ||||||||||||||||||
This operating unit represents the administrative support entities to the insurance operations whose revenues are primarily intercompany and have been eliminated in consolidation under U.S. GAAP, which typically results in a segment loss. Revenue in this operating unit consists primarily of net investment income and realized investment gains or losses, while expenses consist of other general expenses. In the three and six months ended June 30, 2021, the Other Non-Insurance Enterprises had a loss of $2.1 million and $3.9 million, respectively, compared to a loss of $1.7 million and $3.8 million for the same periods 2020, as other general expenses increased.
June 30, 2021 | 10-Q 43
INVESTMENTS
Our investments are an integral part of our business success. Our cash and invested assets at June 30, 2021 were $1.6 billion, of which 90.1% was invested in fixed maturity securities, all of which are classified as available-for-sale. We closely monitor the duration of our fixed maturity investments, and investment purchases and sales are executed with the objective of having adequate funds available to satisfy our insurance obligations.
The following table shows the carrying value of our investments by investment category and cash, cash equivalents and the percentage of each to total cash and invested assets.
| Carrying Value | June 30, 2021 | December 31, 2020 | |||||||||||||||||||||
| (In thousands, except for %) | Amount | % | Amount | % | |||||||||||||||||||
| Cash, Cash Equivalents and Invested Assets | |||||||||||||||||||||||
| Fixed maturity securities: | |||||||||||||||||||||||
| U.S. Treasury and U.S. Government-sponsored enterprises | $ | 15,564 | 1.0 | % | $ | 16,117 | 1.0 | % | |||||||||||||||
| Corporate | 883,182 | 54.2 | % | 877,208 | 52.8 | % | |||||||||||||||||
|
States and political subdivisions
(1)
|
387,970 | 23.8 | % | 409,665 | 24.7 | % | |||||||||||||||||
|
Mortgage-backed
(2)
|
136,630 | 8.4 | % | 140,184 | 8.5 | % | |||||||||||||||||
| Asset-backed | 44,307 | 2.7 | % | 46,091 | 2.8 | % | |||||||||||||||||
| Foreign governments | 114 | — | % | 118 | — | % | |||||||||||||||||
| Total fixed maturity securities | 1,467,767 | 90.1 | % | 1,489,383 | 89.8 | % | |||||||||||||||||
| Cash and cash equivalents | 30,125 | 1.8 | % | 34,131 | 2.1 | % | |||||||||||||||||
| Other investments: | |||||||||||||||||||||||
| Policy loans | 80,621 | 4.9 | % | 83,318 | 5.0 | % | |||||||||||||||||
| Equity securities | 22,657 | 1.4 | % | 22,102 | 1.3 | % | |||||||||||||||||
| Real estate and other long-term investments | 28,959 | 1.8 | % | 29,865 | 1.8 | % | |||||||||||||||||
| Total cash, cash equivalents and invested assets | $ | 1,630,129 | 100.0 | % | $ | 1,658,799 | 100.0 | % | |||||||||||||||
(1)
Includes $160.6 million and $164.0 million of securities guaranteed by third parties at June 30, 2021 and December 31, 2020, respectively.
(2)
Includes $136.5 million and $139.8 million of U.S. Government-sponsored enterprises at June 30, 2021 and December 31, 2020, respectively.
The carrying value of the Company’s fixed maturity securities investment portfolio at June 30, 2021 was $1.5 billion. The distribution of the credit ratings of our portfolio of fixed maturity securities by carrying value as of June 30, 2021 did not materially change from December 31, 2020 – the weighted average was “A” at both dates. Our portfolio mix did not materially change during the six months.
Cash and cash equivalents decreased as of June 30, 2021 compared to December 31, 2020
due primarily to the purchase of 100% of the Company’s Class B common stock from the Foundation for $9.1 million, but increased from March 31, 2021 due to the timing of reinvestment of available cash as we search for suitable investments in the ongoing low interest rate environment.
Real estate and other long-term investments decreased by $0.9 million as of June 30, 2021 to December 31, 2020. Although we paid $8.8 million from a Rabbi Trust (which was considered a long-term investment) to our former Chief Executive Officer, Geoffrey Kolander in February 2021, investments in our limited partnerships increased by $9.0 million in the second quarter of 2021.
June 30, 2021 | 10-Q 44
Obligations of States and Political Subdivisions
The Company’s fixed maturity securities investment portfolio at June 30, 2021 and December 31, 2020 included $388.0 million and $409.7 million, respectively, of securities that are obligations of states and political subdivisions, including municipalities (collectively referred to as the municipal bond portfolio).
The Company's municipal bond portfolio includes third-party guarantees. Detailed below is a presentation by the Nationally Recognized Statistical Rating Organization ("NRSRO") rating of these holdings by funding type as of June 30, 2021.
| General Obligation | Special Revenue | Other | Total |
% Based on Amortized
Cost |
|||||||||||||||||||||||||||||||||||||||||||||||||
| (In thousands, except for %) |
Fair
Value |
Amortized
Cost |
Fair
Value |
Amortized
Cost |
Fair
Value |
Amortized
Cost |
Fair
Value |
Amortized
Cost |
|||||||||||||||||||||||||||||||||||||||||||||
| State and political subdivision fixed maturity securities including third-party guarantees | |||||||||||||||||||||||||||||||||||||||||||||||||||||
| AAA | $ | 21,602 | 20,723 | 3,369 | 3,087 | — | — | 24,971 | 23,810 | 6.7 | % | ||||||||||||||||||||||||||||||||||||||||||
| AA | 56,082 | 52,196 | 122,019 | 113,852 | 12,234 | 10,834 | 190,335 | 176,882 | 49.5 | % | |||||||||||||||||||||||||||||||||||||||||||
| A | 16,567 | 15,062 | 117,862 | 106,204 | 5,085 | 4,415 | 139,514 | 125,681 | 35.2 | % | |||||||||||||||||||||||||||||||||||||||||||
| BBB | 4,036 | 3,664 | 13,706 | 12,972 | 1,543 | 1,450 | 19,285 | 18,086 | 5.1 | % | |||||||||||||||||||||||||||||||||||||||||||
| BB and other | 4,832 | 4,422 | 9,033 | 8,585 | — | — | 13,865 | 13,007 | 3.5 | % | |||||||||||||||||||||||||||||||||||||||||||
| Total | $ | 103,119 | 96,067 | 265,989 | 244,700 | 18,862 | 16,699 | 387,970 | 357,466 | 100.0 | % | ||||||||||||||||||||||||||||||||||||||||||
| State and political subdivision fixed maturity securities excluding third-party guarantees | |||||||||||||||||||||||||||||||||||||||||||||||||||||
| AAA | $ | 3,212 | 3,138 | — | — | — | — | 3,212 | 3,138 | 0.9 | % | ||||||||||||||||||||||||||||||||||||||||||
| AA | 39,237 | 37,729 | 48,288 | 44,586 | 7,588 | 6,534 | 95,113 | 88,849 | 24.9 | % | |||||||||||||||||||||||||||||||||||||||||||
| A | 28,041 | 25,945 | 143,448 | 130,439 | 8,024 | 7,143 | 179,513 | 163,527 | 45.7 | % | |||||||||||||||||||||||||||||||||||||||||||
| BBB | 7,395 | 6,655 | 36,304 | 34,040 | 57 | 55 | 43,756 | 40,750 | 11.4 | % | |||||||||||||||||||||||||||||||||||||||||||
| BB and other | 25,234 | 22,600 | 37,949 | 35,635 | 3,193 | 2,967 | 66,376 | 61,202 | 17.1 | % | |||||||||||||||||||||||||||||||||||||||||||
| Total | $ | 103,119 | 96,067 | 265,989 | 244,700 | 18,862 | 16,699 | 387,970 | 357,466 | 100.0 | % | ||||||||||||||||||||||||||||||||||||||||||
The table below shows the categories in which the Company held investments in special revenue bonds that were greater than 10% of fair value based upon the Company's municipal bond portfolio at June 30, 2021.
| (In thousands) |
Fair
Value |
Amortized
Cost |
% of Total
Fair Value |
||||||||||||||
| Education | $ | 70,516 | 65,120 | 18.2 | % | ||||||||||||
| Utilities | 67,788 | 60,431 | 17.5 | % | |||||||||||||
| Transportation | 40,421 | 38,568 | 10.4 | % | |||||||||||||
The Company's municipal bond portfolio is spread across many states, however, municipal bonds from Texas and California comprise the most significant concentration of the total municipal bond portfolio as of June 30, 2021. The Company holds 21.8% and 10.4% of its municipal bond portfolio in Texas and California issuers, respectively, as of June 30, 2021. There were no other states or individual issuer holdings that represented or exceeded 10% of the total municipal bond portfolio as of June 30, 2021.
June 30, 2021 | 10-Q 45
The table below represents the Company's detailed exposure to municipal bond portfolio in Texas at June 30, 2021.
| June 30, 2021 | General Obligation | Special Revenue | Other | Total | |||||||||||||||||||||||||||||||||||||||||||
| (In thousands) |
Fair
Value |
Amortized
Cost |
Fair
Value |
Amortized
Cost |
Fair
Value |
Amortized
Cost |
Fair
Value |
Amortized
Cost |
|||||||||||||||||||||||||||||||||||||||
| Texas state and political subdivision fixed maturity securities including third-party guarantees | |||||||||||||||||||||||||||||||||||||||||||||||
| AAA | $ | 21,014 | 20,215 | 3,369 | 3,087 | — | — | 24,383 | 23,302 | ||||||||||||||||||||||||||||||||||||||
| AA | 21,699 | 21,378 | 13,613 | 12,800 | 57 | 55 | 35,369 | 34,233 | |||||||||||||||||||||||||||||||||||||||
| A | — | — | 22,311 | 21,844 | — | — | 22,311 | 21,844 | |||||||||||||||||||||||||||||||||||||||
| BBB | — | — | 1,971 | 1,827 | — | — | 1,971 | 1,827 | |||||||||||||||||||||||||||||||||||||||
| BB and other | — | — | 548 | 506 | — | — | 548 | 506 | |||||||||||||||||||||||||||||||||||||||
| Total | $ | 42,713 | 41,593 | 41,812 | 40,064 | 57 | 55 | 84,582 | 81,712 | ||||||||||||||||||||||||||||||||||||||
| Texas state and political subdivision fixed maturity securities excluding third-party guarantees | |||||||||||||||||||||||||||||||||||||||||||||||
| AAA | $ | 3,212 | 3,138 | — | — | — | — | 3,212 | 3,138 | ||||||||||||||||||||||||||||||||||||||
| AA | 32,348 | 31,499 | 3,286 | 3,052 | — | — | 35,634 | 34,551 | |||||||||||||||||||||||||||||||||||||||
| A | 5,957 | 5,806 | 29,929 | 29,011 | — | — | 35,886 | 34,817 | |||||||||||||||||||||||||||||||||||||||
| BBB | 1,196 | 1,150 | 5,637 | 5,205 | 57 | 55 | 6,890 | 6,410 | |||||||||||||||||||||||||||||||||||||||
| BB and other | — | — | 2,960 | 2,796 | — | — | 2,960 | 2,796 | |||||||||||||||||||||||||||||||||||||||
| Total | $ | 42,713 | 41,593 | 41,812 | 40,064 | 57 | 55 | 84,582 | 81,712 | ||||||||||||||||||||||||||||||||||||||
The table below represents the Company's detailed exposure to municipal bond portfolio in California at June 30, 2021.
| June 30, 2021 | General Obligation | Special Revenue | Other | Total | |||||||||||||||||||||||||||||||||||||||||||
| (In thousands) |
Fair
Value |
Amortized
Cost |
Fair
Value |
Amortized
Cost |
Fair
Value |
Amortized
Cost |
Fair
Value |
Amortized
Cost |
|||||||||||||||||||||||||||||||||||||||
| California state and political subdivision fixed maturity securities including third-party guarantees | |||||||||||||||||||||||||||||||||||||||||||||||
| AA | $ | — | — | 25,912 | 24,322 | 2,939 | 2,728 | 28,851 | 27,050 | ||||||||||||||||||||||||||||||||||||||
| A | 1,693 | 1,650 | 4,936 | 4,720 | — | — | 6,629 | 6,370 | |||||||||||||||||||||||||||||||||||||||
| BBB | — | — | 4,841 | 4,663 | — | — | 4,841 | 4,663 | |||||||||||||||||||||||||||||||||||||||
| Total | $ | 1,693 | 1,650 | 35,689 | 33,705 | 2,939 | 2,728 | 40,321 | 38,083 | ||||||||||||||||||||||||||||||||||||||
| California state and political subdivision fixed maturity securities excluding third-party guarantees | |||||||||||||||||||||||||||||||||||||||||||||||
| AA | $ | — | — | 2,715 | 2,632 | — | — | 2,715 | 2,632 | ||||||||||||||||||||||||||||||||||||||
| A | 1,693 | 1,650 | 10,816 | 10,289 | 2,939 | 2,728 | 15,448 | 14,667 | |||||||||||||||||||||||||||||||||||||||
| BBB | — | — | 8,545 | 7,956 | — | — | 8,545 | 7,956 | |||||||||||||||||||||||||||||||||||||||
| BB and other | — | — | 13,613 | 12,828 | — | — | 13,613 | 12,828 | |||||||||||||||||||||||||||||||||||||||
| Total | $ | 1,693 | 1,650 | 35,689 | 33,705 | 2,939 | 2,728 | 40,321 | 38,083 | ||||||||||||||||||||||||||||||||||||||
June 30, 2021 | 10-Q 46
IMPAIRMENT CONSIDERATIONS RELATED TO INVESTMENTS IN FIXED MATURITY AND EQUITY SECURITIES
For the three and six months ended June 30, 2021 and 2020, the Company recorded no credit valuation losses on fixed maturity securities.
Information on both unrealized and realized gains and losses by category is set forth in
Part I, Item 1, Note 5. Investments
of the notes to our consolidated financial statements herein.
LIQUIDITY AND CAPITAL RESOURCES
Liquidity refers to a company's ability to generate sufficient cash flows to meet the needs of its operations. We manage our insurance operations as described herein in order to ensure that we have stable and reliable sources of cash flows to meet our obligations. We expect to meet our cash needs for the next 12 months with cash generated by our insurance operations and from our invested assets. At June 30, 2021, we had $30.1 million in cash and cash equivalents and $1.6 billion in invested assets.
PARENT COMPANY LIQUIDITY AND CAPITAL RESOURCES
Liquidity is the ability to generate amounts of cash adequate to meet our cash needs. Citizens is a holding company and has minimal operations of its own. Our assets consist of the capital stock of our subsidiaries, cash and investments. Our liquidity requirements are met primarily from two sources: cash generated from our operating subsidiaries and our invested assets. Our ability to obtain cash from our insurance subsidiaries depends primarily upon the availability of statutorily permissible payments, including payments Citizens receives from service agreements with our life insurance subsidiaries and dividends from the subsidiaries. The ability to make payments to the holding company is limited by applicable laws and regulations of Bermuda and U.S. states of domicile which subject insurance operations to significant regulatory restrictions. These laws and regulations require, among other things, that our insurance subsidiaries maintain minimum solvency requirements, which limit the amount of dividends that can be paid to the holding company. The regulations also require approval of our service agreements with the applicable regulatory authority in order to prevent insurance subsidiaries from moving large amounts of cash to the unregulated holding company.
Our cash and cash equivalents decreased from $34.1 million at December 31, 2020 to $30.1 million at June 30, 2021, but increased by $10.6 million from March 31, 2021. The decrease was primarily due to the following uses of cash in the first quarter of 2021:
•
$8.8 million severance payment in February 2021 to our former Chief Executive Officer, Geoffrey Kolander, following his resignation pursuant to the terms of his employment agreement and the Chief Executive Officer Separation of Service and Consulting Agreement dated July 29, 2020 (See
Part I, Item 1,
Note 6. Fair Value Measurements
– "Other Long-Term Investments”, herein, and our
Form 10-K
for additional discussion about the severance payment to Mr. Kolander); and
•
$9.1 million payment to the Harold E. Riley Foundation ("Foundation") in March 2021 for the purchase of 100% of the outstanding Class B common stock.
Cash and cash equivalents increased by $10.6 million from March 31, 2021 to June 30, 2021 due to cash received from maturing securities and operations not yet reinvested as we search for suitable investment opportunities in the ongoing low interest rate environment.
On May 5, 2021, we entered into a Credit Facility with Regions Bank. See
Part I, Item 1, Note 7. Commitments and Contingencies
in the notes to our consolidated financial statements, herein, for a description of the Credit Facility. The Credit Facility provides additional liquidity to the Company for short-term and longer-term needs. As of June 30, 2021, we have not borrowed any money under the Credit Facility and have no immediate plans to do so.
June 30, 2021 | 10-Q 47
INSURANCE COMPANY SUBSIDIARY LIQUIDITY AND CAPITAL RESOURCES
The liquidity requirements of our insurance operations are primarily met by premium revenues, investment income and investment maturities. Primary cash needs relate to payments of policy benefits to policyholders, investment purchases and operating expenses. Historically, we have not had to liquidate a material amount of investments to provide cash flow for our insurance operations and we did not do so in the six months ended June 30, 2021. We believe that we have adequate capital resources to support the liquidity requirements of our insurance operations if the cash flow from our insurance operations is insufficient to meet our cash needs. See Contractual Obligations and Off-balance Sheet Arrangements in our
Form 10-K
and below for a discussion of known and estimated cash needs.
In the six months ended June 30, 2021, our operations provided $9.0 million in net cash as compared to $28.6 million provided by operations in the same period in 2020. As mentioned above, we used $8.8 million in cash in the first quarter to pay Mr. Kolander’s severance. Cash provided by operations was also lower, as first year premiums continued to be outpaced by increased surrenders and decreased renewal premiums in our international business. Additionally, increased first year premiums, which have higher costs associated with them than renewal premiums, such as commissions, led to lower cash provided by operations. We have traditionally also had significant cash flows from investing activities due to both scheduled and unscheduled investment security maturities, redemptions, and prepayments. These cash flows, for the most part, are reinvested in fixed income securities and to a lesser extent limited partnerships and other alternative investments. Net cash used in investing activities totaled $4.2 million for the six months ended June 30, 2021 as opposed to $22.8 million used in investing activities for the six months ended June 30, 2020. The investing activities fluctuate from period to period due to timing of securities activities such as calls and maturities and reinvestment of those funds. Cash used in financing activities was $8.8 million in the six months ended June 30, 2021, due primarily to the purchase of the Class B common stock from the Foundation for $9.1 million in March 2021.
Because claims and surrender benefits are our largest expense, a primary liquidity concern is the risk of an extraordinary level of early policyholder surrenders. While surrender benefit expenses increased in the six months ended June 30, 2021 and have been increasing over the last several years, the increases are within expected levels due to the aging of this block of business - a significant portion of surrenders relates to policies that have been in force and have little to no associated surrender charges and endowment products reaching their stated maturities. Death claims also increased in 2021 for the reasons discussed above, which included payment of COVID related death claims that materially impacted our operations. We continue to closely monitor claim volumes to evaluate whether there is a delay in reporting or filing for benefits as a result of the COVID-19 pandemic.
As discussed above, we are subject to regulatory capital requirements that could affect the Company’s ability to access capital from our insurance operations or cause the Company to have to put additional cash in our wholly-owned subsidiaries.
Our domestic companies are subject to minimum capital requirements set by the NAIC in the form of risk-based capital ("RBC"). RBC considers the type of business written by an insurance company, the quality of its assets, and various other aspects of an insurance company's business to develop a minimum level of capital called "Authorized Control Level Risk-Based Capital". This level of capital is then compared to an adjusted statutory capital that includes capital and surplus as reported under statutory accounting principles, plus certain investment reserves. Should the ratio of adjusted statutory capital to control level RBC fall below 200% for our domestic companies, a series of remedial actions by the affected company would be required. Additionally, we have a parental guarantee between Citizens and CICA, Citizens' wholly-owned subsidiary domiciled in Colorado, to maintain a RBC level above 350%. At June 30, 2021, our domestic insurance subsidiaries were above the required minimum RBC levels.
CICA Ltd. is a Bermuda domiciled company. The BMA requires Bermuda insurers to maintain available statutory economic capital and surplus at a level equal to or in excess of the BMA's Enhanced Capital Requirement, which requires a certain Target Capital Level ("TCL"). As of June 30, 2021, CICA Ltd. was above the TCL threshold. At
June 30, 2021 | 10-Q 48
the request of the BMA, on April 15, 2021, Citizens and CICA Ltd. entered into a Keep Well Agreement. The Keep Well Agreement requires Citizens to contribute up to $10 million in capital to CICA Ltd. as necessary to ensure that CICA Ltd. has a minimum capital level of 120%. Since CICA Ltd.’s capital level currently exceeds 120%, Citizens is not currently required to make a capital contribution. Any capital injection that Citizens is required to make under the parental guarantee with CICA or under the Keep Well Agreement with CICA Ltd. could negatively impact the Company’s capital resources and liquidity.
CONTRACTUAL OBLIGATIONS AND OFF-BALANCE SHEET ARRANGEMENTS
As of June 30, 2021, we have no additional contractual obligations or off-balance sheet arrangements other than those described in
Part I
.
Item 1
,
Note 7. Commitments and Contingencies
in the notes to our consolidated financial statements herein and in Part II, Item 7, Contractual Obligations and Off-Balance Sheet Arrangements in our
Form 10-K
. We do not utilize special purpose entities as investment vehicles, nor are there any such entities in which we have an investment that engage in speculative activities of any nature, and we do not use such investments to hedge our investment positions.
CRITICAL ACCOUNTING POLICIES
We believe that the accounting policies set forth in Part I, Item 7, Management’s Discussion and Analysis of Financial Condition and Results of Operations - "Critical Accounting Policies" and Part IV, Item 15, Note 1. Summary of Significant Accounting Policies of our consolidated financial statements in our
Form 10-K
continue to describe the significant judgments and estimates used in the preparation of our consolidated financial statements.
June 30, 2021 | 10-Q 49
Item 3.
QUANTITATIVE AND QUALITATIVE DISCLOSURES ABOUT MARKET RISK
GENERAL
For the Company’s disclosures about market risk, please see Part II, Item 7A, Quantitative and Qualitative Disclosures About Market Risk in our
Form 10-K
. Except as set forth below, there have been no material changes to the Company’s disclosures about market risk in Part II, Item 7A. of our
Form 10-K
. For additional information regarding market risks to which we are subject, see
Part I, Item 1, Note 5. Investments
- "Valuation of Investments" in the notes to our consolidated financial statements herein.
MARKET RISK RELATED TO INTEREST RATES
Our exposure to interest rate changes results from our significant holdings of fixed maturity investments, which comprised 90.1% of our investment portfolio based on carrying value as of June 30, 2021. These investments are mainly exposed to changes in U.S. Treasury rates. Changes in interest rates typically have a sizable effect on the fair values of our fixed maturity securities. The interest rate of the ten-year U.S. Treasury bond increased to 1.45% at June 30, 2021 from 0.93% at December 31, 2020. Net unrealized gains on fixed maturity securities totaled $142.1 million at June 30, 2021, compared to $167.9 million at December 31, 2020, based upon bond interest rates in relation to the U.S. ten-year Treasury yield.
To manage interest risk, we perform periodic projections of asset and liability cash flows to evaluate the potential sensitivity of our investments and liabilities. We assess interest rate sensitivity annually with respect to our AFS fixed maturity securities investments using hypothetical test scenarios that assume either upward or downward shifts in the prevailing interest rates. The changes in fair values of our fixed maturity securities as of June 30, 2021 were within the expected range of this analysis.
There are no fixed maturity securities or other investments classified as trading instruments. All of the Company's fixed maturity securities were classified as AFS at June 30, 2021. At June 30, 2021 and December 31, 2020, we had no investments in derivative instruments or subprime loans.
Item 4.
CONTROLS AND PROCEDURES
EVALUATION OF DISCLOSURE CONTROLS AND PROCEDURES
We maintain disclosure controls and procedures (as defined in Rules 13a-15(e) and 15d-15(e) under the Securities Exchange Act of 1934, as amended (the "Exchange Act")) that are designed to ensure that information required to be disclosed in our reports filed or submitted under the Exchange Act is recorded, processed, summarized and reported within the time periods specified in the SEC’s rules and forms, and that such information is accumulated and communicated to our management, including our principal executive officer and principal financial officer, to allow timely decisions regarding required disclosures.
Our management, including our principal executive officer and principal financial officer, evaluated the effectiveness of our disclosure controls and procedures pursuant to Rules 13a-15(e) and 15d-15(e) under the Exchange Act as of June 30, 2021. Based on such evaluation, our principal executive officer and principal financial officer concluded that our disclosure controls and procedures were effective at a reasonable assurance level as of the end of the period covered by this quarterly report.
CHANGES IN INTERNAL CONTROL OVER FINANCIAL REPORTING
During the three months ended June 30, 2021, there were no changes in the Company's internal control over financial reporting (as defined in rules 13a-15(f) and 15d-15(f) under the Exchange Act) that materially affected, or are reasonably likely to materially affect, our internal control over financial reporting.
June 30, 2021 | 10-Q 50
PART II. OTHER INFORMATION
Item 1.
LEGAL PROCEEDINGS
Part I, Item 3, Legal Proceedings of our
Form 10-K
includes a discussion of our legal proceedings. There have been no material developments in the three and six months ended June 30, 2021 from the legal proceedings described in our
Form 10-K
except as follows:
The Trade Secret Suit filed by the Company, CICA Ltd. and CICA ("Plaintiffs") in the District Court of Travis County, Texas against (i) Randall Riley (“Riley”), a former Citizens executive and son of Citizens’ founder Harold E. Riley, (ii) certain copycat companies formed by Riley, including Citizens American Life, Inc. and Citizens American Life, LLC (collectively, the copycat companies, "CALI") and (iii) Alexis Enrique Delgado, Carlos Nalsen Landa, Enrique Pinzon Ruiz, Johan Emilio Mikuski Silva and Esperanza Peralta de Delgado (collectively, the “Los Raudales Defendants,”), (iv) Michael P. Buchweitz, Jonathan M. Pollio, Jeffrey J. Wood and Steven A. Rekedal, former Citizens executives and employees and, in the case of Steven A. Rekedal, a former Citizens independent consultant (the "Former Citizens Defendants"); (v) First Trinity Financial Corporation, and Trinity American, Inc. (collectively, “First Trinity”) and International Marketing Group S.A., LLC, entities that have founded a business on the exploitation of Citizens’ trade secrets and goodwill, and (vi) Gregg E. Zahn, a First Trinity executive, was previously scheduled for trial in the second quarter of 2021. Due to the COVID-19 pandemic, the jury trial is now expected to occur in the first quarter of 2022.
On June 30, 2021, we filed a no evidence Motion for Summary Judgment against the Los Raudales Defendants seeking dismissal of counterclaims for tortious interference brought by the Los Raudales Defendants. The Los Raudales Defendants subsequently dismissed these counterclaims.
On June 30, 2021, (i) all of the Defendants filed a traditional and no evidence Motion for Partial Summary Judgment against Plaintiffs' non-trade secret claims for unfair competition, tortious interference with contract, conspiracy and unjust enrichment; (ii) the Los Raudales Defendants filed a no evidence Motion for Partial Summary Judgment against Plaintiffs' claims against such defendants; (iii) Defendant Michael P. Buchweitz filed a traditional and no evidence Motion for Summary Judgment against Plaintiffs' claim for breach of contract; (iv) Defendants Gregg E. Zahn and Jeffrey J. Wood filed a traditional and no evidence Motion for Summary Judgment against Plaintiffs' claims of trade secret misappropriation, common law unfair competition, unjust enrichment and conspiracy; and (v) Defendant Jonathan Pollio filed a traditional and no evidence Motion for Partial Summary Judgment on our' breach of contract claim. Essentially, the Defendants argue that claims other than the trade secrets claims that we brought under the Texas Uniform Trade Secrets Act ("TUTSA") are pre-empted by TUTSA. We disagree and have filed motions in opposition to Defendants various Summary Judgment motions. The District Court is in the process of hearing Defendants' motions and as of the date hereof has not yet rendered decisions on any of the motions and thus all of our claims against Defendants remain pending.
Item 1A.
RISK FACTORS
Part I, Item 1A, Risk Factors of our
Form 10-K
includes a discussion of our risk factors. There have been no material changes in the three and six months ended June 30, 2021 from the risk factors included in our
Form 10-K
.
Item 2.
UNREGISTERED SALES OF EQUITY SECURITIES AND USE OF PROCEEDS
None.
Item 3
.
DEFAULTS UPON SENIOR SECURITIES
Not applicable.
June 30, 2021 | 10-Q 51
Item 4.
MINE SAFETY DISCLOSURES
Not applicable.
Item 5.
OTHER INFORMATION
None.
Item 6.
EXHIBITS
|
Exhibit
Number
|
The following exhibits are filed herewith: | |||||||
| 101* | Inline XBRL Document Set for the condensed consolidated financial statements and accompanying notes in Part I, Item 1, Financial Statements of this Quarterly Report on Form 10-Q* | |||||||
| 104* | Inline XBRL for the cover page of this Quarterly Report on Form 10-Q, included in the Exhibit 101 Inline XBRL Document Set* | |||||||
* Filed herewith.
† Indicates management contract or compensatory plan or arrangement.
June 30, 2021 | 10-Q 52
SIGNATURES
Pursuant to the requirements of the Securities Exchange Act of 1934, the Registrant has duly caused this report to be signed on its behalf by the undersigned thereunto duly authorized.
| CITIZENS, INC. | |||||||||||
| By: | /s/ Gerald W. Shields | ||||||||||
| Gerald W. Shields | |||||||||||
| Interim Chief Executive Officer & President | |||||||||||
| By: | /s/ Jeffery P. Conklin | ||||||||||
| Jeffery P. Conklin | |||||||||||
| Vice President, Chief Financial Officer & Treasurer | |||||||||||
| Date: | August 4, 2021 | ||||||||||
June 30, 2021 | 10-Q 53
TABLE OF CONTENTS
Part I, Item 1a, Risk Factors Of OurItem 2. Unregistered Sales Of Equity Securities and Use Of ProceedsItem 3. Defaults Upon Senior SecuritiesItem 4. Mine Safety DisclosuresItem 5. Other InformationItem 6. Exhibits