CIENA CORP
10-Ks and 10-Qs
|
|
|
|
|
|
|
|
|
|
|
|
|
|
|
|
|
|
|
|
|
|
|
|
|
|
|
|
|
|
|
|
|
|
|
|
|
|
|
|
|
|
|
|
|
|
|
|
|
|
|
|
|
|
|
|
|
|
|
UNITED STATES
SECURITIES AND EXCHANGE COMMISSION
Washington, D.C. 20549
FORM 10-K
(Mark One)
|
þ
|
|
ANNUAL REPORT PURSUANT TO SECTION 13 OR 15(d)OF THE SECURITIES EXCHANGE ACT OF 1934
|
|
|
|
|
For the fiscal year ended
|
October 31, 2015
|
OR
|
o
|
|
TRANSITION REPORT PURSUANT TO SECTION 13 OR 15(d)OF THE SECURITIES EXCHANGE ACT OF 1934
|
|
|
|
For the transition period from
to
|
Commission file number
001-36250
Ciena Corporation
(Exact name of registrant as specified in its charter)
|
Delaware
|
|
23-2725311
|
|
(State or other jurisdiction of
|
|
(I.R.S. Employer
|
|
Incorporation or organization)
|
|
Identification No.)
|
|
|
|
|
|
7035 Ridge Road, Hanover, MD
|
|
21076
|
|
(Address of principal executive offices)
|
|
(Zip Code)
|
(410) 694-5700
(Registrant’s telephone number, including area code)
Securities registered pursuant to Section 12(b) of the Act:
|
Title of Each Class
|
|
Name of Each Exchange on Which Registered
|
|
Common Stock, $0.01 par value
|
|
New York Stock Exchange
|
Securities registered pursuant to Section 12(g) of the Act:
None
Indicate by check mark if the registrant is a well-known seasoned issuer, as defined in Rule 405 of the Securities Act. YES
þ
NO
o
Indicate by check mark if the registrant is not required to file reports pursuant to Section 13 or Section 15(d) of the Act. YES
o
NO
þ
Indicate by check mark whether the registrant: (1) has filed all reports required to be filed by Section 13 or 15(d) of the Securities Exchange Act of 1934 during the preceding 12 months (or for such shorter period that the registrant was required to file such reports), and (2) has been subject to such filing requirements for the past 90 days. YES
þ
NO
o
Indicate by check mark whether the registrant has submitted electronically and posted on its corporate Web site, if any, every Interactive Data File required to be submitted and posted pursuant to Rule 405 of Regulation S-T (§232.4-5 of this chapter) during the preceding 12 months (or for such shorter period that the registrant was required to submit and post such files). YES
þ
NO
o
Indicate by check mark if disclosure of delinquent filers pursuant to Item 405 of Regulation S-K is not contained herein, and will not be contained, to the best of registrant’s knowledge, in definitive proxy or information statements incorporated by reference in Part III of this Form 10-K or any amendment to this Form 10-K.
o
Indicate by check mark whether the registrant is a large accelerated filer, an accelerated filer, a non-accelerated filer, or a smaller reporting company. See the definitions of “large accelerated filer,” “accelerated filer” and “smaller reporting company” in Rule 12b-2 of the Act. (Check one):
|
Large accelerated filer
þ
|
|
Accelerated filer
o
|
|
Non-accelerated filer
o
|
|
Smaller reporting company
o
|
|
(Do not check if a smaller reporting company)
|
||||||
Indicate by check mark whether the registrant is a shell company (as defined in Rule 12b-2 of the Exchange Act) YES
o
NO
þ
The aggregate market value of the Registrant’s Common Stock held by non-affiliates of the Registrant was approximately
$2.5 billion
based on the closing price of the Common Stock on the New York Stock Exchange on May 1, 2015.
The number of shares of Registrant’s Common Stock outstanding as of December 11, 2015 was
135,790,185
.
DOCUMENTS INCORPORATED BY REFERENCE
Part III of the Form 10-K incorporates by reference certain portions of the Registrant’s definitive proxy statement for its
2016
Annual Meeting of Stockholders to be filed with the Commission not later than 120 days after the end of the fiscal year covered by this report.
CIENA CORPORATION
ANNUAL REPORT ON FORM 10-K
FOR FISCAL YEAR ENDED
OCTOBER 31, 2015
TABLE OF CONTENTS
|
|
Page
|
|
|
|
|
|
|
|
|
|
|
|
|
|
|
|
|
|
|
|
|
|
|
|
|
|
|
|
|
|
|
|
|
|
2
This annual report contains statements that discuss future events or expectations, projections of results of operations or financial condition, changes in the markets for our products and services, trends in our business, business prospects and strategies and other “forward-looking” information. In some cases, you can identify “forward-looking statements” by words like “may,” “will,” “should,” “expects,” “plans,” “anticipates,” “believes,” “estimates,” “predicts,” “intends,” “potential” or “continue” or the negative of those words and other comparable words. These statements may relate to, among other things, adoption of next-generation network technology and software programmability and control of networks; our competitive landscape; factors impacting our industry; factors impacting the businesses of network operators and their network architectures; our corporate strategy, including our research and development, supply chain and go-to-market initiatives; efforts to increase application of our solutions in customer networks and to increase the reach of our business into new or growing customer and geographic markets; our backlog and seasonality in our business; our acquisition of Cyan, Inc. and its impact on our business and results of operations; expectations for our financial results, revenue, gross margin, operating expense and key operating measures in future periods; the adequacy of our sources of liquidity to satisfy our working capital needs, capital expenditures, and other liquidity requirements; business initiatives including real estate and IT transitions or initiatives; and market risks associated with financial instruments and foreign currency exchange rates. These statements are subject to known and unknown risks, uncertainties and other factors, and actual events or results may differ materially due to factors such as:
|
•
|
our ability to execute our business and growth strategies;
|
|
•
|
fluctuations in our revenue and operating results and our financial results generally;
|
|
•
|
the loss of any of our large customers, a significant reduction in their spending, or a material change in their networking or procurement strategies;
|
|
•
|
the competitive environment in which we operate;
|
|
•
|
market acceptance of products and services currently under development and delays in product or software development;
|
|
•
|
lengthy sales cycles and onerous contract terms with communications service providers, Web-scale providers and other large customers;
|
|
•
|
product performance problems and undetected errors;
|
|
•
|
our ability to diversify our customer base beyond our traditional customers and broaden the application for our solutions in communications networks;
|
|
•
|
the international scale of our operations and fluctuations in currency exchange rates;
|
|
•
|
our ability to accurately forecast demand for our products for purposes of inventory purchase practices;
|
|
•
|
our ability to enforce our intellectual property rights, and costs we may incur in response to intellectual property right infringement claims made against us;
|
|
•
|
the continued availability on commercially reasonable terms of software and other technology under third party licenses;
|
|
•
|
failure to maintain the security of confidential, proprietary or otherwise sensitive business information or systems or to protect against cyber security attacks;
|
|
•
|
the performance of our third party contract manufacturers;
|
|
•
|
changes or disruption in components or supplies provided by third parties, including sole and limited source suppliers;
|
|
•
|
our ability to effectively manage our relationships with third party service partners and distributors;
|
|
•
|
unanticipated risks and additional obligations in connection with our resale of complementary products or technology of other companies;
|
|
•
|
our exposure to the credit risks of our customers and our ability to collect receivables;
|
|
•
|
modification or disruption of our internal business processes and information systems;
|
|
•
|
the effect of our outstanding indebtedness on our liquidity and business;
|
|
•
|
fluctuations in our stock price and our ability to access the capital markets to raise capital;
|
|
•
|
unanticipated expenses or disruptions to our operations caused by facilities transitions or restructuring activities;
|
|
•
|
inability to attract and retain experienced and qualified personnel;
|
|
•
|
disruptions to our operations caused by strategic acquisitions and investments or the inability to achieve the expected benefits and synergies of newly-acquired businesses;
|
|
•
|
our ability to integrate Cyan, Inc. into our operations and to use that acquisition to grow our software business;
|
|
•
|
changes in, and the impact of, government regulations, including with respect to: the communications industry generally; the business of our customers; the use, import or export of products; and the environment, potential climate change and other social initiatives;
|
|
•
|
impairment charges caused by the write-down of goodwill or long-lived assets;
|
|
•
|
our ability to maintain effective internal controls over financial reporting and liabilities that result from the inability to comply with corporate governance requirements; and
|
3
|
•
|
adverse results in litigation matters.
|
These are only some of the factors that may affect the forward-looking statements contained in this annual report. For a discussion identifying additional important factors that could cause actual results to vary materially from those anticipated in the forward-looking statements, see “Management’s Discussion and Analysis of Financial Condition and Results of Operations” and “Risk Factors” in this annual report. You should review these risk factors for a more complete understanding of the risks associated with an investment in our securities. However, we operate in a very competitive and rapidly changing environment and new risks and uncertainties emerge, are identified or become apparent from time to time. It is not possible for us to predict all risks and uncertainties that could have an impact on the forward-looking statements contained in this annual report. You should be aware that the forward-looking statements contained in this annual report are based on our current views and assumptions. We undertake no obligation to revise or update any forward-looking statements made in this annual report to reflect events or circumstances after the date hereof or to reflect new information or the occurrence of unanticipated events, except as required by law. The forward-looking statements in this annual report are intended to be subject to protection afforded by the safe harbor for forward-looking statements contained in the Private Securities Litigation Reform Act of 1995.
Overview
We are a network specialist focused on providing communications networking solutions that enable a wide range of network operators to adopt next-generation architectures. We have optimized our business and solutions to enable network operators to create and deliver the broad array of high-bandwidth services relied upon by enterprise and consumer end users. We provide equipment, software and services that support the transport, switching, aggregation, service delivery and management of voice, video and data traffic on communications networks. In addition to our high-capacity hardware platforms, we offer network management and control software platforms that help network operators simplify and automate their networks and virtualize certain network functions. Our solutions are designed to enable network operators to adopt open, multi-vendor, software-programmable network infrastructures that improve automation, reduce network complexity and flexibly support changing service requirements. Our solutions yield business and operational value for our customers by enabling them to introduce new, revenue-generating services and to reduce network complexity and expense.
Our Converged Packet Optical, Packet Networking and Optical Transport products are used, individually or as part of an integrated solution, by communications service providers, cable and multiservice operators, Web-scale providers, submarine network operators, governments, enterprises, research and education (R&E) institutions and other network operators across the globe. Our products, which support applications from the network core to network access points, allow network operators to scale capacity, increase transmission speeds, allocate traffic and adapt dynamically to changing end-user service demands. Our software solutions are oriented around our Blue Planet software platform, a modular, network virtualization, service orchestration and network management software platform designed to simplify the creation, automation and delivery of services across multi-vendor and multi-domain network environments. To complement our hardware and software solutions, we offer a broad range of network transformation and related support services that help our customers design, optimize, deploy, manage and maintain their networks.
The rapid proliferation of communications services and devices, together with increased mobility, growth in video, cloud-based services and data center interconnection, have fundamentally affected the bandwidth and service demands placed upon communications networks. As the capacity of their network infrastructures are pressured, many network operators also face a rapidly changing business environment and shifting competitive landscape. Newer market entrants, such as cloud service and over-the-top content providers, are challenging certain traditional business models. Our OP
n
Architecture, which enables increased network scalability, flexibility and programmability, is designed to meet these challenges. It allows for network-level software applications to control and configure the network dynamically, while flexible interfaces integrate computing, storage and other network resources. This approach enables highly configurable network infrastructures that can meet the “on-demand” service requirements of both our customers and their end-users. By enhancing software-based management and control, enabling network functions to be provided virtually, and reducing required network elements, our OP
n
approach optimizes network infrastructures. At the same time, it increases network scale at reduced cost and simplifies the management, deployment and orchestration of multi-vendor hardware and software elements. Our OP
n
Architecture, which underpins our solutions offering and guides our research and development strategy, is described more fully in the “Strategy” section below.
Acquisition of Cyan, Inc.
4
On August 3, 2015, we acquired Cyan, Inc. (“Cyan”), a leading provider of software-defined networking (SDN), network functions virtualization (NFV), and metro packet-optical solutions, in a cash and stock transaction. See Note
2
to the Consolidated Financial Statements found in Item 8 of Part II of this annual report for information relating to the terms of this transaction.
We believe that Cyan's best-in-class Blue Planet software platform will significantly strengthen our software offering and accelerate the strategy behind our OP
n
network approach. The Blue Planet software platform offers multi-vendor network and service orchestration and next-generation network management software solutions designed to automate, orchestrate, and manage the lifecycle of virtualized services across data centers and the wide area network (WAN). Further strengthening our leadership in packet-optical hardware solutions, Cyan also brings a metro packet-optical business with a complementary base of key customers for its family of Z-Series high-capacity, multi-layer switching and transport platforms. We believe that this strategic acquisition will accelerate our availability to offer a complete, on-demand solution for virtualized networks and services in an open ecosystem, and will increase our opportunity to play a leading role in the transformation of the network from the delivery of capacity to the creation of service capability on-demand.
Certain Financial Information and Segment Data
We generated revenue of
$2.4 billion
in fiscal
2015
, as compared to
$2.3 billion
in fiscal
2014
. Sales to AT&T were
$423.5 million
, or
18.5%
of total revenue in
fiscal 2014
, and
$487.8 million
, or
19.9%
of total revenue in
fiscal 2015
. We did not have any other customers accounting for greater than 10% of our revenue in
fiscal 2014
or
fiscal 2015
. For more information regarding our results of operations, see “Management's Discussion and Analysis of Financial Condition and Results of Operations” in Item 7 of Part II of this annual report. During fiscal 2015, we continued to organize our operations into four separate operating segments: “Converged Packet Optical;” “Packet Networking;” “Optical Transport;” and “Software and Services.” See Notes 21 and 24 to the Consolidated Financial Statements found in Item 8 of Part II of this annual report for information related to our segment results for fiscal 2015 and our updated operating segments for fiscal 2016, respectively.
The matters discussed in this “Business” section should be read in conjunction with the Consolidated Financial Statements found in Item 8 of Part II of this annual report, which include additional financial information about our operating segments, total assets, revenue, measures of profit and loss, and financial information about geographic areas and customers representing greater than 10% of revenue.
Corporate Information and Access to SEC Reports
We were incorporated in Delaware in November 1992 and completed our initial public offering on February 7, 1997. Our principal executive offices are located at 7035 Ridge Road, Hanover, Maryland 21076. Our telephone number is (410) 694-5700, and our website address is www.ciena.com. We make our annual reports on Form 10-K, quarterly reports on Form 10-Q, current reports on Form 8-K, and amendments to those reports, available free of charge in the “Investors” section of our website as soon as reasonably practicable after we file these reports with the Securities and Exchange Commission (the “SEC”). We routinely post the reports above, recent news and announcements, financial results and other important information about our business on our website at www.ciena.com. Information contained on our website is not a part of this annual report.
Industry Background
The markets in which we sell our communications networking solutions have been subject to significant changes in recent years. Network operators face rapid growth in network traffic, technology convergence and evolving cloud-based service offerings and end-user demands. Increased connectivity and growing demand for bandwidth and expanded service requirements have created significant demands on the network infrastructures of many network operators. While network operators seek to grow revenue and manage the costs of their network, many face competitive pressures that challenge their business models. These pressures include new market entrants, such as Web-scale providers, and competing business models. We believe that these dynamics, and the need to adapt to changing business conditions, are creating an environment that will cause network operators to increasingly adopt infrastructures that are more open, programmable and automated. We also believe that these conditions will require network operators and vendors alike to seek to utilize an open ecosystem of physical and virtual network resources provided by a variety of third parties, driving increased openness and interoperability of network infrastructures.
Network Traffic Growth Driving Increased Capacity Requirements and Transmission Speeds
Optical networks, which carry voice, video and data traffic using multiple wavelengths of light across fiber optic cables, have experienced a multi-year period of strong traffic growth. Increased network traffic is being driven by significant technology shifts including:
5
|
•
|
Growth in Mobile Devices and Applications.
Traffic from mobile applications, including Internet, video and data services, has expanded with the proliferation of smartphones, tablets and other wireless devices.
|
|
•
|
Adoption and Reliance upon Bandwidth-Intensive Applications.
Business customers are increasingly dependent upon enterprise services and data center connectivity that facilitate global operations, employee mobility and access to critical business applications and data. At the same time, consumer-oriented applications and adoption of broadband technologies, including peer-to-peer Internet applications, video services, and multimedia downloads, have added to network traffic demands.
|
|
•
|
Growth in Cloud Computing and Content Delivery.
Enterprises and consumers are continuing to adopt cloud-based technologies and service offerings that host key applications, store data, enable the viewing and downloading of content, and utilize on-demand computing resources.
|
We believe that this traffic growth will require network operators to adopt higher capacity networks with increased transmission speeds, particularly in regional and metropolitan networks and switching applications.
Changes Impacting our Network Operator Customers
We believe the following are illustrative of the significant technology and service changes impacting the businesses of network operators and their design and adoption of next-generation network infrastructures.
|
•
|
“Cloud” Services.
Cloud services are characterized by the sharing of remotely hosted computing, storage and network resources across a network to improve economics through higher utilization of networked elements. Prevalent cloud-based services include Platform as a Service (PaaS), Software as a Service (SaaS) and Infrastructure as a Service (IaaS). Through cloud-based arrangements, smaller enterprises and consumers can subscribe to an expanding range of services to replace locally-housed computing and storage requirements. Larger enterprises and data center operators can use private clouds to consolidate their own resources and public clouds to accommodate peak demand situations, sometimes in combination. Today, infrastructures exist to dynamically allocate centralized storage and computing resources from the cloud to end users and network architectures must be capable of being adapted in real time to changing capacity requirements and locations.
|
|
•
|
Mobility.
Smart mobile devices and tablets that deliver integrated voice, audio, photo, video, email and mobile Internet capabilities are rapidly changing the services and data traffic carried by wireless networks. Because most wireless traffic ultimately travels over a wireline network in order to reach its destination, growth in mobile communications continues to place demands upon wireline networks. As a result, network architectures must be able to adapt and scale capacity cost-effectively to address a changing mix of end user services.
|
|
•
|
Over-the-Top (OTT) Content
. Providers of OTT content are challenging the business models of certain network operators. OTT content refers to video, television and other services delivered directly from the content provider to the viewer or end user. These services are delivered and the Internet connections are provided by a different network operator than the content provider. OTT content is imposing significant demands upon the infrastructures of communications service providers and multi-service operators as bandwidth-intensive traffic associated with this content continues to grow.
|
|
•
|
On-Demand Services
. The application-centric, cloud-driven world is changing user bandwidth consumption patterns. Network service users want to be connected to content and bandwidth whenever they desire, leading to less predictable traffic patterns and usage. To address this trend, many network operators are looking to adopt programmable network infrastructures that enable them to dynamically shift and allocate resources, on demand.
|
|
•
|
Internet of Things
. As the number of networked connections between devices and servers grows, machine-to-machine (M2M)-related traffic is expected to represent an increasing portion of traffic in what some refer to as the “Internet of Things”. These device-to-device connections can provide value-added services and allow users to share data that can be monitored and analyzed by applications residing on various devices. We expect service traffic relating to the interconnection of machines or devices to grow as Internet and cloud-based content delivery, smartgrid applications, health care and safety monitoring, resource/inventory management, home entertainment, consumer appliances and other mobile data applications become more widely adopted.
|
Network Transition to Open, Software Programmable Network Architectures
6
By leveraging software programmability, network operators can adapt more quickly to changing end-user demands, provide network functions virtually on demand, and enable more efficient service delivery. We expect network operators increasingly to look to adopt networking strategies, including one or more of the following, that rely upon software to enable more open and programmable network infrastructures:
|
•
|
Software-Defined Networking (SDN).
In traditional networking approaches, network resources are managed individually, focusing on the needs of a particular network element instead of the needs of the applications that network element enables. SDN seeks to separate or abstract that control from individual network elements, replacing it with a standard network control protocol. The result provides end-to-end visibility of network flows, enabling the ability to optimize traffic paths and programmatically control data flows through a network. SDN seeks to simplify networks, creating more open environments that ease manageability, support automation, and more quickly deliver customized services to end users.
|
|
•
|
Network Function Virtualization (NFV)
. Virtualization is the decoupling of physical IT or communications assets from the services or capabilities they can provide. These virtualization principles — previously applied to computing and storage resources — are now being applied to communications networks, with certain hardware-based network functions now capable of being virtualized and enabled via software. Through NFV, network operators can eliminate costly, single-function or dedicated network appliances, such as firewalls and wide area network (WAN) accelerators, and obtain the same functionality provided by those appliances virtually over centralized, generic servers. We believe that NFV can decrease power and space requirements, reduce cost, and improve network flexibility.
|
We believe that network operator adoption of these approaches and similar efforts to increase network software programmability and control of communications networks will require network operators and vendors alike to increasingly look to utilize an ecosystem of physical and virtual network resources provided by multiple third parties. We expect that these network architectural approaches, in turn, will drive increased openness and interoperability of multi-vendor, multi-domain network environments, requiring an increased degree of cooperation among us and other solutions providers, including our competitors.
Strategy
Our corporate strategy to capitalize on the market dynamics above, promote operational efficiency and drive the profitable growth of our business includes the following initiatives:
Promote our
OP
n
A
rchitecture.
We intend to promote our OP
n
Architecture as the preferred approach for network operators to transition to next-generation networks and address the industry dynamics described above. Our OP
n
Architecture enables a programmable infrastructure that brings together the reliability and capacity of optical networking with the flexibility and economics of packet networking technologies. Our OP
n
Architecture leverages this convergence to enable network operators to scale their networks efficiently and cost effectively, while applying advanced software-based network management and control for enhanced programmability. The software-driven aspects of this architecture become increasingly important as we expect network operators increasingly to seek to utilize an open ecosystem that enables multi-vendor and multi-domain network management and virtualized resources required for next-generation network architectures. We see opportunities to drive the evolution of network infrastructures by offering a portfolio of solutions, including our Blue Planet software platform, that can accelerate the realization of our OP
n
Architecture.
Extend Technology Leaderships and Expand Application of Our Solutions.
Our product development strategy is focused on maintaining our technology leadership and expanding our role in customer networks to support service delivery and additional network applications. Our research and development efforts seek to extend our existing technologies, including our WaveLogic coherent optical processor for 200G and 400G optical transport, and to introduce terabit per second and greater transmission speeds. We are also focused on expanding high-capacity service delivery capabilities in our Packet Networking and Converged Packet Optical products for metro networks, data center interconnectivity and WAN applications. Separately, we are increasing the scale, density and capability of our packet offerings, reducing power and space requirements, and enabling NFV capabilities for applications in metro networks, user aggregation and data center connectivity. We are also focused on increasing software programmability of networks and enabling network operators to automate and accelerate the creation and delivery of new, cloud-based services. These efforts include investments in our Blue Planet software platform — which is designed to automate, orchestrate, and manage physical network resources and virtualized services across data centers and the WAN —and its integration across our portfolio and with additional third party network resources.
7
Expand our Role and Reach through Go-to-Market Model.
To address the industry dynamics described above, we believe that it is important to secure customer relationships with a diverse set of traditional communications service providers and Web-scale providers, as we expect that their purchasing and network decisions will become increasingly interdependent. As such, our go-to-market model is focused on driving sales growth by diversifying our business with existing customers and penetrating additional customer verticals and international markets.
Our sales and marketing efforts seek to promote increased sales to existing customers, particularly through opportunities that expand our role or the application of our solutions within their network and business. We are pursuing opportunities to increase adoption of our packet access and aggregation solutions, and to secure market share of our Blue Planet software platform, including within our existing customers base. We are also focused on opportunities to support metro aggregation, data center interconnectivity, managed services offerings, cloud-based services, submarine networks, business Ethernet services and mobile backhaul. We intend to leverage our existing customer relationships to increase sales and promote the adoption of our solutions as our customers scale and evolve their networks.
We also intend to target important growth markets, including key customer market segments and geographies. Our go-to-market strategy is focused on further penetrating Internet content providers, data center operators and other emerging network operators that form the “Web-scale” marketplace. We intend to use our direct and indirect sales channels to target and expand our sales with several other market verticals, including cable and multiservice operators, submarine network operators, enterprise customers and in the government, research and education (R&E) markets. We are also focused on securing additional communications service provider customers in outside of North America, including in high-growth geographies such as Brazil and India. We believe that this is an important part of our strategy and necessary for continued revenue growth. To leverage the geographic reach of our direct sales resources and expand sales into key geographies, we have pursued channel and distribution opportunities, including our strategic relationship with Ericsson, that enable sales through third parties, including service providers, systems integrators and value-added resellers.
Optimize Business to Yield Operating Leverage.
We are actively pursuing initiatives to improve our operating margin, constrain operating expense and redesign certain business processes, systems, and resources. These initiatives include portfolio optimization and engineering efforts to drive improved efficiencies in the design and development of our solutions and supply procurement initiatives to ensure that our product cost model remains ahead of market-based price erosion. We are also focused on transforming our supply chain, including efforts to reduce our material and overhead costs, reduce customer lead times and improve inventory management and logistics. Our initiatives also include significant investments in the re-engineering of company-wide enterprise resource planning platforms, improved automation of key business processes and systems, and the off-shoring of certain business functions. We seek to leverage these initiatives to promote the profitable growth of our business and to drive additional operating leverage.
Customers and Markets
We sell our product and service solutions through direct and indirect sales channels to network operators in the following customer and market segments.
Communications Service Providers
Our service provider customers include regional, national and international wireline and wireless carriers. Communications service providers are our historical customer base and continue to represent a significant majority of our revenue. We provide service providers with products from the wireline network core to its edge where end users gain access. Our service provider solutions address growing bandwidth demand from multiservice traffic growth and support key service provider offerings, including carrier-managed services, WAN consolidation, data center and inter-site connectivity, wireless backhaul and business Ethernet services.
Cable & Multiservice Operators (MSO)
Our customers include leading cable and multiservice operators in the United States and internationally. Our cable and multiservice operator customers rely upon us for carrier-grade Ethernet transport and switching products and high-capacity coherent optical transport. Our platforms allow cable operators to integrate voice, video and data applications over a converged infrastructure and to scale their networking infrastructure to keep ahead of the bandwidth and application demands of their subscribers. Our products support key cable applications, including business Ethernet services, wireless backhaul, broadcast and digital video, voice over IP, and video on demand.
Web-scale Providers
8
Our customers include a diverse range of Internet content providers focused on applications such as search, social media, video, real-time communications and cloud-based offerings to consumers and enterprises. Customers within this segment also include data center operators and other emerging network operators that are often focused on virtualized infrastructure and Ethernet exchanges. These customers are sometimes collectively included in a customer segment referred to as “Web-scale” providers or "Web 2.0." These customers often require massive scale, low latency, reliability and performance to interconnect critical data centers and connect end users to network resources and content.
Enterprise
Our enterprise customers include large, multi-site commercial organizations, including participants in the financial, health care, transportation, utilities, energy and retail industries. Our products enable inter-site connectivity between data centers, sales offices, manufacturing plants, retail stores and research and development centers, using an owned or leased private fiber network or a carrier-managed service. Our products facilitate key enterprise applications including IT virtualization, cloud computing, business Ethernet services, business continuity, online collaboration, video conferencing, low latency networking and WAN encryption. Our products also enable our enterprise customers to prevent unexpected network downtime and ensure the safety, security and availability of their data.
Government, Research and Education (R&E)
Our government customers include federal and state agencies in the United States as well as international government entities. Our R&E customers include research and education institutions in the United States and abroad, as well as communities or consortia including leaders in research, academia, industry and government. Customers in this segment seek to take advantage of technology innovation, improve their information infrastructure and facilitate increased collaboration. Our solutions feature ultra-high capacity required to meet the requirements of supercomputing systems, as well as network assurance and security features required by customers in this space.
Submarine Network Operators
Our customers include service providers and consortia operators of submarine communications networks across the globe. Our submarine line terminal equipment (SLTE) helps submarine network operators build new networks and upgrade submarine networks to increase transmission speeds and capacity as they address rapid traffic growth, including from Web-scale providers. In recent years, we have had market success in enabling operators to upgrade terrestrial equipment located at the end of submarine networks, extending the value and life of their existing, submerged plant infrastructure. As traffic growth continues globally, we believe that the same trends impacting the terrestrial market will impact the submarine market, requiring further investment and the adoption of network approaches that improve economies of scale, cost per bit and end-to-end latency.
Products and Services
Our product portfolio consists of our Converged Packet Optical, Packet Networking and Optical Transport products. Our product offering also includes a suite of software solutions that unify our product portfolio and provide enhanced network automation, software-defined management and control features, and NFV to enable efficient service delivery. These products, together with our network transformation and support services offerings, allow us to offer comprehensive solutions to customers that address their communications network priorities.
Converged Packet Optical
Our Converged Packet Optical portfolio includes networking solutions optimized for the convergence of coherent optical transport, OTN switching and packet switching.
Using our coherent optical transport technology, our 6500 Packet-Optical Platform provides a flexible and scalable dense wavelength division multiplexing (DWDM) solution that adds capacity to core, regional and metro networks and enables efficient transport at high transmission speeds. Our 6500 Packet-Optical Platform features our WaveLogic coherent optical processors. The third generation of our custom silicon chipset is now in the market. WaveLogic facilitates deployment over existing fiber plant (terrestrial and submarine), scales capacity to 40G, 100G and greater transmission speeds, and minimizes the need for certain network equipment, such as amplifiers, regenerators and dispersion compensation devices. Our 6500 Packet-Optical Platform also includes certain integrated switching elements, addressing market demand for converged network features, functions and layers to drive more robust and cost-effective network infrastructures. This platform, which includes
9
several chassis sizes and a comprehensive set of line cards optimized for individual services or applications, can be used throughout the network, from customer premises to metropolitan networks, to the regional core, where the need for high capacity and carrier-class performance is essential.
This portfolio also includes our 5400 Family of products that provide packet switching capability to allocate network capacity efficiently and enable rapid service delivery. Our 5430 Reconfigurable Switching System includes a family of multi-terabit reconfigurable switching systems that utilize intelligent mesh networking to provide resiliency and feature an integrated optical control plane to automate the provisioning and bandwidth control of high-capacity services. These platforms flexibly support a mix of Carrier Ethernet/MPLS, OTN, WDM, and SONET/SDH switching to facilitate the transition to a service-enabling infrastructure. Our CoreDirector® Multiservice Optical Switch and 5430 Reconfigurable Switching System offer multiservice, multi-protocol switching systems that consolidate the functionality of an add/drop multiplexer, digital cross-connect and packet switch into a single, high-capacity intelligent switching system. These products address both core and metro segments of communications networks and support key managed services, including Ethernet/TDM Private Line and IP services.
In May 2015, we launched our Waveserver™ product. Waveserver is a stackable data center interconnect (DCI) platform that allows network operators, including Web-scale providers and data center operators, to scale bandwidth quickly and to support high-speed data transfer, virtual machine migration and disaster recovery/backup between data centers. Waveserver is a specialized platform, purpose-built for connecting data centers within a single metro area. It is optimized for the capacity, speed, space and power requirements of data center environments. Waveserver is designed to leverage the data server user experience, with open application programming interfaces (APIs) and server-like deployment, provisioning and programmability via smart devices. We believe this product expands our role and market opportunity beyond our current Converged Packet Optical solutions offering and enables us to diversify further our business through sales to additional customer verticals.
Our Converged Packet Optical solutions also include our family of Z-Series high-capacity, multi-layer switching and transport platforms acquired from Cyan. Our Z-Series family is used in regional and metro networks and is designed to support a variety of use cases including increasing capacity for optical transport, traffic aggregation at the network edge and switching optimized for handoff at the network core.
Packet Networking
Our Packet Networking products allow customers to deliver new, revenue-generating services to consumer and enterprise end users. These products have applications from the edge of metro and core networks, where they aggregate traffic, to the access tiers of networks where they can be deployed to support wireless backhaul infrastructures and to deliver business data services. Our Packet Networking products facilitate network simplicity and cost effectiveness, including reduced costs associated with power and space, as compared to traditional IP routing network designs. These solutions also enable a flexible and open architecture that reduces the complexity of growing networks and enables network infrastructures to adapt to new service demands of end users.
Our Packet Networking portfolio includes our 8700 Packetwave platform, a multi-terabit packet switching platform for high-density metro networks and inter-data center wide area networks. The 8700 combines high-capacity Ethernet switching and optical transport technologies for both data center networks and metro networks, to help network operators rapidly deliver cloud-based services, streaming video, and Internet content distribution, efficiently aggregate users, and provide express connections to data centers. By increasing the traffic density while reducing power and space requirements, the 8700 also enables network operators to reduce capital and operating expense associated with their networks and to simplify service management and enablement.
To date, revenue from our Packet Networking segment has been primarily related to our 3000 family of service delivery switches and service aggregation switches, and our 5000 family of service aggregation switches. Our 3000 and 5000 families support the access and aggregation tiers of communications networks and have principally been deployed to support business data services and wireless backhaul infrastructures. Employing sophisticated, carrier-grade Ethernet switching technology, these products deliver “quality of service” capabilities, virtual local area networking and switching functions, and carrier-grade operations, administration, and maintenance features. Our Service-Aware Operating System (SAOS) software is employed in our Packet Networking and Converged Packet Optical platforms to provide a common set of advanced Ethernet features and to incorporate key Operations, Administration, and Maintenance (OA&M) features to support the network and service performance monitoring requirements of large-scale Ethernet deployments. We believe our SAOS is a key differentiator in the market, enabling reduced cost and improving operational efficiency from the network edge to core with consistent system and service attributes.
10
Optical Transport
Our Optical Transport products include stand-alone WDM and SONET/SDH-based optical transport solutions that add capacity to core, regional and metro networks and enable cost-effective and efficient transport of voice, video and data traffic at high transmission speeds. The products in this segment principally include the 4200 Advanced Services Platform, Corestream® Agility Optical Transport System, 5100/5200 Advanced Services Platform, Common Photonic Layer (CPL) and 6100 Multiservice Optical Platform. Our Optical Transport portfolio includes our traditional SONET/SDH transport and data networking products, as well as certain enterprise-oriented transport solutions that support storage and LAN extension, interconnection of data centers, and virtual private networks.
Software and Services
Historically, our software business has principally consisted of the development and licensing of element and network management software and software-related services that support our hardware offerings. In connection with our acquisition of Cyan during the fourth quarter of fiscal 2015, we unified the software resources and activities of both companies under a single brand and comprehensive set of resources known as the "Blue Planet" division. This division, which includes Ciena's former Agility division, is focused on providing next-generation, multi-vendor network virtualization, service orchestration and management solutions. During fiscal 2015, our software revenue was principally related to licensing of our element and network management solutions. The market relating to our Blue Planet software platform and the other applications of our Blue Planet division is in the early stages. As such, a number of features or functions associated with our Blue Planet software platform are in development, not generally available, or have only recently been introduced, and revenue from our Blue Planet software division and its solutions have been immaterial to date.
Blue Planet Software Platform and Network Management and Planning Solutions
Our Blue Planet software platform is a modular, network virtualization, service orchestration and network management software platform that simplifies the creation, automation and delivery of services across multi-vendor and multi-domain network environments. Blue Planet is multi-functional in that it is designed to simplify the management, deployment and orchestration of hardware and software elements and services, from Ciena or third-party vendors, based on the requirements of a network operator. Blue Planet utilizes a container-based, micro-services software architecture that provides flexibility to support the following use cases from a unified software platform:
Management and Control Platform (MCP).
Multi-layer WANs have historically operated using multiple layer- and vendor-specific management systems, with limited awareness of adjacent layers or network resources, resulting in additional complexity and cost, and challenging network management. Through its automation, management and control of multi-vendor and multi-layer network infrastructures, Blue Planet eliminates this complexity. Our MCP solution enables network operators to visualize and control these disparate network elements through a unified solution that incorporates open APIs and resource adapters to control a range of third-party network elements. We believe our MCP solution can enable network operators to simplify their network environments and accelerate end-to-end service delivery.
Multi-Domain Service Orchestration (MDSO).
Network infrastructures are comprised of multiple technology layers and domains — such as the data center, cloud, metro, access and core networks — and it is often complex for network operators to offer services end-to-end in this environment. Blue Planet enables service orchestration across multiple network (physical and virtual) domains and multiple hardware and software vendors. By using open APIs and model-driven templates, Blue Planet integrates with third-party SDN controllers, element and network management systems, and orchestration platforms. We believe our MDSO solution can enable network operators to minimize vendor-specific management silos, reduce network complexity and enhance service management.
NFV Orchestration (NFVO)
. To reduce their dependence upon single-purpose hardware platforms and accelerate the time to market for new revenue-generating services, network operators are increasingly looking for solutions that enable these functions through software that runs on industry-standard servers, network and storage platforms. Blue Planet provides network operators with carrier-grade, NFV management and orchestration capabilities for instantiating and managing virtualized network functions and data center resources. Blue Planet uses an open, vendor-agnostic approach that allows network operators to select and scale those virtual network functions (VNFs) they wish to offer to their end customers. We believe that our NFVO solution can enable network operators to increase network programmability, reduce complexity and cost, and reduce time-to-market with new, revenue-generating services.
11
Our software portfolio also includes our SDN multi-layer WAN controller that spans network layers, our Navigate path computation engine, and network-level software applications that enable WAN services over an open network ecosystem. Our V-WAN application provides service providers the tools to offer enterprise, content, and cloud services to end users in a more automated and self-service oriented manner. We also offer network-level software applications, including Protect and Optimize, that enable network operators to improve reliability, to allow for more rapid network restoration, and to better monetize cloud-based services.
Network Management Solutions and Software.
Our software offerings include our element and network management solutions and planning tools used by network operators. Our network management solutions currently include our OneControl Unified Management System. This integrated network and service management solution supports our Converged Packet Optical, Packet Networking and Optical Transport network elements from a single platform. It offers end to end service creation, activation, and assurance to enable rapid deployment of next-generation services and technologies under a single system. It provides visualization of fault and performance information for network health status, and enables proactive network management. Our OneControl system integrates easily into next-generation back office solutions and features a flexible and scalable deployment model.
The OneControl platform supports element and equipment management functions for large scale networks including as network inventory, network element configuration backup, network element software delivery and security administration. In addition to its network maintenance functions, OneControl also has a rich set of service management applications for the provisioning and troubleshooting of wavelength, OTN and packet services.
Our element and network management software offering also includes a number of software solutions that support installed base of network solution. These include:
|
•
|
ON-Center® Network & Service Management Suite, which provides network and service management for our installed base of 4200 Advanced Services Platform and Corestream products;
|
|
•
|
Optical Suite Release, which provides network and service management for our installed base of traditional SONET/SDH transport Optical Transport products;
|
|
•
|
Ethernet Services Manager which provides network and service management for our installed base of Packet Networking products; and
|
|
•
|
Planet Operate, which provides network and service management for our installed base of Z-Series products acquired from Cyan.
|
Our software suite also includes Ciena OnePlanner, a suite of planning tools advanced, multi-layer network design and optimization tool that leverages Ciena’s extensive background in Layer 0 and Layer 1 control plane planning and simulation, photonic system design, advanced algorithm research, and graphical user interface development into a comprehensive and easy-to-use platform for network engineering and design. OnePlanner correlates data from different network layers, allowing the network planner to easily see the association between services, facilities, and equipment. OnePlanner’s modular architecture enables use of design and engineering modules with the Ciena portfolio.
Global Services
To complement our product portfolio, we offer a broad suite of consulting and support services that help our customers design, optimize, deploy, manage and maintain their communications networks. We believe that our broad set of service offerings is an important component of our network specialist approach and a significant differentiator from our competitors. We believe that our services offering and our close collaborative engagement with customers provide us with valued insight into network and business challenges faced by our customers, enabling them to modernize and gain value from their network infrastructures. Our services offerings enable us to work closely with our customers in the assessment, planning, deployment, and transformation of their networks. We believe that our customers place significant value on the strategic, consultative engagements afforded by our services offering and on our ability to partner with them through services-oriented solutions that address their network and business needs on an individualized basis.
Our services and support portfolio includes the following offerings:
|
•
|
Deployment services, including turn-key installation and turn-up and test services;
|
|
•
|
Maintenance and support services, including:
|
|
•
|
helpdesk and technical support assistance;
|
|
•
|
spares and logistics management;
|
|
•
|
engineering dispatch and on-site professional services; and
|
|
•
|
equipment repair and replacement.
|
12
|
•
|
Software-related services, including software subscription services, consulting, network migration and integration, installation and upgrade support services, and technical support;
|
|
•
|
Network management and monitoring through network operations center (NOC) services; and
|
|
•
|
Project management services, including staging, site preparation and installation support activities.
|
We also provide training services to educate our customers and sales channels on the implementation, use, functionality and support of our solutions. We provide the services above using a combination of Ciena technical support engineers and qualified and authorized third party service partners.
Product Development
Our industry is subject to rapid technological developments, emerging service delivery requirements and shifts in customer and end-user network demand. To remain competitive, we must continually enhance our product platforms and add new features and functionality to ensure alignment with these changing dynamics. Our research and development strategy has been to enable scalable, software-configurable network infrastructures that can dynamically enable service delivery and provide an on-demand end-user experience. Our OP
n
Architecture, which underpins our solutions offering and guides our research and development strategy, leverages the convergence of optical and packet technologies to increase network scale cost effectively, while emphasizing software-enabled programmability, automation and open interfaces. Our product development initiatives include design and development work intended to address growing opportunities for the application of our solutions, such as metropolitan networks, data center interconnectivity, enterprise networking, and packet-based infrastructure solutions for high-capacity cloud-based service delivery. To address these opportunities and promote our OP
n
network vision, our current development efforts are focused upon:
|
•
|
Developing products that enhance software-based network management, orchestration and function virtualization, including:
|
|
•
|
Investments in our Blue Planet software platform to integrate across our portfolio, enable management of additional third party network resources, and enhance orchestration across multi-vendor and multi-domain network environments;
|
|
•
|
Extension of the NFV capabilities of Blue Planet to enable virtualization of additional network features or functions traditionally supported by hardware elements;
|
|
•
|
SDN multi-layer WAN controller; and
|
|
•
|
Network-level applications that automate various network functions, support new service introduction and monetize network assets.
|
|
•
|
Enhancing and extending our Packet-Optical and Packet Networking solutions, including:
|
|
•
|
Extending our leadership in coherent transport platforms, at 100G, 200G and 400G;
|
|
•
|
Continued development of our WaveLogic coherent optical processor to improve network capacity, transmission speed, spectral efficiency and reach;
|
|
•
|
Accelerating packet feature development and technology convergence upon our Converged Packet Optical platforms; and
|
|
•
|
Expanding packet networking capabilities and features for our high-capacity Ethernet aggregation switches, for metro and service aggregation applications, data center interconnection, cloud-service delivery, mobile backhaul and business Ethernet services;
|
|
•
|
Designing products that enable network operators to achieve improved cost and efficiency, including with respect to power, space and cost per bit.
|
Our research and development efforts are also geared toward portfolio optimization and engineering changes intended to drive cost reductions across our platforms.
We regularly review our existing solution offering and prospective development of new components, features or products, to determine their fit within our portfolio and broader corporate strategy. We also assess the market demand, technology evolution, prospective return on investment and growth opportunities, as well as the costs and resources necessary to develop and support these products. To ensure that our product development investments and solutions offerings are closely aligned with market demand, we continually seek input from customers and promote collaboration among our product development, marketing and global field organizations. In some cases, where we seek to utilize or gain access to complementary or emerging technologies or solutions, we may obtain such technology through an acquisition or, alternatively, through initiatives with third parties pursuant to technology licenses, original equipment manufacturer (OEM) arrangements and other strategic technology relationships or investments. In addition, we participate in industry and standards organizations and, where appropriate, incorporate information from these affiliations throughout the product development process.
13
Within our global products group, we maintain a team of skilled engineers with extensive experience in the areas of photonics, packet and circuit switching, network system design, and embedded operating system and network management software. Our research and development expense was $383.4 million, $401.2 million and
$414.2 million
, for fiscal 2013, 2014 and 2015, respectively. For more information regarding our research and development expense, see “Management's Discussion and Analysis of Financial Condition and Results of Operations” in Item 7 of Part II of this report.
Sales and Marketing
Within our global field organization, we maintain a direct sales presence that is organized geographically around the following markets: (i) United States and Canada; (ii) Caribbean and Latin America; (iii) Europe, Middle East and Africa; and (iv) Asia-Pacific. Within each geographic area, we may maintain specific teams or personnel that focus on a particular region, country, customer or market vertical. These teams include sales management, account salespersons, and systems engineers, as well as services professionals and commercial management personnel, who ensure we operate closely with and provide a high level of support to our customers.
We also maintain a global channel program that works with resellers, systems integrators, service providers, and other third party distributors who market and sell our products and services. Our third party channel sales include the packet-optical resale element of our strategic relationship with Ericsson. We intend to pursue and foster targeted strategic channel relationships in an effort to enable us to sell our products as a complement to the broader offering of these vendors or integrators, including, in particular, in support of enterprise-oriented applications and cloud-based services. We see opportunities to leverage our strategic channel relationships to address additional customer market segments, additional applications for our solutions and growth geographies. We believe this strategy and our use of third party channels afford us expanded market opportunities and reduce the financial and operational risk of entering these additional markets.
To support our sales efforts, we engage in marketing activities intended to promote our brand, increase customer awareness of our product, software and service offerings and drive demand generation. Our marketing strategy is highly focused on building our brand, promoting our OPn network architecture and increasing customer adoption of our solutions, particularly our Blue Planet software platform. Our marketing team supports Ciena’s sales efforts through a variety of marketing vehicles, including direct customer interaction, industry events, public relations, industry analysts, social media, trade shows, our website and other marketing channels for our customers and channel partners.
Operations and Supply Chain Management
Operations personnel within our global products group manage our relationships with our third party manufacturers and manage our supply chain. In addition, elements of our global products group team also address component sourcing, product testing and quality, fulfillment and logistics relating to our sales, support and professional services, and distribution efforts.
We utilize a global sourcing strategy that emphasizes procurement of materials and product manufacturing in lower cost regions. We rely upon third party contract manufacturers, with facilities in Canada, Mexico, Thailand and the United States, to manufacture, support and ship, our products, and therefore are exposed to risks associated with their businesses, financial condition and the geographies in which they operate. We also rely upon these contract manufacturers and other third parties to perform design and prototype development, component procurement, full production, final assembly, testing and customer order fulfillment. Our manufacturers procure components necessary for assembly and manufacture of our products based on our specifications, approved vendor lists, bills of materials and testing and quality standards. Our manufacturers' activity is based on rolling forecasts that we provide to them to estimate demand for our products. This build-to-forecast purchase model exposes us to the risk that our customers will not order those products for which we have forecast sales, or will purchase less than we have forecast. As a result, we may incur carrying charges or obsolete material charges for components purchased by our manufacturers that are not ultimately used. We work closely with our manufacturers to manage material, quality, cost and delivery times, and we continually evaluate their services to ensure performance on a reliable and cost-effective basis.
We are currently using a direct order fulfillment model for the sale of several products, and we are engaged in initiatives to expand this model to a broader set of products. This model allows us to rely on our third party contract manufacturers to perform final system integration and testing prior to shipment of products from their facilities directly to our customers. For certain products, we continue to perform a portion of the system assembly, software application, final system integration and testing internally. We believe that our sourcing and manufacturing strategy allows us to conserve capital, lower costs of product sales, adjust quickly to changes in market demand, and operate without dedicating significant resources to manufacturing-related plant and equipment.
14
Shortages or lack of availability of components that we rely upon have occurred and are possible. Our products include some components that are proprietary in nature and only available from one or a small number of suppliers. Significant time would be required to establish relationships with alternate suppliers or providers of such components. We generally do not have long-term contracts with suppliers or contract manufacturers that guarantee supply of components or manufacturing services. If component supplies become limited, production at a contract manufacturer is disrupted, or if we experience difficulty in our relationship with a key supplier or contract manufacturer, we may encounter manufacturing delays that could adversely affect our business and result of operations.
As part of our effort to optimize our operations, we continue to focus on driving cost reductions through sourcing, design and engineering efforts, rationalizing our supply chain, outsourcing or virtualizing certain activities, and consolidating distribution sites and service logistics partners. These efforts also include process optimization and initiatives, such as vendor-managed inventory models, to drive improved efficiencies in our sourcing, logistics and fulfillment.
Backlog
Generally, we make sales pursuant to purchase orders placed by customers under framework agreements that govern the general commercial terms and conditions of the sale of our products and services. These agreements do not obligate customers to purchase any minimum or guaranteed order quantities. Moreover, we are periodically awarded business for new network opportunities or network upgrades following a selection process. In calculating backlog, we only include (i) customer purchase orders for products that have not been shipped and for services that have not yet been performed; and (ii) customer orders relating to products that have been delivered and services that have been performed, but are awaiting customer acceptance under the applicable purchase terms. Generally, our customers may cancel or change their orders with limited advance notice, or they may decide not to accept our products and services, although both cancellation and non-acceptance are infrequent. Backlog may be fulfilled several quarters following receipt of a purchase order, or in the case of certain service obligations, may relate to multi-year support period. As a result, backlog should not necessarily be viewed as an accurate indicator of future revenue for any particular period.
Our backlog increased from $824 million as of October 31, 2014 to $1 billion as of October 31, 2015. Backlog includes product and service orders from commercial and government customers combined. Backlog at October 31, 2015 includes approximately $260 million primarily related to orders for products and maintenance and support services that are not expected to be filled or performed within fiscal 2016. Backlog at October 31, 2014 included approximately $180 million primarily related to orders for products and maintenance and support services, that were not expected to be filled within fiscal 2015. Because backlog can be defined in different ways by different companies, our presentation of backlog may not be comparable with figures presented by other companies in our industry.
Seasonality
Like other companies in our industry, we have experienced quarterly fluctuations in customer activity due to seasonal considerations. We typically experience reductions in order volume toward the end of the calendar year, as the procurement cycles of some of our customers slow and network deployment activity by service providers is curtailed. This period coincides with the first quarter of our fiscal year. This seasonality in our order flows can result in somewhat weaker revenue results in the first quarter of our fiscal year. These seasonal effects may not apply consistently in future periods and may not be a reliable indicator of our future revenue or results of operations.
Competition
Competition among communications network solution vendors remains intense. The markets in which we compete are characterized by rapidly advancing technologies, introduction of new networking solutions and aggressive selling efforts to displace incumbent vendors and capture market share. Competition for sales of communications networking solutions is dominated by a small number of very large, multi-national companies. Our competitors include Alcatel-Lucent, Cisco, Fujitsu, Huawei, Juniper Networks, and ZTE. In April 2015, Nokia Corporation announced its intent to acquire Alcatel-Lucent. Many of these competitors have substantially greater financial, operational and marketing resources than Ciena, significantly broader product offerings or more extensive customer bases. We also continue to compete with several smaller, but established, companies that offer one or more products that compete directly or indirectly with our offerings or whose products address specific niches within the markets and customer segments we address. These competitors include ADVA, BTI, Coriant, ECI, Infinera, and RAD. In addition, there are a variety of earlier-stage companies with products targeted at specific segments of the communications networking market. These competitors often employ aggressive competitive and business tactics as they seek to gain entry to certain customers or markets. Due to these practices and the narrower focus of their development efforts, these
15
competitors may be able to develop and introduce products more quickly, or offer commercial terms that are more attractive to customers.
The principal competitive factors applicable to our markets include:
|
•
|
product functionality, speed, capacity, scalability and performance;
|
|
•
|
price and total cost of ownership of our solutions;
|
|
•
|
incumbency and strength of existing business relationships;
|
|
•
|
ability to offer comprehensive networking solutions, consisting of equipment, software and network consulting services;
|
|
•
|
product development that satisfies customers' immediate and future network requirements;
|
|
•
|
flexibility and openness of platforms, including ease of integration, interoperability and integrated management;
|
|
•
|
manufacturing and lead-time capability; and
|
|
•
|
services and support capabilities.
|
As a result of the intense and fragmented environment in which we compete, winning new opportunities can require that we agree to unfavorable commercial terms or pricing, and certain other onerous contractual commitments. These terms can adversely affect our results of operations. These terms can also lengthen our revenue recognition or cash collection cycles, add start-up costs to initial sales or deployment of our solutions, require financial commitments or performance bonds, and place a disproportionate allocation of risk upon us.
We expect the competitive landscape in which we operate to continue to broaden and competition to increase as network technologies and layers continue to converge, network hardware functions become virtualized, and networks come under unified software management, orchestration and control. As these changes occur, we expect to compete with a broader group of vendors promoting their own network architectural approaches and offering their own solutions. As we expand our solutions offerings, we expect that our business will overlap more directly with additional networking solution suppliers, including IP router vendors, data center switch providers and other suppliers or integrators of networking technology traditionally geared toward different network applications, layers or functions. In addition, as demands for software programmability, management and control increase, we expect to increasingly compete with software vendors and other information technology vendors or integrators. We may also face increased competition from companies, including those in our supply chain, who develop networking products based on off-the-shelf or commoditized hardware technology, referred to as “white box” hardware, particularly where our customer's network strategies seek to emphasize deployment of those product offerings.
Patents, Trademarks and Other Intellectual Property Rights
The success of our business and technology leadership is significantly dependent upon our proprietary and internally developed technology. We rely upon the intellectual property protections afforded by patents, copyrights, trademarks, and trade secret laws to establish, maintain and enforce rights in our proprietary technologies and product branding. We maintain an invention
incentive program that seeks to reward innovation and an internal invention review board that selects appropriate protection mechanisms for our technology. We regularly file applications for patents and have a significant number of patents in the United States and other countries where we do business. As of December 1, 2015, we had 1,508 issued U.S. patents, 249 pending U.S. patent applications and 432 non-U.S. patents.
We also rely on non-disclosure agreements and other contracts and policies regarding confidentiality with employees, contractors and customers to establish proprietary rights and protect trade secrets and confidential information. Our practice is to require employees and relevant consultants to execute non-disclosure and proprietary rights agreements upon commencement of their employment or consulting arrangements with us. These agreements acknowledge our ownership of intellectual property developed by the individual during the course of his or her work with us. The agreements also require that these persons maintain the confidentiality of all proprietary information disclosed to them.
Enforcing proprietary rights, especially patents, can be costly, and we cannot be certain that the steps that we are taking will detect or prevent all unauthorized use. The industry in which we compete is characterized by rapidly changing technology, a large number of patents, and frequent claims and related litigation regarding patent and other intellectual property rights. We have been subject to several claims related to patent infringement, including by competitors and also by non-practicing patent assertion entities, and we have been requested to indemnify customers pursuant to contractual indemnity obligations relating to infringement claims made by third parties. Intellectual property infringement assertions could cause us to incur substantial costs, including settlement costs and legal fees in the defense of related actions. If we are not successful in defending these claims, our business could be adversely affected. For example, we may be required to enter into a license agreement requiring
16
us to make ongoing royalty payments, we may be required to redesign our products or we may be prohibited from selling infringing technology in certain jurisdictions.
Our operating system, element management and network virtualization, management, and orchestration software and other solutions incorporate software and components under licenses from third parties, including software subject to various open source software licenses. As network operators seek to adopt network infrastructures with increased software control and programmability and utilize an open ecosystem of physical and virtual network resources provided by multiple third parties, and as we invest in our Blue Planet software platform, we expect to incorporate into our solutions additional elements of open source software or license additional software or technology from third parties. We expect that these network architectural approaches will require increased openness and interoperability of multi-vendor, multi-domain network environments, requiring an increased degree of cooperation among solutions providers. Failure to obtain or maintain such licenses or other third party intellectual property rights could affect our development efforts and market opportunities, or could require us to re-engineer our products or to obtain alternate technologies. Moreover, there is a risk that open source and other technology licenses could be construed in a manner that could impose unanticipated conditions or restrictions on our ability to commercialize our products.
Environmental Matters
Our business and operations are subject to environmental laws in various jurisdictions around the world, including the Waste Electrical and Electronic Equipment (WEEE) and Restriction of the Use of Certain Hazardous Substances in Electrical and Electronic Equipment (RoHS) regulations adopted by the European Union. We are also subject to disclosure and related requirements that apply to the presence of “conflict minerals” in our products or supply chain. We seek to operate our business in compliance with such laws relating to the materials and content of our products and product takeback and recycling. Environmental regulation is increasing, particularly outside of the United States, and we expect that our domestic and international operations may be subject to additional environmental compliance requirements, which could expose us to additional costs. To date, our compliance costs relating to environmental regulations have not resulted in a material cost or effect on our business, results of operations or financial condition.
Employees
As of October 31, 2015, we had a global workforce consisting of
5,345
employees. We have not experienced any work stoppages, and we consider the relationships with our employees to be good. While we have been able to recruit and retain key personnel with the capabilities required by our business and markets, competition for highly skilled technical, engineering and other personnel with experience in our industry is intense. We believe that our future success depends in critical part on our continued ability to recruit, motivate and retain such qualified personnel.
17
Directors and Executive Officers
The table below sets forth certain information concerning our directors and executive officers:
|
Name
|
Age
|
Position
|
|||
|
Patrick H. Nettles, Ph.D.
|
72
|
|
Executive Chairman of the Board of Directors
|
||
|
Gary B. Smith
|
55
|
|
President, Chief Executive Officer and Director
|
||
|
Stephen B. Alexander
|
56
|
|
Senior Vice President and Chief Technology Officer
|
||
|
James A. Frodsham
|
49
|
|
Senior Vice President and Chief Strategy Officer
|
||
|
François Locoh-Donou
|
44
|
|
Senior Vice President and Chief Operating Officer
|
||
|
James E. Moylan, Jr.
|
64
|
|
Senior Vice President, Finance and Chief Financial Officer
|
||
|
Andrew C. Petrik
|
52
|
|
Vice President and Controller
|
||
|
David M. Rothenstein
|
47
|
|
Senior Vice President, General Counsel and Secretary
|
||
|
Marcus Starke
|
54
|
|
Senior Vice President and Chief Marketing Officer
|
||
|
Harvey B. Cash (1)(3)
|
77
|
|
Director
|
||
|
Bruce L. Claflin (1)(2)
|
64
|
|
Director
|
||
|
Lawton W. Fitt (2)
|
62
|
|
Director
|
||
|
Patrick T. Gallagher (1)(3)
|
60
|
|
Director
|
||
|
T. Michael Nevens (2)
|
66
|
|
Director
|
||
|
Judith M. O’Brien (1)(3)
|
65
|
|
Director
|
||
|
Michael J. Rowny (2)
|
65
|
|
Director
|
||
_________________________________
|
(1)
|
Member of the Compensation Committee
|
|
(2)
|
Member of the Audit Committee
|
|
(3)
|
Member of the Governance and Nominations Committee
|
Our Directors hold staggered terms of office, expiring as follows: Ms. Fitt, Dr. Nettles and Mr. Rowny in 2016; Ms. O’Brien and Messrs. Cash and Smith in 2017; and Messrs. Claflin, Nevens and Gallagher in 2018.
Patrick H. Nettles, Ph.D.
has served as a Director of Ciena since April 1994 and as Executive Chairman of the Board of Directors since May 2001. From October 2000 to May 2001, Dr. Nettles was Chairman of the Board of Directors and Chief Executive Officer of Ciena, and he was President and Chief Executive Officer from April 1994 to October 2000. Dr. Nettles serves as a Trustee for the California Institute of Technology and serves on the board of directors of Axcelis Technologies, Inc. and The Progressive Corporation. Dr. Nettles has previously served on the board of directors of Apptrigger, Inc., formerly known as Carrius Technologies, Inc., and on the board of directors of Optiwind Corp, a privately held company
Gary B. Smith
joined Ciena in 1997 and has served as President and Chief Executive Officer since May 2001. Mr. Smith has served on Ciena’s Board of Directors since October 2000. Prior to his current role, his positions with Ciena included Chief Operating Officer, and Senior Vice President, Worldwide Sales. Mr. Smith previously served as Vice President of Sales and Marketing for INTELSAT and Cray Communications, Inc. Mr. Smith also serves on the boards of directors of Avaya Inc. and CommVault Systems, Inc. Mr. Smith is a member of the President’s National Security Telecommunications Advisory Committee, the Global Information Infrastructure Commission and the Center for Corporate Innovation (CCI).
Stephen B. Alexander
joined Ciena in 1994 and has served as Chief Technology Officer since September 1998 and as a Senior Vice President since January 2000. Mr. Alexander has previously served as General Manager of Products & Technology and General Manager of Transport and Switching & Data Networking.
James A. Frodsham
joined Ciena in May 2004 and has served as Senior Vice President and Chief Strategy Officer since March 2010 with responsibility for our strategic planning and corporate development activities. Mr. Frodsham has previously served as General Manager of Ciena’s former Broadband Access Group and Metro and Enterprise Solutions Group. Prior to joining Ciena, from August 2000 to January 2003, Mr. Frodsham served as chief operating officer of Innovance Networks, an optical networking company. Prior to that, Mr. Frodsham was employed for more than ten years in senior level positions with Nortel Networks in product development and marketing strategy. Mr. Frodsham serves on the board of directors of Innovance Networks.
18
François Locoh-Donou
has served as Ciena's Senior Vice President and Chief Operating Officer since November 2015. In this capacity, Mr. Locoh-Donou leads Ciena’s Global Field Organization, including the global sales and services functions, as well as Ciena's engineering, supply chain, product line management, quality/customer advocacy organizations on a global basis. Mr. Locoh-Donou previously served as Ciena's Senior Vice President, Global Products Group from August 2011 to October 2015. Mr. Locoh-Donou joined Ciena in August 2002 and served as Ciena’s Vice President and General Manager, EMEA from June 2005 to August 2011.
James E. Moylan, Jr.
has served as Senior Vice President, Finance and Chief Financial Officer since December 2007.
Andrew C. Petrik
joined Ciena in 1996 and has served as Vice President, Controller since August 1997 and served as Treasurer from August 1997 to October 2008.
David M. Rothenstein
joined Ciena in January 2001 and has served as Senior Vice President, General Counsel and Secretary since November 2008. Mr. Rothenstein served as Vice President and Associate General Counsel from July 2004 to October 2008 and previously as Assistant General Counsel.
Marcus Starke
joined Ciena in February 2015, and currently serves as Senior Vice President and Chief Marketing Officer where he oversees all global marketing and external communications activities. From May 2014 to January 2015, Mr. Starke served as Chief Marketing Officer at MicroStrategy, a leading global provider of enterprise-ready platforms for business analytics and mobile analytics. From November 2009 to April 2014, Mr. Starke was Senior Vice President, Worldwide Marketing and Communications at SAP, the global market leader in enterprise application software. Prior to that, he was President and CEO (Europe, Middle East and Africa) for Wunderman, as well as Chairman and CEO of the German arm of Publicis Worldwide.
Harvey B. Cash
has served as a Director of Ciena since April 1994. Mr. Cash is a general partner of InterWest Partners, a venture capital firm in Menlo Park, California, which he joined in 1985. Mr. Cash serves on the boards of directors of First Acceptance Corp., Silicon Laboratories, Inc. and Argonaut Group, Inc. and has previously served on the boards of directors of i2 Technologies, Inc., Voyence, Inc. and Staktek Holdings, Inc.
Bruce L. Claflin
has served as a Director of Ciena since August 2006. Mr. Claflin served as President and Chief Executive Officer of 3Com Corporation from January 2001 until his retirement in February 2006. Mr. Claflin joined 3Com as President and Chief Operating Officer in August 1998. Prior to 3Com, Mr. Claflin served as Senior Vice President and General Manager, Sales and Marketing, for Digital Equipment Corporation. Mr. Claflin also worked for 22 years at IBM, where he held various sales, marketing and management positions, including general manager of IBM PC Company’s worldwide research and development, product and brand management, as well as president of IBM PC Company Americas. Mr. Claflin serves on the boards of directors of Advanced Micro Devices (AMD), where he is currently Chairman of the Board and Chairman of its Nominating and Governance Committee, and IDEXX Laboratories, Inc.
Lawton W. Fitt
has served as a Director of Ciena since November 2000. From October 2002 to March 2005, Ms. Fitt served as Director of the Royal Academy of Arts in London. From 1979 to October 2002, Ms. Fitt was an investment banker with Goldman Sachs & Co., where she was a partner from 1994 to October 2002, and a managing director from 1996 to October 2002. In addition to her service as a director of non-profit organizations, Ms. Fitt currently serves on the boards of directors of The Carlyle Group LP and The Progressive Corporation, and she has previously served on the boards of directors of Thomson Reuters, Overture Acquisition Corporation and Frontier Communications Company. She also serves as a director or trustee of several non-profit organizations.
Patrick T. Gallagher
has served as a Director of Ciena since May 2009. Mr. Gallagher currently serves as Chairman of Harmonic Inc, a global provider of high-performance video solutions to the broadcast, cable, telecommunications and managed service provider sectors. From March 2008 until April 2012, Mr. Gallagher was Chairman of Ubiquisys Ltd., a leading developer and supplier of femtocells for the global 3G mobile wireless market. From January 2008 until February 2009, Mr. Gallagher was Chairman of Macro 4 plc, a global software solutions company, and from May 2006 until March 2008, served as Vice Chairman of Golden Telecom Inc., a leading facilities-based provider of integrated communications in Russia and the CIS. From 2003 until 2006, Mr. Gallagher was Executive Vice Chairman and served as Chief Executive Officer of FLAG Telecom Group and, prior to that role, held various senior management positions at British Telecom. Mr. Gallagher is also Chairman of Intercloud SAS, a Paris-headquartered provider of global private cloud connectivity services. Mr. Gallagher also serves on the board of directors of Sollers JSC.
T. Michael Nevens
has served as a Director of Ciena since February 2014. Since 2006, Mr. Nevens has served as senior adviser to Permira Advisers, LLC, an international private equity fund. From 1980 to 2002, Mr. Nevens held various leadership positions at McKinsey & Co., most recently as a director (senior partner) and as managing partner of the firm’s Global Technology Practice. He also served on the board of the McKinsey Global Institute, which conducts research on economic and policy issues. Mr. Nevens is a member of the Advisory Council of the Mendoza College of Business at the University of Notre
19
Dame, where he has been an adjunct professor of Corporate Governance and Strategy. Mr. Nevens serves on the boards of directors of NetApp, Inc. and Altera Corporation.
Judith M. O’Brien
has served as a Director of Ciena since July 2000. Since November 2012, Ms. O'Brien has served as a partner and head of the Emerging Company Practice Group at the law firm of King & Spalding. Ms. O’Brien served as Executive Vice President and General Counsel of Obopay, Inc., a provider of mobile payment services, from November 2006 through December 2010. From February 2001 until October 2006, Ms. O’Brien served as a Managing Director at Incubic Venture Fund, a venture capital firm. From August 1980 until February 2001, Ms. O’Brien was a lawyer with Wilson Sonsini Goodrich & Rosati, where, from February 1984 to February 2001, she was a partner specializing in corporate finance, mergers and acquisitions and general corporate matters. Ms. O'Brien serves on the board of directors of privately-held companies, Theatro Labs, Inc. and Inform, Inc., and has previously served on the board of directors of Adaptec, Inc.
Michael J. Rowny
has served as a Director of Ciena since August 2004. Mr. Rowny has been Chairman of Rowny Capital, a private equity firm, since 1999. From 1994 to 1999, and previously from 1983 to 1986, Mr. Rowny was with MCI Communications in positions including President and Chief Executive Officer of MCI’s International Ventures, Alliances and Correspondent group, acting Chief Financial Officer, Senior Vice President of Finance, and Treasurer. Mr. Rowny’s career in business and government has also included positions as Chairman and Chief Executive Officer of the Ransohoff Company, Chief Executive Officer of Hermitage Holding Company, Executive Vice President and Chief Financial Officer of ICF Kaiser International, Inc., Vice President of the Bendix Corporation, and Deputy Staff Director of the White House. Mr. Rowny serves on the board of directors of Neustar, Inc.
20
Investing in our securities involves a high degree of risk. In addition to the other information contained in this report, you should consider the following risk factors before investing in our securities.
Risks Relating to Our Business
Our revenue and operating results can fluctuate significantly and unpredictably from quarter to quarter.
Our revenue and results of operations can fluctuate significantly and unpredictably from quarter to quarter. Our budgeted expense levels are based on our visibility into customer spending plans and our projections of future revenue and gross margin. Customer spending levels are uncertain and subject to change and reductions in our expense levels to react to deviations from our projections can take significant time to implement. Because the percentage of revenue that we generate from customer orders placed during that particular quarter has increased as compared to our historical periods, this may increase the likelihood of fluctuations in our results. Our revenue for a particular quarter is difficult to predict, and a shortfall in expected orders in a given quarter can materially adversely affect our revenue and results of operations for that quarter or future quarterly periods. Additional factors that contribute to fluctuations in our revenue and operating results include:
|
•
|
broader macroeconomic conditions, including weakness and volatility in global markets, that affect our customers;
|
|
•
|
changes in capital spending by large communications service providers;
|
|
•
|
order timing, volume and cancellations;
|
|
•
|
backlog levels;
|
|
•
|
the level of competition and pricing pressure in our industry;
|
|
•
|
the impact of commercial concessions or unfavorable commercial terms required to maintain incumbency or secure new opportunities with key customers;
|
|
•
|
our level of success in achieving cost reductions and efficiencies in our supply chain;
|
|
•
|
our incurrence of start-up costs required to support initial deployments, gain new customers or enter new markets;
|
|
•
|
the timing of revenue recognition on sales, particularly relating to large orders;
|
|
•
|
the mix of revenue by product segment, geography and customer in any particular quarter;
|
|
•
|
installation service availability and readiness of customer sites;
|
|
•
|
adverse impact of foreign exchange; and
|
|
•
|
seasonal effects in our business.
|
Quarterly fluctuations from these and other factors may also cause our results of operations to fall short of or to exceed significantly the expectations of securities analysts or investors, which may cause volatility in our stock price.
A small number of large communications service providers account for a significant portion of our revenue, and the loss of any of these customers, a significant reduction in their spending, or a material change in their networking or procurement strategies could have a material adverse effect on our business and results of operations.
While our customer base has diversified in recent years to include a number of network operators and new customer verticals, including Web-scale providers and cable and multiservice operators, a significant portion of our revenue remains concentrated among a few, large global communications service providers. By way of example, AT&T accounted for approximately
19.9%
of fiscal 2015 revenue, and our largest ten customers contributed
52.5%
of fiscal 2015 revenue. Consequently, our financial results are closely correlated with the spending of a relatively small number of customers and can be significantly affected by market, industry or competitive dynamics affecting their businesses. The loss of a significant customer could have a material adverse effect on our business and results of operations. Our business and results of operations can also be materially adversely impacted by reductions in spending or capital expenditure budgets by our largest service provider customers. Because the terms of our framework contracts do not obligate customers to purchase any minimum or guaranteed order quantities, and customers often have the right to modify or cancel orders, there can be no assurance as to spending levels, and spending levels can be unpredictable.
Our reliance upon a relatively small number of customers also increases our exposure to changes in their spending levels, network priorities and purchasing strategies. Our customers have previously undertaken, and may undertake in the future, procurement initiatives or adopt network strategies adverse to our business. These initiatives may seek to achieve reductions in capital expenditure, require commercial concessions from suppliers or reduce the number of direct suppliers of networking technology. During fiscal 2015, AT&T and other service provider customers announced initiatives to reduce capital expenditures in future periods, including on network infrastructure, and there can be no assurance that we will be able to maintain the sales
21
levels we achieved during fiscal 2015. Moreover, AT&T and other customers, including service providers, are pursuing network strategies that seek to utilize enhanced software programmability, management and control of networks and to deploy off-the-shelf or commoditized hardware technology, referred to as "white box" hardware, in lieu of existing solutions. These strategies may present challenges and opportunities for our business, particularly where we are an incumbent equipment vendor. As a result, we expect our competitive landscape to broaden and competition to increase in the markets in which we compete for sales to service provider customers. The loss of a significant customer, a significant reduction in their spending, or a material change in their networking or procurement strategies could have a material adverse effect on our business, financial condition and results of operations.
We face intense competition that could hurt our sales and results of operations, and we expect the competitive landscape in which we operate to continue to broaden to include additional solutions providers.
We face a competitive market for sales of communications networking equipment, software and services, and this level of competition could result in pricing pressure, reduced demand, commercial concessions, lower gross margins and loss of market share that could harm our business and results of operations. Competition is intense on a global basis, as we and our competitors aggressively seek to displace incumbent equipment vendors at large service providers and secure new customers. In an effort to maintain our incumbency and secure additional customer opportunities, we have in the past, and may in the future, agree to aggressive pricing, commercial concessions and other unfavorable terms that reduce our revenue and result in low or negative gross margins on a particular order or group of orders. These commercial concessions can also place a disproportionate amount of risk on us.
We expect the competitive landscape in which we operate to broaden, as multinational equipment vendors seek to promote adoption of competing architectural approaches for next-generation networks and retain incumbent positions with large customers globally. As we expand our solutions offering, and, as network technologies, features and layers converge, we expect that our business will overlap more directly with additional networking solution suppliers, including IP router vendors and data center switch providers. In addition, as demands for software programmability, management and control increase, we expect to increasingly compete with software vendors and other information technology vendors and system integrators. We may also face increased competition from companies, including our suppliers, who develop networking products based on off-the-shelf or commoditized hardware technology, referred to as "white box" hardware, particularly where our customer's network strategies seek to emphasize deployment of those product offerings. The expansion of our competitive landscape, and entry of new competitors into our markets and customers, may adversely impact our business and results of operations.
Generally, competition in our markets is based on any one or a combination of the following factors:
|
•
|
product functionality, speed, capacity, scalability and performance;
|
|
•
|
price and total cost of ownership of our solutions;
|
|
•
|
incumbency and existing business relationships;
|
|
•
|
ability to offer comprehensive networking solutions, consisting of equipment, software and network consulting services;
|
|
•
|
product development plans and the ability to meet customers' immediate and future network requirements;
|
|
•
|
flexibility and openness of platforms, including ease of integration, interoperability and integrated software programmability and management;
|
|
•
|
manufacturing and lead-time capability; and
|
|
•
|
services and support capabilities.
|
A small number of very large companies have historically dominated our industry, many of which have substantially greater financial and marketing resources, broader product offerings and more established relationships with service providers and other customer segments than we do. Because of their scale and resources, they may be perceived to be a better fit for the procurement or network operating and management strategies of large service providers. We also compete with a number of smaller companies that provide significant competition for a specific product, application, customer segment or geographic market. Due to the narrower focus of their efforts, these competitors may achieve commercial availability of their products more quickly or may be more attractive to customers in a particular product niche. If competitive pressures increase, or if we fail to compete successfully in our markets, our business and results of operations could suffer.
Our business and operating results could be adversely affected by unfavorable changes in macroeconomic and market conditions and reductions in the level of spending by customers in response to these conditions.
Our business and operating results, which depend significantly on general economic conditions and demand for our products and services, could be materially adversely affected by unfavorable or uncertain macroeconomic and market
22
conditions, globally or with respect to a particular region or country where we operate. Broad macroeconomic weakness and market volatility have previously resulted in sustained periods of decreased demand for our products and services that have adversely affected our operating results. Macroeconomic and market conditions could be adversely affected by a variety of political, economic or other factors in the United States and international markets that could adversely affect spending levels of our customers and their end users, and create volatility or deteriorating conditions in the markets in which we operate. Macroeconomic uncertainty or weakness could result in:
|
•
|
reductions in customer spending and delay, deferral or cancellation of network infrastructure initiatives;
|
|
•
|
increased competition for fewer network projects and sales opportunities;
|
|
•
|
increased pricing pressure that may adversely affect revenue, gross margin and profitability;
|
|
•
|
difficulty forecasting operating results and making decisions about budgeting, planning and future investments;
|
|
•
|
increased overhead and production costs as a percentage of revenue;
|
|
•
|
tightening of credit markets needed to fund capital expenditures by Ciena or our customers;
|
|
•
|
customer financial difficulty, including longer collection cycles and difficulties collecting accounts receivable or write-offs of receivables; and
|
|
•
|
increased risk of charges relating to excess and obsolete inventories and the write-off of other intangible assets.
|
Reductions in customer spending in response to unfavorable or uncertain macroeconomic and market conditions, globally or with respect to a particular region where we operate, would adversely affect our business, results of operations and financial condition.
Our reliance upon third party component suppliers, including sole and limited source suppliers, exposes our business to additional risk and could limit our sales, increase our costs and harm our customer relationships.
We maintain a global sourcing strategy and depend on third party suppliers for support in our product design and development, and in the sourcing of key product components and subsystems. Our products include optical and electronic components for which reliable, high-volume supply is often available only from sole or limited sources. Increases in market demand or scarcity of resources or manufacturing capability have previously resulted in shortages in availability of important components for our solutions, allocation challenges and increased lead times. We are exposed to risks relating to unfavorable economic conditions or other similar challenges affecting the businesses and results of operations of our component providers that can affect their liquidity levels, ability to continue investing in their businesses, ability to meet development commitments and manufacturing capability. These and other challenges affecting our suppliers could expose our business to increased costs, loss or lack of supply, or discontinuation of components that can result in lost revenue, additional product costs, increased lead times and deployment delays that could harm our business and customer relationships. We do not have any guarantees of supply from these third parties, and in certain cases are relying upon temporary commercial arrangements or standard purchase orders. As a result, there is no assurance that we will be able to secure the components or subsystems that we require, in sufficient quantity and quality, and on reasonable terms. The loss of a source of supply, or lack of sufficient availability of key components, could require that we locate an alternate source or redesign our products, either of which could result in business interruption, increased costs and negatively affect our product gross margin and results of operations. Our business and results of operations would be negatively affected if we were to experience any significant disruption or difficulties with key suppliers affecting the price, quality, availability or timely delivery of required components.
Investment of research and development resources in communications networking technologies for which there is not a matching market opportunity, or failure to sufficiently or timely invest in technologies for which there is market demand, would adversely affect our revenue and profitability.
The market for communications networking hardware and software solutions is characterized by rapidly evolving technologies, changes in market demand and increasing adoption of software-based networking solutions. We continually invest in research and development to sustain or enhance our existing hardware and software solutions and to develop or acquire new technologies including new software platforms. There is often a lengthy period between commencing these development initiatives and bringing new or improved solutions to market. During this time, technology preferences, customer demand and the markets for our solutions, or those introduced by our competitors, may move in directions we had not anticipated. There is no guarantee that our new products, including our Blue Planet software platform, or enhancements to other solutions will achieve market acceptance or that the timing of market adoption will be as predicted. There is a significant possibility, therefore, that some of our development decisions, including significant expenditures on acquisitions, research and development costs, or investments in technologies, will not meet our expectations, and that our investment in some projects will be unprofitable. There is also a possibility that we may miss a market opportunity because we failed to invest, or invested too late, in a technology, product or enhancement sought by our customers. Changes in market demand or investment priorities may also cause us to
23
discontinue existing or planned development for new products or features, which can have a disruptive effect on our relationships with customers. If we fail to make the right investments or fail to make them at the right time, our competitive position may suffer, and our revenue and profitability could be harmed.
Network equipment sales to communications service providers, Web-scale providers and other large customers often involve lengthy sales cycles and protracted contract negotiations and may require us to agree to commercial terms or conditions that negatively affect pricing, risk allocation, payment and the timing of revenue recognition.
Our sales initiatives, particularly with communications service providers, Web-scale providers and other large customers, often involve lengthy sales cycles. These selling efforts often involve a significant commitment of time and resources by us and our customers that may include extensive product testing, laboratory or network certification, network or region-specific product certification and homologation requirements for deployment in networks. Even after a customer awards its business or decides to purchase our solutions, the length of deployment time can vary depending upon the customer's schedule, site readiness, the size of the network deployment, the degree of custom configuration required and other factors. Additionally, these sales also often involve protracted and sometimes difficult contract negotiations in which we may deem it necessary to agree to unfavorable contractual or commercial terms that adversely affect pricing, expose us to penalties for delays or non-performance, and require us to assume a disproportionate amount of risk. To maintain incumbency with key customers for existing and future business opportunities, we may be required to offer discounted pricing, make commercial concessions or offer less favorable terms as compared to our historical business arrangements with these customers. We may also be requested to provide deferred payment terms, vendor or third-party financing or other alternative purchase structures that extend the timing of payment and revenue recognition. Alternatively, customers may insist upon terms and conditions that we deem too onerous or not in our best interest, and we may be unable to reach a commercial agreement. As a result, we may incur substantial expense and devote time and resources to potential sales opportunities that never materialize or result in lower than anticipated sales.
We may experience delays in the development of our products that may negatively affect our competitive position and business.
Our hardware and software networking solutions are based on complex technology, and we can experience unanticipated delays in developing, manufacturing and introducing these solutions to market. Delays in product development efforts by us or our supply chain may affect our reputation with customers, affect our ability to seize market opportunities and impact the timing and level of demand for our products. The development of new technologies may increase the complexity of supply chain management or require the acquisition, licensing or interworking with the technology of third parties. As a result, each step in the development cycle of our products presents serious risks of failure, rework or delay, any one of which could adversely affect the cost-effectiveness and timely development of our products. We may encounter delays relating to engineering development activities and software, design, sourcing and manufacture of critical components, and the development of prototypes. In addition, intellectual property disputes, failure of critical design elements, and other execution risks may delay or even prevent the release of these products. If we do not successfully develop products in a timely manner, our competitive position may suffer, and our business, financial condition and results of operations could be harmed.
Product performance problems and undetected errors affecting the performance, reliability or security of our products could damage our business reputation and negatively affect our results of operations.
The development and production of sophisticated hardware and software for communications network equipment is highly complex. Some of our products can be fully tested only when deployed in communications networks or when carrying traffic with other equipment, and software products may contain bugs that can interfere with expected performance. As a result, undetected defects or errors, and product quality, interoperability, reliability and performance problems are often more acute for initial deployments of new products and product enhancements. We have recently launched, and are in the process of launching, a number of new hardware and software platforms, including our Blue Planet software platform, and other solutions targeting metro network applications or Web-scale operators or enterprise end users. Unanticipated product performance problems can relate to the design, manufacturing, installation, operation and interoperability of our products. Undetected errors can also arise as a result of defects in components, software or manufacturing, installation or maintenance services supplied by third parties, and technology acquired from or licensed by third parties. From time to time we have had to replace certain components, provide software remedies or other remediation in response to defects or bugs, and we may have to do so again in the future. There can be no assurance that such remediation would not have a material impact on our business and results of operations. In addition, unanticipated security vulnerabilities relating to our products or the activities of our supply chain, including any actual or perceived exposure of our solutions to malicious software or cyber-attacks, could adversely affect our business and reputation. Product performance, reliability, security and quality problems can negatively affect our business, and may result in some or all of the following effects:
24
|
•
|
damage to our reputation, declining sales and order cancellations;
|
|
•
|
increased costs to remediate defects or replace products;
|
|
•
|
payment of liquidated damages, contractual or similar penalties, or other claims for performance failures or delays;
|
|
•
|
increased warranty expense or estimates resulting from higher failure rates, additional field service obligations or other rework costs related to defects;
|
|
•
|
increased inventory obsolescence;
|
|
•
|
costs and claims that may not be covered by liability insurance coverage or recoverable from third parties; and
|
|
•
|
delays in recognizing revenue or collecting accounts receivable.
|
These and other consequences relating to undetected errors affecting the quality, reliability and security of our products could negatively affect our business and results of operations.
Efforts by us or by our strategic third party channel partners to sell our solutions into targeted geographic markets and customer segments may be unsuccessful.
In order to sell our products into new geographic markets, diversify our customer base beyond our traditional customers and broaden the application for our solutions in communications networks, we continue to promote sales initiatives and foster strategic channel sales relationships, including the packet-optical resale element of our strategic relationship with Ericsson. Specifically, we are targeting sales opportunities with Web-scale providers, cloud infrastructure providers, communications service providers, enterprises, wireless operators, cable and multiservice operators, submarine network operators, research and education institutions, and federal, state and local governments. We also seek to expand our geographic reach and increase market share in international markets, including Brazil and India. To succeed in some of these geographic markets and customer segments we often need to leverage strategic sales channels and distribution arrangements, and we expect these relationships to be an important part of our business. There can be no assurance we will realize the expected benefits of these third party sales partners. In some cases we compete in certain business areas with our third party channel partners or may have divergent interests. Our efforts to manage and drive the intended benefits of such sales relationships may ultimately be unsuccessful, and difficulties selling through our third party channels could limit our growth and could harm our results of operations.
The international scale of our sales and operations exposes us to additional risk and expense that could adversely affect our results of operations.
We market, sell and service our products globally, maintain personnel in numerous countries and rely upon a global supply chain for sourcing important components and manufacturing our products. Our international sales and operations are subject to inherent risks, including:
|
•
|
the impact of economic conditions in countries outside the United States;
|
|
•
|
effects of adverse changes in currency exchange rates;
|
|
•
|
greater difficulty in collecting accounts receivable and longer collection periods;
|
|
•
|
difficulty and cost of staffing and managing foreign operations;
|
|
•
|
less protection for intellectual property rights in some countries;
|
|
•
|
adverse tax and customs consequences, particularly as related to transfer-pricing issues;
|
|
•
|
social, political and economic instability;
|
|
•
|
compliance with certain testing, homologation or customization of products to conform to local standards;
|
|
•
|
higher incidence of corruption or unethical business practices that could expose us to liability or damage our reputation;
|
|
•
|
trade protection measures, export compliance, domestic preference procurement requirements, qualification to transact business and additional regulatory requirements; and
|
|
•
|
natural disasters, epidemics and acts of war or terrorism.
|
Our international operations are also subject to complex foreign and U.S. laws and regulations, including anti-corruption laws, antitrust or competition laws, environmental regulations, and data privacy laws, among others. Violations of these laws and regulations could result in fines and penalties, criminal sanctions against us or our employees, prohibitions on the conduct of our business and on our ability to offer our products and services in certain geographies, and significant harm to our business reputation. There can be no assurance that any individual employee, contractor, agent or other business partner will not violate these legal requirements or our policies to mitigate these risks. Additionally, the costs of complying with these laws (including the costs of investigations, auditing and monitoring) could also adversely affect our current or future business.
The success of our international sales and operations will depend, in large part, on our ability to anticipate and manage effectively these risks. Our failure to manage any of these risks could harm our international operations, reduce our international sales, and could give rise to liabilities, costs or other business difficulties that could adversely affect our operations and financial results.
25
We may be required to write off significant amounts of inventory as a result of our inventory purchase practices, the obsolescence of product lines or unfavorable market conditions.
To avoid delays and meet customer demand for shorter delivery terms, we place orders with our contract manufacturers and component suppliers based on forecasts of customer demand. Our practice of buying inventory based on forecasted demand exposes us to the risk that our customers ultimately may not order the products we have forecast or will purchase fewer products than forecast. As a result, we may purchase inventory in anticipation of sales that ultimately do not occur. Market uncertainty can also limit our visibility into customer spending plans and compound the difficulty of forecasting inventory at appropriate levels. Moreover, our customer purchase agreements generally do not include any minimum purchase commitment. Also, customers often have the right to modify, reduce or cancel purchase quantities, and spending levels can be uncertain and subject to significant fluctuation. As we introduce new products with overlapping feature sets or application, it is increasingly possible that customers may forgo purchases of certain products we have inventoried in favor of next-generation products with similar or increased functionality. We may also be exposed to the risk of inventory write offs as a result of certain supply chain initiatives, including consolidation and transfer of key manufacturing activities. If we are required to write off or write down a significant amount of inventory, our results of operations for the applicable period would be materially adversely affected.
Our intellectual property rights may be difficult and costly to enforce.
We generally rely on a combination of patents, copyrights, trademarks and trade secret laws to establish and maintain proprietary rights in our products and technology. Although we have been issued numerous patents and other patent applications are currently pending, there can be no assurance that any of these patents or other proprietary rights will not be challenged, invalidated or circumvented, or that our rights will provide us with any competitive advantage. In addition, there can be no assurance that patents will be issued from pending applications or that claims allowed on any patents will be sufficiently broad to protect our technology. Further, the laws of some foreign countries may not protect our proprietary rights to the same extent as do the laws of the United States.
We are subject to the risk that third parties may attempt to access, divert or use our intellectual property without authorization. Protecting against the unauthorized use of our products, technology and other proprietary rights is difficult, time-consuming and expensive, and we cannot be certain that the steps that we are taking will prevent or minimize the risks of such unauthorized use. Litigation may be necessary to enforce or defend our intellectual property rights or to determine the validity or scope of the proprietary rights of others. Such litigation could result in substantial cost and diversion of management time and resources, and there can be no assurance that we will obtain a successful result. Any inability to protect and enforce our intellectual property rights could harm our ability to compete effectively.
We may incur significant costs in response to claims by others that we infringe their intellectual property rights.
From time to time third parties may assert claims or initiate litigation or other proceedings related to patent, copyright, trademark and other intellectual property rights to technologies and related standards that are relevant to our business. The rate of infringement assertions by patent assertion entities is increasing, particularly in the United States. Generally, these patent owners neither manufacture nor use the patented invention directly, and they seek solely to derive value from their ownership through royalties from patent licensing programs.
We could be adversely affected by litigation, other proceedings or claims against us, as well as claims against our manufacturers, suppliers or customers, alleging infringement of third party proprietary rights by our products and technology, or components thereof. Regardless of the merit of these claims, they can be time-consuming, divert the time and attention of our technical and management personnel, and result in costly litigation. These claims, if successful, could require us to:
|
•
|
pay substantial damages or royalties;
|
|
•
|
comply with an injunction or other court order that could prevent us from offering certain of our products;
|
|
•
|
seek a license for the use of certain intellectual property, which may not be available on commercially reasonable terms or at all;
|
|
•
|
develop non-infringing technology, which could require significant effort and expense and ultimately may not be successful; and
|
|
•
|
indemnify our customers or other third parties pursuant to contractual obligations to hold them harmless or pay expenses or damages on their behalf.
|
Any of these events could adversely affect our business, results of operations and financial condition. Our exposure to risks associated with the use of intellectual property may be increased as a result of acquisitions, as we have a lower level of visibility into the development process with respect to such technology and the steps taken to safeguard against the risks of infringing the rights of third parties.
26
Our products incorporate software and other technology under license from third parties, and our business would be adversely affected if this technology were no longer available to us on commercially reasonable terms.
We integrate third party software and other technology into our operating system, network management and control platforms and other products. As networks adopt open software control and virtualized network functions, we believe that we will be increasingly required to work with third party technology providers. As a result, we may be required to license certain software or technology from third parties, including competitors. Licenses for software or other technology may not be available or may not continue to be available to us on commercially reasonable terms. Third party licensors may insist on unreasonable financial or other terms in connection with our use of such technology. Our failure to comply with the terms of any license may result in our inability to continue to use such license, which may result in significant costs, harm our market opportunities and require us to obtain or develop a substitute technology.
Our solutions, including our Blue Planet software platform, utilize elements of open source or publicly available software. As networks become more open and software programmable, we expect that we and other communications networking solutions vendors will increasingly contribute to and use technology or open source software developed by standards settings bodies or other industry forums that seek to promote the integration of network layers and functions. The terms of such licenses could be construed in a manner that could impose unanticipated conditions or restrictions on our ability to commercialize our products. This increases our risks associated with our use of such software and may require us to seek licenses from third parties, to re-engineer our products or to discontinue the sale of such solutions. Difficulty obtaining and maintaining technology licenses with third parties may disrupt development of our products, increase our costs and adversely affect our business.
If our contract manufacturers do not perform as we expect, our business and results of operations may be adversely affected.
We rely on third party contract manufacturers to perform the manufacturing of our products, and our future success will depend on our ability to manage these manufacturing resources and ensure sufficient volumes and quality of our products. There are a number of risks associated with our dependence on contract manufacturers, including:
|
•
|
reduced control over delivery schedules and planning;
|
|
•
|
reliance on the quality assurance procedures of third parties;
|
|
•
|
potential uncertainty regarding manufacturing yields and costs;
|
|
•
|
availability of manufacturing capability and capacity, particularly during periods of high demand;
|
|
•
|
risks and uncertainties relating to the locations and geographies of our international contract manufacturing sites;
|
|
•
|
limited warranties provided to us;
|
|
•
|
potential misappropriation of our intellectual property; and
|
|
•
|
potential manufacturing disruptions, including disruptions caused by geopolitical events or environmental factors affecting the locations and geographies of our international contract manufacturing sites.
|
These and other risks could impair our ability to fulfill orders, harm our sales and impact our reputation with customers. If our contract manufacturers are unable or unwilling to continue manufacturing our products or components of our products, or if our contract manufacturers discontinue operations, we would be required to identify and qualify alternative manufacturers, which could cause us to be unable to meet our supply requirements to our customers and result in the breach of our customer agreements. The process of qualifying a new contract manufacturer and commencing volume production is expensive and time-consuming, and if we are required to change or qualify a new contract manufacturer, we would likely lose sales revenue and damage our existing customer relationships.
Data security breaches and cyber-attacks could compromise our intellectual property or other sensitive information and cause significant damage to our business and reputation.
In the ordinary course of our business, we maintain on our network systems certain information that is confidential, proprietary or otherwise sensitive in nature. This information includes intellectual property, financial information and confidential business information relating to Ciena and our customers, suppliers and other business partners. We also produce networking equipment solutions and software used by network operators to ensure security and reliability in their management and transmission of data. Our customers, particularly those in regulated industries, are increasingly focused on the security features of our technology solutions, and maintaining the security of information sensitive to Ciena and our business partners is critical to our business and reputation. Companies in the technology industry have been increasingly subject to a wide variety of security incidents, cyber-attacks and other attempts to gain unauthorized access to networks or sensitive information. Our network systems and storage applications, and the technology solutions that we offer to end customers, may be subject to unauthorized access by hackers or breached due to operator error, malfeasance or other system disruptions. In some cases, it is
27
difficult to anticipate or to detect immediately such incidents and the damage caused thereby. If an actual or perceived breach of network security occurs in our network or in the network of a business partner, the market perception of our products could be harmed. While we continually work to safeguard our products and internal network systems to mitigate these potential risks, there is no assurance that such actions will be sufficient to prevent cyber-attacks or security breaches. Security incidents involving access or improper use of our systems, networks or products could compromise confidential or otherwise protected information, destroy or corrupt data, or otherwise disrupt our operations. These security events could also negatively impact our reputation and our competitive position and could result in litigation with third parties, regulatory action, loss of business, potential liability and increased remediation costs, any of which could have a material adverse effect on our financial condition and results of operations.
Our failure to manage effectively our relationships with third party service partners could adversely impact our financial results and relationship with customers.
We rely on a number of third party service partners, both domestic and international, to complement our global service and support resources. We rely upon these partners for certain installation, maintenance and support functions. In addition, as network operators increasingly seek to rely on vendors to perform additional services relating to the design, construction and operation of their networks, the scope of work performed by our support partners is likely to increase and may include areas where we have less experience providing or managing such services. We must successfully identify, assess, train and certify qualified service partners in order to ensure the proper installation, deployment and maintenance of our products, as well as the skillful performance of other services associated with expanded solutions offerings, including site assessment and construction-related services. Vetting and certification of these partners can be costly and time-consuming, and certain partners may not have the same operational history, financial resources and scale as Ciena. Moreover, certain service partners may provide similar services for other companies, including our competitors. We may not be able to manage effectively our relationships with our service partners, and we cannot be certain that they will be able to deliver services in the manner or time required or that we will be able to maintain the continuity of their services. We may also be exposed to a number of risks or challenges relating to the performance of our service partners, including:
|
•
|
delays in recognizing revenue;
|
|
•
|
liability for injuries to persons, damage to property or other claims relating to the actions or omissions of our service partners;
|
|
•
|
our services revenue and gross margin may be adversely affected; and
|
|
•
|
our relationships with customers could suffer.
|
If we do not manage effectively our relationships with third party service partners, or if they fail to perform these services in the manner or time required, our financial results and relationships with customers could be adversely affected.
We may be adversely affected by fluctuations in currency exchange rates.
As a company with global operations, we face exposure to adverse movements in foreign currency exchange rates. Due to our global presence, a significant percentage of our revenue, operating expense and assets and liabilities are non-U.S. dollar denominated and therefore subject to foreign currency fluctuation. We face exposure to currency exchange rates as a result of the growth in our non-U.S. dollar denominated operating expense in Canada, Europe, Asia and Latin America. An increase in the value of the U.S. dollar could increase the real cost to our customers of our products in those markets outside the United States where we sell in dollars, and a weakened dollar could increase the cost of local operating expenses and procurement of materials or service that we purchase in foreign currencies. From time to time, we may hedge against currency exposure associated with anticipated foreign currency cash flows or assets and liabilities denominated in foreign currency. Such attempts to offset the impact of currency fluctuations are costly, and no amount of hedging can be effective against all circumstances. Losses associated with these hedging instruments and the adverse effect of foreign currency exchange rate fluctuation may negatively affect our results of operations.
We may be exposed to unanticipated risks and additional obligations in connection with our resale of complementary products or technology of other companies.
We have entered into agreements with strategic supply partners that permit us to distribute their products or technology. We may rely upon these relationships to add complementary products or technologies, diversify our product portfolio, or address a particular customer or geographic market. We may enter into additional original equipment manufacturer (OEM), resale or similar strategic arrangements in the future. We may incur unanticipated costs or difficulties relating to our resale of third party products. Our third party relationships could expose us to risks associated with the business, financial condition, intellectual property rights and supply chain continuity of such partners, as well as delays in their development, manufacturing or delivery of
28
products or technology. We may also be required by customers to assume warranty, indemnity, service and other commercial obligations, including potential liability to customers, greater than the commitments, if any, made to us by our technology partners. Some of our strategic supply partners are relatively small companies with limited financial resources. If they are unable to satisfy their obligations to us or our customers, we may have to expend our own resources to satisfy these obligations. Exposure to these risks could harm our reputation with key customers and could negatively affect our business and our results of operations.
Our exposure to the credit risks of our customers and resellers may make it difficult to collect receivables and could adversely affect our revenue and operating results.
In the course of our sales to customers and resale channel partners, we may have difficulty collecting receivables, and our business and results of operations could be exposed to risks associated with uncollectible accounts. Lack of liquidity in the capital markets, macroeconomic weakness and market volatility may increase our exposure to these credit risks. Our attempts to monitor customer payment capability and to take appropriate measures to protect ourselves may not be sufficient, and it is possible that we may have to write down or write off accounts receivable. Such write-downs or write-offs could negatively affect our operating results for the period in which they occur, and, if large, could have a material adverse effect on our revenue and operating results.
Our business is dependent upon the proper functioning of our internal business processes and information systems, and modification or interruption of such systems or external factors may disrupt our business, processes and internal controls.
We rely upon a number of internal business processes and information systems to support key business functions, and the efficient operation of these processes and systems is critical to managing our business. Our business processes and information systems must be sufficiently scalable to support the growth of our business and may require modifications or upgrades that expose us to a number of operational risks. We have commenced a significant upgrade of our company-wide enterprise resource planning platform that will impact multiple locations, functions and processes. We are also currently pursuing initiatives to transform and optimize our business operations through the reengineering of certain other processes, investment in automation, and engagement of strategic partners or resources to assist with certain business functions. These changes will require a significant investment of capital and human resources and may be costly and disruptive to our operations, and could impose substantial demands on management time. These changes may also require changes in our information systems, modification of internal control procedures and significant training of employees or third party resources. There can be no assurance that our business and operations will not experience disruption in connection with this transition. Even if we do not encounter these adverse effects or disruption in our business, the design and implementation of these new systems may be more costly than anticipated.
Our information technology systems, and those of third party information technology providers or business partners, may also be vulnerable to damage or disruption caused by circumstances beyond our control, including catastrophic events, power anomalies or outages, natural disasters, viruses or malware, and computer system or network failures. We may also be exposed to cyber-security related incidents, including unauthorized access of information systems and disclosure or diversion of intellectual property or confidential data. There can be no assurance that our business systems or those of our third party business partners would not be subject to similar incidents, exposing us to significant cost, reputational harm and disruption or damage to our business.
Outstanding indebtedness under our convertible notes and senior secured credit facilities may adversely affect our liquidity and results of operations and could limit our business.
At October 31, 2015, indebtedness on our outstanding convertible notes totaled approximately
$1.0 billion
in aggregate principal. In the event that some or all of these notes are converted into common stock, the ownership interests of our existing stockholders will be diluted, and any sales of such shares in the public market following conversion may adversely affect the market price for our common stock. We are also a party to credit agreements relating to a $200 million senior secured asset-based revolving credit facility and a $250 million senior secured term loan. The agreements governing these credit facilities contain certain covenants that limit our ability, among other things, to incur additional debt, create liens and encumbrances, pay cash dividends, redeem or repurchase stock, enter into certain acquisition transactions or transactions with affiliates, repay certain indebtedness, make investments or dispose of assets. The agreements also include customary remedies, including the right of the lenders to take action with respect to the collateral securing the loans, that would apply should we default or otherwise be unable to satisfy our debt obligations.
Our indebtedness could have important negative consequences, including:
29
|
•
|
increasing our vulnerability to adverse economic and industry conditions;
|
|
•
|
limiting our ability to obtain additional financing, particularly in unfavorable capital and credit market conditions;
|
|
•
|
debt service and repayment obligations that may adversely impact our results of operations and reduce the availability of cash resources for other business purposes;
|
|
•
|
limiting our flexibility in planning for, or reacting to, changes in our business and the markets; and
|
|
•
|
placing us at a possible competitive disadvantage to competitors that have better access to capital resources.
|
We may also enter into additional transactions or credit facilities, including equipment loans, working capital lines of credit and other long-term debt, which may increase our indebtedness and result in additional restrictions upon our business. In addition, major debt rating agencies regularly evaluate our debt based on a number of factors. There can be no assurance that we will be able to maintain our existing debt ratings, and failure to do so could adversely affect our cost of funds, liquidity and access to capital markets.
Significant volatility and uncertainty in the capital markets may limit our access to funding on favorable terms or at all.
The operation of our business requires significant capital. We have accessed the capital markets in the past and have successfully raised funds, including through the issuance of equity, convertible notes and other indebtedness, to increase our cash position, support our operations and undertake strategic growth initiatives. We regularly evaluate our liquidity position, debt obligations, and anticipated cash needs to fund our long-term operating plans, and we may consider it necessary or advisable to raise additional capital or incur additional indebtedness in the future. If we raise additional funds through further issuance of equity or securities convertible into equity, or undertake certain transactions intended to address our existing indebtedness, our existing stockholders could suffer dilution in their percentage ownership of our company or our leverage and outstanding indebtedness could increase. Global capital markets have undergone periods of significant volatility and uncertainty in recent years, and there can be no assurance that such financing alternatives would be available to us on favorable terms or at all, should we determine it necessary or advisable to seek additional cash resources.
Facilities transitions could be disruptive to our operations and may result in unanticipated expense and adverse effects to our cash position and cash flows.
We have recently undertaken and expect to undertake in the future a number of significant facilities transitions affecting a large number of our employee s. The lease term for our Lab 10 building on the Carling Campus in Ottawa, Canada will expire in fiscal 2018, and the lease term for our development facility in Gurgaon, India will expire in fiscal 2017. Both locations house sophisticated research and development lab equipment and significant headcount including key engineering personnel. We will be transitioning our operations in Ottawa to new facilities in contemplation of the expiration of the Lab 10 lease. Relocating our engineering operations may be costly, and there can be no assurance that the transition of key engineering functions to a successor facility will not be disruptive or adversely affect productivity. Significant facilities transitions could be disruptive to our operations and may result in unanticipated expense and adverse effects on our cash position and cash flows.
Restructuring activities could disrupt our business and affect our results of operations.
We have previously taken steps, including reductions in force, office closures, and internal reorganizations to reduce the size and cost of our operations, improve efficiencies, or realign our organization and staffing to better match our market opportunities and our technology development initiatives. We may take similar steps in the future as we seek to realize operating synergies, optimize our operations to achieve our target operating model and profitability objectives, or better reflect changes in the strategic direction of our business. These changes could be disruptive to our business, including our research and development efforts, and could result in significant expense, including accounting charges for inventory and technology-related write-offs, workforce reduction costs and charges relating to consolidation of excess facilities. Substantial expense or charges resulting from restructuring activities could adversely affect our results of operations and use of cash in those periods in which we undertake such actions.
If we are unable to attract and retain qualified personnel, we may be unable to manage our business effectively.
Competition to attract and retain highly skilled technical, engineering and other personnel with experience in our industry is intense, and our employees have been the subject of targeted hiring by our competitors. Competition is particularly intense in certain jurisdictions where we have research and development centers, including the Silicon Valley area of northern California, and we may experience difficulty retaining and motivating existing employees and attracting qualified personnel to fill key positions. Because we rely upon equity awards as a significant component of compensation, particularly for our executive team, a lack of positive performance in our stock price, reduced grant levels, or changes to our compensation program may adversely
30
affect our ability to attract and retain key employees. In addition, none of our executive officers is bound by an employment agreement for any specific term. The loss of members of our management team or other key personnel could be disruptive to our business, and, were it necessary, it could be difficult to replace members of our management team or other key personnel. If we are unable to attract and retain qualified personnel, we may be unable to manage our business effectively, and our operations and financial results could suffer.
Strategic acquisitions and investments could disrupt our operations and may expose us to increased costs and unexpected liabilities.
We may acquire or make investments in other technology companies, or enter into other strategic relationships, to expand the markets we address, diversify our customer base or acquire, or accelerate the development of, technology or products. To do so, we may use cash, issue equity that could dilute our current stockholders, or incur debt or assume indebtedness. These transactions, including our recently completed acquisition of Cyan, involve numerous risks, including:
|
•
|
failure to achieve the anticipated transaction benefits or the projected financial results and operational synergies;
|
|
•
|
greater than expected acquisition and integration costs;
|
|
•
|
disruption due to the integration and rationalization of operations, products, technologies and personnel;
|
|
•
|
diversion of management attention;
|
|
•
|
difficulty completing projects of the acquired company and costs related to in-process projects;
|
|
•
|
difficulty managing customer transitions or entering into new markets;
|
|
•
|
loss of key employees;
|
|
•
|
ineffective internal controls over financial reporting;
|
|
•
|
dependence on unfamiliar suppliers or manufacturers;
|
|
•
|
assumption of or exposure to unanticipated liabilities, including intellectual property infringement claims; and
|
|
•
|
adverse tax or accounting effects including amortization expense related to intangible assets and charges associated with impairment of goodwill.
|
As a result of these and other risks, our acquisitions, investments or strategic transactions may not reap the intended benefits and may ultimately have a negative impact on our business, results of operation and financial condition.
Changes in government regulation affecting the communications industry and the businesses of our customers could harm our prospects and operating results.
The Federal Communications Commission, or FCC, has jurisdiction over the U.S. communications industry, and similar agencies have jurisdiction over the communication industries in other countries. Many of our largest customers, including service providers and multiservice network operators, are subject to the rules and regulations of these agencies. On February 26, 2015, the FCC approved rules that would regulate Internet service providers as telecommunications service carriers under Title II of the Telecommunications Act. The impact of these rules are uncertain, and challenges to these rules are expected. These and similar changes in regulatory requirements covering access to, management of, or carriage of traffic on the Internet in the United States or other internationally could serve as a disincentive to certain wireline or wireless network operators, including certain of our customers, to invest in their network infrastructures or introduce new services. Such changes could adversely affect the sale of our products and services. Similarly, changes in regulatory tariff requirements or other regulations relating to pricing or terms of carriage on communications networks could slow the development or expansion of network infrastructures and adversely affect our business, operating results, and financial condition.
Government regulations affecting the use, import or export of products could adversely affect our operations, negatively affect our revenue and increase our costs.
The United States and various foreign governments have imposed controls, license requirements and other restrictions on the usage, import or export of some of the technologies that we sell. Government regulation of usage, import or export of our products, or our technology within our products, or our failure to obtain required approvals for our products, could harm our international and domestic sales and adversely affect our revenue and costs of sales. Failure to comply with such regulations could result in enforcement actions, fines, penalties or restrictions on export privileges. In addition, costly tariffs on our equipment, restrictions on importation, trade protection measures and domestic preference requirements of certain countries could limit our access to these markets and harm our sales. For example, India's government has implemented security regulations applicable to network equipment vendors and has previously imposed significant tariffs on certain communications equipment. These and other regulations could adversely affect the sale or use of our products, substantially increase our cost of sales and adversely affect our business and revenue.
31
Government regulations related to the environment, potential climate change and other social initiatives could adversely affect our business and operating results.
Our operations are regulated under various federal, state, local and international laws relating to the environment and potential climate change. If we were to violate or become liable under these laws or regulations, we could incur fines, costs related to damage to property or personal injury, and costs related to investigation or remediation activities. Our product design efforts and the manufacturing of our products are also subject to evolving requirements relating to the presence of certain materials or substances in our equipment, including regulations that make producers for such products financially responsible for the collection, treatment and recycling of certain products. For example, our operations and financial results may be negatively affected by environmental regulations, such as the Waste Electrical and Electronic Equipment (WEEE) and Restriction of the Use of Certain Hazardous Substances in Electrical and Electronic Equipment (RoHS) that have been adopted by the European Union. Compliance with these and similar environmental regulations may increase our cost of designing, manufacturing, selling and removing our products. The SEC has adopted disclosure requirements regarding the use of “conflict minerals” mined from the Democratic Republic of Congo and adjoining countries (“DRC”) and procedures regarding a manufacturer's efforts to prevent the sourcing of such minerals from the DRC. Certain of these minerals are present in our products. SEC rules implementing these requirements may have the effect of reducing the pool of suppliers who can supply DRC “conflict free” components and parts, and we may not be able to obtain conflict free products or supplies in sufficient quantities for our operations. Because our supply chain is complex, we may face reputational challenges with our customers, stockholders and other stakeholders if we are unable to verify sufficiently the origins for the "conflict minerals” used in our products and cannot assert that our products are "conflict free". Environmental or similar social initiatives may also make it difficult to obtain supply of compliant components or may require us to write off non-compliant inventory, which could have an adverse effect on our business and operating results.
We may be required to write down goodwill or long-lived assets, and these impairment charges would adversely affect our operating results.
As of
October 31, 2015
, our balance sheet includes
$256.4 million
of goodwill on our balance sheet. This amount primarily represents the remaining excess of the total purchase price of our acquisition of Cyan over the fair value of the net assets acquired. Ciena tests each reporting unit for impairment of goodwill on an annual basis, and between annual tests if an event occurs or circumstances change that would, more likely than not, reduce the fair value of the reporting unit below its carrying value. As of October 31, 2015, our balance sheet also includes
$449.9 million
in long-lived assets, which includes
$202.7 million
of intangible assets. Valuation of our long-lived assets requires us to make assumptions about future sales prices and sales volumes for our products. These assumptions are used to forecast future, undiscounted cash flows upon which our estimates are based. Periods of significant uncertainty or instability of macroeconomic conditions can make forecasting future business difficult. If actual market conditions differ or our forecasts change, we may be required to reassess goodwill or long-lived assets and could record an impairment charge. Any impairment charge relating to goodwill or long-lived assets would have the effect of decreasing our earnings or increasing our losses in such period. If we are required to take a substantial impairment charge, our operating results would be materially adversely affected in such period.
Failure to maintain effective internal controls over financial reporting could have a material adverse effect on our business, operating results and stock price.
Section 404 of the Sarbanes-Oxley Act of 2002 requires that we include in our annual report a report containing management's assessment of the effectiveness of our internal controls over financial reporting as of the end of our fiscal year and a statement as to whether or not such internal controls are effective. Compliance with these requirements has resulted in, and is likely to continue to result in, significant costs and the commitment of time and operational resources. Certain ongoing initiatives, including a significant upgrade of our company-wide enterprise resource planning platform that is underway, will necessitate modifications to our internal control systems, processes and related information systems. Similarly, other efforts to transform business processes, including our supply chain operations, or to transition certain functions to third party resources or providers, will require further changes to our control environment as we optimize our business and operations. Our expansion into new regions could pose further challenges to our internal control systems. We cannot be certain that our current design for internal control over financial reporting, or any additional changes to be made, will be sufficient to enable management to determine that our internal controls are effective for any period, or on an ongoing basis. If we are unable to assert that our internal controls over financial reporting are effective, market perception of our financial condition and the trading price of our stock may be adversely affected, and customer perception of our business may suffer.
Our stock price is volatile.
32
Our common stock price has experienced substantial volatility in the past and may remain volatile in the future. Volatility in our stock price can arise as a result of a number of the factors discussed in this “Risk Factors” section. During fiscal 2015, our closing stock price ranged from a high of
$26.50
per share to a low of
$14.69
per share. The stock market has experienced significant price and volume fluctuation that has affected the market price of many technology companies, with such volatility often unrelated to the operating performance of these companies. Divergence between our actual or anticipated financial results and published expectations of analysts, or the expectations of the market generally, can cause significant swings in our stock price. Our stock price can also be affected by market conditions in our industry as well as announcements that we, our competitors, vendors or our customers may make. These may include announcements of financial results or changes in estimated financial results, technological innovations, the gain or loss of customers or key opportunities. Our common stock is also included in certain market indices, and any change in the composition of these indices to exclude our company would adversely affect our stock price. These and other factors affecting macroeconomic conditions or financial markets may materially adversely affect the market price of our common stock in the future.
Risks Relating to Our Acquisition of Cyan, Inc.
We may fail to realize the anticipated benefits of the merger.
The success of the merger will depend on, among other things, our ability to gain market adoption for our Blue Planet software platform and derive long-term revenue growth based on Cyan’s software capabilities. If the SDN and NFV markets do not develop as we anticipate, or if we are unable to increase market awareness and adoption of our Blue Planet solutions as the preferred solution within those markets, demand for our Blue Planet solutions may not grow, and our future results would be adversely affected. As a result, the success of the merger and our long-term success will depend to a significant extent on potential customers recognizing the benefits of our next-generation software solutions, and the willingness of service providers and high-performance data center and other network operators to increase their use of SDN and NFV solutions in their networks. The market for SDN and NFV solutions is at an early stage, and it is difficult to predict important trends, including the potential growth, if any, of this market. If the market for SDN and NFV solutions does not evolve in the way we anticipate or if customers do not adopt our solutions, we may not to be able to increase sales of our Blue Planet platform. If we are not able to successfully achieve these objectives, the anticipated benefits of the merger may not be realized fully, or at all, or may take longer to realize than expected. There may also be additional unanticipated liabilities or costs in connection with the merger. These costs and expenses could reduce the realization of efficiencies, strategic benefits and growth that we expect to achieve from the merger.
The failure to integrate successfully the business and operations of Cyan in the expected time frame may adversely affect our future results.
There can be no assurances that we will successfully integrate Cyan's business. It is possible that the integration process could result in the loss of key Ciena or former Cyan employees, the loss of customers, the disruption of either company’s or both companies’ ongoing businesses, or in unexpected integration issues, greater than expected integration costs and an overall post-completion integration process that takes longer than originally anticipated. Specifically, the following issues, among others, must be addressed in integrating our operations with those of Cyan in order to realize the anticipated benefits of the merger so the combined company performs as expected:
|
•
|
combining our business with Cyan’s business in a manner that permits us to achieve the cost savings or revenue synergies anticipated to result from the merger;
|
|
•
|
integrating the companies’ technologies and unifying the hardware and software solutions offerings and services available to customers;
|
|
•
|
identifying and eliminating redundant costs;
|
|
•
|
harmonizing the companies’ operating practices, employee-related policies and compensation programs, internal controls and other policies, procedures and processes;
|
|
•
|
maintaining existing agreements with customers, distributors and vendors and avoiding delays in entering into new agreements with prospective customers, distributors and vendors;
|
|
•
|
addressing possible differences in business backgrounds, corporate cultures and management philosophies; and
|
|
•
|
coordinating distribution and marketing efforts.
|
In addition, at times, the attention of certain members of our management and resources may be focused on the integration of the businesses of the two companies and diverted from day-to-day business operations, which may disrupt our ongoing business and the business of the combined company.
33
Lawsuits have been filed against us and Cyan challenging the merger and an adverse ruling may adversely affect Ciena's operations and liquidity.
From May 15 through June 3, 2015, five separate putative class action lawsuits in connection with Ciena’s acquisition of Cyan, Inc. ("Cyan") were filed in the Court of Chancery of the State of Delaware:
|
•
|
Luvishis v. Cyan, Inc., et al.
, C.A. No. 11027-CB, filed May 15, 2015
|
|
•
|
Poll v. Cyan, Inc., et al.
, C.A. No. 11028-CB, filed May 15, 2015
|
|
•
|
Canzano v. Floyd, et al.
, C.A. No. 11052-CB, filed May 20, 2015
|
|
•
|
Kassis v. Cyan, Inc., et al.
, C.A. No. 11069-CB, filed May 27, 2015
|
|
•
|
Fenske v. Cyan, Inc., et al.
, C.A. No. 11090-CB, filed June 3, 2015
|
Each of the complaints named Cyan (except for the Canzano complaint), Ciena, Neptune Acquisition Subsidiary, Inc., a Ciena subsidiary created solely for the purpose of effecting the acquisition (“Merger Sub”), and the members of Cyan’s board of directors as defendants. On June 23, 2015, each of these lawsuits was consolidated into a single case captioned In Re Cyan, Inc. Shareholder Litigation, Consol. C.A. No. 11027-CB. On July 9, 2015, the plaintiffs filed a verified amended class action complaint, which named as defendants Ciena, Merger Sub, and the members of Cyan’s board of directors. On August 5, 2015, the defendants filed motions to dismiss the amended complaint. On October 1, 2015, the plaintiffs filed a second amended complaint which named as defendants the members of Cyan’s board of directors. Cyan, Ciena, and Merger Sub were not named as defendants. The second amended complaint generally alleges that the Cyan board members breached their fiduciary duties by engaging in a conflicted and unfair sales process, failing to maximize stockholder value in the acquisition, taking steps to preclude competitive bidding, and failing to disclose material information necessary for stockholders to make an informed decision regarding the acquisition. The second amended complaint seeks (i) a declaration that the plaintiffs are entitled to a quasi-appraisal remedy, (ii) rescissory damages, (iii) recovery through an accounting of all damages caused as a result of the alleged breaches of fiduciary duties, (iv) compensatory damages, and (v) costs including attorneys’ fees and experts’ fees. The actions also seek to recover costs, including attorneys’ fees and experts’ fees. On October 15, 2015, the defendants filed a renewed motion to dismiss. A briefing schedule for these motions has been set, with briefing to be completed in March 2016. The outcome of the consolidated action described above or any other lawsuit that may be brought challenging the merger is uncertain.
Third parties with whom Cyan had a business relationship may terminate or alter existing contracts or relationships with us.
As a result of the merger, Ciena assumed Cyan's contracts with customers, suppliers, vendors, landlords, licensors and other business partners. Certain of these contracts require consent from these other parties in connection with the merger. If these consents cannot be obtained, Ciena may suffer a loss of potential future revenue and may lose rights that are material to its business and the business of the combined company. In addition, third parties with whom we have (or Cyan had) relationships may terminate or otherwise reduce the scope of their relationship with us now that the merger is complete. Any such disruptions could limit our ability to achieve the anticipated benefits of the merger.
We may be unable to retain Cyan personnel successfully now that the merger has been completed.
The success of the merger will significantly depend on our ability to retain the talents and dedication of key professionals formerly employed by Cyan. It is possible that these employees may decide not to remain with the combined company. If key employees terminate their employment, or if an insufficient number of employees is retained to maintain effective operations, the combined company’s business activities may be adversely affected and management’s attention may be diverted from successfully integrating Cyan to hiring suitable replacements, all of which may cause the combined company’s business to suffer. In addition, we and Cyan may not be able to locate suitable replacements for any key employees that leave either company or offer employment to potential replacements on reasonable terms.
34
Not applicable.
Overview
. As of
October 31, 2015
, all of our properties are leased and we do not own any real property. We lease facilities globally related to the ongoing operations of our four business segments and related functions. Our principal executive offices are located in two buildings in Hanover, Maryland.
Our largest facility is our research and development center located at Lab 10 on the former Nortel Carling Campus in Ottawa, Canada. See below for information regarding the lease associated with this engineering facility and our planned future relocation from this facility. We also have engineering and/or service facilities located in San Jose, California; Petaluma, California; Alpharetta, Georgia; Spokane, Washington; Kanata, Canada; and Gurgaon, India. In addition, we lease various smaller offices in the United States, Mexico, South America, Europe, the Middle East and the Asia-Pacific region to support our sales and services operations. We believe the facilities we are now using are adequate and suitable for our business requirements.
Hanover, Maryland Headquarters Lease
. Ciena entered into an agreement dated November 3, 2011, with W2007 RDG Realty, L.L.C. relating to a 15-year lease of office space for its corporate headquarters in Hanover, Maryland, consisting of an agreed-upon rentable area of approximately 154,100 square feet.
Ottawa Lease and Planned Relocation.
Ciena Canada, Inc., a subsidiary of Ciena, and Public Works and Government Services Canada (PWGSC) are parties to a lease agreement relating to Ciena’s lease of the Lab 10 building on the former Nortel Carling Campus in Ottawa, Canada. Our Lab 10 facility houses sophisticated research and development lab equipment and significant headcount including key engineering personnel. This facility consists of a rentable area of 265,000 square feet. This lease will terminate on December 31, 2017.
In contemplation of the termination of the Lab 10 lease, on October 23, 2014, Ciena Canada, Inc. entered into an agreement to lease the office building located at 5050 Innovation Drive, Ottawa, Canada, consisting of an agreed-upon rentable area of 170,582 square feet. Ciena occupied approximately 102,000 square feet of this facility during fiscal 2015 and expects to occupy the remaining amount during fiscal 2016. In addition, on April 15, 2015, Ciena Canada, Inc. entered into a work letter and a lease agreement related to the construction and lease of two new office buildings in Ottawa, Canada, consisting of a rentable area of approximately 254,318 square feet, that will be built adjacent to the premises subject to the October 2014 lease. Ciena expects to occupy these buildings by September 2017. These three facilities are expected to be part of a future campus that will replace the Lab 10 building. The October 2014 lease also provides Ciena a right of first offer to lease additional space in the building adjacent to the premises located at 4000 Innovation Drive, for so long as landlord owns the building and subject to any existing rights of the current tenant. The development of our new facilities and the transition of our operations in Ottawa will require significant effort, time and cost in advance of the expiration of the Lab 10 lease.
For additional information regarding our lease obligations, see Note
23
to the Consolidated Financial Statements in Item 8 of Part II of this annual report.
35
From May 15 through June 3, 2015, five separate putative class action lawsuits in connection with Ciena’s then-pending acquisition of Cyan, Inc. (“Cyan”) were filed in the Court of Chancery of the State of Delaware:
|
•
|
Luvishis v. Cyan, Inc., et al., C.A. No. 11027-CB, filed May 15, 2015
|
|
•
|
Poll v. Cyan, Inc., et al., C.A. No. 11028-CB, filed May 15, 2015
|
|
•
|
Canzano v. Floyd, et al., C.A. No. 11052-CB, filed May 20, 2015
|
|
•
|
Kassis v. Cyan, Inc., et al., C.A. No. 11069-CB, filed May 27, 2015
|
|
•
|
Fenske v. Cyan, Inc., et al., C.A. No. 11090-CB, filed June 3, 2015
|
Each of the complaints named Cyan (except for the Canzano complaint), Ciena, Neptune Acquisition Subsidiary, Inc., a Ciena subsidiary created solely for the purpose of effecting the acquisition (“Merger Sub”), and the members of Cyan’s board of directors as defendants. On June 23, 2015, each of these lawsuits was consolidated into a single case captioned In Re Cyan, Inc. Shareholder Litigation, Consol. C.A. No. 11027-CB. On July 9, 2015, the plaintiffs filed a verified amended class action complaint, which named as defendants Ciena, Merger Sub, and the members of Cyan’s board of directors. On August 5, 2015, the defendants filed motions to dismiss the amended complaint. On October 1, 2015, the plaintiffs filed a second amended complaint which named as defendants the members of Cyan’s board of directors. Cyan, Ciena, and Merger Sub were not named as defendants. The second amended complaint generally alleges that the Cyan board members breached their fiduciary duties by engaging in a conflicted and unfair sales process, failing to maximize stockholder value in the acquisition, taking steps to preclude competitive bidding, and failing to disclose material information necessary for stockholders to make an informed decision regarding the acquisition. The second amended complaint seeks (i) a declaration that the plaintiffs are entitled to a quasi-appraisal remedy, (ii) rescissory damages, (iii) recovery through an accounting of all damages caused as a result of the alleged breaches of fiduciary duties, (iv) compensatory damages, and (v) costs including attorneys’ fees and experts’ fees. On October 15, 2015, the defendants filed a renewed motion to dismiss. A briefing schedule for these motions has been set, with briefing to be completed in March 2016.
As a result of our acquisition of Cyan in August 2015, we became a defendant in a securities class action lawsuit. On April 1, 2014, a purported stockholder class action lawsuit was filed in the Superior Court of California, County of San Francisco, against Cyan, the members of Cyan’s board of directors, Cyan’s former Chief Financial Officer, and the underwriters of Cyan’s initial public offering. On April 30, 2014, a substantially similar lawsuit was filed in the same court against the same defendants. The two cases have been consolidated as Beaver County Employees Retirement Fund, et al. v. Cyan, Inc. et al., Case No. CGC-14-538355. The consolidated complaint alleges violations of federal securities laws on behalf of a purported class consisting of purchasers of Cyan’s common stock pursuant or traceable to the registration statement and prospectus for Cyan’s initial public offering in April 2013, and seeks unspecified compensatory damages and other relief. In July 2014, the defendants filed a demurrer to the consolidated complaint, which the court overruled in October 2014 and allowed the case to proceed. On May 19, 2015, the proposed class was certified. On August 25, 2015, the defendants filed a motion for judgment on the pleadings based on an alleged lack of subject matter jurisdiction over the case, which motion was denied on October 23, 2015. Ciena believes that the consolidated lawsuit is without merit and intends to defend it vigorously.
On May 29, 2008, Graywire, LLC filed a complaint in the United States District Court for the Northern District of Georgia against Ciena and
four
other defendants, alleging, among other things, that certain of the parties' products infringe U.S. Patent 6,542,673 (the “'673 Patent”), relating to an identifier system and components for optical assemblies. The complaint seeks injunctive relief and damages. In July 2009, upon request of Ciena and certain other defendants, the U.S. Patent and Trademark Office (“PTO”) granted the defendants'
inter partes
application for reexamination with respect to certain claims of the '673 Patent, and the district court granted the defendants' motion to stay the case pending reexamination of all of the patents-in-suit. In December 2010, the PTO confirmed the validity of some claims and rejected the validity of other claims of the '673 Patent, to which Ciena and other defendants filed an appeal. On March 16, 2012, the PTO on appeal rejected multiple claims of the '673 Patent, including the
two
claims on which Ciena is alleged to infringe. Subsequently, the plaintiff requested a reopening of the prosecution of the '673 Patent, which request was denied by the PTO on April 29, 2013. Thereafter, on May 28, 2013, the plaintiff filed an amendment with the PTO in which it canceled the claims of the '673 Patent on which Ciena is alleged to infringe. The case currently remains stayed, and there can be no assurance as to whether or when the stay will be lifted.
In addition to the matters described above, Ciena is subject to various legal proceedings and claims arising in the ordinary course of business, including claims against third parties that may involve contractual indemnification obligations on the part of Ciena. Ciena does not expect that the ultimate costs to resolve these matters will have a material effect on its results of operations, financial position or cash flows.
36
Not applicable.
37
(a) Our common stock is traded on the New York Stock Exchange under the stock symbol “CIEN.”
The following table sets forth the high and low sales prices of our common stock, as reported on the New York Stock Exchange for the fiscal periods indicated.
|
High
|
Low
|
||||||
|
Fiscal Year 2014
|
|
|
|||||
|
First Quarter ended January 31
|
$
|
24.37
|
|
$
|
20.93
|
|
|
|
Second Quarter ended April 30
|
$
|
27.16
|
|
$
|
18.88
|
|
|
|
Third Quarter ended July 31
|
$
|
22.94
|
|
$
|
18.00
|
|
|
|
Fourth Quarter ended October 31
|
$
|
20.98
|
|
$
|
13.77
|
|
|
|
Fiscal Year 2015
|
|
|
|||||
|
First Quarter ended January 31
|
$
|
20.32
|
|
$
|
14.69
|
|
|
|
Second Quarter ended April 30
|
$
|
22.50
|
|
$
|
17.86
|
|
|
|
Third Quarter ended July 31
|
$
|
26.50
|
|
$
|
20.67
|
|
|
|
Fourth Quarter ended October 31
|
$
|
25.49
|
|
$
|
17.97
|
|
|
As of
December 11, 2015
, there were approximately
775
holders of record of our common stock and
135,790,185
shares of common stock outstanding. We have never paid cash dividends on our capital stock. We currently intend to retain earnings for use in our business, and we do not anticipate paying any cash dividends in the foreseeable future.
The following graph shows a comparison of cumulative total returns for an investment in our common stock, the S&P Telecom Select Index and the S&P Global SmallCap Index from
October 31, 2010
to
October 31, 2015
. The S&P Telecom Select Industry Index comprises stocks in the S&P Total Market Index that are classified in the Global Industry Classification Standard as alternative carriers, communications equipment, integrated telecom services, and wireless telecom services sub-industries. The S&P Global SmallCap Index comprises the stocks representing the lowest 15% of float-adjusted market cap in each developed and emerging country. This graph is not deemed to be “filed” with the SEC or subject to the liabilities of Section 18 of the Securities Exchange Act of 1934, as amended (the "Exchange Act"), and the graph shall not be deemed to be incorporated by reference into any prior or subsequent filing by us under the Securities Act of 1933, as amended, or the Exchange Act.
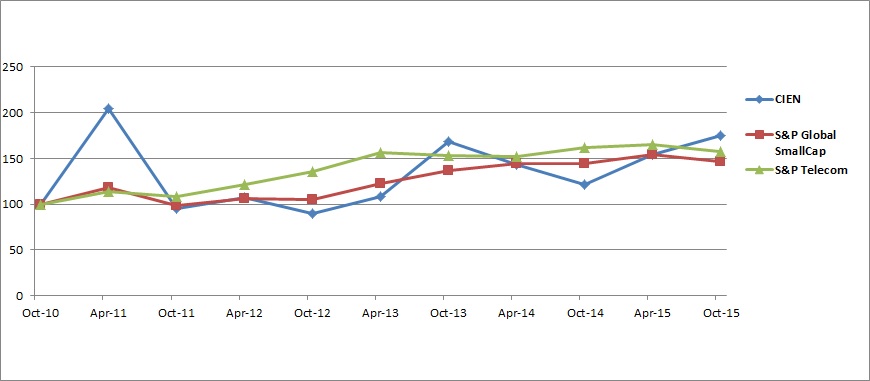
Assumes $100 invested in Ciena Corporation, the S&P Telecom Select Index and the S&P Global SmallCap Index, respectively, on
October 31, 2010
with all dividends reinvested at month-end.
38
(b) Not applicable.
(c) Not applicable.
39
The following selected consolidated financial data should be read in conjunction with Item 7, “Management’s Discussion and Analysis of Financial Condition and Results of Operations” and the Consolidated Financial Statements and the notes thereto included in Item 8, “Financial Statements and Supplementary Data” in Part II of this annual report. We have a 52 or 53-week fiscal year, which ends on the Saturday nearest to the last day of October in each year. For purposes of financial statement presentation, each fiscal year is described as having ended on October 31. Fiscal 2011, 2013, 2014 and 2015 consisted of 52 weeks, and fiscal 2012 consisted of 53 weeks.
|
Year Ended October 31,
(in thousands)
|
|||||||||||||||||||
|
|
2011
|
2012
|
2013
|
2014
|
2015
|
||||||||||||||
|
Cash and cash equivalents
|
$
|
541,896
|
|
$
|
642,444
|
|
$
|
346,487
|
|
$
|
586,720
|
|
$
|
790,971
|
|
||||
|
Short-term investments
|
$
|
—
|
|
$
|
50,057
|
|
$
|
124,979
|
|
$
|
140,205
|
|
$
|
135,107
|
|
||||
|
Long-term investments
|
$
|
50,264
|
|
$
|
—
|
|
$
|
15,031
|
|
$
|
50,057
|
|
$
|
95,105
|
|
||||
|
Total assets
|
$
|
1,951,418
|
|
$
|
1,881,143
|
|
$
|
1,802,770
|
|
$
|
2,072,632
|
|
$
|
2,695,051
|
|
||||
|
Short-term debt
|
$
|
—
|
|
$
|
216,210
|
|
$
|
—
|
|
$
|
190,063
|
|
$
|
2,500
|
|
||||
|
Long-term debt
|
$
|
1,442,364
|
|
$
|
1,225,806
|
|
$
|
1,212,019
|
|
$
|
1,274,791
|
|
$
|
1,271,639
|
|
||||
|
Total liabilities
|
$
|
1,937,545
|
|
$
|
1,970,115
|
|
$
|
1,885,447
|
|
$
|
2,142,247
|
|
$
|
2,074,175
|
|
||||
|
Stockholders’ equity (deficit)
|
$
|
13,873
|
|
$
|
(88,972
|
)
|
$
|
(82,677
|
)
|
$
|
(69,615
|
)
|
$
|
620,876
|
|
||||
40
Statement of Operations Data:
|
Year Ended October 31,
(in thousands, except per share data)
|
|||||||||||||||||||
|
|
2011
|
2012
|
2013
|
2014
|
2015
|
||||||||||||||
|
Revenue
|
$
|
1,741,970
|
|
$
|
1,833,923
|
|
$
|
2,082,546
|
|
$
|
2,288,289
|
|
$
|
2,445,669
|
|
||||
|
Cost of goods sold
|
1,032,824
|
|
1,109,699
|
|
1,217,371
|
|
1,339,937
|
|
1,370,106
|
|
|||||||||
|
Gross profit
|
709,146
|
|
724,224
|
|
865,175
|
|
948,352
|
|
1,075,563
|
|
|||||||||
|
Operating expenses:
|
|
|
|
|
|
||||||||||||||
|
Research and development
|
379,862
|
|
364,179
|
|
383,408
|
|
401,180
|
|
414,201
|
|
|||||||||
|
Selling and marketing
|
251,990
|
|
266,338
|
|
304,170
|
|
328,325
|
|
333,836
|
|
|||||||||
|
General and administrative
|
126,242
|
|
114,002
|
|
122,432
|
|
126,824
|
|
123,402
|
|
|||||||||
|
Amortization of intangible assets
|
69,665
|
|
51,697
|
|
49,771
|
|
45,970
|
|
69,511
|
|
|||||||||
|
Acquisition and integration costs
|
42,088
|
|
—
|
|
—
|
|
—
|
|
25,539
|
|
|||||||||
|
Restructuring costs
|
5,781
|
|
7,854
|
|
7,169
|
|
349
|
|
8,626
|
|
|||||||||
|
Change in fair value of contingent consideration
|
(3,289
|
)
|
—
|
|
—
|
|
—
|
|
—
|
|
|||||||||
|
Total operating expenses
|
872,339
|
|
804,070
|
|
866,950
|
|
902,648
|
|
975,115
|
|
|||||||||
|
Income (loss) from operations
|
(163,193
|
)
|
(79,846
|
)
|
(1,775
|
)
|
45,704
|
|
100,448
|
|
|||||||||
|
Interest and other income (loss), net
|
6,022
|
|
(15,200
|
)
|
(5,744
|
)
|
(25,262
|
)
|
(25,505
|
)
|
|||||||||
|
Interest expense
|
(37,926
|
)
|
(39,653
|
)
|
(44,042
|
)
|
(47,115
|
)
|
(51,179
|
)
|
|||||||||
|
Gain on cost method investments
|
7,249
|
|
—
|
|
—
|
|
—
|
|
—
|
|
|||||||||
|
Loss on extinguishment of debt
|
—
|
|
—
|
|
(28,630
|
)
|
—
|
|
—
|
|
|||||||||
|
Income (loss) before income taxes
|
(187,848
|
)
|
(134,699
|
)
|
(80,191
|
)
|
(26,673
|
)
|
23,764
|
|
|||||||||
|
Provision for income taxes
|
7,673
|
|
9,322
|
|
5,240
|
|
13,964
|
|
12,097
|
|
|||||||||
|
Net income (loss)
|
$
|
(195,521
|
)
|
$
|
(144,021
|
)
|
$
|
(85,431
|
)
|
$
|
(40,637
|
)
|
$
|
11,667
|
|
||||
|
Basic net income (loss) per common share
|
$
|
(2.04
|
)
|
$
|
(1.45
|
)
|
$
|
(0.83
|
)
|
$
|
(0.38
|
)
|
$
|
0.10
|
|
||||
|
Diluted net income (loss) per potential common share
|
$
|
(2.04
|
)
|
$
|
(1.45
|
)
|
$
|
(0.83
|
)
|
$
|
(0.38
|
)
|
$
|
0.10
|
|
||||
|
Weighted average basic common shares outstanding
|
95,854
|
|
99,341
|
|
102,350
|
|
105,783
|
|
118,416
|
|
|||||||||
|
Weighted average diluted potential common shares outstanding
|
95,854
|
|
99,341
|
|
102,350
|
|
105,783
|
|
120,101
|
|
|||||||||
41
Item 7.
Management's Discussion and Analysis of Financial Condition and Results of Operations
The following discussion and analysis should be read in conjunction with our “Selected Consolidated Financial Data” and consolidated financial statements and notes thereto included elsewhere in this annual report.
Overview
We are a network specialist focused on providing communications networking solutions that enable a wide range of network operators to adopt next-generation architectures. We have optimized our business and solutions to enable network operators to create and deliver the broad array of high-bandwidth services relied upon by enterprise and consumer end users. We provide equipment, software and services that support the transport, switching, aggregation, service delivery and management of voice, video and data traffic on communications networks. In addition to our high-capacity hardware platforms, we offer network management and control software platforms that help network operators simplify and automate their networks and virtualize certain network functions. Our solutions are designed to enable network operators to adopt open, multi-vendor, software-programmable network infrastructures that improve automation, reduce network complexity and flexibly support changing service requirements. Our solutions yield business and operational value for our customers by enabling them to introduce new, revenue-generating services and to reduce network complexity and expense.
Our Converged Packet Optical, Packet Networking and Optical Transport products are used, individually or as part of an integrated solution, by communications service providers, cable and multiservice operators, Web-scale providers, submarine network operators, governments, enterprises, research and education (R&E) institutions and other network operators across the globe. Our products, which support applications from the network core to network access points, allow network operators to scale capacity, increase transmission speeds, allocate traffic and adapt dynamically to changing end-user service demands. Our software solutions are oriented around our Blue Planet software platform, a modular, network virtualization, service orchestration and network management software platform designed to simplify the creation, automation and delivery of services across multi-vendor and multi-domain network environments. To complement our hardware and software solutions, we offer a broad range of network transformation and related support services that help our customers design, optimize, deploy, manage and maintain their networks.
The rapid proliferation of communications services and devices, together with increased mobility, growth in video, cloud-based services and data center interconnection, have fundamentally affected the bandwidth and service demands placed upon communications networks. As the capacity of their network infrastructures are pressured, many network operators also face a rapidly changing business environment and shifting competitive landscape. Newer market entrants, such as cloud service and over-the-top content providers, are challenging certain traditional business models. Our OP
n
Architecture, which enables increased network scalability, flexibility and programmability, is designed to meet these challenges. It allows for network-level software applications to control and configure the network dynamically, while flexible interfaces integrate computing, storage and other network resources. This approach enables highly configurable network infrastructures that can meet the “on-demand” service requirements of both our customers and their end-users. By enhancing software-based management and control, enabling network functions to be provided virtually, and reducing required network elements, our OP
n
approach optimizes network infrastructures. At the same time, it increases network scale at reduced cost and simplifies the management, deployment and orchestration of multi-vendor hardware and software elements. Our OP
n
Architecture, which underpins our solutions offering and guides our research and development strategy, is described more fully in the “Strategy” section of the description of our business in Item 1 of Part I of this report.
Our quarterly reports on Form 10-Q, annual reports on Form 10-K, and current reports on Form 8-K filed with the SEC are available through the SEC's website at www.sec.gov or free of charge on our website as soon as reasonably practicable after we file these documents. We routinely post the reports above, recent news and announcements, financial results and other information about Ciena that is important to investors in the "Investors" section of our website at www.ciena.com. Investors are encouraged to review the “Investors” section of our website because, as with the other disclosure channels that we use, from time to time we may post material information on that site that is not otherwise disseminated by us.
Acquisition of Cyan, Inc.
On August 3, 2015, we acquired Cyan, Inc. (“Cyan”), a leading provider of software-defined networking (SDN), network function virtualization (NFV) and metro packet-optical solutions, in a cash and stock transaction. Subject to the terms and conditions of the merger agreement, at closing each outstanding Cyan share was exchanged for 0.19936 shares of Ciena common stock and $0.63 in cash, resulting in an exchange of all of the outstanding shares of Cyan common stock for approximately
$33.6 million
in cash and
10.6 million
shares of Ciena common stock. Ciena assumed all then-outstanding Cyan stock options and unvested
42
restricted stock unit awards and substituted for them approximately
1.0 million
Ciena restricted stock unit awards and stock options exercisable for approximately
2.4 million
shares of Ciena common stock. See Note
2
to our Consolidated Financial Statements included in in Item 8 of Part II of this report for more information relating to this transaction.
Our acquisition of Cyan is intended to advance a strategy that started with the introduction of our OP
n
Architecture and was extended with the launch of our Agility software division in fiscal 2014. We believe that Cyan's best-in-class Blue Planet software solutions portfolio will significantly strengthen our software offering. Complementing Ciena's network control and application software technologies, Cyan adds multi-vendor network virtualization, service orchestration and next-generation network management software. The Blue Planet portfolio offers a carrier-grade, multi-vendor SDN and NFV platform designed to automate, orchestrate, and manage the lifecycle of virtualized services across data centers and the wide area network (WAN). Further strengthening our leadership in packet-optical hardware products, Cyan brings a metro packet-optical business with a complementary base of key customers for its family of Z-Series high-capacity, multi-layer switching and transport platforms. We believe that this strategic acquisition will accelerate our availability to offer a complete, on-demand solution for virtualized networks and services in an open ecosystem, and will increase our opportunity to play a leading role in the transformation of the network from the delivery of capacity to the creation of service capability on-demand.
In connection with our acquisition of Cyan, during the fourth quarter of fiscal 2015, we unified the software resources and activities of both companies under a single brand and comprehensive set of resources known as the "Blue Planet" division. This division, which includes Ciena's former Agility division, is focused on providing next-generation, multi-vendor network virtualization, service orchestration and management solutions. For fiscal 2015, revenue from Cyan's packet-optical solutions is included in our Converged Packet Optical operating segment and revenue from its Blue Planet software solutions is included in our Software and Services operating segment. See Note 24 to our Consolidated Financial Statements included in Item 8 of Part II of this report for information relating to our operating segments for fiscal 2016.
During fiscal 2015, we incurred approximately
$25.5 million
of acquisition-related costs associated with this transaction. These costs and expenses include fees associated with financial, legal and accounting advisors, facilities and systems consolidation costs, and severance and other employment-related costs, including payments to certain former Cyan executives and approximately
$7.6 million
of non-cash share-based compensation expense. We also expect our future financial results to be impacted, in a number of ways, as a result of the purchase accounting for the Cyan transaction. We recorded finite-lived intangible assets such as developed technology, customer relationships, trademarks, and trade names, the amortization of which will increase our expense during the useful life of these assets.
Market Opportunity
The markets in which we sell our communications networking solutions have been subject to significant changes in recent years, including rapid growth in network traffic, increased mobility, and evolving cloud-based service offerings and end-user service demands. These conditions have placed significant demands on network infrastructures. They have also created market opportunities and challenged the business models and competitive landscapes of network operators, and the vendors that support them. Existing and emerging network operators are competing to distinguish their service offerings and rapidly introduce differentiated, revenue-generating services. At the same time, network operators continue to seek to manage the costs of their networks and to ensure a profitable business model. These dynamics are driving technology convergence of network features, functions and layers, virtualization of certain network functions, and solutions that leverage increased software-based network control and programmability. We believe that these dynamics, and the need to adapt to changing business conditions, are creating an environment that will cause network operators to adopt infrastructures that are more open, programmable and automated. We also believe that these conditions will require network operators and vendors alike to utilize an ecosystem of physical and virtual network resources provided by a variety of third parties, driving increased openness and interoperability of network infrastructures.
During fiscal 2015, we saw certain of our service provider customers increase efforts to constrain capital expenditure budgets, which adversely impacted certain segments of our market, including in the U.S. Notwithstanding these market dynamics, which together with certain customer-specific factors affecting spending, impacted our markets, our revenue increased during fiscal 2015. Increased revenue benefited from our efforts to diversify our customer base to include additional customer segments, such as Web-scale providers, cable and multiservice operators, and additional service providers in geographies including Brazil and India, and our strategy of focusing on certain higher growth segments of the network infrastructure market, including Webscale providers. Our fiscal 2015 revenue also benefited from the addition of revenue from our acquisition of Cyan during the fourth quarter of fiscal 2015. Our corporate strategy to capitalize on these market dynamics, promote operational efficiency and drive profitable growth of our business includes the initiatives set forth in the "Strategy" section of the description of our business in Item 1 of Part 1 of this annual report.
Competitive Landscape
43
The markets in which we compete are characterized by rapidly advancing technologies, introduction of new networking solutions and intense selling efforts to displace incumbent vendors and to capture market share. We continue to encounter a highly competitive and fragmented marketplace for our solutions. Our sales of Converged Packet Optical solutions face an intense competitive environment as we and our competitors introduce new, high-capacity, high-speed network solutions and seek adoption of these solutions and our network architectural approach. We expect the competitive landscape in which we operate to continue to broaden and to remain challenging and dynamic. As we expand our solutions offering, including our sales of Packet Networking solutions such as our 8700 Packetwave Platform, and our Waveserver data center interconnect (DCI) platform, we expect that our business will overlap more directly with additional networking solution suppliers, including IP router vendors, data center switch providers and other suppliers or integrators of networking technology traditionally geared toward different network applications, layers or functions. In addition, as we seek adoption of our Blue Planet software platform, and network operator demands for software programmability, management and control increase, we expect increasingly to compete with software vendors, information technology vendors or integrators of these solutions to promote our network architectural approach. We may also face increased competition from companies, including those in our supply chain, who develop networking products based on off-the-shelf or commoditized hardware technology, referred to as “white box” hardware, particularly where our customer's network strategies seek to emphasize deployment of those product offerings.
Against the backdrop of these competitive dynamics, maintaining incumbency with key customers around the globe, and securing new opportunities with a diverse set of network operators, often requires that we agree to aggressive pricing, significant commercial concessions or other unfavorable commercial terms. These terms have previously and may in the future adversely affect our quarterly results of operations and contribute to fluctuations in our results. These terms can also lengthen our revenue recognition or cash collection cycles, add start-up costs to initial sales or deployment of our solutions, require financial commitments or performance bonds, and include onerous contractual commitments that place a disproportionate allocation of risk upon us.
Convertible Notes Indebtedness
Maturity of 4.0% Convertible Senior Notes due 2015.
On March 15, 2015, our outstanding 4.0% Convertible Senior Notes due 2015 (the “2015 Notes”) matured. As a result of conversion elections made by holders of a substantial majority of the outstanding 2015 Notes under the terms of the indenture governing the 2015 Notes, together with certain private exchange transactions conducted by us prior to maturity, approximately $180.6 million in aggregate principal amount of the 2015 Notes, representing 96.3% of the outstanding aggregate principal amount of the 2015 Notes, was settled through the issuance of Ciena common stock at or prior to maturity. In total, we issued approximately 8.9 million shares of Ciena common stock as a result of the conversion elections and private exchange transactions in respect of the 2015 Notes. We repaid in cash approximately $6.9 million in aggregate principal amount of the 2015 Notes at maturity.
Assumption and Conversion of Cyan Convertible Notes.
Upon the closing of our acquisition of Cyan, we assumed its $50.0 million in outstanding principal amount of 8.0% Convertible Senior Secured Notes due 2019 (the "2019 Notes"). Under the terms of the indenture governing the 2019 notes, following the closing of the acquisition, the note holders were given the right to convert the 2019 Notes at an increased conversion rate of approximately 91.79 shares of Ciena common stock and $290.08 in cash for each $1,000 principal amount of the 2019 Notes. During the fourth quarter of fiscal 2015, holders representing all of the outstanding aggregate principal amount of the 2019 Notes surrendered their notes for conversion and, accordingly, there are no remaining 2019 Notes outstanding. In satisfaction of such conversions, during the fourth quarter of fiscal 2015, we issued approximately 4.6 million shares of Ciena common stock and paid $14.5 million in cash.
See Note
15
to our Consolidated Financial Statements included in in Item 8 of Part II of this report for more information relating to our outstanding convertible notes.
Financial Results for Fourth Quarter of
Fiscal 2015
Revenue for the
fourth
quarter of
fiscal 2015
was
$692.0 million
, representing a sequential
increase
of
14.8%
from
$602.9 million
in the
third
quarter of
fiscal 2015
. Fourth quarter revenue includes $84.4 million from products and services relating to the Cyan business acquired on August 3, 2015. Revenue-related details reflecting sequential changes from the
third
quarter of
fiscal 2015
include the following:
|
•
|
Product revenue for the
fourth
quarter of
fiscal 2015
increased
by
$80.4 million
, primarily reflecting increases of
$76.3 million
in
Converged Packet Optical
and
$6.5 million
in
Packet Networking
. These increases were partially offset by a decrease of
$1.7 million
in software. Increased Converged Packet Optical revenue reflects
$81.0 million
|
44
relating to the Z-Series Packet-Optical Platform acquired from Cyan. Sales of this platform primarily benefited from significantly increased sales to Windstream Corporation, which has been participating in certain U.S. government-supported funding programs at levels that we do not expect to recur. Accordingly, we expect quarterly revenue for this product during fiscal 2016 to decrease considerably from the level attained in the fourth quarter.
|
•
|
Service revenue for the
fourth
quarter of
fiscal 2015
increased
by
$8.7 million
, inclusive of
$3.4 million
from the acquired Cyan business.
|
|
•
|
Revenue from North America for the
fourth
quarter of
fiscal 2015
was
$480.0 million
,
an increase
from
$389.6 million
in the
third
quarter of
fiscal 2015
. This primarily reflects increases of $75.7 million in Converged Packet Optical, $7.6 million in Packet Networking, and $6.8 million in Software and Services.
|
|
•
|
Europe, Middle East and Africa ("EMEA") revenue for the
fourth
quarter of
fiscal 2015
was
$94.0 million
, a slight increase from
$93.2 million
in the
third
quarter of
fiscal 2015
. This primarily reflects an increase of $2.3 million in Converged Packet Optical, partially offset by a decrease of $1.0 million in Software and Services.
|
|
•
|
Caribbean and Latin America ("CALA") revenue for the
fourth
quarter of
fiscal 2015
was
$45.7 million
,
a decrease
from
$65.1 million
in the
third
quarter of
fiscal 2015
. This primarily reflects a decrease of $21.4 million in Converged Packet Optical offset by an increase of $2.5 million in Software and Services.
|
|
•
|
Asia Pacific ("APAC") revenue for the
fourth
quarter of
fiscal 2015
was
$72.3 million
,
an increase
from
$55.0 million
in the
third
quarter of
fiscal 2015
. This primarily reflects an increase of $19.7 million in Converged Packet Optical, partially offset by a decrease of $1.5 million in Software and Services.
|
|
•
|
For the
fourth
quarter of
fiscal 2015
, AT&T and Windstream Corporation accounted for 19.1% and 10.5%, respectively, of total revenue. For the third quarter of fiscal 2015, AT&T accounted for
20.2%
of total revenue and no other customer accounted for 10% or more of revenue.
|
Gross margin for the
fourth
quarter of
fiscal 2015
was
43.8%
, a
decrease
from
44.8%
in the
third
quarter of
fiscal 2015
. Gross margin for the
fourth
quarter of
fiscal 2015
was adversely affected by the strong sales volume of lower margin Z-Series Packet-Optical Platform and the impact of certain items relating to the purchase accounting for the Cyan acquisition that increased costs of goods sold during the quarter. These items included the revaluation of the acquired Cyan inventory and increased expense for amortization of acquired intangible assets.
Operating expense was
$293.6 million
for the
fourth
quarter of
fiscal 2015
, a
$68.2 million
increase
from
$225.4 million
in the
third
quarter of
fiscal 2015
. This increase principally reflects $60.2 million of operating expense resulting from the Cyan acquisition, including
$25.4 million
related to amortization of acquired intangible assets,
$19.6 million
in acquisition and integration costs, $8.2 million in research and development expense, and $7.0 million in selling and marketing expense. The remaining operating expense increase of $8.0 million primarily reflects increases of $4.4 million in selling and marketing expense, due to incentive compensation, and $4.1 million in general and administrative expense, primarily due to increased performance-based stock compensation expense.
Reflecting the increases in operating expense above, income from operations for the
fourth
quarter of
fiscal 2015
was
$9.4 million
, as compared to
$44.5 million
during the
third
quarter of
fiscal 2015
. Due primarily to the fluctuation in foreign currency exchange rates, net of hedging, we incurred losses in interest and other income, net of
$6.2 million
and
$5.5 million
during the
fourth
quarter of
fiscal 2015
and the
third
quarter of
fiscal 2015
, respectively. Our net
loss
for the
fourth
quarter of
fiscal 2015
was
$13.8 million
, or
$0.10
per diluted common share. This compares to a net
income
of
$23.6 million
or
$0.19
per diluted common share, for the
third
quarter of
fiscal 2015
.
We
generated
$84.6 million
of cash
from
operations during the
fourth
quarter of
fiscal 2015
. This compares with
$117.5 million
in cash
generated
from
operations during the
third
quarter of
fiscal 2015
. As of
October 31, 2015
, we had
$791.0 million
in cash and cash equivalents,
$135.1 million
of short-term investments in U.S. treasury securities and commercial paper and
$95.1 million
of long-term investments in U.S. treasury securities. This compares to
$697.1 million
in cash and cash equivalents,
$160.1 million
of short-term investments in U.S. treasury securities and commercial paper, and
$70.2 million
of long-term investments in U.S. treasury securities at
July 31, 2015
.
As of
October 31, 2015
, we had
5,345
employees,
an increase
from
5,196
as of
July 31, 2015
and
an increase
from
5,161
and
4,754
at
October 31, 2014
and
2013
, respectively.
45
Consolidated Results of Operations
Operating Segments
For the periods covered by this report, Ciena’s internal organizational structure and the management of its business were grouped into the following operating segments, each of which is more fully described in the "Products and Services" section of the description of our business in Item 1 of Part I of this annual report:
|
•
|
Converged Packet Optical —
includes the 6500 Packet-Optical Platform and the 5430 Reconfigurable Switching System, which feature our WaveLogic coherent optical processors. Products also include Waveserver, the family of CoreDirector® Multiservice Optical Switches and the OTN configuration for the 5410 Reconfigurable Switching System. Revenue from sales of the Z-Series Packet-Optical Platform acquired from Cyan is included in our Converged Packet Optical segment. This segment also includes sales of operating system software and enhanced software features embedded in each of these products. Revenue from this segment is included in product revenue on the Consolidated Statement of Operations.
|
|
•
|
Packet Networking —
includes the 3000 family of service delivery switches and service aggregation switches and the 5000 family of service aggregation switches. This segment also includes the 8700 Packetwave Platform and the Ethernet packet configuration for the 5410 Service Aggregation Switch. This segment also includes sales of operating system software and enhanced software features embedded in each of these products. Revenue from this segment is included in product revenue on the Consolidated Statement of Operations.
|
|
•
|
Optical Transport —
includes the 4200 Advanced Services Platform, Corestream® Agility Optical Transport System, 5100/5200 Advanced Services Platform, Common Photonic Layer (CPL) and 6100 Multiservice Optical Platform. This segment includes sales from SONET/SDH, transport and data networking products, as well as certain enterprise-oriented transport solutions that support storage and LAN extension, interconnection of data centers, and virtual private networks. This segment also includes operating system software and enhanced software features embedded in each of these products. Revenue from this segment is included in product revenue on the Consolidated Statement of Operations.
|
|
•
|
Software and Services —
includes the sale of network management solutions, including the OneControl Unified Management System, ON-Center® Network & Service Management Suite, Ethernet Services Manager, Optical Suite Release and Planet Operate. This segment includes sales of Ciena's Blue Planet
s
oftware platform, a modular network virtualization, service orchestration and network management software solution, and Ciena's SDN Multilayer WAN Controller and its related applications. This segment includes a broad range of services for consulting and network design, installation and deployment, software subscription, maintenance support and training activities. Except for revenue from the software portion of this segment, which is included in product revenue, revenue from this segment is included in services revenue on the Consolidated Statement of Operations.
|
Fiscal 2014
compared to
Fiscal 2015
Revenue
During fiscal
2015
, the U.S. dollar strengthened against a number of foreign currencies, including the Canadian Dollar and the Euro, in which we have our most significant foreign currency revenue exposure. Consequently, our total revenue reported in U.S. dollars during fiscal
2015
was adversely impacted by approximately
$48.4 million
, or
1.9%
, as compared to fiscal
2014
. The table below (in thousands, except percentage data) sets forth the changes in our operating segment revenue for the periods indicated:
|
|
Fiscal Year
|
|
|
|||||||||||||||
|
2014
|
%*
|
2015
|
%*
|
Increase
(decrease)
|
%**
|
|||||||||||||
|
Revenue:
|
|
|
|
|
|
|
||||||||||||
|
Converged Packet Optical
|
$
|
1,455,501
|
|
63.6
|
$
|
1,661,702
|
|
67.9
|
$
|
206,201
|
|
14.2
|
|
|||||
|
Packet Networking
|
244,116
|
|
10.7
|
229,223
|
|
9.4
|
(14,893
|
)
|
(6.1
|
)
|
||||||||
|
Optical Transport
|
127,215
|
|
5.6
|
73,004
|
|
3.0
|
(54,211
|
)
|
(42.6
|
)
|
||||||||
|
Software and Services
|
461,457
|
|
20.1
|
481,740
|
|
19.7
|
20,283
|
|
4.4
|
|
||||||||
|
Consolidated revenue
|
$
|
2,288,289
|
|
100.0
|
$
|
2,445,669
|
|
100.0
|
$
|
157,380
|
|
6.9
|
|
|||||
46
_________________________________
|
*
|
Denotes % of total revenue
|
|
**
|
Denotes % change from 2014 to 2015
|
|
•
|
Converged Packet Optical
revenue
increased
, reflecting a $139.7 million increase in sales of our 6500 Packet-Optical Platform, largely driven by service provider demand for high-capacity, optical transport for coherent 40G and 100G network infrastructures, and a $19.1 million increase in sales of the OTN configuration for the 5410 Reconfigurable Switching System. Increased revenue also reflects the addition of $81.0 million relating to the Z-Series Packet-Optical Platform acquired from Cyan. These increases were partially offset by decreases of $16.8 million in sales of our CoreDirector® Multiservice Optical Switches and $16.8 million in sales of our 5430 Reconfigurable Switching System. The strong performance of this segment, particularly as compared to the expected and continued revenue declines in Optical Transport segment revenue, reflects the preference of network operators to adopt next-generation architectures that enable the convergence of high-capacity, coherent optical transport with integrated OTN switching and control plane functionality.
|
|
•
|
Packet Networking
revenue
decreased
, reflecting decreases of $15.8 million in sales of our 3000 and 5000 families of service delivery and aggregation switches and $2.6 million in sales of our legacy broadband products. These decreases were offset by a $3.8 million increase in sales of our 8700 Packetwave Platform, which became available for sale in the fourth quarter of fiscal 2014.
|
|
•
|
Optical Transport
revenue
decreased
, reflecting decreases of $20.5 million in sales of our 4200 Advanced Services Platform, $16.9 million in sales of our 5100/5200 Advanced Services Platform and $16.8 million in sales of our other stand-alone transport products. Revenue for our Optical Transport segment, which currently consists principally of stand-alone WDM and SONET/SDH-based transport platforms, has experienced meaningful declines in annual revenue in recent years. We expect this trend to continue, reflecting network operators' transition toward next-generation network architectures as described above.
|
|
•
|
Software and Services
revenue
increased
, reflecting increases of $18.8 million in maintenance and support services sales and $3.1 million in installation and deployment services sales partially offset by a decrease of $1.1 million in network transformation consulting sales.
|
Our operating segments each engage in business and operations across four geographic regions: North America; EMEA; CALA; and APAC. Results for North America include only activities in the United States and Canada. Part of our business and growth strategy is to secure additional communications service provider customers outside of North America, including in high-growth geographies such as Brazil and India. We believe that this is an important part of our strategy and required for continued revenue growth. The following table reflects our geographic distribution of revenue principally based on the relevant location for our delivery of products and performance of services. Our revenue, particularly when considered by geographic distribution, can fluctuate significantly from quarter to quarter. Among other things, the timing of revenue recognition for large network projects, particularly outside of North America, can result in large variations in geographic revenue results in any particular quarter. The table below (in thousands, except percentage data) sets forth the changes in geographic distribution of revenue for the periods indicated:
|
|
Fiscal Year
|
|
|
|||||||||||||||
|
2014
|
%*
|
2015
|
%*
|
Increase
(decrease)
|
%**
|
|||||||||||||
|
North America
|
$
|
1,477,329
|
|
64.6
|
$
|
1,598,328
|
|
65.4
|
$
|
120,999
|
|
8.2
|
|
|||||
|
EMEA
|
417,399
|
|
18.2
|
400,294
|
|
16.4
|
(17,105
|
)
|
(4.1
|
)
|
||||||||
|
CALA
|
212,018
|
|
9.3
|
201,499
|
|
8.2
|
(10,519
|
)
|
(5.0
|
)
|
||||||||
|
APAC
|
181,543
|
|
7.9
|
245,548
|
|
10.0
|
64,005
|
|
35.3
|
|
||||||||
|
Total
|
$
|
2,288,289
|
|
100.0
|
$
|
2,445,669
|
|
100.0
|
$
|
157,380
|
|
6.9
|
|
|||||
_________________________________
|
*
|
Denotes % of total revenue
|
|
**
|
Denotes % change from 2014 to 2015
|
47
|
•
|
North America revenue
includes sales to AT&T for fiscal 2014 and fiscal 2015 of
$423.5 million
and
$487.8 million
, respectively. Revenues reflect increases of $184.0 million in Converged Packet Optical sales and $6.2 million in Software and Services sales, partially offset by decreases of $38.2 million in Optical Transport sales and $31.0 million in sales of Packet Networking. Converged Packet Optical sales principally reflect a $106.8 million increase in sales of our 6500 Packet-Optical Platform on increased sales to AT&T, cable and multiservice operators and Web-scale providers, and a $76.3 million increase due to sales of our Z-Series Packet-Optical Platform acquired from Cyan during the fourth quarter.
|
|
•
|
EMEA revenue
reflects decreases of $13.2 million in Optical Transport sales and $6.5 million in Software and Services sales. These decreases were partially offset by an increase of $2.2 million in sales of Converged Packet Optical sales.
|
|
•
|
CALA revenue
reflects a $20.6 million decrease in Converged Packet Optical sales. This decrease was partially offset by an increase of $9.7 million in Software and Services sales. Converged Packet Optical sales reflect a $41.3 million decrease in sales of our 5430 Reconfigurable Switching System, partially offset primarily by a $15.5 million increase in sales of our 6500 Packet-Optical Platform primarily to certain communications service providers. Software and Services sales reflect increases of $5.7 million in installation and deployment services sales and $2.3 million of network transformation consulting sales.
|
|
•
|
APAC revenue
reflects increases of $40.6 million in Converged Packet Optical sales, $16.0 million in Packet Networking sales and $10.8 million in Software and Services sales. These increases were partially offset by a decrease of $3.4 million in sales of Optical Transport. Converged Packet Optical sales reflect increases of $18.7 million of sales of our 6500 Packet-Optical Platform, $18.6 million of sales of our 5430 Reconfigurable Switching System, principally to communication service providers and submarine network operators, and $1.3 million of the Cyan acquired Z-Series Packet-Optical Platform. Sales of our 6500 Packet-Optical Platform reflect increased sales to communication service providers, sales through our strategic relationship with Ericsson and sales to submarine network providers.
|
While we have benefited from the diversification of our business and customer base, our largest ten customers contributed
56.4%
of
fiscal 2014
revenue and
52.5%
of
fiscal 2015
revenue. A sizable portion of our revenue continues to be derived from sales to service provider customers. Consequently, our financial results are closely correlated with the spending of a relatively small number of customers and can be significantly affected by market, industry or competitive dynamics affecting their businesses. Our reliance upon a relatively small number of customers also increases our exposure to changes in their spending levels, network priorities and purchasing strategies. The loss of a significant customer could have a material adverse effect on our business and results of operations and our results of operations can fluctuate quarterly depending upon sales volumes and purchasing priorities with these large customers.
Sales to AT&T were
$423.5 million
, or
18.5%
of total revenue, in
fiscal 2014
and
$487.8 million
, or
19.9%
of total revenue, in
fiscal 2015
. During fiscal 2015, AT&T and other service provider customers announced initiatives to reduce capital expenditures in future periods, including on network infrastructure, and there can be no assurance that we will be able to maintain the sales levels we achieved during fiscal 2015. Moreover, AT&T and other customers, including service providers, are pursuing network strategies that seek to utilize enhanced software programmability, management and control of networks and to deploy off-the-shelf or commoditized hardware technology, referred to as "white box" hardware, in lieu of existing solutions. These strategies may present challenges and opportunities for our business, particularly where we are an incumbent equipment vendor. We did not have any other customers accounting for greater than 10% of our revenue in
fiscal 2014
or
fiscal 2015
.
As our business has diversified, we have taken a number of steps to increase the velocity of our business and improve our operating efficiency, including through inventory management and lead time reduction. As a result, the percentage of product revenue that we generate from customer orders placed during that particular quarter has increased meaningfully, as compared to our historical periods. Our increased reliance upon orders placed during a particular quarter may make it harder to predict our revenue and results of operations, and may further increase the likelihood of fluctuations in our results.
Cost of Goods Sold and Gross Profit
Product cost of goods sold consists primarily of amounts paid to third party contract manufacturers, component costs, employee-related costs and overhead, shipping and logistics costs associated with manufacturing-related operations, warranty and other contractual obligations, royalties, license fees, amortization of intangible assets, cost of excess and obsolete inventory and, when applicable, estimated losses on committed customer contracts.
48
Services cost of goods sold consists primarily of direct and third party costs, including employee-related costs, associated with our provision of services including installation, deployment, maintenance support, consulting and training activities and, when applicable, estimated losses on committed customer contracts.
Our gross profit as a percentage of revenue, or “gross margin,” is susceptible to fluctuations due to a number of factors. In any given period, gross margin can vary significantly depending upon the mix and concentration of revenue by segment, product line within a particular segment, geography and customers. Gross margin can also be affected by our concentration of lower margin "common" equipment sales and higher margin products including channel cards, the mix of lower margin installation services within our service revenue, our introduction of new products, and changes in expense for excess and obsolete inventory and warranty obligations. We regularly encounter market-based price erosion, and we expect that our gross margins will be subject to fluctuation and significantly dependent upon on our level of success in driving product cost reductions relative to the price reductions that we encounter. Accordingly, gross margin can be adversely affected by the level of pricing pressure and competition that we encounter in the market. In an effort to retain or secure customers, enter new markets or capture market share, we may agree to pricing or other unfavorable commercial terms that result in lower or negative gross margins on a particular order or group of orders. Gross margin can also be affected as a result of our degree of success in implementing certain optimization initiatives focused on rationalizing our supply chain and consolidating third party contract manufacturers and distribution sites. These factors and market dynamics may result in fluctuation in our results of operations and can adversely affect our gross margin and results of operations in certain periods.
Service gross margin can be affected by the mix of customers and services, particularly the mix between deployment and maintenance services, geographic mix and the timing and extent of any investments in internal resources to support this business.
The tables below (in thousands, except percentage data) set forth the changes in revenue, cost of goods sold and gross profit for the periods indicated:
|
|
Fiscal Year
|
|
|
||||||||||||||
|
2014
|
%*
|
2015
|
%*
|
Increase
(decrease)
|
%**
|
||||||||||||
|
Total revenue
|
$
|
2,288,289
|
|
100.0
|
$
|
2,445,669
|
|
100.0
|
$
|
157,380
|
|
6.9
|
|||||
|
Total cost of goods sold
|
1,339,937
|
|
58.6
|
1,370,106
|
|
56.0
|
30,169
|
|
2.3
|
||||||||
|
Gross profit
|
$
|
948,352
|
|
41.4
|
$
|
1,075,563
|
|
44.0
|
$
|
127,211
|
|
13.4
|
|||||
_________________________________
|
*
|
Denotes % of total revenue
|
|
**
|
Denotes % change from 2014 to 2015
|
|
|
Fiscal Year
|
|
|
||||||||||||||
|
2014
|
%*
|
2015
|
%*
|
Increase
(decrease)
|
%**
|
||||||||||||
|
Product revenue
|
$
|
1,865,826
|
|
100.0
|
$
|
2,002,395
|
|
100.0
|
$
|
136,569
|
|
7.3
|
|||||
|
Product cost of goods sold
|
1,083,022
|
|
58.0
|
1,120,373
|
|
56.0
|
37,351
|
|
3.4
|
||||||||
|
Product gross profit
|
$
|
782,804
|
|
42.0
|
$
|
882,022
|
|
44.0
|
$
|
99,218
|
|
12.7
|
|||||
_________________________________
|
*
|
Denotes % of product revenue
|
|
**
|
Denotes % change from 2014 to 2015
|
49
|
|
Fiscal Year
|
|
|
|||||||||||||||
|
2014
|
%*
|
2015
|
%*
|
Increase
(decrease)
|
%**
|
|||||||||||||
|
Service revenue
|
$
|
422,463
|
|
100.0
|
$
|
443,274
|
|
100.0
|
$
|
20,811
|
|
4.9
|
|
|||||
|
Service cost of goods sold
|
256,915
|
|
60.8
|
249,733
|
|
56.3
|
(7,182
|
)
|
(2.8
|
)
|
||||||||
|
Service gross profit
|
$
|
165,548
|
|
39.2
|
$
|
193,541
|
|
43.7
|
$
|
27,993
|
|
16.9
|
|
|||||
_________________________________
|
*
|
Denotes % of service revenue
|
|
**
|
Denotes % change from 2014 to 2015
|
|
•
|
Gross profit as a percentage of revenue
increased
as a result of the factors described below.
|
|
•
|
Gross profit on products as a percentage of product revenue
increased
as a result of our relative success in driving product cost reductions and realizing improved manufacturing efficiencies as compared to the market-based price erosion we encountered during the period.
|
|
•
|
Gross profit on services as a percentage of services revenue
increased
, primarily due to increased sales of higher margin software subscription services and reduced repair costs to support maintenance service contracts.
|
Operating Expense
We expect operating expense to increase in fiscal 2016 from the level reported for fiscal 2015, in part relating to the acquisition of the Cyan business during the fourth quarter of fiscal 2015 and the addition of its personnel and operations. We also expect operating expense to increase in order to fund our research and development initiatives, to provide for investments in the re-engineering of company-wide enterprise resource planning platforms, and to fund the transition of key facilities. In particular, the development of our new facilities and the transition of our operations in Ottawa will require significant effort, time and cost in advance of the expiration of the lease for our Lab 10 facility. For additional information regarding this lease and the facility transition, see Item 2 of Part I of this annual report.
Operating expense consists of the component elements described below.
Research and development expense
primarily consists of salaries and related employee expense (including share-based compensation expense), prototype costs relating to design, development, and testing of our products, depreciation expense and third party consulting costs.
Selling and marketing expense
primarily consists of salaries, commissions and related employee expense (including share-based compensation expense), and sales and marketing support expense, including travel, demonstration units, trade show expense and third party consulting costs.
General and administrative expense
primarily consists of salaries and related employee expense (including share-based compensation expense), and costs for third party consulting and other services.
Acquisition and integration costs
consist of expenses for financial, legal and accounting advisors, facilities and systems consolidation costs, and severance and other employment-related costs related to our recent acquisition of Cyan.
Amortization of intangible assets
primarily reflects the amortization of purchased technology and the value of customer relationships derived from our acquisitions.
Restructuring costs
primarily reflect actions Ciena has taken to better align its workforce, facilities and operating costs with perceived market opportunities, business strategies and changes in market and business conditions.
The table below (in thousands, except percentage data) sets forth the changes in operating expense for the periods indicated:
50
|
|
Fiscal Year
|
|
|
|||||||||||||||
|
2014
|
%*
|
2015
|
%*
|
Increase
(decrease)
|
%**
|
|||||||||||||
|
Research and development
|
$
|
401,180
|
|
17.5
|
$
|
414,201
|
|
16.9
|
$
|
13,021
|
|
3.2
|
|
|||||
|
Selling and marketing
|
328,325
|
|
14.3
|
333,836
|
|
13.7
|
5,511
|
|
1.7
|
|
||||||||
|
General and administrative
|
126,824
|
|
5.5
|
123,402
|
|
5.0
|
(3,422
|
)
|
(2.7
|
)
|
||||||||
|
Amortization of intangible assets
|
45,970
|
|
2.0
|
69,511
|
|
2.8
|
23,541
|
|
51.2
|
|
||||||||
|
Acquisition and integration costs
|
—
|
|
—
|
25,539
|
|
1.0
|
25,539
|
|
—
|
|
||||||||
|
Restructuring costs
|
349
|
|
—
|
8,626
|
|
0.4
|
8,277
|
|
2,371.6
|
|
||||||||
|
Total operating expenses
|
$
|
902,648
|
|
39.3
|
$
|
975,115
|
|
39.8
|
$
|
72,467
|
|
8.0
|
|
|||||
_________________________________
|
*
|
Denotes % of total revenue
|
|
**
|
Denotes % change from 2014 to 2015
|
|
•
|
Research and development expense
benefited by
$28.0 million
as a result of foreign exchange rates, net of hedging, primarily due to a stronger U.S. dollar in relation to the Canadian dollar. Including the effect of foreign exchange rates, research and development expenses increased by
$13.0 million
, primarily reflecting increases of $8.6 million in facilities and information systems expense, $6.3 million in employee compensation and related costs, $1.2 million in technology and related expense and $1.1 million in depreciation expense. These increases were partially offset by decreases of $7.0 million in professional services and $2.3 million in prototype expense. Research and development expense also reflects a $4.5 million reduction in reimbursements from our strategic jobs investment fund grant from the province of Ontario as the maximum funding limit under this grant was met in the second quarter of fiscal 2015.
|
|
•
|
Selling and marketing expense
benefited by
$16.9 million
as a result of foreign exchange rates, primarily due to a stronger U.S. dollar in relation to the Euro and the Canadian Dollar. Including the effect of foreign exchange rates, selling and marketing expenses increased by
$5.5 million
, primarily reflecting increases of $10.4 million in employee compensation and related costs and $1.2 million in customer demonstration equipment. These increases were partially offset by decreases of $2.2 million in trade show and related costs, $2.2 million in travel and related costs and $1.5 million in professional services.
|
|
•
|
General and administrative expense
benefited by
$4.4 million
as a result of foreign exchange rates, primarily due to a stronger U.S. dollar in relation to the Euro and the Canadian Dollar. Including the effect of foreign exchange rates, general and administrative expense decreased by
$3.4 million
, reflecting an $8.5 million decrease in legal fees, primarily due to certain patent litigation costs incurred during fiscal 2014. This decrease was partially offset by increases of $4.5 million in employee compensation and related costs and $1.0 million in facilities and information systems expense.
|
|
•
|
Acquisition and integration costs
increased
, reflecting financial, legal and accounting advisors, facilities and systems consolidation costs, and severance and other employment-related costs related to our acquisition of Cyan during fiscal 2015.
|
|
•
|
Amortization of intangible assets
increased
due to expense related to acquired intangible assets from our acquisition of Cyan during the fourth quarter of fiscal 2015.
|
|
•
|
Restructuring costs
primarily reflect certain severance and related expense associated with headcount reductions and initiatives to improve efficiency. During fiscal 2015, we incurred approximately
$8.6 million
in restructuring costs, primarily reflecting a global workforce reduction of approximately 125 employees in the first quarter of fiscal 2015 as part of our business optimization strategy to improve our gross margin, constrain operating expense and redesign certain business processes, systems, and resources. As we look to manage operating expense and drive further efficiency and leverage from our operations, we will continue to assess allocation of headcount, facilities and other resources to ensure that they are optimized toward key growth opportunities.
|
Other items
The table below (in thousands, except percentage data) sets forth the changes in other items for the periods indicated:
51
|
|
Fiscal Year
|
|
|
|||||||||||||||||
|
2014
|
%*
|
2015
|
%*
|
Increase
(decrease)
|
%**
|
|||||||||||||||
|
Interest and other income (loss), net
|
$
|
(25,262
|
)
|
(1.1
|
)
|
$
|
(25,505
|
)
|
(1.0
|
)
|
$
|
(243
|
)
|
(1.0
|
)
|
|||||
|
Interest expense
|
$
|
47,115
|
|
2.1
|
|
$
|
51,179
|
|
2.1
|
|
$
|
4,064
|
|
8.6
|
|
|||||
|
Provision for income taxes
|
$
|
13,964
|
|
0.6
|
|
$
|
12,097
|
|
0.5
|
|
$
|
(1,867
|
)
|
(13.4
|
)
|
|||||
_________________________________
|
*
|
Denotes % of total revenue
|
|
**
|
Denotes % change from 2014 to 2015
|
|
•
|
Interest and other income (loss), net
reflects a $2.9 million increase in losses related to foreign exchange rates on assets and liabilities denominated in a currency other than the relevant functional currency, net of hedging activity, offset by a $2.7 million non-cash gain related to the change in fair value of the embedded redemption feature associated with our 2015 Notes, which matured during the second quarter of fiscal 2015.
|
|
•
|
Interest expense
increased
, primarily due to a higher level of outstanding debt in fiscal 2015 as compared to fiscal 2014. See Note
15
to our Consolidated Financial Statements included in in Item 8 of Part II of this report for more information.
|
|
•
|
Provision for income taxes
decreased
primarily due to foreign and state taxes.
|
Fiscal 2013
compared to
Fiscal 2014
Revenue
The table below (in thousands, except percentage data) sets forth the changes in our operating segment revenue for the periods indicated:
|
|
Fiscal Year
|
|
|
|||||||||||||||
|
2013
|
%*
|
2014
|
%*
|
Increase
(decrease)
|
%**
|
|||||||||||||
|
Revenue:
|
|
|
|
|
|
|
||||||||||||
|
Converged Packet Optical
|
$
|
1,187,231
|
|
57.0
|
$
|
1,455,501
|
|
63.6
|
$
|
268,270
|
|
22.6
|
|
|||||
|
Packet Networking
|
222,898
|
|
10.7
|
244,116
|
|
10.7
|
21,218
|
|
9.5
|
|
||||||||
|
Optical Transport
|
233,821
|
|
11.2
|
127,215
|
|
5.6
|
(106,606
|
)
|
(45.6
|
)
|
||||||||
|
Software and Services
|
438,596
|
|
21.1
|
461,457
|
|
20.1
|
22,861
|
|
5.2
|
|
||||||||
|
Consolidated revenue
|
$
|
2,082,546
|
|
100.0
|
$
|
2,288,289
|
|
100.0
|
$
|
205,743
|
|
9.9
|
|
|||||
_________________________________
|
*
|
Denotes % of total revenue
|
|
**
|
Denotes % change from 2013 to 2014
|
|
•
|
Converged Packet Optical
revenue
increased
significantly, reflecting a $258.2 million increase in sales of our 6500 Packet-Optical Platform, largely driven by service provider and Web-scale provider demand for high-capacity, optical transport for coherent 40G and 100G network infrastructures. In addition, sales of our 5430 reconfigurable switching system and the OTN configuration for the 5410 Reconfigurable Switching System increased by $25.6 million and $6.0 million respectively. These increases were partially offset by a $21.5 million decrease in sales of our CoreDirector® Multiservice Optical Switches. The strong performance of this segment, particularly as compared to the expected declines in Optical Transport segment revenue, reflects the preference of network operators to adopt next-generation architectures that enable the convergence of high-capacity, coherent optical transport with integrated OTN switching and control plane functionality.
|
|
•
|
Packet Networking
revenue
increased
, reflecting a $30.4 million increase in sales of our 3000 and 5000 families of service delivery and aggregation switches. This increase was largely driven by the expansion of Ethernet business services by AT&T, our largest service provider customer. Segment revenue also benefited from $1.7 million in initial sales of our 8700 Packetwave Platform. These increases were partially offset by decreases of $5.3 million in sales of our 5410 Service Aggregation Switch and $5.1 million in sales of our older, stand-alone broadband products.
|
52
|
•
|
Optical Transport
revenue
decreased
, reflecting sales decreases of $46.6 million in other stand-alone transport products, $36.2 million of 5100/5200 Advanced Services Platform and $23.8 million in our 4200 Advanced Services Platform. Revenue for our Optical Transport segment, which currently consists principally of stand-alone WDM and SONET/SDH-based transport platforms, has experienced meaningful declines in annual revenue in recent years, reflecting network operators' transition toward next-generation converged network architectures as described above.
|
|
•
|
Software and Services
revenue
increased
, reflecting increases of $10.4 million in maintenance and support services revenue, $8.4 million in installation and deployment services revenue, $2.8 million in software sales and $1.2 million in networking transformation consulting revenue.
|
The table below (in thousands, except percentage data) sets forth the changes in geographic distribution of revenue for the periods indicated:
|
|
Fiscal Year
|
|
|
||||||||||||||
|
2013
|
%*
|
2014
|
%*
|
Increase
(decrease)
|
%**
|
||||||||||||
|
North America
|
$
|
1,360,169
|
|
65.3
|
$
|
1,477,329
|
|
64.6
|
$
|
117,160
|
|
8.6
|
|||||
|
EMEA
|
376,405
|
|
18.1
|
417,399
|
|
18.2
|
40,994
|
|
10.9
|
||||||||
|
CALA
|
174,360
|
|
8.4
|
212,018
|
|
9.3
|
37,658
|
|
21.6
|
||||||||
|
APAC
|
171,612
|
|
8.2
|
181,543
|
|
7.9
|
9,931
|
|
5.8
|
||||||||
|
Total
|
$
|
2,082,546
|
|
100.0
|
$
|
2,288,289
|
|
100.0
|
$
|
205,743
|
|
9.9
|
|||||
_________________________________
|
*
|
Denotes % of total revenue
|
|
**
|
Denotes % change from 2013 to 2014
|
|
•
|
North America revenue
includes sales to AT&T for fiscal 2013 and fiscal 2014 of
$373.6 million
and
$423.5 million
, respectively. Revenues reflect increases of $145.6 million in Converged Packet Optical sales, $21.4 million in Software and Services sales and $20.2 million in sales of Packet Networking. These increases were partially offset by a decrease of $70.1 million in Optical Transport sales.
|
|
•
|
EMEA revenue
reflects increases of $58.4 million in Converged Packet Optical sales, $5.4 million in Software and Services Sales and $2.3 million in Packet Networking sales. These increases were partially offset by a decrease of $25.0 million in Optical Transport sales.
|
|
•
|
CALA revenue
reflects increases of $41.3 million in Converged Packet Optical sales and $2.5 million in Software and Services sales. These increases was partially offset by a decrease of $6.1 million in Optical Transport sales.
|
|
•
|
APAC revenue
reflects an increase of $23.0 million in Converged Packet Optical sales. This increase was partially offset by decreases of $6.5 million in Software and Services sales, $5.3 million in Optical Transport sales and $1.3 million in Packet Networking sales. Software and Services sales reflect decreases of $3.4 million in maintenance and support services sales, $1.2 million in installation and deployment services sales and $1.0 million in software sales. Maintenance and support services sales reflect decreases in sales to certain service providers. Installation and deployment services sales reflect a decrease in sales to submarine network operators.
|
Cost of Goods Sold and Gross Profit
The tables below (in thousands, except percentage data) set forth the changes in revenue, cost of goods sold and gross profit for the periods indicated:
|
|
Fiscal Year
|
|
|
||||||||||||||
|
2013
|
%*
|
2014
|
%*
|
Increase
(decrease)
|
%**
|
||||||||||||
|
Total revenue
|
$
|
2,082,546
|
|
100.0
|
$
|
2,288,289
|
|
100.0
|
$
|
205,743
|
|
9.9
|
|||||
|
Total cost of goods sold
|
1,217,371
|
|
58.5
|
1,339,937
|
|
58.6
|
122,566
|
|
10.1
|
||||||||
|
Gross profit
|
$
|
865,175
|
|
41.5
|
$
|
948,352
|
|
41.4
|
$
|
83,177
|
|
9.6
|
|||||
_________________________________
53
|
*
|
Denotes % of total revenue
|
|
**
|
Denotes % change from 2013 to 2014
|
|
|
Fiscal Year
|
|
|
||||||||||||||
|
2013
|
%*
|
2014
|
%*
|
Increase
(decrease)
|
%**
|
||||||||||||
|
Product revenue
|
$
|
1,680,125
|
|
100.0
|
$
|
1,865,826
|
|
100.0
|
$
|
185,701
|
|
11.1
|
|||||
|
Product cost of goods sold
|
967,510
|
|
57.6
|
1,083,022
|
|
58.0
|
115,512
|
|
11.9
|
||||||||
|
Product gross profit
|
$
|
712,615
|
|
42.4
|
$
|
782,804
|
|
42.0
|
$
|
70,189
|
|
9.8
|
|||||
_________________________________
|
*
|
Denotes % of product revenue
|
|
**
|
Denotes % change from 2013 to 2014
|
|
|
Fiscal Year
|
|
|
||||||||||||||
|
2013
|
%*
|
2014
|
%*
|
Increase
(decrease)
|
%**
|
||||||||||||
|
Service revenue
|
$
|
402,421
|
|
100.0
|
$
|
422,463
|
|
100.0
|
$
|
20,042
|
|
5.0
|
|||||
|
Service cost of goods sold
|
249,861
|
|
62.1
|
256,915
|
|
60.8
|
7,054
|
|
2.8
|
||||||||
|
Service gross profit
|
$
|
152,560
|
|
37.9
|
$
|
165,548
|
|
39.2
|
$
|
12,988
|
|
8.5
|
|||||
_________________________________
|
*
|
Denotes % of service revenue
|
|
**
|
Denotes % change from 2013 to 2014
|
|
•
|
Gross profit as a percentage of revenue
remained relatively unchanged.
|
|
•
|
Gross profit on products as a percentage of product revenue
decreased
slightly, due to lower margins on Packet Networking and Optical Transport products. The decline was largely offset by improved mix of higher-margin packet platforms with software content within our Converged Packet Optical segment, and greater leverage from efforts to streamline and optimize our supply chain activities.
|
|
•
|
Gross profit on services as a percentage of services revenue
increased
primarily due to increased maintenance and consulting services revenues and increased margin due to improved efficiencies for managed spares projects.
|
Operating expense
The table below (in thousands, except percentage data) sets forth the changes in operating expense for the periods indicated:
|
|
Fiscal Year
|
|
|
|||||||||||||||
|
2013
|
%*
|
2014
|
%*
|
Increase
(decrease)
|
%**
|
|||||||||||||
|
Research and development
|
$
|
383,408
|
|
18.4
|
$
|
401,180
|
|
17.5
|
$
|
17,772
|
|
4.6
|
|
|||||
|
Selling and marketing
|
304,170
|
|
14.6
|
328,325
|
|
14.3
|
24,155
|
|
7.9
|
|
||||||||
|
General and administrative
|
122,432
|
|
5.9
|
126,824
|
|
5.5
|
4,392
|
|
3.6
|
|
||||||||
|
Amortization of intangible assets
|
49,771
|
|
2.4
|
45,970
|
|
2.0
|
(3,801
|
)
|
(7.6
|
)
|
||||||||
|
Restructuring costs
|
7,169
|
|
0.3
|
349
|
|
—
|
(6,820
|
)
|
(95.1
|
)
|
||||||||
|
Total operating expenses
|
$
|
866,950
|
|
41.6
|
$
|
902,648
|
|
39.3
|
$
|
35,698
|
|
4.1
|
|
|||||
_________________________________
|
*
|
Denotes % of total revenue
|
|
**
|
Denotes % change from 2013 to 2014
|
54
|
•
|
Research and development expense
benefited by $15.4 million as a result of foreign exchange rates, primarily due to strengthening of the U.S. dollar in relation to the Canadian Dollar. The $17.8 million increase primarily reflects increases of $8.1 million in professional services expense, $6.9 million in employee compensation and related costs, $5.3 million in prototype expense, partially offset by a decrease of $2.6 million in technology and related costs.
|
|
•
|
Selling and marketing expense
benefited by $1.9 million as a result of foreign exchange rates, primarily due to strengthening of the U.S. dollar in relation to the Canadian Dollar. The $24.2 million increase primarily reflects increases of $20.6 million in employee compensation and related costs, $3.3 million of travel and related costs and $1.2 million in facilities and information technology costs. These increases were partially offset by a decrease of $1.4 million in customer demonstration equipment.
|
|
•
|
General and administrative expense
increased by $4.4 million, primarily reflecting an increase in legal fees and settlements and consulting services.
|
|
•
|
Amortization of intangible assets
decreased due to certain intangible assets having reached the end of their economic lives.
|
|
•
|
Restructuring costs
primarily reflect certain severance and related expense associated with headcount reductions and restructuring activities to align our workforce and resources with market opportunities and research and development initiatives. Restructuring costs for fiscal 2013 also include the consolidation of certain facilities located within Maryland associated with the transition of our headquarters facility.
|
Other items
The table below (in thousands, except percentage data) sets forth the changes in other items for the periods indicated:
|
|
Fiscal Year
|
|
|
|||||||||||||||||
|
2013
|
%*
|
2014
|
%*
|
Increase
(decrease)
|
%**
|
|||||||||||||||
|
Interest and other income (loss), net
|
$
|
(5,744
|
)
|
(0.3
|
)
|
$
|
(25,262
|
)
|
(1.1
|
)
|
$
|
(19,518
|
)
|
(339.8
|
)
|
|||||
|
Interest expense
|
$
|
44,042
|
|
2.1
|
|
$
|
47,115
|
|
2.1
|
|
$
|
3,073
|
|
7.0
|
|
|||||
|
Loss on extinguishment of debt
|
$
|
(28,630
|
)
|
(1.4
|
)
|
$
|
—
|
|
—
|
|
$
|
28,630
|
|
(100.0
|
)
|
|||||
|
Provision for income taxes
|
$
|
5,240
|
|
0.3
|
|
$
|
13,964
|
|
0.6
|
|
$
|
8,724
|
|
166.5
|
|
|||||
_________________________________
|
*
|
Denotes % of total revenue
|
|
**
|
Denotes % change from 2013 to 2014
|
|
•
|
Interest and other income (loss), net
reflects a $5.7 million non-cash loss related to the change in fair value of the embedded redemption feature associated with our 2015 Notes and a $13.5 million increase in losses related to foreign exchange rates on assets and liabilities denominated in a currency other than the relevant functional currency, net of hedging activity.
|
|
•
|
Interest expense
increased
, primarily due to a higher level of outstanding debt in fiscal 2014 as compared to fiscal 2013. See Note
15
to our Consolidated Financial Statements included in in Item 8 of Part II of this report for more information.
|
|
•
|
Loss on extinguishment of debt
for fiscal 2013 reflects a non-cash loss of $28.6 million relating to the exchange transactions during the first quarter of fiscal 2013. Upon issuance, the 4.0% convertible senior notes due December 15, 2020 (the "2020 Notes") were recorded at a fair value of $213.6 million. The exchange transactions resulted in the retirement of outstanding 2015 Notes with a carrying value of $187.9 million and the write-off of unamortized debt issuance costs of $2.3 million and $0.6 million relating to the redemption feature on the 2015 Notes, which was accounted for as a separate embedded derivative.
|
|
•
|
Provision for income taxes
increased primarily due to foreign and state tax expenses.
|
Segment Profit
55
The table below (in thousands, except percentage data) sets forth the changes in our segment profit for the respective periods:
|
|
Fiscal Year
|
|
||||||||||||
|
2014
|
2015
|
Increase
(decrease)
|
%*
|
|||||||||||
|
Segment profit:
|
|
|
|
|
||||||||||
|
Converged Packet Optical
|
$
|
353,942
|
|
$
|
471,484
|
|
$
|
117,542
|
|
33.2
|
|
|||
|
Packet Networking
|
$
|
19,467
|
|
$
|
28,136
|
|
$
|
8,669
|
|
44.5
|
|
|||
|
Optical Transport
|
$
|
38,974
|
|
$
|
15,930
|
|
$
|
(23,044
|
)
|
|
(59.1
|
)
|
||
|
Software and Services
|
$
|
134,789
|
|
$
|
145,812
|
|
$
|
11,023
|
|
|
8.2
|
|
||
_________________________________
|
*
|
Denotes % change from 2014 to 2015
|
|
•
|
Converged Packet Optical
segment
profit
increased
, primarily due to increased sales volume and improved gross margin, partially offset by increased research and development expense. Increased sales volume is largely driven by service provider demand for convergence of high-capacity, coherent 40G and 100G network infrastructures with integrated OTN switching and control plane functionality.
|
|
•
|
Packet Networking
segment
profit
increased
due to lower research and development costs and improved gross margin partially offset by lower sales volume.
|
|
•
|
Optical Transport
segment
profit
decreased
, primarily due to reduced sales volume and decreased gross margin. Revenue for our Optical Transport segment, which currently consists principally of stand-alone WDM and SONET/SDH-based transport platforms, has experienced meaningful declines in annual revenue in recent years, reflecting network operators' transition toward next-generation network architectures as described above.
|
|
•
|
Software and Services
segment
profit
increased
, primarily due to increases in sales of maintenance and support services, installation and deployment services, software subscription services and increased margin due to lower repair costs to support maintenance service contracts. These increases were partially offset by increased software research and development costs.
|
The table below (in thousands, except percentage data) sets forth the changes in our segment profit for the respective periods:
|
|
Fiscal Year
|
|
||||||||||||
|
2013
|
2014
|
Increase
(decrease)
|
%*
|
|||||||||||
|
Segment profit:
|
|
|
|
|
||||||||||
|
Converged Packet Optical
|
$
|
242,335
|
|
$
|
353,942
|
|
$
|
111,607
|
|
46.1
|
|
|||
|
Packet Networking
|
$
|
22,740
|
|
$
|
19,467
|
|
$
|
(3,273
|
)
|
(14.4
|
)
|
|||
|
Optical Transport
|
$
|
89,754
|
|
$
|
38,974
|
|
$
|
(50,780
|
)
|
(56.6
|
)
|
|||
|
Software and Services
|
$
|
126,938
|
|
$
|
134,789
|
|
$
|
7,851
|
|
6.2
|
|
|||
_________________________________
|
*
|
Denotes % change from 2013 to 2014
|
|
•
|
Converged Packet Optical
segment
profit
increased
, primarily due to increased sales volume and improved gross margin. The increased sales volume is largely driven by service provider and Web-scale provider demand for high-capacity, coherent 40G and 100G network infrastructures with integrated OTN switching and control plane functionality. The improved gross margin is primarily due to sales reflecting a greater mix of higher-margin packet platforms with software content within the segment. These increases were partially offset by increased research and development expense.
|
|
•
|
Packet Networking
segment
profit
decreased
due to lower margins on our 3000 and 5000 families of service delivery and aggregation switches, reflecting increased pricing pressure and competitive dynamics, and increased research and development expense. Decreased segment profit was partially offset by increased sales volume.
|
56
|
•
|
Optical Transport
segment
profit
decreased
, primarily due to reduced sales volume and lower gross margin, partially offset by lower research and development expense. The decrease in gross margin is primarily due to an increase in obsolete and excess inventory expense for the discontinuance of certain parts and components used in the manufacture of our Optical Transport products, including our Corestream® Agility Optical Transport platform. Revenue for our Optical Transport segment, which currently consists principally of stand-alone WDM and SONET/SDH-based transport platforms, has experienced meaningful declines in annual revenue in recent years, reflecting network operators' transition toward next-generation network architectures as described above.
|
|
•
|
Software and Services
segment
profit
increased
slightly, due to higher sales for software and consulting services and improved efficiencies for managed spares projects. These increases were partially offset by higher software research and development expense.
|
Liquidity and Capital Resources
At
October 31, 2015
, our principal sources of liquidity were cash and cash equivalents and investments in marketable debt securities, representing U.S. treasuries and commercial paper, and our ABL Credit Facility. The following table sets forth changes in our cash and cash equivalents and investments in marketable debt securities (in thousands):
|
|
October 31,
|
Increase
|
|||||||||
|
|
2014
|
2015
|
(decrease)
|
||||||||
|
Cash and cash equivalents
|
$
|
586,720
|
|
$
|
790,971
|
|
$
|
204,251
|
|
||
|
Short-term investments in marketable debt securities
|
140,205
|
|
135,107
|
|
(5,098
|
)
|
|||||
|
Long-term investments in marketable debt securities
|
50,057
|
|
95,105
|
|
45,048
|
|
|||||
|
Total cash and cash equivalents and investments in marketable debt securities
|
$
|
776,982
|
|
$
|
1,021,183
|
|
$
|
244,201
|
|
||
The change in total cash and cash equivalents and investments in marketable debt securities during
fiscal 2015
was primarily related to the following:
|
•
|
$262.1 million
cash
provided by
operations, consisting of
$274.9 million
provided by
net income adjusted for non-cash charges offset by
$12.8 million
used in
working capital;
|
|
•
|
$62.1 million
used for
purchases of equipment, furniture, fixtures and intellectual property;
|
|
•
|
$24.1 million
provided by
the settlement of foreign currency forward contracts, net;
|
|
•
|
$8.0 million
used to pay
capital lease obligations;
|
|
•
|
$2.0 million
used for
the purchase of a cost method investment;
|
|
•
|
$37.2 million
from
the acquisition of Cyan, net of cash acquired;
|
|
•
|
$29.9 million
used for
the repayment of long-term debt;
|
|
•
|
$30.3 million
from
proceeds of stock issuances under our employee stock purchase plan and the exercise of stock options; and
|
|
•
|
$6.7 million
decrease
due to the effect of exchange rate changes on cash and cash equivalents.
|
Ciena and certain of its subsidiaries are parties to a senior secured asset-based revolving credit facility (the “ABL Credit Facility”) providing for a total commitment of $200.0 million with a maturity date of December 31, 2016. Ciena principally uses the ABL Credit Facility to support the issuance of letters of credit that arise in the ordinary course of its business and thereby to reduce its use of cash required to collateralize these instruments. As of
October 31, 2015
, letters of credit totaling
$63.4 million
were collateralized by our ABL Credit Facility. There were no borrowings outstanding under the ABL Credit Facility as of
October 31, 2015
. Ciena and certain of its subsidiaries are also parties to a Credit Agreement providing for senior secured term loans in an aggregate principal amount of
$250 million
(the “Term Loan”) with a maturity date of July 15, 2019. For additional information about our Term Loan and ABL Credit Facility, see Note
15
and Note
16
, respectively, to our Consolidated Financial Statements included in in Item 8 of Part II of this report.
We regularly evaluate our liquidity position, debt obligations, and anticipated cash needs to fund our operating plans and may consider capital raising and other market opportunities that may be available to us. Based on past performance and current expectations, we believe that our cash, cash equivalents, investments and other sources of liquidity, including our ABL Credit Facility, will satisfy the working capital needs, capital expenditures, and other liquidity requirements associated with our operations through at least the next 12 months.
The following sections set forth the components of our
$262.1 million
of cash
provided by
operating activities for
fiscal 2015
:
57
Net income adjusted for non-cash charges
The following tables set forth (in thousands) our net income adjusted for non-cash charges during fiscal 2015:
|
|
Year ended
|
||
|
|
October 31, 2015
|
||
|
Net income
|
$
|
11,667
|
|
|
Adjustments for non-cash charges:
|
|
||
|
Depreciation of equipment, building, furniture and fixtures, and amortization of leasehold improvements
|
55,901
|
|
|
|
Share-based compensation costs
|
55,340
|
|
|
|
Amortization of intangible assets
|
79,866
|
|
|
|
Provision for inventory excess and obsolescence
|
26,846
|
|
|
|
Provision for warranty
|
17,881
|
|
|
|
Other
|
27,373
|
|
|
|
Net income adjusted for non-cash charges
|
$
|
274,874
|
|
Working Capital
Our working capital used
$12.8 million
of cash during fiscal 2015. The following tables set forth (in thousands) the major components of the reduction in working capital:
|
|
Year ended
|
||
|
|
October 31, 2015
|
||
|
Cash used in accounts receivable
|
$
|
(37,297
|
)
|
|
Cash provided by inventories
|
46,898
|
|
|
|
Cash used in prepaid expenses and other
|
(46,383
|
)
|
|
|
Cash used in accounts payable, accruals and other obligations
|
(10,505
|
)
|
|
|
Cash provided by deferred revenue
|
34,525
|
|
|
|
Cash provided by a reduction in working capital
|
$
|
(12,762
|
)
|
The
$37.3 million
of cash
used in
accounts receivable during
fiscal 2015
reflects the higher sales volume in the fourth quarter of fiscal 2015 compared to the fourth quarter of fiscal 2014. Our days sales outstanding (DSOs) remained relatively flat from
82
days for
fiscal 2014
to
81
days for
fiscal 2015
. The
$46.9 million
in cash
generated from
reductions in inventory during
fiscal 2015
reflects, in part, certain supply chain initiatives to improve manufacturing efficiencies and inventory management and the reduction of deferred costs of sales. The reduction of the deferred costs of sales relates to the completion of certain submarine network projects. As a result, our inventory turns
increased
from
4.3
turns during
fiscal 2014
to
5.9
turns during
fiscal 2015
. Cash
used in
prepaid expense and other during
fiscal 2015
was
$46.4 million
, primarily reflecting a
$30.0 million
financing receivable with an 18-month term. The
$10.5 million
of cash used in accounts payable, accruals and other obligations during fiscal 2015 reflects shorter vendor payment cycles. The
$34.5 million
of cash provided by deferred revenue represents either payments received in advance of shipment or payments received after shipment but before revenue recognition.
Cash paid for interest
The
$274.9 million
of cash provided by our net income adjusted for non-cash charges during fiscal 2015 reflects interest payments by Ciena of
$40.8 million
. The following tables set forth (in thousands) our interest paid during fiscal 2015:
58
|
|
Year ended
|
||
|
|
October 31, 2015
|
||
|
4.0% Convertible Senior Notes, due March 15, 2015
(1)
|
$
|
3,750
|
|
|
0.875% Convertible Senior Notes due June 15, 2017
(2)
|
4,375
|
|
|
|
3.75% Convertible Senior Notes, due October 15, 2018
(3)
|
13,125
|
|
|
|
4.0% Convertible Senior Notes, due December 15, 2020
(4)
|
7,500
|
|
|
|
Term Loan Payable due July 15, 2019
(5)
|
9,475
|
|
|
|
Interest rate swap
(6)
|
793
|
|
|
|
ABL Credit Facility
(7)
|
1,754
|
|
|
|
Cash paid during the fiscal year for interest
|
$
|
40,772
|
|
|
(1)
|
The final interest payment owing on our 4.0% convertible senior notes, due March 15, 2015, was paid during the second fiscal quarter of 2015.
|
|
(2)
|
Interest on our outstanding 0.875% convertible senior notes, due June 15, 2017, is payable on June 15 and December 15 of each year.
|
|
(3)
|
Interest on our outstanding 3.75% convertible senior notes, due October 15, 2018, is payable on April 15 and October 15 of each year.
|
|
(4)
|
Interest on our outstanding 4.0% convertible senior notes, due December 15, 2020, is payable on June 15 and December 15 of each year.
|
|
(5)
|
Interest on our outstanding Term Loan, due July 15, 2019, is payable periodically based on the underlying market index rate selected for borrowing. The Term Loan bears interest at LIBOR plus a spread of 300 basis points subject to a minimum LIBOR rate of 0.75%. During fiscal 2015, the interest rate on our Term Loan was 3.75%.
|
|
(6)
|
Payments on our interest rate swap arrangement are variable and effectively fix the total interest rate under the Term Loan at 5.004% from July 20, 2015 through July 19, 2018.
|
|
(7)
|
During
fiscal 2015
, we utilized the ABL Credit Facility to collateralize certain standby letters of credit and paid $1.8 million in commitment fees, interest expense and other administrative charges relating to our ABL Credit Facility.
|
For additional information about our convertible notes,Term Loan, ABL Credit Facility and interest rate swap see Note
15
and
16
to our Consolidated Financial Statements included in Item 8 of Part II of this report and Item 7A of Part II of this report.
Contractual Obligations
On October 23, 2014, Ciena Canada, Inc., a subsidiary of Ciena, entered into a lease agreement to lease an office building located at 5050 Innovation Drive, Ottawa, Canada. On April 15, 2015, Ciena Canada, Inc. entered into a work letter and a lease agreement related to the construction and lease of two new office buildings consisting of a rentable area of approximately 254,318 square feet that will be built adjacent to the premises subject to the October 2014 lease. These facilities are expected to be part of a future campus that will replace Ciena’s largest facility and a key research and development center located in the Lab 10 building on the former Nortel Carling Campus in Ottawa, Canada. With respect to the lease entered into in the second quarter of fiscal 2015, the future minimum rental commitments to be paid over the 15-year lease term are approximately CAD$112.9 million. The following is a summary of our future minimum payments under contractual obligations as of
October 31, 2015
(in thousands):
59
|
Total
|
Less than one
year
|
One to three
years
|
Three to five
years
|
Thereafter
|
|||||||||||||||
|
Principal due at maturity on convertible notes (1)
|
$
|
1,061,291
|
|
$
|
—
|
|
$
|
844,164
|
|
$
|
—
|
|
$
|
217,127
|
|
||||
|
Principal due on Term Loan
|
246,875
|
|
2,500
|
|
5,000
|
|
239,375
|
|
—
|
|
|||||||||
|
Interest due on convertible notes
|
89,375
|
|
25,000
|
|
45,625
|
|
15,000
|
|
3,750
|
|
|||||||||
|
Interest due on Term Loan (2)
|
34,619
|
|
9,354
|
|
18,474
|
|
6,791
|
|
—
|
|
|||||||||
|
Payments due under interest rate swap (2)
|
8,525
|
|
3,136
|
|
5,389
|
|
—
|
|
—
|
|
|||||||||
|
Operating leases (3)
|
149,754
|
|
32,480
|
|
48,840
|
|
21,985
|
|
46,449
|
|
|||||||||
|
Purchase obligations (4)
|
204,075
|
|
204,075
|
|
—
|
|
—
|
|
—
|
|
|||||||||
|
Capital leases - equipment
|
5,101
|
|
4,764
|
|
337
|
|
—
|
|
—
|
|
|||||||||
|
Capital leases - buildings (5)
|
127,826
|
|
1,938
|
|
10,396
|
|
14,909
|
|
100,583
|
|
|||||||||
|
Other obligations
|
3,184
|
|
2,944
|
|
240
|
|
—
|
|
—
|
|
|||||||||
|
Total (6)
|
$
|
1,930,625
|
|
$
|
286,191
|
|
$
|
978,465
|
|
$
|
298,060
|
|
$
|
367,909
|
|
||||
_________________________________
|
(1)
|
Includes the accretion of the principal amount on the 2020 Notes payable at maturity at a rate of 1.85% per year compounded semi-annually, commencing December 27, 2012.
|
|
(2)
|
Interest on the Term Loan and payments under the interest rate swap are variable and were calculated using the rate in effect on the balance sheet date. For additional information about our Term Loan and the interest rate swap, see Note
15
to our Consolidated Financial Statements included in in Item 8 of Part II of this report and Item 7A of Part II of this report.
|
|
(3)
|
Does not include variable insurance, taxes, maintenance and other costs that may be required by the applicable operating lease. These costs are not expected to have a material future impact.
|
|
(4)
|
Purchase obligations relate to purchase order commitments to our contract manufacturers and component suppliers for inventory. In certain instances, we are permitted to cancel, reschedule or adjust these orders. Consequently, only a portion of the amount reported above relates to firm, non-cancelable and unconditional obligations.
|
|
(5)
|
This represents the total minimum lease payments due for all buildings that are subject to capital lease accounting, as well as buildings that are expected to be recorded as capital leases upon the commencement of the lease term. Payment timing is based on the excepted commencement of the lease term. Does not include variable insurance, taxes, maintenance and other costs required by the applicable capital lease. These costs are not expected to have a material future impact.
|
|
(6)
|
As of
October 31, 2015
, we also had approximately
$13.3 million
of other long-term obligations on our Consolidated Balance Sheet for unrecognized tax positions that are not included in this table because the timing or amount of any cash settlement with the respective tax authority cannot be reasonably estimated.
|
Some of our commercial commitments, including some of the future minimum payments in operating leases set forth above and certain commitments to customers, are secured by standby letters of credit collateralized under our ABL Credit Facility or restricted cash. Restricted cash balances are included in other current assets or other long-term assets depending upon the duration of the underlying letter of credit obligation. The following is a summary of our commercial commitments secured by standby letters of credit by commitment expiration date as of
October 31, 2015
(in thousands):
|
Total
|
Less than one
year
|
One to
three years
|
Three to
five years
|
Thereafter
|
|||||||||||||||
|
Standby letters of credit
|
$
|
65,886
|
|
$
|
31,606
|
|
$
|
15,299
|
|
$
|
6,008
|
|
$
|
12,973
|
|
||||
Off-Balance Sheet Arrangements
We do not engage in any off-balance sheet financing arrangements. In particular, we do not have any equity interests in so-called limited purpose entities, which include special purpose entities (SPEs) and structured finance entities.
Critical Accounting Policies and Estimates
The preparation of our consolidated financial statements requires that we make estimates and judgments that affect the reported amounts of assets, liabilities, revenue and expense, and related disclosure of contingent assets and liabilities. By their
60
nature, these estimates and judgments are subject to an inherent degree of uncertainty. On an ongoing basis, we reevaluate our estimates, including those related to share-based compensation, bad debts, inventories, intangible and other long-lived assets, goodwill, income taxes, warranty obligations, restructuring, derivatives and hedging, and contingencies and litigation. We base our estimates on historical experience and on various other assumptions that we believe to be reasonable under the circumstances. Among other things, these estimates form the basis for judgments about the carrying values of assets and liabilities that are not readily apparent from other sources. Actual results may differ from these estimates under different assumptions or conditions. To the extent that there are material differences between our estimates and actual results, our consolidated financial statements will be affected.
We believe that the following critical accounting policies reflect those areas where significant judgments and estimates are used in the preparation of our consolidated financial statements.
Revenue Recognition
We recognize revenue when all of the following criteria are met: persuasive evidence of an arrangement exists; delivery has occurred or services have been rendered; the price to the buyer is fixed or determinable; and collectibility is reasonably assured. Customer purchase agreements and customer purchase orders are generally used to determine the existence of an arrangement. Shipping documents and evidence of customer acceptance, when applicable, are used to verify delivery or services rendered. We assess whether the price is fixed or determinable based on the payment terms associated with the transaction and whether the sales price is subject to refund or adjustment. We assess collectibility based primarily on the creditworthiness of the customer as determined by credit checks and analysis, as well as the customer's payment history. Revenue for maintenance services is deferred and recognized ratably over the period during which the services are to be performed. Shipping and handling fees billed to customers are included in revenue, with the associated expenses included in product cost of goods sold.
We apply the percentage-of-completion method to long-term arrangements where we are required to undertake significant production, customization or modification engineering, and reasonable and reliable estimates of revenue and cost are available. Utilizing the percentage-of-completion method, we recognize revenue based on the ratio of actual costs incurred to date to total estimated costs expected to be incurred. In instances that do not meet the percentage-of-completion method criteria, recognition of revenue is deferred until there are no uncertainties regarding customer acceptance. Unbilled percentage- of-completion revenues recognized are included in accounts receivable, net. Billings in excess of revenues recognized on these contracts are recorded within deferred revenue. The percentage of total revenue recognized using the percentage-of-completion method
for the fiscal years ended
October 31, 2013
,
October 31, 2014
and
October 31, 2015
were
4.5%
,
4.0%
and
1.8%
, respectively.
Software revenue is recognized when persuasive evidence of an arrangement exists, delivery has occurred, the fee is fixed or determinable, and collectibility is probable. In instances where final acceptance criteria of the software are specified by the customer, revenue is deferred until there are no uncertainties regarding customer acceptance
We limit the amount of revenue recognition for delivered elements to the amount that is not contingent on the future delivery of products or services, future performance obligations or subject to customer-specified return or refund privileges.
Revenue for multiple element arrangements is allocated to each unit of accounting based on the relative selling price of each delivered element, with revenue recognized for each delivered element when the revenue recognition criteria are met. We determine the selling price for each deliverable based upon the selling price hierarchy for multiple-deliverable arrangements. Under this hierarchy, we use vendor-specific objective evidence ("VSOE") of selling price, if it exists, or third party evidence ("TPE") of selling price if VSOE does not exist. If neither VSOE nor TPE of selling price exists for a deliverable, we use our best estimate of selling price ("BESP") for that deliverable. For multiple element software arrangements where VSOE of undelivered maintenance does not exist, revenue for the entire arrangement is recognized over the maintenance term.
VSOE, when determinable, is established based on our pricing and discounting practices for the specific product or service when sold separately. In determining whether VSOE exists, we require that a substantial majority of the selling prices for a product or service fall within a reasonably narrow pricing range. We have generally been unable to establish TPE of selling price because our go-to-market strategy differs from that of others in our markets, and the extent of customization and differentiated features and functions varies among comparable products or services from our peers. We determine BESP based upon management-approved pricing guidelines, which consider multiple factors including the type of product or service, gross margin objectives, competitive and market conditions, and the go-to-market strategy, all of which can affect pricing practices.
Our total deferred revenue for products was
$50.5 million
and
$66.5 million
as of
October 31, 2014
and
October 31, 2015
, respectively. Our services revenue is deferred and recognized ratably over the period during which the services are to be
61
performed. Our total deferred revenue for services was
$95.2 million
and
$122.5 million
as of
October 31, 2014
and
October 31, 2015
, respectively.
Business Combinations
We record acquisitions using the purchase method of accounting. All of the assets acquired, liabilities assumed, contractual contingencies and contingent consideration are recognized at their fair value as of the acquisition date. The excess of the purchase price over the estimated fair values of the net tangible and net intangible assets acquired is recorded as goodwill. The application of the purchase method of accounting for business combinations requires management to make significant estimates and assumptions in the determination of the fair value of assets acquired and liabilities assumed in order to properly allocate purchase price consideration between assets that are depreciated and amortized from goodwill. These assumptions and estimates include a market participant's use of the asset and the appropriate discount rates for a market participant. Our estimates are based on historical experience, information obtained from the management of the acquired companies and, when appropriate, includes assistance from independent third-party appraisal firms. Our significant assumptions and estimates can include, but are not limited to, the cash flows that an asset is expected to generate in the future, the appropriate weighted-average cost of capital, and the cost savings expected to be derived from acquiring an asset. These estimates are inherently uncertain and unpredictable. In addition, unanticipated events and circumstances may occur which may affect the accuracy or validity of such estimates. During fiscal 2015, we completed the Cyan acquisition for a purchase price of
$335.7 million
. See Note
2
to the Consolidated Financial Statements included in Item 8 of Part II of this report.
Share-Based Compensation
We estimate the fair value of our restricted stock unit awards based on the fair value of our common stock on the date of grant. Our outstanding restricted stock unit awards are subject to service-based vesting conditions and/or performance-based vesting conditions. We recognize the estimated fair value of service-based awards, net of estimated forfeitures, as share-based expense ratably over the vesting period on a straight-line basis. Awards with performance-based vesting conditions require the achievement of certain financial or other performance criteria or targets as a condition to the vesting, or acceleration of vesting. We recognize the estimated fair value of performance-based awards, net of estimated forfeitures, as share-based expense over the performance period, using graded vesting, which considers each performance period or tranche separately, based upon our determination of whether it is probable that the performance targets will be achieved. At each reporting period, we reassess the probability of achieving the performance targets and the performance period required to meet those targets and the expense is adjusted accordingly. Determining whether the performance targets will be achieved involves judgment, and the estimate of expense may be revised periodically based on changes in the probability of achieving the performance targets. Revisions are reflected in the period in which the estimate is changed. If any performance goals are not met, no compensation cost is ultimately recognized against that goal and, to the extent previously recognized, compensation cost is reversed.
Because share-based compensation expense is based on awards that are ultimately expected to vest, the amount of expense takes into account estimated forfeitures. We estimate forfeitures at the time of grant and revise these estimates, if necessary, in subsequent periods if actual forfeitures differ from those estimates. Changes in these estimates and assumptions can materially affect the measurement of estimated fair value of our share-based compensation. See Note
20
to our Consolidated Financial Statements in Item 8 of Part II of this report for information regarding our assumptions related to share-based compensation and the amount of share-based compensation expense we incurred for the periods covered in this report. As of
October 31, 2015
, total unrecognized compensation expense was
$78.7 million
: (i)
$2.8 million
, which relates to unvested stock options and is expected to be recognized over a weighted-average period of
1.6 years
; and (ii)
$75.9 million
, which relates to unvested restricted stock units and is expected to be recognized over a weighted-average period of
1.5
years.
We recognize windfall tax benefits associated with the exercise of stock options or release of restricted stock units directly to stockholders' equity only when realized. A windfall tax benefit occurs when the actual tax benefit realized by us upon an employee's disposition of a share-based award exceeds the deferred tax asset, if any, associated with the award that we had recorded. When assessing whether a tax benefit relating to share-based compensation has been realized, we follow the “with-and-without” method. Under the with-and-without method, the windfall is considered realized and recognized for financial statement purposes only when an incremental benefit is provided after considering all other tax benefits including our net operating losses. The with-and-without method results in the windfall from share-based compensation awards always being effectively the last tax benefit to be considered. Consequently, the windfall attributable to share-based compensation will not be considered realized in instances where our net operating loss carryover (that is unrelated to windfalls) is sufficient to offset the current year's taxable income before considering the effects of current-year windfalls.
Reserve for Inventory Obsolescence
62
We make estimates about future customer demand for our products when establishing the appropriate reserve for excess and obsolete inventory. We write down inventory that has become obsolete or unmarketable by an amount equal to the difference between the cost of inventory and the estimated market value based on assumptions about future demand and market conditions. Inventory write downs are a component of our product cost of goods sold. Upon recognition of the write down, a new lower cost basis for that inventory is established, and subsequent changes in facts and circumstances do not result in the restoration or increase in that newly established cost basis. In an effort to limit our exposure to delivery delays and to satisfy customer needs we purchase inventory based on forecasted sales across our product lines. In addition, part of our research and development strategy is to promote the convergence of similar features and functionalities across our product lines. Each of these practices exposes us to the risk that our customers will not order products for which we have forecasted sales, or will purchase less than we have forecasted. Historically, we have experienced write downs due to changes in our strategic direction, discontinuance of a product and declines in market conditions. We recorded charges for excess and obsolete inventory of
$32.3 million
and
$26.8 million
in
fiscal 2014
and
2015
, respectively. The charges in fiscal
2014
were primarily related to engineering design changes and the discontinuance of certain parts and components used in the manufacture of our Optical Transport, including our Corestream® Agility Optical Transport platform, and Converged Packet Optical products. The charges in fiscal
2015
were primarily related to the discontinuance of certain parts and components used in the manufacture of our Converged Packet Optical products and a decrease in the forecasted demand for both our legacy, stand-alone WDM and SONET/SDH-based transport platforms and our 5410 Service Aggregation Switch. Our inventory net of allowance for excess and obsolescence was
$254.7 million
and
$191.2 million
as of
October 31, 2014
and
October 31, 2015
, respectively.
Allowance for Doubtful Accounts Receivable
Our allowance for doubtful accounts receivable is based on management's assessment, on a specific identification basis, of the collectibility of customer accounts. We perform ongoing credit evaluations of our customers and generally have not required collateral or other forms of security from customers. In determining the appropriate balance for our allowance for doubtful accounts receivable, management considers each individual customer account receivable in order to determine collectibility. In doing so, we consider creditworthiness, payment history, account activity and communication with such customer. If a customer's financial condition changes, or if actual defaults are higher than our historical experience, we may be
required to take a charge for an allowance for doubtful accounts receivable which could have an adverse impact on our results of operations. Our accounts receivable, net of allowance for doubtful accounts, was
$519.0 million
and
$550.8 million
as of
October 31, 2014
and
October 31, 2015
, respectively. Our allowance for doubtful accounts was
$2.1 million
and
$3.0 million
as of
October 31, 2014
and
October 31, 2015
, respectively.
Goodwill
Goodwill is the excess of the purchase price over the fair values assigned to the net assets acquired in a business combination. We test goodwill for impairment on an annual basis, which we have determined to be the last business day of fiscal September each year. We also test goodwill for impairment between annual tests if an event occurs or circumstances change that would, more likely than not, reduce the fair value of the reporting unit below its carrying value.
The first step in the process of assessing goodwill impairment is to compare the fair value of the reporting unit with the unit’s carrying amount, including goodwill. If this test indicates that the fair value is less than the carrying value, then step two is required to compare the implied fair value of the reporting unit’s goodwill with the carrying amount of the reporting unit’s goodwill. A non-cash goodwill impairment charge would have the effect of decreasing our earnings or increasing our losses in such period. If we are required to take a substantial impairment charge, our operating results would be materially adversely affected in such period. As of the end of fiscal 2014, there was no goodwill balance. At the end of fiscal 2015, the goodwill balance was
$256.4 million
as a result of our acquisition of Cyan. See Note
2
to the Consolidated Financial Statements included in Item 8 of Part II of this report.
Long-lived Assets
Our long-lived assets include: equipment; building; furniture and fixtures; finite-lived intangible assets and maintenance spares. As of
October 31, 2014
and
October 31, 2015
these assets totaled
$309.4 million
and
$449.9 million
, net, respectively. We test long-lived assets for impairment whenever events or changes in circumstances indicate that the assets' carrying amount is not recoverable from its undiscounted cash flows. Our long-lived assets are assigned to asset groups which represent the lowest level for which we identify cash flows. We measure impairment loss as the amount by which the carrying amount of the asset or asset group exceeds its fair value.
Deferred Tax Valuation Allowance
63
As of
October 31, 2015
, we have recorded a valuation allowance offsetting all our net deferred tax assets of
$1.5 billion.
When measuring the need for a valuation allowance, we assess both positive and negative evidence regarding the realizability of these deferred tax assets. We record a valuation allowance to reduce our deferred tax assets to the amount that is more likely than not to be realized. In determining net deferred tax assets and valuation allowances, management is required to make judgments and estimates related to projections of profitability, the timing and extent of the utilization of net operating loss carryforwards, applicable tax rates, transfer pricing methodologies and tax planning strategies. The valuation allowance is reviewed quarterly and is maintained until sufficient positive evidence exists to support a reversal. Because evidence such as our operating results during the most recent three-year period is afforded more weight than forecasted results for future periods, our cumulative loss during this three-year period represents sufficient negative evidence regarding the need for nearly a full valuation allowance. We will release this valuation allowance when management determines that it is more likely than not that our deferred tax assets will be realized. Any future release of valuation allowance may be recorded as a tax benefit increasing net income or as an adjustment to paid-in capital, based on tax ordering requirements.
Warranty
Our liability for product warranties, included in other accrued liabilities, was
$56.0 million
and
$56.7 million
as of
October 31, 2014
and
October 31, 2015
, respectively. Our products are generally covered by a warranty for periods ranging from one to five years. We accrue for warranty costs as part of our cost of goods sold based on associated material costs, technical support labor costs and associated overhead. Material cost is estimated based primarily upon historical trends in the volume of product returns within the warranty period and the cost to repair or replace the equipment. Technical support labor cost is estimated based primarily upon historical trends and the cost to support the customer cases within the warranty period. The provision for product warranties was
$22.1 million
and
$17.9 million
for fiscal
2014
and
2015
, respectively. See Note
12
to the Consolidated Financial Statements included in Item 8 of Part II of this report. The provision for warranty claims may fluctuate on a quarterly basis depending upon the mix of products and customers in that period. If actual product failure rates, material replacement costs, service or labor costs differ from our estimates, revisions to the estimated warranty provision would be required. An increase in warranty claims or the related costs associated with satisfying our warranty obligations could increase our cost of sales and negatively affect our gross margin.
Effects of Recent Accounting Pronouncements
See Note
1
to our Consolidated Financial Statements in Item 8 of Part II of this report for information relating to our discussion of the effects of recent accounting pronouncements.
Unaudited Quarterly Results of Operations
The tables below (in thousands, except per share data) set forth the operating results in our consolidated statements of operations for each of the eight quarters in the period ended
October 31, 2015
. This information is unaudited, but in our opinion reflects all adjustments (consisting only of normal recurring adjustments) that we consider necessary for a fair statement of such information in accordance with generally accepted accounting principles. The results for any quarter are not necessarily indicative of results for any future period.
64
|
Jan. 31,
|
Apr. 30,
|
Jul. 31,
|
Oct. 31,
|
Jan. 31,
|
Apr. 30,
|
Jul. 31,
|
Oct. 31,
|
||||||||||||||||||||||||
|
2014
|
2014
|
2014
|
2014
|
2015
|
2015
|
2015
|
2015
|
||||||||||||||||||||||||
|
Revenue:
|
|
|
|
|
|
|
|
|
|
|
|
|
|
|
|
|
|||||||||||||||
|
Products
|
$
|
432,941
|
|
$
|
460,821
|
|
$
|
495,889
|
|
$
|
476,175
|
|
$
|
422,315
|
|
$
|
511,880
|
|
$
|
493,919
|
|
$
|
574,281
|
|
|||||||
|
Services
|
100,762
|
|
99,240
|
|
107,673
|
|
114,788
|
|
106,847
|
|
109,722
|
|
109,013
|
|
117,692
|
|
|||||||||||||||
|
Total Revenue
|
533,703
|
|
560,061
|
|
603,562
|
|
590,963
|
|
529,162
|
|
621,602
|
|
602,932
|
|
691,973
|
|
|||||||||||||||
|
Cost of goods sold:
|
|
|
|
|
|
|
|
|
|
|
|
|
|
|
|
|
|||||||||||||||
|
Products
|
245,216
|
|
257,632
|
|
275,003
|
|
305,171
|
|
236,548
|
|
286,898
|
|
273,837
|
|
323,090
|
|
|||||||||||||||
|
Services
|
62,636
|
|
64,738
|
|
64,586
|
|
64,955
|
|
62,319
|
|
62,293
|
|
59,226
|
|
65,895
|
|
|||||||||||||||
|
Total costs of goods sold
|
307,852
|
|
322,370
|
|
339,589
|
|
370,126
|
|
298,867
|
|
349,191
|
|
333,063
|
|
388,985
|
|
|||||||||||||||
|
Gross profit
|
225,851
|
|
237,691
|
|
263,973
|
|
220,837
|
|
230,295
|
|
272,411
|
|
269,869
|
|
302,988
|
|
|||||||||||||||
|
Operating expenses:
|
|
|
|
|
|
|
|
|
|
|
|
|
|
|
|
|
|||||||||||||||
|
Research and development
|
101,497
|
|
103,492
|
|
97,685
|
|
98,506
|
|
100,761
|
|
105,202
|
|
100,379
|
|
107,859
|
|
|||||||||||||||
|
Selling and marketing
|
78,348
|
|
83,662
|
|
81,919
|
|
84,396
|
|
76,712
|
|
82,471
|
|
81,650
|
|
93,003
|
|
|||||||||||||||
|
General and administrative
|
30,097
|
|
31,882
|
|
36,285
|
|
28,560
|
|
29,553
|
|
30,302
|
|
29,743
|
|
33,804
|
|
|||||||||||||||
|
Amortization of intangible assets
|
12,439
|
|
11,493
|
|
11,019
|
|
11,019
|
|
11,019
|
|
11,019
|
|
11,019
|
|
36,454
|
|
|||||||||||||||
|
Acquisition and integration costs
|
—
|
|
—
|
|
—
|
|
—
|
|
—
|
|
1,020
|
|
2,435
|
|
22,084
|
|
|||||||||||||||
|
Restructuring costs
|
115
|
|
—
|
|
63
|
|
171
|
|
8,085
|
|
(17
|
)
|
192
|
|
366
|
|
|||||||||||||||
|
Total operating expenses
|
222,496
|
|
230,529
|
|
226,971
|
|
222,652
|
|
226,130
|
|
229,997
|
|
225,418
|
|
293,570
|
|
|||||||||||||||
|
Income (loss) from operations
|
3,355
|
|
7,162
|
|
37,002
|
|
(1,815
|
)
|
4,165
|
|
42,414
|
|
44,451
|
|
9,418
|
|
|||||||||||||||
|
Interest and other income (loss), net
|
(5,998
|
)
|
(1,905
|
)
|
(6,328
|
)
|
(11,031
|
)
|
(8,233
|
)
|
(5,549
|
)
|
(5,491
|
)
|
(6,232
|
)
|
|||||||||||||||
|
Interest expense
|
(11,028
|
)
|
(11,020
|
)
|
(11,508
|
)
|
(13,559
|
)
|
(13,661
|
)
|
(12,947
|
)
|
(11,883
|
)
|
(12,688
|
)
|
|||||||||||||||
|
Income (loss) before income taxes
|
(13,671
|
)
|
(5,763
|
)
|
19,166
|
|
(26,405
|
)
|
(17,729
|
)
|
23,918
|
|
27,077
|
|
(9,502
|
)
|
|||||||||||||||
|
Provision for income tax
|
2,265
|
|
4,395
|
|
3,006
|
|
4,298
|
|
1,050
|
|
3,265
|
|
3,452
|
|
4,330
|
|
|||||||||||||||
|
Net income (loss)
|
$
|
(15,936
|
)
|
$
|
(10,158
|
)
|
$
|
16,160
|
|
$
|
(30,703
|
)
|
$
|
(18,779
|
)
|
$
|
20,653
|
|
$
|
23,625
|
|
$
|
(13,832
|
)
|
|||||||
|
Basic net income (loss) per common share
|
$
|
(0.15
|
)
|
$
|
(0.10
|
)
|
$
|
0.15
|
|
$
|
(0.29
|
)
|
$
|
(0.17
|
)
|
$
|
0.18
|
|
$
|
0.20
|
|
$
|
(0.10
|
)
|
|||||||
|
Diluted net income (loss) per potential common share
|
$
|
(0.15
|
)
|
$
|
(0.10
|
)
|
$
|
0.15
|
|
$
|
(0.29
|
)
|
$
|
(0.17
|
)
|
$
|
0.17
|
|
$
|
0.19
|
|
$
|
(0.10
|
)
|
|||||||
|
Weighted average basic common shares outstanding
|
104,501
|
|
105,451
|
|
106,236
|
|
106,931
|
|
107,773
|
|
113,555
|
|
118,413
|
|
134,097
|
|
|||||||||||||||
|
Weighted average diluted potential common shares outstanding
|
104,501
|
|
105,451
|
|
120,809
|
|
106,931
|
|
107,773
|
|
128,017
|
|
133,233
|
|
134,097
|
|
|||||||||||||||
65
The following discussion about our market risk disclosures includes forward-looking statements. Actual results could differ materially from those projected in these forward-looking statements. We are exposed to market risk related to changes in interest rates and foreign currency exchange rates.
Interest Rate Sensitivity
.
We currently hold investments in U.S. Government obligations and commercial paper with varying maturities. See Notes
5
and
6
to our Consolidated Financial Statements included in Item 8 of Part II of this report for information relating to investments and fair value. These investments are sensitive to interest rate movements and their fair value will decline as interest rates rise and increase as interest rates decline. The estimated impact on these investments of a 100 basis point (1.0%) increase in interest rates across the yield curve from rates in effect as of the balance sheet date would be a
$2.2 million
decline in value.
Our earnings and cash flows from operations may be exposed to changes in interest rates because of the floating rate of interest in our Term Loan. See Note
15
to our Consolidated Financial Statements included in Item 8 of Part II of this report for information relating to the Term Loan. The Term Loan bears interest at LIBOR plus a spread of 300 basis points subject to a minimum LIBOR rate of 0.75%. As of
October 31, 2015
, the interest rate in effect on our Term Loan was
3.75%
. During fiscal 2014, Ciena entered into interest rate cap arrangements to limit the interest rate under the Term Loan to a maximum LIBOR rate of 0.75% plus a spread of 300 basis points through July 2015. Also in fiscal 2014, Ciena entered into interest rate swap arrangements ("interest rate swap") that fix the total interest rate under the Term Loan at 5.004%, for the period commencing on July 20, 2015 through July 19, 2018. As such, a 100 basis point increase in the LIBOR rate as of our most recent LIBOR rate setting would have an immaterial impact in annualized interest expense on our Term Loan as recognized in our Consolidated Financial Statements.
Foreign Currency Exchange Risk.
As a global concern, our business and results of operations are exposed to and can be impacted by movements in foreign currency exchange rates. Due to our global sales presence, some of our sales transactions and revenue are non-U.S. dollar denominated, with the Canadian Dollar and Euro being our most significant foreign currency revenue exposures. If the U.S. dollar strengthens against these currencies, our revenue for these transactions reported in U.S. dollars would decline. For our U.S. dollar denominated sales, an increase in the value of the U.S. dollar would increase the real costs of our products to customers in markets outside the United States, which could impact our competitive position. During fiscal
2015
, approximately
20.2%
of revenue was non-U.S. dollar denominated. During fiscal 2015 as compared to fiscal 2014, the U.S. dollar strengthened against a number of foreign currencies, including the Canadian Dollar and Euro and, consequently, our revenue reported in U.S. dollars was adversely impacted by approximately
$48.4 million
or
1.9%
. As it relates to costs of goods sold, employee-related and facilities costs associated with certain manufacturing-related operations in Canada represent our primary exposure to foreign currency exchange risk.
With regard to operating expense, our primary exposure to foreign currency exchange risk relates to operating expense incurred in Canadian Dollars, British Pounds, Euros and Indian Rupees. During fiscal
2015
, approximately
46.1%
of our operating expense was non-U.S. dollar denominated. If these currencies strengthen, costs reported in U.S. dollars will increase. During fiscal
2015
, research and development expense
benefited by
approximately
$28.0 million
, net of hedging losses of
$5.5 million
, primarily due to the strengthening of the U.S. dollar in relation to the Canadian Dollar in comparison to fiscal
2014
. Also in fiscal
2015
, sales and marketing expense and general and administrative expense
benefited by
approximately
$16.9 million
and
$4.4 million
, respectively, in each case, due to the strengthening of the U.S. dollar in relation to the Euro and the Canadian Dollar in comparison to fiscal
2014
.
From time to time, Ciena uses foreign currency forward contracts to reduce variability in certain forecasted non-U.S. dollar denominated cash flows. Generally, these derivatives have maturities of
12
months or less and are designated as cash flow hedges. At the inception of the cash flow hedge, and on an ongoing basis, Ciena assesses whether the forward contract has been effective in offsetting changes in cash flows attributable to the hedged risk during the hedging period. The effective portion of the derivative's net gain or loss is initially reported as a component of accumulated other comprehensive income (loss) and, upon the occurrence of the forecasted transaction, is subsequently reclassified to the line item in the Consolidated Statement of Operations to which the hedged transaction relates. Any net gain or loss associated with the ineffectiveness of the hedging instrument is reported in interest and other income (loss), net.
Ciena Corporation, as the U.S. parent entity, uses the U.S. dollar as its functional currency, however some of Ciena's foreign branch offices and subsidiaries use the local currency as their functional currency. During
fiscal 2015
, Ciena recorded
$47.6 million
in foreign currency exchange losses, as a result of monetary assets and liabilities that were transacted in a currency other than the entity's functional currency, and the re-measurement adjustments were recorded in interest and other income (loss), net on the Consolidated Statement of Operations. From time to time, Ciena uses foreign currency forwards to
66
hedge these balance sheet exposures. These forwards are not designated as hedges for accounting purposes and any net gain or loss associated with these derivatives is reported in interest and other income (loss), net. During fiscal
2015
, Ciena recorded gains of
$23.2 million
from these derivatives. See Note
1
, Note
4
and Note
13
to our Consolidated Financial Statements included in Item 8 of Part II of this report.
Convertible Notes Outstanding.
The fair market value of each of our outstanding issues of convertible notes is subject to interest rate and market price risk due to the convertible feature of the notes and other factors. Generally the fair market value of fixed interest rate debt will increase as interest rates fall and decrease as interest rates rise. The fair market value of the notes may also increase as the market price of our stock rises and decrease as the market price of our stock falls. Interest rate and market value changes affect the fair market value of the notes and may affect the prices at which we would be able to repurchase such notes were we to do so. These changes do not impact our financial position, cash flows or results of operations. For additional information on the fair value of our outstanding notes, see Note
15
to our Consolidated Financial Statements included in Item 8 of Part II of this report.
67
The following is an index to the consolidated financial statements:
|
|
Page
|
|
|
Number
|
68
Report of Independent Registered Public Accounting Firm
To the Board of Directors and Shareholders of Ciena Corporation:
In our opinion, the accompanying consolidated financial statements listed in the accompanying index present fairly, in all material respects, the financial position of Ciena Corporation and its subsidiaries (the “Company”) at October 31, 2015 and 2014, and the results of their operations and their cash flows for each of the three years in the period ended October 31, 2015 in conformity with accounting principles generally accepted in the United States of America. Also in our opinion, the Company maintained, in all material respects, effective internal control over financial reporting as of October 31, 2015, based on criteria established in Internal Control - Integrated Framework (2013) issued by the Committee of Sponsoring Organizations of the Treadway Commission (COSO). The Company's management is responsible for these financial statements, for maintaining effective internal control over financial reporting and for its assessment of the effectiveness of internal control over financial reporting, included in the accompanying Report of Management on Internal Control Over Financial Reporting under Item 9A. Our responsibility is to express opinions on these financial statements and on the Company's internal control over financial reporting based on our integrated audits. We conducted our audits in accordance with the standards of the Public Company Accounting Oversight Board (United States). Those standards require that we plan and perform the audits to obtain reasonable assurance about whether the financial statements are free of material misstatement and whether effective internal control over financial reporting was maintained in all material respects. Our audits of the financial statements included examining, on a test basis, evidence supporting the amounts and disclosures in the financial statements, assessing the accounting principles used and significant estimates made by management, and evaluating the overall financial statement presentation. Our audit of internal control over financial reporting included obtaining an understanding of internal control over financial reporting, assessing the risk that a material weakness exists, and testing and evaluating the design and operating effectiveness of internal control based on the assessed risk. Our audits also included performing such other procedures as we considered necessary in the circumstances. We believe that our audits provide a reasonable basis for our opinions.
A company’s internal control over financial reporting is a process designed to provide reasonable assurance regarding the reliability of financial reporting and the preparation of financial statements for external purposes in accordance with generally accepted accounting principles. A company’s internal control over financial reporting includes those policies and procedures that (i) pertain to the maintenance of records that, in reasonable detail, accurately and fairly reflect the transactions and dispositions of the assets of the company; (ii) provide reasonable assurance that transactions are recorded as necessary to permit preparation of financial statements in accordance with generally accepted accounting principles, and that receipts and expenditures of the company are being made only in accordance with authorizations of management and directors of the company; and (iii) provide reasonable assurance regarding prevention or timely detection of unauthorized acquisition, use, or disposition of the company’s assets that could have a material effect on the financial statements.
Because of its inherent limitations, internal control over financial reporting may not prevent or detect misstatements. Also, projections of any evaluation of effectiveness to future periods are subject to the risk that controls may become inadequate because of changes in conditions, or that the degree of compliance with the policies or procedures may deteriorate.
/s/ PricewaterhouseCoopers LLP
Baltimore, Maryland
December 21, 2015
69
CIENA CORPORATION
(in thousands, except share data)
|
|
October 31,
|
||||||
|
|
2014
|
2015
|
|||||
|
ASSETS
|
|
|
|||||
|
Current assets:
|
|
|
|||||
|
Cash and cash equivalents
|
$
|
586,720
|
|
$
|
790,971
|
|
|
|
Short-term investments
|
140,205
|
|
135,107
|
|
|||
|
Accounts receivable, net
|
518,981
|
|
550,792
|
|
|||
|
Inventories
|
254,660
|
|
191,162
|
|
|||
|
Prepaid expenses and other
|
192,624
|
|
196,178
|
|
|||
|
Total current assets
|
1,693,190
|
|
1,864,210
|
|
|||
|
Long-term investments
|
50,057
|
|
95,105
|
|
|||
|
Equipment, building, furniture and fixtures, net
|
126,632
|
|
191,973
|
|
|||
|
Goodwill
|
—
|
|
256,434
|
|
|||
|
Other intangible assets, net
|
128,677
|
|
202,673
|
|
|||
|
Other long-term assets
|
74,076
|
|
84,656
|
|
|||
|
Total assets
|
$
|
2,072,632
|
|
$
|
2,695,051
|
|
|
|
LIABILITIES AND STOCKHOLDERS’ EQUITY (DEFICIT)
|
|||||||
|
Current liabilities:
|
|
|
|||||
|
Accounts payable
|
$
|
209,777
|
|
$
|
222,140
|
|
|
|
Accrued liabilities and other short-term obligations
|
276,608
|
|
316,283
|
|
|||
|
Deferred revenue
|
104,688
|
|
126,111
|
|
|||
|
Current portion of long-term debt
|
190,063
|
|
2,500
|
|
|||
|
Total current liabilities
|
781,136
|
|
|
667,034
|
|
||
|
Long-term deferred revenue
|
40,930
|
|
62,962
|
|
|||
|
Other long-term obligations
|
45,390
|
|
72,540
|
|
|||
|
Long-term debt, net
|
1,274,791
|
|
1,271,639
|
|
|||
|
Total liabilities
|
2,142,247
|
|
2,074,175
|
|
|||
|
Commitments and contingencies (Note 23)
|
|
|
|
|
|||
|
Stockholders’ equity (deficit):
|
|
|
|||||
|
Preferred stock — par value $0.01; 20,000,000 shares authorized; zero shares issued and outstanding
|
—
|
|
—
|
|
|||
|
Common stock — par value $0.01; 290,000,000 shares authorized; 106,979,960 and 135,612,217 shares issued and outstanding
|
1,070
|
|
1,356
|
|
|||
|
Additional paid-in capital
|
5,954,440
|
|
6,640,436
|
|
|||
|
Accumulated other comprehensive loss
|
(14,668
|
)
|
(22,126
|
)
|
|||
|
Accumulated deficit
|
(6,010,457
|
)
|
(5,998,790
|
)
|
|||
|
Total stockholders’ equity (deficit)
|
(69,615
|
)
|
620,876
|
|
|||
|
Total liabilities and stockholders’ equity (deficit)
|
$
|
2,072,632
|
|
$
|
2,695,051
|
|
|
The accompanying notes are an integral part of these consolidated financial statements.
70
CIENA CORPORATION
(in thousands, except per share data)
|
|
Year Ended October 31,
|
||||||||||
|
|
2013
|
2014
|
2015
|
||||||||
|
Revenue:
|
|
|
|
||||||||
|
Products
|
$
|
1,680,125
|
|
$
|
1,865,826
|
|
$
|
2,002,395
|
|
||
|
Services
|
402,421
|
|
422,463
|
|
443,274
|
|
|||||
|
Total revenue
|
2,082,546
|
|
2,288,289
|
|
2,445,669
|
|
|||||
|
Cost of goods sold:
|
|
|
|
||||||||
|
Products
|
967,510
|
|
1,083,022
|
|
1,120,373
|
|
|||||
|
Services
|
249,861
|
|
256,915
|
|
249,733
|
|
|||||
|
Total cost of goods sold
|
1,217,371
|
|
1,339,937
|
|
1,370,106
|
|
|||||
|
Gross profit
|
865,175
|
|
948,352
|
|
1,075,563
|
|
|||||
|
Operating expenses:
|
|
|
|
||||||||
|
Research and development
|
383,408
|
|
401,180
|
|
414,201
|
|
|||||
|
Selling and marketing
|
304,170
|
|
328,325
|
|
333,836
|
|
|||||
|
General and administrative
|
122,432
|
|
126,824
|
|
123,402
|
|
|||||
|
Amortization of intangible assets
|
49,771
|
|
45,970
|
|
69,511
|
|
|||||
|
Acquisition and integration costs
|
—
|
|
—
|
|
25,539
|
|
|||||
|
Restructuring costs
|
7,169
|
|
349
|
|
8,626
|
|
|||||
|
Total operating expenses
|
866,950
|
|
902,648
|
|
975,115
|
|
|||||
|
Income (loss) from operations
|
(1,775
|
)
|
45,704
|
|
100,448
|
|
|||||
|
Interest and other income (loss), net
|
(5,744
|
)
|
(25,262
|
)
|
(25,505
|
)
|
|||||
|
Interest expense
|
(44,042
|
)
|
(47,115
|
)
|
(51,179
|
)
|
|||||
|
Loss on extinguishment of debt
|
(28,630
|
)
|
—
|
|
—
|
|
|||||
|
Income (loss) before income taxes
|
(80,191
|
)
|
(26,673
|
)
|
23,764
|
|
|||||
|
Provision for income taxes
|
5,240
|
|
13,964
|
|
12,097
|
|
|||||
|
Net income (loss)
|
$
|
(85,431
|
)
|
$
|
(40,637
|
)
|
$
|
11,667
|
|
||
|
Basic net income (loss) per common share
|
$
|
(0.83
|
)
|
$
|
(0.38
|
)
|
$
|
0.10
|
|
||
|
Diluted net income (loss) per potential common share
|
$
|
(0.83
|
)
|
$
|
(0.38
|
)
|
$
|
0.10
|
|
||
|
Weighted average basic common shares outstanding
|
102,350
|
|
105,783
|
|
118,416
|
|
|||||
|
Weighted average diluted potential common shares outstanding
|
102,350
|
|
105,783
|
|
120,101
|
|
|||||
The accompanying notes are an integral part of these consolidated financial statements.
71
CIENA CORPORATION
CONSOLIDATED STATEMENTS OF COMPREHENSIVE INCOME (LOSS)
(in thousands)
|
|
Year ended October 31,
|
||||||||||
|
|
2013
|
2014
|
2015
|
||||||||
|
Net income (loss)
|
$
|
(85,431
|
)
|
$
|
(40,637
|
)
|
$
|
11,667
|
|
||
|
Change in unrealized gain (loss) on available-for-sale securities, net of tax
|
(14
|
)
|
41
|
|
(149
|
)
|
|||||
|
Change in unrealized gain (loss) on foreign currency forward contracts, net of tax
|
(310
|
)
|
114
|
|
(95
|
)
|
|||||
|
Change in unrealized loss on forward starting interest rate swap, net of tax
|
—
|
|
(2,109
|
)
|
(3,439
|
)
|
|||||
|
Change in accumulated translation adjustments
|
(4,096
|
)
|
(4,940
|
)
|
(3,775
|
)
|
|||||
|
Other comprehensive loss
|
(4,420
|
)
|
(6,894
|
)
|
(7,458
|
)
|
|||||
|
Total comprehensive income (loss)
|
$
|
(89,851
|
)
|
$
|
(47,531
|
)
|
$
|
4,209
|
|
||
The accompanying notes are an integral part of these consolidated financial statements.
72
CIENA CORPORATION
CONSOLIDATED STATEMENTS OF CHANGES IN STOCKHOLDERS’ EQUITY (DEFICIT)
(in thousands, except share data)
|
Common Stock
Shares
|
Par Value
|
Additional
Paid-in-Capital
|
Accumulated Other
Comprehensive
Income (Loss)
|
Accumulated
Deficit
|
Total
Stockholders’
Equity (Deficit)
|
|||||||||||||||||
|
Balance at October 31, 2012
|
100,601,792
|
|
$
|
1,006
|
|
$
|
5,797,765
|
|
$
|
(3,354
|
)
|
$
|
(5,884,389
|
)
|
$
|
(88,972
|
)
|
|||||
|
Net loss
|
—
|
|
—
|
|
—
|
|
—
|
|
(85,431
|
)
|
(85,431
|
)
|
||||||||||
|
Other comprehensive loss
|
—
|
|
—
|
|
—
|
|
(4,420
|
)
|
—
|
|
(4,420
|
)
|
||||||||||
|
Equity component of convertible notes payable issued
|
—
|
|
—
|
|
43,131
|
|
—
|
|
—
|
|
43,131
|
|
||||||||||
|
Equity component of deferred debt issuance costs
|
—
|
|
—
|
|
(603
|
)
|
—
|
|
—
|
|
(603
|
)
|
||||||||||
|
Issuance of shares from employee equity plans
|
3,103,917
|
|
31
|
|
15,867
|
|
—
|
|
—
|
|
15,898
|
|
||||||||||
|
Share-based compensation expense
|
—
|
|
—
|
|
37,720
|
|
—
|
|
—
|
|
37,720
|
|
||||||||||
|
Balance at October 31, 2013
|
103,705,709
|
|
1,037
|
|
5,893,880
|
|
(7,774
|
)
|
(5,969,820
|
)
|
(82,677
|
)
|
||||||||||
|
Net loss
|
—
|
|
—
|
|
—
|
|
—
|
|
(40,637
|
)
|
(40,637
|
)
|
||||||||||
|
Other comprehensive loss
|
—
|
|
—
|
|
—
|
|
(6,894
|
)
|
—
|
|
(6,894
|
)
|
||||||||||
|
Issuance of shares from employee equity plans
|
3,274,251
|
|
33
|
|
17,630
|
|
—
|
|
—
|
|
17,663
|
|
||||||||||
|
Share-based compensation expense
|
—
|
|
—
|
|
42,930
|
|
—
|
|
—
|
|
42,930
|
|
||||||||||
|
Balance at October 31, 2014
|
106,979,960
|
|
1,070
|
|
5,954,440
|
|
(14,668
|
)
|
(6,010,457
|
)
|
(69,615
|
)
|
||||||||||
|
Net income
|
—
|
|
—
|
|
—
|
|
—
|
|
11,667
|
|
11,667
|
|
||||||||||
|
Other comprehensive loss
|
—
|
|
—
|
|
—
|
|
(7,458
|
)
|
—
|
|
(7,458
|
)
|
||||||||||
|
Issuance of shares from Cyan acquisition
|
10,638,553
|
|
106
|
|
302,008
|
|
—
|
|
—
|
|
302,114
|
|
||||||||||
|
Equity component of convertible note acquired
|
—
|
|
—
|
|
82,164
|
|
—
|
|
—
|
|
82,164
|
|
||||||||||
|
Conversion of convertible notes into common shares
|
13,488,013
|
|
135
|
|
216,254
|
|
—
|
|
—
|
|
216,389
|
|
||||||||||
|
Issuance of shares from employee equity plans
|
4,505,691
|
|
45
|
|
30,230
|
|
—
|
|
—
|
|
30,275
|
|
||||||||||
|
Share-based compensation expense
|
—
|
|
—
|
|
55,340
|
|
—
|
|
—
|
|
55,340
|
|
||||||||||
|
Balance at October 31, 2015
|
135,612,217
|
|
$
|
1,356
|
|
$
|
6,640,436
|
|
$
|
(22,126
|
)
|
$
|
(5,998,790
|
)
|
$
|
620,876
|
|
|||||
The accompanying notes are an integral part of these consolidated financial statements.
73
CIENA CORPORATION
(in thousands)
|
|
Year Ended October 31,
|
||||||||||
|
|
2013
|
2014
|
2015
|
||||||||
|
Cash flows from operating activities:
|
|
|
|
||||||||
|
Net income (loss)
|
$
|
(85,431
|
)
|
$
|
(40,637
|
)
|
$
|
11,667
|
|
||
|
Adjustments to reconcile net income (loss) to net cash provided by operating activities:
|
|
|
|
||||||||
|
Loss on extinguishment of debt
|
28,630
|
|
—
|
|
—
|
|
|||||
|
Depreciation of equipment, building, furniture and fixtures, and amortization of leasehold improvements
|
55,699
|
|
55,616
|
|
55,901
|
|
|||||
|
Share-based compensation costs
|
37,720
|
|
42,930
|
|
55,340
|
|
|||||
|
Amortization of intangible assets
|
71,308
|
|
57,151
|
|
79,866
|
|
|||||
|
Provision for inventory excess and obsolescence
|
19,938
|
|
32,332
|
|
26,846
|
|
|||||
|
Provision for warranty
|
24,558
|
|
22,129
|
|
17,881
|
|
|||||
|
Other
|
9,023
|
|
25,668
|
|
27,373
|
|
|||||
|
Changes in assets and liabilities:
|
|
|
|
||||||||
|
Accounts receivable
|
(145,421
|
)
|
(33,164
|
)
|
(37,297
|
)
|
|||||
|
Inventories
|
(8,943
|
)
|
(37,889
|
)
|
46,898
|
|
|||||
|
Prepaid expenses and other
|
(82,809
|
)
|
(7,931
|
)
|
(46,383
|
)
|
|||||
|
Accounts payable, accruals and other obligations
|
115,312
|
|
(59,837
|
)
|
(10,505
|
)
|
|||||
|
Deferred revenue
|
5,094
|
|
33,448
|
|
34,525
|
|
|||||
|
Net cash provided by operating activities
|
44,678
|
|
89,816
|
|
262,112
|
|
|||||
|
Cash flows used in investing activities:
|
|
|
|
||||||||
|
Payments for equipment, furniture, fixtures and intellectual property
|
(43,814
|
)
|
(48,216
|
)
|
(62,109
|
)
|
|||||
|
Restricted cash
|
2,338
|
|
2,060
|
|
(40
|
)
|
|||||
|
Purchase of available for sale securities
|
(184,864
|
)
|
(245,196
|
)
|
(245,323
|
)
|
|||||
|
Proceeds from maturities of available for sale securities
|
95,000
|
|
195,000
|
|
205,000
|
|
|||||
|
Purchase of cost method investment
|
—
|
|
—
|
|
(2,000
|
)
|
|||||
|
Settlement of foreign currency forward contracts, net
|
479
|
|
(10,041
|
)
|
24,133
|
|
|||||
|
Acquisition of business, net of cash acquired
|
—
|
|
—
|
|
37,212
|
|
|||||
|
Net cash used in investing activities
|
(130,861
|
)
|
(106,393
|
)
|
(43,127
|
)
|
|||||
|
Cash flows from financing activities:
|
|
|
|
||||||||
|
Proceeds from issuance of long-term debt, net
|
—
|
|
248,750
|
|
—
|
|
|||||
|
Payment of long-term debt
|
(216,210
|
)
|
(625
|
)
|
(29,867
|
)
|
|||||
|
Payment of debt and equity issuance costs
|
(3,692
|
)
|
(4,227
|
)
|
(421
|
)
|
|||||
|
Payment of capital lease obligations
|
(3,335
|
)
|
(3,034
|
)
|
(8,038
|
)
|
|||||
|
Proceeds from issuance of common stock
|
15,898
|
|
17,663
|
|
30,275
|
|
|||||
|
Net cash provided by (used in) financing activities
|
(207,339
|
)
|
258,527
|
|
(8,051
|
)
|
|||||
|
Effect of exchange rate changes on cash and cash equivalents
|
(2,435
|
)
|
(1,717
|
)
|
(6,683
|
)
|
|||||
|
Net increase (decrease) in cash and cash equivalents
|
(295,957
|
)
|
240,233
|
|
204,251
|
|
|||||
|
Cash and cash equivalents at beginning of fiscal year
|
642,444
|
|
346,487
|
|
586,720
|
|
|||||
|
Cash and cash equivalents at end of fiscal year
|
$
|
346,487
|
|
$
|
586,720
|
|
$
|
790,971
|
|
||
|
Supplemental disclosure of cash flow information
|
|
|
|
||||||||
|
Cash paid during the fiscal year for interest
|
$
|
32,397
|
|
$
|
36,276
|
|
$
|
40,772
|
|
||
|
Cash paid during the fiscal year for income taxes, net
|
$
|
10,679
|
|
$
|
11,396
|
|
$
|
10,668
|
|
||
|
Non-cash investing activities
|
|
|
|
||||||||
|
Purchase of equipment in accounts payable
|
$
|
6,191
|
|
$
|
4,961
|
|
$
|
20,922
|
|
||
|
Equipment acquired under capital leases
|
$
|
2,538
|
|
$
|
10,424
|
|
$
|
464
|
|
||
|
Building subject to capital lease
|
$
|
—
|
|
$
|
—
|
|
$
|
14,939
|
|
||
|
Construction in progress subject to build-to-suit lease
|
$
|
—
|
|
$
|
—
|
|
$
|
18,663
|
|
||
|
Non-cash financing activities
|
|||||||||||
|
Conversion of 4.0% convertible senior notes, due March 15, 2015 into 8,898,387 shares of common stock
|
$
|
—
|
|
$
|
—
|
|
$
|
180,645
|
|
||
|
Conversion of 8.0% convertible senior notes, due December 15, 2019, assumed from the Cyan acquisition, into 4,589,626 shares of common stock
|
$
|
—
|
|
$
|
—
|
|
$
|
117,140
|
|
||
|
Fair value of shares issued related to acquisition of business
|
$
|
—
|
|
$
|
—
|
|
$
|
302,114
|
|
||
The accompanying notes are an integral part of these consolidated financial statements.
74
CIENA CORPORATION
NOTES TO CONSOLIDATED FINANCIAL STATEMENTS
(1) CIENA CORPORATION AND SIGNIFICANT ACCOUNTING POLICIES AND ESTIMATES
Description of Business
Ciena Corporation (“Ciena” or the “Company”) is a network specialist focused on providing communications networking solutions that enable a wide range of network operators to adopt next-generation architectures. Ciena has optimized its business and solutions to enable network operators to create and deliver the broad array of high-bandwidth services relied upon by enterprise and consumer end users. Ciena provides equipment, software and services that support the transport, switching, aggregation, service delivery and management of voice, video and data traffic on communications networks. In addition to its high-capacity hardware platforms, Ciena offers network management and control software platforms that help network operators simplify and automate their networks and virtualize certain network functions. Ciena's solutions are designed to enable network operators to adopt open, multi-vendor, software-programmable network infrastructures that improve automation, reduce network complexity and flexibly support changing service requirements. Ciena's solutions yield business and operational value for its customers by enabling them to introduce new, revenue-generating services and to reduce network complexity and expense.
Ciena's Converged Packet Optical, Packet Networking and Optical Transport products are used, individually or as part of an integrated solution, by communications service providers, cable and multiservice operators, Web-scale providers, submarine network operators, governments, enterprises, research and education (R&E) institutions and other network operators across the globe. Ciena's products, which support applications from the network core to network access points, allow network operators to scale capacity, increase transmission speeds, allocate traffic and adapt dynamically to changing end-user service demands. Ciena's software solutions are oriented around its Blue Planet software platform, a modular, network virtualization, service orchestration and network management software platform designed to simplify the creation, automation and delivery of services across multi-vendor and multi-domain network environments. To complement its hardware and software solutions, Ciena offers a broad range of network transformation and related support services that help its customers design, optimize, deploy, manage and maintain their networks. Ciena’s principal executive offices are located at 7035 Ridge Road, Hanover, Maryland 21076.
Basis of Presentation
The accompanying consolidated financial statements include the accounts of Ciena and its wholly owned subsidiaries. All intercompany accounts and transactions have been eliminated in consolidation.
Ciena has a
52 or 53 week
fiscal year, which ends on the Saturday nearest to the last day of October in each year (November 2, 2013, November 1, 2014 and October 31, 2015 for the periods reported).
Fiscal 2013
,
fiscal 2014
and
fiscal 2015
each consisted of a 52-week fiscal year. For purposes of financial statement presentation, each fiscal year is described as having ended on
October 31
.
Ciena has identified prior period errors in the classification of foreign currency differences on changes in operating assets and liabilities for each of the three quarters of fiscal 2015. The matters identified have no impact on any of the cash flow statement sub totals in any of the quarters, and are limited to equal and offsetting errors within the subtotal of cash provided by operations. Ciena concluded that the errors were not material to any of its previously issued financial statements. Ciena intends to revise the affected periods when they are presented in fiscal 2016 on a comparable basis to reflect the correct accounting. The revisions will result in net reclassifications within the cash flows from operating activities section of the cash flow from "Other" to “Changes in operating assets and liabilities” of
$19.0 million
,
$10.0 million
and
$0.1 million
for the nine, six and three month periods ending July 31, 2015, April 30, 2015 and January 31, 2015, respectively.
Business Combinations
Ciena records acquisitions using the purchase method of accounting. All of the assets acquired, liabilities assumed, contractual contingencies and contingent consideration are recognized at their fair value as of the acquisition date. The excess of the purchase price over the estimated fair values of the net tangible and net intangible assets acquired is recorded as goodwill. The application of the purchase method of accounting for business combinations requires management to make significant estimates and assumptions in the determination of the fair value of assets acquired and liabilities assumed in order to properly allocate purchase price consideration between assets that are depreciated and amortized from goodwill. These assumptions and estimates include a market participant's use of the asset and the appropriate discount rates for a market participant. Ciena's estimates are based on historical experience, information obtained from the management of the acquired companies and, when appropriate, includes assistance from independent third-party appraisal firms. Our significant assumptions and estimates can include, but are not limited to, the cash flows that an asset is expected to generate in the future, the appropriate weighted-average cost of capital, and the cost savings expected to be derived from acquiring an asset. These
75
estimates are inherently uncertain and unpredictable. In addition, unanticipated events and circumstances may occur which may affect the accuracy or validity of such estimates.
Use of Estimates
The preparation of the financial statements and related disclosures in conformity with Generally Accepted Accounting Principles ("GAAP") requires management to make estimates and judgments that affect the amounts reported in the consolidated financial statements and accompanying notes. Estimates are used for selling prices for multiple element arrangements, shared-based compensation, convertible notes payable valuations, bad debts, valuation of inventories and investments, recoverability of intangible assets, other long-lived assets and goodwill, income taxes, warranty obligations, restructuring liabilities, derivatives, contingencies and litigation. Ciena bases its estimates on historical experience and assumptions that it believes are reasonable. Actual results may differ materially from management’s estimates.
Cash and Cash Equivalents
Ciena considers all highly liquid investments purchased with original maturities of
three
months or less to be cash equivalents. Any restricted cash collateralizing letters of credit is included in other current assets and other long-term assets depending upon the duration of the restriction.
Investments
Ciena's investments are classified as available-for-sale and are reported at fair value, with unrealized gains and losses recorded in accumulated other comprehensive income (loss). Ciena recognizes losses in the income statement when it determines that declines in the fair value of its investments below their cost basis are other-than-temporary. In determining whether a decline in fair value is other-than-temporary, Ciena considers various factors, including market price (when available), investment ratings, the financial condition and near-term prospects of the investee, the length of time and the extent to which the fair value has been less than Ciena's cost basis, and Ciena's intent and ability to hold the investment until maturity or for a period of time sufficient to allow for any anticipated recovery in market value. Ciena considers all marketable debt securities that it expects to convert to cash within
one
year or less to be short-term investments, with all others considered to be long-term investments.
Ciena has a minority equity investment in a privately held technology company that is classified in other long-term assets. This investment is carried at cost because Ciena owns less than 20% of the voting equity and does not have the ability to exercise significant influence over the company. Ciena monitors this investment for impairment and makes appropriate reductions to the carrying value when necessary. As of
October 31, 2015
, the carrying value of this investment was
$2.0 million
. With respect to this investment, Ciena has not estimated the fair value of this cost method investment because determining the fair value is not practicable. Ciena has not evaluated this investment for impairment as there have not been any events or changes in circumstances that Ciena believes would have had a significant adverse effect on the fair value of this investment.
Inventories
Inventories are stated at the lower of cost or market, with cost computed using standard cost, which approximates actual cost, on a first-in, first-out basis. Ciena records a provision for excess and obsolete inventory when an impairment has been identified.
Segment Reporting
Ciena's chief operating decision maker, its chief executive officer, evaluates the company's performance and allocates resources based on multiple factors, including measures of segment profit(loss). Operating segments are defined as components of an enterprise that engage in business activities that may earn revenue and incur expense, for which discrete financial information is available, and for which such information is evaluated regularly by the chief operating decision maker for purposes of allocating resources and assessing performance. Ciena considers the following to be its operating segments for reporting purposes: (i) Converged Packet Optical, (ii) Packet Networking, (iii) Optical Transport, and (iv) Software and Services. See Note
21
below.
Goodwill
76
Goodwill is the excess of the purchase price over the fair values assigned to the net assets acquired in a business combination. Ciena tests goodwill for impairment on an annual basis, which we have determined to be the last business day of fiscal September each year. Ciena also tests goodwill for impairment between annual tests if an event occurs or circumstances change that would, more likely than not, reduce the fair value of the reporting unit below its carrying value.
The first step in the process of assessing goodwill impairment is to compare the fair value of the reporting unit with the unit’s carrying amount, including goodwill. If this test indicates that the fair value is less than the carrying value, then step two is required to compare the implied fair value of the reporting unit’s goodwill with the carrying amount of the reporting unit’s goodwill. A non-cash goodwill impairment charge would have the effect of decreasing our earnings or increasing our losses in such period. If we are required to take a substantial impairment charge, our operating results would be materially adversely affected in such period.
Long-lived Assets
Long-lived assets include: equipment, building, furniture and fixtures; intangible assets; and maintenance spares. Ciena tests long-lived assets for impairment whenever triggering events or changes in circumstances indicate that the asset's carrying amount is not recoverable from its undiscounted cash flows. An impairment loss is measured as the amount by which the carrying amount of the asset or asset group exceeds its fair value. Ciena's long-lived assets are assigned to asset groups that represent the lowest level for which cash flows can be identified.
Equipment, Building, Furniture and Fixtures and Internal Use Software
Equipment, building, furniture and fixtures are recorded at cost. Depreciation and amortization are computed using the straight-line method over useful lives of
two
to
five
years for equipment, furniture and fixtures and the shorter of useful life or lease term for leasehold improvements. During the second quarter of fiscal 2015, Ciena gained partial access to an office building in Ottawa, Canada pursuant to a lease arrangement accounted for as a capital lease, which is depreciated over the lease term. The lease building is part of Ciena's new campus facility that will replace the Lab 10 research and development center on the former Nortel Carling campus. See Note
10
below.
Ciena establishes assets and liabilities for the estimated construction costs incurred under build-to-suit lease arrangements to the extent that Ciena is involved in the construction of structural improvements or takes construction risk prior to commencement of a lease. See Notes
10
and
12
below.
Qualifying internal use software and website development costs incurred during the application development stage, which consist primarily of outside services and purchased software license costs, are capitalized and amortized straight-line over the estimated useful lives of
two
to
five
years.
Intangible Assets
Ciena has recorded finite-lived intangible assets as a result of several acquisitions. Finite-lived intangible assets are carried at cost less accumulated amortization. Amortization is computed using the straight-line method over the expected economic lives of the respective assets, up to
seven
years, which approximates the use of intangible assets.
Maintenance Spares
Maintenance spares are recorded at cost. Spares usage cost is expensed ratably over
four
years.
Concentrations
Substantially all of Ciena's cash and cash equivalents are maintained at a small number of major U.S. financial institutions. The majority of Ciena's cash equivalents consist of money market funds. Deposits held with banks may exceed the amount of insurance provided on such deposits. Because these deposits generally may be redeemed upon demand, management believes that they bear minimal risk.
Historically, a significant percentage of Ciena's revenue has been concentrated among sales to a small number of large communications service providers. Consolidation among Ciena's customers has increased this concentration. Consequently, Ciena's accounts receivable are concentrated among these customers. See Note
21
below.
77
Additionally, Ciena's access to certain materials or components is dependent upon sole or limited source suppliers. The inability of any of these suppliers to fulfill Ciena's supply requirements, or significant changes in supply cost, could affect future results. Ciena relies on a small number of contract manufacturers to perform the majority of the manufacturing for its products. If Ciena cannot effectively manage these manufacturers or forecast future demand, or if these manufacturers fail to deliver products or components on time, Ciena's business and results of operations may suffer.
Revenue Recognition
Ciena recognizes revenue when all of the following criteria are met: persuasive evidence of an arrangement exists; delivery has occurred or services have been rendered; the price to the buyer is fixed or determinable; and collectibility is reasonably assured. Customer purchase agreements and customer purchase orders are generally used to determine the existence of an arrangement. Shipping documents and evidence of customer acceptance, when applicable, are used to verify delivery or services rendered. Ciena assesses whether the price is fixed or determinable based on the payment terms associated with the transaction and whether the sales price is subject to refund or adjustment. Ciena assesses collectibility based primarily on the creditworthiness of the customer as determined by credit checks and analysis, as well as the customer's payment history. Revenue for maintenance services is deferred and recognized ratably over the period during which the services are performed. Shipping and handling fees billed to customers are included in revenue, with the associated expenses included in product cost of goods sold.
Ciena applies the percentage-of-completion method to long-term arrangements where Ciena is required to undertake significant production, customization or modification engineering, and reasonable and reliable estimates of revenue and cost are available. Utilizing the percentage-of-completion method, Ciena recognizes revenue based on the ratio of actual costs incurred to date to total estimated costs expected to be incurred. In instances that do not meet the percentage-of-completion method criteria, recognition of revenue is deferred until there are no uncertainties regarding customer acceptance. Unbilled percentage-of-completion revenues recognized are included in accounts receivable, net. Billings in excess of revenues recognized on these contracts are recorded within deferred revenue. The percentage of total revenue recognized using the percentage-of-completion method
for the fiscal years ended
October 31, 2013
,
October 31, 2014
and
October 31, 2015
were
4.5%
,
4.0%
and
1.8%
, respectively.
Software revenue is recognized when persuasive evidence of an arrangement exists, delivery has occurred, the fee is fixed or determinable, and collectibility is probable. In instances where final acceptance criteria of the software are specified by the customer, revenue is deferred until there are no uncertainties regarding customer acceptance.
Ciena limits the amount of revenue recognition for delivered elements to the amount that is not contingent on the future delivery of products or services, future performance obligations or subject to customer-specified return or refund privileges.
Revenue for multiple element arrangements is allocated to each unit of accounting based on the relative selling price of each delivered element, with revenue recognized for each delivered element when the revenue recognition criteria are met. Ciena determines the selling price for each deliverable based upon the selling price hierarchy for multiple-deliverable arrangements. Under this hierarchy, Ciena uses vendor-specific objective evidence ("VSOE") of selling price, if it exists, or third party evidence ("TPE") of selling price if VSOE does not exist. If neither VSOE nor TPE of selling price exists for a deliverable, Ciena uses its best estimate of selling price ("BESP") for that deliverable. For multiple element software arrangements where VSOE of undelivered maintenance does not exist, revenue for the entire arrangement is recognized over the maintenance term.
VSOE, when determinable, is established based on Ciena's pricing and discounting practices for the specific product or service when sold separately. In determining whether VSOE exists, Ciena requires that a substantial majority of the selling prices for a product or service fall within a reasonably narrow pricing range. Ciena has been unable to establish TPE of selling price because its go-to-market strategy differs from that of others in its markets, and the extent of customization and differentiated features and functions varies among comparable products or services from its peers. Ciena determines BESP based upon management-approved pricing guidelines, which consider multiple factors including the type of product or service, gross margin objectives, competitive and market conditions, and the go-to-market strategy, all of which can affect pricing practices.
Warranty Accruals
Ciena provides for the estimated costs to fulfill customer warranty obligations upon recognition of the related revenue. Estimated warranty costs include estimates for material costs, technical support labor costs and associated overhead. Warranty is included in cost of goods sold and is determined based upon actual warranty cost experience, estimates of component failure
78
rates and management's industry experience. Ciena's sales contracts do not permit the right of return of the product by the customer after the product has been accepted.
Accounts Receivable, Net
Ciena's allowance for doubtful accounts is based on its assessment, on a specific identification basis, of the collectibility of customer accounts. Ciena performs ongoing credit evaluations of its customers and generally has not required collateral or other forms of security from them. In determining the appropriate balance for Ciena's allowance for doubtful accounts, management considers each individual customer account receivable in order to determine collectibility. In doing so, management considers creditworthiness, payment history, account activity and communication with the customer. If a customer's financial condition changes, Ciena may be required to record an allowance for doubtful accounts for that customer, which could negatively affect its results of operations.
Research and Development
Ciena charges all research and development costs to expense as incurred. Types of expense incurred in research and development include employee compensation, cost of prototype equipment, consulting and third party services, depreciation, facility costs and information technology.
Government Grants
Ciena accounts for proceeds from government grants as a reduction of operating expense when there is reasonable assurance that Ciena has complied with the conditions attached to the grant and that the grant proceeds will be received. Grant benefits are recorded to the line item in the Consolidated Statement of Operations to which the grant activity relates. See Note
23
below.
Advertising Costs
Ciena expenses all advertising costs as incurred.
Legal Costs
Ciena expenses legal costs associated with litigation defense as incurred.
Share-Based Compensation Expense
Ciena measures and recognizes compensation expense for share-based awards based on estimated fair values on the date of grant. Ciena estimates the fair value of each option-based award on the date of grant using the Black-Scholes option-pricing model. This model is affected by Ciena's stock price as well as estimates regarding a number of variables, including expected stock price volatility over the expected term of the award and projected employee stock option exercise behaviors. Ciena estimates the fair value of each restricted stock unit award based on the fair value of the underlying common stock on the date of grant. In each case, Ciena only recognizes expense in its Consolidated Statement of Operations for those stock options or restricted stock units that are expected ultimately to vest. Ciena recognizes the estimated fair value of performance-based awards, net of estimated forfeitures, as share-based expense over the performance period, using graded vesting, which considers each performance period or tranche separately, based upon its determination of whether it is probable that the performance targets will be achieved. At each reporting period, Ciena reassesses the probability of achieving the performance targets and the performance period required to meet those targets and the expense is adjusted accordingly. Ciena uses the straight-line method to record expense for shared-based awards with only service-based vesting. See Note
20
below.
Income Taxes
Ciena accounts for income taxes using an asset and liability approach that recognizes deferred tax assets and liabilities for the expected future tax consequences attributable to differences between the carrying amounts of assets and liabilities for financial reporting purposes and their respective tax bases, and for operating loss and tax credit carryforwards. In estimating future tax consequences, Ciena considers all expected future events other than the enactment of changes in tax laws or rates. Valuation allowances are provided if, based upon the weight of the available evidence, it is more likely than not that some or all of the deferred tax assets will not be realized.
79
In the ordinary course of business, transactions occur for which the ultimate outcome may be uncertain. In addition, tax authorities periodically audit Ciena's income tax returns. These audits examine significant tax filing positions, including the timing and amounts of deductions and the allocation of income tax expenses among tax jurisdictions. Ciena is currently under audit in India for 2010 through 2013 and in Canada for 2010 through 2013. Management does not expect the outcome of these audits to have a material adverse effect on Ciena's consolidated financial position, results of operations or cash flows. Ciena's major tax jurisdictions and the earliest open tax years are as follows: United States (2012), United Kingdom (2013), Canada (2010) and India (2010). Limited adjustments can be made to Federal U.S. tax returns in earlier years in order to reduce net operating loss carryforwards. Ciena classifies interest and penalties related to uncertain tax positions as a component of income tax expense.
Ciena has not provided for U.S. deferred income taxes on the cumulative unremitted earnings of its non-U.S. affiliates, as it plans to indefinitely reinvest cumulative unremitted foreign earnings outside the U.S., and it is not practicable to determine the unrecognized deferred income taxes. These cumulative unremitted foreign earnings relate to ongoing operations in foreign jurisdictions and are required to fund foreign operations, capital expenditures and any expansion requirements.
Ciena recognizes windfall tax benefits associated with the exercise of stock options or release of restricted stock units directly to stockholders' equity only when realized. A windfall tax benefit occurs when the actual tax benefit realized by Ciena upon an employee's disposition of a share-based award exceeds the deferred tax asset, if any, associated with the award that Ciena had recorded. When assessing whether a tax benefit relating to share-based compensation has been realized, Ciena follows the “with-and-without” method. Under the with-and-without method, the windfall is considered realized and recognized for financial statement purposes only when an incremental benefit is provided after considering all other tax benefits including Ciena's net operating losses. The with-and-without method results in the windfall from share-based compensation awards always being effectively the last tax benefit to be considered. Consequently, the windfall attributable to share-based compensation will not be considered realized in instances where Ciena's net operating loss carryover (that is unrelated to windfalls) is sufficient to offset the current year's taxable income before considering the effects of current-year windfalls.
Loss Contingencies
Ciena is subject to the possibility of various losses arising in the ordinary course of business. These may relate to disputes, litigation and other legal actions. Ciena considers the likelihood of loss or the incurrence of a liability, as well as Ciena's ability to reasonably estimate the amount of loss, in determining loss contingencies. An estimated loss contingency is accrued when it is probable that a liability has been incurred and the amount of loss can be reasonably estimated. Ciena regularly evaluates current information available to it in order to determine whether any accruals should be adjusted and whether new accruals are required.
Fair Value of Financial Instruments
The carrying value of Ciena's cash and cash equivalents, accounts receivable, accounts payable and accrued liabilities approximates fair market value due to the relatively short period of time to maturity. For information related to the fair value of Ciena's convertible notes and term loan, see Note
15
below.
Fair value for the measurement of financial assets and liabilities is defined as the price that would be received to sell an asset or paid to transfer a liability in an orderly transaction between market participants at the measurement date. As such, fair value is a market-based measurement that should be determined based on assumptions that market participants would use in pricing an asset or liability. Ciena utilizes a valuation hierarchy for disclosure of the inputs for fair value measurement. This hierarchy prioritizes the inputs into three broad levels as follows:
|
•
|
Level 1 inputs are unadjusted quoted prices in active markets for identical assets or liabilities;
|
|
•
|
Level 2 inputs are quoted prices for identical or similar assets or liabilities in less active markets or model-derived valuations in which significant inputs are observable for the asset or liability, either directly or indirectly through market corroboration, for substantially the full term of the financial instrument; and
|
|
•
|
Level 3 inputs are unobservable inputs based on Ciena's assumptions used to measure assets and liabilities at fair value.
|
By distinguishing between inputs that are observable in the marketplace, and therefore more objective, and those that are unobservable and therefore more subjective, the hierarchy is designed to indicate the relative reliability of the fair value
80
measurements. A financial asset's or liability's classification within the hierarchy is determined based on the lowest level input that is significant to the fair value measurement.
Restructuring
From time to time, Ciena takes actions to better align its workforce, facilities and operating costs with perceived market opportunities, business strategies and changes in market and business conditions. Ciena recognizes a liability for the cost associated with an exit or disposal activity in the period in which the liability is incurred, except for one-time employee termination benefits related to a service period, typically more than
60 days
, which are accrued over the service period. See Note
3
below.
Foreign Currency
Certain of Ciena's foreign branch offices and subsidiaries use the U.S. dollar as their functional currency because Ciena, as the U.S. parent entity, exclusively funds the operations of these branch offices and subsidiaries. For those subsidiaries using the local currency as their functional currency, assets and liabilities are translated at exchange rates in effect at the balance sheet date, and the statement of operations is translated at a monthly average rate. Resulting translation adjustments are recorded directly to a separate component of stockholders' equity. Where the monetary assets and liabilities are transacted in a currency other than the entity's functional currency, re-measurement adjustments are recorded in interest and other income (loss), net on the Consolidated Statement of Operations. See Note
4
below.
Derivatives
Ciena's
4.0%
convertible senior notes due March 15, 2015 (the "2015 Notes") matured during the second quarter of fiscal 2015. The 2015 Notes included a redemption feature accounted for as a separate embedded derivative that expired when the 2015 notes matured. Until maturity of the 2015 Notes, the embedded redemption feature was recorded at fair value on a recurring basis, and these changes were included in interest and other income (loss), net on the Consolidated Statement of Operations. See Note
4
below.
From time to time, Ciena uses foreign currency forward contracts to reduce variability in certain forecasted non-U.S. dollar denominated cash flows. Generally, these derivatives have maturities of
12 months
or less. During fiscal 2014, Ciena also entered into interest rate hedge arrangements to reduce variability in certain forecasted interest expense associated with its Term Loan. All of these derivatives are designated as cash flow hedges. At the inception of the cash flow hedge, and on an ongoing basis, Ciena assesses whether the derivative has been effective in offsetting changes in cash flows attributable to the hedged risk during the hedging period. The effective portion of the derivative's net gain or loss is initially reported as a component of accumulated other comprehensive income (loss), and upon occurrence of the forecasted transaction, is subsequently reclassified to the line item in the Consolidated Statement of Operations to which the hedged transaction relates. Any net gain or loss associated with the ineffectiveness of the hedging instrument is reported in interest and other income (loss), net. To date, no ineffectiveness has occurred.
From time to time, Ciena uses foreign currency forward contracts to hedge certain balance sheet exposures. These forward contracts are not designated as hedges for accounting purposes, and any net gain or loss associated with these derivatives is reported in interest and other income (loss), net on the Consolidated Statement of Operations.
Ciena records derivative instruments in the Consolidated Statements of Cash Flows within operating, investing, or financing activities consistent with the cash flows of the hedged items.
See Notes
6
and
13
below.
Computation of Net Income (Loss) per Share
Ciena calculates basic earnings per share ("EPS") by dividing earnings attributable to common stock by the weighted-average number of common shares outstanding for the period. Diluted EPS includes other potential dilutive shares that would be outstanding if securities or other contracts to issue common stock were exercised or converted into common stock. Ciena uses a dual presentation of basic and diluted EPS on the face of its income statement. A reconciliation of the numerator and denominator used for the basic and diluted EPS computations is set forth in Note
17
below.
Software Development Costs
81
Ciena develops software for sale to its customers. GAAP requires the capitalization of certain software development costs that are incurred subsequent to the date technological feasibility is established and prior to the date the product is generally available for sale. The capitalized cost is then amortized straight-line over the estimated life of the product. Ciena defines technological feasibility as being attained at the time a working model is completed. To date, the period between Ciena achieving technological feasibility and the general availability of such software has been short, and software development costs qualifying for capitalization have been insignificant. Accordingly, Ciena has not capitalized any software development costs.
Newly Issued Accounting Standards -Effective
In November 2015, Financial Accounting Standards Board ("FASB") issued Accounting Standards Update (“ASU”) No. 2015-17 (Topic 740),
Balance Sheet Classification of Deferred Taxes
. ASU 2015-17 requires deferred tax liabilities and assets to be classified as noncurrent in the Consolidated Balance Sheet. The standard will be effective for financial statements issued for annual periods beginning after December 15, 2016, and interim periods within those annual periods. Early adoption is permitted for financial statements that have not been previously issued. The ASU may be applied either prospectively to all deferred tax liabilities and assets or retrospectively to all periods presented. Ciena adopted this ASU on a prospective basis in the fourth quarter of fiscal 2015.
Newly Issued Accounting Standards - Not Yet Effective
In May 2014, FASB issued ASU No. 2014-09,
Revenue from Contracts with Customers
(Topic 606), which provides guidance for revenue recognition. This ASU affects any entity that either enters into contracts with customers to transfer goods or services or enters into contracts for the transfer of non-financial assets. This ASU will supersede the revenue recognition requirements in Topic 605, Revenue Recognition, and most industry-specific guidance. This ASU also supersedes some cost guidance included in Subtopic 605-35, Revenue Recognition-Construction-Type and Production-Type Contracts. In August 2015, the FASB issued an amendment to defer the effective date by one year and allow entities to early adopt no earlier than the original effective date. Based on this amendment, the standard will be effective for Ciena beginning in the first quarter of fiscal 2019. Ciena is currently evaluating the impact of the adoption of this ASU on its Consolidated Financial Statements and disclosures.
In April 2015, FASB issued ASU No. 2015-03,
Simplifying the Presentation of Debt Issuance Costs
. ASU 2015-03 requires debt issuance costs related to a recognized debt liability to be presented in the balance sheet as a direct deduction from the carrying value of that debt liability, consistent with debt discounts. The guidance is effective retrospectively for fiscal years, and interim periods within those years, and will be effective for Ciena beginning in the first quarter of fiscal 2017. Early adoption is permitted for financial statements that have not been previously issued. Ciena does not expect that the impact of adopting this guidance will be material to its Consolidated Financial Statements or disclosures.
(2) BUSINESS COMBINATIONS
On
August 3, 2015
, Ciena acquired Cyan, Inc. (“Cyan”), a leading provider of SDN, NFV and metro packet-optical solutions, in a cash and stock transaction. Subject to the terms and conditions of the merger agreement, at closing each outstanding Cyan share was exchanged for
0.19936
shares of Ciena common stock and
$0.63
in cash, resulting in an exchange of all of the outstanding shares of Cyan common stock for approximately
$33.6 million
in cash and
10.6 million
shares of Ciena common stock. Ciena assumed all the then-outstanding Cyan unvested restricted stock unit awards and stock options and substituted for them approximately
1.0 million
Ciena restricted stock unit awards and stock options exercisable for approximately
2.4 million
shares of Ciena common stock.
Upon the closing of the acquisition, Ciena assumed Cyan’s
$50.0 million
in outstanding principal amount of
8.0%
Convertible Senior Secured Notes due 2019 (the "2019 Notes"). Under the terms of the indenture governing the 2019 notes, following the closing of the acquisition, the note holders were given the right to convert the 2019 Notes at an increased conversion rate of approximately
91.79
shares of Ciena common stock and
$290.08
in cash for each $1,000 principal amount of 2019 Notes surrendered for conversion. Subsequently, during the fourth quarter of fiscal 2015, holders representing all of the outstanding aggregate principal amount of the 2019 Notes surrendered their 2019 notes for conversion and, accordingly, there are
no
remaining 2019 Notes outstanding. In satisfaction of such conversions, Ciena issued approximately
4.6 million
shares of Ciena common stock and paid
$14.5 million
in cash.
During fiscal 2015, Ciena incurred approximately
$25.5 million
of acquisition-related costs associated with this transaction. These costs and expenses include fees associated with financial, legal and accounting advisors, facilities and systems consolidation costs, and severance and other employment-related costs, including payments to certain former Cyan executives and approximately
$7.6 million
of non-cash share-based compensation expense.
82
The following table summarizes the purchase price for the acquisition (in thousands):
|
Amount
|
|||
|
Cash
|
$
|
33,621
|
|
|
Value of common stock issued
|
270,113
|
|
|
|
Fair value of vested stock awards
|
32,001
|
|
|
|
Total purchase price
|
$
|
335,735
|
|
The fair value of Ciena's common stock issued in the acquisition was based on Ciena's opening stock price on August 3, 2015. The fair value of replacement vested stock options was determined using the Black-Scholes option-pricing model.
The following table summarizes the final allocation related to Cyan based on the estimated fair value of the acquired assets and assumed liabilities (in thousands):
|
Amount
|
|||
|
Cash and cash equivalents
|
$
|
60,831
|
|
|
Restricted cash
|
10,001
|
|
|
|
Accounts receivable
|
23,891
|
|
|
|
Inventory
|
12,849
|
|
|
|
Prepaid expenses and other
|
3,502
|
|
|
|
Equipment, furniture and fixtures
|
7,962
|
|
|
|
Goodwill
|
256,434
|
|
|
|
Customer relationships
|
36,323
|
|
|
|
Trademarks
|
3,432
|
|
|
|
Developed technology
|
88,814
|
|
|
|
Order backlog
|
25,293
|
|
|
|
Other long-term assets
|
789
|
|
|
|
Accounts payable
|
(30,856
|
)
|
|
|
Accrued liabilities
|
(15,887
|
)
|
|
|
Deferred revenue
|
(16,643
|
)
|
|
|
Long-term debt
|
(48,836
|
)
|
|
|
Additional paid-in capital related to equity component of long-term debt
|
(82,164
|
)
|
|
|
Total purchase consideration
|
$
|
335,735
|
|
Under purchase accounting rules, Ciena valued the acquired finished goods inventory to fair value, which is defined as the estimated selling price less the sum of (a) costs of disposal, and (b) a reasonable profit allowance for Ciena’s selling effort. This valuation resulted in an increase in inventory carrying value of approximately
$3.1 million
for marketable inventory.
Customer relationships and contracts represent agreements with existing Cyan customers and have estimated useful lives of
4
years to
7
years. The majority of the order backlog, which is amortized over the fulfillment period, was fulfilled during the fourth quarter of fiscal 2015.
Developed technology represents purchased technology that had reached technological feasibility and for which Cyan had substantially completed development as of the date of acquisition. Fair value was determined using future discounted cash flows related to the projected income stream of the developed technology for a discrete projection period. Cash flows were discounted to their present value as of the closing date. Developed technology is amortized on a straight line basis over its estimated useful lives of
5
years to
7
years.
83
The goodwill generated from the acquisition of Cyan was primarily related to expected synergies. The amount of goodwill allocated to the Converged Packet Optical segment and the Software and Services segment was
$55.0 million
and
$201.4 million
, respectively. The goodwill is not deductible for income tax purposes.
The following unaudited pro forma financial information summarizes the results of operations for the periods indicated as if Ciena’s acquisition of Cyan had been completed as of the beginning of the earliest period. Revenue attributable to Cyan since the August 3, 2015 acquisition date was
$84.4 million
. As Ciena has begun to integrate the combined operations, eliminating overlapping processes and expenses and integrating its products and sales efforts with those of Cyan, it is impractical to determine the earnings specific to Cyan since the acquisition date. These unaudited pro forma amounts (in thousands) do not purport to be indicative of the results that would have actually been obtained if the acquisition occurred as of the beginning of the periods presented, or that may be obtained in the future.
|
Fiscal Year
|
|||||||
|
2014
|
2015
|
||||||
|
Pro forma revenue
|
$
|
2,388,772
|
|
$
|
2,565,081
|
|
|
|
Pro forma net income (loss)
|
$
|
(168,041
|
)
|
$
|
16,286
|
|
|
The pro forma earnings were adjusted to exclude
$25.5 million
in acquisition-related costs and
$3.1 million
of nonrecurring expense related to the fair value adjustment to acquisition-date inventory incurred in fiscal 2015. Fiscal 2014 pro forma earnings were adjusted to include these amounts.
Additionally, pro forma earnings were adjusted to (i) exclude the mark to market changes in the fair value of Cyan's warrants, as they were automatically exercised on a cashless basis immediately prior to the effective time of the merger and (ii) exclude the fair value of bifurcated conversion features in Cyan's convertible notes, as these features were no longer bifurcated upon the consummation of the merger. The total amounts of these adjustments were
$4.7 million
and
$60.6 million
in fiscal 2014 and 2015, respectively.
(3) RESTRUCTURING COSTS
Ciena has undertaken a number of restructuring activities intended to reduce expense and better align its workforce and costs with market opportunities, product development and business strategies. The following table sets forth the restructuring activity and balance of the restructuring liability accounts for the fiscal years indicated (in thousands):
|
Workforce
reduction
|
Consolidation
of excess
facilities
|
Total
|
|||||||||
|
Balance at October 31, 2012
|
$
|
1,449
|
|
|
$
|
3,600
|
|
|
$
|
5,049
|
|
|
Additional liability recorded
|
5,041
|
|
(a)
|
2,128
|
|
(a)
|
7,169
|
|
|||
|
Non-cash disposal
|
—
|
|
(747
|
)
|
(747
|
)
|
|||||
|
Cash payments
|
(6,410
|
)
|
(3,045
|
)
|
(9,455
|
)
|
|||||
|
Balance at October 31, 2013
|
80
|
|
|
1,936
|
|
|
2,016
|
|
|||
|
Additional liability recorded
|
685
|
|
(b)
|
9
|
|
694
|
|
||||
|
Adjustment to previous estimates
|
—
|
|
|
(345
|
)
|
(345
|
)
|
||||
|
Cash payments
|
(584
|
)
|
(466
|
)
|
(1,050
|
)
|
|||||
|
Balance at October 31, 2014
|
181
|
|
|
1,134
|
|
|
1,315
|
|
|||
|
Additional liability recorded
|
8,631
|
|
(c)
|
(5
|
)
|
8,626
|
|
||||
|
Cash payments
|
(8,221
|
)
|
(441
|
)
|
(8,662
|
)
|
|||||
|
Balance at October 31, 2015
|
$
|
591
|
|
|
$
|
688
|
|
|
$
|
1,279
|
|
|
Current restructuring liabilities
|
$
|
591
|
|
|
$
|
362
|
|
|
$
|
953
|
|
|
Non-current restructuring liabilities
|
$
|
—
|
|
|
$
|
326
|
|
|
$
|
326
|
|
_________________________________
84
|
(a)
|
During fiscal 2013, Ciena recorded a charge of
$5.0 million
of severance and other employee-related costs associated with a workforce reduction of approximately
100
employees. Ciena also recorded charges of
$2.1 million
related to its consolidation of several facilities primarily in the Linthicum, Maryland area.
|
|
(b)
|
During fiscal 2014, Ciena recorded a charge of
$0.7 million
of severance and other employee-related costs associated with a workforce reduction of approximately
25
employees.
|
|
(c)
|
During fiscal 2015, Ciena recorded a charge of
$8.6 million
of severance and other employee-related costs associated with a global workforce reduction of approximately
125
employees.
|
(4) INTEREST AND OTHER INCOME (LOSS), NET
The components of interest and other income (loss), net, were as follow (in thousands):
|
October 31,
|
||||||||||||
|
2013
|
2014
|
2015
|
||||||||||
|
Interest income
|
$
|
550
|
|
$
|
407
|
|
$
|
1,178
|
|
|||
|
Change in fair value of embedded derivative
|
2,950
|
|
(2,740
|
)
|
—
|
|
||||||
|
Gain (loss) on non-hedge designated foreign currency forward contracts
|
296
|
|
(5,757
|
)
|
23,243
|
|
||||||
|
Foreign currency exchange losses
|
(8,168
|
)
|
(15,663
|
)
|
(47,607
|
)
|
||||||
|
Other
|
(1,372
|
)
|
(1,509
|
)
|
(2,319
|
)
|
||||||
|
Interest and other income (loss), net
|
$
|
(5,744
|
)
|
$
|
(25,262
|
)
|
$
|
(25,505
|
)
|
|||
Ciena Corporation, as the U.S. parent entity, uses the U.S. dollar as its functional currency; however, some of its foreign branch offices and subsidiaries use the local currency as their functional currency. During
fiscal 2013
,
fiscal 2014
and
fiscal 2015
, Ciena recorded
$8.2 million
,
$15.7 million
and
$47.6 million
in foreign currency exchange losses, respectively, as a result of monetary assets and liabilities that were transacted in a currency other than the entity's functional currency, and the re-measurement adjustments were recorded in interest and other income (loss), net on the Consolidated Statement of Operations. From time to time, Ciena uses foreign currency forwards to hedge these balance sheet exposures. These forwards are not designated as hedges for accounting purposes and any net gain or loss associated with these derivatives is reported in interest and other income (loss), net. During fiscal 2014 Ciena recorded losses of
$5.8 million
from non-hedge designated foreign currency forward contracts. During fiscal
2015
, Ciena recorded gains of
$23.2 million
from non-hedge designated foreign currency forward contracts.
(5) SHORT-TERM AND LONG-TERM INVESTMENTS
As of
October 31, 2014
, investments are comprised of the following (in thousands):
|
|
October 31, 2014
|
||||||||||||||
|
Amortized Cost
|
Gross Unrealized
Gains |
Gross Unrealized
Losses |
Estimated Fair
Value |
||||||||||||
|
U.S. government obligations:
|
|||||||||||||||
|
Included in short-term investments
|
$
|
110,182
|
|
$
|
29
|
|
$
|
—
|
|
$
|
110,211
|
|
|||
|
Included in long-term investments
|
50,016
|
|
41
|
|
—
|
|
50,057
|
|
|||||||
|
$
|
160,198
|
|
$
|
70
|
|
$
|
—
|
|
$
|
160,268
|
|
||||
|
Commercial paper:
|
|||||||||||||||
|
Included in short-term investments
|
$
|
29,994
|
|
$
|
—
|
|
$
|
—
|
|
$
|
29,994
|
|
|||
|
$
|
29,994
|
|
$
|
—
|
|
$
|
—
|
|
$
|
29,994
|
|
||||
As of
October 31, 2015
, investments are comprised of the following (in thousands):
85
|
|
October 31, 2015
|
||||||||||||||
|
Amortized Cost
|
Gross Unrealized
Gains
|
Gross Unrealized
Losses
|
Estimated Fair
Value
|
||||||||||||
|
U.S. government obligations:
|
|||||||||||||||
|
Included in short-term investments
|
$
|
110,108
|
|
$
|
10
|
|
$
|
—
|
|
$
|
110,118
|
|
|||
|
Included in long-term investments
|
95,171
|
|
—
|
|
(66
|
)
|
95,105
|
|
|||||||
|
$
|
205,279
|
|
$
|
10
|
|
$
|
(66
|
)
|
$
|
205,223
|
|
||||
|
Commercial paper:
|
|||||||||||||||
|
Included in short-term investments
|
$
|
24,989
|
|
$
|
—
|
|
$
|
—
|
|
$
|
24,989
|
|
|||
|
$
|
24,989
|
|
$
|
—
|
|
$
|
—
|
|
$
|
24,989
|
|
||||
The following table summarizes the legal maturities of debt investments at
October 31, 2015
:
|
|
October 31, 2015
|
||||||
|
Amortized Cost
|
Estimated Fair
Value |
||||||
|
Less than one year
|
$
|
135,097
|
|
$
|
135,107
|
|
|
|
Due in 1-2 years
|
95,171
|
|
95,105
|
|
|||
|
$
|
230,268
|
|
$
|
230,212
|
|
||
(6) FAIR VALUE MEASUREMENTS
As of the dates indicated, the following tables summarizes the fair value of assets and liabilities that were recorded at fair value on a recurring basis (in thousands):
|
|
October 31, 2014
|
||||||||||||||
|
|
Level 1
|
Level 2
|
Level 3
|
Total
|
|||||||||||
|
Assets:
|
|
|
|
|
|||||||||||
|
Money market funds
|
$
|
440,013
|
|
$
|
—
|
|
$
|
—
|
|
$
|
440,013
|
|
|||
|
U.S. government obligations
|
—
|
|
160,268
|
|
—
|
|
160,268
|
|
|||||||
|
Commercial paper
|
—
|
|
89,989
|
|
—
|
|
89,989
|
|
|||||||
|
Foreign currency forward contracts
|
—
|
|
1,561
|
|
—
|
|
1,561
|
|
|||||||
|
Total assets measured at fair value
|
$
|
440,013
|
|
$
|
251,818
|
|
$
|
—
|
|
$
|
691,831
|
|
|||
|
Liabilities:
|
|||||||||||||||
|
Foreign currency forward contracts
|
$
|
—
|
|
$
|
200
|
|
$
|
—
|
|
$
|
200
|
|
|||
|
Forward starting interest rate swap
|
—
|
|
2,083
|
|
—
|
|
2,083
|
|
|||||||
|
Total liabilities measured at fair value
|
$
|
—
|
|
$
|
2,283
|
|
$
|
—
|
|
$
|
2,283
|
|
|||
86
|
|
October 31, 2015
|
||||||||||||||
|
|
Level 1
|
Level 2
|
Level 3
|
Total
|
|||||||||||
|
Assets:
|
|
|
|
|
|||||||||||
|
Money market funds
|
$
|
642,073
|
|
$
|
—
|
|
$
|
—
|
|
$
|
642,073
|
|
|||
|
U.S. government obligations
|
—
|
|
205,223
|
|
—
|
|
205,223
|
|
|||||||
|
Commercial paper
|
—
|
|
74,983
|
|
—
|
|
74,983
|
|
|||||||
|
Foreign currency forward contracts
|
—
|
|
89
|
|
—
|
|
89
|
|
|||||||
|
Total assets measured at fair value
|
$
|
642,073
|
|
$
|
280,295
|
|
$
|
—
|
|
$
|
922,368
|
|
|||
|
Liabilities:
|
|||||||||||||||
|
Foreign currency forward contracts
|
$
|
—
|
|
$
|
512
|
|
$
|
—
|
|
$
|
512
|
|
|||
|
Forward starting interest rate swap
|
—
|
|
5,522
|
|
—
|
|
5,522
|
|
|||||||
|
Total liabilities measured at fair value
|
$
|
—
|
|
$
|
6,034
|
|
$
|
—
|
|
$
|
6,034
|
|
|||
As of the dates indicated, the assets and liabilities above were presented on Ciena’s Consolidated Balance Sheet as follows (in thousands):
|
|
October 31, 2014
|
||||||||||||||
|
|
Level 1
|
Level 2
|
Level 3
|
Total
|
|||||||||||
|
Assets:
|
|
|
|
|
|||||||||||
|
Cash equivalents
|
$
|
440,013
|
|
$
|
59,995
|
|
$
|
—
|
|
$
|
500,008
|
|
|||
|
Short-term investments
|
—
|
|
140,205
|
|
—
|
|
140,205
|
|
|||||||
|
Prepaid expenses and other
|
—
|
|
1,561
|
|
—
|
|
1,561
|
|
|||||||
|
Long-term investments
|
—
|
|
50,057
|
|
—
|
|
50,057
|
|
|||||||
|
Total assets measured at fair value
|
$
|
440,013
|
|
$
|
251,818
|
|
$
|
—
|
|
$
|
691,831
|
|
|||
|
Liabilities:
|
|||||||||||||||
|
Accrued liabilities
|
$
|
—
|
|
$
|
200
|
|
$
|
—
|
|
$
|
200
|
|
|||
|
Other long-term obligations
|
—
|
|
2,083
|
|
—
|
|
2,083
|
|
|||||||
|
Total liabilities measured at fair value
|
$
|
—
|
|
$
|
2,283
|
|
$
|
—
|
|
$
|
2,283
|
|
|||
|
|
October 31, 2015
|
||||||||||||||
|
|
Level 1
|
Level 2
|
Level 3
|
Total
|
|||||||||||
|
Assets:
|
|
|
|
|
|||||||||||
|
Cash equivalents
|
$
|
642,073
|
|
$
|
49,994
|
|
$
|
—
|
|
$
|
692,067
|
|
|||
|
Short-term investments
|
—
|
|
135,107
|
|
—
|
|
135,107
|
|
|||||||
|
Prepaid expenses and other
|
—
|
|
89
|
|
—
|
|
89
|
|
|||||||
|
Long-term investments
|
—
|
|
95,105
|
|
—
|
|
95,105
|
|
|||||||
|
Total assets measured at fair value
|
$
|
642,073
|
|
$
|
280,295
|
|
$
|
—
|
|
$
|
922,368
|
|
|||
|
Liabilities:
|
|||||||||||||||
|
Accrued liabilities
|
$
|
—
|
|
$
|
512
|
|
$
|
—
|
|
$
|
512
|
|
|||
|
Other long-term obligations
|
—
|
|
5,522
|
|
—
|
|
5,522
|
|
|||||||
|
Total liabilities measured at fair value
|
$
|
—
|
|
$
|
6,034
|
|
$
|
—
|
|
$
|
6,034
|
|
|||
Ciena did not have any transfers between Level 1 and Level 2 fair value measurements during the periods presented.
87
(7) ACCOUNTS RECEIVABLE
As of
October 31, 2014
, there were
no
customers that accounted for greater than
10%
of net accounts receivable. As of
October 31, 2015
, there was
one
customer that accounted for
10.4%
of net accounts receivable. Ciena has not historically experienced a significant amount of bad debt expense. The following table summarizes the activity in Ciena’s allowance for doubtful accounts for the fiscal years indicated (in thousands):
|
Year ended
|
Beginning
|
Net
|
Ending
|
|||||||||||||
|
October 31,
|
Balance
|
Provisions
|
Deductions
|
Balance
|
||||||||||||
|
2013
|
$
|
1,500
|
|
$
|
2,339
|
|
$
|
1,884
|
|
$
|
1,955
|
|
||||
|
2014
|
$
|
1,955
|
|
$
|
2,761
|
|
$
|
2,633
|
|
$
|
2,083
|
|
||||
|
2015
|
$
|
2,083
|
|
$
|
1,576
|
|
$
|
696
|
|
$
|
2,963
|
|
||||
(8) INVENTORIES
As of the dates indicated, inventories are comprised of the following (in thousands):
|
|
October 31,
|
||||||
|
|
2014
|
2015
|
|||||
|
Raw materials
|
$
|
64,853
|
|
$
|
53,082
|
|
|
|
Work-in-process
|
8,371
|
|
9,120
|
|
|||
|
Finished goods
|
165,799
|
|
125,966
|
|
|||
|
Deferred cost of goods sold
|
75,763
|
|
55,995
|
|
|||
|
|
314,786
|
|
244,163
|
|
|||
|
Provision for excess and obsolescence
|
(60,126
|
)
|
(53,001
|
)
|
|||
|
|
$
|
254,660
|
|
$
|
191,162
|
|
|
Ciena writes down its inventory for estimated obsolescence or unmarketable inventory by an amount equal to the difference between the cost of inventory and the estimated net realizable value based on assumptions about future demand and market conditions. During
fiscal 2013
and fiscal
2014
, Ciena recorded a provision for inventory reserves that were primarily related to engineering design changes and the discontinuance of certain parts and components used in the manufacture of our Optical Transport products, including our Corestream® Agility Optical Transport platform and Converged Packet Optical products. During
fiscal 2015
, Ciena recorded a provision for excess and obsolescence of
$26.8 million
, primarily related to the discontinuance of certain parts and components used in the manufacture of its Converged Packet Optical products and a decrease in the forecasted demand for both its legacy, stand-alone WDM and SONET/SDH-based transport platforms and its 5410 Service Aggregation Switch. Deductions from the provision for excess and obsolete inventory relate to disposal activities.
The following table summarizes the activity in Ciena’s reserve for excess and obsolete inventory for the fiscal years indicated (in thousands):
|
Year ended
|
Beginning
|
|
|
Ending
|
||||||||||||
|
October 31,
|
Balance
|
Provisions
|
Disposals
|
Balance
|
||||||||||||
|
2013
|
$
|
40,010
|
|
$
|
19,938
|
|
$
|
18,385
|
|
$
|
41,563
|
|
||||
|
2014
|
$
|
41,563
|
|
$
|
32,332
|
|
$
|
13,769
|
|
$
|
60,126
|
|
||||
|
2015
|
$
|
60,126
|
|
$
|
26,846
|
|
$
|
33,971
|
|
$
|
53,001
|
|
||||
(9) PREPAID EXPENSES AND OTHER
As of the dates indicated, prepaid expenses and other are comprised of the following (in thousands):
88
|
|
October 31,
|
||||||
|
|
2014
|
2015
|
|||||
|
Prepaid VAT and other taxes
|
$
|
86,464
|
|
$
|
74,754
|
|
|
|
Product demonstration equipment, net
|
42,385
|
|
41,611
|
|
|||
|
Deferred deployment expense
|
27,991
|
|
26,193
|
|
|||
|
Prepaid expenses
|
23,539
|
|
25,074
|
|
|||
|
Financing receivable
|
—
|
|
19,869
|
|
|||
|
Other non-trade receivables
|
10,683
|
|
8,588
|
|
|||
|
Derivative assets
|
1,562
|
|
89
|
|
|||
|
|
$
|
192,624
|
|
$
|
196,178
|
|
|
Depreciation of product demonstration equipment was
$7.4 million
,
$9.0 million
and
$9.8 million
for fiscal
2013
,
2014
and
2015
, respectively.
(10) EQUIPMENT, BUILDING, FURNITURE AND FIXTURES
As of the dates indicated, equipment, building, furniture and fixtures are comprised of the following (in thousands):
|
|
October 31,
|
||||||
|
|
2014
|
2015
|
|||||
|
Equipment, furniture and fixtures
|
$
|
383,059
|
|
$
|
404,935
|
|
|
|
Building subject to capital lease
|
—
|
|
13,459
|
|
|||
|
Construction in progress, subject to build-to-suit lease
|
—
|
|
18,663
|
|
|||
|
Leasehold improvements
|
46,354
|
|
49,196
|
|
|||
|
|
429,413
|
|
486,253
|
|
|||
|
Accumulated depreciation and amortization
|
(302,781
|
)
|
(294,280
|
)
|
|||
|
|
$
|
126,632
|
|
$
|
191,973
|
|
|
On October 23, 2014, Ciena entered into a lease agreement to lease an office building located in Ottawa, Canada. During fiscal 2015, Ciena gained access to a portion of the building and recorded a capital lease asset and liability.
Ciena capitalizes construction in progress and records a corresponding long-term liability for build-to-suit lease agreements where Ciena is considered the owner, for accounting purposes, during the construction period. On April 15, 2015, Ciena entered into a build-to-suit lease arrangement pursuant to which the landlord will construct, and Ciena will subsequently lease,
two
new office buildings at its new Ottawa, Canada campus. The landlord will construct the buildings and contribute up to a maximum of CAD
$290.00
per rentable square foot in total construction costs plus certain allowances for tenant improvements, and Ciena will be responsible for any additional construction costs. This arrangement qualifies as a capital lease. As a result, the facilities will be depreciated over the lease term.
During fiscal
2013
, fiscal
2014
and fiscal
2015
, Ciena recorded depreciation of equipment, furniture and fixtures, and amortization of leasehold improvements of
$48.3 million
,
$46.6 million
and
$46.1 million
, respectively.
(11) INTANGIBLE ASSETS
As of the dates indicated, intangible assets are comprised of the following (in thousands):
89
|
|
October 31,
|
||||||||||||||||||||||
|
|
2014
|
2015
|
|||||||||||||||||||||
|
Gross
Intangible
|
Accumulated
Amortization
|
Net
Intangible
|
Gross
Intangible
|
Accumulated
Amortization
|
Net
Intangible
|
||||||||||||||||||
|
Developed technology
|
$
|
417,833
|
|
$
|
(351,929
|
)
|
$
|
65,904
|
|
$
|
506,647
|
|
$
|
(382,130
|
)
|
$
|
124,517
|
|
|||||
|
Patents and licenses
|
46,538
|
|
(45,908
|
)
|
630
|
|
46,538
|
|
(46,072
|
)
|
466
|
|
|||||||||||
|
Customer relationships, covenants not to compete, outstanding purchase orders and contracts
|
323,573
|
|
(261,430
|
)
|
62,143
|
|
388,621
|
|
(310,931
|
)
|
77,690
|
|
|||||||||||
|
Total intangible assets
|
$
|
787,944
|
|
$
|
(659,267
|
)
|
$
|
128,677
|
|
$
|
941,806
|
|
$
|
(739,133
|
)
|
$
|
202,673
|
|
|||||
The aggregate amortization expense of intangible assets was
$71.3 million
,
$57.2 million
and
$79.9 million
for fiscal
2013
, fiscal
2014
and fiscal
2015
, respectively. Expected future amortization of intangible assets for the fiscal years indicated is as follows (in thousands):
|
Year Ended October 31,
|
|
||
|
2016
|
$
|
75,627
|
|
|
2017
|
41,773
|
|
|
|
2018
|
19,092
|
|
|
|
2019
|
18,545
|
|
|
|
2020
|
17,518
|
|
|
|
Thereafter
|
30,118
|
|
|
|
|
$
|
202,673
|
|
(12) OTHER BALANCE SHEET DETAILS
As of the dates indicated, other long-term assets are comprised of the following (in thousands):
|
|
October 31,
|
||||||
|
|
2014
|
2015
|
|||||
|
Maintenance spares inventory, net
|
$
|
54,101
|
|
$
|
55,259
|
|
|
|
Deferred debt issuance costs, net
|
15,160
|
|
10,820
|
|
|||
|
Financing receivable
|
—
|
|
10,107
|
|
|||
|
Other
|
4,815
|
|
8,470
|
|
|||
|
|
$
|
74,076
|
|
$
|
84,656
|
|
|
Deferred debt issuance costs relate to Ciena's convertible notes payable (described in Note 15 below), Term Loan (described in Note 15 below) and ABL Credit Facility (described in Note 16 below). Deferred debt issuance costs are amortized using the straight-line method, which approximates the effect of the effective interest rate method, through the maturity of the related debt. The amortization of deferred debt issuance costs is included in interest expense, and was
$5.4 million
,
$4.8 million
and
$4.7 million
for fiscal
2013
, fiscal
2014
and fiscal
2015
, respectively.
As of the dates indicated, accrued liabilities and other short-term obligations are comprised of the following (in thousands):
90
|
|
October 31,
|
||||||
|
|
2014
|
2015
|
|||||
|
Compensation, payroll related tax and benefits
|
$
|
82,207
|
|
$
|
109,466
|
|
|
|
Warranty
|
55,997
|
|
56,654
|
|
|||
|
Vacation
|
35,126
|
|
34,189
|
|
|||
|
Capital lease obligations
|
7,788
|
|
4,923
|
|
|||
|
Interest payable
|
6,409
|
|
5,389
|
|
|||
|
Other
|
89,081
|
|
105,662
|
|
|||
|
|
$
|
276,608
|
|
$
|
316,283
|
|
|
The following table summarizes the activity in Ciena’s accrued warranty for the fiscal years indicated (in thousands):
|
Year ended
|
Beginning
|
|
|
|
Ending
|
|||||||||||||||
|
October 31,
|
Balance
|
Acquired
|
Provisions
|
Settlements
|
Balance
|
|||||||||||||||
|
2013
|
$
|
55,132
|
|
$
|
—
|
|
$
|
24,558
|
|
$
|
23,387
|
|
$
|
56,303
|
|
|||||
|
2014
|
$
|
56,303
|
|
$
|
—
|
|
$
|
22,129
|
|
$
|
22,435
|
|
$
|
55,997
|
|
|||||
|
2015
|
$
|
55,997
|
|
$
|
2,996
|
|
$
|
17,881
|
|
$
|
20,220
|
|
$
|
56,654
|
|
|||||
The decreases in fiscal 2013, fiscal 2014 and fiscal 2015 warranty provisions were primarily due to lower failure rates and reduced costs due to efficiencies.
As of the dates indicated, deferred revenue is comprised of the following (in thousands):
|
|
October 31,
|
||||||
|
|
2014
|
2015
|
|||||
|
Products
|
$
|
50,457
|
|
$
|
66,527
|
|
|
|
Services
|
95,161
|
|
122,546
|
|
|||
|
|
145,618
|
|
189,073
|
|
|||
|
Less current portion
|
(104,688
|
)
|
(126,111
|
)
|
|||
|
Long-term deferred revenue
|
$
|
40,930
|
|
$
|
62,962
|
|
|
As of the dates indicated, other long-term obligations are comprised of the following (in thousands):
|
October 31,
|
|||||||
|
2014
|
2015
|
||||||
|
Income tax liability
|
$
|
14,342
|
|
$
|
13,308
|
|
|
|
Deferred tenant allowance
|
10,839
|
|
9,807
|
|
|||
|
Straight-line rent
|
5,174
|
|
6,237
|
|
|||
|
Capital lease obligations
|
4,589
|
|
13,794
|
|
|||
|
Construction liability
|
—
|
|
18,663
|
|
|||
|
Forward starting interest rate swap
|
2,083
|
|
5,522
|
|
|||
|
Other
|
8,363
|
|
5,209
|
|
|||
|
$
|
45,390
|
|
$
|
72,540
|
|
||
Ciena capitalizes construction in progress and records a corresponding long-term liability for build-to-suit lease agreements where Ciena is considered the owner during the construction period for accounting purposes.
91
The following is a schedule by fiscal years of future minimum lease payments under capital leases and the present value of minimum lease payments as of
October 31, 2015
(in thousands):
|
Period ending October 31,
|
Amount
|
||
|
2016
|
$
|
6,057
|
|
|
2017
|
1,630
|
|
|
|
2018
|
1,292
|
|
|
|
2019
|
1,292
|
|
|
|
2020
|
1,390
|
|
|
|
Thereafter
|
18,445
|
|
|
|
Net minimum capital lease payments
|
30,106
|
|
|
|
Less: Amount representing interest
|
(11,389
|
)
|
|
|
Present value of minimum lease payments
|
18,717
|
|
|
|
Less: Current portion of present value of minimum lease payments
|
(4,923
|
)
|
|
|
Long-term portion of present value of minimum lease payments
|
$
|
13,794
|
|
|
(13)
|
DERIVATIVE INSTRUMENTS
|
Foreign Currency Derivatives
As of
October 31, 2015
and 2014, Ciena had forward contracts to reduce the variability in its Canadian Dollar and Indian Rupee denominated expense, which principally relates to research and development activities. The notional amount of these contracts was approximately
$68.1 million
and
$51.5 million
as of
October 31, 2015
and
October 31, 2014
, respectively. These foreign exchange contracts have maturities of
12
months or less and have been designated as cash flow hedges.
During
fiscal 2015
and fiscal 2014, in order to hedge certain balance sheet exposures, Ciena entered into forward contracts to sell Brazilian Real and buy an equivalent U.S. Dollar amount. During fiscal 2015 and fiscal 2014, in order to hedge certain balance sheet exposures, Ciena entered into forward contracts to sell U.S. Dollars and buy an equivalent amount of Canadian Dollars. The notional principal of these contracts was approximately
$146.5 million
and
$194.5 million
as of
October 31, 2015
and
October 31, 2014
. These foreign exchange contracts have maturities of
12
months or less. These derivative contracts have not been designated as hedges.
Interest Rate Derivatives
During fiscal 2014 Ciena entered into interest rate cap arrangements to limit interest paid under the Term Loan to a maximum of
0.75%
plus a spread of
300
basis points through July 2015. The interest rate caps expired in July 2015. Also in fiscal 2014, Ciena entered into floating interest rate to fixed interest rate swap arrangements ("interest rate swap") that fix the interest rate under the Term Loan at
5.004%
, for the period commencing on July 20, 2015 through July 19, 2018. The total notional amount of these derivatives as of
October 31, 2015
and October 31, 2014 was
$246.9 million
and
$247.5 million
, respectively.
Ciena expects the variable rate payments to be received under the terms of the interest rate swap to exactly offset the forecasted variable rate payments on the equivalent notional amounts of the Term Loan. These derivative contracts have been designated as cash flow hedges.
Other information regarding Ciena's derivatives is immaterial for separate financial statement presentation. See Note
4
and Note
6
above.
(14) ACCUMULATED OTHER COMPREHENSIVE INCOME
The following table summarizes the changes
in accumulated balances of other comprehensive income (AOCI):
92
|
Unrealized Gain/(Loss) on Marketable Securities
|
Unrealized Gain/(Loss) on Foreign Currency Forward Contracts
|
Unrealized Gain/(Loss) on Forward Starting Interest Rate Swap
|
Cumulative Foreign Currency Translation Adjustment
|
Total
|
||||||||||||||||
|
Balance at October 31, 2012
|
$
|
44
|
|
$
|
49
|
|
$
|
—
|
|
$
|
(3,447
|
)
|
$
|
(3,354
|
)
|
|||||
|
Other comprehensive loss before reclassifications
|
(14
|
)
|
(1,431
|
)
|
—
|
|
(4,096
|
)
|
(5,541
|
)
|
||||||||||
|
Amounts reclassified from AOCI
|
—
|
|
1,121
|
|
—
|
|
—
|
|
1,121
|
|
||||||||||
|
Balance at October 31, 2013
|
30
|
|
(261
|
)
|
—
|
|
(7,543
|
)
|
(7,774
|
)
|
||||||||||
|
Other comprehensive loss before reclassifications
|
41
|
|
(1,265
|
)
|
(2,083
|
)
|
(4,940
|
)
|
(8,247
|
)
|
||||||||||
|
Amounts reclassified from AOCI
|
—
|
|
1,353
|
|
—
|
|
—
|
|
1,353
|
|
||||||||||
|
Balance at October 31, 2014
|
71
|
|
(173
|
)
|
(2,083
|
)
|
(12,483
|
)
|
(14,668
|
)
|
||||||||||
|
Other comprehensive loss before reclassifications
|
(149
|
)
|
(5,547
|
)
|
(4,232
|
)
|
(3,775
|
)
|
(13,703
|
)
|
||||||||||
|
Amounts reclassified from AOCI
|
—
|
|
5,452
|
|
793
|
|
—
|
|
6,245
|
|
||||||||||
|
Balance at October 31, 2015
|
$
|
(78
|
)
|
$
|
(268
|
)
|
$
|
(5,522
|
)
|
$
|
(16,258
|
)
|
$
|
(22,126
|
)
|
|||||
All amounts reclassified from accumulated other comprehensive income related to settlement (gains) losses on foreign currency forward contracts designated as cash flow hedges impacted "research and development" on the Consolidated Statements of Operations. All amounts reclassified from accumulated other comprehensive income related to settlement (gains) losses on forward starting interest swaps designated as cash flow hedges impacted "interest and other income (loss), net" on the Consolidated Statements of Operations.
Term Loan
On July 15, 2014, Ciena entered into a Credit Agreement providing for a senior secured term loan in an aggregate principal amount of
$250 million
(the “Term Loan”), which bears interest at a rate equal to LIBOR (subject to a floor of
0.75%
) plus an applicable margin of
3.00%
, and matures on July 15, 2019. The Term Loan Credit Agreement requires Ciena to make quarterly installment payments in aggregate amounts equal to
0.25%
of the original principal amount of the Term Loan, or approximately
$0.6 million
, with the balance of the Term Loan payable at maturity. The Term Loan Credit Agreement requires mandatory prepayments on the occurrence of certain customary events and, when the total secured net leverage ratio (as defined in the Term Loan Credit Agreement) is in excess of
2.50
to
1.00
, the Term Loan Credit Agreement requires a mandatory prepayment of
50%
of excess annual cash flow (as defined in the Term Loan Credit Agreement).
The Term Loan Credit Agreement contains customary covenants that limit, absent lender approval, the ability of Ciena to, among other things, incur additional debt, create liens and encumbrances, pay cash dividends, enter into certain acquisition transactions or transactions with affiliates, merge, dissolve, repay certain indebtedness, change the nature of Ciena’s business, make investments or dispose of assets.
The Term Loan Credit Agreement contains customary events of default including, among other things, failure to pay obligations when due, initiation of bankruptcy or insolvency proceedings, defaults on certain other indebtedness, change of control, incurrence of certain material judgments, violation of affirmative and negative covenants, and breaches of representations and warranties set forth in the Term Loan Credit Agreement. Upon an event of default, the administrative agent may, subject to various customary cure rights, require the immediate payment of all amounts outstanding and foreclose on collateral.
In connection with Ciena entering into the Term Loan Credit Agreement, Ciena and certain of its subsidiaries entered into a guaranty, a security agreement and a pledge agreement, each on customary terms. The Term Loan is secured by (i) second-
93
priority security interests in the ABL Priority Collateral (as defined in Note
16
below), and (ii) first-priority security interests in substantially all other tangible and intangible assets including equipment, intercompany notes, intellectual property and material owned real property (the "Term Loan Priority Collateral").
The principal balance, unamortized discount and net carrying amount of the Term Loan were as follows as of
October 31, 2015
(in thousands):
|
Principal Balance
|
Unamortized Discount
|
Net Carrying Amount
|
||||||||||
|
Term Loan Payable due July 15, 2019
|
$
|
246,875
|
|
$
|
(1,076
|
)
|
$
|
245,799
|
|
|||
The following table sets forth, in thousands, the carrying value and the estimated fair value of the Term Loan:
|
October 31, 2015
|
||||||||
|
Carrying Value
|
Fair Value
(2)
|
|||||||
|
Term Loan Payable due July 15, 2019
(1)
|
$
|
245,799
|
|
$
|
247,184
|
|
||
|
(1)
|
Includes unamortized bond discount.
|
|
(2)
|
The Term Loan was categorized as Level 2 in the fair value hierarchy. Ciena estimated the fair value of its Term Loan using a market approach based upon observable inputs, such as current market transactions involving this security.
|
Outstanding Convertible Notes Payable
Ciena has
three
issuances of convertible notes payable outstanding. The notes are senior unsecured obligations of Ciena and rank equally with all of Ciena’s other existing and future senior unsecured debt. The indentures governing Ciena’s notes provide for customary events of default which include (subject in certain cases to customary grace and cure periods), among others, the following: nonpayment of principal or interest; breach of covenants or other agreements in the indenture; defaults in or failure to pay certain other indebtedness; and certain events of bankruptcy or insolvency. Generally, if an event of default occurs and is continuing, the trustee or the holders of at least
25%
in aggregate principal amount of the notes may declare the principal of, accrued interest on, and premium, if any, on all the notes immediately due and payable. Under the indentures, if Ciena undergoes a “fundamental change” (as that term is defined in the indenture governing the notes to include certain change in control transactions), holders of notes will have the right, subject to certain exemptions, to require Ciena to purchase for cash any or all of their notes at a price equal to the principal amount, plus accrued interest. If the holder elects to convert his or her notes in connection with a specified fundamental change Ciena will be required, in certain circumstances, to increase the applicable conversion rate, depending on the price paid per share for Ciena common stock and the effective date of the fundamental change transaction.
4.0%
Convertible Senior Notes, due March 15, 2015
On March 15, 2015, Ciena's outstanding
4.0%
Convertible Senior Notes due 2015 (the “2015 Notes”) matured. As a result of conversion elections made by holders of a substantial majority of the outstanding 2015 Notes under the terms of the indenture, together with certain private exchange transactions conducted by Ciena prior to maturity, approximately
$180.6
million in aggregate principal amount of 2015 Notes, representing
96.3%
of the outstanding aggregate principal amount of 2015 Notes, was settled through the issuance of Ciena common stock at or prior to maturity. In total, Ciena issued approximately
8.9 million
shares of Ciena common stock as a result of the conversion elections and private exchange transactions in respect of the 2015 Notes. Ciena repaid in cash approximately
$6.9 million
in aggregate principal amount of 2015 Notes at maturity.
0.875%
Convertible Senior Notes due June 15, 2017
On June 11, 2007, Ciena completed a public offering of
0.875%
convertible senior notes due June 15, 2017, in aggregate principal amount of
$500.0 million
. Interest is payable on June 15 and December 15 of each year, beginning on December 15, 2007.
At the election of the holder, the notes may be converted prior to maturity into shares of Ciena common stock at the initial conversion rate of
26.2154
shares per
$1,000
in principal amount, which is equivalent to an initial conversion price of approximately
$38.15
per share. The notes are not redeemable by Ciena prior to maturity.
94
Ciena used approximately
$42.5 million
of the net proceeds of this offering to purchase a call spread option on its common stock that is intended to limit exposure to potential dilution from conversion of the notes. See Note
18
below for a description of this call spread option.
During the fourth quarter of fiscal 2015, Ciena entered into certain private exchange transactions to repurchase
$5.9 million
of the notes for cash slightly below par.
3.75%
Convertible Senior Notes, due October 15, 2018
On October 18, 2010, Ciena completed a private placement of
3.75%
convertible senior notes due October 15, 2018, in aggregate principal amount of
$350.0 million
. Interest is payable on the notes on April 15 and October 15 of each year, beginning on April 15, 2011.
At the election of the holder, the notes may be converted prior to maturity into shares of Ciena common stock at the initial conversion rate of
49.5872
shares per
$1,000
in principal amount, which is equivalent to an initial conversion price of approximately
$20.17
per share.
The net proceeds from the offering were approximately
$340.4 million
after deducting the placement agents’ fees and other fees and expenses. Ciena used
$76.1 million
of the net proceeds to effect the repurchase of its
0.25%
convertible senior notes due 2013, which matured during fiscal 2013.
4.0%
Convertible Senior Notes due December 15, 2020
On December 27, 2012, Ciena issued
$187.5 million
in aggregate principal amount of
4.0%
Convertible Senior Notes due December 15, 2020 (the “2020 Notes”) in separate private offerings in exchange for
$187.5
million in aggregate principal amount of 2015 Notes above.
The 2020 Notes are senior unsecured obligations and rank equally with all of Ciena's other existing and future senior unsecured debt. The 2020 Notes pay interest from the date of issuance at a rate of
4.0%
per year. The interest is payable semi-annually on June 15 and December 15, commencing on June 15, 2013. The principal amount of the 2020 Notes will also accrete at a rate of
1.85%
per year commencing December 27, 2012, compounding on a semi-annual basis. The accreted portion of the principal payable at maturity does not bear interest and is not convertible into shares of Ciena's common stock. The 2020 Notes will mature on December 15, 2020. Consequently, in the event the 2020 Notes are converted, the accreted liability will extinguish without payment.
The 2020 Notes may be converted prior to maturity, at the option of the holder, into shares of Ciena's common stock at an initial conversion rate of
49.0557
shares of common stock per
$1,000
in original principal amount, which is equal to an initial conversion price of
$20.39
per share. In addition, Ciena may elect to convert the 2020 Notes, in whole or in part, at any time on or prior to December 15, 2020, if the daily volume weighted average price of the common stock equals or exceeds
130%
of the conversion price then in effect for at least
20
trading days in any
30
consecutive trading day period. If Ciena elects to convert the 2020 Notes on or before maturity, the conversion rate will be adjusted to include an amount of additional shares, determined by reference to a make-whole table, payable in Ciena common stock, or its cash equivalent, at Ciena's election. An aggregate of
9,197,944
shares of Ciena common stock issuable upon conversion of the 2020 Notes has been reserved for issuance.
Upon certain fundamental changes, holders of the 2020 Notes have the option to require Ciena to purchase the 2020 Notes at a price equal to the accreted principal amount of the notes delivered for repurchase plus any accrued and unpaid interest on the original principal amount. Upon a holder's election to convert the 2020 Notes in connection with certain fundamental changes, the conversion rate will be adjusted to include an amount of additional shares, determined by reference to a make-whole table, payable in Ciena common stock, or its cash equivalent, at Ciena's election.
Accounting guidance issued by the FASB requires the issuer of convertible debt instruments with cash settlement features, including partial cash settlement, to account separately for the liability and equity components of the instrument. Under this guidance, the debt is recognized at the present value of its cash flows discounted using the issuer's nonconvertible debt borrowing rate at the time of issuance and the equity component is recognized as the difference between the proceeds from the issuance of the note and the fair value of the liability. The reduced carrying value on the convertible debt results in a debt discount that is accreted back to the convertible debt's principal amount through the recognition of non-cash interest expense over the expected life of the debt, which results in recognizing the interest expense on these borrowings at effective rates approximating what Ciena would have incurred had nonconvertible debt with otherwise similar terms been issued.
Because the additional make-whole shares can be settled in cash or common stock at Ciena's option, the debt and equity components were accounted for separately. Ciena measured the fair value of the debt component of the 2020 Notes using an effective interest rate of
7.0%
. As a result, Ciena attributed
$170.4
million of the fair value of the 2020 Notes to the debt component. The debt component was netted against the face value of the 2020 Notes to determine the debt discount. The debt discount will be accreted over the period from the date of issuance to the contractual maturity date, resulting in the recognition of non-cash interest expense. In addition, Ciena recorded
$43.1 million
within additional paid-in capital representing the equity
95
component of the 2020 Notes. There was no net tax expense recorded due to Ciena’s full valuation allowance against its deferred tax assets.
The 2020 Notes were issued pursuant to an Indenture entered into as of December 27, 2012 (the “Indenture”) with The Bank of New York Mellon Trust Company, N.A., as trustee. The Indenture provides for customary events of default which include (subject in certain cases to customary grace and cure periods), among others, the following: nonpayment of principal (including accreted portion) or interest; breach of covenants or other agreements in the Indenture; defaults in failure to pay certain other indebtedness; and certain events of bankruptcy or insolvency. Generally, if an event of default occurs and is continuing under the Indenture, the trustee or the holders of at least
25%
in aggregate original principal amount of the 2020 Notes then outstanding may declare the principal (including accreted portion), premium, if any, and accrued interest on all the 2020 Notes immediately due and payable.
The principal balance, unamortized discount and net carrying value of the liability and equity components of our 2020 notes were as follows as of
October 31, 2015
|
|
Liability Component
|
Equity Component
|
|||||||||||||
|
Principal Balance
|
Unamortized Discount
|
Net Carrying Amount
|
Net Carrying Amount
|
||||||||||||
|
4.0% Convertible Senior Notes due December 15, 2020
|
$
|
197,582
|
|
$
|
(13,347
|
)
|
$
|
184,235
|
|
$
|
43,131
|
|
|||
The following table sets forth, in thousands, the carrying value and the estimated current fair value of Ciena’s outstanding convertible notes:
|
|
October 31, 2015
|
|||||||
|
Description
|
Carrying Value
|
Fair Value
(1)
|
||||||
|
0.875% Convertible Senior Notes due June 15, 2017
|
$
|
494,105
|
|
$
|
494,723
|
|
||
|
3.75% Convertible Senior Notes, due October 15, 2018
|
350,000
|
|
482,125
|
|
||||
|
4.0% Convertible Senior Notes, due December 15, 2020
(2)
|
184,235
|
|
265,791
|
|
||||
|
|
$
|
1,028,340
|
|
$
|
1,242,639
|
|
||
_________________________________
|
(1)
|
The convertible notes were categorized as Level 2 in the fair value hierarchy. Ciena estimates the fair value of its outstanding convertible notes using a market approach based on observable inputs, such as current market transactions involving comparable securities.
|
|
(2)
|
Includes unamortized discount and accretion of principal.
|
(16) ABL CREDIT FACILITY
Ciena Corporation and certain of its subsidiaries are parties to a senior secured asset-based revolving credit facility (the “ABL Credit Facility”) providing for a total commitment of
$200 million
with a maturity date of December 31, 2016. Ciena principally uses the ABL Credit Facility to support the issuance of letters of credit that arise in the ordinary course of its business and thereby to reduce its use of cash required to collateralize these instruments. As of
October 31, 2015
, letters of credit totaling
$63.4 million
were collateralized by the ABL Credit Facility. There were
no
borrowings outstanding under the ABL Credit Facility as of
October 31, 2015
.
(17) EARNINGS (LOSS) PER SHARE CALCULATION
The following table (in thousands except per share amounts) is a reconciliation of the numerator and denominator of the basic net income (loss) per common share (“Basic EPS”) and the diluted net income (loss) per potential common share (“Diluted EPS”). Basic EPS is computed using the weighted average number of common shares outstanding. Diluted EPS is computed using the weighted average number of the following, in each case, to the extent the effect is not anti-dilutive: (i) common shares outstanding, (ii) shares issuable upon vesting of restricted stock units, (iii) shares issuable under Ciena’s employee stock purchase plan and upon exercise of outstanding stock options, using the treasury stock method, and (iv) shares underlying Ciena’s outstanding convertible notes.
96
Numerator
|
|
Year Ended October 31,
|
||||||||||
|
|
2013
|
2014
|
2015
|
||||||||
|
Net income (loss)
|
$
|
(85,431
|
)
|
$
|
(40,637
|
)
|
$
|
11,667
|
|
||
Denominator
|
|
Year Ended October 31,
|
|||||||
|
|
2013
|
2014
|
2015
|
|||||
|
Basic weighted average shares outstanding
|
102,350
|
|
105,783
|
|
118,416
|
|
||
|
Add: Shares underlying outstanding stock options, employee stock purchase plan and restricted stock units
|
—
|
|
—
|
|
1,685
|
|
||
|
Diluted weighted average shares outstanding
|
102,350
|
|
105,783
|
|
120,101
|
|
||
EPS
|
|
Year Ended October 31,
|
||||||||||
|
|
2013
|
2014
|
2015
|
||||||||
|
Basic EPS
|
$
|
(0.83
|
)
|
$
|
(0.38
|
)
|
$
|
0.10
|
|
||
|
Diluted EPS
|
$
|
(0.83
|
)
|
$
|
(0.38
|
)
|
$
|
0.10
|
|
||
The following table summarizes the weighted average shares excluded from the calculation of the denominator for Diluted EPS due to their anti-dilutive effect for the fiscal years indicated (in thousands):
|
|
Year Ended October 31,
|
|||||||
|
|
2013
|
2014
|
2015
|
|||||
|
Shares underlying stock options and restricted stock units
|
3,890
|
|
3,176
|
|
1,562
|
|
||
|
0.25% Convertible Senior Notes due May 1, 2013
|
2,682
|
|
—
|
|
—
|
|
||
|
4.0% Convertible Senior Notes due March 15, 2015
|
10,541
|
|
9,198
|
|
3,386
|
|
||
|
0.875% Convertible Senior Notes due June 15, 2017
|
13,108
|
|
13,108
|
|
13,080
|
|
||
|
3.75% Convertible Senior Notes due October 15, 2018
|
17,355
|
|
17,355
|
|
17,355
|
|
||
|
8.0% Cyan Convertible Senior Notes due 2019
|
—
|
|
—
|
|
187
|
|
||
|
4.0% Convertible Senior Notes due December 15, 2020
|
7,855
|
|
9,198
|
|
9,198
|
|
||
|
Total excluded due to anti-dilutive effect
|
55,431
|
|
|
52,035
|
|
44,768
|
|
|
(18) STOCKHOLDERS’ EQUITY
Call Spread Option
Ciena purchased a call spread option relating to the
0.875%
convertible senior notes due June 15, 2017 for
$42.5 million
during the third quarter of fiscal 2007. The call spread option is designed to mitigate exposure to potential dilution from the conversion of the notes. The call spread option was purchased at the time of the notes offering from an affiliate of the underwriter. The cost of the call spread option was recorded as a reduction in paid-in capital.
The call spread option is exercisable, upon maturity of the relevant issue of convertible note, for such number of shares of Ciena common stock issuable upon conversion of that series of notes in full. The call spread option has a “lower strike price” equal to the conversion price for the notes and a “higher strike price” that serves to cap the amount of dilution protection provided. At its election, Ciena can exercise the call spread option on a net cash basis or a net share basis. The value of the consideration of a net share settlement will be equal to the value upon a net cash settlement and can range from
$0
, if the market price per share of Ciena common stock upon exercise is equal to or below the lower strike price, or approximately
$76.1 million
, if the market price per share of Ciena common stock upon exercise is at or above the higher strike price. If the market price on the date of exercise is between the lower strike price and the higher strike price, in lieu of a net settlement, Ciena may elect to receive the full number of shares underlying the call spread option by paying the aggregate option exercise price, which is equal to the original principal outstanding on that series of notes. Should there be an early unwind of the call spread option, the amount of cash or shares to be received by Ciena will depend upon the existing overall market conditions, and on Ciena’s stock price, the volatility of Ciena’s stock and the remaining term of the call spread option. The number of shares subject to the call spread option, and the lower and higher strike prices, are subject to customary adjustments.
97
(19) INCOME TAXES
For the periods indicated, the provision for income taxes consists of the following (in thousands):
|
|
October 31,
|
||||||||||
|
|
2013
|
2014
|
2015
|
||||||||
|
Provision for income taxes:
|
|
|
|
||||||||
|
Current:
|
|
|
|
||||||||
|
Federal
|
$
|
—
|
|
$
|
—
|
|
$
|
—
|
|
||
|
State
|
906
|
|
1,831
|
|
1,435
|
|
|||||
|
Foreign
|
4,334
|
|
12,133
|
|
10,662
|
|
|||||
|
Total current
|
5,240
|
|
13,964
|
|
12,097
|
|
|||||
|
Deferred:
|
|
|
|
||||||||
|
Federal
|
—
|
|
—
|
|
—
|
|
|||||
|
State
|
—
|
|
—
|
|
—
|
|
|||||
|
Foreign
|
—
|
|
—
|
|
—
|
|
|||||
|
Total deferred
|
—
|
|
—
|
|
—
|
|
|||||
|
Provision for income taxes
|
$
|
5,240
|
|
$
|
13,964
|
|
$
|
12,097
|
|
||
For the periods indicated, income (loss) before provision for income taxes consists of the following (in thousands):
|
|
October 31,
|
||||||||||
|
|
2013
|
2014
|
2015
|
||||||||
|
United States
|
$
|
(59,594
|
)
|
$
|
(42,742
|
)
|
$
|
(1,029
|
)
|
||
|
Foreign
|
(20,597
|
)
|
16,069
|
|
24,793
|
|
|||||
|
Total
|
$
|
(80,191
|
)
|
$
|
(26,673
|
)
|
$
|
23,764
|
|
||
Ciena's foreign income tax as a percentage of foreign income is dependent upon the mix of earnings in our foreign jurisdictions. Depending upon the mix of earnings in these jurisdictions, including those jurisdictions which are loss making, the tax on total foreign income may appear disproportionate compared to the expected tax based on the U.S. federal statutory rate. Ciena expects that this result may continue until earnings from foreign operations mature and maintain a more consistent contribution.
For the periods indicated, the tax provision reconciles to the amount computed by multiplying income or loss before income taxes by the U.S. federal statutory rate of
35%
as follows:
|
|
October 31,
|
|||||||
|
|
2013
|
2014
|
2015
|
|||||
|
Provision at statutory rate
|
35.00
|
%
|
35.00
|
%
|
35.00
|
%
|
||
|
State taxes
|
(1.13
|
)%
|
(6.87
|
)%
|
6.04
|
%
|
||
|
Foreign taxes
|
(12.70
|
)%
|
(70.25
|
)%
|
28.98
|
%
|
||
|
Research and development credit
|
17.39
|
%
|
32.07
|
%
|
(25.55
|
)%
|
||
|
Non-deductible loss on debt extinguishment
|
(11.21
|
)%
|
—
|
%
|
—
|
%
|
||
|
Non-deductible compensation and other
|
(8.78
|
)%
|
(29.59
|
)%
|
30.16
|
%
|
||
|
Valuation allowance
|
(25.10
|
)%
|
(12.71
|
)%
|
(23.73
|
)%
|
||
|
Effective income tax rate
|
(6.53
|
)%
|
(52.35
|
)%
|
50.90
|
%
|
||
98
As a result of prospective application of Accounting Standards Update No. 2015-17,
Income Taxes (Topic 740): Balance Sheet Classification of Deferred Taxes
, Ciena offset all deferred tax liabilities and assets, as well as any related valuation allowance, and is presenting them as a single non-current amount as of October 31, 2015. Ciena has not retrospectively adjusted prior periods.
The significant components of deferred tax assets and liabilities are as follows (in thousands):
|
|
October 31,
|
||||||
|
|
2014
|
2015
|
|||||
|
Deferred tax assets:
|
|
|
|||||
|
Reserves and accrued liabilities
|
$
|
59,707
|
|
$
|
63,290
|
|
|
|
Depreciation and amortization
|
268,783
|
|
203,991
|
|
|||
|
NOL and credit carry forward
|
1,155,389
|
|
1,202,641
|
|
|||
|
Other
|
12,956
|
|
25,750
|
|
|||
|
Gross deferred tax assets
|
1,496,835
|
|
1,495,672
|
|
|||
|
Valuation allowance
|
(1,496,835
|
)
|
(1,495,672
|
)
|
|||
|
Net deferred tax asset
|
$
|
—
|
|
$
|
—
|
|
|
A reconciliation of the beginning and ending amount of unrecognized tax benefits, excluding interest and penalties, is as follows (in thousands):
|
Amount
|
|||
|
Unrecognized tax benefits at October 31, 2012
|
$
|
11,052
|
|
|
Decrease related to positions taken in prior period
|
(3,925
|
)
|
|
|
Increase related to positions taken in current period
|
2,146
|
|
|
|
Reductions related to expiration of statute of limitations
|
(994
|
)
|
|
|
Unrecognized tax benefits at October 31, 2013
|
8,279
|
|
|
|
Increase related to positions taken in prior period
|
2,479
|
|
|
|
Increase related to positions taken in current period
|
5,241
|
|
|
|
Reductions related to expiration of statute of limitations
|
(899
|
)
|
|
|
Unrecognized tax benefits at October 31, 2014
|
15,100
|
|
|
|
Increase related to positions taken in prior period
|
3,658
|
|
|
|
Increase related to positions taken in current period
|
9,138
|
|
|
|
Reductions related to expiration of statute of limitations
|
(360
|
)
|
|
|
Unrecognized tax benefits at October 31, 2015
|
$
|
27,536
|
|
As of
October 31, 2014
and
2015
, Ciena had accrued
$3.4 million
and
$4.3 million
of interest and penalties, respectively, related to unrecognized tax benefits within other long-term liabilities in the Consolidated Balance Sheets. Interest and penalties of
$2.0 million
and
$0.9 million
were recorded to the provision for income taxes during fiscal 2014 and
fiscal 2015
respectively, and no such charges or benefits were recorded for fiscal 2013. If recognized, the entire balance of unrecognized tax benefits would impact the effective tax rate. Over the next 12 months, Ciena does not estimate any material changes in unrecognized income tax benefits.
During fiscal 2002, Ciena established a valuation allowance against its deferred tax assets. Ciena intends to maintain a valuation allowance until sufficient positive evidence exists to support a reversal. Any future release of the valuation allowance may be recorded as a tax benefit increasing net income or as an adjustment to paid-in capital, based on tax ordering requirements. The following table summarizes the activity in Ciena’s valuation allowance against its gross deferred tax assets (in thousands):
99
|
Year ended
|
Beginning
|
|
|
Ending
|
||||||||||||
|
October 31,
|
Balance
|
Additions
|
Deductions
|
Balance
|
||||||||||||
|
2013
|
$
|
1,488,994
|
|
$
|
—
|
|
$
|
1,695
|
|
$
|
1,487,299
|
|
||||
|
2014
|
$
|
1,487,299
|
|
$
|
9,536
|
|
$
|
—
|
|
$
|
1,496,835
|
|
||||
|
2015
|
$
|
1,496,835
|
|
$
|
—
|
|
$
|
1,163
|
|
$
|
1,495,672
|
|
||||
As of
October 31, 2015
, Ciena had a
$2.9 billion
net operating loss carry forward and a
$0.1 billion
income tax credit carry forward which begin to expire in fiscal year 2018 and 2019, respectively. Ciena’s ability to use net operating losses and credit carry forwards is subject to limitations pursuant to the ownership change rules of the Internal Revenue Code Section 382.
The income tax provision does not reflect the tax savings resulting from deductions associated with Ciena’s equity compensation and the call spread option associated with Ciena’s convertible debt. The cumulative tax benefit through
October 31, 2015
of approximately
$83.0 million
will be credited to additional paid-in capital when realized. For deductions associated with Ciena’s equity compensation, credits to paid-in capital will be recorded when those tax benefits are used to reduce taxes payable.
(20) SHARE-BASED COMPENSATION EXPENSE
Ciena has outstanding equity awards issued under its legacy equity plans and equity plans assumed as a result of previous acquisitions. In connection with its acquisition of Cyan during the fourth quarter of fiscal 2015, Ciena also assumed the Cyan, Inc. 2006 and 2013 Stock Incentive Plans and exchanged outstanding Cyan stock options and unvested restricted stock unit awards at closing for options to acquire approximately
2.4 million
shares of Ciena common stock and
1.0 million
Ciena restricted stock units. Ciena grants equity awards under its 2008 Omnibus Incentive Plan and makes shares of its common stock available for purchase under its Amended and Restated Employee Stock Purchase Plan (“ESPP”).
2008 Plan
The 2008 Plan authorizes the issuance of awards including stock options, restricted stock units (RSUs), restricted stock, unrestricted stock, stock appreciation rights (SARs) and other equity and/or cash performance incentive awards to employees, directors and consultants of Ciena. Subject to certain restrictions, the Compensation Committee of the Board of Directors has broad discretion to establish the terms and conditions for awards under the 2008 Plan, including the number of shares, vesting conditions, and the required service or performance criteria. Options and SARs have a maximum term of
ten
years, and their exercise price may not be less than
100%
of fair market value on the date of grant. Repricing of stock options and SARs is prohibited without stockholder approval. Certain change in control transactions may cause awards granted under the 2008 Plan to vest, unless the awards are continued or substituted for in connection with the transaction. As of
October 31, 2015
, the total number of shares authorized for issuance under the 2008 Plan is
25.1 million
and approximately
6.3 million
shares remained available for issuance thereunder.
Stock Options
Outstanding stock option awards to employees are generally subject to service-based vesting conditions and vest incrementally over a
four
-year period. The following table is a summary of Ciena's stock option activity for the periods indicated (shares in thousands):
|
Shares Underlying
Options
Outstanding
|
Weighted
Average
Exercise Price
|
|||||
|
Balance as of October 31, 2014
|
1,288
|
|
$
|
25.43
|
|
|
|
Granted
|
—
|
|
—
|
|
||
|
Granted in exchange for Cyan options
|
2,381
|
|
18.20
|
|
||
|
Exercised
|
(1,165
|
)
|
12.49
|
|
||
|
Canceled
|
(211
|
)
|
25.84
|
|
||
|
Balance as of October 31, 2015
|
2,293
|
|
$
|
24.45
|
|
|
100
The total intrinsic value of options exercised during fiscal
2013
, fiscal
2014
and fiscal
2015
was
$2.0 million
,
$1.0 million
and
$11.8 million
, respectively. There were no stock options granted by Ciena during fiscal
2013
, fiscal
2014
or fiscal
2015
. The weighted average fair value of each stock option granted by Ciena in exchange for Cyan awards was
$13.04
.
The following table summarizes information with respect to stock options outstanding at
October 31, 2015
, based on Ciena’s closing stock price on the last trading day of Ciena’s fiscal
2015
(shares and intrinsic value in thousands):
|
|
|
|
Options Outstanding at
|
Vested Options at
|
||||||||||||||||||||||||||||||
|
October 31, 2015
|
October 31, 2015
|
|||||||||||||||||||||||||||||||||
|
Number
|
Weighted
Average
Remaining
|
Weighted
|
Number
|
Weighted
Average
Remaining
|
Weighted
|
|||||||||||||||||||||||||||||
|
Range of
|
of
|
Contractual
|
Average
|
Aggregate
|
of
|
Contractual
|
Average
|
Aggregate
|
||||||||||||||||||||||||||
|
Exercise
|
Underlying
|
Life
|
Exercise
|
Intrinsic
|
Underlying
|
Life
|
Exercise
|
Intrinsic
|
||||||||||||||||||||||||||
|
Price
|
Shares
|
(Years)
|
Price
|
Value
|
Shares
|
(Years)
|
Price
|
Value
|
||||||||||||||||||||||||||
|
$
|
0.05
|
|
—
|
|
$
|
11.16
|
|
418
|
|
3.65
|
$
|
6.58
|
|
$
|
7,337
|
|
414
|
|
3.59
|
$
|
6.55
|
|
$
|
7,277
|
|
|||||||||
|
$
|
11.34
|
|
—
|
|
$
|
17.24
|
|
599
|
|
5.74
|
13.52
|
|
6,366
|
|
488
|
|
5.41
|
13.36
|
|
5,267
|
|
|||||||||||||
|
$
|
17.43
|
|
—
|
|
$
|
24.50
|
|
81
|
|
4.92
|
19.52
|
|
372
|
|
52
|
|
2.91
|
20.28
|
|
200
|
|
|||||||||||||
|
$
|
24.69
|
|
—
|
|
$
|
28.28
|
|
268
|
|
1.45
|
27.37
|
|
—
|
|
265
|
|
1.39
|
27.39
|
|
—
|
|
|||||||||||||
|
$
|
28.61
|
|
—
|
|
$
|
31.08
|
|
89
|
|
1.83
|
29.82
|
|
—
|
|
89
|
|
1.83
|
29.82
|
|
—
|
|
|||||||||||||
|
$
|
31.85
|
|
—
|
|
$
|
32.55
|
|
56
|
|
4.87
|
32.04
|
|
—
|
|
46
|
|
4.41
|
32.03
|
|
—
|
|
|||||||||||||
|
$
|
33.00
|
|
—
|
|
$
|
37.10
|
|
398
|
|
2.36
|
35.95
|
|
—
|
|
378
|
|
2.10
|
35.90
|
|
—
|
|
|||||||||||||
|
$
|
37.31
|
|
—
|
|
$
|
55.63
|
|
384
|
|
4.00
|
45.69
|
|
—
|
|
311
|
|
3.15
|
45.65
|
|
—
|
|
|||||||||||||
|
$
|
0.05
|
|
—
|
|
$
|
55.63
|
|
2,293
|
|
3.78
|
$
|
24.45
|
|
$
|
14,075
|
|
2,043
|
|
3.32
|
$
|
24.20
|
|
$
|
12,744
|
|
|||||||||
Assumptions for Option-Based Awards
Ciena recognizes the fair value of stock options as share-based compensation expense on a straight-line basis over the requisite service period. Ciena did not grant any option-based awards during fiscal 2013, fiscal 2014, or fiscal 2015. Ciena used the following assumptions for option-based awards issued in exchange for Cyan options:
|
Expected volatility
|
35.87
|
%
|
|
Risk-free interest rate
|
1.26
|
%
|
|
Expected term (years)
|
0.72-6.88
|
|
|
Expected dividend yield
|
0.0
|
%
|
Restricted Stock Units
A restricted stock unit is a stock award that entitles the holder to receive shares of Ciena common stock as the unit vests. Ciena's outstanding restricted stock unit awards are subject to service-based vesting conditions and/or performance-based vesting conditions. Awards subject to service-based conditions typically vest in increments over a
three
or
four
-year period. Awards with performance-based vesting conditions require the achievement of certain operational, financial or other performance criteria or targets as a condition of vesting, or the acceleration of vesting, of such awards. Ciena recognizes the estimated fair value of performance-based awards, net of estimated forfeitures, as share-based compensation expense over the performance period, using graded vesting, which considers each performance period or tranche separately, based upon Ciena's determination of whether it is probable that the performance targets will be achieved. At each reporting period, Ciena reassesses the probability of achieving the performance targets and the performance period required to meet those targets.
The following table is a summary of Ciena's restricted stock unit activity for the period indicated, with the aggregate fair value of the balance outstanding at the end of each period, based on Ciena's closing stock price on the last trading day of the relevant period (shares and aggregate fair value in thousands):
101
|
Restricted
Stock Units
Outstanding
|
Weighted
Average
Grant Date
Fair Value
Per Share
|
Aggregate Fair
Value
|
||||||||
|
Balance as of October 31, 2014
|
4,012
|
|
$
|
18.02
|
|
$
|
67,241
|
|
||
|
Granted
|
2,666
|
|
|
|
||||||
|
Granted in exchange for Cyan awards
|
1,030
|
|
|
|||||||
|
Vested
|
(2,320
|
)
|
|
|
||||||
|
Canceled or forfeited
|
(502
|
)
|
|
|
||||||
|
Balance as of October 31, 2015
|
4,886
|
|
$
|
20.02
|
|
$
|
117,951
|
|
||
The total fair value of restricted stock units that vested and were converted into common stock during fiscal
2013
, fiscal
2014
and fiscal
2015
was
$37.3 million
,
$48.1 million
and
$50.5 million
, respectively. The weighted average fair value of each restricted stock unit granted by Ciena during fiscal
2013
, fiscal
2014
and fiscal
2015
was
$16.30
,
$21.82
and
$19.41
, respectively. The weighted average fair value of each restricted stock unit granted by Ciena in exchange for Cyan awards was
$25.39
.
Assumptions for Restricted Stock Unit Awards
The fair value of each restricted stock unit award is based on the closing price on the date of grant. Share-based expense for service-based restricted stock unit awards is recognized, net of estimated forfeitures, ratably over the vesting period on a straight-line basis.
Share-based expense for performance-based restricted stock unit awards, net of estimated forfeitures, is recognized ratably over the performance period based upon Ciena's determination of whether it is probable that the performance targets will be achieved. At each reporting period, Ciena reassesses the probability of achieving the performance targets and the performance period required to meet those targets. The estimation of whether the performance targets will be achieved involves judgment, and the estimate of expense is revised periodically based on the probability of achieving the performance targets. Revisions are reflected in the period in which the estimate is changed. If any performance goals are not met, no compensation cost is ultimately recognized against that goal and, to the extent previously recognized, compensation expense is reversed.
Because share-based compensation expense is recognized only for those awards that are ultimately expected to vest, the amount of share-based compensation expense recognized reflects a reduction for estimated forfeitures. Ciena estimates forfeitures at the time of grant and revises those estimates in subsequent periods based upon new or changed information.
Amended and Restated Employee Stock Purchase Plan (ESPP)
Under the ESPP, eligible employees may enroll in a
twelve
-month offer period that begins in December and June of each year. Each offer period includes
two
six
-month purchase periods. Employees may purchase a limited number of shares of Ciena common stock at
85%
of the fair market value on either the day immediately preceding the offer date or the purchase date, whichever is lower. The ESPP is considered compensatory for purposes of share-based compensation expense. Pursuant to the ESPP's “evergreen” provision, on December 31 of each year, the number of shares available under the ESPP increases by up to
0.6 million
shares, provided that the total number of shares available at that time shall not exceed
8.2 million
. Unless earlier terminated, the ESPP will terminate on
January 24, 2023
.
During fiscal
2013
, fiscal
2014
and fiscal
2015
, Ciena issued
0.9 million
,
0.9 million
and
1.0 million
shares under the ESPP, respectively. At
October 31,
2015
,
6.4 million
shares remained available for issuance under the ESPP.
Share-Based Compensation Expense for Periods Reported
The following table summarizes share-based compensation expense for the periods indicated (in thousands):
102
|
|
Year Ended October 31,
|
||||||||||
|
|
2013
|
2014
|
2015
|
||||||||
|
Product costs
|
$
|
2,522
|
|
$
|
2,531
|
|
$
|
2,400
|
|
||
|
Service costs
|
1,771
|
|
2,216
|
|
2,156
|
|
|||||
|
Share-based compensation expense included in cost of goods sold
|
4,293
|
|
4,747
|
|
4,556
|
|
|||||
|
Research and development
|
8,214
|
|
9,682
|
|
10,665
|
|
|||||
|
Sales and marketing
|
13,290
|
|
14,958
|
|
15,539
|
|
|||||
|
General and administrative
|
12,055
|
|
13,568
|
|
17,018
|
|
|||||
|
Acquisition and integration costs
|
—
|
|
—
|
|
7,588
|
|
|||||
|
Share-based compensation expense included in operating expense
|
33,559
|
|
38,208
|
|
50,810
|
|
|||||
|
Share-based compensation expense capitalized in inventory, net
|
(132
|
)
|
(25
|
)
|
(26
|
)
|
|||||
|
Total share-based compensation
|
$
|
37,720
|
|
$
|
42,930
|
|
$
|
55,340
|
|
||
As of
October 31, 2015
, total unrecognized share-based compensation expense was
$78.7 million
: (i)
$2.8 million
, which relates to unvested stock options and is expected to be recognized over a weighted-average period of
1.6 years
; and (ii)
$75.9 million
which relates to unvested restricted stock units and is expected to be recognized over a weighted-average period of
1.5
years.
(21) SEGMENT AND ENTITY WIDE DISCLOSURES
Segment Reporting
Ciena’s internal organizational structure and the management of its business are grouped into the following operating segments:
|
•
|
Converged Packet Optical —
includes the 6500 Packet-Optical Platform and the 5430 Reconfigurable Switching System, which feature Ciena's WaveLogic coherent optical processors. Products also include Waveserver, the family of CoreDirector® Multiservice Optical Switches and the OTN configuration for the 5410 Reconfigurable Switching System. Revenue from sales of the Z-Series Packet-Optical Platform acquired from Cyan is included in our Converged Packet Optical segment. This segment also includes sales of operating system software and enhanced software features embedded in each of these products. Revenue from this segment is included in product revenue on the Consolidated Statement of Operations.
|
|
•
|
Packet Networking —
includes the 3000 family of service delivery switches and service aggregation switches and the 5000 family of service aggregation switches. This segment also includes the 8700 Packetwave Platform and the Ethernet packet configuration for the 5410 Service Aggregation Switch. This segment also includes sales of operating system software and enhanced software features embedded in each of these products. Revenue from this segment is included in product revenue on the Consolidated Statement of Operations.
|
|
•
|
Optical Transport —
includes the 4200 Advanced Services Platform, Corestream® Agility Optical Transport System, 5100/5200 Advanced Services Platform, Common Photonic Layer (CPL) and 6100 Multiservice Optical Platform. This segment includes sales from SONET/SDH, transport and data networking products, as well as certain enterprise-oriented transport solutions that support storage and LAN extension, interconnection of data centers, and virtual private networks. This segment also includes operating system software and enhanced software features embedded in each of these products. Revenue from this segment is included in product revenue on the Consolidated Statement of Operations.
|
|
•
|
Software and Services —
includes the sale of network management solutions, including the OneControl Unified Management System, ON-Center® Network & Service Management Suite, Ethernet Services Manager, Optical Suite Release and Planet Operate. This segment includes sales of Ciena's Blue Planet
s
oftware platform, a modular network virtualization, service orchestration and network management software solution, and Ciena's SDN Multilayer WAN Controller and its related applications. This segment includes a broad range of services for consulting and network design, installation and deployment, software subscription, maintenance support and training activities. Except for revenue from the software portion of this segment, which is included in product revenue, revenue from this segment is included in services revenue on the Consolidated Statement of Operations.
|
103
Ciena's long-lived assets, including equipment, building, furniture and fixtures, finite-lived intangible assets and maintenance spares, are not reviewed by the chief operating decision maker for purposes of evaluating performance and allocating resources. As of
October 31, 2015
, equipment, building, furniture and fixtures totaling
$192.0 million
primarily supports asset groups within Ciena's Converged Packet Optical segment, Packet Networking segment, Software and Services segment and Ciena's unallocated selling and general and administrative activities. As of
October 31, 2015
,
$166.5 million
of Ciena's intangible assets, including goodwill of
$55.0 million
from the acquisition of Cyan, were assigned to asset groups within Ciena's Converged Packet Optical segment and
$292.6 million
of Ciena's intangible assets, including goodwill of
$201.4 million
from the acquisition of Cyan, were assigned to asset groups within Ciena's Software and Services segment. As of
October 31, 2015
, all of the maintenance spares totaling
$55.3 million
were assigned to asset groups within Ciena's Software and Services segment.
Segment Revenue
The table below (in thousands, except percentage data) sets forth Ciena’s segment revenue for the respective periods indicated:
|
|
Fiscal Year
|
||||||||||
|
|
2013
|
2014
|
2015
|
||||||||
|
Revenue:
|
|
|
|
||||||||
|
Converged Packet Optical
|
$
|
1,187,231
|
|
$
|
1,455,501
|
|
$
|
1,661,702
|
|
||
|
Packet Networking
|
222,898
|
|
244,116
|
|
229,223
|
|
|||||
|
Optical Transport
|
233,821
|
|
127,215
|
|
73,004
|
|
|||||
|
Software and Services
|
438,596
|
|
461,457
|
|
481,740
|
|
|||||
|
Consolidated revenue
|
$
|
2,082,546
|
|
$
|
2,288,289
|
|
$
|
2,445,669
|
|
||
Segment Profit
Segment profit is determined based on internal performance measures used by the chief executive officer to assess the performance of each operating segment in a given period. In connection with that assessment, the chief executive officer excludes the following items: selling and marketing costs; general and administrative costs; acquisition and integration costs; amortization of intangible assets; restructuring costs; interest and other income (loss), net; interest expense; loss on extinguishment of debt and provisions for income taxes.
The table below (in thousands) sets forth Ciena’s segment profit and the reconciliation to consolidated net income (loss) during the respective periods indicated:
104
|
|
Fiscal Year
|
||||||||||
|
|
2013
|
2014
|
2015
|
||||||||
|
Segment profit:
|
|
|
|
||||||||
|
Converged Packet Optical
|
$
|
242,335
|
|
$
|
353,942
|
|
$
|
471,484
|
|
||
|
Packet Networking
|
22,740
|
|
19,467
|
|
28,136
|
|
|||||
|
Optical Transport
|
89,754
|
|
38,974
|
|
15,930
|
|
|||||
|
Software and Services
|
126,938
|
|
134,789
|
|
145,812
|
|
|||||
|
Total segment profit
|
481,767
|
|
547,172
|
|
661,362
|
|
|||||
|
Less: non-performance operating expenses
|
|
|
|
||||||||
|
Selling and marketing
|
304,170
|
|
328,325
|
|
333,836
|
|
|||||
|
General and administrative
|
122,432
|
|
126,824
|
|
123,402
|
|
|||||
|
Amortization of intangible assets
|
49,771
|
|
45,970
|
|
69,511
|
|
|||||
|
Acquisition and integration costs
|
—
|
|
—
|
|
25,539
|
|
|||||
|
Restructuring costs
|
7,169
|
|
349
|
|
8,626
|
|
|||||
|
Add: other non-performance financial items
|
|||||||||||
|
Interest expense and other income (loss), net
|
(49,786
|
)
|
(72,377
|
)
|
(76,684
|
)
|
|||||
|
Loss on extinguishment of debt
|
(28,630
|
)
|
—
|
|
—
|
|
|||||
|
Less: Provision for income taxes
|
5,240
|
|
13,964
|
|
12,097
|
|
|||||
|
Consolidated net income (loss)
|
$
|
(85,431
|
)
|
$
|
(40,637
|
)
|
$
|
11,667
|
|
||
Entity Wide Reporting
Ciena's operating segments each engage in business across
four
geographic regions: North America; Europe, Middle East and Africa (“EMEA”); Asia Pacific (“APAC”); and Caribbean and Latin America ("CALA"). North America includes only activities in the United States and Canada. The following table reflects Ciena’s geographic distribution of revenue principally based on the relevant location for Ciena's delivery of products and performance of services. For the periods below, Ciena’s geographic distribution of revenue was as follows (in thousands):
|
|
Fiscal Year
|
||||||||||
|
|
2013
|
2014
|
2015
|
||||||||
|
North America
|
$
|
1,360,169
|
|
$
|
1,477,329
|
|
$
|
1,598,328
|
|
||
|
EMEA
|
376,405
|
|
417,399
|
|
400,294
|
|
|||||
|
CALA
|
174,360
|
|
212,018
|
|
201,499
|
|
|||||
|
APAC
|
171,612
|
|
181,543
|
|
245,548
|
|
|||||
|
Total
|
$
|
2,082,546
|
|
$
|
2,288,289
|
|
$
|
2,445,669
|
|
||
North America includes
$1,217.5 million
,
$1,318.0 million
and
$1,479.5 million
of United States revenue for fiscal years ended
October 31, 2013
,
2014
and
2015
, respectively. No other country accounted for at least 10% of total revenue for the periods presented above.
The following table reflects Ciena's geographic distribution of equipment, building, furniture and fixtures, net, with any country accounting for at least 10% of total equipment, building, furniture and fixtures, net, specifically identified. Equipment, building, furniture and fixtures, net, attributable to geographic regions outside of the United States and Canada are reflected as “Other International.” For the periods below, Ciena's geographic distribution of equipment, building, furniture and fixtures, net, was as follows (in thousands):
105
|
|
October 31,
|
||||||||||
|
|
2013
|
2014
|
2015
|
||||||||
|
United States
|
$
|
64,132
|
|
$
|
73,420
|
|
$
|
96,292
|
|
||
|
Canada
|
43,772
|
|
42,015
|
|
84,318
|
|
|||||
|
Other International
|
11,825
|
|
11,197
|
|
11,363
|
|
|||||
|
Total
|
$
|
119,729
|
|
$
|
126,632
|
|
$
|
191,973
|
|
||
AT&T accounted for greater than 10% of Ciena's revenue in Ciena's fiscal years ended
October 31, 2013
,
2014
and
2015
, with total revenue of
$373.6 million
,
$423.5 million
and
$487.8 million
, respectively. AT&T purchases products and services from each of Ciena's operating segments.
(22) OTHER EMPLOYEE BENEFIT PLANS
Ciena has a Defined Contribution Pension Plan that covers a majority of its Canada-based employees. The plan covers all Canada-based employees who are not part of an excluded group. Total contributions (employee and employer) cannot exceed the lesser of
18%
of participant earnings and an annual dollar limit (CAD
$25,370
for
2015
). This plan includes a required employer contribution of
1%
for all participants and a
50%
matching of participant contributions up to a total annual maximum of CAD
$3,000
per employee. During fiscal
2013
,
2014
and
2015
, Ciena made matching contributions of approximately CAD
$3.9 million
, CAD
$4.1 million
and CAD
$4.3 million
, respectively.
Ciena has a 401(k) defined contribution profit sharing plan. Participants may contribute up to
60%
of pre-tax compensation, subject to certain limitations. The plan includes an employer matching contribution equal to
50%
of the first
6%
an employee contributes each pay period. Ciena may also make discretionary annual profit contributions up to the IRS regulated limit. Ciena has made no profit sharing contributions to date. During fiscal
2013
,
2014
and
2015
, Ciena made matching contributions of approximately
$4.0 million
,
$4.5 million
and
$4.7 million
, respectively.
(23) COMMITMENTS AND CONTINGENCIES
Ontario Grant
Ciena was awarded a conditional grant from the Province of Ontario in June 2011. Under this strategic jobs investment fund grant, Ciena was eligible to receive up to an aggregate of CAD
$25.0 million
in funding for eligible costs relating to certain next-generation, coherent optical transport development initiatives over the period from
November 1, 2010 to October 31, 2015
. Amounts received under the grant are subject to recoupment in the event that Ciena fails to achieve certain minimum investment, employment and project milestones. As of October 31,
2015
, Ciena has received payment for the full amount of the grant. Payments received were recorded as a reduction in research and development expenses.
Foreign Tax Contingencies
Ciena is subject to various tax liabilities arising in the ordinary course of business. Ciena does not expect that the ultimate settlement of these liabilities will have a material effect on its results of operations, financial position or cash flows.
Litigation
From May 15 through June 3, 2015, five separate putative class action lawsuits in connection with Ciena’s then-pending acquisition of Cyan, Inc. (“Cyan”) were filed in the Court of Chancery of the State of Delaware:
|
•
|
Luvishis v. Cyan, Inc., et al., C.A. No. 11027-CB, filed May 15, 2015
|
|
•
|
Poll v. Cyan, Inc., et al., C.A. No. 11028-CB, filed May 15, 2015
|
|
•
|
Canzano v. Floyd, et al., C.A. No. 11052-CB, filed May 20, 2015
|
|
•
|
Kassis v. Cyan, Inc., et al., C.A. No. 11069-CB, filed May 27, 2015
|
|
•
|
Fenske v. Cyan, Inc., et al., C.A. No. 11090-CB, filed June 3, 2015
|
Each of the complaints named Cyan (except for the Canzano complaint), Ciena, Neptune Acquisition Subsidiary, Inc., a Ciena subsidiary created solely for the purpose of effecting the acquisition (“Merger Sub”), and the members of Cyan’s board of directors as defendants. On June 23, 2015, each of these lawsuits was consolidated into a single case captioned In Re Cyan, Inc. Shareholder Litigation, Consol. C.A. No. 11027-CB. On July 9, 2015, the plaintiffs filed a verified amended class action complaint, which named as defendants Ciena, Merger Sub, and the members of Cyan’s board of directors. On August 5, 2015,
106
the defendants filed motions to dismiss the amended complaint. On October 1, 2015, the plaintiffs filed a second amended complaint which named as defendants the members of Cyan’s board of directors. Cyan, Ciena, and Merger Sub were not named as defendants. The second amended complaint generally alleges that the Cyan board members breached their fiduciary duties by engaging in a conflicted and unfair sales process, failing to maximize stockholder value in the acquisition, taking steps to preclude competitive bidding, and failing to disclose material information necessary for stockholders to make an informed decision regarding the acquisition. The second amended complaint seeks (i) a declaration that the plaintiffs are entitled to a quasi-appraisal remedy, (ii) rescissory damages, (iii) recovery through an accounting of all damages caused as a result of the alleged breaches of fiduciary duties, (iv) compensatory damages, and (v) costs including attorneys’ fees and experts’ fees. On October 15, 2015, the defendants filed a renewed motion to dismiss. A briefing schedule for these motions has been set, with briefing to be completed in March 2016.
As a result of our acquisition of Cyan in August 2015, we became a defendant in a securities class action lawsuit. On April 1, 2014, a purported stockholder class action lawsuit was filed in the Superior Court of California, County of San Francisco, against Cyan, the members of Cyan’s board of directors, Cyan’s former Chief Financial Officer, and the underwriters of Cyan’s initial public offering. On April 30, 2014, a substantially similar lawsuit was filed in the same court against the same defendants. The two cases have been consolidated as Beaver County Employees Retirement Fund, et al. v. Cyan, Inc. et al., Case No. CGC-14-538355. The consolidated complaint alleges violations of federal securities laws on behalf of a purported class consisting of purchasers of Cyan’s common stock pursuant or traceable to the registration statement and prospectus for Cyan’s initial public offering in April 2013, and seeks unspecified compensatory damages and other relief. In July 2014, the defendants filed a demurrer to the consolidated complaint, which the court overruled in October 2014 and allowed the case to proceed. On May 19, 2015, the proposed class was certified. On August 25, 2015, the defendants filed a motion for judgment on the pleadings based on an alleged lack of subject matter jurisdiction over the case, which motion was denied on October 23, 2015. Ciena believes that the consolidated lawsuit is without merit and intends to defend it vigorously.
On May 29, 2008, Graywire, LLC filed a complaint in the United States District Court for the Northern District of Georgia against Ciena and
four
other defendants, alleging, among other things, that certain of the parties' products infringe U.S. Patent 6,542,673 (the “'673 Patent”), relating to an identifier system and components for optical assemblies. The complaint seeks injunctive relief and damages. In July 2009, upon request of Ciena and certain other defendants, the U.S. Patent and Trademark Office (“PTO”) granted the defendants'
inter partes
application for reexamination with respect to certain claims of the '673 Patent, and the district court granted the defendants' motion to stay the case pending reexamination of all of the patents-in-suit. In December 2010, the PTO confirmed the validity of some claims and rejected the validity of other claims of the '673 Patent, to which Ciena and other defendants filed an appeal. On March 16, 2012, the PTO on appeal rejected multiple claims of the '673 Patent, including the
two
claims on which Ciena is alleged to infringe. Subsequently, the plaintiff requested a reopening of the prosecution of the '673 Patent, which request was denied by the PTO on April 29, 2013. Thereafter, on May 28, 2013, the plaintiff filed an amendment with the PTO in which it canceled the claims of the '673 Patent on which Ciena is alleged to infringe. The case currently remains stayed, and there can be no assurance as to whether or when the stay will be lifted.
In addition to the matters described above, Ciena is subject to various legal proceedings and claims arising in the ordinary course of business, including claims against third parties that may involve contractual indemnification obligations on the part of Ciena. Ciena does not expect that the ultimate costs to resolve these matters will have a material effect on its results of operations, financial position or cash flows.
Lease Commitments
Ciena has certain minimum obligations under non-cancelable leases expiring on various dates through
2032
for equipment and facilities. The following table summarizes our future annual minimum lease commitments under non-cancelable leases that are not recorded on the balance as of
October 31, 2015
(in thousands):
|
2016
|
2017
|
2018
|
2019
|
2020
|
Thereafter
|
Total
|
||||||||||||||||||||||
|
Operating leases
|
$
|
32,480
|
|
$
|
30,030
|
|
$
|
18,823
|
|
$
|
12,279
|
|
$
|
9,693
|
|
$
|
46,449
|
|
$
|
149,754
|
|
|||||||
|
Other lease commitments
(1)
|
646
|
|
1,731
|
|
6,081
|
|
6,081
|
|
6,146
|
|
82,139
|
|
102,824
|
|
||||||||||||||
|
Total
|
$
|
33,126
|
|
$
|
31,761
|
|
$
|
24,904
|
|
$
|
18,360
|
|
$
|
15,839
|
|
$
|
128,588
|
|
$
|
252,578
|
|
|||||||
(1) Represents the expected timing and amounts of payments for rent associated with capital and build-to-suit lease arrangements that have not yet been placed into service. For future payments related to capital leases that have been placed into service, see Note
12
above.
107
Rental expense for fiscal
2013
, fiscal
2014
and fiscal
2015
was approximately
$26.0 million
,
$22.9 million
and
$25.7 million
, respectively. In addition, Ciena paid approximately
$1.6 million
,
$0.5 million
and
$0.8 million
during fiscal
2013
, fiscal
2014
and fiscal
2015
, respectively, related to rent costs for restructured facilities and unfavorable lease commitments, which were offset against Ciena’s restructuring liabilities and unfavorable lease obligations. The amount for operating lease commitments above does not include variable expenses relating to insurance, taxes, maintenance and other costs required by the applicable operating lease. These costs are not expected to have a material impact on Ciena's financial condition, results of operations or cash flows.
(24) SUBSEQUENT EVENT
During the first quarter of fiscal 2016, Ciena reorganized its internal organizational structure, management of its business and the reporting of its operating segments. In connection with the creation of its new Chief Operating Officer organization, Ciena has reorganized the management of its business resulting in
three
operating segments: Networking Platforms; Software and Software-Related Services; and Global Services. As a result of this reorganization, the Converged Packet-Optical, Packet Networking and Optical Transport segments were realigned to form a new Networking Platforms segment under a single operating segment manager. Ciena's existing Software and Service operating segment was reorganized into
two
separate operating segments; Software and Software-Related Services and Global Services. The Software and Software-Related Services segment will include sales of Ciena's network virtualization, management, control and orchestration software solutions and software-related services, including subscription, installation, support and consulting services. The Global Services segment will include sales of a broad range of services for consulting and network design, installation and deployment, maintenance support and training activities.
None.
108
Disclosure Controls and Procedures
As of the end of the period covered by this report, we carried out an evaluation under the supervision and with the participation of management, including our Chief Executive Officer and Chief Financial Officer, of our disclosure controls and procedures (as defined in Rules 13a-15(e) and 15d-15(e) under the Securities Exchange Act of 1934, as amended). Based upon this evaluation, our Chief Executive Officer and Chief Financial Officer concluded that our disclosure controls and procedures were effective as of the end of the period covered by this report.
Changes in Internal Control over Financial Reporting
There was no change in our internal control over financial reporting (as defined in Rules 13a-15(f) and 15d-15(f) under the Securities Exchange Act of 1934, as amended) during the most recently completed fiscal quarter that has materially affected, or is reasonably likely to materially affect, our internal control over financial reporting.
Report of Management on Internal Control Over Financial Reporting
The management of Ciena Corporation is responsible for establishing and maintaining adequate internal control over financial reporting (as defined in Rules 13a-15(f) and 15d-15(f) under the Securities Exchange Act of 1934).
The internal control over financial reporting at Ciena Corporation was designed to provide reasonable assurance regarding the reliability of financial reporting and the preparation of financial statements for external purposes in accordance with accounting principles generally accepted in the United States of America. Internal control over financial reporting includes those policies and procedures that:
|
•
|
pertain to the maintenance of records that, in reasonable detail, accurately and fairly reflect the transactions and dispositions of the assets of Ciena Corporation;
|
|
•
|
provide reasonable assurance that transactions are recorded as necessary to permit preparation of financial statements in accordance with accounting principles generally accepted in the United States of America;
|
|
•
|
provide reasonable assurance that receipts and expenditures of Ciena Corporation are being made only in accordance with authorization of management and directors of Ciena Corporation; and
|
|
•
|
provide reasonable assurance regarding prevention or timely detection of unauthorized acquisition, use or disposition of assets that could have a material effect on the consolidated financial statements.
|
Because of its inherent limitations, internal control over financial reporting may not prevent or detect misstatements.
Management of Ciena Corporation assessed the effectiveness of the company’s internal control over financial reporting as of
October 31, 2015
. Management based this assessment on criteria for effective internal control over financial reporting described in “Internal Control — Integrated Framework” issued by the Committee of Sponsoring Organizations of the Treadway Commission. Based on this assessment, management determined that, as of
October 31, 2015
, Ciena Corporation maintained effective internal control over financial reporting. Management reviewed the results of its assessment with the Audit Committee of our Board of Directors.
PricewaterhouseCoopers LLP, independent registered public accounting firm, who audited and reported on the consolidated financial statements of Ciena Corporation included in this annual report, has also audited the effectiveness of Ciena Corporation’s internal control over financial reporting as of
October 31, 2015
, as stated in its report appearing in Item 8 of Part II of this annual report.
|
/s/ Gary B. Smith
|
/s/ James E. Moylan, Jr.
|
||
|
Gary B. Smith
|
|
James E. Moylan, Jr.
|
|
|
President and Chief Executive Officer
|
|
Senior Vice President and Chief Financial Officer
|
|
|
December 21, 2015
|
|
December 21, 2015
|
|
None.
109
Information relating to Ciena’s directors and executive officers is set forth in Part I of this annual report under the caption "Item 1. Business—Directors and Executive Officers.”
Additional information responsive to this item concerning our Audit Committee and regarding compliance with Section 16(a) of the Exchange Act is incorporated herein by reference from Ciena’s definitive proxy statement with respect to our
2016
Annual Meeting of Stockholders to be filed with the SEC within 120 days after the end of the fiscal year covered by this Form 10-K.
As part of our system of corporate governance, our board of directors has adopted a code of ethics that is specifically applicable to our chief executive officer and senior financial officers. This Code of Ethics for Senior Financial Officers, as well as our Code of Business Conduct and Ethics, applicable to all directors, officers and employees, are available on the "Corporate Governance" page of our website at
http://www.ciena.com
. We intend to satisfy any disclosure requirement under Item 5.05 of Form 8-K regarding an amendment to, or waiver from, a provision of the Code of Ethics for Senior Financial Officers, by posting such information on our website at the address above.
Information responsive to this item is incorporated herein by reference from Ciena’s definitive proxy statement with respect to our
2016
Annual Meeting of Stockholders to be filed with the SEC within 120 days after the end of the fiscal year covered by this Form 10-K.
Information responsive to this item is incorporated herein by reference from Ciena’s definitive proxy statement with respect to our
2016
Annual Meeting of Stockholders to be filed with the SEC within 120 days after the end of the fiscal year covered by this Form 10-K.
Information responsive to this item is incorporated herein by reference from Ciena’s definitive proxy statement with respect to our
2016
Annual Meeting of Stockholders to be filed with the SEC within 120 days after the end of the fiscal year covered by this Form 10-K.
Information responsive to this item is incorporated herein by reference from Ciena’s definitive proxy statement with respect to our
2016
Annual Meeting of Stockholders to be filed with the SEC within 120 days after the end of the fiscal year covered by this Form 10-K.
110
|
(a)
|
1. The information required by this item is included in Item 8 of Part II of this annual report.
|
|
2.
|
The information required by this item is included in Item 8 of Part II of this annual report.
|
|
3.
|
Exhibits: See Index to Exhibits, which is incorporated by reference in this Item. The Exhibits listed in the accompanying Index to Exhibits are filed herewith or incorporated by reference as part of this annual report.
|
|
(b)
|
Exhibits. See Index to Exhibits, which is incorporated by reference in this Item. The Exhibits listed in the accompanying Index to Exhibits are filed herewith or incorporated by reference as part of this annual report.
|
|
(c)
|
Not applicable.
|
111
SIGNATURES
Pursuant to the requirements of Section 13 or 15(d) of the Securities Exchange Act of 1934, the Registrant has duly caused this report to be signed on its behalf by the undersigned, thereunto duly authorized on the
21st day of December 2015
.
|
Ciena Corporation
|
|
||
|
By:
|
/s/ Gary B. Smith
|
|
|
|
Gary B. Smith
|
|
||
|
President, Chief Executive Officer and Director
|
|
||
Pursuant to the requirements of the Securities Exchange Act of 1934, this report has been signed below by the following persons on behalf of the Registrant and in the capacities and on the date indicated.
|
Signatures
|
Title
|
|
Date
|
|
|
/s/ Patrick H. Nettles, Ph.D.
|
|
Executive Chairman of the Board of Directors
|
|
December 21, 2015
|
|
Patrick H. Nettles, Ph.D.
|
|
|
|
|
|
/s/ Gary B. Smith
|
|
President, Chief Executive Officer and Director
|
|
December 21, 2015
|
|
Gary B. Smith
(Principal Executive Officer)
|
|
|
|
|
|
/s/ James E. Moylan, Jr.
|
|
Sr. Vice President, Finance and Chief Financial Officer
|
|
December 21, 2015
|
|
James E. Moylan, Jr.
(Principal Financial Officer)
|
|
|
|
|
|
/s/ Andrew C. Petrik
|
|
Vice President, Controller
|
|
December 21, 2015
|
|
Andrew C. Petrik
(Principal Accounting Officer)
|
|
|
|
|
|
/s/ Harvey B. Cash
|
|
Director
|
|
December 21, 2015
|
|
Harvey B. Cash
|
|
|
|
|
|
/s/ Bruce L. Claflin
|
|
Director
|
|
December 21, 2015
|
|
Bruce L. Claflin
|
|
|
|
|
|
/s/ Lawton W. Fitt
|
|
Director
|
|
December 21, 2015
|
|
Lawton W. Fitt
|
|
|
|
|
|
/s/ Patrick T. Gallagher
|
|
Director
|
|
December 21, 2015
|
|
Patrick T. Gallagher
|
|
|
|
|
|
/s/ T. Michael Nevens
|
Director
|
December 21, 2015
|
||
|
T. Michael Nevens
|
||||
|
/s/ Judith M. O’Brien
|
|
Director
|
|
December 21, 2015
|
|
Judith M. O’Brien
|
|
|
|
|
|
/s/ Michael J. Rowny
|
|
Director
|
|
December 21, 2015
|
|
Michael J. Rowny
|
||||
112
INDEX TO EXHIBITS
|
|
|
Incorporated by Reference
|
|
|||||||
|
|
|
Form and
|
|
|
Filed
|
|||||
|
Exhibit
|
|
Registration or
|
|
|
Here-
|
|||||
|
Number
|
Exhibit Description
|
Commission No.
|
Exhibit
|
Filing Date
|
with (X)
|
|||||
|
2.1
|
Agreement and Plan of Merger, dated as of May 3, 2015, among Ciena Corporation, Neptune Acquisition Subsidiary, Inc. and Cyan, Inc.
|
8-K (000-21969)
|
2.1
|
5/4/2015
|
||||||
|
2.2
|
Amendment No. 1, dated as of June 2, 2015, to Agreement and Plan of Merger, dated as of May 3, 2015, among Ciena Corporation, Cyan, Inc. and Neptune Acquisition Subsidiary, Inc.
|
S-4 (333-204732)
|
Annex A
|
6/4/2015
|
||||||
|
3.1
|
Amended and Restated Certificate of Incorporation of Ciena Corporation
|
8-K (000-21969)
|
3.1
|
3/27/2008
|
||||||
|
3.2
|
Amended and Restated Bylaws of Ciena Corporation
|
8-K (000-21969)
|
3.1
|
8/28/2008
|
||||||
|
4.1
|
Specimen Stock Certificate
|
10-K (000-21969)
|
4.1
|
12/27/2007
|
||||||
|
4.2
|
Indenture dated June 11, 2007 between Ciena Corporation and The Bank of New York, as trustee, for 0.875% Convertible Senior Notes due 2017, including the Form of Global Note attached as Exhibit A thereto
|
8-K (000-21969)
|
4.7
|
6/12/2007
|
||||||
|
4.3
|
Indenture dated October 18, 2010 between Ciena Corporation and The Bank of New York Mellon Trust Company, N.A., as trustee, for 3.75% Convertible Senior Notes due 2018, including the Form of Global Note attached as Exhibit A thereto
|
8-K (000-21969)
|
4.1
|
10/21/2010
|
||||||
|
4.4
|
Indenture dated December 27, 2012 between Ciena Corporation and The Bank of New York Mellon Trust Company, N.A., as trustee, for 4.0% Convertible Senior Notes due 2020, including the Form of Global Note attached as Exhibit A thereto
|
8-K (000-21969)
|
4.1
|
12/31/2012
|
||||||
|
10.1
|
1999 Non-Officer Stock Option Plan and Form of Stock Option Agreement*
|
10-K (000-21969)
|
10.22
|
12/10/1999
|
||||||
|
10.2
|
Amendment No. 1 to 1999 Non-Officer Stock Option Plan*
|
10-K (000-21969)
|
10.25
|
12/13/2001
|
||||||
|
10.3
|
Catena Networks, Inc. 1998 Equity Incentive Plan, as amended*
|
10-Q (000-21969)
|
10.38
|
5/20/2004
|
||||||
|
10.4
|
Internet Photonics, Inc. Amended and Restated 2000 Corporate Stock Option Plan*
|
10-Q (000-21969)
|
10.39
|
5/20/2004
|
||||||
|
10.5
|
Ciena Corporation 2000 Equity Incentive Plan (Amended and Restated ONI Systems Corp. 2000 Equity Incentive Plan)*
|
10-K (000-21969)
|
10.37
|
12/11/2003
|
||||||
|
10.6
|
Form of Stock Option Award Agreement for executive officers under Ciena Corporation 2000 Equity Incentive Plan*
|
8-K (000-21969)
|
10.1
|
11/4/2005
|
||||||
|
10.7
|
Form of Restricted Stock Unit Agreement for executive officers under Ciena Corporation 2000 Equity Incentive Plan*
|
8-K (000-21969)
|
10.2
|
11/4/2005
|
||||||
|
10.8
|
Form of Performance Stock Unit Award Agreement for executive officers under Ciena Corporation 2000 Equity Incentive Plan*
|
8-K (000-21969)
|
10.3
|
11/4/2005
|
||||||
|
10.9
|
Form of Non-Statutory Stock Option Award Agreement for directors under Ciena Corporation 2000 Equity Incentive Plan*
|
8-K (000-21969)
|
10.4
|
11/4/2005
|
|
|||||
113
|
|
|
Incorporated by Reference
|
|
|||||||
|
|
|
Form and
|
|
|
Filed
|
|||||
|
Exhibit
|
|
Registration or
|
|
|
Here-
|
|||||
|
Number
|
Exhibit Description
|
Commission No.
|
Exhibit
|
Filing Date
|
with (X)
|
|||||
|
10.10
|
Form of Restricted Stock Unit Award Agreement for directors under Ciena Corporation 2000 Equity Incentive Plan*
|
8-K (000-21969)
|
10.5
|
11/4/2005
|
|
|||||
|
10.11
|
Amended and Restated 2003 Employee Stock Purchase Plan*
|
8-K (000-21969)
|
10.2
|
3/23/2012
|
||||||
|
10.12
|
Employee Stock Purchase Plan Enrollment Agreement*
|
10-K (000-21969)
|
|
10.33
|
|
12/22/2011
|
||||
|
10.13
|
1996 Outside Directors Stock Option Plan*
|
S-1 (333-17729)
|
10.4
|
12/12/1996
|
|
|||||
|
10.14
|
Forms of 1996 Outside Directors Stock Option Agreement*
|
S-1 (333-17729)
|
10.5
|
12/12/1996
|
|
|||||
|
10.15
|
Third Amended and Restated 1994 Stock Option Plan*
|
S-1 (333-17729)
|
10.2
|
12/12/1996
|
|
|||||
|
10.16
|
Amended and Restated 1994 Stock Option Plan Forms of Employee Stock Option Agreement*
|
S-1 (333-17729)
|
10.3
|
12/12/1996
|
|
|||||
|
10.17
|
2008 Omnibus Incentive Plan*
|
8-K (000-21969)
|
10.1
|
3/27/2008
|
|
|||||
|
10.18
|
Amendment (No. 1) to Ciena Corporation 2008 Omnibus Incentive Plan dated April 14, 2010*
|
8-K (000-21969)
|
10.1
|
4/15/2010
|
|
|||||
|
10.19
|
Amendment (No. 2) to Ciena Corporation 2008 Omnibus Incentive Plan dated March 21, 2012*
|
8-K (000-21969)
|
10.1
|
3/23/2012
|
||||||
|
10.20
|
Amendment (No. 3) to Ciena Corporation 2008 Omnibus Incentive Plan dated April 10, 2014*
|
10-Q (001-36250)
|
10.1
|
6/11/2014
|
||||||
|
10.21
|
Form of 2008 Omnibus Incentive Plan Restricted Stock Unit Agreement (Employee)*
|
10-K (000-21969)
|
10.18
|
12/22/2011
|
||||||
|
10.22
|
Form of 2008 Omnibus Incentive Plan Non-Qualified Stock Option Agreement (Employee)*
|
10-Q (000-21969)
|
10.2
|
6/4/2009
|
|
|||||
|
10.23
|
Form of 2008 Omnibus Incentive Plan Restricted Stock Unit Agreement (Director)*
|
10-Q (000-21969)
|
10.3
|
6/4/2009
|
||||||
|
10.24
|
Form of Indemnification Agreement with Directors and Executive Officers*
|
10-Q (000-21969)
|
10.1
|
3/3/2006
|
|
|||||
|
10.25
|
Amended and Restated Change in Control Severance Agreement dated November 1, 2013, between Ciena Corporation and Gary B. Smith*
|
8-K (000-21969)
|
10.1
|
11/01/2013
|
||||||
|
10.26
|
Form of Amended and Restated Change in Control Severance Agreement between Ciena Corporation and Executive Officers*
|
8-K (000-21969)
|
10.2
|
11/01/2013
|
||||||
|
10.27
|
Ciena Corporation Directors Restricted Stock Deferral Plan*
|
10-Q (000-21969)
|
10.1
|
8/31/2007
|
|
|||||
|
10.28
|
Ciena Corporation Amended and Restated Incentive Bonus Plan, as amended December 15, 2011*
|
10-K (000-21969)
|
10.26
|
12/22/2011
|
||||||
|
10.29
|
Ciena Corporation 2010 Inducement Equity Award Plan*
|
10-K (000-21969)
|
10.35
|
12/22/2009
|
|
|||||
|
10.30
|
Form of 2010 Inducement Equity Award Plan Restricted Stock Unit Agreement*
|
8-K (000-21969)
|
10.2
|
3/25/2010
|
|
|||||
|
10.31
|
U.S. Executive Severance Benefit Plan*
|
10-Q (000-21969)
|
10.1
|
6/9/2011
|
|
|||||
|
10.32
|
Lease Agreement dated as of March 19, 2010 between Ciena Canada, Inc. and Nortel Networks Technology Corp.#
|
10-Q (000-21969)
|
10.1
|
6/10/2010
|
|
|||||
|
10.33
|
Lab 10 Lease Amending Agreement dated February 13, 2012 between Her Majesty the Queen in Right of Canada, as Represented by the Minister of Public Works and Government Services, and Ciena Canada, Inc.
|
8-K (000-21969)
|
1.1
|
2/15/2012
|
||||||
114
|
|
|
Incorporated by Reference
|
|
|||||||
|
|
|
Form and
|
|
|
Filed
|
|||||
|
Exhibit
|
|
Registration or
|
|
|
Here-
|
|||||
|
Number
|
Exhibit Description
|
Commission No.
|
Exhibit
|
Filing Date
|
with (X)
|
|||||
|
10.34
|
Second Lease Amending Agreement dated August 29, 2013 by and between Her Majesty the Queen in Right of Canada, as Represented by the Minister of Public Works and Government Services, as landlord, and Ciena Canada, Inc., as tenant
|
8-K (000-21969)
|
|
8/3/2013
|
||||||
|
10.35
|
Third Lease Amending Agreement dated July 11, 2014 by and between Her Majesty the Queen in Right of Canada, as Represented by the Minister of Public Works and Government Services, as landlord, and Ciena Canada, Inc., as tenant
|
8-K (001-36250)
|
10.1
|
7/11/2014
|
||||||
|
10.36
|
Lab 10 Lease Amending Agreement dated February 13, 2012 between Her Majesty the Queen in Right of Canada, as Represented by the Minister of Public Works and Government Services, and Ciena Canada, Inc.
|
8-K (000-21969)
|
1.1
|
2/15/2012
|
||||||
|
10.37
|
Second Lease Amending Agreement dated August 29, 2013 by and between Her Majesty the Queen in Right of Canada, as Represented by the Minister of Public Works and Government Services, as landlord, and Ciena Canada, Inc., as tenant
|
8-K (000-21969)
|
10.1
|
8/3/2013
|
||||||
|
10.38
|
Third Lease Amending Agreement dated July 11, 2014 by and between Her Majesty the Queen in Right of Canada, as Represented by the Minister of Public Works and Government Services, as landlord, and Ciena Canada, Inc., as tenant
|
8-K (001-36250)
|
10.1
|
7/11/2014
|
||||||
|
10.39
|
Lease Agreement by and between Ciena Canada, Inc. and Innovation Blvd. II Limited dated as of October 23, 2014+
|
—
|
|
—
|
|
—
|
X
|
|||
|
10.40
|
Amendment No. 1 to the Lease Agreement dated October 23, 2014, between Innovations Blvd II Limited and Ciena Canada, Inc., dated April 15, 2015.
|
8-K (001-36250)
|
10.3
|
6/3/2015
|
||||||
|
10.41
|
Intellectual Property License Agreement dated as of March 19, 2010 between Ciena Luxembourg S.a.r.l. and Nortel Networks Limited#
|
10-Q (000-21969)
|
10.3
|
6/10/2010
|
|
|||||
|
10.42
|
Lease Agreement dated November 3, 2011 between Ciena Corporation and W2007 RDG Realty, L.L.C. ++
|
10-K (000-21969)
|
|
10.34
|
|
12/22/2011
|
||||
|
10.43
|
ABL Credit Agreement, dated August 13, 2012, by and among Ciena Corporation, Ciena Communications, Inc. and Ciena Canada, Inc., as the borrowers, the lenders party thereto, Deutsche Bank AG New York Branch, as administrative agent and collateral agent, Bank of America, N.A., as syndication agent, and Morgan Stanley Senior Funding, Inc. and Wells Fargo Bank, National Association, as co-documentation agents ++
|
10-Q (000-21969)
|
10.1
|
9/5/2012
|
||||||
|
10.44
|
Amendment to ABL Credit Agreement, dated August 24, 2012, by and among Ciena Corporation, Ciena Communications, Inc. and Ciena Canada, Inc., as the borrowers, and Deutsche Bank AG New York Branch, as administrative agent ++
|
10-Q (000-21969)
|
10.2
|
9/5/2012
|
||||||
|
10.45
|
Omnibus Second Amendment to ABL Credit Agreement and First Amendment to U.S. Security Agreement, Canadian Security Agreement, U.S. Pledge Agreement, U.S. Guaranty and Canadian Guaranty, entered into as of March 5, 2013, by and among Ciena Corporation, Ciena Communications, Inc., Ciena Canada, Inc., and Deutsche Bank AG New York Branch
|
10-Q (000-21969)
|
10.2
|
3/13/2013
|
||||||
115
|
|
|
Incorporated by Reference
|
|
|||||||
|
|
|
Form and
|
|
|
Filed
|
|||||
|
Exhibit
|
|
Registration or
|
|
|
Here-
|
|||||
|
Number
|
Exhibit Description
|
Commission No.
|
Exhibit
|
Filing Date
|
with (X)
|
|||||
|
10.46
|
Third Amendment to ABL Credit Agreement, dated July 15, 2014 by and among Ciena Corporation, Ciena Communications, Inc., Ciena Government Solutions, Inc. Ciena Canada, Inc., Deutsche Bank AG New York Branch, as administrative agent and collateral agent, and the lenders party thereto.
|
10-Q (001-36250)
|
10.1
|
9/9/2014
|
||||||
|
10.47
|
Omnibus Fourth Amendment to Credit Agreement and First Amendment to U.S. Pledge Agreement and Canadian Pledge Agreement, dated April 15, 2015.
|
8-K (001-36250)
|
10.2
|
6/3/2015
|
||||||
|
10.48
|
Fifth Amendment to ABL Credit Agreement dated July 2, 2015, by and among Ciena Corporation, Ciena Communications, Inc., Ciena Government Solutions, Inc. Ciena Canada, Inc., Deutsche Bank AG New York Branch, as administrative agent and collateral agent, and the lenders party thereto.
|
10-Q (001-36250)
|
10.2
|
9/9/2015
|
||||||
|
10.49
|
Joinder Agreement under ABL Credit Agreement and Related Agreements as of March 15, 2013 by and between Ciena Government Solutions, Inc. and Deutsche Bank AG New York Branch, as Administrative Agent and as Collateral Agent, for the benefit of the Secured Creditors++
|
10-Q (000-21969)
|
10.2
|
6/12/2013
|
||||||
|
10.50
|
Amended and Restated Security Agreement, dated August 13, 2012, amended and restated as of July 15, 2014, by and among Ciena Corporation, Ciena Communications, Inc., Ciena Government Solutions, Inc., and Deutsche Bank AG New York Branch, as Collateral Agent++
|
10-Q (001-36250)
|
10.2
|
9/9/2014
|
||||||
|
10.51
|
Amended and Restated Pledge Agreement, dated August 13, 2012, amended and restated as of July 15, 2014, by and among Ciena Corporation, Ciena Communications, Inc., Ciena Government Solutions, Inc., and Deutsche Bank AG New York Branch, as Pledgee++
|
10-Q (001-36250)
|
10.3
|
9/9/2014
|
||||||
|
10.52
|
U.S. Guaranty, dated August 13, 2012, by and among Ciena Corporation and Ciena Communications, Inc., as guarantors, and Deutsche Bank AG New York Branch, as administrative agent ++
|
10-Q (000-21969)
|
10.5
|
9/5/2012
|
||||||
|
10.53
|
Canadian Guaranty, dated August 13, 2012, by and between Ciena Canada, Inc., as guarantor, and Deutsche Bank AG New York Branch, as administrative agent ++
|
10-Q (000-21969)
|
10.7
|
9/5/2012
|
||||||
|
10.54
|
Amended and Restated Canadian Security Agreement, dated August 13, 2012, amended and restated as of July 15, 2014, by and among Ciena Canada, Inc., each other assignor from time to time party thereto, and Deutsche Bank AG New York Branch, as Collateral Agent.++
|
10-Q (001-36250)
|
10.4
|
9/9/2014
|
||||||
|
10.55
|
Credit Agreement, dated July 15, 2014, by and among Ciena Corporation, the lenders party thereto, and Bank of America, N.A., as Administrative Agent++
|
10-Q (001-36250)
|
10.5
|
9/9/2014
|
||||||
|
10.56
|
First Amendment to Credit Agreement, dated July 15, 2014 and First Amendment to Certain Pledge Agreements (U.S. Pledge Agreement, dated July 15, 2014 and Canadian Pledge Agreement, dated December 12, 2014), dated April 15, 2015.++
|
8-K (001-36250)
|
10.1
|
6/3/2015
|
||||||
|
10.57
|
Second Amendment to Credit Agreement, dated July 2, 2015, by and among Ciena Corporation, the lenders party thereto, and Bank of America, N.A., as Administrative Agent. ++
|
10-Q (001-36250)
|
10.1
|
9/9/2015
|
||||||
116
|
|
|
Incorporated by Reference
|
|
|||||||
|
|
|
Form and
|
|
|
Filed
|
|||||
|
Exhibit
|
|
Registration or
|
|
|
Here-
|
|||||
|
Number
|
Exhibit Description
|
Commission No.
|
Exhibit
|
Filing Date
|
with (X)
|
|||||
|
10.58
|
Guaranty, dated July 15, 2014, by and among Ciena Communications, Inc., Ciena Government Solutions, Inc. and Bank of America, N.A., as Administrative Agent.++
|
10-Q (001-36250)
|
10.6
|
9/9/2014
|
||||||
|
10.59
|
Term Loan Security Agreement, dated July 15, 2014, by and among Ciena Corporation, Ciena Communications, Inc., Ciena Government Solutions, Inc., and Bank of America, N.A., as Collateral Agent. ++
|
10-Q (001-36250)
|
10.7
|
9/9/2014
|
||||||
|
10.60
|
Term Loan Pledge Agreement, dated July 15, 2014, by and among Ciena Corporation, Ciena Communications, Inc., Ciena Government Solutions, Inc., and Bank of America, N.A., as Pledgee.++
|
10-Q (001-36250)
|
10.8
|
9/9/2014
|
||||||
|
10.61
|
Cyan, Inc. 2006 Stock Plan
|
S-1 (333-187732)
|
10.2.1
|
4/4/2013
|
||||||
|
10.62
|
Cyan, Inc. 2013 Equity Incentive Plan
|
S-1 (333-187732)
|
10.3.1
|
4/4/2013
|
||||||
|
10.63
|
Lease Agreement between Ciena Canada, Inc. and Innovation Blvd. II Limited, dated April 15, 2015
|
8-K (001-36250)
|
10.4
|
6/3/2015
|
||||||
|
12.1
|
|
Computation of Earnings to Fixed Charges
|
|
—
|
|
—
|
|
—
|
|
X
|
|
21.1
|
|
Subsidiaries of registrant
|
|
—
|
|
—
|
|
—
|
|
X
|
|
23.1
|
|
Consent of Independent Registered Public Accounting Firm
|
|
—
|
|
—
|
|
—
|
|
X
|
|
31.1
|
|
Certification of Chief Executive Officer Pursuant to Rule 13a-14(a) under the Securities Exchange Act of 1934 as Adopted Pursuant to Section 302 of the Sarbanes-Oxley Act of 2002
|
|
—
|
|
—
|
|
—
|
|
X
|
|
31.2
|
|
Certification of Chief Financial Officer Pursuant to Rule 13a-14(a) under the Securities Exchange Act of 1934 as Adopted Pursuant to Section 302 of the Sarbanes-Oxley Act of 2002
|
|
—
|
|
—
|
|
—
|
|
X
|
|
32.1
|
|
Certification of Chief Executive Officer Pursuant to 18 U.S.C. Section 1350 as Adopted Pursuant to Section 906 of the Sarbanes-Oxley Act of 2002
|
|
—
|
|
—
|
|
—
|
|
X
|
|
32.2
|
|
Certification of Chief Financial Officer Pursuant to 18 U.S.C. Section 1350 as Adopted Pursuant to Section 906 of the Sarbanes-Oxley Act of 2002
|
|
—
|
|
—
|
|
—
|
|
X
|
|
101.INS
|
|
XBRL Instance Document
|
|
—
|
|
—
|
|
—
|
|
X
|
|
101.SCH
|
|
XBRL Taxonomy Extension Schema Document
|
|
—
|
|
—
|
|
—
|
|
X
|
|
101.CAL
|
|
XBRL Taxonomy Extension Calculation Linkbase Document
|
|
—
|
|
—
|
|
—
|
|
X
|
|
101.DEF
|
|
XBRL Taxonomy Extension Definition Linkbase Document
|
|
—
|
|
—
|
|
—
|
|
X
|
|
101.LAB
|
|
XBRL Taxonomy Extension Label Linkbase Document
|
|
—
|
|
—
|
|
—
|
|
X
|
|
101.PRE
|
|
XBRL Taxonomy Extension Presentation Linkbase Document
|
|
—
|
|
—
|
|
—
|
|
X
|
117
________________________________
|
*
|
|
Represents management contract or compensatory plan or arrangement
|
|
+
|
|
Pursuant to Item 601(b)(2) of Regulation S-K, certain schedules and exhibits referenced in the table of contents have been omitted. Ciena hereby agrees to furnish supplementally a copy of any omitted exhibit or schedule to the SEC upon request. In addition, representations and warranties included in these agreements, as amended, were made by the parties to one another in connection with a negotiated transaction. These representations and warranties were made as of specific dates, only for purposes of these agreements and for the benefit of the parties thereto. These representations and warranties were subject to important exceptions and limitations agreed upon by the parties, including being qualified by confidential disclosures, made for the purposes of allocating contractual risk between the parties rather than establishing these matters as facts. These agreements are filed with this report only to provide investors with information regarding its terms and conditions, and not to provide any other factual information regarding Ciena or any other party thereto. Accordingly, investors should not rely on the representations and warranties contained in these agreements or any description thereof as characterizations of the actual state of facts or condition of any party, its subsidiaries or affiliates. The information in these agreements should be considered together with Ciena’s public reports filed with the SEC.
|
|
++
|
Representations and warranties included in these agreements, as amended, were made by the parties to one another in connection with a negotiated transaction. These representations and warranties were made as of specific dates, only for purposes of these agreements and for the benefit of the parties thereto. These representations and warranties were subject to important exceptions and limitations agreed upon by the parties, including being qualified by confidential disclosures, made for the purposes of allocating contractual risk between the parties rather than establishing these matters as facts. These agreements are filed with this report only to provide investors with information regarding its terms and conditions, and not to provide any other factual information regarding Ciena or any other party thereto. Accordingly, investors should not rely on the representations and warranties contained in these agreements or any description thereof as characterizations of the actual state of facts or condition of any party, its subsidiaries or affiliates. The information in these agreements should be considered together with Ciena’s public reports filed with the SEC.
|
|
|
#
|
|
Certain portions of these documents have been omitted based on a request for confidential treatment submitted to the SEC. The non-public information that has been omitted from these documents has been separately filed with the SEC. Each redacted portion of these documents is indicated by a “[*]” and is subject to the request for confidential treatment submitted to the SEC. The redacted information is confidential information of the Registrant.
|
118
TABLE OF CONTENTS
Part IItem 1. BusinessItem 1A. Risk FactorsItem 1B. Unresolved Staff CommentsItem 2. PropertiesItem 3. Legal ProceedingsItem 4. Mine Safety DisclosuresPart IIItem 5. Market For Registrant S Common Stock, Related Stockholder Matters and Issuer Purchases Of Equity SecuritiesItem 6. Selected Consolidated Financial DataItem 7. Management's Discussion and Analysis Of Financial Condition and Results Of OperationsItem 7A. Quantitative and Qualitative Disclosures About Market RiskItem 8. Financial Statements and Supplementary DataItem 9. Changes in and Disagreements with Accountants on Accounting and Financial DisclosureItem 9A. Controls and ProceduresItem 9B. Other InformationPart IIIItem 10. Directors, Executive Officers and Corporate GovernanceItem 11. Executive CompensationItem 12. Security Ownership Of Certain Beneficial Owners and Management and Related Stockholder MattersItem 13. Certain Relationships and Related Transactions, and Director IndependenceItem 14. Principal Accountant Fees and ServicesPart IVItem 15. Exhibits and Financial Statement Schedules