Table of Contents
SECURITIES AND EXCHANGE COMMISSION
| o | REGISTRATION STATEMENT PURSUANT TO SECTION 12(b) OR 12(g) OF THE SECURITIES EXCHANGE ACT OF 1934 |
| þ | ANNUAL REPORT PURSUANT TO SECTION 13 OR 15(d) OF THE SECURITIES EXCHANGE ACT OF 1934 |
| o | TRANSITION REPORT PURSUANT TO SECTION 13 OR 15(d) OF THE SECURITIES EXCHANGE ACT OF 1934 |
| o |
SHELL COMPANY REPORT PURSUANT TO SECTION 13 OR 15(d) OF THE SECURITIES EXCHANGE ACT OF 1934
|

(Jurisdiction of incorporation or organization)
Xicheng District
Beijing 100033, China
(Address of principal executive offices)
16 Financial Street
Xicheng District
Beijing 100033, China
Tel: (86-10) 6363-1191
Fax: (86-10) 6657-5112
Email: liyh@e-chinalife.com
(Name, Telephone, Email and/or Facsimile Number and Address of Company Contact Person)
| Title of each class | Name of each exchange on which registered | |
| American depositary shares | New York Stock Exchange | |
| H shares, par value RMB1.00 per share | New York Stock Exchange* |
| * | Not for trading, but only in connection with the listing on the New York Stock Exchange of American depositary shares, each representing 15 H shares. |
(Title of Class)
(Title of Class)
| Large accelerated filer þ | Accelerated filer o | Non-accelerated filer o |
Table of Contents
| 1 | ||||
|
|
||||
| 2 | ||||
|
|
||||
| 4 | ||||
|
|
||||
| 5 | ||||
|
|
||||
| 5 | ||||
|
|
||||
| 5 | ||||
|
|
||||
| 5 | ||||
|
|
||||
| 5 | ||||
|
|
||||
| 10 | ||||
|
|
||||
| 10 | ||||
|
|
||||
| 10 | ||||
|
|
||||
| 26 | ||||
|
|
||||
| 26 | ||||
|
|
||||
| 29 | ||||
|
|
||||
| 71 | ||||
|
|
||||
| 73 | ||||
|
|
||||
| 73 | ||||
|
|
||||
| 73 | ||||
|
|
||||
| 87 | ||||
|
|
||||
| 93 | ||||
|
|
||||
| 96 | ||||
|
|
||||
| 96 | ||||
|
|
||||
| 96 | ||||
|
|
||||
| 96 | ||||
|
|
||||
| 97 | ||||
|
|
||||
| 97 | ||||
|
|
||||
| 101 | ||||
|
|
||||
| 103 | ||||
|
|
||||
| 104 | ||||
|
|
||||
| 105 | ||||
|
|
||||
| 105 | ||||
|
|
||||
| 105 | ||||
|
|
||||
| 106 | ||||
|
|
||||
| 110 | ||||
|
|
||||
| 110 | ||||
|
|
||||
| 110 | ||||
|
|
||||
| 112 | ||||
|
|
||||
| 112 | ||||
|
|
||||
| 117 | ||||
|
|
||||
| 118 | ||||
|
|
||||
| 118 | ||||
|
|
||||
| 118 | ||||
|
|
||||
| 133 |
i
Table of Contents
| 133 | ||||||||
|
|
||||||||
| 134 | ||||||||
|
|
||||||||
| 142 | ||||||||
|
|
||||||||
| 142 | ||||||||
|
|
||||||||
| 142 | ||||||||
|
|
||||||||
| 142 | ||||||||
|
|
||||||||
| 142 | ||||||||
|
|
||||||||
| 146 | ||||||||
|
|
||||||||
| 146 | ||||||||
|
|
||||||||
| 146 | ||||||||
|
|
||||||||
| 146 | ||||||||
|
|
||||||||
| 147 | ||||||||
|
|
||||||||
| 148 | ||||||||
|
|
||||||||
| 148 | ||||||||
|
|
||||||||
| 148 | ||||||||
|
|
||||||||
| 148 | ||||||||
|
|
||||||||
| 148 | ||||||||
|
|
||||||||
| 149 | ||||||||
|
|
||||||||
| 150 | ||||||||
|
|
||||||||
| 150 | ||||||||
|
|
||||||||
| 150 | ||||||||
|
|
||||||||
| 151 | ||||||||
|
|
||||||||
| 151 | ||||||||
|
|
||||||||
| 151 | ||||||||
|
|
||||||||
| 151 | ||||||||
|
|
||||||||
| 154 | ||||||||
|
|
||||||||
| 154 | ||||||||
|
|
||||||||
| 154 | ||||||||
|
|
||||||||
| 154 | ||||||||
|
|
||||||||
| Exhibit 1.1 | ||||||||
| Exhibit 4.6 | ||||||||
| Exhibit 4.13 | ||||||||
| Exhibit 8.1 | ||||||||
| Exhibit 12.1 | ||||||||
| Exhibit 12.2 | ||||||||
| Exhibit 13.1 | ||||||||
ii
Table of Contents
| • | future developments in the insurance industry in China; | ||
| • | the industry regulatory environment as well as the industry outlook generally; | ||
| • | the amount and nature of, and potential for, future development of our business; | ||
| • | the outcome of litigation and regulatory proceedings that we currently face or may face in the future; | ||
| • | our business strategy and plan of operations; | ||
| • | the prospective financial information regarding our business; | ||
| • | our dividend policy; and | ||
| • | information regarding our embedded value. |
1
Table of Contents
2
Table of Contents
3
Table of Contents
4
Table of Contents
| ITEM 1. | IDENTITY OF DIRECTORS, SENIOR MANAGEMENT AND ADVISERS. |
| ITEM 2. | OFFER STATISTICS AND EXPECTED TIMETABLE. |
| ITEM 3. | KEY INFORMATION. |
5
Table of Contents
| For the year ended December 31, | ||||||||||||
| IFRS | 2008 | 2009 | 2009 | |||||||||
| RMB | RMB | US$ | ||||||||||
| (in millions except for per share data) | ||||||||||||
|
|
||||||||||||
|
|
||||||||||||
|
|
||||||||||||
|
Revenues
|
||||||||||||
|
Gross written premiums
|
265,656 | 275,970 | 40,430 | |||||||||
|
Less: premiums ceded to reinsurers
|
(156 | ) | (158 | ) | (23 | ) | ||||||
|
|
||||||||||||
|
Net written premiums
|
265,500 | 275,812 | 40,407 | |||||||||
|
Net change in unearned premium reserves
|
(323 | ) | (735 | ) | (108 | ) | ||||||
|
|
||||||||||||
|
Net premiums earned
|
265,177 | 275,077 | 40,299 | |||||||||
|
|
||||||||||||
|
Investment income
|
44,946 | 38,890 | 5,697 | |||||||||
|
Net realized gains/(losses) on financial assets
|
(5,964 | ) | 21,244 | 3,112 | ||||||||
|
Net fair value gains/(losses) on assets at fair
value through income (held-for-trading)
|
(7,194 | ) | 1,449 | 212 | ||||||||
|
Other income
|
3,420 | 2,630 | 385 | |||||||||
|
|
||||||||||||
|
Total revenues
|
300,385 | 339,290 | 49,706 | |||||||||
|
|
||||||||||||
|
|
||||||||||||
|
Benefits, claims and expenses
|
||||||||||||
|
Insurance benefits and claims
|
||||||||||||
|
Life insurance death and other benefits
|
(89,659 | ) | (74,858 | ) | (10,967 | ) | ||||||
|
Accident and health claims and claim adjustment
expenses
|
(7,641 | ) | (7,808 | ) | (1,144 | ) | ||||||
|
Increase in insurance contracts liabilities
|
(134,649 | ) | (154,372 | ) | (22,616 | ) | ||||||
|
Investment contract benefits
|
(1,931 | ) | (2,142 | ) | (314 | ) | ||||||
|
Policyholder dividends resulting from
participation in profits
|
(1,671 | ) | (14,487 | ) | (2,122 | ) | ||||||
|
Underwriting and policy acquisition costs
|
(24,200 | ) | (22,936 | ) | (3,360 | ) | ||||||
|
Administrative expenses
|
(16,652 | ) | (18,719 | ) | (2,742 | ) | ||||||
|
Other operating expenses
|
(3,409 | ) | (2,390 | ) | (350 | ) | ||||||
|
Statutory insurance fund
|
(558 | ) | (537 | ) | (79 | ) | ||||||
|
|
||||||||||||
|
Total benefits, claims and expenses
|
(280,370 | ) | (298,249 | ) | (43,694 | ) | ||||||
|
|
||||||||||||
|
|
||||||||||||
|
Share of results of associates
|
(56 | ) | 704 | 103 | ||||||||
|
Net profit before income tax expenses
|
19,959 | 41,745 | 6,116 | |||||||||
|
Income tax expenses
|
(685 | ) | (8,709 | ) | (1,276 | ) | ||||||
|
|
||||||||||||
|
Net profit
|
19,274 | 33,036 | 4,840 | |||||||||
|
|
||||||||||||
|
Attributable to:
|
||||||||||||
|
- Shareholders of the Company
|
19,137 | 32,881 | 4,817 | |||||||||
|
- Minority interests
|
137 | 155 | 23 | |||||||||
|
Basic and diluted earnings per share
(1)
|
0.68 | 1.16 | 0.17 | |||||||||
|
|
||||||||||||
|
|
||||||||||||
|
Other comprehensive income/(loss)
|
||||||||||||
|
Available-for-sale financial assets
|
||||||||||||
|
Arising from available-for-sale securities
|
(61,622 | ) | 39,470 | 5,782 | ||||||||
|
Reclassification adjustment for gains included in
profit or loss
|
4,878 | (21,040 | ) | (3,082 | ) | |||||||
|
Impact from available-for-sale securities on
other assets and liabilities
|
11,702 | (3,999 | ) | (586 | ) | |||||||
|
Share of other comprehensive income/(loss) of
associates
|
291 | (70 | ) | (10 | ) | |||||||
|
Others
|
(3 | ) | — | — | ||||||||
|
Income tax relating to components of other
comprehensive income/(loss)
|
11,260 | (3,607 | ) | (528 | ) | |||||||
|
Other comprehensive income/(loss) for the year
|
(33,494 | ) | 10,754 | 1,575 | ||||||||
|
Total comprehensive income/(loss) for the year
|
(14,220 | ) | 43,790 | 6,415 | ||||||||
|
Attributable to
|
||||||||||||
|
- Shareholders of the Company
|
(14,316 | ) | 43,626 | 6,391 | ||||||||
|
- Minority interests
|
96 | 164 | 24 | |||||||||
| (1) | Numbers for the years ended December 31, 2008 and December 31, 2009 are based on the weighted average number of 28,264,705,000 shares in issue during such years. |
6
Table of Contents
| As of December 31, | ||||||||||||
| IFRS | 2008 | 2009 | 2009 | |||||||||
| RMB | RMB | US$ | ||||||||||
| (in millions) | ||||||||||||
|
|
||||||||||||
|
Consolidated Statement of Financial Position
|
||||||||||||
|
|
||||||||||||
|
Assets
|
||||||||||||
|
Property, plant and equipment
|
16,720 | 17,467 | 2,559 | |||||||||
|
Investments in associates
|
7,891 | 8,470 | 1,241 | |||||||||
|
|
||||||||||||
|
Financial assets
|
||||||||||||
|
Held-to-maturity securities
|
211,929 | 235,099 | 34,442 | |||||||||
|
Loans
|
17,926 | 23,081 | 3,381 | |||||||||
|
Term deposits
|
228,272 | 344,983 | 50,540 | |||||||||
|
Statutory deposits—restricted
|
6,153 | 6,153 | 901 | |||||||||
|
Available-for-sale securities
|
424,939 | 517,499 | 75,814 | |||||||||
|
Securities at fair value through income
|
14,099 | 9,133 | 1,338 | |||||||||
|
Accrued investment income
|
13,149 | 14,208 | 2,081 | |||||||||
|
Premiums receivables
|
6,433 | 6,818 | 999 | |||||||||
|
Reinsurance assets
|
940 | 832 | 122 | |||||||||
|
Other assets
|
4,957 | 6,317 | 925 | |||||||||
|
Cash and cash equivalents
|
34,085 | 36,197 | 5,303 | |||||||||
|
|
||||||||||||
|
Total assets
|
987,493 | 1,226,257 | 179,648 | |||||||||
|
|
||||||||||||
|
|
||||||||||||
|
Liabilities and equity
|
||||||||||||
|
|
||||||||||||
|
Liabilities
|
||||||||||||
|
|
||||||||||||
|
Insurance contracts
|
662,865 | 818,164 | 119,862 | |||||||||
|
Financial liabilities
|
||||||||||||
|
Investment contracts
|
65,063 | 67,326 | 9,863 | |||||||||
|
Securities sold under agreements to repurchase
|
11,390 | 33,553 | 4,916 | |||||||||
|
Policyholder dividends payable
|
43,178 | 54,587 | 7,997 | |||||||||
|
Annuity and other insurance balances payable
|
4,980 | 5,721 | 838 | |||||||||
|
Premiums received in advance
|
1,811 | 1,804 | 264 | |||||||||
|
Other liabilities
|
11,057 | 11,978 | 1,755 | |||||||||
|
Deferred tax liabilities
|
10,344 | 16,361 | 2,397 | |||||||||
|
Current income tax liabilities
|
1,668 | 3,850 | 564 | |||||||||
|
Statutory insurance fund
|
266 | 137 | 20 | |||||||||
|
|
||||||||||||
|
Total liabilities
|
812,622 | 1,013,481 | 148,476 | |||||||||
|
|
||||||||||||
|
Shareholders’ equity
|
||||||||||||
|
Share capital
|
28,265 | 28,265 | 4,141 | |||||||||
|
Reserves
|
84,447 | 102,787 | 15,058 | |||||||||
|
Retained earnings
|
61,235 | 80,020 | 11,723 | |||||||||
|
|
||||||||||||
|
|
||||||||||||
|
Total shareholders’ equity
|
173,947 | 211,072 | 30,922 | |||||||||
|
|
||||||||||||
|
|
||||||||||||
|
Minority interests
|
924 | 1,704 | 250 | |||||||||
|
|
||||||||||||
|
|
||||||||||||
|
Total equity
|
174,871 | 212,776 | 31,172 | |||||||||
|
|
||||||||||||
|
Total liabilities and equity
|
987,493 | 1,226,257 | 179,648 | |||||||||
|
|
||||||||||||
7
Table of Contents
8
Table of Contents
| RMB per US$ | HK$ per US$ | |||||||||||||||
| High | Low | High | Low | |||||||||||||
|
October 2009
|
6.8292 | 6.8248 | 7.7502 | 7.7495 | ||||||||||||
|
November 2009
|
6.8300 | 6.8255 | 7.7501 | 7.7495 | ||||||||||||
|
December 2009
|
6.8299 | 6.8244 | 7.7572 | 7.7495 | ||||||||||||
|
January 2010
|
6.8295 | 6.8258 | 7.7752 | 7.7539 | ||||||||||||
|
February 2010
|
6.8330 | 6.8258 | 7.7716 | 7.7619 | ||||||||||||
|
March 2010
|
6.8270 | 6.8254 | 7.7648 | 7.7574 | ||||||||||||
|
April 2010 (through April 23, 2010)
|
6.8275 | 6.8229 | 7.7672 | 7.7565 | ||||||||||||
9
Table of Contents
| Period-end rate | Average rate | |||||||||||||||
| RMB per | RMB per | |||||||||||||||
| US$ | HK$ per US$ | US$ | HK$ per US$ | |||||||||||||
|
2005
|
8.0702 | 7.7533 | 8.1826 | 7.7755 | ||||||||||||
|
2006
|
7.8041 | 7.7771 | 7.9579 | 7.7685 | ||||||||||||
|
2007
|
7.2946 | 7.7984 | 7.6072 | 7.8008 | ||||||||||||
|
2008
|
6.8225 | 7.7499 | 6.9477 | 7.7814 | ||||||||||||
|
2009
|
6.8259 | 7.7536 | 6.8295 | 7.7513 | ||||||||||||
|
2010 (through April 23, 2010)
|
6.8270 | 7.7628 | 6.8264 | 7.7640 | ||||||||||||
10
Table of Contents
| • | engaging in misrepresentation or fraudulent activities when marketing or selling insurance policies or annuity contracts to customers; | ||
| • | hiding unauthorized or unsuccessful activities, resulting in unknown and unmanaged risks or losses; or | ||
| • | otherwise not complying with laws or our control policies or procedures. |
11
Table of Contents
12
Table of Contents
13
Table of Contents
14
Table of Contents
15
Table of Contents
16
Table of Contents
17
Table of Contents
| • | Property and casualty companies. Beginning on January 1, 2003, property and casualty insurance companies have been permitted to sell accident and short-term health insurance products, but only with regulatory approval. There were 52 property and casualty insurers as of December 31, 2009. We believe property and casualty insurers have the competitive advantage of being able to bundle, or cross-sell, accident and health products with the other non-life insurance products that they are currently selling to their existing and potential customers. We believe this will lead to greater competition in the accident and health insurance sectors, especially for the group accident and short-term health insurance products we offer. On December 30, 2006, we established a property and casualty joint venture, CLPCIC, with CLIC. While this joint venture mainly focuses on property insurance business, it also develops accident and short-term health insurance business. Its operations may have a negative impact on sales of accident and short-term health insurance products by our wholly-owned businesses in the future. | ||
| • | Mutual fund companies, commercial banks and other financial services providers. We face competition from other financial services providers, primarily licensed mutual fund companies, commercial banks providing personal banking services and operating business of various financial products, trust companies and securities brokerage firms licensed to manage separate accounts. Recent changes in Chinese investment regulations relaxing rules on the formation of mutual funds and sales of securities have led to greater availability and variety of financial investment products. These products may prove to be attractive to the public and thereby adversely affect the sale of some products we offer, including participating life insurance policies and annuities. |
18
Table of Contents
19
Table of Contents
20
Table of Contents
21
Table of Contents
22
Table of Contents
| • | the extent of government involvement; | ||
| • | its level of development; | ||
| • | its growth rate; and | ||
| • | its control of foreign exchange. |
23
Table of Contents
24
Table of Contents
25
Table of Contents
| ITEM 4. | INFORMATION ON THE COMPANY |
 in connection with the restructuring.
| • | CLIC transferred to us (1) all long-term insurance policies (policies having a term of more than one year from the date of issuance) issued on or after June 10, 1999, having policy terms approved by or filed with the CIRC on or after June 10, 1999 and either (i) recorded as a long-term insurance policy as of June 30, 2003 in a database attached to the restructuring agreement as an annex or (ii) having policy terms for group supplemental medical insurance (fund type), (2) stand-alone short-term policies (policies having a term of one year or less from the date of issuance) issued on or after June 10, 1999 and (3) all riders supplemental to the policies described in clauses (1) and (2) above, together with the applicable reinsurance contracts specified in an annex to the restructuring agreement. We refer to these policies in this annual report as the “transferred policies”. All other insurance policies were retained by CLIC. We refer to these policies as the “non-transferred policies”. We assumed all obligations and liabilities of CLIC under the transferred policies. CLIC continues to be responsible for its liabilities and obligations under the non-transferred policies following the effective date. |
26
Table of Contents
| • | Cash, specified investment assets and various other assets were also transferred to us. | ||
| • | CLIC agreed not to, directly or indirectly through its subsidiaries and affiliates, participate, operate or engage in life, accident and health insurance businesses and any other business in China which may compete with our insurance business. CLIC also undertook (1) to refer to us any corporate business opportunity that falls within our business scope and which may directly or indirectly compete with our business and (2) to grant us a right of first refusal, on the same terms and conditions, to purchase any new business developed by CLIC. See “Item 7. Major Shareholders and Related Party Transactions—Related Party Transactions—Continuing Related Party Transactions with CLIC”. | ||
| • | Substantially all of the management personnel and employees who were employed by CLIC in connection with the transferred assets and business were transferred to us. Some management and personnel remained with CLIC. | ||
| • | CLIC retained the trademarks used in our business, including the “China Life” name in English and Chinese and the “ball” logos, and granted us and our branches a royalty-free license to use these trademarks. CLIC and its subsidiaries and affiliates will be entitled to use these trademarks, but CLIC may not license or transfer these trademarks to any other third parties. See “Item 7. Major Shareholders and Related Party Transactions—Related Party Transactions—Continuing Related Party Transactions with CLIC”. | ||
| • | CLIC’s contracts with its agents and other intermediaries were transferred to us. | ||
| • | We entered into various agreements under which we provide policy administration services to CLIC for the non-transferred policies, manage CLIC’s investment assets and lease office space from CLIC for our branch and field offices. See “Item 7. Major Shareholders and Related Party Transactions”. |
27
Table of Contents
28
Table of Contents
| As of or for the year ended | Annual | |||||||||||||||
| December 31, | growth rate | |||||||||||||||
| 2008 | 2009 | 2009 | (2008-2009) | |||||||||||||
| RMB | RMB | US$ | ||||||||||||||
| (in millions, except as otherwise indicated) | ||||||||||||||||
|
Individual life gross written premiums
|
252,130 | 261,715 | 38,341 | 3.8 | % | |||||||||||
|
Individual life liabilities of insurance contracts
|
654,037 | 808,591 | 118,459 | 23.6 | % | |||||||||||
|
Individual life liabilities of investment contracts
|
10,928 | 14,579 | 2,136 | 33.4 | % | |||||||||||
29
Table of Contents
| For the year ended December 31, | ||||||||||||
| 2008 | 2009 | 2009 | ||||||||||
| RMB | RMB | US$ | ||||||||||
| (in millions) | ||||||||||||
|
Gross written premiums
|
||||||||||||
|
Whole life and term life insurance
|
35,729 | 38,665 | 5,664 | |||||||||
|
Endowment
|
188,099 | 184,841 | 27,079 | |||||||||
|
Annuities
|
28,302 | 38,209 | 5,598 | |||||||||
30
Table of Contents
31
Table of Contents
32
Table of Contents
| As of or for the year ended | Annual | |||||||||||||||
| December 31, | growth rate | |||||||||||||||
| 2008 | 2009 | 2009 | (2008-2009) | |||||||||||||
| RMB | RMB | US$ | ||||||||||||||
| (in millions, except as otherwise indicated) | ||||||||||||||||
|
Group life gross written premiums
|
340 | 190 | 28 | (44.1 | %) | |||||||||||
|
Group life liabilities of insurance contracts
|
811 | 632 | 93 | (22.1 | %) | |||||||||||
|
Group life liabilities of investment contracts
|
54,135 | 52,747 | 7,727 | (2.6 | %) | |||||||||||
| For the year ended December 31, | ||||||||||||
| 2008 | 2009 | 2009 | ||||||||||
| RMB | RMB | US$ | ||||||||||
| (in millions) | ||||||||||||
|
Gross written premiums:
|
||||||||||||
|
Group annuities
|
41 | 18 | 3 | |||||||||
|
Group whole life and term life insurance
|
299 | 172 | 25 | |||||||||
33
Table of Contents
| As of or for the year ended | Annual | |||||||||||||||
| December 31, | growth rate | |||||||||||||||
| 2008 | 2009 | 2009 | (2008-2009) | |||||||||||||
| RMB | RMB | US$ | ||||||||||||||
| (in millions, except as otherwise indicated) | ||||||||||||||||
|
Short-term accident insurance premiums
|
6,221 | 7,076 | 1,037 | 13.7 | % | |||||||||||
|
Short-term health insurance premiums
|
6,965 | 6,989 | 1,024 | 0.3 | % | |||||||||||
|
Accident and health reserves for
claims and claim adjustment expenses
(gross)
|
2,780 | 2,944 | 431 | 5.9 | % | |||||||||||
|
Accident and health insurance
unearned premium reserves (gross)
|
5,237 | 5,997 | 879 | 14.5 | % | |||||||||||
34
Table of Contents
35
Table of Contents
36
Table of Contents
| • | for individual insurance distribution channels, the upgraded and modified Kang Ning Whole Life and Kang Ning Term Life products. Three types of products — Kang Ning Whole Life Major Disease Insurance, Kang Ning Term Life Major Disease Insurance and Kang Ning Supplemental Endowment Insurance — expand the coverage and increase the level of protection. The Fu Lu Participating series, such as Fu Lu Shuang Xi Participating Endowment and Fu Lu Zun Xiang Participating Endowment, enhances the product’s wealth management and protective function. A new generation children participating product, Fu Xing Children Participating Endowment, improves the product’s protective function. In addition, we also developed our first adjustable participating endowment product, Fu Rui Participating Life Endowment, to satisfy the needs of a particular group of customers; | ||
| • | the Hong Ying Participating Endowment product, to be marketed through commercial banks, which extends the insurance and payment period and satisfies the broad insurance needs of consumers; | ||
| • | our first group whole life major disease insurance product, Kang Zhong Whole Life Major Disease Insurance, to be marketed through group insurance channels; and | ||
| • | the Hong Kang Participating Endowment (Class A) and Hong Kang Supplemental Major Disease Prepayment Insurance (Class A), to be marketed through telephone sales. |
37
Table of Contents
| As of December 31, | ||||||||||||
| 2007 | 2008 | 2009 | ||||||||||
|
Number of exclusive agents (approximately)
|
638,000 | 716,000 | 777,000 | |||||||||
|
Number of field offices
|
15,500 | 16,813 | 19,000 | |||||||||
38
Table of Contents
| • | improving the overall productivity of our exclusive agents by expanding our customer-oriented market segmentation sales approach and standardized sales services to all agents nationwide; | ||
| • | motivating our exclusive agents with an improved performance-based compensation scheme; | ||
| • | building a more professional exclusive agent force by improving our training programs and enhancing our training efforts, such as the Chartered Insurance Agency Manager courses organized by the Life Insurance Marketing and Research Association, and increasing the number of qualified exclusive agents; | ||
| • | improving the quality of our exclusive agent force by expanding our recruitment program and standardizing our recruitment procedures and admission requirements; and | ||
| • | improving the efficiency of our exclusive agents by providing sales support and equipments, including expanding the China Life sales support system nationwide and equipping our more productive exclusive agents with personal electronic devices to further enhance their marketing, time management and customer service capabilities. |
39
Table of Contents
| • | In the individual life insurance market, Ping An, China Pacific Life and we collectively represented 65% of total individual life insurance premiums in 2008. We primarily compete based on the nationwide reach of our sales network and the level of services we provide, as well as our strong brand name. | ||
| • | In the group life insurance market, Ping An, China Pacific Life and we collectively represented 63% of total group life insurance premiums in 2008. We primarily compete based on the nationwide reach of our sales network and the level of services we provide, as well as our relationships and reputation among large companies and institutions in China. |
40
Table of Contents
| • | In the accident insurance market, Ping An, China Pacific Life and we collectively represented 80% of total accident premiums in 2008. We primarily compete based on the nationwide reach of our sales network and the level of services we provide and our strong brand name, as well as our cooperative arrangements with other companies and institutions. | ||
| • | In the health insurance market, Ping An, China Pacific Life and we collectively represented 53% of total health premiums in 2008. We primarily compete based on the nationwide reach of our sales network, the level of services we provide, our multi-layered managed care scheme and systems of policy review and claim management, as well as our strong brand name. |
| Individual | ||||||||||||||||||||
| life | Group life | Accident | Health | Total | ||||||||||||||||
| premiums | premiums | premiums | premiums | premiums | ||||||||||||||||
| market share | market share | market share | market share | market share | ||||||||||||||||
|
China Life
|
43 | % | 44 | % | 48 | % | 19 | % | 39 | % | ||||||||||
|
Ping An Insurance Company of China, Ltd.
|
13 | % | 9 | % | 15 | % | 28 | % | 13 | % | ||||||||||
|
China Pacific Life Insurance Co. Ltd.
|
9 | % | 10 | % | 17 | % | 6 | % | 9 | % | ||||||||||
|
New China Life Insurance Co. Ltd.
|
8 | % | 3 | % | 3 | % | 5 | % | 7 | % | ||||||||||
|
Tai Kang Life Insurance Co. Ltd.
|
8 | % | 13 | % | 3 | % | 3 | % | 8 | % | ||||||||||
|
Others
(1)
|
19 | % | 21 | % | 14 | % | 39 | % | 24 | % | ||||||||||
|
|
||||||||||||||||||||
|
Total
|
100 | % | 100 | % | 100 | % | 100 | % | 100 | % | ||||||||||
|
|
||||||||||||||||||||
| (1) | Others include Taiping Life Insurance Co. Ltd., Minsheng Life Insurance Co., Ltd., Sino Life Insurance Co., Ltd., PICC Life Insurance Co., Ltd., PICC Health Insurance Co., Ltd., Hua Tai Life Insurance Co., Ltd., Union Life Insurance Co., Ltd., Greatwall Life Insurance Co., Ltd., Manulife-Sinochem Life Insurance Co. Ltd., Pacific-Antai Life Insurance Co. Ltd., AXA-Minmetals Assurance Co., Ltd., China CMG Life Insurance Co., Ltd., Citic-Prudential Life Insurance Co., Ltd., John Hancock-Tianan Life Insurance Co. Ltd., Generali China Life Insurance Co. Ltd., Sun Life Everbright Life Insurance Co. Ltd., ING Capital Life Insurance Co., Ltd., Haier New York Life Insurance Co., Ltd., Aviva-COFCO Life Insurance Co., Ltd., AEGON-CNOOC Life Insurance Co., Ltd., CIGNA and CMC Life Insurance Co., Ltd., Nissay-SVA Life, Insurance Co., Ltd., Heng An Standard Life Insurance Co., Ltd., Skandia-BSM Life Insurance Co., Ltd., Sino-US Metlife Insurance Co., Ltd. and Shanghai, Guangdong, Shenzhen, Beijing, Jiangsu, Dongguan and Jiangmen branches of American International Assurance Co., Ltd., Cathay Life Insurance Co., Ltd., Met Life Insurance Co., Ltd., Allianz China Life Insurance Co., Ltd., Samsung Air China life Insurance Co., Ltd., Jiahe Life Insurance Co., Ltd., Reward Health Insurance Co., Ltd., Dragon Life Insurance Co., Ltd., Zhongxin Grand Oriental Person’s Life Insurance Co., Ltd., Kunlun Health Insurance Co., Ltd., Huaxia Life Insurance Co., Ltd., Sinatag Life Insurance Co., Ltd., Yingda Taihe Life Insurance Co., Ltd., Happy Life Insurance Co., Ltd., Sino-French Life Insurance Co., Ltd., Sunshine Life Insurance Corporation Limited, Pingan Pension Co., Ltd., Pingan Health Insurance Co., Ltd. and Guohua Life Insurance Co., Ltd.. | |
| Source : | China Insurance Yearbook 2009 |
41
Table of Contents
42
Table of Contents
43
Table of Contents
44
Table of Contents
45
Table of Contents
| As of December 31, | ||||||||||||||||||||||||
| 2007 | 2008 | 2009 | ||||||||||||||||||||||
| Carrying | % of | Carrying | % of | Carrying | % of | |||||||||||||||||||
| value | total | value | total | value | total | |||||||||||||||||||
| (RMB in millions, except as otherwise indicated) | ||||||||||||||||||||||||
|
Cash and cash equivalents
|
25,317 | 3.0 | % | 34,085 | 3.6 | % | 36,197 | 3.1 | % | |||||||||||||||
|
Term deposits (excluding structured
deposits)
|
164,248 | 19.3 | % | 225,367 | 24.0 | % | 344,710 | 29.4 | % | |||||||||||||||
|
Structured deposits
|
4,346 | 0.5 | % | 2,905 | 0.3 | % | 273 | 0.0 | % | |||||||||||||||
|
Statutory deposits—restricted
|
5,773 | 0.7 | % | 6,153 | 0.7 | % | 6,153 | 0.5 | % | |||||||||||||||
|
|
||||||||||||||||||||||||
|
Debt securities, held-to-maturity
|
195,703 | 23.0 | % | 211,929 | 22.6 | % | 235,099 | 20.1 | % | |||||||||||||||
|
Debt Securities, available-for-sale
|
241,382 | 28.4 | % | 356,220 | 38.0 | % | 340,825 | 29.1 | % | |||||||||||||||
|
Debt securities, financial assets at fair
value through income (held-for-trading)
|
6,096 | 0.7 | % | 7,736 | 0.8 | % | 6,391 | 0.5 | % | |||||||||||||||
|
Debt securities
|
443,181 | 52.1 | % | 575,885 | 61.4 | % | 582,315 | 49.7 | % | |||||||||||||||
|
|
||||||||||||||||||||||||
|
|
||||||||||||||||||||||||
|
Loans
|
7,144 | 0.8 | % | 17,926 | 1.9 | % | 23,081 | 2.0 | % | |||||||||||||||
|
|
||||||||||||||||||||||||
|
Equity securities, available for sale
|
176,133 | 20.7 | % | 68,719 | 7.3 | % | 176,674 | 15.1 | % | |||||||||||||||
|
Equity securities, financial assets at
fair value through income
(held-for-trading)
|
19,014 | 2.2 | % | 6,363 | 0.7 | % | 2,742 | 0.2 | % | |||||||||||||||
|
Equity securities
|
195,147 | 23.0 | % | 75,082 | 8.0 | % | 179,416 | 15.3 | % | |||||||||||||||
|
|
||||||||||||||||||||||||
|
|
||||||||||||||||||||||||
|
Resale agreements
|
5,053 | 0.6 | % | — | — | — | — | |||||||||||||||||
|
Total investment assets
|
850,209 | 100 | % | 937,403 | 100 | % | 1,172,145 | 100 | % | |||||||||||||||
|
|
||||||||||||||||||||||||
|
|
||||||||||||||||||||||||
|
Average cash and investment assets balance
|
768,507 | 893,806 | 1,054,774 | |||||||||||||||||||||
46
Table of Contents
| • | interest rate risk, relating to the market price and cash flow variability associated with changes in interest rates; | ||
| • | credit risk, relating to the uncertainty associated with the continued ability of a given obligor to make timely payments of principal and interest; | ||
| • | market valuation risk, relating to the changes in market value for our investments, particularly our securities investment fund holdings and shares listed on the Chinese securities exchanges, which are denominated and traded in Renminbi; | ||
| • | liquidity risk, relating to the lack of liquidity in many of the debt securities markets we invest in, due to contractual restrictions on transfer or the size of our investments in relation to the overall market; and | ||
| • | currency exchange risk, relating to the impact of changes in the value of the Renminbi against the U.S. dollar and other currencies on the value of our investments. |
47
Table of Contents
| As of or for the years ended December 31, | ||||||||||||||||
| 2008 | 2009 | |||||||||||||||
| Yield (1) | Amount | Yield (1) | Amount | |||||||||||||
| (RMB in millions, except as otherwise indicated) | ||||||||||||||||
|
Cash, cash equivalents and term deposits:
|
||||||||||||||||
|
Investment income
|
4.9 | % | 11,378 | 3.3 | % | 10,805 | ||||||||||
|
Ending assets: cash and cash equivalents
|
34,085 | 36,197 | ||||||||||||||
|
Ending assets: statutory deposits—restricted
|
6,153 | 6,153 | ||||||||||||||
|
Ending assets: term deposits
|
228,272 | 344,983 | ||||||||||||||
|
|
||||||||||||||||
|
Ending assets
|
268,510 | 387,333 | ||||||||||||||
|
|
||||||||||||||||
|
Debt securities:
|
||||||||||||||||
|
Investment income
|
4.5 | % | 22,690 | 4.1 | % | 23,759 | ||||||||||
|
Net realized gains/(losses)
|
2,445 | 3,346 | ||||||||||||||
|
Net fair value gains/(losses) on assets at fair
value through income
|
300 | (277 | ) | |||||||||||||
|
|
||||||||||||||||
|
Total
|
25,435 | 26,828 | ||||||||||||||
|
Ending assets
|
575,885 | 582,315 | ||||||||||||||
|
|
||||||||||||||||
|
Loans:
|
||||||||||||||||
|
Investment income
|
5.6 | % | 696 | 5.7 | % | 1,172 | ||||||||||
|
Ending assets
|
17,926 | 23,081 | ||||||||||||||
48
Table of Contents
| As of or for the years ended December 31, | ||||||||||||||||
| 2008 | 2009 | |||||||||||||||
| Yield (1) | Amount | Yield (1) | Amount | |||||||||||||
| (RMB in millions, except as otherwise indicated) | ||||||||||||||||
|
Equity securities:
|
||||||||||||||||
|
Investment income
|
7.5 | % | 10,093 | 2.5 | % | 3,146 | ||||||||||
|
Net realized gains/(losses)
|
(8,409 | ) | 17,898 | |||||||||||||
|
Net fair value gains/(losses) on assets at fair
value through income
|
(7,494 | ) | 1,726 | |||||||||||||
|
|
||||||||||||||||
|
Total
|
(5,810 | ) | 22,770 | |||||||||||||
|
Ending assets
|
75,082 | 179,405 | ||||||||||||||
|
|
||||||||||||||||
|
Resale and repurchase agreements:
|
||||||||||||||||
|
Resale agreements:
|
||||||||||||||||
|
Investment income
|
3.0 | % | 89 | N/A | 8 | |||||||||||
|
Total
|
89 | 8 | ||||||||||||||
|
Ending assets
|
— | — | ||||||||||||||
|
|
||||||||||||||||
|
Repurchase agreements:
|
||||||||||||||||
|
Investment expense
|
(438 | ) | (111 | ) | ||||||||||||
|
Ending assets
|
11,390 | 33,553 | ||||||||||||||
|
|
||||||||||||||||
|
Investments in associates:
|
||||||||||||||||
|
Investment income/(losses)
|
(0.8 | %) | (56 | ) | 8.6 | % | 704 | |||||||||
|
Ending assets
|
7,891 | 8,470 | ||||||||||||||
|
|
||||||||||||||||
|
Total investments:
|
||||||||||||||||
|
Investment income
|
3.48 | % | 44,946 | 5.78 | % | 38,890 | ||||||||||
|
Net realized gains/(losses)
|
(5,964 | ) | 21,244 | |||||||||||||
|
Net fair value gains/(losses) on assets at
fair value through income
|
(7,194 | ) | 1,449 | |||||||||||||
|
Business tax and extra charges for investment
|
(650 | ) | (662 | ) | ||||||||||||
|
|
||||||||||||||||
|
Total
|
31,138 | 60,921 | ||||||||||||||
|
Ending assets
|
937,403 | 1,172,145 | ||||||||||||||
| (1) | Yields for 2008 and 2009 are calculated by dividing the investment income for that year by the average of the ending balances of that year and the previous year. |
49
Table of Contents
| As of December 31, | ||||||||||||
| 2007 | 2008 | 2009 | ||||||||||
| Amortized | Amortized | Amortized | ||||||||||
| cost | cost | cost | ||||||||||
| (RMB in millions) | ||||||||||||
|
Due in one year or less
|
46,706 | 64,621 | 84,393 | |||||||||
|
Due after one year and through five years
|
93,372 | 155,320 | 196,090 | |||||||||
|
Due after five years and through ten years
|
26,434 | 6,759 | 64,500 | |||||||||
|
Due after ten years
|
2,082 | 1,572 | — | |||||||||
|
|
||||||||||||
|
|
||||||||||||
|
Total term deposits and structured term deposits
|
168,594 | 228,272 | 344,983 | |||||||||
|
|
||||||||||||
| As of December 31, | ||||||||||||
| 2007 | 2008 | 2009 | ||||||||||
| Amortized | Amortized | Amortized | ||||||||||
| cost | cost | cost | ||||||||||
| (RMB in millions) | ||||||||||||
|
Industrial & Commercial Bank of China
|
5,657 | 7,939 | 2,700 | |||||||||
|
Agriculture Bank of China
|
18,090 | 18,354 | 16,883 | |||||||||
|
Bank of China
|
13,738 | 5,137 | 70,400 | |||||||||
|
China Construction Bank
|
200 | 18,200 | 21,000 | |||||||||
|
Other banks
|
130,909 | 178,642 | 234,000 | |||||||||
|
|
||||||||||||
|
|
||||||||||||
|
Total term deposits and structured term deposits
|
168,594 | 228,272 | 344,983 | |||||||||
|
|
||||||||||||
| • | Chinese government bonds; | ||
| • | government agency bonds (including local government bonds issued and repaid by the Ministry of Finance as agent, central bank notes, financial bonds issued by state-owned policy banks of the Chinese government, and RMB-denominated bonds issued by international development institutions); | ||
| • | corporate bonds (including financial bonds issued by commercial banks, corporate bonds, convertible corporate bonds, short-term financing bonds and medium-term notes); and | ||
| • | subordinated bonds and debt (including subordinated bonds issued by state-owned policy banks of the Chinese government, subordinated bonds issued by commercial banks, subordinated debt with fixed terms issued by commercial banks and subordinated debt with fixed terms issued by insurance companies). |
50
Table of Contents
| As of December 31, | ||||||||||||||||||||||||||||||||||||||||||||||||
| 2007 | 2008 | 2009 | ||||||||||||||||||||||||||||||||||||||||||||||
| Amortized | % of | Estimated | % of | Amortized | % of | Estimated | % of | Amortized | % of | Estimated | % of | |||||||||||||||||||||||||||||||||||||
| cost | total | fair value | total | cost | total | fair value | total | cost | total | fair value | total | |||||||||||||||||||||||||||||||||||||
| (RMB in millions) | ||||||||||||||||||||||||||||||||||||||||||||||||
|
Debt securities,
available-for-sale:
|
||||||||||||||||||||||||||||||||||||||||||||||||
|
Government bonds
|
83,137 | 18.3 | % | 80,588 | 18.4 | % | 73,130 | 13.2 | % | 80,006 | 13.5 | % | 50,623 | 8.6 | % | 51,996 | 8.9 | % | ||||||||||||||||||||||||||||||
|
Government agency bonds
|
111,906 | 24.7 | % | 107,154 | 24.4 | % | 180,135 | 32.5 | % | 191,121 | 32.3 | % | 167,313 | 28,4 | % | 165,231 | 28.3 | % | ||||||||||||||||||||||||||||||
|
Corporate bonds
|
46,464 | 10.2 | % | 43,742 | 10.0 | % | 64,388 | 11.6 | % | 67,505 | 11.4 | % | 103,603 | 17.7 | % | 102,553 | 17.6 | % | ||||||||||||||||||||||||||||||
|
Subordinated bonds/debt
|
10,462 | 2.3 | % | 9,898 | 2.3 | % | 17,265 | 3.1 | % | 17,588 | 3.0 | % | 21,198 | 3.6 | % | 21,045 | 3.6 | % | ||||||||||||||||||||||||||||||
|
|
||||||||||||||||||||||||||||||||||||||||||||||||
|
|
||||||||||||||||||||||||||||||||||||||||||||||||
|
Total debt securities,
available-for-sale
|
251,969 | 55.5 | % | 241,382 | 55.0 | % | 334,918 | 60.4 | % | 356,220 | 60.1 | % | 342,737 | 58.4 | % | 340,825 | 58.5 | % | ||||||||||||||||||||||||||||||
|
|
||||||||||||||||||||||||||||||||||||||||||||||||
|
|
||||||||||||||||||||||||||||||||||||||||||||||||
|
Debt securities, held
to maturity:
|
||||||||||||||||||||||||||||||||||||||||||||||||
|
Government bonds
|
96,786 | 21.3 | % | 96,234 | 21.9 | % | 102,688 | 18.5 | % | 112,681 | 19.0 | % | 103,980 | 17.8 | % | 107,432 | 18.4 | % | ||||||||||||||||||||||||||||||
|
Government agency bonds
|
71,273 | 15.7 | % | 68,080 | 15.5 | % | 79,400 | 14.3 | % | 84,558 | 14.3 | % | 84,619 | 14.5 | % | 82,728 | 14.2 | % | ||||||||||||||||||||||||||||||
|
Corporate bonds
|
3,272 | 0.7 | % | 3,403 | 0.8 | % | 3,267 | 0.6 | % | 3,494 | 0.6 | % | 3,139 | 0.5 | % | 3,245 | 0.6 | % | ||||||||||||||||||||||||||||||
|
Subordinated bonds/debt
|
24,372 | 5.4 | % | 23,872 | 5.4 | % | 26,574 | 4.8 | % | 27,865 | 4.7 | % | 43,361 | 7.4 | % | 42,264 | 7.3 | % | ||||||||||||||||||||||||||||||
|
|
||||||||||||||||||||||||||||||||||||||||||||||||
|
|
||||||||||||||||||||||||||||||||||||||||||||||||
|
Total debt securities,
held to maturity
|
195,703 | 43.1 | % | 191,589 | 43.6 | % | 211,929 | 38.2 | % | 228,598 | 38.6 | % | 235,099 | 40.2 | % | 235,669 | 40.4 | % | ||||||||||||||||||||||||||||||
|
|
||||||||||||||||||||||||||||||||||||||||||||||||
|
|
||||||||||||||||||||||||||||||||||||||||||||||||
|
Debt securities,
financial assets at
fair value through
income
(held-for-trading)
|
||||||||||||||||||||||||||||||||||||||||||||||||
|
Government bonds
|
710 | 0.2 | % | 693 | 0.2 | % | 1,404 | 0.3 | % | 1,428 | 0.2 | % | 2,483 | 0.4 | % | 2,438 | 0.4 | % | ||||||||||||||||||||||||||||||
|
Government agency bonds
|
4,679 | 1.0 | % | 4,583 | 1.0 | % | 4,525 | 0.8 | % | 4,660 | 0.8 | % | 3,559 | 0.6 | % | 3,549 | 0.6 | % | ||||||||||||||||||||||||||||||
|
Corporate
bonds
|
458 | 0.1 | % | 513 | 0.1 | % | 1,614 | 0.3 | % | 1,648 | 0.3 | % | 403 | 0.1 | % | 404 | 0.1 | % | ||||||||||||||||||||||||||||||
|
Subordinated bonds/debt
|
329 | 0.1 | % | 307 | 0.1 | % | — | — | — | — | — | — | — | — | ||||||||||||||||||||||||||||||||||
|
|
||||||||||||||||||||||||||||||||||||||||||||||||
|
|
||||||||||||||||||||||||||||||||||||||||||||||||
|
Total debt
securities,
financial assets
at fair value through
income
(held-for-trading)
|
6,176 | 1.4 | % | 6,096 | 1.4 | % | 7,543 | 1.4 | % | 7,736 | 1.3 | % | 6,445 | 1.1 | % | 6,391 | 1.1 | % | ||||||||||||||||||||||||||||||
|
|
||||||||||||||||||||||||||||||||||||||||||||||||
|
|
||||||||||||||||||||||||||||||||||||||||||||||||
|
Total debt securities
|
453,768 | 100 | % | 439,067 | 100 | % | 554,583 | 100.0 | % | 592,554 | 100.0 | % | 580,623 | 100 | % | 582,834 | 100 | % | ||||||||||||||||||||||||||||||
|
|
||||||||||||||||||||||||||||||||||||||||||||||||
51
Table of Contents
| As of December 31, | ||||||||||||||||||||||||
| 2007 | 2008 | 2009 | ||||||||||||||||||||||
| Amortized | Estimated | Amortized | Estimated | Amortized | Estimated | |||||||||||||||||||
| cost | fair value | cost | fair value | cost | fair value | |||||||||||||||||||
| (RMB in millions) | ||||||||||||||||||||||||
|
Due in one year or less
|
3,512 | 3,533 | 31,757 | 32,294 | 8,844 | 8,886 | ||||||||||||||||||
|
Due after one year and through five years
|
73,198 | 73,533 | 97,909 | 103,801 | 79,641 | 82,511 | ||||||||||||||||||
|
Due after five years and through ten years
|
142,001 | 140,450 | 168,978 | 183,617 | 165,523 | 169,484 | ||||||||||||||||||
|
Due after ten years
|
228,961 | 215,455 | 248,203 | 265,106 | 323,827 | 315,612 | ||||||||||||||||||
|
|
||||||||||||||||||||||||
|
|
||||||||||||||||||||||||
|
Total debt securities
|
447,672 | 432,971 | 546,847 | 584,818 | 577,835 | 576,493 | ||||||||||||||||||
|
|
||||||||||||||||||||||||
52
Table of Contents
| As of December 31, | ||||||||||||||||||||||||
| 2007 | 2008 | 2009 | ||||||||||||||||||||||
| Carrying | % of | Carrying | % of | Carrying | % of | |||||||||||||||||||
| value | total | value | total | value | total | |||||||||||||||||||
| (RMB in millions, except as otherwise indicated) | ||||||||||||||||||||||||
|
|
||||||||||||||||||||||||
|
Open-end
|
53,555 | 76.8 | % | 31,047 | 91.4 | % | 68,343 | 89.8 | % | |||||||||||||||
|
Closed-end
|
16,214 | 23.2 | % | 2,906 | 8.6 | % | 7,779 | 10.2 | % | |||||||||||||||
|
|
||||||||||||||||||||||||
|
|
||||||||||||||||||||||||
|
Total
|
69,769 | 100 | % | 33,953 | 100 | % | 76,122 | 100 | % | |||||||||||||||
|
|
||||||||||||||||||||||||
53
Table of Contents
54
Table of Contents
55
Table of Contents
56
Table of Contents
57
Table of Contents
| • | bank deposits; | ||
| • | Chinese government bonds; | ||
| • | government agency bonds (including local government bonds issued and repaid by the Ministry of Finance as agent, central bank notes, financial bonds issued by state-owned policy banks of the Chinese government, and RMB-denominated bonds issued by international development institutions); | ||
| • | corporate bonds (including financial bonds issued by commercial banks, corporate bonds, convertible corporate bonds, short-term financing bonds and medium-term notes); | ||
| • | subordinated bonds and debt (including subordinated bonds issued by state-owned policy banks of the Chinese government, subordinated bonds issued by commercial banks, fixed term subordinated debt issued by commercial banks and fixed term subordinated debt issued by insurance companies.); | ||
| • | other bonds and debts as approved by relevant government agencies; | ||
| • | policy loans; | ||
| • | Chinese securities investment funds; | ||
| • | RMB-denominated common shares listed on PRC stock exchanges; | ||
| • | indirect investments in infrastructure projects; | ||
| • | equity interests of non-listed Chinese commercial banks; | ||
| • | repurchase and resale agreements; | ||
| • | overseas investments; and | ||
| • | other investment channels as approved by the State Council. |
58
Table of Contents
59
Table of Contents
60
Table of Contents
61
Table of Contents
| • | currency market products such as commercial paper, negotiable deposits, repurchase agreements, reverse repurchase agreements and currency market funds; | ||
| • | fixed income instruments such as bank deposits, structured deposits, bonds, convertible bonds, bond funds, securitization products and trust products; | ||
| • | equity investments such as stocks, stock investment funds, equities and equity-type products; and | ||
| • | other investments permitted by the PRC Insurance Law and the State Council. |
| • | 18% of the portion of net premium received in the most recent fiscal year net of business tax and other surcharges which is not in excess of RMB 100 million, plus 16% of the portion which are in excess of RMB 100 million; and | ||
| • | 26% of the portion of the average annual claims payments during the most recent three fiscal years which is not in excess of RMB 70 million, plus 23% of the portion which is in excess of RMB 70 million. |
62
Table of Contents
| • | 4% of the period-end reserves for insurance risks after unbundling of mixed insurance contracts; | ||
| • | 4% of the period-end reserves for insurance contracts; | ||
| • | 1% of the liabilities for other risks after unbundling of investment-linked insurance contracts; | ||
| • | 4% of the liabilities for other risks after unbundling of other mixed insurance contracts; | ||
| • | 4% of the liabilities for insurance policies which do not pass the tests for significant insurance risks; | ||
| • | 0.1% of the total sums at risk under term life policies, the coverage period of which expires within three years; | ||
| • | 0.15% of the total sums at risk under term life policies, the coverage period of which expires within three to five years; | ||
| • | 0.3% of the total sums at risk under term life policies, the coverage period of which will not expire within five years; | ||
| • | 0.3% of the total sums at risk under whole life policies; and | ||
| • | 0.3% of the sums at risk of all other insurance and annuity products with a coverage period longer than one year. |
63
Table of Contents
64
Table of Contents
65
Table of Contents
66
Table of Contents
67
Table of Contents
68
Table of Contents
69
Table of Contents
70
Table of Contents
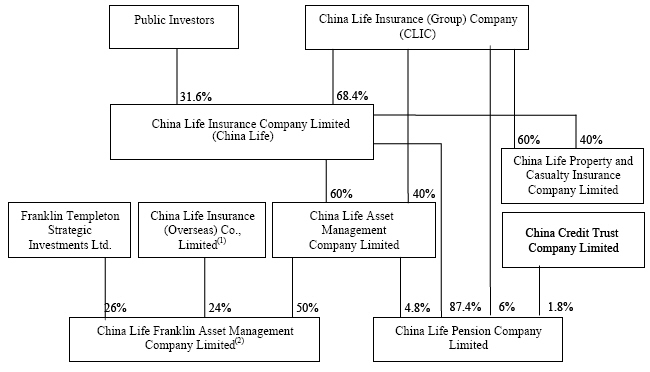
| (1) | Wholly owned by CLIC | |
| (2) | Formerly known as China Life Asset Management (Hong Kong) Company Limited |
71
Table of Contents
| Proportion of Ownership Interest | ||||||||
| Name of Subsidiary | Jurisdiction of Incorporation | Owned by China Life | ||||||
|
|
||||||||

|
The People’s Republic of China | 60% | ||||||
|
China Life Asset
|
(directly) | |||||||
|
Management Company Limited
|
||||||||
|
|
||||||||

|
Hong Kong | 50% (2) | ||||||
|
China Life Franklin Asset
|
(indirectly through affiliate) | |||||||
|
Management Company Limited
(1)
|
||||||||
|
|
||||||||

|
The People’s Republic of China | 92.2% (3) | ||||||
|
China Life Pension Company Limited
(2)
|
(directly and indirectly through affiliate) | |||||||
| (1) | Formerly known as China Life Asset Management (Hong Kong) Company Limited | |
| (2) | AMC, which is 60% owned by us, owns 50% | |
| (3) | We own 87.4% and AMC, which is 60% owned by us, owns 4.8% |
72
Table of Contents
| ITEM 4A. | UNRESOLVED STAFF COMMENTS. |
| ITEM 5. | OPERATING AND FINANCIAL REVIEW AND PROSPECTS. |
73
Table of Contents
| • | Individual life insurance , which offers participating and non-participating life insurance and annuities to individuals. The financial results of our individual long-term health and long-term accident insurance business are also reflected in our individual life insurance business segment. Our individual life insurance business comprises long-term products, including long-term health and long-term accident insurance products, meaning products having a term of more than one year at the date of their issuance. |
| • | Group life insurance , which offers participating and non-participating life insurance and annuities products to companies and institutions. The financial results of our group long-term health and long-term accident insurance business are also reflected in our group life insurance business segment. Our group life insurance business comprises long-term products. |
| • | Short-term insurance , which offers short-term accident insurance and health insurance to individuals and groups. Our short-term insurance businesses comprise short-term products, meaning products having a term of one year or less at the date of their execution. |
| • | Individual life insurance had total gross written premiums of RMB 261,715 million (US$38,341 million) in 2009. |
74
Table of Contents
| • | Group life insurance had total gross written premiums of RMB 190 million (US$28 million) in 2009. |
| • | Short-term insurance had total gross written premiums of RMB 14,065 million (US$2,061 million) in 2009. |
| • | insurance premiums from the sale of life insurance policies and annuity contracts, including participating and non-participating policies and annuity contracts with life contingencies, as well as accident and health insurance products. Net premiums earned accounted for 81.1% of total revenues in 2009. |
| • | investment income and realized and, in some cases, unrealized gains and losses from our investment assets. Investment income and net realized and unrealized gains and losses accounted for 18.2% of total revenues in 2009. |
| • | insurance benefits provided to our policyholders, accident and health claims and claim adjustment expenses; |
| • | increase in insurance contracts liabilities; |
| • | investment contract benefits; |
| • | policyholder dividends resulting from participation in profits; |
| • | underwriting and policy acquisition costs; and |
| • | administrative and other expenses. |
75
Table of Contents
| • | our ability to design and distribute products and services and to introduce new products which gain market acceptance on a timely basis; |
| • | our ability to price our insurance and investment products at levels that enable us to earn a margin over the costs of providing benefits and the expense of acquiring customers and administering those products; |
| • | our returns on investment assets; |
| • | our mortality and morbidity experience; |
| • | our lapse experience, which affects our ability to recover the cost of acquiring new business over the lives of the contracts; |
| • | our cost of administering insurance contracts and providing customer services; |
| • | our ability to manage liquidity and credit risk in our investment portfolio and to manage duration risk in our asset and policy portfolios through asset-liability management; and |
| • | changes in regulations. |
76
Table of Contents
| For the year ended | ||||||||
| December 31, | ||||||||
| 2008 | 2009 | |||||||
| (RMB in millions) | ||||||||
|
Debt securities
|
2,023 | 200 | ||||||
|
Equity securities
|
(15,744 | ) | (2,350 | ) | ||||
|
|
||||||||
|
Total
|
(13,721 | ) | (2,150 | ) | ||||
|
|
||||||||
77
Table of Contents
| As of December 31, | ||||||||||||||||
| 2008 | 2009 | |||||||||||||||
| Cost or | Cost or | |||||||||||||||
| amortized | Estimated | amortized | Estimated | |||||||||||||
| cost | fair value | cost | fair value | |||||||||||||
| (RMB in millions) | ||||||||||||||||
|
|
||||||||||||||||
|
Debt securities
|
||||||||||||||||
|
Government bonds
|
73,130 | 80,006 | 50,623 | 51,996 | ||||||||||||
|
Government agency bonds
|
180,135 | 191,121 | 167,312 | 165,231 | ||||||||||||
|
Corporate bonds
|
64,388 | 67,505 | 103,603 | 102,553 | ||||||||||||
|
Subordinated bonds/debt
|
17,265 | 17,588 | 21,198 | 21,045 | ||||||||||||
|
|
||||||||||||||||
|
|
||||||||||||||||
|
Subtotal
|
334,918 | 356,220 | 342,736 | 340,825 | ||||||||||||
|
|
||||||||||||||||
|
|
||||||||||||||||
|
Equity securities
|
||||||||||||||||
|
Funds
|
32,313 | 29,890 | 62,818 | 75,798 | ||||||||||||
|
Common stocks
|
38,132 | 38,829 | 72,740 | 100,876 | ||||||||||||
|
|
||||||||||||||||
|
Subtotal
|
70,445 | 68,719 | 135,558 | 176,674 | ||||||||||||
|
|
||||||||||||||||
|
|
||||||||||||||||
|
Total
|
405,363 | 424,939 | 478,294 | 517,499 | ||||||||||||
|
|
||||||||||||||||
78
Table of Contents
| • | loss of major contracts; |
| • | breach of debt covenants; and |
| • | bankruptcy. |
| • | The market price of the equity securities was more than 50% below its cost at the balance sheet date; |
| • | The market price of the equity securities was more than 20% below its cost for a period of at least six months at the balance sheet date; and |
| • | The market price of the equity securities was below its cost for a period of more than one year. |
79
Table of Contents
| As of or for the year ended | Annual | |||||||||||||||
| December 31, | growth rate | |||||||||||||||
| 2008 | 2009 | 2009 | (2008-2009) | |||||||||||||
| RMB | RMB | US$ | ||||||||||||||
| (in millions) | ||||||||||||||||
|
|
||||||||||||||||
|
Individual life insurance business
(1)
|
||||||||||||||||
|
|
||||||||||||||||
|
Whole life and term life insurance:
|
||||||||||||||||
|
Gross written premiums
|
35,729 | 38,665 | 5,664 | 8.2 | % | |||||||||||
|
|
||||||||||||||||
|
Endowment:
|
||||||||||||||||
|
Gross written premiums
|
188,099 | 184,841 | 27,079 | (1.7 | %) | |||||||||||
|
|
||||||||||||||||
|
Annuities:
|
||||||||||||||||
|
Gross written premiums
|
28,302 | 38,209 | 5,598 | 35.0 | % | |||||||||||
|
|
||||||||||||||||
|
Group life insurance business
(1)
|
||||||||||||||||
|
|
||||||||||||||||
|
Whole life and term life insurance:
|
||||||||||||||||
|
Gross written premiums
|
299 | 172 | 25 | (42.5 | %) | |||||||||||
|
|
||||||||||||||||
|
Annuities:
|
||||||||||||||||
|
Gross written premiums
|
41 | 18 | 3 | 56.1 | % | |||||||||||
|
|
||||||||||||||||
|
Short-term insurance business
(2)
|
||||||||||||||||
|
|
||||||||||||||||
|
Accident gross written insurance premiums
|
6,221 | 7,076 | 1,037 | 13.7 | % | |||||||||||
|
Health gross written insurance premiums
|
6,965 | 6,989 | 1,024 | 0.3 | % | |||||||||||
| (1) | Including long-term health and accident products. | |
| (2) | Including short-term health and accident products. |
80
Table of Contents
| • | The reserves for long-term insurance contracts are recognized on the basis of best estimates of future payouts that will be required to fulfill the contractual obligations. These expenses refer to the expected net future cash outflows for the insurance contracts, which is the difference between the expected future cash outflows and the expected future cash inflows. The expected future cash inflows include cash inflows rising from the undertaking of insurance obligations. The expected future cash outflows are cash outflows incurred to fulfill contractual obligations, consisting of the following: |
| (i) | The guaranteed benefits based on contractual terms, including payments for deaths, disabilities, diseases, survivals, maturities and surrenders. |
81
Table of Contents
| (ii) | Additional non-guaranteed benefits, such as policyholder dividends. |
| (iii) | Expenses incurred to manage insurance contracts or to process claims, including administration and claim settlement expenses. |
| Various assumptions for the estimates are reviewed at the end of each reporting period and any changes will be recognized in net profit. |
| • | Margin has been taken into consideration while computing the reserve of insurance contracts, measured separately and recognized in the net profit in each period over the life of the contracts. At the inception of the contracts, we do not recognize Day 1 gain, whereas on the other hand, Day 1 loss is recognized as incurred. |
| Margin is comprised of risk margin and residual margin. Risk margin is the reserve accrued to compensate for the uncertain amount and timing of future cash flows. At the inception of the contract, the residual margin is calculated net of certain acquisition costs by us for not recognizing the Day 1 gain. The residual margin is amortized over the life of the contracts. The subsequent measurement of residual margin is independent from the best estimate of future discounted cash flows and risk margin. The assumption changes have no effect on the subsequent measurement of residual margin. |
| • | We have considered the impact of time value on the reserve calculation for insurance contracts. |
| • | For the insurance contracts of which future returns are affected by the investment yields of corresponding investment portfolios, investment return assumptions are applied as discount rates to assess the time value impacts on reserve computation. In developing discount rate assumptions, we consider investment experience, current and future investment portfolio and trend of the yield curve. The discount rate reflects the future economic outlook as well as our investment strategy. The assumed discount rate with risk margin ranges from 3.50% to 5.00% for the year of 2008 and ranges from 4.40% to 5.00% for the year of 2009. |
| For the insurance contracts of which the future returns are not affected by the investment yields of the corresponding investment portfolios, we use discount rate assumption to assess the time value impacts based on the “yield curve of reserve computation benchmark for insurance contracts”, published on “China Bond” website, with the consideration includes the liquidity spreads, taxation impacts and other relevant factors. The assumed discount rate with risk margin ranges from 2.81% to 4.95% for the year of 2008 and ranges from 2.69% to 5.32% for the year of 2009. |
| The discount rate assumption is affected by certain factors, such as future macro-economy, fiscal policies, capital market results and availability of investment channels for investments of our insurance funds. We determine discount rate assumption based on the information obtained at the end of each reporting period including consideration of risk margin. |
82
Table of Contents
| • | The mortality and morbidity assumptions are based on our historical mortality and morbidity experience. The assumed mortality rates and morbidity rates are varying by age of the insured and contract type. |
| We base our mortality assumptions on China Life Insurance Mortality Table (2000-2003), adjusted where appropriate to reflect our recent historical mortality experience. The main source of uncertainty with life insurance contracts is that epidemics and wide-ranging lifestyle changes could result in deterioration in future mortality experience, thus leading to an inadequate liability. Similarly, continuing advancements in medical care and social conditions could result in improvements in longevity that exceed those allowed for in the estimates used to determine the liability for contracts where we are exposed to longevity risk. |
| We base our morbidity assumptions for critical illness products on analysis of historical experience and expectations of future developments. There are two main sources of uncertainty. First, wide-ranging lifestyle changes could result in future deterioration in morbidity experience. Second, future development of medical technologies and improved coverage of medical facilities available to policyholders may bring forward the timing of diagnosing critical illness, which demands earlier payment of the critical illness benefits. Both could ultimately result in an inadequate liability if current morbidity assumptions do not properly reflect such secular trends. |
| Risk margin is considered in our mortality and morbidity assumptions. |
| • | The expense assumption has been based on expected unit costs with the consideration of risk margin. Unit costs have been based on an analysis of actual experience and expressed on both a per-policy and a percent-of-premium basis. Our expense assumption is effected by certain factors, such as inflation, market competition and other factors. We determine expense assumption based on the information obtained at the end of each reporting period with the consideration of risk margin. We have estimated the percentage of premiums costs to be 1.59% to 1.74% of premiums for individual life products and 1.54% for group life products for 2008; and 1.05% to 1.17% of premiums for individual life products and 1.01% for group life products for 2009, in each case plus a fixed per-policy expense. |
| • | The lapse rates and other assumptions are effected by certain factors, such as future macro-economic trends, availability of financial substitutions, market competition and other factors, which brings uncertainty to lapse rate and other assumptions. The lapse rates and other assumptions are determined with reference to past experience where creditable, current conditions, future expectations and other information obtained at the end of each reporting period with consideration of risk margin. |
| • | Insurance components; and |
| • | Non-insurance components. |
83
Table of Contents
84
Table of Contents
85
Table of Contents
| • | whether there has been any trades within past 30 days of the reporting date; |
| • | the volume of the trades within this 30 day period; and |
| • | the degree which the implied yields for a debt security for observed transactions differs from our understanding of the current relevant market rates and information. |
86
Table of Contents
87
Table of Contents
88
Table of Contents
89
Table of Contents
90
Table of Contents
91
Table of Contents
92
Table of Contents
93
Table of Contents
| As at December 31, | As at December 31, | |||||||
| 2009 | 2008 | |||||||
|
|
||||||||
|
Ratio of assets and liabilities
|
82.65 | % | 82.29 | % | ||||
94
Table of Contents
| As of December 31, 2009 | As of December 31, 2008 | |||||||
| (RMB in millions, | ||||||||
| except percentage data) | ||||||||
|
Actual capital
|
147,119 | 124,561 | ||||||
|
Minimum capital
|
48,459 | 40,154 | ||||||
|
Solvency ratio
|
303.59 | % | 310.21 | % | ||||
| Later | ||||||||||||||||||||
| than 3 | ||||||||||||||||||||
| Not | Later than | years but | ||||||||||||||||||
| later | 1 year but | not later | Later | |||||||||||||||||
| than | not later | than 5 | than | |||||||||||||||||
| As of December 31, 2009 | 1 year | than 3 years | years | 5 years | Total | |||||||||||||||
| (RMB in millions) | ||||||||||||||||||||
|
Securities sold under agreements to repurchase
|
33,553 | — | — | — | 33,553 | |||||||||||||||
|
Annuity and other insurance balances payable
|
5,721 | — | — | — | 5,721 | |||||||||||||||
|
Insurance contracts
|
(7,558 | ) | 34,103 | 118,673 | 1,335,276 | 1,480,494 | ||||||||||||||
|
Investment contracts
|
18,386 | 20,121 | 13,595 | 34,352 | 86,454 | |||||||||||||||
|
Off balance sheet operating leases
|
297 | 371 | 107 | 49 | 824 | |||||||||||||||
|
Capital commitments
|
419 | 69 | — | — | 488 | |||||||||||||||
|
|
||||||||||||||||||||
|
Total
|
50,818 | 54,664 | 132,375 | 1,369,677 | 1,607,534 | |||||||||||||||
|
|
||||||||||||||||||||
95
Table of Contents
| • | holding all other variables constant, if mortality rates and morbidity rates increase or decease from current best estimates by 10%, pre-tax profit for the year would have been RMB 8,899 million or RMB 9,290 million lower or higher. | ||
| • | holding all other variables constant, if lapse rates increase or decease from current best estimates by 10%, pre-tax profit for the year would have been RMB 5,426 million or RMB 5,802 million lower or higher. | ||
| • | holding all other variables constant, if the discount rates are 50 basis points higher or lower than current best estimates, pre-tax profit for the year would have been RMB 23,429 million or RMB 27,157 million higher or lower. |
96
Table of Contents
| ITEM 6. | DIRECTORS, SENIOR MANAGEMENT AND EMPLOYEES |
| Name | Age | Position | ||||
|
|
||||||
|
Yang Chao
|
60 | Chairman of the board of directors and executive director | ||||
|
Wan Feng
|
52 | President and executive director | ||||
|
Lin Dairen
|
52 | Vice President and executive director | ||||
|
Liu Yingqi
|
52 | Vice President, executive director and secretary of the board of directors | ||||
|
Miao Jianmin
|
45 | Non-executive director | ||||
|
Shi Guoqing
|
58 | Non-executive director | ||||
|
Zhuang Zuojin
|
58 | Non-executive director | ||||
|
Sun Shuyi
|
69 | Independent director | ||||
|
Ma Yongwei
|
68 | Independent director | ||||
|
Sun Changji
|
68 | Independent director | ||||
|
Bruce Douglas Moore
|
61 | Independent director | ||||
|
Liu Jiade
|
47 | Vice president | ||||
|
Zhou Ying
|
56 | Vice president | ||||
|
Su Hengxuan
|
47 | Vice president | ||||
|
Miao Ping
|
52 | Vice president | ||||
|
Hwei-Chung Shao
|
56 | Chief actuary | ||||
97
Table of Contents
98
Table of Contents
| Name | Age | Position | ||||
|
|
||||||
|
Xia Zhihua
|
54 | Chairperson of board of supervisors | ||||
|
Shi Xiangming
|
51 | Supervisor | ||||
|
Yang Hong
|
43 | Employee representative supervisor | ||||
|
Wang Xu
|
43 | Employee representative supervisor | ||||
|
Tian Hui
|
58 | Supervisor | ||||
99
Table of Contents
100
Table of Contents
101
Table of Contents
| Compensation | ||||||||||||||||||||
| for loss of | ||||||||||||||||||||
| Inducement | Other | office as | ||||||||||||||||||
| Name | Salaries/Fees | Fees | Benefits | director | Total | |||||||||||||||
| In RMB | ||||||||||||||||||||
|
Yang Chao
|
864,168 | — | — | — | 864,168 | |||||||||||||||
|
Wan Feng
|
929,600 | — | — | — | 929,600 | |||||||||||||||
|
Lin Dairen
|
855,733 | — | — | — | 855,733 | |||||||||||||||
|
Liu Yingqi
|
855,733 | — | — | — | 855,733 | |||||||||||||||
|
Miao Jianmin
|
— | — | — | — | — | |||||||||||||||
|
Shi Guoqing
|
— | — | — | — | — | |||||||||||||||
|
Zhuang Zuojin
|
— | — | — | — | — | |||||||||||||||
|
Sun Shuyi
|
— | — | — | — | — | |||||||||||||||
|
Ma Yongwei
|
— | — | — | — | — | |||||||||||||||
|
Sun Changji
|
— | — | — | — | — | |||||||||||||||
|
Bruce Douglas Moore
|
157,500 | — | — | — | 157,500 | |||||||||||||||
|
Long Yongtu
(1)
|
— | — | — | — | — | |||||||||||||||
|
Chau Tak Hay
(1)
|
112,500 | — | — | — | 112,500 | |||||||||||||||
|
Cai Rang
(1)
|
112,500 | — | — | — | 112,500 | |||||||||||||||
|
Ngai Wai Fung
(1)
|
112,500 | — | — | — | 112,500 | |||||||||||||||
|
Xia Zhihua
|
855,733 | — | — | — | 855,733 | |||||||||||||||
|
Shi Xiangming
|
337,283 | — | — | — | 337,283 | |||||||||||||||
|
Yang Hong
|
553,000 | — | — | — | 553,000 | |||||||||||||||
|
Wang Xu
|
322,583 | — | — | — | 322,583 | |||||||||||||||
|
Tian Hui
|
120,000 | — | — | — | 120,000 | |||||||||||||||
|
Wu Weimin
(2)
|
251,417 | — | — | — | 251,417 | |||||||||||||||
|
Qing Ge
(2)
|
251,417 | — | — | — | 251,417 | |||||||||||||||
|
|
||||||||||||||||||||
|
|
||||||||||||||||||||
|
Total
|
6,691,667 | — | — | — | 6,691,667 | |||||||||||||||
|
|
||||||||||||||||||||
| (1) |
Resigned as the independent non-executive director on May 25, 2009.
|
|
| (2) | Resigned as the employee representative supervisor on May 25, 2009. |
| Name | Total | |||
| In RMB | ||||
|
|
||||
|
Liu Jiade
|
850,000 | |||
|
Zhou Ying
|
850,000 | |||
|
Su Hengxuan
|
850,000 | |||
|
Miao Ping
|
60,000 | |||
|
Liu Lefei
(3)
|
170,000 | |||
|
Liu Anlin
(4)
|
700,000 | |||
|
Hwei-Chung Shao
|
2,930,000 | |||
|
|
||||
|
|
||||
|
Total
|
4,860,000 | |||
|
|
||||
| (3) | Removed as our chief investment officer on January 19, 2009. | |
| (4) | Removed as our chief information technology officer on December 21, 2009. |
102
Table of Contents
103
Table of Contents
| As of December 31 | ||||||||||||||||||||||||
| 2007 | 2008 | 2009 | ||||||||||||||||||||||
| Number | % | Number | % | Number | % | |||||||||||||||||||
| of | of | of | of | of | of | |||||||||||||||||||
| employees | total | employees | total | employees | total | |||||||||||||||||||
|
Management and administrative staff
|
18,535 | 19.17 | % | 20,250 | 19.81 | % | 21,450 | 20.52 | % | |||||||||||||||
|
Financial and auditing staff
|
7,931 | 8.20 | % | 7,663 | 7.50 | % | 7,967 | 7.62 | % | |||||||||||||||
|
Sales and marketing staff
(1)
|
25,473 | 26.34 | % | 25,473 | 24.92 | % | 26,320 | 25.18 | % | |||||||||||||||
|
Underwriters, claim specialists and customer
service staff
|
33,703 | 34.85 | % | 38,797 | 37.96 | % | 39,329 | 37.54 | % | |||||||||||||||
|
Other professional and technical staff
(2)
|
2,742 | 2.84 | % | 3,680 | 3.60 | % | 3,800 | 3.64 | % | |||||||||||||||
|
Other
|
8,314 | 8.60 | % | 6,378 | 6.24 | % | 5,759 | 5.51 | % | |||||||||||||||
|
|
||||||||||||||||||||||||
|
|
||||||||||||||||||||||||
|
Total
|
96,698 | 100 | % | 102,241 | 100 | % | 104,535 | 100 | % | |||||||||||||||
|
|
||||||||||||||||||||||||
| (1) | Includes direct sales representatives. | |
| (2) | Includes actuaries, product development personnel, investment management personnel and information technology specialists. |
104
Table of Contents
| ITEM 7. | MAJOR SHAREHOLDERS AND RELATED PARTY TRANSACTIONS. |
| Percentage of | ||||||||||||
| Percentage of | Total Share | |||||||||||
| Title of Class | Identity of Person or Group | Amount Owned | Class | Capital | ||||||||
|
|
||||||||||||
|
A Shares
|
China Life Insurance (Group) Company | 19,323,530,000(L) | 92.80 | % | 68.37 | % | ||||||
|
H Shares
|
JPMorgan Chase & Co. (1) | 592,454,359(L) | 7.96 | % | 2.10 | % | ||||||
|
|
52,441,871(S) | 0.70 | % | 0.19 | % | |||||||
|
|
282,699,343(P) | 3.80 | % | 1.00 | % | |||||||
|
H Shares
|
Blackrock, Inc. (2) | 387,227,148(L) | 5.20 | % | 1.37 | % | ||||||
|
|
864,500(S) | 0.01 | % | 0.00 | % | |||||||
| The letter L denotes a long position. The letter S denotes a short position. The letter P denotes interest in a lending pool. |
| (1): | JPMorgan Chase & Co. was interested in a total of 592,454,359 H shares in accordance with the provisions of Part XV of the Securities and Futures Ordinance, or the SFO. Of these shares, JPMorgan Chase Bank, N.A., J.P. Morgan Investment Management Inc., JPMorgan Asset Management (UK) Limited, JPMorgan Asset Management (Japan) Limited, JF Asset Management Limited, J.P. Morgan Securities Ltd., J.P. Morgan Whitefriars Inc., JPMorgan Asset Management (Taiwan) Limited, JF International Management Inc., China International Fund Management Co Ltd and J.P. Morgan Markets Limited were interested in 282,699,343 H shares, 2,411,912 H shares, 31,218,909 H shares, 642,000 H shares, 183,182,750 H shares, 37,959,749 H shares, 26,534,196 H shares, 10,363,000 H shares, 1,582,000 H shares, 11,609,000 H shares and 4,251,500 H shares respectively. All of these entities are either controlled or indirectly controlled subsidiaries of JPMorgan Chase & Co. | |
| Included in the 592,454,359 H shares are 282,699,343 H shares (3.80%) which are held in the “lending pool”, as defined under Section 5(4) of the Securities and Futures (Disclosure of Interests Securities Borrowing and Lending) Rules. | ||
| In addition, JPMorgan Chase & Co. held by way of attribution a short position as defined under Part XV, SFO in 52,441,871 H shares (0.70%). | ||
| (2): | Blackrock, Inc. was interested in a total of 387,227,148 H shares in accordance with the provisions of Part XV, SFO. Of these shares, BlackRock Investment Management, LLC., BlackRock Financial Management, Inc., BlackRock Institutional Trust Company, N.A., BlackRock Fund Advisors, BlackRock Advisors, LLC., BlackRock Capital Management, Inc., BlackRock Investment Management (Australia) Limited, Blackrock Advisors UK Ltd., BlackRock International Ltd., BlackRock Investment Management (LUX), BlackRock Investment Management (UK) Ltd and BlackRock Fund Managers Ltd were interested in 4,619,993 H shares, 382,607,155 H shares, 295,115,665 H shares, 219,911,665 H shares, 18,292,065 H shares, 53,900 H shares, 233,395 H shares, 49,719,000 H shares, 5,063,550 H shares, 6,351,685 H shares, 7,163,795 H shares and 1,992,000 H shares respectively. All of these entities are either controlled or indirectly controlled subsidiaries of Blackrock, Inc. | |
| Blackrock, Inc. held by way of attribution a short position as defined under Part XV, SFO in 864,500 H shares (0.01%). |
105
Table of Contents
106
Table of Contents
107
Table of Contents
108
Table of Contents
| The aggregate value for | ||||
| the year ended | ||||
| Transactions | December 31, 2009 | |||
| (RMB in millions) | ||||
|
1. Policy management agreement
|
1,193 | |||
|
2. Asset management agreement
|
||||
|
(a) between CLIC and
AMC
|
112 | |||
|
(b) between AMC and
us
|
540 | |||
|
3. Property leasing agreement
|
64 | |||
| 1) | the transactions were entered into in the ordinary and usual course of our business; | ||
| 2) | the transactions were conducted either on normal commercial terms or on terms that are fair and reasonable so far as our independent shareholders are concerned; | ||
| 3) | the transactions were entered into in accordance with the agreements governing those transactions; and | ||
| 4) | the amounts of the transactions had not exceeded the relevant annual caps as announced by us. |
109
Table of Contents
| ITEM 8. | FINANCIAL INFORMATION. |
110
Table of Contents
| • | our results of operations and cash flows; | ||
| • | our financial position; | ||
| • | statutory solvency requirements as determined under PRC GAAP with reference to CIRC rules; | ||
| • | our shareholders’ interests; | ||
| • | general business conditions; | ||
| • | our future prospects; | ||
| • | statutory and regulatory restrictions on the payment of dividends by us; and | ||
| • | other factors that our board of directors deems relevant. |
| • | recovery of accumulated losses, if any; |
| • | allocations to the statutory common reserve fund equivalent to 10% of our after-tax income, as determined under PRC GAAP; and |
| • | allocations to a discretionary common reserve fund as approved by the shareholders in a shareholders’ meeting. |
111
Table of Contents
112
Table of Contents
| • | Net assets, defined as assets less PRC statutory policy reserves and other liabilities; and |
| • | Net-of-tax adjustments for relevant differences between the market value and the book value of assets, together with relevant net-of-tax adjustments to certain liabilities. |
113
Table of Contents
| ITEM | 2009 | 2008 | ||||||
|
A Adjusted Net Worth
|
159,948 | 137,816 | ||||||
|
B Value of In-Force Business before Cost of Solvency Margin
|
149,387 | 122,898 | ||||||
|
C Cost of Solvency Margin
|
(24,106 | ) | (20,626 | ) | ||||
|
D Value of In-Force Business after Cost of Solvency Margin (B+C)
|
125,282 | 102,271 | ||||||
|
E Embedded Value (A + D)
|
285,229 | 240,087 | ||||||
|
F Value of One Year’s Sales before Cost of Solvency Margin
|
21,352 | 17,528 | ||||||
|
G Cost of Solvency Margin
|
(3,638 | ) | (3,604 | ) | ||||
|
H Value of One Year’s Sales after Cost of Solvency Margin (F + G)
|
17,713 | 13,924 | ||||||
| Note: | Numbers may not be additive due to rounding. |
| ITEM | RMB million | |||
|
A Embedded Value at Start of Year
|
240,087 | |||
|
B Expected Return on Embedded Value
|
21,123 | |||
|
C Value of New Business in the Period
|
17,713 | |||
|
D Operating Experience Variance
|
(560 | ) | ||
|
E Investment Experience Variance
|
19,590 | |||
|
F Methodology, Model and Assumption Changes
|
(1,155 | ) | ||
|
G Market Value Adjustment
|
(4,283 | ) | ||
|
H Exchange Gains or Losses
|
(28 | ) | ||
|
I Shareholder Dividend Distribution
|
(6,500 | ) | ||
|
J Other
|
(757 | ) | ||
|
K Embedded Value as at 31 Dec 2009 (sum A through J)
|
285,229 | |||
| Notes: | 1) | Numbers may not be additive due to rounding. |
| 2) | Items B through J are explained below: |
| B | Reflects unwinding of the opening value of in-force business and value of new business sales in 2009 plus the expected return on investments supporting the 2009 opening net worth. | ||
| C | Value of new business sales in 2009. |
114
Table of Contents
| D | Reflects the difference between actual experience in 2009 (including lapse, mortality, morbidity, and expense etc.) and the assumptions. | ||
| E | Compares actual with expected investment returns during 2009. | ||
| F | Reflects the effect of projection method, model enhancements and assumption changes. | ||
| G | Change in the market value adjustment from the beginning of year 2009 to the end of 2009, and other related adjustments. | ||
| H | Reflect the gains or losses due to change in exchange rate. | ||
| I | Reflects dividends distributed to shareholders during 2009. | ||
| J | Other miscellaneous items. |
| VALUE OF IN- | VALUE OF ONE | ||||||||
| FORCE BUSINESS | YEAR’S SALES | ||||||||
| Scenarios 1-16: Assuming the method to | AFTER COST OF | AFTER COST OF | |||||||
| determine taxable income for 2009 and thereafter | SOLVENCY | SOLVENCY | |||||||
| was the same as that in 2008 | MARGIN | MARGIN | |||||||
|
|
|||||||||
|
Base case scenario
|
125,282 | 17,713 | |||||||
|
1.
Risk discount rate of 11.5%
|
118,536 | 16,706 | |||||||
|
2.
Risk discount rate of 10.5%
|
132,544 | 18,800 | |||||||
|
3.
10% increase in investment return
|
148,993 | 20,492 | |||||||
|
4.
10% decrease in investment return
|
101,664 | 14,958 | |||||||
|
5.
10% increase in expenses
|
123,264 | 16,211 | |||||||
|
6.
10% decrease in expenses
|
127,297 | 19,215 | |||||||
|
7.
10% increase in mortality rate for non-annuity
products and 10% decrease in mortality rate for
annuity products
|
123,782 | 17,581 | |||||||
|
8.
10% decrease in mortality rate for non-annuity
products and 10% increase in mortality rate for
annuity products
|
126,802 | 17,847 | |||||||
|
9.
10% increase in lapse rates
|
123,681 | 17,461 | |||||||
|
10.
10% decrease in lapse rates
|
126,962 | 17,974 | |||||||
|
11.
10% increase in morbidity rates
|
123,562 | 17,546 | |||||||
|
12.
10% decrease in morbidity rates
|
127,016 | 17,882 | |||||||
|
13.
10% increase in claim ratio of short term business
|
125,029 | 17,200 | |||||||
|
14.
10% decrease in claim ratio of short term business
|
125,534 | 18,227 | |||||||
|
15.
Solvency margin at 150% of statutory minimum
|
113,229 | 15,894 | |||||||
|
16.
Using 2008 EV assumptions
|
126,117 | 17,994 | |||||||
|
17.
Projected taxable income based on accounting profit in
accordance to “the Provisions on the Accounting
Treatment Related to Insurance Contracts”
|
120,004 | 17,227 | |||||||
|
|
|||||||||
| Adjusted Net Worth | |||||||||
|
Base Case Scenario
|
159,948 | ||||||||
|
18.
Taxable income based on accounting profit in
accordance to “the Provisions on the Accounting
Treatment Related to Insurance Contracts” for 2009
|
156,112 | ||||||||
| Note: | Scenarios 17 and 18 reflect the sensitivity to a different approach in determining the taxable income. |
115
Table of Contents
| • | a review of the methodology used to develop the embedded value and value of one year’s sales as at 31 December 2009, in the light of the requirements of the “Life Insurance Embedded Value Reporting Guidelines” issued by the China Insurance Regulatory Commission (“CIRC”) in September 2005; |
| • | a review of the economic and operating assumptions used to develop the embedded value and value of one year’s sales as at 31 December 2009; |
| • | a review of the results of China Life’s calculation of the EV Results. |
| • | the embedded value methodology used by China Life is consistent with the requirements of the “Life Insurance Embedded Value Reporting Guidelines” issued by the CIRC, the methodology applied by China Life is a common methodology used to determine embedded values of life insurance companies in China at the current time; |
| • | the economic assumptions used by China Life are internally consistent, have been set with regard to current economic conditions, and have made allowance for the company’s current and expected future asset mix and investment strategy; |
| • | the operating assumptions used by China Life have been set with appropriate regard to past, current and expected future experience; |
| • | no changes have been assumed to the treatment of tax, but some sensitivity results relating to tax have been shown by China Life; and |
| • | the EV Results have been prepared, in all material respects, in accordance with the methodology and assumptions set out in the Embedded Value section. |
116
Table of Contents
| ITEM 9. | THE OFFER AND LISTING. |
| Price per H Share | Price per ADS (1) | Price per A share | ||||||||||||||||||||||
| (HK$) | (US$) | (RMB) | ||||||||||||||||||||||
| High | Low | High | Low | High | Low | |||||||||||||||||||
|
Annual
|
||||||||||||||||||||||||
|
2005
|
6.9000 | 4.8500 | 13.49 | 9.45 | — | — | ||||||||||||||||||
|
2006
|
27.2000 | 7.0500 | 52.18 | 13.76 | — | — | ||||||||||||||||||
|
2007
|
52.0000 | 19.2600 | 106.56 | 36.70 | 75.0800 | (2) | 32.0400 | (2) | ||||||||||||||||
|
2008
|
39.8500 | 16.7000 | 76.75 | 33.57 | 58.9700 | 18.1500 | ||||||||||||||||||
|
2009
|
41.0000 | 19.9000 | 79.86 | 38.34 | 33.1800 | 18.6700 | ||||||||||||||||||
|
Quarterly
|
||||||||||||||||||||||||
|
First Quarter, 2008
|
39.8500 | 25.1500 | 76.75 | 50.00 | 58.9700 | 26.7100 | ||||||||||||||||||
|
Second Quarter, 2008
|
35.3500 | 27.2000 | 68.35 | 52.18 | 36.5900 | 23.9200 | ||||||||||||||||||
|
Third Quarter, 2008
|
30.4000 | 25.4000 | 59.09 | 48.79 | 27.6400 | 18.9700 | ||||||||||||||||||
|
Fourth Quarter, 2008
|
29.5000 | 16.7000 | 57.00 | 33.57 | 23.7900 | 18.1500 | ||||||||||||||||||
|
First Quarter, 2009
|
26.4500 | 19.9000 | 51.56 | 38.34 | 24.0300 | 18.6700 | ||||||||||||||||||
|
Second Quarter, 2009
|
30.5000 | 25.4500 | 59.39 | 50.10 | 27.7500 | 22.6200 | ||||||||||||||||||
|
Third Quarter, 2009
|
36.1500 | 28.6000 | 70.09 | 54.83 | 34.0100 | 25.1000 | ||||||||||||||||||
|
Fourth Quarter, 2009
|
41.0000 | 32.8000 | 79.86 | 63.16 | 33.1800 | 28.3800 | ||||||||||||||||||
|
First Quarter, 2010
|
39.3000 | 32.6000 | 76.14 | 62.50 | 31.4200 | 26.6900 | ||||||||||||||||||
|
Monthly
|
||||||||||||||||||||||||
|
October 2009
|
37.1000 | 32.8000 | 72.63 | 63.16 | 31.5400 | 28.3800 | ||||||||||||||||||
|
November 2009
|
40.7500 | 36.2000 | 78.85 | 70.64 | 32.3000 | 29.5100 | ||||||||||||||||||
|
December 2009
|
41.0000 | 36.3000 | 79.86 | 70.97 | 31.1800 | 29.1000 | ||||||||||||||||||
|
January 2010
|
39.3000 | 33.8000 | 76.14 | 65.04 | 31.4200 | 27.0500 | ||||||||||||||||||
|
February 2010
|
34.8500 | 32.6000 | 67.48 | 62.50 | 28.0900 | 26.6900 | ||||||||||||||||||
|
March 2010
|
37.3500 | 34.2000 | 72.04 | 67.25 | 28.7300 | 27.0200 | ||||||||||||||||||
|
April 2010 (through April 23, 2010)
|
38.2000 | 36.3000 | 74.79 | 70.17 | 29.2800 | 27.1300 | ||||||||||||||||||
| (1) | Each ADS represented 40 H shares until December 29, 2006 when the ratio was altered such that each ADS represented 15 H shares. The market quotations shown in the table above have been restated for all periods to reflect the current ratio of 15 H shares per ADS. | |
| (2) | From the date of listing: January 9, 2007. |
117
Table of Contents
| ITEM 10. | ADDITIONAL INFORMATION. |
118
Table of Contents
| • | varying the rights of existing classes of shares; |
| • | voting rights; |
| • | our power to purchase our own shares; |
| • | rights of minority shareholders; and |
| • | liquidation procedures. |
119
Table of Contents
| • | recovery of accumulated losses, if any; |
| • | allocations to the statutory common reserve fund equivalent to 10% of our after-tax income; and |
| • | allocations to a discretionary common reserve fund as approved by the shareholders in a shareholders’ meeting. |
120
Table of Contents
| • | where the number of directors is less than the number stipulated in the PRC company law or two-thirds of the number specified in our articles of association; |
| • | where our unrecovered losses reach one-third of the total amount of our share capital; |
| • | where shareholders, individually or jointly, holding 10% or more of our issued and outstanding voting shares so request in writing; |
| • | whenever our board of directors deems necessary, or more than half of directors (including at least two independent directors) or our board of supervisors so requests; or |
| • | any other event as maybe provided by applicable laws, rules, regulations or our articles of association. |
121
Table of Contents
| • | an increase or decrease in our share capital or the issuance of shares, warrants, debentures and other similar securities; |
| • | our division, merger, dissolution or liquidation (shareholders who object to a proposed merger are entitled to demand that either we or the shareholders who approved the merger purchase their shares at a fair price); |
| • | amendments to our articles of association; |
| • | amendment of shareholders’ rights of any class of shares; |
| • | purchase or sale within any single year of any material assets exceeding 30% of our latest audited total assets; |
| • | any equity-based incentive plan; and |
| • | any other matters as provided under applicable laws or regulations or determined by a majority of shareholders at a general meeting to have a material impact on us and should be approved by two-thirds of the voting rights. |
122
Table of Contents
| • | is necessary to enable them and the public to appraise the position of us and our subsidiaries; |
| • | is necessary to avoid the establishment of a false market in our securities; and |
| • | might reasonably be expected to affect materially market activity in, and the price of, our securities. |
123
Table of Contents
124
Table of Contents
| • | is in a position to elect more than one-half of the board of directors; |
| • | has the power to exercise, or to control the exercise of, 30% or more of our voting rights; |
| • | holds 30% or more of our issued and outstanding shares; or |
| • | has de facto control of us in any other way. |
| • | to relieve a director or supervisor from his or her duty to act honestly in our best interests; |
| • | to approve the appropriation by a director or supervisor, for his or her own benefit or for the benefit of any other person, of our assets in any way, including without limitation opportunities which may be advantageous to us; or |
| • | to approve the appropriation by a director or supervisor, for his or her own benefit or for the benefit of another person, of the individual rights of other shareholders, including without limitation rights to distributions and voting rights (except in accordance with a restructuring of our company which has been submitted for approval by the shareholders at a general meeting in accordance with our articles of association). |
125
Table of Contents
| • | to act honestly in our company’s best interests; |
| • | not to exploit corporate assets for personal gains; and |
| • | not to expropriate the rights of our shareholders. |
126
Table of Contents
| • | the retirement or non-retirement of directors under any age limit requirement; |
| • | directors’ borrowing power; or |
| • | number of shares required for directors’ qualification. |
127
Table of Contents
128
Table of Contents
| • | convening shareholders’ meetings and reporting its work to shareholders at these meetings; |
| • | implementing shareholders’ resolutions; |
| • | determining the company’s business plans and investment proposals; |
| • | formulating the company’s annual financial budgets and final accounts; |
| • | formulating the company’s profit distribution plans and loss recovery plans; |
| • | formulating proposals for the increase or decrease in the company’s registered capital and the issue of debentures; |
| • | formulating major acquisition and disposal plans and plans for the merger, division or dissolution of the company; |
| • | deciding on the company’s internal management structure and formulating its basic management system; and |
| • | appointing or removing the company’s principal executive officers; appointing and removing other senior officers based on the recommendation of the principal executive officer and deciding on the remuneration of the senior officers. |
129
Table of Contents
| • | examining the company’s financial affairs; |
| • | monitoring compliance with laws, regulations, the articles of association of the company and the shareholders resolutions by the directors and officers of the company; and suggesting removing the directors and officers who violate these laws and regulations; |
| • | requiring corrective action from directors and officers whose actions are contrary to the interests of the company; |
| • | proposing the holding of extraordinary shareholders’ meetings; |
| • | proposing new items to be inserted in the agenda of the shareholders’ meeting. |
| • | bringing lawsuits against directors or members of senior management, if they violate laws, regulations or articles of association of the company; and |
| • | exercising and performing other powers and functions provided for in the company’s articles of association. |
130
Table of Contents
131
Table of Contents
132
Table of Contents
133
Table of Contents
134
Table of Contents
135
Table of Contents
136
Table of Contents
137
Table of Contents
138
Table of Contents
139
Table of Contents
140
Table of Contents
141
Table of Contents
| ITEM 11. | QUANTITATIVE AND QUALITATIVE DISCLOSURES ABOUT MARKET RISK. |
142
Table of Contents
| Expected Maturity Date | ||||||||||||||||||||||||||||||||
| Fair | ||||||||||||||||||||||||||||||||
| As of December 31, 2009 | 2010 | 2011 | 2012 | 2013 | 2014 | Thereafter | Total | value | ||||||||||||||||||||||||
| (RMB in millions, except as otherwise stated) | ||||||||||||||||||||||||||||||||
|
Assets
|
||||||||||||||||||||||||||||||||
|
Held-to-maturity and
available-for-sale debt
securities
|
||||||||||||||||||||||||||||||||
|
Fixed rate bonds
|
||||||||||||||||||||||||||||||||
|
in RMB
|
4,206 | 32,650 | 5,521 | 7,824 | 20,552 | 480,981 | 551,734 | 550,128 | ||||||||||||||||||||||||
|
Average interest rate
|
3.68 | % | 4.57 | % | 4.74 | % | 4.66 | % | 4.75 | % | 4.36 | % | 4.39 | % | ||||||||||||||||||
|
|
||||||||||||||||||||||||||||||||
|
in US$
|
— | — | — | — | — | — | — | — | ||||||||||||||||||||||||
|
Average interest rate
|
— | — | — | — | — | — | — | |||||||||||||||||||||||||
|
in HK$
|
— | — | — | — | — | 7 | 7 | 7 | ||||||||||||||||||||||||
|
Average interest rate
|
— | — | — | — | — | 5.38 | % | 5.38 | % | |||||||||||||||||||||||
|
|
||||||||||||||||||||||||||||||||
|
Variable rate bonds
|
||||||||||||||||||||||||||||||||
|
in RMB
|
3,784 | 1,746 | 1,008 | 5,073 | 3,219 | 8,362 | 23,192 | 23,546 | ||||||||||||||||||||||||
|
Average interest rate
|
4.76 | % | 5.33 | % | 5.10 | % | 4.98 | % | 5.62 | % | 4.68 | % | 4.96 | % | ||||||||||||||||||
|
|
||||||||||||||||||||||||||||||||
|
in US$
|
854 | — | — | 2,048 | — | — | 2,902 | 2,902 | ||||||||||||||||||||||||
|
Average interest rate
|
0.99 | % | — | — | 1.41 | % | — | — | 1.29 | % | ||||||||||||||||||||||
|
|
||||||||||||||||||||||||||||||||
|
Term deposits (excluding
structured deposits)
|
||||||||||||||||||||||||||||||||
|
in RMB
|
77,580 | 19,200 | 36,400 | 78,367 | 58,850 | 64,500 | 337,897 | 337,897 | ||||||||||||||||||||||||
|
Average interest rate
|
2.69 | % | 4.34 | % | 3.78 | % | 4.06 | % | 3.64 | % | 3.76 | % | 3.60 | % | ||||||||||||||||||
|
|
||||||||||||||||||||||||||||||||
|
in US$
|
6,813 | — | — | — | — | — | 6,813 | 6,813 | ||||||||||||||||||||||||
|
Average interest rate
|
3.18 | % | — | — | — | — | — | 3.18 | % | |||||||||||||||||||||||
|
|
||||||||||||||||||||||||||||||||
|
Structured deposits
(1)
|
||||||||||||||||||||||||||||||||
|
|
||||||||||||||||||||||||||||||||
|
in US$
|
— | — | 273 | — | — | — | 273 | 272 | ||||||||||||||||||||||||
|
Average interest rate
|
— | — | 0.95 | % | — | — | — | 0.95 | % | |||||||||||||||||||||||
|
|
||||||||||||||||||||||||||||||||
|
Liabilities
|
||||||||||||||||||||||||||||||||
|
Securities sold under agreements
to repurchase
|
33,553 | — | — | — | — | — | 33,553 | 33,553 | ||||||||||||||||||||||||
|
Average interest rate
|
1.84 | % | — | — | — | — | — | 1.84 | % | |||||||||||||||||||||||
|
|
||||||||||||||||||||||||||||||||
|
Investment contracts
|
2,035 | 1,043 | 1,118 | 657 | 2,144 | 60,329 | 67,326 | 66,184 | ||||||||||||||||||||||||
|
Average interest rate
|
2.02 | % | 1.34 | % | 1.39 | % | 2.50 | % | 2.50 | % | 2.35 | % | 2.32 | % | ||||||||||||||||||
143
Table of Contents
| Expected Maturity Date | ||||||||||||||||||||||||||||||||
| Fair | ||||||||||||||||||||||||||||||||
| As of December 31, 2008 | 2009 | 2010 | 2011 | 2012 | 2013 | Thereafter | Total | value | ||||||||||||||||||||||||
| (RMB in millions, except as otherwise stated) | ||||||||||||||||||||||||||||||||
|
Assets
|
||||||||||||||||||||||||||||||||
|
Held-to-maturity and
available-for-sale debt
securities
|
||||||||||||||||||||||||||||||||
|
Fixed rate bonds
|
||||||||||||||||||||||||||||||||
|
in RMB
|
28,157 | 3,202 | 52,559 | 8,386 | 17,379 | 405,956 | 515,638 | 553,271 | ||||||||||||||||||||||||
|
Average interest rate
|
4.23 | % | 4.50 | % | 4.57 | % | 4.33 | % | 4.59 | % | 4.34 | % | 4.37 | % | ||||||||||||||||||
|
|
||||||||||||||||||||||||||||||||
|
in US$
|
— | — | — | — | — | — | — | — | ||||||||||||||||||||||||
|
Average interest rate
|
— | — | — | — | — | — | — | |||||||||||||||||||||||||
|
|
||||||||||||||||||||||||||||||||
|
Variable rate bonds
|
||||||||||||||||||||||||||||||||
|
in RMB
|
3,600 | 3,845 | 1,861 | 1,216 | 6,557 | 11,224 | 28,303 | 28,641 | ||||||||||||||||||||||||
|
Average interest rate
|
6.06 | % | 4.94 | % | 4.86 | % | 5.04 | % | 4.87 | % | 4.90 | % | 5.05 | % | ||||||||||||||||||
|
|
||||||||||||||||||||||||||||||||
|
in US$
|
— | 854 | — | — | 2,050 | — | 2,905 | 2,905 | ||||||||||||||||||||||||
|
Average interest rate
|
— | 3.15 | % | — | — | 3.49 | % | — | 3.39 | % | ||||||||||||||||||||||
|
|
||||||||||||||||||||||||||||||||
|
Term deposits (excluding
structured deposits)
|
||||||||||||||||||||||||||||||||
|
in RMB
|
59,700 | 18,080 | 19,200 | 39,400 | 78,367 | 5,699 | 220,446 | 220,446 | ||||||||||||||||||||||||
|
Average interest rate
|
3.95 | % | 4.13 | % | 4.34 | % | 3.79 | % | 4.06 | % | 3.97 | % | 4.01 | % | ||||||||||||||||||
|
|
||||||||||||||||||||||||||||||||
|
in US$
|
4,921 | — | — | — | — | — | 4,921 | 4,921 | ||||||||||||||||||||||||
|
Average interest rate
|
6.00 | % | — | — | — | — | — | 6.00 | % | |||||||||||||||||||||||
|
|
||||||||||||||||||||||||||||||||
|
Structured deposits
(1)
|
||||||||||||||||||||||||||||||||
|
|
||||||||||||||||||||||||||||||||
|
in US$
|
— | — | — | 273 | — | 2,632 | 2,905 | 2,887 | ||||||||||||||||||||||||
|
Average interest rate
|
— | — | — | 3.65 | % | — | 8.09 | % | 7.67 | % | ||||||||||||||||||||||
|
|
||||||||||||||||||||||||||||||||
|
Liabilities
|
||||||||||||||||||||||||||||||||
|
Securities sold under agreements
to repurchase
|
11,390 | — | — | — | — | — | 11,390 | 11,390 | ||||||||||||||||||||||||
|
Average interest rate
|
1.14 | % | — | — | — | — | — | 1.14 | % | |||||||||||||||||||||||
|
|
||||||||||||||||||||||||||||||||
|
Investment contracts
|
2,258 | 947 | 1,088 | 783 | 1,274 | 46,879 | 53,229 | 51,212 | ||||||||||||||||||||||||
|
Average interest rate
|
2.31 | % | 2.15 | % | 1.58 | % | 2.50 | % | 2.50 | % | 2.47 | % | 2.44 | % | ||||||||||||||||||
| (1) | assuming the interest rates are within the specified ranges and the deposits are not terminated earlier by the banks. |
144
Table of Contents
| As of December 31, | ||||||||||||||||
| 2008 | 2009 | |||||||||||||||
| Carrying amount | Fair value | Carrying amount | Fair value | |||||||||||||
| (RMB in millions) | ||||||||||||||||
|
Equity securities
|
75,082 | 75,082 | 179,416 | 179,416 | ||||||||||||
|
Financial assets
at fair value
through income
(held for
trading)
|
6,363 | 6,363 | 2,742 | 2,742 | ||||||||||||
|
Available-for-sale
|
68,719 | 68,719 | 176,674 | 176,674 | ||||||||||||
145
Table of Contents
| Expected Maturity Date | ||||||||||||||||||||||||||||||||
| Fair | ||||||||||||||||||||||||||||||||
| As of December 31, 2009 | 2010 | 2011 | 2012 | 2013 | 2014 | Thereafter | Total | value | ||||||||||||||||||||||||
| (in millions) | ||||||||||||||||||||||||||||||||
|
Debt securities
|
||||||||||||||||||||||||||||||||
|
in US$
|
— | 125 | — | — | 300 | — | 425 | 425 | ||||||||||||||||||||||||
|
Average interest rate
|
— | 3.15 | % | — | — | 3.49 | % | — | 3.39 | % | ||||||||||||||||||||||
|
|
||||||||||||||||||||||||||||||||
|
in HK$
|
— | — | — | — | — | 8 | 8 | 8 | ||||||||||||||||||||||||
|
Average interest rate
|
— | — | — | — | — | 5.38 | % | 5.38 | % | |||||||||||||||||||||||
|
|
||||||||||||||||||||||||||||||||
|
Term deposits (excluding
structured deposits)
|
||||||||||||||||||||||||||||||||
|
in US$
|
998 | — | — | — | — | — | 998 | 998 | ||||||||||||||||||||||||
|
Average interest rate
|
3.18 | % | — | — | — | — | — | 3.18 | % | |||||||||||||||||||||||
|
|
||||||||||||||||||||||||||||||||
|
Structured deposits
(1)
|
||||||||||||||||||||||||||||||||
|
in US$
|
— | — | 40 | — | — | — | 40 | 40 | ||||||||||||||||||||||||
|
Average interest rate
|
— | — | 0.95 | % | — | — | — | 0.95 | % | |||||||||||||||||||||||
|
|
||||||||||||||||||||||||||||||||
|
Cash and Cash equivalents
|
||||||||||||||||||||||||||||||||
|
in US$
|
5 | — | — | — | — | — | 5 | 5 | ||||||||||||||||||||||||
|
Average interest rate
|
1.95 | % | — | — | — | — | — | 1.95 | % | |||||||||||||||||||||||
|
|
||||||||||||||||||||||||||||||||
|
in HK$
|
341 | — | — | — | — | — | 341 | 341 | ||||||||||||||||||||||||
|
Average interest rate
|
0.00 | % | — | — | — | — | — | 0.00 | % | |||||||||||||||||||||||
| (1) | assuming the interest rates are within the specified range and the deposits are not terminated earlier by the banks. |
| Expected Maturity Date | ||||||||||||||||||||||||||||||||
| Fair | ||||||||||||||||||||||||||||||||
| As of December 31, 2008 | 2009 | 2010 | 2011 | 2012 | 2013 | Thereafter | Total | value | ||||||||||||||||||||||||
| (in millions) | ||||||||||||||||||||||||||||||||
|
Debt securities
|
||||||||||||||||||||||||||||||||
|
in US$
|
— | 125 | — | — | 300 | — | 425 | 425 | ||||||||||||||||||||||||
|
Average interest rate
|
— | 3.15 | % | — | — | 3.49 | % | — | 3.39 | % | ||||||||||||||||||||||
|
|
||||||||||||||||||||||||||||||||
|
Term deposits (excluding
structured deposits)
|
||||||||||||||||||||||||||||||||
|
in US$
|
720 | — | — | — | — | — | 720 | 720 | ||||||||||||||||||||||||
|
Average interest rate
|
6.00 | % | — | — | — | — | — | 6.00 | % | |||||||||||||||||||||||
|
|
||||||||||||||||||||||||||||||||
|
Structured deposits
(1)
|
||||||||||||||||||||||||||||||||
|
in US$
|
— | — | — | 40 | — | 385 | 425 | 425 | ||||||||||||||||||||||||
|
Average interest rate
|
— | — | — | 3.65 | % | — | 8.09 | % | 7.67 | % | ||||||||||||||||||||||
|
|
||||||||||||||||||||||||||||||||
|
Cash and Cash equivalents
|
||||||||||||||||||||||||||||||||
|
in US$
|
1,205 | — | — | — | — | — | 1,205 | 1,205 | ||||||||||||||||||||||||
|
Average interest rate
|
3.57 | % | — | — | — | — | — | 3.57 | % | |||||||||||||||||||||||
|
|
||||||||||||||||||||||||||||||||
|
in HK$
|
579 | — | — | — | — | — | 579 | 579 | ||||||||||||||||||||||||
|
Average interest rate
|
0.10 | % | — | — | — | — | — | 0.10 | % | |||||||||||||||||||||||
| ITEM 12. | DESCRIPTION OF SECURITIES OTHER THAN EQUITY SECURITIES. |
146
Table of Contents
| Category | Depositary Actions | Associated Fee | ||
|
|
||||
|
(a) Depositing or
substituting the underlying shares |
Each person to whom ADRs are issued against deposits of shares, including
deposits and issuances in respect of:
•
share distributions, rights, merger
•
exchange of securities or any other transaction or event
or other distribution affecting the ADSs or the deposited securities
|
US$5.00 for each 100 ADSs (or portion thereof) evidenced by the new ADRs delivered | ||
|
|
||||
|
(b) Receiving or
distributing dividends |
Distribution of dividends | US$0.02 or less per ADS | ||
|
|
||||
|
(c) Selling or
exercising rights |
Distribution or sale of securities, the fee being in an amount equal to the fee for the execution and delivery of ADSs which would have been charged as a result of the deposit of such securities | US$5.00 for each 100 ADSs (or portion thereof) | ||
|
|
||||
|
(d) Withdrawing an
underlying security |
Acceptance of ADRs surrendered for withdrawal of deposited securities | US$5.00 for each 100 ADSs (or portion thereof) evidenced by the ADRs surrendered | ||
|
|
||||
|
(e) Transferring,
splitting or grouping receipts |
Transfers, combining or grouping of depositary receipts | US$1.50 per ADS | ||
|
|
||||
|
(f) Expenses of the
depositary
|
Expenses incurred on behalf of ADR holders in connection with:
•
compliance with foreign exchange control regulations or
any law or regulation relating to foreign investment;
•
the depositary’s or its custodian’s compliance with
applicable law, rule or regulation;
•
stock transfer or other taxes and other governmental
charges;
•
cable, telex, facsimile transmission and delivery;
•
expenses of the depositary in connection with the
conversion of foreign currency into U.S. dollars (which are paid out of
such foreign currency); and
•
any other charge payable by depositary or its agents.
|
Expenses payable at the sole discretion of the depositary by billing ADR holders or by deducting charges from one or more cash dividends or other cash distributions. |
| Amount Reimbursed from | ||||
| Category of Expenses | January 1, 2009 to January 3, 2010 | |||
|
Investor relations
(1)
|
US$ | 262,627.05 | ||
|
Broker reimbursements
(2)
|
US$ | 42,400.65 | ||
|
Total
|
US$ | 305,027.70 | ||
| (1) | Includes expenses related to announcement of results, ADR training programs, non-deal roadshows and investor relations activities. | |
| (2) | Broker reimbursements are fees payable to Broadridge and other service providers for the distribution of hard copy material to beneficial ADR holders holding in the Depositary Trust Company. Corporate material includes information related to shareholders’ meetings and related voting instruction cards. These fees are SEC approved. |
147
Table of Contents
| Category of Expenses |
Amount Reimbursed from
January 4, 2010 to April 23, 2010 |
|||
|
NYSE listing fees
|
US$ | 38,000.00 | ||
|
Legal fees
(1)
|
US$ | 69,363.12 | ||
|
Investor relations
(2)
|
US$ | 23,410.00 | ||
|
Total
|
US$ | 130,773.12 | ||
| (1) | Includes legal expenses related to change of our depositary bank. | |
| (2) | Includes expenses related to a investor relations conference in Japan. |
| ITEM 13. | DEFAULTS, DIVIDEND ARREARAGES AND DELINQUENCIES. |
| ITEM 14. | MATERIAL MODIFICATIONS TO THE RIGHTS OF SECURITY HOLDERS AND USE OF PROCEEDS. |
148
Table of Contents
| ITEM 15. | CONTROLS AND PROCEDURES. |
| • | pertain to the maintenance of records that, in reasonable detail, accurately and fairly reflect the transactions and dispositions of the assets and liabilities of the Company; |
| • | provide reasonable assurance that transactions are recorded as necessary to permit preparation of financial statements in accordance with the applicable generally accepted accounting principles, and that receipts and expenditures of the Company are being made only in accordance with authorizations of management and directors of the Company; and |
| • | provide reasonable assurance regarding prevention or timely detection of unauthorized acquisition, use or disposition of the Company’s assets that could have a material effect on the financial statements. |
149
Table of Contents
| ITEM 16A. | AUDIT COMMITTEE FINANCIAL EXPERT. |
| ITEM 16B. | CODE OF ETHICS. |
| ITEM 16C. | PRINCIPAL ACCOUNTANT FEES AND SERVICES. |
| Audit Fees | Audit-Related Fees | Tax Fees | All Other Fees | |||||||||||||
| (RMB in millions) | ||||||||||||||||
|
2009
|
69.50 | (1) | — | — | — | |||||||||||
|
2008
|
64 | (1) | — | — | — | |||||||||||
| (1) | Audit fees include fees billed for professional services rendered for audits of the consolidated financial statements, review of interim financial statements, statutory audits of China Life and its subsidiaries. |
150
Table of Contents
| ITEM 16D. | EXEMPTIONS FROM THE LISTING STANDARDS FOR AUDIT COMMITTEES. |
| ITEM 16E. | PURCHASES OF EQUITY SECURITIES BY THE ISSUER AND AFFILIATED PURCHASERS. |
| ITEM 16F. | CHANGE IN REGISTRANT’S CERTIFYING ACCOUNTANT. |
| ITEM 16G. | CORPORATE GOVERNANCE. |
151
Table of Contents
152
Table of Contents
153
Table of Contents
| ITEM 17. | FINANCIAL STATEMENTS. |
| ITEM 18. | FINANCIAL STATEMENTS. |
| ITEM 19. | EXHIBITS. |
154
Table of Contents
| No. | Description of Exhibit | |||
|
|
||||
| 1.1 |
Amended and Restated Articles of Association of the Registrant
|
|||
|
|
||||
| 2.1 |
Form of H share certificate
(1)
|
|||
|
|
||||
| 2.2 |
Form of Deposit Agreement, including the Form of American Depositary Receipt
(2)
|
|||
|
|
||||
| 4.1 |
Restructuring Agreement
(1)
|
|||
|
|
||||
| 4.2 |
Trademark License Agreement
(1)
|
|||
|
|
||||
| 4.3 |
Policy Management Agreement
(4)
|
|||
|
|
||||
| 4.4 |
Asset Management Agreement between China Life Insurance Company Limited and China Life
Asset Management Company Limited
(5)
|
|||
|
|
||||
| 4.5 |
Asset Management Agreement between China Life Insurance (Group) Company and China Life
Asset Management Company Limited
(5)
|
|||
|
|
||||
| 4.6 |
Property Leasing Agreement
|
|||
|
|
||||
| 4.7 |
Non-Competition Agreement
(1)
|
|||
|
|
||||
| 4.8 |
Confirmation Letter to Renew Policy Management Agreement
(5)
|
|||
|
|
||||
| 4.9 |
Agreement for Assignment of Rights and Obligations under Property Leasing
Agreement
(5)
|
|||
|
|
||||
| 4.10 |
Capital Injection Agreement between China Life Insurance Company Limited and China Life
Pension Insurance Company Limited
(5)
|
|||
|
|
||||
| 4.11 |
Capital Injection Agreement between China Life Insurance Company Limited and China Life
Property and Casualty Insurance Company Limited
(5)
|
|||
|
|
||||
| 4.12 |
Capital Injection Agreement among China Life Insurance Company Limited, China Life
Insurance (Group) Company and China Life Asset Management Company
Limited
(5)
|
|||
|
|
||||
| 4.13 |
Entrustment and Account Management Agreement for Corporate Annuity Fund
|
|||
|
|
||||
| 8.1 |
List of subsidiaries of the Registrant
|
|||
|
|
||||
| 11.1 |
Code of Business Conduct and Ethics
(3)
|
|||
|
|
||||
| 12.1 |
Certification pursuant to Rule 13a-14(a)
|
|||
|
|
||||
| 12.2 |
Certification pursuant to Rule 13a-14(a)
|
|||
|
|
||||
| 13.1 |
Certification pursuant to Rule 13a-14(a) and Section 1350 of Chapter 63 of Title 18 of
the United States Code
|
|||
| (1) | Incorporated by reference to the Registration Statement on Form F-1 (File No. 333-110615), filed with the Commission on December 9, 2003. | |
| (2) | Incorporated by reference to the Registration Statement on Form F-6 (File No. 333-164005), filed with the Commission on January 4, 2010. | |
| (3) | Incorporated by reference to the Annual Report on Form 20-F for the fiscal year ended December 31, 2004, filed with the Commission on May 27, 2005. | |
| (4) | Incorporated by reference to the Annual Report on Form 20-F for the fiscal year ended December 31, 2005, filed with the Commission on May 30, 2006. | |
| (5) | Incorporated by reference to the Annual Report on Form 20-F for the fiscal year ended December 31, 2008, filed with the Commission on April 28, 2009. |
155
Table of Contents
|
China Life Insurance Company Limited
|
||||
| By: | /s/ Wan Feng | |||
| Name: | Wan Feng | |||
| Title: | President and Executive Director | |||
i
Table of Contents
| F-2 | ||||
|
|
||||
| F-3 | ||||
|
|
||||
| F-5 | ||||
|
|
||||
| F-7 | ||||
|
|
||||
| F-9 | ||||
|
|
||||
| F-11 |
F-1
Table of Contents

Hong Kong, April 7, 2010
F-2
Table of Contents
As at 31 December 2009
| As at 31 | As at 31 | As at 1 | ||||||||||||||
| December | December | January | ||||||||||||||
| 2009 | 2008 | 2008 | ||||||||||||||
| Note | RMB million | RMB million | RMB million | |||||||||||||
|
|
||||||||||||||||
|
ASSETS
|
||||||||||||||||
|
Property, plant and equipment
|
6 | 17,467 | 16,720 | 15,506 | ||||||||||||
|
Investments in associates
|
7 | 8,470 | 7,891 | 6,449 | ||||||||||||
|
Financial assets
|
||||||||||||||||
|
Held-to-maturity securities
|
8.1 | 235,099 | 211,929 | 195,703 | ||||||||||||
|
Loans
|
8.2 | 23,081 | 17,926 | 7,144 | ||||||||||||
|
Term deposits
|
8.3 | 344,983 | 228,272 | 168,594 | ||||||||||||
|
Statutory deposits-restricted
|
8.4 | 6,153 | 6,153 | 5,773 | ||||||||||||
|
Available-for-sale securities
|
8.5 | 517,499 | 424,939 | 417,515 | ||||||||||||
|
Securities at fair value through income
|
8.6 | 9,133 | 14,099 | 25,110 | ||||||||||||
|
Securities purchased under agreements to resell
|
8.7 | — | — | 5,053 | ||||||||||||
|
Accrued investment income
|
8.8 | 14,208 | 13,149 | 9,857 | ||||||||||||
|
Premiums receivable
|
10 | 6,818 | 6,433 | 6,218 | ||||||||||||
|
Reinsurance assets
|
11 | 832 | 940 | 1,111 | ||||||||||||
|
Other assets
|
12 | 6,317 | 4,957 | 4,990 | ||||||||||||
|
Cash and cash equivalents
|
36,197 | 34,085 | 25,317 | |||||||||||||
|
|
||||||||||||||||
|
|
||||||||||||||||
|
Total assets
|
1,226,257 | 987,493 | 894,340 | |||||||||||||
|
|
||||||||||||||||
F-3
Table of Contents
As at 31 December 2009
| As at 31 | As at 31 | As at 1 | ||||||||||||||
| December | December | January | ||||||||||||||
| 2009 | 2008 | 2008 | ||||||||||||||
| Note | RMB million | RMB million | RMB million | |||||||||||||
|
|
||||||||||||||||
|
LIABILITIES AND EQUITY
|
||||||||||||||||
|
Liabilities
|
||||||||||||||||
|
Insurance contracts
|
13 | 818,164 | 662,865 | 527,507 | ||||||||||||
|
Financial liabilities
|
||||||||||||||||
|
Investment contracts
|
14 | 67,326 | 65,063 | 53,424 | ||||||||||||
|
Securities sold under agreements to repurchase
|
15 | 33,553 | 11,390 | 100 | ||||||||||||
|
Policyholder dividends payable
|
54,587 | 43,178 | 64,473 | |||||||||||||
|
Annuity and other insurance balances payable
|
5,721 | 4,980 | 4,059 | |||||||||||||
|
Premiums received in advance
|
1,804 | 1,811 | 2,201 | |||||||||||||
|
Other liabilities
|
16 | 11,978 | 11,057 | 10,135 | ||||||||||||
|
Deferred tax liabilities
|
24 | 16,361 | 10,344 | 22,997 | ||||||||||||
|
Current income tax liabilities
|
3,850 | 1,668 | 8,312 | |||||||||||||
|
Statutory insurance fund
|
17 | 137 | 266 | 122 | ||||||||||||
|
|
||||||||||||||||
|
|
||||||||||||||||
|
Total liabilities
|
1,013,481 | 812,622 | 693,330 | |||||||||||||
|
|
||||||||||||||||
|
|
||||||||||||||||
|
Shareholders’ equity
|
||||||||||||||||
|
Share capital
|
29 | 28,265 | 28,265 | 28,265 | ||||||||||||
|
Reserves
|
30 | 102,787 | 84,447 | 111,276 | ||||||||||||
|
Retained earnings
|
80,020 | 61,235 | 60,593 | |||||||||||||
|
|
||||||||||||||||
|
|
||||||||||||||||
|
Total shareholders’ equity
|
211,072 | 173,947 | 200,134 | |||||||||||||
|
|
||||||||||||||||
|
|
||||||||||||||||
|
Minority interests
|
1,704 | 924 | 876 | |||||||||||||
|
|
||||||||||||||||
|
|
||||||||||||||||
|
Total equity
|
212,776 | 174,871 | 201,010 | |||||||||||||
|
|
||||||||||||||||
|
|
||||||||||||||||
|
Total liabilities and equity
|
1,226,257 | 987,493 | 894,340 | |||||||||||||
|
|
||||||||||||||||
F-4
Table of Contents
For the year ended 31 December 2009
| 2009 | 2008 | |||||||||||
| Note | RMB million | RMB million | ||||||||||
|
|
||||||||||||
|
REVENUES
|
||||||||||||
|
Gross written premiums
|
275,970 | 265,656 | ||||||||||
|
Less: premiums ceded to reinsurers
|
(158 | ) | (156 | ) | ||||||||
|
|
||||||||||||
|
Net written premiums
|
275,812 | 265,500 | ||||||||||
|
Net change in unearned premium reserves
|
(735 | ) | (323 | ) | ||||||||
|
|
||||||||||||
|
|
||||||||||||
|
Net premiums earned
|
275,077 | 265,177 | ||||||||||
|
|
||||||||||||
|
|
||||||||||||
|
Investment income
|
18 | 38,890 | 44,946 | |||||||||
|
Net realised gains/(losses) on financial assets
|
19 | 21,244 | (5,964 | ) | ||||||||
|
Net fair value gains/(losses) on assets at fair value through
income
|
20 | 1,449 | (7,194 | ) | ||||||||
|
Other income
|
2,630 | 3,420 | ||||||||||
|
|
||||||||||||
|
|
||||||||||||
|
Total revenues
|
339,290 | 300,385 | ||||||||||
|
|
||||||||||||
|
|
||||||||||||
|
BENEFITS, CLAIMS AND EXPENSES
|
||||||||||||
|
Insurance benefits and claims
|
||||||||||||
|
Life insurance death and other benefits
|
21 | (74,858 | ) | (89,659 | ) | |||||||
|
Accident and health claims and claim adjustment expenses
|
21 | (7,808 | ) | (7,641 | ) | |||||||
|
Increase in insurance contracts liabilities
|
21 | (154,372 | ) | (134,649 | ) | |||||||
|
Investment contract benefits
|
22 | (2,142 | ) | (1,931 | ) | |||||||
|
Policyholder dividends resulting from participation in profits
|
(14,487 | ) | (1,671 | ) | ||||||||
|
Underwriting and policy acquisition costs
|
(22,936 | ) | (24,200 | ) | ||||||||
|
Administrative expenses
|
(18,719 | ) | (16,652 | ) | ||||||||
|
Other operating expenses
|
(2,390 | ) | (3,409 | ) | ||||||||
|
Statutory insurance fund
|
(537 | ) | (558 | ) | ||||||||
|
|
||||||||||||
|
|
||||||||||||
|
Total benefits, claims and expenses
|
(298,249 | ) | (280,370 | ) | ||||||||
|
|
||||||||||||
|
|
||||||||||||
|
Share of results of associates
|
7 | 704 | (56 | ) | ||||||||
|
Net profit before income tax expenses
|
23 | 41,745 | 19,959 | |||||||||
|
Income tax expenses
|
24 | (8,709 | ) | (685 | ) | |||||||
|
|
||||||||||||
|
|
||||||||||||
|
Net profit
|
33,036 | 19,274 | ||||||||||
|
|
||||||||||||
|
|
||||||||||||
|
Attributable to:
|
||||||||||||
|
- shareholders of the Company
|
32,881 | 19,137 | ||||||||||
|
- minority interests
|
155 | 137 | ||||||||||
|
|
||||||||||||
|
|
||||||||||||
|
Basic and diluted earnings per share
|
25 | RMB 1.16 | RMB 0.68 | |||||||||
|
|
||||||||||||
F-5
Table of Contents
For the year ended 31 December 2009
| 2009 | 2008 | |||||||||||
| Note | RMB million | RMB million | ||||||||||
|
|
||||||||||||
|
Other comprehensive income/(loss)
|
||||||||||||
|
Available-for-sale financial assets
|
||||||||||||
|
Arising from available-for-sale securities
|
39,470 | (61,622 | ) | |||||||||
|
Reclassification adjustment for gains included in profit or loss
|
(21,040 | ) | 4,878 | |||||||||
|
Impact from available-for-sale securities on other assets and liabilities
|
(3,999 | ) | 11,702 | |||||||||
|
Share of other comprehensive income/(loss) of associates
|
(70 | ) | 291 | |||||||||
|
Others
|
— | (3 | ) | |||||||||
|
Income tax relating to components of other comprehensive income/(loss)
|
24 | (3,607 | ) | 11,260 | ||||||||
|
|
||||||||||||
|
|
||||||||||||
|
Other comprehensive income/(loss) for the year
|
10,754 | (33,494 | ) | |||||||||
|
|
||||||||||||
|
|
||||||||||||
|
Total comprehensive income/(loss) for the year
|
43,790 | (14,220 | ) | |||||||||
|
|
||||||||||||
|
|
||||||||||||
|
Attributable to:
|
||||||||||||
|
- shareholders of the Company
|
43,626 | (14,316 | ) | |||||||||
|
- minority interests
|
164 | 96 | ||||||||||
|
|
||||||||||||
F-6
Table of Contents
For the year ended 31 December 2009
| Attributable to shareholders | ||||||||||||||||||||
| of the Company | ||||||||||||||||||||
| Retained | Minority | |||||||||||||||||||
| Share capital | Reserves | earnings | interests | Total | ||||||||||||||||
| RMB million | RMB million | RMB million | RMB million | RMB million | ||||||||||||||||
| (Note 29) | (Note 30) | |||||||||||||||||||
|
|
||||||||||||||||||||
|
As at 1 January 2008
|
28,265 | 111,276 | 60,593 | 876 | 201,010 | |||||||||||||||
|
|
||||||||||||||||||||
|
Net profit
|
— | — | 19,137 | 137 | 19,274 | |||||||||||||||
|
|
||||||||||||||||||||
|
Other comprehensive loss for
the year
|
— | (33,453 | ) | — | (41 | ) | (33,494 | ) | ||||||||||||
|
|
||||||||||||||||||||
|
|
||||||||||||||||||||
|
Total comprehensive
income/(loss)
|
— | (33,453 | ) | 19,137 | 96 | (14,220 | ) | |||||||||||||
|
|
||||||||||||||||||||
|
|
||||||||||||||||||||
|
Transactions with owners
|
||||||||||||||||||||
|
Capital contribution
|
— | — | — | 45 | 45 | |||||||||||||||
|
Appropriation to reserve
|
— | 6,624 | (6,624 | ) | — | — | ||||||||||||||
|
Dividends paid
|
— | — | (11,871 | ) | — | (11,871 | ) | |||||||||||||
|
Dividends to minority interests
|
— | — | (93 | ) | (93 | ) | ||||||||||||||
|
|
||||||||||||||||||||
|
|
||||||||||||||||||||
|
Total transactions with owners
|
— | 6,624 | (18,495 | ) | (48 | ) | (11,919 | ) | ||||||||||||
|
|
||||||||||||||||||||
|
|
||||||||||||||||||||
|
As at 31 December 2008
|
28,265 | 84,447 | 61,235 | 924 | 174,871 | |||||||||||||||
|
|
||||||||||||||||||||
F-7
Table of Contents
For the year ended 31 December 2009
| Attributable to shareholders | ||||||||||||||||||||
| of the Company | ||||||||||||||||||||
| Retained | Minority | |||||||||||||||||||
| Share capital | Reserves | earnings | interests | Total | ||||||||||||||||
| RMB million | RMB million | RMB million | RMB million | RMB million | ||||||||||||||||
| (Note 29) | (Note 30) | |||||||||||||||||||
|
|
||||||||||||||||||||
|
As at 1 January 2009
|
28,265 | 84,447 | 61,235 | 924 | 174,871 | |||||||||||||||
|
|
||||||||||||||||||||
|
Net profit
|
— | — | 32,881 | 155 | 33,036 | |||||||||||||||
|
|
||||||||||||||||||||
|
|
||||||||||||||||||||
|
Other comprehensive income for
the period
|
— | 10,745 | — | 9 | 10,754 | |||||||||||||||
|
|
||||||||||||||||||||
|
|
||||||||||||||||||||
|
Total comprehensive income
|
— | 10,745 | 32,881 | 164 | 43,790 | |||||||||||||||
|
|
||||||||||||||||||||
|
|
||||||||||||||||||||
|
Transactions with owners
|
||||||||||||||||||||
|
Capital contribution
|
— | — | 720 | 720 | ||||||||||||||||
|
Appropriation to reserve
|
— | 7,595 | (7,595 | ) | — | — | ||||||||||||||
|
Dividends paid
|
— | — | (6,501 | ) | — | (6,501 | ) | |||||||||||||
|
Dividends to minority interest
|
— | — | — | (104 | ) | (104 | ) | |||||||||||||
|
|
||||||||||||||||||||
|
|
||||||||||||||||||||
|
Total transactions with owners
|
— | 7,595 | (14,096 | ) | 616 | (5,885 | ) | |||||||||||||
|
|
||||||||||||||||||||
|
|
||||||||||||||||||||
|
As at 31 December 2009
|
28,265 | 102,787 | 80,020 | 1,704 | 212,776 | |||||||||||||||
|
|
||||||||||||||||||||
F-8
Table of Contents
For the year ended 31 December 2009
| 2009 | 2008 | |||||||
| RMB million | RMB million | |||||||
|
|
||||||||
|
CASH FLOWS FROM OPERATING ACTIVITIES
|
||||||||
|
Net profit before income tax expenses:
|
41,745 | 19,959 | ||||||
|
|
||||||||
|
Adjustments for:
|
||||||||
|
Investment income
|
(38,890 | ) | (44,946 | ) | ||||
|
Net realised and unrealised (gains)/losses on financial assets
|
(22,693 | ) | 13,158 | |||||
|
Insurance contracts
|
155,252 | 135,284 | ||||||
|
Depreciation and amortisation
|
1,560 | 1,363 | ||||||
|
Amortisation of premiums and discounts
|
10 | (156 | ) | |||||
|
Loss on foreign exchange and impairments
|
28 | 907 | ||||||
|
Changes in operational assets and liabilities:
|
||||||||
|
Financial assets at fair value through income
|
6,435 | 3,977 | ||||||
|
Receivables and payables
|
9,917 | 4,484 | ||||||
|
|
||||||||
|
Cash generated from operating activities
|
||||||||
|
Income tax paid
|
(3,995 | ) | (8,583 | ) | ||||
|
Interest received
|
291 | 101 | ||||||
|
Dividends received
|
40 | 529 | ||||||
|
|
||||||||
|
|
||||||||
|
Net cash inflow from operating activities
|
149,700 | 126,077 | ||||||
|
|
||||||||
|
|
||||||||
|
CASH FLOWS FROM INVESTING ACTIVITIES
|
||||||||
|
Sales and maturities:
|
||||||||
|
Sales of debt securities
|
95,197 | 19,594 | ||||||
|
Maturities of debt securities
|
25,730 | 4,187 | ||||||
|
Sales of equity securities
|
101,112 | 59,855 | ||||||
|
Property, plant and equipment
|
420 | 247 | ||||||
|
Purchases:
|
||||||||
|
Debt securities
|
(148,559 | ) | (119,989 | ) | ||||
|
Equity securities
|
(149,523 | ) | (49,480 | ) | ||||
|
Property, plant and equipment
|
(3,261 | ) | (2,950 | ) | ||||
|
Investment in associate
|
— | (1,200 | ) | |||||
|
Term deposits, net
|
(116,711 | ) | (60,095 | ) | ||||
|
Securities purchased under agreements to resell, net
|
8 | 5,142 | ||||||
|
Interest received
|
34,139 | 30,378 | ||||||
|
Dividends received
|
3,159 | 9,563 | ||||||
|
Other
|
(5,462 | ) | (11,162 | ) | ||||
|
|
||||||||
|
|
||||||||
|
Net cash outflow from investing activities
|
(163,751 | ) | (115,910 | ) | ||||
|
|
||||||||
F-9
Table of Contents
For the year ended 31 December 2009
| 2009 | 2008 | |||||||
| RMB million | RMB million | |||||||
|
|
||||||||
|
CASH FLOWS FROM FINANCING ACTIVITIES
|
||||||||
|
Proceeds from investment in securities sold under agreements to
repurchase, net
|
22,163 | 11,290 | ||||||
|
Interest paid
|
(111 | ) | (437 | ) | ||||
|
Contribution from minority shareholders
|
720 | — | ||||||
|
Dividends paid to the Company’s shareholders
|
(6,501 | ) | (11,871 | ) | ||||
|
Dividends paid to minority interests
|
(104 | ) | (93 | ) | ||||
|
|
||||||||
|
|
||||||||
|
Net cash inflow/(outflow) from financing activities
|
16,167 | (1,111 | ) | |||||
|
|
||||||||
|
|
||||||||
|
Foreign currency losses on cash and cash equivalents
|
(4 | ) | (288 | ) | ||||
|
|
||||||||
|
Net increase in cash and cash equivalents
|
2,112 | 8,768 | ||||||
|
|
||||||||
|
|
||||||||
|
Cash and cash equivalents
|
||||||||
|
Beginning of year
|
34,085 | 25,317 | ||||||
|
|
||||||||
|
|
||||||||
|
End of year
|
36,197 | 34,085 | ||||||
|
|
||||||||
|
|
||||||||
|
Analysis of balance of cash and cash equivalents
|
||||||||
|
Cash at bank and in hand
|
23,640 | 20,841 | ||||||
|
Short-term bank deposits
|
12,557 | 13,244 | ||||||
F-10
Table of Contents
FOR THE YEAR ENDED 31 DEC 2009
| 1 |
ORGANIZATION AND PRINCIPAL ACTIVITIES
|
| 2 |
SUMMARY OF SIGNIFICANT ACCOUNTING POLICIES
|
| 2.1 |
First-time Adoption of International Financial Reporting Standards and Statement of Compliance
|
| Stock Exchange | GAAP | |
|
|
||
|
Stock Exchange of
Hong Kong
|
Hong Kong Financial Reporting Standards (“HKFRS”) | |
|
|
||
|
New York Stock
Exchange
|
HKFRS with reconciliations to accounting principles generally accepted in the US (“US GAAP”) | |
|
|
||
|
Shanghai Stock
Exchange
|
China Accounting Standards (“CAS”) |
F-11
Table of Contents
FOR THE YEAR ENDED 31 DEC 2009
| 2 |
SUMMARY OF SIGNIFICANT ACCOUNTING POLICIES (continued)
|
| 2.1 |
First-time Adoption of International Financial Reporting Standards and Statement of Compliance (continued)
|
| As at 31 December 2008 | ||||||||||||
| Assets | Liabilities | Equity | ||||||||||
| RMB million | RMB million | RMB million | ||||||||||
|
|
||||||||||||
|
Under CAS(before adoption of MoF new guidance)
|
990,164 | 854,283 | 135,881 | |||||||||
|
|
||||||||||||
|
Insurance contracts
|
16 | (52,004 | ) | 52,020 | ||||||||
|
Tax implication
|
(2,661 | ) | 10,343 | (13,004 | ) | |||||||
|
Share of insurance associate, net of tax
|
(26 | ) | — | (26 | ) | |||||||
|
|
||||||||||||
|
|
||||||||||||
|
Under CAS(after adoption of MoF new guidance)
|
987,493 | 812,622 | 174,871 | |||||||||
|
|
||||||||||||
| As at 1 January 2008 | ||||||||||||
| Assets | Liabilities | Equity | ||||||||||
| RMB million | RMB million | RMB million | ||||||||||
|
|
||||||||||||
|
Under CAS(before adoption of MoF new guidance)
|
894,601 | 723,512 | 171,089 | |||||||||
|
|
||||||||||||
|
Insurance contracts
|
(260 | ) | (40,155 | ) | 39,895 | |||||||
|
Tax implication
|
— | 9,973 | (9,973 | ) | ||||||||
|
Share of insurance associate, net of tax
|
(1 | ) | — | (1 | ) | |||||||
|
|
||||||||||||
|
|
||||||||||||
|
Under CAS(after adoption of MoF new guidance)
|
894,340 | 693,330 | 201,010 | |||||||||
|
|
||||||||||||
F-12
Table of Contents
FOR THE YEAR ENDED 31 DEC 2009
| 2 |
SUMMARY OF SIGNIFICANT ACCOUNTING POLICIES (continued)
|
| 2.1 |
First-time Adoption of International Financial Reporting Standards and Statement of Compliance (continued)
|
|
For the year ended
31 December 2008 |
||||
| Net profit | ||||
| RMB million | ||||
|
|
||||
|
Under CAS(before adoption of MoF new guidance)
|
10,205 | |||
|
|
||||
|
Insurance contracts
|
12,125 | |||
|
Tax implication
|
(3,031 | ) | ||
|
Share of insurance associate, net of tax
|
(25 | ) | ||
|
|
||||
|
|
||||
|
Under CAS(after adoption of MoF new guidance)
|
19,274 | |||
|
|
||||
| Equity | Net profit | |||||||||||
| As at 31 | As at 1 | For the year ended | ||||||||||
| December 2008 | January 2008 | 31 December 2008 | ||||||||||
| RMB million | RMB million | RMB million | ||||||||||
|
|
||||||||||||
|
Under HKFRS
|
181,573 | 206,376 | 21,414 | |||||||||
|
|
||||||||||||
|
Adjustments:
|
||||||||||||
|
PPE
|
1,239 | 1,344 | (105 | ) | ||||||||
|
Insurance contracts
|
(9,881 | ) | (8,498 | ) | (2,465 | ) | ||||||
|
Tax implication
|
2,154 | 1,789 | 643 | |||||||||
|
Share of insurance associate, net of tax
|
(214 | ) | (1 | ) | (213 | ) | ||||||
|
|
||||||||||||
|
|
||||||||||||
|
Upon first-time adoption of IFRS
|
174,871 | 201,010 | 19,274 | |||||||||
|
|
||||||||||||
F-13
Table of Contents
FOR THE YEAR ENDED 31 DEC 2009
| 2 |
SUMMARY OF SIGNIFICANT ACCOUNTING POLICIES (continued)
|
| 2.1 |
First-time Adoption of International Financial Reporting Standards and Statement of Compliance (continued)
|
| 2.2 |
Basis of preparation
|
F-14
Table of Contents
FOR THE YEAR ENDED 31 DEC 2009
| 2 |
SUMMARY OF SIGNIFICANT ACCOUNTING POLICIES (continued)
|
| 2.2 |
Basis of preparation (continued)
|
| • |
IFRS 2 (amendments) ‘Group cash-settled share-based payment transactions
|
| • |
IFRS 3 (revised) ‘Business combinations’
|
| • |
IFRS 5 (amendment) ‘Measurement of non-current assets (or disposal Groups) classified as held for sale’
|
| • |
IFRS 9 ‘Financial instruments’
|
| • |
IAS 1 (amendment) ‘Presentation of financial statements’
|
| • |
IAS 27 (revised) ‘Consolidated and separate financial statements’
|
| • |
IAS 32 (amendment)’Classification of rights issues’
|
| • |
IAS 38 (amendment) ‘Intangible Assets’
|
| • |
IFRIC 17 ‘Distribution of non-cash assets to owners’
|
| • |
IFRIC 18 ‘Transfers of assets from customers’
|
| 2.3 |
Consolidation
|
F-15
Table of Contents
FOR THE YEAR ENDED 31 DEC 2009
| 2 |
SUMMARY OF SIGNIFICANT ACCOUNTING POLICIES (continued)
|
| 2.3 |
Consolidation (continued)
|
| 2.4 |
Segment reporting
|
| 2.5 |
Foreign currency translation
|
F-16
Table of Contents
FOR THE YEAR ENDED 31 DEC 2009
| 2 |
SUMMARY OF SIGNIFICANT ACCOUNTING POLICIES (continued)
|
| 2.6 |
Property, plant and equipment
|
| Estimated useful life | ||
|
|
||
|
Buildings
|
15 to 35 years | |
|
Office equipment, furniture and fixtures
|
5 to 10 years | |
|
Motor vehicles
|
4 to 8 years | |
|
Leasehold improvements
|
Over the lesser of the remaining term of the lease or the useful life |
F-17
Table of Contents
FOR THE YEAR ENDED 31 DEC 2009
| 2 |
SUMMARY OF SIGNIFICANT ACCOUNTING POLICIES (continued)
|
| 2.7 |
Financial assets
|
| 2.7.a |
Classification
|
| (i) |
Held-to-maturity securities
|
| (ii) |
Securities at fair value through income
|
| (iii) |
Available-for-sale securities
|
| 2.7.b |
Recognition and measurement
|
F-18
Table of Contents
FOR THE YEAR ENDED 31 DEC 2009
| 2 |
SUMMARY OF SIGNIFICANT ACCOUNTING POLICIES (continued)
|
| 2.7 |
Financial assets (continued)
|
| 2.7.c |
Term deposits
|
| 2.7.d |
Loans
|
| 2.7.e |
Securities purchased under agreements to resell
|
| 2.7.f |
Impairment of financial assets other than at fair value through income
|
| • |
Significant financial difficulty of the issuer or debtor;
|
| • |
A breach of contract, such as a default or delinquency in payments;
|
| • |
It becomes probable that the issuer or debtor will enter bankruptcy or other financial
reorganisation;
|
| • |
The disappearance of an active market for that financial asset because of financial difficulties;
|
| 2.8 |
Cash and cash equivalents
|
F-19
Table of Contents
FOR THE YEAR ENDED 31 DEC 2009
| 2 |
SUMMARY OF SIGNIFICANT ACCOUNTING POLICIES (continued)
|
| 2.9 |
Insurance contracts and investment contracts
|
| 2.9.1 |
Classification
|
| 2.9.2 |
Insurance contracts
|
| 2.9.2.a |
Recognition and measurement
|
| (i) |
Short-term insurance contracts
|
| (ii) |
Long-term insurance contracts
|
| (a) |
The reserves for long-term insurance contracts are recognised on the basis of
best estimates of future payouts that will be required to fulfil the
contractual obligations. These expenses refer to the expected net future cash
outflows for the insurance contracts, which is the difference between the
expected future cash outflows and the expected future cash inflows. The
expected future cash inflows include cash inflows arising from the
undertaking of insurance obligations. The expected future cash outflows are
cash outflows incurred to fulfil contractual obligations, consisting of the
following:
|
| • |
The guaranteed benefits based on contractual terms, including
payments for deaths, disabilities, diseases, survivals, maturities and
surrenders.
|
| • |
Additional non-guaranteed benefits, such as policyholder dividends.
|
F-20
Table of Contents
FOR THE YEAR ENDED 31 DEC 2009
| 2 |
SUMMARY OF SIGNIFICANT ACCOUNTING POLICIES (continued)
|
| 2.9.2 |
Insurance contracts (continued)
|
| 2.9.2.a |
Recognition and measurement (continued)
|
| (ii) |
Long-term insurance contracts (continued)
|
| • |
Expenses incurred to manage insurance contracts or to process claims,
including administration and claim settlement expenses, etc.
|
| (b) |
Margin has been taken into consideration while computing the reserve of
insurance contracts, measured separately and recognized in the net profit in
each period over the life of the contracts. At the inception of the
contracts, the Group doesn’t recognize Day 1 gain, whereas on the other hand,
Day 1 loss is recognized as incurred.
|
| (c) |
The Group has considered the impact of time value on the reserve calculation
for insurance contracts.
|
| (iii) |
Universal life contracts and unit-linked contracts
|
| • |
Insurance components
|
| • |
Non-insurance components
|
| 2.9.2.b |
Liability adequacy test
|
| 2.9.2.c |
Reinsurance contracts held
|
F-21
Table of Contents
FOR THE YEAR ENDED 31 DEC 2009
| 2 |
SUMMARY OF SIGNIFICANT ACCOUNTING POLICIES (continued)
|
| 2.9 |
Insurance contracts and investment contracts (continued)
|
| 2.9.3 |
Investment contracts
|
| 2.9.4 |
DPF in long-term insurance contracts and investment contracts
|
| 2.10 |
Securities sold with agreements to repurchase
|
| 2.11 |
Derivative instruments
|
F-22
Table of Contents
FOR THE YEAR ENDED 31 DEC 2009
| 2 |
SUMMARY OF SIGNIFICANT ACCOUNTING POLICIES (continued)
|
| 2.12 |
Employee benefits
|
| 2.13 |
Share capital
|
| 2.14 |
Revenue recognition
|
F-23
Table of Contents
FOR THE YEAR ENDED 31 DEC 2009
| 2 |
SUMMARY OF SIGNIFICANT ACCOUNTING POLICIES (continued)
|
| 2.15 |
Current and deferred income taxation
|
| 2.16 |
Operating leases
|
| 2.17 |
Contingencies
|
| 2.18 |
Dividend distribution
|
F-24
Table of Contents
FOR THE YEAR ENDED 31 DEC 2009
| 3 |
CRITICAL ACCOUNTING ESTIMATES AND JUDGMENTS IN APPLYING ACCOUNTING POLICIES
|
| 3.1 |
Estimate of future benefit payments and premiums arising from long-term insurance contracts
|
F-25
Table of Contents
FOR THE YEAR ENDED 31 DEC 2009
| 3 |
CRITICAL ACCOUNTING ESTIMATES AND JUDGMENTS IN APPLYING ACCOUNTING POLICIES (continued)
|
| 3.2 |
Investments
|
| • |
Debt securities: fair values are generally based
upon current bid prices. Where current bid prices
are not readily available, fair values are
estimated using either prices observed in recent
transactions, values obtained from current bid
prices of comparable investments and valuation
techniques when the market is not active.
|
||
| • |
Equity securities: fair values are generally
based upon current bid prices. Where current bid
prices are not readily available, fair values are
estimated using either prices observed in recent
transactions or commonly used market pricing
model. Equity securities, for which fair values
cannot be measured reliably, are recognized at
cost less impairment.
|
||
| • |
Term deposits (excluding structured deposits),
loans and securities purchased or sold under
agreements to resell or repurchase: the carrying
amounts of these assets in the statement of
financial position approximate fair values.
|
||
| • |
Structured deposits: the market for structured
deposits is not active and the Group establishes
fair value by using discounted cash flow analysis
and option pricing models as the valuation
technique. The Group uses the US$ swap rate (the
benchmark rate) to determine the fair value of
financial instruments.
|
| 3.3 |
Income tax
|
F-26
Table of Contents
FOR THE YEAR ENDED 31 DEC 2009
| 4 |
Risk Management
|
| 4.1 |
Insurance risk
|
| 4.1.1 |
Types of Insurance risks
|
| 4.1.2 |
Concentration of insurance risks
|
F-27
Table of Contents
FOR THE YEAR ENDED 31 DEC 2009
| 4 |
MANAGEMENT OF INSURANCE AND FINANCIAL RISK (continued)
|
| 4.1 |
Insurance risk (continued)
|
| 4.1.2 |
Concentration of insurance risks (continued)
|
| 2009 | 2008 | |||||||||||||||
| Product name | RMB million | % | RMB million | % | ||||||||||||
|
Premiums
|
||||||||||||||||
|
Hong Feng Endowment (a)
|
59,229 | 22.6 | % | 105,343 | 41.7 | % | ||||||||||
|
Hong Fu Endowment (b)
|
54,919 | 21.0 | % | 8,169 | 3.2 | % | ||||||||||
|
Kang Ning Whole Life (c)
|
30,151 | 11.5 | % | 31,806 | 12.6 | % | ||||||||||
|
Hong Tai Endowment (d)
|
11,300 | 4.3 | % | 13,999 | 5.5 | % | ||||||||||
|
Hong Rui Endowment (e)
|
674 | 0.3 | % | 2,221 | 0.9 | % | ||||||||||
|
Others (f)
|
105,632 | 40.3 | % | 90,932 | 36.1 | % | ||||||||||
|
|
||||||||||||||||
|
Total
|
261,905 | 100.0 | % | 252,470 | 100.0 | % | ||||||||||
|
|
||||||||||||||||
|
|
||||||||||||||||
|
Insurance benefits
|
||||||||||||||||
|
Hong Feng Endowment (a)
|
464 | 0.9 | % | 290 | 0.5 | % | ||||||||||
|
Hong Fu Endowment (b)
|
36 | 0.1 | % | 4 | 0.0 | % | ||||||||||
|
Kang Ning Whole Life (c)
|
2,772 | 5.4 | % | 2,466 | 3.8 | % | ||||||||||
|
Hong Tai Endowment (d)
|
29,173 | 56.6 | % | 7,343 | 11.4 | % | ||||||||||
|
Hong Rui Endowment (e)
|
11,299 | 21.9 | % | 26,168 | 40.8 | % | ||||||||||
|
Others (f)
|
7,812 | 15.1 | % | 27,920 | 43.5 | % | ||||||||||
|
|
||||||||||||||||
|
Total
|
51,556 | 100.0 | % | 64,191 | 100.0 | % | ||||||||||
|
|
||||||||||||||||
|
|
||||||||||||||||
|
Liabilities of
long-term insurance
contracts
|
||||||||||||||||
|
Hong Feng Endowment (a)
|
265,270 | 32.8 | % | 213,103 | 32.5 | % | ||||||||||
|
Hong Fu Endowment (b)
|
58,369 | 7.2 | % | 7,570 | 1.2 | % | ||||||||||
|
Kang Ning Whole Life (c)
|
85,260 | 10.5 | % | 71,548 | 11.0 | % | ||||||||||
|
Hong Tai Endowment (d)
|
28,757 | 3.6 | % | 49,263 | 7.5 | % | ||||||||||
|
Hong Rui Endowment (e)
|
13,186 | 1.6 | % | 24,415 | 3.7 | % | ||||||||||
|
Others (f)
|
358,381 | 44.3 | % | 288,949 | 44.1 | % | ||||||||||
|
|
||||||||||||||||
|
Total
|
809,223 | 100.0 | % | 654,848 | 100.0 | % | ||||||||||
|
|
||||||||||||||||
| (a) |
Hong Feng is long-term individual endowment insurance contract with options for premium term of single.
Insured period can be 5 years or 10 years. The insured can be benefited up to age of 65. Maturity benefit
is paid at 100% of basic sum insured. Disease Death benefit incurred within one year after contract
effective date is paid at premium received (without interest). Disease death benefit incurred exceed one
year after contract effective date is paid at basic sum insured. Accident death benefit is paid at 300% of
basic sum insured.
|
|
| (b) |
Hong Fu is long-term individual endowment insurance contract with options for premium term of single and 3
year, designed for healthy policyholders of age between 30 days and 60 years old. Maturity benefit for lump
sum premium is paid at 100% of basic sum insured. Maturity benefit for regular premium is paid at basic sum
insured multiplied by number of year of premium payments. Disease Death benefit incurred within one year
after contract effective date is paid at premium received (without interest). Disease death benefits
incurred exceed one year after contract effective date are paid at basic sum insured and basic sum insured
multiplied by number of year of premium payments for lump sum premium and regular premium respectively.
Accident death benefit is paid at 300% of basic sum insured and 300% of basic sum insured multiplied by
number of year of premium payments for lump sum premium and regular premium respectively.
|
|
| (c) |
Kang Ning Whole Life is long-term individual whole life insurance contract with options for premium term of
single, 10 years or 20 years. Its critical illness benefit accounts for 200% of basic sum insured. Both
death and disability benefit are paid at 300% of basic sum insured less any paid critical illness benefit.
|
F-28
Table of Contents
FOR THE YEAR ENDED 31 DEC 2009
| 4 |
MANAGEMENT OF INSURANCE AND FINANCIAL RISK (continued)
|
| 4.1 |
Insurance risk (continued)
|
| 4.1.2 |
Concentration of insurance risks (continued)
|
| (d) |
Hong Tai is long-term individual endowment insurance contract with options for premium
term of single and 5 years, 10 years, 15 years and 20 years, designed for healthy
policyholders of age between 30 days and 60 years old. Maturity benefit for lump sum
premium is paid at 100% of basic sum insured. Maturity benefit for regular premium is
paid at basic sum insured multiplied by number of year of premium payments. Disease Death
benefit incurred within one year after contract effective date is paid at premium
received (without interest). Disease death benefits incurred exceed one year after
contract effective date are paid at basic sum insured and basic sum insured multiplied by
number of year of premium payments for lump sum premium and regular premium respectively.
|
|
| (e) |
Hong Rui is long-term individual endowment insurance contract with options for premium
term of single and 5 years. The insured can be benefited up to age of 70. Accident
benefit is paid at basic sum insured for lumps sum premium and the accident benefit is
paid at basic sum insured multiplied by number of year of premium payment if the accident
happens within the first to the fourth year of insured or 500% of the basic sum insured
if the accident happens after the fifth year of insured. The maturity benefit is paid at
100% and 500% of the basic sum insured, for lump sum premium and regular premium,
respectively.
|
|
| (f) |
Others consist of various long-term insurance contracts with no significant concentration.
|
| 4.1.3 |
Sensitivity Analysis
|
F-29
Table of Contents
FOR THE YEAR ENDED 31 DEC 2009
| 4 |
MANAGEMENT OF INSURANCE AND FINANCIAL RISK (continued)
|
| 4.1 |
Insurance risk (continued)
|
| 4.1.3 |
Sensitivity Analysis (continued)
|
| Short-term insurance contracts (accident year) | ||||||||||||||||||||||||
| 2005 | 2006 | 2007 | 2008 | 2009 | Total | |||||||||||||||||||
|
|
||||||||||||||||||||||||
|
Current year/End of the year
|
6,653 | 6,771 | 7,082 | 7,725 | 8,102 | |||||||||||||||||||
|
Later than 1 year
|
7,039 | 6,074 | 6,891 | 7,591 | ||||||||||||||||||||
|
Later than 2 years
|
7,087 | 6,168 | 6,990 | |||||||||||||||||||||
|
Later than 3 years
|
7,087 | 6,168 | ||||||||||||||||||||||
|
Later than 4 years
|
7,087 | |||||||||||||||||||||||
|
|
||||||||||||||||||||||||
|
|
||||||||||||||||||||||||
|
Estimated accumulated claims
|
7,087 | 6,168 | 6,990 | 7,591 | 8,102 | 35,938 | ||||||||||||||||||
|
|
||||||||||||||||||||||||
|
|
||||||||||||||||||||||||
|
Accumulated paid claims
|
(7,087 | ) | (6,168 | ) | (6,990 | ) | (7,271 | ) | (5,478 | ) | (32,994 | ) | ||||||||||||
|
|
||||||||||||||||||||||||
|
|
||||||||||||||||||||||||
|
Unpaid claims
|
— | — | — | 320 | 2,624 | 2,944 | ||||||||||||||||||
|
|
||||||||||||||||||||||||
| Short-term insurance contracts (accident year) | ||||||||||||||||||||||||
| 2005 | 2006 | 2007 | 2008 | 2009 | Total | |||||||||||||||||||
|
|
||||||||||||||||||||||||
|
Current year/End of the year
|
5,928 | 6,703 | 7,036 | 7,671 | 8,017 | |||||||||||||||||||
|
Later than 1 year
|
6,314 | 6,013 | 6,847 | 7,538 | ||||||||||||||||||||
|
Later than 2 years
|
6,426 | 6,106 | 6,945 | |||||||||||||||||||||
|
Later than 3 years
|
6,426 | 6,106 | ||||||||||||||||||||||
|
Later than 4 years
|
6,426 | |||||||||||||||||||||||
|
|
||||||||||||||||||||||||
|
|
||||||||||||||||||||||||
|
Estimated accumulated claims
|
6,426 | 6,106 | 6,945 | 7,538 | 8,017 | 35,032 | ||||||||||||||||||
|
|
||||||||||||||||||||||||
|
|
||||||||||||||||||||||||
|
Accumulated paid claims
|
(6,426 | ) | (6,106 | ) | (6,945 | ) | (7,221 | ) | (5,421 | ) | (32,119 | ) | ||||||||||||
|
|
||||||||||||||||||||||||
|
|
||||||||||||||||||||||||
|
Unpaid claims
|
— | — | — | 317 | 2,596 | 2,913 | ||||||||||||||||||
|
|
||||||||||||||||||||||||
| 4.2 |
Financial risk
|
F-30
Table of Contents
FOR THE YEAR ENDED 31 DEC 2009
| 4 |
MANAGEMENT OF INSURANCE AND FINANCIAL RISK (continued)
|
| 4.2 |
Financial risk (continued)
|
| 4.2.1 |
Market risk
|
| (i) |
Interest rate risk
|
F-31
Table of Contents
FOR THE YEAR ENDED 31 DEC 2009
| 4 |
MANAGEMENT OF INSURANCE AND FINANCIAL RISK (continued)
|
|
| 4.2 |
Financial risk (continued)
|
|
| 4.2.1 |
Market risk (continued)
|
|
| (ii) |
Price risk
|
|
|
Price risk arises mainly from the volatility of prices of equity securities held by the Group. Prices of equity
securities are determined by market forces. The Group is subject to increased price risk largely because China’s
stock markets are relatively volatile.
|
||
|
The Group manages price risk by holding an appropriately diversified investment portfolio as permitted by laws and
regulations designed to reduce the risk of concentration in any one specific industry or issuer.
|
||
|
At 31 December 2009, if all the Group’s equity securities’ prices had increased or decreased by 10% with all other
variables held constant, pre-tax profit for the year would have been RMB 127 million (2008: RMB 452 million) higher
or lower respectively, mainly as a result of an increase or decrease in fair value of equity securities excluding
available-for-sale securities, net of impact thereof on undistributed participating policyholders’ dividends. Pre-tax
available-for-sale reserve in equity would have been RMB 11,470 million higher or lower (2008: RMB 4,619 million) as
a result of an increase or decrease in fair value of available-for-sale equity securities, net of impact thereof on
undistributed participating policyholders’ dividends.
|
||
| (iii) |
Currency risk
|
|
|
Currency risk is volatility of fair value or future cash flows of financial instruments resulting from changes in
foreign currency exchange rates. The Group operates principally in the PRC except for limited exposure to foreign
exchange rate risk arising primarily with respect to structured deposits, debt securities and common stocks
denominated in US dollar (“US$”) or HK dollar (“HK$”).
|
||
|
The Group holds shares traded on the HK stock market, which are traded in HK dollars. Investment income from H share
holdings have offset the adverse impact of the appreciation of the Renminbi and thus spread the risk indirectly.
|
||
|
The following table summaries financial assets denominated in currencies other than RMB as at 31 December 2009 and
2008.
|
| US$ | HK$ | Total | ||||||||||
| As at 31 December 2009 | RMB million | RMB million | RMB million | |||||||||
|
|
||||||||||||
|
Equity securities
|
— | 13,570 | 13,570 | |||||||||
|
- Available-for-sale securities
|
— | 13,570 | 13,570 | |||||||||
|
Debt securities
|
2,902 | 7 | 2,909 | |||||||||
|
- Held-to-maturity securities
|
2,048 | 7 | 2,055 | |||||||||
|
- Available-for-sale securities
|
854 | — | 854 | |||||||||
|
Term deposits (excluding structured deposits)
|
6,814 | — | 6,814 | |||||||||
|
Structured deposits
|
273 | — | 273 | |||||||||
|
Cash and cash equivalents
|
1,911 | 1,538 | 3,449 | |||||||||
|
|
||||||||||||
|
|
||||||||||||
|
Total
|
11,900 | 15,115 | 27,015 | |||||||||
|
|
||||||||||||
F-32
Table of Contents
FOR THE YEAR ENDED 31 DEC 2009
| 4 |
MANAGEMENT OF INSURANCE AND FINANCIAL RISK (continued)
|
|
| 4.2 |
Financial risk (continued)
|
|
| 4.2.1 |
Market risk (continued)
|
|
| (iii) |
Currency risk (continued)
|
| US$ | HK$ | Total | ||||||||||
| As at 31 December 2008 | RMB million | RMB million | RMB million | |||||||||
|
|
||||||||||||
|
Equity securities
|
— | 2,410 | 2,410 | |||||||||
|
- Available-for-sale securities
|
— | 2,398 | 2,398 | |||||||||
|
- Securities at fair value through income
|
— | 12 | 12 | |||||||||
|
Debt securities
|
2,905 | — | 2,905 | |||||||||
|
- Held-to-maturity securities
|
2,051 | — | 2,051 | |||||||||
|
- Available-for-sale securities
|
854 | — | 854 | |||||||||
|
Term deposits (excluding structured deposits)
|
4,921 | — | 4,921 | |||||||||
|
Structured deposits
|
2,905 | — | 2,905 | |||||||||
|
Cash and cash equivalents
|
8,236 | 511 | 8,747 | |||||||||
|
|
||||||||||||
|
|
||||||||||||
|
Total
|
18,967 | 2,921 | 21,888 | |||||||||
|
|
||||||||||||
|
Monetary assets are exposed to currency risk whereas non-monetary
assets, such as equity securities, expose themselves to price risk.
As at 31 December 2009, if RMB had strengthened or weakened by 10%
against USD and HK dollar with all other variables held constant,
pre-tax profit for the year would have been RMB 1,345 million (2008:
RMB 1,948 million) lower or higher respectively, mainly as a result
of foreign exchange losses or gains on translation of USD and HK
dollar denominated financial assets other than the equity securities
included in the table above.
|
||
| 4.2.2 |
Credit risk
|
|
|
Credit risk is the risk that one party to a financial transaction or
the issuer of a financial instrument will fail to discharge an
obligation and cause another party to incur a financial loss.
Because the Group is limited in the types of investments as
permitted by China Insurance Regulatory Commission (“CIRC”) and a
significant portion of the portfolio is in government bonds,
government agency bonds and term deposits with the state-owned
commercial banks, the Group’s overall exposure to credit risk is
relatively low.
|
||
|
Credit risk is controlled by the application of credit approvals,
limits and monitoring procedures. The Group manages credit risk
through in-house fundamental analysis of the Chinese economy and the
underlying obligors and transaction structures. Where appropriate,
the Group obtains collateral in the form of rights to cash,
securities, property and equipment.
|
||
|
Credit exposure
|
||
|
The carrying amount of financial assets included on the consolidated
statement of financial position represents the maximum credit
exposure without taking account of any collateral held or other
credit enhancements attached. The Group has no credit risk exposures
relating to off-statement of financial position items as at 31
December 2009 and 2008.
|
||
|
Collateral and other credit enhancements
|
||
|
Securities purchased under agreements to resell are pledged by
counterpart’s debt securities or term deposits of which the Group
could take the ownership should the owner of the collateral default.
Policy loans and premium receivables are collateralized by their
policies’ cash value according to the terms and conditions of policy
loan contracts and policy contracts respectively signed by the Group
together with policyholders.
|
F-33
Table of Contents
FOR THE YEAR ENDED 31 DEC 2009
| 4 |
MANAGEMENT OF INSURANCE AND FINANCIAL RISK (continued)
|
|
| 4.2 |
Financial risk (continued)
|
|
| 4.2.2 |
Credit risk (continued)
|
|
|
Credit quality
|
||
|
The Group’s debt securities investment includes government bonds,
government agency bonds, corporate bonds and subordinated bonds or
debts, and most of the debt securities are guaranteed by either the
Chinese government or a Chinese government controlled financial
institution. As at 31 December 2009, 100% (as at 31 December 2008:
100%) of the corporate bonds held by the Group have credit rating of
AA/A-2 or above. As at 31 December 2009, 99.5% (as at 31 December
2008: 99.3% ) of the subordinated bonds or debts held by the Group
either have credit rating of AA/A-2 or above, or were issued by
national commercial banks. The bond or debt’s credit rating is
assigned by a qualified appraisal institution in the PRC at the time
of its issuance.
|
||
|
As at 31 December 2009, 100% (as at 31 December 2008: 99.8%) of the
Group’s bank deposits are with the four largest state-owned
commercial banks, other national commercial banks and China
Securities Depository and Clearing Corporation Limited (CSDCC) in
the PRC, and almost all of the reinsurance agreements of the Group
are with a state-owned reinsurance company. The Group believes these
commercial banks, SD&C and the reinsurance company have a high
credit quality. As a result, the Group concludes credit risk
associated with term deposits and accrued investment income thereof,
statutory deposits-restricted, cash equivalents and reinsurance
assets will not cause material impact on the Group’s consolidated
financial statements as at 31 December 2009 and 2008.
|
||
|
The credit risk associated with securities purchased under agreements to
resell, policy loans and premium receivables will not cause a material impact
on the Group’s consolidated financial statements taking into consideration of
their collateral held and maturity term of no more than one year as at 31
December 2009 and 2008.
|
F-34
Table of Contents
FOR THE YEAR ENDED 31 DEC 2009
| 4 |
MANAGEMENT OF INSURANCE AND FINANCIAL RISK (continued)
|
|
| 4.2 |
Financial risk (continued)
|
|
| 4.2.3 |
Liquidity risk
|
|
|
Liquidity risk is the risk that the Group will not have access to sufficient funds to meet its liabilities as they become due.
|
||
|
In the normal course of business, the Group attempts to match the maturity of financial assets to the maturity of insurance and
financial liabilities.
|
||
|
The following tables set forth the contractual and expected undiscounted cash flows for financial assets, insurance and financial
liabilities:
|
| Contractual and expected cash flows | ||||||||||||||||||||||||
| (undiscounted) | ||||||||||||||||||||||||
| Not | Later than 1 | Later than 3 | ||||||||||||||||||||||
| later | year but not | years but not | Later | |||||||||||||||||||||
| Carrying | Without | than 1 | later than 3 | later than 5 | than 5 | |||||||||||||||||||
| As at 31 December 2009 | amount | maturity | year | years | years | years | ||||||||||||||||||
|
|
||||||||||||||||||||||||
|
Financial assets
|
||||||||||||||||||||||||
|
|
||||||||||||||||||||||||
|
Contractual cash flows in/(out)
|
||||||||||||||||||||||||
|
Equity securities
|
179,390 | 179,390 | — | — | — | — | ||||||||||||||||||
|
Debt securities
|
582,285 | — | 27,803 | 91,257 | 85,720 | 686,923 | ||||||||||||||||||
|
Loans
|
23,081 | — | 14,448 | 1,234 | 1,234 | 12,746 | ||||||||||||||||||
|
Term deposits
|
344,983 | — | 91,552 | 79,100 | 149,936 | 65,405 | ||||||||||||||||||
|
Statutory deposits-restricted
|
6,153 | — | 191 | 2,319 | 4,406 | — | ||||||||||||||||||
|
Accrued investment income
|
14,208 | — | 14,208 | — | — | — | ||||||||||||||||||
|
Premiums receivable
|
6,818 | — | 6,818 | — | — | — | ||||||||||||||||||
|
Cash and cash equivalent
|
36,176 | — | 36,176 | — | — | — | ||||||||||||||||||
|
|
||||||||||||||||||||||||
|
|
||||||||||||||||||||||||
|
Subtotal
|
1,193,094 | 179,390 | 191,196 | 173,910 | 241,296 | 765,074 | ||||||||||||||||||
|
|
||||||||||||||||||||||||
|
|
||||||||||||||||||||||||
|
Financial and insurance liabilities
|
||||||||||||||||||||||||
|
|
||||||||||||||||||||||||
|
Expected cash flows out/(in)
|
||||||||||||||||||||||||
|
Insurance contracts
|
818,164 | — | (7,558 | ) | 34,103 | 118,673 | 1,335,276 | |||||||||||||||||
|
Investment contracts
|
67,274 | — | 18,386 | 20,121 | 13,595 | 34,352 | ||||||||||||||||||
|
|
||||||||||||||||||||||||
|
Contractual cash flows out/(in)
|
||||||||||||||||||||||||
|
Securities sold under
agreements to repurchase
|
33,553 | — | 33,553 | — | — | — | ||||||||||||||||||
|
Annuity and other insurance
balances payable
|
5,721 | — | 5,721 | — | — | — | ||||||||||||||||||
|
|
||||||||||||||||||||||||
|
|
||||||||||||||||||||||||
|
Subtotal
|
924,712 | — | 50,102 | 54,224 | 132,268 | 1,369,628 | ||||||||||||||||||
|
|
||||||||||||||||||||||||
|
|
||||||||||||||||||||||||
|
Total cash flows in/(out)
|
268,382 | 179,390 | 141,094 | 119,686 | 109,028 | (604,554 | ) | |||||||||||||||||
|
|
||||||||||||||||||||||||
F-35
Table of Contents
FOR THE YEAR ENDED 31 DEC 2009
| 4 |
MANAGEMENT OF INSURANCE AND FINANCIAL RISK (continued)
|
|
| 4.2 |
Financial risk (continued)
|
|
| 4.2.3 |
Liquidity risk (continued)
|
| Contractual and expected cash flows | ||||||||||||||||||||||||
| (undiscounted) | ||||||||||||||||||||||||
| Not | Later than 1 | Later than 3 | ||||||||||||||||||||||
| later | year but not | years but not | Later | |||||||||||||||||||||
| Carrying | Without | than 1 | later than 3 | later than 5 | than 5 | |||||||||||||||||||
| As at 31 December 2008 | amount | maturity | year | years | years | years | ||||||||||||||||||
|
|
||||||||||||||||||||||||
|
Financial assets
|
||||||||||||||||||||||||
|
|
||||||||||||||||||||||||
|
Contractual cash flows in/(out)
|
||||||||||||||||||||||||
|
Equity securities
|
75,075 | 75,075 | — | — | — | — | ||||||||||||||||||
|
Debt securities
|
575,871 | — | 49,178 | 108,633 | 77,224 | 571,228 | ||||||||||||||||||
|
Loans
|
17,926 | — | 9,293 | 1,234 | 1,234 | 13,363 | ||||||||||||||||||
|
Term deposits
|
228,272 | — | 69,359 | 50,902 | 126,210 | 9,298 | ||||||||||||||||||
|
Statutory deposits-restricted
|
6,153 | — | 460 | 748 | 5,919 | — | ||||||||||||||||||
|
Accrued investment income
|
13,149 | — | 13,149 | — | — | — | ||||||||||||||||||
|
Premiums receivable
|
6,433 | — | 6,433 | — | — | — | ||||||||||||||||||
|
Cash and cash equivalent
|
34,074 | — | 34,074 | — | — | — | ||||||||||||||||||
|
|
||||||||||||||||||||||||
|
|
||||||||||||||||||||||||
|
Subtotal
|
956,953 | 75,075 | 181,946 | 161,517 | 210,587 | 593,889 | ||||||||||||||||||
|
|
||||||||||||||||||||||||
|
|
||||||||||||||||||||||||
|
Financial and insurance liabilities
|
||||||||||||||||||||||||
|
|
||||||||||||||||||||||||
|
Expected cash flows out/(in)
|
||||||||||||||||||||||||
|
Insurance contracts
|
662,865 | — | (2,367 | ) | 20,358 | 95,160 | 1,069,670 | |||||||||||||||||
|
Investment contracts
|
65,050 | — | 18,079 | 18,582 | 9,979 | 37,430 | ||||||||||||||||||
|
|
||||||||||||||||||||||||
|
Contractual cash flows out/(in)
|
||||||||||||||||||||||||
|
Securities sold under
agreements to repurchase
|
11,390 | — | 11,390 | — | — | — | ||||||||||||||||||
|
Annuity and other insurance
balances payable
|
4,980 | — | 4,980 | — | — | — | ||||||||||||||||||
|
|
||||||||||||||||||||||||
|
|
||||||||||||||||||||||||
|
Subtotal
|
744,285 | — | 32,082 | 38,940 | 105,139 | 1,107,100 | ||||||||||||||||||
|
|
||||||||||||||||||||||||
|
|
||||||||||||||||||||||||
|
Total cash flows in/(out)
|
212,668 | 75,075 | 149,864 | 122,577 | 105,448 | (513,211 | ) | |||||||||||||||||
|
|
||||||||||||||||||||||||
|
The amounts set forth in the tables above for insurance and investment contracts in each column are the cash flows representing expected
future benefit payments taking into consideration of future premiums payments or deposits from policyholders. The excess cash inflow
from matured financial assets will be reinvested to cover any future liquidity exposures. The estimate is subject to assumptions related
to mortality, morbidity, discount rate, loss ratio, expenses assumption and other assumptions. Actual experience may differ from
estimates.
|
||
|
At 31 December 2009, declared dividends of RMB 23,833 million (2008: RMB 24,295 million) included in policyholder dividends payable have
a maturity not later than one year. For the remaining policyholder dividends payable, the amount and timing of the cash flows are
indeterminate due to the uncertainty of future experiences including investment returns and are subject to future declarations by the
Group.
|
||
|
The other maturity analysis is conducted on the assumption that all investment contracts (with DPF and without DPF) and universal life
insurance contracts were surrendered immediately. This would cause a cash outflow of RMB 50,365 million, RMB 1,482 million and RMB
14,891 million respectively for the period ended 31 December 2009 (2008: RMB 51,818 million, RMB 1,543 million and RMB 11,249 million
respectively), payable within one year. Although contractually these options can be exercised immediately by all policyholders at once,
the Group’s expected cash flows as shown in the above tables are based on past experience and future expectations.
|
F-36
Table of Contents
FOR THE YEAR ENDED 31 DEC 2009
| 4 |
MANAGEMENT OF INSURANCE AND FINANCIAL RISK (continued)
|
|
| 4.2 |
Financial risk (continued)
|
|
| 4.2.4 |
Capital management
|
|
|
The Group’s objectives when managing capital, which is actual capital,
calculated as the difference between admitted assets (defined by CIRC)
and the admitted liabilities (defined by CIRC), are to comply with the
insurance capital requirements required by the CIRC to meet the minimum
capital and safeguard the Group’s ability to continue as a going concern
so that it can continue to provide returns for shareholders and benefits
for other stakeholders.
|
||
|
The Group is also subject to other local capital requirements, such as
statutory deposits-restricted requirement and Statutory reserve fund
requirement, discussed in detail under Note 8.4 and Note 30,
respectively.
|
||
|
The Group ensures its continuous and full compliance with the regulations
mainly through monitoring quarterly and annual static solvency margin, as
well as the dynamic solvency margin, which predicts the solvency margin
for the next three years based on different scenarios. It has complied
with all the local capital requirements.
|
||
|
The table below summarises the solvency ratio of the Company, the
regulatory capital held (represented by actual capital) against the
minimum required capital (represented by minimum capital). The solvency
ratio for the year ended 31 December 2008 was recalculated due to the
adoption of MoF new guidance as disclosed in Note 2.1.
|
| As at 31 | As at 31 | |||||||
| December 2009 | December 2008 | |||||||
| RMB million | RMB million | |||||||
|
|
||||||||
|
Actual capital
|
147,119 | 124,561 | ||||||
|
Minimum capital
|
48,459 | 40,154 | ||||||
|
Solvency ratio
|
304 | % | 310 | % | ||||
|
According to “Solvency Regulations of Insurance Companies”, the solvency
ratio is computed by dividing the actual capital by the minimum capital.
CIRC will closely monitor those insurance companies with solvency ratio
less than 100% and may, depending on the individual circumstances,
undertake certain regulatory measures, including but not limited to
restricting the payment of dividends. Insurance companies with solvency
ratio between 100% and 150% would be required to submit and implement
plans preventing capital from being inadequate. And Insurance companies
with solvency ratio above 100% but significant solvency risk noticed
would be required to take necessary rectification action.
|
F-37
Table of Contents
FOR THE YEAR ENDED 31 DEC 2009
| 4 |
MANAGEMENT OF INSURANCE AND FINANCIAL RISK (continued)
|
|
| 4.3 |
Fair value hierarchy
|
|
|
At 31 December 2009, investments classified as Level 1 comprise
approximately 41.78% of financial assets measured at fair value on a
recurring basis. Fair value measurements classified as Level 1 include
certain debt securities, equity securities that are traded in an
active exchange market or inter-bank market. The Group considers a
combination of certain factors to determine whether a market for a
financial instrument is active, including the occurrence of trades
within the specific period, the respective trading volume, and the
degree which the implied yields for a debt security for observed
transactions differs from the Group’s understanding of the current
relevant market rates and information.
|
||
|
At 31 December 2009, investments classified as Level 2 comprise
approximately 57.93% of financial assets measured at fair value on a
recurring basis. They primarily include certain debt securities and
equity securities. Valuations are generally obtained from third party
pricing services for identical or comparable assets, or through the
use of valuation methodologies using observable market inputs, or
recent quoted market prices. Valuation service providers typically
gather, analyze and interpret information related to market
transactions and other key valuation model inputs from multiple
sources, and through the use of widely accepted internal valuation
models, provide a theoretical quote on various securities.
|
||
|
For the years ended 31 December 2009 and 2008, most of these prices
obtained from the pricing services are for debt securities issued by
the Chinese government and government controlled organizations. These
pricing services utilize a discounted cash flow valuation model using
market observable inputs, mainly interest rates, to determine a fair
value. These debt securities are classified as Level 2.
|
||
|
Fair value provide by valuation service providers are subject to a
number of validation procedures by management. These procedures
include a review of the valuation models utilized and the results of
these models, and as well as the recalculation of prices obtained from
pricing services at the end of each reporting period.
|
||
|
Fair value is based on significant inputs, other than Level 1 quoted
price, that are observable for the asset being measured, either
directly or indirectly, for substantially the full term of the asset
through corroboration with observable market data. Observable inputs
generally used to measure the fair value of securities classified as
Level 2 include quoted market prices for similar assets in active
markets; quoted market prices in markets that are not active for
identical or similar assets and other market observable inputs.
|
||
|
Under certain conditions, the Group may not received price from
independent third party pricing services. In this instance, the Group
may choose to apply internally developed values to the assets being
measured. In such cases, the valuations are generally classified as
Level 3. Key inputs involved in internal valuation services include,
but are not limited to market price from recently completed
transactions, interest yield curves, credit spreads, currency rates as
well as assumptions made by management based on judgements and
experiences.
|
||
|
At 31 December 2009, investments classified as Level 3 comprise
approximately 0.29% of financial assets measured at fair value on a
recurring basis. They primarily include subordinated debts, certain
corporate and government agency bonds and certain equity securities.
Prices are determined using valuation methodologies such as discounted
cash flow models and other similar techniques. Determinations to
classify fair value measures within Level 3 of the valuation hierarchy
are generally based on the significance of the unobservable factors to
the overall fair value measurement, and valuation methodologies such
as discounted cash flow models and other similar techniques.
|
F-38
Table of Contents
FOR THE YEAR ENDED 31 DEC 2009
| 4 |
MANAGEMENT OF INSURANCE AND FINANCIAL RISK (continued)
|
|
| 4.3 |
Fair value hierarchy (continued)
|
|
|
For the accounting policies regarding the determination of the fair values of financial assets and financial liabilities, see Note 3.2.
|
||
|
The following table presents the Group’s assets and liabilities measured at fair value at 31 December 2009.
|
| Level 1 | Level 2 | Level 3 | Total balance | |||||||||||||
|
|
||||||||||||||||
|
Assets
|
||||||||||||||||
|
Available-for-sale securities
|
||||||||||||||||
|
—Equity securities
|
172,383 | 3,053 | 1,238 | 176,674 | ||||||||||||
|
—Debt securities
|
42,308 | 298,216 | 301 | 340,825 | ||||||||||||
|
Securities at fair value through income
|
||||||||||||||||
|
—Equity securities
|
2,704 | 38 | — | 2,742 | ||||||||||||
|
—Debt securities
|
2,628 | 3,763 | — | 6,391 | ||||||||||||
|
|
||||||||||||||||
|
|
||||||||||||||||
|
Total assets
|
220,023 | 305,070 | 1,539 | 526,632 | ||||||||||||
|
|
||||||||||||||||
|
|
||||||||||||||||
|
Liabilities
|
||||||||||||||||
|
Investment contracts at fair value through
income
|
(52 | ) | — | — | (52 | ) | ||||||||||
|
|
||||||||||||||||
|
|
||||||||||||||||
|
Total liabilities
|
(52 | ) | — | — | (52 | ) | ||||||||||
|
|
||||||||||||||||
|
The following table presents the changes in Level 3 instruments for the year ended 31 December 2009.
|
| Securities at fair value | ||||||||||||||||
| Available-for-sale Securities | through income | |||||||||||||||
| Debt | Equity | Equity | Total | |||||||||||||
| securities | Securities | Securities | assets | |||||||||||||
|
|
||||||||||||||||
|
Opening balance
|
385 | 1,007 | 15 | 1,407 | ||||||||||||
|
Total gains and losses
recognized in
|
||||||||||||||||
|
— Profit or loss
|
3 | — | 15 | 18 | ||||||||||||
|
— Other comprehensive
income/(loss)
|
(3 | ) | 127 | — | 124 | |||||||||||
|
Transfer out of Level 3
|
— | (617 | ) | (30 | ) | (647 | ) | |||||||||
|
Purchases
|
— | 721 | — | 721 | ||||||||||||
|
Settlements
|
(84 | ) | — | — | (84 | ) | ||||||||||
|
|
||||||||||||||||
|
|
||||||||||||||||
|
Closing balance
|
301 | 1,238 | — | 1,539 | ||||||||||||
|
|
||||||||||||||||
|
Total gains for the
period included in
income for assets and
liabilities held at
the end of the
reporting period
|
— | — | — | — | ||||||||||||
|
|
||||||||||||||||
|
In 2009, the Group transferred certain debt and equity securities between Level
1, Level 2 and Level 3. This was due to the change in the availability of
market observable inputs.
|
F-39
Table of Contents
FOR THE YEAR ENDED 31 DEC 2009
| 5 |
SEGMENT INFORMATION
|
|
| 5.1 |
Operating segments
|
|
|
The Group operates in four operating segments:
|
||
| (i) |
Individual life insurance business
|
|
|
Individual life insurance business relates primarily to the sale of long-term life insurance
contracts and universal life contracts to individuals and assumed individual reinsurance
contracts.
|
||
| (ii) |
Group life insurance business
|
|
|
Group life insurance business relates primarily to the sale of insurance contracts and
investment contracts to group entities.
|
||
| (iii) |
Short-term insurance business
|
|
|
Short-term insurance business relates primarily to the sale of short-term insurance contracts.
|
||
| (iv) |
Corporate and other business
|
|
|
Corporate and other business relates primarily to income, tax expenses and allocated costs of
insurance agency business in respect of the provision of the services to CLIC, as described
in Note 28, share of results of associates, income and expenses of subsidiaries, unallocated
incomes and expenditures of the Group.
|
||
| 5.2 |
Allocation basis of income and expenses
|
|
|
Investment income, net realised gains or losses on financial assets, net fair value gains or
losses on assets at fair value through income and foreign exchange losses within other
operating expenses are allocated among segments in proportion to each respective segment’s
average liabilities of insurance contracts and investment contracts at the beginning and end
of the year. Administrative expenses and certain other operating expenses are allocated among
segments in proportion to the unit cost of products in the respective segments. Except for
those arising from investment contracts presented in corresponding segments, other income and
other operating expenses are presented in “Corporate & Other” directly.
|
||
| 5.3 |
Allocation basis of assets and liabilities
|
|
|
Financial assets and securities sold under agreements to repurchase are allocated among
segments in proportion to each respective segment’s average liabilities of insurance
contracts and investment contracts at the beginning and end of the year. Insurance
liabilities are presented among segments respectively.
|
F-40
Table of Contents
FOR THE YEAR ENDED 31 DEC 2009
| 5 |
SEGMENT INFORMATION (continued)
|
| For the year ended 31 December 2009 | ||||||||||||||||||||||||
| Individual | Group | Short- | Corporate | |||||||||||||||||||||
| life | life | term | & other | Elimination | Total | |||||||||||||||||||
| (RMB million) | ||||||||||||||||||||||||
|
|
||||||||||||||||||||||||
|
Revenues
|
||||||||||||||||||||||||
|
Gross written premiums
|
261,715 | 190 | 14,065 | — | — | 275,970 | ||||||||||||||||||
|
|
||||||||||||||||||||||||
|
- Term Life
|
805 | 112 | — | — | — | |||||||||||||||||||
|
- Whole Life
|
37,860 | 60 | — | — | — | |||||||||||||||||||
|
- Endowment
|
184,841 | — | — | — | — | |||||||||||||||||||
|
- Annuity
|
38,209 | 18 | — | — | — | |||||||||||||||||||
|
|
||||||||||||||||||||||||
|
Net premiums earned
|
261,694 | 189 | 13,194 | — | 275,077 | |||||||||||||||||||
|
Investment income
|
35,693 | 2,614 | 408 | 175 | — | 38,890 | ||||||||||||||||||
|
Net realised gains on financial assets
|
19,522 | 1,430 | 222 | 70 | — | 21,244 | ||||||||||||||||||
|
Net fair value gains on assets at fair
value through income
|
1,330 | 97 | 16 | 6 | — | 1,449 | ||||||||||||||||||
|
Other income
|
283 | 331 | — | 2,586 | (570 | ) | 2,630 | |||||||||||||||||
|
|
||||||||||||||||||||||||
|
including: inter-segment revenue
|
— | — | — | 570 | (570 | ) | — | |||||||||||||||||
|
|
||||||||||||||||||||||||
|
|
||||||||||||||||||||||||
|
Segment revenues
|
318,522 | 4,661 | 13,840 | 2,837 | (570 | ) | 339,290 | |||||||||||||||||
|
|
||||||||||||||||||||||||
|
|
||||||||||||||||||||||||
|
Benefits, claims and expenses
|
||||||||||||||||||||||||
|
Insurance benefits and claims
|
||||||||||||||||||||||||
|
Life insurance death and other benefits
|
(74,416 | ) | (442 | ) | — | — | — | (74,858 | ) | |||||||||||||||
|
Accident and health claims and claim
adjustment expenses
|
— | — | (7,808 | ) | — | — | (7,808 | ) | ||||||||||||||||
|
Increase in insurance contracts liabilities
|
(154,552) | 180 | — | — | — | (154,372 | ) | |||||||||||||||||
|
Investment contract benefits
|
(560 | ) | (1,582 | ) | — | — | — | (2,142 | ) | |||||||||||||||
|
Policyholder dividends resulting from
participation in profits
|
(13,181 | ) | (1,306 | ) | — | — | — | (14,487 | ) | |||||||||||||||
|
Underwriting and policy acquisition costs
|
(20,881 | ) | (113 | ) | (1,877 | ) | (65 | ) | — | (22,936 | ) | |||||||||||||
|
Administrative expenses
|
(13,057 | ) | (779 | ) | (3,236 | ) | (1,647 | ) | — | (18,719 | ) | |||||||||||||
|
Other operating expenses
|
(1,702 | ) | (131 | ) | (387 | ) | (740 | ) | 570 | (2,390 | ) | |||||||||||||
|
|
||||||||||||||||||||||||
|
including: Inter-segment expenses
|
(504 | ) | (37 | ) | (6 | ) | (23 | ) | 570 | — | ||||||||||||||
|
|
||||||||||||||||||||||||
|
Statutory insurance fund
|
(404 | ) | (21 | ) | (112 | ) | — | — | (537 | ) | ||||||||||||||
|
|
||||||||||||||||||||||||
|
|
||||||||||||||||||||||||
|
Segment benefits, claims and expenses
|
(278,753 | ) | (4,194 | ) | (13,420 | ) | (2,452 | ) | 570 | (298,249 | ) | |||||||||||||
|
|
||||||||||||||||||||||||
|
|
||||||||||||||||||||||||
|
Share of results of associates
|
— | — | — | 704 | — | 704 | ||||||||||||||||||
|
|
||||||||||||||||||||||||
|
|
||||||||||||||||||||||||
|
Segment results
|
39,769 | 467 | 420 | 1,089 | — | 41,745 | ||||||||||||||||||
|
|
||||||||||||||||||||||||
|
|
||||||||||||||||||||||||
|
Income tax expenses
|
— | — | — | (8,709 | ) | — | (8,709 | ) | ||||||||||||||||
|
|
||||||||||||||||||||||||
|
|
||||||||||||||||||||||||
|
Net profit/(loss)
|
39,769 | 467 | 420 | (7,620 | ) | — | 33,036 | |||||||||||||||||
|
|
||||||||||||||||||||||||
|
|
||||||||||||||||||||||||
|
Attributable to
|
||||||||||||||||||||||||
|
- shareholders of the Company
|
39,769 | 467 | 420 | (7,775 | ) | — | 32,881 | |||||||||||||||||
|
- minority interests
|
— | — | — | 155 | — | 155 | ||||||||||||||||||
|
|
||||||||||||||||||||||||
|
Unrealised gains/(losses) included in
shareholder’s equity
|
9,953 | 729 | 113 | (50 | ) | — | 10,745 | |||||||||||||||||
|
|
||||||||||||||||||||||||
|
Depreciation and amortisation
|
1,169 | 69 | 289 | 33 | — | 1,560 | ||||||||||||||||||
F-41
Table of Contents
FOR THE YEAR ENDED 31 DEC 2009
| 5 |
SEGMENT INFORMATION (continued)
|
| As at 31 December 2009 | ||||||||||||||||||||||||
| Individual | Group | Short- | Corporate | |||||||||||||||||||||
| life | life | term | & other | Elimination | Total | |||||||||||||||||||
| (RMB million) | ||||||||||||||||||||||||
|
|
||||||||||||||||||||||||
|
Assets
|
||||||||||||||||||||||||
|
|
||||||||||||||||||||||||
|
Financial assets
|
1,056,319 | 76,351 | 11,877 | 5,609 | — | 1,150,156 | ||||||||||||||||||
|
Cash and cash equivalents
|
32,808 | 2,401 | 373 | 615 | — | 36,197 | ||||||||||||||||||
|
Other
|
701 | — | 114 | 8,470 | — | 9,285 | ||||||||||||||||||
|
|
||||||||||||||||||||||||
|
|
||||||||||||||||||||||||
|
Segment assets
|
1,089,828 | 78,752 | 12,364 | 14,694 | — | 1,195,638 | ||||||||||||||||||
|
|
||||||||||||||||||||||||
|
|
||||||||||||||||||||||||
|
Unallocated
|
||||||||||||||||||||||||
|
Property, plant and equipment
|
17,467 | |||||||||||||||||||||||
|
Other
|
13,152 | |||||||||||||||||||||||
|
|
||||||||||||||||||||||||
|
|
||||||||||||||||||||||||
|
Total
|
1,226,257 | |||||||||||||||||||||||
|
|
||||||||||||||||||||||||
|
|
||||||||||||||||||||||||
|
Liabilities
|
||||||||||||||||||||||||
|
|
||||||||||||||||||||||||
|
Insurance contracts
|
808,591 | 632 | 8,941 | — | — | 818,164 | ||||||||||||||||||
|
Financial liabilities
|
||||||||||||||||||||||||
|
Investment contracts
|
14,579 | 52,747 | — | — | — | 67,326 | ||||||||||||||||||
|
Securities sold under
agreements to repurchase
|
30,250 | 2,215 | 345 | 743 | — | 33,553 | ||||||||||||||||||
|
Other
|
120 | 436 | — | — | — | 556 | ||||||||||||||||||
|
|
||||||||||||||||||||||||
|
|
||||||||||||||||||||||||
|
Segment liabilities
|
853,540 | 56,030 | 9,286 | 743 | — | 919,599 | ||||||||||||||||||
|
|
||||||||||||||||||||||||
|
|
||||||||||||||||||||||||
|
Unallocated
|
||||||||||||||||||||||||
|
Other
|
93,882 | |||||||||||||||||||||||
|
|
||||||||||||||||||||||||
|
|
||||||||||||||||||||||||
|
Total
|
1,013,481 | |||||||||||||||||||||||
|
|
||||||||||||||||||||||||
F-42
Table of Contents
FOR THE YEAR ENDED 31 DEC 2009
| 5 |
SEGMENT INFORMATION (continued)
|
| For the year ended 31 December 2008 | ||||||||||||||||||||||||
| Individual | Group | Short- | Corporate | |||||||||||||||||||||
| life | life | term | & other | Elimination | Total | |||||||||||||||||||
| (RMB million) | ||||||||||||||||||||||||
|
|
||||||||||||||||||||||||
|
Revenues
|
||||||||||||||||||||||||
|
Gross written premiums
|
252,130 | 340 | 13,186 | — | — | 265,656 | ||||||||||||||||||
|
|
||||||||||||||||||||||||
|
- Term Life
|
308 | 25 | — | — | — | |||||||||||||||||||
|
- Whole Life
|
35,421 | 274 | — | — | — | |||||||||||||||||||
|
- Endowment
|
188,099 | — | — | — | — | |||||||||||||||||||
|
- Annuity
|
28,302 | 41 | — | — | — | |||||||||||||||||||
|
|
||||||||||||||||||||||||
|
Net premiums earned
|
252,113 | 339 | 12,725 | — | 265,177 | |||||||||||||||||||
|
Investment income
|
40,407 | 3,699 | 524 | 316 | — | 44,946 | ||||||||||||||||||
|
Net realised losses on financial assets
|
(5,355 | ) | (490 | ) | (69 | ) | (50 | ) | — | (5,964 | ) | |||||||||||||
|
Net fair value losses on assets at fair
value through income
|
(6,382 | ) | (584 | ) | (83 | ) | (145 | ) | — | (7,194 | ) | |||||||||||||
|
Other income
|
605 | 683 | 2,513 | (381 | ) | 3,420 | ||||||||||||||||||
|
|
||||||||||||||||||||||||
|
including: inter-segment revenue
|
— | — | — | 381 | (381 | ) | — | |||||||||||||||||
|
|
||||||||||||||||||||||||
|
|
||||||||||||||||||||||||
|
Segment revenues
|
281,388 | 3,647 | 13,097 | 2,634 | (381 | ) | 300,385 | |||||||||||||||||
|
|
||||||||||||||||||||||||
|
|
||||||||||||||||||||||||
|
Benefits, claims and expenses
|
||||||||||||||||||||||||
|
Insurance benefits and claims
|
||||||||||||||||||||||||
|
Life insurance death and other benefits
|
(88,507 | ) | (1,152 | ) | — | — | — | (89,659 | ) | |||||||||||||||
|
Accident and health claims and claim
adjustment expenses
|
— | — | (7,641 | ) | — | — | (7,641 | ) | ||||||||||||||||
|
Increase in insurance contracts liabilities
|
(135,298) | 649 | — | — | — | (134,649 | ) | |||||||||||||||||
|
Investment contract benefits
|
(224 | ) | (1,707 | ) | — | — | — | (1,931 | ) | |||||||||||||||
|
Policyholder dividends resulting from
participation in profits
|
(1,589 | ) | (82 | ) | — | — | — | (1,671 | ) | |||||||||||||||
|
Underwriting and policy acquisition costs
|
(22,127 | ) | (212 | ) | (1,848 | ) | (13 | ) | — | (24,200 | ) | |||||||||||||
|
Administrative expenses
|
(11,347 | ) | (761 | ) | (2,614 | ) | (1,930 | ) | — | (16,652 | ) | |||||||||||||
|
Other operating expenses
|
(2,826 | ) | (273 | ) | (263 | ) | (428 | ) | 381 | (3,409 | ) | |||||||||||||
|
|
||||||||||||||||||||||||
|
including: Inter-segment expenses
|
(212 | ) | (19 | ) | (3 | ) | (147 | ) | 381 | — | ||||||||||||||
|
|
||||||||||||||||||||||||
|
Statutory insurance fund
|
(395 | ) | (28 | ) | (135 | ) | — | — | (558 | ) | ||||||||||||||
|
|
||||||||||||||||||||||||
|
|
||||||||||||||||||||||||
|
Segment benefits, claims and expenses
|
(262,313 | ) | (3,566 | ) | (12,501 | ) | (2,371 | ) | 381 | (280,370 | ) | |||||||||||||
|
|
||||||||||||||||||||||||
|
|
||||||||||||||||||||||||
|
Share of results of associates
|
— | — | — | (56 | ) | — | (56 | ) | ||||||||||||||||
|
|
||||||||||||||||||||||||
|
|
||||||||||||||||||||||||
|
Segment results
|
19,075 | 81 | 596 | 207 | — | 19,959 | ||||||||||||||||||
|
|
||||||||||||||||||||||||
|
|
||||||||||||||||||||||||
|
Income tax expenses
|
— | — | — | (685 | ) | — | (685 | ) | ||||||||||||||||
|
|
||||||||||||||||||||||||
|
|
||||||||||||||||||||||||
|
Net profit/(loss)
|
19,075 | 81 | 596 | (478 | ) | — | 19,274 | |||||||||||||||||
|
|
||||||||||||||||||||||||
|
|
||||||||||||||||||||||||
|
Attributable to
|
||||||||||||||||||||||||
|
- shareholders of the Company
|
19,075 | 81 | 596 | (615 | ) | — | 19,137 | |||||||||||||||||
|
- minority interests
|
— | — | — | 137 | — | 137 | ||||||||||||||||||
|
Unrealised gains/(losses) included in
shareholder’s equity
|
(30,457 | ) | (2,788 | ) | (395 | ) | 188 | — | (33,452 | ) | ||||||||||||||
|
|
||||||||||||||||||||||||
|
Depreciation and amortisation
|
1,014 | 68 | 248 | 28 | — | 1,358 | ||||||||||||||||||
F-43
Table of Contents
FOR THE YEAR ENDED 31 DEC 2009
| 5 |
SEGMENT INFORMATION (continued)
|
| As at 31 December 2008 | ||||||||||||||||||||||||
| Individual | Group | Short- | Corporate | |||||||||||||||||||||
| life | life | term | & other | Elimination | Total | |||||||||||||||||||
| (RMB million) | ||||||||||||||||||||||||
|
|
||||||||||||||||||||||||
|
Assets
|
||||||||||||||||||||||||
|
|
||||||||||||||||||||||||
|
Financial assets
|
827,033 | 74,923 | 10,606 | 3,905 | — | 916,467 | ||||||||||||||||||
|
Cash and cash equivalents
|
30,724 | 2,812 | 398 | 151 | — | 34,085 | ||||||||||||||||||
|
Other
|
698 | — | 77 | 7,891 | — | 8,666 | ||||||||||||||||||
|
|
||||||||||||||||||||||||
|
|
||||||||||||||||||||||||
|
Segment assets
|
858,455 | 77,735 | 11,081 | 11,947 | — | 959,218 | ||||||||||||||||||
|
|
||||||||||||||||||||||||
|
|
||||||||||||||||||||||||
|
Unallocated
|
||||||||||||||||||||||||
|
Property, plant and equipment
|
16,720 | |||||||||||||||||||||||
|
Other
|
11,555 | |||||||||||||||||||||||
|
|
||||||||||||||||||||||||
|
|
||||||||||||||||||||||||
|
Total
|
987,493 | |||||||||||||||||||||||
|
|
||||||||||||||||||||||||
|
|
||||||||||||||||||||||||
|
Liabilities
|
||||||||||||||||||||||||
|
|
||||||||||||||||||||||||
|
Insurance contracts
|
654,037 | 811 | 8,017 | — | — | 662,865 | ||||||||||||||||||
|
Financial Liabilities
|
||||||||||||||||||||||||
|
Investment contracts
|
10,928 | 54,135 | — | — | — | 65,063 | ||||||||||||||||||
|
Securities sold under
agreements to repurchase
|
10,141 | 928 | 131 | 190 | — | 11,390 | ||||||||||||||||||
|
Other
|
48 | 237 | — | — | — | 285 | ||||||||||||||||||
|
|
||||||||||||||||||||||||
|
|
||||||||||||||||||||||||
|
Segment liabilities
|
675,154 | 56,111 | 8,148 | 190 | — | 739,603 | ||||||||||||||||||
|
|
||||||||||||||||||||||||
|
|
||||||||||||||||||||||||
|
Unallocated
|
||||||||||||||||||||||||
|
Other
|
73,019 | |||||||||||||||||||||||
|
|
||||||||||||||||||||||||
|
|
||||||||||||||||||||||||
|
Total
|
812,622 | |||||||||||||||||||||||
|
|
||||||||||||||||||||||||
F-44
Table of Contents
FOR THE YEAR ENDED 31 DEC 2009
| 6 |
PROPERTY, PLANT AND EQUIPMENT
|
| 2009 | ||||||||||||||||||||||||
| Office | ||||||||||||||||||||||||
| equipment | ||||||||||||||||||||||||
| furniture and | Motor | Assets under | Leasehold | |||||||||||||||||||||
| Buildings | fixtures | vehicles | construction | improvements | Total | |||||||||||||||||||
| (RMB Million) | ||||||||||||||||||||||||
|
|
||||||||||||||||||||||||
|
Cost
|
||||||||||||||||||||||||
|
As at 1 January 2009
|
13,397 | 4,092 | 1,853 | 3,024 | 691 | 23,057 | ||||||||||||||||||
|
Transfers upon completion
|
560 | 6 | — | (607 | ) | 41 | — | |||||||||||||||||
|
Additions
|
190 | 750 | 157 | 1,520 | 78 | 2,695 | ||||||||||||||||||
|
Disposals
|
(75 | ) | (213 | ) | (164 | ) | (401 | ) | (18 | ) | (871 | ) | ||||||||||||
|
|
||||||||||||||||||||||||
|
As at 31 December 2009
|
14,072 | 4,635 | 1,846 | 3,536 | 792 | 24,881 | ||||||||||||||||||
|
|
||||||||||||||||||||||||
|
|
||||||||||||||||||||||||
|
Accumulated depreciation
|
||||||||||||||||||||||||
|
As at 1 January 2009
|
(2,789 | ) | (2,157 | ) | (1,116 | ) | — | (243 | ) | (6,305 | ) | |||||||||||||
|
Additions
|
(502 | ) | (598 | ) | (175 | ) | — | (139 | ) | (1,414 | ) | |||||||||||||
|
Disposals
|
15 | 168 | 142 | — | 10 | 335 | ||||||||||||||||||
|
|
||||||||||||||||||||||||
|
As at 31 December 2009
|
(3,276 | ) | (2,587 | ) | (1,149 | ) | — | (372 | ) | (7,384 | ) | |||||||||||||
|
|
||||||||||||||||||||||||
|
|
||||||||||||||||||||||||
|
Impairment
|
||||||||||||||||||||||||
|
As at 1 January 2009
|
(32 | ) | — | — | — | — | (32 | ) | ||||||||||||||||
|
Additions
|
(1 | ) | — | — | — | — | (1 | ) | ||||||||||||||||
|
Disposals
|
3 | — | — | — | — | 3 | ||||||||||||||||||
|
|
||||||||||||||||||||||||
|
As at 31 December 2009
|
(30 | ) | — | — | — | — | (30 | ) | ||||||||||||||||
|
|
||||||||||||||||||||||||
|
|
||||||||||||||||||||||||
|
Net book value
|
||||||||||||||||||||||||
|
As at 1 January 2009
|
10,576 | 1,935 | 737 | 3,024 | 448 | 16,720 | ||||||||||||||||||
|
|
||||||||||||||||||||||||
|
As at 31 December 2009
|
10,766 | 2,048 | 697 | 3,536 | 420 | 17,467 | ||||||||||||||||||
|
|
||||||||||||||||||||||||
F-45
Table of Contents
FOR THE YEAR ENDED 31 DEC 2009
| 6 |
PROPERTY, PLANT AND EQUIPMENT(Continued)
|
| 2008 | ||||||||||||||||||||||||
| Office | ||||||||||||||||||||||||
| equipment | ||||||||||||||||||||||||
| furniture and | Motor | Assets under | Leasehold | |||||||||||||||||||||
| Buildings | fixtures | vehicles | construction | improvements | Total | |||||||||||||||||||
| (RMB Million) | ||||||||||||||||||||||||
|
|
||||||||||||||||||||||||
|
Cost
|
||||||||||||||||||||||||
|
As at 1 January 2008
|
12,655 | 3,617 | 1,815 | 2,594 | 333 | 21,014 | ||||||||||||||||||
|
Transfers upon completion
|
416 | — | — | (416 | ) | — | — | |||||||||||||||||
|
Additions
|
439 | 752 | 203 | 898 | 369 | 2,661 | ||||||||||||||||||
|
Disposals
|
(113 | ) | (277 | ) | (165 | ) | (52 | ) | (11 | ) | (618 | ) | ||||||||||||
|
|
||||||||||||||||||||||||
|
As at 31 December 2008
|
13,397 | 4,092 | 1,853 | 3,024 | 691 | 23,057 | ||||||||||||||||||
|
|
||||||||||||||||||||||||
|
|
||||||||||||||||||||||||
|
Accumulated depreciation
|
||||||||||||||||||||||||
|
As at 1 January 2008
|
(2,374 | ) | (1,865 | ) | (1,097 | ) | — | (159 | ) | (5,495 | ) | |||||||||||||
|
Additions
|
(444 | ) | (531 | ) | (175 | ) | — | (94 | ) | (1,244 | ) | |||||||||||||
|
Disposals
|
29 | 239 | 156 | — | 10 | 434 | ||||||||||||||||||
|
|
||||||||||||||||||||||||
|
As at 31 December 2008
|
(2,789 | ) | (2,157 | ) | (1,116 | ) | — | (243 | ) | (6,305 | ) | |||||||||||||
|
|
||||||||||||||||||||||||
|
|
||||||||||||||||||||||||
|
Impairment
|
||||||||||||||||||||||||
|
As at 1 January 2008
|
(13 | ) | — | — | — | — | (13 | ) | ||||||||||||||||
|
Additions
|
(24 | ) | — | — | — | — | (24 | ) | ||||||||||||||||
|
Disposals
|
5 | — | — | — | — | 5 | ||||||||||||||||||
|
|
||||||||||||||||||||||||
|
As at 31 December 2008
|
(32 | ) | — | — | — | — | (32 | ) | ||||||||||||||||
|
|
||||||||||||||||||||||||
|
|
||||||||||||||||||||||||
|
Net book value
|
||||||||||||||||||||||||
|
As at 1 January 2008
|
10,268 | 1,752 | 718 | 2,594 | 174 | 15,506 | ||||||||||||||||||
|
|
||||||||||||||||||||||||
|
As at 31 December 2008
|
10,576 | 1,935 | 737 | 3,024 | 448 | 16,720 | ||||||||||||||||||
|
|
||||||||||||||||||||||||
F-46
Table of Contents
FOR THE YEAR ENDED 31 DEC 2009
| 7 |
INVESTMENTS IN ASSOCIATES
|
| 2009 | 2008 | |||||||
| RMB million | RMB million | |||||||
|
|
||||||||
|
As at 1 January
|
7,891 | 6,449 | ||||||
|
Additional capital contribution to China Life Property
&Casualty Insurance Company Limited(“CLP&C”)(Note 28(e))
|
— | 1,200 | ||||||
|
Investment in China Life Insurance Brokers(“CIB”)
|
— | 7 | ||||||
|
Share of results
|
704 | (56 | ) | |||||
|
Other equity movements
|
(70 | ) | 291 | |||||
|
Dividend received
|
(55 | ) | — | |||||
|
|
||||||||
|
|
||||||||
|
As at 31 December
|
8,470 | 7,891 | ||||||
|
|
||||||||
|
The group’s share in investment its associates, all of which are unlisted, is as follows:
|
||
|
Assets and liabilities of associates
|
| Country of | Interest | |||||||||||||||
| Name | incorporation | held | Assets | Liabilities | ||||||||||||
| RMB million | RMB million | |||||||||||||||
|
|
||||||||||||||||
|
Guangdong
Development Bank(“GDB”)
|
PRC | 20 | % | 90,584 | 84,419 | |||||||||||
|
CLP&C
|
PRC | 40 | % | 641 | 357 | |||||||||||
|
|
||||||||||||||||
|
|
||||||||||||||||
|
Total as at 1 January 2008
|
91,225 | 84,776 | ||||||||||||||
|
|
||||||||||||||||
|
|
||||||||||||||||
|
GDB
|
PRC | 20 | % | 112,252 | 105,283 | |||||||||||
|
CLP&C
|
PRC | 40 | % | 3,595 | 2,680 | |||||||||||
|
CIB
|
PRC | 49 | % | 7 | — | |||||||||||
|
|
||||||||||||||||
|
|
||||||||||||||||
|
Total as at 31 December 2008
|
115,854 | 107,963 | ||||||||||||||
|
|
||||||||||||||||
|
|
||||||||||||||||
|
GDB
|
PRC | 20 | % | 136,344 | 128,859 | |||||||||||
|
CLP&C
|
PRC | 40 | % | 4,855 | 3,876 | |||||||||||
|
CIB
|
PRC | 49 | % | 6 | — | |||||||||||
|
|
||||||||||||||||
|
|
||||||||||||||||
|
Total as at 31 December 2009
|
141,205 | 132,735 | ||||||||||||||
|
|
||||||||||||||||
|
Revenues and profit/(loss) of associates
|
| Name | Revenue | Profit/(Loss) | ||||||
| RMB million | RMB million | |||||||
|
|
||||||||
|
GDB
|
3,542 | 559 | ||||||
|
CLP&C
|
1,273 | (615 | ) | |||||
|
CIB
|
— | — | ||||||
|
|
||||||||
|
|
||||||||
|
Total for the year ended
31 December 2008
|
4,815 | (56 | ) | |||||
|
|
||||||||
|
|
||||||||
|
GDB
|
3,023 | 673 | ||||||
|
CLP&C
|
2,946 | 32 | ||||||
|
CIB
|
— | (1 | ) | |||||
|
|
||||||||
|
|
||||||||
|
Total for the year ended
31 December 2009
|
5,969 | 704 | ||||||
|
|
||||||||
F-47
Table of Contents
FOR THE YEAR ENDED 31 DEC 2009
| 8 |
FINANCIAL ASSETS
|
|
| 8.1 |
Held-to-maturity securities
|
| As at 31 | As at 31 | As at 1 | ||||||||||
| December 2009 | December 2008 | January 2008 | ||||||||||
| RMB million | RMB million | RMB million | ||||||||||
|
|
||||||||||||
|
Debt securities
|
||||||||||||
|
Government bonds
|
103,980 | 102,688 | 96,786 | |||||||||
|
Government agency bonds
|
84,619 | 79,400 | 71,273 | |||||||||
|
Corporate bonds
|
3,139 | 3,267 | 3,272 | |||||||||
|
Subordinated bonds/debts
|
43,361 | 26,574 | 24,372 | |||||||||
|
|
||||||||||||
|
|
||||||||||||
|
Total
|
235,099 | 211,929 | 195,703 | |||||||||
|
|
||||||||||||
| As at 31 | As at 31 | As at 1 | ||||||||||
| Debt securities | December 2009 | December 2008 | January 2008 | |||||||||
| - Contractual maturity schedule | RMB million | RMB million | RMB million | |||||||||
|
|
||||||||||||
|
Maturing
|
||||||||||||
|
Within one year
|
5,937 | 24,107 | 2,896 | |||||||||
|
After one year but within five years
|
34,903 | 28,445 | 50,059 | |||||||||
|
After five years but within ten years
|
43,792 | 55,866 | 52,508 | |||||||||
|
After ten years
|
150,467 | 103,511 | 90,240 | |||||||||
|
|
||||||||||||
|
|
||||||||||||
|
Total
|
235,099 | 211,929 | 195,703 | |||||||||
|
|
||||||||||||
| 8.2 |
Loans
|
| As at 31 | As at 31 | As at 1 | ||||||||||
| December 2009 | December 2008 | January 2008 | ||||||||||
| RMB million | RMB million | RMB million | ||||||||||
|
|
||||||||||||
|
Policy loans
|
13,831 | 8,676 | 5,944 | |||||||||
|
Other loans
|
9,250 | 9,250 | 1,200 | |||||||||
|
|
||||||||||||
|
|
||||||||||||
|
Total
|
23,081 | 17,926 | 7,144 | |||||||||
|
|
||||||||||||
| As at 31 | As at 31 | As at 1 | ||||||||||
| December 2009 | December 2008 | January 2008 | ||||||||||
| RMB million | RMB million | RMB million | ||||||||||
|
|
||||||||||||
|
Maturing
|
||||||||||||
|
Within one year
|
13,831 | 8,676 | 5,944 | |||||||||
|
After one year but within five years
|
— | — | — | |||||||||
|
After five years but within ten years
|
1,200 | 1,200 | 1,200 | |||||||||
|
After ten years
|
8,050 | 8,050 | — | |||||||||
|
|
||||||||||||
|
|
||||||||||||
|
Total
|
23,081 | 17,926 | 7,144 | |||||||||
|
|
||||||||||||
F-48
Table of Contents
FOR THE YEAR ENDED 31 DEC 2009
| 8.3 |
Term deposits
|
| As at 31 | As at 31 | As at 1 | ||||||||||
| December 2009 | December 2008 | January 2008 | ||||||||||
| RMB million | RMB million | RMB million | ||||||||||
|
|
||||||||||||
|
Maturing
|
||||||||||||
|
Within one year
|
84,393 | 64,621 | 46,706 | |||||||||
|
After one year but within five years
|
196,090 | 155,320 | 93,372 | |||||||||
|
After five years but within ten years
|
64,500 | 6,759 | 26,434 | |||||||||
|
After ten years
|
— | 1,572 | 2,082 | |||||||||
|
|
||||||||||||
|
|
||||||||||||
|
Total
|
344,983 | 228,272 | 168,594 | |||||||||
|
|
||||||||||||
|
Included in term deposits are structured deposits of RMB 273 million (31 December 2008: RMB 2,905 million; 1 January 2008: 4,346
million). The interest rate on these deposits fluctuates based on changes in interest rate indexes. Structured deposits are stated
at amortised cost.
|
||
| 8.4 |
Statutory deposits-restricted
|
| As at 31 | As at 31 | As at 1 | ||||||||||
| December 2009 | December 2008 | January 2008 | ||||||||||
| RMB million | RMB million | RMB million | ||||||||||
|
|
||||||||||||
|
Contractual maturity schedule
|
||||||||||||
|
Within one year
|
100 | 200 | 5,353 | |||||||||
|
After one year but within five years
|
6,053 | 5,953 | 420 | |||||||||
|
|
||||||||||||
|
|
||||||||||||
|
Total
|
6,153 | 6,153 | 5,773 | |||||||||
|
|
||||||||||||
|
Insurance companies in China are required to deposit an amount equal to 20% of their registered capital with banks designated by
CIRC. These funds may not be used for any purpose, other than to pay off debts during a liquidation proceeding.
|
F-49
Table of Contents
FOR THE YEAR ENDED 31 DEC 2009
| 8 |
FINANCIAL ASSETS (continued)
|
|
| 8.5 |
Available-for-sale securities
|
| As at 31 | As at 31 | As at 1 | ||||||||||
| December 2009 | December 2008 | January 2008 | ||||||||||
| RMB million | RMB million | RMB million | ||||||||||
|
|
||||||||||||
|
Debt securities
|
||||||||||||
|
Government bonds
|
51,996 | 80,006 | 80,588 | |||||||||
|
Government agency bonds
|
165,231 | 191,121 | 107,154 | |||||||||
|
Corporate bonds
|
102,553 | 67,505 | 43,742 | |||||||||
|
Subordinated bonds/debts
|
21,045 | 17,588 | 9,898 | |||||||||
|
|
||||||||||||
|
|
||||||||||||
|
Subtotal
|
340,825 | 356,220 | 241,382 | |||||||||
|
|
||||||||||||
|
|
||||||||||||
|
Equity securities
|
||||||||||||
|
Funds
|
75,798 | 29,890 | 60,624 | |||||||||
|
Common stocks
|
100,876 | 38,829 | 115,509 | |||||||||
|
|
||||||||||||
|
|
||||||||||||
|
Subtotal
|
176,674 | 68,719 | 176,133 | |||||||||
|
|
||||||||||||
|
|
||||||||||||
|
Total
|
517,499 | 424,939 | 417,515 | |||||||||
|
|
||||||||||||
|
|
||||||||||||
|
Debt securities
|
||||||||||||
|
Listed in mainland, PRC
|
28,086 | 29,202 | 31,947 | |||||||||
|
Unlisted
|
312,739 | 327,018 | 209,435 | |||||||||
|
|
||||||||||||
|
|
||||||||||||
|
Subtotal
|
340,825 | 356,220 | 241,382 | |||||||||
|
|
||||||||||||
|
|
||||||||||||
|
Equity securities
|
||||||||||||
|
Listed in Hong Kong, PRC
|
13,570 | 2,398 | 8,464 | |||||||||
|
Listed in mainland, PRC
|
97,803 | 39,311 | 123,810 | |||||||||
|
Unlisted
|
65,301 | 27,010 | 43,859 | |||||||||
|
|
||||||||||||
|
|
||||||||||||
|
Subtotal
|
176,674 | 68,719 | 176,133 | |||||||||
|
|
||||||||||||
|
|
||||||||||||
|
Total
|
517,499 | 424,939 | 417,515 | |||||||||
|
|
||||||||||||
F-50
Table of Contents
FOR THE YEAR ENDED 31 DEC 2009
| 8 |
FINANCIAL ASSETS (continued)
|
|
| 8.5 |
Available-for-sale securities(continued)
|
| As at 31 | As at 31 | As at 1 | ||||||||||
| Debt securities | December 2009 | December 2008 | January 2008 | |||||||||
| - contractual maturity schedule | RMB million | RMB million | RMB million | |||||||||
|
|
||||||||||||
|
Maturing
|
||||||||||||
|
Within one year
|
2,912 | 7,801 | 612 | |||||||||
|
After one year but within five years
|
45,607 | 73,461 | 22,672 | |||||||||
|
After five years but within ten years
|
123,719 | 121,916 | 87,615 | |||||||||
|
After ten years
|
168,587 | 153,042 | 130,483 | |||||||||
|
|
||||||||||||
|
|
||||||||||||
|
Total
|
340,825 | 356,220 | 241,382 | |||||||||
|
|
||||||||||||
F-51
Table of Contents
FOR THE YEAR ENDED 31 DEC 2009
| 8 |
FINANCIAL ASSETS (continued)
|
|
| 8.6 |
Securities at fair value through income
|
| As at 31 | As at 31 | As at 1 | ||||||||||
| December 2009 | December 2008 | January 2008 | ||||||||||
| RMB million | RMB million | RMB million | ||||||||||
|
|
||||||||||||
|
Debt securities
|
||||||||||||
|
Government bonds
|
2,438 | 1,428 | 693 | |||||||||
|
Government agency bonds
|
3,549 | 4,660 | 4,583 | |||||||||
|
Corporate bonds
|
404 | 1,648 | 513 | |||||||||
|
Subordinated bonds/debts
|
— | — | 307 | |||||||||
|
|
||||||||||||
|
|
||||||||||||
|
Subtotal
|
6,391 | 7,736 | 6,096 | |||||||||
|
|
||||||||||||
|
|
||||||||||||
|
Equity securities
|
||||||||||||
|
Funds
|
569 | 4,063 | 9,145 | |||||||||
|
Common stocks
|
2,162 | 2,295 | 9,842 | |||||||||
|
Warrants
|
11 | 5 | 27 | |||||||||
|
|
||||||||||||
|
|
||||||||||||
|
Subtotal
|
2,742 | 6,363 | 19,014 | |||||||||
|
|
||||||||||||
|
|
||||||||||||
|
Total
|
9,133 | 14,099 | 25,110 | |||||||||
|
|
||||||||||||
|
|
||||||||||||
|
Debt securities
|
||||||||||||
|
Listed in mainland, PRC
|
672 | 1,216 | 578 | |||||||||
|
Unlisted
|
5,719 | 6,520 | 5,518 | |||||||||
|
|
||||||||||||
|
|
||||||||||||
|
Subtotal
|
6,391 | 7,736 | 6,096 | |||||||||
|
|
||||||||||||
|
|
||||||||||||
|
Equity securities
|
||||||||||||
|
Listed in Hong Kong, PRC
|
— | 12 | 12 | |||||||||
|
Listed in mainland, PRC
|
2,201 | 2,755 | 10,767 | |||||||||
|
Unlisted
|
541 | 3,596 | 8,235 | |||||||||
|
|
||||||||||||
|
|
||||||||||||
|
Subtotal
|
2,742 | 6,363 | 19,014 | |||||||||
|
|
||||||||||||
|
|
||||||||||||
|
Total
|
9,133 | 14,099 | 25,110 | |||||||||
|
|
||||||||||||
F-52
Table of Contents
FOR THE YEAR ENDED 31 DEC 2009
| 8 |
FINANCIAL ASSETS (continued)
|
|
| 8.7 |
Securities purchased under agreements to resell
|
| As at 31 | As at 31 | As at 1 | ||||||||||
| December 2009 | December 2008 | January 2008 | ||||||||||
| RMB million | RMB million | RMB million | ||||||||||
|
|
||||||||||||
|
Maturing:
|
||||||||||||
|
Within thirty days
|
— | — | 5,053 | |||||||||
|
|
||||||||||||
| 8.8 |
Accrued investment income
|
| As at 31 | As at 31 | As at 1 | ||||||||||
| December 2009 | December 2008 | January 2008 | ||||||||||
| RMB million | RMB million | RMB million | ||||||||||
|
|
||||||||||||
|
Bank deposits
|
5,987 | 4,525 | 3,700 | |||||||||
|
Debt securities
|
8,030 | 8,348 | 6,014 | |||||||||
|
Others
|
191 | 276 | 143 | |||||||||
|
|
||||||||||||
|
|
||||||||||||
|
Total
|
14,208 | 13,149 | 9,857 | |||||||||
|
|
||||||||||||
|
|
||||||||||||
|
Current
|
14,208 | 13,149 | 9,824 | |||||||||
|
Non-current
|
— | — | 33 | |||||||||
|
|
||||||||||||
|
|
||||||||||||
|
Total
|
14,208 | 13,149 | 9,857 | |||||||||
|
|
||||||||||||
F-53
Table of Contents
FOR THE YEAR ENDED 31 DEC 2009
| 9 |
FAIR VALUE OF FINANCIAL ASSETS AND LIABILITIES
|
|
|
The estimates and judgments to determine the fair value of financial assets are described in Note 3.2.
|
||
|
The fair value of investment contracts are determined by using valuation techniques, with consideration of the present value of expected cash flows arising from contracts using
a risk-adjusted discount rate, allowing for risk free rate available on valuation date, the own credit risk and risk margin associated with the future cash flows.
|
||
|
The table below presents the estimated fair value and carrying value of financial assets and liabilities.
|
| Carrying value | Estimated fair value | |||||||||||||||
| As at 31 | As at 31 | As at 31 | As at 31 | |||||||||||||
| December | December | December | December | |||||||||||||
| 2009 | 2008 | 2009 | 2008 | |||||||||||||
| RMB million | RMB million | RMB million | RMB million | |||||||||||||
|
|
||||||||||||||||
|
Held-to-maturity securities
|
235,099 | 211,929 | 235,668 | 228,598 | ||||||||||||
|
Loans
|
23,081 | 17,926 | 23,081 | 17,926 | ||||||||||||
|
Term deposits (excluding
structured deposits)
|
344,710 | 225,367 | 344,710 | 225,367 | ||||||||||||
|
Structured deposits
|
273 | 2,905 | 272 | 2,887 | ||||||||||||
|
Statutory deposits-restricted
|
6,153 | 6,153 | 6,153 | 6,153 | ||||||||||||
|
Available-for-sale securities
|
517,499 | 424,939 | 517,499 | 424,939 | ||||||||||||
|
Securities at fair value
through income
|
9,133 | 14,099 | 9,133 | 14,099 | ||||||||||||
|
Cash and cash equivalents
|
36,197 | 34,085 | 36,197 | 34,085 | ||||||||||||
|
Investment contracts
|
(67,326 | ) | (65,063 | ) | (66,184 | ) | (63,878 | ) | ||||||||
|
Securities sold under
agreements to repurchase
|
(33,553 | ) | (11,390 | ) | (33,553 | ) | (11,390 | ) | ||||||||
| 10 |
PREMIUMS RECEIVABLE
|
|
|
The aging of premiums receivable is within 12 months.
|
||
| 11 |
REINSURANCE ASSETS
|
| As at 31 | As at 31 | As at 1 | ||||||||||
| December 2009 | December 2008 | January 2008 | ||||||||||
| RMB million | RMB million | RMB million | ||||||||||
|
|
||||||||||||
|
Long-term insurance contracts ceded (Note 13)
|
701 | 700 | 658 | |||||||||
|
Due from reinsurance companies
|
17 | 163 | 399 | |||||||||
|
Ceded unearned premiums (Note 13)
|
83 | 58 | 38 | |||||||||
|
Claims recoverable from reinsurers (Note 13)
|
31 | 19 | 16 | |||||||||
|
|
||||||||||||
|
|
||||||||||||
|
Total
|
832 | 940 | 1,111 | |||||||||
|
|
||||||||||||
|
|
||||||||||||
|
Current
|
131 | 240 | 453 | |||||||||
|
Non-current
|
701 | 700 | 658 | |||||||||
|
|
||||||||||||
|
|
||||||||||||
|
Total
|
832 | 940 | 1,111 | |||||||||
|
|
||||||||||||
F-54
Table of Contents
FOR THE YEAR ENDED 31 DEC 2009
| 12 |
OTHER ASSETS
|
| As at 31 | As at 31 | As at 1 | ||||||||||
| December 2009 | December 2008 | January 2008 | ||||||||||
| RMB million | RMB million | RMB million | ||||||||||
|
|
||||||||||||
|
Land use rights
|
3,279 | 2,667 | 2,606 | |||||||||
|
Due from CLIC (Note 28(f))
|
646 | 684 | 739 | |||||||||
|
Deposits on fund units
pending
issuance/receivables on
funds units redeemed
|
300 | — | 500 | |||||||||
|
Advances
|
302 | 273 | 206 | |||||||||
|
Others
|
1,790 | 1,333 | 939 | |||||||||
|
|
||||||||||||
|
|
||||||||||||
|
Total
|
6,317 | 4,957 | 4,990 | |||||||||
|
|
||||||||||||
|
|
||||||||||||
|
Current
|
2,471 | 1,720 | 2,122 | |||||||||
|
Non-current
|
3,846 | 3,237 | 2,868 | |||||||||
|
|
||||||||||||
|
|
||||||||||||
|
Total
|
6,317 | 4,957 | 4,990 | |||||||||
F-55
Table of Contents
FOR THE YEAR ENDED 31 DEC 2009
| 13 |
INSURANCE CONTRACTS
|
| (a) |
Process used to decide on assumptions
|
|
(i) For the insurance contracts of which future returns are affected by the investment yields of corresponding
investment portfolios, investment return assumptions are applied as discount rates to assess the time value impacts on
reserve computation.
|
||
|
In developing discount rate assumptions, the Group considers investment experience, current and future investment
portfolio and trend of the yield curve. The discount rate reflects the future economic outlook as well as the company’s
investment strategy. The assumed discount rate with risk margin for the past two years are as follows:
|
| Discount rate assumptions | ||||
|
|
||||
|
As at 31 December 2008
|
3.50%~5.00 | % | ||
|
As at 31 December 2009
|
4.40%~5.00 | % | ||
|
For the insurance contracts of which the future returns are not affected by the investment yields of the corresponding
investment portfolios, the Group use discount rate assumption to assess the time value impacts based on the “yield curve
of reserve computation benchmark for insurance contracts”, published on “China Bond” website, with the consideration
includes the liquidity spreads, taxation impacts and other relevant factors. The assumed discount rate with risk margin
for the past two years are as follows:
|
| Discount rate assumptions | ||||
|
As at 31 December 2008
|
2.81%~4.95 | % | ||
|
As at 31 December 2009
|
2.69%~5.32 | % | ||
|
The discount rate assumption is affected by certain factors, such as future macro-economy, fiscal policies, capital
market and availability of investment channel of insurance funds. The Group determines discount rate assumption based on
the information obtained at the end of each reporting period including consideration of risk margin.
|
||
|
(ii) The mortality and morbidity assumptions are based on the Group’s historical mortality and morbidity experience. The
assumed mortality rates and morbidity rates are varying by age of the insured and contract type.
|
||
|
The Group bases its mortality assumptions on China Life Insurance Mortality Table (2000-2003), adjusted where
appropriate to reflect the Group’s recent historical mortality experience. The main source of uncertainty with life
insurance contracts is that epidemics and wide-ranging lifestyle changes could result in deterioration in future
mortality experience, thus leading to an inadequate liability. Similarly, continuing advancements in medical care and
social conditions could result in improvements in longevity that exceed those allowed for in the estimates used to
determine the liability for contracts where the Group is exposed to longevity risk.
|
||
|
The Group bases its morbidity assumptions for critical illness products on analysis of historical experience and
expectations of future developments. There are two main sources of uncertainty. First, wide-ranging lifestyle changes
could result in future deterioration in morbidity experience. Second, future development of medical technologies and
improved coverage of medical facilities available to policyholders may bring forward the timing of diagnosing critical
illness, which demands earlier payment of the critical illness benefits. Both could ultimately result in an inadequate
liability if current morbidity assumptions do not properly reflect such secular trends.
|
||
|
Risk margin is considered in the Group’s mortality and morbidity assumptions.
|
F-56
Table of Contents
FOR THE YEAR ENDED 31 DEC 2009
| 13 |
INSURANCE CONTRACTS (continued)
|
|
|
(a)
Process used to decide on assumptions (continued)
|
||
|
(iii) The expense assumption has been based on expected unit costs with the consideration of risk margin. Unit costs
have been based on an analysis of actual experience and expressed on both a per-policy and a percent-of-premium basis.
The Group’s expense assumption is effected by certain factors, such as inflation, market competition and other factors.
The Group determines expense assumption based on the information obtained at the end of each reporting period with the
consideration of risk margin.
|
| Individual Life | Group Life | |||||||||||||||
| RMB Per Policy | % of Premium | RMB Per Policy | % of Premium | |||||||||||||
|
|
||||||||||||||||
|
As at 31 December 2008
|
22.5~33.0 | 1.59%~1.74 | % | 9.7 | 1.54 | % | ||||||||||
|
As at 31 December 2009
|
26.3~38.5 | 1.05%~1.17 | % | 11.3 | 1.01 | % | ||||||||||
|
(iv) The lapse rates and other assumptions are effected by certain factors, such as future macro-economy,
availability of financial substitutions, market competition and other factors, which brings uncertainty
to lapse rate and other assumptions. The lapse rates and other assumptions are determined with reference
to past experience where creditable, current conditions, future expectations and other information
obtained at the end of each reporting period with consideration of risk margin.
|
||
|
The Group did not change its process used to decide on assumptions for the insurance contracts disclosed
in this note.
|
||
|
(b)
Net liabilities of insurance contracts
|
| As at 31 | As at 31 | As at 1 | ||||||||||
| December 2009 | December 2008 | January 2008 | ||||||||||
| RMB million | RMB million | RMB million | ||||||||||
|
|
||||||||||||
|
Gross
|
||||||||||||
|
Long-term insurance contracts
|
809,223 | 654,848 | 520,158 | |||||||||
|
Short term insurance contracts
|
||||||||||||
|
- claims and claim adjustment expenses
|
2,944 | 2,780 | 2,455 | |||||||||
|
- unearned premiums
|
5,997 | 5,237 | 4,894 | |||||||||
|
|
||||||||||||
|
|
||||||||||||
|
Total, gross
|
818,164 | 662,865 | 527,507 | |||||||||
|
|
||||||||||||
|
|
||||||||||||
|
Recoverable from reinsurers
|
||||||||||||
|
Long-term insurance contracts (Note 11)
|
(701 | ) | (700 | ) | (658 | ) | ||||||
|
Short-term insurance contracts
|
||||||||||||
|
- claims and claim adjustment expenses (Note 11)
|
(31 | ) | (19 | ) | (16 | ) | ||||||
|
- unearned premiums (Note 11)
|
(83 | ) | (58 | ) | (38 | ) | ||||||
|
|
||||||||||||
|
|
||||||||||||
|
Total, ceded
|
(815 | ) | (777 | ) | (712 | ) | ||||||
|
|
||||||||||||
|
|
||||||||||||
|
Net
|
||||||||||||
|
Long-term insurance contracts
|
808,522 | 654,148 | 519,500 | |||||||||
|
Short-term insurance contracts
|
||||||||||||
|
- claims and claim adjustment expenses
|
2,913 | 2,761 | 2,439 | |||||||||
|
- unearned premiums
|
5,914 | 5,179 | 4,856 | |||||||||
|
|
||||||||||||
|
|
||||||||||||
|
Total, net
|
817,349 | 662,088 | 526,795 | |||||||||
|
|
||||||||||||
F-57
Table of Contents
FOR THE YEAR ENDED 31 DEC 2009
| 13 |
INSURANCE CONTRACTS (continued)
|
|
|
(c)
Movements in liabilities of short-term insurance contracts
|
||
|
The table below presents movement of reserves of claims and claim adjustment expenses:
|
| 2009 | 2008 | |||||||
| RMB million | RMB million | |||||||
|
|
||||||||
|
- Notified claims
|
352 | 378 | ||||||
|
- Incurred but not reported
|
2,428 | 2,077 | ||||||
|
|
||||||||
|
|
||||||||
|
Total as at 1 January — Gross
|
2,780 | 2,455 | ||||||
|
|
||||||||
|
|
||||||||
|
Cash paid for claims settled in year
|
||||||||
|
- Cash paid for current year claims
|
(5,478 | ) | (5,124 | ) | ||||
|
- Cash paid for prior year claims
|
(2,274 | ) | (2,256 | ) | ||||
|
Claims incurred in year
|
||||||||
|
- Claims arising in current year
|
7,951 | 7,842 | ||||||
|
- Claims arising in prior year
|
(35 | ) | (137 | ) | ||||
|
|
||||||||
|
|
||||||||
|
Total as at 31 December — Gross
|
2,944 | 2,780 | ||||||
|
|
||||||||
|
|
||||||||
|
- Notified claims
|
228 | 352 | ||||||
|
- Incurred but not reported
|
2,716 | 2,428 | ||||||
|
|
||||||||
|
|
||||||||
|
Total as at 31 December — Gross
|
2,944 | 2,780 | ||||||
|
|
||||||||
|
The table below presents movement of unearned premium reserves:
|
| 2009 | 2008 | |||||||||||||||||||||||
| RMB million | RMB million | |||||||||||||||||||||||
| Gross | Ceded | Net | Gross | Ceded | Net | |||||||||||||||||||
|
|
||||||||||||||||||||||||
|
As at 1 January
|
5,237 | (58 | ) | 5,179 | 4,894 | (38 | ) | 4,856 | ||||||||||||||||
|
Increase
|
5,997 | (83 | ) | 5,914 | 5,237 | (58 | ) | 5,179 | ||||||||||||||||
|
Release
|
(5,237 | ) | 58 | (5,179 | ) | (4,894 | ) | 38 | (4,856 | ) | ||||||||||||||
|
|
||||||||||||||||||||||||
|
|
||||||||||||||||||||||||
|
As at 31 December
|
5,997 | (83 | ) | 5,914 | 5,237 | (58 | ) | 5,179 | ||||||||||||||||
|
|
||||||||||||||||||||||||
|
(d)
Movements in liabilities of long-term insurance contracts
|
||
|
The table below presents movement in the liabilities of insurance contracts:
|
| 2009 | 2008 | |||||||||||
| RMB million | RMB million | |||||||||||
|
|
||||||||||||
|
As at 1 January
|
654,848 | 520,158 | ||||||||||
|
|
||||||||||||
|
Premiums
|
261,905 | 252,470 | ||||||||||
|
Release of liabilities
|
(i | ) | (127,472 | ) | (140,281 | ) | ||||||
|
Accretion of interest
|
26,834 | 24,414 | ||||||||||
|
Change in assumptions
|
(8,085 | ) | (3,720 | ) | ||||||||
|
Other movements
|
1,193 | 1,807 | ||||||||||
|
|
||||||||||||
|
|
||||||||||||
|
As at 31 December
|
809,223 | 654,848 | ||||||||||
|
|
||||||||||||
| (i) |
The release of liabilities
mainly consists of payments for death or other
termination and related expenses, release of residual margin
and change of reserves for
claims and claim adjustment expenses.
|
F-58
Table of Contents
FOR THE YEAR ENDED 31 DEC 2009
| 14 |
INVESTMENT CONTRACTS
|
| As at 31 | As at 31 | As at 1 | ||||||||||
| December 2009 | December 2008 | January 2008 | ||||||||||
| RMB million | RMB million | RMB million | ||||||||||
|
|
||||||||||||
|
Investment Contracts with DPF
|
50,219 | 51,676 | 48,961 | |||||||||
|
Investment Contracts without DPF
|
||||||||||||
|
- At amortised cost
|
17,055 | 13,374 | 4,463 | |||||||||
|
- Designated as at fair value through income
|
52 | 13 | — | |||||||||
|
|
||||||||||||
|
|
||||||||||||
|
Total
|
67,326 | 65,063 | 53,424 | |||||||||
|
|
||||||||||||
|
The table below presents movement of investment contracts with DPF
|
| 2009 | 2008 | |||||||
| RMB million | RMB million | |||||||
|
|
||||||||
|
As at 1 January
|
51,676 | 48,961 | ||||||
|
|
||||||||
|
Deposits received
|
10,061 | 19,472 | ||||||
|
Deposits withdrawn and paid on death and other benefits
|
(12,488 | ) | (17,621 | ) | ||||
|
Policy fees deducted from account balances
|
(221 | ) | (356 | ) | ||||
|
Interest credited
|
1,191 | 1,220 | ||||||
|
|
||||||||
|
|
||||||||
|
As at 31 December
|
50,219 | 51,676 | ||||||
|
|
||||||||
F-59
Table of Contents
FOR THE YEAR ENDED 31 DEC 2009
| 15 |
SECURITIES SOLD UNDER AGREEMENTS TO REPURCHASE
|
| As at 31 | As at 31 | As at 1 | ||||||||||
| December 2009 | December 2008 | January 2008 | ||||||||||
| RMB million | RMB million | RMB million | ||||||||||
|
|
||||||||||||
|
Maturing:
|
||||||||||||
|
Within thirty days
|
25,326 | 11,390 | 100 | |||||||||
|
After thirty but within ninety days
|
8,227 | — | — | |||||||||
|
|
||||||||||||
|
|
||||||||||||
|
Total
|
33,553 | 11,390 | 100 | |||||||||
|
|
||||||||||||
|
The carrying values of debt securities pledged as collateral are as follows
|
| As at 31 | As at 31 | As at 1 | ||||||||||
| December 2009 | December 2008 | January 2008 | ||||||||||
| RMB million | RMB million | RMB million | ||||||||||
|
|
||||||||||||
|
Debt securities pledged
|
34,306 | 12,048 | 99 | |||||||||
|
|
||||||||||||
|
|
||||||||||||
|
Total
|
34,306 | 12,048 | 99 | |||||||||
|
|
||||||||||||
F-60
Table of Contents
FOR THE YEAR ENDED 31 DEC 2009
| 16 |
OTHER LIABILITIES
|
| As at 31 | As at 31 | As at 1 | ||||||||||
| December 2009 | December 2008 | January 2008 | ||||||||||
| RMB million | RMB million | RMB million | ||||||||||
|
|
||||||||||||
|
Salary and staff welfare payable
|
2,892 | 2,936 | 1,973 | |||||||||
|
Commission and brokerage payable
|
1,320 | 1,654 | 1,134 | |||||||||
|
Agent deposits
|
659 | 632 | 811 | |||||||||
|
Tax payable
|
356 | 284 | 739 | |||||||||
|
Payable to constructors
|
317 | 308 | 293 | |||||||||
|
Stock
appreciation rights (Note 26)
|
1,555 | 716 | 1,290 | |||||||||
|
Others
|
4,879 | 4,527 | 3,895 | |||||||||
|
|
||||||||||||
|
|
||||||||||||
|
Total
|
11,978 | 11,057 | 10,135 | |||||||||
|
|
||||||||||||
|
|
||||||||||||
|
Current
|
11,978 | 11,057 | 10,135 | |||||||||
|
Non-current
|
— | — | — | |||||||||
|
|
||||||||||||
|
|
||||||||||||
|
Total
|
11,978 | 11,057 | 10,135 | |||||||||
|
|
||||||||||||
|
|
||||||||||||
| 17 |
STATUTORY INSURANCE FUND
|
|
|
As required by CIRC Order [2008] No. 2, all insurance companies have
to pay statutory insurance fund contribution to the CIRC since 1
January 2009. The Group is subject to statutory insurance fund
contribution, (i) at 0.15% and 0.05% of premiums and accumulated
policyholder deposits from life policies with guaranteed benefits and
life policies without guaranteed benefits, respectively. (ii) at 0.8%
and 0.15% of premiums from short-term health policies and long-term
health policies, respectively. (iii) at 0.8% of premiums from accident
insurance contracts, at 0.08% and 0.05% of accumulated policyholder
deposits from accident investment contracts with guaranteed benefits
and without guaranteed benefits, respectively. When the accumulated
statutory insurance fund contributions reach 1% of the Group’s total
assets, no additional contribution to the statutory insurance fund is
required.
|
||
|
For the year ended 31 December 2008, as required by CIRC Order [2004]
No. 16, all insurance companies have to pay statutory insurance fund
contribution to the CIRC. The Group is subject to statutory insurance
fund contribution at 1%, 0.15% and 0.05% of net premium from accident
and short-term health policies, long-term life policies with
guaranteed benefits and long-term health policies and long-term life
policies without guaranteed benefits, respectively. When the
accumulated statutory insurance fund contributions reach 1% of the
Group’s total assets, no additional contribution to the statutory
insurance fund is required.
|
F-61
Table of Contents
FOR THE YEAR ENDED 31 DEC 2009
| 18 |
INVESTMENT INCOME
|
| For the year ended 31 December | ||||||||
| 2009 | 2008 | |||||||
| RMB million | RMB million | |||||||
|
|
||||||||
|
Debt securities
|
23,759 | 22,690 | ||||||
|
|
||||||||
|
— held-to-maturity securities
|
9,882 | 9,245 | ||||||
|
— available-for-sale securities
|
13,580 | 13,074 | ||||||
|
— at fair value through income
|
297 | 371 | ||||||
|
|
||||||||
|
Equity securities
|
3,146 | 10,093 | ||||||
|
|
||||||||
|
— available-for-sale securities
|
3,108 | 9,563 | ||||||
|
— at fair value through income
|
38 | 530 | ||||||
|
|
||||||||
|
Bank deposits
|
10,805 | 11,378 | ||||||
|
Loans
|
1,172 | 696 | ||||||
|
Securities purchased under agreements to resell
|
8 | 89 | ||||||
|
|
||||||||
|
|
||||||||
|
Total
|
38,890 | 44,946 | ||||||
|
|
||||||||
|
Included in investment income is interest income of RMB 35,744 million (2008: RMB 34,853 million)
using the effective interest method.
|
F-62
Table of Contents
FOR THE YEAR ENDED 31 DEC 2009
| 19 |
NET REALISED GAINS/(LOSSES) ON FINANCIAL ASSETS
|
| For the year ended 31 December | ||||||||
| 2009 | 2008 | |||||||
| RMB million | RMB million | |||||||
|
|
||||||||
|
Debt securities
|
||||||||
|
Net realised gains
|
3,146 | 422 | ||||||
|
Impairments
|
200 | 2,023 | ||||||
|
|
||||||||
|
|
||||||||
|
Subtotal
|
3,346 | 2,445 | ||||||
|
|
||||||||
|
|
||||||||
|
Equity securities
|
||||||||
|
Net realised gains
|
20,248 | 7,335 | ||||||
|
Impairments
|
(2,350 | ) | (15,744 | ) | ||||
|
|
||||||||
|
|
||||||||
|
Subtotal
|
17,898 | (8,409 | ) | |||||
|
|
||||||||
|
|
||||||||
|
Total
|
21,244 | (5,964 | ) | |||||
|
|
||||||||
|
Net realised gains/(losses) on financial assets are from available-for-sale securities.
|
||
|
During the year ended 31 December 2009, the Company recognized impairment expense of RMB 2,350
million (2008: RMB 15,744 million) of available-for-sale securities for which the Company
determined that objective impairment evidence of impairment existed.
|
||
|
As at the end of 31 December 2008, the Company held RMB 400 million available-for-sale securities,
entrusted to Minfa, which had been impaired entirely due to Minfa’s bankruptcy. During the year,
Minfa’s bankruptcy administrator according to the Fuzhou Intermediate People’s Court’s final
resolution ([2008] No. 2-7) dated 31 December 2009 granted the Company certain listed shares with
total fair value of RMB 200 million as of 31 December 2009 as a first distribution. Consequently
the Company has reversed RMB 200 million impaired losses. The Company has completed the ownership
registration of these listed shares on 11 January 2010.
|
||
|
During the year ended 31 December 2008, RMB 2,023 million of previously recognized impairment
losses relating to certain available-for-sale debt securities decreased. This decrease related
objectively to certain events occurring after the impairment was recognized and as such the
previously recognized impairment loss was reversed.
|
||
| 20 |
NET FAIR VALUE GAINS/(LOSSES) ON ASSETS AT FAIR VALUE THROUGH INCOME
|
| For the year ended 31 December | ||||||||
| 2009 | 2008 | |||||||
| RMB million | RMB million | |||||||
|
|
||||||||
|
Debt securities
|
(277 | ) | 300 | |||||
|
Equity securities
|
1,726 | (7,494 | ) | |||||
|
|
||||||||
|
|
||||||||
|
Total
|
1,449 | (7,194 | ) | |||||
|
|
||||||||
F-63
Table of Contents
FOR THE YEAR ENDED 31 DEC 2009
| 21 |
INSURANCE BENEFITS AND CLAIMS
|
| Gross | Ceded | Net | ||||||||||
| RMB million | RMB million | RMB million | ||||||||||
|
|
||||||||||||
|
For the year ended 31 December 2009
|
||||||||||||
|
Life insurance death and other benefits
|
74,876 | (18 | ) | 74,858 | ||||||||
|
Accident and health claims and claim
adjustment expenses
|
7,909 | (101 | ) | 7,808 | ||||||||
|
Increase in insurance contracts
|
154,374 | (2 | ) | 154,372 | ||||||||
|
|
||||||||||||
|
|
||||||||||||
|
Total insurance benefits and claims
|
237,159 | (121 | ) | 237,038 | ||||||||
|
|
||||||||||||
|
|
||||||||||||
|
For the year ended 31 December 2008
|
||||||||||||
|
Life insurance death and other benefits
|
89,677 | (18 | ) | 89,659 | ||||||||
|
Accident and health claims and claim
adjustment expenses
|
7,703 | (62 | ) | 7,641 | ||||||||
|
Increase in insurance contracts
|
134,690 | (41 | ) | 134,649 | ||||||||
|
|
||||||||||||
|
|
||||||||||||
|
Total insurance benefits and claims
|
232,070 | (121 | ) | 231,949 | ||||||||
|
|
||||||||||||
| 22 |
INVESTMENT CONTRACT BENEFITS
|
|
Benefits of investment contract are mainly the interest credited to
investment contracts and universal life contracts.
|
||
| 23 |
NET PROFIT BEFORE INCOME TAX EXPENSES
|
|
|
Net profit before income tax expenses is stated after charging the following:
|
| For the year ended 31 December | ||||||||
| 2009 | 2008 | |||||||
| RMB million | RMB million | |||||||
|
|
||||||||
|
Employee salary and welfare cost
|
7,773 | 5,089 | ||||||
|
Housing benefits
|
472 | 336 | ||||||
|
Contribution to the defined contribution pension plan
|
1,182 | 873 | ||||||
|
Depreciation and amortisation
|
1,560 | 1,358 | ||||||
|
Interest expenses on securities sold under the
agreements to repurchase
|
111 | 438 | ||||||
|
Exchange loss
|
28 | 907 | ||||||
F-64
Table of Contents
FOR THE YEAR ENDED 31 DEC 2009
| 24 |
TAXATION
|
|
|
Deferred income tax assets and liabilities are offset when there is a legally enforceable right to offset
current tax assets against current tax liabilities and when the deferred income tax relate to the same fiscal
authority.
|
||
| (a) |
The amount of taxation charged to the net profit represents
|
| For the year ended 31 December | ||||||||
| 2009 | 2008 | |||||||
| RMB million | RMB million | |||||||
|
|
||||||||
|
Current taxation — Enterprise income tax
|
6,299 | 2,078 | ||||||
|
Deferred taxation
|
2,410 | (1,393 | ) | |||||
|
|
||||||||
|
|
||||||||
|
Taxation charges
|
8,709 | 685 | ||||||
|
|
||||||||
| (b) |
The reconciliation between the Group’s effective tax rate and the statutory tax rate of 25% in the PRC (for the
year ended 31 December 2008: 25%) is as follows:
|
| For the year ended 31 December | ||||||||||||
| 2009 | 2008 | |||||||||||
| RMB million | RMB million | |||||||||||
|
|
||||||||||||
|
Net profit before income tax expenses
|
41,745 | 19,959 | ||||||||||
|
|
||||||||||||
|
Tax computed at the statutory tax rate
|
10,436 | 4,990 | ||||||||||
|
Non-taxable income
|
(i | ) | (2,627 | ) | (4,524 | ) | ||||||
|
Additional tax liability from expenses
not deductible for tax purposes
|
(i | ) | 520 | 196 | ||||||||
|
Unused tax losses
|
25 | 23 | ||||||||||
|
Other
|
355 | — | ||||||||||
|
|
||||||||||||
|
|
||||||||||||
|
Income taxes at effective tax rate
|
8,709 | 685 | ||||||||||
|
|
||||||||||||
| (i) |
Non-taxable income mainly includes interest income from government bonds and fund distribution. Expenses not
deductible for tax purposes mainly include commission, brokerage and donation expenses in excess of deductible
amounts as allowed by relevant tax regulations.
|
F-65
Table of Contents
FOR THE YEAR ENDED 31 DEC 2009
| 24 |
TAXATION (continued)
|
|
| (c) |
The movement in deferred tax assets and liabilities during the year is as follows:
|
|
|
As at 31 December 2009, deferred income taxation is calculated in full on temporary differences under the liability method using a principal taxation rate of
25%.
|
||
|
Deferred tax
|
| Insurance | Investment | Others | Total | |||||||||||||
| RMB | RMB | RMB | RMB | |||||||||||||
| million | million | million | million | |||||||||||||
|
|
(i) | (ii) | (iii) | |||||||||||||
|
|
||||||||||||||||
|
As at 1 January 2008
|
(2,372 | ) | (20,625 | ) | — | (22,997 | ) | |||||||||
|
(Charged) / credited to net profit
|
(4,154 | ) | 4,966 | 581 | 1,393 | |||||||||||
|
(Charged) / credited to other
comprehensive income
|
(2,926 | ) | 14,186 | — | 11,260 | |||||||||||
|
|
||||||||||||||||
|
- Available-for-sale securities
|
— | 14,186 | — | 14,186 | ||||||||||||
|
- Others
|
(2,926 | ) | — | — | (2,926 | ) | ||||||||||
|
|
||||||||||||||||
|
|
||||||||||||||||
|
As at 31 December 2008
|
(9,452 | ) | (1,473 | ) | 581 | (10,344 | ) | |||||||||
|
|
||||||||||||||||
|
|
||||||||||||||||
|
As at 1 January 2009
|
(9,452 | ) | (1,473 | ) | 581 | (10,344 | ) | |||||||||
|
(Charged) / credited to net profit
|
(79 | ) | (2,404 | ) | 73 | (2,410 | ) | |||||||||
|
(Charged) / credited to other
comprehensive income
|
1,000 | (4,607 | ) | — | (3,607 | ) | ||||||||||
|
|
||||||||||||||||
|
- Available-for-sale securities
|
— | (4,607 | ) | — | (4,607 | ) | ||||||||||
|
- Others
|
1,000 | — | — | 1,000 | ||||||||||||
|
|
||||||||||||||||
|
|
||||||||||||||||
|
As at 31 December 2009
|
(8,531 | ) | (8,484 | ) | 654 | (16,361 | ) | |||||||||
|
|
||||||||||||||||
| (i) |
The deferred tax arising from the insurance is mainly related to the temporary difference of short duration insurance contracts liabilities, policyholder
dividend payables and impacts of adoption of MoF new guidance as disclosed in Note 2.1;
|
|
| (iii) |
The deferred tax arising from the investments is mainly related to the temporary difference of unrealised gains/(losses) of available-for-sale securities
and securities at fair value through income;
|
|
| (iv) |
The deferred tax arising from others is mainly related to the temporary difference of employee salary and welfare cost payables.
|
F-66
Table of Contents
FOR THE YEAR ENDED 31 DEC 2009
| 24 |
TAXATION (continued)
|
|
| (c) |
The movement in deferred tax assets and liabilities during the year is as follows (continued):
|
| As at 31 | As at 31 | As at 1 | ||||||||||
| December 2009 | December 2008 | January 2008 | ||||||||||
| RMB million | RMB million | RMB million | ||||||||||
|
|
||||||||||||
|
Deferred tax assets:
|
||||||||||||
|
- deferred tax assets to be recovered after more than 12
months
|
6,063 | 7,115 | 7,276 | |||||||||
|
- deferred tax assets to be recovered within 12 months
|
592 | 540 | 1,046 | |||||||||
|
|
||||||||||||
|
|
||||||||||||
|
Subtotal
|
6,655 | 7,655 | 8,322 | |||||||||
|
|
||||||||||||
|
|
||||||||||||
|
Deferred tax liabilities:
|
||||||||||||
|
- deferred tax liabilities to be settled after more than 12
months
|
(22,668 | ) | (17,651 | ) | (31,023 | ) | ||||||
|
- deferred tax liabilities to be settled within 12 months
|
(348 | ) | (348 | ) | (296 | ) | ||||||
|
|
||||||||||||
|
|
||||||||||||
|
Subtotal
|
(23,016 | ) | (17,999 | ) | (31,319 | ) | ||||||
|
|
||||||||||||
|
|
||||||||||||
|
Total net deferred income tax liabilities
|
(16,361 | ) | (10,344 | ) | (22,997 | ) | ||||||
|
|
||||||||||||
| 25 |
EARNINGS PER SHARE
|
|
|
There is no difference between basic and diluted earnings per share.
The basic and diluted earnings per share for the year ended 31
December 2009 are based on the weighted average number of
28,264,705,000 ordinary shares (for the year ended 31 December 2008:
28,264,705,000).
|
F-67
Table of Contents
FOR THE YEAR ENDED 31 DEC 2009
| 26 |
STOCK APPRECIATION RIGHTS
|
|
|
Stock appreciation rights have been awarded in units, with each unit
representing the value of one H share. No shares of common stock will
be issued under the stock appreciation rights plan. According to the
Company’s plan, all stock appreciation rights will have an exercise
period of five years from date of award and will not be exercisable
before the fourth anniversary of the date of award unless specified
market or other conditions have been met. The exercise price of stock
appreciation rights will be the average closing price of the shares in
the five trading days prior to the date of the award. Upon the
exercise of stock appreciation rights, exercising recipients will
receive payments in RMB, subject to any withholding tax, equal to the
number of stock appreciation rights exercised times the difference
between the exercise price and market price of the H shares at the
time of exercise.
|
||
|
The Board of Directors of the Company approved, on 5 January 2006, an
award of stock appreciation rights of 4.05 million units and on 21
August 2006, another award of stock appreciation rights of 53.22
million units to eligible employees. The exercise prices of the two
awards were HK$5.33 and HK$6.83, respectively, the average closing
price of shares in the five trading days prior to 1 July 2005 and 1
January 2006, the dates for vesting and exercise price setting
purposes of this award. No stock appreciation right was exercised,
forfeited or expired in 2009. As at 31 December 2009, there are 55.71
million units outstanding (as at 31 December 2008: 55.71 million) and
55.71 million units exercisable (as at 31 December 2008: 55.71
million). As at 31 December 2009, the amount of intrinsic value for
the vested stock appreciation rights is RMB 1,551 million (as at 31
December 2008: RMB 826 million).
|
||
|
The fair value of the stock appreciation rights is estimated on the
date of valuation using lattice-based option valuation models based on
expected volatility from 60% to 70%, an expected dividend yield of no
higher than 0.5% and risk-free interest rate from 0.2% to 0.3%.
|
||
|
As at 31 December 2009, the Company charged compensation cost of RMB
839 million (as at 31 December 2008: reversed RMB 574 million) which
was included in net profit. RMB 1,542 million and RMB 13 million were
included in Salary and staff welfare payable for the units not
exercised and exercised but not paid as at 31 December 2009 (as at 31
December 2008: RMB 703 million and RMB 13 million respectively).
|
||
| 27 |
DIVIDENDS
|
|
|
Pursuant to the shareholders’ approval at the Annual General Meeting
in May 2009, a final dividend of RMB 0.23 per ordinary share totalling
RMB 6,501 million in respect of the year ended 31 December 2008 was
declared and was paid in 2009. These dividends have been recorded in
the consolidated financial statements for the year ended 31 December
2009.
|
||
|
Pursuant to a resolution passed at the meeting of the Board of
Directors on 7 April 2010, a final dividend of RMB 0.70 per ordinary
share totalling approximately RMB 19,785 million for the year ended 31
December 2009 was proposed for shareholders’ approval at the Annual
General Meeting. The dividend has not been provided in the
consolidated financial statements for the year ended 31 December 2009.
|
F-68
Table of Contents
FOR THE YEAR ENDED 31 DEC 2009
| 28 |
SIGNIFICANT RELATED PARTY TRANSACTIONS
|
|
| (a) |
Related parties where control exists
|
|
|
The information of parent company is as follows:
|
| Location of | Relationship with | Nature of | Legal | |||||||
| Name | registration | Principal business | the company | economic | Representative | |||||
|
|
||||||||||
|
CLIC
|
Beijing, China | Life insurance, health and accident insurance and other types of personal insurance and reinsurance. Funds management business under permission of national laws and regulations or State Council of the People’s Republic of China. Various types of personal insurance, Consulting and agency services. Other business under approvals by National Insurance Supervisors department’s | Immediate and ultimate holding company | State owned | Chao Yang |
| (b) |
Registered capital and changes for related parties where control exists
|
| As at 31 December 2008 | Increase | Decrease | As at 31 December 2009 | |||||||||||||
| Name of related party | RMB million | RMB million | RMB million | RMB million | ||||||||||||
|
|
||||||||||||||||
|
CLIC
|
4,600 | — | — | 4,600 | ||||||||||||
|
China Life Asset Management
Company Limited (“AMC”)
|
1,000 | 2,000 | — | 3,000 | ||||||||||||
|
China Life Pension Company
Limited (“Pension Company”)
|
2,500 | — | — | 2,500 | ||||||||||||
|
China Life Franklin Asset
Management Co, Limited (“AMC
HK”)
|
HKD 60 million | — | — | HKD 60 million | ||||||||||||
| Note: |
In February 2009, the Company, AMC and CLIC entered into an agreement, whereby AMC’s registered capital increased to RMB 2,000 million. The Company subscribed for RMB 1,200
million, in the form of RMB 1,080 million cash and RMB 120 million retained earnings. CLIC subscribed for RMB 800 million, in the form of RMB 720 million cash and RMB 80 million
retained earnings. CIRC approved the change of registered capital in April 2009.
|
|
| (c) |
Shares held and the changes for related parties where control exists
|
| As at 31 December 2008 | As at 31 December 2009 | |||||||||||||||||||||||
| Amount | Percentage of | Increase | Decrease | Amount | Percentage of | |||||||||||||||||||
| Shareholder | RMB million | holding | RMB million | RMB million | RMB million | holding | ||||||||||||||||||
|
|
||||||||||||||||||||||||
|
CLIC
|
19,324 | 68.40 | % | — | — | 19,324 | 68.40 | % | ||||||||||||||||
|
|
||||||||||||||||||||||||
| As at 31 December 2008 | As at 31 December 2009 | |||||||||||||||||||||||
| Amount | Percentage of | Increase | Decrease | Amount | Percentage of | |||||||||||||||||||
| Subsidiaries | RMB million | holding | RMB million | RMB million | RMB million | holding | ||||||||||||||||||
|
|
||||||||||||||||||||||||
|
AMC
|
600 | 60.00 | % | 1,080 | — | 1,680 | 60.00 | % | ||||||||||||||||
|
Pension
Company
|
2,305 | 92.20 | % | — | — | 2,305 | 92.20 | % | ||||||||||||||||
|
AMC HK
|
HK$30 million | 50.00 | % | — | — | HK$30 million | 50.00 | % | ||||||||||||||||
|
|
||||||||||||||||||||||||
F-69
Table of Contents
FOR THE YEAR ENDED 31 DEC 2009
| 28 |
SIGNIFICANT RELATED PARTY TRANSACTIONS (continued)
|
| (d) |
Related parties
|
|
|
Related parties are those parties which have the ability, directly or indirectly, to control the
other party or exercise significant influence over the other party in making financial and
operating decisions. Parties are also considered to be related if they are subject to common
control or common significant influence. The table set forth below summarises the names of
significant related parties and nature of relationship with the Company as at 31 December 2009:
|
| Significant related party | Relationship with the Company | |
|
|
||
|
CLIC
|
The ultimate holding company | |
|
AMC
|
A subsidiary of the Company | |
|
GDB
|
An associate of the Company | |
|
CLP&C
|
An associate of the Company and under common control of the ultimate holding company | |
|
Pension Company
|
A subsidiary of the Company | |
|
China Life Real Estate Co., Limited
(“CLRE”, former Beijing Zhongbaoxin Real
Estate Development Co., Limited)
|
A subsidiary of a subsidiary of the ultimate holding company | |
|
China Life Insurance (Overseas) Co.,
Limited (“China Life Overseas”)
|
Under common control of the ultimate holding company | |
|
AMC HK
|
A subsidiary of a subsidiary of the Company | |
|
CIB
|
An associate of the Company | |
|
China Life Investment Holding Company
Limited (“IHC”)
|
Under common control of the ultimate holding company | |
|
Chengdu Insurance Institution
|
Under common control of the ultimate holding company | |
|
China Life Enterprise Annuity Fund (“EAP”)
|
A pension fund operated for the benefit of employees in the Company and AMC |
| Note: |
In July 2009, CLIC, the Company and the AMC entered into an agreement, whereby they agreed to
establish a defined contribution enterprise annuity fund for their employees.
|
F-70
Table of Contents
FOR THE YEAR ENDED 31 DEC 2009
| 28 |
SIGNIFICANT RELATED PARTY TRANSACTIONS (continued)
|
|
| (e) |
Transactions with significant related parties
|
|
|
The following table summarises significant transactions carried out by the Group with its significant related parties for the year ended
31 December 2009.
|
| For the year ended 31 December | |||||||||||||
| 2009 | 2008 | ||||||||||||
| Note | RMB million | RMB million | |||||||||||
|
Transactions with CLIC and its subsidiaries
|
|||||||||||||
|
Policy management fee income earned from CLIC
|
(i | ) | 1,193 | 1,298 | |||||||||
|
Asset management fee earned from CLIC
|
(ii | ) | 112 | 243 | |||||||||
|
Additional capital contribution to AMC from CLIC
|
720 | — | |||||||||||
|
Rewards from CLIC for non-transferred policies
|
(iii | ) | — | 88 | |||||||||
|
Dividends to CLIC
|
4,444 | 8,116 | |||||||||||
|
Property leasing expense charged by CLIC
|
(iv | ) | — | 33 | |||||||||
|
Dividends to CLIC from AMC
|
104 | 93 | |||||||||||
|
Non-performing assets management fee earned from CLIC and others
|
— | 16 | |||||||||||
|
Asset management fee earned from China Life Overseas
|
(ii | ) | 15 | 15 | |||||||||
|
Asset management fee earned from CLP&C
|
(ii | ) | 3 | 2 | |||||||||
|
Property insurance payments to CLP&C
|
37 | 29 | |||||||||||
|
Claim payment and others to the Company from CLP&C
|
41 | 46 | |||||||||||
|
Brokerage fee from CLP&C
|
(v | ) | 129 | 79 | |||||||||
|
Additional capital contribution to CLP&C
|
(vi | ) | — | 1,200 | |||||||||
|
Rentals and policy management fee income earned from CLP&C
|
36 | — | |||||||||||
|
Rentals, project payments and others to CLRE
|
(vii | ) | 8 | 18 | |||||||||
|
Property leasing expense charged by IHC
|
(iv | ) | 64 | 33 | |||||||||
|
Asset management fee earned from IHC
|
7 | 21 | |||||||||||
|
Services fee and other income earned from IHC
|
30 | — | |||||||||||
|
Asset purchase payments to Chengdu Insurance Institution
|
19 | — | |||||||||||
|
Transaction with GDB
|
|||||||||||||
|
Interest income earned from GDB
|
309 | 361 | |||||||||||
|
Brokerage fee charged by GDB
|
(viii | ) | 20 | 25 | |||||||||
|
Dividends from GDB
|
55 | — | |||||||||||
|
Transaction with EAP
|
|||||||||||||
|
Payment to EAP
|
298 | — | |||||||||||
|
Transaction with AMC
|
|||||||||||||
|
Asset management fee expense charged to the Company
by AMC
|
(ii | ) | 540 | 362 | |||||||||
|
Dividends to the Company
|
156 | 140 | |||||||||||
|
Payments of insurance policies by AMC to the Company
|
1 | 1 | |||||||||||
|
Brokerage fee to the Company
|
(ix | ) | 5 | 1 | |||||||||
|
Additional capital contribution to AMC
|
1,080 | — | |||||||||||
|
Transaction with Pension Company
|
|||||||||||||
|
Additional capital contribution to Pension Company
|
(x | ) | — | 1,855 | |||||||||
|
Surcharge on building sold to Pension Company
|
(xi | ) | 244 | — | |||||||||
|
Expenses paid on behalf of Pension Company
|
86 | 79 | |||||||||||
|
IT services fee income earned from Pension Company
|
2 | — | |||||||||||
|
Investment brokerage fee charged by the Company
|
2 | — | |||||||||||
|
Brokerage fee to the Company
|
(ix | ) | 3 | 1 | |||||||||
|
Transaction with AMC HK
|
|||||||||||||
|
Investment management fee expense charged to the Company
by AMC HK
|
(ii | ) | 8 | 7 | |||||||||
F-71
Table of Contents
FOR THE YEAR ENDED 31 DEC 2009
| 28 |
SIGNIFICANT RELATED PARTY TRANSACTIONS (continued)
|
|
| (e) |
Transactions with significant related parties (continued)
|
|
|
Note:
|
||
| (i) |
As part of the restructuring, CLIC transferred its entire branch
services network to the Company. CLIC and the Company have entered
into an agreement on 24 December 2005 to engage the Company to provide
policy administration services to CLIC relating to the non-transferred
policies. The Company, as a service provider, does not acquire any
rights or assume any obligations as an insurer under the
non-transferred policies. In consideration of the services provided
under the agreement, CLIC will pay the Company a policy management fee
based on the estimated cost of providing the services, to which a
profit margin is added. The policy management fee is equal to, for
each semi-annual payment period, the sum of (1) the number of
non-transferred policies in force that were within their policy term
as at the last day of the period, multiplied by RMB8.00 per policy and
(2) 2.50% of the actual premiums and deposits in respect of such
policies collected during the period. The agreement would be
automatically renewed for a three year term subject to compliance with
the Stock Exchange regulations unless a written notice of non renewal
is issued by the Company or the Group 180 days prior to the expiration
of the contract or the renewed term. The Company and the Group could
modify term of policy management fee based on the current market terms
when renewing the contract. Otherwise, the original fee term would
apply. On 30 December 2008, the Company and CLIC signed a renewal
agreement to extend the contract signed on 24 December 2005 to 31
December 2011, with all the terms unchanged. The policy management fee
income is included in other income in consolidated statement of
comprehensive income statement.
|
|
| (ii) |
In December 2005, CLIC and the AMC have entered into an
agreement, whereby CLIC agreed to pay the AMC a service fee at the
rate of 0.05% per annum. The service fee was calculated and payable on
a monthly basis, by multiplying the average of balance of book value
of the assets under management (after deducting the funds obtained and
interests accrued from repurchase transactions) at the beginning and
at the end of any given month by the rate of 0.05%, divided by 12.
Such rate was determined with reference to the applicable management
fee rate pre-determined for each specified category of assets managed
by the AMC to arrive at a comprehensive service fee rate. On 30
December 2008, CLIC and AMC signed a renewal agreement, which expanded
the effective period of the original agreement to 31 December 2011.
The service fee is calculated in the same way of original agreement
and would be adjusted according to the performance.
|
|
|
In December 2005, the Company and the AMC have entered into a separate
agreement, whereby the Company agreed to pay the AMC a fixed service
fee and a variable service fee. The fixed service fee is payable
monthly and is calculated with reference to the net asset value of the
assets in each specified category managed by the AMC and the
applicable management fee rates pre-determined by the parties on an
arm’s length basis. The variable service fee equals to 10% of the
fixed service fee per annum payable annually. The service fees were
determined by the Company and the AMC based on an analysis of the cost
of service, market practice and the size and composition of the asset
pool to be managed. On 30 December 2008, the Company and AMC signed a
renewal agreement, which expanded the effective period of the original
agreement to 31 December 2010. The variable service fee changes to 20%
of the fixed service fee per annum payable annually and is adjusted
according to the performance.
|
||
|
In March 2007, CLP&C and the AMC have entered into an agreement,
whereby CLP&C agreed to pay the AMC a fixed service fee and a variable
service fee. The agreement expired in December 2008. In 2009, CLP&C
and the AMC signed a new agreement, with effective period to 31
December 2010. The agreement is subject to an automatic renewal for
one year if there is no objection between both parities when expired.
According to the agreement, the fixed service fee is payable monthly
and the service fee is calculated and payable on a monthly basis, by
multiplying the average of balance of book value of the assets under
management at the beginning and at the end of any given month by the
rate of 0.05%, divided by 12. The variable service fee is adjusted
according to the investment performance.
|
||
|
In September 2007, China Life Overseas and the AMC HK have entered
into an agreement, whereby China Life Overseas agreed to pay the AMC
HK a management service fee at a basis rate and calculated based on
actual net investment return yield. In 2009, China Life Overseas and
the AMC HK signed a renewal agreement, which expanded the effective
period of the original agreement to 31 December 2009.
|
||
F-72
Table of Contents
FOR THE YEAR ENDED 31 DEC 2009
| 28 |
SIGNIFICANT RELATED PARTY TRANSACTIONS (continued)
|
|
| (e) |
Transactions with significant related parties (continued)
|
|
|
Note: (continued)
|
||
|
In April 2007, Pension Company and the AMC have entered into an
agreement, whereby Pension Company agreed to pay the AMC a fixed
service fee and a bonus for excess return per annum. The agreement
expired in December 2008. In 2009, Pension Company and AMC signed a
new agreement with effective period to 31 December 2009. The agreement
is subject to an automatic renewal for one year if there is no
objection between both parties when expired. According to the
agreement, the fixed service fee is calculated and payable on a
monthly basis, by multiplying the average of balance of book value of
the assets under management at the beginning and at the end of any
given month by the rate of 0.05%, divided by 12. The bonus equals to
10% of the excess return per annum payable annually.
|
||
|
In May 2008, the Company and the AMC HK have entered into a “Offshore
Investment Management Service Agreement for Entrusted Fund”, whereby the
Company agreed to pay AMC HK Primary and Secondary Market asset management fee.
The fixed asset management fee is calculated on a monthly basis, and paid
quarterly. Asset management fee for the Primary market is calculated on a rate
of 2% of the total investment realised gains. Asset management fee for the
Secondary market is calculated by a fixed rate of 0.45%.
|
||
|
The asset management fee charged to the Company and Pension Company by AMC and
AMC HK is eliminated in the consolidated statement of comprehensive income
statement.
|
||
| (iii) |
The Company assisted CLIC to mitigate business risk arising from
non-transferred policies, and received in 2008 a fee income of RMB 88 million
from CLIC as the reward for such non-transferrable policies.
|
|
| (iv) |
In January 2007, the Company has entered into a property leasing agreement
with CLIC, pursuant to which CLIC agreed to lease to the Company some of its
owned and leased buildings. The annual rent payable by the Company to CLIC in
relation to the CLIC owned properties is determined by reference to market rent
or, the costs incurred by CLIC in holding and maintaining the properties, plus
a margin of approximately 5%. The annual rent payable by the Company to CLIC in
relation to the CLIC leased properties is determined by reference to the rent
payable under the head lease plus the actual costs incurred by CLIC arising in
connection with the subletting of the properties. The Company has directly paid
the relevant rental expenses raised from CLIC leased properties to the
third-party instead of CLIC. The rental was payed on a semi annual basis and
the rent of the buildings subleased by CLIC was payed directly to the owner.
The agreement will expire on December 2009.
|
|
|
In November 2008, the Company, CLIC and IHC entered into a property leasing
transfer agreement. According to the agreement, CLIC has effectively
transferred the rights and obligations of the property leasing agreement to IHC
in June 2008. Apart from the transfer of the rights and obligations, the terms
of the original property leasing agreement remains unchanged.
|
||
| (v) |
In November 2008, the Company and CLP&C entered into an agreement, whereby
CLP&C entrusted the Company to act as an agent to sell appointed insurance
products in authorized areas. The service fee is determined according to cost
(tax included) added marginal profit.
|
|
| (vi) |
In May 2008, the Company and CLP&C entered into an agreement, whereby
CLP&C’s share capital would increase to RMB3,000 million, of which the Company
subscribed for RMB1,200 million. The subscription has been paid on 26 May,
2008. CIRC approved the change of registered capital of CLP&C on 6 July, 2008.
|
|
| (vii) |
The Group made certain project payments to third parties through CLRE and
paid other miscellaneous expenditures mainly comprised of rentals and deposits
to CLRE.
|
F-73
Table of Contents
FOR THE YEAR ENDED 31 DEC 2009
| 28 |
SIGNIFICANT RELATED PARTY TRANSACTIONS (continued)
|
| (e) |
Transactions with significant related parties (continued)
|
|
|
Note: (continued)
|
||
| (viii) |
In April 2007, the Company and GDB entered into a five year
individual bank insurance agency agreement. All insurance products
suitable for delivery through bank channels are involved in the
agreement. GDB will provide services, including selling insurance
products, receiving premiums, paying benefits. The company has agreed
to pay commission fees as follows: 1) A monthly service fee,
calculated on a monthly basis, by multiplying total premium received
and a fixed commission rate; or 2) A monthly commission fee,
calculated on a monthly basis, by multiplying number of policy being
handled and fixed commission rate which is not more than RMB1 per
policy, where GDB handles premiums receipts and benefits payments. The
agreement will expire in five years.
|
|
| (ix) |
In November 2007, the Company and Pension Company entered into an agreement, whereby
Pension Company entrusted the Company to sale enterprise annuity funds and provide customer
service. The service fee is calculated on a rate of 80% of first year management fee. The
agreement term is one year and is subject to an automatic renewal for one year.
|
|
|
In June 2007, the Company and AMC entered into an agreement, whereby AMC entrusted the
Company to provide market developing service and enterprise annuity asset management
service. The service fee is calculated by the first year actual asset management fee
collected deducted by risk reserve and other related fees. The agreement expired on 31
December 2008.
|
||
| (x) |
In June 2008, the Company and China Credit Trust Co., Ltd (“CCTIC”) made capital
injection to Pension Company. Pension Company’s share capital was increased to RMB 2,500
million after the capital contribution. As a result, the ownership percentage of the
Company, CLIC, AMC and CCTIC was 87.4%, 6.0%, 4.8% and 1.8%, respectively.
|
|
| (xi) |
The Company sold certain floors of the office building which is under construction to
Pension Company. The Company received the payment from Pension Company in Feb 2009.
|
|
| (f) |
Amounts due from / to significant related parties
|
|
|
The following table summarises the resulting balance due from and to significant related
parties. The balance is non-interest bearing, unsecured and has no fixed repayment terms
except for the deposits in GDB.
|
| As at 31 December 2009 | As at 31 December 2008 | |||||||
| RMB million | RMB million | |||||||
|
The Group
|
||||||||
|
Amount due from CLIC (Note 12)
|
646 | 684 | ||||||
|
Amount due from China Life Overseas
|
15 | 8 | ||||||
|
Amount due from CLP&C
|
22 | 2 | ||||||
|
Amount due to CLP&C
|
(2 | ) | (28 | ) | ||||
|
Amount deposited with GDB
|
7,098 | 7,114 | ||||||
|
Amount due from CLRE
|
— | 1 | ||||||
|
Amount due to CLRE
|
— | (8 | ) | |||||
|
Amount due from IHC
|
34 | 21 | ||||||
|
Amount due to IHC
|
(64 | ) | (33 | ) | ||||
|
The Company
|
||||||||
|
Amount due from Pension Company
|
56 | 66 | ||||||
|
Amount due to AMC
|
(43 | ) | (68 | ) | ||||
|
Amount due to AMC HK
|
(1 | ) | (2 | ) | ||||
F-74
Table of Contents
FOR THE YEAR ENDED 31 DEC 2009
| 28 |
SIGNIFICANT RELATED PARTY TRANSACTIONS (continued)
|
|
| (g) |
Key management compensation
|
| For the year ended 31 December | ||||||||
| 2009 | 2008 | |||||||
| RMB million | RMB million | |||||||
|
|
||||||||
|
Salaries and other short-term employee benefits
|
13 | 24 | ||||||
|
Termination benefits
|
— | — | ||||||
|
Post-employment benefits
|
— | — | ||||||
|
Share-based payment
|
— | — | ||||||
|
Other long-term benefits
|
— | — | ||||||
|
|
||||||||
|
|
||||||||
|
Total
|
13 | 24 | ||||||
|
|
||||||||
| (h) |
Transactions with state-owned enterprises
|
|
|
Under IAS 24(amendment), business transactions between state-owned enterprises controlled by the
PRC government are within the scope of related party transactions. CLIC, the ultimate holding
company of the Group, is a state-owned enterprise. The Group’s key business and therefore the
business transactions with other state-owned enterprises are primarily related to insurance and
investment activities. The related party transactions with other state-owned enterprises were
conducted in the ordinary course of business. Due to the complex ownership structure, the PRC
government may hold indirect interests in many companies. Some of these interests may, in
themselves or when combined with other indirect interests, be controlling interests which may not
be known to the Group. Nevertheless, the Group believes that the following captures the material
related parties and applied IAS 24 (amendment) exemption to disclose only qualitative information.
|
||
|
As at 31 December 2009 and 2008, most of bank deposits were with state-owned banks; the issuers of
corporate bonds and subordinated bonds held by the Group were mainly state-owned enterprises. For
the year ended 31 December 2008, a large portion of its group insurance business of the Group were
with state-owned enterprises; the majority of bank assurance brokerage charges were paid to
state-owned banks and post office; almost all of the reinsurance agreements of the Group are
entered into with a state-owned reinsurance company; most of bank deposit interest income were
from state-owned banks.
|
| 29 |
SHARE CAPITAL
|
| As at 31 | As at 31 | As at 1 | ||||||||||||||||||||||
| December 2009 | December 2008 | January 2008 | ||||||||||||||||||||||
| No. of shares | RMB million | No. of shares | RMB million | No. of shares | RMB million | |||||||||||||||||||
|
|
||||||||||||||||||||||||
|
Registered,
authorized, issued
and fully paid
|
||||||||||||||||||||||||
|
Ordinary shares of
RMB1 each
|
28,264,705,000 | 28,265 | 28,264,705,000 | 28,265 | 28,264,705,000 | 28,265 | ||||||||||||||||||
|
|
||||||||||||||||||||||||
|
As at 31 December 2009, the Company’s share capital is as follows:
|
| As at 31 December 2009 | ||||||||
| No. of shares | RMB million | |||||||
|
|
||||||||
|
Owned by CLIC (Note 33(i))
|
19,323,530,000 | 19,324 | ||||||
|
Owned by other shareholders
|
8,941,175,000 | 8,941 | ||||||
|
|
||||||||
|
Including: Domestic listed
|
1,500,000,000 | 1,500 | ||||||
|
Overseas listed
|
7,441,175,000 | 7,441 | ||||||
|
|
||||||||
|
|
||||||||
|
Total
|
28,264,705,000 | 28,265 | ||||||
|
|
||||||||
|
Overseas listed shares are traded on the Stock Exchange of Hong Kong and the New York Stock Exchange.
|
F-75
Table of Contents
FOR THE YEAR ENDED 31 DEC 2009
| 30 |
RESERVES
|
| Exchange | ||||||||||||||||||||||||
| differences on | ||||||||||||||||||||||||
| Additional | translating | |||||||||||||||||||||||
| paid in | Unrealised | Reserve | General | foreign | ||||||||||||||||||||
| capital | gains/(losses) | fund | reserve | operations | Total | |||||||||||||||||||
| RMB million | RMB million | RMB million | RMB million | RMB million | RMB million | |||||||||||||||||||
| (a) | (b) | |||||||||||||||||||||||
|
|
||||||||||||||||||||||||
|
As at 1 January 2008
|
53,860 | 43,509 | 9,480 | 4,427 | — | 111,276 | ||||||||||||||||||
|
Other comprehensive
loss for the year
|
— | (33,452 | ) | — | — | (1 | ) | (33,453 | ) | |||||||||||||||
|
Appropriation to reserve
|
— | — | 4,708 | 1,916 | — | 6,624 | ||||||||||||||||||
|
|
||||||||||||||||||||||||
|
|
||||||||||||||||||||||||
|
As at 31 December 2008
|
53,860 | 10,057 | 14,188 | 6,343 | (1 | ) | 84,447 | |||||||||||||||||
|
|
||||||||||||||||||||||||
|
|
||||||||||||||||||||||||
|
Other comprehensive
income for the year
|
— | 10,745 | — | — | — | 10,745 | ||||||||||||||||||
|
Appropriation to reserve
|
— | — | 4,302 | 3,293 | — | 7,595 | ||||||||||||||||||
|
|
||||||||||||||||||||||||
|
|
||||||||||||||||||||||||
|
As at 31 December 2009
|
53,860 | 20,802 | 18,490 | 9,636 | (1 | ) | 102,787 | |||||||||||||||||
|
|
||||||||||||||||||||||||
F-76
Table of Contents
FOR THE YEAR ENDED 31 DEC 2009
| 30 |
RESERVES (continued)
|
| (a) |
Under relevant PRC law, the Company is required to
transfer 10% of its net profit under CAS to statutory
reserve fund. The Company appropriated 10% of net
profit to the statutory reserve for the year ended 31
December 2009 and 2008, RMB 3,293 million and RMB
1,916 million respectively. The Company also
appropriated RMB 2,992 million to the statutory
reserve fund under CAS retrospectively reflected in 1
January 2008 due to adoption of MoF new guidance as
disclosed in Note 2.1. In May 2009, approved by Annual
General Meeting, the Company appropriated RMB 1,009
million to discretionary reserve fund for the year
ended 31 December 2008 based on the net profit under A
share financial statement (2008: RMB 2,792 million).
|
|
| (b) |
Pursuant to “Financial Standards of Financial
Enterprises — Implementation Guide” issued by Ministry
of Finance of People’s Republic of China on 30 March
2007, for the year ended 31 December 2009 and 2008,
the Company appropriated 10% of net profit under CAS
which is RMB 3,293 million and RMB 1,916 million
respectively to general reserve for future uncertain
disasters, which can not be used for dividend
distribution or share capital increment. The Company
also appropriated RMB 1,635 million to general reserve
under CAS retrospectively reflected in 1 January 2008
due to adoption of MoF new guidance as disclosed in
Note 2.1.
|
|
|
Under related PRC law, dividends may be paid only out of distributable
profits. Distributable profits generally means the Company’s after-tax
profits as determined under accounting standards generally accepted in
PRC or IFRS, whichever is lower, less any recovery of accumulated
losses and allocations to statutory funds that the Company is required
to make, subject to further regulatory restrictions. Any distributable
profits that are not distributed in a given year are retained and
available for distribution in subsequent years. The amount of
distributable retained earnings based on the above is RMB 78,491
million as at 31 December 2009 (as at 31 December 2008: RMB 60,848
million).
|
F-77
Table of Contents
FOR THE YEAR ENDED 31 DEC 2009
| 31 |
CONTINGENCIES
|
|
|
The following is a summary of the significant contingent liabilities:
|
| As at 31 | As at 31 | |||||||
| December | December | |||||||
| 2009 | 2008 | |||||||
| RMB million | RMB million | |||||||
|
|
||||||||
|
Pending lawsuits
|
113 | 96 | ||||||
|
|
||||||||
|
The Group has been named in a number of lawsuits arising in the ordinary course of business. Provision has been made for the probable losses to the Group on those
claims when management can reasonably estimate the outcome of the lawsuits taking into account the legal advice. No provision has been made for pending lawsuits
when the outcome of the lawsuits cannot be reasonably estimated or management believes a loss is not probable.
|
||
| 32 |
COMMITMENTS
|
|
| (a) |
Capital commitments
|
| i) |
Capital commitments for property, plant and equipment
|
| As at 31 | As at 31 | |||||||
| December | December | |||||||
| 2009 | 2008 | |||||||
| RMB million | RMB million | |||||||
|
|
||||||||
|
Contracted but not provided for
|
488 | 878 | ||||||
|
|
||||||||
| ii) |
Capital commitments to acquire Bohai Venture Capital Fund
|
|
The Group committed to contribute RMB 500 million to Bohai Venture Capital Fund to Bohai Venture Capital Fund Management Company of which RMB 245 million had been
paid at 31 December 2009. The remaining RMB 255 million will be paid when called.
|
||
| (b) |
Operating lease commitments
|
|
|
The future minimum lease payments under non-cancellable operating leases are as follows:
|
| As at 31 | As at 31 | |||||||
| December | December | |||||||
| 2009 | 2008 | |||||||
| RMB million | RMB million | |||||||
|
|
||||||||
|
Land and buildings
|
||||||||
|
Not later than one year
|
297 | 238 | ||||||
|
Later than one year but not later than five years
|
478 | 383 | ||||||
|
Later than five years
|
49 | 44 | ||||||
|
|
||||||||
|
|
||||||||
|
Total
|
824 | 665 | ||||||
|
|
||||||||
|
The operating lease payments charged to the net profit for the year ended 31 December 2009 was RMB 593 million (for the year ended 31 December 2008: RMB 482
million).
|
F-78
Table of Contents
FOR THE YEAR ENDED 31 DEC 2009
| 33 |
SUBSEQUENT EVENTS
|
| (i) |
The 36-month restriction of 19,323,530,000 ordinary shares held by
the CLIC expired on 11 January 2010, of which 19,173,530,000 shares
are publically traded and 150,000,000 shares are frozen due to
regulatory requirement.
|
||
| (ii) |
On 27 December 2009, the Group purchased 934 million shares of
Sino-Ocean Land Holdings Limited (“Sino-ocean”, a HKSE listed
company) at the total cost of HKD 5,819 million. As a result of this
acquisition, the Group became the second largest shareholder by
holding 16.57% of the total Sino-ocean shares outstanding.
|
||
|
On 12 January 2010, the Group acquired 423 million more shares of
Sino-ocean. As a result of this acquisition, the Group became the
largest shareholder by holding 24.08% equity interest of Sino-ocean.
|
F-79