CHIMERA INVESTMENT CORP
10-Ks and 10-Qs
|
|
|
|
|
|
|
|
|
|
|
|
|
|
|
|
|
|
|
|
|
|
|
|
|
|
|
|
|
|
|
|
|
|
|
|
|
|
|
|
|
|
|
|
|
|
|
|
|
|
SECURITIES AND EXCHANGE COMMISSION
WASHINGTON, D.C. 20549
FORM 10-K
(MARK ONE)
[X] ANNUAL REPORT PURSUANT TO SECTION 13 OR 15 (d) OF THE SECURITIES
EXCHANGE ACT OF 1934
FOR THE FISCAL YEAR ENDED: DECEMBER 31, 2010
OR
[ ] TRANSITION REPORT PURSUANT TO SECTION 13 OR 15 (d) OF THE SECURITIES EXCHANGE ACT OF 1934
FOR THE TRANSITION PERIOD FROM TO
COMMISSION FILE NUMBER: 1-33796
CHIMERA INVESTMENT CORPORATION
(Exact Name of Registrant as Specified in its Charter)
|
MARYLAND
|
26-0630461
|
|
(State or other jurisdiction of incorporation
of organization)
|
(I.R.S. Employer Identification Number)
|
|
1211 Avenue of the Americas, Suite 2902
|
|
|
New York, New York
|
10036
|
|
(Address of Principal Executive Offices)
|
(Zip Code)
|
(646) 454-3759
(Registrant’s telephone number, including area code)
Securities registered pursuant to Section 12(b) of the Act:
|
Title of Each Class
|
Name of Each Exchange on Which Registered
|
|
Common Stock, par value $.01 per share
|
New York Stock Exchange
|
Securities registered pursuant to Section 12(g) of the Act:
None.
Indicate by check mark whether the Registrant is a well-known seasoned issuer, as defined in Rule 405 of the Securities Act. Yes
X
No
Indicate by check mark if the Registrant is not required to file reports pursuant to Section 13 or Section 15(d) of the Act. Yes No
X
Indicate by check mark whether the Registrant (1) has filed all reports required to be filed by Section 13 or 15(d) of the Securities Exchange Act of 1934 during the preceding 12 months (or for such shorter period that the Registrant was required to file such reports), and (2) has been subject to such filing requirements for the past 90 days:
Yes
X
No ___
Indicate by check mark whether the registrant has submitted electronically and posted on its corporate Web site, if any, every Interactive Data File required to be submitted and posted pursuant to Rule 405 of Regulation S-T (§ 232.405 of this chapter) during the preceding 12 months (or for such shorter period that the registrant was required to submit and post such files).
Yes_X__ No____
Indicate by check mark if disclosure of delinquent filers pursuant to Item 405 of Regulation S-K is not contained herein, and will not be contained, to the best of registrant’s knowledge, in definitive proxy or information statements incorporated by reference in Part III of this Form 10-K or any amendment to this Form 10-K.
Indicate by check mark whether the registrant is a large accelerated filer, an accelerated filer, a non-accelerated filer or a smaller reporting company. See the definitions of “accelerated filer, large accelerated filer and smaller reporting company” in Rule 12b-2 of the Exchange Act. (Check one): Large accelerated filer
X
Accelerated filer
__
Non-accelerated filer __ Smaller reporting company __
Indicate by check mark whether the Registrant is a shell company (as defined in Rule 12b-2 of the Act). Yes __ No
X
.
At June 30, 2010, the aggregate market value of the voting stock held by non-affiliates of the Registrant was $3,025,787,429 based on the closing sale price on the New York Stock Exchange on that date.
The number of shares of the Registrant’s Common Stock outstanding on February 16, 2011 was 1,027,058,153.
Documents Incorporated by Reference
The registrant intends to file a definitive proxy statement pursuant to Regulation 14A within 120 days of the end of the fiscal year ended December 31, 2010. Portions of such proxy statement are incorporated by reference into Part III of this Form 10-K.
CHIMERA INVESTMENT CORPORATION
2010 FORM 10-K ANNUAL REPORT
TABLE OF CONTENTS
|
PAGE
|
||
|
PART I
|
||
|
3
|
||
|
12
|
||
|
46
|
||
|
46
|
||
|
46
|
||
|
46
|
||
|
PART II
|
||
|
47
|
||
|
50
|
||
|
50
|
||
|
69
|
||
|
73
|
||
|
73
|
||
|
73
|
||
|
74
|
||
|
PART III
|
||
|
75
|
||
|
75
|
||
|
75
|
||
|
75
|
||
|
75
|
||
|
PART IV
|
||
|
76
|
||
|
F-1
|
||
|
S-1
|
||
|
EXHIBITS
|
||
ii
SPECIAL NOTE REGARDING FORWARD-LOOKING STATEMENTS
We make forward-looking statements in this annual report that are subject to risks and uncertainties. These forward-looking statements include information about possible or assumed future results of our business, financial condition, liquidity, results of operations, plans and objectives. When we use the words ‘‘believe,’’ ‘‘expect,’’ ‘‘anticipate,’’ ‘‘estimate,’’ ‘‘plan,’’ ‘‘continue,’’ ‘‘intend,’’ ‘‘should,’’ ‘‘may,’’ ‘‘would,’’ ‘‘will’’ or similar expressions, we intend to identify forward-looking statements. Statements regarding the following subjects, among others, are forward-looking by their nature:
|
|
●
|
our business and investment strategy;
|
|
|
●
|
our projected financial and operating results;
|
|
|
●
|
our ability to maintain existing financing arrangements, obtain future financing arrangements and the terms of such arrangements;
|
|
|
●
|
general volatility of the securities markets in which we invest;
|
|
|
●
|
the impact of and changes to various government programs, including the US Department of the Treasury’s purchase of Agency residential mortgage-backed securities, the Term Asset-Backed Securities Loan Facility and the Public-Private Investment program;
|
|
|
●
|
our expected investments;
|
|
|
●
|
changes in the value of our investments;
|
|
|
●
|
interest rate mismatches between our investments and our borrowings used to fund such purchases;
|
|
|
●
|
changes in interest rates and mortgage prepayment rates;
|
|
|
●
|
effects of interest rate caps on our adjustable-rate investments;
|
|
|
●
|
rates of default or decreased recovery rates on our investments;
|
|
|
●
|
prepayments of the mortgage and other loans underlying our mortgage-backed or other asset-backed securities;
|
|
|
●
|
the degree to which our hedging strategies may or may not protect us from interest rate volatility;
|
|
|
●
|
impact of and changes in governmental regulations, tax law and rates, accounting guidance, and similar matters;
|
|
|
●
|
availability of investment opportunities in real estate-related and other securities;
|
|
|
●
|
availability of qualified personnel;
|
|
|
●
|
estimates relating to our ability to make distributions to our stockholders in the future;
|
|
|
●
|
our understanding of our competition; and
|
|
|
●
|
market trends in our industry, interest rates, the debt securities markets or the general economy.
|
1
The forward-looking statements are based on our beliefs, assumptions and expectations of our future performance, taking into account all information currently available to us. You should not place undue reliance on these forward-looking statements. These beliefs, assumptions and expectations can change as a result of many possible events or factors, not all of which are known to us. Some of these factors are described under the caption ‘‘Risk Factors’’ in this Annual Report on Form 10-K and any subsequent Quarterly Reports on Form 10-Q. If a change occurs, our business, financial condition, liquidity and results of operations may vary materially from those expressed in our forward-looking statements. Any forward-looking statement speaks only as of the date on which it is made. New risks and uncertainties arise from time to time, and it is impossible for us to predict those events or how they may affect us. Except as required by law, we are not obligated to, and do not intend to, update or revise any forward-looking statements, whether as a result of new information, future events or otherwise.
2
The Company
We are a specialty finance company that invests, either directly or indirectly through our subsidiaries, in residential mortgage-backed securities, or RMBS, residential mortgage loans, commercial mortgage loans, real estate-related securities and various other asset classes. We elected to be taxed as a real estate investment trust, or REIT, for federal income tax purposes commencing with our taxable year ended December 31, 2007. Therefore, we generally will not be subject to federal income tax on our taxable income that is distributed to our stockholders. We were incorporated in Maryland in June 2007 and commenced operations in November 2007. We listed our common stock on the New York Stock Exchange, or NYSE, in November 2007 and trade under the symbol “CIM”.
We are externally managed by Fixed Income Discount Advisory Company, which we refer to as our Manager or FIDAC. Our Manager is an investment advisor registered with the Securities and Exchange Commission, or SEC. Additionally, our Manager is a wholly-owned subsidiary of Annaly Capital Management, Inc., or Annaly, a New York Stock Exchange-listed REIT, which has a long track record of managing investments in U.S. government agency mortgage-backed securities.
Our objective is to provide attractive risk-adjusted returns to our investors over the long-term, primarily through dividends and secondarily through capital appreciation. We intend to achieve this objective by investing in a broad class of financial assets to construct an investment portfolio that is designed to achieve attractive risk-adjusted returns and that is structured to comply with the various federal income tax requirements for REIT status and to maintain our exclusion from regulation under the Investment Company Act of 1940, or 1940 Act.
Our Manager
We are externally managed and advised by FIDAC, a fixed-income management company, pursuant to a management agreement. All of our officers are employees of our Manager or one of its affiliates. We believe our relationship with our Manager enables us to leverage our Manager’s well-respected and established portfolio management resources for each of our targeted asset classes and its sophisticated infrastructure supporting those resources, including investment professionals focusing on residential mortgage loans, U.S. government agency residential mortgage-backed securities, or Agency RMBS, which are mortgage pass-through certificates, collateralized mortgage obligations, or CMOs, and other mortgage-backed securities representing interests in or obligations backed by pools of mortgage loans issued or guaranteed by the Federal National Mortgage Association, or Fannie Mae, the Federal Home Loan Mortgage Corporation, or Freddie Mac, and the Government National Mortgage Association, or Ginnie Mae, non-Agency RMBS, commercial mortgage loans, commercial mortgage-backed securities, or CMBS, and other asset-backed securities, or ABS. Additionally, we have benefitted and expect to continue to benefit from our Manager’s finance and administration functions, which address legal, compliance, investor relations and operational matters, including portfolio management, trade allocation and execution, securities valuation, risk management and information technologies in connection with the performance of its duties. Our Manager commenced active investment management operations in 1994.
Our Manager is responsible for administering our business activities and day-to-day operations. Pursuant to the terms of the management agreement, our Manager provides us with our management team, including our officers, along with appropriate support personnel. Our Manager is at all times subject to the supervision and oversight of our board of directors and has only such functions and authority as we delegate to it.
Our Investment Strategy
Our objective is to provide attractive risk-adjusted returns to our investors over the long-term, primarily through dividends and secondarily through capital appreciation. We intend to achieve this objective by investing in a diversified investment portfolio of RMBS, residential mortgage loans, real estate-related securities and various other asset classes, subject to maintaining our REIT status and exemption from registration under the 1940 Act. The RMBS, ABS, CMBS, and collateralized debt obligations, or CDOs, we purchase may include investment-grade and non-investment grade classes, including the BB-rated, B-rated and non-rated classes.
3
We rely on our Manager’s expertise in identifying assets within our target asset classes. Our Manager makes investment decisions based on various factors, including expected cash yield, relative value, risk-adjusted returns, current and projected credit fundamentals, current and projected macroeconomic considerations, current and projected supply and demand, credit and market risk concentration limits, liquidity, cost of financing and financing availability, as well as maintaining our REIT qualification and our exemption from registration under the 1940 Act.
Over time, we will modify our investment allocation strategy as market conditions change to seek to maximize the returns from our investment portfolio. We believe this strategy, combined with our Manager’s experience, will enable us to pay dividends and achieve capital appreciation throughout changing interest rate and credit cycles and provide attractive long-term returns to investors.
Our targeted asset classes and the principal investments we expect to make in each are as follows:
|
Asset Class
|
Principal Investments
|
||
|
Residential Mortgage-Backed Securities
|
● |
Non-Agency RMBS, including investment-grade and non-investment grade classes, including the BB-rated, B-rated and non-rated classes.
|
|
| ● |
Agency RMBS.
|
||
|
Residential Mortgage Loans
|
● |
Prime mortgage loans, which are mortgage loans that conform to the underwriting guidelines of Fannie Mae and Freddie Mac, which we refer to as Agency Guidelines; and jumbo prime mortgage loans, which are mortgage loans that conform to the Agency Guidelines except as to loan size.
|
|
| ● |
Alt-A mortgage loans, which are mortgage loans that may have been originated using documentation standards that are less stringent than the documentation standards applied by certain other first lien mortgage loan purchase programs, such as the Agency Guidelines, but have one or more compensating factors such as a borrower with a strong credit or mortgage history or significant assets.
|
||
|
Commercial Mortgage Loans
|
● |
First or second lien loans secured by multifamily properties, which are residential rental properties consisting of five or more dwelling units; and mixed residential or other commercial properties; retail properties; office properties; or industrial properties, which may or may not conform to the Agency Guidelines.
|
|
|
Other Asset-Backed Securities
|
● |
CMBS.
|
|
| ● |
Debt and equity tranches of CDOs.
|
||
| ● |
Consumer and non-consumer ABS, including investment-grade and non-investment grade classes, including the BB-rated, B-rated and non-rated classes.
|
4
Since we commenced operations in November 2007, we have focused our investment activities on acquiring non-Agency and Agency RMBS and on purchasing residential mortgage loans that have been originated by select high-quality originators, including the retail lending operations of leading commercial banks. Our investment portfolio at December 31, 2010 was weighted toward non-Agency RMBS. At December 31, 2010, approximately 83.4% of our investment portfolio was non-Agency RMBS, 12.6% of our investment portfolio was Agency RMBS, and 4.0% of our investment portfolio was securitized residential mortgage loans. At December 31, 2009, approximately 64.6% of our investment portfolio was non-Agency RMBS, 23.3% of our investment portfolio was Agency RMBS, and 12.1% of our investment portfolio was securitized residential mortgage loans. We expect that over the near term, our investment portfolio will continue to be weighted toward RMBS, subject to maintaining our REIT qualification and our 1940 Act exemption.
In addition, we have engaged in and anticipate continuing to engage in transactions with residential mortgage lending operations of leading commercial banks and other high-quality originators in which we identify and re-underwrite residential mortgage loans owned by such entities, and rather than purchasing and securitizing such residential mortgage loans ourselves, we and the originator would structure the securitization and we would purchase the resulting mezzanine and subordinate non-Agency RMBS. We may also engage in similar transactions with non-Agency RMBS in which we acquire once AAA-rated non-Agency RMBS and immediately re-securitize those securities. We may sell the resulting AAA-rated super senior RMBS and retain the rated or unrated mezzanine RMBS. Our investment decisions, however, will depend on prevailing market conditions and will change over time. As a result, we cannot predict the percentage of our assets that will be invested in each asset class or whether we will invest in other classes of investments. We may change our investment strategy and policies without a vote of our stockholders.
We have elected to be taxed as a REIT and operate our business to be exempt from registration under the 1940 Act, and therefore we are required to invest a substantial majority of our assets in loans secured by mortgages on real estate and real estate-related assets. Subject to maintaining our REIT qualification and our 1940 Act exemption, we do not have any limitations on the amounts we may invest in any of our targeted asset classes.
Investment Portfolio
The following briefly discusses the principal types of investments that we have made and expect to make:
Residential Mortgage-Backed Securities
We have invested in and intend to continue to invest in RMBS which are typically pass-through certificates created by the securitization of a pool of mortgage loans that are collateralized by residential real estate properties.
The securitization process is governed by one or more of the rating agencies, including Fitch Ratings, Moody’s Investors Service, Standard & Poor’s, and DBRS Limited which determine the respective bond class sizes, generally based on a sequential payment structure. Bonds that are rated from AAA to BBB by the rating agencies are considered “investment grade.” Bond classes that are subordinate to the BBB class are considered “below-investment grade” or “non-investment grade.” The respective bond class sizes are determined based on the review of the underlying collateral by the rating agencies. The payments received from the underlying loans are used to make the payments on the RMBS. Based on the sequential payment priority, the risk of nonpayment for the investment grade RMBS is lower than the risk of nonpayment for the non-investment grade bonds. Accordingly, the investment grade class is typically sold at a lower yield compared to the non-investment grade classes which are sold at higher yields.
We invest in investment grade and non-investment grade RMBS. We evaluate the credit characteristics of these types of securities, including, but not limited to, loan balance distribution, geographic concentration, property type, occupancy, periodic and lifetime cap, weighted-average loan-to-value and weighted-average FICO score. Qualifying securities are then analyzed using base line expectations of expected prepayments and loss severities, issuers and the current state of the fixed-income market and broader economy in general. Losses and prepayments are stressed simultaneously based on a credit risk-based model. Securities in this portfolio are monitored for variance from expected prepayments, severities, losses and cash flow. The due diligence process is particularly important and costly with respect to newly formed originators or issuers because there may be little or no information publicly available about these entities and investments.
5
We may invest in net interest margin securities, or NIMs, which are notes that are payable from and secured by excess cash flow that is generated by RMBS or home equity line of credit-backed securities, or HELOCs, after paying the debt service, expenses and fees on such securities. The excess cash flow represents all or a portion of a residual that is generally retained by the originator of the RMBS or HELOCs. The residual is illiquid, thus the originator will monetize the position by securitizing the residual and issuing a NIM, usually in the form of a note that is backed by the excess cash flow generated in the underlying securitization.
We may invest in mortgage pass-through certificates issued or guaranteed by Ginnie Mae, Fannie Mae or Freddie Mac which are securities representing interests in “pools” of mortgage loans secured by residential real property where payments of both interest and principal, plus pre-paid principal, on the securities are made monthly to holders of the security, in effect passing through monthly payments made by the individual borrowers on the mortgage loans that underlie the securities, net of fees paid to the issuer/guarantor and servicers of the securities. We may also invest in CMOs issued by the Agencies. CMOs consist of multiple classes of securities, with each class bearing different stated maturity dates. Monthly payments of principal, including prepayments, are first returned to investors holding the shortest maturity class; investors holding the longer maturity classes receive principal only after the first class has been retired.
Agency RMBS are collateralized by either fixed-rate mortgage loans, or FRMs, adjustable-rate mortgage loans, or ARMs, or hybrid ARMs. Hybrid ARMs are mortgage loans that have interest rates that are fixed for an initial period (typically three, five, seven or ten years) and thereafter reset at regular intervals subject to interest rate caps. Our allocation between securities collateralized by FRMs, ARMs or hybrid ARMs will depend on various factors including, but not limited to, relative value, expected future prepayment trends, supply and demand, costs of financing, costs of hedging, expected future interest rate volatility and the overall shape of the U.S. Treasury and interest rate swap yield curves. We take these factors into account when we make these types of investments.
Residential Mortgage Loans
We have invested and intend to continue to invest in residential mortgage loans (mortgage loans secured by residential real property) primarily through direct purchases from selected high-quality originators. We may to enter into additional mortgage loan purchase agreements with a number of primary mortgage loan originators, including mortgage bankers, commercial banks, savings and loan associations, home builders, credit unions and mortgage conduits. We may also purchase mortgage loans on the secondary market. We expect these loans to be secured primarily by residential properties in the United States.
We invest primarily in residential mortgage loans underwritten to our specifications. The originators perform the credit review of the borrowers, the appraisal of the properties securing the loan, and maintain other quality control procedures. We generally consider the purchase of loans when the originators have verified the borrowers’ income and assets, verified their credit history and obtained appraisals of the properties. We or a third party perform an independent underwriting review of the processing, underwriting and loan closing methodologies that the originators used in qualifying a borrower for a loan. Depending on the size of the loans, we may not review all of the loans in a pool, but rather select loans for underwriting review based upon specific risk-based criteria such as property location, loan size, effective loan-to-value ratio, borrower’s credit score and other criteria we believe to be important indicators of credit risk. Additionally, before the purchase of loans, we obtain representations and warranties from each originator stating that each loan is underwritten to our requirements or, in the event underwriting exceptions have been made, we are informed so that we may evaluate whether to accept or reject the loans. An originator who breaches these representations and warranties in making a loan that we purchase may be obligated to repurchase the loan from us. As added security, we use the services of a third-party document custodian to insure the quality and accuracy of all individual mortgage loan closing documents and to hold the documents in safekeeping. As a result, all of the original loan collateral documents that are signed by the borrower, other than the original credit verification documents, are examined, verified and held by the third-party document custodian.
We may originate mortgage loans or provide other types of financing to the owners of real estate. We currently do not intend to establish a loan servicing platform, but expect to retain highly-rated servicers to service our mortgage loan portfolio. We purchase certain residential mortgage loans on a servicing-retained basis. In the future, however, we may decide to originate mortgage loans or other types of financing, and we may elect to service mortgage loans and other types of assets.
6
We expect that all servicers servicing our loans will be highly rated by the rating agencies. We also conduct a due diligence review of each servicer before executing a servicing agreement. Servicing procedures will typically follow Fannie Mae guidelines but will be specified in each servicing agreement. All servicing agreements will meet standards for inclusion in highly rated mortgage-backed or asset-backed securitizations.
We expect that the loans we acquire will be first lien, single-family residential traditional fixed-rate, adjustable-rate and hybrid adjustable-rate loans with original terms to maturity of not more than 40 years and are either fully amortizing or are interest-only for up to ten years, and fully amortizing thereafter. Fixed-rate mortgage loans bear an interest rate that is fixed for the life of the loan. All adjustable-rate and hybrid adjustable-rate residential mortgage loans will bear an interest rate tied to an interest rate index. Most loans have periodic and lifetime constraints on how much the loan interest rate can change on any predetermined interest rate reset date. The interest rate on each adjustable-rate mortgage loan resets monthly, semi-annually or annually and generally adjusts to a margin over a U.S. Treasury index or London Interbank Offer Rate, or LIBOR, index. Hybrid adjustable-rate loans have a fixed rate for an initial period, generally three to ten years, and then convert to adjustable-rate loans for their remaining term to maturity.
We acquire residential mortgage loans for our portfolio with the intention of either securitizing them and retaining them in our portfolio as securitized mortgage loans, or holding them in our residential mortgage loan portfolio. To facilitate the securitization or financing of our loans, we expect to generally create subordinate certificates, which provide a specified amount of credit enhancement. We expect to issue securities through securities underwriters and either retain these securities or finance them in the repurchase agreement market. There is no limit on the amount we may retain of these below-investment-grade subordinate certificates. Until we securitize our residential mortgage loans, we expect to finance our residential mortgage loan portfolio through the use of warehouse facilities and repurchase agreements.
Commercial Mortgage Loans
We may invest in commercial mortgage loans. Generally, we may invest in first or second lien loans secured by multifamily properties, which are residential rental properties consisting of five or more dwelling units, or by mixed residential or other commercial properties, retail properties, office properties or industrial properties. These loans may or may not conform to the Agency guidelines.
Other Asset-Backed Securities
We may invest in securities issued in various CDO offerings to gain exposure to bank loans, corporate bonds, ABS, mortgages, RMBS, CMBS, and other instruments. To avoid any actual or perceived conflicts of interest with our Manager, an investment in any such security structured or managed by our Manager will be approved by a majority of our independent directors. To the extent such securities are treated as debt of the CDO issuer for federal income tax purposes, we will hold the securities directly, subject to the requirements of our continued qualification as a REIT. To the extent the securities represent equity interests in a CDO issuer for federal income tax purposes, we may be required to hold such securities through a taxable REIT subsidiary, or TRS, which would cause the income recognized with respect to such securities to be subject to federal (and applicable state and local) corporate income tax. See “Risk Factors – Tax Risks.” We could fail to qualify as a REIT or we could become subject to a penalty tax if the income we recognize from certain investments that are treated or could be treated as equity interests in a foreign corporation exceed 5% of our gross income in a taxable year.
We may invest in CMBS, which are secured by, or evidence ownership interests in, a single commercial mortgage loan or a pool of mortgage loans secured by commercial properties. These securities may be senior, subordinated, investment grade or non-investment grade. We intend to invest in CMBS that will yield current interest income and where we consider the return of principal to be likely. We intend to acquire CMBS from private originators of, or investors in, mortgage loans, including savings and loan associations, mortgage bankers, commercial banks, finance companies, investment banks and other entities.
In general, CDO issuers are special purpose vehicles that hold a portfolio of income-producing assets financed through the issuance of rated debt securities of different seniority and equity. The debt tranches are typically rated based on cash flow structure, portfolio quality, diversification and credit enhancement. The equity securities issued by the CDO vehicle are the “first loss” piece of the CDO vehicle’s capital structure, but they are also generally entitled to all residual amounts available for payment after the CDO vehicle’s senior obligations have been satisfied. Some CDO vehicles are “synthetic,” in which the credit risk to the collateral pool is transferred to the CDO vehicle by a credit derivative such as a credit default swap.
7
We also may invest in consumer ABS. These securities are generally securities for which the underlying collateral consists of assets such as home equity loans, credit card receivables and auto loans. We also expect to invest in non-consumer ABS. These securities are generally secured by loans to businesses and consist of assets such as equipment loans, truck loans and agricultural equipment loans. Issuers of consumer and non-consumer ABS generally are special purpose entities owned or sponsored by banks and finance companies, captive finance subsidiaries of non-financial corporations or specialized originators such as credit card lenders. We may purchase RMBS and ABS which are denominated in foreign currencies or are collateralized by non-U.S. assets.
Investment Guidelines
We have adopted a set of investment guidelines that set out the asset classes, risk tolerance levels, diversification requirements and other criteria used to evaluate the merits of specific investments as well as the overall portfolio composition. Our Manager’s Investment Committee reviews our compliance with the investment guidelines periodically and our board of directors receives an investment report at each quarter-end in conjunction with its review of our quarterly results. Our board also reviews our investment portfolio and related compliance with our investment policies and procedures and investment guidelines at each regularly scheduled board of directors meeting.
Our board of directors and our Manager’s Investment Committee have adopted the following guidelines for our investments and borrowings:
|
|
●
|
No investment shall be made that would cause us to fail to qualify as a REIT for federal income tax purposes;
|
|
|
●
|
No investment shall be made that would cause us to be regulated as an investment company under the 1940 Act;
|
|
|
●
|
With the exception of real estate and housing, no single industry shall represent greater than 20% of the securities or aggregate risk exposure in our portfolio; and
|
|
|
●
|
Investments in non-rated or deeply subordinated ABS or other securities that are non-qualifying assets for purposes of the 75% REIT asset test will be limited to an amount not to exceed 50% of our stockholders’ equity.
|
These investment guidelines may be changed by a majority of our board of directors without the approval of our stockholders.
Our board of directors has also adopted a separate set of investment guidelines and procedures to govern our relationships with FIDAC. We have also adopted detailed compliance policies to govern our interaction with FIDAC, including when FIDAC is in receipt of material non-public information.
Our Financing Strategy
We use leverage to increase potential returns to our stockholders. We are not required to maintain any specific debt-to-equity ratio as we believe the appropriate leverage for the particular assets we are financing depends on the credit quality and risk of those assets. At December 31, 2010, our ratio of debt-to-equity was 1.1:1. For purposes of calculating this ratio, our equity is equal to the total stockholders’ equity on our consolidated statements of financial condition. Our debt consists of repurchase agreements and securitized debt. As part of our borrowing, we have entered into a RMBS repurchase agreement with Annaly, which owns approximately 4.38% of our outstanding shares of common stock. As of December 31, 2010, we had no financing under this agreement. As of December 31, 2009, we had outstanding under this agreement $259.0 million which consisted of approximately 10.95% of our total financing. In addition, we have entered into a RMBS repurchase agreement with RCap Securities, Inc, a wholly owned subsidiary of Annaly. As of December 31, 2010 and 2009, we had no financing under this agreement.
8
Subject to our maintaining our qualification as a REIT, we may use a number of sources to finance our investments, including the following:
|
|
●
|
Repurchase Agreements
. We finance certain of our assets through the use of repurchase agreements. We anticipate that repurchase agreements will be one of the sources we will use to achieve our desired amount of leverage for our residential real estate assets. We maintain formal relationships with multiple counterparties to obtain financing on favorable terms.
|
|
|
●
|
Warehouse Facilities
. We may utilize credit facilities for capital needed to fund our assets. We intend to maintain formal relationships with multiple counterparties to maintain warehouse lines on favorable terms.
|
|
|
●
|
Securitization
. We have and may continue to acquire residential mortgage loans for our portfolio with the intention of securitizing them and retaining the securitized mortgage loans in our portfolio. To facilitate the securitization or financing of our loans, we generally create subordinate certificates, providing a specified amount of credit enhancement, which we intend to retain in our portfolio.
|
|
|
●
|
Asset-Backed Commercial Paper
. We may finance certain of our assets using asset-backed commercial paper, or ABCP, conduits, which are bankruptcy-remote special purpose vehicles that issue commercial paper and the proceeds of which are used to fund assets, either through repurchase or secured lending programs. We may utilize ABCP conduits of third parties or create our own conduit.
|
|
|
●
|
Term Financing CDOs
. We may finance certain of our assets using term financing strategies, including CDOs and other match-funded financing structures. CDOs are multiple class debt securities, or bonds, secured by pools of assets, such as mortgage-backed securities and corporate debt. Like typical securitization structures, in a CDO:
|
|
|
o
|
the assets are pledged to a trustee for the benefit of the holders of the bonds;
|
|
|
o
|
one or more classes of the bonds are rated by one or more rating agencies; and
|
|
|
o
|
one or more classes of the bonds are marketed to a wide variety of fixed-income investors which enables the CDO sponsor to achieve a relatively low cost of long-term financing.
|
Unlike typical securitization structures, the underlying assets may be sold, subject to certain limitations, without a corresponding pay-down of the CDO, provided the proceeds are reinvested in qualifying assets. As a result, CDOs enable the sponsor to actively manage, subject to certain limitations, the pool of assets. We believe CDO financing structures may be an appropriate financing vehicle for our target asset classes because they will enable us to obtain relatively low, long-term cost of funds and minimize the risk that we may have to refinance our liabilities before the maturities of our investments, while giving us the flexibility to manage credit risk and, subject to certain limitations, to take advantage of profit opportunities.
Our Interest Rate Hedging and Risk Management Strategy
We may, from time to time, utilize derivative financial instruments to hedge all or a portion of the interest rate risk associated with our borrowings. Under the federal income tax laws applicable to REITs, we generally enter into certain transactions to hedge indebtedness that we incur, or plan to incur, to acquire or carry real estate assets, although our total gross income from such hedges and other non-qualifying sources must not exceed 25% of our gross income.
We engage in a variety of interest rate management techniques that seek to mitigate changes in interest rates or other potential influences on the values of our assets. The federal income tax rules applicable to REITs may require us to implement certain of these techniques through a TRS that is fully subject to corporate income taxation. Our interest rate management techniques may include:
|
|
●
|
puts and calls on securities or indices of securities;
|
|
|
●
|
Eurodollar futures contracts and options on such contracts;
|
|
|
●
|
interest rate caps, swaps and swaptions;
|
|
|
●
|
U.S. Treasury securities and options on U.S. Treasury securities; and
|
|
|
●
|
other similar transactions.
|
9
We attempt to reduce interest rate risks and to minimize exposure to interest rate fluctuations through the use of match funded financing structures, when appropriate, whereby we seek (i) to match the maturities of our debt obligations with the maturities of our assets and (ii) to match the interest rates on our investments with like-kind debt (i.e., floating rate assets are financed with floating rate debt and fixed-rate assets are financed with fixed-rate debt), directly or through the use of interest rate swaps, caps or other financial instruments, or through a combination of these strategies. This will allow us to minimize the risk that we have to refinance our liabilities before the maturities of our assets and to reduce the impact of changing interest rates on our earnings.
Compliance with REIT and Investment Company Requirements
We monitor our investment securities and the income from these securities and, to the extent we enter into hedging transactions, we monitor income from our hedging transactions as well, so as to ensure at all times that we maintain our qualification as a REIT and our exempt status under the 1940 Act.
Employees
We are externally managed and advised by our Manager pursuant to a management agreement as discussed below. We have no employees other than our officers, each of whom is also an employee of our Manager or one of its affiliates. Our Manager is not obligated to dedicate certain of its employees exclusively to us, nor is it or its employees obligated to dedicate any specific portion of its time to our business. Our Manager uses the proceeds from its management fee in part to pay compensation to its officers and employees who, notwithstanding that certain of them also are our officers, receive no cash compensation directly from us.
The Management Agreement
We entered into a management agreement with our Manager with an initial term ending December 31, 2010, with automatic, one-year renewals at the end of each calendar year following the initial term, subject to approval by our independent directors. Under the management agreement, our Manager implements our business strategy and performs certain services for us, subject to oversight by our board of directors. Our Manager is responsible for, among other things, performing all of our day-to-day functions; determining investment criteria in conjunction with our board of directors; sourcing, analyzing and executing investments; asset sales and financings; and performing asset management duties.
Our independent directors review our Manager’s performance annually, and following the initial term, the management agreement may be terminated by us without cause upon the affirmative vote of at least two-thirds of our independent directors, or by a vote of the holders of at least a majority of the outstanding shares of our common stock (other than shares held by Annaly or its affiliates), based upon: (i) our Manager’s unsatisfactory performance that is materially detrimental to us, or (ii) our determination that the management fees payable to our Manager are not fair, subject to our Manager’s right to prevent termination based on unfair fees by accepting a reduction of management fees agreed to by at least two-thirds of our independent directors. We will provide our Manager with 180-days’ prior notice of such termination. Upon termination without cause, we will pay our Manager a substantial termination fee. We may also terminate the management agreement with 30 days’ prior notice from our board of directors, without payment of a termination fee, for cause or upon a change of control of Annaly or our Manager, each as defined in the management agreement. Our Manager may terminate the management agreement if we become required to register as an investment company under the 1940 Act, with such termination deemed to occur immediately before such event, in which case we would not be required to pay a termination fee. Our Manager may also decline to renew the management agreement by providing us with 180-days’ written notice, in which case we would not be required to pay a termination fee.
We pay our Manager a management fee quarterly in arrears in an amount equal to 1.50% per annum, calculated quarterly, of our stockholders’ equity. For purposes of calculating the management fee, our stockholders’ equity means the sum of the net proceeds from any issuances of our equity securities since inception (allocated on a pro rata daily basis for such issuances during the fiscal quarter of any such issuance), plus our retained earnings at the end of such quarter (without taking into account any non-cash equity compensation expense incurred in current or prior periods), less any amount that we pay for repurchases of our common stock, and less any unrealized gains, losses or other items that do not affect realized net income (regardless of whether such items are included in other comprehensive income, or OCI, or loss, or in net income). This amount is adjusted to exclude one-time events pursuant to changes in generally accepted accounting principles, or GAAP, and certain non-cash charges after discussions between our Manager and our independent directors and approved by a majority of our independent directors. The management fee will be reduced, but not below zero, by our proportionate share of any CDO base management fees FIDAC receives in connection with the CDOs in which we invest, based on the percentage of equity we hold in such CDOs. The management fee is payable independent of the performance of our investment portfolio.
10
For the years ended December 31, 2010, 2009 and 2008, our Manager earned management fees of $40.9 million, $25.7 million and $8.4 million, respectively and received expense reimbursement of $465 thousand, $0 and $0, respectively. From our inception through 2009, our Manager waived its right to require us to pay our pro rata portion of rent, telephone, utilities, office furniture, equipment, machinery and other office, internal and overhead expenses of our Manager and its affiliates required for our operations.
Competition
Our net income depends, in large part, on our ability to acquire assets at favorable spreads over our borrowing costs. In acquiring real estate-related assets, we will compete with other mortgage REITs, specialty finance companies, savings and loan associations, banks, mortgage bankers, insurance companies, mutual funds, institutional investors, investment banking firms, financial institutions, governmental bodies and other entities. In addition, there are numerous mortgage REITs with similar asset acquisition objectives, including a number that have been recently formed, and others that may be organized in the future. These other REITs will increase competition for the available supply of mortgage assets suitable for purchase. Many of our competitors are significantly larger than we are, have access to greater capital and other resources and may have other advantages over us. In addition, some of our competitors may have higher risk tolerances or different risk assessments, which could allow them to consider a wider variety of investments and establish more favorable relationships than we can. Current market conditions may attract more competitors, which may increase the competition for sources of financing. An increase in the competition for sources of funding could adversely affect the availability and cost of financing, and thereby adversely affect the market price of our common stock.
Distributions
To maintain our qualification as a REIT, we must distribute substantially all of our taxable income to our stockholders for each year. We have declared and paid regular quarterly dividends in the past and intend to do so in the future.
Available Information
Our investor relations website is www.chimerareit.com. We make available on the website under "Financial Information/SEC filings," free of charge, our annual report on Form 10-K, our quarterly reports on Form 10-Q, our current reports on Form 8-K and any other reports (including any amendments to such reports) as soon as reasonably practicable after we electronically file or furnish such materials to the SEC. Information on our website, however, is not part of this Annual Report on Form 10-K. All reports filed with the Securities and Exchange Commission may also be read and copied at the SEC’s public reference room at 100 F Street, N.E., Washington, D.C. 20549. Further information regarding the operation of the public reference room may be obtained by calling 1-800-SEC-0330. In addition, all of our filed reports can be obtained at the SEC’s website at www.sec.gov.
11
If any of the following risks occur, our business, financial condition or results of operations could be materially and adversely affected. In that case, the trading price of our common stock could decline, and stockholders may lose some or all of their investment.
Risks Associated With Recent Adverse Developments in the Mortgage Finance and Credit Markets
Difficult conditions in the financial markets and the economy generally have caused us and may continue to cause us market value losses related to our holdings, and we do not expect these conditions to improve in the near future.
Our results of operations are materially affected by conditions in the mortgage market, the financial markets and the economy generally. Recently, concerns over inflation, energy costs, geopolitical issues, the availability and cost of credit, the mortgage market and a declining real estate market have contributed to increased volatility and diminished expectations for the economy and markets going forward. The mortgage market, including the market for prime and Alt-A loans, has been severely affected by changes in the lending landscape and there is no assurance that these conditions have stabilized or that they will not worsen. The severity of the liquidity limitation was largely unanticipated by the markets. For now (and for the foreseeable future), access to mortgages has been substantially limited. This has an impact on new demand for homes, which will compress the home ownership rates and weigh heavily on future home price performance. There is a strong correlation between home price growth rates and mortgage loan delinquencies. The market deterioration has caused us to expect increased losses related to our holdings and, during 2008, to sell assets at a loss. Continued market deterioration may once again force us to sell assets at a loss.
A substantial portion of our assets are classified for accounting purposes as “available-for-sale” and carried at fair value. Changes in the fair values of those assets are directly charged or credited to OCI. As a result, a decline in values may reduce the book value of our assets. Moreover, if the decline in value of an available-for-sale security is other than temporary, such decline will reduce earnings.
All of our repurchase agreements and interest rate swap agreements are subject to bilateral margin calls in the event that the collateral securing our obligations under those facilities exceeds or does not meet our collateralization requirements. For example, during 2008, due to the deterioration in the market value of our assets, we received and met margin calls under our repurchase agreements, which required us to obtain additional funding from third parties, including from Annaly, and taking other steps to increase our liquidity. Additionally, the disruptions during 2008 resulted in us not being in compliance with the net income covenant in one of our whole loan repurchase agreements and the liquidity covenants in our other whole loan repurchase agreement at a time during which we had no amounts outstanding under those facilities. We amended these covenants, and on July 29, 2008, we terminated those facilities to avoid paying non-usage fees. We can provide no assurances that such events will not occur again and at a time when we cannot find additional funding which may result in us having to dispose of assets at an inopportune time when prices are depressed.
Dramatic declines in the housing market, with falling home prices and increasing foreclosures and unemployment, have resulted in significant asset write-downs by financial institutions, which have caused many financial institutions to seek additional capital, to merge with other institutions and, in some cases, to fail. In addition, we rely on the availability of financing to acquire residential mortgage loans, real estate-related securities and real estate loans on a leveraged basis. Institutions from which we will seek to obtain financing may have owned or financed residential mortgage loans, real estate-related securities and real estate loans, which have declined in value and caused them to suffer losses as a result of the recent downturn in the residential mortgage market. Many lenders and institutional investors have reduced and, in some cases, ceased to provide funding to borrowers, including other financial institutions. If these conditions persist, these institutions may become insolvent or tighten their lending standards, which could make it more difficult for us to obtain financing on favorable terms or at all. Our profitability may be adversely affected if we are unable to obtain cost-effective financing for our investments.
12
Mortgage loan modification programs, future legislative action and changes in the requirements necessary to qualify for refinancing a mortgage may adversely affect the value of, and the returns on, the assets in which we invest.
During the second half of 2008, in 2009, and in 2010, the U.S. government, through the Federal Housing Administration, or FHA, and the FDIC, implemented programs designed to provide homeowners with assistance in avoiding residential mortgage loan foreclosures including the Hope for Homeowners Act of 2008, which allows certain distressed borrowers to refinance their mortgages into FHA-insured loans and the Home Affordable Modification Program, or HAMP, which provides a detailed, uniform model for one-time modification of eligible residential mortgage loans. The programs may also involve, among other things, the modification of mortgage loans to reduce the principal amount of the loans or the rate of interest payable on the loans, or to extend the payment terms of the loans. Members of the U.S. Congress have indicated support for additional legislative relief for homeowners, including an amendment of the bankruptcy laws to permit the modification of mortgage loans in bankruptcy proceedings. These loan modification programs, including future legislative or regulatory actions and amendments to the bankruptcy laws, that result in the modification of outstanding mortgage loans, as well as changes in the requirements necessary to qualify for refinancing a mortgage may adversely affect the value of, and the returns on, our non-Agency RMBS and Agency RMBS. Depending on whether or not we purchased an instrument at a premium or discount, the yield we receive may be positively or negatively impacted by any modification.
The U.S. Government's pressing for refinancing of certain loans may affect prepayment rates for mortgage loans in mortgage-backed securities.
In addition to the increased pressure upon residential mortgage loan investors and servicers to engage in loss mitigation activities, the U.S. Government is pressing for refinancing of certain loans, and this encouragement may affect prepayment rates for mortgage loans in mortgage-backed securities. In connection with government-related securities, in February 2009 President Obama unveiled the Homeowner Affordability and Stability Plan, which, in part, calls upon Fannie Mae and Freddie Mac to loosen their eligibility criteria for the purchase of loans in order to provide access to low-cost refinancing for borrowers who are current on their mortgage payments but who cannot otherwise qualify to refinance at a lower market rate. The major change was to permit an increase in the loan-to-value, or LTV, ratio of a refinancing loan eligible for sale up to 105%. In July 2009, the FHFA authorized Fannie Mae and Freddie Mac to raise the present LTV ratio ceiling of 105% to 125%. The charters governing the operations of Fannie Mae and Freddie Mac prohibit purchases of loans with loan to value ratios in excess of 80% unless the loans have mortgage insurance (or unless other types of credit enhancement are provided in accordance with the statutory requirements). The FHFA, which regulates Fannie Mae and Freddie Mac, determined that new mortgage insurance will not be required on the refinancing if the applicable entity already owns the loan or guarantees the related mortgage-backed securities. Additionally, the Treasury reports that in some cases a new appraisal will not be necessary upon refinancing. The Treasury estimates that up to 5,000,000 homeowners with loans owned or guaranteed by Fannie Mae or Freddie Mac may be eligible for this refinancing program, which has been extended to terminate in June 2011.
The HERA authorized a voluntary FHA mortgage insurance program called HOPE for Homeowners, or H4H Program, designed to refinance certain delinquent borrowers into new FHA-insured loans. The H4H Program targets delinquent borrowers under conventional mortgage loans, as well as under government-insured or -guaranteed mortgage loans, that were originated on or before January 1, 2008. Holders of existing mortgage loans being refinanced under the H4H Program must accept a write-down of principal and waive all prepayment fees. While the use of the program has been extremely limited to date, Congress continues to amend the program to encourage its use. The H4H Program is effective through September 30, 2011.
The U.S. Department of Housing and Urban Development launched the FHA Short Refinance Option for people who owe more on their mortgage than their home is worth because their local markets saw large declines in home values. These people can refinance their mortgages into an FHA loan subject to certain conditions. This program, which the Administration estimates could help up to 3 million to 4 million homeowners, is due to run through the end of 2012.
To the extent these and other economic stabilization or stimulus efforts are successful in increasing prepayment speeds for residential mortgage loans, such as those in mortgage-backed securities, that could potentially harm our income and operating results, particularly in connection with loans or mortgage-backed securities purchased at a premium or our interest-only securities.
13
The actions of the U.S. government, Federal Reserve and Treasury, including the establishment of the TALF and the PPIP, may adversely affect our business.
The TALF was first announced by the Treasury on November 25, 2008, and has been expanded in size and scope since its initial announcement. Under the TALF, the Federal Reserve Bank of New York makes non-recourse loans to borrowers to fund their purchase of eligible assets, currently certain asset backed securities but not RMBS. The nature of the eligible assets has been expanded several times. The Treasury has stated that through its expansion of the TALF, non-recourse loans will be made available to investors to certain fund purchases of legacy securitization assets. On March 23, 2009, the Treasury in conjunction with the FDIC, and the Federal Reserve, announced the PPIP. The PPIP aims to recreate a market for specific illiquid residential and commercial loans and securities through a number of joint public and private investment funds. The PPIP is designed to draw new private capital into the market for these securities and loans by providing government equity co-investment and attractive public financing. The TALF program ended in June 2010.
It is not possible to predict how the TALF, the PPIP, or other recent U.S. Government actions will impact the financial markets, including current significant levels of volatility, or our current or future investments. To the extent the market does not respond favorably to these initiatives or they do not function as intended, our business may not receive any benefits from this legislation. In addition, the U.S. government, Federal Reserve, Treasury and other governmental and regulatory bodies have taken or are considering taking other actions to address the financial crisis. We cannot predict whether or when such actions may occur, and such actions could have a dramatic impact on our business, results of operations and financial condition.
There can be no assurance that the actions of the U.S. Government, the Federal Reserve, the Treasury and other governmental and regulatory bodies for the purpose of stabilizing the financial markets, including the establishment of the TALF and the PPIP, or market response to those actions, will achieve the intended effect, that our business will benefit from these actions or that further government or market developments will not adversely impact us.
In response to the financial issues affecting the banking system and the financial markets and going concern threats to investment banks and other financial institutions, the U.S. Government, the Federal Reserve, the Treasury and other governmental and regulatory bodies have taken action to attempt to stabilize the financial markets. Significant measures include the enactment of the Economic Stabilization Act of 2008, or the EESA, to, among other things, establish the Troubled Asset Relief Program, or the TARP; the enactment of the HERA, which established a new regulator for Fannie Mae and Freddie Mac; the establishment of the TALF; and the establishment of the PPIP.
There can be no assurance that the EESA, HERA, TALF, PPIP or other recent U.S. Government actions will have a beneficial impact on the financial markets, including on current levels of volatility. To the extent the market does not respond favorably to these initiatives or these initiatives do not function as intended, our business may not receive the anticipated positive impact from the legislation. There can also be no assurance that we will be eligible to participate in any programs established by the U.S. Government such as the TALF or the PPIP or, if we are eligible, that we will be able to utilize them successfully or at all. In addition, because the programs are designed, in part, to provide liquidity to restart the market for certain of our targeted assets, the establishment of these programs may result in increased competition for attractive opportunities in our targeted assets. It is also possible that our competitors may utilize the programs which would provide them with attractive debt and equity capital funding from the U.S. Government. In addition, the U.S. Government, the Federal Reserve, the Treasury and other governmental and regulatory bodies have taken or are considering taking other actions to address the financial crisis. We cannot predict whether or when such actions may occur, and such actions could have a dramatic impact on our business, results of operations and financial condition.
The conservatorship of Fannie Mae and Freddie Mac, their reliance upon the U.S. Government for solvency, and related efforts that may significantly affect Fannie Mae and Freddie Mac and their relationship with the U.S. Government, may adversely affect our business, operations and financial condition.
Due to increased market concerns about Fannie Mae and Freddie Mac’s ability to withstand future credit losses associated with securities held in their investment portfolios, and on which they provide guarantees, without the direct support of the U.S. Government Congress passed the Housing and Economic Recovery Act of 2008, or the HERA. Among other things, the HERA established the Federal Housing Finance Agency, or FHFA, which has broad regulatory powers over Fannie Mae and Freddie Mac. On September 6, 2008, the FHFA placed Fannie Mae and Freddie Mac into conservatorship and, together with the Treasury, established a program designed to boost investor confidence in Fannie Mae’s and Freddie Mac’s debt and mortgage-backed securities. As the conservator of Fannie Mae and Freddie Mac, the FHFA controls and directs their operations and may (1) take over the assets of and operate Fannie Mae and Freddie Mac with all the powers of their shareholders, directors and officers of Fannie Mae and Freddie Mac and conduct all business of Fannie Mae and Freddie Mac; (2) collect all obligations and money due to Fannie Mae and Freddie Mac; (3) perform all functions of Fannie Mae and Freddie Mac which are consistent with the conservator’s appointment; (4) preserve and conserve the assets and property of Fannie Mae and Freddie Mac; and (5) contract for assistance in fulfilling any function, activity, action or duty of the conservator.
14
In addition to FHFA becoming the conservator of Fannie Mae and Freddie Mac, the Treasury and Fannie Mae and Freddie Mac have entered into Preferred Stock Purchase Agreements (or PSPAs) pursuant to which the Treasury has ensured that each of Fannie Mae and Freddie Mac maintains a positive net worth. On December 24, 2009, the Treasury amended the terms of the PSPAs to remove the $200 billion per institution limit established under the PSPAs until the end of 2012. The Treasury also amended the PSPAs with respect to the requirements for Fannie Mae and Freddie Mac to reduce their portfolios.
In addition, in 2008 the Federal Reserve established a program to purchase $100 billion in direct obligations of Fannie Mae, Freddie Mac and the Federal Home Loan Bank and $500 billion in Agency mortgage-backed securities. These targets were increased in March 2009 to $200 billion and $1.25 trillion of Agency debentures and Agency mortgage-backed securities, respectively. The Federal Reserve stated that its actions were intended to reduce the cost and increase the availability of credit for the purchase of houses, and were meant to support housing markets and foster improved conditions in financial markets more generally. The Federal Reserve completed this program in March 2010.
The problems faced by Fannie Mae and Freddie Mac resulting in their placement into federal conservatorship and receipt of significant U.S. Government support have sparked debate among some federal policy makers regarding the continued role of the U.S. Government in providing liquidity for mortgage loans and mortgage-backed securities. With Fannie Mae’s and Freddie Mac’s future under debate, the nature of their guarantee obligations could be considerably limited relative to historical measurements. Any changes to the nature of their guarantee obligations could redefine what constitutes a mortgage-backed security and could have broad adverse implications for the market and our business, operations and financial condition. If Fannie Mae or Freddie Mac are eliminated, or their structures change radically (i.e., limitation or removal of the guarantee obligation), we may be unable to acquire Agency RMBS.
Although the Treasury previously committed capital to Fannie Mae and Freddie Mac through 2012, and in the White Paper the Treasury committed to providing sufficient capital to enable Fannie Mae and Freddie Mac to meet their current and future guarantee obligations, there can be no assurance that these actions will be adequate for their needs. If these actions are inadequate, Fannie Mae and Freddie Mac could continue to suffer losses and could fail to honor their guarantees and other obligations. Furthermore, the current credit support provided by the Treasury to Fannie Mae and Freddie Mac, and any additional credit support it may provide in the future, could have the effect of lowering the interest rates we expect to receive from mortgage-backed securities, and tightening the spread between the interest we earn on our mortgage-backed securities and the cost of financing those assets.
On February 11, 2011, the U.S Department of the Treasury (or Treasury) issued a White Paper titled “Reforming America's Housing Finance Market” (or the White Paper) that lays out, among other things, proposals to limit or potentially wind down the role that Fannie Mae and Freddie Mac play in the mortgage market. Any such proposals, if enacted, may have broad adverse implications for the mortgage-backed securities market and our business, operations and financial condition. We expect such proposals to be the subject of significant discussion and it is not yet possible to determine whether or when such proposals may be enacted, what form any final legislation or policies might take and how proposals, legislation or policies emanating from the White Paper may impact the mortgage-backed securities market and our business, operations and financial condition. We are evaluating, and will continue to evaluate, the potential impact of the proposals set forth in the White Paper.
Future policies that change the relationship between Fannie Mae and Freddie Mac and the U.S. Government, including those that result in their winding down, nationalization, privatization, or elimination, may create market uncertainty and have the effect of reducing the actual or perceived credit quality of securities issued or guaranteed by Fannie Mae or Freddie Mac. As a result, such policies could increase the risk of loss on investments in mortgage-backed securities guaranteed by Fannie Mae and/or Freddie Mac. It also is possible that such policies could adversely impact the market for such securities and spreads at which they trade. All of the foregoing could materially and adversely affect our business, operations and financial condition.
15
We have received financing from Annaly which is a significant shareholder of ours and which owns our Manager.
Our ability to fund our investments on a leveraged basis depends to a large extent upon our ability to secure warehouse, repurchase, credit, and/or commercial paper financing on acceptable terms. The current dislocation in the non-Agency mortgage sector has made it difficult for us to obtain short-term financing on favorable terms. As a result, we have completed loan securitizations in order to obtain long-term financing and terminated our un-utilized whole loan repurchase agreements in order to avoid paying non-usage fees under those agreements. In addition, commencing in 2008, we entered into a RMBS repurchase agreement with Annaly, which owns approximately 4.38% of our outstanding shares of common stock. This agreement contains customary representations, warranties and covenants contained in such agreements including Annaly having the right to make margin calls if the value of our RMBS collateralizing the agreement falls. As of December 31, 2009, we had $259.0 million outstanding under this agreement which consists of approximately 10.95% of our total financing. As of December 31, 2010, we had no amounts outstanding under this agreement. We cannot assure you that Annaly will provide us with financing in the future. If Annaly does not provide us with financing at a time we are unable to obtain other financing, we could be forced to sell our assets at an inopportune time when prices are depressed.
Risks Associated With Our Management and Relationship With Our Manager
We are dependent on our Manager and its key personnel for our success.
We have no separate facilities and are completely reliant on our Manager. We have no employees other than our officers. Our officers are also employees of our Manager, which has significant discretion as to the implementation of our investment and operating policies and strategies. Accordingly, we depend on the diligence, skill and network of business contacts of the senior management of our Manager. Our Manager’s employees evaluate, negotiate, structure, close and monitor our investments; therefore, our success will depend on their continued service. The departure of any of the senior managers of our Manager could have a material adverse effect on our performance. In addition, we can offer no assurance that our Manager will remain our investment manager or that we will continue to have access to our Manager’s senior managers. Our management agreement with our Manager only extends until December 31, 2011. If the management agreement is terminated and no suitable replacement is found to manage us, we may not be able to execute our business plan. Moreover, our Manager is not obligated to dedicate certain of its employees exclusively to us nor is it obligated to dedicate any specific portion of its time to our business, and none of our Manager’s employees are contractually dedicated to us under our management agreement with our Manager. The only employees of our Manager who are primarily dedicated to our operations are Matthew Lambiase, our President and Chief Executive Officer, Alexandra Denahan, our Chief Financial Officer, Christian J. Woschenko, our Head of Investments, and William B. Dyer, our Head of Underwriting.
There are conflicts of interest in our relationship with our Manager and Annaly, which could result in decisions that are not in the best interests of our stockholders.
We are subject to conflicts of interest arising out of our relationship with Annaly and our Manager. An Annaly executive officer is our Manager’s sole director, two of Annaly’s employees are our directors and several of Annaly’s employees are officers of our Manager and us. Specifically, each of our officers also serves as an employee of our Manager or its affiliates. As a result, our Manager and our officers may have conflicts between their duties to us and their duties to, and interests in, Annaly or our Manager. There may also be conflicts in allocating investments which are suitable both for us and Annaly as well as other FIDAC managed investment vehicles, including CreXus Investment Corp., or CreXus, a public specialty finance company that acquires, manages, and finances, directly or through its subsidiaries, commercial mortgage loans and other commercial real estate debt, CMBS, and other commercial real estate-related assets. Annaly owns approximately 4.5 million shares of common stock of CreXus. Annaly and CreXus may compete with us with respect to certain investments which we may want to acquire, and as a result we may either not be presented with the opportunity or have to compete with Annaly to acquire these investments. Our Manager and our officers may choose to allocate favorable investments to Annaly or CreXus instead of to us. The ability of our Manager and its officers and employees to engage in other business activities may reduce the time our Manager spends managing us. Further, during turbulent conditions in the mortgage industry, distress in the credit markets or other times when we will need focused support and assistance from our Manager, other entities for which our Manager also acts as an investment manager will likewise require greater focus and attention, placing our Manager’s resources in high demand. In such situations, we may not receive the necessary support and assistance we require or would otherwise receive if we were internally managed or if our Manager did not act as a manager for other entities. There is no assurance that the allocation policy that addresses some of the conflicts relating to our investments will be adequate to address all of the conflicts that may arise. In addition, we have entered into a repurchase agreement with Annaly, our Manager’s parent, to finance our RMBS. This financing arrangement may make us less likely to terminate our Manager. It could also give rise to further conflicts because Annaly may be a creditor of ours. As one of our creditors, Annaly’s interests may diverge from the interests of our stockholders.
16
We pay our Manager substantial management fees regardless of the performance of our portfolio. Our Manager’s entitlement to substantial nonperformance-based compensation might reduce its incentive to devote its time and effort to seeking investments that provide attractive risk-adjusted returns for our portfolio. This in turn could hurt both our ability to make distributions to our stockholders and the market price of our common stock. Annaly owns approximately 4.38% of our outstanding shares of common stock which entitles them to receive quarterly distributions. In evaluating investments and other management strategies, this may lead our Manager to place emphasis on the maximization of revenues at the expense of other criteria, such as preservation of capital. Investments with higher yield potential are generally riskier or more speculative. This could result in increased risk to the value of our invested portfolio. Annaly may sell the shares in us purchased concurrently with our initial public offering at any time. Annaly may sell the shares in us purchased immediately after our 2008 secondary offering at any time after the earlier of (i) October 24, 2011 or (ii) the termination of the management agreement. Annaly may sell the shares in us that it purchased immediately after our April 15, 2009 secondary offering at any time after the earlier of (i) April 15, 2012 or (ii) the termination of the management agreement. Annaly may sell the shares in us that it purchased immediately after our May 27, 2009 secondary offering at any time after the earlier of (i) May 27, 2012 or (ii) the termination of the management agreement. To the extent Annaly sells some of its shares, its interests may be less aligned with our interests.
The management agreement with our Manager was not negotiated on an arm’s-length basis and may not be as favorable to us as if it had been negotiated with an unaffiliated third party and may be costly and difficult to terminate.
Our president, chief financial officer, head of investments, treasurer, controller, secretary and head of underwriting also serve as employees of our Manager. In addition, certain of our directors are employees of our Manager or its affiliates. Our management agreement with our Manager was negotiated between related parties, and its terms, including fees payable, may not be as favorable to us as if it had been negotiated with an unaffiliated third party. Termination of the management agreement with our Manager without cause is difficult and costly. Our independent directors review our Manager’s performance and the management fees annually, the management agreement may be terminated annually by us without cause upon the affirmative vote of at least two-thirds of our independent directors, or by a vote of the holders of at least a majority of the outstanding shares of our common stock (other than those shares held by Annaly or its affiliates), based upon: (i) our Manager’s unsatisfactory performance that is materially detrimental to us, or (ii) a determination that the management fees payable to our Manager are not fair, subject to our Manager’s right to prevent termination based on unfair fees by accepting a reduction of management fees agreed to by at least two-thirds of our independent directors. Our Manager must be provided 180-days’ prior notice of any such termination. Additionally, upon such termination, the management agreement provides that we will pay our Manager a termination fee equal to three times the average annual base management fee calculated as of the end of the most recently completed fiscal quarter. These provisions may adversely affect our ability to terminate our Manager without cause. The management agreement is renewable on an annual basis, however, our Manager may terminate the management agreement annually upon 180-days’ prior notice. If the management agreement is terminated and no suitable replacement is found to manage us, we may not be able to execute our business plan.
Our board of directors approved very broad investment guidelines for our Manager and will not approve each investment decision made by our Manager.
Our Manager is authorized to follow very broad investment guidelines. Our board of directors periodically reviews our investment guidelines and our investment portfolio, but does not, and is not required to review all of our proposed investments or any type or category of investment, except that an investment in a security structured or managed by our Manager must be approved by a majority of our independent directors. In addition, in conducting periodic reviews, our board of directors relies primarily on information provided to them by our Manager. Furthermore, our Manager uses complex strategies, and transactions entered into by our Manager may be difficult or impossible to unwind by the time they are reviewed by our board of directors. Our Manager has great latitude within the broad investment guidelines in determining the types of assets it may decide are proper investments for us, which could result in investment returns that are substantially below expectations or that result in losses, which would materially and adversely affect our business operations and results. Further, decisions made and investments entered into by our Manager may not be in the best interests of our stockholders.
17
We may change our investment strategy, asset allocation, or financing plans without stockholder consent, which may result in riskier investments.
We may change our investment strategy, asset allocation, or financing plans at any time without the consent of our stockholders, which could result in our making investments that are different from, and possibly riskier than, the investments described in this Form 10-K. A change in our investment strategy or financing plans may increase our exposure to interest rate and default risk and real estate market fluctuations. Furthermore, a change in our asset allocation could result in our making investments in asset categories different from those described in this Form 10-K. These changes could adversely affect the market price of our common stock and our ability to make distributions to our stockholders.
While investments in investment vehicles managed by our Manager require approval by a majority of our independent directors, our Manager has an incentive to invest our funds in investment vehicles managed by our Manager because of the possibility of generating an additional incremental management fee, which may reduce other investment opportunities available to us. In addition, we cannot assure you that investments in investment vehicles managed by our Manager will prove beneficial to us.
We may invest in CDOs managed by our Manager, including the purchase or sale of all or a portion of the equity of such CDOs, which may result in an immediate loss in book value and present a conflict of interest between us and our Manager.
We may invest in securities of CDOs managed by our Manager. If all of the securities of a CDO managed by our Manager were not fully placed as a result of our not investing, our Manager could experience losses due to changes in the value of the underlying investments accumulated in anticipation of the launch of such investment vehicle. The accumulated investments in a CDO transaction are generally sold at the price at which they were purchased and not the prevailing market price at closing. Accordingly, to the extent we invest in a portion of the equity securities for which there has been a deterioration of value since the securities were purchased, we would experience an immediate loss equal to the decrease in the market value of the underlying investment. As a result, the interests of our Manager in our investing in such a CDO may conflict with our interests and that of our stockholders.
Our investment focus is different from those of other entities that are or have been managed by our Manager.
Our investment focus is different from those of other entities that are or have been managed by our Manager. In particular, entities managed by our Manager have not purchased whole mortgage loans or structured whole loan securitizations. In addition, our Manager has limited experience in managing CDOs and investing in CDOs, non-Agency RMBS, CMBS and other ABS which we may pursue as part of our investment strategy. Accordingly, our Manager’s historical returns are not indicative of its performance for our investment strategy and we can offer no assurance that our Manager will replicate the historical performance of the Manager’s investment professionals in their previous endeavors. Our investment returns could be substantially lower than the returns achieved by our Manager’s investment professionals’ previous endeavors.
We compete with investment vehicles of our Manager for access to our Manager’s resources and investment opportunities.
Our Manager provides investment and financial advice to a number of investment vehicles, including CreXus, and some of our Manager’s personnel are also employees of Annaly and in that capacity are involved in Annaly’s investment process. Accordingly, we will compete with our Manager’s other investment vehicles and with Annaly for our Manager’s resources. Our Manager may sponsor and manage other investment vehicles with an investment focus that overlaps with ours, which could result in us competing for access to the benefits that we expect our relationship with our Manager will provide to us.
18
Risks Related To Our Business
Failure to procure adequate capital and funding on favorable terms, or at all, would adversely affect our results and may, in turn, negatively affect the market price of shares of our common stock and our ability to distribute dividends to our stockholders.
The capital and credit markets have been experiencing extreme volatility and disruption since August 2007. The volatility and disruption have reached unprecedented levels. In some cases, the markets have exerted downward pressure on stock prices and credit capacity for certain lenders. We depend upon the availability of adequate funding and capital for our operations. We intend to finance our assets over the long-term through a variety of means, including repurchase agreements, credit facilities, securitizations, commercial paper and CDOs. Our access to capital depends upon a number of factors over which we have little or no control, including:
|
|
●
|
general market conditions;
|
|
|
●
|
the market’s perception of our growth potential;
|
|
|
●
|
our current and potential future earnings and cash distributions;
|
|
|
●
|
the market price of the shares of our capital stock; and
|
|
|
●
|
the market’s view of the quality of our assets.
|
The current situation in the mortgage sector and the current weakness in the broader credit markets could adversely affect one or more of our potential lenders and could cause one or more of our lenders or potential lenders to be unwilling or unable to provide us with financing. In general, this could potentially increase our financing costs and reduce our liquidity or require us to sell assets at an inopportune time or price.
We have and expect to use a number of sources to finance our investments, including repurchase agreements, warehouse facilities, securitizations, asset-backed commercial paper and term CDOs. Current market conditions have affected the cost and availability of financing from each of these sources — and their individual providers — to different degrees; some sources generally are unavailable, some are available but at a high cost, and some are largely unaffected. For example, in the repurchase agreement market, borrowers have been affected differently depending on the type of security they are financing. Non-Agency RMBS have been harder to finance, depending on the type of assets collateralizing the RMBS. The amount, term and margin requirements associated with these types of financings have been negatively impacted.
Currently, warehouse facilities to finance whole loan prime residential mortgages are generally available from major banks, but at significantly higher cost and greater margin requirements than previously offered. Many major banks that offer warehouse facilities have also reduced the amount of capital available to new entrants and consequently the size of those facilities offered now are smaller than those previously available.
It is currently a challenging market to term finance whole loans through securitization or bonds issued by a CDO structure. The highly rated senior bonds in these securitizations and CDO structures currently have liquidity, but at much wider spreads than issues priced earlier this year. The junior subordinate tranches of these structures currently have few buyers and current market conditions have forced issuers to retain these lower rated bonds rather than sell them.
Certain issuers of ABCP, have been unable to place (or roll) their securities, which has resulted, in some instances, in forced sales of RMBS, and other securities which has further negatively impacted the market value of these assets. These market conditions are fluid and likely to change over time.
As a result, the execution of our investment strategy may be dictated by the cost and availability of financing from these different sources.
In addition, the impairment of other financial institutions could negatively affect us. If one or more major market participants fails or otherwise experience a major liquidity crisis, as was the case for Bear Stearns & Co. in March 2008, and Lehman Brothers Holdings Inc. in September 2008, it could adversely affect the marketability of all fixed income securities and this could negatively impact the value of the securities we acquire, thus reducing our net book value.
19
Furthermore, if any of our potential lenders or any of our lenders are unwilling or unable to provide us with financing, we could be forced to sell our securities or residential mortgage loans at an inopportune time when prices are depressed.
Our business, results of operations and financial condition may be materially adversely affected by disruptions in the financial markets. We cannot assure you, under such extreme conditions, that these markets will remain an efficient source of long-term financing for our assets. If our strategy is not viable, we will have to find alternative forms of financing for our assets, which may not be available. Further, as a REIT, we are required to distribute annually at least 90% of our REIT taxable income, determined without regard to the deduction for dividends paid and excluding net capital gain, to our stockholders and are therefore not able to retain significant amounts of our earnings for new investments. We cannot assure you that any, or sufficient, funding or capital will be available to us in the future on terms that are acceptable to us. If we cannot obtain sufficient funding on acceptable terms, there may be a negative impact on the market price of our common stock and our ability to make distributions to our stockholders. Moreover, our ability to grow will be dependent on our ability to procure additional funding. To the extent we are not able to raise additional funds through the issuance of additional equity or borrowings, our growth will be constrained.
We operate in a highly competitive market for investment opportunities and more established competitors may be able to compete more effectively for investment opportunities than we can.
A number of entities compete with us to make the types of investments that we plan to make. We compete with other REITs, public and private funds, commercial and investment banks and commercial finance companies. Many of our competitors are substantially larger and have considerably greater financial, technical and marketing resources than we do. Several other REITs have recently raised, or are expected to raise, significant amounts of capital, and may have investment objectives that overlap with ours, which may create competition for investment opportunities. Some competitors may have a lower cost of funds and access to funding sources that are not available to us. In addition, some of our competitors may have higher risk tolerances or different risk assessments, which could allow them to consider a wider variety of investments and establish more favorable relationships than us. We cannot assure you that the competitive pressures we face will not have a material adverse effect on our business, financial condition and results of operations. Also, as a result of this competition, we may not be able to take advantage of attractive investment opportunities from time to time, and we can offer no assurance that we will be able to identify and make investments that are consistent with our investment objectives.
Loss of our 1940 Act exemption would adversely affect us and negatively affect the market price of shares of our common stock and our ability to distribute dividends and could result in the termination of the management agreement with our Manager.
We conduct our operations so that neither we nor any of our subsidiaries are required to register as an investment company under the 1940 Act. Because we are a holding company that will conduct its businesses primarily through wholly-owned subsidiaries, the securities issued by these subsidiaries that are excepted from the definition of “investment company” under Section 3(c)(1) or Section 3(c)(7) of the 1940 Act, together with any other investment securities we may own, may not have a combined value in excess of 40% of the value of our adjusted total assets on an unconsolidated basis. This requirement limits the types of businesses in which we may engage through our subsidiaries. In addition, the assets we and our subsidiaries may acquire are limited by the provisions of the 1940 Act, the rules and regulations promulgated under the 1940 Act and SEC staff interpretative guidance, which may adversely affect our performance.
If the value of securities issued by our subsidiaries that are excepted from the definition of “investment company” by Section 3(c)(1) or 3(c)(7) of the 1940 Act, together with any other investment securities we own, exceeds 40% of our adjusted total assets on an unconsolidated basis, or if one or more of such subsidiaries fail to maintain an exception or exemption from the 1940 Act, we could, among other things, be required either (a) to substantially change the manner in which we conduct our operations to avoid being required to register as an investment company or (b) to register as an investment company under the 1940 Act, either of which could have an adverse effect on us and the market price of our securities. If we were required to register as an investment company under the 1940 Act, we would become subject to substantial regulation with respect to our capital structure (including our ability to use leverage), management, operations, transactions with affiliated persons (as defined in the 1940 Act), portfolio composition, including restrictions with respect to diversification and industry concentration, and other matters.
20
We expect certain subsidiaries to rely upon the exemption from registration as an investment company under the 1940 Act pursuant to Section 3(c)(5)(C) of the 1940 Act, which is available for entities “primarily engaged in the business of purchasing or otherwise acquiring mortgages and other liens on and interests in real estate.” This exemption generally requires that at least 55% of these subsidiaries’ assets must be comprised of qualifying real estate assets and at least 80% of each of their portfolios must be comprised of qualifying real estate assets and real estate-related assets under the 1940 Act. We expect each of our subsidiaries relying on Section 3(c)(5)(C) to rely on guidance published by the SEC staff or on our analyses of guidance published with respect to other types of assets to determine which assets are qualifying real estate assets and real estate-related assets. If the SEC staff publishes new or different guidance with respect to these matters, we may be required to adjust our strategy accordingly. In addition, we may be limited in our ability to make certain investments and these limitations could result in the subsidiary holding assets we might wish to sell or selling assets we might wish to hold.
Certain of our subsidiaries may rely on the exemption provided by Section 3(c)(6) which excludes from the definition of “investment company” any company primarily engaged, directly or through majority-owned subsidiaries, in a business, among others, described in Section 3(c)(5)(C) of the 1940 Act (from which not less than 25% of such company's gross income during its last fiscal year was derived) together with an additional business or additional businesses other than investing, reinvesting, owning, holding or trading in securities. The SEC staff has issued little interpretive guidance with respect to Section 3(c)(6) and any guidance published by the staff could require us to adjust our strategy accordingly.
We expect certain of our subsidiaries we may form in the future to rely on Section 3(c)(7) for their 1940 Act exemption and, therefore our interest in each of these subsidiaries would constitute an “investment security” for purposes of determining whether we pass the 40% test.
We may in the future, however, organize one or more subsidiaries that seek to rely on the 1940 Act exemption provided to certain structured financing vehicles by Rule 3a-7. If we organize subsidiaries that rely on Rule 3a-7 for an exemption from the 1940 Act, these subsidiaries will also need to comply with the restrictions described in “Business—Operating and Regulatory Structure—1940 Act Exemption.” In general, Rule 3a-7 exempts from the 1940 Act issuers that limit their activities as follows:
●
the issuer issues securities the payment of which depends primarily on the cash flow from “eligible assets” that by their terms convert into cash within a finite time period;
●
the securities sold are fixed income securities rated investment grade by at least one rating agency (fixed income securities which are unrated or rated below investment grade may be sold to institutional accredited investors and any securities may be sold to “qualified institutional buyers” and to persons involved in the organization or operation of the issuer);
●
the issuer acquires and disposes of eligible assets (1) only in accordance with the agreements pursuant to which the securities are issued, (2) so that the acquisition or disposition does not result in a downgrading of the issuer’s fixed income securities and (3) the eligible assets are not acquired or disposed of for the primary purpose of recognizing gains or decreasing losses resulting from market value changes; and
●
unless the issuer is issuing only commercial paper, the issuer appoints an independent trustee, takes reasonable steps to transfer to the trustee an ownership or perfected security interest in the eligible assets, and meets rating agency requirements for commingling of cash flows.
Any subsidiary also would need to be structured to comply with any guidance that may be issued by the Division of Investment Management of the SEC on how the subsidiary must be organized to comply with the restrictions contained in Rule 3a-7. Compliance with Rule 3a-7 may require that the indenture governing the subsidiary include additional limitations on the types of assets the subsidiary may sell or acquire out of the proceeds of assets that mature, are refinanced or otherwise sold, on the period of time during which such transactions may occur, and on the amount of transactions that may occur. In light of the requirements of Rule 3a-7, our ability to manage assets held in a special purpose subsidiary that complies with Rule 3a-7 will be limited and we may not be able to purchase or sell assets owned by that subsidiary when we would otherwise desire to do so, which could lead to losses. Initially, we will limit the aggregate value of our interests in our subsidiaries that may in the future seek to rely on Rule 3a-7 to 20% or less of our total assets on an unconsolidated basis, as we continue to discuss with the SEC staff the use of subsidiaries that rely on Rule 3a-7 to finance our operations.
21
The determination of whether an entity is a majority-owned subsidiary of our company is made by us. The 1940 Act defines a majority-owned subsidiary of a person as a company of which 50% or more of the outstanding voting securities are owned by such person, or by another company which is a majority-owned subsidiary of such person. The 1940 Act further defines voting securities as any security presently entitling the owner or holder thereof to vote for the election of directors of a company. We treat companies in which we own at least a majority of the outstanding voting securities as majority-owned subsidiaries for purposes of the 40% test. We have not requested the SEC to approve our treatment of any company as a majority-owned subsidiary and the SEC has not done so. If the SEC were to disagree with our treatment of one or more companies as majority-owned subsidiaries, we would need to adjust our strategy and our assets in order to continue to pass the 40% test. Any such adjustment in our strategy could have a material adverse effect on us.
There can be no assurance that the laws and regulations governing the 1940 Act status of REITs, including the Division of Investment Management of the SEC providing more specific or different guidance regarding these exemptions, will not change in a manner that adversely affects our operations. If we or our subsidiaries fail to maintain an exception or exemption from the 1940 Act, we could, among other things, be required either to (a) change the manner in which we conduct our operations to avoid being required to register as an investment company, (b) effect sales of our assets in a manner that, or at a time when, we would not otherwise choose to do so, or (c) register as an investment company, any of which could negatively affect the value of our common stock, the sustainability of our business model, and our ability to make distributions which could have an adverse effect on our business and the market price for our shares of common stock.
Rapid changes in the values of our RMBS, residential mortgage loans, and other real estate-related investments may make it more difficult for us to maintain our qualification as a REIT or our exemption from the 1940 Act.
If the market value or income potential of our RMBS, residential mortgage loans, and other real estate-related investments declines as a result of increased interest rates, prepayment rates or other factors, we may need to increase our real estate investments and income or liquidate our non-qualifying assets to maintain our REIT qualification or our exemption from the 1940 Act. If the decline in real estate asset values or income occurs quickly, this may be especially difficult to accomplish. This difficulty may be exacerbated by the illiquid nature of any non-real estate assets we may own. We may have to make investment decisions that we otherwise would not make absent the REIT and 1940 Act considerations.
We leverage our investments, which may adversely affect our return on our investments and may reduce cash available for distribution to our stockholders.
We leverage our investments through borrowings, generally through the use of repurchase agreements, warehouse facilities, credit facilities, securitizations, commercial paper and CDOs. We are not required to maintain any specific debt-to-equity ratio. The amount of leverage we use varies depending on our ability to obtain credit facilities, the lenders’ and rating agencies’ estimates of the stability of the investments’ cash flow, and our assessment of the appropriate amount of leverage for the particular assets we are funding. Under some credit facilities, we expect to be required to maintain minimum average cash balances in connection with borrowings. Our return on our investments and cash available for distribution to our stockholders may be reduced to the extent that changes in market conditions prevent us from leveraging our investments, require us to decrease our rate of leverage, increase the amount of collateral we post, or increase the cost of our financing relative to the income that can be derived from the assets acquired. Our debt service payments will reduce cash flow available for distributions to stockholders, which could adversely affect the price of our common stock. We may not be able to meet our debt service obligations, and, to the extent that we cannot, we risk the loss of some or all of our assets to foreclosure or sale to satisfy the obligations. We leverage certain of our assets through repurchase agreements. A decrease in the value of these assets may lead to margin calls which we will have to satisfy. We may not have the funds available to satisfy any such margin calls and we may be forced to sell assets at significantly depressed prices due to market conditions or otherwise. The satisfaction of such margin calls may reduce cash flow available for distribution to our stockholders. Any reduction in distributions to our stockholders or sales of assets at inopportune times or prices may cause the value of our common stock to decline, in some cases, precipitously.
22
We depend on warehouse and repurchase facilities, credit facilities and commercial paper to execute our business plan, and our inability to access funding could have a material adverse effect on our results of operations, financial condition and business.
Our ability to fund our investments depends to a large extent upon our ability to secure warehouse, repurchase, credit, and commercial paper financing on acceptable terms. We can provide no assurance that we will be successful in establishing sufficient warehouse, repurchase, and credit facilities and issuing commercial paper. In addition, because warehouse, repurchase, and credit facilities and commercial paper are short-term commitments of capital, the lenders may respond to market conditions, which may favor an alternative investment strategy for them, making it more difficult for us to secure continued financing. During certain periods of the credit cycle, such as recently, lenders may curtail their willingness to provide financing. If we are not able to renew our then existing warehouse, repurchase, and credit facilities and issue commercial paper or arrange for new financing on terms acceptable to us, or if we default on our covenants or are otherwise unable to access funds under any of these facilities, we will have to curtail our asset acquisition activities.
It is possible that the lenders that provide us with financing could experience changes in their ability to advance funds to us, independent of our performance or the performance of our investments, including our mortgage loans. In addition, if the regulatory capital requirements imposed on our lenders change, they may be required to significantly increase the cost of the warehouse facilities that they provide to us. Our lenders also may revise their eligibility requirements for the types of residential mortgage loans they are willing to finance or the terms of such financings, based on, among other factors, the regulatory environment and their management of perceived risk, particularly with respect to assignee liability. Financing of equity-based lending, for example, may become more difficult in the future. Moreover, the amount of financing we will receive under our warehouse and repurchase facilities will be directly related to the lenders’ valuation of the assets that secure the outstanding borrowings. Typically warehouse, repurchase, and credit facilities grant the respective lender the absolute right to reevaluate the market value of the assets that secure outstanding borrowings at any time. If a lender determines in its sole discretion that the value of the assets has decreased, it has the right to initiate a margin call. A margin call would require us to transfer additional assets to such lender without any advance of funds from the lender for such transfer or to repay a portion of the outstanding borrowings. Any such margin call could have a material adverse effect on our results of operations, financial condition, business, liquidity and ability to make distributions to our stockholders, and could cause the value of our common stock to decline. We may be forced to sell assets at significantly depressed prices to meet such margin calls and to maintain adequate liquidity, which could cause us to incur losses. Moreover, to the extent we are forced to sell assets at such time, given market conditions, we may be forced to sell assets at the same time as others facing similar pressures to sell similar assets, which could greatly exacerbate a difficult market environment and which could result in our incurring significantly greater losses on our sale of such assets. In an extreme case of market duress, a market may not even be present for certain of our assets at any price.
Certain financing facilities may contain covenants that restrict our operations and may inhibit our ability to grow our business and increase revenues.
Certain financing facilities we may enter into may contain extensive restrictions, covenants, and representations and warranties that, among other things, require us to satisfy specified financial, asset quality, loan eligibility and loan performance tests. If we fail to meet or satisfy any of these covenants or representations and warranties, we would be in default under these agreements and our lenders could elect to declare all amounts outstanding under the agreements to be immediately due and payable, enforce their respective interests against collateral pledged under such agreements and restrict our ability to make additional borrowings. Certain financing agreements may contain cross-default provisions, so that if a default occurs under any one agreement, the lenders under our other agreements could also declare a default. The covenants and restrictions we expect in our financing facilities may restrict our ability to, among other things:
|
●
|
incur or guarantee additional debt;
|
|
|
●
|
make certain investments or acquisitions;
|
|
|
●
|
make distributions on or repurchase or redeem capital stock;
|
|
|
●
|
engage in mergers or consolidations;
|
|
|
●
|
finance mortgage loans with certain attributes;
|
|
|
●
|
reduce liquidity below certain levels;
|
|
|
●
|
grant liens;
|
|
|
●
|
incur operating losses for more than a specified period;
|
|
|
●
|
enter into transactions with affiliates; and
|
|
|
●
|
hold mortgage loans for longer than established time periods.
|
23
These restrictions may interfere with our ability to obtain financing, including the financing needed to qualify as a REIT, or to engage in other business activities, which may significantly harm our business, financial condition, liquidity and results of operations. A default and resulting repayment acceleration could significantly reduce our liquidity, which could require us to sell our assets to repay amounts due and outstanding. This could also significantly harm our business, financial condition, results of operations, and our ability to make distributions, which could cause the value of our common stock to decline. A default will also significantly limit our financing alternatives such that we will be unable to pursue our leverage strategy, which could curtail our investment returns.
The repurchase agreements, warehouse facilities and credit facilities and commercial paper that we use to finance our investments may require us to provide additional collateral and may restrict us from leveraging our assets as fully as desired.
We will try to use repurchase agreements, warehouse facilities, credit facilities and commercial paper to finance our investments. We currently have uncommitted repurchase agreements with 23 counterparties, including Annaly, for financing our RMBS. Our repurchase agreements are uncommitted and the counterparty may refuse to advance funds under the agreements to us. If the market value of the loans or securities pledged or sold by us to a funding source decline in value, we may be required by the lending institution to provide additional collateral or pay down a portion of the funds advanced, but we may not have the funds available to do so. Posting additional collateral will reduce our liquidity and limit our ability to leverage our assets, which could adversely affect our business. In the event we do not have sufficient liquidity to meet such requirements, lending institutions can accelerate repayment of our indebtedness, increase our borrowing rates, liquidate our collateral or terminate our ability to borrow. Such a situation would likely result in a rapid deterioration of our financial condition and possibly necessitate a filing for protection under the U.S. Bankruptcy Code. Further, financial institutions may require us to maintain a certain amount of cash that is not invested or to set aside non-levered assets sufficient to maintain a specified liquidity position which would allow us to satisfy our collateral obligations. As a result, we may not be able to leverage our assets as fully as we would choose which could reduce our return on equity. If we are unable to meet these collateral obligations, then, as described above, our financial condition could deteriorate rapidly.
If the counterparty to our repurchase transactions defaults on its obligation to resell the underlying security back to us at the end of the transaction term, or if the value of the underlying security has declined as of the end of that term or if we default on our obligations under the repurchase agreement, we will lose money on our repurchase transactions.
When we engage in a repurchase transaction, we generally sell securities to the transaction counterparty and receive cash from the counterparty. The counterparty is obligated to resell the securities back to us at the end of the term of the transaction, which is typically 30-90 days. Because the cash we receive from the counterparty when we initially sell the securities to the counterparty is less than the value of those securities (this difference is referred to as the haircut), if the counterparty defaults on its obligation to resell the securities back to us we would incur a loss on the transaction equal to the amount of the haircut (assuming there was no change in the value of the securities). We would also lose money on a repurchase transaction if the value of the underlying securities has declined as of the end of the transaction term, as we would have to repurchase the securities for their initial value but would receive securities worth less than that amount. Any losses we incur on our repurchase transactions could adversely affect our earnings, and thus our cash available for distribution to our stockholders. If we default on one of our obligations under a repurchase transaction, the counterparty can terminate the transaction and cease entering into any other repurchase transactions with us. In that case, we would likely need to establish a replacement repurchase facility with another repurchase dealer in order to continue to leverage our portfolio and carry out our investment strategy. There is no assurance we would be able to establish a suitable replacement facility.
24
Our rights under our repurchase agreements are subject to the effects of the bankruptcy laws in the event of the bankruptcy or insolvency of us or our lenders under the repurchase agreements.
In the event of our insolvency or bankruptcy, certain repurchase agreements may qualify for special treatment under the U.S. Bankruptcy Code, the effect of which, among other things, would be to allow the lender under the applicable repurchase agreement to avoid the automatic stay provisions of the U.S. Bankruptcy Code and to foreclose on the collateral agreement without delay. In the event of the insolvency or bankruptcy of a lender during the term of a repurchase agreement, the lender may be permitted, under applicable insolvency laws, to repudiate the contract, and our claim against the lender for damages may be treated simply as an unsecured creditor. In addition, if the lender is a broker or dealer subject to the Securities Investor Protection Act of 1970, or an insured depository institution subject to the Federal Deposit Insurance Act, our ability to exercise our rights to recover our securities under a repurchase agreement or to be compensated for any damages resulting from the lender’s insolvency may be further limited by those statutes. These claims would be subject to significant delay and, if and when received, may be substantially less than the damages we actually incur.
An increase in our borrowing costs relative to the interest we receive on our assets may adversely affect our profitability, and thus our cash available for distribution to our stockholders.
As our repurchase agreements and other short-term borrowings mature, we will be required either to enter into new borrowings or to sell certain of our investments. An increase in short-term interest rates at the time that we seek to enter into new borrowings would reduce the spread between our returns on our assets and the cost of our borrowings. This would adversely affect our returns on our assets that are subject to prepayment risk, including our mortgage-backed securities, which might reduce earnings and, in turn, cash available for distribution to our stockholders.
If we issue senior securities we will be exposed to additional risks.
If we decide to issue senior securities in the future, it is likely that they will be governed by an indenture or other instrument containing covenants restricting our operating flexibility. Additionally, any convertible or exchangeable securities that we issue in the future may have rights, preferences and privileges more favorable than those of our common stock and may result in dilution to owners of our common stock. We and, indirectly, our stockholders, will bear the cost of issuing and servicing such securities.
Our securitizations will expose us to additional risks.
We have and expect to continue to securitize certain of our portfolio investments to generate cash for funding new investments. We expect to structure these transactions either as financing transactions or as sales for GAAP. In each such transaction, we convey a pool of assets to a special purpose vehicle, the issuing entity, and the issuing entity issues one or more classes of non-recourse notes pursuant to the terms of an indenture. The notes are secured by the pool of assets. In exchange for the transfer of assets to the issuing entity, we receive the cash proceeds of the sale of non-recourse notes and a 100% interest in the equity of the issuing entity. The securitization of our portfolio investments might magnify our exposure to losses on those portfolio investments because any equity interest we retain in the issuing entity would be subordinate to the notes issued to investors and we would, therefore, absorb all of the losses sustained with respect to a securitized pool of assets before the owners of the notes experience any losses. Moreover, we cannot be assured that we will be able to access the securitization market, or be able to do so at favorable rates. The inability to securitize our portfolio could hurt our performance and our ability to grow our business.
The use of CDO financings with over-collateralization requirements may have a negative impact on our cash flow.
We expect that the terms of CDOs we may sponsor will generally provide that the principal amount of assets must exceed the principal balance of the related bonds by a certain amount, commonly referred to as ‘‘over-collateralization.’’ We anticipate that the CDO terms will provide that, if certain delinquencies or losses exceed the specified levels based on the analysis by the rating agencies (or any financial guaranty insurer) of the characteristics of the assets collateralizing the bonds, the required level of over-collateralization may be increased or may be prevented from decreasing as would otherwise be permitted if losses or delinquencies did not exceed those levels. Other tests (based on delinquency levels or other criteria) may restrict our ability to receive net income from assets collateralizing the obligations. We cannot assure you that the performance tests will be satisfied. In advance of completing negotiations with the rating agencies or other key transaction parties on our future CDO financings, we cannot assure you of the actual terms of the CDO delinquency tests, over-collateralization terms, cash flow release mechanisms or other significant factors regarding the calculation of net income to us. Given recent volatility in the CDO market, rating agencies may depart from historic practices for CDO financings, making them more costly for us. Failure to obtain favorable terms with regard to these matters may materially and adversely affect the availability of net income to us. If our assets fail to perform as anticipated, our over-collateralization or other credit enhancement expense associated with our CDO financings will increase.
25
Hedging against interest rate exposure may adversely affect our earnings, which could reduce our cash available for distribution to our stockholders.
Subject to maintaining our qualification as a REIT, we pursue various hedging strategies to seek to reduce our exposure to losses from adverse changes in interest rates. Our hedging activity varies in scope based on the level and volatility of interest rates, the type of assets held and other changing market conditions. Interest rate hedging may fail to protect or could adversely affect us because, among other things:
|
|
●
|
interest rate hedging can be expensive, particularly during periods of rising and volatile interest rates;
|
|
|
●
|
available interest rate hedges may not correspond directly with the interest rate risk for which protection is sought;
|
|
|
●
|
the duration of the hedge may not match the duration of the related liability;
|
|
|
●
|
the amount of income that a REIT may earn from hedging transactions (other than through TRSs) to offset interest rate losses is limited by federal tax provisions governing REITs;
|
|
|
●
|
the credit quality of the party owing money on the hedge may be downgraded to such an extent that it impairs our ability to sell or assign our side of the hedging transaction; and
|
|
|
●
|
the party owing money in the hedging transaction may default on its obligation to pay.
|
Our hedging transactions, which are intended to limit losses, may actually limit gains and increase our exposure to losses. As a result, our hedging activity may adversely affect our earnings, which could reduce our cash available for distribution to our stockholders. In addition, hedging instruments involve risk since they often are not traded on regulated exchanges, guaranteed by an exchange or its clearing house, or regulated by any U.S. or foreign governmental authorities. Consequently, there are no requirements with respect to record keeping, financial responsibility or segregation of customer funds and positions. Furthermore, the enforceability of agreements underlying derivative transactions may depend on compliance with applicable statutory and commodity and other regulatory requirements and, depending on the identity of the counterparty, applicable international requirements. The business failure of a hedging counterparty with whom we enter into a hedging transaction will most likely result in its default. Default by a party with whom we enter into a hedging transaction may result in the loss of unrealized profits and force us to cover our commitments, if any, at the then current market price. Although generally we will seek to reserve the right to terminate our hedging positions, it may not always be possible to dispose of or close out a hedging position without the consent of the hedging counterparty, and we may not be able to enter into an offsetting contract in order to cover our risk. We cannot assure you that a liquid secondary market will exist for hedging instruments purchased or sold, and we may be required to maintain a position until exercise or expiration, which could result in losses.
Our hedging strategies may not be successful in mitigating the risks associated with interest rates.
Subject to complying with REIT tax requirements, we have employed and intend to continue to employ techniques that limit, or hedge, the adverse effects of rising interest rates on our short-term repurchase agreements. In general, our hedging strategy depends on our view of our entire portfolio, consisting of assets, liabilities and derivative instruments, in light of prevailing market conditions. We could misjudge the condition of our investment portfolio or the market.
Our hedging activity will vary in scope based on the level and volatility of interest rates and principal repayments, the type of securities held and other changing market conditions. Our actual hedging decisions will be determined in light of the facts and circumstances existing at the time and may differ from our currently anticipated hedging strategy. These techniques may include entering into interest rate caps, collars, floors, forward contracts, futures or swap agreements. We may conduct certain hedging transactions through a TRS, which will be subject to federal, state and, if applicable, local income tax.
26
There are no perfect hedging strategies, and interest rate hedging may fail to protect us from loss. Alternatively, we may fail to properly assess a risk to our investment portfolio or may fail to recognize a risk entirely, leaving us exposed to losses without the benefit of any offsetting hedging activities. The derivative financial instruments we select may not have the effect of reducing our interest rate risk. The nature and timing of hedging transactions may influence the effectiveness of these strategies. Poorly designed strategies or improperly executed transactions could actually increase our risk and losses. In addition, hedging activities could result in losses if the event against which we hedge does not occur. For example, interest rate hedging could fail to protect us or adversely affect us because, among other things:
|
|
●
|
available interest rate hedging may not correspond directly with the interest rate risk for which protection is sought;
|
|
|
●
|
the duration of the hedge may not match the duration of the related liability;
|
|
|
●
|
as explained in further detail in the risk factor immediately below, the party owing money in the hedging transaction may default on its obligation to pay;
|
|
|
●
|
the credit quality of the party owing money on the hedge may be downgraded to such an extent that it impairs our ability to sell or assign our side of the hedging transaction; and
|
|
|
●
|
the value of derivatives used for hedging may be adjusted from time to time in accordance with accounting rules to reflect changes in fair value. Downward adjustments, or “mark-to-market losses,” would reduce our stockholders’ equity.
|
Whether the derivatives we acquire achieve hedge accounting treatment or not, hedging generally involves costs and risks. Our hedging strategies may adversely affect us because hedging activities involve costs that we will incur regardless of the effectiveness of the hedging activity. Those costs may be higher in periods of market volatility, both because the counterparties to our derivative agreements may demand a higher payment for taking risks, and because repeated adjustments of our hedges during periods of interest rate changes also may increase costs. Especially if our hedging strategies are not effective, we could incur significant hedging-related costs without any corresponding economic benefits.
We have elected not to qualify for hedge accounting treatment.
We record derivative and hedge transactions in accordance with GAAP. We have elected not to qualify for hedge accounting treatment. As a result, our operating results may suffer because losses on the derivatives that we enter into may not be offset by a change in the fair value of the related hedged transaction.
Declines in the fair values of our investments may adversely affect periodic reported results and credit availability, which may reduce earnings and, in turn, cash available for distribution to our stockholders.
A substantial portion of our assets are classified for accounting purposes as “available-for-sale” and carried at fair value. Changes in the fair values of those assets will be directly charged or credited to OCI. In addition, a decline in values will reduce the book value of our assets. A decline in the fair value of our assets may adversely affect us, particularly in instances where we have borrowed money based on the fair value of those assets. If the fair value of those assets declines, the lender may require us to post additional collateral to support the loan. If we were unable to post the additional collateral, we would have to sell the assets at a time when we might not otherwise choose to do so. A reduction in credit available may reduce our earnings and, in turn, cash available for distribution to stockholders.
The lack of liquidity in our investments may adversely affect our business.
We may invest in securities or other instruments that are not liquid. It may be difficult or impossible to obtain third party pricing on the investments we purchase. Illiquid investments typically experience greater price volatility as a ready market does not exist. In addition, validating third party pricing for illiquid investments may be more subjective than more liquid investments. The illiquidity of our investments may make it difficult for us to sell such investments if the need or desire arises. In addition, if we are required to liquidate all or a portion of our portfolio quickly, we may realize significantly less than the value at which we have previously recorded our investments. As a result, our ability to vary our portfolio in response to changes in economic and other conditions may be relatively limited, which could adversely affect our results of operations and financial condition.
27
We are highly dependent on information systems and third parties, and systems failures could significantly disrupt our business, which may, in turn, negatively affect the market price of our common stock and our ability to pay dividends to our stockholders.
Our business is highly dependent on communications and information systems. Any failure or interruption of our systems could cause delays or other problems in our securities trading activities, including mortgage-backed securities trading activities, which could have a material adverse effect on our operating results and negatively affect the market price of our common stock and our ability to pay dividends to our stockholders.
Compliance with proposed and recently enacted changes in securities laws and regulations increases our costs.
The Sarbanes-Oxley Act of 2002 and rules and regulations promulgated by the SEC and the New York Stock Exchange have increased the scope, complexity and cost of corporate governance, reporting and disclosure practices. We believe that these rules and regulations will make it more costly for us to obtain director and officer liability insurance, and we may be required to accept reduced coverage or incur substantially higher costs to obtain coverage. These rules and regulations could also make it more difficult for us to attract and retain qualified members of management and our board of directors, particularly to serve on our audit committee.
The Dodd-Frank Act contains many regulatory changes and calls for future rulemaking that may affect our business, including, but not limited to resolutions involving derivatives, risk-retention in securitizations and short-term financings. We are evaluating the potential impact of regulatory change under the Dodd-Frank Act.
The increasing number of proposed federal, state and local laws may increase our risk of liability with respect to certain mortgage loans, may include judicial modification provisions and could increase our cost of doing business.
The United States Congress and various state and local legislatures are considering legislation, which, among other provisions, would permit limited assignee liability for certain violations in the mortgage loan origination process, and would allow judicial modification of loan principal in the event of personal bankruptcy. We cannot predict whether or in what form Congress or the various state and local legislatures may enact legislation affecting our business. We are evaluating the potential impact of these initiatives, if enacted, on our practices and results of operations. As a result of these and other initiatives, we are unable to predict whether federal, state or local authorities will require changes in our practices in the future or in our portfolio. These changes, if required, could adversely affect our profitability, particularly if we make such changes in response to new or amended laws, regulations or ordinances in any state where we acquire a significant portion of our mortgage loans, or if such changes result in us being held responsible for any violations in the mortgage loan origination process, or if the principal amount of loans we own or are in RMBS pools we own are modified in the personal bankruptcy process.
Risks Related to Our Investments
We might not be able to purchase residential mortgage loans, mortgage-backed securities and other investments that meet our investment criteria or at favorable spreads over our borrowing costs.
To the extent we purchase assets using leverage, our net income depends on our ability to acquire residential mortgage loans, mortgage-backed securities and other investments at favorable spreads over our borrowing costs. Our investments are selected by our Manager, and our stockholders will not have input into such investment decisions. Our Manager has conducted due diligence with respect to each investment purchased. However, there can be no assurance that our Manager's due diligence processes will uncover all relevant facts or that any investment will be successful.
We may not realize income or gains from our investments.
We invest to generate both current income and capital appreciation. The investments we invest in may, however, not appreciate in value and, in fact, may decline in value, and the debt securities we invest in may default on interest or principal payments. Accordingly, we may not be able to realize income or gains from our investments. Any gains that we do realize may not be sufficient to offset any other losses we experience. Any income that we realize may not be sufficient to offset our expenses.
28
Our investments may be concentrated and will be subject to risk of default.
While we intend to diversify our portfolio of investments, we are not required to observe specific diversification criteria. To the extent that our portfolio is concentrated in any one region or type of security, downturns relating generally to such region or type of security may result in defaults on a number of our investments within a short time period, which may reduce our net income and the value of our shares and accordingly may reduce our ability to pay dividends to our stockholders.
Our investments in subordinated RMBS are generally in the “first loss” position and our investments in the mezzanine RMBS are generally in the “second loss” position and therefore subject to losses.
In general, losses on a mortgage loan included in a securitization will be borne first by the equity holder of the issuing trust, and then by the “first loss” subordinated security holder and then by the “second loss” mezzanine holder. In the event of default and the exhaustion of any classes of securities junior to those in which we invest and there is any further loss, we will not be able to recover all of our investment in the securities we purchase. In addition, if the underlying mortgage portfolio has been overvalued by the originator, or if the values subsequently decline and, as a result, less collateral is available to satisfy interest and principal payments due on the related RMBS, the securities in which we invest may effectively become the “first loss” position behind the more senior securities, which may result in significant losses to us. The prices of lower credit quality securities are generally less sensitive to interest rate changes than more highly rated investments, but more sensitive to adverse economic downturns or individual issuer developments. A projection of an economic downturn, for example, could cause a decline in the price of lower credit quality securities because the ability of obligors of mortgages underlying RMBS to make principal and interest payments may be impaired. In such event, existing credit support in the securitization structure may be insufficient to protect us against loss of our principal on these securities.
Increases in interest rates could negatively affect the value of our investments, which could result in reduced earnings or losses and negatively affect the cash available for distribution to our stockholders.
We have and will continue to invest in real estate-related assets by acquiring RMBS, residential mortgage loans, CMBS and CDOs backed by real estate-related assets. Under a normal yield curve, an investment in these assets will decline in value if long-term interest rates increase. Declines in market value may ultimately reduce earnings or result in losses to us, which may negatively affect cash available for distribution to our stockholders. A significant risk associated with these investments is the risk that both long-term and short-term interest rates will increase significantly. If long-term rates were to increase significantly, the market value of these investments would decline, and the duration and weighted average life of the investments would increase. We could realize a loss if these assets were sold. At the same time, an increase in short-term interest rates would increase the amount of interest owed on the repurchase agreements or other adjustable rate financings we may enter into to finance the purchase of these assets. Market values of our investments may decline without any general increase in interest rates for a number of reasons, such as increases in defaults, increases in voluntary prepayments for those investments that are subject to prepayment risk and widening of credit spreads.
In a period of rising interest rates, our interest expense could increase while the interest we earn on our fixed-rate assets would not change, which would adversely affect our profitability.
Our operating results will depend in large part on the differences between the income from our assets, net of credit losses and financing costs. We anticipate that, in most cases, the income from such assets will respond more slowly to interest rate fluctuations than the cost of our borrowings. Consequently, changes in interest rates, particularly short-term interest rates, may significantly influence our net income. Increases in these rates will tend to decrease our net income and market value of our assets. Interest rate fluctuations resulting in our interest expense exceeding our interest income would result in operating losses for us and may limit or eliminate our ability to make distributions to our stockholders.
Interest rate mismatches between our investments and any borrowings used to fund purchases of these assets may reduce our income during periods of changing interest rates.
We intend to fund some of our acquisitions of residential mortgage loans, real estate-related securities and real estate loans with borrowings that have interest rates based on indices and repricing terms with shorter maturities than the interest rate indices and repricing terms of our adjustable-rate assets. Accordingly, if short-term interest rates increase, this may harm our profitability.
29
Some of the residential mortgage loans, real estate-related securities and real estate loans we acquire are and will be fixed-rate securities. This means that their interest rates will not vary over time based upon changes in a short-term interest rate index. Therefore, the interest rate indices and repricing terms of the assets that we acquire and their funding sources will create an interest rate mismatch between our assets and liabilities. During periods of changing interest rates, these mismatches could reduce our net income, dividend yield and the market price of our stock.
Accordingly, in a period of rising interest rates, we could experience a decrease in net income or a net loss because the interest rates on our borrowings adjust whereas the interest rates on our fixed-rate assets remain unchanged.
Interest rate caps on our adjustable rate RMBS may adversely affect our profitability.
Adjustable-rate RMBS are typically subject to periodic and lifetime interest rate caps. Periodic interest rate caps limit the amount an interest rate can increase during any given period. Lifetime interest rate caps limit the amount an interest rate can increase over the life of the security. Our borrowings typically will not be subject to similar restrictions. Accordingly, in a period of rapidly increasing interest rates, the interest rates paid on our borrowings could increase without limitation while caps could limit the interest rates on our adjustable-rate RMBS. This problem is magnified for hybrid adjustable-rate and adjustable-rate RMBS that are not fully indexed. Further, some hybrid adjustable-rate and adjustable-rate RMBS may be subject to periodic payment caps that result in a portion of the interest being deferred and added to the principal outstanding. As a result, we may receive less cash income on hybrid adjustable-rate and adjustable-rate RMBS than we need to pay interest on our related borrowings. These factors could reduce our net interest income and cause us to suffer a loss.
A significant portion of our portfolio investments will be recorded at fair value as determined in accordance with our pricing policy and, as a result, there will be uncertainty as to the value of these investments.
A significant portion of our portfolio of investments is in the form of securities that are not publicly traded. The fair value of securities and other investments that are not publicly traded may not be readily determinable. It may be difficult or impossible to obtain third party pricing on the investments we purchase. We value these investments quarterly at fair value, as determined in accordance with our pricing policy as approved by our board of directors. Because such valuations are inherently uncertain, may fluctuate over short periods of time and may be based on estimates, our determinations of fair value may differ materially from the values that would have been used if a ready market for these securities existed. The value of our common stock could be adversely affected if our determinations regarding the fair value of these investments were materially higher than the values that we ultimately realize upon their disposal.
A prolonged economic slowdown, a recession or declining real estate values could impair our investments and harm our operating results.
Many of our investments are susceptible to economic slowdowns or recessions, which could lead to financial losses in our investments and a decrease in revenues, net income and assets. Unfavorable economic conditions also could increase our funding costs, limit our access to the capital markets or result in a decision by lenders not to extend credit to us. These events could prevent us from increasing investments and have an adverse effect on our operating results.
Changes in prepayment rates could negatively affect the value of our investment portfolio, which could result in reduced earnings or losses and negatively affect the cash available for distribution to our stockholders.
There are seldom any restrictions on borrowers’ abilities to prepay their residential mortgage loans. Homeowners tend to prepay mortgage loans faster when interest rates decline. Consequently, owners of the loans have to reinvest the money received from the prepayments at the lower prevailing interest rates. Conversely, homeowners tend not to prepay mortgage loans when interest rates increase. Consequently, owners of the loans are unable to reinvest money that would have otherwise been received from prepayments at the higher prevailing interest rates. This volatility in prepayment rates may affect our ability to maintain targeted amounts of leverage on our portfolio of residential mortgage loans, RMBS, and CDOs backed by real estate-related assets and may result in reduced earnings or losses for us and negatively affect the cash available for distribution to our stockholders.
30
To the extent our investments are purchased at a premium, faster than expected prepayments result in a faster than expected amortization of the premium paid, which would adversely affect our earnings. Conversely, if these investments were purchased at a discount, faster than expected prepayments accelerate our recognition of income.
The mortgage loans we invest in and the mortgage loans underlying the mortgage and asset-backed securities we invest in are subject to delinquency, foreclosure and loss, which could result in losses to us.
Residential mortgage loans are typically secured by single-family residential property and are subject to risks of delinquency and foreclosure and risks of loss. The ability of a borrower to repay a loan secured by a residential property is dependent upon the income or assets of the borrower. A number of factors, including a general economic downturn, acts of God, terrorism, social unrest and civil disturbances, may impair borrowers’ abilities to repay their loans. In addition, we invest in non-Agency RMBS, which are backed by residential real property but, in contrast to Agency RMBS, their principal and interest is not guaranteed by federally chartered entities such as Fannie Mae and Freddie Mac and, in the case of Ginnie Mae, the U.S. government. The U.S. Department of Treasury and FHFA have also entered into preferred stock purchase agreements between the U.S. Department of Treasury and Fannie Mae and Freddie Mac pursuant to which the U.S. Department of Treasury will ensure that each of Fannie Mae and Freddie Mac maintains a positive net worth. Asset-backed securities are bonds or notes backed by loans or other financial assets. The ability of a borrower to repay these loans or other financial assets is dependent upon the income or assets of these borrowers. Commercial mortgage loans are secured by multifamily or commercial property and are subject to risks of delinquency and foreclosure, and risks of loss that are greater than similar risks associated with loans made on the security of single-family residential property. The ability of a borrower to repay a loan secured by an income-producing property typically is dependent primarily upon the successful operation of such property rather than upon the existence of independent income or assets of the borrower. If the net operating income of the property is reduced, the borrower’s ability to repay the loan may be impaired. Net operating income of an income producing property can be affected by, among other things, tenant mix, success of tenant businesses, property management decisions, property location and condition, competition from comparable types of properties, changes in laws that increase operating expense or limit rents that may be charged, any need to address environmental contamination at the property, the occurrence of any uninsured casualty at the property, changes in national, regional or local economic conditions or specific industry segments, declines in regional or local real estate values, declines in regional or local rental or occupancy rates, increases in interest rates, real estate tax rates and other operating expenses, changes in governmental rules, regulations and fiscal policies, including environmental legislation, acts of God, terrorism, social unrest and civil disturbances. In the event of any default under a mortgage loan held directly by us, we will bear a risk of loss of principal to the extent of any deficiency between the value of the collateral and the principal and accrued interest of the mortgage loan, which could have a material adverse effect on our cash flow from operations. In the event of the bankruptcy of a mortgage loan borrower, the mortgage loan to such borrower will be deemed to be secured only to the extent of the value of the underlying collateral at the time of bankruptcy (as determined by the bankruptcy court), and the lien securing the mortgage loan will be subject to the avoidance powers of the bankruptcy trustee or debtor-in-possession to the extent the lien is unenforceable under state law. Foreclosure of a mortgage loan can be an expensive and lengthy process which could have a substantial negative effect on our anticipated return on the foreclosed mortgage loan. RMBS evidence interests in or are secured by pools of residential mortgage loans and CMBS evidence interests in or are secured by a single commercial mortgage loan or a pool of commercial mortgage loans. Accordingly, the RMBS and CMBS we invest in are subject to all of the risks of the respective underlying mortgage loans.
We may be required to repurchase mortgage loans or indemnify investors if we breach representations and warranties, which could harm our earnings.
If we sell loans, we would be required to make customary representations and warranties about such loans to the loan purchaser. Our residential mortgage loan sale agreements will require us to repurchase or substitute loans in the event we breach a representation or warranty given to the loan purchaser. In addition, we may be required to repurchase loans as a result of borrower fraud or in the event of early payment default on a mortgage loan. Likewise, we are required to repurchase or substitute loans if we breach a representation or warranty in connection with our securitizations. The remedies available to a purchaser of mortgage loans are generally broader than those available to us against the originating broker or correspondent. Further, if a purchaser enforces its remedies against us, we may not be able to enforce the remedies we have against the sellers. The repurchased loans typically can only be financed at a steep discount to their repurchase price, if at all. They are also typically sold at a significant discount to the unpaid principal balance. Significant repurchase activity could harm our cash flow, results of operations, financial condition and business prospects.
31
We may enter into derivative contracts that could expose us to contingent liabilities in the future.
Subject to maintaining our qualification as a REIT, part of our investment strategy involves entering into derivative contracts that could require us to fund cash payments in certain circumstances. These potential payments will be contingent liabilities and therefore may not appear on our consolidated statement of financial condition. Our ability to fund these contingent liabilities will depend on the liquidity of our assets and access to capital at the time, and the need to fund these contingent liabilities could adversely impact our financial condition.
Our Manager’s due diligence of potential investments may not reveal all of the liabilities associated with such investments and may not reveal other weaknesses in such investments, which could lead to investment losses.
Before making an investment, our Manager assesses the strengths and weaknesses of the originator or issuer of the asset as well as other factors and characteristics that are material to the performance of the investment. In making the assessment and otherwise conducting customary due diligence, our Manager relies on resources available to it and, in some cases, an investigation by third parties. This process is particularly important with respect to newly formed originators or issuers with unrated and other subordinated tranches of RMBS and ABS because there may be little or no information publicly available about these entities and investments. There can be no assurance that our Manager’s due diligence process will uncover all relevant facts or that any investment will be successful.
Our real estate investments are subject to risks particular to real property.
We own assets secured by real estate and may own real estate directly in the future, either through direct investments or upon a default of mortgage loans. Real estate investments are subject to various risks, including:
|
|
●
|
acts of God, including earthquakes, floods and other natural disasters, which may result in uninsured losses;
|
|
|
●
|
acts of war or terrorism, including the consequences of terrorist attacks, such as those that occurred on September 11, 2001;
|
|
|
●
|
adverse changes in national and local economic and market conditions;
|
|
|
●
|
changes in governmental laws and regulations, fiscal policies and zoning ordinances and the related costs of compliance with laws and regulations, fiscal policies and ordinances;
|
|
|
●
|
costs of remediation and liabilities associated with environmental conditions such as indoor mold; and
|
|
|
●
|
the potential for uninsured or under-insured property losses.
|
If any of these or similar events occurs, it may reduce our return from an affected property or investment and reduce or eliminate our ability to make distributions to stockholders.
We may be exposed to environmental liabilities with respect to properties to which we take title.
In the course of our business, we may take title to real estate, and, if we do take title, we could be subject to environmental liabilities with respect to these properties. In such a circumstance, we may be held liable to a governmental entity or to third parties for property damage, personal injury, investigation, and clean-up costs incurred by these parties in connection with environmental contamination, or may be required to investigate or clean up hazardous or toxic substances, or chemical releases at a property. The costs associated with investigation or remediation activities could be substantial. If we ever become subject to significant environmental liabilities, our business, financial condition, liquidity, and results of operations could be materially and adversely affected.
32
We may in the future invest in RMBS collateralized by subprime mortgage loans, which are subject to increased risks.
We may in the future invest in RMBS backed by collateral pools of subprime residential mortgage loans. ‘‘Subprime’’ mortgage loans refer to mortgage loans that have been originated using underwriting standards that are less restrictive than the underwriting requirements used as standards for other first and junior lien mortgage loan purchase programs, such as the programs of Fannie Mae and Freddie Mac. These lower standards include mortgage loans made to borrowers having imperfect or impaired credit histories (including outstanding judgments or prior bankruptcies), mortgage loans where the amount of the loan at origination is 80% or more of the value of the mortgage property, mortgage loans made to borrowers with low credit scores, mortgage loans made to borrowers who have other debt that represents a large portion of their income and mortgage loans made to borrowers whose income is not required to be disclosed or verified. Due to economic conditions, including increased interest rates and lower home prices, as well as aggressive lending practices, subprime mortgage loans have in recent periods experienced increased rates of delinquency, foreclosure, bankruptcy and loss, and they are likely to continue to experience delinquency, foreclosure, bankruptcy and loss rates that are higher, and that may be substantially higher, than those experienced by mortgage loans underwritten in a more traditional manner. Thus, because of the higher delinquency rates and losses associated with subprime mortgage loans, the performance of RMBS backed by subprime mortgage loans in which we may invest could be correspondingly adversely affected, which could adversely impact our results of operations, financial condition and business.
Our Manager utilizes analytical models and data in connection with the valuation of our investments, and any incorrect, misleading or incomplete information used in connection therewith would subject us to potential risks.
Given the complexity of our investments and strategies, our Manager must rely heavily on analytical models (both net present value based loss mitigation models and those supplied by third-parties) and information and data supplied by third-parties, or Models and Data. Models and Data will be used to value investments or potential investments and also in connection with hedging our investments. When Models and Data prove to be incorrect, misleading or incomplete, any decisions made in reliance thereon expose us to potential risks. For example, by relying on Models and Data, especially valuation models, our Manager may be induced to buy certain investments at prices that are too high, to sell certain other investments at prices that are too low or to miss favorable opportunities altogether. Similarly, any hedging based on faulty Models and Data may prove to be unsuccessful. Furthermore, any valuations of our investments that are based on valuation models may prove to be incorrect.
Some of the risks of relying on analytical models and third-party data are particular to analyzing tranches from securitizations, such as RMBS. These risks include, but are not limited to, the following: (i) collateral cash flows and/or liability structures may be incorrectly modeled in all or only certain scenarios, or may be modeled based on simplifying assumptions that lead to errors; (ii) information about collateral may be incorrect, incomplete, or misleading; (iii) collateral or bond historical performance (such as historical prepayments, defaults, cash flows, etc.) may be incorrectly reported, or subject to interpretation (e.g., different issuers may report delinquency statistics based on different definitions of what constitutes a delinquent loan); or (iv) collateral or bond information may be outdated, in which case the models may contain incorrect assumptions as to what has occurred since the date information was last updated.
Some of the analytical models used by our Manager, such as mortgage prepayment models or mortgage default models, are predictive in nature. The use of predictive models has inherent risks. For example, such models may incorrectly forecast future behavior, leading to potential losses on a cash flow and/or a mark-to-market basis. In addition, the predictive models used by our Manager may differ substantially from those models used by other market participants, with the result that valuations based on these predictive models may be substantially higher or lower for certain investments than actual market prices. Furthermore, since predictive models are usually constructed based on historical data supplied by third-parties, the success of relying on such models may depend heavily on the accuracy and reliability of the supplied historical data and the ability of these historical models to accurately reflect future periods.
All valuation models rely on correct market data inputs. If incorrect market data is entered into even a well-founded valuation model, the resulting valuations will be incorrect. However, even if market data is inputted correctly, “model prices” will often differ substantially from market prices, especially for securities with complex characteristics, such as derivative securities.
Regulatory and Legal Risks
Violations of federal, state and local laws by the originator, the servicer, or may result in rescission of the loans or penalties that may adversely impact our income.
Violations of certain provisions of federal, state and local laws by the originator, the servicer or us, as well as actions by governmental agencies, authorities and attorneys general, may limit our or the servicer’s ability to collect all or part of the principal of, or interest on, the residential mortgage loans we purchase and hold, and loans that serve as security for the RMBS we purchase and hold. Violations could also subject the entity that made or modified the loans to damages and administrative enforcement (including disgorgement of prior interest and fees paid). In particular, a loan seller’s failure to comply with certain requirements of federal and state laws could subject the seller (and other assignees of the mortgage loans) to monetary penalties and result in the obligors’ rescinding the mortgage loans against the seller and any subsequent holders of the mortgage loans, even if the assignee was not responsible for and was unaware of those violations. These adverse consequences vary depending on the applicable law and may vary depending on the type or severity of the violation, but they typically include:
33
|
|
●
|
the ability of the homeowner to rescind, or cancel, the loan;
|
|
|
●
|
the inability of the holder of the loan to collect all of the principal and interest otherwise due on the loan;
|
|
|
●
|
the right of the homeowner to a refund of amounts previously paid (which may include amounts financed by the loan), or to set off those amounts against his or her future loan obligations; and
|
|
|
●
|
the liability of the servicer and the owner of the loan for actual damages, statutory damages and punitive damages, civil or criminal penalties, costs and attorneys’ fees.
|
The terms of the documents under which we intend to purchase loans, and the terms of the documents used to create the RMBS we intend to purchase, may entitle the holders of the loans and the special purpose vehicles that hold loans in RMBS to contractual indemnification against these liabilities. For example, the sellers of loans placed in a securitization typically represent that each mortgage loan was made in compliance with applicable federal and state laws and regulations at the time it was made. If there is a material breach of that representation, the seller may be contractually obligated to cure the breach or repurchase or replace the affected mortgage loan. If the seller is unable or otherwise fails to satisfy these obligations, the yield on the loans and RMBS might be materially and adversely affected. Due to the well publicized recent deterioration in the housing and commercial property markets, many of the sellers that issued these indemnifications are no longer in business or are unable to financially respond to their indemnification obligations. Consequently, holders of interests in the loans and RMBS may ultimately have to absorb the losses arising from the sellers’ violations. While we attempt to take these factors into account in the prices we pay for loans and RMBS, we can offer no assurances concerning the validity of the assumptions we use in our pricing decisions.
Furthermore, the volume of new and modified laws and regulations at both the federal and state levels has increased in recent years. For example, H.R. 1105, which was signed into law in March 2009, gives the Federal Trade Commission, or FTC, authority to issue rules under which it will define what constitutes unfair and deceptive practices relating to mortgage lending and loan servicing and which gives enforcement authority to state attorneys general. There is also an increased risk that the both we and the servicer of loans we purchase or that are held in RMBS we purchase may be involved in litigation over violations or alleged violations of recently enacted and proposed laws. It is possible that these laws might result in additional significant costs and liabilities, which could further adversely affect the results of our operations. Any litigation would increase our expenses and reduce funds available for distribution to our stockholders.
Some local municipalities also have enacted laws that impose potentially significant penalties on loan servicing activities related to abandoned properties or real estate owned properties.
Any of these preceding could result in delays and/or reductions in receipts of amounts due on the loans we intend to purchase or on the loans held in RMBS we intend to purchase, harming our income and operating results.
We may be subject to liability for potential violations of predatory lending and other laws, which could adversely impact our results of operations, financial condition and business.
Various federal, state and local laws have been enacted that are designed to discourage predatory lending practices and more are currently proposed. The federal Home Ownership and Equity Protection Act of 1994, commonly known as HOEPA, prohibits inclusion of certain provisions in residential mortgage loans that have mortgage rates or origination costs in excess of prescribed levels and requires that borrowers be given certain disclosures before origination. Some states have enacted, or may enact, similar laws or regulations, which in some cases impose restrictions and requirements greater than those in HOEPA. In addition, under the anti-predatory lending laws of some states, the origination of certain residential mortgage loans, including loans that are not classified as “high cost” loans under applicable law, must satisfy a net tangible benefits test with respect to the related borrower. This test may be highly subjective and open to interpretation. As a result, a court may determine that a residential mortgage loan we hold, for example, does not meet the test even if the related originator reasonably believed that the test was satisfied.
34
Failure of residential mortgage loan originators or servicers to comply with these laws, to the extent any of their residential mortgage loans become part of our mortgage-related assets, could subject us, as an assignee or purchaser of the related residential mortgage loans or RMBS, to monetary penalties and could result in the borrowers rescinding the affected residential mortgage loans. Lawsuits have been brought in various states making claims against assignees or purchasers of high cost loans for violations of state law. Named defendants in these cases have included numerous participants in the secondary mortgage market. If the loans are found to have been originated in violation of predatory or abusive lending laws, we could incur losses, which could adversely impact our results of operations, financial condition and business.
There is the potential for limitations on our ability to finance purchases of loans and RMBS, and for losses on the loans and RMBS we purchase, as a result of violations of law by the originating lenders.
In June 2003, a California jury found a warehouse lender and securitization underwriter liable in part for fraud on consumers committed by a lender to whom it provided financing and underwriting services. The jury found that the investment bank was aware of the fraud and substantially assisted the lender in perpetrating the fraud by providing financing and underwriting services that allowed the lender to continue to operate, and held it liable for 10% of the plaintiff’s damages. This instance of liability is the first case we know of in which an investment bank was held partly responsible for violations committed by a mortgage lender customer. Shortly after the announcement of the jury verdict in the California case, the Florida Attorney General filed suit against the same financial institution, seeking an injunction to prevent it from financing mortgage loans within Florida, as well as damages and civil penalties, based on theories of unfair and deceptive trade practices and fraud. The suit claimed that this financial institution aided and abetted the same lender involved in the California case in its commission of fraudulent representations in Florida.
In December of 2008, the Massachusetts Supreme Judicial Court upheld a lower court’s order entered against a lender that enjoined the lender from foreclosing, without court approval, on certain mortgage loans secured by the borrower’s principal dwelling that the court considered “presumptively unfair.”
In May of 2009, another securitizer of residential mortgage loans entered into a settlement agreement with the Commonwealth of Massachusetts stemming from its investigation of subprime lending and securitization markets. The securitizer agreed to provide loan restructuring (including significant principal write-downs) valued at approximately $50 million to Massachusetts subprime borrowers and to make a $10 million payment to the Commonwealth.
If other courts or regulators take similar actions, investment banks and investors in residential and commercial mortgage loans and RMBS (such as us) might face increased litigation as they are named as defendants in lawsuits and regulatory actions against the mortgage companies or securitizers with which they do business or they might be prohibited from foreclosing on loans they purchased. Some investment banks may charge more for warehouse lending and reduce the prices they pay for loans to build in the costs of this potential litigation or exit the business entirely, thereby increasing our cost of borrowing. Any such actions by courts and regulators, and any such increases in our costs of borrowing, could, in turn, have a material adverse effect on our results of operations, financial condition, and business prospects.
We are required to obtain various state licenses in order to purchase mortgage loans in the secondary market and there is no assurance we will be able to obtain or maintain those licenses.
While we are not required to obtain licenses to purchase mortgage-backed securities, we are required to obtain various state licenses to purchase mortgage loans in the secondary market. There is no assurance that we will obtain all of the licenses that we desire or that we will not experience significant delays in seeking these licenses. Furthermore, we will be subject to various information reporting requirements to maintain these licenses, and there is no assurance that we will satisfy those requirements. Our failure to obtain or maintain licenses will restrict our investment options and could harm our business.
35
The federal government’s pressing for refinancing of certain loans may affect prepayment rates for mortgage loans in RMBS.
In addition to the increased pressure upon residential mortgage loan investors and servicers to engage in loss mitigation activities, the federal government is pressing for refinancing of certain loans, and this encouragement may affect prepayment rates for mortgage loans in RMBS. To the extent these and other economic stabilization or stimulus efforts are successful in increasing prepayment speeds for residential mortgage loans, such as those in RMBS, that could potentially harm our income and operating results, particularly in connection with loans or RMBS purchased at a premium or our interest-only securities.
Federal and state agencies have taken enforcement actions and enacted regulations and government programs that require government sponsored enterprises (such as Fannie Mae and Freddie Mac), insured depository institutions, and state regulated loan servicers to engage in loss mitigation activities relating to residential mortgage loans.
Federal and state agencies have taken enforcement actions and enacted regulations that require government sponsored enterprises (such as Fannie Mae and Freddie Mac), insured depository institutions, and state regulated loan servicers to engage in loss mitigation activities relating to residential mortgage loans. Other agencies have published policies that strongly recommend these entities to engage in loss mitigation activities. These loss mitigation activities may include, for example, loan modifications that significantly reduce interest and payments, deferrals of payments, and reductions of principal balances. Such modifications may adversely affect our business and financial condition.
We will likely be subject to civil liability if we fail to make required disclosures to consumers.
Purchasers of consumer purpose, residential mortgage loans have affirmative disclosure obligations to consumers under the HFSTH Act, which Congress enacted in May 2009 with an immediate effective date. This new statutory obligation will subject purchasers of mortgage loans to civil liability if they fail to make the required disclosures. Specifically, section 404 of the HFSTH Act amends the Truth in Lending Act to provide that a creditor that purchases or is assigned a mortgage loan must notify the borrower in writing of a sale or transfer of his or her mortgage loan, not later than 30 days after the transaction’s completion. The notice must include how to reach an agent or party having authority to act on behalf of the new creditor, the location of the place where the transfer of ownership is recorded and any other relevant information about the new creditor. This disclosure would be in addition to any transfer of servicing notice required under the Real Estate Settlement Procedures Act. Federal consumer credit law does not typically impose responsibility on assignees to communicate directly with mortgagors, and the statutory language is ambiguous.
Litigation alleging inability to foreclose may limit our ability to recover on some of the loans we purchase or that are held in RMBS.
In October 2007, a judge in the U.S. District Court for the Northern District of Ohio dismissed 14 cases in which plaintiffs sought to foreclose mortgages held in securitization trusts by ruling that those plaintiffs lacked standing to sue. In each case, the judge found that the plaintiff was not the owner of the note and mortgage on the date the foreclosure complaint was filed in court. Similar actions have been initiated in other states. These actions arise as a result of the common practice in the mortgage industry of mortgage loan sellers providing the loan purchasers unrecorded assignments of the mortgage in blank (i.e., the assignments do not name the assignee). Some courts have held that before a note holder may initiate a foreclosure, the note holder must show proof to the court that the mortgage itself has been properly assigned to the purchaser each time the mortgage loan has been sold. It is sometimes difficult to obtain and then record originals of each successive assignment. It is still unclear whether higher courts will uphold the requirements imposed by these lower courts.
Until the issue is settled, investors in mortgage loans are at risk of being unable to foreclose on defaulted loans, or at a minimum will be subject to delays until all assignments in the chain of the loan’s title are properly recorded. Thus, we may not be able to recover on some of the loans we purchase or that are held in the RMBS we purchase, or we may suffer delays in foreclosure, all of which could result in a lower return on our loans and RMBS.
In addition, some legislatures are also instituting stringent proof of ownership requirements that a servicer must satisfy before commencing a foreclosure action. By way of example, the New York State Assembly earlier this year amended state law to require that any foreclosure complaint contain an affirmative allegation that the plaintiff is the owner and holder of the note and mortgage at issue or has been delegated the authority to institute the foreclosure action by the owner and holder of the subject mortgage and note. Again, laws of this type may limit our ability to recover on some of the loans we purchase or that are held in the RMBS we purchase, and may result in delays in the foreclosure process, all of which could result in a lower return on our loans and RMBS.
36
Legislative action to provide mortgage relief and foreclosure moratoriums may negatively impact our business.
As delinquencies and defaults in residential mortgages have recently increased, there has been an increasing amount of legislative action that might restrict our ability to foreclose and resell the property of a customer in default. For example, some recently enacted state laws may require the lender to deliver a notice of intent to foreclose, provide borrowers additional time to cure or reinstate their loans, impose mandatory settlement conference and mediation requirements, require lenders to offer loan modifications, and prohibit initiation of foreclosure until the borrower has been provided time to consult with foreclosure counselors.
Alternatively, new federal legislation and some legislatures provide a subsidy to a customer to permit the customer to continue to make payments during a period of hardship. In the case of a subsidy, it is possible that we might be required to forego a portion of the amount otherwise due on the loan for a temporary period.
Finally, some state legislatures are requiring foreclosing lenders to give special notices to tenants in properties that the lenders are foreclosing on, or to permit the tenants to remain in the property for a period of time following the foreclosure.
These laws delay the initiation or completion of foreclosure proceedings on specified types of residential mortgage loans, or otherwise limit the ability of residential loan servicers to take actions that may be essential to preserve the value of the mortgage loans on behalf of the holders of RMBS. Any such limitations are likely to cause delayed or reduced collections from mortgagors and generally increased servicing costs. Any restriction on our ability to foreclose on a loan, any requirement that we forego a portion of the amount otherwise due on a loan or any requirement that we modify any original loan terms is likely to negatively impact our business, financial condition, liquidity and results of operations.
United States military operations may increase risk of Servicemembers Civil Relief Act shortfalls.
Under the federal Service members Civil Relief Act, a borrower who enters active military service after the origination of his or her mortgage loan generally may not be required to pay interest above an annual rate of 6%, and the note holder is restricted from exercising certain enforcement remedies, during the period of the borrower’s active duty status. Several states also have enacted or are considering similar laws with varying applicability and effect. As a result of military operations in Afghanistan and Iraq, the United States has placed a substantial number of armed forces reservists and members of the National Guard on active duty status. It is possible that the number of reservists and members of the National Guard placed on active duty status may remain at high levels for an extended time. To the extent that a member of the military, or a member of the armed forces reserves or National Guard who is called to active duty, is a mortgagor on a loan underlying RMBS we may purchase, the interest rate limitation of the Servicemembers Civil Relief Act, and any comparable state law, will apply. An increase in the number of borrowers taking advantage of those laws may increase servicing expenses for loans underlying RMBS we may purchase, and may also reduce cash flow and the interest payments collected from those borrowers. In the event of default, the laws may result in delaying or preventing the loan servicer from exercising otherwise available remedies for default. If these events occur, they may result in interest shortfalls on the loans in underlying RMBS we may purchase that will be borne by holders of those RMBS.
Risks Related To Our Common Stock
The market price and trading volume of our shares of common stock may be volatile.
At December 31, 2010, we had 1,027,034,357 shares of common stock issued and outstanding. The market price of shares of our common stock may be highly volatile and could be subject to wide fluctuations. In addition, the trading volume in our shares of common stock may fluctuate and cause significant price variations to occur. We cannot assure you that the market price of our shares of common stock will not fluctuate or decline significantly in the future. Some of the factors that could negatively affect our share price or result in fluctuations in the price or trading volume of our shares of common stock include those set forth under “Risk Factors” and “A Warning About Forward-Looking Statements” and in the information incorporated and deemed to be incorporated by reference herein, as well as:
37
|
|
●
|
actual or anticipated variations in our quarterly operating results or business prospects;
|
|
|
●
|
changes in our earnings estimates or publication of research reports about us or the real estate industry;
|
|
|
●
|
an inability to meet or exceed securities analysts' estimates or expectations;
|
|
|
●
|
increases in market interest rates;
|
|
|
●
|
hedging or arbitrage trading activity in our shares of common stock;
|
|
|
●
|
capital commitments;
|
|
|
●
|
changes in market valuations of similar companies;
|
|
|
●
|
changes in valuations of our assets;
|
|
|
●
|
adverse market reaction to any increased indebtedness we incur in the future;
|
|
|
●
|
additions or departures of management personnel;
|
|
|
●
|
actions by institutional shareholders;
|
|
|
●
|
speculation in the press or investment community;
|
|
|
●
|
changes in our distribution policy;
|
|
|
●
|
regulatory changes affecting our industry generally or our business;
|
|
|
●
|
general market and economic conditions; and
|
|
|
●
|
future sales of our shares of common stock or securities convertible into, or exchangeable or exercisable for, our shares of common stock.
|
Common stock eligible for future sale may have adverse effects on our share price.
If we issue a significant number of shares of common stock or securities convertible into common stock in a short period of time, there could be a dilution of the existing common stock and a decrease in the market price of the common stock.
We cannot predict the effect, if any, of future sales of common stock, or the availability of shares for future sales, on the market price of the common stock. Sales of substantial amounts of common stock, or the perception that such sales could occur, may adversely affect prevailing market prices for the common stock. At December 31, 2010, we had 1,027,034,357 shares of common stock issued and outstanding. Annaly owned approximately 4.38% of our outstanding shares of common stock as of December 31, 2010. Our equity incentive plan provides for grants of restricted common stock and other equity-based awards up to an aggregate of 8% of the issued and outstanding shares of our common stock (on a fully diluted basis) at the time of the award, subject to a ceiling of 40,000,000 shares available for issuance under the plan. On January 2, 2008, our executive officers and other employees of our Manager and our independent directors were granted, as a group, 1,301,000 shares of our restricted common stock. The restricted common stock granted to our executive officers and other employees of our Manager or its affiliates vests in equal installments on the first business day of each fiscal quarter over a period of 10 years beginning on January 2, 2008, of which 416,200 shares vested and 43,025 shares were forfeited as of December 31, 2010. The restricted common stock granted to our executive officers and other employees of our Manager or its affiliates that remain outstanding and are unvested will fully vest on the death of the individual. We do not make distributions on shares of restricted stock that have not vested.
Annaly has agreed with us to a lock-up period in connection with the shares purchased by Annaly immediately after our 2008 secondary offering that will expire at the earlier of (i) October 24, 2011 or (ii) the termination of the management agreement. Annaly has agreed with us to a further lock-up period in connection with the shares purchased by Annaly immediately after our April 15, 2009 secondary offering that will expire at the earlier of (i) April 15, 2012 or (ii) the termination of the management agreement. Annaly has agreed with us to a further lock-up period in connection with the shares purchased by Annaly immediately after our May 27, 2009 secondary offering that will expire at the earlier of (i) May 27, 2012 or (ii) the termination of the management agreement. When the lock-up periods expire, these common shares will become eligible for sale, in some cases subject to the requirements of Rule 144 under the Securities Act of 1933, as amended, or the Securities Act. The market price of our common stock may decline significantly when the restrictions on resale by certain of our stockholders lapse. Sales of substantial amounts of common stock or the perception that such sales could occur may adversely affect the prevailing market price for our common stock.
38
There is a risk that our stockholders may not receive distributions or that distributions may not grow over time.
We intend to make distributions on a quarterly basis out of assets legally available to our stockholders in amounts such that all or substantially all of our REIT taxable income in each year is distributed. We have not established a minimum distribution payment level and our ability to pay distributions may be adversely affected by a number of factors, including the risk factors described herein. All distributions will be made at the discretion of our board of directors and will depend on our earnings, our financial condition, maintenance of our REIT status and other factors as our board of directors may deem relevant from time to time. Among the factors that could adversely affect our results of operations and impair our ability to pay distributions to our stockholders are:
|
|
●
|
the profitability of the investments of net proceeds from our equity raises;
|
|
|
●
|
our ability to make profitable investments;
|
|
|
●
|
margin calls or other expenses that reduce our cash flow;
|
|
|
●
|
defaults in our asset portfolio or decreases in the value of our portfolio; and
|
|
|
●
|
the fact that anticipated operating expense levels may not prove accurate, as actual results may vary from estimates.
|
A change in any one of these factors could affect our ability to make distributions. We cannot assure you that we will achieve investment results that will allow us to make a specified level of cash distributions or year-to-year increases in cash distributions.
Market interest rates may have an effect on the trading value of our shares.
One of the factors that investors may consider in deciding whether to buy or sell our shares is our distribution rate as a percentage of our share price relative to market interest rates. If market interest rates increase, prospective investors may demand a higher distribution rate or seek alternative investments paying higher dividends or interest. As a result, interest rate fluctuations and capital market conditions can affect the market value of our shares. For instance, if interest rates rise, it is likely that the market price of our shares will decrease as market rates on interest-bearing securities, such as bonds, increase.
Investing in our shares may involve a high degree of risk.
The investments we make in accordance with our investment objectives may result in a high amount of risk when compared to alternative investment options and volatility or loss of principal. Our investments may be highly speculative and aggressive, are subject to credit risk, interest rate, and market value risks, among others, and therefore an investment in our shares may not be suitable for someone with lower risk tolerance.
Broad market fluctuations could negatively impact the market price of our common stock.
The stock market has experienced extreme price and volume fluctuations that have affected the market price of many companies in industries similar or related to ours and that have been unrelated to these companies’ operating performances. These broad market fluctuations could reduce the market price of our common stock. Furthermore, our operating results and prospects may be below the expectations of public market analysts and investors or may be lower than those of companies with comparable market capitalizations, which could lead to a material decline in the market price of our common stock.
Future sales of shares may have adverse consequences for investors.
We may issue additional shares in subsequent public offerings or private placements to make new investments or for other purposes. We are not required to offer any such shares to existing shareholders on a pre-emptive basis. Therefore, it may not be possible for existing shareholders to participate in such future share issues, which may dilute the existing shareholders’ interests in us.
Our charter and bylaws contain provisions that may inhibit potential acquisition bids that stockholders may consider favorable, and the market price of our common stock may be lower as a result.
Our charter and bylaws contain provisions that have an anti-takeover effect and inhibit a change in our board of directors. These provisions include the following:
39
|
|
●
|
There are ownership limits and restrictions on transferability and ownership in our charter.
To qualify as a REIT for each taxable year after 2007, not more than 50% of the value of our outstanding stock may be owned, directly or constructively, by five or fewer individuals during the second half of any calendar year. In addition, our shares must be beneficially owned by 100 or more persons during at least 335 days of a taxable year of 12 months or during a proportionate part of a shorter taxable year for each taxable year after 2007. To assist us in satisfying these tests, our charter generally prohibits any person from beneficially or constructively owning more than 9.8% in value or number of shares, whichever is more restrictive, of any class or series of our outstanding capital stock. These restrictions may discourage a tender offer or other transactions or a change in the composition of our board of directors or control that might involve a premium price for our shares or otherwise be in the best interests of our stockholders and any shares issued or transferred in violation of such restrictions being automatically transferred to a trust for a charitable beneficiary, thereby resulting in a forfeiture of the additional shares.
|
|
|
●
|
Our charter permits our board of directors to issue stock with terms that may discourage a third party from acquiring us
. Our charter permits our board of directors to amend the charter without stockholder approval to increase the total number of authorized shares of stock or the number of shares of any class or series and to issue common or preferred stock, having preferences, conversion or other rights, voting powers, restrictions, limitations as to dividends or other distributions, qualifications, or terms or conditions of redemption as determined by our board. Thus, our board could authorize the issuance of stock with terms and conditions that could have the effect of discouraging a takeover or other transaction in which holders of some or a majority of our shares might receive a premium for their shares over the then-prevailing market price of our shares.
|
|
|
●
|
Maryland Control Share Acquisition Act.
Maryland law provides that ‘‘control shares’’ of a corporation acquired in a ‘‘control share acquisition’’ will have no voting rights except to the extent approved by a vote of two-thirds of the votes eligible to be cast on the matter under the Maryland Control Share Acquisition Act. ‘‘Control shares’’ means voting shares of stock that, if aggregated with all other shares of stock owned by the acquirer or in respect of which the acquirer is able to exercise or direct the exercise of voting power (except solely by a revocable proxy), would entitle the acquirer to exercise voting power in electing directors within one of the following ranges of voting power: one-tenth or more but less than one-third, one-third or more but less than a majority, or a majority or more of all voting power. A ‘‘control share acquisition’’ means the acquisition of control shares, subject to certain exceptions.
|
If voting rights or control shares acquired in a control share acquisition are not approved at a stockholders’ meeting, or if the acquiring person does not deliver an acquiring person statement as required by the Maryland Control Share Acquisition Act, then, subject to certain conditions and limitations, the issuer may redeem any or all of the control shares for fair value. If voting rights of such control shares are approved at a stockholders’ meeting and the acquirer becomes entitled to vote a majority of the shares of stock entitled to vote, all other stockholders may exercise appraisal rights. Our bylaws contain a provision exempting acquisitions of our shares from the Maryland Control Share Acquisition Act. However, our board of directors may amend our bylaws in the future to repeal or modify this exemption, in which case any control shares of our company acquired in a control share acquisition will be subject to the Maryland Control Share Acquisition Act.
|
|
●
|
Business Combinations
. Under Maryland law, ‘‘business combinations’’ between a Maryland corporation and an interested stockholder or an affiliate of an interested stockholder are prohibited for five years after the most recent date on which the interested stockholder becomes an interested stockholder. These business combinations include a merger, consolidation, share exchange or, in circumstances specified in the statute, an asset transfer or issuance or reclassification of equity securities. An interested stockholder is defined as:
|
|
|
o
|
any person who beneficially owns 10% or more of the voting power of the corporation’s shares; or
|
|
|
o
|
an affiliate or associate of the corporation who, at any time within the two-year period before the date in question, was the beneficial owner of 10% or more of the voting power of the then outstanding voting stock of the corporation.
|
40
A person is not an interested stockholder under the statute if the board of directors approved in advance the transaction by which such person otherwise would have become an interested stockholder. However, in approving a transaction, the board of directors may provide that its approval is subject to compliance, at or after the time of approval, with any terms and conditions determined by the board. After the five-year prohibition, any business combination between the Maryland corporation and an interested stockholder generally must be recommended by the board of directors of the corporation and approved by the affirmative vote of at least:
|
|
o
|
80% of the votes entitled to be cast by holders of outstanding shares of voting stock of the corporation; and
|
|
|
o
|
two-thirds of the votes entitled to be cast by holders of voting stock of the corporation, other than shares held by the interested stockholder with whom or with whose affiliate the business combination is to be effected or held by an affiliate or associate of the interested stockholder.
|
These super-majority vote requirements do not apply if the corporation’s common stockholders receive a minimum price, as defined under Maryland law, for their shares in the form of cash or other consideration in the same form as previously paid by the interested stockholder for its shares. The statute permits various exemptions from its provisions, including business combinations that are exempted by the board of directors before the time that the interested stockholder becomes an interested stockholder. Our board of directors has adopted a resolution which provides that any business combination between us and any other person is exempted from the provisions of the Maryland Control Share Acquisition Act, provided that the business combination is first approved by the board of directors. This resolution, however, may be altered or repealed in whole or in part at any time. If this resolution is repealed, or the board of directors does not otherwise approve a business combination, this statute may discourage others from trying to acquire control of us and increase the difficulty of consummating any offer.
|
|
●
|
Staggered board.
Our board of directors is divided into three classes of directors. The current terms of the directors expire in 2011, 2012 and 2013 respectively. Directors of each class are chosen for three-year terms upon the expiration of their current terms, and each year one class of directors is elected by the stockholders. The staggered terms of our directors may reduce the possibility of a tender offer or an attempt at a change in control, even though a tender offer or change in control might be in the best interests of our stockholders.
|
|
|
●
|
Our charter and bylaws contain other possible anti-takeover provisions.
Our charter and bylaws contains other provisions that may have the effect of delaying, deferring or preventing a change in control of us or the removal of existing directors and, as a result, could prevent our stockholders from being paid a premium for their common stock over the then-prevailing market price.
|
Our rights and the rights of our stockholders to take action against our directors and officers are limited, which could limit stockholder's recourse in the event of actions not in their best interests.
Our charter limits the liability of our directors and officers to us and our stockholders for money damages, except for liability resulting from:
|
|
●
|
actual receipt of an improper benefit or profit in money, property or services; or
|
|
|
●
|
a final judgment based upon a finding of active and deliberate dishonesty by the director or officer that was material to the cause of action adjudicated
|
for which Maryland law prohibits such exemption from liability.
In addition, our charter authorizes us to obligate our company to indemnify our present and former directors and officers for actions taken by them in those capacities to the maximum extent permitted by Maryland law. Our bylaws require us to indemnify each present or former director or officer, to the maximum extent permitted by Maryland law, in the defense of any proceeding to which he or she is made, or threatened to be made, a party because of his or her service to us. In addition, we may be obligated to fund the defense costs incurred by our directors and officers.
41
The fair value of certain of the assets on our consolidated balance sheets as calculated according to GAAP may not reflect amounts we would receive if we disposed of those assets.
GAAP requires that we consolidate our RMBS re-securitization transactions on our consolidated balance sheets and report these assets at fair value. Under GAAP, fair value for these assets is measured by determining the fair value of the underlying RMBS assets we contributed to the re-securitization trust as opposed to evaluating the fair value of the re-securitized securities we received as a result of the RMBS re-securitization transaction.
The fair value of the underlying RMBS assets subject to the RMBS re-securitization transactions may differ from the value of the re-securitized securities we received as a result of the RMBS re-securitization transaction. Discrepancies arise as a result of market dynamics, the limitations of the measurement techniques required by GAAP, the consolidation accounting principles under GAAP and the subordinate nature, complexity, illiquidity and restrictive features of the re-securitized securities we own. These differences between the fair value of the underlying RMBS consolidated on our consolidated balance sheet under GAAP presentation and the economic value of our investments in the re-securitized securities can be significant.
A discrepancy where the fair value of the underlying RMBS assets contained in a re-securitization trust is different from the amount we would receive if we sold the re-securitized securities we own may result in an overstatement or understatement of our book value due to the accounting standards we are required to apply. Reporting a higher book value than the value of our net investments in assets could have adverse effects on us. The adverse effects could include the inability to agree upon covenants with counterparties, the inability to satisfy collateral demands of counterparties based on their review of our financial statements, or an overestimation in the market price of our common stock.
Changes in the fair values of our assets, liabilities, and interest rate swaps can have adverse effects on us, including earnings volatility, and volatility in our book value.
The fair values for our assets, liabilities, and interest rate swaps can be volatile. The fair values can change rapidly and significantly from a variety of factors, including changes in interest rates, credit performance, perceived risk, supply, demand, and actual and projected cash flows and prepayments. Decreases in fair value may not necessarily be the result of deterioration in future cash flows. Moreover, fair values for illiquid assets can be difficult to estimate, which may lead to volatility and uncertainty of earnings.
For GAAP purposes, we mark to market some, but not all, of the assets and liabilities on our consolidated balance sheet. In addition, valuation adjustments on certain consolidated assets and our interest rate swaps are reflected in our consolidated statement of income. If we sell an asset that has not been marked to market through our consolidated statement of income at a reduced market price relative to its cost basis, our reported earnings will be reduced.
A decrease in the fair value of the securities we own may result in a reduction in our book value due to the accounting standards we are required to apply. Reporting a low book value could have adverse effects even if that book value is not indicative of the actual value of our net investments in assets. The adverse effects could include the inability to meet or agree upon covenants with counterparties, to enter into interest rate swaps, or a reduction in the market price of our common stock.
Tax Risks
Your investment has various federal income tax risks.
This summary of certain tax risks is limited to the federal tax risks addressed below. Additional risks or issues may exist that are not addressed in this Form 10-K and that could affect the federal tax treatment of us or our stockholders. This is not intended to be used and cannot be used by any stockholder to avoid penalties that may be imposed on stockholders under the Internal Revenue Code, or the Code. We strongly urge you to seek advice based on your particular circumstances from an independent tax advisor concerning the effects of federal, state and local income tax law on an investment in common stock and on your individual tax situation.
42
Complying with REIT requirements may cause us to forego otherwise attractive opportunities.
To qualify as a REIT for federal income tax purposes, we must continually satisfy various tests regarding the sources of our income, the nature and diversification of our assets, the amounts we distribute to our stockholders and the ownership of our stock. To meet these tests, we may be required to forego investments we might otherwise make. We may be required to make distributions to stockholders at disadvantageous times or when we do not have funds readily available for distribution. Thus, compliance with the REIT requirements may hinder our investment performance.
Complying with REIT requirements may force us to liquidate otherwise attractive investments.
To qualify as a REIT, we generally must ensure that at the end of each calendar quarter at least 75% of the value of our total assets consists of cash, cash items, government securities and qualified REIT real estate assets, including certain mortgage loans and mortgage-backed securities. The remainder of our investment in securities (other than government securities and qualifying real estate assets) generally cannot include more than 10% of the outstanding voting securities of any one issuer or more than 10% of the total value of the outstanding securities of any one issuer. In addition, in general, no more than 5% of the value of our assets (other than government securities, qualifying real estate assets, and stock in one or more TRSs) can consist of the securities of any one issuer, and no more than 25% of the value of our total securities can be represented by securities of one or more TRSs. If we fail to comply with these requirements at the end of any quarter, we must correct the failure within 30 days after the end of such calendar quarter or qualify for certain statutory relief provisions to avoid losing our REIT status and suffering adverse tax consequences. As a result, we may be required to liquidate from our portfolio otherwise attractive investments. These actions could have the effect of reducing our income and amounts available for distribution to our stockholders.
Potential characterization of distributions or gain on sale may be treated as unrelated business taxable income to tax-exempt investors.
If (1) all or a portion of our assets are subject to the rules relating to taxable mortgage pools, (2) we are a ‘‘pension-held REIT,’’ or (3) a tax-exempt stockholder has incurred debt to purchase or hold our common stock, then a portion of the distributions to and, in the case of a stockholder described in clause (3), gains realized on the sale of common stock by such tax-exempt stockholder may be subject to federal income tax as unrelated business taxable income under the Internal Revenue Code.
Classification of a securitization or financing arrangement we enter into as a taxable mortgage pool could subject us or certain of our stockholders to increased taxation.
We intend to structure our securitization and financing arrangements as to not create a taxable mortgage pool. However, if we have borrowings with two or more maturities and, (1) those borrowings are secured by mortgages or mortgage-backed securities and (2) the payments made on the borrowings are related to the payments received on the underlying assets, then the borrowings and the pool of mortgages or mortgage-backed securities to which such borrowings relate may be classified as a taxable mortgage pool under the Internal Revenue Code. If any part of our investments were to be treated as a taxable mortgage pool, then our REIT status would not be impaired, but a portion of the taxable income we recognize may, under regulations to be issued by the Treasury Department, be characterized as ‘‘excess inclusion’’ income and allocated among our stockholders to the extent of and generally in proportion to the distributions we make to each stockholder. Any excess inclusion income would:
|
|
●
|
not be allowed to be offset by a stockholder’s net operating losses;
|
|
|
●
|
be subject to a tax as unrelated business income if a stockholder were a tax-exempt stockholder;
|
|
|
●
|
be subject to the application of federal income tax withholding at the maximum rate (without reduction for any otherwise applicable income tax treaty) with respect to amounts allocable to foreign stockholders; and
|
|
|
●
|
be taxable (at the highest corporate tax rate) to us, rather than to our stockholders, to the extent the excess inclusion income relates to stock held by disqualified organizations (generally, tax-exempt organizations not subject to tax on unrelated business income, including governmental organizations).
|
Failure to qualify as a REIT would subject us to federal income tax, which would reduce the cash available for distribution to our stockholders.
We qualify as a REIT for federal income tax purposes commencing with our taxable year ended December 31, 2007. However, the federal income tax laws governing REITs are extremely complex, and interpretations of the federal income tax laws governing qualification as a REIT are limited. Qualifying as a REIT requires us to meet various tests regarding the nature of our assets and our income, the ownership of our outstanding stock, and the amount of our distributions on an ongoing basis. While we intend to operate so that we will qualify as a REIT, given the highly complex nature of the rules governing REITs, the ongoing importance of factual determinations, including the tax treatment of certain investments we may make, and the possibility of future changes in our circumstances, no assurance can be given that we will so qualify for any particular year. If we fail to qualify as a REIT in any calendar year and we do not qualify for certain statutory relief provisions, we would be required to pay federal income tax on our taxable income. We might need to borrow money or sell assets to pay that tax. Our payment of income tax would decrease the amount of our income available for distribution to our stockholders. Furthermore, if we fail to maintain our qualification as a REIT and we do not qualify for certain statutory relief provisions, we no longer would be required to distribute substantially all of our REIT taxable income to our stockholders. Unless our failure to qualify as a REIT were excused under federal tax laws, we would be disqualified from taxation as a REIT for the four taxable years following the year during which qualification was lost.
43
Failure to make required distributions would subject us to tax, which would reduce the cash available for distribution to our stockholders.
To qualify as a REIT, we must distribute to our stockholders each calendar year at least 90% of our REIT taxable income (excluding certain items of non-cash income in excess of a specified threshold), determined without regard to the deduction for dividends paid and excluding net capital gain. To the extent that we satisfy the 90% distribution requirement, but distribute less than 100% of our taxable income, we will be subject to federal corporate income tax on our undistributed income. In addition, we will incur a 4% nondeductible excise tax on the amount, if any, by which our distributions in any calendar year are less than the sum of:
|
|
●
|
85% of our REIT ordinary income for that year;
|
|
|
●
|
95% of our REIT capital gain net income for that year; and
|
|
|
●
|
any undistributed taxable income from prior years.
|
We intend to distribute our REIT taxable income to our stockholders in a manner intended to satisfy the 90% distribution requirement and to avoid both corporate income tax and the 4% nondeductible excise tax. However, there is no requirement that TRSs distribute their after-tax net income to their parent REIT or their stockholders. Our taxable income may substantially exceed our net income as determined by GAAP, because, for example, realized capital losses will be deducted in determining our GAAP net income, but may not be deductible in computing our taxable income. In addition, we may invest in assets that generate taxable income in excess of economic income or in advance of the corresponding cash flow from the assets. To the extent that we generate such non-cash taxable income in a taxable year, we may incur corporate income tax and the 4% nondeductible excise tax on that income if we do not distribute such income to stockholders in that year. As a result of the foregoing, we may generate less cash flow than taxable income in a particular year. In that event, we may be required to use cash reserves, incur debt, or liquidate non-cash assets at rates or at times that we regard as unfavorable to satisfy the distribution requirement and to avoid corporate income tax and the 4% nondeductible excise tax in that year. Moreover, our ability to distribute cash may be limited by financing facilities we may enter into.
Ownership limitations may restrict change of control or business combination opportunities in which our stockholders might receive a premium for their shares.
In order for us to qualify as a REIT for each taxable year after 2007, no more than 50% in value of our outstanding capital stock may be owned, directly or indirectly, by five or fewer individuals during the last half of any calendar year. ‘‘Individuals’’ for this purpose include natural persons, private foundations, some employee benefit plans and trusts, and some charitable trusts. To preserve our REIT qualification, our charter generally prohibits any person from directly or indirectly owning more than 9.8% in value or in number of shares, whichever is more restrictive, of any class or series of the outstanding shares of our capital stock. This ownership limitation could have the effect of discouraging a takeover or other transaction in which holders of our common stock might receive a premium for their shares over the then prevailing market price or which holders might believe to be otherwise in their best interests.
Our ownership of and relationship with any TRS which we may form or acquire will be limited, and a failure to comply with the limits would jeopardize our REIT status and may result in the application of a 100% excise tax.
A REIT may own up to 100% of the stock of one or more TRSs. A TRS may earn income that would not be qualifying income if earned directly by the parent REIT. Both the subsidiary and the REIT must jointly elect to treat the subsidiary as a TRS. Overall, no more than 25% of the value of a REIT’s assets may consist of stock or securities of one or more TRSs. A TRS will pay federal, state and local income tax at regular corporate rates on any income that it earns. In addition, the TRS rules impose a 100% excise tax on certain transactions between a TRS and its parent REIT that are not conducted on an arm’s-length basis. Any TRS that we may form would pay federal, state and local income tax on its taxable income, and its after-tax net income would be available for distribution to us but would not be required to be distributed to us. We anticipate that the aggregate value of the TRS stock and securities owned by us will be less than 25% of the value of our total assets (including the TRS stock and securities). Furthermore, we will monitor the value of our investments in our TRSs to ensure compliance with the rule that no more than 25% of the value of our assets may consist of TRS stock and securities (which is applied at the end of each calendar quarter). In addition, we will scrutinize all of our transactions with taxable REIT subsidiaries to ensure that they are entered into on arm’s-length terms to avoid incurring the 100% excise tax described above. There can be no assurance, however, that we will be able to comply with the 25% limitation discussed above or to avoid application of the 100% excise tax discussed above.
44
We could fail to qualify as a REIT or we could become subject to a penalty tax if income we recognize from certain investments that are treated or could be treated as equity interests in a foreign corporation exceeds 5% of our gross income in a taxable year.
We may invest in securities, such as subordinated interests in certain CDO offerings, that are treated or could be treated for federal (and applicable state and local) corporate income tax purposes as equity interests in foreign corporations. Categories of income that qualify for the 95% gross income test include dividends, interest and certain other enumerated classes of passive income. Under certain circumstances, the federal income tax rules concerning controlled foreign corporations and passive foreign investment companies require that the owner of an equity interest in a foreign corporation include amounts in income without regard to the owner’s receipt of any distributions from the foreign corporation. Amounts required to be included in income under those rules are technically neither actual dividends nor any of the other enumerated categories of passive income specified in the 95% gross income test. Furthermore, there is no clear precedent with respect to the qualification of such income under the 95% gross income test. Due to this uncertainty, we intend to limit our direct investment in securities that are or could be treated as equity interests in a foreign corporation such that the sum of the amounts we are required to include in income with respect to such securities and other amounts of non-qualifying income do not exceed 5% of our gross income. We cannot assure you that we will be successful in this regard. To avoid any risk of failing the 95% gross income test, we may be required to invest only indirectly, through a domestic TRS, in any securities that are or could be considered to be equity interests in a foreign corporation. This, of course, will result in any income recognized from any such investment to be subject to federal income tax in the hands of the TRS, which may, in turn, reduce our yield on the investment.
Liquidation of our assets may jeopardize our REIT qualification.
To qualify as a REIT, we must comply with requirements regarding our assets and our sources of income. If we are compelled to liquidate our investments to repay obligations to our lenders, we may be unable to comply with these requirements, ultimately jeopardizing our qualification as a REIT, or we may be subject to a 100% tax on any resultant gain if we sell assets in transactions that are considered to be prohibited transactions.
The tax on prohibited transactions will limit our ability to engage in transactions, including certain methods of securitizing mortgage loans that would be treated as sales for federal income tax purposes.
A REIT’s net income from prohibited transactions is subject to a 100% tax. In general, prohibited transactions are sales or other dispositions of property, other than foreclosure property, but including mortgage loans, held primarily for sale to customers in the ordinary course of business. We might be subject to this tax if we sold or securitized our assets in a manner that was treated as a sale for federal income tax purposes. Therefore, to avoid the prohibited transactions tax, we may choose not to engage in certain sales of assets at the REIT level and may securitize assets only in transactions that are treated as financing transactions and not as sales for tax purposes even though such transactions may not be the optimal execution on a pre-tax basis. We could avoid any prohibited transactions tax concerns by engaging in securitization transactions through a TRS, subject to certain limitations described above. To the extent that we engage in such activities through domestic TRSs, the income associated with such activities will be subject to federal (and applicable state and local) corporate income tax.
45
Characterization of the repurchase agreements we enter into to finance our investments as sales for tax purposes rather than as secured lending transactions would adversely affect our ability to qualify as a REIT.
We have entered into and will enter into repurchase agreements with a variety of counterparties to achieve our desired amount of leverage for the assets in which we invest. When we enter into a repurchase agreement, we generally sell assets to our counterparty to the agreement and receive cash from the counterparty. The counterparty is obligated to resell the assets back to us at the end of the term of the transaction, which is typically 30 to 90 days. We believe that for federal income tax purposes we will be treated as the owner of the assets that are the subject of repurchase agreements and that the repurchase agreements will be treated as secured lending transactions notwithstanding that such agreement may transfer record ownership of the assets to the counterparty during the term of the agreement. It is possible, however, that the IRS could successfully assert that we did not own these assets during the term of the repurchase agreements, in which case we could fail to qualify as a REIT.
Complying with REIT requirements may limit our ability to hedge effectively.
The REIT provisions of the Internal Revenue Code substantially limit our ability to hedge mortgage-backed securities and related borrowings. Under these provisions, our annual gross income from non-qualifying hedges, together with any other income not generated from qualifying real estate assets, cannot exceed 25% of our annual gross income. In addition, our aggregate gross income from non-qualifying hedges, fees, and certain other non-qualifying sources cannot exceed 5% of our annual gross income. As a result, we might have to limit our use of advantageous hedging techniques or implement those hedges through a TRS, which we may form in the future. This could increase the cost of our hedging activities or expose us to greater risks associated with changes in interest rates than we would otherwise want to bear.
We may be subject to adverse legislative or regulatory tax changes that could reduce the market price of our common stock.
At any time, the federal income tax laws or regulations governing REITs or the administrative interpretations of those laws or regulations may be amended. We cannot predict when or if any new federal income tax law, regulation or administrative interpretation, or any amendment to any existing federal income tax law, regulation or administrative interpretation, will be adopted, promulgated or become effective and any such law, regulation or interpretation may take effect retroactively. We and our stockholders could be adversely affected by any such change in, or any new, federal income tax law, regulation or administrative interpretation.
Dividends payable by REITs do not qualify for the reduced tax rates.
Legislation enacted in 2003 generally reduces the maximum tax rate for dividends payable to domestic stockholders that are individuals, trusts and estates from 38.6% to 15% (through 2012). Dividends payable by REITs, however, are generally not eligible for the reduced rates. Although this legislation does not adversely affect the taxation of REITs or dividends paid by REITs, the more favorable rates applicable to regular corporate dividends could cause investors who are individuals, trusts and estates to perceive investments in REITs to be relatively less attractive than investments in stock of non-REIT corporations that pay dividends, which could adversely affect the value of the stock of REITs, including our common stock.
None.
We do not own any property. Our executive and administrative office is located at 1211 Avenue of the Americas, Suite 2902, New York, New York 10036, telephone (646) 454-3759. We share this office space with Annaly and FIDAC.
We are not party to any material litigation or legal proceedings, or to the best of our knowledge, any threatened litigation or legal proceedings, which, in our opinion, individually or in the aggregate, would have a material adverse effect on our results of operations or financial condition.
46
Our common stock began trading publicly on the New York Stock Exchange under the trading symbol “CIM” on November 16, 2007. As of February 16, 2011, we had 1,027,058,153 shares of common stock issued and outstanding which were held by approximately 178,652 beneficial holders. The following tables set forth, for the periods indicated, the high, low, and closing sales prices per share of our common stock as reported on the New York Stock Exchange composite tape and the cash dividends declared per share of our common stock.
|
Stock Price
|
||||||||||||
|
High
|
Low
|
Close
|
||||||||||
|
Quarter Ended December 31, 2010
|
$ | 4.30 | $ | 3.86 | $ | 4.11 | ||||||
|
Quarter Ended September 30, 2010
|
$ | 4.17 | $ | 3.51 | $ | 3.95 | ||||||
|
Quarter Ended June 30, 2010
|
$ | 4.18 | $ | 3.61 | $ | 3.61 | ||||||
|
Quarter Ended March 31, 2010
|
$ | 4.14 | $ | 3.56 | $ | 3.89 | ||||||
|
Quarter Ended December 31, 2009
|
$ | 4.14 | $ | 3.49 | $ | 3.88 | ||||||
|
Quarter Ended September 30, 2009
|
$ | 4.30 | $ | 3.20 | $ | 3.82 | ||||||
|
Quarter Ended June 30, 2009
|
$ | 3.78 | $ | 3.04 | $ | 3.49 | ||||||
|
Quarter Ended March 31, 2009
|
$ | 3.60 | $ | 2.49 | $ | 3.36 | ||||||
|
Common Dividends
Declared Per Share
|
|
|
Quarter Ended December 31, 2010
|
$0.17
|
|
Quarter Ended September 30, 2010
|
$0.18
|
|
Quarter Ended June 30, 2010
|
$0.17
|
|
Quarter Ended March 31, 2010
|
$0.17
|
|
Quarter Ended December 31, 2009
|
$0.17
|
|
Quarter Ended September 30, 2009
|
$0.12
|
|
Quarter Ended June 30, 2009
|
$0.08
|
|
Quarter Ended March 31, 2009
|
$0.06
|
We pay quarterly dividends and distribute to our stockholders all or substantially all of our taxable income in each year (subject to certain adjustments). This enables us to qualify for the tax benefits accorded to a REIT under the Code. We have not established a minimum dividend payment level and our ability to pay dividends may be adversely affected for the reasons described under the caption “Risk Factors.” All distributions will be made at the discretion of our board of directors and will depend on our earnings, our financial condition, maintenance of our REIT status and such other factors as our board of directors may deem relevant from time to time.
47
Share Performance Graph
The following graph and table set forth certain information comparing the yearly percentage change in cumulative total return on our common stock to the cumulative total return of the Standard & Poor’s Composite-500 Stock Index or S&P 500 Index, and the Bloomberg REIT Mortgage Index, or BBG REIT Index, an industry index of mortgage REITs. The comparison is for the period from November 15, 2007, the day our common stock commenced trading on the NYSE, to December 31, 2010 and assumes the reinvestment of dividends. The graph and table assume that $100 was invested in our common stock and the two other indices on November 15, 2007. Upon written request we will provide stockholders with a list of the REITs included in the BBG REIT Index.
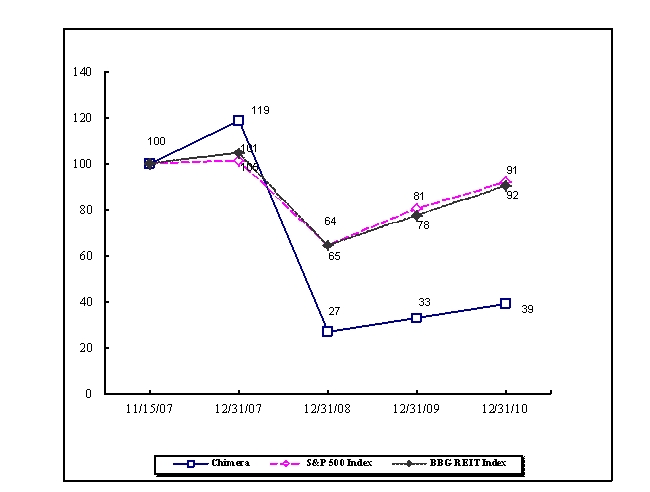
|
11/15/2007
|
12/31/2007
|
12/31/2008
|
12/31/2009
|
12/31/2010
|
||
|
Chimera
|
100
|
119
|
27
|
33
|
39
|
|
|
S&P 500 Index
|
100
|
101
|
64
|
81
|
92
|
|
|
BBG REIT Index
|
100
|
105
|
65
|
78
|
91
|
The information in the share performance graph and table has been obtained from sources believed to be reliable, but neither its accuracy nor its completeness can be guaranteed. The historical information set forth above is not necessarily indicative of future performance. Accordingly, we do not make or endorse any predictions as to future share performance.
48
The share performance graph and table shall not be deemed, under the Securities Act of 1933, as amended, or the Securities Exchange Act of 1934, as amended, to be (i) “soliciting material” or “filed” or (ii) incorporated by reference by any general statement into any filing made by us with the Securities and Exchange Commission, except to the extent that we specifically incorporates such share performance graph and table by reference.
Equity Compensation Plan Information
We have adopted a long term stock incentive plan, or Incentive Plan, to provide incentives to our independent directors, employees of our Manager and its affiliates to stimulate their efforts towards our continued success long-term growth and profitability and to attract, reward and retain personnel and other service providers. The Incentive Plan authorizes the Compensation Committee of the board of directors to grant awards, including incentive stock options as defined under Section 422 of the Code, or ISOs, non-qualified stock options, or NQSOs, restricted shares and other types of incentive awards. The Incentive Plan authorizes the granting of options or other awards for an aggregate of 40,000,000 shares of common stock. For a description of our Incentive Plan, see Note 11 to the Consolidated Financial Statements.
The following table provides information as of December 31, 2010 concerning shares of our common stock authorized for issuance under our existing Incentive Plan.
|
Plan Category
|
Number of Securities
to be Issued Upon
Exercise of
Outstanding Options, Warrants, and Rights
|
Weighted Average Exercise Price of Outstanding Options, Warrants, and Rights
|
Number of Securities Remaining Available
for Future Issuance
Under Equity
Compensation Plans
|
|||||||||
|
Equity Compensation Plans Approved by Stockholders
|
- | - | 38,742,025 | |||||||||
|
Equity Compensation Plans Not Approved by Stockholders (1)
|
- | - | - | |||||||||
|
Total
|
- | - | 38,742,025 | |||||||||
|
(1) We do not have any equity plans that have not been approved by our stockholders.
|
||||||||||||
49
The following selected financial data are derived from our audited consolidated financial statements for the years ended December 31, 2010 and 2009. The selected financial data should be read in conjunction with the more detailed information contained in the Consolidated Financial Statements and Notes thereto and “Management's Discussion and Analysis of Financial Condition and Results of Operations” included elsewhere in this Form 10-K.
|
Consolidated Statements of Financial Condition Highlights
|
||||||||||||||||
|
(dollars in thousands, except share and per share data)
|
||||||||||||||||
|
December 31,
|
December 31,
|
December 31,
|
December 31,
|
|||||||||||||
|
2010
|
2009
|
2008
|
2007
|
|||||||||||||
|
Non-Agency Mortgage-Backed Securities
|
||||||||||||||||
|
Senior
|
$ | 987,685 | $ | 2,022,406 | $ | 603,234 | $ | 1,124,290 | ||||||||
|
Subordinated
|
$ | 2,210,858 | $ | 376,459 | $ | 9,871 | $ | - | ||||||||
|
Senior, non-retained
|
$ | 2,330,568 | $ | - | $ | - | $ | - | ||||||||
|
Agency Mortgage-Backed securities
|
$ | 2,133,584 | $ | 1,690,029 | $ | 242,362 | $ | - | ||||||||
|
Mortgage loans held for investment
|
$ | - | $ | - | $ | - | $ | 162,371 | ||||||||
|
Securitized loans held for investment
|
$ | 353,532 | $ | 470,533 | $ | 583,346 | $ | - | ||||||||
|
Total assets
|
$ | 8,073,700 | $ | 4,618,328 | $ | 1,477,501 | $ | 1,565,636 | ||||||||
|
Repurchase agreements
|
$ | 1,808,797 | $ | 1,716,398 | $ | - | $ | 270,584 | ||||||||
|
Repurchase agreements with affiliates
|
$ | - | $ | 259,004 | $ | 562,119 | $ | - | ||||||||
|
Securitized debt
|
$ | 289,236 | $ | 390,350 | $ | 488,743 | $ | - | ||||||||
|
Securitized debt, non-retained
|
$ | 1,956,079 | $ | - | $ | - | $ | - | ||||||||
|
Total liabilities
|
$ | 4,390,695 | $ | 2,491,766 | $ | 1,063,046 | $ | 1,026,747 | ||||||||
|
Shareholders' equity
|
$ | 3,683,006 | $ | 2,126,562 | $ | 414,455 | $ | 538,889 | ||||||||
|
Book value per share (1)
|
$ | 3.59 | $ | 3.17 | $ | 2.34 | $ | 14.29 | ||||||||
|
Number of shares outstanding
|
1,027,034,357 | 670,371,587 | 177,198,212 | 37,705,563 | ||||||||||||
|
(1) See discussion of Financial Condition on page 56 for a review of GAAP book value.
|
||||||||||||||||
|
|
||||||||||||||||
|
(dollars in thousands, except share and per share data)
|
||||||||||||||||
|
For the
|
For the
|
For the
|
For the Period
|
|||||||||||||
|
Year Ended
|
Year Ended
|
Year Ended
|
November 21, 2007 to | |||||||||||||
|
December 31, 2010
|
December 31, 2009
|
December 31, 2008
|
December 31, 2007
|
|||||||||||||
|
Net interest income
|
$ | 603,202 | $ | 263,456 | $ | 44,715 | $ | 3,077 | ||||||||
|
Net income (loss)
|
$ | 532,851 | $ | 323,983 | $ | (119,809 | ) | $ | (2,906 | ) | ||||||
|
Income (loss) per share-basic and diluted
|
$ | 0.65 | $ | 0.64 | $ | (1.90 | ) | $ | (0.08 | ) | ||||||
|
Average shares-basic and diluted
|
822,617,319 | 507,042,421 | 63,155,878 | 37,401,737 | ||||||||||||
|
Dividends declared per share (1)
|
$ | 0.69 | $ | 0.43 | $ | 0.62 | $ | 0.025 | ||||||||
|
(1) For applicable period as reported in our earnings announcements.
|
||||||||||||||||
The following discussion of our financial condition and results of operations should be read in conjunction with the consolidated financial statements and notes to those statements included in Item 8 of this Form 10-K. The discussion may contain certain forward-looking statements that involve risks and uncertainties. Forward-looking statements are those that are not historical in nature. As a result of many factors, such as those set forth under “Risk Factors” in this Form 10-K, our actual results may differ materially from those anticipated in such forward-looking statements.
50
Executive Summary
We are a specialty finance company that invests, either directly or indirectly through our subsidiaries, in residential mortgage-backed securities, or RMBS, residential mortgage loans, real estate related securities and various other asset classes. We are externally managed by Fixed Income Discount Advisory Company, which we refer to as FIDAC or our Manager. FIDAC is a fixed-income investment management company that is registered as an investment adviser with the Securities and Exchange Commission, or SEC. FIDAC is a wholly owned subsidiary of Annaly Capital Management, Inc., or Annaly. FIDAC has a broad range of experience in managing investments in Agency RMBS, which are mortgage pass-through certificates, collateralized mortgage obligations, or CMOs, and other mortgage-backed securities representing interests in or obligations backed by pools of mortgage loans issued or guaranteed by Fannie Mae, Freddie Mac, and Ginnie Mae, non-Agency RMBS, collateralized debt obligations, or CDOs, and other real estate related investments.
We have elected and intend to qualify to be taxed as a REIT for federal income tax purposes commencing with our taxable year ended December 31, 2007. Our targeted asset classes and the principal investments we expect to make in each are as follows:
|
●
|
RMBS, including:
|
|
|
o
|
Non-Agency RMBS, including investment-grade and non-investment grade classes, including the BB-rated, B-rated and non-rated classes
|
|
|
o
|
Agency RMBS
|
|
●
|
Residential mortgage loans, including:
|
|
|
o
|
Prime mortgage loans
|
|
|
o
|
Jumbo prime mortgage loans
|
|
|
o
|
Alt-A mortgage loans
|
|
●
|
Commercial mortgage loans
|
|
●
|
Asset Backed Securities, or ABS, including:
|
|
|
o
|
Commercial mortgage-backed securities, or CMBS
|
|
|
o
|
Debt and equity tranches of collateralized debt obligations, or CDOs
|
|
|
o
|
Consumer and non-consumer ABS, including investment-grade and non-investment grade classes, including the BB-rated, B-rated and non-rated classes
|
We completed our initial public offering on November 21, 2007. In that offering and in a concurrent private offering we raised net proceeds of approximately $533.6 million from the sales of shares of our common stock. Since then we have raised an aggregate of approximately $3.1 billion in follow-on offerings from the sales of shares of our common stock.
Our objective is to provide attractive risk-adjusted returns to our investors over the long-term, primarily through dividends and secondarily through capital appreciation. We intend to achieve this objective by investing in a broad class of financial assets to construct an investment portfolio that is designed to achieve attractive risk-adjusted returns and that is structured to comply with the various federal income tax requirements for REIT status and to maintain our exemption from the Investment Company Act of 1940, or the 1940 Act.
Since we commenced operations in November 2007, we have focused our investment activities on acquiring non-Agency RMBS and on purchasing residential mortgage loans that have been originated by select high-quality originators, including the retail lending operations of leading commercial banks. Our investment portfolio is weighted toward non-Agency RMBS. At December 31, 2010, approximately 83.4% of our investment portfolio’s principal value was non-Agency RMBS, 12.6% of our investment portfolio’s principal value was Agency RMBS, and 4.0% of our investment portfolio’s principal value was secured residential mortgage loans. At December 31, 2009, approximately 64.6% of our investment portfolio’s principal value was non-Agency RMBS, 23.3% of our investment portfolio’s principal value was Agency RMBS, and 12.1% of our investment portfolio’s principal value was secured residential mortgage loans. We expect that over the near term our investment portfolio will continue to be weighted toward RMBS, subject to maintaining our REIT qualification and our 1940 Act exemption.
51
Our investment strategy is intended to take advantage of opportunities in the current interest rate and credit environment. We will adjust our strategy to changing market conditions by shifting our asset allocations across these various asset classes as interest rate and credit cycles change over time. We believe that our strategy, combined with FIDAC’s experience, will enable us to pay dividends and achieve capital appreciation throughout changing market cycles. We expect to take a long-term view of assets and liabilities, and our reported earnings and mark-to-market valuations at the end of a financial reporting period will not significantly impact our objective of providing attractive risk-adjusted returns to our stockholders over the long-term.
We use leverage to seek to increase our potential returns and to fund the acquisition of our assets. Our income is generated primarily by the difference, or net spread, between the income we earn on our assets and the cost of our borrowings. We expect to finance our investments using a variety of financing sources including, when available, repurchase agreements, warehouse facilities, securitizations, commercial paper and term financing CDOs. We may manage our debt by utilizing interest rate hedges, such as interest rate swaps, to reduce the effect of interest rate fluctuations related to our debt.
Recent Developments
During the period of market dislocation that commenced in August 2007, fiscal and monetary policymakers established new liquidity facilities for primary dealers and commercial banks, reduced short-term interest rates, and passed legislation that is intended to address the challenges of mortgage borrowers and lenders. In September 2008 Fannie Mae and Freddie Mac were placed into the conservatorship of the Federal Housing Finance Agency, or FHFA, their federal regulator, pursuant to its powers under The Federal Housing Finance Regulatory Reform Act of 2008, a part of the Housing and Economic Recovery Act of 2008. In addition to FHFA becoming the conservator of Fannie Mae and Freddie Mac, the Treasury and FHFA entered into preferred stock purchase agreements (PSPAs) between the Treasury and Fannie Mae and Freddie Mac pursuant to which the Treasury will ensure that each of Fannie Mae and Freddie Mac maintains a positive net worth. On December 24, 2009, the Treasury amended the terms of the PSPAs with Fannie Mae and Freddie Mac to remove the $200 billion per institution limit established under the PSPAs until the end of 2012. The Treasury also amended the PSPAs with respect to the requirements for Fannie Mae and Freddie Mac to reduce their portfolios.
On July 21, 2010, President Obama signed into law the Dodd-Frank Wall Street Reform and Consumer Protection Act, or the Dodd-Frank Act. The Dodd-Frank Act provides for new regulations on financial institutions and creates new supervisory and advisory bodies, including the new Consumer Financial Protection Bureau. The Dodd-Frank Act tasks many agencies with issuing a variety of new regulations, including rules related to mortgage origination and servicing, securitization and derivatives. As the Dodd-Frank Act has only recently been enacted and because a significant number of regulations have yet to be proposed or adopted in final form, it is not possible for us to predict how the Dodd-Frank Act will impact our business.
On February 11, 2011, the U.S Department of the Treasury issued a White Paper titled “Reforming America's Housing Finance Market” that lays out, among other things, proposals to limit or potentially wind down the role that Fannie Mae and Freddie Mac play in the mortgage market. Any such proposals, if enacted, may have broad adverse implications for the mortgage-backed securities market and our business, operations and financial condition. We expect such proposals to be the subject of significant discussion and it is not yet possible to determine whether or when such proposals may be enacted, what form any final legislation or policies might take and how proposals, legislation or policies emanating from the White Paper may impact the mortgage-backed securities market and our business, operations and financial condition. We are evaluating the potential impact of the proposals set forth in the White Paper.
Market conditions are evolving on a number of fronts. Regulatory and technical dynamics continue to develop, and monetary policy initiatives, including additional large scale asset purchases by the Federal Reserve, continue to support asset prices and lower yields across a wide range of market sectors, including ours.
52
Trends
We expect the results of our operations to be affected by various factors, many of which are beyond our control. Our results of operations will primarily depend on, among other things, the level of our net interest income, the market value of our assets, and the supply of and demand for such assets. Our net interest income, which reflects the amortization of purchase premiums and accretion of discounts, varies primarily as a result of changes in interest rates, borrowing costs, and prepayment speeds, which is a measurement of how quickly borrowers pay down the unpaid principal balance on their mortgage loans.
Prepayment Speeds
. Prepayment speeds, as reflected by the Constant Prepayment Rate, or CPR, vary according to interest rates, the type of investment, conditions in financial markets, and other factors, none of which can be predicted with any certainty. In general, when interest rates rise, it is relatively less attractive for borrowers to refinance their mortgage loans, and as a result, prepayment speeds tend to decrease. When interest rates fall, prepayment speeds tend to increase. For mortgage loan and RMBS investments purchased at a premium, as prepayment speeds increase, the amount of income we earn decreases because the purchase premium we paid for the bonds amortizes faster than expected. Conversely, decreases in prepayment speeds result in increased income and can extend the period over which we amortize the purchase premium. For mortgage loan and RMBS investments purchased at a discount, as prepayment speeds increase, the amount of income we earn increases because of the acceleration of the accretion of the discount into interest income. Conversely, decreases in prepayment speeds result in decreased income and can extend the period over which we accrete the purchase discount into interest income.
Rising Interest Rate Environment
. As indicated above, as interest rates rise, prepayment speeds generally decrease. Rising interest rates, however, increase our financing costs which may result in a net negative impact on our net interest income. In addition, if we acquire Agency and non-Agency RMBS collateralized by monthly reset adjustable-rate mortgages, or ARMs, and three- and five-year hybrid ARMs, such interest rate increases could result in decreases in our net investment income, as there could be a timing mismatch between the interest rate reset dates on our RMBS portfolio and the financing costs of these investments. We expect, that our fixed-rate assets would decline in value in a rising interest rate environment and that our net interest spreads on fixed rate assets could decline in a rising interest rate environment to the extent such assets are financed with floating rate debt.
Falling Interest Rate Environment
. As interest rates fall, prepayment speeds generally increase. Falling interest rates, however, decrease our financing costs which may result in a net positive impact on our net interest income. In addition, if we acquire Agency and non-Agency RMBS collateralized by monthly reset adjustable-rate mortgages, or ARMs, and three- and five-year hybrid ARMs, such interest rate decreases could result in increases in our net investment income, as there could be a timing mismatch between the interest rate reset dates on our RMBS portfolio and the financing costs of these investments. We expect, however, that our fixed-rate assets would increase in value in a falling interest rate environment and that our net interest spreads on fixed rate assets could increase in a falling interest rate environment to the extent such assets are financed with floating rate debt.
Credit Risk.
One of our strategic focuses is acquiring assets which we believe to be of high credit quality. We believe this strategy will generally keep our credit losses and financing costs low. We also focus on acquiring distressed assets non-Agency RMBS have been downgraded because of defaults in the mortgages collateralizing such RMBS. When we acquire such RMBS we attempt to purchase it at a price such that its loss-adjusted return profile is in line with our targeted yields. We retain the risk of potential credit losses on all of the residential mortgage loans we hold in our portfolio as well as all of the non-Agency RMBS. We attempt to mitigate credit risk in the asset selection process. Prior to the purchase of investments, we conduct a credit-risk based analysis of the collateral securing our investment that includes examining borrower characteristics, geographic concentrations, current and projected delinquencies, current and projected severities, and actual and expected prepayment speeds among other characteristics to formulate expected losses.
Size of Investment Portfolio
. The size of our investment portfolio, as measured by the aggregate unpaid principal balance of our mortgage loans and aggregate principal balance of our mortgage related securities and the other assets we own is also a key revenue driver. Generally, as the size of our investment portfolio grows, the amount of interest income we receive increases. The larger investment portfolio, however, drives increased expenses as we incur additional interest expense to finance the purchase of our assets.
Current Environment
. We expect to use a number of sources to finance our investments, including repurchase agreements, warehouse facilities, securitizations, asset-backed commercial paper and term CDOs. Current market conditions have affected the cost and availability of financing from each of these sources and their individual providers to different degrees; some sources generally are unavailable, some are available but at a high cost, and some are largely unaffected.
53
In the current market, it may be difficult or impossible to obtain third party pricing on the investments we purchase. In addition, validating third party pricing for our investments may be more subjective as fewer participants may be willing to provide this service to us. Moreover, the current market is more illiquid than in recent history for some of the investments we purchase. Illiquid investments typically experience greater price volatility as a ready market does not exist. As volatility increases or liquidity decreases we may have greater difficulty financing our investments which may negatively impact our earnings and the execution of our investment strategy.
Critical Accounting Estimates
Our consolidated financial statements are prepared in accordance with accounting principles generally accepted in the United States of America, or GAAP. These accounting principles may require us to make some complex and subjective decisions and assessments. Our most critical accounting policies will involve decisions and assessments that could affect our reported assets and liabilities, as well as our reported revenues and expenses. We believe that all of the decisions and assessments upon which our consolidated financial statements are based will be reasonable at the time made and based upon information available to us at that time. The following are our most critical accounting policies:
Valuation of Investments
Accounting Standards Codification, or ASC 820,
Fair Value Measurements and Disclosures
, establishes a framework for measuring fair value, and establishes a three-level valuation hierarchy for disclosure of fair value measurement and enhances disclosure requirements for fair value measurements. The valuation hierarchy is based upon the transparency of inputs to the valuation of an asset or liability as of the measurement date. The three levels are defined as follows:
Level 1 – inputs to the valuation methodology are quoted prices (unadjusted) for identical assets and liabilities in active markets.
Level 2 – inputs to the valuation methodology include quoted prices for similar assets and liabilities in active markets, and inputs that are observable for the asset or liability, either directly or indirectly, for substantially the full term of the financial instrument.
Level 3 – inputs to the valuation methodology are unobservable and significant to overall fair value.
Non-Agency and Agency RMBS are valued using a pricing model. The RMBS pricing model incorporates such factors as coupons, prepayment speeds, spread to the Treasury and swap curves, convexity, duration, periodic and life caps, and credit enhancement. Management reviews the fair values determined by the pricing model and compares its results to dealer quotes received on each investment to validate the reasonableness of the valuations indicated by the pricing models. The dealer quotes incorporate common market pricing methods, including a spread measurement to the Treasury curve or interest rate swap curve as well as underlying characteristics of the particular security including coupon, periodic and life caps, rate reset period, issuer, additional credit support and expected life of the security.
Although we utilize a pricing model to compute the fair value of the securities in our portfolio, we validate our fair values by seeking indications of fair value from third-party dealers and/or pricing services. The variability of fair value among dealers and pricing services can be wide at this time as full liquidity for the non-Agency market has yet to return. In addition, there are fewer participants in the RMBS sector available to fair value investments. Our internal valuations of the securities on which we received dealer marks were 0.02% lower at December 31, 2010 and 1.05% lower at December 31, 2009 than the aggregated dealer marks.
Any changes to the valuation methodology are reviewed by management to ensure the changes are appropriate. As markets and products develop and the pricing for certain products becomes more transparent, we continue to refine our valuation methodologies. The methods used by us may produce a fair value calculation that may not be indicative of net realizable value or reflective of future fair values. Furthermore, while we believe our valuation methods are appropriate and consistent with other market participants, the use of different methodologies, or assumptions, to determine the fair value of certain financial instruments could result in a different estimate of fair value at the reporting date. We use inputs that are current as of the measurement date, which may include periods of market dislocation, during which price transparency may be reduced. This condition could cause our financial instruments to be reclassified from Level 2 to Level 3.
54
Other-than-Temporary Impairments
We evaluate each investment in our RMBS portfolio for other-than-temporary impairments, or OTTI, quarterly or more often if market conditions warrant. Each investment is analyzed and we determine if we (1) have the intent to sell the security, (2) are more likely than not to be required to sell the security before recovery, or (3) we do not expect to recover the entire amortized cost basis of the security. Further, each security is analyzed for credit loss by comparing the difference between the present value of cash flows expected to be collected and the amortized cost basis. The credit loss, if any, is then recognized in the consolidated statements of operations, while the balance of impairment related to other factors is recognized in other comprehensive income (loss).
Interest Income
Interest income on RMBS and loans held for investment is recognized over the life of the investment using the effective interest method. The effective interest method requires significant management judgment in calculating the yields utilized to accrete discounts and amortize premiums. The assumptions used by us to calculate the expected yield include current and future prepayment assumptions, expected principal write-downs, loss severities, changes in interest rates, and other factors that affect the expected yield. Income recognition is suspended for loans when, in the opinion of management, a full recovery of income and principal becomes doubtful. Income recognition is resumed when the loan becomes contractually current and performance is demonstrated to be resumed.
Accounting For Derivative Financial Instruments and Hedging Activities
Our policies permit us to enter into derivative contracts, including interest rate swaps and interest rate caps, as a means of mitigating our interest rate risk. We use interest rate derivative instruments to mitigate interest rate risk rather than to enhance returns. We account for these instruments as free-standing derivatives. Accordingly, they are carried at fair value with realized and unrealized gains and losses recognized in earnings.
We recognize all derivatives as either assets or liabilities in the statement of financial condition and measure those instruments at fair value. Additionally, the fair value adjustments will affect net income as we did not elect to use hedge accounting.
Derivatives will be used for economic hedging purposes rather than speculation. We will rely on quotations from third parties to determine fair values. We compare the dealer quotes received by the Company to the fair values generated by our own internal pricing model which incorporates such factors as term to maturity, the Treasury curve, LIBOR rates, and payment rates on the fixed portion of the interest rate swaps. If our hedging activities do not achieve our desired results, our reported earnings may be adversely affected.
Allowance for Probable Credit Losses
We have established an allowance for loan losses at a level that management believes is adequate based on an evaluation of known and inherent probable losses related to our loan portfolio. The estimate is based on a variety of factors including current economic conditions, industry loss experience, the loan originator’s loss experience, credit quality trends, loan portfolio composition, delinquency trends, national and local economic trends, national unemployment data, changes in housing appreciation or depreciation and whether specific geographic areas where we have significant loan concentrations are experiencing adverse economic conditions and events such as natural disasters that may affect the local economy or property values. Upon purchase of the pools of loans, we obtained written representations and warranties from the sellers that we could be reimbursed for the value of the loan if the loan fails to meet the agreed upon origination standards. While we have little history of our own to establish loan trends, delinquency trends of the originators and the current market conditions aid in determining the allowance for loan losses. We also performed due diligence procedures on a sample of loans that met our criteria during the purchase process. We have created an unallocated provision for probable loan losses estimated as a percentage of the remaining principal on the loans. Management’s estimate is based on historical experience of similarly underwritten pools.
When we determine it is probable that specific contractually due amounts are uncollectible, the amount is considered impaired. Where impairment is indicated, a valuation write-off is measured based upon the excess of the recorded investment over the net fair value of the collateral, reduced by selling costs. Any deficiency between the carrying amount of an asset and the net sales price of repossessed collateral is charged to the allowance for loan losses.
55
Income Taxes
We have elected and intend to qualify to be taxed as a REIT. Therefore we will generally not be subject to corporate federal or state income tax to the extent that we make qualifying distributions to our stockholders, and provided we satisfy on a continuing basis, through actual investment and operating results, the REIT requirements including certain asset, income, distribution and stock ownership tests.
If we fail to qualify as a REIT, and do not qualify for certain statutory relief provisions, we will be subject to federal, state and local income taxes and may be precluded from qualifying as a REIT for the subsequent four taxable years following the year in which we lost our REIT qualification. Accordingly, our failure to qualify as a REIT could have a material adverse impact on our results of operations and amounts available for distribution to our stockholders.
The dividends paid deduction of a REIT for qualifying dividends to its stockholders is computed using our taxable income as opposed to net income reported on the consolidated financial statements. Taxable income, generally, will differ from net income reported on the consolidated financial statements because the determination of taxable income is based on tax provisions and not financial accounting principles.
Financial Condition
Estimated Economic Book Value
This Management Discussion and Analysis section contains analysis and discussion of financial information that utilizes or presents ratios based on GAAP book value. The table and discussion below present our estimated economic book value. We calculate and disclose this non-GAAP measurement because we believe it represents our estimated economic book value at the measurement date.
On January 1, 2010 GAAP required us to consolidate certain re-securitization transactions we consummated during 2009 and 2010. In these re-securitizations, we transferred assets to the re-securitization trusts, which issued tranches of senior and subordinate notes or certificates. We sold the senior tranches and therefore have no continuing involvement in these trusts other than being a holder of notes or certificates issued by the trusts, with the same rights of other holders of the notes or certificates. The notes and certificates we own that were issued by the trusts are largely subordinated interests in those trusts. The trusts have no recourse to our assets other than pursuant to a breach by us of the transaction documents related to the transfer of the assets by us to the trusts.
GAAP requires us to fair value and present the assets of these trusts on our consolidated statements of financial condition as if we still owned the underlying securities we transferred to the trusts. We present the assets related to the consolidated trusts in our consolidated statements of financial position as a component of non-Agency mortgage-backed securities identified as senior, non-retained, and the liabilities as securitized debt, non-retained. We have fair valued the underlying securities we transferred to the trusts for the calculation of GAAP book value in accordance with our pricing policy, as described more fully in our critical accounting estimates, and recorded the corresponding liability for the notes or certificates sold to third parties. All fair value adjustments are recorded in Other Comprehensive Income.
As, we are unable to sell the underlying securities that we transferred into the trusts because we no longer own those securities, we also present our estimated economic book value. We believe this measure represents the estimated value of the securities issued by these trusts that we own. In contrast to GAAP book value, our estimated economic book value considers only the assets we own or are able to dispose of, pledge, or otherwise monetize. To determine our estimated economic book value, we fair value the notes or certificates issued by the re-securitization trusts that we actually own in accordance with our pricing policy. Accordingly, our estimated economic book value does not include assets or liabilities for which we have no continuing involvement, specifically the notes or certificates of the re-securitization trusts that were sold to third parties. We believe this estimate represents the value of the assets that we hold in our portfolio should we decide to sell, pledge, or otherwise dispose of assets as of the measurement date.
At December 31, 2010 the difference between GAAP book value and estimated economic book value was determined to be $374.5 million. This difference is primarily driven by the nature of the assets we have retained in these re-securitization transactions as compared to the nature of underlying securities in these transactions. In these re-securitization transactions, we retained the subordinated, typically non-rated, first loss notes or certificates issued by the re-securitization trusts. These securities are complex, typically locked out as to principal repayment, relatively illiquid, and do not necessarily appreciate or depreciate in tandem with the broader non-Agency RMBS market or with the underlying securities owned by the trusts. The table below presents the adjustments to GAAP book value that we believe necessary to adequately reflect our calculation of estimated economic book value.
56
|
GAAP Book Value
|
Adjustments
|
Estimated
Economic Book Value
|
||||||||||
|
(dollars in thousands)
|
||||||||||||
|
Assets:
|
||||||||||||
|
Non-Agency Mortgage-Backed Securities, at fair value
|
||||||||||||
|
Senior ($484.1 million and $0 resulting from consolidation of VIEs)
|
$ | 987,685 | $ | - | $ | 987,685 | ||||||
|
Subordinated ($1.5 billion and $0 resulting from consolidation of VIEs)
|
2,210,858 | - | 2,210,858 | |||||||||
|
Senior, non-retained
|
2,330,568 | (2,330,568 | ) | - | ||||||||
|
Agency Mortgage-Backed Securities, at fair value
|
2,133,584 | - | 2,133,584 | |||||||||
|
Securitized loans held for investment, net of allowance for loan losses of $6.6 million and $4.6 million, respectively
|
353,532 | - | 353,532 | |||||||||
|
Other current assets
|
57,473 | - | 57,473 | |||||||||
|
Total assets
|
$ | 8,073,700 | $ | (2,330,568 | ) | $ | 5,743,132 | |||||
|
Repurchase agreements ($2.0 billion and $1.8 billion of RMBS pledged as collateral, respectively)
|
1,808,797 | - | 1,808,797 | |||||||||
|
Securitized debt ($302.9 million and $388.3 million of securitized loans pledged as collateral, respectively)
|
289,236 | - | 289,236 | |||||||||
|
Securitized debt, non-retained ($2.0 billion and $0 of non-retained RMBS pledged as collateral, respectively)
|
1,956,079 | (1,956,079 | ) | - | ||||||||
|
Other liabilities
|
336,582 | - | 336,582 | |||||||||
|
Total liabilities
|
4,390,694 | (1,956,079 | ) | 2,434,615 | ||||||||
|
Total stockholders' equity
|
3,683,006 | (374,489 | ) | 3,308,517 | ||||||||
|
Total liabilities and stockholders' equity
|
$ | 8,073,700 | $ | (2,330,568 | ) | $ | 5,743,132 | |||||
|
Book Value Per Share
|
$ | 3.59 | $ | (0.36 | ) | $ | 3.23 | |||||
Our estimate of economic book value has important limitations. Our estimate of fair value is as of a point in time and subject to significant judgment. Other market participants may derive a different fair value for each asset than we calculate. Should we sell the assets in our portfolio, we may realize materially different proceeds from the sale than we have estimated as of the reporting date.
Although we believe that the calculation of estimated economic book value described above helps our management and investors understand the fair value of the assets we own and the liabilities for which we are legally obligated, it is of limited usefulness as an analytical tool. It does not take account of the fair value of assets that we do not own, but regarding which we will be the principal beneficiary of increases in value above, and will bear the principal burden of reductions in value to below, what currently is anticipated. Therefore, the estimated economic book value should not be viewed in isolation and is not a substitute for book value computed in accordance with GAAP.
Portfolio Review
At December 31, 2010, our portfolio consisted of $5.5 billion of non-Agency RMBS, $2.1 billion of Agency RMBS and $353.5 million of securitized mortgage loans. At December 31, 2009, our portfolio consisted of $2.4 billion of non-Agency RMBS, $1.7 billion of Agency RMBS and $470.5 million of securitized mortgage loans.
57
The following table summarizes certain characteristics of our portfolio at December 31, 2010 and 2009:
|
December 31, 2010
|
December 31, 2009
|
|||||||
|
Interest earning assets at period-end *
|
$ | 8,016,227 | $ | 4,559,427 | ||||
|
Interest bearing liabilities at period-end
|
$ | 4,054,112 | $ | 2,365,752 | ||||
|
Leverage at period-end
|
1.1:1
|
1.1:1
|
||||||
|
Leverage at period-end (recourse)
|
0.5:1
|
0.9:1
|
||||||
|
Portfolio Composition, at principal value
|
||||||||
|
Non-Agency RMBS
|
83.4 | % | 64.6 | % | ||||
|
Senior
|
4.0 | % | 37.5 | % | ||||
|
Senior, interest only
|
35.7 | % | 0.0 | % | ||||
|
Subordinated
|
29.8 | % | 22.0 | % | ||||
|
Subordinated, interest only
|
1.8 | % | 5.1 | % | ||||
|
Senior, non-retained
|
12.1 | % | 0.0 | % | ||||
|
Agency RMBS
|
12.6 | % | 23.3 | % | ||||
|
Securitized loans
|
4.0 | % | 12.1 | % | ||||
|
Fixed-rate percentage of portfolio
|
51.7 | % | 52.7 | % | ||||
|
Adjustable-rate percentage of portfolio
|
48.3 | % | 47.3 | % | ||||
|
Annualized yield on average earning assets for the year ended
|
8.91 | % | 6.37 | % | ||||
|
Annualized cost of funds on average borrowed funds for the year ended
|
4.01 | % | 1.51 | % | ||||
|
* Excludes cash and cash equivalents
|
||||||||
The following table presents details of each asset class in our portfolio at December 31, 2010. The principal or notional value represents the interest income earning balance of each class. The weighted average amortized cost, fair value, coupon, yield, and CPR at period-end are weighted by each investment’s respective principal/notional value in the asset class. The figure presenting the annualized yield over the current quarter is the annualized interest income earned on the asset class during the quarter, divided by the average of the beginning and ending amortized cost of the asset class.
| December 31, 2010 | ||||||||||||||||||||||||||||||
|
Principal or Notional Value at Period-End
|
Weighted Average Amortized
Cost Basis at Period-End
|
Weighted
Average
Fair Value
at Period-End
|
Weighted Average Coupon at Period-End
|
Weighted Average
Yield (Loss Adjusted) at Period-End
|
Annualized Yield Over Current Quarter
|
Weighted Average 3 Month CPR at Period-End
|
||||||||||||||||||||||||
|
Non-Agency Mortgage-Backed Securities
|
||||||||||||||||||||||||||||||
|
Senior
|
664,251 | $ | 99.64 | $ | 101.56 | 4.48 | % | 4.65 | % | 5.73 | % | 16 | % | |||||||||||||||||
|
Senior, interest only
|
5,929,634 | $ | 6.98 | $ | 5.28 | 1.74 | % | 14.71 | % | 29.03 | % | 16 | % | |||||||||||||||||
|
Subordinated
|
4,962,829 | $ | 44.35 | $ | 43.88 | 4.11 | % | 16.78 | % | 25.63 | % | 15 | % | |||||||||||||||||
|
Subordinated, interest only
|
304,993 | $ | 9.93 | $ | 10.81 | 3.03 | % | 27.60 | % | 24.62 | % | 16 | % | |||||||||||||||||
|
Senior, non-retained
|
2,008,167 | $ | 98.51 | $ | 116.05 | (1 | ) | 5.17 | % | 4.36 | % | 6.85 | % | 15 | % | |||||||||||||||
|
Agency Mortgage-Backed Securities
|
2,092,465 | $ | 103.30 | $ | 104.80 | 5.05 | % | 4.51 | % | 3.34 | % | 24 | % | |||||||||||||||||
|
Securitized loans
|
||||||||||||||||||||||||||||||
|
Senior
|
296,458 | $ | 101.19 | $ | 101.19 | 5.50 | % | 5.54 | % | 4.82 | % | 28 | % | |||||||||||||||||
|
Senior, interest only
|
313,720 | $ | 0.01 | $ | 0.01 | 0.41 | % | 100.00 | % | 3795.92 | % | 29 | % | |||||||||||||||||
|
Subordinated
|
59,540 | $ | 100.93 | $ | 100.93 | 5.36 | % | 2.85 | % | 5.94 | % | 30 | % | |||||||||||||||||
|
(1) See discussion of Financial Condition on page 56 for a review of GAAP book value.
|
||||||||||||||||||||||||||||||
Our portfolio is primarily comprised of non-Agency RMBS which is subject to risk of loss with regard to principal repayment. The following table summarizes certain characteristics of our non-Agency portfolio at December 31, 2010 and 2009:
58
|
December 31, 2010
|
December 31, 2009
|
|||||||||
|
Number of securities in portfolio
|
581 | 209 | ||||||||
|
Weighted average maturity (years)
|
27.4 | 28.5 | ||||||||
|
Weighted average amortized loan to value
|
72.5 | % | 73.8 | % | ||||||
|
Weighted average FICO
|
717.3 | 715.7 | ||||||||
|
Weighted average loan balance (in thousands)
|
$ | 447.6 | $ | 415.9 | ||||||
|
Weighted average percentage owner occupied
|
83.3 | % | 82.8 | % | ||||||
|
Weighted average percentage single family residence
|
63.1 | % | 59.9 | % | ||||||
|
Weighted average current credit enhancement
|
16.0 | % | 12.2 | % | ||||||
|
Weighted average geographic concentration
|
CA
|
57.8 | % |
CA
|
44.8 | % | ||||
|
FL
|
13.3 | % |
FL
|
17.3 | % | |||||
|
NY
|
7.3 | % |
NY
|
7.5 | % | |||||
|
NJ
|
3.9 | % |
MD
|
4.9 | % | |||||
|
VA
|
3.3 | % |
NJ
|
4.4 | % | |||||
The table below summarizes the credit ratings of our RMBS investments at December 31, 2010 and 2009. The Company’s investment guidelines place no restrictions on the credit ratings of the assets we may acquire or retain. In addition, the table below includes AAA rated non-Agency seniors consolidated pursuant to the adoption of ASC 810, but for which we have no continuing involvement.
|
December 31, 2010
|
December 31, 2009
|
||||||
|
AAA
|
41.25 | % | 39.41 | % | |||
|
AA
|
7.91 | % | 0.75 | % | |||
| A | 1.92 | % | 0.55 | % | |||
|
BBB
|
0.80 | % | 1.07 | % | |||
|
BB
|
0.01 | % | 1.77 | % | |||
| B | 0.01 | % | 2.18 | % | |||
|
Below B or not rated
|
48.10 | % | 54.27 | % | |||
|
Total
|
100.00 | % | 100.00 | % | |||
Our management team evaluates each investment based on the characteristics of the underlying collateral rather than relying on the ratings assigned to the asset by rating agencies.
Results of Operations for the Years Ended December 31, 2010, 2009 and 2008
Net Income (Loss) Summary
Our net income for the year ended December 31, 2010 was $532.9 million, or $0.65 per average share. Our net income for the year ended December 31, 2009 was $324.0 million, or $0.64 per average share. Our net loss for the year ended December 31, 2008 was $119.8 million, or $1.90 per average share.
Net income increased by $208.9 million for the year ended December 31, 2010, when compared to the year ended December 31, 2009. We attribute the increase in net income to an increase in interest income as our portfolio of interest earning assets increased from $4.6 billion at December 31, 2009 to $8.0 billion at December 31, 2010.
Net income per share increased by $2.54 per share and total net income increased by $443.8 million for the year ended December 31, 2009, when compared to the year ended December 31, 2008. We attribute the increase in net income in part to realized gains on sales of investments equal to $103.6 million for the year ended December 31, 2009 as compared to realized losses on sales of investments equal to $144.3 million for the year ended December 31, 2008. Net income for the year ended December 31, 2009 also increased in part due to the 355 basis point increase in interest rate spread on the portfolio of assets for the year ended December 31, 2009, when compared to the year ended December 31, 2008.
59
The table below presents the net income (loss) summary for the years ended December 31, 2010, 2009 and 2008.
Net Income (Loss) Summary
(dollars in thousands, except for share and per share data)
|
CHIMERA INVESTMENT CORPORATION
|
||||||||||||
|
CONSOLIDATED STATEMENTS OF OPERATIONS AND COMPREHENSIVE INCOME (LOSS)
|
||||||||||||
|
(dollars in thousands, except share and per share data)
|
||||||||||||
|
For the Year Ended
|
||||||||||||
|
December 31, 2010
|
December 31, 2009
|
December 31, 2008
|
||||||||||
|
Net Interest Income:
|
||||||||||||
|
Interest income
|
$ | 562,878 | $ | 298,539 | $ | 105,259 | ||||||
|
Interest expense
|
37,175 | 35,083 | 60,544 | |||||||||
|
Interest income, non-retained
|
192,560 | - | - | |||||||||
|
Interest expense, non-retained
|
115,061 | - | - | |||||||||
|
Net interest income (expense)
|
603,202 | 263,456 | 44,715 | |||||||||
|
Other-than-temporary impairments:
|
||||||||||||
|
Total other-than-temporary impairment losses
|
(54,343 | ) | (16,264 | ) | - | |||||||
|
Non-credit portion of loss recognized in other comprehensive income (loss)
|
41,665 | 6,268 | - | |||||||||
|
Net other-than-temporary credit impairment losses
|
(12,678 | ) | (9,996 | ) | - | |||||||
|
Other gains (losses):
|
||||||||||||
|
Unrealized gains (losses) on interest rate swaps
|
(9,989 | ) | - | 4,156 | ||||||||
|
Realized gains (losses) on sales of investments, net
|
10,085 | 103,646 | (144,304 | ) | ||||||||
|
Realized losses on principal write-downs of non-Agency RMBS
|
(7,385 | ) | (255 | ) | - | |||||||
|
Realized gains (losses) on terminations of interest rate swaps
|
- | - | (10,337 | ) | ||||||||
|
Total other gains (losses)
|
(7,289 | ) | 103,391 | (150,485 | ) | |||||||
|
Net investment income (loss)
|
583,235 | 356,851 | (105,770 | ) | ||||||||
|
Other expenses:
|
||||||||||||
|
Management fee
|
40,924 | 25,704 | 8,428 | |||||||||
|
Provision for loan losses
|
2,689 | 3,102 | 1,540 | |||||||||
|
General and administrative expenses
|
6,015 | 4,061 | 4,059 | |||||||||
|
Total other expenses
|
49,628 | 32,867 | 14,027 | |||||||||
|
Income (loss) before income taxes
|
533,607 | 323,984 | (119,797 | ) | ||||||||
|
Income taxes
|
756 | 1 | 12 | |||||||||
|
Net income (loss)
|
$ | 532,851 | $ | 323,983 | $ | (119,809 | ) | |||||
|
Net income (loss) per share-basic and diluted
|
$ | 0.65 | $ | 0.64 | $ | (1.90 | ) | |||||
|
Weighted average number of shares outstanding-basic and diluted
|
822,617,319 | 507,042,421 | 63,155,878 | |||||||||
|
Comprehensive income (loss):
|
||||||||||||
|
Net income (loss)
|
$ | 532,851 | $ | 323,983 | $ | (119,809 | ) | |||||
|
Other comprehensive income (loss):
|
||||||||||||
|
Unrealized gains (losses) on available-for-sale securities, net
|
364,427 | 260,309 | (421,125 | ) | ||||||||
|
Reclassification adjustment for net losses included in net income (loss) for other-than-temporary credit impairment losses
|
12,678 | 9,996 | - | |||||||||
|
Reclassification adjustment for realized losses (gains) included in net income (loss)
|
(2,700 | ) | (103,391 | ) | 144,304 | |||||||
|
Other comprehensive income (loss)
|
374,405 | 166,914 | (276,821 | ) | ||||||||
|
Comprehensive income (loss)
|
$ | 907,256 | $ | 490,897 | $ | (396,630 | ) | |||||
|
See notes to consolidated financial statements.
|
||||||||||||
Net Interest Income and Average Earning Asset Yield
We had average earning assets of $8.5 billion, $4.3 billion and $1.7 billion for the years ended December 31, 2010, 2009 and 2008, respectively. Our primary source of income is interest income earned on our assets. Our interest income was $755.4 million, $298.5 million and $105.3 million for the years ended December 31, 2010, 2009 and 2008, respectively. The yield on our portfolio was 8.91%, 6.90% and 5.96% for the years ended December 31, 2010, 2009 and 2008, respectively. For the year ended December 31, 2010 as compared to the year ended December 31, 2009, interest income increased by $456.9 million due to the consolidation of securitization entities upon adoption of ASC 810 on January 1, 2010, an increase in average interest earning assets of $4.2 billion and an increase by 201 basis points in the yield on average earning assets for the year ended December 31, 2010 when compared to the year ended December 31, 2009. Interest income for the year ended December 31, 2009 as compared to the year ended December 31, 2008, increased by $193.3 million due to increases in interest earning assets of $2.6 billion and an increase in the yield on average earning assets of 94 basis points.
60
Interest Expense and the Cost of Funds
Our largest expense is the cost of borrowed funds. We had average borrowed funds of $3.8 billion, $1.7 billion and $1.3 billion and total interest expense of $152.2 million, $35.1 million and $60.5 million for the years ended December 31, 2010, 2009 and 2008, respectively. Our average cost of funds was 4.01%, 2.03% and 4.64% for the years ended December 31, 2010, 2009 and 2008, respectively. The average cost of funds rate increased by 198 basis points and the average borrowed funds increased by $2.1 billion during the year ended December 31, 2010, when compared to the year ended December 31, 2009. We attribute the increase in our interest expense to the increase in the average cost of funds resulting from the consolidation of securitization entities upon adoption of ASC 810 on January 1, 2010.
The table below shows our average borrowed funds and average cost of funds as compared to average one-month and average six-month LIBOR for the years ended December 31, 2010, 2009 and 2008 and the four quarters in 2010.
| Average Cost of Funds | ||||||||||||||||||||||||||||||||
|
Average Borrowed Funds
|
Interest Expense
|
Average Cost of Funds
|
Average One-Month LIBOR
|
Average Six-Month LIBOR
|
Average One-Month LIBOR Relative to Average Six-Month LIBOR
|
Average Cost of Funds Relative to Average One-Month LIBOR
|
Average Cost of Funds Relative to Average Six-Month LIBOR
|
|||||||||||||||||||||||||
|
(Ratios have been annualized, dollars in thousands)
|
||||||||||||||||||||||||||||||||
|
For the year ended December 31, 2010
|
$ | 3,793,049 | $ | 152,236 | 4.01 | % | 0.27 | % | 0.52 | % | (0.25 | %) | 3.74 | % | 3.49 | % | ||||||||||||||||
|
For the year ended December 31, 2009
|
$ | 1,724,698 | $ | 35,083 | 2.03 | % | 0.33 | % | 1.12 | % | (0.79 | %) | 1.70 | % | 0.91 | % | ||||||||||||||||
|
For the year ended December 31, 2008
|
$ | 1,304,873 | $ | 60,544 | 4.64 | % | 2.68 | % | 3.06 | % | (0.38 | %) | 1.96 | % | 1.58 | % | ||||||||||||||||
|
For the quarter ended December 31, 2010
|
$ | 3,871,908 | $ | 39,649 | 4.10 | % | 0.26 | % | 0.45 | % | (0.19 | %) | 3.84 | % | 3.65 | % | ||||||||||||||||
|
For the quarter ended September 30, 2010
|
$ | 3,733,893 | $ | 42,764 | 4.58 | % | 0.29 | % | 0.59 | % | (0.30 | %) | 4.29 | % | 3.99 | % | ||||||||||||||||
|
For the quarter ended June 30, 2010
|
$ | 3,906,061 | $ | 28,619 | 2.93 | % | 0.32 | % | 0.63 | % | (0.31 | %) | 2.61 | % | 2.30 | % | ||||||||||||||||
|
For the quarter ended March 31, 2010
|
$ | 3,660,334 | $ | 41,204 | 4.50 | % | 0.23 | % | 0.40 | % | (0.17 | %) | 4.27 | % | 4.10 | % | ||||||||||||||||
Net Interest Income
Our net interest income, which equals interest income less interest expense, totaled $603.2 million, $263.5 million and $44.7 million for the years ended December 31, 2010, 2009 and 2008, respectively. Our net interest spread, which equals the yield on our average assets for the period less the average cost of funds for the period, was 4.90%, 4.87% and 1.32% for the years ended December 31, 2010, 2009 and 2008, respectively. Our net interest income increased by $339.7 million for the year ended December 31, 2010, when compared to the year ended December 31, 2009 due to the increase in interest earning assets resulting from the consolidation of securitization entities upon adoption of ASC 810 on January 1, 2010. Our net interest income increased by $218.8 million for the year ended December 31, 2009, when compared to the year ended December 31, 2008 due to the 355 basis point increase in our net interest spread.
The table below shows our average assets held, total interest income, yield on average interest earning assets, average balance of repurchase agreements, interest expense, average cost of funds, net interest income, and net interest rate spread for the years ended December 31, 2010, 2009 and 2008 and the four quarters in 2010.
61
|
Net Interest Income
|
||||||||||||||||||||||||||||||||
|
Average Earning Assets Held *
|
Interest Earned on Assets *
|
Yield on Average Interest Earning Assets
|
Average Debt Balance
|
Interest Expense
|
Average Cost of Funds
|
Net Interest Income
|
Net Interest Rate Spread
|
|||||||||||||||||||||||||
|
(Ratios have been annualized, dollars in thousands)
|
||||||||||||||||||||||||||||||||
|
For the year ended December 31, 2010
|
$ | 8,479,109 | $ | 755,398 | 8.91 | % | $ | 3,793,049 | $ | 152,236 | 4.01 | % | $ | 603,202 | 4.90 | % | ||||||||||||||||
|
For the year ended December 31, 2009
|
$ | 4,328,892 | $ | 298,539 | 6.90 | % | $ | 1,724,698 | $ | 35,083 | 2.03 | % | $ | 263,456 | 4.87 | % | ||||||||||||||||
|
For the year ended December 31, 2008
|
$ | 1,711,705 | $ | 102,093 | 5.96 | % | $ | 1,304,873 | $ | 60,544 | 4.64 | % | $ | 44,715 | 1.32 | % | ||||||||||||||||
|
For the quarter ended December 31, 2010
|
$ | 9,311,588 | $ | 193,744 | 8.32 | % | $ | 3,871,908 | $ | 39,649 | 4.10 | % | $ | 154,098 | 4.22 | % | ||||||||||||||||
|
For the quarter ended September 30, 2010
|
$ | 8,801,534 | $ | 198,461 | 9.02 | % | $ | 3,733,893 | $ | 42,764 | 4.58 | % | $ | 155,697 | 4.44 | % | ||||||||||||||||
|
For the quarter ended June 30, 2010
|
$ | 8,640,373 | $ | 183,349 | 8.49 | % | $ | 3,906,061 | $ | 28,619 | 2.93 | % | $ | 154,730 | 5.56 | % | ||||||||||||||||
|
For the quarter ended March 31, 2010
|
$ | 7,162,943 | $ | 179,845 | 10.04 | % | $ | 3,660,334 | $ | 41,204 | 4.50 | % | $ | 138,641 | 5.54 | % | ||||||||||||||||
|
* Excludes cash and cash equivalents
|
||||||||||||||||||||||||||||||||
Other-Than-Temporary Impairments
During the years ended December 31, 2010 and 2009, we recorded other-than-temporary impairments of $12.7 million and $10.0 million respectively. During the year ended December 31, 2008, no impairments were recorded. We recorded impairments on investments in an unrealized loss position where our estimate of future cash flows were below our amortized cost basis. Impaired securities were most typically first loss tranches of RMBS which would absorb expected principal write downs or interest only tranches whose market values are more sensitive to changes in prepayment speeds.
Gains and Losses on Sales of Assets
During the year ended December 31, 2010, we sold RMBS with a carrying value of $885.4 million for realized gains of $10.1 million. During the year ended December 31, 2009, we sold RMBS with a carrying value of $1.8 billion for realized gains of $103.6 million.
On January 29, 2010, we transferred $1.7 billion in principal value of our RMBS to the CSMC 2010-1R Trust in a re-securitization transaction. This transaction was recorded as a “secured borrowing” pursuant to ASC Topics 860 and 810. In this transaction, we financed through the transaction $271.6 million of AAA-rated fixed rate bonds to third party investors for net proceeds of $268.1 million. We retained $391.9 million of AAA-rated bonds, $1.0 billion in subordinated bonds and the owner trust certificate, and interest only bonds with a notional value of $1.6 billion. The subordinated bonds and the owner trust certificate provide credit support to the AAA-rated bonds. The bonds issued by the trust are collateralized by RMBS that were transferred to the CSMC 2010-1R Trust.
On April 30, 2010, we transferred $566.6 million in principal value of our RMBS to the CSMC 2010-11R Trust in a re-securitization transaction. This transaction was recorded as a “secured borrowing” pursuant to ASC Topics 860 and 810. In this transaction, we financed $138.8 million of AAA-rated fixed rate bonds with third party investors for net proceeds of $137.4 million. We retained $427.7 million in subordinated bonds and the owner trust certificate, and interest only bonds with a notional value of $566.6 million. The subordinated bonds and the owner trust certificate provide credit support to the AAA-rated bonds. The bonds issued by the trust are collateralized by RMBS that were transferred to the CSMC 2010-11R Trust.
62
On May 27, 2010, we transferred $1.2 billion in principal value of our RMBS to the CSMC 2010-12R Trust in a re-securitization transaction. This transaction was recorded as a “secured borrowing” pursuant to ASC Topics 860 and 810. In this transaction, we financed $294.0 million of AAA-rated fixed rate bonds with third party investors for net proceeds of $294.3 million. We retained $136.3 million of AAA-rated bonds, $788.2 million in subordinated bonds and the owner trust certificate, and interest only bonds with a notional value of $1.2 billion. The subordinated bonds and the owner trust certificate provide credit support to the AAA-rated bonds. The bonds issued by the trust are collateralized by RMBS that were transferred to the CSMC 2010-12R Trust.
In addition, during the year ended December 31, 2010, we recorded non-recourse financing with third party investors related to re-securitizations executed in prior periods. We financed through these transactions $704.5 million of AAA-rated fixed rate bonds with third party investors for net proceeds of $703.0 million. In total, in 2010, we financed through our secured debt financing, $1.3 billion of AAA-rated fixed rate bonds for net proceeds of $1.3 billion.
Management Fee, Loan Loss Provision and General and Administrative Expenses
We paid FIDAC a management fee of $40.9 million, $25.7 million and $8.4 million for the years ended December 31, 2010, 2009 and 2008, respectively. We attribute the $15.2 million increase in management fees recorded during the year ended December 31, 2010, when compared to the year ended December 31, 2009, to the increase in stockholders equity resulting from our April, June and November 2010 secondary offerings. Our management fee increased by $17.3 million for the year ended December 31, 2009, when compared to the year ended December 31, 2008. The increase in management fees reflects the increase in stockholder’s equity from our April and May 2009 secondary offerings.
The loan loss provision was $2.7 million, $3.1 million and $1.5 million for the years ended December 31, 2010, 2009 and 2008, respectively. Our loan loss provision decreased by $413 thousand for the year ended December 31, 2010, when compared to the year ended December 31, 2009 due to the decline in the unpaid principal balance of the loan pool. The loan loss provision for the year ended December 31, 2009 increased by $1.6 million when compared to the year ended December 31, 2008. This increase in the provision is attributable to management’s estimate of the effect that increasing rates of delinquencies, foreclosure and bankruptcy activities specific to our securitized loans and the broader mortgage market as a whole will have on the realizable value our securitized loan portfolio.
General and administrative expenses, or G&A were $6.0 million, $4.1 million and $4.1 million for the years ended December 31, 2010, 2009 and, respectively. Our G&A expenses increased by $1.9 million for the year ended December 31, 2010, when compared to the year ended December 31, 2009, largely due to greater information and research costs as well as reimbursement to FIDAC for our pro rata portion of rent, telephone, utilities, office furniture, equipment, machinery and other office, internal and overhead expenses of FIDAC and its affiliates required for our operations. G&A remained relatively unchanged for the year ended December 31, 2009, when compared to the year ended December 31, 2008.
Total expenses as a percentage of average total assets were 0.78%, 0.99% and 0.85% for the years ended December 31, 2010, 2009 and 2008, respectively.
From our inception through 2009, FIDAC waived its right to require us to pay our pro rata portion of rent, telephone, utilities, office furniture, equipment, machinery and other office, internal and overhead expenses of FIDAC and its affiliates required for our operations. During the year ended December 31, 2010, we reimbursed FIDAC approximately $465,000 for such expenses.
The table below shows our total management fee, loan loss provision and G&A expenses as compared to average total assets and average equity for the years ended December 31, 2010, 2009 and 2008 and the four quarters in 2010.
63
|
Management Fees, Loan Loss Provision and G&A Expenses and Operating Expense Ratios
|
||||||||||||
|
Total Management Fee, Loan Loss Provision and G&A Expenses
|
Total Management Fee, Loan Loss Provision and G&A Expenses/Total Assets
|
Total Management Fee, Loan Loss Provision and G&A Expenses/Average Equity
|
||||||||||
|
(Ratios have been annualized, dollars in thousands)
|
||||||||||||
|
For the year ended December 31, 2010
|
$ | 49,628 | 0.78 | % | 1.71 | % | ||||||
|
For the year ended December 31, 2009
|
$ | 32,867 | 0.99 | % | 2.25 | % | ||||||
|
For the year ended December 31, 2008
|
$ | 14,027 | 0.85 | % | 3.50 | % | ||||||
|
For the quarter ended December 31, 2010
|
$ | 14,454 | 0.76 | % | 1.76 | % | ||||||
|
For the quarter ended September 30, 2010
|
$ | 13,598 | 0.77 | % | 1.87 | % | ||||||
|
For the quarter ended June 30, 2010
|
$ | 11,696 | 0.72 | % | 1.80 | % | ||||||
|
For the quarter ended March 31, 2010
|
$ | 9,880 | 0.73 | % | 1.79 | % | ||||||
Net Income (Loss) and Return on Average Equity
Our net income was $532.9 million and 324.0 million for the years ended December 31, 2010 and 2009, respectively. Our net loss was $119.8 million for the year ended December 31, 2008. We attribute the $208.9 million increase in net income for the year ended December 31, 2010, when compared to the year ended December 31, 2009 to the consolidation of securitization entities upon adoption of ASC 810 on January 1, 2010 as well as to the growth in income producing assets over the period. The table below shows our net interest income, loss on sale of assets and termination of interest rate swaps, unrealized gains (loss) on interest rate swaps, total expenses, income tax, each as a percentage of average equity, and the return on average equity for the years ended December 31, 2010, 2009 and 2008 and the four quarters in 2010.
|
Components of Return on Average Equity
|
||||||
|
Net Interest
Income/Average
Equity
|
Realized Gains
(Losses) on
Sales, Credit
Losses and
OTTI/Average
Equity
|
Unrealized Gains
(Losses) on
Interest Rate Swaps/Average
Equity
|
Total
Expenses/
Average
Equity
|
Income
Tax/Average
Equity
|
Return on
Average
Equity
|
|
|
(Ratios have been annualized)
|
||||||
|
For the year ended December 31, 2010
|
20.77%
|
(0.34%)
|
(0.34%)
|
(1.71%)
|
(0.03%)
|
18.35%
|
|
For the year ended December 31, 2009
|
18.03%
|
6.41%
|
0.00%
|
(2.25%)
|
0.00%
|
22.19%
|
|
For the year ended December 31, 2008
|
11.17%
|
(38.64%)
|
1.04%
|
(3.50%)
|
0.00%
|
(29.93%)
|
|
For the quarter ended December 31, 2010
|
18.72%
|
0.22%
|
1.80%
|
(1.76%)
|
0.00%
|
18.98%
|
|
For the quarter ended September 30, 2010
|
21.42%
|
(0.19%)
|
(1.87%)
|
(1.87%)
|
(0.10%)
|
17.39%
|
|
For the quarter ended June 30, 2010
|
23.78%
|
(1.11%)
|
(1.73%)
|
(1.80%)
|
0.00%
|
19.14%
|
|
For the quarter ended March 31, 2010
|
25.09%
|
(0.57%)
|
0.00%
|
(1.79%)
|
0.00%
|
22.73%
|
Liquidity and Capital Resources
Liquidity measures our ability to meet cash requirements, including ongoing commitments to repay our borrowings, fund and maintain RMBS, mortgage loans and other assets, pay dividends and other general business needs. Our principal sources of capital and funds for additional investments primarily include earnings from our investments, borrowings under securitizations and re-securitizations, repurchase agreements and other financing facilities, and proceeds from equity offerings. We expect these sources of financing will be sufficient to meet our short-term liquidity needs.
64
We expect to continue to borrow funds in the form of repurchase agreements and, subject to market conditions, other types of financing. The terms of the repurchase transaction borrowings under our master repurchase agreements generally conform to the terms in the standard master repurchase agreement as published by the Securities Industry and Financial Markets Association, or SIFMA, as to repayment, margin requirements and the segregation of all securities we have initially sold under the repurchase transaction. In addition, each lender typically requires that we include supplemental terms and conditions to the standard master repurchase agreement. Typical supplemental terms and conditions include changes to the margin maintenance requirements, required haircuts, and purchase price maintenance requirements, requirements that all controversies related to the repurchase agreement be litigated in a particular jurisdiction and cross default provisions. These provisions will differ for each of our lenders and will not be determined until we engage in a specific repurchase transaction.
For our short-term (one year or less) and long-term liquidity, which include investing and compliance with collateralization requirements under our repurchase agreements (if the pledged collateral decreases in value or in the event of margin calls created by prepayments of the pledged collateral), we also rely on the cash flow from investments, primarily monthly principal and interest payments to be received on our RMBS and whole mortgage loans, cash flow from the sale of securities as well as any primary securities offerings authorized by our board of directors.
Based on our current portfolio, leverage ratio and available borrowing arrangements, we believe our assets will be sufficient to enable us to meet anticipated short-term (one year or less) liquidity requirements such as to fund our investment activities, pay fees under our management agreement, fund our distributions to stockholders and pay general corporate expenses. However, a decline in the value of our collateral or a decrease in prepayment rates substantially below our expectations could cause a temporary liquidity shortfall due to the timing of the necessary margin calls on the financing arrangements and the actual receipt of the cash related to principal paydowns. If our cash resources are at any time insufficient to satisfy our liquidity requirements, we may have to sell investments or issue debt or additional equity securities in a common stock offering. If required, the sale of RMBS or whole mortgage loans at prices lower than their carrying value would result in losses and reduced income.
Our ability to meet our long-term (greater than one year) liquidity and capital resource requirements will be subject to obtaining additional debt financing and equity capital. Subject to our maintaining our qualification as a REIT as well as market conditions, we expect to use a number of sources to finance our investments, including repurchase agreements, warehouse facilities, securitization, commercial paper and term financing CDOs. Such financing will depend on market conditions for capital raises and for the investment of any proceeds. If we are unable to renew, replace or expand our sources of financing on substantially similar terms, it may have an adverse effect on our business and results of operations. Upon liquidation, holders of our debt securities and shares of preferred stock and lenders with respect to other borrowings will receive a distribution of our available assets prior to the holders of our common stock.
We held cash and cash equivalents of approximately $7.2 million, $24.3 million and $27.5 million at December 31, 2010, 2009 and 2008, respectively. Our cash and cash equivalents decreased due to normal quarterly fluctuations in cash balances related to the timing of principal and interest payments, repayments of debt, and asset purchases and sales.
Our operating activities provided net cash of approximately $305.6 million, $168.7 million and $30.7 million for the years ended December 31, 2010, 2009 and 2008, respectively. The cash provided by operating activities increased due to the increase in net interest income earned by the portfolio which resulted from the increase in average interest earning assets of $8.5 billion in investments at December 31, 2010 as compared to $4.3 billion at December 31, 2009.
Our investing activities used net cash of $1.6 billion, $2.8 billion and $1.1 billion for the years ended December 31, 2010, 2009 and 2008, respectively. During the year ended December 31, 2010 we utilized cash to purchase $4.0 billion in securities which were offset by proceeds from asset sales of $896.3 million and principal payments of $1.5 billion. During the year ended December 31, 2009 we utilized cash to purchase $5.3 billion in securities and sold $1.9 billion and received principal payments of $656.9 million. The increase in principal payments resulted from the larger portfolio at December 31, 2010 as compared to December 31, 2009 and the adoption of ASC 810.
Our financing activities as of December 31, 2010 consisted of net proceeds from our April, June and November 2010 secondary offerings in which we raised approximately $1.3 billion, repurchase agreements, and payments received on our securitizations. Our financing activities as of December 31, 2009 consisted of net proceeds from our April and May, 2009 secondary offerings in which we raised approximately $1.5 billion, repurchase agreements, and payments received on our securitizations. We currently have established uncommitted repurchase agreements for RMBS with 23 counterparties, including Annaly. At December 31, 2009, we had $259.0 million outstanding under our repurchase agreement with Annaly, which constituted 10.95% of our total financing. As of December 31, 2009, our repurchase agreement with Annaly had weighted average borrowing rates of 1.72% and weighted average remaining maturities of 5 days. This agreement was collateralized by our RMBS which had an estimated fair value of $314.3 million at December 31, 2009. The interest rates of these repurchase agreements are generally indexed to the one-month LIBOR rate and reprice accordingly.
65
At
December 31, 2010 and 2009, the repurchase agreements for RMBS had the following remaining maturities:
|
December 31, 2010
|
December 31, 2009
|
|||||||
|
Overnight
|
$ | - | $ | - | ||||
|
1-30 days (1)
|
232,265 | 1,772,662 | ||||||
|
30 to 59 days
|
970,394 | 62,243 | ||||||
|
60 to 89 days
|
545,442 | - | ||||||
|
90 to 119 days
|
60,696 | - | ||||||
|
Greater than or equal to 120 days
|
- | 140,497 | ||||||
|
Total
|
$ | 1,808,797 | $ | 1,975,402 | ||||
|
(1) Repurchase agreements with affiliates totaled $259.0 million as of December 31, 2009. There were no repurchase agreements with affiliates as of December 31, 2010.
|
||||||||
We are not required to maintain any specific debt-to-equity ratio as we believe the appropriate leverage for the particular assets we are financing depends on the credit quality and risk of those assets. At December 31, 2010 and 2009, our total debt was approximately $4.1 billion and $2.4 billion, which represented a debt-to-equity ratio of approximately 1.1:1 and 1.1:1, respectively.
Stockholders’ Equity
On March 31, 2010, we announced the sale of 85,000,000 shares of common stock at a price of $3.61 per share in a public offering. In addition, the underwriters exercised the option to purchase an additional 12,750,000 shares of common stock to cover overallotments. The aggregate net proceeds we received before expenses in this sale were approximately $352.9 million. This sale was completed on April 7, 2010.
On June 22, 2010, we announced the sale of 100,000,000 shares of common stock at a price of $3.61 per share in a public offering. In addition, the underwriters exercised the option to purchase an additional 15,000,000 shares of common stock to cover overallotments. The aggregate net proceeds we received before expenses in this sale were approximately $415.2 million. This sale was completed on June 28, 2010.
On November 2, 2010, we announced the sale of 125,000,000 shares of common stock at a price of $3.80 per share in a public offering. In addition, the underwriters exercised the option to purchase an additional 18,750,000 shares of common stock to cover overallotments. The aggregate net proceeds we received before expenses in this sale were approximately $546.3 million. This sale was completed on November 8, 2010.
On
April 15, 2009, we announced the sale of 235,000,000 shares of common stock at $3.00 per share for estimated proceeds, less the underwriters’ discount and offering expenses, of $674.8 million. Immediately following the sale of these shares Annaly purchased 24,955,752 shares at the same price per share as the public offering, for proceeds of approximately $74.9 million. In addition, on April 16, 2009 the underwriters exercised the option to purchase up to an additional 35,250,000 shares of common stock to cover over-allotments for proceeds, less the underwriters’ discount, of approximately $101.3 million. These sales were completed on April 21, 2009. In all, we raised net proceeds of approximately $850.9 in these offerings.
On May 27, 2009, we announced the sale of 168,000,000 shares of common stock at $3.22 per share for estimated proceeds, less the underwriters’ discount and offering expenses, of $519.3 million. Immediately following the sale of these shares Annaly purchased 4,724,017 shares at the same price per share as the public offering, for proceeds of approximately $15.2 million. In addition, on June 1, 2009 the underwriters exercised the option to purchase up to an additional 25,200,000 shares of common stock to cover over-allotments for proceeds, less the underwriters’ discount, of approximately $77.9 million. These sales were completed on June 2, 2009. In all, we raised net proceeds of approximately $612.4 million in these offerings.
66
On December 31, 2010, 57,483 shares of our common stock were awarded to the independent members of our Board of Directors under our Long Term Incentive Plan. Each independent director annually receives the equivalent of $45,000 in our common stock at each year end, based on pro-rata days of service during the year. These shares vested on the date of award.
On September 24, 2009, we adopted a dividend reinvestment and share purchase plan, or DRSPP. The DRSPP provides holders of record of our common stock an opportunity to automatically reinvest all or a portion of their cash distributions received on common stock in additional shares of our common stock as well as to make optional cash payments to purchase shares of our common stock. Persons who are not already stockholders may also purchase our common stock under the plan through optional cash payments. The DRSPP is administered by The Bank of New York Mellon. During the year ended December 31, 2010 we raised $263,000 by issuing 67,596 shares through the DRSPP. During the year ended December 31, 2009 no shares were issued under the DRSPP.
During the year ended December 31, 2010, we declared dividends to common shareholders totaling $577.5 million, or $0.69 per share. During the year ended December 31, 2009, we declared dividends to common shareholders totaling $242.4 million, or $0.43 per share.
There was no preferred stock issued or outstanding as of December 31, 2010 and 2009.
Our charter provides that we may issue up to 1,600,000,000 shares of stock, consisting of up to 1,500,000,000 shares of common stock having a par value of $0.01 per share and up to 100,000,000 shares of preferred stock having a par value of $0.01 per share. On November 3, 2010, we filed an amendment to our Articles of Incorporation. Our Articles of Incorporation previously allowed us to issue up to a total of 1,100,000,000 shares of capital stock, par value $0.01 per share. As of November 3, 2010, we had 883,168,113 shares of common stock issued and outstanding. To retain the ability to issue additional shares of capital stock, we have increased the number of shares are authorized to issue to 1,600,000,000 shares consisting of 1,500,000,000 shares of common stock, $0.01 par value per common share, and 100,000,000 shares of preferred stock, $0.01 par value per preferred share.
Management Agreement and Related Party Transactions
Management Agreement
On November 15, 2007 we entered into a management agreement with FIDAC, pursuant to which FIDAC is entitled to receive a management fee and, in certain circumstances, a termination fee and reimbursement of certain expenses as described in the management agreement. Such fees and expenses do not have fixed and determinable payments. The management fee is payable quarterly in arrears in an amount equal to 1.50% per annum, calculated quarterly, of our stockholders’ equity (as defined in the management agreement). FIDAC uses the proceeds from its management fee in part to pay compensation to its officers and employees who, notwithstanding that certain of them also are our officers, receive no cash compensation directly from us. The management fee will be reduced, but not below zero, by our proportionate share of any CDO base management fees FIDAC receives in connection with the CDOs in which we invest, based on the percentage of equity we hold in such CDOs.
Financing Arrangements with Affiliates
In April 2009, we entered into a Securities Industry and Financial Markets Association standard preprinted form Master Repurchase Agreement with RCap Securities, Inc., a wholly owned subsidiary of Annaly. This standard agreement does not contain any sort of liquidity, net worth or other similar types of positive or negative covenants. Rather, the agreement contains covenants that require the buyer and seller of securities to deliver collateral or securities, and similar covenants which are customary in Master Repurchase Agreements. At December 31, 2010 and 2009 we had no financing under this agreement. We have been in compliance with all covenants of this agreement since we entered into this agreement.
In March 2008, we entered into a Securities Industry and Financial Markets Association standard preprinted form Master Repurchase Agreement with Annaly. This standard agreement does not contain any sort of liquidity, net worth or other similar types of positive or negative covenants. Rather, the agreement contains covenants that require the buyer and seller of securities to deliver collateral or securities, and similar covenants which are customary in Master Repurchase Agreements. At December 31, 2010 we had no financing under this agreement. At December 31, 2009, the Company financed $259.0 million under this agreement at a weighted average rate of 1.72%. We have been in compliance with all covenants of this agreement since we entered into this agreement.
67
Restricted Stock Grants
We granted 1,301,000 shares of restricted stock to our Manager’s employees and members of our board of directors during the year ended December 31, 2008. During the years ended December 31, 2010 and 2009, 146,400 and 128,900 shares of restricted stock we had awarded to FIDAC’s employees and our board members vested and 21,070 and 4,075 shares were forfeited or cancelled, respectively. At December 31, 2010 and 2009 there are approximately 885,000 million and 1.0 million unvested shares of restricted stock issued to employees of FIDAC, respectively. For the years ended December 31, 2010 and 2009, compensation expense less general and administrative costs associated with the amortization of the fair value of the restricted stock was approximately $490,000 and $451,000, respectively.
Contractual Obligations and Commitments
The following tables summarize our contractual obligations at December 31, 2010.
|
Contractual Obligations
|
Within
One Year
|
One to
Three Years
|
Three to
Five Years
|
Greater Than
or Equal to
Five Years
|
Total
|
|||||||||||||||
|
(dollars in thousands)
|
||||||||||||||||||||
|
Repurchase agreements for RMBS
|
$ | 1,808,797 | $ | - | $ | - | $ | - | $ | 1,808,797 | ||||||||||
|
Securitized debt
|
634,988 | 831,305 | 305,953 | 417,976 | 2,190,222 | |||||||||||||||
|
Interest expense on RMBS repurchase agreements (1)
|
1,223 | - | - | - | 1,223 | |||||||||||||||
|
Interest expense on securitized debt (1)
|
86,453 | 113,635 | 68,335 | 171,042 | 439,465 | |||||||||||||||
|
Total
|
$ | 2,531,461 | $ | 944,940 | $ | 374,288 | $ | 589,018 | $ | 4,439,707 | ||||||||||
|
(1) Interest is based on variable rates in effect as of December 31, 2010.
|
||||||||||||||||||||
The repurchase agreements for our repurchase facilities generally do not include substantive provisions other than those contained in the standard master repurchase agreement as published by the Securities Industry and Financial Markets Association. The securitized debt reflected in the table above is non-recourse.
Off-Balance Sheet Arrangements
We do not have any relationships with unconsolidated entities or financial partnerships, such as entities often referred to as structured finance or special purpose entities, which would have been established for the purpose of facilitating off-balance sheet arrangements or other contractually narrow or limited purposes. Further, we have not guaranteed any obligations of unconsolidated entities nor do we have any commitment or intent to provide funding to any such entities.
Capital Expenditures
At December 31, 2010 and 2009, we had no material commitments or capital expenditures.
Dividends
To qualify as a REIT, we must pay annual dividends to our stockholders of at least 90% of our taxable income, determined without regard to the deduction for dividends paid and excluding any net capital gains. We intend to pay regular quarterly dividends to our stockholders. Before we pay any dividend, whether for U.S. federal income tax purposes or otherwise, which would only be paid out of available cash to the extent permitted under our financing facilities, we must first meet any operating requirements and scheduled debt service on our financing facilities and other debt payable.
68
Inflation
Virtually all of our assets and liabilities are interest rate sensitive in nature. As a result, interest rates and other factors influence our performance far more so than does inflation. Changes in interest rates do not necessarily correlate with inflation rates or changes in inflation rates. Our consolidated financial statements are prepared in accordance with GAAP and our distributions will be determined by our board of directors consistent with our obligation to distribute to our stockholders at least 90% of our REIT taxable income on an annual basis in order to maintain our REIT qualification; in each case, our activities and balance sheet are measured with reference to historical cost and/or fair market value without considering inflation.
Subsequent Events
On January 28, 2011 the Company entered into an equity distribution agreement with FIDAC and UBS Securities LLC, or UBS. Through this agreement, from time to time we may sell through UBS, as our sales agent, up to 125,000,000 shares of our common stock in ordinary brokers’ transactions at market prices or other transactions as agreed between us and UBS.
The primary components of our market risk are related to credit risk, interest rate risk, prepayment risk, market value risk and real estate risk. While we do not seek to avoid risk completely, we believe the risk can be quantified from historical experience and we seek to actively manage that risk, to earn sufficient compensation to justify taking those risks and to maintain capital levels consistent with the risks we undertake.
Credit Risk
We are subject to credit risk in connection with our investments and face more credit risk on assets we own which are rated below ‘‘AAA’’. The credit risk related to these investments pertains to the ability and willingness of the borrowers to pay, which is assessed before credit is granted or renewed and periodically reviewed throughout the loan or security term. We believe that residual loan credit quality is primarily determined by the borrowers’ credit profiles and loan characteristics. FIDAC uses a comprehensive credit review process. FIDAC’s analysis of loans includes borrower profiles, as well as valuation and appraisal data. FIDAC uses compensating factors such as liquid assets, low loan to value ratios and job stability in evaluating loans. FIDAC’s resources include a proprietary portfolio management system, as well as third party software systems. FIDAC utilizes a third party due diligence firm to perform an independent underwriting review to insure compliance with existing guidelines. FIDAC selects loans for review predicated on risk-based criteria such as loan-to-value, borrower’s credit score(s) and loan size. FIDAC also outsources underwriting services to review higher risk loans, either due to borrower credit profiles or collateral valuation issues. In addition to statistical sampling techniques, FIDAC creates adverse credit and valuation samples, which we individually review. FIDAC rejects loans that fail to conform to our standards. FIDAC accepts only those loans which meet our underwriting criteria. Once we own a loan, FIDAC’s surveillance process includes ongoing analysis through our proprietary data warehouse and servicer files. Additionally, the non-Agency RMBS and other ABS which we acquire for our portfolio are reviewed by FIDAC to ensure that they satisfy our risk based criteria. FIDAC’s review of non-Agency RMBS and other ABS includes utilizing its proprietary portfolio management system. FIDAC’s review of non-Agency RMBS and other ABS is based on quantitative and qualitative analysis of the risk-adjusted returns on non-Agency RMBS and other ABS present.
Interest Rate Risk
Interest rate risk is highly sensitive to many factors, including governmental, monetary and tax policies, domestic and international economic and political considerations and other factors beyond our control. We are subject to interest rate risk in connection with our investments and our related debt obligations, which are generally repurchase agreements, warehouse facilities, securitization, commercial paper and term financing CDOs. Our repurchase agreements and warehouse facilities may be of limited duration that are periodically refinanced at current market rates. We intend to mitigate this risk through utilization of derivative contracts, primarily interest rate swap agreements.
69
Interest Rate Effect on Net Interest Income
Our operating results depend, in large part, on differences between the income from our investments and our borrowing costs. Most of our warehouse facilities and repurchase agreements provide financing based on a floating rate of interest calculated on a fixed spread over LIBOR. The fixed spread varies depending on the type of underlying asset which collateralizes the financing. Accordingly, the portion of our portfolio which consists of floating interest rate assets will be match-funded utilizing our expected sources of short-term financing, while our fixed interest rate assets will not be match-funded. During periods of rising interest rates, the borrowing costs associated with our investments tend to increase while the income earned on our fixed interest rate investments may remain substantially unchanged. This will result in a narrowing of the net interest spread between the related assets and borrowings and may even result in losses. Further, during this portion of the interest rate and credit cycles, defaults could increase and result in credit losses to us, which could adversely affect our liquidity and operating results. Such delinquencies or defaults could also have an adverse effect on the spread between interest-earning assets and interest-bearing liabilities. Hedging techniques are partly based on assumed levels of prepayments of our fixed-rate and hybrid adjustable-rate mortgage loans and RMBS. If prepayments are slower or faster than assumed, the life of the mortgage loans and RMBS will be longer or shorter, which would reduce the effectiveness of any hedging strategies we may use and may cause losses on such transactions. Hedging strategies involving the use of derivative securities are highly complex and may produce volatile returns.
Interest Rate Effects on Fair Value
Another component of interest rate risk is the effect changes in interest rates will have on the fair value of the assets we acquire. We face the risk that the fair value of our assets will increase or decrease at different rates than that of our liabilities, including our hedging instruments. We primarily assess our interest rate risk by estimating the duration of our assets and the duration of our liabilities. Duration essentially measures the market price volatility of financial instruments as interest rates change. We generally calculate duration using various financial models and empirical data. Different models and methodologies can produce different duration numbers for the same securities.
It is important to note that the impact of changing interest rates on fair value can change significantly when interest rates change beyond 100 basis points from current levels. Therefore, the volatility in the fair value of our assets could increase significantly when interest rates change beyond 100 basis points. In addition, other factors impact the fair value of our interest rate-sensitive investments and hedging instruments, such as the shape of the yield curve, market expectations as to future interest rate changes and other market conditions. Accordingly, in the event of changes in actual interest rates, the change in the fair value of our assets would likely differ from that shown above and such difference might be material and adverse to our stockholders.
Interest Rate Cap Risk
We also invest in adjustable-rate mortgage loans and RMBS. These are mortgages or RMBS in which the underlying mortgages are typically subject to periodic and lifetime interest rate caps and floors, which limit the amount by which the security’s interest yield may change during any given period. However, our borrowing costs pursuant to our financing agreements will not be subject to similar restrictions. Therefore, in a period of increasing interest rates, interest rate costs on our borrowings could increase without limitation by caps, while the interest-rate yields on our adjustable-rate mortgage loans and RMBS would effectively be limited. This problem will be magnified to the extent we acquire adjustable-rate RMBS that are not based on mortgages which are fully indexed. In addition, the mortgages or the underlying mortgages in an RMBS may be subject to periodic payment caps that result in some portion of the interest being deferred and added to the principal outstanding. This could result in our receipt of less cash income on our adjustable-rate mortgages or RMBS than we need in order to pay the interest cost on our related borrowings. These factors could lower our net interest income or cause a net loss during periods of rising interest rates, which would harm our financial condition, cash flows and results of operations.
Interest Rate Mismatch Risk
We fund a substantial portion of our acquisitions of hybrid adjustable-rate mortgages and RMBS with borrowings that, after the effect of hedging, have interest rates based on indices and re-pricing terms similar to, but of somewhat shorter maturities than, the interest rate indices and re-pricing terms of the mortgages and RMBS. Thus, in most cases the interest rate indices and re-pricing terms of our mortgage assets and our funding sources will not be identical, thereby creating an interest rate mismatch between assets and liabilities. Therefore, our cost of funds would likely rise or fall more quickly than would our earnings rate on assets. During periods of changing interest rates, such interest rate mismatches could negatively impact our financial condition, cash flows and results of operations. To mitigate interest rate mismatches, we may utilize the hedging strategies discussed above. Our analysis of risks is based on FIDAC’s experience, estimates, models and assumptions. These analyses rely on models which utilize estimates of fair value and interest rate sensitivity. Actual economic conditions or implementation of investment decisions by our management may produce results that differ significantly from the estimates and assumptions used in our models and the projected results shown in this Form 10-K.
70
Our profitability and the value of our portfolio (including interest rate swaps) may be adversely affected during any period as a result of changing interest rates. The following table quantifies the potential changes in net interest income and portfolio value should interest rates go up or down 25, 50, and 75 basis points, assuming the yield curves of the rate shocks will be parallel to each other and the current yield curve. All changes in income and value are measured as percentage changes from the projected net interest income and portfolio value at the base interest rate scenario. The base interest rate scenario assumes interest rates at December 31, 2010 and various estimates regarding prepayment and all activities are made at each level of rate shock. Actual results could differ significantly from these estimates.
|
Change in Interest Rate
|
Projected Percentage
Change in Net Interest
Income %
|
Projected Percentage
Change in Portfolio
Value %
|
|
-75 Basis Points
|
(22.71%)
|
5.21%
|
|
-50 Basis Points
|
(17.14%)
|
3.46%
|
|
-25 Basis Points
|
(11.22%)
|
1.72%
|
|
Base Interest Rate
|
-
|
-
|
|
+25 Basis Points
|
4.97%
|
(1.70%)
|
|
+50 Basis Points
|
9.04%
|
(3.38%)
|
|
+75 Basis Points
|
13.12%
|
(5.04%)
|
Prepayment Risk
As we receive prepayments of principal on these investments, premiums and discounts on such investments will be amortized or accreted against interest income. In general, an increase in prepayment rates will accelerate the amortization of purchase premiums, thereby reducing the interest income earned on the investments. Conversely, discounts on such investments are accreted into interest income. In general, an increase in prepayment rates will accelerate the accretion of purchase discounts, thereby increasing the interest income earned on the investments.
Extension Risk
FIDAC computes the projected weighted-average life of our investments based on assumptions regarding the rate at which the borrowers will prepay the underlying mortgages. In general, when fixed-rate or hybrid adjustable-rate mortgage loans or RMBS are acquired with borrowings, we may, but are not required to, enter into an interest rate swap agreement or other hedging instrument that effectively fixes our borrowing costs for a period close to the anticipated average life of the fixed-rate portion of the related assets. This strategy is designed to protect us from rising interest rates because the borrowing costs are fixed for the duration of the fixed-rate portion of the related assets. However, if prepayment rates decrease in a rising interest rate environment, the life of the fixed-rate portion of the related assets could extend beyond the term of the swap agreement or other hedging instrument. This could have a negative impact on our results from operations, as borrowing costs would no longer be fixed after the end of the hedging instrument while the income earned on the hybrid adjustable-rate assets would remain fixed. This situation may also cause the market value of our hybrid adjustable-rate assets to decline, with little or no offsetting gain from the related hedging transactions. In extreme situations, we may be forced to sell assets to maintain adequate liquidity, which could cause us to incur losses.
Market Risk
Market Value Risk
Our available-for-sale securities are reflected at their estimated fair value with unrealized gains and losses excluded from earnings and reported in other comprehensive income. The estimated fair value of these securities fluctuates primarily due to changes in interest rates, prepayment speeds, market liquidity, credit quality, and other factors. Generally, in a rising interest rate environment, the estimated fair value of these securities would be expected to decrease; conversely, in a decreasing interest rate environment, the estimated fair value of these securities would be expected to increase. As market volatility increases or liquidity decreases, the fair value of our investments may be adversely impacted. If we are unable to readily obtain independent pricing to validate our estimated fair value of securities in the portfolio, the fair value gains or losses recorded in other comprehensive income may be adversely affected.
71
Real Estate Market Risk
We own assets secured by real property and may own real property directly in the future. Residential property values are subject to volatility and may be affected adversely by a number of factors, including, but not limited to, national, regional and local economic conditions (which may be adversely affected by industry slowdowns and other factors); local real estate conditions (such as an oversupply of housing); changes or continued weakness in specific industry segments; construction quality, age and design; demographic factors; and retroactive changes to building or similar codes. In addition, decreases in property values reduce the value of the collateral and the potential proceeds available to a borrower to repay our loans, which could also cause us to suffer losses.
Risk Management
To the extent consistent with maintaining our REIT status, we seek to manage risk exposure to protect our portfolio of residential mortgage loans, RMBS, and other assets and related debt against the effects of major interest rate changes. We generally seek to manage our risk by:
|
|
●
|
monitoring and adjusting, if necessary, the reset index and interest rate related to our RMBS and our financings;
|
|
|
●
|
attempting to structure our financing agreements to have a range of different maturities, terms, amortizations and interest rate adjustment periods;
|
|
|
●
|
using derivatives, financial futures, swaps, options, caps, floors and forward sales to adjust the interest rate sensitivity of our investments and our borrowings;
|
|
|
●
|
using securitization financing to lower average cost of funds relative to short-term financing vehicles further allowing us to receive the benefit of attractive terms for an extended period of time in contrast to short term financing and maturity dates of the investments included in the securitization; and
|
|
|
●
|
actively managing, on an aggregate basis, the interest rate indices, interest rate adjustment periods, and gross reset margins of our investments and the interest rate indices and adjustment periods of our financings.
|
Our efforts to manage our assets and liabilities are concerned with the timing and magnitude of the re-pricing of assets and liabilities. We attempt to control risks associated with interest rate movements. Methods for evaluating interest rate risk include an analysis of our interest rate sensitivity “gap”, which is the difference between interest-earning assets and interest-bearing liabilities maturing or re-pricing within a given time period. A gap is considered positive when the amount of interest-rate sensitive assets exceeds the amount of interest-rate sensitive liabilities. A gap is considered negative when the amount of interest-rate sensitive liabilities exceeds interest-rate sensitive assets. During a period of rising interest rates, a negative gap would tend to adversely affect net interest income, while a positive gap would tend to result in an increase in net interest income. During a period of falling interest rates, a negative gap would tend to result in an increase in net interest income, while a positive gap would tend to affect net interest income adversely. Because different types of assets and liabilities with the same or similar maturities may react differently to changes in overall market rates or conditions, changes in interest rates may affect net interest income positively or negatively even if an institution were perfectly matched in each maturity category.
The following table sets forth the estimated maturity or re-pricing of our interest-earning assets and interest-bearing liabilities at December 31, 2010. The amounts of assets and liabilities shown within a particular period were determined in accordance with the contractual terms of the assets and liabilities, except adjustable-rate loans, and securities are included in the period in which their interest rates are first scheduled to adjust and not in the period in which they mature and does include the effect of the interest rate swaps. The interest rate sensitivity of our assets and liabilities in the table could vary substantially if based on actual prepayment experience.
72
|
Within 3
Months
|
3-12 Months
|
1 Year to
3 Years
|
Greater than
3 Years
|
Total
|
||||||||||||||||
|
Rate sensitive assets
|
$ | 5,120,119 | $ | 561,453 | $ | 7,027,551 | $ | 3,922,933 | $ | 16,632,056 | ||||||||||
|
Cash equivalents
|
7,173 | - | - | - | 7,173 | |||||||||||||||
|
Total rate sensitive assets
|
5,127,292 | 561,453 | 7,027,551 | 3,922,933 | 16,639,229 | |||||||||||||||
|
Rate sensitive liabilities
|
3,609,370 | 60,696 | - | - | 3,670,066 | |||||||||||||||
|
Interest rate sensitivity gap
|
$ | 1,517,922 | $ | 500,757 | $ | 7,027,551 | $ | 3,922,933 | $ | 12,969,163 | ||||||||||
|
Cumulative rate sensitivity gap
|
$ | 1,517,922 | $ | 2,018,679 | $ | 9,046,230 | $ | 12,969,163 | ||||||||||||
|
Cumulative interest rate sensitivity gap as a
|
||||||||||||||||||||
|
percentage of total rate sensitive assets
|
9 | % | 12 | % | 54 | % | 78 | % | ||||||||||||
Our analysis of risks is based on our manager’s experience, estimates, models and assumptions. These analyses rely on models which utilize estimates of fair value and interest rate sensitivity. Actual economic conditions or implementation of investment decisions by our manager may produce results that differ significantly from the estimates and assumptions used in our models and the projected results shown in the above tables and in this Form 10-K. These analyses contain certain forward-looking statements and are subject to the safe harbor statement set forth under the heading, “Special Note Regarding Forward-Looking Statements.”
Our consolidated financial statements and the related notes, together with the Report of Independent Registered Public Accounting Firm thereon, are set forth on pages
F-1 through F-32
of this Form 10-K.
None.
Our management, including our Chief Executive Officer, or CEO and Chief Financial Officer, or CFO, reviewed and evaluated the effectiveness of the design and operation of our disclosure controls and procedures (as defined in Rule 13a-15(e) and 15d-15(e) of the Securities Exchange Act) as of the end of the period covered by this annual report. Based on that review and evaluation, the CEO and CFO have concluded that our current disclosure controls and procedures, as designed and operating, (1) were effective in ensuring that information regarding the Company and its subsidiaries is made known to our management, including our CEO and CFO, as appropriate to allow timely decisions regarding required disclosure and (2) were effective in providing reasonable assurance that information the Company must disclose in its periodic reports under the Securities Exchange Act is recorded, processed, summarized and reported within the time periods prescribed by the SEC’s rules and forms.
There have been no changes in the Company’s internal controls over financial reporting that occurred during the quarter ended December 31, 2010 that have materially affected, or are reasonably likely to affect its internal control over financial reporting.
Management Report On Internal Control Over Financial Reporting
Management of the Company is responsible for establishing and maintaining adequate internal control over financial reporting. Internal control over financial reporting is defined in Rules 13a-15(f) under the Securities Exchange Act as a process designed by, or under the supervision of, the Company’s principal executive and principal financial officers and effected by the Company’s Board of Directors, management and other personnel to provide reasonable assurance regarding the reliability of financial reporting and the preparation of financial statements for external purposes in accordance with generally accepted accounting principles and includes those policies and procedures that:
73
|
•
|
pertain to the maintenance of records that in reasonable detail accurately and fairly reflect the transactions and dispositions of the assets of the Company;
|
||
|
|
|||
|
•
|
provide reasonable assurance that transactions are recorded as necessary to permit preparation of financial statements in accordance with generally accepted accounting principles, and that receipts and expenditures of the Company are being made only in accordance with authorizations of management and directors of the Company; and
|
||
|
|
|||
|
•
|
provide reasonable assurance regarding prevention or timely detection of unauthorized acquisition, use or disposition of the Company’s assets that could have a material effect on the financial statements.
|
Because of its inherent limitations, internal control over financial reporting may not prevent or detect misstatements. As a result, even systems determined to be effective can provide only reasonable assurance regarding the preparation and presentation of financial statements. Moreover, projections of any evaluation of effectiveness to future periods are subject to the risks that controls may become inadequate because of changes in conditions or that the degree of compliance with the policies or procedures may deteriorate.
The Company’s management assessed the effectiveness of the Company’s internal control over financial reporting as of December 31, 2010. In making this assessment, the Company’s management used criteria set forth by the Committee of Sponsoring Organizations of the Treadway Commission (COSO) in Internal Control-Integrated Framework.
Based on management’s assessment, the Company’s management believes that, as of December 31, 2010, the Company’s internal control over financial reporting was effective based on those criteria. The Company’s independent registered public accounting firm, Deloitte & Touche LLP, has issued an attestation report on the Company’s internal control over financial reporting. This report appears on page F-2 of this annual report on Form 10-K.
None.
74
The information required by Item 10 as to our directors is incorporated herein by reference to the proxy statement to be filed with the SEC within 120 days after December 31, 2010.
The information regarding our executive officers required by Item 10 is incorporated by reference to the proxy statement to be filed with the SEC within 120 days after December 31, 2010.
The information required by Item 10 as to our compliance with Section 16(a) of the Securities Exchange Act of 1934 is incorporated by reference to the proxy statement to be filed with the SEC within 120 days after December 31, 2010.
We have adopted a Code of Business Conduct and Ethics within the meaning of Item 406(b) of Regulation S-K. This Code of Business Conduct and Ethics applies to our principal executive officer, principal financial officer and principal accounting officer. This Code of Business Conduct and Ethics is publicly available on our website at www.chimerareit.com. If we make substantive amendments to this Code of Business Conduct and Ethics or grant any waiver, including any implicit waiver, we intend to disclose these events on our website.
The information regarding certain matters pertaining to our corporate governance required by Item 407(c)(3), (d)(4) and (d)(5) of Regulation S-K is incorporated by reference to the Proxy Statement to be filed with the SEC within 120 days after December 31, 2010.
The information required by Item 11 is incorporated herein by reference to the proxy statement to be filed with the SEC within 120 days after December 31, 2010.
The information required by Item 12 is incorporated herein by reference to the proxy statement to be filed with the SEC within 120 days after December 31, 2010.
The information required by Item 13 is incorporated herein by reference to the proxy statement to be filed with the SEC within 120 days after December 31, 2010.
The information required by Item 14 is incorporated herein by reference to the proxy statement to be filed with the SEC within 120 days after December 31, 2010.
75
(a) Documents filed as part of this report:
1. Financial Statements.
2. Schedules to Financial Statements.
All financial statement schedules have been omitted because they are either inapplicable or the information required is provided in our Financial Statements and Notes thereto, included in Part II, Item 8, of this Annual Report on Form 10-K.
3.
Exhibits:
EXHIBIT INDEX
|
Exhibit
Number
|
Description
|
|
|
3.1
|
Articles of Amendment and Restatement of Chimera Investment Corporation (filed as Exhibit 3.1 to the Company’s Registration Statement on Amendment No. 1 to Form S-11 (File No. 333-145525) filed on September 27, 2007 and incorporated herein by reference)
|
|
|
3.2
|
Articles of Amendment of Chimera Investment Corporation (filed as Exhibit 3.1 to the Company’s Report on Form 8-K filed on May 28, 2009 and incorporated herein by reference)
|
|
|
3.3
|
Amended and Restated Bylaws of Chimera Investment Corporation (filed as Exhibit 3.2 to the Company’s Registration Statement on Amendment No. 2 to Form S-11 (File No. 333-145525) filed on November 5, 2007 and incorporated herein by reference)
|
|
|
4.1
|
Specimen Common Stock Certificate of Chimera Investment Corporation (filed as Exhibit 4.1 to the Company’s Registration Statement on Amendment No. 1 to Form S-11 (File No. 333-145525) filed on September 27, 2007 and incorporated herein by reference)
|
|
|
10.1
|
Form of Management Agreement between Chimera Investment Corporation and Fixed Income Discount Advisory Company (filed as Exhibit 10.1 to the Company’s Registration Statement on Amendment No. 1 to Form S-11 (File No. 333-145525) filed on September 27, 2007 and incorporated herein by reference)
|
|
|
10.2
|
Form of Amendment No. 1 to the Management Agreement between Chimera Investment Corporation and Fixed Income Discount Advisory Company (filed as Exhibit 10.2 to the Company’s Registration Statement on Amendment No. 1 to Form S-11 (File No. 333-151403) filed on October 14, 2008 and incorporated herein by reference)
|
|
|
10.3
|
Form of Amendment No. 2 to the Management Agreement between Chimera Investment Corporation and Fixed Income Discount Advisory Company (filed as Exhibit 10.1 to the Company’s Current Report on Form 8-K filed on October 20, 2008 and incorporated herein by reference)
|
|
|
10.4†
|
Form of Equity Incentive Plan (filed as Exhibit 10.2 to the Company’s Registration Statement on Amendment No. 1 to Form S-11 (File No. 333-145525) filed on September 27, 2007 and incorporated herein by reference)
|
|
|
10.5†
|
Form of Restricted Common Stock Award (filed as Exhibit 10.3 to the Company’s Registration Statement on Amendment No. 1 to Form S-11 (File No. 333-145525) filed on September 27, 2007 and incorporated herein by reference)
|
|
|
10.6†
|
Form of Stock Option Grant (filed as Exhibit 10.4 to the Company’s Registration Statement on Amendment No. 1 to Form S-11 (File No. 333-145525) filed on September 27, 2007 and incorporated herein by reference)
|
|
|
10.7
|
Form of Master Securities Repurchase Agreement (filed as Exhibit 10.5 to the Company’s Registration Statement on Amendment No. 3 to Form S-11 (File No. 333-145525) filed on November 13, 2007 and incorporated herein by reference)
|
|
|
12.1
|
Computation of Ratio of Earnings to Fixed Charges
|
|
|
21.1
|
Subsidiaries of Registrant
|
76
|
23.3
|
Consent of Independent Registered Public Accounting Firm.
|
|
|
31.1
|
Certification of Matthew Lambiase, Chief Executive Officer and President of the Registrant, pursuant to Section 302 of the Sarbanes-Oxley Act of 2002.
|
|
|
31.2
|
Certification of A. Alexandra Denahan, Chief Financial Officer of the Registrant, pursuant to Section 302 of the Sarbanes-Oxley Act of 2002.
|
|
|
32.1
|
Certification of Matthew Lambiase, Chief Executive Officer and President of the Registrant, pursuant to 18 U.S.C. Section 1350 as adopted pursuant to Section 906 of the Sarbanes-Oxley Act of 2002.
|
|
|
32.2
|
Certification of A. Alexandra Denahan, Chief Financial Officer of the Registrant, pursuant to 18 U.S.C. Section 1350 as adopted pursuant to Section 906 of the Sarbanes-Oxley Act of 2002.
|
|
Exhibit 101.INS XBRL
|
Instance Document **
|
|
|
Exhibit 101.SCH XBRL
|
Taxonomy Extension Schema Document **
|
|
|
Exhibit 101.CAL XBRL
|
Taxonomy Extension Calculation Linkbase Document **
|
|
|
Exhibit 101.DEF XBRL
|
Additional Taxonomy Extension Definition Linkbase Document Created**
|
|
|
Exhibit 101.LAB XBRL
|
Taxonomy Extension Label Linkbase Document **
|
|
|
Exhibit 101.PRE XBRL
|
Taxonomy Extension Presentation Linkbase Document **
|
†
Represents a management contract or compensatory plan or arrangement
** Submitted electronically herewith. Attached as Exhibit 101 to this report are the following documents formatted in XBRL (Extensible Business Reporting Language): (i) Consolidated Statements of Financial Condition at December 31, 2010 and December 31, 2009; (ii) Consolidated Statements of Operations and Comprehensive Income (Loss) for the years ended December 31, 2010, 2009 and 2008; (iii) Consolidated Statement of Stockholders' Equity for the years ended December 31, 2010, 2009 and 2008; (iv) Consolidated Statements of Cash Flows for the years ended December 31, 2010, 2009 and 2008; and (v) Notes to Consolidated Financial Statements. Users of this data are advised pursuant to Rule 406T of Regulation S-T that this interactive data file is deemed not filed or part of a registration statement or prospectus for purposes of sections 11 or 12 of the Securities Act of 1933, is deemed not filed for purposes of section 18 of the Securities and Exchange Act of 1934, and otherwise is not subject to liability under these sections.
77
CHIMERA INVESTMENT CORPORATION
|
Report of Independent Registered Public Accounting Firm
|
F-2
|
|
Consolidated Financial Statements
|
|
|
Consolidated Statements of Financial Condition For the Years Ended December 31, 2010 and 2009
|
F-3
|
|
Consolidated Statements of Operations and Comprehensive Income (Loss) For the Years
|
|
|
Ended December 31, 2010, 2009 and 2008
|
F-4
|
|
Consolidated Statements of Stockholders' Equity For the Years Ended December 31, 2010,
|
|
|
2009 and 2008
|
F-5
|
|
|
|
|
Consolidated Statements of Cash Flows For the Years Ended December 31, 2010, 2009
|
|
|
and 2008
|
F-6
|
|
Notes to Consolidated Financial Statements
|
F-7
|
F-1
REPORT OF INDEPENDENT REGISTERED PUBLIC ACCOUNTING FIRM
To the Board of Directors and Stockholders of
Chimera Investment Corporation
New York, New York
We have audited the accompanying consolidated statements of financial condition of Chimera Investment Corporation and subsidiaries (the "Company") as of December 31, 2010 and 2009, and the related consolidated statements of operations and comprehensive income (loss), changes in stockholders' equity, and cash flows for each of the three years in the period ended December 31, 2010. We also have audited the Company's internal control over financial reporting as of December 31, 2010, based on criteria established in Internal Control — Integrated Framework issued by the Committee of Sponsoring Organizations of the Treadway Commission. The Company's management is responsible for these consolidated financial statements, for maintaining effective internal control over financial reporting, and for its assessment of the effectiveness of internal control over financial reporting, included in the accompanying Management Report On Internal Control Over Financial Reporting at Item 9A. Our responsibility is to express an opinion on these consolidated financial statements and an opinion on the Company's internal control over financial reporting based on our audits.
We conducted our audits in accordance with the standards of the Public Company Accounting Oversight Board (United States). Those standards require that we plan and perform the audit to obtain reasonable assurance about whether the financial statements are free of material misstatement and whether effective internal control over financial reporting was maintained in all material respects. Our audits of the consolidated financial statements included examining, on a test basis, evidence supporting the amounts and disclosures in the consolidated financial statements, assessing the accounting principles used and significant estimates made by management, and evaluating the overall consolidated financial statement presentation. Our audit of internal control over financial reporting included obtaining an understanding of internal control over financial reporting, assessing the risk that a material weakness exists, and testing and evaluating the design and operating effectiveness of internal control based on the assessed risk. Our audits also included performing such other procedures as we considered necessary in the circumstances. We believe that our audits provide a reasonable basis for our opinions.
A company's internal control over financial reporting is a process designed by, or under the supervision of, the company's principal executive and principal financial officers, or persons performing similar functions, and effected by the company's board of directors, management, and other personnel to provide reasonable assurance regarding the reliability of financial reporting and the preparation of financial statements for external purposes in accordance with generally accepted accounting principles. A company's internal control over financial reporting includes those policies and procedures that (1) pertain to the maintenance of records that, in reasonable detail, accurately and fairly reflect the transactions and dispositions of the assets of the company; (2) provide reasonable assurance that transactions are recorded as necessary to permit preparation of financial statements in accordance with generally accepted accounting principles, and that receipts and expenditures of the company are being made only in accordance with authorizations of management and directors of the company; and (3) provide reasonable assurance regarding prevention or timely detection of unauthorized acquisition, use, or disposition of the company's assets that could have a material effect on the financial statements.
Because of the inherent limitations of internal control over financial reporting, including the possibility of collusion or improper management override of controls, material misstatements due to error or fraud may not be prevented or detected on a timely basis. Also, projections of any evaluation of the effectiveness of the internal control over financial reporting to future periods are subject to the risk that the controls may become inadequate because of changes in conditions, or that the degree of compliance with the policies or procedures may deteriorate.
As discussed in Note 8 to the consolidated financial statements, the Company adopted Accounting Standards Codification (“ASC”) 810,
Consolidation
and 860,
Transfers and Servicing
as of January 1, 2010, and the adoption had a material impact to the consolidated financial statements as it relates to the consolidation of certain variable interest entities.
In our opinion, the consolidated financial statements referred to above present fairly, in all material respects, the financial position of Chimera Investment Corporation and subsidiaries as of December 31, 2010 and 2009 and the results of their operations and their cash flows for each of the three years in the period ended December 31, 2010, in conformity with accounting principles generally accepted in the United States of America. Also, in our opinion, the Company maintained, in all material respects, effective internal control over financial reporting as of December 31, 2010, based on the criteria established in Internal Control — Integrated Framework issued by the Committee of Sponsoring Organizations of the Treadway Commission.
/s/ Deloitte & Touche LLP
New York, New York
February 28, 2011
F-2
|
CHIMERA INVESTMENT CORPORATION
|
||||||||
|
CONSOLIDATED STATEMENTS OF FINANCIAL CONDITION
|
||||||||
|
(dollars in thousands, except share and per share data)
|
||||||||
|
December 31, 2010
|
December 31, 2009
|
|||||||
|
Assets:
|
||||||||
|
Cash and cash equivalents
|
$ | 7,173 | $ | 24,279 | ||||
|
Non-Agency Mortgage-Backed Securities, at fair value
|
||||||||
|
Senior ($484.1 million and $0 resulting from consolidation of VIEs)
|
987,685 | 2,022,406 | ||||||
|
Subordinated ($1.5 billion and $0 resulting from consolidation of VIEs)
|
2,210,858 | 376,459 | ||||||
|
Senior, non-retained
|
2,330,568 | - | ||||||
|
Agency Mortgage-Backed Securities, at fair value
|
2,133,584 | 1,690,029 | ||||||
|
Securitized loans held for investment, net of allowance for loan losses of $6.6 million and $4.6 million, respectively
|
353,532 | 470,533 | ||||||
|
Accrued interest receivable
|
49,088 | 33,128 | ||||||
|
Other assets
|
1,212 | 1,494 | ||||||
|
Total assets
|
$ | 8,073,700 | $ | 4,618,328 | ||||
|
Liabilities:
|
||||||||
|
Repurchase agreements ($2.0 billion and $1.8 billion of RMBS pledged as collateral, respectively)
|
$ | 1,808,797 | $ | 1,716,398 | ||||
|
Repurchase agreements with affiliates ($0 and $314.3 million of RMBS pledged as collateral, respectively)
|
- | 259,004 | ||||||
|
Securitized debt ($302.9 million and $388.3 million of securitized loans pledged as collateral, respectively)
|
289,236 | 390,350 | ||||||
|
Securitized debt, non-retained ($2.3 billion and $0 of non-retained RMBS pledged as collateral, respectively)
|
1,956,079 | - | ||||||
|
Payable for investments purchased
|
127,693 | - | ||||||
|
Accrued interest payable
|
11,641 | 3,235 | ||||||
|
Dividends payable
|
174,445 | 113,788 | ||||||
|
Accounts payable and other liabilities
|
393 | 472 | ||||||
|
Investment management fees payable to affiliate
|
12,422 | 8,519 | ||||||
|
Interest rate swaps, at fair value
|
9,988 | - | ||||||
|
Total liabilities
|
$ | 4,390,694 | $ | 2,491,766 | ||||
|
Commitments and Contingencies (Note 15)
|
- | - | ||||||
|
Stockholders' Equity:
|
||||||||
|
Common stock: par value $0.01 per share; 1,500,000,000 shares authorized,
1,027,034,357 and 670,371,587 shares issued and outstanding, respectively
|
$ | 10,261 | $ | 6,693 | ||||
|
Additional paid-in-capital
|
3,601,890 | 2,290,614 | ||||||
|
Accumulated other comprehensive income (loss)
|
274,651 | (99,754 | ) | |||||
|
Retained earnings (accumulated deficit)
|
(203,796 | ) | (70,991 | ) | ||||
|
Total stockholders' equity
|
$ | 3,683,006 | $ | 2,126,562 | ||||
|
Total liabilities and stockholders' equity
|
$ | 8,073,700 | $ | 4,618,328 | ||||
|
See notes to consolidated financial statements.
|
||||||||
F-3
|
CHIMERA INVESTMENT CORPORATION
|
||||||||||||
|
CONSOLIDATED STATEMENTS OF OPERATIONS AND COMPREHENSIVE INCOME (LOSS)
|
||||||||||||
|
(dollars in thousands, except share and per share data)
|
||||||||||||
|
For the Year Ended
|
||||||||||||
|
December 31, 2010
|
December 31, 2009
|
December 31, 2008
|
||||||||||
|
Net Interest Income:
|
||||||||||||
|
Interest income
|
$ | 562,878 | $ | 298,539 | $ | 105,259 | ||||||
|
Interest expense
|
37,175 | 35,083 | 60,544 | |||||||||
|
Interest income, non-retained
|
192,560 | - | - | |||||||||
|
Interest expense, non-retained
|
115,061 | - | - | |||||||||
|
Net interest income (expense)
|
603,202 | 263,456 | 44,715 | |||||||||
|
Other-than-temporary impairments:
|
||||||||||||
|
Total other-than-temporary impairment losses
|
(54,343 | ) | (16,264 | ) | - | |||||||
|
Non-credit portion of loss recognized in other comprehensive
income (loss)
|
41,665 | 6,268 | - | |||||||||
|
Net other-than-temporary credit impairment losses
|
(12,678 | ) | (9,996 | ) | - | |||||||
|
Other gains (losses):
|
||||||||||||
|
Unrealized gains (losses) on interest rate swaps
|
(9,989 | ) | - | 4,156 | ||||||||
|
Realized gains (losses) on sales of investments, net
|
10,085 | 103,646 | (144,304 | ) | ||||||||
|
Realized losses on principal write-downs of non-Agency RMBS
|
(7,385 | ) | (255 | ) | - | |||||||
|
Realized gains (losses) on terminations of interest rate swaps
|
- | - | (10,337 | ) | ||||||||
|
Total other gains (losses)
|
(7,289 | ) | 103,391 | (150,485 | ) | |||||||
|
Net investment income (loss)
|
583,235 | 356,851 | (105,770 | ) | ||||||||
|
Other expenses:
|
||||||||||||
|
Management fee
|
40,924 | 25,704 | 8,428 | |||||||||
|
Provision for loan losses
|
2,689 | 3,102 | 1,540 | |||||||||
|
General and administrative expenses
|
6,015 | 4,061 | 4,059 | |||||||||
|
Total other expenses
|
49,628 | 32,867 | 14,027 | |||||||||
|
Income (loss) before income taxes
|
533,607 | 323,984 | (119,797 | ) | ||||||||
|
Income taxes
|
756 | 1 | 12 | |||||||||
|
Net income (loss)
|
$ | 532,851 | $ | 323,983 | $ | (119,809 | ) | |||||
|
Net income (loss) per share-basic and diluted
|
$ | 0.65 | $ | 0.64 | $ | (1.90 | ) | |||||
|
Weighted average number of shares outstanding-basic and diluted
|
822,617,319 | 507,042,421 | 63,155,878 | |||||||||
|
Comprehensive income (loss):
|
||||||||||||
|
Net income (loss)
|
$ | 532,851 | $ | 323,983 | $ | (119,809 | ) | |||||
|
Other comprehensive income (loss):
|
||||||||||||
|
Unrealized gains (losses) on available-for-sale securities, net
|
364,427 | 260,309 | (421,125 | ) | ||||||||
|
Reclassification adjustment for net losses included in net income
(loss) for other-than-temporary credit impairment losses
|
12,678 | 9,996 | - | |||||||||
|
Reclassification adjustment for realized losses (gains) included
in net income (loss)
|
(2,700 | ) | (103,391 | ) | 144,304 | |||||||
|
Other comprehensive income (loss)
|
374,405 | 166,914 | (276,821 | ) | ||||||||
|
Comprehensive income (loss)
|
$ | 907,256 | $ | 490,897 | $ | (396,630 | ) | |||||
|
See notes to consolidated financial statements.
|
||||||||||||
F-4
|
CHIMERA INVESTMENT CORPORATION
|
||||||||||||||||||||
|
CONSOLIDATED STATEMENTS OF CHANGES IN STOCKHOLDERS' EQUITY
|
||||||||||||||||||||
|
(dollars in thousands, except per share data)
|
||||||||||||||||||||
|
Common Stock
Par Value
|
Additional Paid-in
Capital
|
Accumulated
Other
Comprehensive
Income (Loss)
|
Retained Earnings
(Accumulated
Deficit)
|
Total
|
||||||||||||||||
|
Balance, December 31, 2007
|
$ | 377 | $ | 532,208 | $ | 10,153 | $ | (3,849 | ) | $ | 538,889 | |||||||||
|
Net income (loss)
|
- | - | - | (119,809 | ) | (119,809 | ) | |||||||||||||
|
Other comprehensive income (loss)
|
- | - | (276,821 | ) | - | (276,821 | ) | |||||||||||||
|
Proceeds from direct purchase and dividend reinvestment
|
- | 97 | - | - | 97 | |||||||||||||||
|
Proceeds from common stock offerings
|
1,265 | 272,036 | - | - | 273,301 | |||||||||||||||
|
Proceeds from common stock offerings to affiliate
|
117 | 26,166 | - | - | 26,283 | |||||||||||||||
|
Restricted stock grants
|
1 | 1,459 | - | - | 1,460 | |||||||||||||||
|
Common dividends declared, $0.62 per share
|
- | - | - | (28,945 | ) | (28,945 | ) | |||||||||||||
|
Balance, December 31, 2008
|
$ | 1,760 | $ | 831,966 | $ | (266,668 | ) | $ | (152,603 | ) | $ | 414,455 | ||||||||
|
Net income (loss)
|
- | - | - | 323,983 | 323,983 | |||||||||||||||
|
Other comprehensive income (loss)
|
- | - | 166,914 | - | 166,914 | |||||||||||||||
|
Proceeds from direct purchase and dividend reinvestment
|
- | 50 | - | - | 50 | |||||||||||||||
|
Proceeds from common stock offerings
|
4,635 | 1,368,246 | - | - | 1,372,881 | |||||||||||||||
|
Proceeds from common stock offerings to affiliates
|
296 | 89,782 | - | - | 90,078 | |||||||||||||||
|
Restricted stock grants
|
2 | 570 | - | - | 572 | |||||||||||||||
|
Common dividends declared, $0.26 per share
|
- | - | - | (242,371 | ) | (242,371 | ) | |||||||||||||
|
Balance, December 31, 2009
|
$ | 6,693 | $ | 2,290,614 | $ | (99,754 | ) | $ | (70,991 | ) | $ | 2,126,562 | ||||||||
|
Net income (loss)
|
- | - | - | 532,851 | 532,851 | |||||||||||||||
|
Cumulative effect of change in accounting principle
|
- | - | - | (88,187 | ) | (88,187 | ) | |||||||||||||
|
Other comprehensive income (loss)
|
- | - | 374,405 | - | 374,405 | |||||||||||||||
|
Proceeds from direct purchase and dividend reinvestment
|
- | 263 | - | - | 263 | |||||||||||||||
|
Proceeds from common stock offerings
|
3,566 | 1,310,057 | - | - | 1,313,623 | |||||||||||||||
|
Restricted stock grants
|
2 | 956 | - | - | 958 | |||||||||||||||
|
Common dividends declared, $0.69 per share
|
- | - | - | (577,469 | ) | (577,469 | ) | |||||||||||||
|
Balance, December 31, 2010
|
$ | 10,261 | $ | 3,601,890 | $ | 274,651 | $ | (203,796 | ) | $ | 3,683,006 | |||||||||
|
See notes to consolidated financial statements.
|
||||||||||||||||||||
F-5
|
CHIMERA INVESTMENT CORPORATION
|
||||||||||||
|
|
||||||||||||
|
(dollars in thousands)
|
||||||||||||
|
December 31, 2010
|
December 31, 2009
|
December 31, 2008
|
||||||||||
|
Cash Flows From Operating Activities:
|
||||||||||||
|
Net income (loss)
|
$ | 532,851 | $ | 323,983 | $ | (119,809 | ) | |||||
|
Adjustments to reconcile net income to net cash provided by (used in) operating activities:
|
||||||||||||
|
(Accretion) amortization of investment discounts/premiums
|
(247,435 | ) | (49,249 | ) | 294 | |||||||
|
Unrealized losses (gains) on interest rate swaps
|
9,989 | - | (4,156 | ) | ||||||||
|
Realized loss (gain) on termination of interest rate swaps
|
- | - | 10,337 | |||||||||
|
Realized losses (gains) on sales of investments
|
(10,085 | ) | (103,646 | ) | 144,304 | |||||||
|
Realized losses on principal write-downs of non-Agency RMBS
|
7,385 | 255 | - | |||||||||
|
Net other-than-temporary credit impairment losses
|
12,678 | 9,996 | - | |||||||||
|
Provision for loan losses
|
2,689 | 3,102 | 1,540 | |||||||||
|
Restricted stock grants
|
958 | 572 | 1,460 | |||||||||
|
Changes in operating assets:
|
||||||||||||
|
Decrease (increase) in accrued interest receivable
|
(15,960 | ) | (23,177 | ) | (5,613 | ) | ||||||
|
Decrease (increase) in other assets
|
282 | (237 | ) | (694 | ) | |||||||
|
Changes in operating liabilities:
|
||||||||||||
|
Increase (decrease) in accounts payable and other liabilities
|
(79 | ) | 85 | (126 | ) | |||||||
|
Increase (decrease) in investment management fees payable to affiliate
|
3,903 | 6,227 | 1,076 | |||||||||
|
Increase (decrease) in accrued interest payable
|
8,406 | 770 | 2,050 | |||||||||
|
Net cash provided by (used in) operating activities
|
$ | 305,582 | $ | 168,681 | $ | 30,663 | ||||||
|
Cash Flows From Investing Activities:
|
||||||||||||
|
Mortgage-Backed Securities portfolio:
|
||||||||||||
|
Purchases
|
(4,022,951 | ) | (5,324,267 | ) | (1,483,416 | ) | ||||||
|
Sales
|
896,261 | 1,857,210 | 567,455 | |||||||||
|
Principal payments
|
799,543 | 548,048 | 174,449 | |||||||||
|
Mortgage-Backed Securities portfolio, non-retained:
|
||||||||||||
|
Principal payments
|
628,930 | - | - | |||||||||
|
Loans held for investment portfolio:
|
||||||||||||
|
Purchases
|
- | - | (735,271 | ) | ||||||||
|
Sales
|
- | - | 90,732 | |||||||||
|
Principal payments
|
- | - | 23,115 | |||||||||
|
Securitized loans:
|
||||||||||||
|
Purchases
|
- | - | (111 | ) | ||||||||
|
Principal payments
|
113,330 | 108,850 | 40,714 | |||||||||
|
Reverse repurchase agreements
|
- | - | 265,000 | |||||||||
|
Restricted cash
|
- | - | 1,350 | |||||||||
|
Net cash provided by (used in) investing activities
|
$ | (1,584,887 | ) | $ | (2,810,159 | ) | $ | (1,055,983 | ) | |||
|
Cash Flows From Financing Activities:
|
||||||||||||
|
Proceeds from repurchase agreements
|
15,370,110 | 59,370,624 | 85,585,116 | |||||||||
|
Payments on repurchase agreements
|
(15,536,715 | ) | (57,957,341 | ) | (85,293,581 | ) | ||||||
|
Net proceeds from common stock offerings
|
1,313,623 | 1,372,881 | 273,301 | |||||||||
|
Net proceeds from common stock offerings to affiliates
|
- | 90,078 | 26,283 | |||||||||
|
Proceeds from securitized debt borrowings
|
- | - | 526,716 | |||||||||
|
Payments on securitized debt borrowings
|
(102,000 | ) | (102,393 | ) | (37,973 | ) | ||||||
|
Proceeds from securitized debt borrowings, non-retained
|
1,295,657 | - | - | |||||||||
|
Payments on securitized debt borrowings, non-retained
|
(561,927 | ) | - | - | ||||||||
|
Net proceeds from direct purchase and dividend reinvestment
|
263 | 50 | 97 | |||||||||
|
Net payments on termination of interest rate swaps
|
- | - | (10,337 | ) | ||||||||
|
Common dividends paid
|
(516,812 | ) | (135,622 | ) | (22,848 | ) | ||||||
|
Net cash provided by (used in) financing activities
|
$ | 1,262,199 | $ | 2,638,277 | $ | 1,046,774 | ||||||
|
Net increase (decrease) in cash and cash equivalents
|
(17,106 | ) | (3,201 | ) | 21,454 | |||||||
|
Cash and cash equivalents at beginning of period
|
24,279 | 27,480 | 6,026 | |||||||||
|
Cash and cash equivalents at end of period
|
$ | 7,173 | $ | 24,279 | $ | 27,480 | ||||||
|
Supplemental disclosure of cash flow information:
|
||||||||||||
|
Interest paid
|
$ | 143,830 | $ | 34,452 | $ | 58,493 | ||||||
|
Taxes paid
|
$ | 756 | $ | 1 | $ | 33 | ||||||
|
Non-cash investing activities:
|
||||||||||||
|
Payable for investments purchased
|
$ | (127,693 | ) | $ | - | $ | - | |||||
|
Net change in unrealized gain on available-for sale securities
|
$ | 374,405 | $ | 166,914 | $ | (276,821 | ) | |||||
|
Non-cash financing activities:
|
||||||||||||
|
Common dividends declared, not yet paid
|
$ | 174,445 | $ | 113,788 | $ | 7,040 | ||||||
|
See notes to consolidated financial statements.
|
||||||||||||
F-6
CHIMERA INVESTMENT CORPORATION
NOTES TO CONSOLIDATED FINANCIAL STATEMENTS
For the Years Ended December 31, 2010, 2009 and 2008
Chimera Investment Corporation (“Company”) was organized in Maryland on June 1, 2007. The Company commenced operations on November 21, 2007 when it completed its initial public offering. The Company has elected to be taxed as a real estate investment trust (“REIT”), under the Internal Revenue Code of 1986, as amended. As long as the Company qualifies as a REIT, the Company will generally not be subject to U.S. federal or state corporate taxes on its income to the extent that the Company distributes at least 90% of its taxable net income to its stockholders. In July 2008, the Company formed Chimera Securities Holdings, LLC, a wholly-owned subsidiary. In June 2009, the Company formed Chimera Asset Holding LLC and Chimera Holding LLC, both wholly-owned subsidiaries. In January 2010, the Company formed Chimera Special Holding LLC, which is a wholly-owned subsidiary of Chimera Asset Holding LLC. In July 2010, the Company formed CIM Trading Company LLC, a wholly-owned subsidiary. Chimera Securities Holdings, LLC, Chimera Asset Holding LLC, Chimera Holding LLC, and Chimera Special Holding LLC are qualified REIT subsidiaries. CIM Trading Company LLC is a taxable REIT subsidiary. Annaly Capital Management, Inc. (“Annaly”) owns approximately 4.38% of the Company’s common shares. The Company is managed by Fixed Income Discount Advisory Company (“FIDAC”), an investment advisor registered with the Securities and Exchange Commission (“SEC”). FIDAC is a wholly-owned subsidiary of Annaly.
(a) Basis of Presentation
The consolidated financial statements include the accounts of the Company and its direct and indirect wholly-owned subsidiaries. All intercompany balances and transactions have been eliminated.
(b) Cash and Cash Equivalents
Cash and cash equivalents include cash on hand and cash deposited overnight in money market funds.
(c) Non-Agency and Agency Residential Mortgage-Backed Securities
The Company invests in residential mortgage-backed securities (“RMBS”) representing interests in obligations backed by pools of mortgage loans. The Company classifies its investment securities as either “trading,” “available-for-sale,” or “held-to-maturity.” In addition, the Company delineates between (1) Agency, (2) non-Agency, and (3) non-Agency, non-retained securities. The Agency RMBS are mortgage pass-through certificates, collateralized mortgage obligations (“CMOs”), and other mortgage-backed securities representing interests in or obligations backed by pools of mortgage loans issued or guaranteed as to principal and/or interest repayment by agencies of the U.S. Government or federally chartered corporations such as Government National Mortgage Association (“Ginnie Mae”), the Federal Home Loan Mortgage Corporation (“Freddie Mac”) or the Federal National Mortgage Association (“Fannie Mae”). The non-Agency RMBS portfolio is not issued or guaranteed by Fannie Mae, Freddie Mac, or Ginnie Mae and is therefore subject to credit risk. Non-Agency, non-retained securities are further detailed in Note 8 to these consolidated financial statements.
The Company holds its RMBS as available-for-sale, records investments at estimated fair value as described in Note 5 of these consolidated financial statements, and includes unrealized gains and losses in other comprehensive income (loss) in the consolidated statements of operations and comprehensive income (loss). From time to time, as part of the overall management of its portfolio, the Company may sell any of its RMBS investments and recognize a realized gain or loss as a component of earnings in the consolidated statements of operations and comprehensive income (loss) utilizing the specific identification method.
F-7
Interest income on RMBS is computed on the remaining principal balance of the investment security. Premium or discount amortization/accretion on Agency RMBS is recognized over the life of the investment using the effective interest method
.
Premium or discount amortization/accretion on non-Agency RMBS is recognized in accordance with Accounting Standards Codification (“ASC”) 325,
Investment-Other
. For non-Agency RMBS, the Company estimates at the time of purchase expected future cash flows, prepayment speeds, credit losses, loss severity, and loss timing based on the Company’s observation of available market data, its experience, and the collective judgment of its management team to determine the effective interest rate on the RMBS. Not less than quarterly, the Company reevaluates, and if necessary, makes adjustments to its analysis utilizing internal models, external market research and sources in conjunction with its view on performance in the non-Agency RMBS sector. Changes to the Company’s assumptions subsequent to the purchase date may increase or decrease the amortization/accretion of premiums or discounts which affects interest income. Changes to assumptions that decrease expected future cash flows may result in other-than-temporary impairment (“OTTI”).
The Company evaluates each investment in its RMBS portfolio for OTTI quarterly or more often if market conditions warrant. The Company determines if it (1) has the intent to sell the security, (2) is more likely than not that it will be required to sell the securities before recovery, or (3) does not expect to recover the entire amortized cost basis of the security. Further, the security is analyzed for credit loss by comparing the difference between the present value of cash flows expected to be collected and the amortized cost basis. The credit loss, if any, will then be recognized in the consolidated statements of operations, while the balance of impairment related to other factors will be recognized in other comprehensive income (loss).
(d) Securitized Loans Held for Investment
The Company’s securitized residential mortgage loans are comprised of fixed-rate and variable-rate loans. Mortgage loans are designated as held for investment, recorded on trade date, and are carried at their principal balance outstanding, plus any premiums or discounts, less allowances for loan losses. Interest income on loans held for investment is recognized over the life of the investment using the effective interest method. Income recognition is suspended for loans when, in the opinion of management, a full recovery of income and principal becomes doubtful. Income recognition is resumed when the loan becomes contractually current and performance is demonstrated to be resumed. The Company estimates fair value of securitized loans as described in Note 5 of these consolidated financial statements.
(e) Allowance for Loan Losses
The Company has established an allowance for loan losses at a level that management believes is adequate based on an evaluation of known and inherent risks related to the Company’s loan portfolio. The estimate is based on a variety of factors including current economic conditions, industry loss experience, the loan originator’s loss experience, credit quality trends, loan portfolio composition, delinquency trends, national and local economic trends, national unemployment data, changes in housing appreciation or depreciation and whether specific geographic areas where the Company has significant loan concentrations are experiencing adverse economic conditions and events such as natural disasters that may affect the local economy or property values. Upon purchase of a pool of loans, the Company obtains written representations and warranties from the sellers that the Company could be reimbursed for the value of the loan if the loan fails to meet the agreed upon origination standards. While the Company has little history of its own to establish loan trends, delinquency trends of the originators and the current market conditions aid in determining the allowance for loan losses. The Company has created an unallocated provision for probable loan losses estimated as a percentage of the remaining unpaid principal balance on the loans. Management’s estimate is based on historical experience of similarly underwritten pools in conjunction with current and expected market trends.
When the Company determines it is probable that specific contractually due amounts are uncollectible, the amount is considered impaired. Where impairment is indicated, a valuation write-off is measured based upon the excess of the recorded investment over the net fair value of the collateral, reduced by selling costs. Any deficiency between the carrying amount of an asset and the net sales price of repossessed collateral is charged to the allowance for loan losses.
(f) Repurchase Agreements
The Company may finance the acquisition of its investment securities through the use of repurchase agreements. Repurchase agreements are treated as collateralized financing transactions and are carried at their contractual amounts, including accrued interest, as specified in the respective agreements.
F-8
(g) Securitized Debt and Securitized Debt, Non-Retained
The Company has issued securitized debt to finance its residential mortgage loan portfolio and has re-securitized RMBS to finance a portion of its RMBS portfolio. Certain transactions involving residential mortgage loans are accounted for as financings, and are recorded as an asset called “Securitized loans held for investment” and the corresponding debt as “Securitized debt” in the consolidated statements of financial condition. These securitizations are collateralized by residential adjustable or fixed rate mortgage loans that have been placed in a trust and pay interest and principal payments to the debt holders of that securitization. Re-securitization transactions classified as “Securitized debt, non-retained” reflect the transfer to a trust of fixed or adjustable rate RMBS which are classified as “Non-Agency Mortgage-Backed Securities Senior, non-retained” that pay interest and principal payments to the debt holders of that re-securitization. Re-securitization transactions completed by the Company are accounted for as financings pursuant to the adoption of ASC 810,
Consolidation
. The holders of securitized debt and securitized debt, non-retained have no recourse to the Company, and the Company does not receive any interest or principal paid on such securitized debt, non-retained. The Company estimates fair value of securitized debt and securitized debt, non-retained as described in Note 5 to these consolidated financial statements.
(h) Fair Value Disclosure
A complete discussion of the methodology utilized by the Company to fair value its financial instruments is included in Note 5 to these consolidated financial statements.
(i) Derivative Financial Instruments and Hedging Activity
The Company’s policies permit it to enter into derivative contracts, including interest rate swaps and interest rate caps, as a means of mitigating its interest rate risk. The Company intends to use interest rate derivative instruments to mitigate interest rate risk rather than to enhance returns. Interest rate swaps are recorded as either assets or liabilities in the consolidated statement of financial condition, and measured at fair value with realized and unrealized gains and losses recognized in earnings. The Company estimates fair value of interest rate swaps as described in Note 5 of these consolidated financial statements.
(j) Sales, Securitizations, and Re-Securitizations
The Company periodically enters into transactions in which it sells financial assets, such as RMBS, mortgage loans and other assets. Gains and losses on sales of assets are computed on the specific identification method whereby the Company records a gain or loss on the difference between the carrying value of the asset and the proceeds from the sale. In addition, the Company from time to time securitizes or re-securitizes assets and sells tranches in the newly securitized assets. These transactions may be recorded as either a sale and the assets contributed to the securitization are removed from the consolidated statements of financial condition and a gain or loss is recognized, or as a financing whereby the assets contributed to the securitization are not derecognized but rather the liabilities issued by the securitization are recorded to reflect the term financing of the assets. In these securitizations and re-securitizations, the Company may retain senior or subordinated interests in the securitized and/or re-securitized assets.
(k) Income Taxes
The Company qualifies to be taxed as a REIT, and therefore it generally will not be subject to corporate, federal, or state income tax to the extent that qualifying distributions are made to stockholders and the REIT requirements, including certain asset, income, distribution and stock ownership tests are met. If the Company failed to qualify as a REIT and did not qualify for certain statutory relief provisions, the Company would be subject to federal, state and local income taxes and may be precluded from qualifying as a REIT for the subsequent four taxable years following the year in which the REIT qualification was lost. The Company and its subsidiary CIM Trading Company LLC made a joint election to treat the subsidiary as a taxable REIT subsidiary. As such, CIM Trading Company LLC is taxable as a domestic C corporation and subject to federal, state, and local income taxes based upon its taxable income.
The provisions of FASB ASC 740,
Income Taxes
, clarify the accounting for uncertainty in income taxes recognized in financial statements and prescribe a recognition threshold and measurement attribute for tax positions taken or expected to be taken on a tax return. FASB ASC 740 also requires that interest and penalties related to unrecognized tax benefits be recognized in financial statements. The Company does not have any unrecognized tax benefits that would affect its financial position. Thus, no accruals for penalties and interest were necessary as of December 31, 2010.
(l) Net Income per Share
The Company calculates basic net income per share by dividing net income for the period by the weighted-average shares of its common stock outstanding for that period. Diluted net income per share takes into account the effect of dilutive instruments, such as stock options, but uses the average share price for the period in determining the number of incremental shares that are to be added to the weighted average number of shares outstanding. The Company had no potentially dilutive securities outstanding during the periods presented.
F-9
(m) Stock-Based Compensation
The Company accounts for stock based compensation awards granted to the employees of FIDAC and its affiliates in accordance with ASC 505-50,
Equity-Based Payments to Non-Employees
. Accounting principles generally accepted in the United States of America (“GAAP”) requires the Company to measure the fair value of the equity instrument using the stock prices and other measurement assumptions as of the earlier of either the date at which a performance commitment by the counterparty is reached or the date at which the counterparty’s performance is complete. Compensation expense related to the grants of stock and stock options is recognized over the vesting period of such grants based on the fair value of the stock on the vesting date.
(n) Use of Estimates
The preparation of the consolidated financial statements in conformity with GAAP requires management to make estimates and assumptions that affect the reported amounts of assets and liabilities and disclosure of contingent assets and liabilities at the date of the financial statements and the reported amounts of revenues and expenses during the reporting period. The most significant estimates are related to the following: all investment securities classified as available-for-sale and interest rate swaps are reported at their estimated fair value; all investment securities are amortized/accreted based on yields that incorporate management’s assumptions as to the expected performance of the investment over time; and the loan loss provision reflects management estimates with regard to expected losses of the securitized loan portfolio. Actual results could differ from those estimates.
(o) Consolidation
The consolidated financial statements include the financial statements of the Company and its subsidiaries. All inter-company balances and transactions have been eliminated in consolidation.
(p) Recent Accounting Pronouncements
Assets
Receivables (ASC 310)
In April 2010, the FASB issued Accounting Standards Update (“ASU”) 2010-18, which addresses the effect of a loan modification when a loan is part of a pool accounted for as a single asset. This update clarifies the treatment of a troubled debt restructuring. This guidance allows acquired assets, which have evidence of credit deterioration upon acquisition and common risk characteristics, to be accounted for in the aggregate as a pool. Upon establishment of the pool, the pool becomes the unit of accounting. Any purchase discount is not allocated to individual loans, thus all of the loans in the pool accrete at a single pool rate based on cash flow projections for the pool. Likewise, impairment analysis is performed on the pool as a whole, not on individual loans. Modifications to loans, even if those modifications are considered troubled debt restructuring, do not result in a loan being removed from the pool. This treatment is consistent with the current accounting practices of the Company and therefore has no material effect on the Company’s consolidated financial statements.
In July 2010, the FASB released ASU 2010-20, which addresses disclosures about the credit quality of financing receivables and the allowance for credit losses. The purpose of this update is to provide greater transparency regarding the allowance for credit losses and the credit quality of financing receivables as well as to assist in the assessment of credit risk exposures and evaluation of the adequacy of allowances for credit losses. Additional disclosures must be provided on a disaggregated basis. The update defines two levels of disaggregation – portfolio segment and class of financing receivable. Additionally, the update requires disclosure of credit quality indicators, past due information and modifications of financing receivables. The update is not applicable to mortgage banking activities (loans originated or purchased for resale to investors); derivative instruments such as repurchase agreements; debt securities; a transferors interest in securitization transactions accounted for as sales under ASC 860; and purchased beneficial interests in securitized financial assets. This update became effective for the Company for interim or annual periods ending on or after December 15, 2010. Adoption of this guidance results in increased footnote disclosure in the Company’s consolidated financial statements.
In January 2011, the FASB released ASU 2011-01, which defers the effective date of disclosures about troubled debt restructurings required in ASU 2010-20. The delay has allowed the FASB time to clarify the guidance for determining what constitutes a troubled debt restructuring. This update does not defer the other disclosure requirements under ASU 2010-20.
F-10
Broad Transactions
Consolidation (ASC 810)
Effective January 1, 2010, the consolidation standards have been amended by ASU 2009-17. This amendment updates the existing standard and eliminates the exemption from consolidation of a Qualified Special Purpose Entity (“QSPE”). The update requires an enterprise to perform an analysis to determine whether the enterprise’s variable interest or interests give it a controlling financial interest in a variable interest entity (“VIE”). The analysis identifies the primary beneficiary of a VIE as the enterprise that has both: a) the power to direct the activities that most significantly impact the entity’s economic performance and b) the obligation to absorb losses of the entity or the right to receive benefits from the entity which could potentially be significant to the VIE. The update requires enhanced disclosures to provide users of financial statements with more transparent information about an enterprises involvement in a VIE. The Company determined it is the primary beneficiary on a number of VIEs formed through re-securitizations. The Company was required to consolidate RMBS re-securitization transactions previously recorded during the year ended December 31, 2009 as sales for GAAP beginning with the effective date of this ASU. Consolidation of these transactions altered the presentation of the consolidated financial statements by increasing its non-Agency portfolio and increasing the value of non-recourse liabilities for which it has no continuing obligation. The consolidation has reversed previously recorded GAAP gains on sales of assets related to the re-securitizations undertaken in 2009. The reversal of this gain will be accreted over the remaining life of the re-securitized assets. The adoption of this guidance has resulted in material changes to the format and content of the Company’s consolidated financial statements, as well as enhanced disclosures as described in Note 8 to these consolidated financial statements.
Derivatives and Hedging (ASC 815)
The FASB issued ASU 2010-8 in February 2010 and provided technical corrections to ASC 815. This update provides a four step analysis to determine whether call or put options that can accelerate the settlement of debt instruments should be considered clearly and closely related to the debt host contract. If it is determined that such option is closely related to the host contract, bifurcation of the host contract from the derivative instrument is not necessary. If an existing hybrid instrument requires bifurcation under this update, a one-time election can be made to utilize the Fair Value Option for the entire contract. This update was effective for the Company January 1, 2010 and continues to have no effect on the consolidated financial statements.
ASU 2010-11 was issued in March 2010 and defined a scope exception for embedded derivative features which involve only the transfer of credit risk that is only in the form of subordination of one financial instrument to another. Such instruments would not be subject to bifurcation under ASC 815. This guidance is effective for the first quarter beginning after June 15, 2010, however early adoption for the first fiscal quarter is allowed. The Company elected to early adopt for the first quarter of 2010. Adoption has had no effect on the consolidated financial statements.
Fair Value Measurements and Disclosures (ASC 820)
In January 2010, FASB issued ASU 2010-06 which increases disclosures regarding the fair value of assets. The key provisions of this guidance include the requirement to disclose separately the amounts of significant transfers in and out of Level 1 and Level 2 including a description of the reason for the transfers. Previously this was only required of transfers between Level 2 and Level 3 assets. Further, reporting entities are required to provide fair value measurement disclosures for each class of assets and liabilities; a class is potentially a subset of the assets or liabilities within a line item in the statement of financial position. Additionally, disclosures about the valuation techniques and inputs used to measure fair value for both recurring and nonrecurring fair value measurements are required for either Level 2 or Level 3 assets. This portion of the guidance is effective for the Company beginning January 1, 2010. Adoption of this guidance resulted in increased footnote disclosure in the Company’s consolidated financial statements. The guidance also requires that the disclosure on any Level 3 assets presents separately information about purchases, sales, issuances and settlements. In other words, Level 3 assets are presented on a gross basis rather than as one net number. However, this last portion of the guidance is not effective for the Company until January 1, 2011. Adoption of this portion of ASU 2010-06 will result in increased footnote disclosure in the Company’s consolidated financial statements.
F-11
Subsequent Events (ASC 855)
In February 2010, the FASB issued ASU 2010-09 as an amendment to ASC 855. This update eliminated the requirement to provide a specific date through which subsequent events were evaluated. The purpose of this update was to alleviate potential conflicts between ASC 855 and SEC reporting requirements. The update was effective upon issuance.
Transfers and Servicing (ASC 860)
On June 12, 2009, the FASB issued ASU 2009-16, an amendment update to the accounting standards governing the transfer and servicing of financial assets. This amendment updated the existing standard and eliminated the concept of a QSPE, clarified the surrendering of control to effect sale treatment and modified the financial components approach – limiting the circumstances in which a financial asset or portion thereof should be derecognized when the transferor maintains continuing involvement. It defined the term “Participating Interest”. Under this standard update, the transferor must recognize and initially measure at fair value all assets obtained and liabilities incurred as a result of a transfer, including any retained beneficial interest. Additionally, the amendment required enhanced disclosures regarding the transferors risk associated with continuing involvement in any transferred assets. The amendment was effective beginning January 1, 2010. The Company has determined the amendment had a material impact on the consolidated financial statements. See discussion under Consolidation (ASC 810) above.
The following tables present the principal value, unamortized premium, unamortized discount, gross unrealized gain, gross unrealized loss, and fair value of the Company’s available-for-sale RMBS portfolio as of December 31, 2010 and 2009, at fair value by asset class. The RMBS portfolio is composed of Agency and non-Agency RMBS collateralized by residential mortgage loans. The Agency RMBS are mortgage pass-through certificates, CMOs, and other mortgage-backed securities representing interests in or obligations backed by pools of mortgage loans issued or guaranteed by Fannie Mae, Freddie Mac, or Ginnie Mae. The non-Agency RMBS portfolio is not issued or guaranteed by Fannie Mae, Freddie Mac, or Ginnie Mae and is therefore subject to credit risk. The Company classifies its non-Agency RMBS into senior, subordinated, and senior, non-retained interests. Senior interests in non-Agency RMBS are considered to be entitled to the first principal repayments in their pro-rata ownership interests. At December 31, 2010 the non-Agency RMBS portfolio included $5.9 billion in notional Interest Only (“IO”) senior securities and $305.0 million in notional IO subordinated securities. At December 31, 2009 the non-Agency RMBS portfolio includes $379.0 million in notional IO subordinated securities. Securities identified as senior, non-retained have been consolidated pursuant to the adoption of ASC 810. See Note 8 of these consolidated financial statements for a detailed discussion.
F-12
|
December 31, 2010
|
||||||||||||||||||||||||
|
(dollars in thousands)
|
||||||||||||||||||||||||
|
Principal Value
|
Unamortized
Premium
|
Unamortized
Discount
|
Gross Unrealized
Gain
|
Gross Unrealized
Loss
|
Fair Value
|
|||||||||||||||||||
|
Non-Agency RMBS
|
||||||||||||||||||||||||
|
Senior
|
$ | 664,251 | $ | 420,657 | $ | (9,320 | ) | $ | 21,758 | $ | (109,661 | ) | $ | 987,685 | ||||||||||
|
Subordinated
|
4,962,829 | 58,298 | (2,789,906 | ) | 206,189 | (226,552 | ) | 2,210,858 | ||||||||||||||||
|
Senior, non-retained
|
2,008,167 | 79,730 | (109,619 | ) | 428,213 | (75,923 | ) | 2,330,568 | ||||||||||||||||
|
Agency RMBS
|
2,035,823 | 67,134 | - | 47,717 | (17,090 | ) | 2,133,584 | |||||||||||||||||
|
Total
|
$ | 9,671,070 | $ | 625,819 | $ | (2,908,845 | ) | $ | 703,877 | $ | (429,226 | ) | $ | 7,662,695 | ||||||||||
|
December 31, 2009
|
||||||||||||||||||||||||
|
(dollars in thousands)
|
||||||||||||||||||||||||
|
Principal Value
|
Unamortized
Premium
|
Unamortized
Discount
|
Gross Unrealized
Gain
|
Gross Unrealized
Loss
|
Fair Value
|
|||||||||||||||||||
|
Non-Agency RMBS
|
||||||||||||||||||||||||
|
Senior
|
$ | 2,757,212 | $ | 1,536 | $ | (628,210 | ) | $ | 83,946 | $ | (192,078 | ) | $ | 2,022,406 | ||||||||||
|
Subordinated
|
1,616,031 | 10,346 | (1,239,769 | ) | 65,996 | (76,145 | ) | 376,459 | ||||||||||||||||
|
Agency RMBS
|
1,616,450 | 55,081 | (29 | ) | 20,767 | (2,240 | ) | 1,690,029 | ||||||||||||||||
|
Total
|
$ | 5,989,693 | $ | 66,963 | $ | (1,868,008 | ) | $ | 170,709 | $ | (270,463 | ) | $ | 4,088,894 | ||||||||||
The following tables present the gross unrealized losses and estimated fair value of the Company’s RMBS by length of time that such securities have been in a continuous unrealized loss position at December 31, 2010 and 2009. The securities in an unrealized loss position have been evaluated by the Company for OTTI as discussed in the paragraphs following these tables. Five securities have been in a continuous unrealized loss position for greater than twelve months, all of which are subordinated interests held by the Company that, although performing in line with the Company’s expectations, are in unrealized loss position due to significant market value declines consistent with similar asset classes as a result of the credit crisis.
F-13
|
December 31, 2010
|
||||||||||||||||||||||||
|
(dollars in thousands)
|
||||||||||||||||||||||||
|
Unrealized Loss Position For:
|
||||||||||||||||||||||||
|
Less than 12 Months
|
12 Months or More
|
Total
|
||||||||||||||||||||||
|
RMBS
|
Estimated Fair
Value
|
Unrealized
Losses
|
Estimated Fair
Value
|
Unrealized
Losses
|
Estimated Fair
Value
|
Unrealized
Losses
|
||||||||||||||||||
|
Non-Agency RMBS
|
||||||||||||||||||||||||
| Senior | $ | 549,968 | $ | (109,662 | ) | $ | - | $ | - | $ | 549,968 | $ | (109,662 | ) | ||||||||||
| Subordinated | 1,178,493 | (217,224 | ) | 12,826 | (9,328 | ) | 1,191,319 | (226,552 | ) | |||||||||||||||
| Senior, non-retained | 764,724 | (75,923 | ) | - | - | 764,724 | (75,923 | ) | ||||||||||||||||
|
Agency
|
600,464 | (17,090 | ) | - | - | 600,464 | (17,090 | ) | ||||||||||||||||
|
Total
|
$ | 3,093,649 | $ | (419,899 | ) | $ | 12,826 | $ | (9,328 | ) | $ | 3,106,475 | $ | (429,227 | ) | |||||||||
|
December 31, 2009
|
||||||||||||||||||||||||
|
(dollars in thousands)
|
||||||||||||||||||||||||
|
Unrealized Loss Position For:
|
||||||||||||||||||||||||
|
Less than 12 Months
|
12 Months or More
|
Total
|
||||||||||||||||||||||
|
RMBS
|
Estimated Fair
Value
|
Unrealized
Losses
|
Estimated Fair
Value
|
Unrealized
Losses
|
Estimated Fair
Value
|
Unrealized
Losses
|
||||||||||||||||||
|
Non-Agency RMBS
|
||||||||||||||||||||||||
| Senior | $ | 539,579 | $ | (38,466 | ) | $ | 489,670 | $ | (153,613 | ) | $ | 1,029,249 | $ | (192,079 | ) | |||||||||
| Subordinated | 179,226 | (72,438 | ) | 5,862 | (3,707 | ) | 185,088 | (76,145 | ) | |||||||||||||||
|
Agency
|
682,681 | (2,240 | ) | - | - | 682,681 | (2,240 | ) | ||||||||||||||||
|
Total
|
$ | 1,401,486 | $ | (113,144 | ) | $ | 495,532 | $ | (157,320 | ) | $ | 1,897,018 | $ | (270,464 | ) | |||||||||
The Company recorded a $12.7 million other-than-temporary credit impairment during the year ended December 31, 2010 on investments where the expected future cash flows of certain non-Agency RMBS were less than their amortized cost basis. The impairment recorded during the year ended December 31, 2010 was related to thirty-eight securities. The impaired investments were interests in non-Agency RMBS. As of December 31, 2010, the impaired securities had cumulative losses ranging from 0% up to 14%, three-month prepayments speeds between 0 and 69 Constant Prepayment Rate (“CPR”), 60+ day delinquencies between 0% and 32% of the pool balance, and weighted average FICO scores on the pools between 666 and 753.
The Company evaluates each investment in its RMBS portfolio for OTTI quarterly or more often if market conditions warrant. The amortized cost of each investment in an unrealized loss position is compared to the present value of expected future cash flows of the position. In estimating future cash flows, the Company evaluated the non-Agency RMBS for OTTI by considering delinquencies, credit losses, loss severities, prepayment speeds, geographic data, borrower characteristics, loan to value ratios, seasoning and credit support in conjunction with broader macroeconomic expectations such as home price depreciation, expectations of future delinquencies and loss severities and the ability of the borrower to refinance or modify their loans. If after determining the expected future cash flows of the position, the amortized cost of the security is less than the present value of its expected future cash flows, an other-than-temporary credit impairment has occurred. If the Company does not intend to sell and is not more likely than not required to sell the debt security prior to its anticipated recovery, the credit loss, if any, is recognized in the statement of operations, while the balance of impairment related to other factors is recognized in Other Comprehensive Income (Loss). If the Company intends to sell the debt security, or will be more likely than not required to sell the security before its anticipated recovery, the full unrealized loss is recognized in the statement of operations. The determination cannot be overcome by management judgment of the probability of collecting all cash flows previously projected. A summary of the OTTI included in earnings for the years ended December 31, 2010, 2009 and 2008 is presented below.
F-14
| For the Year Ended | ||||||||||||
|
December 31, 2010
|
December 31, 2009
|
December 31, 2008
|
||||||||||
| (dollars in thousands) | ||||||||||||
|
Cumulative credit loss beginning balance
|
$ | 9,996 | $ | - | $ | - | ||||||
|
Additions:
|
||||||||||||
|
Other-than-temporary impairments not previously recognized
|
9,437 | 9,567 | - | |||||||||
|
Increases related to other-than-temporary impairments on securities with
previously recognized other-than-temporary impairments
|
3,241 | 429 | - | |||||||||
|
Cumulative credit loss ending balance
|
$ | 22,674 | $ | 9,996 | $ | - | ||||||
The following table presents details of each asset class in the Company’s RMBS portfolio at December 31, 2010
and 2009
. The principal or notional value represents the interest income earning balance of each class. The weighted average amortized cost, fair value, coupon, yield, and CPR at period-end are weighted by each investment’s respective principal/notional value in the asset class. The figure presenting the annualized yield over the current quarter is the annualized interest income earned on the asset class during the quarter, divided by the average of the beginning and ending amortized cost of the asset class.
| December 31, 2010 | ||||||||||||||||||||||||||||
|
Principal or
Notional
Value at
Period-End
|
Weighted
Average
Amortized
Cost Basis at
Period-End
|
Weighted
Average Fair
Value at
Period-End
|
Weighted
Average
Coupon at
Period-End
|
Weighted
Average
Yield (Loss
Adjusted) at
Period-End
|
Annualized
Yield Over
Current Quarter
|
Weighted
Average 3
Month CPR
at Period-End
|
||||||||||||||||||||||
| Non-Agency Mortgage-Backed Securities |
|
|||||||||||||||||||||||||||
|
Senior
|
664,251 | $ | 99.64 | $ | 101.56 | 4.48 | % | 4.65 | % | 5.73 | % | 16 | % | |||||||||||||||
|
Senior, interest only
|
5,929,634 | $ | 6.98 | $ | 5.28 | 1.74 | % | 14.71 | % | 29.03 | % | 16 | % | |||||||||||||||
|
Subordinated
|
4,962,829 | $ | 44.35 | $ | 43.88 | 4.11 | % | 16.78 | % | 25.63 | % | 15 | % | |||||||||||||||
|
Subordinated, interest only
|
304,993 | $ | 9.93 | $ | 10.81 | 3.03 | % | 27.60 | % | 24.62 | % | 16 | % | |||||||||||||||
|
Senior, non-retained
|
2,008,167 | $ | 98.51 | $ | 116.05 | 5.17 | % | 4.36 | % | 6.85 | % | 15 | % | |||||||||||||||
|
Agency Mortgage-Backed
Securities
|
2,092,465 | $ | 103.30 | $ | 104.80 | 5.05 | % | 4.51 | % | 3.34 | % | 24 | % | |||||||||||||||
The Company’s investment guidelines place no restrictions on the credit rating of the assets the Company is able to hold in its portfolio. The portfolio is most heavily weighted to contain RMBS with credit risk. The Company chooses assets for the portfolio after carefully evaluating each investment’s risk profile.
|
December 31, 2010
|
December 31, 2009
|
|||||||
|
AAA
|
41.25 | % | 39.41 | % | ||||
|
AA
|
7.91 | % | 0.75 | % | ||||
| A | 1.92 | % | 0.55 | % | ||||
|
BBB
|
0.80 | % | 1.07 | % | ||||
|
BB
|
0.01 | % | 1.77 | % | ||||
| B | 0.01 | % | 2.18 | % | ||||
|
Below B or not rated
|
48.10 | % | 54.27 | % | ||||
|
Total
|
100.00 | % | 100.00 | % | ||||
The table above reflects the credit rating of the Company’s consolidated RMBS portfolio. At December 31, 2010, approximately 20% of the AAA, AA, and A securities balance reflected in the table above include senior, non-retained, non-Agency RMBS.
The AAA rated assets in the RMBS portfolio are predominantly Agency RMBS and senior non-retained non-Agency RMBS. As the Company securitizes or re-securitizes assets, it expects the Below B or not rated percentages in the portfolio to increase as the Company typically retains the subordinated tranches of these types of transactions.
F-15
Actual maturities of mortgage-backed securities are generally shorter than stated contractual maturities. Actual maturities of the Company’s RMBS are affected by the contractual lives of the underlying mortgages, periodic payments of principal and prepayments of principal. The following tables summarize the Company’s RMBS at December 31, 2010 and 2009 according to their estimated weighted-average life classifications. The weighted-average lives of the mortgage-backed securities at December 31, 2010 and 2009 in the tables below are based on consensus constant prepayment speeds. The prepayment model considers current yield, forward yield, steepness of the interest rate curve, current mortgage rates, mortgage rates of the outstanding loan, loan age, margin and volatility.
|
December 31, 2010
|
||||||||||||||||
|
(dollars in thousands)
|
||||||||||||||||
|
Less than one
year
|
Weighted Average Life
Greater than one
year and less
than five years
|
Greater than five
years
|
Total
|
|||||||||||||
|
Fair value
|
||||||||||||||||
|
Non-Agency RMBS
|
||||||||||||||||
|
Senior
|
$ | 26,962 | $ | 587,075 | $ | 373,648 | $ | 987,685 | ||||||||
|
Subordinated
|
7,941 | 218,986 | 1,983,931 | 2,210,858 | ||||||||||||
|
Senior, non-retained
|
200,468 | 1,889,732 | 240,368 | 2,330,568 | ||||||||||||
|
Agency RMBS
|
- | 1,560,859 | 572,725 | 2,133,584 | ||||||||||||
|
Total fair value
|
$ | 235,371 | $ | 4,256,652 | $ | 3,170,672 | $ | 7,662,695 | ||||||||
|
Amortized cost
|
||||||||||||||||
|
Non-Agency RMBS
|
||||||||||||||||
|
Senior
|
$ | 26,920 | $ | 584,859 | $ | 463,810 | $ | 1,075,589 | ||||||||
|
Subordinated
|
11,076 | 253,558 | 1,966,587 | 2,231,221 | ||||||||||||
|
Senior, non-retained
|
251,579 | 1,500,955 | 225,744 | 1,978,278 | ||||||||||||
|
Agency RMBS
|
- | 1,513,644 | 589,313 | 2,102,957 | ||||||||||||
|
Total amortized cost
|
$ | 289,575 | $ | 3,853,016 | $ | 3,245,454 | $ | 7,388,045 | ||||||||
|
December 31, 2009
|
||||||||||||||||
|
(dollars in thousands)
|
||||||||||||||||
|
Less than one
year
|
Weighted Average Life
Greater than one
year and less
than five years
|
Greater than five
years
|
Total
|
|||||||||||||
|
Fair value
|
||||||||||||||||
|
Non-Agency RMBS
|
||||||||||||||||
|
Senior
|
$ | 20,533 | $ | 1,520,809 | $ | 481,065 | $ | 2,022,407 | ||||||||
|
Subordinated
|
137 | 204,481 | 171,840 | 376,458 | ||||||||||||
|
Agency RMBS
|
- | 1,690,029 | - | 1,690,029 | ||||||||||||
|
Total fair value
|
$ | 20,670 | $ | 3,415,319 | $ | 652,905 | $ | 4,088,894 | ||||||||
|
Amortized cost
|
||||||||||||||||
|
Non-Agency RMBS
|
||||||||||||||||
|
Senior
|
$ | 20,549 | $ | 1,631,461 | $ | 478,530 | $ | 2,130,540 | ||||||||
|
Subordinated
|
76 | 244,937 | 141,594 | 386,607 | ||||||||||||
|
Agency RMBS
|
- | 1,671,502 | - | 1,671,502 | ||||||||||||
|
Total amortized cost
|
$ | 20,625 | $ | 3,547,900 | $ | 620,124 | $ | 4,188,649 | ||||||||
F-16
The non-Agency RMBS portfolio is subject to credit risk. The Company seeks to mitigate credit risk through its asset selection process. The non-Agency RMBS portfolio is primarily collateralized by what the Company classifies as Alt-A first lien mortgages. The Company categorizes collateral as Alt-A regardless of whether the loans were originally described as “prime” if the behavior of the collateral when the Company purchased the security more typically resembles Alt-A. The Company defines Alt-A collateral characteristics to be when the 60+ day delinquency bucket of the pool is greater than 5% and weighted average FICO scores are greater than 650 at origination. At December 31, 2010, 99% of the non-Agency RMBS are Alt-A collateral. At December 31, 2009, 78% of the non-Agency RMBS were Alt-A collateral. The non-Agency securities contained in this portion of the portfolio have the following collateral characteristics at December 31, 2010 and 2009.
|
December 31, 2010
|
December 31, 2009
|
||||
|
Number of securities in portfolio
|
581
|
209
|
|||
|
Weighted average maturity (years)
|
27.4
|
28.5
|
|||
|
Weighted average amortized loan to value
|
72.5%
|
73.8%
|
|||
|
Weighted average FICO
|
717.3
|
715.7
|
|||
|
Weighted average loan balance (in thousands)
|
$447.6
|
$415.9
|
|||
|
Weighted average percentage owner occupied
|
83.3%
|
82.8%
|
|||
|
Weighted average percentage single family residence
|
63.1%
|
59.9%
|
|||
|
Weighted average current credit enhancement
|
16.0%
|
12.2%
|
|||
|
Weighted average geographic concentration
|
CA
|
57.8%
|
CA
|
44.8%
|
|
|
FL
|
13.3%
|
FL
|
17.3%
|
||
|
NY
|
7.3%
|
NY
|
7.5%
|
||
|
NJ
|
3.9%
|
MD
|
4.9%
|
||
|
VA
|
3.3%
|
NJ
|
4.4%
|
||
The information presented in the table above includes senior, non-retained, non-Agency RMBS consolidated pursuant to the adoption of ASC 810 on January 1, 2010 by the Company.
The table below presents origination year for the Company’s portfolio of non-Agency RMBS at December 31, 2010 and 2009.
|
Origination Year as a Percentage of
Outstanding Principal Balance
|
December 31, 2010
|
December 31, 2009
|
||||||
|
2004
|
0.1 | % | 0.0 | % | ||||
|
2005
|
13.4 | % | 8.7 | % | ||||
|
2006
|
27.0 | % | 36.7 | % | ||||
|
2007
|
56.1 | % | 50.8 | % | ||||
|
2008
|
3.3 | % | 3.8 | % | ||||
|
2009
|
0.1 | % | 0.0 | % | ||||
|
Total
|
100.0 | % | 100.0 | % | ||||
On January 29, 2010, the Company transferred $1.7 billion in principal value of its RMBS to the CSMC 2010-1R Trust in a re-securitization transaction. This transaction was recorded as a “secured borrowing” pursuant to ASC Topics 860 and 810. In this transaction, the Company financed through the transaction $271.6 million of AAA-rated fixed rate bonds to third party investors for net proceeds of $268.1 million. The Company retained $391.9 million of AAA-rated bonds, $1.0 billion in subordinated bonds and the owner trust certificate, and interest only bonds with a notional value of $1.6 billion on the date of transfer. The subordinated bonds and the owner trust certificate provide credit support to the AAA-rated bonds. The bonds issued by the trust are collateralized by RMBS that were transferred to the CSMC 2010-1R Trust.
On April 30, 2010, the Company transferred $566.6 million in principal value of its RMBS to the CSMC 2010-11R Trust in a re-securitization transaction. This transaction was recorded as a “secured borrowing” pursuant to ASC Topics 860 and 810. In this transaction, the Company financed through the transaction $138.8 million of AAA-rated fixed rate bonds to third party investors for net proceeds of $137.4 million. The Company retained $427.7 million in subordinated bonds and the owner trust certificate, and interest only bonds with a notional value of $566.6 million on the date of transfer. The subordinated bonds and the owner trust certificate provide credit support to the AAA-rated bonds. The bonds issued by the trust are collateralized by RMBS that were transferred to the CSMC 2010-11R Trust.
F-17
On May 27, 2010, the Company transferred $1.2 billion in principal value of its RMBS to the CSMC 2010-12R Trust in a re-securitization transaction. This transaction was recorded as a “secured borrowing” pursuant to ASC Topics 860 and 810. In this transaction, the Company financed through the transaction $294.0 million of AAA-rated fixed rate bonds to third party investors for net proceeds of $294.3 million. The Company retained $136.3 million of AAA-rated bonds, $788.2 million in subordinated bonds and the owner trust certificate, and interest only bonds with a notional value of $1.2 billion on the date of transfer. The subordinated bonds and the owner trust certificate provide credit support to the AAA-rated bonds. The bonds issued by the trust are collateralized by RMBS that were transferred to the CSMC 2010-12R Trust.
On March 11, 2009, the Company transferred $281.9 million in principal value of its RMBS to the JMAC 2009-R2 Trust in a re-securitization transaction. In this transaction, the Company sold $49.4 million of AAA-rated floating rate bonds to third party investors and realized a loss on the sale of approximately $119 thousand. The Company retained $143.1 million of AAA-rated bonds, $89.4 million in subordinated bonds and the owner trust certificate. The subordinated bonds and the owner trust certificate provide credit support to the AAA-rated bonds. The bonds issued by the trust are collateralized by RMBS that have been transferred to the JMAC 2009-R2 Trust.
On July 30, 2009, the Company transferred $1.5 billion in principal value of its RMBS to the JPMRT 2009-7 Trust in a re-securitization transaction. In this transaction, the Company sold $166.3 million of AAA-rated fixed and floating rate bonds to third party investors and realized a gain on the sale of approximately $7.3 million. The Company retained $690.6 million of AAA-rated bonds, $665.5 million in subordinated bonds and the owner trust certificate. The subordinated bonds and the owner trust certificate provide credit support to the AAA-rated bonds. The bonds issued by the trust are collateralized by RMBS that have been transferred to the JPMRT 2009-7 Trust.
On September 30, 2009, the Company transferred $1.7 billion in principal value of its RMBS to the CMSC 2009-12R Trust in a re-securitization transaction. In this transaction, the Company sold $260.6 million of AAA-rated fixed and floating rate bonds to third party investors and realized a gain on sale of approximately $5.2 million. The Company retained $655.0 million of AAA-rated bonds, $815.1 million in subordinated bonds and the owner trust certificate. The subordinated bonds and the owner trust certificate provide credit support to the AAA-rated bonds. The bonds issued by the trust are collateralized by RMBS that have been transferred to the CSMC 2009-12R Trust.
During the year ended December 31, 2010, the Company sold RMBS with a carrying value of $885.4 million for realized gains of $10.1 million. During the year ended December 31, 2009, the Company sold RMBS with a carrying value of $1.8 billion for realized gains of $103.6 million.
In addition, during the year ended December 31, 2010, the Company recorded non-recourse financing with third party investors related to re-securitizations executed in prior periods. The Company financed through these transactions $704.5 million of AAA-rated fixed rate bonds with third party investors for net proceeds of $703.0 million. In total, in 2010, the Company financed through its secured debt financing $1.3 billion of AAA-rated fixed rate bonds for net proceeds of $1.3 billion. During the year ended December 31, 2009, the Company recorded no non-recourse financing with third party investors.
The following table represents the Company’s securitized residential mortgage loans classified as held for investment at December 31, 2010 and 2009. At December 31, 2010, approximately 56% of the Company’s securitized loans are adjustable rate mortgage loans and 44% are fixed rate mortgage loans. All of the adjustable rate loans held for investment are hybrid adjustable rate mortgages (“ARMs”). Hybrid ARMs are mortgages that have interest rates that are fixed for an initial period (typically three, five, seven or ten years) and thereafter reset at regular intervals subject to interest rate caps. The periodic cap on all hybrid ARMs in the securitized loan portfolio range from 0.00% to 3.00% for the years ended December 31, 2010 and 2009, respectively. The securitized loans held for investment are carried at their principal balance outstanding, plus premiums or discounts, less an allowance for loan losses.
F-18
|
December 31, 2010
|
December 31, 2009
|
|||||||
| (dollars in thousands) | ||||||||
|
Securitized loans, at amortized cost
|
$ | 360,118 | $ | 475,084 | ||||
|
Less: allowance for loan losses
|
6,586 | 4,551 | ||||||
|
Securitized loans held for investment
|
$ | 353,532 | $ | 470,533 | ||||
The securitized loan portfolio is collateralized by prime, jumbo, first lien residential mortgages of which 56% were originated during 2008 and 42% were originated during 2007 and the remaining 2% of the loans were originated prior to 2007. A summary of key characteristics of these loans follows.
|
December 31, 2010
|
December 31, 2009
|
||||
|
Number of loans
|
513
|
681
|
|||
|
Weighted average maturity (years)
|
26.6
|
27.2
|
|||
|
Weighted average amortized loan to value
|
74.5%
|
73.0%
|
|||
|
Weighted average FICO
|
755
|
756
|
|||
|
Weighted average loan balance (in thousands)
|
$694.3
|
$690.1
|
|||
|
Weighted average percentage owner occupied
|
90.5%
|
90.9%
|
|||
|
Weighted average percentage single family residence
|
58.2%
|
60.0%
|
|||
|
Weighted average geographic concentration
|
CA
|
33.3%
|
CA
|
33.8%
|
|
|
FL
|
6.7%
|
FL
|
6.4%
|
||
|
NJ
|
5.3%
|
NJ
|
6.3%
|
||
|
IL
|
5.3%
|
IL
|
6.0%
|
||
|
AZ
|
5.2%
|
VA
|
4.8%
|
||
The following table summarizes the changes in the allowance for loan losses for the securitized mortgage loan portfolio during the years ended December 31, 2010, 2009 and 2008:
|
December 31, 2010
|
December 31, 2009
|
December 31, 2008
|
||||||||||
| (dollars in thousands) | ||||||||||||
|
Balance, beginning of period
|
$ | 4,551 | $ | 1,621 | $ | 81 | ||||||
|
Provision for loan losses
|
2,689 | 3,102 | 1,540 | |||||||||
|
Charge-offs
|
(654 | ) | (172 | ) | - | |||||||
|
Balance, end of period
|
$ | 6,586 | $ | 4,551 | $ | 1,621 | ||||||
On a quarterly basis, the Company evaluates the adequacy of its allowance for loan losses which is calculated to reflect management’s estimate of possible losses in the securitized loan portfolio at the reporting date. The Company’s provision for loan losses considers the quality of the collateral, performance of like collateral, and expectations of future market conditions as described more fully in Note 2(e). The Company’s provision for loan losses is calculated on the outstanding principal balance of the portfolio, 60+ day delinquencies for like collateral and current and expected severities for similarly underwritten loans. The Company’s allowance for loan losses at December 31, 2010 was $6.6 million, representing 185 basis points of the principal balance of the Company’s securitized mortgage loan portfolio. The Company’s allowance for loan losses at December 31, 2009 was $4.6 million, representing 97 basis points of the principal balance of the Company’s securitized loan portfolio. At December 31, 2010, 3.12% of the securitized loans held for investment were greater than 60 days delinquent and 0.93% were in some stage of bankruptcy, foreclosure, or were real estate owned. At December 31, 2009, 1.82% of the securitized loans held for investment were greater than 60 days delinquent and 0.89% were in some stage of bankruptcy, foreclosure, or real estate owned.
GAAP defines fair value, establishes a framework for measuring fair value, establishes a three-level valuation hierarchy for disclosure of fair value measurement and enhances disclosure requirements for fair value measurements. The valuation hierarchy is based upon the transparency of inputs to the valuation of an asset or liability as of the measurement date. The three levels are defined as follows:
F-19
Level 1 – inputs to the valuation methodology are quoted prices (unadjusted) for identical assets and liabilities in active markets.
Level 2 – inputs to the valuation methodology include quoted prices for similar assets and liabilities in active markets, and inputs that are observable for the asset or liability, either directly or indirectly, for substantially the full term of the financial instrument.
Level 3 – inputs to the valuation methodology are unobservable and significant to fair value.
The following discussion describes the methodologies utilized by the Company to fair value its financial instruments by instrument class.
Short-term Instruments
The carrying value of cash and cash equivalents, accrued interest receivable, dividends payable, accounts payable, and accrued interest payable generally approximates estimated fair value due to the short term nature of these financial instruments.
Non-Agency and Agency RMBS
Generally, the Company determines the fair value of its investment securities utilizing a pricing model that incorporates such factors as coupon, prepayment speeds, weighted average life, collateral composition, borrower characteristics, expected interest rates, life caps, periodic caps, reset dates, collateral seasoning, expected losses, expected default severity, credit enhancement, and other pertinent factors. Certain very liquid asset classes, such as Agency fixed-rate pass-throughs may be priced using independent sources such as quoted prices for “To-Be-Announced” securities. Management reviews the fair values generated by the model to determine whether prices are reflective of the current market. Management performs a validation of the fair value calculated by the pricing model by comparing its results to independent prices provided by dealers in the securities and/or third party pricing services. The Company believes the observable inputs used in its model in conjunction with dealer and/or third party pricing services meets the criteria for classification as Level 2.
Non-Agency, Non-Retained RMBS
The non-Agency, non-retained securities reflected in the consolidated financial statements are securities consolidated pursuant to the Company’s adoption of ASC 860 and ASC 810 on January 1, 2010. These assets have been financed with third parties without recourse to the Company in the normal course of the Company’s portfolio optimization strategy. The Company fair values these assets as described above in
Non-Agency and Agency RMBS.
See Note 8 to these consolidated financial statements for a detailed discussion of these securities.
Interest Rate Swaps
The Company obtains quotations from third parties to determine the fair values of its interest rate swaps. The Company compares the third party quotations received to its own estimate of fair value to evaluate for reasonableness. The dealer quotes will incorporate common market pricing methods, including a spread measurement to the Treasury curve or interest rate swap curve as well as underlying characteristics of the particular contract. Interest rate swaps are modeled by the Company by incorporating such factors as the term to maturity, Treasury curve, LIBOR rates, and the payment rates on the fixed portion of the interest rate swaps.
Any changes to the valuation methodology are reviewed by management to ensure the changes are appropriate. As markets and products develop and the pricing for certain products becomes more transparent, the Company will continue to refine its valuation methodologies. The methods used to produce a fair value calculation may not be indicative of net realizable value or reflective of future fair values. Furthermore, while the Company believes its valuation methods are appropriate and consistent with other market participants, the use of different methodologies, or assumptions, to determine the fair value of certain financial instruments could result in a different estimate of fair value at the reporting date. The Company uses inputs that are current as of the measurement date, which may include periods of market dislocation, during which price transparency may be reduced.
During times of market dislocation, as has been experienced for some time, the observability of prices and inputs can be reduced for certain instruments. If dealers or independent pricing services are unable to provide a price for an asset, or if the price provided by them is deemed unreliable by the Company, then the asset will be valued at its fair value as determined in good faith by the Company. In addition, validating third party pricing for the Company’s investments may be more subjective as fewer participants may be willing to provide this service to the Company. Illiquid investments typically experience greater price volatility as a ready market does not exist. As fair value is not an entity-specific measure and is a market-based approach which considers the value of an asset or liability from the perspective of a market participant, observability of prices and inputs can vary significantly from period to period. A condition such as this can cause instruments to be reclassified from Level 1 to Level 2 or Level 2 to Level 3 when the Company is unable to obtain third party pricing verification.
F-20
If at the valuation date, the fair value of an investment security is less than its amortized cost at the date of the consolidated statement of financial condition, the Company analyzes the investment security for OTTI. Management evaluates the Company’s RMBS for OTTI at least on a quarterly basis, and more frequently when economic or market concerns warrant such evaluation. Consideration is given to (1) the length of time and the extent to which the fair value has been lower than carrying value, (2) the intent of the Company to sell the investment prior to recovery in fair value (3) whether the Company will more likely than not be required to sell the investment before the expected recovery, and (4) the expected future cash flows of the investment in relation to its amortized cost. Unrealized losses on assets that are considered OTTI due to credit are recognized in earnings and the cost basis of the assets are adjusted.
At December 31, 2010, the Company has classified its assets and liabilities as Level 2. At December 31, 2009, the Company classified its assets as Level 2. The Company’s financial assets and liabilities carried at fair value on a recurring basis are valued at December 31, 2010 and 2009 as presented below.
|
December 31, 2010
|
||||||||||||
|
Level 1
|
Level 2
|
Level 3
|
||||||||||
|
(dollars in thousands)
|
||||||||||||
|
Assets:
|
||||||||||||
|
Non-Agency RMBS
|
||||||||||||
| Senior | $ | - | $ | 987,685 | $ | - | ||||||
| Subordinated | - | 2,210,858 | - | |||||||||
| Senior, non-retained | - | 2,330,568 | - | |||||||||
|
Agency mortgage-backed securities
|
- | 2,133,584 | - | |||||||||
|
Liabilities:
|
||||||||||||
|
Interest rate swaps
|
- | 9,988 | - | |||||||||
|
December 31, 2009
|
||||||||||||
|
Level 1
|
Level 2
|
Level 3
|
||||||||||
|
(dollars in thousands)
|
||||||||||||
|
Assets:
|
||||||||||||
|
Non-Agency RMBS
|
||||||||||||
| Senior | $ | - | $ | 2,022,406 | $ | - | ||||||
| Subordinated | - | 376,459 | - | |||||||||
| Senior, non-retained | - | - | - | |||||||||
|
Agency mortgage-backed securities
|
- | 1,690,029 | - | |||||||||
In the aggregate, the Company’s fair valuations of RMBS investments were 0.02% lower than the aggregated dealer marks for the year ended December 31, 2010 and 1.05% lower than the aggregated dealer marks for the year ended December 31, 2009.
Securitized Loans Held for Investment
The Company records securitized loans held for investment when it securitizes loans and records the transaction as a “financing.” The Company carries securitized loans held for investment at principal value, plus premiums or discounts paid, less an allowance for loan losses. The Company estimates the fair value of its securitized loans held for investment at the loss adjusted expected future cash flows of the collateral. The Company models each underlying asset by considering, among other items, the nature of the underlying collateral, coupon, servicer, actual and expected defaults, actual and expected default severities, reset indices, and prepayment speeds in conjunction with market research for similar collateral performance and management’s expectations of general economic conditions in the sector and greater economy.
Repurchase Agreements
The Company records repurchase agreements at their contractual amounts including accrued interest payable. Repurchase agreements are collateralized financing transactions utilized by the Company to acquire investment securities. Due to the short term nature of these financial instruments, the Company estimated the fair value of these repurchase agreements to be the contractual obligation plus accrued interest payable at maturity.
F-21
Securitized Debt and Securitized Debt, Non-Retained
The Company records securitized debt for certificates or notes financed without recourse to the Company in securitization or re-securitization transactions treated as “financings” pursuant to ASC 860. The Company carries securitized debt at the principal balance outstanding on non-retained notes associated with its securitized loans held for investment plus premiums or discounts recorded with the sale of the notes to third parties. The premiums or discounts associated with the sale of the notes or certificates are amortized over the life of the instrument. The Company estimates the fair value of securitized debt by estimating the future cash flows associated with underlying assets collateralizing the secured debt outstanding. The Company models each underlying asset by considering, among other items, the structure of the underlying security, coupon, servicer, actual and expected defaults, actual and expected default severities, reset indices, and prepayment speeds in conjunction with market research for similar collateral performance and management’s expectations of general economic conditions in the sector and greater economy.
The following table presents the carrying value and estimated fair value, as described above, of the Company’s financial instruments at December 31, 2010 and 2009.
|
December 31, 2010
|
December 31, 2009
|
|||||||||||||||
|
Carrying
Amount
|
Estimated
Fair
Value
|
Carrying
Amount
|
Estimated
Fair
Value
|
|||||||||||||
| (dollars in thousands) | ||||||||||||||||
|
Non-Agency RMBS
|
$ | 5,529,111 | $ | 5,529,111 | $ | 2,398,865 | $ | 2,398,865 | ||||||||
|
Agency RMBS
|
2,133,584 | 2,133,584 | 1,690,029 | 1,690,029 | ||||||||||||
|
Securitized loans held for investment
|
353,532 | 345,410 | 470,533 | 453,388 | ||||||||||||
|
Repurchase agreements
|
(1,808,797 | ) | (1,811,575 | ) | (1,975,402 | ) | (1,977,664 | ) | ||||||||
|
Securitized debt
|
(289,236 | ) | (303,102 | ) | (390,350 | ) | (408,404 | ) | ||||||||
|
Securitized debt, non-retained
|
(1,956,079 | ) | (1,887,121 | ) | - | - | ||||||||||
|
Interest rate swaps
|
(9,988 | ) | (9,988 | ) | - | - | ||||||||||
The Company had outstanding $1.8 billion and $2.0 billion of repurchase agreements with weighted average borrowing rates of 0.45% and 0.60% and weighted average remaining maturities of 49 and 26 days as of December 31, 2010 and 2009, respectively. At December 31, 2010 and 2009, RMBS pledged as collateral under these repurchase agreements had an estimated fair value of $2.0 billion and $2.0 billion, respectively. The average daily balances of the Company’s repurchase agreements for the years ended December 31, 2010 and December 30, 2009 were $1.5 billion and $1.3 billion, respectively. The interest rates of these repurchase agreements are generally indexed to the one-month LIBOR rate and re-price accordingly.
At December 31, 2010 and December 31, 2009, the repurchase agreements collateralized by RMBS had the following remaining maturities.
|
December 31, 2010
|
December 31, 2009
|
|||||||
| (dollars in thousands) | ||||||||
|
Overnight
|
$ | - | $ | - | ||||
|
1-30 days (1)
|
232,265 | 1,772,662 | ||||||
|
30 to 59 days
|
970,394 | 62,243 | ||||||
|
60 to 89 days
|
545,442 | - | ||||||
|
90 to 119 days
|
60,696 | - | ||||||
|
Greater than or equal to 120 days
|
- | 140,497 | ||||||
|
Total
|
$ | 1,808,797 | $ | 1,975,402 | ||||
|
(1) Repurchase agreements with affiliates totaled $259.0 million as of December 31, 2009. There were no repurchase agreements with affiliates as of December 31, 2010.
|
||||||||
F-22
At December 31, 2010 and 2009, the Company did not have an amount at risk greater than 10% of its equity with any counterparty.
All of the Company’s securitized debt is collateralized by residential mortgage loans or RMBS. For financial reporting purposes, the Company’s securitized debt is accounted for as a financing. Thus, the residential mortgage loans or RMBS held as collateral are recorded in the assets of the Company as securitized loans held for investment or RMBS and the securitized debt is recorded as a liability in the statements of financial condition.
At December 31, 2010, the Company’s securitized debt collateralized by residential mortgage loans had a principal balance of $303.1 million. The debt matures between the years 2023 and 2038. At December 31, 2010, the debt carried a weighted average cost of financing equal to 5.52%, that is secured by residential mortgage loans of which approximately 44% of the remaining principal balance pays a fixed rate of 6.29% and 56% of the remaining principal balance pays a variable rate of 5.47%. At December 31, 2009, the Company’s securitized debt collateralized by residential mortgage loans had a principal balance of $390.4 million. At December 31, 2009, the debt carried a weighted average cost of financing equal to 5.50%, that is secured by residential mortgage loans of which approximately 43% of the remaining principal balance pays a fixed rate of 6.33% and 57% of the remaining principal balance pays a variable rate of 5.63%.
At December 31, 2010, the Company’s securitized debt, non-retained, collateralized by RMBS had a principal balance of $2.0 billion. The debt matures between the years 2035 and 2047. At December 31, 2010, the debt carried a weighted average cost of financing equal to 5.17%. At December 31, 2009, the Company did not have securitized debt, non-retained collateralized by RMBS.
The following table presents the estimated principal repayment schedule of the securitized debt and securitized debt, non-retained held by the Company at December 31, 2010 and 2009, based on expected cash flows of the residential mortgage loans or RMBS, as adjusted for projected losses, collateralizing the debt. All of the securitized debt recorded in the Company’s consolidated statements of financial condition is non-recourse to the Company.
|
December 31, 2010
|
December 31, 2009
|
|||||||
| (dollars in thousands) | ||||||||
|
Within One Year
|
$ | 634,988 | $ | 37,192 | ||||
|
One to Three Years
|
831,305 | 70,885 | ||||||
|
Three to Five Years
|
305,953 | 59,382 | ||||||
|
Greater Than or Equal to Five Years
|
417,977 | 240,945 | ||||||
|
Total
|
$ | 2,190,223 | $ | 408,404 | ||||
The significant increase in debt reflected in the table above reflects the Company’s adoption of ASC 810 on January 1, 2010. See Note 8 for a more detailed discussion.
Maturities of the Company’s securitized debt are dependent upon cash flows received from the underlying loans. The estimate of their repayment is based on scheduled principal payments on the underlying loans. This estimate will differ from actual amounts to the extent prepayments and/or loan losses are experienced. See Note 4 for a more detailed discussion of the loans collateralizing the securitized debt.
In June 2009, the FASB issued two new accounting standards that amended guidance applicable to the accounting for transfers of financial assets and the consolidation of VIEs (ASC 860 and ASC 810, respectively). The primary affect of these standards was to eliminate the concept of a QPSE when transferring assets and to remove the exemption of a QSPE when applying the consolidation standard. The Company adopted these new accounting standards as of January 1, 2010.
The Company uses securitization trusts or variable interest entities in its securitization and re-securitization transactions. Prior to January 1, 2010, these variable interest entities met the definition of QSPE’s and, as such, were not subject to consolidation. Effective January 1, 2010, all such variable interest entities were considered for consolidation based on the criteria in ASC 810.
F-23
Per ASC 810, an entity shall consolidate a VIE when that entity has a variable interest that provides the reporting entity with a controlling financial interest. The assessment of the characteristics of the reporting entity’s VIE shall consider the VIEs purpose and design. A controlling financial interest is defined as (a) the power to direct the activities of a VIE that most significantly impact the VIEs economic performance and (b) the obligation to absorb losses of the VIE that could potentially be significant to the VIE and/or the right to receive benefits from the VIE that could potentially be significant to the VIE.
Since the Company’s inception, the Company has created VIEs for the purpose of securitizing whole mortgage loans or re-securitizing RMBS and obtaining permanent, non-recourse term financing. The Company evaluated its interest in each securitization trust VIE to determine the primary beneficiary status. The Company found that seven trusts, one of which had been consolidated since its inception, met the requirements of consolidation. The Company determined that in these seven securitizations, based on holding all of the subordinate interests, it maintains the obligation to absorb losses and/or the right to receive benefits from the VIE that could be significant to the VIE. In addition, the Company had the power to direct activities of the trust or was determined to have the ability to control the trust due to its contribution in the purpose and design of the structure. The remaining two trusts evaluated did not meet the requirements to consolidate due to the inability to control one of the trusts and the lack of obligations to absorb losses on the other trust.
VIEs for Which the Company is the Primary Beneficiary
Based on the Company’s consolidation evaluation, the Company consolidated three VIEs on January 1, 2010 that were not previously consolidated and consolidated three VIEs that it created during 2010. The Company’s retained beneficial interest is typically the subordinated tranches of these re-securitizations and in some cases the Company may hold interests in additional tranches. The effect in the current year is the inclusion of an additional $2.3 billion of non-Agency mortgage-backed securities at fair value no longer retained by the Company and the inclusion in its liabilities of $2.0 billion of non-recourse securitized debt associated with these re-securitizations.
On an ongoing basis, the Company expects that the VIEs will be fair valued as Level 2 assets. Line items pertaining to the third-party owned interests are separately stated within the Company’s consolidated financial statements and labeled as “non-retained”.
The trusts are structured as pass through entities that receive principal and interest on the underlying collateral and distribute those payments to the certificate holders. The assets and other instruments held by the securitization entities are restricted in that they can only be used to fulfill the obligations of the securitization entity. Additionally, the obligations of the securitization entities do not have any recourse to the general credit of any other consolidated subsidiaries, nor to the Company as the primary beneficiary. The Company’s risks associated with its involvement with these VIEs is limited to its risks and rights as a certificate holder of the bonds it has retained. See Note 5 for a discussion of the fair value measurement of the assets and liabilities.
The securitization entities newly consolidated by the Company are similar in nature to the Company’s portfolio as a whole. The securitization entities are all composed of RMBS of the quality and characteristics of assets reflected in the RMBS classifications found in the Company’s consolidated financial statements. See Note 3 for a discussion of the securities characteristics of the portfolio.
The table below presents the assets and liabilities of consolidated entities as of January 1, 2010. The cumulative effect adjustment reflects the reversal of realized gains of $98.1 million previously recorded on the sales of these newly consolidated trusts net of the additional accretion of discounts due to consolidating the trusts. At December 31, 2009, none of the re-securitization transactions completed during 2009 were consolidated.
F-24
|
Carrying Value (1)
|
||||
|
(dollars in thousands)
|
||||
|
Assets
|
||||
|
Non-Agency RMBS
|
||||
|
Senior, non-retained
|
$ | 1,114,034 | ||
|
Liabilities
|
||||
|
Securitized debt, non-retained
|
1,202,221 | |||
|
Net assets and liabilities of newly consolidated entities
|
(88,187 | ) | ||
|
Cumulative effect adjustment to retained earnings upon adoption
|
$ | (88,187 | ) | |
|
(1) Carrying value represents the amount the assets would have been recorded at in the consolidated financial statements at January 1, 2010 had they been recorded in the consolidated financial statements on the date the Company first met the conditions for consolidation.
|
||||
The cumulative effect of adopting ASC 810 on January 1, 2010 based on the shares outstanding on that date was to reduce the beginning book value of the Company by $0.13 per share.
The table below reflects the assets and liabilities recorded in the consolidated statements of financial condition related to the newly consolidated securitization entities as of December 31, 2010.
|
December 31, 2010
|
||||
| (dollars in thousands) | ||||
|
Assets
|
||||
|
Non-Agency RMBS
|
||||
|
Senior, non-retained
|
$ | 2,330,568 | ||
|
Liabilities
|
||||
|
Securitized debt, non-retained
|
$ | 1,956,079 | ||
The consolidation of these securitization entities increases both the income and expense recorded in the consolidated statements of operations for the Company as detailed in the table below.
|
For the Year Ended
December 31, 2010
|
||||
| (dollars in thousands) | ||||
|
Interest income, non-retained
|
$ | 192,560 | ||
|
Interest expense, non-retained
|
115,061 | |||
|
Net interest income, non-retained
|
$ | 77,499 | ||
A discussion of the significant accounting policies of the Company to record income and expense is included in Note 2 to these consolidated financial statements. The effect of adopting ASC 810 based on the weighted average shares outstanding was to increase the net interest income of the Company by approximately $0.09 for the year ended December 31, 2010.
The effect of the consolidation of these securitization entities on the consolidated statements of cash flows for the Company is presented in the table below for the periods presented.
|
For the Year Ended
|
||||||||||||
|
December 31, 2010
|
December 31, 2009
|
December 31, 2008
|
||||||||||
| (dollars in thousands) | ||||||||||||
|
Proceeds from securitized debt borrowings, non-retained
|
$ | 1,295,657 | $ | - | $ | - | ||||||
|
Payments on securitized debt borrowings, non-retained
|
(561,927 | ) | - | - | ||||||||
|
Increase (decrease) in accrued interest receivable
|
(279 | ) | - | - | ||||||||
|
Increase (decrease) in accrued interest payable
|
279 | - | - | |||||||||
|
Net cash flows, non-retained
|
$ | 733,730 | $ | - | $ | - | ||||||
F-25
VIEs for Which the Company is Not the Primary Beneficiary
The table below represents the carrying amounts and classification of assets recorded on the Company’s consolidated financial statements related to its variable interests in non-consolidated VIEs, as well as its maximum exposure to loss as a result of its involvement with these VIEs.
|
December 31, 2010
|
December 31, 2009
|
|||||||||||||||
|
Amortized Cost
|
Fair Value
|
Amortized Cost
|
Fair Value
|
|||||||||||||
| (dollars in thousands) | ||||||||||||||||
|
Assets
|
||||||||||||||||
|
Non-Agency RMBS
|
||||||||||||||||
|
Senior
|
$ | 400 | $ | 559 | $ | 47,998 | $ | 46,047 | ||||||||
|
Subordinated
|
7,664 | 6,485 | 9,701 | 7,081 | ||||||||||||
|
Agency RMBS
|
2,680 | 2,530 | 4,730 | 4,720 | ||||||||||||
|
Total
|
$ | 10,744 | $ | 9,574 | $ | 62,429 | $ | 57,848 | ||||||||
The Company’s involvement with VIEs for which it is not the primary beneficiary generally are in the form of purchasing securities issued by the trusts similar to its investments in other RMBS that are not part of a trust it has evaluated for consolidation. The Company’s maximum exposure to loss in these entities is represented by the fair value of these assets. This amount does not include OTTI or other write-downs that the Company previously recognized through earnings.
In connection with the Company’s interest rate risk management strategy, the Company economically hedges a portion of its interest rate risk by entering into derivative financial instrument contracts. These derivative financial instrument contracts do not qualify as hedges under ASC 815. As of December 31, 2010, such instruments are comprised of interest rate swaps, which in effect modify the cash flows on repurchase agreements. The use of interest rate swaps creates exposure to credit risk relating to potential losses that could be recognized if the counterparties to these instruments fail to perform their obligations under the contracts. In the event of a default by the counterparty, the Company could have difficulty obtaining its RMBS pledged as collateral for swaps. The Company does not anticipate any defaults by its counterparties.
The Company’s swaps are used to lock in a fixed rate related to a portion of its current and anticipated future 30-day term repurchase agreements.
The table below summarizes the location and fair value of interest rate swaps reported in the Consolidated Statements of Financial Condition as of December 31, 2010. The Company had no interest rate swaps outstanding as of December 31, 2009.
|
Location on Consolidated
Statement of Financial
Condition
|
Notional Amount
|
Net Estimated Fair
Value/Carrying Value
|
|||||||
|
(dollars in thousands)
|
|||||||||
|
December 31, 2010
|
Assets
|
$ | - | $ | - | ||||
|
December 31, 2010
|
Liabilities
|
$ | 450,000 | $ | (9,988 | ) | |||
The effect of the Company’s interest rate swaps on the Consolidated Statements of Operations and Comprehensive Income (Loss) is presented below.
F-26
|
Location on Consolidated Statements of Operations and Comprehensive Income (Loss)
|
||||||||
|
Interest Expense
|
Unrealized Gain (Loss) on Interest Rate Swaps
|
|||||||
|
(dollars in thousands)
|
||||||||
|
For the Year Ended:
|
||||||||
|
December 31, 2010
|
$ | 5,789 | $ | (9,988 | ) | |||
|
December 31, 2009
|
$ | - | $ | - | ||||
|
December 31, 2008
|
$ | 5,752 | $ | 4,156 | ||||
The weighted average pay rate on the Company’s interest rate swaps at December 31, 2010 was 2.59% and the weighted average receive rate was 0.26%. The Company had no interest rate swaps outstanding as of December 31, 2009.
On March 31, 2010, the Company announced the sale of 85,000,000 shares of common stock at a price of $3.61 per share in a public offering. In addition, the underwriters exercised the option to purchase an additional 12,750,000 shares of common stock to cover overallotments. The aggregate net proceeds the Company received before expenses in this sale were approximately $352.9 million. This sale was completed on April 7, 2010.
On June 22, 2010, the Company announced the sale of 100,000,000 shares of common stock at a price of $3.61 per share in a public offering. In addition, the underwriters exercised the option to purchase an additional 15,000,000 shares of common stock to cover overallotments. The aggregate net proceeds the Company received before expenses in this sale were approximately $415.2 million. This sale was completed on June 28, 2010.
On November 2, 2010, the Company announced the sale of 125,000,000 shares of common stock at a price of $3.80 per share in a public offering. In addition, the underwriters exercised the option to purchase an additional 18,750,000 shares of common stock to cover overallotments. The aggregate net proceeds the Company received before expenses in this sale were approximately $546.3 million. This sale was completed on November 8, 2010.
On May 27, 2009, the Company announced the sale of 168,000,000 shares of common stock at $3.22 per share for estimated proceeds, less the underwriters’ discount and offering expenses, of $519.3 million. Immediately following the sale of these shares Annaly purchased 4,724,017 shares at the same price per share as the public offering, for proceeds of approximately $15.2 million. In addition, on June 1, 2009 the underwriters exercised the option to purchase up to an additional 25,200,000 shares of common stock to cover over-allotments for proceeds, less the underwriters’ discount, of approximately $77.9 million. These sales were completed on June 2, 2009. In all, the Company raised net proceeds of approximately $612.4 million in these offerings.
On April 15, 2009, the Company announced the sale of 235,000,000 shares of common stock at $3.00 per share for estimated proceeds, less the underwriters’ discount and offering expenses, of $674.8 million. Immediately following the sale of these shares Annaly purchased 24,955,752 shares at the same price per share as the public offering, for proceeds of approximately $74.9 million. In addition, on April 16, 2009 the underwriters exercised the option to purchase up to an additional 35,250,000 shares of common stock to cover over-allotments for proceeds, less the underwriters’ discount, of approximately $101.3 million. These sales were completed on April 21, 2009. In all, the Company raised net proceeds of approximately $850.9 in these offerings.
On September 24, 2009, the Company implemented a dividend reinvestment and share purchase plan (“DRSPP”). The DRSPP provides holders of record of its common stock an opportunity to automatically reinvest all or a portion of their cash distributions received on common stock in additional shares of our common stock as well as to make optional cash payments to purchase shares of our common stock. Persons who are not already stockholders may also purchase our common stock under the plan through optional cash payments. The DRSPP is administered by the Administrator, The Bank of New York Mellon. During the year ended December 31, 2010, the Company raised $263,000 by issuing 67,596 shares through the DRSPP. During the year ended December 31, 2009 no shares were issued under the DRSPP.
F-27
During the year ended December 31, 2010, the Company declared dividends to common shareholders totaling $577.5 million or $0.69 per share. During the year ended December 31, 2009, the Company declared dividends to common shareholders totaling $242.4 million or $0.43 per share.
There was no preferred stock issued or outstanding as of December 31, 2010 or 2009.
On November 3, 2010, the Company filed an amendment to its Articles of Incorporation. The Company’s Articles of Incorporation previously allowed the Company to issue up to a total of 1,100,000,000 shares of capital stock, par value $0.01 per share. As of November 3, 2010, the Company had 883,168,113 shares of common stock issued and outstanding. To retain the ability to issue additional shares of capital stock, the Company has increased the number of shares authorized to issue to 1,600,000,000 shares consisting of 1,500,000,000 shares of common stock, $0.01 par value per common share, and 100,000,000 shares of preferred stock, $0.01 par value per preferred share.
The Company has adopted a long term stock incentive plan to provide incentives to its independent directors and employees of FIDAC and its affiliates, to stimulate their efforts towards the Company’s continued success, long-term growth and profitability and to attract, reward and retain personnel and other service providers. The incentive plan authorizes the Compensation Committee of the board of directors to grant awards, including incentive stock options, non-qualified stock options, restricted shares and other types of incentive awards. The specific award granted to an individual is based upon, in part, the individual’s position within FIDAC, the individual’s position within the Company, his or her contribution to the Company’s performance, market practices, as well as the recommendations of FIDAC. The incentive plan authorizes the granting of options or other awards for an aggregate of the greater of 8.0% of the outstanding shares of the Company’s common stock up to a ceiling of 40,000,000 shares.
On January 2, 2008, the Company granted restricted stock awards in the amount of 1,301,000 shares to FIDAC’s employees and the Company’s independent directors. The awards to the independent directors vested on the date of grant and the awards to FIDAC’s employees vest quarterly over a period of 10 years. Of these shares, as of December 31, 2010, 416,200 shares have vested and 43,025 shares were forfeited or cancelled.
Each independent director was awarded a pro-rata portion of $45,000 in common stock based on term of service in 2010, which vested on December 31, 2010.
As of December 31, 2010, there was $15.7 million of total unrecognized compensation costs related to non-vested share-based compensation arrangements granted under the long term incentive plan, based on the closing price of the shares on the grant date. That cost is expected to be recognized over a weighted-average period of 7.0 years. The total fair value of shares vested, less those forfeited, during the year ended December 31, 2010 was $481,000, based on the closing price of the stock on the vesting date.
As a REIT, the Company is not subject to Federal income tax to the extent that it makes qualifying distributions to its stockholders, and provided it satisfies on a continuing basis, through actual investment and operating results, the REIT requirements including certain asset, income, distribution and stock ownership tests. Most states recognize REIT status as well. During the year ended December 31, 2010, the Company recorded $752,000 in income tax expense related to federal REIT excise tax due as a result of a shortfall in the Company’s 2009 distributions as compared to the amount required under applicable law and $3,000 in state income taxes. During the year ended December 31, 2009, the Company recorded $1,000 in income tax expense related to state and federal tax liabilities on undistributed income.
In general, common stock cash dividends declared by the Company will be considered ordinary income to stockholders for income tax purposes. From time to time, a portion of the Company’s dividends may be characterized as capital gains or return of capital. For the year ended December 31, 2010, the Company estimates that all income distributed in the form of dividends will be characterized as ordinary income. The Company files tax returns in several U.S jurisdictions, including New York State and New York City. The 2010 tax year remains open to U.S. federal, state and local tax examinations.
F-28
For the year ended December 31, 2009, all income distributed in the form of dividends was characterized as ordinary income.
During July 2010, the Company formed CIM Trading Company LLC, a wholly-owned subsidiary, and made a joint election to treat the subsidiary as a taxable REIT subsidiary (“TRS”). As such, CIM Trading Company LLC is taxable as a domestic C corporation and subject to federal, state, and local income taxes based upon its taxable income. For the year ended December 31, 2010, no income tax expense has been recorded for this TRS as the Company does not expect the subsidiary to have federal taxable income for the year.
The Company’s primary components of market risk are credit risk and interest rate risk. The Company is subject to credit risk and interest rate risk in connection with its investments in non-Agency residential mortgage loans and credit sensitive mortgage-backed securities. When the Company assumes credit risk, it attempts to minimize interest rate risk through asset selection, hedging and matching the income earned on mortgage assets with the cost of related liabilities. The Company is subject to interest rate risk, primarily in connection with its investments in fixed-rate and adjustable-rate mortgage-backed securities, residential mortgage loans, and borrowings under repurchase agreements. The Company attempts to minimize credit risk through due diligence and asset selection by purchasing loans underwritten to agreed-upon specifications of selected originators. The Company has established a whole loan target market including prime borrowers with FICO scores generally greater than 650, Alt-A documentation, geographic diversification, owner-occupied property, and moderate loan to value ratio. These factors are considered to be important indicators of credit risk.
The Company has entered into a management agreement with FIDAC, which provides for an initial term through December 31, 2010 with an automatic one-year extension option and subject to certain termination rights. On November 18, 2010, the Compensation Committee of the Board of Directors renewed the management agreement through December 31, 2011. The Company pays FIDAC a quarterly management fee equal to 1.50% per annum of the gross Stockholders’ Equity (as defined in the management agreement) of the Company.
Management fees accrued and paid to FIDAC for the years ended December 31, 2010 and 2009 were $40.9 million and $25.7 million, respectively.
The Company is obligated to reimburse FIDAC for its costs incurred under the management agreement. In addition, the management agreement permits FIDAC to require the Company to pay for its pro rata portion of rent, telephone, utilities, office furniture, equipment, machinery and other office, internal and overhead expenses that FIDAC incurred in the operation of the Company. These expenses are allocated between FIDAC and the Company based on the ratio of the Company’s proportion of gross assets compared to all remaining gross assets managed by FIDAC as calculated at each quarter end. FIDAC and the Company will modify this allocation methodology, subject to the Company’s board of directors’ approval if the allocation becomes inequitable (i.e., if the Company becomes very highly leveraged compared to FIDAC’s other funds and accounts). During the year ended December 31, 2010, the Company reimbursed FIDAC approximately $465,000 for such expenses. During the year ended December 31, 2009, FIDAC waived its right to request reimbursement from the Company for these expenses.
During the years ended December 31, 2010 and 2009, 146,400 and 128,900 shares of restricted stock issued by the Company to FIDAC’s employees vested, as discussed in Note 11.
In April 2009, the Company entered into a Securities Industry and Financial Markets Association standard preprinted form Master Repurchase Agreement with RCap Securities, Inc., a wholly owned subsidiary of Annaly. This standard agreement does not contain any sort of liquidity, net worth or other similar types of positive or negative covenants. Rather, the agreement contains covenants that require the buyer and seller of securities to deliver collateral or securities, and similar covenants which are customary in Master Repurchase Agreements. At December 31, 2010 and 2009, the Company had no financing under this agreement. The Company has been in compliance with all covenants of this agreement since it entered into this agreement.
F-29
In March 2008, the Company entered into a Securities Industry and Financial Markets Association standard preprinted form Master Repurchase Agreement with Annaly. This standard agreement does not contain any sort of liquidity, net worth or other similar types of positive or negative covenants. Rather, the agreement contains covenants that require the buyer and seller of securities to deliver collateral or securities, and similar covenants which are customary in Master Repurchase Agreements. At December 31, 2010, the Company had no financing under this agreement. At December 31, 2009, the Company financed $259.0 million under this agreement at a weighted average rate of 1.72%. The Company has been in compliance with all covenants of this agreement since it entered into this agreement.
From time to time, the Company may become involved in various claims and legal actions arising in the ordinary course of business. Management is not aware of any reported or unreported contingencies at December 31, 2010.
On January 28, 2011 the Company entered into an equity distribution agreement with FIDAC and UBS Securities LLC (“UBS”). Through this agreement, the Company may sell through UBS, as its sales agent, up to 125,000,000 shares of our common stock in ordinary brokers’ transactions at market prices or other transactions as agreed between the Company and UBS.
The following is a presentation of the results of operations for the quarters ended December 31, 2010, September 30, 2010, June 30, 2010 and March 31, 2010.
F-30
|
CHIMERA INVESTMENT CORPORATION
|
||||||||||||||||
|
CONSOLIDATED STATEMENTS OF OPERATIONS
|
||||||||||||||||
|
(dollars in thousands, except share and per share data)
|
||||||||||||||||
|
(unaudited)
|
||||||||||||||||
| For the Quarters Ended | ||||||||||||||||
|
December 31,
2010
|
September 30,
2010
|
June 30, 2010
|
March 31, 2010
|
|||||||||||||
|
Net Interest Income:
|
||||||||||||||||
|
Interest income
|
$ | 159,967 | $ | 140,405 | $ | 133,522 | $ | 128,984 | ||||||||
|
Interest expense
|
12,076 | 10,527 | 7,198 | 7,374 | ||||||||||||
|
Interest income, non-retained
|
33,780 | 58,090 | 49,829 | 50,861 | ||||||||||||
|
Interest expense, non-retained
|
27,573 | 32,237 | 21,421 | 33,830 | ||||||||||||
|
Net interest income (expense)
|
154,098 | 155,731 | 154,732 | 138,641 | ||||||||||||
|
Other-than-temporary impairments:
|
||||||||||||||||
|
Total other-than-temporary impairment losses
|
(5,596 | ) | (1,314 | ) | (24,746 | ) | (22,687 | ) | ||||||||
|
Non-credit portion of loss recognized in other comprehensive income (loss)
|
3,233 | 436 | 17,853 | 20,143 | ||||||||||||
|
Net other-than-temporary credit impairment losses
|
(2,363 | ) | (878 | ) | (6,893 | ) | (2,544 | ) | ||||||||
|
Other gains (losses):
|
||||||||||||||||
|
Unrealized gains (losses) on interest rate swaps
|
14,831 | (13,583 | ) | (11,237 | ) | - | ||||||||||
|
Realized gains (losses) on sales of investments, net
|
7,711 | 2,032 | - | 342 | ||||||||||||
|
Realized losses on principal write-downs of non-Agency RMBS
|
(3,593 | ) | (2,517 | ) | (326 | ) | (949 | ) | ||||||||
|
Total other gains (losses)
|
18,949 | (14,068 | ) | (11,563 | ) | (607 | ) | |||||||||
|
Net investment income (loss)
|
170,684 | 140,785 | 136,276 | 135,490 | ||||||||||||
|
Other expenses:
|
||||||||||||||||
|
Management fee
|
12,229 | 11,318 | 9,263 | 8,114 | ||||||||||||
|
Provision for loan losses
|
577 | 482 | 1,024 | 606 | ||||||||||||
|
General and administrative expenses
|
1,648 | 1,798 | 1,409 | 1,160 | ||||||||||||
|
Total other expenses
|
14,454 | 13,598 | 11,696 | 9,880 | ||||||||||||
|
Income (loss) before income taxes
|
156,230 | 127,187 | 124,580 | 125,610 | ||||||||||||
|
Income taxes
|
3 | 752 | 1 | - | ||||||||||||
|
Net income (loss)
|
$ | 156,227 | $ | 126,435 | $ | 124,579 | $ | 125,610 | ||||||||
The following is a presentation of the results of operations for the quarters ended December 31, 2009, September 30, 2009, June 30, 2009 and March 31, 2009.
F-31
|
CHIMERA INVESTMENT CORPORATION
|
||||||||||||||||
|
CONSOLIDATED STATEMENTS OF OPERATIONS
|
||||||||||||||||
|
(dollars in thousands, except share and per share data)
|
||||||||||||||||
|
(unaudited)
|
||||||||||||||||
|
For the Quarters Ended
|
||||||||||||||||
|
December 31,
2009
|
September 30,
2009
|
June 30, 2009
|
March 31, 2009
|
|||||||||||||
|
Net Interest Income:
|
||||||||||||||||
|
Interest income
|
$ | 100,765 | $ | 104,690 | $ | 65,077 | $ | 28,007 | ||||||||
|
Interest expense
|
8,530 | 9,197 | 8,313 | 9,042 | ||||||||||||
|
Net interest income (expense)
|
92,235 | 95,493 | 56,764 | 18,965 | ||||||||||||
|
Other-than-temporary impairments:
|
||||||||||||||||
|
Total other-than-temporary impairment losses
|
(1,480 | ) | (6,209 | ) | (8,575 | ) | - | |||||||||
|
Non-credit portion of loss recognized in other comprehensive income (loss)
|
164 | 4,024 | 2,080 | - | ||||||||||||
|
Net other-than-temporary credit impairment losses
|
(1,316 | ) | (2,185 | ) | (6,495 | ) | - | |||||||||
|
Other gains (losses):
|
||||||||||||||||
|
Realized gains (losses) on sales of investments, net
|
16,191 | 74,508 | 9,321 | 3,627 | ||||||||||||
|
Realized losses on principal write-downs on non-Agency RMBS
|
(195 | ) | (61 | ) | - | - | ||||||||||
|
Total other gains (losses)
|
15,996 | 74,447 | 9,321 | 3,627 | ||||||||||||
|
Net investment income (loss)
|
106,915 | 167,755 | 59,590 | 22,592 | ||||||||||||
|
Other expenses:
|
||||||||||||||||
|
Management fee
|
8,516 | 8,649 | 5,955 | 2,583 | ||||||||||||
|
Provision for loan losses
|
1,692 | 47 | 1,130 | 234 | ||||||||||||
|
General and administrative expenses
|
1,238 | 1,057 | 861 | 905 | ||||||||||||
|
Total other expenses
|
11,446 | 9,753 | 7,946 | 3,722 | ||||||||||||
|
Income (loss) before income taxes
|
95,469 | 158,002 | 51,644 | 18,870 | ||||||||||||
|
Income taxes
|
- | - | - | 1 | ||||||||||||
|
Net income (loss)
|
$ | 95,469 | $ | 158,002 | $ | 51,644 | $ | 18,869 | ||||||||
F-32
Pursuant to the requirements of Section 13 or 15(d) of the Securities Exchange Act of 1934, the registrant has duly caused this report to be signed on its behalf by the undersigned, thereunto duly authorized, in the city of New York, State of New York.
| CHIMERA INVESTMENT CORPORATION | ||
| By: |
/s/ Matthew Lambiase
|
|
|
Matthew Lambiase
|
||
|
Chief Executive Officer and President
|
||
| February 25, 2011 | ||
Pursuant to the requirements of the Securities Exchange Act of 1934, this report has been signed below by the following persons on behalf of the registrant and in the capacities and on the date indicated.
|
Signatures
|
Title
|
Date
|
|
/s/ Matthew Lambiase
|
Chief Executive Officer, President, and
Director (Principal Executive Officer)
|
February 25, 2011
|
|
Matthew Lambiase
|
||
|
/s/ A. Alexandra Denahan
|
Chief Financial Officer (Principal Financial
and Accounting Officer)
|
February 25, 2011
|
|
A. Alexandra Denahan
|
||
|
/s/ Jeremy Diamond
|
Director
|
February 25, 2011
|
|
Jeremy Diamond
|
||
|
/s/ Mark Abrams
|
Director
|
February 25, 2011
|
|
Mark Abrams
|
||
|
/s/ Paul A. Keenan
|
Director
|
February 25, 2011
|
|
Paul A. Keenan
|
||
|
/s/ Paul Donlin
|
Director
|
February 25, 2011
|
|
Paul Donlin
|
||
| /s/ Gerard Creagh | Director |
February 25, 2011
|
| Gerard Creagh | ||
|
/s/ Dennis Mahoney
|
Director | February 25, 2011 |
| Dennis Mahoney | ||
|
/s/ John P. Reilly
|
Director |
February 25, 2011
|
|
John P. Reilly
|
| S-1 |
TABLE OF CONTENTS
Part IItem 1. BusinessItem 1A. Risk FactorsItem 1B. Unresolved Staff CommentsItem 2. PropertiesItem 3. Legal ProceedingsItem 4. (removed and Reserved)Part IIItem 5. Market For Registrant's Common Equity, Related Stockholder Matters and Issuer Purchases Of Equity SecuritiesItem 6. Selected Financial DataItem 7. Management's Discussion and Analysis Of Financial Condition and Result Of OperationsItem 7A. Quantitative and Qualitative Disclosures About Market RiskItem 8. Financial Statements and Supplementary DataItem 9. Changes in and Disagreements with Accountants on Accounting and Financial DisclosureItem 9A. Controls and ProceduresItem 9B. Other InformationPart IIIItem 10. Directors, Executive Officers and Corporate GovernanceItem 11. Executive CompensationItem 12. Security Ownership Of Certain Beneficial Owners and Management and Related Stockholder MattersItem 12. Security Ownership Of Certain Beneficial Owners and Management and Related StockholderItem 13. Certain Relationships and Related Transactions, and Director IndependenceItem 14. Principal Accountant Fees and ServicesPart IVItem 15. Exhibits and Financial Statement Schedules