CHIMERA INVESTMENT CORP
10-Ks and 10-Qs
|
|
|
|
|
|
|
|
|
|
|
|
|
|
|
|
|
|
|
|
|
|
|
|
|
|
|
|
|
|
|
|
|
|
|
|
|
|
|
|
|
|
|
|
|
|
|
|
|
|
SECURITIES AND EXCHANGE COMMISSION
WASHINGTON, D.C. 20549
FORM 10-K
(MARK ONE)
[X] ANNUAL REPORT PURSUANT TO SECTION 13 OR 15 (d) OF THE SECURITIES
EXCHANGE ACT OF 1934
FOR THE FISCAL YEAR ENDED: DECEMBER 31, 2015
OR
[ ] TRANSITION REPORT PURSUANT TO SECTION 13 OR 15 (d) OF THE
SECURITIES EXCHANGE ACT OF 1934
FOR THE TRANSITION PERIOD FROM TO
COMMISSION FILE NUMBER: 1-33796
CHIMERA INVESTMENT CORPORATION
(Exact Name of Registrant as Specified in its Charter)
| MARYLAND | 26-0630461 |
| (State or other jurisdiction of incorporation of organization) | (I.R.S. Employer Identification Number) |
| 520 Madison Avenue, 32 nd Floor | |
| New York, New York | 10022 |
| (Address of Principal Executive Offices) | (Zip Code) |
(212) 626-2300
(Registrant’s telephone number, including area code)
Securities registered pursuant to Section 12(b) of the Act:
|
Title of Each Class
|
Name of Each Exchange on Which Registered
|
|
Common Stock, par value $.01 per share
|
New York Stock Exchange
|
Securities registered pursuant to Section 12(g) of the Act:
None
Indicate by check mark whether the Registrant is a well-known seasoned issuer, as defined in Rule 405 of the Securities Act.
Yes
þ
No
o
Indicate by check mark if the Registrant is not required to file reports pursuant to Section 13 or Section 15(d) of the Act. Yes
o
No
þ
Indicate by check mark whether the Registrant (1) has filed all reports required to be filed by Section 13 or 15(d) of the Securities Exchange Act of 1934 during the preceding 12 months (or for such shorter period that the Registrant was required to file such reports), and (2) has been subject to such filing requirements for the past 90 days:
Yes
þ
No
o
Indicate by check mark whether the registrant has submitted electronically and posted on its corporate Web site, if any, every Interactive Data File required to be submitted and posted pursuant to Rule 405 of Regulation S-T (§ 232.405 of this chapter) during the preceding 12 months (or for such shorter period that the registrant was required to submit and post such files).
Yes
þ
No
o
Indicate by check mark if disclosure of delinquent filers pursuant to Item 405 of Regulation S-K is not contained herein, and will not be contained, to the best of registrant’s knowledge, in definitive proxy or information statements incorporated by reference in Part III of this Form 10-K or any amendment to this Form 10-K.
þ
Indicate by check mark whether the registrant is a large accelerated filer, an accelerated filer, a non-accelerated filer or a smaller reporting company. See the definitions of “accelerated filer, large accelerated filer and smaller reporting company” in Rule 12b-2 of the Exchange Act. (Check one):
Large accelerated filer
þ
Accelerated filer
o
Non-accelerated filer
o
Smaller reporting company
o
Indicate by check mark whether the Registrant is a shell company (as defined in Rule 12b-2 of the Act). Yes
o
No
þ
At June 30, 2015, the aggregate market value of the voting stock held by non-affiliates of the Registrant was $2,683,573,258 based on the closing sale price on the New York Stock Exchange on that date.
The number of shares of the Registrant’s Common Stock outstanding on January 29, 2016 was 187,711,868.
CHIMERA INVESTMENT CORPORATION
2015 FORM 10-K ANNUAL REPORT
TABLE OF CONTENTS
|
|
PAGE
|
|
|
3
|
||
|
10
|
||
|
43
|
||
|
43
|
||
|
43
|
||
|
43
|
||
|
44
|
||
|
46
|
||
|
47
|
||
|
78
|
||
|
82
|
||
|
82
|
||
|
83
|
||
|
84
|
||
|
85
|
||
|
85
|
||
|
85
|
||
|
85
|
||
|
85
|
||
|
86
|
||
|
|
F-1 | |
|
|
S-1 | |
|
EXHIBITS
|
||
SPECIAL NOTE REGARDING FORWARD-LOOKING STATEMENTS
We make forward-looking statements in this report that are subject to risks and uncertainties. These forward-looking statements include information about possible or assumed future results of our business, financial condition, liquidity, results of operations, plans and objectives. When we use the words ‘‘believe,’’ ‘‘expect,’’ ‘‘anticipate,’’ ‘‘estimate,’’ ‘‘plan,’’ ‘‘continue,’’ ‘‘intend,’’ ‘‘should,’’ ‘‘may,’’ ‘‘would,’’ ‘‘will’’ or similar expressions, we intend to identify forward-looking statements. Statements regarding the following subjects, among others, are forward-looking by their nature:
|
|
·
|
our business and investment strategy;
|
|
|
·
|
availability of investment opportunities in real estate-related and other securities;
|
|
|
·
|
our expected investments;
|
|
|
·
|
changes in the value of our investments;
|
|
|
·
|
interest rate mismatches between our investments and our borrowings used to finance such purchases;
|
|
|
·
|
changes in interest rates and mortgage prepayment rates;
|
|
|
·
|
effects of interest rate caps on our adjustable-rate investments;
|
|
|
·
|
rates of default, delinquencies or decreased recovery rates on our investments;
|
|
|
·
|
prepayments of the mortgage and other loans underlying our mortgage-backed securities, or RMBS, or other asset-backed securities, or ABS;
|
|
|
·
|
general volatility of the securities markets in which we invest;
|
|
|
·
|
our ability to maintain existing financing arrangements and our ability to obtain future financing arrangements;
|
|
|
·
|
the degree to which our hedging strategies may or may not protect us from interest rate volatility;
|
|
|
·
|
impact of and changes in governmental regulations, tax law and rates, accounting guidance, and similar matters;
|
|
|
·
|
the impact of and changes to various government programs;
|
|
|
·
|
market trends in our industry, interest rates, the debt securities markets or the general economy;
|
|
|
·
|
our understanding of our competition;
|
|
|
·
|
our transition from an externally-managed real estate investment trust, or REIT, to an internally-managed REIT (see below under “The Internalization”);
|
|
|
·
|
availability of qualified personnel;
|
|
|
·
|
our expectations regarding materiality or significance;
|
|
|
·
|
the effectiveness of our disclosure controls and procedures;
|
|
|
·
|
material weaknesses in our internal controls over financial reporting;
|
|
|
·
|
inadequacy of or weakness in our internal controls over financial reporting of which we are not currently aware or which have not been detected;
|
|
|
·
|
additional information that may arise from the preparation of our financial statements;
|
|
|
·
|
estimates relating to our ability to make distributions to our stockholders in the future;
|
|
|
·
|
our ability to maintain our classification as a real estate investment trust, or REIT, for federal income tax purposes; and
|
|
|
·
|
our ability to maintain our exemption from registration under the Investment Company Act of 1940, as amended, or 1940 Act.
|
The forward-looking statements are based on our beliefs, assumptions and expectations of our future performance, taking into account all information currently available to us. You should not place undue reliance on these forward-looking statements. These beliefs, assumptions and expectations can change as a result of many possible events or factors, not all of which are known to us. Some of these factors are described under the caption ‘‘Risk Factors’’ in this 2015 Form 10-K. If a change occurs, our business, financial condition, liquidity and results of operations may vary materially from those expressed in our forward-looking statements. Any forward-looking statement speaks only as of the date on which it is made. New risks and uncertainties arise from time to time, and it is impossible for us to predict those events or how they may affect us. Except as required by law, we are not obligated to, and do not intend to, update or revise any forward-looking statements, whether as a result of new information, future events or otherwise.
2
In this Annual Report on Form 10-K, references to “we,” “us,” “our” or “the Company” refer to Chimera Investment Corporation and its subsidiaries unless specifically stated otherwise or the context otherwise indicates. The following defines certain of the commonly used terms in this Annual Report on Form 10-K: Agency refers to federally chartered corporation, such as Fannie Mae or Freddie Mac, or an agency of the U.S. Government, such as Ginnie Mae; MBS refers to mortgage-backed securities secured by pools of residential or commercial mortgage loans; RMBS refers to mortgage-backed securities secured by pools of residential mortgage loans; CMBS refers to mortgage-backed securities secured by pools of commercial mortgage loans; Agency MBS refers to MBS that are issued or guaranteed by an Agency; Agency RMBS and Agency CMBS refer to MBS that are secured by pools of residential and commercial mortgage loans, respectively, and are issued or guaranteed by an Agency; Non-Agency RMBS refers to residential MBS that are not guaranteed by any agency of the U.S. Government or any Agency.
The Company
We are a publicly traded real estate investment trust, or REIT, that is primarily engaged in the business of investing, on a leveraged basis, in a diversified portfolio of mortgage assets, including Agency RMBS, Non-Agency RMBS, Agency CMBS, residential mortgage loans, and real estate related securities. We were incorporated in Maryland on June 01, 2007 and commenced operations on November 21, 2007. We invest, either directly or indirectly through our subsidiaries, in RMBS, residential mortgage loans, Agency CMBS, commercial mortgage loans, real estate-related securities and various other asset classes. We have elected and believe that we are organized and have operated in a manner that enables us to be taxed as a REIT under the Internal Revenue Code of 1986, as amended, or the Code. If we qualify for taxation as a REIT, we generally will not be subject to U.S. federal income tax on our taxable income that is distributed to our stockholders. To ensure we qualify as a REIT, no person may own more than 9.8% of the outstanding shares of any class of our common stock, unless our Board of Directors waives this limitation.
Our Investment Strategy
Our objective is to provide attractive risk-adjusted returns to our investors over the long-term, primarily through dividends and secondarily through capital appreciation. We intend to achieve this objective by investing in a diversified investment portfolio of RMBS, Agency CMBS, residential mortgage loans, commercial mortgage loans, real estate-related securities and various other asset classes, subject to maintaining our REIT status and exemption from registration under the 1940 Act. The MBS, and real estate-related securities we purchase may include investment-grade and non-investment grade classes, including the BB-rated, B-rated and non-rated classes.
We make investment decisions based on various factors, including expected cash yield, relative value, risk-adjusted returns, current and projected credit fundamentals, current and projected macroeconomic considerations, current and projected supply and demand, credit and market risk concentration limits, liquidity, cost of financing and financing availability, as well as maintaining our REIT qualification and our exemption from registration under the 1940 Act.
The Internalization
In August 2015, we entered into agreements to internalize the Company’s management (the “Internalization”). Prior to the Internalization, we were managed by Fixed Income Discount Advisory Company, (
“
FIDAC”
)
, an investment advisor registered with the Securities and Exchange Commission (“SEC”) and a wholly-owned subsidiary of Annaly Capital Management Inc. (“Annaly”). Pursuant to a transition services agreement that we entered into with FIDAC on August 5, 2015, we terminated the management agreement with FIDAC, and we hired a number of employees formerly employed by FIDAC or its affiliates. In addition, FIDAC agreed to continue to provide us a number of services previously provided under the Management Agreement at the same level, quality and time frame until December 31, 2015, at which time we had the option to extend the term of the Transition Services Agreement (the “TSA”) for up to three one-month extension periods. While our transition to internal management was completed by December 31, 2015, we extended the TSA for certain IT and internal audit services through the end of February 2016 primarily in connection with the completion of our 2015 financial audit. Those services are now completed, and FIDAC no longer provides any management services to us.
3
As described in the Transition Services Agreement, we extended offers of employment to certain employees of FIDAC and its affiliates, including certain of FIDAC’s executive officers. We had also been party to an administrative services agreement (the “Administrative Services Agreement”) with RCap Securities, Inc. (“ RCap ”), a sister company of FIDAC, pursuant to which RCap provided trade clearing and brokerage services to us from time to time. Under the terms of the Transition Services Agreement and in furtherance of the completion of the Internalization, the Management Agreement and the Administrative Services Agreement were both terminated without the payment of any termination fee.
On August 5, 2015, we also entered into a share repurchase agreement (the “Share Repurchase Agreement”) with Annaly. Pursuant to the terms of the Share Repurchase Agreement, we agreed to purchase the entire 4.4% stake owned by Annaly in the Company, and we are no longer an affiliate of Annaly. The repurchase of these shares owned by Annaly was settled on August 17, 2015.
For more information regarding the Internalization, including information related to arrangements with our management team and the appointment of certain new members of management, please refer to our Current Report on Form 8-K filed on August 5, 2015.
Business Overview
Currently, we focus our investment activities primarily on acquiring Non-Agency and Agency MBS, and on purchasing residential mortgage loans. At December 31, 2015, based on the amortized cost balance of our interest earning assets, approximately 46% of our investment portfolio was Agency MBS, 20% of our investment portfolio was Non-Agency RMBS, and 34% of our investment portfolio was securitized residential mortgage loans. At December 31, 2014, based on the amortized cost balance of our interest earning assets, approximately 52% of our investment portfolio was Agency MBS, 16% of our investment portfolio was Non-Agency RMBS, and 32% of our investment portfolio was securitized residential mortgage loans. As discussed in
“
Management's Discussion and Analysis,
”
the change in the composition of our assets during 2015 relates primarily to the decrease in our Agency MBS assets to reduce interest rate exposure in our Agency portfolio.
We have engaged in transactions with residential mortgage lending operations of leading commercial banks and other originators in which we identified and re-underwrote residential mortgage loans owned by such entities, and purchased and securitized such residential mortgage loans. In the past we have also acquired formerly AAA-rated Non-Agency RMBS and immediately re-securitized those securities. We sold the resulting AAA-rated super senior RMBS and retained the rated or unrated mezzanine and subordinate RMBS.
Our investment decisions depend on prevailing market conditions and our business opportunities at such time and we expect that these will change over time. As a result, we cannot predict the percentage of our assets that will be invested in each asset class or whether we will invest in other classes of investments. We may change our investment strategy and policies without a vote of our stockholders.
Our investment strategy is intended to take advantage of opportunities in the current interest rate and credit environment. We expect to adjust our strategy to changing market conditions by shifting our asset allocations across these various asset classes as interest rate and credit cycles change over time. We believe that our strategy will enable us to pay dividends and achieve capital appreciation throughout changing market cycles. We expect to take a long-term view of assets and liabilities, and our reported earnings and estimates of the fair value of our investments at the end of a financial reporting period will not significantly impact our objective of providing attractive risk-adjusted returns to our stockholders over the long-term.
We use leverage to seek to increase our potential returns and to finance the acquisition of our assets. Our income is generated primarily by the difference, or net spread, between the income we earn on our assets and the cost of our borrowings. We finance our investments using a variety of financing sources including, when available, repurchase agreements, warehouse facilities and securitizations. We manage our debt and interest rate risk by utilizing interest rate hedges, such as interest rate swaps, caps, options and futures to reduce the effect of interest rate fluctuations related to our financing sources.
4
We have elected to be taxed as a REIT and operate our business to be exempt from registration under the 1940 Act, and therefore we are required to invest a substantial majority of our assets in loans secured by mortgages on real estate and real estate-related assets. Subject to maintaining our REIT qualification and our 1940 Act exemption, we do not have any limitations on the amounts we may invest in any of our targeted asset classes.
Investment Portfolio
The following briefly discusses the principal types of investments that we have made and may in the future make:
Residential Mortgage-Backed Securities
We invest in mortgage pass-through certificates issued or guaranteed by Ginnie Mae, Fannie Mae or Freddie Mac which are securities representing interests in “pools” of mortgage loans secured by residential real property where payments of both interest and principal, plus pre-paid principal, on the securities are made monthly to holders of the security, in effect passing through monthly payments made by the individual borrowers on the mortgage loans that underlie the securities, net of fees paid to the issuer/guarantor and servicers of the securities. We may also invest in collateralized mortgage obligations, or CMOs, issued by the Agencies. CMOs consist of multiple classes of securities, with each class bearing different stated maturity dates. Monthly payments of principal, including prepayments, are first returned to investors holding the shortest maturity class; investors holding the longer maturity classes receive principal only after the first class has been retired.
Agency RMBS are collateralized by either fixed-rate mortgage loans, or FRMs, adjustable-rate mortgage loans, or ARMs, or hybrid ARMs. Hybrid ARMs are mortgage loans that have interest rates that are fixed for an initial period (typically three, five, seven or ten years) and thereafter reset at regular intervals subject to interest rate caps. Our allocation between securities collateralized by FRMs, ARMs or hybrid ARMs will depend on various factors including, but not limited to, relative value, expected future prepayment trends, supply and demand, costs of financing, costs of hedging, expected future interest rate volatility and the overall shape of the U.S. Treasury and interest rate swap yield curves. We take these factors into account when we make these types of investments.
We invest in investment grade and non-investment grade RMBS. We evaluate certain credit characteristics of these types of securities, including, but not limited to, loan balance distribution, geographic concentration, property type, occupancy, periodic and lifetime caps, weighted-average loan-to-value and weighted-average Fair Isaac Corporation (“FICO”) score. Qualifying securities are then analyzed using base line expectations of expected prepayments and loss severities, the current state of the fixed-income market and broader economy in general. Losses and prepayments are stressed simultaneously based on a credit risk-based model. Securities in this portfolio are monitored for variance from expected prepayments, severities, losses and cash flow. The due diligence process is particularly important and costly with respect to newly formed originators or issuers because there may be little or no information publicly available about these entities and investments.
We may invest in net interest margin securities, or NIMs, which are notes that are payable from and secured by excess cash flow that is generated by RMBS or home equity line of credit-backed securities, or HELOCs, after paying the debt service, expenses and fees on such securities. The excess cash flow represents all or a portion of a residual that is generally retained by the originator of the RMBS or HELOCs. The residual is illiquid, and thus the originator will monetize the position by securitizing the residual and issuing a NIM, usually in the form of a note that is backed by the excess cash flow generated in the underlying securitization. We may also invest in interest-only (“IO”) Agency and Non-Agency RMBS. These IO RMBS represent right to receive a specified proportion of the contractual interest flows of the collateral.
We have invested in and intend to continue to invest in RMBS which are typically pass-through certificates created by the securitization of a pool of mortgage loans that are collateralized by residential real estate properties.
5
The securitization process is typically governed by one or more of the rating agencies, including Fitch Ratings, Moody’s Investors Service, Standard & Poor’s, and DBRS Limited which determine the respective bond class sizes, generally based on a sequential payment structure. Bonds that are rated from AAA to BBB by the rating agencies are considered “investment grade.” Bond classes that are subordinate to the BBB class or are unrated are considered “below-investment grade” or “non-investment grade.” The respective bond class sizes are determined based on the review of the underlying collateral by the rating agencies. The payments received from the underlying loans are used to make the payments on the RMBS. Based on the sequential payment priority, the risk of nonpayment for the investment grade RMBS is lower than the risk of nonpayment for the non-investment grade bonds. Accordingly, the investment grade class is typically sold at a lower yield compared to the non-investment grade or unrated classes which are sold at higher yields.
Residential Mortgage Loans
We have invested in and may in the future invest in residential mortgage loans (mortgage loans secured by residential real property) primarily through direct purchases from selected mortgage originators. We may enter into additional mortgage loan purchase agreements with a number of primary mortgage loan originators, including mortgage bankers, commercial banks, savings and loan associations, home builders, credit unions and mortgage conduits. We may also purchase mortgage loans on the secondary market. We expect these loans to be secured primarily by residential properties in the United States.
The residential mortgage loans in which we have previously invested were primarily underwritten to our specifications. The originators performed the credit review of the borrowers, the appraisal of the properties securing the loan, and maintained other quality control procedures. We generally considered the purchase of loans when the originators have verified the borrowers’ income and assets, verified their credit history and obtained appraisals of the properties. We or a third party performed an independent underwriting review of the processing, underwriting and loan closing methodologies that the originators used in qualifying a borrower for a loan. Depending on the size of the loans, we may not have reviewed all of the loans in a pool, but rather selected loans for underwriting review based upon specific risk-based criteria such as property location, loan size, effective loan-to-value ratio, borrower’s credit score and other criteria we believe to be important indicators of credit risk. Additionally, before the purchase of loans, we obtained representations and warranties from each originator stating that each loan was underwritten to our requirements or, in the event underwriting exceptions have been made, we were informed so that we may evaluate whether to accept or reject the loans. An originator who breaches these representations and warranties in making a loan that we purchase may be obligated to repurchase the loan from us. As added security, we used the services of a third-party document custodian to insure the quality and accuracy of all individual mortgage loan closing documents and to hold the documents in safekeeping. As a result, all of the original loan collateral documents that are signed by the borrower, other than the original credit verification documents, were examined, verified and held by the third-party document custodian.
We may originate mortgage loans or provide other types of financing to the owners of real estate. We currently do not intend to establish a loan servicing platform, but expect to retain highly-rated servicers to service any mortgage loan portfolio we acquire. We have previously purchased certain residential mortgage loans on a servicing-retained basis. In the future, however, we may decide to originate mortgage loans or other types of financing, and we may elect to service mortgage loans and other types of assets.
We conduct a due diligence review of each servicer before executing a servicing agreement. Servicing procedures would typically follow Fannie Mae guidelines but will be specified in each servicing agreement.
We have in the past and may in the future acquire residential mortgage loans for our portfolio with the intention of either securitizing them and retaining them in our portfolio as securitized mortgage loans, or holding them in our residential mortgage loan portfolio. To facilitate the securitization or financing of our loans, we may create subordinate certificates, which provide a specified amount of credit enhancement. We may issue securities through securities underwriters and either retain these securities or finance them in the repurchase agreement market. There is no limit on the amount we may retain of these below-investment-grade subordinate certificates. Until we securitize our residential mortgage loans, we expect to finance our residential mortgage loan portfolio through the use of warehouse facilities and repurchase agreements.
6
We withdrew our licenses in various jurisdictions to avoid not being in good standing under such licenses. The failure to maintain licenses or our good standing in various jurisdictions may temporarily require us to cease certain business strategies or modify the way in which we execute such strategies. For example, without the state licenses necessary to purchase residential mortgage loans, it was necessary for us to structure securitization transactions in a different manner than we may otherwise have chosen to do. This may, among other things, cause us to be unable to execute aspects of our business which may have otherwise been profitable, or we may incur additional costs related to such business operations that we otherwise would not have. We have reapplied for licenses in many jurisdictions and have been approved in most but not all jurisdictions. These conditions may have a material adverse effect on our business, financial condition and results of operations.
Agency CMBS
The Agency CMBS we acquire are Ginnie Mae Construction Loan Certificates (“CLCs”) and the resulting project loan certificates (“PLCs”) when the construction project is complete. Each CLC is backed by a single multifamily property [or health care facilities]. The investor in the CLC is committed to fund the full amount of the project; however, actual funding generally occurs monthly as construction progresses on the property and only after each construction advance is insured by the FHA and issued by Ginnie Mae. The principal balance of the CLC increases as payments by the investor fund each construction advance. Each Ginnie Mae approved mortgage originator must provide the agency with supporting documentation regarding advances and disbursements before each construction advance is issued by Ginnie Mae. We also review this documentation prior to funding each Ginnie Mae guaranteed advance. Upon completion of the construction project the CLC is replaced with a PLC. Ginnie Mae guaranteed the timely payment of principal and interest on each CLC and PLC. This obligation is backed by the full faith and credit of the United States.
As the holder of a CLC, we generally receive monthly payments of interest equal to a pro rata share of the interest payments on the underlying mortgage loan, less applicable servicing and guaranty fees. GNMA CLCs pay interest only during construction, and so there are no payments of principal. As a holder of a PLC, we generally receive monthly payments of principal and interest equal to the aggregate amount of the scheduled monthly principal and interest payments on the mortgage loans underlying that PLC, less applicable servicing and guaranty fees. In addition, such payments will include any prepayments and other unscheduled recoveries of principal of, and any prepayment penalties on, an underlying mortgage loan to the extent received by the Ginnie Mae Issuer during the month preceding the month of the payment. The mortgage loans underlying the PLCs generally contain a lock-out and prepayment penalty period of 10 years during which the related borrower must pay a prepayment penalty equal to a specified percentage of the principal amount of the mortgage loan in connection with voluntary and certain involuntary prepayments. Ginnie Mae does not guaranty the payment of prepayment penalties.
Commercial Mortgage Loans
We may invest in commercial mortgage loans consisting of first or second lien loans secured by multifamily properties, which are residential rental properties consisting of five or more dwelling units, or by mixed residential or other commercial properties, retail properties, office properties or industrial properties. These loans may or may not conform to the Agency guidelines.
Other Asset-Backed Securities
We may invest in securities issued in various collateralized debt obligation, (
“
CDO
”
), offerings to gain exposure to bank loans, corporate bonds, asset-backed securities, or ABS, mortgages, RMBS, CMBS, and other instruments.
We may invest in CMBS, which are secured by, or evidence ownership interests in, a single commercial mortgage loan or a pool of mortgage loans secured by commercial properties. These securities may be senior, subordinated, investment grade or non-investment grade. We intend to invest in CMBS that will yield current interest income and where we consider the return of principal to be likely. We intend to acquire CMBS from private originators of, or investors in, mortgage loans, including savings and loan associations, mortgage bankers, commercial banks, finance companies, investment banks and other entities.
7
Investment Guidelines
We have adopted a set of investment guidelines that set out the asset classes, risk tolerance levels, diversification requirements and other criteria used to evaluate the merits of specific investments as well as the overall portfolio composition. Our investment committee (“Investment Committee”) periodically reviews our compliance with the investment guidelines. Our board also reviews our investment portfolio and related compliance with our investment policies and procedures and investment guidelines at each regularly scheduled Board of Directors meeting.
Our Board of Directors and our Investment Committee have adopted the following guidelines for our investments and borrowings:
|
|
·
|
No investment shall be made that would cause us to fail to qualify as a REIT for federal income tax purposes;
|
|
|
·
|
No investment shall be made that would cause us to be regulated as an investment company under the 1940 Act;
|
|
|
·
|
With the exception of real estate and housing, no single industry shall represent greater than 20% of the securities or aggregate risk exposure in our portfolio; and
|
|
|
·
|
Investments in non-rated or deeply subordinated ABS or other securities that are non-qualifying assets for purposes of the 75% REIT asset test will be limited to an amount not to exceed 50% of our stockholders’ equity.
|
These investment guidelines may be changed by a majority of our Board of Directors without the approval of our stockholders.
Our Financing Strategy
We use leverage to increase potential returns to our stockholders. We are not required to maintain any specific debt-to-equity ratio as we believe the appropriate leverage for the particular assets we are financing depends on the credit quality and risk of those assets. At December 31, 2015 and 2014, our ratio of debt-to-equity was 4.0:1 and 3.8:1, respectively. For purposes of calculating this ratio, our equity is equal to the Total stockholders’ equity on our Consolidated Statements of Financial Condition, and our debt consists of repurchase agreements and securitized debt.
Subject to our maintaining our qualification as a REIT, we may use a number of sources to finance our investments, including the following:
|
|
·
|
Repurchase Agreements
. We have financed certain of our assets through the use of repurchase agreements. We anticipate that repurchase agreements will be one of the sources we will use to achieve our desired amount of leverage for our residential real estate assets. We maintain formal relationships with many counterparties to obtain financing on favorable terms.
|
|
|
·
|
Warehouse Facilities
. We have utilized and may in the future utilize credit facilities for capital needed to fund our assets. We intend to maintain formal relationships with multiple counterparties to maintain warehouse lines on favorable terms.
|
|
|
·
|
Securitization
. We have acquired and may in the future acquire residential mortgage loans for our portfolio with the intention of securitizing them and retaining a portion of the securitized mortgage loans in our portfolio. To facilitate the securitization or financing of our loans, we generally create subordinate certificates, providing a specified amount of credit enhancement, which we intend to retain in our portfolio.
|
|
|
·
|
Re-REMICs.
We have acquired and may in the future acquire Non-Agency RMBS for our portfolio with the intention of re-securitizing them and retaining a portion of the re-securitized Non-Agency RMBS in our portfolio, typically the subordinate certificates. To facilitate the re-securitization, we transfer Non-Agency RMBS to a special purpose entity that has been formed as a securitization vehicle that will issue multiple classes of securities secured by and payable from cash flows on the underlying Non-Agency RMBS.
|
8
Our Interest Rate Hedging and Risk Management Strategy
From time to time, we use derivative financial instruments to hedge all or a portion of the interest rate risk associated with our borrowings. Under the federal income tax laws applicable to REITs, we generally enter into certain transactions to hedge indebtedness that we incur, or plan to incur, to acquire or carry real estate assets.
We may engage in a variety of interest rate management techniques that seek to mitigate changes in interest rates or other potential influences on the values of our assets. The federal income tax rules applicable to REITs may require us to implement certain of these techniques through a taxable REIT subsidiary, or TRS, that is fully subject to corporate income taxation. Our interest rate management techniques may include:
|
|
·
|
puts and calls on securities or indices of securities;
|
|
|
·
|
Eurodollar futures contracts and options on such contracts;
|
|
|
·
|
interest rate caps, swaps and swaptions;
|
|
|
·
|
U.S. Treasury futures, contracts, securities and options on U.S. Treasury securities; and
|
|
|
·
|
other similar transactions.
|
We may attempt to reduce interest rate risks and to minimize exposure to interest rate fluctuations through the use of match funded financing structures, when appropriate, whereby we seek (i) to match the maturities of our debt obligations with the maturities of our assets and (ii) to match the interest rates on our investments with similar debt (i.e., floating rate assets are financed with floating rate debt and fixed-rate assets are financed with fixed-rate debt), directly or through the use of interest rate swaps, caps or other financial instruments, or through a combination of these strategies. This will allow us to minimize the risk that we have to refinance our liabilities before the maturities of our assets and to reduce the impact of changing interest rates on our earnings.
Compliance with REIT and Investment Company Requirements
We monitor our investment securities and the income from these securities and, to the extent we enter into hedging transactions, we monitor income from our hedging transactions as well, so as to ensure at all times that we maintain our qualification as a REIT and our exempt status under the 1940 Act.
Employees
As at December 31, 2015, we had 32 employees, all of whom were full-time. We believe that our relationship with our employees is good. None of our employees are unionized or represented under a collective bargaining agreement.
Competition
Our net income depends, in large part, on our ability to acquire assets at favorable spreads over our borrowing costs. In acquiring real estate-related assets, we will compete with other mortgage REITs, specialty finance companies, savings and loan associations, banks, mortgage bankers, insurance companies, mutual funds, institutional investors, investment banking firms, financial institutions, hedge funds, governmental bodies (including the U.S. Federal Reserve) and other entities. In addition, there are numerous mortgage REITs with similar asset acquisition objectives, and others that may be organized in the future. These other REITs will increase competition for the available supply of mortgage assets suitable for purchase. Many of our competitors are significantly larger than we are, have access to greater capital and other resources and may have other advantages over us. In addition, some of our competitors may have higher risk tolerances or different risk assessments, which could allow them to consider a wider variety of investments and establish more favorable relationships than we can. Current market conditions may attract more competitors, which may increase the competition for sources of financing. An increase in the competition for sources of funding could adversely affect the availability and cost of financing, and thereby adversely affect the market price of our common stock.
9
Distributions
To maintain our qualification as a REIT, we must distribute substantially all of our REIT taxable income to our stockholders each year, and we intend to distribute all such taxable income to satisfy such requirement. We have declared and paid regular quarterly dividends in the past and intend to do so in the future. The Board of Directors declared and paid a common stock cash dividend of $0.48 per common share for each quarter of 2015. The Board of Directors have also declared the first quarter 2016 dividend of $0.48 per share and expects to maintain a $0.48 per share dividend for the remaining three quarters of 2016.
Available Information
Our investor relations website is www.chimerareit.com. We make available on the website under "Investor Relations/SEC filings," free of charge, our annual report on Form 10-K, our quarterly reports on Form 10-Q, our current reports on Form 8-K and any other reports (including any amendments to such reports) as soon as reasonably practicable after we electronically file or furnish such materials to the SEC. Information on our website, however, is not part of this Annual Report on Form 10-K. All reports filed with the SEC may also be read and copied at the SEC’s public reference room at 100 F Street, N.E., Washington, D.C. 20549. Further information regarding the operation of the public reference room may be obtained by calling 1-800-SEC-0330. In addition, all of our filed reports can be obtained at the SEC’s website at www.sec.gov.
You should carefully consider the following factors, together with all the other information included in this 2015 Form 10-K, in evaluating our company and our business. If any of the following risks actually occur, our business, financial condition and results of operations could be materially and adversely affected, and the value of our stock could decline. Additional risks and uncertainties not presently known to us or that we currently deem immaterial also may impair our business operations. As such, you should not consider this list to be a complete statement of all potential risks or uncertainties.
Risks Associated With Our Investments and Our Operations
The mortgage loans we invest in and the mortgage loans underlying the mortgage-backed and asset-backed securities we invest in are subject to delinquency, foreclosure and loss, which could result in losses to us.
Residential mortgage loans are typically secured by single-family residential property and are subject to risks of delinquency and foreclosure and risks of loss. The ability of a borrower to repay a loan secured by a residential property is dependent upon the income or assets of the borrower. A number of factors, including a general economic downturn, acts of God, terrorism, social unrest and civil disturbances, may impair borrowers’ abilities to repay their loans. In addition, we invest in Non-Agency RMBS, which are backed by residential real property but, in contrast to Agency RMBS, their principal and interest is not guaranteed by federally chartered entities such as Fannie Mae and Freddie Mac and, in the case of Ginnie Mae, the U.S. government. The U.S. Department of Treasury and FHFA have also entered into preferred stock purchase agreements between the U.S. Department of Treasury and Fannie Mae and Freddie Mac pursuant to which the U.S. Department of Treasury will ensure that each of Fannie Mae and Freddie Mac maintains a positive net worth. Asset-backed securities are bonds or notes backed by loans or other financial assets.
10
Commercial mortgage loans are secured by multifamily or commercial property and are subject to risks of delinquency and foreclosure, and risks of loss that are greater than similar risks associated with loans made on the security of single-family residential property. The ability of a borrower to repay a loan secured by an income-producing property typically is dependent primarily upon the successful operation of such property rather than upon the existence of independent income or assets of the borrower. If the net operating income of the property is reduced, the borrower’s ability to repay the loan may be impaired. Net operating income of an income producing property can be affected by, among other things, tenant mix, success of tenant businesses, property management decisions, property location and condition, competition from comparable types of properties, changes in laws that increase operating expense or limit rents that may be charged, any need to address environmental contamination at the property, the occurrence of any uninsured casualty at the property, changes in national, regional or local economic conditions or specific industry segments, declines in regional or local real estate values, declines in regional or local rental or occupancy rates, increases in interest rates, real estate tax rates and other operating expenses, changes in governmental rules, regulations and fiscal policies, including environmental legislation, acts of God, terrorism, social unrest and civil disturbances.
In the event of any default under a mortgage loan held directly by us, we will bear a risk of loss of principal to the extent of any deficiency between the value of the collateral and the principal and accrued interest of the mortgage loan, which could have a material adverse effect on our cash flow from operations. In the event of the bankruptcy of a mortgage loan borrower, the mortgage loan to such borrower will be deemed to be secured only to the extent of the value of the underlying collateral at the time of bankruptcy (as determined by the bankruptcy court), and the lien securing the mortgage loan will be subject to the avoidance powers of the bankruptcy trustee or debtor-in-possession to the extent the lien is unenforceable under state law. Foreclosure of a mortgage loan can be an expensive and lengthy process which could have a substantial negative effect on our anticipated return on the foreclosed mortgage loan. RMBS evidence interests in or is secured by pools of residential mortgage loans and CMBS evidence interests in or is secured by a single commercial mortgage loan or a pool of commercial mortgage loans. Accordingly, the RMBS and CMBS we invest in are subject to all of the risks of the respective underlying mortgage loans, and we refer to RMBS and CMBS collectively MBS.
We have significant credit risk, especially on Non-Agency RMBS, in certain geographic areas and may be disproportionately affected by economic or housing downturns, natural disasters, terrorist events, adverse climate changes or other adverse events specific to those markets.
We are not required to observe specific diversification criteria. A significant number of the mortgages collateralizing our RMBS may be concentrated in certain geographic areas. For example, with respect to our Non-Agency RMBS portfolio, we have significantly higher exposure in California, Florida, New York, and New Jersey which constitute, collectively, 48.9% of such portfolio at December 31, 2015. Certain markets within these states (particularly California and Florida) experienced significant decreases in residential home value during the housing crisis and continue to experience challenging economic and real estate conditions. Any event that adversely affects the economy or real estate market in these states could have a disproportionately adverse effect on our Non-Agency RMBS portfolio. In general, any material decline in the economy or significant difficulties in the real estate markets would be likely to cause a decline in the value of residential properties securing the mortgages in the relevant geographic area. This, in turn, would increase the risk of delinquency, default and foreclosure on real estate collateralizing our Non-Agency RMBS in this area. This may then materially adversely affect our credit loss experience on our Non-Agency RMBS in such area if unexpectedly high rates of default (e.g., in excess of the default rates forecasted) and/or higher than expected loss severities on the mortgages collateralizing such securities were to occur.
The occurrence of a natural disaster (such as an earthquake, tornado, hurricane or a flood) or a significant adverse climate change may cause a sudden decrease in the value of real estate and would likely reduce the value of the properties securing the mortgages collateralizing our Non-Agency RMBS. Since certain natural disasters may not typically be covered by the standard hazard insurance policies maintained by borrowers, the borrowers may have to pay for repairs due to the disasters. Borrowers may not repair their property or may stop paying their mortgages under those circumstances. This would likely cause defaults and credit loss severities to increase on the pool of mortgages securing our Non-Agency RMBS which, unlike Agency RMBS, are not guaranteed as to principal and/or interest by the U.S. Government, any federal agency or federally chartered corporation.
11
We leverage our investments, which may adversely affect our return on our investments and may reduce cash available for distribution to our stockholders.
We leverage our investments through borrowings, generally through the use of repurchase agreements, warehouse facilities, credit facilities and securitizations. We are not required to maintain any specific debt-to-equity ratio. The amount of leverage we use varies depending on our ability to obtain credit facilities, the lenders’ and rating agencies’ estimates of the stability of the investments’ cash flow, and our assessment of the appropriate amount of leverage for the particular assets we are funding. Under some credit facilities, we expect to be required to maintain minimum average cash balances in connection with borrowings. Our return on our investments and cash available for distribution to our stockholders may be reduced to the extent that changes in market conditions prevent us from leveraging our investments, require us to decrease our rate of leverage, increase the amount of collateral we post, or increase the cost of our financing relative to the income that can be derived from the assets acquired. Our debt service payments will reduce cash flow available for distributions to stockholders, which could adversely affect the price of our common stock. We may not be able to meet our debt service obligations, and, to the extent that we cannot, we risk the loss of some or all of our assets to foreclosure or sale to satisfy the obligations. We leverage certain of our assets through repurchase agreements. A decrease in the value of these assets may lead to margin calls which we will have to satisfy. We may not have the funds available to satisfy any such margin calls and we may be forced to sell assets at significantly depressed prices due to market conditions or otherwise. The satisfaction of such margin calls may reduce cash flow available for distribution to our stockholders. Any reduction in distributions to our stockholders or sales of assets at inopportune times or prices may cause the value of our common stock to decline, in some cases, precipitously.
Changes in prepayment rates could negatively affect the value of our investment portfolio, which could result in reduced earnings or losses and negatively affect the cash available for distribution to our stockholders.
There are seldom any restrictions on borrowers’ abilities to prepay their residential mortgage loans. Homeowners tend to prepay mortgage loans faster when interest rates decline. Consequently, owners of the loans have to reinvest the money received from the prepayments at the lower prevailing interest rates. Conversely, homeowners tend not to prepay mortgage loans when interest rates increase. Consequently, owners of the loans are unable to reinvest money that would have otherwise been received from prepayments at the higher prevailing interest rates. This volatility in prepayment rates may affect our ability to maintain targeted amounts of leverage and return on our portfolio of residential mortgage loans, RMBS, and CDOs backed by real estate-related assets and may result in reduced earnings or losses for us and negatively affect the cash available for distribution to our stockholders.
To the extent our investments are purchased at a premium, faster than expected prepayments result in a faster than expected amortization of the premium paid, which would adversely affect our earnings. Conversely, if these investments were purchased at a discount, faster than expected prepayments accelerate our recognition of income.
Increases in interest rates could negatively affect the value of our investments, which could result in reduced earnings or losses and negatively affect the cash available for distribution to our stockholders.
We have invested in and will continue to invest in real estate-related assets by acquiring RMBS, residential mortgage loans, CMBS and CDOs backed by real estate-related assets. Under a normal yield curve, an investment in these assets will decline in value if long-term interest rates increase. Declines in market value may ultimately reduce earnings or result in losses to us, which may negatively affect cash available for distribution to our stockholders. A significant risk associated with these investments is the risk that both long-term and short-term interest rates will increase significantly. If long-term rates were to increase significantly, the market value of these investments would decline, and the duration and weighted average life of the investments would increase. We could realize a loss if these assets were sold. At the same time, an increase in short-term interest rates would increase the amount of interest owed on the repurchase agreements or other adjustable rate financings we may enter into to finance the purchase of these assets. Market values of our investments may decline without any general increase in interest rates for a number of reasons, such as increases in defaults, increases in voluntary prepayments for those investments that are subject to prepayment risk and widening of credit spreads.
In a period of rising interest rates, our interest expense could increase while the interest we earn on our fixed-rate assets would not change, which would adversely affect our profitability.
Our operating results will depend in large part on the differences between the income from our assets, net of credit losses and financing costs. We anticipate that, in most cases, the income from such assets will respond more slowly to interest rate fluctuations than the cost of our borrowings. Consequently, changes in interest rates, particularly short-term interest rates, may significantly influence our net income. Increases in these rates will tend to decrease our net income and market value of our assets. Interest rate fluctuations resulting in our interest expense exceeding our interest income would result in operating losses for us and may limit or eliminate our ability to make distributions to our stockholders. Although we use hedging strategies to protect against increases in interest expense, there is no guarantee the hedge strategy will be effective or will prevent decreases in net income in a period of rising interest rates.
12
We have experienced declines in the market value of our assets resulting in us recording impairments, which have had an adverse effect on our results of operations and financial condition.
A decline in the market value of our MBS or other assets may require us to recognize an other-than-temporary impairment (or “OTTI”) against such assets under GAAP. When the fair value of our MBS is less than its amortized cost, the security is considered impaired. We assess our impaired securities on at least a quarterly basis and designate such impairments as either temporary or other-than-temporary. The determination as to whether an OTTI exists and, if so, the amount we consider other-than-temporarily impaired is subjective, as such determinations are based on both factual and subjective information available at the time of assessment. As a result, the timing and amount of OTTI constitute material estimates that are susceptible to significant change. In the future, we may experience declines in the fair value of our MBS and other assets that could result in additional OTTI that will be recognized in earnings.
The lack of liquidity in our investments may adversely affect our business.
We invest in securities or other instruments that are not liquid. It may be difficult or impossible to obtain third party pricing on the investments we purchase. Illiquid investments typically experience greater price volatility as an active market does not exist. In addition, validating third party pricing for illiquid investments may be more subjective than more liquid investments. The illiquidity of our investments may make it difficult for us to sell such investments if the need or desire arises. In addition, if we are required to liquidate all or a portion of our portfolio quickly, we may realize significantly less than the value at which we have previously recorded our investments. As a result, our ability to vary our portfolio in response to changes in economic and other conditions may be relatively limited, which could adversely affect our results of operations and financial condition.
We depend on third-party service providers, including mortgage servicers, for a variety of services related to our Non-Agency RMBS and whole mortgage loans we may acquire. We are, therefore, subject to the risks associated with third-party service providers.
We depend on a variety of services provided by third-party service providers related to our Non-Agency RMBS and whole mortgage loans we may acquire. We rely on the mortgage servicers who service the mortgage loans backing our Non-Agency RMBS to, among other things, collect principal and interest payments on the underlying mortgages and perform loss mitigation services. Our mortgage servicers and other service providers to our Non-Agency RMBS, such as trustees, bond insurance providers and custodians, may not perform in a manner that promotes our interests. In addition, continued foreclosure avoidance requirements including, among other things, loan modifications may reduce the value of mortgage loans backing our Non-Agency RMBS or whole mortgage loans that we acquire. Mortgage servicers may be incentivized by the Federal government to pursue such loan modifications, as well as forbearance plans and other actions intended to prevent foreclosure, even if such loan modifications and other actions are not in the best interests of the beneficial owners of the mortgage loans. In addition to the financial incentives for mortgage loan servicers to modify loans and take other actions that are intended to prevent foreclosures, legislation has recently been adopted that creates a safe harbor from liability to creditors for servicers that undertake loan modifications and other actions that are intended to prevent foreclosures. Finally, any regulatory effort to delay the initiation or completion of foreclosure proceedings on specified types of residential mortgage loans (some for a limited period of time), may limit the ability of mortgage servicers to take actions that may be essential to preserve the value of the mortgage loans underlying the mortgage servicing rights. Any such limitations are likely to cause delayed or reduced collections from mortgagors and generally increase servicing costs. As a result, the mortgage loan servicers on which we rely may not perform in our best interests or up to our expectations. If our third-party service providers do not perform as expected, our business, financial condition and results of operations and ability to make distributions to our shareholders may be materially adversely affected.
13
Mortgage loan modification programs, future legislative action and changes in the requirements necessary to qualify for refinancing a mortgage may adversely affect the value of, and the returns on, the assets in which we invest.
The U.S. Government, through the Federal Housing Administration, or FHA, and the Federal Deposit Insurance Corporate, or FDIC, has implemented programs designed to provide homeowners with assistance in avoiding residential mortgage loan foreclosures including the Hope for Homeowners Act of 2008, which allows certain distressed borrowers to refinance their mortgages into FHA-insured loans and the Home Affordable Modification Program, or HAMP, which provides a detailed, uniform model for one-time modification of eligible residential mortgage loans. The programs may also involve, among other things, the modification of mortgage loans to reduce the principal amount of the loans or the rate of interest payable on the loans, or to extend the payment terms of the loans. These loan modification programs, including future legislative or regulatory actions and amendments to the bankruptcy laws, that result in the modification of outstanding mortgage loans, as well as changes in the requirements necessary to qualify for refinancing a mortgage may affect the value of, and the returns on, our Non-Agency RMBS and Agency RMBS. Depending on whether or not we purchased an instrument at a premium or discount, the yield we receive may be positively or negatively impacted by any modification.
The U.S. Government's efforts to encourage refinancing of certain loans may affect prepayment rates for mortgage loans in mortgage-backed securities.
In addition to the increased pressure upon residential mortgage loan investors and servicers to engage in loss mitigation activities, the U.S. Government has also expressed a need for refinancing of certain loans, and this encouragement may affect prepayment rates for mortgage loans in mortgage-backed securities. To the extent these and other economic stabilization or stimulus efforts are successful in increasing prepayment speeds for residential mortgage loans, such as those in mortgage-backed securities, that could potentially have a negative impact on our income and operating results, particularly in connection with loans or mortgage-backed securities purchased at a premium or our interest-only securities.
We might not be able to purchase residential mortgage loans, mortgage-backed securities and other investments that meet our investment criteria at favorable spreads over our borrowing costs.
To the extent we purchase assets using leverage, our net income depends on our ability to acquire residential mortgage loans, mortgage-backed securities and other investments at favorable spreads over our borrowing costs. Our investments are selected by our investment team, and our stockholders will not have input into such investment decisions.
We may not realize income or gains from our investments.
We invest to generate both current income and capital appreciation. The investments we invest in may, however, not appreciate in value and, in fact, may decline in value, and the debt securities we invest in may default on interest or principal payments. Accordingly, we may not be able to realize income or gains from our investments. Any gains that we do realize may not be sufficient to offset any other losses we experience. Any income that we realize may not be sufficient to offset our expenses.
Our investments in subordinated RMBS are generally in the “first loss” position and our investments in the mezzanine RMBS are generally in the “second loss” position and therefore subject to losses.
In general, losses on a mortgage loan included in a securitization will be borne first by the equity holder of the issuing trust, and then by the “first loss” subordinated security holder and then by the “second loss” mezzanine holder. In the event of default and the exhaustion of any classes of securities junior to those in which we invest and there is any further loss, we will not be able to recover all of our investment in the securities we purchase. In addition, if the underlying mortgage portfolio has been overvalued by the originator, or if the values subsequently decline and, as a result, less collateral is available to satisfy interest and principal payments due on the related RMBS, the securities in which we invest may effectively become the “first loss” position behind the more senior securities, which may result in significant losses to us. The prices of lower credit quality securities are generally less sensitive to interest rate changes than more highly rated investments, but more sensitive to adverse economic downturns or individual issuer developments. A projection of an economic downturn, for example, could cause a decline in the price of lower credit quality securities because the ability of obligors of mortgages underlying RMBS to make principal and interest payments may be impaired. In such event, existing credit support in the securitization structure may be insufficient to protect us against loss of our principal on these securities.
14
Interest rate caps on our adjustable-rate MBS may adversely affect our profitability.
Adjustable-rate MBS are typically subject to periodic and lifetime interest rate caps. Periodic interest rate caps limit the amount an interest rate can increase during any given period. Lifetime interest rate caps limit the amount an interest rate can increase over the life of the security. Our borrowings typically will not be subject to similar restrictions. Accordingly, in a period of rapidly increasing interest rates, the interest rates paid on our borrowings could increase without limitation while caps could limit the interest rates on our adjustable-rate MBS. This problem is magnified for hybrid adjustable-rate and adjustable-rate MBS that are not fully indexed. Further, some hybrid adjustable-rate and adjustable-rate MBS may be subject to periodic payment caps that result in a portion of the interest being deferred and added to the principal outstanding. As a result, we may receive less cash income on hybrid adjustable-rate and adjustable-rate MBS than we need to pay interest on our related borrowings. These factors could reduce our net interest income or cause us to suffer a loss.
A flat or inverted yield curve may adversely affect adjustable-rate MBS prepayment rates and supply.
Our net interest income varies primarily as a result of changes in interest rates as well as changes in interest rates across the yield curve. When the differential between short-term and long-term benchmark interest rates narrows, the yield curve is said to be “flattening.” We believe that when the yield curve is relatively flat, borrowers have an incentive to refinance into hybrids with longer initial fixed-rate periods and fixed rate mortgages, causing our MBS to experience faster prepayments. In addition, a flatter yield curve generally leads to fixed-rate mortgage rates that are closer to the interest rates available on ARMs, potentially decreasing the supply of adjustable-rate RMBS. At times, short-term interest rates may increase and exceed long-term interest rates, causing an inverted yield curve. When the yield curve is inverted, fixed-rate mortgage rates may approach or be lower than mortgage rates on ARMs, further increasing adjustable-rate MBS prepayments and further negatively impacting adjustable-rate MBS supply. Increases in prepayments on our MBS portfolio cause our premium amortization to accelerate, lowering the yield on such assets. If this happens, we could experience a decrease in net income or incur a net loss during these periods, which may negatively impact our distributions to stockholders.
A significant portion of our portfolio investments will be recorded at fair value as determined in accordance with our pricing policy and, as a result, there will be uncertainty as to the value of these investments.
A significant portion of our portfolio of investments is in the form of securities that are not publicly traded. The fair value of securities and other investments that are not publicly traded may not be readily determinable. It may be difficult or impossible to obtain third party pricing on the investments we purchase. We value these investments quarterly at fair value, as determined in accordance with our valuation policy. Because such valuations are inherently uncertain, may fluctuate over short periods of time and may be based on estimates, our determinations of fair value may differ materially from the values that would have been used if a ready market for these securities existed. The value of our common stock could be adversely affected if our determinations regarding the fair value of these investments were materially higher than the values that we ultimately realize upon their disposal.
A prolonged economic slowdown, a recession or declining real estate values could impair our investments and negatively affect our operating results.
Many of our investments are susceptible to economic slowdowns or recessions, which could lead to financial losses in our investments and a decrease in revenues, net income and assets. Unfavorable economic conditions also could increase our funding costs, limit our access to the capital markets or result in a decision by lenders not to extend credit to us. These events could prevent us from increasing investments and have an adverse effect on our operating results.
15
We may be required to repurchase mortgage loans or indemnify investors if we breach representations and warranties, which could negatively affect our earnings.
If we sell loans, we would be required to make customary representations and warranties about such loans to the loan purchaser. Our residential mortgage loan sale agreements will require us to repurchase or substitute loans in the event we breach a representation or warranty given to the loan purchaser. In addition, we may be required to repurchase loans as a result of borrower fraud or in the event of early payment default on a mortgage loan. Likewise, we are required to repurchase or substitute loans if we breach a representation or warranty in connection with our securitizations. The remedies available to a purchaser of mortgage loans are generally broader than those available to us against the originating broker or correspondent. Further, if a purchaser enforces its remedies against us, we may not be able to enforce the remedies we have against the sellers. The repurchased loans typically can only be financed at a steep discount to their repurchase price, if at all. They are also typically sold at a significant discount to the unpaid principal balance. Significant repurchase activity could negatively affect our cash flow, results of operations, financial condition and business prospects.
We may incur losses in connection with executing or participating in future securitizations which could materially and adversely impact our business and financial condition.
There are a number of factors that may cause us to incur a loss executing or participating in future securitizations. For example, the price we pay for the mortgage loans that we securitize is impacted by the level of competition in the marketplace for acquiring residential mortgage loans. In addition, the cost to us of the short-term debt that we use to finance our holdings of mortgage loans prior to securitization is affected by a number of factors including the availability of this type of financing to us, the interest rate on this type of financing, the duration of the financing we incur, and the percentage of our mortgage loans for which third parties are willing to provide short-term financing.
We may also suffer losses if the value of the mortgage loans we acquire declines prior to securitization. Declines in the value of a residential mortgage loan can be due to, among other things, changes in interest rates and changes in the credit quality of the loan. In addition, transaction costs incurred in executing transactions impact any liability that we may incur, or may be required to reserve for; in connection with executing a transaction can cause a loss to us. To the extent that we incur a loss executing or participating in future securitizations for the reasons described above or for other reasons, it could materially and adversely impact our business and financial condition.
Our due diligence of potential investments may not reveal all of the liabilities associated with such investments and may not reveal other weaknesses in such investments, which could lead to investment losses.
Before making an investment, we assess the strengths and weaknesses of the originator or issuer of the asset as well as other factors and characteristics that are material to the performance of the investment. In making the assessment and otherwise conducting customary due diligence, we rely on resources available to us and, in some cases, an investigation by third parties. This process is particularly important with respect to newly formed originators or issuers with unrated and other subordinated tranches of MBS and ABS because there may be little or no information publicly available about these entities and investments. There can be no assurance that our due diligence process will uncover all relevant facts or that any investment will be successful.
Our real estate investments are subject to risks particular to real property.
We own assets secured by real estate and may own real estate directly in the future, either through direct investments or upon a default of mortgage loans. Real estate investments are subject to various risks, including:
|
|
·
|
acts of God, including earthquakes, hurricanes, floods and other natural disasters, that may result in uninsured losses;
|
|
|
·
|
acts of war or terrorism, including the consequences of terrorist attacks, such as those that occurred on September 11, 2001;
|
|
|
·
|
adverse changes in national and local economic and market conditions;
|
|
|
·
|
changes in governmental laws and regulations, fiscal policies and zoning ordinances and the related costs of compliance with laws and regulations, fiscal policies and ordinances;
|
|
|
·
|
costs of remediation and liabilities associated with environmental conditions such as indoor mold; and
|
|
|
·
|
the potential for uninsured or under-insured property losses.
|
16
If any of these or similar events occurs, it may reduce our return from an affected property or investment and reduce or eliminate our ability to make distributions to stockholders.
We may be exposed to environmental liabilities with respect to properties to which we take title.
In the course of our business, we may take title to real estate, and, if we do take title, we could be subject to environmental liabilities with respect to these properties. In such a circumstance, we may be held liable to a governmental entity or to third parties for property damage, personal injury, investigation, and clean-up costs incurred by these parties in connection with environmental contamination, or may be required to investigate or clean up hazardous or toxic substances, or chemical releases at a property. The costs associated with investigation or remediation activities could be substantial. If we ever become subject to significant environmental liabilities, our business, financial condition, liquidity, and results of operations could be materially and adversely affected.
We have and may in the future invest in RMBS collateralized by subprime mortgage loans, which are subject to increased risks.
We may in the future invest in RMBS backed by collateral pools of subprime residential mortgage loans. ‘‘Subprime’’ mortgage loans refer to mortgage loans that have been originated using underwriting standards that are less restrictive than the underwriting requirements used as standards for other first and junior lien mortgage loan purchase programs, such as the programs of Fannie Mae and Freddie Mac. These lower standards include mortgage loans made to borrowers having imperfect or impaired credit histories (including outstanding judgments or prior bankruptcies), mortgage loans where the amount of the loan at origination is 80% or more of the value of the mortgage property, mortgage loans made to borrowers with low credit scores, mortgage loans made to borrowers who have other debt that represents a large portion of their income and mortgage loans made to borrowers whose income is not required to be disclosed or verified. Due to economic conditions, including increased interest rates and lower home prices, as well as aggressive lending practices, subprime mortgage loans have in recent periods experienced increased rates of delinquency, foreclosure, bankruptcy and loss, and they are likely to continue to experience delinquency, foreclosure, bankruptcy and loss rates that are higher, and that may be substantially higher, than those experienced by mortgage loans underwritten in a more traditional manner. Thus, because of the higher delinquency rates and losses associated with subprime mortgage loans, the performance of RMBS collateralized by subprime mortgage loans in which we may invest could be correspondingly adversely affected, which could adversely impact our results of operations, financial condition and business.
We may invest in securities in the developing Agency risk transfer sector that are subject to mortgage credit risk.
We may invest in securities in the developing Agency risk transfer sector (“CRT Sector”). The CRT Sector is comprised of the risk sharing transactions issued by Fannie Mae (“CAS”) and Freddie Mac (“STACR”), and similarly structured transactions arranged by third party market participants. The securities issued in the CRT Sector are designed to synthetically transfer mortgage credit risk from Fannie Mae and Freddie Mac to private investors. Currently, CAS and STACR transactions are structured as unsecured and unguaranteed bonds issued by Fannie Mae or Freddie Mac, respectively, whose principal payments are determined by the delinquency and prepayment experience of a reference pool of mortgages originated and guaranteed by Fannie Mae or Freddie Mac, respectively, in a particular quarter. Transactions arranged by third party market participants in the CRT Sector are similarly structured to reference a specific pool of loans that have been securitized by Fannie Mae or Freddie Mac and synthetically transfer mortgage credit risk related to those loans to the purchaser of the securities. The holder of the securities in the CRT Sector has the risk that the borrowers may default on their obligations to make full and timely payments of principal and interest. Investments in securities in the CRT Sector could cause us to incur losses of income from, and/or losses in market value relating to, these assets if there are defaults of principal and/or interest on the pool of mortgages referenced in the transaction.
17
We utilize analytical models and data in connection with the valuation of our investments, and any incorrect, misleading or incomplete information used in connection therewith would subject us to potential risks.
Given the complexity of our investments and strategies, we must rely heavily on analytical models and information and data supplied by third-parties (“Models and Data”). Models and Data will be used to value investments or potential investments and also in connection with hedging our investments. When Models and Data prove to be incorrect, misleading or incomplete, any decisions made in reliance thereon expose us to potential risks. For example, by relying on Models and Data, especially valuation models, we may be induced to buy certain investments at prices that are too high, to sell certain other investments at prices that are too low or to miss favorable opportunities altogether. Similarly, any hedging based on faulty Models and Data may prove to be unsuccessful. Furthermore, any valuations of our investments that are based on valuation models may prove to be incorrect.
Some of the risks of relying on analytical models and third-party data are particular to analyzing tranches from securitizations, such as RMBS. These risks include, but are not limited to, the following: (i) collateral cash flows and/or liability structures may be incorrectly modeled in all or only certain scenarios, or may be modeled based on simplifying assumptions that lead to errors; (ii) information about collateral may be incorrect, incomplete, or misleading; (iii) collateral or bond historical performance (such as historical prepayments, defaults, cash flows, etc.) may be incorrectly reported, or subject to interpretation (e.g., different issuers may report delinquency statistics based on different definitions of what constitutes a delinquent loan); or (iv) collateral or bond information may be outdated, in which case the models may contain incorrect assumptions as to what has occurred since the date information was last updated.
Some of the analytical models we use, such as mortgage prepayment models or mortgage default models, are predictive in nature. The use of predictive models has inherent risks. For example, such models may incorrectly forecast future behavior, leading to potential losses on a cash flow and/or a mark-to-market basis. In addition, the predictive models we use may differ substantially from those models used by other market participants, with the result that valuations based on these predictive models may be substantially higher or lower for certain investments than actual market prices. Furthermore, since predictive models are usually constructed based on historical data supplied by third-parties, the success of relying on such models may depend heavily on the accuracy and reliability of the supplied historical data and the ability of these historical models to accurately reflect future periods.
All valuation models rely on correct market data inputs. If incorrect market data is entered into even a well-designed valuation model, the resulting valuations will be incorrect. However, even if market data is appropriately captured in the model, the resulting “model prices” will often differ substantially from market prices, especially for securities with complex characteristics, such as derivative securities.
Our use of models in connection with the valuation of our assets subjects us to potential risks in the event that such models are incorrect, misleading or based on incomplete information.
As part of our risk management process, we may use models to evaluate, depending on the asset class, house price appreciation and depreciation by county, region, prepayment speeds and foreclosure frequency, cost and timing. Certain assumptions used as inputs to the models may be based on historical trends. These trends may not be indicative of future results. Furthermore, the assumptions underlying the models may prove to be inaccurate, causing the model output also to be incorrect. In the event models and data prove to be incorrect, misleading or incomplete, any decisions made in reliance thereon expose us to potential risks. For example, by relying on incorrect models and data, we may be induced to buy certain assets at prices that are too high, to sell certain other assets at prices that are too low or to miss favorable opportunities altogether.
Valuations of some of our assets are subject to inherent uncertainty, may be based on estimates, may fluctuate over short periods of time and may differ from the values that would have been used if a ready market for these assets existed.
While the determination of the fair value of our investment assets takes into consideration valuations provided by third-party dealers and pricing services, the final determination of exit price fair values for our investment assets is based on our judgment, and such valuations may differ from those provided by third-party dealers and pricing services. Valuations of certain assets may be difficult to obtain or may not be reliable. In general, dealers and pricing services heavily disclaim their valuations as such valuations are not intended to be binding bid prices. Additionally, dealers may claim to furnish valuations only as an accommodation and without special compensation, and so they may disclaim any and all liability arising out of any inaccuracy or incompleteness in valuations. Depending on the complexity and illiquidity of an asset, valuations of the same asset can vary substantially from one dealer or pricing service to another.
18
Our results of operations, financial condition and business could be materially adversely affected if our fair value determinations of these assets were materially higher than the values that would exist if a ready market existed for these assets.
We are dependent on our executive officers and other key personnel for our success, particularly now that we are an internally managed company, the loss of any of whom may materially adversely affect our business.
Our success is dependent upon the efforts, experience, diligence, skill and network of business contacts of our executive officers and key personnel, particularly since internalizing our company in 2015. The departure of any of our executive officers and/or key personnel could have a material adverse effect on our operations and performance.
We may change our investment strategy, asset allocation, or financing plans without stockholder consent, which may result in riskier investments.
We may change our investment strategy, asset allocation, or financing plans at any time without the consent of our stockholders, which could result in our making investments that are different from, and possibly riskier than, the investments described in this 2015 Form 10-K. A change in our investment strategy or financing plans may increase our exposure to interest rate and default risk and real estate market fluctuations. Furthermore, a change in our asset allocation could result in our making investments in asset categories different from those described in this 2015 Form 10-K. These changes could adversely affect the market price of our common stock and our ability to make distributions to our stockholders.
We may engage in new business initiatives and invest in different types of assets than we are not accustomed to and these activities could expose us to new, different or increased risks.
We continually evaluate new business opportunities and investment strategies that may allow us to diversify our business. We have and may in the future invest in a variety of mortgage-related and other financial assets that may or may not be closely related to our existing business. Additionally, we may enter other operating businesses that may or may not be closely related to our current business. These new assets or business operations may have new, different or increased risks than what we are currently exposed to in our business and we may not be able to manage these risks successfully. Additionally, when investing in new assets or businesses we will be exposed to the risk that those assets, or income generated by those assets or businesses, will affect our ability to meet the requirements to maintain our REIT status or our status as exempt from registration under the 1940 Act. If we are not able to successfully manage the risks associated with new assets types or businesses, it could have an adverse effect on our business, results of operations and financial condition.
We operate in a highly competitive market for investment opportunities and more established competitors may be able to compete more effectively for investment opportunities than we can.
A number of entities compete with us to make the types of investments that we plan to make. We compete with other REITs, public and private funds, commercial and investment banks and commercial finance companies. Many of our competitors are substantially larger and have considerably greater financial, technical and marketing resources than we do. Several other REITs have raised, or are expected to raise, significant amounts of capital, and may have investment objectives that overlap with ours, which may create competition for investment opportunities. Some competitors may have a lower cost of funds and access to funding sources that are not available to us. In addition, some of our competitors may have higher risk tolerances or different risk assessments, which could allow them to consider a wider variety of investments and establish more favorable relationships than us. We cannot assure you that the competitive pressures we face will not have a material adverse effect on our business, financial condition and results of operations. Also, as a result of this competition, we may not be able to take advantage of attractive investment opportunities from time to time, and we can offer no assurance that we will be able to identify and make investments that are consistent with our investment objectives.
19
We are highly dependent on information systems and third parties, and systems failures could significantly disrupt our business, which may, in turn, negatively affect the market price of our common stock and our ability to pay dividends to our stockholders.
Our business is highly dependent on communications and information systems. Any failure or interruption of our systems or cyber-attacks or security breaches of our networks or systems could cause delays or other problems in our securities trading activities, including mortgage-backed securities trading activities, which could have a material adverse effect on our operating results and negatively affect the market price of our common stock and our ability to pay dividends to our stockholders. In addition, we also face the risk of operational failure, termination or capacity constraints of any of the third parties with which we do business or that facilitate our business activities, including clearing agents or other financial intermediaries we use to facilitate our securities transactions.
Computer malware, viruses, and computer hacking and phishing attacks have become more prevalent in our industry and may occur on our systems in the future. We rely heavily on our financial, accounting and other data processing systems. It is difficult to determine what, if any, negative impact may directly result from any specific interruption or cyber-attacks or security breaches of our networks or systems or any failure to maintain performance, reliability and security of our technical infrastructure. However, any such computer malware, viruses, and computer hacking and phishing attacks may negatively affect our operations.
Risks Associated With Adverse Developments in the Mortgage Finance and Credit Markets
Market conditions for mortgages and mortgage-related assets as well as the broader financial markets may materially adversely affect the value of the assets in which we invest.
Our results of operations are materially affected by conditions in the markets for mortgages and mortgage-related assets, including MBS, as well as the broader financial markets and the economy generally. Beginning in 2007, significant adverse changes in financial market conditions resulted in a deleveraging of the entire global financial system and the forced sale of large quantities of mortgage-related and other financial assets, which resulted in significant volatility in the market for mortgages and mortgage-related assets and significant losses by certain commercial banks, investment banks and insurance companies with exposure to the residential mortgage market. The 2007-2008 financial crisis and its aftermath impacted investor perception of the risk associated with residential MBS, real estate-related securities and various other asset classes in which we invest, which has continued, in varying degrees through the present. More recently, concerns over economic growth rates, continuing relatively high levels of unemployment and uncertainty regarding future U.S. monetary policy have contributed to increased interest rate volatility. As a result of these circumstances, values for residential MBS, real estate-related securities and various other asset classes in which we may invest have experienced volatility. Any decline in the value of our investments, or perceived market uncertainty about their value, would likely make it difficult for us to obtain financing on favorable terms or at all, or maintain our compliance with terms of any financing arrangements already in place. Although markets have stabilized more recently, renewed volatility and/or deterioration in the broader residential mortgage and MBS markets could materially adversely affect the performance and market value of our investments.
Any downgrade or perceived potential of a downgrade, of U.S. sovereign credit ratings by the various credit rating agencies may have a materially adverse effect on our business.
During the summer of 2011, Standard & Poor’s Ratings Services (or S&P), one of the major credit rating agencies, downgraded the U.S. sovereign credit rating in response to the protracted debate over the “U.S. debt ceiling limit” and S&P’s perception of the U.S. Government’s ability to address its long-term budget deficit. At the same time, S&P also lowered the credit ratings of the government sponsored enterprises, or GSEs, in response to the downgrade in the U.S. sovereign credit rating, as the value of the Agency MBS issued by the GSEs and their ability to meet their obligations under such Agency MBS are largely determined by the support provided to them by the U.S. Government and market perceptions of the strength of such support and the likelihood of its continuity.
20
We could be adversely affected in a number of ways in the event of a default by the U.S. Government, a further downgrade by S&P or a downgrade of the U.S. sovereign credit rating by another credit rating agency Such adverse effects could include higher financing costs and/or a reduction in the amount of financing provided based on the market value of collateral posted under our repurchase agreements and other financing arrangements. In addition, although the rating agencies have more recently determined that the GSEs’ outlook is generally stable, to the extent that the credit rating of any or all of the GSEs were to be downgraded in the future, the value of our Agency MBS could be adversely affected. These outcomes could in turn materially adversely affect our operations and financial condition in a number of ways, including a reduction in the net interest spread between our assets and associated repurchase agreement borrowings or a decrease in our ability to obtain repurchase agreement financing on acceptable terms, or at all.
The conservatorship of Fannie Mae and Freddie Mac, their reliance upon the U.S. Government for solvency, and related efforts that may significantly affect Fannie Mae and Freddie Mac and their relationship with the U.S. Government, may adversely affect our business, operations and financial condition.
Due to increased market concerns about Fannie Mae and Freddie Mac’s ability to withstand future credit losses associated with securities held in their investment portfolios and on which they provide guarantees, without the direct support of the U.S. Government, Congress passed the Housing and Economic Recovery Act of 2008, or the HERA. Among other things, the HERA established the Federal Housing Finance Agency, or FHFA, which has broad regulatory powers over Fannie Mae and Freddie Mac. On September 6, 2008, the FHFA placed Fannie Mae and Freddie Mac into conservatorship and, together with the Treasury, established a program designed to boost investor confidence in Fannie Mae’s and Freddie Mac’s debt and mortgage-backed securities. As the conservator of Fannie Mae and Freddie Mac, the FHFA controls and directs their operations and may (1) take over the assets of and operate Fannie Mae and Freddie Mac with all the powers of their shareholders, directors and officers of Fannie Mae and Freddie Mac and conduct all business of Fannie Mae and Freddie Mac; (2) collect all obligations and money due to Fannie Mae and Freddie Mac; (3) perform all functions of Fannie Mae and Freddie Mac which are consistent with the conservator’s appointment; (4) preserve and conserve the assets and property of Fannie Mae and Freddie Mac; and (5) contract for assistance in fulfilling any function, activity, action or duty of the conservator.
The problems faced by Fannie Mae and Freddie Mac resulting in their placement into federal conservatorship and receipt of significant U.S. Government support have sparked debate among some federal policy makers regarding the continued role of the U.S. Government in providing liquidity for mortgage loans and mortgage-backed securities. With Fannie Mae’s and Freddie Mac’s future under debate, the nature of their guarantee obligations could be considerably limited relative to historical measurements. Any changes to the nature of their guarantee obligations could redefine what constitutes a mortgage-backed security and could have broad adverse implications for the market and our business, operations and financial condition. If Fannie Mae or Freddie Mac are eliminated, or their structures change radically (i.e., limitation or removal of the guarantee obligation), we may be unable to acquire Agency RMBS.
Although the Treasury previously committed capital to Fannie Mae and Freddie Mac through 2012, and in the report issued on February 11, 2011 by the U.S. Department of Treasury titled “Reforming America’s Housing Finance Market” committed to providing sufficient capital to enable Fannie Mae and Freddie Mac to meet their current and future guarantee obligations, there can be no assurance that these actions will be adequate for their needs. If these actions are inadequate, Fannie Mae and Freddie Mac could continue to suffer losses and could fail to honor their guarantees and other obligations. Furthermore, the current credit support provided by the Treasury to Fannie Mae and Freddie Mac, and any additional credit support it may provide in the future, could have the effect of lowering the interest rates we expect to receive from RMBS, and tightening the spread between the interest we earn on our RMBS and the cost of financing those assets.
Future policies that change the relationship between Fannie Mae and Freddie Mac and the U.S. Government, including those that result in their winding down, nationalization, privatization, or elimination, may create market uncertainty and have the effect of reducing the actual or perceived credit quality of securities issued or guaranteed by Fannie Mae or Freddie Mac. As a result, such policies could increase the risk of loss on investments in mortgage-backed securities guaranteed by Fannie Mae and/or Freddie Mac. It also is possible that such policies could adversely impact the market for such securities and other securities types and spreads at which they trade. All of the foregoing could materially and adversely affect our business, operations and financial condition.
21
Adverse developments involving major financial institutions and our lenders, including European counterparties, could result in a rapid reduction in our ability to borrow and materially adversely affect our business, profitability and liquidity.
A significant portion of our Agency MBS is financed with repurchase agreements. We secure our borrowings under these agreements by pledging our Agency MBS as collateral to the lender. The collateral we pledge exceeds the amount of the borrowings under each agreement. If the counterparty to the repurchase agreement defaults on its obligations and we are not able to recover our pledged assets, we are at risk of losing the over-collateralized amount. The amount of this exposure is the difference between the amount loaned to us plus interest due to the counterparty and the fair value of the collateral pledged by us to the lender including accrued interest receivable on such collateral.
We also use interest rate swaps to manage our interest rate risks. Under these swap agreements, we pledge Agency MBS or cash as collateral as part of a margin arrangement for interest rate swaps that are in an unrealized loss position. If a counterparty were to default on its obligation, we would be exposed to a loss to a swap counterparty to the extent that the amount of our Agency MBS pledged exceeded the unrealized loss on the associated swaps and we were not able to recover the excess collateral.
Over the past several years, several large financial institutions, including those domiciled in Europe, have experienced financial difficulty and have been either rescued by government assistance or by other large banks or institutions. Some of these financial institutions have provided us financing under repurchase agreements or we have entered into interest rate swaps with such institutions. Any future adverse developments involving major financial institutions or our lenders could affect our ability to borrow and materially adversely affect our business, profitability and liquidity.
In addition, we have entered into repurchase agreements and/or interest rate swaps with six financial institution counterparties that are either domiciled in Europe or a U.S.-based subsidiary of a European domiciled financial institution. It is possible that European credit crisis may impact the operations of the U.S. subsidiaries of a European domiciled financial institution. Our financings and operations could be adversely affected by such events.
Risks Related to Financing
Failure to procure adequate capital and funding on favorable terms, or at all, would adversely affect our results and may, in turn, negatively affect the market price of shares of our common stock and our ability to distribute dividends to our stockholders.
We depend upon the availability of adequate funding and capital for our operations. We intend to finance our assets over the long-term through a variety of means, including repurchase agreements, credit facilities and securitizations. Our access to capital depends upon a number of factors, over which we have little or no control, including:
|
|
·
|
general market conditions;
|
|
|
·
|
the market’s perception of our growth potential;
|
|
|
·
|
our current and potential future earnings and cash distributions;
|
|
|
·
|
the market price of the shares of our capital stock; and
|
|
|
·
|
the market’s view of the quality of our assets.
|
We have used and may in the future use a number of sources to finance our investments, including repurchase agreements, warehouse facilities and securitizations. Current market conditions have affected the cost and availability of financing from each of these sources — and their individual providers — to different degrees; some are available but at a high cost, and some are largely unaffected. For example, in the repurchase agreement market, borrowers have been affected differently depending on the type of security they are financing. Non-Agency RMBS have been harder or more expensive to finance, depending on the type of assets collateralizing the RMBS.
22
The impairment of financial institutions could negatively affect us. If one or more major market participants fail or otherwise experience a major liquidity crisis, it could adversely affect the marketability of all fixed income securities and this could negatively impact the value of the securities we acquire, thus reducing our net book value.
Furthermore, if any of our lenders or any of our potential lenders are unwilling or unable to provide us with financing, we could be forced to sell our securities or residential mortgage loans at an inopportune time when prices are depressed.
Our business, results of operations and financial condition may be materially adversely affected by disruptions in the financial markets. We cannot assure you, under such extreme conditions, that these markets will remain an efficient source of long-term financing for our assets. If our strategy is not viable, we will have to find alternative forms of financing for our assets, which may not be available. Further, as a REIT, we are required to distribute annually at least 90% of our REIT taxable income (subject to certain adjustments) to our stockholders and are, therefore, not able to retain significant amounts of our earnings for new investments. We cannot assure you that any, or sufficient, funding or capital will be available to us in the future on terms that are acceptable to us. If we cannot obtain sufficient funding on acceptable terms, there may be a negative impact on the market price of our common stock and our ability to make distributions to our stockholders. Moreover, our ability to grow will be dependent on our ability to procure additional funding. To the extent we are not able to raise additional funds through the issuance of additional equity or borrowings, our growth will be constrained.
Certain financing facilities may contain covenants that restrict our operations and may inhibit our ability to grow our business and increase revenues.
Certain financing facilities we may enter into contain restrictions, covenants, and representations and warranties that, among other things, may require us to satisfy specified financial, asset quality, loan eligibility and loan performance tests. If we fail to meet or satisfy any of these covenants or representations and warranties, we would be in default under these agreements and our lenders could elect to declare all amounts outstanding under the agreements to be immediately due and payable, enforce their respective interests against collateral pledged under such agreements and restrict our ability to make additional borrowings. Certain financing agreements may contain cross-default provisions, so that if a default occurs under any one agreement, the lenders under our other agreements could also declare a default. The covenants and restrictions we expect in our financing facilities may restrict our ability to, among other things:
|
|
·
|
incur or guarantee additional debt;
|
|
|
·
|
make certain investments or acquisitions;
|
|
|
·
|
make distributions on or repurchase or redeem capital stock;
|
|
|
·
|
engage in mergers or consolidations;
|
|
|
·
|
finance mortgage loans with certain attributes;
|
|
|
·
|
reduce liquidity below certain levels;
|
|
|
·
|
grant liens;
|
|
|
·
|
incur operating losses for more than a specified period;
|
|
|
·
|
enter into transactions with affiliates; and
|
|
|
·
|
hold mortgage loans for longer than established time periods.
|
These restrictions may interfere with our ability to obtain financing, or to engage in other business activities, which may have a significant negative impact on our business, financial condition, liquidity and results of operations. A default and resulting repayment acceleration could significantly reduce our liquidity, which could require us to sell our assets to repay amounts due and outstanding. This could also significantly harm our business, financial condition, results of operations, and our ability to make distributions, which could cause the value of our common stock to decline. A default will also significantly limit our financing alternatives such that we will be unable to pursue our leverage strategy, which could curtail our investment returns.
23
The repurchase agreements, warehouse facilities and credit facilities that we use to finance our investments may require us to provide additional collateral and may restrict us from leveraging our assets as fully as desired.
We use repurchase agreements, warehouse facilities and credit facilities to finance our investments. We currently have uncommitted repurchase agreements with 25 counterparties for financing our MBS. Our repurchase agreements are uncommitted and the counterparty may refuse to advance funds under the agreements to us. If the market value of the loans or securities pledged or sold by us to a funding source decline in value, we may be required by the lending institution to provide additional collateral or pay down a portion of the funds advanced, but we may not have the funds available to do so. Posting additional collateral will reduce our liquidity and limit our ability to leverage our assets, which could adversely affect our business. In the event we do not have sufficient liquidity to meet such requirements, lending institutions can accelerate repayment of our indebtedness, increase our borrowing rates, liquidate our collateral or terminate our ability to borrow. Such a situation would likely result in a rapid deterioration of our financial condition and possibly necessitate a filing for protection under the U.S. Bankruptcy Code. Further, financial institutions may require us to maintain a certain amount of cash that is not invested or to set aside non-levered assets sufficient to maintain a specified liquidity position which would allow us to satisfy our collateral obligations. As a result, we may not be able to leverage our assets as fully as we would choose which could reduce our return on equity. If we are unable to meet these collateral obligations, then, as described above, our financial condition could deteriorate rapidly.
If the counterparty to our repurchase transactions defaults on its obligation to resell the underlying security back to us at the end of the transaction term, or if the value of the underlying security has declined as of the end of that term or if we default on our obligations under the repurchase agreement, we will lose money on our repurchase transactions.
When we engage in a repurchase transaction, we generally sell securities to the transaction counterparty and receive cash from the counterparty. The counterparty is obligated to resell the securities back to us at the end of the term of the transaction, which is typically 30-90 days. Because the cash we receive from the counterparty when we initially sell the securities to the counterparty is less than the value of those securities (this difference is referred to as the haircut), if the counterparty defaults on its obligation to resell the securities back to us we would incur a loss on the transaction equal to the amount of the haircut (assuming there was no change in the value of the securities). We would also lose money on a repurchase transaction if the value of the underlying securities has declined as of the end of the transaction term, as we would have to repurchase the securities for their initial value but would receive securities worth less than that amount. Any losses we incur on our repurchase transactions could adversely affect our earnings, and thus our cash available for distribution to our stockholders. If we default on one of our obligations under a repurchase transaction, the counterparty can terminate the transaction and cease entering into any other repurchase transactions with us. In that case, we would likely need to establish a replacement repurchase facility with another repurchase dealer in order to continue to leverage our portfolio and carry out our investment strategy. There is no assurance we would be able to establish a suitable replacement facility.
Our rights under our repurchase agreements are subject to the effects of the bankruptcy laws in the event of the bankruptcy or insolvency of us or our lenders under the repurchase agreements.
In the event of our insolvency or bankruptcy, certain repurchase agreements may qualify for special treatment under the U.S. Bankruptcy Code, the effect of which, among other things, would be to allow the lender under the applicable repurchase agreement to avoid the automatic stay provisions of the U.S. Bankruptcy Code and to foreclose on the collateral agreement without delay. In the event of the insolvency or bankruptcy of a lender during the term of a repurchase agreement, the lender may be permitted, under applicable insolvency laws, to repudiate the contract, and our claim against the lender for damages may be treated simply as an unsecured creditor. In addition, if the lender is a broker or dealer subject to the Securities Investor Protection Act of 1970, or an insured depository institution subject to the Federal Deposit Insurance Act, our ability to exercise our rights to recover our securities under a repurchase agreement or to be compensated for any damages resulting from the lender’s insolvency may be further limited by those statutes. These claims would be subject to significant delay and, if and when received, may be substantially less than the damages we actually incur.
24
An increase in our borrowing costs relative to the interest we receive on our assets may adversely affect our profitability, and thus our cash available for distribution to our stockholders.
As our repurchase agreements and other short-term borrowings mature, we will be required either to enter into new borrowings or to sell certain of our investments. An increase in short-term interest rates at the time that we seek to enter into new borrowings would reduce the spread between our returns on our assets and the cost of our borrowings. This would adversely affect our returns on our assets that are subject to prepayment risk, including our RMBS, which might reduce earnings and, in turn, cash available for distribution to our stockholders.
If we issue senior securities we will be exposed to additional risks.
If we decide to issue senior securities in the future, it is likely that they will be governed by an indenture or other instrument containing covenants restricting our operating flexibility. Additionally, any convertible or exchangeable securities that we issue in the future may have rights, preferences and privileges more favorable than those of our common stock and may result in dilution to owners of our common stock. We and, indirectly, our stockholders, will bear the cost of issuing and servicing such securities.
Our securitizations will expose us to additional risks.
We securitize and may continue to securitize certain of our portfolio investments to generate cash for funding new investments. We expect to structure these transactions either as financing transactions or as sales for GAAP. In each such transaction, we convey a pool of assets to a special purpose vehicle, the issuing entity, and the issuing entity issues one or more classes of non-recourse notes pursuant to the terms of an indenture. The notes are secured by the pool of assets. The securitization of our portfolio investments might magnify our exposure to losses on those portfolio investments because any interest we retain in the issuing entity would be subordinate to the notes issued to investors and we would, therefore, absorb all of the losses sustained with respect to a securitized pool of assets before the owners of the notes experience any losses. Moreover, we cannot be assured that we will be able to access the securitization market, or be able to do so at favorable rates. The inability to securitize our portfolio could hurt our performance and our ability to grow our business.
We depend on warehouse and repurchase facilities and credit facilities to execute our business plan, and our inability to access funding could have a material adverse effect on our results of operations, financial condition and business.
Our ability to fund our investments depends to a large extent upon our ability to secure warehouse, repurchase and credit financing on acceptable terms. We can provide no assurance that we will be successful in establishing sufficient warehouse, repurchase, and credit facilities. In addition, because warehouse, repurchase, and credit facilities are short-term commitments of capital, the lenders may respond to market conditions, which may favor an alternative investment strategy for them, making it more difficult for us to secure continued financing. During certain periods of the credit cycle, such as recently, lenders may curtail their willingness to provide financing. If we are not able to renew our then existing warehouse, repurchase, and credit facilities or arrange for new financing on terms acceptable to us, or if we default on our covenants or are otherwise unable to access funds under any of these facilities, we will have to curtail our asset acquisition activities.
It is possible that the lenders that provide us with financing could experience changes in their ability to advance funds to us, independent of our performance or the performance of our investments, including our mortgage loans. In addition, if the regulatory capital requirements imposed on our lenders change, they may be required to significantly increase the cost of the warehouse facilities that they provide to us. Our lenders also may revise their eligibility requirements for the types of residential mortgage loans they are willing to finance or the terms of such financings, based on, among other factors, the regulatory environment and their management of perceived risk, particularly with respect to assignee liability. Financing of equity-based lending, for example, may become more difficult in the future. Moreover, the amount of financing we will receive under our warehouse and repurchase facilities will be directly related to the lenders’ valuation of the assets that secure the outstanding borrowings. Typically warehouse, repurchase, and credit facilities grant the respective lender the absolute right to reevaluate the market value of the assets that secure outstanding borrowings at any time. If a lender determines in its sole discretion that the value of the assets has decreased, it has the right to initiate a margin call. A margin call would require us to transfer additional assets to such lender without any advance of funds from the lender for such transfer or to repay a portion of the outstanding borrowings. Any such margin call could have a material adverse effect on our results of operations, financial condition, business, liquidity and ability to make distributions to our stockholders, and could cause the value of our common stock to decline. We may be forced to sell assets at significantly depressed prices to meet such margin calls and to maintain adequate liquidity, which could cause us to incur losses. Moreover, to the extent we are forced to sell assets at such time, given market conditions, we may be forced to sell assets at the same time as others facing similar pressures to sell similar assets, which could greatly exacerbate a difficult market environment and which could result in our incurring significantly greater losses on our sale of such assets. In an extreme case of market duress, a market may not even be present for certain of our assets at any price.
25
Hedging against interest rate exposure may not be successful in mitigating the risks associated with interest rates and may adversely affect our earnings, which could reduce our cash available for distribution to our stockholders.
Subject to maintaining our qualification as a REIT, we pursue various hedging strategies to seek to reduce our exposure to losses from adverse changes in interest rates. Our hedging activity varies in scope based on the level and volatility of interest rates, the type of assets held, financing used and other changing market conditions. There are no perfect hedging strategies, and interest rate hedging may fail to protect us from loss. Alternatively, we may fail to properly assess a risk to our investment portfolio or may fail to recognize a risk entirely, leaving us exposed to losses without the benefit of any offsetting hedging activities. The derivative financial instruments we select may not have the effect of reducing our interest rate risk. The nature and timing of hedging transactions may influence the effectiveness of these strategies. Poorly designed strategies or improperly executed transactions could actually increase our risk and losses. In addition, hedging activities could result in losses if the event against which we hedge does not occur. For example, interest rate hedging could fail to protect us or adversely affect us because, among other things:
|
|
·
|
interest rate hedging can be expensive, particularly during periods of rising and volatile interest rates;
|
|
|
·
|
available interest rate hedges may not correlate directly with the interest rate risk for which protection is sought;
|
|
|
·
|
the duration of the hedge may not match the duration of the related liability;
|
|
|
·
|
the amount of income that a REIT may earn from hedging transactions to offset interest rate losses may be limited by federal tax provisions governing REITs;
|
|
|
·
|
the credit quality of the party owing money on the hedge may be downgraded to such an extent that it impairs our ability to sell or assign our side of the hedging transaction;
|
|
|
·
|
the party owing money in the hedging transaction may default on its obligation to pay; and
|
|
|
·
|
the value of derivatives used for hedging may be adjusted from time to time in accordance with accounting rules to reflect changes in fair value. Downward adjustments, or “mark-to-market losses,” would reduce our stockholders’ equity.
|
Our hedging transactions, which are intended to limit losses, may actually limit gains and increase our exposure to losses. As a result, our hedging activity may adversely affect our earnings, which could reduce our cash available for distribution to our stockholders. In addition, some hedging instruments involve risk since they are not currently traded on regulated exchanges, guaranteed by an exchange or its clearing house, or regulated by any U.S. or foreign governmental authorities. Consequently, there are no requirements with respect to record keeping, financial responsibility or segregation of customer funds and positions. Furthermore, the enforceability of agreements underlying derivative transactions may depend on compliance with applicable statutory and commodity and other regulatory requirements and, depending on the identity of the counterparty, applicable international requirements. The business failure of a hedging counterparty with whom we enter into a hedging transaction will most likely result in its default. Default by a party with whom we enter into a hedging transaction may result in the loss of unrealized profits and force us to cover our commitments, if any, at the then current market price. Although generally we will seek to reserve the right to terminate our hedging positions, it may not always be possible to dispose of or close out a hedging position without the consent of the hedging counterparty, and we may not be able to enter into an offsetting contract in order to cover our risk. We cannot assure you that a liquid secondary market will exist for hedging instruments purchased or sold, and we may be required to maintain a position until exercise or expiration, which could result in losses.
26
We may enter into derivative contracts that could expose us to contingent liabilities in the future.
Subject to maintaining our qualification as a REIT, part of our investment strategy involves entering into derivative contracts that could require us to fund cash payments in certain circumstances. These potential payments will be contingent liabilities, the value of which are unknown, and therefore may not appear on our Consolidated Statements of Financial Condition. Our ability to fund these contingent liabilities will depend on the liquidity of our assets and access to capital at the time, and the need to fund these contingent liabilities could adversely impact our financial condition.
Risks Related To Accounting Matters and our 1940 Act Exemption
Our reported GAAP financial results differ from the taxable income results that impact our dividend distribution requirements and, therefore, our GAAP results may not be an accurate indicator of future taxable income and dividend distributions.
Generally, the cumulative net income we report over the life of an asset will be the same for GAAP and tax purposes, although the timing of this income recognition over the life of the asset could be materially different. Differences exist in the accounting for GAAP net income and REIT taxable income which can lead to significant variances in the amount and timing of when income and losses are recognized under these two measures. Due to these differences, our reported GAAP financial results could materially differ from our determination of taxable income results, which impacts our dividend distribution requirements, and, therefore, our GAAP results may not be an accurate indicator of future taxable income and dividend distributions.
We may generate taxable income in excess of our GAAP income on Non-Agency RMBS purchased at a discount to par value, which may result in significant timing variances in the recognition of income and losses.
We have acquired and intend to continue to acquire Non-Agency RMBS at prices that reflect significant market discounts on their unpaid principal balances. For financial statement reporting purposes, we generally establish a portion of this market discount as a Non-Accretable Difference. This credit reserve is generally not accreted into income for financial statement reporting purposes. For tax purposes, however, we are not permitted to anticipate, or establish a reserve for, credit losses prior to their occurrence. As a result, the entire market discount is accreted into income in determining taxable income during periods in which no actual losses are incurred. Losses are only recognized for tax purposes when incurred (thus lowering taxable income in periods in which losses are incurred). These differences in accounting for tax and GAAP can lead to significant timing variances in the recognition of income and losses. Taxable income on Non-Agency RMBS purchased at a discount to their par value may be higher than GAAP earnings in early periods (before losses are actually incurred). Because we distribute dividends to our stockholders based on our taxable income, our dividend distributions could exceed our GAAP income in periods during which our taxable income exceeds our GAAP income on Non-Agency RMBS purchased at discount to par value and can be significantly less than GAAP income in periods where losses are realized for tax but were realized for GAAP in prior periods.
We have elected not to qualify for hedge accounting treatment for GAAP reporting.
We record derivative and hedge transactions in accordance with GAAP. Our interest rate swaps have not been designated as hedging instruments for accounting purposes. Consequently, changes in the fair value of swaps are reported as a component of net income in the Consolidated Statements of Operations and Comprehensive Income.
27
Changes or declines in the fair values of our assets, liabilities, and hedging instruments can have adverse effects on us, including earnings volatility or reduced earnings, which may reduce cash available for distribution to our stockholders.
A substantial portion of our assets are classified for accounting purposes as “available-for-sale” and carried at fair value. Changes in the fair values of those assets will be directly charged or credited to OCI. In addition, a decline in values will reduce the book value of our assets. A decline in the fair value of our assets may adversely affect us, particularly in instances where we have borrowed money based on the fair value of those assets. If the fair value of those assets declines, the lender may require us to post additional collateral to support the loan. If we were unable to post the additional collateral, we would have to sell the assets at a time when we might not otherwise choose to do so. A reduction in credit available may reduce our ability to invest and to earn interest income which would reduce cash available for distribution to stockholders.
In addition, the fair values for our assets, liabilities, and hedging instruments can be volatile. The fair values can change rapidly and significantly from a variety of factors, including changes in interest rates, credit performance, perceived risk, supply, demand, and actual and projected cash flows and prepayments. Decreases in fair value may not necessarily be the result of deterioration in future cash flows. Moreover, fair values for illiquid assets can be difficult to estimate, which may lead to volatility and uncertainty of earnings as a result of OTTI, or book value as a result of increases in unrealized losses.
For GAAP purposes, we estimate the fair value of most, but not all, of the assets and liabilities on our Consolidated Statements of Financial Condition. In addition, valuation adjustments on certain consolidated assets and our hedging instruments are reflected in our Consolidated Statements of Operations and Comprehensive Income. If we sell an asset below its cost basis, our reported earnings will be reduced by realized losses.
A decrease in the fair value of the securities we own may result in a reduction in our book value due to the accounting standards we are required to apply. Reporting a low book value could have adverse effects such as the inability to meet or agree upon covenants with counterparties, to enter into hedge instruments, or a reduction in the market price of our common stock.
The fair value of certain of the assets on our Consolidated Statements of Financial Condition as calculated according to GAAP may not reflect amounts we would receive if we disposed of those assets.
GAAP requires that we consolidate certain of our RMBS re-securitization transactions on our Consolidated Statements of Financial Condition and report these assets at fair value. Under GAAP, fair value for these assets is measured by determining the fair value of the underlying RMBS assets we contributed to the re-securitization trust as opposed to evaluating the fair value of the re-securitized securities we acquired as a result of the RMBS re-securitization transaction.
The fair value of the underlying RMBS assets subject to the RMBS re-securitization transactions may differ from the value of the re-securitized securities we received as a result of the RMBS re-securitization transaction. Discrepancies arise as a result of market dynamics, the limitations of the measurement techniques required by GAAP, the consolidation accounting principles under GAAP and the subordinate nature, complexity, illiquidity and restrictive features of the re-securitized securities we own. These differences between the fair values of the underlying RMBS consolidated on our Consolidated Statements of Financial Condition under GAAP presentation and the economic value of our investments in the re-securitized securities can be significant.
A discrepancy where the fair value of the underlying RMBS assets contained in a re-securitization trust is different from the amount we would receive if we sold the re-securitized securities we own may result in an overstatement or understatement of our book value due to the accounting standards we are required to apply. Reporting a higher book value than the value of our net investments in assets could have adverse effects on us. The adverse effects could include the inability to agree upon covenants with counterparties, the inability to satisfy collateral demands of counterparties based on their review of our financial statements, or an overestimation in the market price of our common stock.
28
Loss of our 1940 Act exemption would adversely affect us and negatively affect the market price of shares of our common stock and our ability to distribute dividends.
We conduct our operations so that neither we nor any of our subsidiaries are required to register as an investment company under the 1940 Act. Because we are a holding company that will conduct its businesses primarily through wholly-owned subsidiaries, the securities issued by these subsidiaries that are excepted from the definition of “investment company” under Section 3(c)(1) or Section 3(c)(7) of the 1940 Act, together with any other investment securities we may own, may not have a combined value in excess of 40% of the value of our adjusted total assets on an unconsolidated basis. This requirement limits the types of businesses in which we may engage through our subsidiaries. In addition, the assets we and our subsidiaries may acquire are limited by the provisions of the 1940 Act, the rules and regulations promulgated under the 1940 Act and SEC staff interpretative guidance, which may adversely affect our performance.
If the value of securities issued by our subsidiaries that are excepted from the definition of “investment company” by Section 3(c)(1) or 3(c)(7) of the 1940 Act, together with any other investment securities we own, exceeds 40% of our adjusted total assets on an unconsolidated basis, or if one or more of such subsidiaries fail to maintain an exception or exemption from the 1940 Act, we could, among other things, be required either (a) to substantially change the manner in which we conduct our operations to avoid being required to register as an investment company or (b) to register as an investment company under the 1940 Act, either of which could have an adverse effect on us and the market price of our securities. If we were required to register as an investment company under the 1940 Act, we would become subject to substantial regulation with respect to our capital structure (including our ability to use leverage), management, operations, transactions with affiliated persons (as defined in the 1940 Act), portfolio composition, including restrictions with respect to diversification and industry concentration, and other matters.
Certain of our subsidiaries rely on the exemption from registration provided by Section 3(c)(5)(C) of the 1940 Act. Section 3(c)(5)(C) as interpreted by the staff of the SEC, requires us to invest at least 55% of our assets in “mortgages and other liens on and interest in real estate” (or Qualifying Real Estate Assets) and at least 80% of our assets in Qualifying Real Estate Assets plus real estate related assets. The assets that we acquire, therefore, are limited by the provisions of the 1940 Act and the rules and regulations promulgated under the 1940 Act. On August 31, 2011, the SEC issued a concept release titled “Companies Engaged in the Business of Acquiring Mortgages and Mortgage-Related Instruments” (SEC Release No. IC-29778). Under the concept release, the SEC is reviewing interpretive issues related to the Section 3(c)(5)(C) exemption. The potential outcomes of the SEC’s actions are unclear as is the SEC’s timetable for its review and actions. If the SEC determines that any of our securities are not Qualifying Real Estate Assets or real estate related assets or otherwise believes we do not satisfy the exemption under Section 3(c)(5)(C), we could be required to restructure our activities or sell certain of our assets. The net effect of these factors will be to lower our net interest income. If we fail to qualify for exemption from registration as an investment company, our ability to use leverage would be substantially reduced, and we would not be able to conduct our business as described. Our business will be materially and adversely affected if we fail to qualify for this exemption.
Certain of our subsidiaries may rely on the exemption provided by Section 3(c)(6) which excludes from the definition of “investment company” any company primarily engaged, directly or through majority-owned subsidiaries, in a business, among others, described in Section 3(c)(5)(C) of the 1940 Act (from which not less than 25% of such company’s gross income during its last fiscal year was derived) together with an additional business or additional businesses other than investing, reinvesting, owning, holding or trading in securities. The SEC staff has issued little interpretive guidance with respect to Section 3(c)(6) and any guidance published by the staff could require us to adjust our strategy accordingly.
We expect certain of our subsidiaries we may form in the future to rely on Section 3(c)(7) for their 1940 Act exemption and, therefore our interest in each of these subsidiaries would constitute an “investment security” for purposes of determining whether we pass the 40% test.
29
We may in the future, however, organize one or more subsidiaries that seek to rely on the 1940 Act exemption provided to certain structured financing vehicles by Rule 3a-7. If we organize subsidiaries that rely on Rule 3a-7 for an exemption from the 1940 Act, these subsidiaries will also need to comply with the restrictions described in “Business—Operating and Regulatory Structure—1940 Act Exemption.” In general, Rule 3a-7 exempts from the 1940 Act issuers that limit their activities as follows:
|
|
·
|
the issuer issues securities the payment of which depends primarily on the cash flow from “eligible assets” that by their terms convert into cash within a finite time period;
|
|
|
·
|
the securities sold are fixed income securities rated investment grade by at least one rating agency (fixed income securities which are unrated or rated below investment grade may be sold to institutional accredited investors and any securities may be sold to “qualified institutional buyers” and to persons involved in the organization or operation of the issuer);
|
|
|
·
|
the issuer acquires and disposes of eligible assets (1) only in accordance with the agreements pursuant to which the securities are issued, (2) so that the acquisition or disposition does not result in a downgrading of the issuer’s fixed income securities and (3) the eligible assets are not acquired or disposed of for the primary purpose of recognizing gains or decreasing losses resulting from market value changes; and
|
|
|
·
|
unless the issuer is issuing only commercial paper, the issuer appoints an independent trustee, takes reasonable steps to transfer to the trustee an ownership or perfected security interest in the eligible assets, and meets rating agency requirements for commingling of cash flows.
|
Any subsidiary also would need to be structured to comply with any guidance that may be issued by the Division of Investment Management of the SEC on how the subsidiary must be organized to comply with the restrictions contained in Rule 3a-7. Compliance with Rule 3a-7 may require that the indenture governing the subsidiary include additional limitations on the types of assets the subsidiary may sell or acquire out of the proceeds of assets that mature, are refinanced or otherwise sold, on the period of time during which such transactions may occur, and on the amount of transactions that may occur. In light of the requirements of Rule 3a-7, our ability to manage assets held in a special purpose subsidiary that complies with Rule 3a-7 will be limited and we may not be able to purchase or sell assets owned by that subsidiary when we would otherwise desire to do so, which could lead to losses. We currently limit the aggregate value of our interests in our subsidiaries that may in the future seek to rely on Rule 3a-7 to 20% or less of our total assets on an unconsolidated basis, as we continue to discuss with the SEC staff the use of subsidiaries that rely on Rule 3a-7 to finance our operations.
The determination of whether an entity is a majority-owned subsidiary of our company is made by us. The 1940 Act defines a majority-owned subsidiary of a person as a company of which 50% or more of the outstanding voting securities are owned by such person, or by another company which is a majority-owned subsidiary of such person. The 1940 Act further defines voting securities as any security presently entitling the owner or holder thereof to vote for the election of directors of a company. We treat companies in which we own at least a majority of the outstanding voting securities as majority-owned subsidiaries for purposes of the 40% test. We have not requested the SEC to approve our treatment of any company as a majority-owned subsidiary and the SEC has not done so. If the SEC were to disagree with our treatment of one or more companies as majority-owned subsidiaries, we would need to adjust our strategy and our assets in order to continue to pass the 40% test. Any such adjustment in our strategy could have a material adverse effect on us.
There can be no assurance that the laws and regulations governing the 1940 Act status of REITs, including the Division of Investment Management of the SEC providing more specific or different guidance regarding these exemptions, will not change in a manner that adversely affects our operations. If we or our subsidiaries fail to maintain an exception or exemption from the 1940 Act, we could, among other things, be required either to (a) change the manner in which we conduct our operations to avoid being required to register as an investment company, (b) effect sales of our assets in a manner that, or at a time when, we would not otherwise choose to do so, or (c) register as an investment company, any of which could negatively affect the value of our common stock, the sustainability of our business model, and our ability to make distributions which could have an adverse effect on our business and the market price for our shares of common stock.
30
Rapid changes in the values of our MBS, residential mortgage loans, and other real estate-related investments may make it more difficult for us to maintain our qualification as a REIT or our exemption from the 1940 Act.
If the market value or income potential of our MBS, residential mortgage loans, and other real estate-related investments declines as a result of increased interest rates, prepayment rates or other factors, we may need to increase our real estate investments and income or liquidate our non-qualifying assets to maintain our REIT qualification or our exemption from the 1940 Act. If the decline in real estate asset values or income occurs quickly, this may be especially difficult to accomplish. This difficulty may be exacerbated by the illiquid nature of any non-real estate assets we may own. We may have to make investment decisions that we otherwise would not make absent the REIT and 1940 Act considerations.
Regulatory and Legal Risks
Violations of federal, state and local laws, including violations of predatory lending and other laws, by the originator, the servicer, or us may result in rescission of the loans or penalties that may adversely impact our operations, financial condition and business prospects.
Violations of certain provisions of federal, state and local laws by the originator, the servicer or us, as well as actions by governmental agencies, authorities and attorneys general, may limit our or the servicer’s ability to collect all or part of the principal of, or interest on, the residential mortgage loans we purchase and hold, and loans that serve as security for the RMBS we purchase and hold. Violations could also subject the entity that made or modified the loans to damages and administrative enforcement (including disgorgement of prior interest and fees paid). In particular, a loan seller’s failure to comply with certain requirements of federal and state laws could subject the seller (and other assignees of the mortgage loans) to monetary penalties and result in the obligors’ rescinding the mortgage loans against the seller and any subsequent holders of the mortgage loans, even if the assignee was not responsible for and was unaware of those violations. These adverse consequences vary depending on the applicable law and may vary depending on the type or severity of the violation, but they typically include:
|
|
·
|
the ability of the homeowner to rescind, or cancel, the loan;
|
|
|
·
|
the inability of the holder of the loan to collect all of the principal and interest otherwise due on the loan;
|
|
|
·
|
the right of the homeowner to collect a refund of amounts previously paid (which may include amounts financed by the loan), or to set off those amounts against his or her future loan obligations; and
|
|
|
·
|
the liability of the servicer and the owner of the loan for actual damages, statutory damages and punitive damages, civil or criminal penalties, costs and attorneys’ fees.
|
The terms of the documents under which we intend to purchase loans, and the terms of the documents used to create the RMBS we intend to purchase, may entitle the holders of the loans and the special purpose vehicles that hold loans in RMBS to contractual indemnification against these liabilities. For example, the sellers of loans placed in a securitization typically represent that each mortgage loan was made in compliance with applicable federal and state laws and regulations at the time it was made. If there is a material breach of that representation, the seller may be contractually obligated to cure the breach or repurchase or replace the affected mortgage loan. If the seller is unable or otherwise fails to satisfy these obligations, the yield on the loans and RMBS might be materially and adversely affected. Due to the deterioration in the housing and commercial property markets, many of the sellers that issued these indemnifications are no longer in business or are unable to financially respond to their indemnification obligations. Consequently, holders of interests in the loans and RMBS may ultimately have to absorb the losses arising from the sellers’ violations. While we attempt to take these factors into account in the prices we pay for loans and RMBS, we can offer no assurances concerning the validity of the assumptions we use in our pricing decisions.
31
Furthermore, the volume of new and modified laws and regulations at both the federal and state levels has increased in recent years. For example, the Dodd-Frank Act established the Consumer Financial Protection Bureau which, among other things, restricts and supervises unfair, deceptive or abusive acts or practices in mortgage lending. In addition, The federal Home Ownership and Equity Protection Act of 1994, commonly known as HOEPA, prohibits inclusion of certain provisions in residential mortgage loans that have mortgage rates or origination costs in excess of prescribed levels and requires that borrowers be given certain disclosures before origination. Accordingly, there is an increased risk that we or the originator or servicer of loans we purchase or that are held in RMBS we purchase may be involved in litigation over violations or alleged violations of recently enacted and proposed laws. It is possible that these laws might result in additional significant costs and liabilities, which could further adversely affect the results of our operations. In addition, failure of residential mortgage loan originators or servicers to comply with these laws, to the extent any of their residential mortgage loans become part of our mortgage-related assets, could subject us, as an assignee or purchaser of the related residential mortgage loans or RMBS, to monetary penalties and could result in the borrowers rescinding the affected residential mortgage loans. Any litigation or penalty would increase our expenses and reduce funds available for distribution to our stockholders.
Some local municipalities also have enacted laws that impose potentially significant penalties on loan servicing activities related to abandoned properties or real estate owned properties.
Any of these preceding examples could result in delays and/or reductions in receipts of amounts due on the loans we intend to purchase or on the loans held in RMBS we intend to purchase, negatively affecting our income and operating results.
There is the potential for limitations on our ability to finance purchases of loans and RMBS, and for losses on the loans and RMBS we purchase, as a result of violations of law by the originating lenders.
In June 2003, a California jury found a warehouse lender and securitization underwriter liable in part for fraud on consumers committed by a lender to whom it provided financing and underwriting services. The jury found that the investment bank was aware of the fraud and substantially assisted the lender in perpetrating the fraud by providing financing and underwriting services that allowed the lender to continue to operate, and held it liable for 10% of the plaintiff’s damages. This instance of liability is the first case we know of in which an investment bank was held partly responsible for violations committed by a mortgage lender customer. Shortly after the announcement of the jury verdict in the California case, the Florida Attorney General filed suit against the same financial institution, seeking an injunction to prevent it from financing mortgage loans within Florida, as well as damages and civil penalties, based on theories of unfair and deceptive trade practices and fraud. The suit claimed that this financial institution aided and abetted the same lender involved in the California case in its commission of fraudulent representations in Florida.
In December of 2008, the Massachusetts Supreme Judicial Court upheld a lower court’s order entered against a lender that enjoined the lender from foreclosing, without court approval, on certain mortgage loans secured by the borrower’s principal dwelling that the court considered “presumptively unfair.”
In May of 2009, another securitizer of residential mortgage loans entered into a settlement agreement with the Commonwealth of Massachusetts stemming from its investigation of subprime lending and securitization markets. The securitizer agreed to provide loan restructuring (including significant principal write-downs) valued at approximately $50 million to Massachusetts subprime borrowers and to make a $10 million payment to the Commonwealth.
The Dodd Frank Act includes new authority, mentioned above, to take any actions against covered persons or service providers found to have committed or to have been engaging in an unfair, deceptive, or abusive acts or practices in connection with mortgage loans and other transactions, and that authority extends to any person that knowingly or recklessly provides substantial assistance to those persons or providers.
If other courts or regulators take similar actions, investment banks and investors in residential and commercial mortgage loans and RMBS like us might face increased litigation as they are named as defendants in lawsuits and regulatory actions against the mortgage companies or securitizers with which they do business or they might be prohibited from foreclosing on loans they purchased. Some investment banks may charge more for warehouse lending and reduce the prices they pay for loans to build in the costs of this potential litigation or exit the business entirely, thereby increasing our cost of borrowing. Any such actions by courts and regulators, and any such increases in our costs of borrowing, could, in turn, have a material adverse effect on our results of operations, financial condition, and business prospects.
32
Our securitization activities expose us to an increased risk of litigation, which may materially and adversely affect our business and financial condition.
Through certain of our wholly-owned subsidiaries, we have and continue to engage in securitization transactions relating to residential mortgage loans.
We utilize disclosure documentation, including term sheets and offering memorandums, which include disclosures regarding the securitization transactions and the assets being securitized. If our disclosure documentation is alleged or found to contain inaccuracies or omissions, we may be liable under federal securities laws, state securities laws or other applicable laws for damages to third parties that invest in these securitization transactions, including in circumstances in which we relied on a third party in preparing accurate disclosures, or we may incur other expenses and costs in connection with disputing these allegations or settling claims.
We may also sell or contribute residential mortgage loans to third parties who, in turn, securitize those loans. In these circumstances, we may also prepare disclosure documentation, including documentation that is included in term sheets and offering memorandums relating to those securitization transactions. We could be liable under federal securities laws, state securities laws, or other applicable laws for damages to third parties that invest in these securitization transactions, including liability for disclosures prepared by third parties or with respect to loans that we did not sell or contribute to the securitization.
We are required to obtain various state licenses in order to purchase mortgage loans in the secondary market and there is no assurance we will be able to obtain or maintain those licenses.
While we are not required to obtain licenses to purchase mortgage-backed securities, we are required to obtain various state licenses to purchase mortgage loans in the secondary market. There is no assurance that we will obtain all of the licenses that we desire or that we will not experience significant delays in seeking these licenses. Furthermore, we will be subject to various information reporting requirements to maintain these licenses, and there is no assurance that we will satisfy those requirements. Our failure to obtain or maintain licenses will restrict our investment options and could harm our business.
Federal and state agencies have taken enforcement actions and enacted regulations and government programs that require government sponsored enterprises (such as Fannie Mae and Freddie Mac), insured depository institutions, and state regulated loan servicers to engage in loss mitigation activities relating to residential mortgage loans.
Federal and state agencies have taken enforcement actions and enacted regulations that require GSEs (such as Fannie Mae and Freddie Mac), insured depository institutions, and state regulated loan servicers to engage in loss mitigation activities relating to residential mortgage loans. Other agencies have published policies that strongly recommend these entities to engage in loss mitigation activities. These loss mitigation activities may include, for example, loan modifications that significantly reduce interest and payments, deferrals of payments, and reductions of principal balances. Such modifications may adversely affect our business and financial condition.
Litigation alleging inability to foreclose may limit our ability to recover on some of the loans we purchase or that are held in RMBS.
In October 2007, a judge in the U.S. District Court for the Northern District of Ohio dismissed 14 cases in which plaintiffs sought to foreclose mortgages held in securitization trusts by ruling that those plaintiffs lacked standing to sue. In each case, the judge found that the plaintiff was not the owner of the note and mortgage on the date the foreclosure complaint was filed in court. Similar actions have been initiated in other states. These actions arise as a result of the common practice in the mortgage industry of mortgage loan sellers providing the loan purchasers unrecorded assignments of the mortgage in blank (i.e., the assignments do not name the assignee). Some courts have held that before a note holder may initiate a foreclosure, the note holder must show proof to the court that the mortgage itself has been properly assigned to the purchaser each time the mortgage loan has been sold. It is sometimes difficult to obtain and then record originals of each successive assignment. It is still unclear whether higher courts will uphold the requirements imposed by these lower courts.
While many purchasers have strengthened their assignment and recordation processes since that time, investors in mortgage loans remain at risk of being unable to foreclose on defaulted loans, or at a minimum will be subject to delays until all assignments in the chain of the loan’s title are properly recorded. Thus, we may not be able to recover on some of the loans we purchase or that are held in the RMBS we purchase, or we may suffer delays in foreclosure, all of which could result in a lower return on our loans and RMBS.
33
In addition, some legislatures are also instituting stringent proof of ownership requirements that a servicer must satisfy before commencing a foreclosure action. By way of example, in January 2011 the New York State Assembly amended state law to require that any foreclosure complaint contain an affirmative allegation that the plaintiff is the owner and holder of the note and mortgage at issue or has been delegated the authority to institute the foreclosure action by the owner and holder of the subject mortgage and note. Again, laws of this type may limit our ability to recover on some of the loans we purchase or that are held in the RMBS we purchase, and may result in delays in the foreclosure process, all of which could result in a lower return on our loans and RMBS.
Legislative action to provide mortgage relief and foreclosure moratoriums may negatively impact our business.
As delinquencies and defaults in residential mortgages have recently increased, there has been an increasing amount of legislative action that might restrict our ability to foreclose and resell the property of a customer in default. For example, some recently enacted state laws may require the lender to deliver a notice of intent to foreclose, provide borrowers additional time to cure or reinstate their loans, impose mandatory settlement conference and mediation requirements, require lenders to offer loan modifications, and prohibit initiation of foreclosure until the borrower has been provided time to consult with foreclosure counselors.
Alternatively, new federal legislation and some legislatures provide a subsidy to a customer to permit the customer to continue to make payments during a period of hardship. In the case of a subsidy, it is possible that we might be required to forego a portion of the amount otherwise due on the loan for a temporary period.
Finally, federal laws and the laws of some states require foreclosing lenders to give special notices to tenants in properties on which the lenders are foreclosing on, or to permit the tenants to remain in the property for a period of time following the foreclosure.
These laws delay the initiation or completion of foreclosure proceedings on specified types of residential mortgage loans, or otherwise limit the ability of residential loan servicers to take actions that may be essential to preserve the value of the mortgage loans on behalf of the holders of RMBS. Any such limitations are likely to cause delayed or reduced collections from mortgagors and generally increased servicing costs. Any restriction on our ability to foreclose on a loan, any requirement that we forego a portion of the amount otherwise due on a loan or any requirement that we modify any original loan terms is likely to negatively impact our business, financial condition, liquidity and results of operations.
United States military operations may increase risk of Servicemembers Civil Relief Act shortfalls.
Under the federal Servicemembers Civil Relief Act, a borrower who enters active military service after the origination of his or her mortgage loan generally may not be required to pay interest above an annual rate of 6%, and the note holder is restricted from exercising certain enforcement remedies, during the period of the borrower’s active duty status. Several states also have enacted or are considering similar laws with varying applicability and effect. As a result of military operations in the Middle East, the United States has placed a substantial number of armed forces reservists and members of the National Guard on active duty status. It is possible that the number of reservists and members of the National Guard placed on active duty status may remain at high levels for an extended time. To the extent that a member of the military, or a member of the armed forces reserves or National Guard who is called to active duty, is a mortgagor on a loan we purchase or an underlying loan in a RMBS we may purchase, the interest rate limitation of the Servicemembers Civil Relief Act, and any comparable state law, will apply. An increase in the number of borrowers taking advantage of those laws may increase servicing expenses for a loan we purchase or an underlying loan in a RMBS we may purchase, and may also reduce cash flow and the interest payments collected from those borrowers. In the event of default, the laws may result in delaying or preventing the loan servicer from exercising otherwise available remedies for default. If these events occur, they may result in interest shortfalls on the loans we purchase or on the underlying loans in a RMBS we may purchase that could result in a lower return on our loans or additional losses.
34
The Dodd-Frank Act contains many regulatory changes and calls for future rulemaking that may affect
our business.
The Dodd-Frank Wall Street Reform and Consumer Protection Act, or the Dodd-Frank Act, contains many regulatory changes and calls for future rulemaking that may affect our business, including, but not limited to resolutions involving derivatives, risk-retention in securitizations, the origination of residential mortgage loans and short-term financings. The Dodd-Frank Act’s requirements may impact the housing and mortgage markets, which could have an adverse effect on our business.
The increasing number of proposed federal, state and local laws may increase our risk of liability with respect to certain mortgage loans, may include judicial modification provisions and could increase our cost of doing business.
The United States Congress and various state and local legislatures are considering legislation, which, among other provisions, would permit limited assignee liability for certain violations in the mortgage loan and servicing origination process, and would allow judicial modification of loan principal in the event of personal bankruptcy. We cannot predict whether or in what form Congress or the various state and local legislatures may enact legislation affecting our business. For example, the California Homeowner Bill of Rights, which became effective on January 1, 2013, imposes new obligations and potential liabilities on investors, master servicers, servicers and subservicers, including anti-blight and tenant protection provisions. We are evaluating the impact of these initiatives on our portfolio and results of operations. As a result of these and other initiatives, we are unable to predict whether federal, state or local authorities will require changes in our practices in the future or in our portfolio. These changes, if required, could adversely affect our profitability, particularly if we make such changes in response to new or amended laws, regulations or ordinances in any state where we acquire a significant portion of our mortgage loans, or if such changes result in us being held responsible for any violations in the mortgage loan origination process, or if the principal amount of loans we own or are in RMBS pools we own are modified in the personal bankruptcy process.
Risks Related To Our Common Stock
The market price and trading volume of our shares of common stock may be volatile.
The market price of shares of our common stock may be highly volatile and could be subject to wide fluctuations. In addition, the trading volume in our shares of common stock may fluctuate and cause significant price variations to occur. We cannot assure you that the market price of our shares of common stock will not fluctuate or decline significantly in the future. Some of the factors that could negatively affect our share price or result in fluctuations in the price or trading volume of our shares of common stock include those set forth under “Risk Factors” and “Special Note Regarding Forward-Looking Statements” and in the information incorporated and deemed to be incorporated by reference herein, as well as:
|
|
·
|
actual or anticipated variations in our quarterly operating results or business prospects;
|
|
|
·
|
changes in our earnings estimates or publication of research reports about us or the real estate industry;
|
|
|
·
|
an inability to meet or exceed securities analysts' estimates or expectations;
|
|
|
·
|
increases in market interest rates;
|
|
|
·
|
hedging or arbitrage trading activity in our shares of common stock;
|
|
|
·
|
capital commitments;
|
|
|
·
|
changes in market valuations of similar companies;
|
|
|
·
|
changes in valuations of our assets;
|
|
|
·
|
adverse market reaction to any increased indebtedness we incur in the future;
|
|
|
·
|
additions or departures of management personnel;
|
|
|
·
|
actions by institutional shareholders, including large block sales at a discount;
|
|
|
·
|
speculation in the press or investment community;
|
|
|
·
|
changes in our distribution policy;
|
|
|
·
|
regulatory changes affecting our industry generally or our business;
|
|
|
·
|
general market and economic conditions; and
|
|
|
·
|
future sales of our shares of common stock or securities convertible into, or exchangeable or exercisable for, our shares of common stock.
|
35
Common stock eligible for future sale may have adverse consequences for investors and adverse effects on our share price.
We cannot predict the effect, if any, of future sales of common stock, or the availability of shares for future sales, on the market price of the common stock. Sales of substantial amounts of common stock, or the perception that such sales could occur, may adversely affect prevailing market prices for the common stock. In addition, we are not required to offer any such shares to existing shareholders on a pre-emptive basis. Therefore, it may not be possible for existing shareholders to participate in such future share issues, which may dilute the existing shareholders’ interests in us.
There is a risk that our stockholders may not receive distributions or that distributions may not grow over time.
We intend to make distributions on a quarterly basis out of assets legally available to our stockholders in amounts such that all or substantially all of our REIT taxable income in each year is distributed. Our ability to pay distributions may be adversely affected by a number of factors, including the risk factors described herein. All distributions will be made at the discretion of our Board of Directors and will depend on our earnings, our financial condition, maintenance of our REIT status and other factors as our Board of Directors may deem relevant from time to time.
Among the factors that could adversely affect our results of operations and impair our ability to pay distributions to our stockholders are:
|
|
·
|
our ability to make profitable investments;
|
|
|
·
|
margin calls or other expenses that reduce our cash flow;
|
|
|
·
|
defaults in our asset portfolio or decreases in the value of our portfolio;
|
|
|
·
|
the fact that anticipated operating expense levels may not prove accurate, as actual results may vary from estimates; and
|
|
|
·
|
increased cost of financing.
|
A change in any one of these factors could affect our ability to make distributions. We cannot assure you that we will achieve investment results that will allow us to make a specified level of cash distributions or year-to-year increases in cash distributions.
Investing in our shares may involve a high degree of risk and broad market fluctuations could negatively impact the market price of our common stock.
The investments we make in accordance with our investment objectives may result in a high amount of risk when compared to alternative investment options and volatility or loss of principal. Our investments may be highly speculative and aggressive, are subject to credit risk, interest rate, and market value risks, among others, and therefore an investment in our shares may not be suitable for someone with lower risk tolerance.
Furthermore, the stock market has experienced extreme price and volume fluctuations that have affected the market price of many companies in industries similar or related to ours and that have been unrelated to these companies’ operating performances. These broad market fluctuations could reduce the market price of our common stock.
36
Our charter and bylaws contain provisions that may inhibit potential acquisition bids that stockholders may consider favorable, and the market price of our common stock may be lower as a result.
Our charter and bylaws contain provisions that have an anti-takeover effect and inhibit a change in our Board of Directors. These provisions include the following:
|
|
·
|
There are ownership limits and restrictions on transferability and ownership in our charter.
To qualify as a REIT for each taxable year after 2007, not more than 50% of the value of our outstanding stock may be owned, directly or constructively, by five or fewer individuals during the second half of any calendar year. In addition, our shares must be beneficially owned by 100 or more persons during at least 335 days of a taxable year of 12 months or during a proportionate part of a shorter taxable year for each taxable year after 2007. To assist us in satisfying these tests, our charter generally prohibits any person from beneficially or constructively owning more than 9.8% in value or number of shares, whichever is more restrictive, of any class or series of our outstanding capital stock. These restrictions may discourage a tender offer or other transactions or a change in the composition of our Board of Directors or control that might involve a premium price for our shares or otherwise be in the best interests of our stockholders and any shares issued or transferred in violation of such restrictions being automatically transferred to a trust for a charitable beneficiary, thereby resulting in a forfeiture of the additional shares.
|
|
|
·
|
Our charter permits our Board of Directors to issue stock with terms that may discourage a third party from acquiring us
. Our charter permits our Board of Directors to amend the charter without stockholder approval to increase the total number of authorized shares of stock or the number of shares of any class or series and to issue common or preferred stock, having preferences, conversion or other rights, voting powers, restrictions, limitations as to dividends or other distributions, qualifications, or terms or conditions of redemption as determined by our board. Thus, our board could authorize the issuance of stock with terms and conditions that could have the effect of discouraging a takeover or other transaction in which holders of some or a majority of our shares might receive a premium for their shares over the then-prevailing market price of our shares.
|
|
|
·
|
Maryland Control Share Acquisition Act.
Maryland law provides that ‘‘control shares’’ of a corporation acquired in a ‘‘control share acquisition’’ will have no voting rights except to the extent approved by a vote of two-thirds of the votes eligible to be cast on the matter under the Maryland Control Share Acquisition Act. ‘‘Control shares’’ means voting shares of stock that, if aggregated with all other shares of stock owned by the acquirer or in respect of which the acquirer is able to exercise or direct the exercise of voting power (except solely by a revocable proxy), would entitle the acquirer to exercise voting power in electing directors within one of the following ranges of voting power: one-tenth or more but less than one-third, one-third or more but less than a majority, or a majority or more of all voting power. A ‘‘control share acquisition’’ means the acquisition of control shares, subject to certain exceptions.
|
If voting rights or control shares acquired in a control share acquisition are not approved at a stockholders’ meeting, or if the acquiring person does not deliver an acquiring person statement as required by the Maryland Control Share Acquisition Act, then, subject to certain conditions and limitations, the issuer may redeem any or all of the control shares for fair value. If voting rights of such control shares are approved at a stockholders’ meeting and the acquirer becomes entitled to vote a majority of the shares of stock entitled to vote, all other stockholders may exercise appraisal rights. Our bylaws contain a provision exempting acquisitions of our shares from the Maryland Control Share Acquisition Act. However, our Board of Directors may amend our bylaws in the future to repeal or modify this exemption, in which case any control shares of our company acquired in a control share acquisition will be subject to the Maryland Control Share Acquisition Act.
|
|
·
|
Business Combinations
. Under Maryland law, ‘‘business combinations’’ between a Maryland corporation and an interested stockholder or an affiliate of an interested stockholder are prohibited for five years after the most recent date on which the interested stockholder becomes an interested stockholder. These business combinations include a merger, consolidation, share exchange or, in circumstances specified in the statute, an asset transfer or issuance or reclassification of equity securities. An interested stockholder is defined as:
|
|
|
·
|
any person who beneficially owns 10% or more of the voting power of the corporation’s shares; or
|
|
|
·
|
an affiliate or associate of the corporation who, at any time within the two-year period before the date in question, was the beneficial owner of 10% or more of the voting power of the then outstanding voting stock of the corporation.
|
37
A person is not an interested stockholder under the statute if the Board of Directors approved in advance the transaction by which such person otherwise would have become an interested stockholder. However, in approving a transaction, the Board of Directors may provide that its approval is subject to compliance, at or after the time of approval, with any terms and conditions determined by the board. After the five-year prohibition, any business combination between the Maryland corporation and an interested stockholder generally must be recommended by the Board of Directors of the corporation and approved by the affirmative vote of at least:
|
|
·
|
80% of the votes entitled to be cast by holders of outstanding shares of voting stock of the corporation; and
|
|
|
·
|
two-thirds of the votes entitled to be cast by holders of voting stock of the corporation, other than shares held by the interested stockholder with whom or with whose affiliate the business combination is to be effected or held by an affiliate or associate of the interested stockholder.
|
These super-majority vote requirements do not apply if the corporation’s common stockholders receive a minimum price, as defined under Maryland law, for their shares in the form of cash or other consideration in the same form as previously paid by the interested stockholder for its shares. The statute permits various exemptions from its provisions, including business combinations that are exempted by the Board of Directors before the time that the interested stockholder becomes an interested stockholder. Our Board of Directors has adopted a resolution which provides that any business combination between us and any other person is exempted from the provisions of the Maryland Control Share Acquisition Act, provided that the business combination is first approved by the Board of Directors. This resolution, however, may be altered or repealed in whole or in part at any time. If this resolution is repealed, or the Board of Directors does not otherwise approve a business combination, this statute may discourage others from trying to acquire control of us and increase the difficulty of consummating any offer.
|
|
·
|
Staggered board.
Our Board of Directors is divided into three classes of directors. Directors of each class are chosen for three-year terms upon the expiration of their current terms, and each year one class of directors is elected by the stockholders. The staggered terms of our directors may reduce the possibility of a tender offer or an attempt at a change in control, even though a tender offer or change in control might be in the best interests of our stockholders.
|
|
|
·
|
Our charter and bylaws contain other possible anti-takeover provisions.
Our charter and bylaws contains other provisions that may have the effect of delaying, deferring or preventing a change in control of us or the removal of existing directors and, as a result, could prevent our stockholders from being paid a premium for their common stock over the then-prevailing market price.
|
Our rights and the rights of our stockholders to take action against our directors and officers are limited, which could limit stockholders’ recourse in the event of actions not in their best interests.
Our charter limits the liability of our directors and officers to us and our stockholders for money damages, except for liability resulting from:
|
|
·
|
actual receipt of an improper benefit or profit in money, property or services; or
|
|
|
·
|
a final judgment based upon a finding of active and deliberate dishonesty by the director or officer that was material to the cause of action adjudicated for which Maryland law prohibits such exemption from liability.
|
38
In addition, our charter authorizes us to obligate our company to indemnify our present and former directors and officers for actions taken by them in those capacities to the maximum extent permitted by Maryland law. Our bylaws require us to indemnify each present or former director or officer, to the maximum extent permitted by Maryland law, in the defense of any proceeding to which he or she is made, or threatened to be made, a party because of his or her service to us. In addition, we may be obligated to fund the defense costs incurred by our directors and officers.
Tax Risks
Your investment has various federal income tax risks.
This summary of certain tax risks is limited to the federal tax risks addressed below. Additional risks or issues may exist that are not addressed in this Form 10-K and that could affect the federal tax treatment of us or our stockholders. This is not intended to be used and cannot be used by any stockholder to avoid penalties that may be imposed on stockholders under the Internal Revenue Code, or the Code. We strongly urge you to seek advice based on your particular circumstances from an independent tax advisor concerning the effects of federal, state and local income tax law on an investment in common stock and on your individual tax situation.
Complying with REIT requirements may cause us to forego otherwise attractive opportunities.
To qualify as a REIT for federal income tax purposes, we must continually satisfy various tests regarding the sources of our income, the nature and diversification of our assets, the amounts we distribute to our stockholders and the ownership of our stock. To meet these tests, we may be required to forego investments we might otherwise make. We may be required to make distributions to stockholders at disadvantageous times or when we do not have funds readily available for distribution. Thus, compliance with the REIT requirements may hinder our investment performance.
We may enter into re-securitization transactions, the tax treatment of which could have a material adverse
effect on our results of operations.
We have engaged in and intend to engage in future re-securitization transactions in which we transfer Non-Agency RMBS to a special purpose entity that has formed or will form a securitization vehicle that will issue multiple classes of securities secured by and payable from cash flows on the underlying Non-Agency RMBS. In the past, we have structured transactions as REMICs. We have structured the REMIC securitization transactions as a sale by a TRS of mortgage loans to an issuer, another TRS (the “Depositor”), followed by a sale of the resulting REMIC securities through a placement agent retained by the Depositor to investors. In each such securitization, we have purchased all of the REMIC securities that were not purchased from the placement agent by unrelated third parties. Although such transactions are treated as sales for tax purposes, they have been undertaken by a TRS such that the prohibited transactions tax rules have not been implicated.
Complying with REIT requirements may force us to liquidate otherwise attractive investments.
To qualify as a REIT, we generally must ensure that at the end of each calendar quarter at least 75% of the value of our total assets consists of cash, cash items, government securities and qualified REIT real estate assets, including certain mortgage loans and mortgage-backed securities. The remainder of our investment in securities (other than government securities and qualifying real estate assets) generally cannot include more than 10% of the outstanding voting securities of any one issuer or more than 10% of the total value of the outstanding securities of any one issuer. In addition, in general, no more than 5% of the value of our assets (other than government securities, qualifying real estate assets, and stock in one or more TRSs) can consist of the securities of any one issuer, and no more than 25% (20% after December 31, 2017) of the value of our total securities can be represented by securities of one or more TRSs. If we fail to comply with these requirements at the end of any quarter, we must correct the failure within 30 days after the end of such calendar quarter or qualify for certain statutory relief provisions to avoid losing our REIT status and suffering adverse tax consequences. As a result, we may be required to liquidate from our portfolio otherwise attractive investments. These actions could have the effect of reducing our income and amounts available for distribution to our stockholders.
39
Potential characterization of distributions or gain on sale may be treated as unrelated business taxable income to tax-exempt investors.
If (1) all or a portion of our assets are subject to the rules relating to taxable mortgage pools, (2) we are a ‘‘pension-held REIT,’’ or (3) a tax-exempt stockholder has incurred debt to purchase or hold our common stock, then a portion of the distributions to and, in the case of a stockholder described in clause (3), gains realized on the sale of common stock by such tax-exempt stockholder may be subject to federal income tax as unrelated business taxable income under the Internal Revenue Code.
Classification of a securitization or financing arrangement we enter into as a taxable mortgage pool could subject us or certain of our stockholders to increased taxation.
We intend to structure our securitization and financing arrangements so as to not create a taxable mortgage pool. However, if we have borrowings with two or more maturities and, (1) those borrowings are secured by mortgages or mortgage-backed securities and (2) the payments made on the borrowings are related to the payments received on the underlying assets, then the borrowings and the pool of mortgages or mortgage-backed securities to which such borrowings relate may be classified as a taxable mortgage pool under the Internal Revenue Code. If any part of our investments were to be treated as a taxable mortgage pool, then our REIT status would not be impaired, but a portion of the taxable income we recognize may, under regulations to be issued by the Treasury Department, be characterized as ‘‘excess inclusion’’ income and allocated among our stockholders to the extent of and generally in proportion to the distributions we make to each stockholder. Any excess inclusion income would:
|
|
·
|
not be allowed to be offset by a stockholder’s net operating losses;
|
|
|
·
|
be subject to a tax as unrelated business income if a stockholder were a tax-exempt stockholder;
|
|
|
·
|
be subject to the application of federal income tax withholding at the maximum rate (without reduction for any otherwise applicable income tax treaty) with respect to amounts allocable to foreign stockholders; and
|
|
|
·
|
be taxable (at the highest corporate tax rate) to us, rather than to our stockholders, to the extent the excess inclusion income relates to stock held by disqualified organizations (generally, tax-exempt organizations not subject to tax on unrelated business income, including governmental organizations).
|
Failure to qualify as a REIT would subject us to federal income tax, which would reduce the cash available for distribution to our stockholders.
We qualify as a REIT for federal income tax purposes commencing with our taxable year ended December 31, 2007. However, the federal income tax laws governing REITs are extremely complex, and interpretations of the federal income tax laws governing qualification as a REIT are limited. Qualifying as a REIT requires us to meet various tests regarding the nature of our assets and our income, the ownership of our outstanding stock, and the amount of our distributions on an ongoing basis. While we intend to operate so that we will qualify as a REIT, given the highly complex nature of the rules governing REITs, the ongoing importance of factual determinations, including the tax treatment of certain investments we may make, and the possibility of future changes in our circumstances, no assurance can be given that we will so qualify for any particular year. If we fail to qualify as a REIT in any calendar year and we do not qualify for certain statutory relief provisions, we would be required to pay federal income tax on our taxable income. We might need to borrow money or sell assets to pay that tax. Our payment of income tax would decrease the amount of our income available for distribution to our stockholders. Furthermore, if we fail to maintain our qualification as a REIT and we do not qualify for certain statutory relief provisions, we no longer would be required to distribute substantially all of our REIT taxable income to our stockholders. Unless our failure to qualify as a REIT were excused under federal tax laws, we would be disqualified from taxation as a REIT for the four taxable years following the year during which qualification was lost.
40
Failure to make required distributions would subject us to tax, which would reduce the cash available for distribution to our stockholders.
To qualify as a REIT, we must distribute to our stockholders each calendar year at least 90% of our REIT taxable income (excluding certain items of non-cash income in excess of a specified threshold), determined without regard to the deduction for dividends paid and excluding net capital gain. To the extent that we satisfy the 90% distribution requirement, but distribute less than 100% of our taxable income, we will be subject to federal corporate income tax on our undistributed income. In addition, we will incur a 4% nondeductible excise tax on the amount, if any, by which our distributions in any calendar year are less than the sum of:
|
|
·
|
85% of our REIT ordinary income for that year;
|
|
|
·
|
95% of our REIT capital gain net income for that year; and
|
|
|
·
|
any undistributed taxable income from prior years.
|
We intend to distribute our REIT taxable income to our stockholders in a manner intended to satisfy the 90% distribution requirement and to avoid both corporate income tax and the 4% nondeductible excise tax. REIT taxable income only includes after-tax TRS net income to the extent such TRS distributes a dividend to the REIT. Therefore, our REIT dividend distributions may or may not include after-tax net income from our TRS.
Our taxable income may substantially exceed our net income as determined by GAAP. As an example, realized capital losses may be included in our GAAP net income, but may not be deductible in computing our taxable income. In addition, we may invest in assets that generate taxable income in excess of economic income or in advance of the corresponding cash flow from the assets. To the extent that we generate such non-cash taxable income in a taxable year, we may incur corporate income tax and the 4% nondeductible excise tax on that income if we do not distribute such income to stockholders in that year. In that event, we may be required to use cash reserves, incur debt, or liquidate non-cash assets at rates or at times that we regard as unfavorable to satisfy the distribution requirement and to avoid corporate income tax and the 4% nondeductible excise tax in that year. Moreover, our ability to distribute cash may be limited by available financing facilities. Therefore, our dividend payment level may fluctuate significantly, and, under some circumstances, we may not pay dividends at all.
Ownership limitations may restrict change of control or business combination opportunities in which our stockholders might receive a premium for their shares.
In order for us to qualify as a REIT for each taxable year after 2007, no more than 50% in value of our outstanding capital stock may be owned, directly or indirectly, by five or fewer individuals during the last half of any calendar year. ‘‘Individuals’’ for this purpose include natural persons, private foundations, some employee benefit plans and trusts, and some charitable trusts. To preserve our REIT qualification, our charter generally prohibits any person from directly or indirectly owning more than 9.8% in value or in number of shares, whichever is more restrictive, of any class or series of the outstanding shares of our capital stock. This ownership limitation could have the effect of discouraging a takeover or other transaction in which holders of our common stock might receive a premium for their shares over the then prevailing market price or which holders might believe to be otherwise in their best interests.
Our ownership of and relationship with any TRS which we may form or acquire will be limited, and a failure to comply with the limits would jeopardize our REIT status and may result in the application of a 100% excise tax.
A REIT may own up to 100% of the stock of one or more TRSs. A TRS may earn income that would not be qualifying income if earned directly by the parent REIT. Both the subsidiary and the REIT must jointly elect to treat the subsidiary as a TRS. Overall, no more than 25% of the value of a REIT’s assets may consist of stock or securities of one or more TRSs. A TRS will pay federal, state and local income tax at regular corporate rates on any taxable income that it earns. In addition, the TRS rules impose a 100% excise tax on certain transactions between a TRS and its parent REIT that are not conducted on an arm’s-length basis. Our TRS after-tax net income would be available for distribution to us but would not be required to be distributed to us. We anticipate that the aggregate value of the TRS stock and securities owned by us will be less than 25% of the value of our total assets (including the TRS stock and securities). Furthermore, we will monitor the value of our investments in our TRSs to ensure compliance with the rule that no more than 25% (20% after December 31, 2017) of the value of our assets may consist of TRS stock and securities (which is applied at the end of each calendar quarter). In addition, we will scrutinize all of our transactions with taxable REIT subsidiaries to ensure that they are entered into on arm’s-length terms to avoid incurring the 100% excise tax described above. There can be no assurance, however, that we will be able to comply with the 25% (20% after December 31, 2017) limitation discussed above or to avoid application of the 100% excise tax discussed above.
41
The tax on prohibited transactions will limit our ability to engage in transactions, including certain methods of securitizing mortgage loans that would be treated as sales for federal income tax purposes.
A REIT’s net income from prohibited transactions is subject to a 100% tax. In general, prohibited transactions are sales or other dispositions of property, other than foreclosure property, but including mortgage loans, held primarily for sale to customers in the ordinary course of business. We might be subject to this tax if we sold or securitized our assets in a manner that was treated as a sale for federal income tax purposes. Therefore, to avoid the prohibited transactions tax, we may choose not to engage in certain sales of assets at the REIT level and may securitize assets only in transactions that are treated as financing transactions and not as sales for tax purposes even though such transactions may not be the optimal execution on a pre-tax basis. We could avoid any prohibited transactions tax concerns by engaging in securitization transactions through a TRS, subject to certain limitations described above. To the extent that we engage in such activities through domestic TRSs, the income associated with such activities will be subject to federal (and applicable state and local) corporate income tax.
Characterization of the repurchase agreements we enter into to finance our investments as sales for tax purposes rather than as secured lending transactions would adversely affect our ability to qualify as a REIT.
We have entered into and will enter into repurchase agreements with a variety of counterparties to achieve our desired amount of leverage for the assets in which we invest. When we enter into a repurchase agreement, we generally sell assets to our counterparty to the agreement and receive cash from the counterparty. The counterparty is obligated to resell the assets back to us at the end of the term of the transaction, which is typically 30 to 90 days. We believe that for federal income tax purposes we will be treated as the owner of the assets that are the subject of repurchase agreements and that the repurchase agreements will be treated as secured lending transactions notwithstanding that such agreement may transfer record ownership of the assets to the counterparty during the term of the agreement. It is possible, however, that the IRS could successfully assert that we did not own these assets during the term of the repurchase agreements, in which case we could fail to qualify as a REIT.
Complying with REIT requirements may limit our ability to hedge effectively.
The REIT provisions of the Internal Revenue Code substantially limit our ability to hedge mortgage-backed securities and related borrowings. Under these provisions, our annual gross income from non-qualifying hedges, together with any other income not generated from qualifying real estate assets, cannot exceed 25% of our annual gross income. In addition, our aggregate gross income from non-qualifying hedges, fees, and certain other non-qualifying sources cannot exceed 5% of our annual gross income. As a result, we might have to limit our use of advantageous hedging techniques or implement those hedges through a TRS, which we may form in the future. This could increase the cost of our hedging activities or expose us to greater risks associated with changes in interest rates than we would otherwise want to bear.
We may be subject to adverse legislative or regulatory tax changes that could reduce the market price of our common stock.
At any time, the federal income tax laws or regulations governing REITs or the administrative interpretations of those laws or regulations may be amended. We cannot predict when or if any new federal income tax law, regulation or administrative interpretation, or any amendment to any existing federal income tax law, regulation or administrative interpretation, will be adopted, promulgated or become effective and any such law, regulation or interpretation may take effect retroactively. We and our stockholders could be adversely affected by any such change in, or any new, federal income tax law, regulation or administrative interpretation.
Dividends payable by REITs generally do not qualify for the reduced tax rates available for some dividends.
Qualified dividend income payable to U.S. stockholders that are individuals, trusts and estates is subject to the reduced maximum tax rate applicable to capital gains. Dividends payable by REITs, however, generally are not eligible for the reduced rates. The more favorable rates applicable to regular corporate qualified dividends could cause investors who are individuals, trusts and estates to perceive investments in REITs to be relatively less attractive than investments in the stocks of non-REIT corporations that pay dividends, which could adversely affect the value of the shares of REITs, including our common stock. Tax rates could be changed in future legislation.
42
None.
As of December 31, 2015, we do not own any property. Our executive and administrative office is located at 520 Madison Avenue, 32
nd
Floor, New York, New York 10022, telephone (212) 626-2300. We believe that this space is suitable and adequate for our current needs.
After the issuance of the interim financial statements for the third quarter of 2011, the Audit Committee of our Board of Directors initiated an internal investigation, with the assistance of outside counsel and financial advisors engaged by outside counsel, regarding the facts and circumstances relating to our accounting for Non-Agency RMBS and the restatement of our financial statements. This investigation addressed facts and circumstances raised by derivative demand letters served by several of our shareholders. The Audit Committee concluded its investigation in the fourth quarter of 2014 and reached agreements with FIDAC and the shareholders that resolve the issues raised in the derivative demand letters. The Audit Committee also pursued additional remedies against other parties regarding the facts and circumstances relating to our accounting for Non-Agency RMBS and the restatement of our financial statements, which were resolved in the first quarter of 2016 and we expect to recover $95 million which will be characterized as taxable income in 2016. The Company intends to declare a special dividend soon after receipt of this amount.
Not applicable.
43
Our common stock began trading publicly on the NYSE under the trading symbol “CIM” on November 16, 2007. As of December 31, 2015, we had 187,711,868 shares of common stock issued and outstanding which were held by 251 holders of record. The following tables set forth, for the periods indicated, the high, low, and closing sales prices per share of our common stock as reported on the NYSE composite tape and the cash dividends declared per share of our common stock.
|
Stock Price
|
||||||||||||
|
High
|
Low
|
Close
|
||||||||||
|
Quarter Ended December 31, 2015
|
$ | 14.63 | $ | 12.86 | $ | 13.64 | ||||||
|
Quarter Ended September 30, 2015
|
$ | 14.54 | $ | 13.21 | $ | 13.37 | ||||||
|
Quarter Ended June 30, 2015
|
$ | 15.94 | $ | 13.71 | $ | 13.71 | ||||||
|
Quarter Ended March 31, 2015
|
$ | 16.45 | $ | 15.35 | $ | 15.70 | ||||||
|
Quarter Ended December 31, 2014
|
$ | 16.95 | $ | 15.25 | $ | 15.90 | ||||||
|
Quarter Ended September 30, 2014
|
$ | 16.65 | $ | 15.20 | $ | 15.20 | ||||||
|
Quarter Ended June 30, 2014
|
$ | 16.65 | $ | 15.15 | $ | 15.95 | ||||||
|
Quarter Ended March 31, 2014
|
$ | 15.95 | $ | 14.95 | $ | 15.30 | ||||||
|
Common Dividends
Declared Per Share
|
||||
|
Quarter Ended December 31, 2015
|
$ | 0.48 | ||
|
Quarter Ended September 30, 2015
|
$ | 0.48 | ||
|
Quarter Ended June 30, 2015
|
$ | 0.48 | ||
|
Quarter Ended March 31, 2015
|
$ | 0.48 | ||
|
Quarter Ended December 31, 2014
|
$ | 0.45 | ||
|
Quarter Ended September 30, 2014
|
$ | 0.45 | ||
|
Quarter Ended June 30, 2014
|
$ | 0.45 | ||
|
Quarter Ended March 31, 2014
|
$ | 0.45 | ||
We pay quarterly dividends and distribute to our stockholders all or substantially all of our taxable income in each year (subject to certain adjustments). This enables us to qualify for the tax benefits accorded to a REIT under the Code. We have not established a minimum dividend payment level and our ability to pay dividends may be adversely affected for the reasons described under the caption “Risk Factors.” All distributions will be made at the discretion of our Board of Directors and will depend on our taxable income, our financial condition, maintenance of our REIT status and such other factors as our Board of Directors may deem relevant from time to time.
The Board of Directors declared dividends of $1.92 per share during 2015. The Board of Directors declared dividends of $1.80 per share during 2014.
44
Share Performance Graph
The following graph and table set forth certain information comparing the yearly percentage change in cumulative total return on our common stock to the cumulative total return of the Standard & Poor’s Composite-500 Stock Index or S&P 500 Index, and the Bloomberg REIT Mortgage Index, or BBG REIT Index, an industry index of mortgage REITs. The comparison is for the period from December 31, 2010 to December 31, 2015 and assumes the reinvestment of dividends. The graph and table assume that $100 was invested in our common stock and each of the two other indices on December 31, 2010. Upon written request we will provide stockholders with a list of the REITs included in the BBG REIT Index.
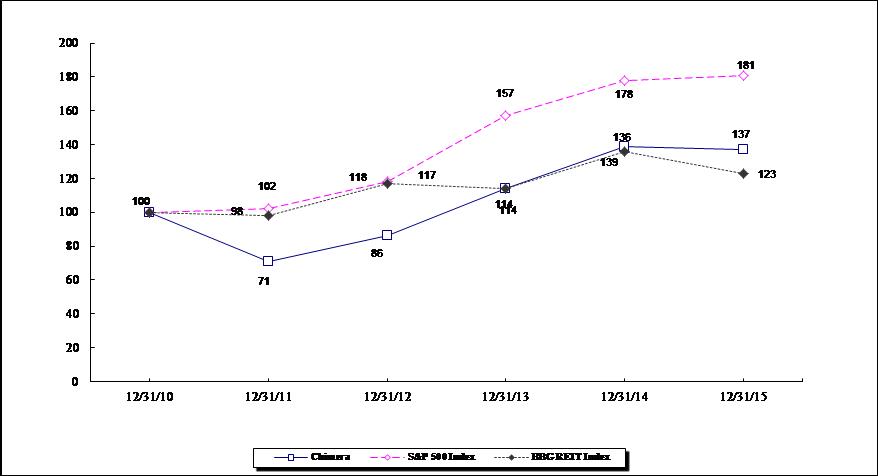
| 12/31/2010 | 12//31/2011 | 12/31/2012 | 12/31/2013 | 12/31/2014 | 12/31/2015 | |||||||||||||||||||
| Chimera | 100 | 71 | 86 | 114 | 139 | 137 | ||||||||||||||||||
| S&P 500 Index | 100 | 102 | 118 | 157 | 178 | 181 | ||||||||||||||||||
| BBG REIT Index | 100 | 98 | 117 | 114 | 136 | 123 | ||||||||||||||||||
The information in the share performance graph and table has been obtained from sources believed to be reliable, but neither its accuracy nor its completeness can be guaranteed. The historical information set forth above is not necessarily indicative of future performance. Accordingly, we do not make or endorse any predictions as to future share performance.
The share performance graph and table shall not be deemed, under the Securities Act of 1933, as amended, or the Securities Exchange Act of 1934, as amended, to be (i) “soliciting material” or “filed” or (ii) incorporated by reference by any general statement into any filing made by us with the SEC, except to the extent that we specifically incorporate such share performance graph and table by reference.
45
Equity Compensation Plan Information
We have adopted a long term stock incentive plan, or Incentive Plan, to provide incentives to our independent directors and employees to stimulate their efforts towards our continued success, long-term growth and profitability and to attract, reward and retain personnel and other service providers. The Incentive Plan authorizes the Compensation Committee of the Board of Directors to grant awards, including incentive stock options as defined under Section 422 of the Code, (
“
ISOs
”
), non-qualified stock options, (
“
NQSOs
”
), restricted shares and other types of incentive awards. The Incentive Plan authorizes the granting of options or other awards for an aggregate of 8,000,000 shares of common stock. For a description of our Incentive Plan, see Note 12 to the Consolidated Financial Statements.
The following table provides information as of December 31, 2015 concerning shares of our common stock authorized for issuance under our existing Incentive Plan.
|
Plan Category
|
Number of Securities
to be Issued Upon
Exercise of
Outstanding Options,
Warrants, and Rights
|
Weighted Average
Exercise Price of
Outstanding
Options, Warrants,
and Rights
|
Number of Securities
Remaining Available
for Future Issuance
Under Equity
Compensation Plans
|
|||||||||
|
Equity Compensation Plans Approved by Stockholders
|
- | - | 7,432,548 | |||||||||
|
Equity Compensation Plans Not Approved by Stockholders (1)
|
- | - | - | |||||||||
|
Total
|
- | - | 7,432,548 | |||||||||
|
(1) We do not have any equity plans that have not been approved by our stockholders.
|
||||||||||||
The following selected financial data are as of and for the years ended December 31, 2015, 2014, 2013, 2012 and 2011. The selected financial data should be read in conjunction with the more detailed information contained in the Consolidated Financial Statements and Notes thereto contained in Part IV, Financial Statements, and “Management's Discussion and Analysis of Financial Condition and Results of Operations” in Part II, Item 7, included elsewhere in this 2015 Form 10-K.
|
Consolidated Statements of Financial Condition Highlights
|
||||||||||||||||||||
|
(dollars in thousands, except share and per share data)
|
||||||||||||||||||||
|
December 31,
|
December 31,
|
December 31,
|
December 31,
|
December 31,
|
||||||||||||||||
|
2015
|
2014
|
2013
|
2012
|
2011
|
||||||||||||||||
|
Non-Agency Mortgage-Backed Securities
|
$ | 3,675,841 | $ | 3,404,149 | $ | 3,774,463 | $ | 3,961,208 | $ | 4,088,945 | ||||||||||
|
Agency Mortgage-Backed securities
|
$ | 6,514,824 | $ | 8,441,522 | $ | 1,997,578 | $ | 1,806,697 | $ | 3,144,531 | ||||||||||
|
Securitized loans held for investment, net of allowance for loan losses
|
$ | - | $ | 626,112 | $ | 783,484 | $ | 1,300,131 | $ | 256,632 | ||||||||||
|
Securitized loans held for investment, at fair value
|
$ | 4,768,416 | $ | 4,699,215 | $ | - | $ | - | $ | - | ||||||||||
|
Total assets
|
$ | 15,344,646 | $ | 19,155,005 | $ | 6,936,081 | $ | 7,742,489 | $ | 7,747,135 | ||||||||||
|
Repurchase agreements
|
$ | 7,439,339 | $ | 8,455,381 | $ | 1,658,561 | $ | 1,528,025 | $ | 2,672,989 | ||||||||||
|
Securitized debt, collateralized by Non-Agency RMBS
|
$ | 529,415 | $ | 704,915 | $ | 933,732 | $ | 1,336,261 | $ | 1,630,276 | ||||||||||
|
Securitized debt, loans held for investment
|
$ | - | $ | 521,997 | $ | 669,981 | $ | 1,169,710 | $ | 212,778 | ||||||||||
|
Securitized debt at fair value, loans held for investment
|
$ | 3,720,496 | $ | 3,868,366 | $ | - | $ | - | $ | - | ||||||||||
|
Total liabilities
|
$ | 12,398,458 | $ | 15,547,315 | $ | 3,604,571 | $ | 4,200,010 | $ | 4,699,516 | ||||||||||
|
Shareholders' equity
|
$ | 2,946,188 | $ | 3,607,690 | $ | 3,331,510 | $ | 3,542,479 | $ | 3,047,619 | ||||||||||
|
Book value per share (1)
|
$ | 15.70 | $ | 17.55 | $ | 16.20 | $ | 17.25 | $ | 14.85 | ||||||||||
|
Number of shares outstanding
|
187,711,868 | 205,546,144 | 205,525,247 | 205,519,492 | 205,493,418 | |||||||||||||||
|
(1) See discussion of Estimated Economic Book Value in Management's Discussion and Analysis of Financial Condition and Results of Operations.
|
||||||||||||||||||||
46
|
|
||||||||||||||||||||
|
(dollars in thousands, except share and per share data)
|
||||||||||||||||||||
| For the Year Ended | ||||||||||||||||||||
|
December 31, 2015
|
December 31, 2014
|
December 31, 2013
|
December 31, 2012
|
December 31, 2011
|
||||||||||||||||
|
Interest income
|
$ | 872,737 | $ | 687,795 | $ | 511,783 | $ | 589,440 | $ | 705,024 | ||||||||||
|
Income expense
|
$ | 259,365 | $ | 147,785 | $ | 101,999 | $ | 126,558 | $ | 134,858 | ||||||||||
|
Net interest income
|
$ | 613,372 | $ | 540,010 | $ | 409,784 | $ | 462,882 | $ | 570,166 | ||||||||||
|
Net income
|
$ | 250,349 | $ | 589,205 | $ | 362,686 | $ | 327,767 | $ | 137,329 | ||||||||||
|
Income per share-basic
|
$ | 1.25 | $ | 2.87 | $ | 1.77 | $ | 1.60 | $ | 0.67 | ||||||||||
|
Core earnings per basic common share (1)
|
$ | 2.37 | $ | 1.95 | $ | 1.70 | $ | 1.85 | $ | 2.38 | ||||||||||
|
Average shares-basic
|
199,563,196 | 205,450,095 | 205,418,876 | 205,366,207 | 205,273,039 | |||||||||||||||
|
Dividends declared per share (2)
|
$ | 1.92 | $ | 1.80 | $ | 2.80 | $ | 1.90 | $ | 2.55 | ||||||||||
|
(1) See discussion of Core Earnings per basic common share in Management's Discussion and Analysis of Financial Condition and Results of Operations.
|
||||||||||||||||||||
|
(2) For applicable period as reported in our earnings announcements.
|
||||||||||||||||||||
The following discussion of our financial condition and results of operations should be read in conjunction with the consolidated financial statements and notes to those statements included in Item 15 of this 2015 Form 10-K. The discussion may contain certain forward-looking statements that involve risks and uncertainties. Forward-looking statements are those that are not historical in nature. As a result of many factors, such as those set forth under “Risk Factors” in this 2015 Form 10-K, our actual results may differ materially from those anticipated in such forward-looking statements.
Executive Summary
We are a REIT primarily engaged in the business of investing, on a leveraged basis, in a diversified portfolio of mortgage assets, including Agency RMBS, Non-Agency RMBS, Agency CMBS, residential mortgage loans, and real estate related securities. Our principal business objective is to deliver shareholder value through the generation of distributable income and through asset performance linked to residential mortgage credit fundamentals. We selectively invest in residential mortgage assets with a focus on credit analysis, projected prepayment rates, interest rate sensitivity and expected return.
We focus our investment activities primarily on acquiring Non-Agency and Agency residential and commercial mortgage-backed securities, (
“
MBS
”)
, and on purchasing residential mortgage loans. At December 31, 2015, based on the amortized cost balance of our interest earning assets, approximately 46% of our investment portfolio was Agency MBS, 20% of our investment portfolio was Non-Agency RMBS, and 34% of our investment portfolio was securitized residential mortgage loans. At December 31, 2014, based on the amortized cost balance of our interest earning assets, approximately 52% of our investment portfolio was Agency MBS, 16% of our investment portfolio was Non-Agency RMBS, and 32% of our investment portfolio was securitized residential mortgage loans.
We make investment decisions based on various factors, including expected cash yield, relative value, risk-adjusted returns, current and projected credit fundamentals, current and projected macroeconomic considerations, current and projected supply and demand, credit and market risk concentration limits, liquidity, cost of financing and financing availability, as well as maintaining our REIT qualification and our exemption from registration under the 1940 Act.
We have engaged in transactions with residential mortgage lending operations of leading commercial banks and other originators in which we identified and re-underwrote residential mortgage loans owned by such entities, and purchased and securitized such residential mortgage loans. In the past we have also acquired formerly AAA-rated Non-Agency RMBS and immediately re-securitized those securities. We sold the resulting AAA-rated super senior RMBS and retained the rated or unrated mezzanine and subordinate RMBS.
47
Our investment strategy is intended to take advantage of opportunities in the current interest rate and credit environment. We expect to adjust our strategy to changing market conditions by shifting our asset allocations across these various asset classes as interest rate and credit cycles change over time. We believe that our strategy will
enable us to pay dividends and achieve capital appreciation throughout changing market cycles. We expect to take a long-term view of assets and liabilities, and our reported earnings and estimates of the fair value of our investments at the end of a financial reporting period will not significantly impact our objective of providing attractive risk-adjusted returns to our stockholders over the long-term.
We use leverage to seek to increase our potential returns and to finance the acquisition of our assets. Our income is generated primarily by the difference, or net spread, between the income we earn on our assets and the cost of our borrowings. We expect to finance our investments using a variety of financing sources including, when available, repurchase agreements, warehouse facilities and securitizations. We may manage our debt and interest rate risk by utilizing interest rate hedges, such as interest rate swaps, caps, options and futures to reduce the effect of interest rate fluctuations related to our financing sources.
We have elected and believe we are organized and have operated in a manner that qualifies us to be taxed as a REIT under the Code. A REIT generally will not be subject to federal income tax on taxable income that is distributed to stockholders. Furthermore, substantially all of our assets consist of qualified REIT real estate assets (of the type described in Code Section 856(c)(5)). We calculate that at least 75% of our assets were qualified REIT assets, as defined in the Code, as of December 31, 2015 and December 31, 2014. We also calculate that our revenues qualified for the 75% REIT income test and for the 95% REIT income test for years ended December 31, 2015, 2014 and 2013. We also met all REIT requirements regarding the ownership of our common stock and the distribution of our REIT taxable income. Therefore, as of December 31, 2015, 2014 and 2013, we believe that we qualified as a REIT under the Code.
We operate our business to be exempt from registration under the 1940 Act, and therefore we are required to invest a substantial majority of our assets in loans secured by mortgages on real estate and real estate-related assets. Subject to maintaining our REIT qualification and our 1940 Act exemption, we do not have any limitations on the amounts we may invest in any of our targeted asset classes.
Looking forward, we cannot predict the percentage of our assets that will be invested in each asset class or whether we will invest in other classes of investments. We may change our investment strategy and policies without a vote of our stockholders.
Business Environment
The interest rate environment over the last three years has been extremely volatile. During that period, we have experienced many fluctuations in the 10-year Treasury yield that have exceeded 50 basis points (0.50%) in a short timeframe. More broadly, the global fixed income, equity and commodity markets experienced market turbulence and increased volatility during 2015 as investors braced and waited for the Federal Reserve Bank to increase rates.
During this volatile market period, we have continued to acquire investments that we believe provide a risk-adjusted return and income that support the dividend that we distribute to our investors.
Investment Portfolio
For our credit portfolio, we acquired, in the third quarter of 2014, the subordinate notes and call rights with respect to seven residential mortgage loan securitizations sponsored by Springleaf Financial. As planned, we exercised the calls rights to acquire the remaining residential mortgage loans, and then securitized those mortgage loans, for one of the Springleaf transactions in 2014 and for three of the Springleaf transactions that were eligible to be called in 2015. By exercising our call rights and securitizing the remaining mortgage loans, we were able to increase structural leverage while reducing interest costs on our investment in the mortgage loans. In addition, we executed one other securitization of seasoned subprime collateral in the second quarter of 2015.
48
To reduce the rate sensitivity of our Agency portfolio, we decreased our exposure to Agency MBS by more than $2.5 billion during 2015. We also sold Agency MBS with a 4% coupon for Agency MBS with a 3.5% coupon to mitigate prepayment risk as rates declined at certain points during 2015. At December 31, 2014, our portfolio of 4% Agency MBS was 75% of our total Agency MBS compared to 29% by December 31, 2015, while our portfolio of 3.5% Agency MBS increased from 18% at December 31, 2014 to 35% at December 31, 2015. We also significantly increased our Agency CMBS portfolio in 2015. We began the year with less than $250 million of Agency CMBS and increased this portfolio over $700 million to $952 million as of December 31, 2015. Our Agency CMBS portfolio is less interest rate sensitive than our Agency MBS portfolio because our Agency CMBS have lock out periods and prepayment penalties that protect the portfolio against prepayment risk, as well as attractive risk adjusted yields.
Business Operations
As discussed in “Item 1 Business” section, in August 2015, we became internally managed. Specifically, we now have employees and no longer rely on a third-party manager to operate our business. In connection with the Internalization, we have relocated to new office space in New York, and hired the additional staff necessary to complete the internalization. Further, before year end, we built, tested, and completed the construction of a new data center, back up facility and have an independent software suite. We expect operating expenses to be lower on an internalized basis compared to the prior externally managed model and have eliminated certain inherent conflicts particular to externally managed companies.
Stock Buy Back
In August 2015, we announced a $250 million stock buyback plan. Immediately following the announcement, we entered into a share repurchase agreement with Annaly to acquire the 9 million shares owned by Annaly. We used the remaining amount available after the purchase of shared owned by Annaly to purchase shares in the open market during the third and fourth quarter of 2015. The stock buyback reduced shares outstanding by 18 million shares or 9% of shares outstanding prior to the buyback. On February 18, 2016, the Board of Directors increased the existing share buyback program by $100 million to $350 million.
Net Income Summary
The table below presents our net income on a GAAP basis for the years ended December 31, 2015, 2014 and 2013.
49
|
Net Income
|
||||||||||||
|
(dollars in thousands)
|
||||||||||||
|
(unaudited)
|
||||||||||||
|
For the Year Ended
|
||||||||||||
|
December 31, 2015
|
December 31, 2014
|
December 31, 2013
|
||||||||||
|
Net Interest Income:
|
||||||||||||
|
Interest income (1)
|
$ | 872,737 | $ | 687,795 | $ | 511,783 | ||||||
|
Interest expense (2)
|
259,365 | 147,785 | 101,999 | |||||||||
|
Net interest income (expense)
|
613,372 | 540,010 | 409,784 | |||||||||
|
Other-than-temporary impairments:
|
||||||||||||
|
Total other-than-temporary impairment losses
|
(8,700 | ) | (8,713 | ) | (4,356 | ) | ||||||
|
Portion of loss recognized in other comprehensive income
|
(58,744 | ) | (55,279 | ) | (40,811 | ) | ||||||
|
Net other-than-temporary credit impairment losses
|
(67,444 | ) | (63,992 | ) | (45,167 | ) | ||||||
|
Other Investment gains (losses):
|
||||||||||||
|
Net unrealized gains (losses) on derivatives
|
67,385 | (103,496 | ) | 34,369 | ||||||||
|
Realized gains (losses) on terminations of interest rate swaps
|
(98,949 | ) | (82,852 | ) | (7,713 | ) | ||||||
|
Net realized gains (losses) on derivatives
|
(83,073 | ) | - | - | ||||||||
|
Net gains (losses) on derivatives
|
(114,637 | ) | (186,348 | ) | 26,656 | |||||||
|
Net unrealized gains (losses) on financial instruments at fair value
|
(158,433 | ) | 193,534 | (44,277 | ) | |||||||
|
Net realized gains (losses) on sales of investments
|
77,074 | 91,709 | 68,107 | |||||||||
|
Gain on deconsolidation
|
(256 | ) | 47,846 | - | ||||||||
|
Gains (losses) on Extinguishment of Debt
|
(5,930 | ) | (2,184 | ) | - | |||||||
|
Realized losses on principal write-downs of Non-Agency RMBS
|
- | - | (18,316 | ) | ||||||||
|
Total other gains (losses)
|
(202,182 | ) | 144,557 | 32,170 | ||||||||
|
Other expenses:
|
||||||||||||
|
Management fees
|
24,609 | 32,514 | 25,952 | |||||||||
|
Expense recoveries from Manager
|
(6,906 | ) | (8,936 | ) | (6,788 | ) | ||||||
|
Net management fees
|
17,703 | 23,578 | 19,164 | |||||||||
|
Provision for loan losses, net
|
- | (232 | ) | (1,799 | ) | |||||||
|
Compensation and benefits
|
10,544 | - | - | |||||||||
|
General and administrative expenses
|
31,633 | 20,403 | 14,085 | |||||||||
|
Servicing Fees of consolidated VIEs
|
25,244 | 10,004 | 2,649 | |||||||||
|
Deal Expenses
|
8,272 | 1,398 | - | |||||||||
|
Other (income) expense
|
- | (23,783 | ) | - | ||||||||
|
Total other expenses
|
93,396 | 31,368 | 34,099 | |||||||||
|
Income (loss) before income taxes
|
250,350 | 589,207 | 362,688 | |||||||||
|
Income taxes
|
1 | 2 | 2 | |||||||||
|
Net income (loss)
|
$ | 250,349 | $ | 589,205 | $ | 362,686 | ||||||
|
Net income (loss) per share available to common shareholders:
|
||||||||||||
|
Basic
|
$ | 1.25 | $ | 2.87 | $ | 1.77 | ||||||
|
Diluted
|
$ | 1.25 | $ | 2.87 | $ | 1.76 | ||||||
|
Weighted average number of common shares outstanding:
|
||||||||||||
|
Basic
|
199,563,196 | 205,450,095 | 205,418,876 | |||||||||
|
Diluted
|
199,650,177 | 205,508,769 | 205,514,069 | |||||||||
|
(1) Includes interest income of consolidated VIEs of $575,715, $428,992 and $371,559 for the years ended December 31, 2015, 2014
and 2013, respectively. See Note 8 for further discussion.
|
|
(2) Includes interest expense of consolidated VIEs of $191,922, $119,103 and $95,229 for the years ended December 31, 2015, 2014
and 2013, respectively. See Note 8 for further discussion.
|
|
See accompanying notes to consolidated financial statements.
|
Our net income decreased by $339 million to $250 million, or $1.25 per average basic common share, for the year ended December 31, 2015 as compared to $589 million, or $2.87 per average basic common share, for the year ended December 31, 2014. Interest income increased by $185 million, or 27%, to $873 million for the year ended December 31, 2015 as compared to $688 million for the same period of 2014. This increase in interest income was offset by an increase of $111 million in interest expense to $259 million for the year ended December 31, 2015 as compared to $148 million for the same period of 2014. This resulted in an overall increase of $73 million in net interest income, year over year as we have continued to rebalance our portfolio to more Non-Agency holdings with higher costs of financing, but higher interest returns.
50
The overall decrease in earnings for the year ended December 31, 2015 compared to the same period of 2014 is attributable primarily to an increase in net unrealized losses on financial instruments at fair value of $352 million. The Company recognized an unrealized loss for the year ended 2015 of $158 million, compared to an unrealized gain on financial instruments at fair value of $194 million for the year ended December 31, 2014. A significant portion of our financial assets and liabilities are carried at fair value with changes in fair value reflected in earnings. This can result in significant changes in net income as prices change as a result of changes in market conditions.
Our net income increased by $226 million to $589 million, or $2.87 per average basic common share, for the year ended December 31, 2014 as compared to $363 million, or $1.77 per average basic common share, for the year ended December 31, 2013. The increase in earnings for the year ended December 31, 2014 over the same period of 2013 is primarily attributable to higher interest income, net of interest expense, of $130 million, to $540 million for the year ended December 31, 2014 from $410 million in the same period of the prior year. The increase in net interest income is due to the increase in invested assets from the acquisition of additional Agency RMBS and securitized loans held for investment. In addition to the increase in net interest income, we recognized gains as a result of changes in fair value of financial instruments carried at fair value of $238 million. The Company recognized a gain of $194 million in fair value of financial instruments carried at fair value for the year ended December 31, 2014, compared to a loss of $44 million for the year ended December 31, 2013. This gain from increase in fair value of financial instruments carried at fair value was offset by net unrealized losses on derivatives as a result of changes in fair value on derivatives of $138 million. The Company recognized net unrealized losses on derivatives of $104 million for the year ended December 31, 2014 compared to a gain of $34 million for the year ended December 31, 2013.
We discuss the changes in our net income in greater detail in the discussion on our results of operations below.
Results of Operations for the years Ended December 31, 2015, 2014 and 2013
Our primary source of income is interest income earned on our assets. Our economic net interest income equals interest income excluding interest earned on cash and cash equivalents less interest expense and realized losses on our interest rate hedges.
Interest Income
Interest income increased by $185 million, or 27%, to $873 million for the year ended December 31, 2015 from $688 million for the same period of 2014. The increase is primarily due to the acquisition of seasoned sub-prime residential mortgage loan pools during the second half of 2014 and 2015. Seasoned sub-prime residential mortgage loans contributed $288 million of interest income during the year ended December 31, 2015 as compared to $104 million for the same period of 2014. In addition we also increased our agency holdings which contributed an additional $12 million in interest income for the year as compared to 2014. These increases were offset by a decline in interest income of $38 million on our Non-Agency RMBS and jumbo prime securitizations held in consolidated VIEs as these portfolios continue to run-off.
Interest income increased by $176 million, or 34%, to $688 million for the year ended December 31, 2014 from $512 million for the same period of 2013. The increase is primarily due to the increase in agency holdings of approximately $6.4 billion acquired during 2014 and the increase in securitized loans of approximately $4.5 billion also acquired during 2014. Interest income on our Agency RMBS portfolio increased by $110 million and interest income on our securitized loan portfolio increased by $100 million. Both portfolios increased from the prior year due to acquisitions during 2014 financed by additional repurchase agreements and secured debt as we increased our leverage ratio during 2014.The increases are partially offset by a decline in interest income on our Non-Agency portfolio of $34 million year over year as natural principal payments and expected losses have reduced the interest earning balance of these assets.
51
Interest Expense
Interest expense increased by $111 million, or 76%, to $259 million for the year ended December 31, 2015 from $148 million for the same period of 2014. The increase is primarily due to increased interest expense of $95 million on our securitized debt collateralized by seasoned sub-prime residential mortgage loans due to the financing added for the acquisition of seasoned sub-prime residential mortgage loans during the second half of 2014 and in 2015. Interest expense on repurchase agreements increased by $33 million during the year ended December 31, 2015 when compared to the same period of 2014, as repurchase agreements balances increased to finance both the Agency and Non-Agency portfolio. The interest rates were higher on repurchase agreements collateralized by Agency and Non-Agency MBS. The increase in interest rates for repurchase agreements collateralized by Agency MBS was driven by market factors and the increase in interest rates for repurchase agreements collateralized by Non-Agency MBS was driven by the addition of longer term repurchase agreements and anticipated increase in the federal funds rate. These increases were offset by a decline in interest expense of $23 million on our securitized debt, collateralized by Non-Agency RMBS and jumbo prime securitizations held in our consolidated VIEs as this portfolio continues to run-off.
Interest expense increased by $46 million, or 45%, to $148 million for the year ended December 31, 2014 from $102 million for the same period of 2013. The increase is primarily due to increased interest expense of $24 million on our securitized debt and $21 million on our repurchase agreements. During 2014, we increased leverage to finance additional investments in Agency RMBS, Non-Agency RMBS, as well as securitized loans held for investment. Our repurchase agreement obligation increased by $6.8 billion to $8.5 billion as of December 31, 2014 as compared to $1.7 billion as of December 31, 2013.
Interest expense for GAAP reporting does not include the periodic costs of our derivatives, which are reported separately.
Net Economic Interest Income
Our economic net interest income equals interest income, less interest expense and realized losses on our interest rate swaps. Realized losses on our interest rate swaps are the periodic net settlement payments made or received. For the purpose of computing economic net interest income and ratios relating to cost of funds measures throughout this section, interest expense includes net payments on our interest rate swaps, which is presented as a part of Realized gains (losses) on derivatives in our Consolidated Statements of Operations and Comprehensive Income. Interest rate swaps are used to manage the increase in interest paid on repurchase agreements in a rising rate environment. Presenting the net contractual interest payments on interest rate swaps with the interest paid on interest-bearing liabilities reflects our total contractual interest payments. We believe this presentation is useful to investors because it depicts the economic value of our investment strategy by showing actual interest expense and net interest income. Where indicated, interest expense, including interest payments on interest rate swaps, is referred to as economic interest expense. Where indicated, net interest income reflecting interest payments on interest rate swaps, is referred to as economic net interest income.
The following table reconciles the GAAP and non-GAAP measurements reflected in the Management’s Discussion and Analysis of Financial Condition and Results of Operations.
|
GAAP
Interest
Income
|
GAAP
Interest
Expense
|
Add: Net
Realized
Losses on
Interest Rate
Swaps
|
Economic
Interest
Expense
|
GAAP Net
Interest
Income
|
Less: Net
Realized
Losses on
Interest Rate
Swaps
|
Economic
Net
Interest
Income (1)
|
||||||||||||||||||||||
|
For the Year Ended December 31, 2015
|
$ | 872,737 | $ | 257,150 | $ | 47,227 | $ | 304,377 | $ | 615,587 | $ | 47,227 | $ | 567,361 | ||||||||||||||
|
For the Year Ended December 31, 2014
|
$ | 687,795 | $ | 147,785 | $ | 52,522 | $ | 200,307 | $ | 540,010 | $ | 52,522 | $ | 487,466 | ||||||||||||||
|
For the Year Ended December 31, 2013
|
$ | 511,783 | $ | 101,999 | $ | 21,789 | $ | 123,788 | $ | 409,784 | $ | 21,789 | $ | 387,957 | ||||||||||||||
|
For the Quarter Ended December 31, 2015
|
$ | 201,912 | $ | 64,954 | $ | 11,673 | $ | 76,627 | $ | 136,958 | $ | 11,673 | $ | 125,272 | ||||||||||||||
|
For the Quarter Ended September 30, 2015
|
$ | 211,876 | $ | 65,696 | $ | 11,355 | $ | 77,051 | $ | 146,180 | $ | 11,355 | $ | 134,714 | ||||||||||||||
|
For the Quarter Ended June 30, 2015
|
$ | 215,804 | $ | 66,044 | $ | 9,030 | $ | 75,074 | $ | 149,760 | $ | 9,030 | $ | 140,173 | ||||||||||||||
|
For the Quarter Ended March 31, 2015
|
$ | 243,145 | $ | 60,456 | $ | 15,169 | $ | 75,625 | $ | 182,689 | $ | 15,169 | $ | 167,202 | ||||||||||||||
|
(1) Excludes interest income on cash and cash equivalents.
|
||||||||||||||||||||||||||||
52
Net Interest Rate Spread
The following table shows our average earning assets held, interest earned on assets, yield on average interest earning assets, average debt balance, economic interest expense, economic average cost of funds, economic net interest income, and net interest rate spread for the periods presented.
|
For the Year Ended
|
||||||||||||||||||||||||
| December 31, 2015 |
December 31, 2014
|
|||||||||||||||||||||||
|
(dollars in thousands)
|
||||||||||||||||||||||||
|
Average
Balance
|
Interest
|
Average
Yield/Cost
|
Average
Balance
|
Interest
|
Average
Yield/Cost
|
|||||||||||||||||||
|
Assets:
|
||||||||||||||||||||||||
|
Interest-earning assets (1):
|
||||||||||||||||||||||||
|
Agency MBS
|
$ | 6,569,743 | $ | 192,501 | 2.9 | % | $ | 5,222,882 | $ | 180,206 | 3.5 | % | ||||||||||||
|
Non-Agency RMBS
|
1,274,344 | 105,647 | 8.3 | % | 801,547 | 78,577 | 9.8 | % | ||||||||||||||||
|
Non-Agency RMBS transferred to consolidated VIEs
|
1,554,681 | 266,141 | 17.1 | % | 1,867,986 | 295,475 | 15.8 | % | ||||||||||||||||
|
Jumbo Prime securitized residential mortgage loans held for investment
|
540,156 | 21,913 | 4.1 | % | 720,965 | 30,010 | 4.2 | % | ||||||||||||||||
|
Seasoned sub-prime securitized residential mortgage loans held for investment
|
4,527,246 | 287,661 | 6.4 | % | 1,419,155 | 103,505 | 7.3 | % | ||||||||||||||||
|
Total
|
$ | 14,466,170 | $ | 873,863 | 6.0 | % | $ | 10,032,535 | $ | 687,773 | 6.9 | % | ||||||||||||
|
Liabilities and stockholders' equity:
|
||||||||||||||||||||||||
|
Interest-bearing liabilities:
|
||||||||||||||||||||||||
|
Agency repurchase agreements (2)
|
$ | 5,776,980 | $ | 77,975 | 1.3 | % | $ | 4,749,283 | $ | 71,569 | 1.5 | % | ||||||||||||
|
Non-Agency repurchase agreements
|
1,627,909 | 36,694 | 2.3 | % | 444,599 | 9,634 | 2.2 | % | ||||||||||||||||
|
Securitized debt, collateralized by Non-Agency RMBS
|
620,611 | 35,282 | 5.7 | % | 799,473 | 53,367 | 6.7 | % | ||||||||||||||||
|
Securitized debt, collateralized by jumbo prime residential mortgage loans
|
431,179 | 16,766 | 3.9 | % | 720,965 | 21,602 | 3.0 | % | ||||||||||||||||
|
Securitized debt, collateralized by seasoned sub-prime residential mortgage loans
|
3,734,069 | 137,658 | 3.7 | % | 1,174,682 | 44,134 | 3.8 | % | ||||||||||||||||
|
Total
|
$ | 12,190,748 | $ | 304,375 | 2.5 | % | $ | 7,889,002 | $ | 200,306 | 2.5 | % | ||||||||||||
|
Net economic interest income/net interest rate spread
|
$ | 569,488 | 3.5 | % | $ | 487,467 | 4.4 | % | ||||||||||||||||
|
Net interest-earning assets/net interest margin
|
$ | 2,275,422 | 3.9 | % | $ | 2,143,533 | 4.9 | % | ||||||||||||||||
|
Ratio of interest-earning assets to interest bearing liabilities
|
1.19 | 1.27 | ||||||||||||||||||||||
|
(1) Interest-earning assets at amortized cost
|
||||||||||||||||||||||||
|
(2) Interest includes periodic cash settlements on swaps
|
||||||||||||||||||||||||
|
For the Quarter Ended
|
||||||||||||||||||||||||
| December 31, 2015 |
December 31, 2014
|
|||||||||||||||||||||||
|
(dollars in thousands)
|
||||||||||||||||||||||||
|
Average
Balance
|
Interest
|
Average
Yield/Cost
|
Average
Balance
|
Interest
|
Average
Yield/Cost
|
|||||||||||||||||||
|
Assets:
|
||||||||||||||||||||||||
|
Interest-earning assets (1):
|
||||||||||||||||||||||||
|
Agency MBS
|
$ | 5,967,169 | $ | 37,762 | 2.5 | % | $ | 7,898,850 | $ | 70,884 | 3.6 | % | ||||||||||||
|
Non-Agency RMBS
|
1,452,460 | 27,993 | 7.7 | % | 810,882 | 16,786 | 8.3 | % | ||||||||||||||||
|
Non-Agency RMBS transferred to consolidated VIEs
|
1,465,966 | 64,045 | 17.5 | % | 1,697,510 | 70,058 | 16.5 | % | ||||||||||||||||
|
Jumbo Prime securitized residential mortgage loans held for investment
|
474,543 | 3,688 | 3.1 | % | 666,017 | 8,564 | 5.1 | % | ||||||||||||||||
|
Seasoned sub-prime securitized residential mortgage loans held for investment
|
4,522,426 | 68,411 | 6.1 | % | 4,612,214 | 76,153 | 6.6 | % | ||||||||||||||||
|
Total
|
$ | 13,882,564 | $ | 201,899 | 5.8 | % | $ | 15,685,473 | $ | 242,445 | 6.2 | % | ||||||||||||
|
Liabilities and stockholders' equity:
|
||||||||||||||||||||||||
|
Interest-bearing liabilities:
|
||||||||||||||||||||||||
|
Agency repurchase agreements (2)
|
$ | 5,296,934 | $ | 20,045 | 1.5 | % | $ | 7,215,664 | $ | 25,533 | 1.4 | % | ||||||||||||
|
Non-Agency repurchase agreements
|
2,095,149 | 12,677 | 2.4 | % | 1,032,058 | 5,695 | 2.2 | % | ||||||||||||||||
|
Securitized debt, collateralized by Non-Agency RMBS
|
550,634 | 8,171 | 5.9 | % | 723,905 | 13,808 | 7.6 | % | ||||||||||||||||
|
Securitized debt, collateralized by jumbo prime residential mortgage loans
|
368,975 | 3,041 | 3.3 | % | 547,370 | 4,541 | 3.3 | % | ||||||||||||||||
|
Securitized debt, collateralized by seasoned sub-prime residential mortgage loans
|
3,601,921 | 32,693 | 3.6 | % | 3,817,717 | 33,895 | 3.6 | % | ||||||||||||||||
|
Total
|
$ | 11,913,613 | $ | 76,627 | 2.6 | % | $ | 13,336,714 | $ | 83,472 | 2.5 | % | ||||||||||||
|
Net economic interest income/net interest rate spread
|
$ | 125,272 | 3.2 | % | $ | 158,973 | 3.7 | % | ||||||||||||||||
|
Net interest-earning assets/net interest margin
|
$ | 1,968,951 | 3.6 | % | $ | 2,348,761 | 4.1 | % | ||||||||||||||||
|
Ratio of interest-earning assets to interest bearing liabilities
|
1.17 | 1.18 | ||||||||||||||||||||||
|
(1) Interest-earning assets at amortized cost
|
||||||||||||||||||||||||
|
(2) Interest includes periodic cash settlements on swaps
|
||||||||||||||||||||||||
53
Net Economic Interest Income and the Average Earning Assets
Our economic net interest income increased by $186 million to $874 million for the year ended December 31, 2015 from $688 million for the same period of 2014. Our net interest rate spread, which equals the yield on our average assets less the economic average cost of funds decreased by approximately 90 basis points for the year ended December 31, 2015 as compared to the same period of 2014. The net interest margin, which equals the net economic interest income as a percentage of the net average balance of our interest-earning assets less our interest-bearing liabilities, decreased by 100 basis for the year ended December 31, 2015 as compared to the same period of 2014. Average earning assets increased by $4.4 billion for the year ended December 31, 2015 from the same period of the prior year, primarily as a result of the increase in subprime residential mortgage loans held for investment. Our net interest margin declined due to a decline in the total average yield on our interest-earning assets which was not fully offset by the decline in our average cost of funds. The portfolio has experienced several changes from the same period for the prior year as we have increased our average Agency RMBS and seasoned sub-prime securitized loans held for investment and our jumbo prime securitized loans have declined as a percentage of the total portfolio. These changes have increased our leverage, resulting in lower net interest rate spreads, but higher total interest income.
Economic Interest Expense and the Cost of Funds
The borrowing rate at which we are able to finance our assets using repurchase agreements is typically correlated to LIBOR and the term of the financing. The table below shows our average borrowed funds, economic interest expense, average cost of funds (inclusive of realized losses on interest rate swaps), average one-month LIBOR, average six-month LIBOR, average one-month LIBOR relative to average six-month LIBOR, and average cost of funds relative to average one- and six- month LIBOR.
|
Average Debt
Balance
|
Economic
Interest
Expense (1)
|
Average
Cost of
Funds
|
Average One-
Month
LIBOR
|
Average Six-
Month
LIBOR
|
Average One-
Month
LIBOR
Relative to
Average Six-
Month
LIBOR
|
Average Cost
of Funds
Relative to
Average One-
Month
LIBOR
|
Average Cost
of Funds
Relative to Average Six-Month LIBOR
|
|||||||||||||||||||||||||
|
(Ratios have been annualized, dollars in thousands)
|
||||||||||||||||||||||||||||||||
|
For The Year Ended December 31, 2015
|
$ | 12,190,748 | $ | 304,375 | 2.50 | % | 0.20 | % | 0.48 | % | (0.28 | %) | 2.30 | % | 2.02 | % | ||||||||||||||||
|
For The Year Ended December 31, 2014
|
$ | 7,889,002 | $ | 200,306 | 2.54 | % | 0.16 | % | 0.33 | % | (0.17 | %) | 2.38 | % | 2.21 | % | ||||||||||||||||
|
For The Year Ended December 31, 2013
|
$ | 3,527,712 | $ | 123,788 | 3.51 | % | 0.19 | % | 0.41 | % | (0.22 | %) | 3.32 | % | 3.10 | % | ||||||||||||||||
|
For The Quarter Ended December 31, 2015
|
$ | 11,913,613 | $ | 76,627 | 2.60 | % | 0.25 | % | 0.63 | % | (0.38 | %) | 2.35 | % | 1.97 | % | ||||||||||||||||
|
For The Quarter Ended September 30, 2015
|
$ | 11,859,833 | $ | 77,051 | 2.60 | % | 0.20 | % | 0.51 | % | (0.31 | %) | 2.40 | % | 2.09 | % | ||||||||||||||||
|
For The Quarter Ended June 30, 2015
|
$ | 11,799,997 | $ | 75,074 | 2.50 | % | 0.18 | % | 0.42 | % | (0.24 | %) | 2.32 | % | 2.08 | % | ||||||||||||||||
|
For The Quarter Ended March 31, 2015
|
$ | 13,311,297 | $ | 75,625 | 2.27 | % | 0.17 | % | 0.38 | % | (0.21 | %) | 2.10 | % | 1.89 | % | ||||||||||||||||
|
(1) Includes effect of realized losses on interest rate swaps.
|
||||||||||||||||||||||||||||||||
Average interest-bearing liabilities increased by $4.3 billion, for the year ended December 31, 2015 as compared to the same period of 2014. Economic interest expense increased by $104 million, for the year ended December 31, 2015 as compared to the same period of 2014. The increase in average interest-bearing liabilities is a result of the increase in leverage from Agency and Non-Agency repurchase agreements and securitized debt entered during, 2015, offset by declines in our securitized debt collateralized by Non-Agency RMBS. The additional financing was used to increase our Agency RMBS and securitized residential mortgage loans. Our interest expense has increased due to the increase in average interest-bearing liabilities.
Contributing to the overall increased economic interest expense are higher interest rates. Average one-month and six month LIBOR were up four basis point and 15 basis points, respectively, in the year of 2015 as compared to the same period of 2014. While we do acquire interest rate hedges to mitigate changes in interest rate risks, the hedges may not fully offset interest expense movements.
54
Net other-than-temporary credit impairment losses
OTTI losses are generated when fair values decline below our amortized cost basis, an unrealized loss, and the expected future cash flows decline from prior periods, an adverse change. When an unrealized loss and an adverse change in cash flows occur, we will recognize an OTTI loss in earnings. In addition, if we intend to sell a security, or believe we will be required to sell a security in an unrealized loss position, we will recognize an OTTI loss in earnings equal to the unrealized loss.
OTTI losses were $67 million, $64 million and $45 million for the years ended December 31, 2015, 2014 and 2013, respectively. Of these amounts, $58 million, $59 million and $38 million of the OTTI for the years ended December 31, 2015, 2014 and 2013, respectively, was related to securities included in our consolidated VIEs. As of December 31, 2015, we had 26 non-agency RMBS securities subject to OTTI in an unrealized loss position totaling $10 million for which we did not recognize impairment. We intend to hold these securities until they recover their amortized cost. We continue to monitor our investment portfolio and will record an OTTI for all investments in an unrealized loss position for which we do not believe we will recover our amortized cost prior to maturity or sale.
Net gains (losses) on derivatives
The table below shows a summary of our net gain (loss) on derivative instruments, for the quarters ended December 31, 2015, 2014 and 2013.
|
December 31, 2015
|
December 31, 2014
|
December 31, 2013
|
||||||||||
|
(dollars in thousands)
|
||||||||||||
|
Periodic interest cost of interest rate swaps, net
|
$ | (47,227 | ) | $ | (52,523 | ) | $ | (21,857 | ) | |||
|
Realized gain (loss) on derivative instruments, net:
|
||||||||||||
|
Mortgage Options
|
443 | 7,505 | 12,115 | |||||||||
|
Treasury Futures
|
(35,523 | ) | (38,552 | ) | 2,029 | |||||||
|
Swaptions
|
(353 | ) | (24 | ) | - | |||||||
|
Other Derivative Assets
|
(415 | ) | 742 | - | ||||||||
|
Swaps - Terminations
|
(98,949 | ) | - | - | ||||||||
|
Total realized gain (loss) on derivative instruments, net
|
(134,795 | ) | (30,329 | ) | 14,144 | |||||||
|
Unrealized gain on derivative instruments, net:
|
||||||||||||
|
Interest Rate Swaps
|
64,819 | (84,913 | ) | $ | 23,740 | |||||||
|
Mortgage Options
|
226 | 340 | - | |||||||||
|
Treasury Futures
|
8,634 | (17,856 | ) | 10,629 | ||||||||
|
Swaptions
|
(6,294 | ) | (1,067 | ) | - | |||||||
|
Total unrealized gain (loss) on derivative instruments, net:
|
67,385 | (103,496 | ) | 34,369 | ||||||||
|
Total gain (loss) on derivative instruments, net
|
$ | (114,637 | ) | $ | (186,348 | ) | $ | 26,656 | ||||
Our derivative portfolio primarily includes interest rate swaps, swaptions, Treasury futures, and mortgage options. During the year ended December 31, 2015, we terminated interest rate swap agreements with a notional value of $1.5 billion for $99 million. In addition, during the year ended December 31, 2015, swaps with a notional value of $800 million matured. These terminations and maturities were offset by an additional $1.5 billion of swaps and swaptions added during the year ended December 31, 2015. During the year ended December 31, 2015, we reduced our Treasury positions by $488 million of notional. Changes in our derivative positions were a result of changes in the portfolio composition and changes in interest rates.
55
During the year ended December 31, 2015, we recognized net losses on derivatives of $115 million compared to net losses of $186 million for the same period of 2014. The net gains and losses on our derivatives include both unrealized and realized gains and losses. Realized gains and losses include the net cash paid and received on our interest rate swaps during the period as well as sales and settlements of our Treasury futures and mortgage options. The realized loss on our derivative instruments is primarily a result of the pay fixed leg of our swaps carried at a higher interest rate than the received floating leg of these same swaps resulting in a net payment on the periodic settlement of the swaps during the year. We also incurred realized losses on our treasury futures for the year ended 2014 as interest rates declined during the year, resulting in net payments to close out our future positions as they came due.
Unrealized gains and losses include the change in market value, period over period, on our derivatives portfolio. Changes in market value are generally a result of changes in interest rates. The unrealized gains and losses of our derivatives portfolio are generally offset by net changes in our investment portfolio. We may or may not ultimately realize these unrealized derivative gains and losses depending on trade activity, changes in interest rates and the values of the underlying securities.
Our interest rate swaps are primarily used to economically hedge the effects of changes in interest rates on our portfolio specifically our floating rate debt. Therefore, we included the periodic interest costs of the interest rate swaps for the years ended December 31, 2015, 2014 and 2013 on these economic hedges in our presentation of economic net interest income and our net interest spreads. As we do not account for these as hedges for GAAP presentation, we present these gains and losses separately in the consolidated statements of operations and comprehensive income. The increase in the net periodic interest cost of the interest rate swaps are primarily due to declines in interest rates year over year as we pay a fixed rate on our interest rate swaps and are receiving a lower floating rate.
Treasury futures are not included in our economic interest expense and economic net interest income. We also do not include any gains or losses on our mortgage options in our economic interest expense and economic net interest income as the mortgage options were sold for income generation and not as an economic hedge for changes in interest rates in our portfolio. As we identify opportunities in the mortgage backed securities market, we may from time to time purchase or sell mortgage options, including both call and put options to take advantage of these opportunities. We had no mortgage options as of December 31, 2015. The realized gains on our mortgage options for the year ended December 31, 2015, 2014 and 2013 were $445 thousand, $7.5 million and $12 million, respectively.
Net Unrealized Gains (Losses) on Financial Instruments at Fair Value
We have elected the fair value option with changes in fair value reflected in earnings for our Agency and Non-Agency IO RMBS securities, securitized loans held for investment and the related financing for the securitized loans consolidated as a VIE in our statement of financial condition. The table below shows the unpaid principal, fair value and impact of change in fair value on each of these financial instruments:
|
As of December 31, 2015
|
As of December 31, 2014
|
As of December 31, 2013
|
December 31, 2015
|
December 31, 2014
|
December 31, 2013
|
|||||||||||||||||||||||||||||||
|
(dollars in thousands)
|
(dollars in thousands)
|
(dollars in thousands)
|
(dollars in thousands)
|
|||||||||||||||||||||||||||||||||
|
Unpaid
Principal/
Notional
|
Fair Value
|
Unpaid]
Principal/
Notional
|
Fair Value
|
Unpaid
Principal/
Notional
|
Fair Value
|
Gain/(Loss) on
Change in Fair Value
|
Gain/(Loss) on
Change in Fair Value
|
Gain/(Loss) on
Change in Fair Value
|
||||||||||||||||||||||||||||
|
Assets:
|
||||||||||||||||||||||||||||||||||||
|
IO RMBS securities
|
$ | 12,433,432 | $ | 518,614 | $ | 9,322,862 | $ | 400,125 | $ | 6,345,424 | $ | 300,076 | $ | (18,392 | ) | $ | 22,563 | $ | (44,277 | ) | ||||||||||||||||
|
Non-Agency RMBS securities
|
N/A | 20,339 | N/A | - | - | - | (3,691 | ) | - | - | ||||||||||||||||||||||||||
|
Securitized loans held for investment, at fair value
|
4,787,918 | 4,768,416 | 4,619,193 | 4,699,215 | - | - | (97,646 | ) | 144,960 | - | ||||||||||||||||||||||||||
|
Liabilities:
|
||||||||||||||||||||||||||||||||||||
|
Securitized debt at fair value
|
3,769,830 | 3,720,496 | 3,964,053 | 3,868,366 | - | - | (38,704 | ) | 26,011 | - | ||||||||||||||||||||||||||
|
Total
|
$ | 20,991,180 | $ | 9,027,865 | $ | 17,906,108 | $ | 8,967,706 | $ | 6,345,424 | $ | 300,076 | $ | (158,433 | ) | $ | 193,534 | $ | (44,277 | ) | ||||||||||||||||
56
Unrealized gains and losses on our Agency and Non-Agency RMBS portfolio represent the changes in fair values of the securities from the prior period. Unrealized gains and losses on our entire Agency and Non-Agency RMBS portfolio are reflected in earnings. IO securities represent the right to receive the interest on a pool of mortgage backed securities, including both Agency and Non-Agency mortgage pools. The fair value of IO RMBS securities are heavily impacted by changes in expected prepayment rates. When IO securities prepay, the holder of the IO security will receive less interest on the investment due to the reduced principal. During the second quarter of 2015, we acquired residual interests in several seasoned pools of mortgage loans. These holdings generally do not have a traditional unpaid principal amount and pay cash based on guidance in the trust documents when excess cash is available. Many of these holdings do not pay any interest and may never pay interest. We have elected to carry these residual interests at fair value with changes in fair value reflected in earnings. As of January 1, 2015, the Company adopted the guidance in ASU 2014-13,
Measuring the Financial Assets and the Financial Liabilities of a Consolidated Collateralized Financing Entity
, which allowed us to carry both the assets and liabilities of certain consolidated VIEs at fair value with changes in fair value reflected in earnings.
During the years ended December 31, 2015, 2014 and 2013, we recorded unrealized losses in earnings of $158 million, unrealized gain of $194 million and unrealized loss of $44 million, respectively, on the financial instruments carried at fair value.
Gains and Losses on Sales of Assets and Loss on extinguishment of securitized debt
Net realized gains on sales of investments were $77 million, $92 million and $68 million for the year ended December 31, 2015, 2014 and 2013, respectively. We do not forecast sales of investments as we generally expect to invest for long term gains. However, from time to time, we may sell assets to create liquidity necessary to pursue new opportunities, achieve targeted leverage ratios as well as for gains when prices indicate a sale is most beneficial to us, or is the most prudent course of action to maintain a targeted risk adjusted yield for our investors.
During 2015, the Company also purchased $1.3 billion of securitized debt collateralized by subprime residential mortgage loans for a cash payment of $1.3 billion resulting in a loss on extinguishment of debt of $6 million. During 2014, the Company purchased $54 million of securitized debt collateralized by non-agency RMBS for cash payments of $56 million, resulting in a loss on extinguishment of debt of $2 million. When the Company acquires its outstanding debt, it extinguishes the outstanding debt and recognizes a gain or loss based on the difference between the carrying value of the debt and the cost to acquire the debt which is reflected in the Consolidated Statement of Operations and Comprehensive Income as a loss on extinguishment of debt during the years ended December 31, 2015, 2014 and 2013, respectively.
Management Fees, Compensation, General and Administrative Expenses and Deal Expenses
On August 5, 2015, as discussed above under “The Internalization,” we announced the mutual agreement to terminate the Management Agreement between us and our Manager, effective immediately. Thus, as of August 5, 2015, we began incurring compensation expense as we are now internally managed (whereas prior to the Internalization, such expenses were incurred by our Manager, and we paid a management fee). The table below shows our total management fee and general and administrative, or G&A, expenses, compensation and benefit expense and deal expenses as compared to average total assets and average equity for the periods presented.
57
|
Total Net Management
Fee, Compensation and
Other Expenses
|
Total Net Management
Fee, Compensation and
Other Expenses/Average
Assets
|
Total Net Management
Fee, Compensation and
Other Expenses/Average
Equity
|
||||||||||
|
(Ratios have been annualized, dollars in thousands)
|
||||||||||||
|
For The Year Ended December 31, 2015
|
$ | 68,152 | 0.40 | % | 2.05 | % | ||||||
|
For The Year Ended December 31, 2014 (1)
|
$ | 45,379 | 0.35 | % | 1.31 | % | ||||||
|
For The Year Ended December 31, 2013
|
$ | 33,249 | 0.57 | % | 1.00 | % | ||||||
|
For The Quarter Ended December 31, 2015
|
$ | 18,600 | 0.46 | % | 2.45 | % | ||||||
|
For The Quarter Ended September 30, 2015
|
$ | 17,863 | 0.44 | % | 2.18 | % | ||||||
|
For The Quarter Ended June 30, 2015
|
$ | 17,715 | 0.43 | % | 2.04 | % | ||||||
|
For The Quarter Ended March 31, 2015
|
$ | 13,974 | 0.29 | % | 1.57 | % | ||||||
|
(1) Does not include one-time management fee reduction of $24 million
|
||||||||||||
We incurred management fees of $25 million, $33 and $26 million for each of the years ended December 31, 2015, 2014 and 2013, respectively. We also recognized reimbursements from FIDAC related to the amended Management Agreement of approximately $7 million, $9 million and $7 million for each of the year ended December 31, 2015, 2014 and 2013. The management fee is based on our stockholders’ equity as defined in the Management Agreement. See further discussion of the management fee, including amendments to the Management Agreement, as well as other agreements with FIDAC in our discussion of related party transactions below.
In connection with the Internalization and the termination of the Management Agreement, we became internally managed and hired employees. Thus, as of August 5, 2015, we began to incur compensation and benefits costs. Compensation and benefits costs have replaced the management fee as the cost to operate our business. Compensation and benefit costs for the year ended December 31, 2015 was $11 million.
G&A expenses were approximately $32 million, $20 million and $14 million for the year ended December 31, 2015, 2014 and 2013, respectively. The increase in G&A expenses is primarily due to transition costs incurred as part of the Internalization of $9 million, which occurred during the second half of 2015. We also incurred deal expenses $8 million for the year ended December 31, 2015 related to the call and re-securitization of certain of our subprime mortgage pools.
In addition, during the third quarter of 2014, we received a reimbursement of prior management fees paid to FIDAC of $24 million which did not recur in 2015.
Servicing Fees
Servicing fees paid by our consolidated VIEs were approximately $25 million, $10 million and $3 million for the year ended December 31, 2015, 2014 and 2013, respectively. These servicing fees are related to the consolidation of the whole loan securitization vehicles and are paid from interest income earned by the VIEs. The increase in servicing fees is primarily due to the addition of subprime mortgage loans from the prior year. Subprime mortgage loans average asset balance increased to $4.5 billion for year ended December 31, 2015 from $1.4 billion for the same period of 2014.
Net Income (Loss) and Return on Average Equity
The table below shows our economic net interest income, realized gains (losses) on sale of assets and the credit related OTTI, realized and unrealized gains (losses) on interest rate swaps and IOs, total management fee and G&A expenses, and income tax, each as a percentage of average equity, and the return on average equity for the periods presented.
58
|
Economic Net Interest
Income/Average Equity *
|
Realized Gains
(Losses) on Sales and
OTTI/Average
Equity
|
Realized and Unrealized
Gains (Losses) on Interest
Rate Swaps and IOs/Average
Equity
|
Total Management Fee,
Compensation and G&A
Expenses/Average Equity
|
Return on Average Equity
|
|||||||||||
|
(Ratios have been annualized)
|
|||||||||||||||
|
For The Year Ended December 31, 2015
|
15.70% | (0.01%) | (1.42%) | (2.05%) | 11.58% | ||||||||||
|
For The Year Ended December 31, 2014
|
14.06% | 17.67% | (1.83%) | (1.31%) | 16.99% | ||||||||||
|
For The Year Ended December 31, 2013
|
11.70% | 0.72% | (0.29%) | (1.00%) | 10.55% | ||||||||||
|
For The Quarter Ended December 31, 2015
|
14.98% | 1.27% | (1.54%) | (2.45%) | 33.02% | ||||||||||
|
For The Quarter Ended September 30, 2015
|
15.05% | (1.74%) | 5.72% | (2.18%) | (5.89%) | ||||||||||
|
For The Quarter Ended June 30, 2015
|
15.06% | (2.00%) | 3.55% | (2.04%) | 13.64% | ||||||||||
|
For The Quarter Ended March 31, 2015
|
17.06% | 2.44% | (8.96%) | (1.57%) | 7.52% | ||||||||||
|
* Includes effect of realized losses on interest rate swaps.
|
|||||||||||||||
Our net income was $250 million, $589 million and $363 million for the years ended December 31, 2015, 2014 and 2013, respectively. Economic net interest income as a percentage of average equity increased by 164 basis point at December 31, 2015 compared to 2014. Return on average equity decreased by 541 basis point for the year ended December 31, 2015 as compared to the same period of 2014 due to lower income in the year 2015, primarily as a result of unrealized losses on financial instruments at fair value.
Core earnings
Core earnings is a non-GAAP measure and is defined as GAAP net income excluding unrealized gains on the aggregate portfolio, impairment losses, realized gains on sales of investments, realized gains or losses on futures, realized gains or losses on swap terminations, gain on deconsolidation, extinguishment of debt and certain other non-recurring gains or losses. As defined, core earnings include interest income and expense as well as realized losses on interest rate swaps used to hedge interest rate risk. Core earnings are provided for the purpose of comparability to other peer issuers, but have important limitations. Core earnings as described above helps evaluate our financial performance without the impact of certain transactions and is of limited usefulness as an analytical tool. Therefore, core earnings should not be viewed in isolation and is not a substitute for net income or net income per basic share computed in accordance with GAAP.
The following table provides GAAP measures of net income and net income per basic share available to common stockholders for the periods presented and details with respect to reconciling the line items to core earnings and related per average basic common share amounts:
59
|
For the Year Ended
|
||||||||||||
|
December 31, 2015
|
December 31, 2014
|
December 31, 2013
|
||||||||||
|
(dollars in thousands, except per share data)
|
||||||||||||
|
GAAP Net income
|
$ | 250,349 | $ | 589,205 | $ | 362,686 | ||||||
|
Adjustments:
|
||||||||||||
|
Net other-than-temporary credit impairment losses
|
67,444 | 63,992 | 45,167 | |||||||||
|
Net unrealized (gains) losses on derivatives
|
(67,385 | ) | 103,496 | (34,369 | ) | |||||||
|
Net unrealized (gains) losses on financial instruments at fair value
|
158,433 | (193,534 | ) | 44,277 | ||||||||
|
Net realized (gains) losses on sales of investments
|
(77,074 | ) | (91,709 | ) | (68,107 | ) | ||||||
|
(Gains) losses on extinguishment of debt
|
5,930 | 2,184 | - | |||||||||
|
Realized (gains) losses on terminations of interest rate swaps
|
98,949 | - | - | |||||||||
|
Net realized (gains) losses on derivatives
|
35,523 | 38,552 | (2,029 | ) | ||||||||
|
Total other (gains) losses
|
256 | (71,629 | ) | - | ||||||||
|
Core Earnings
|
$ | 472,425 | $ | 440,557 | $ | 347,625 | ||||||
|
GAAP net income per basic common share
|
$ | 1.25 | $ | 2.87 | $ | 1.77 | ||||||
|
Core earnings per basic common share
|
$ | 2.37 | $ | 2.14 | $ | 1.69 | ||||||
|
For the Quarter Ended
|
||||||||||||||||||||
|
December 31, 2015
|
September 30, 2015
|
June 30, 2015
|
March 31, 2015
|
December 31, 2014
|
||||||||||||||||
|
(dollars in thousands, except per share data)
|
||||||||||||||||||||
|
GAAP Net income
|
$ | 115,380 | $ | (48,259 | ) | $ | 116,187 | $ | 67,041 | $ | 6,485 | |||||||||
|
Adjustments:
|
||||||||||||||||||||
|
Net other-than-temporary credit impairment losses
|
14,696 | 17,832 | 27,101 | 7,815 | 55,122 | |||||||||||||||
|
Net unrealized (gains) losses on derivatives
|
(46,842 | ) | 71,540 | (88,028 | ) | (4,055 | ) | 91,777 | ||||||||||||
|
Net unrealized (gains) losses on financial instruments at fair value
|
69,793 | 40,955 | 37,260 | 10,425 | (9,812 | ) | ||||||||||||||
|
Net realized (gains) losses on sales of investments
|
(34,285 | ) | (3,539 | ) | (9,685 | ) | (29,565 | ) | (23,564 | ) | ||||||||||
|
(Gains) losses on extinguishment of debt
|
(8,906 | ) | 19,915 | (5,079 | ) | - | - | |||||||||||||
|
Realized (gains) losses on terminations of interest rate swaps
|
(754 | ) | - | 31,124 | 68,579 | - | ||||||||||||||
|
Net realized (gains) losses on derivatives
|
(9,018 | ) | 9,309 | 7,778 | 27,454 | 17,523 | ||||||||||||||
|
Total other (gains) losses
|
256 | - | - | - | - | |||||||||||||||
|
Core Earnings
|
$ | 100,320 | $ | 107,753 | $ | 116,658 | $ | 147,694 | $ | 137,531 | ||||||||||
|
GAAP net income per basic common share
|
$ | 0.61 | $ | (0.24 | ) | $ | 0.57 | $ | 0.33 | $ | 0.03 | |||||||||
|
Core earnings per basic common share
|
$ | 0.53 | $ | 0.54 | $ | 0.57 | $ | 0.72 | $ | 0.67 | ||||||||||
Our Core earnings for the year was $472 million or $2.37 per average basic common share, compared to $441 million or $2.14 per average basic common share. Core earnings increased for the year ended December 31, 2015 as compared to the same period of 2014 as a result of increase in net interest income offset partially by increased servicing fees, internalization costs and deal expenses.
Financial Condition
Estimated Economic Book Value
This Management Discussion and Analysis section contains analysis and discussion of financial information that utilizes or presents ratios based on GAAP book value. The table and discussion below present our estimated economic book value. We calculate and disclose this non-GAAP measurement because we believe it represents an estimate of the fair value of the assets we own or are able to dispose of, pledge, or otherwise monetize. The estimated economic book value should not be viewed in isolation and is not a substitute for book value computed in accordance with GAAP.
GAAP requires us to consolidate certain securitizations and re-securitization transactions where we have determined that we are the primary beneficiary. In these transactions, we transfer assets to the trusts, which issue tranches of senior and subordinate notes or certificates. We sell the senior tranches and therefore have no continuing involvement in these trusts other than being a holder of notes or certificates issued by the trusts, with the same rights as other holders of the notes or certificates. However, with respect to certain VIEs collateralized by loans held for investment, we have the ability to approve loan modifications and determine the course of action to be taken as it relates to loans in technical default, including whether or not to proceed with foreclosure. The notes and certificates we own that were issued by the trusts are largely subordinated interests in those trusts. The trusts have no recourse to our assets other than pursuant to a breach by us of the transaction documents related to the transfer of the assets by us to the trusts, but are presented as if we own 100% of the trust.
60
For re-securitized RMBS transactions and loan securitizations, we present the pre-securitized assets transferred into the consolidated trusts in our Consolidated Statements of Financial Condition as Non-Agency or Securitized loans held for investment. Post securitization RMBS assets sold are presented as liabilities in our Consolidated Statements of Financial Condition as Securitized debt, collateralized by Non-Agency RMBS and Securitized debt, collateralized by loans held for investment. We have presented the underlying securities we transferred to the trusts for the calculation of GAAP book value at fair value and recorded the corresponding liability for the notes or certificates sold to third parties at amortized cost or fair value. Fair value adjustments that are not credit related are recorded in Other comprehensive income. Credit related impairments are deemed other-than-temporary and are recorded in earnings.
Because we are unable to dispose of, monetize or pledge the RMBS or loans we transferred into the trusts, we also present our estimated economic book value. We believe this measure represents the estimated value of the securities issued by these trusts that we own. In contrast to GAAP book value, our estimated economic book value considers only the assets we own or are able to dispose of, pledge, or otherwise monetize. To determine our estimated economic book value, we consider only the fair value of the notes or certificates issued by the securitization and re-securitization trusts that we actually own. Accordingly, our estimated economic book value does not include assets or liabilities for which we have no direct ownership, specifically the notes or certificates of the securitization and re-securitization trusts that were sold to third parties.
At December 31, 2015, the difference between GAAP book value and estimated economic book value was $196 million, or $1.05 per share. At December 31, 2014, the difference between GAAP book value and estimated economic book value was $336 million, or $1.65 per share. This difference is primarily driven by the value of the RMBS assets we have retained in these re-securitization transactions as compared to the value of consolidated loans and securities net of RMBS assets sold, but treated as a secured financing on the statement of financial condition. In these re-securitization transactions, we have generally retained the subordinated, typically non-rated, first loss notes or certificates issued by the securitization trusts. These securities are complex, typically locked out as to principal repayment, relatively illiquid, and do not necessarily appreciate or depreciate in tandem with the broader Non-Agency RMBS market or with the loans on securities owned by the trusts. As the senior notes pay off, we expect the difference between our economic and our GAAP book value to decrease. The tables below present the adjustments to GAAP book value that we believe are necessary to adequately reflect our calculation of estimated economic book value as of December 31, 2015 and December 31, 2014.
61
|
December 31, 2015
|
||||
|
(dollars in thousands, except per share data)
|
||||
|
GAAP Book Value
|
$ | 2,946,188 | ||
|
GAAP Book Value per Share
|
$ | 15.70 | ||
|
Economic Adjustments:
|
||||
|
Assets of Consolidated VIEs
|
(6,908,910 | ) | ||
|
Non-Recourse Liabilities of Consolidated VIEs
|
4,249,911 | |||
|
Interests in VIEs eliminated in consolidation
|
2,462,713 | |||
|
Total Adjustments - Net
|
(196,286 | ) | ||
|
Total Adjustments - Net (per share)
|
1.05 | |||
|
Economic Book Value
|
$ | 2,749,902 | ||
|
Economic Book Value per Share
|
$ | 14.65 | ||
|
December 31, 2014
|
||||
|
(dollars in thousands, except per share data)
|
||||
|
GAAP Book Value
|
$ | 3,607,690 | ||
|
GAAP Book Value per Share
|
$ | 17.55 | ||
|
Economic Adjustments:
|
||||
|
Assets of Consolidated VIEs
|
(7,798,794 | ) | ||
|
Non-Recourse Liabilities of Consolidated VIEs
|
5,095,278 | |||
|
Interests in VIEs eliminated in consolidation
|
2,367,953 | |||
|
Total Adjustments - Net
|
(335,563 | ) | ||
|
Total Adjustments - Net (per share)
|
1.65 | |||
|
Economic Book Value
|
$ | 3,272,127 | ||
|
Economic Book Value per Share
|
$ | 15.90 | ||
Our estimate of economic book value has important limitations. Our estimate of fair value is as of a point in time and subject to significant judgment, primarily the estimate of the fair value of the securities issued by the trusts which we own and can freely sell or pledge. Should we sell the assets in our portfolio, we may realize materially different proceeds from the sale than we have estimated as of the reporting date.
The calculation of estimated economic book value described above is used by management to understand the fair value of the assets we own and the liabilities for which we are legally obligated, and is presented for informational use only. The estimated economic book value should not be viewed in isolation and is not a substitute for book value computed in accordance with GAAP.
Portfolio Review
During the year ended December 31, 2015, on an aggregate basis, we purchased $7.7 billion of invested assets, sold $7.7 billion of invested assets, and received $1.4 billion in principal payments related to our Agency and Non-Agency RMBS. In addition, we used $2.1 billion of proceeds received from principal and interest on our investments to repay principal on our securitized debt.
The following table summarizes certain characteristics of our portfolio at December 31, 2015 and December 31, 2014.
62
|
December 31, 2015
|
December 31, 2014
|
|||||||
|
Interest earning assets at period-end (1)
|
$ | 14,959,081 | $ | 17,170,998 | ||||
|
Interest bearing liabilities at period-end
|
$ | 11,689,250 | $ | 13,550,659 | ||||
|
Leverage at period-end
|
4.0:1
|
3.8:1
|
||||||
|
Leverage at period-end (recourse)
|
2.7:1
|
2.6:1
|
||||||
|
Portfolio Composition, at amortized cost
|
||||||||
|
Non-Agency RMBS
|
10.4 | % | 5.1 | % | ||||
|
Senior
|
4.7 | % | 1.5 | % | ||||
|
Senior, interest only
|
1.9 | % | 1.4 | % | ||||
|
Subordinated
|
3.7 | % | 2.2 | % | ||||
|
Subordinated, interest only
|
0.1 | % | 0.1 | % | ||||
|
RMBS transferred to consolidated VIEs
|
10.1 | % | 10.3 | % | ||||
|
Agency MBS
|
46.0 | % | 52.1 | % | ||||
|
Residential
|
37.2 | % | 50.9 | % | ||||
|
Commercial
|
6.8 | % | N/A | |||||
|
Interest-only
|
2.0 | % | 1.2 | % | ||||
|
Securitized loans held for investment
|
33.5 | % | 32.5 | % | ||||
|
Fixed-rate percentage of portfolio
|
84.7 | % | 92.5 | % | ||||
|
Adjustable-rate percentage of portfolio
|
15.3 | % | 7.5 | % | ||||
|
Annualized yield on average interest earning assets for the year ended
|
6.0 | % | 6.9 | % | ||||
|
Annualized cost of funds on average borrowed funds for the year ended (2)
|
2.5 | % | 2.5 | % | ||||
|
(1) Excludes cash and cash equivalents.
|
||||||||
|
(2) Includes the effect of realized losses on interest rate swaps.
|
||||||||
The following table presents details of each asset class in our portfolio at December 31, 2015 and December 31, 2014. The principal or notional value represents the interest income earning balance of each class. The weighted average figures are weighted by each investment’s respective principal/notional value in the asset class.
63
|
December 31, 2015
|
||||||||||||||||||||||||||||||||||||||||||||
|
Principal or
Notional Value at
Period-End
(dollars in
thousands)
|
Weighted Average
Amortized Cost
Basis
|
Weighted
Average Fair
Value
|
Weighted
Average
Coupon
|
Weighted
Average
Yield at
Period-End
(1)
|
Weighted
Average 3
Month CPR
at Period-End
|
Weighted
Average 12
Month CPR
'at Period-End
|
Weighted
Average
Delinquency
Pipeline 60+
|
Weighted
Average Loss
Severity (2)
|
Weighted
Average
Credit Enhancement
|
Principal
Writedowns
During
Period
(dollars in thousands)
|
||||||||||||||||||||||||||||||||||
|
Non-Agency Mortgage-Backed Securities
|
||||||||||||||||||||||||||||||||||||||||||||
|
Senior
|
$ | 947,992 | $ | 69.97 | $ | 72.97 | 2.0 | % | 5.1 | % | 11.8 | % | 11.5 | % | 26.2 | % | 57.8 | % | 10.5 | % | $ | 4,531 | ||||||||||||||||||||||
|
Senior, interest only
|
$ | 5,388,159 | $ | 4.93 | $ | 4.23 | 1.6 | % | 13.4 | % | 13.7 | % | 13.6 | % | 19.5 | % | 54.9 | % | 0.0 | % | $ | - | ||||||||||||||||||||||
|
Subordinated
|
$ | 762,466 | $ | 69.25 | $ | 79.26 | 3.2 | % | 9.1 | % | 11.5 | % | 14.7 | % | 15.5 | % | 54.5 | % | 14.6 | % | $ | 3,572 | ||||||||||||||||||||||
|
Subordinated, interest only
|
$ | 284,931 | $ | 5.34 | $ | 3.95 | 1.2 | % | 11.5 | % | 9.7 | % | 11.3 | % | 14.5 | % | 43.0 | % | 0.0 | % | $ | - | ||||||||||||||||||||||
|
RMBS transferred to consolidated VIEs
|
$ | 2,741,748 | $ | 52.47 | $ | 78.07 | 4.5 | % | 17.7 | % | 12.4 | % | 11.9 | % | 19.9 | % | 61.6 | % | 1.2 | % | $ | 33,677 | ||||||||||||||||||||||
|
Agency Mortgage-Backed Securities
|
||||||||||||||||||||||||||||||||||||||||||||
|
Residential
|
$ | 5,045,418 | $ | 105.07 | $ | 104.41 | 3.7 | % | 2.8 | % | 8.5 | % | 17.0 | % | 0.1 | % | N/A | N/A | $ | - | ||||||||||||||||||||||||
|
Commercial
|
$ | 952,091 | $ | 102.27 | $ | 102.28 | 3.4 | % | 3.0 | % | 0.8 | % | 3.1 | % | 0.0 | % | N/A | N/A | $ | - | ||||||||||||||||||||||||
|
Interest-only
|
$ | 6,722,472 | $ | 4.17 | $ | 4.06 | 0.8 | % | 3.4 | % | 6.3 | % | 9.9 | % | 0.2 | % | N/A | N/A | $ | - | ||||||||||||||||||||||||
|
Securitized loans
|
$ | 4,787,918 | $ | 99.54 | $ | 100.15 | 6.6 | % | 5.9 | % | 8.9 | % | 9.2 | % | 3.8 | % | 58.0 | % | N/A | $ | 11,822 | |||||||||||||||||||||||
|
(1) Bond Equivalent Yield at period end. Weighted Average Yield is calculated using each investment's respective amortized cost.
|
||||||||||||||||||||||||||||||||||||||||||||
|
(2) Calculated based on reported losses to date, utilizing widest data set available (i.e., life-time losses, 12-month loss, etc.)
|
||||||||||||||||||||||||||||||||||||||||||||
|
December 31, 2014
|
||||||||||||||||||||||||||||||||||||||||||||
|
Principal or
Notional Value
at
Period-End
(dollars in
thousands)
|
Weighted
Average
Amortized Cost
Basis
|
Weighted
Average Fair
Value
|
Weighted Average
Coupon
|
Weighted Average
Yield at
Period-End
(1)
|
Weighted Average 3 Month CPR
at Period-End
|
Weighted Average 12 Month CPR
at Period-End
|
Weighted Average Delinquency Pipeline 60+
|
Weighted Average Loss Severity (2)
|
Weighted Average
Credit
Enhancement
|
Principal Writedowns During
Period
(dollars in thousands)
|
||||||||||||||||||||||||||||||||||
|
Non-Agency Mortgage-Backed Securities
|
||||||||||||||||||||||||||||||||||||||||||||
|
Senior
|
$ | 344,951 | $ | 55.09 | $ | 79.63 | 4.3 | % | 15.9 | % | 10.8 | % | 11.6 | % | 30.9 | % | 68.6 | % | 10.4 | % | $ | 2,190 | ||||||||||||||||||||||
|
Senior, interest only
|
$ | 5,178,737 | $ | 4.35 | $ | 3.97 | 1.6 | % | 14.4 | % | 12.2 | % | 13.0 | % | 21.2 | % | 51.6 | % | 0.0 | % | $ | - | ||||||||||||||||||||||
|
Subordinated
|
$ | 690,599 | $ | 50.18 | $ | 65.79 | 3.1 | % | 10.6 | % | 13.9 | % | 14.8 | % | 15.8 | % | 45.5 | % | 11.7 | % | $ | 5,669 | ||||||||||||||||||||||
|
Subordinated, interest only
|
$ | 216,403 | $ | 4.43 | $ | 3.14 | 0.9 | % | 9.2 | % | 7.0 | % | 11.3 | % | 13.3 | % | 46.1 | % | 0.0 | % | $ | - | ||||||||||||||||||||||
|
RMBS transferred to consolidated VIEs
|
$ | 3,133,610 | $ | 53.51 | $ | 80.03 | 4.5 | % | 17.4 | % | 10.2 | % | 10.7 | % | 21.9 | % | 59.5 | % | 1.3 | % | $ | 25,603 | ||||||||||||||||||||||
|
Agency Mortgage-Backed Securities
|
||||||||||||||||||||||||||||||||||||||||||||
|
Residential
|
$ | 7,774,266 | $ | 104.96 | $ | 106.19 | 4.0 | % | 3.2 | % | 9.7 | % | 10.6 | % |
NA
|
NA
|
NA
|
$ | - | |||||||||||||||||||||||||
|
Interest-only
|
$ | 3,884,523 | $ | 4.89 | $ | 4.79 | 0.9 | % | 3.1 | % | 11.7 | % | 9.5 | % |
NA
|
NA
|
NA
|
$ | - | |||||||||||||||||||||||||
|
Securitized loans
|
$ | 5,241,100 | $ | 99.13 | $ | 101.74 | 6.6 | % | 6.3 | % | 9.8 | % | 8.2 | % | 10.3 | % | 46.0 | % | 36.5 | % | $ | - | ||||||||||||||||||||||
|
(1) Bond Equivalent Yield at period end. Weighted Average Yield is calculated using each investment's respective amortized cost.
|
||||||||||||||||||||||||||||||||||||||||||||
|
(2) Calculated based on reported losses to date, utilizing widest data set available (i.e., life-time losses, 12-month loss, etc.)
|
||||||||||||||||||||||||||||||||||||||||||||
Based on the projected cash flows for our Non-Agency RMBS that are not of high credit quality, a portion of the original purchase discount is designated as Accretable Discount, which reflects the purchase discount expected to be accreted into interest income, and a portion is designated as Non-Accretable Difference, which represents the contractual principal on the security that is not expected to be collected. The amount designated as Non-Accretable Difference may be adjusted over time, based on the actual performance of the security, its underlying collateral, actual and projected cash flow from such collateral, economic conditions and other factors. If the performance of a security is more favorable than previously estimated, a portion of the amount designated as Non-Accretable Difference may be accreted into interest income over time. Conversely, if the performance of a security is less favorable than previously estimated, an OTTI may be recognized resulting in an increase in the amounts designated as Non-Accretable Difference.
The following table presents changes to Accretable Discount and Non-Accretable Difference as it pertains to our entire Non-Agency RMBS portfolio for assets with purchase discounts during the previous five quarters.
64
|
For the Quarters Ended
|
||||||||||||||||||||
|
December 31, 2015
|
September 30, 2015
|
June 30, 2015
|
March 31, 2015
|
December 31, 2014
|
||||||||||||||||
|
(dollars in thousands)
|
||||||||||||||||||||
|
Accretable Discount
|
||||||||||||||||||||
|
Balance, beginning of period
|
$ | 1,003,385 | $ | 1,035,492 | $ | 990,332 | $ | 987,861 | $ | 977,042 | ||||||||||
|
Accretion of discount
|
(43,520 | ) | (41,498 | ) | (41,302 | ) | (44,350 | ) | (44,165 | ) | ||||||||||
|
Purchases
|
1,845 | 6,194 | 28,894 | 80,712 | 2,636 | |||||||||||||||
|
Sales and deconsolidation
|
(35,144 | ) | (22,645 | ) | (1,458 | ) | (29,147 | ) | (1,977 | ) | ||||||||||
|
Transfers from/(to) credit reserve, net
|
27,882 | 25,842 | 59,026 | (4,744 | ) | 54,325 | ||||||||||||||
|
Balance, end of period
|
$ | 954,448 | $ | 1,003,385 | $ | 1,035,492 | $ | 990,332 | $ | 987,861 | ||||||||||
|
For the Quarters Ended
|
||||||||||||||||||||
|
December 31, 2015
|
September 30, 2015
|
June 30, 2015
|
March 31, 2015
|
December 31, 2014
|
||||||||||||||||
|
(dollars in thousands)
|
||||||||||||||||||||
|
Non-Accretable Difference
|
||||||||||||||||||||
|
Balance, beginning of period
|
$ | 879,440 | $ | 1,001,560 | $ | 947,202 | $ | 908,927 | $ | 933,668 | ||||||||||
|
Principal Writedowns
|
(27,064 | ) | (32,587 | ) | (34,261 | ) | (39,955 | ) | (37,044 | ) | ||||||||||
|
Purchases
|
27,855 | 13,279 | 121,253 | 80,712 | 2,636 | |||||||||||||||
|
Sales and deconsolidation
|
(29,347 | ) | (94,802 | ) | (709 | ) | (15,041 | ) | - | |||||||||||
|
Net other-than-temporary credit impairment losses
|
14,716 | 17,832 | 27,101 | 7,815 | 63,992 | |||||||||||||||
|
Transfers to/(from) credit reserve, net
|
(27,882 | ) | (25,842 | ) | (59,026 | ) | 4,744 | (54,325 | ) | |||||||||||
|
Balance, end of period
|
$ | 837,718 | $ | 879,440 | $ | 1,001,560 | $ | 947,202 | $ | 908,927 | ||||||||||
Liquidity and Capital Resources
General
Liquidity measures our ability to meet cash requirements, including ongoing commitments to repay our borrowings, purchase RMBS, mortgage loans and other assets for our portfolio, pay dividends and other general business needs. Our principal sources of capital and funds for additional investments primarily include earnings from our investments, borrowings under securitizations and re-securitizations, repurchase agreements and other financing facilities, and proceeds from equity offerings.
To meet our short term (one year or less) liquidity needs, we expect to continue to borrow funds in the form of repurchase agreements and, subject to market conditions, other types of financing. The terms of the repurchase transaction borrowings under our master repurchase agreements generally conform to the terms in the standard master repurchase agreement as published by the Securities Industry and Financial Markets Association, or SIFMA, as to repayment, margin requirements and the segregation of all securities we have initially sold under the repurchase transaction. In addition, each lender typically requires that we include supplemental terms and conditions to the standard master repurchase agreement. Typical supplemental terms and conditions include changes to the margin maintenance requirements, cross default provisions, required haircuts (or the percentage that is subtracted from the value of RMBS that collateralizes the financing), purchase price maintenance requirements, and requirements that all disputes related to the repurchase agreement be litigated or arbitrated in a particular jurisdiction. These provisions may differ for each of our lenders.
We also expect to meet our short term liquidity needs by relying on the cash flows generated by our investments. These cash flows are primarily comprised of monthly principal and interest payments received on our investments. We may also sell our investments and utilize those proceeds to meet our short term liquidity needs or enter into non-recourse financing of our assets through sales of securities to third parties of loan securitizations or RMBS re-securitization transactions, similar to transactions that we have completed in prior periods.
Based on our current portfolio, leverage ratio and available borrowing arrangements, we believe our assets will be sufficient to enable us to meet anticipated short-term liquidity requirements. However, a decline in the value of our collateral could cause a temporary liquidity shortfall due to the timing of margin calls on the financing arrangements and the actual receipt of the cash related to principal paydowns. If our cash resources are at any time insufficient to satisfy our liquidity requirements, we may have to sell investments, potentially at a loss, or issue debt or additional equity securities in a common stock offering.
65
To meet our longer term liquidity needs (greater than one year), we expect our principal sources of capital and funds to continue to be provided by earnings from our investments, borrowings under securitizations and re-securitizations, repurchase agreements and other financing facilities, as well as proceeds from equity offerings.
In addition to the principal sources of capital described above, we may enter into warehouse facilities and use longer dated structured repurchase agreements. The use of any particular source of capital and funds will depend on market conditions, availability of these facilities, and the investment opportunities available to us.
Current Period
We held cash and cash equivalents of approximately $114 million and $165 million at December 31, 2015 and December 31, 2014, respectively. As a result of our operating, investing and financing activities described above, our cash position decreased by $51 million from December 31, 2014 to December 31, 2015.
Our operating activities provided net cash of approximately $396 million, 183 million and $305 million for the year ended December 31, 2015, 2014 and 2013, respectively. The cash provided by our operations is primarily due to interest received in excess of interest paid during the period. During 2015, interest received net of interest paid was $645 million. This cash received was offset in part by payments on derivatives of $158 million, including $99 million paid for termination of existing swaps during the year ended December 31, 2015. During 2014, interest received net of interest paid was $466 million. During 2014, we paid cash to cover margin requirements on our interest rate swaps and other financial instruments of approximately $186 million, which is primarily reflected in other assets and other payments from derivative sales and settlements during the year ended December 31, 2014. The cash provided by operating activities decreased for the year ended December 31, 2013 as compared to prior year due primarily to a decrease in interest collected on the portfolio, net of interest paid, of $61 million, offset in part by lower management fees paid during 2013 as compared to prior year.
Our investing activities provided cash of approximately $2.0 billion, used cash of $6.1 billion and provided cash of $305 million for the years ended December 31, 2015, 2014 and 2013, respectively. During the year ended December 31, 2015 we purchased investments of $7.7 billion, primarily Agency RMBS. This use of cash was offset during the year from sales of investments of $7.7 billion and principal repayments of $2.2 billion. The purchases and sales activity was primarily due to our continuing to balance our Agency portfolio to maximize spread income and provide liquidity for purchases of Non-Agency RMBS and mortgage loan pools. During the year ended December 31, 2014 we purchased investments of $12.1 billion, primarily Agency RMBS and securitized loans. This use of cash was offset during the period from sales of investments of $5.6 billion and principal repayments of $1.2 billion during 2014. Additionally, during 2014, we used cash of $774 million to acquire interests in a group of trusts collateralized by pools of seasoned sub-prime residential mortgage loans. During the year ended December 31, 2013 we generated cash from sales of RMBS investments of $1.2 billion and principal payments of $1.5 billion related to all our investment assets offset by purchases of $2.4 billion in RMBS securities.
Our financing activities used cash of $2.5 billion, provided cash of $5.7 billion and used cash of $1.2 billion for the year ended December 31, 2015, 2014 and 2013, respectively. During the year ended December 31, 2015, we paid proceeds on our repurchase agreements, net of proceeds received on our repurchase agreements of $1.0 billion. We also repaid principal of our securitized debt of $2.3 billion and paid dividends of $381 million. Additionally, during the second half of 2015, we also paid $250 million to repurchase common stock outstanding. These uses of cash were offset, in part, by receipt of cash on debt issuance of $1.5 billion. During the year ended December 31, 2014, we received proceeds on our repurchase agreements, net of repayments on our repurchase agreements of $6.8 billion and received proceeds from securitized debt borrowings of $392 million. These proceeds were offset by payments and repurchases on our securitized debt of $583 million and payments of dividends of $575 million. The payments of dividends during the year ended December 31, 2014 includes the $205 million of special dividends announced in the fourth quarter of 2013, but paid during the first quarter of 2014. The year ended December 31, 2013 reflected payments on securitized debt borrowings of $914 million, payment of dividends of $370 million and proceeds from repurchase agreements, net of payments on repurchase agreements, of $131 million.
66
Our recourse leverage is 2.7:1 and 2.6:1 for the periods ended December 31, 2015 and December 31, 2014, respectively. Our recourse leverage excludes the securitized debt which can only be repaid from the proceeds on the assets securing this debt in their respective VIEs. The decrease in our recourse leverage compared to September 30, 2014 is a result of the sale of higher leverage agency positions to acquire residential mortgage loans. Our recourse leverage is presented as a ratio of our repurchase agreements, which are recourse to the assets of the Company, to our economic net equity calculated as a part of our economic book value.
We believe that our cash balances provide an appropriate level of liquidity. Even though we have unrestricted Agency MBS investments, we expect to meet our future cash needs primarily from principal and interest payments on our portfolio and do not anticipate we will need to sell unrestricted Agency MBS investments to meet our liquidity needs. We expect to continue to finance our MBS portfolio largely through repurchase agreements and loans through the securitization market. In addition, we may from time to time sell securities or issue debt as a source of cash to fund new purchases.
At December 31, 2015 and December 31, 2014 the remaining maturities on our RMBS repurchase agreements were as follows.
|
December 31, 2015
|
December 31, 2014
|
|||||||
|
(dollars in thousands)
|
||||||||
|
Overnight
|
$ | - | $ | - | ||||
|
1 to 29 days
|
3,312,902 | 2,652,717 | ||||||
|
30 to 59 days
|
2,501,513 | 1,371,856 | ||||||
|
60 to 89 days
|
246,970 | 656,915 | ||||||
|
90 to 119 days
|
430,026 | 2,068,740 | ||||||
|
Greater than or equal to 120 days
|
947,928 | 1,705,153 | ||||||
|
Total
|
$ | 7,439,339 | $ | 8,455,381 | ||||
|
Average days to maturity
|
77 Days
|
100 Days
|
||||||
We collateralize the repurchase agreements we use to finance our operations with our MBS investments. Our counterparties negotiate a ‘haircut’ when we enter into a financing transaction, which varies from lender to lender. The size of the haircut reflects the perceived risk associated with holding the MBS by the lender. The haircut provides lenders with a cushion for daily market value movements that reduce the need for a margin call to be issued or margin to be returned as normal daily increases or decreases in MBS market values occur. At December 31, 2015, the weighted average haircut on our repurchase agreements collateralized by Agency MBS was 5.3% compared to a haircut on Agency MBS of 5.1% at December 31, 2014. At December 31, 2015, the weighted average haircut on our repurchase agreements collateralized by Non-Agency MBS was 32.9% compared to a haircut on Non-Agency MBS of 29.4% at December 31, 2014.
As the fair value of the Non-Agency MBS is more difficult to determine, as well as more volatile period to period than Agency MBS, the Non-Agency MBS typically requires a larger haircut. Repurchase agreements also subject us to two types of margin calls. First, there are monthly margin calls that are triggered as principal payments and pre-payments are received by us as these payments lower the value of the collateral. As a result, we expect to receive margin calls from our repurchase counterparties monthly simply due to the principal paydowns on our Agency RMBS. The monthly principal payments and pre-payments are not known in advance and vary depending on the behavior of the borrowers related to the underlying mortgages. Second, counterparties make margin calls or return margin as a result of normal daily increases or decreases in asset fair values. In addition, when financing assets using standard form of SIFMA Master Repurchase Agreements, the counterparty to the agreement typically nets its exposure to us on all outstanding repurchase agreements and issues margin calls if movement of the fair values of the assets in the aggregate exceeds their allowable exposure to us. A decline in asset fair values could create a margin call, or may create no margin call depending on the counterparty’s specific policy. In addition, counterparties consider a number of factors, including their aggregate exposure to us as a whole and the number of days remaining before the repurchase transaction closes prior to issuing a margin call. See Note 5 to our Consolidated Financial Statements for a discussion on how we determine the fair values of the RMBS collateralizing our repurchase agreements.
67
The table below presents our average daily repurchase balance and the repurchase balance at each period end for the periods presented. Our balance at period-end tends to fluctuate from the average daily balances due to the adjusting of the size of our portfolio by using leverage. Our average repurchase agreement balance for the year ended December 31, 2015 increased compared to our average repurchase agreement balance for the year ended December 31, 2014 due to additional borrowings on our repurchase agreements in excess of repayments during 2015. We continue to deploy capital for strategic purchases of investments.
|
Period
|
Average
Repurchase
Balance
|
Repurchase
Balance at Period
End
|
||||||
|
(dollars in thousands)
|
||||||||
|
Year Ended December 31, 2015
|
$ | 7,404,890 | $ | 7,439,339 | ||||
|
Year Ended December 31, 2014
|
$ | 5,192,654 | $ | 8,455,381 | ||||
|
Year Ended December 31, 2013
|
$ | 1,480,666 | $ | 1,561,920 | ||||
|
Quarter End December 31, 2015
|
$ | 7,404,890 | $ | 7,439,339 | ||||
|
Quarter End September 30, 2015
|
$ | 7,016,080 | $ | 7,150,821 | ||||
|
Quarter End June 30, 2015
|
$ | 6,904,516 | $ | 6,813,831 | ||||
|
Quarter End March 31, 2015
|
$ | 8,315,355 | $ | 8,296,224 | ||||
We are not required to maintain any specific debt-to-equity ratio. We believe the appropriate leverage for the particular assets we are financing depends on the credit quality and risk of those assets. At December 31, 2015 and December 31, 2014 our total debt was approximately $11.7 billion and $13.6 billion which represented a debt-to-equity ratio for both periods of approximately 4.0:1 and 3.8:1, respectively. We include our repurchase agreements and securitized debt in the numerator of our debt-to-equity ratio and stockholders’ equity as the denominator.
During the year of 2015, we decreased our leverage as we sold portions of our Agency MBS portfolio to generate liquidity to settle repurchase agreements as well as to acquire a pool of mortgage loans. At December 31, 2015, we had repurchase agreements with 24 counterparties. All of our repurchase agreements are secured by Agency and Non-Agency RMBS or, in limited circumstances, cash. Under these repurchase agreements we may not be able to reclaim our collateral but still be obligated to pay our repurchase obligations. We mitigate this risk by limiting our exposure to any counterparty to approximately 10% or less of our total equity, as well as ensuring all our counterparties are highly rated. Therefore, we believe the risk of loss of our collateral posted is mitigated by the terms of our agreements. As of December 31, 2015 and December 31, 2014, we had $8.8 billion and $9.3 billion, respectively, of securities pledged against our repurchase agreement obligations.
Our repurchase agreements have original maturities ranging from 30 to 956 days. The average days to maturity on our repurchase agreements at December 31, 2015 and December 31, 2014 were 77 days and 100 days, respectively. We expect to renew each of our repurchase agreements at maturity. When we renew our repurchase agreements, there is a risk that we will not be able to obtain as favorable an interest rate as a result of rising rates. We offset the risk of our repurchase agreements primarily through the use of interest rate swaps. The average remaining maturities on our interest rate swaps at December 31, 2015 range from less than 1 year to 19 years and have a weighted average maturity of approximately 4 years. We use these interest rate swaps to protect the portfolio from short term changes in interest rates. We currently have three swap counterparties. When our interest rate swaps are in a net loss position (expected cash payments are in excess of expected cash receipts on the swaps), we post collateral as required by the terms of our swap agreements. As of December 31, 2015, we have posted $94 million of cash and securities as collateral to our swap counterparties.
During the year of 2015, we called securitized debt, collateralized by loans held for investment with an unpaid principal balance of $1.3 billion at par. This outstanding debt acquired is part of a securitization vehicle which has a call date in 2016. Additionally, during the year ended December 31, 2015, we issued new debt, collateralized by these same loans held for investment, with an unpaid principal balance of $1.7 billion for $1.7 billion.
68
Exposure to European Financial Counterparties
Our Agency RMBS are primarily financed with repurchase agreements. We secure our borrowings under these agreements by pledging our Agency RMBS as collateral to the lender. The collateral we pledge exceeds the amount of the borrowings under each agreement, typically with the extent of over-collateralization being at least 3% of the amount borrowed. If the counterparty to the repurchase agreement defaults on its obligations and we are not able to recover our pledged assets, we are at risk of losing the over-collateralized amount. The amount of this exposure is the difference between the amount loaned to us plus interest due to the counterparty and the fair value of the collateral pledged by us to the lender including accrued interest receivable on such collateral.
We also use interest rate swaps to manage our interest rate risks. Under these swap agreements, we pledge Agency RMBS or cash as collateral as part of a margin arrangement for interest rate swaps that are in an unrealized loss position. If swap counterparty were to default on its obligation, we would be exposed to a loss to the extent that the amount of our Agency RMBS pledged exceeded the unrealized loss on the associated swaps and we were not able to recover the excess collateral.
Over the past several years, several large European financial institutions have experienced financial difficulty and have been either rescued by government assistance or by other large European banks or institutions. Some of these financial institutions or their U.S. subsidiaries have provided us financing under repurchase agreements or we have entered into interest rate swaps with such institutions. We have entered into repurchase agreements or interest rate swaps with six counterparties as of December 31, 2015 that is either domiciled in Europe or is a U.S.-based subsidiary of a European-domiciled financial institution. The following table summarizes our exposure to such counterparties at December 31, 2015:
|
December 31, 2015
|
||||||||||||||||||
|
Country
|
Number of
Counterparties
|
Repurchase
Agreement
Financing
|
Interest Rate
Swaps at Fair
Value
|
Exposure (1)
|
Exposure as a
Percentage of Total
Assets
|
|||||||||||||
|
(dollars in thousands)
|
||||||||||||||||||
|
France
|
2 | $ | 546,425 | $ | (42,473 | ) | $ | 51,130 | 0.33% | |||||||||
|
Netherlands
|
1 | 161,000 | - | 8,625 | 0.06% | |||||||||||||
|
Switzerland
|
2 | 1,022,684 | (6,369 | ) | 318,831 | 2.08% | ||||||||||||
|
United Kingdom
|
2 | 250,484 | - | 20,102 | 0.13% | |||||||||||||
|
Total
|
7 | $ | 1,980,593 | $ | (48,842 | ) | $ | 398,688 | 2.60% | |||||||||
|
(1) Represents the amount of securities pledged as collateral to each counterparty less the aggregate of repurchase agreement financing and unrealized loss on swaps for each counterparty.
|
||||||||||||||||||
At December 31, 2015, we did not use credit default swaps or other forms of credit protection to hedge the exposures summarized in the table above.
If the European credit crisis continues to impact these major European financial institutions, it is possible that it will also impact the operations of their U.S. subsidiaries. Our financings and operations could be adversely affected by such events. We monitor our exposure to our repurchase agreement and swap counterparties on a regular basis, using various methods, including review of recent rating agency actions, financial relief plans, credit spreads or other developments and by monitoring the amount of cash and securities collateral pledged and the associated loan amount under repurchase agreements or the fair value of swaps with our counterparties. We make reverse margin calls on our counterparties to recover excess collateral as permitted by the agreements governing our financing arrangements or interest rate swaps, or may try to take other actions to reduce the amount of our exposure to a counterparty when necessary.
Stockholders’ Equity
Other than as discussed below under “Restricted Stock Grants,” we did not issue any shares during the years ended December 31, 2015 and 2014.
69
During the year ended December 31, 2015, we declared dividends to common shareholders totaling $379 million, or $1.92 per share. During the year ended December 31, 2014, we declared dividends to common shareholders totaling $370 million, or $1.80 per share.
We had no preferred stock issued or outstanding as of December 31, 2015 and December 31, 2014.
Related Party Transactions
The Management Agreement
As discussed above, on August 5, 2015, we entered into agreements to internalize our management. Prior to the Internalization, we were managed by FIDAC pursuant to the Management Agreement (the “Management Agreement”). In connection with the Internalization, we terminated the Management Agreement without the payment of any termination fee.
The Management Agreement provided that FIDAC would pay all past and future expenses that the Company or our Audit Committee incur to: (1) evaluate the Company’s accounting policy related to the application of GAAP to its Non-Agency RMBS portfolio (the “Evaluation”); (2) restate the financial statements for the period covering 2008 through 2011 as a result of the Evaluation (the “Restatement Filing”); and (3) investigate and evaluate any shareholder derivative demands arising from the Evaluation or the Restatement Filing (the “Investigation”); provided, however, that the Manager’s obligation to pay expenses applies only to expenses not paid by our insurers under our insurance policies. Expenses shall include, without limitation, fees and costs incurred with respect to auditors, outside counsel, and consultants engaged by us or our Audit Committee for the Evaluation, Restatement Filing and the Investigation. The amount paid by the Manager related to these expenses for the year ended December 31, 2015 and 2014 is $7 million and $9 million, respectively. Recoveries are presented in the Consolidated Statements of Operations and Comprehensive Income as Expense recoveries from Manager.
Restricted Stock Grants
We granted 260,200 shares of restricted stock to employees of FIDAC and its affiliates and members of our Board of Directors on January 2, 2008. On February 2, 2015 we granted 84,700 shares of restricted stock to employees of FIDAC. At December 31, 2015 and December 31, 2014, there were approximately 71,000 and 39,400 unvested shares of restricted stock issued to our employees, respectively.
Contractual Obligations and Commitments
The following tables summarize our contractual obligations at December 31, 2015 and December 31, 2014. The estimated principal repayment schedule of the securitized debt is based on expected cash flows of the residential mortgage loans or RMBS, as adjusted for expected principal writedowns on the underlying collateral of the debt.
70
|
December 31, 2015
|
||||||||||||||||||||
|
(dollars in thousands)
|
||||||||||||||||||||
|
Contractual Obligations
|
Within One Year
|
One to Three
Years
|
Three to Five
Years
|
Greater Than
or Equal to
Five Years
|
Total
|
|||||||||||||||
|
Repurchase agreements for RMBS
|
$ | 7,180,496 | $ | 258,841 | $ | - | $ | - | $ | 7,439,337 | ||||||||||
|
Securitized debt
|
735,901 | 1,125,618 | 817,774 | 1,567,821 | 4,247,113 | |||||||||||||||
|
Interest expense on RMBS repurchase agreements (1)
|
24,974 | 2,099 | - | - | 27,073 | |||||||||||||||
|
Interest expense on securitized debt (1)
|
153,606 | 269,110 | 218,958 | 547,859 | 1,189,533 | |||||||||||||||
|
Total
|
$ | 8,094,977 | $ | 1,655,668 | $ | 1,036,732 | $ | 2,115,680 | $ | 12,903,056 | ||||||||||
|
(1) Interest is based on variable rates in effect as of December 31, 2015.
|
||||||||||||||||||||
|
December 31, 2014
|
||||||||||||||||||||
|
(dollars in thousands)
|
||||||||||||||||||||
|
Contractual Obligations
|
Within One Year
|
One to Three
Years
|
Three to Five
Years
|
Greater Than
or Equal to
Five Years
|
Total
|
|||||||||||||||
|
Repurchase agreements for RMBS
|
$ | 8,155,381 | $ | 300,000 | $ | - | $ | - | $ | 8,455,381 | ||||||||||
|
Securitized debt
|
880,367 | 1,427,236 | 940,975 | 1,645,706 | 4,894,284 | |||||||||||||||
|
Interest expense on RMBS repurchase agreements (1)
|
18,451 | 3 | - | - | 18,454 | |||||||||||||||
|
Interest expense on securitized debt (1)
|
184,079 | 313,263 | 238,776 | 573,623 | 1,309,741 | |||||||||||||||
|
Total
|
$ | 9,238,278 | $ | 2,040,502 | $ | 1,179,751 | $ | 2,219,329 | $ | 14,677,860 | ||||||||||
|
(1) Interest is based on variable rates in effect as of December 31, 2014.
|
||||||||||||||||||||
Off-Balance Sheet Arrangements
We do not have any relationships with unconsolidated entities or financial partnerships, such as entities often referred to as structured finance or special purpose entities, which would have been established for the purpose of facilitating off-balance sheet arrangements or other contractually narrow or limited purposes. Further, we have not guaranteed any obligations of unconsolidated entities nor do we have any commitment or intent to provide funding to any such entities.
Capital Expenditure Requirements
At December 31, 2015 and December 31, 2014, we had no material commitments for capital expenditures.
Dividends
To qualify as a REIT, we must pay annual dividends to our stockholders of at least 90% of our taxable income (subject to certain adjustments). We intend to pay regular quarterly dividends to our stockholders. Before we pay any dividend, we must first meet any operating requirements and scheduled debt service on our financing facilities and other debt payable.
Inflation
A significant portion of our assets and liabilities are interest rate sensitive in nature. As a result, interest rates and other factors influence our performance far more so than does inflation. Changes in interest rates do not necessarily correlate with inflation rates or changes in inflation rates. Our consolidated financial statements are prepared in accordance with GAAP and our distributions will be determined by our Board of Directors consistent with our obligation to distribute to our stockholders at least 90% of our REIT taxable income on an annual basis in order to maintain our REIT qualification; in each case, our activities and financial condition are measured with reference to historical cost or fair market value without considering inflation.
71
Other Matters
We have organized ourselves as a holding company and conduct our real estate businesses primarily through wholly-owned subsidiaries and at all times intend to conduct our business so as not to become regulated as an investment company under the 1940 Act. If we were to become regulated as an investment company, our ability to use leverage would be substantially reduced.
Section 3(a)(1)(C) of the Investment Company Act defines an investment company as any issuer that is engaged or proposes to engage in the business of investing, reinvesting, owning, holding or trading in securities and owns or proposes to acquire investment securities having a value exceeding 40% of the value of the issuer’s total assets (exclusive of U.S. Government securities and cash items) on an unconsolidated basis (the “40% test”). Excluded from the term “investment securities,” among other things, are securities issued by majority-owned subsidiaries that rely on the exemptions from registration other than Sections 3(c)(1) and 3(c)(7) of the Investment Company Act, such as the exemption provided by Section 3(c)(5)(C) of the Investment Company Act.
Certain of our subsidiaries, including Chimera RMBS Whole Pool, LLC (f/k/a Chimera Asset Holding LLC) and certain subsidiaries that we may form in the future, rely on the exemption from registration provided by Section 3(c)(5)(C) of the Investment Company Act. Section 3(c)(5)(C), as interpreted by the staff of the Securities and Exchange Commission (or the SEC), requires us to invest at least 55% of our assets in “mortgages and other liens on and interest in real estate” (or Qualifying Real Estate Assets) and at least 80% of our assets in Qualifying Real Estate Assets plus real estate related assets. The assets that we acquire, therefore, are limited by the provisions of and the rules and regulations promulgated under the Investment Company Act.
We also have formed, and may in the future form, certain other wholly-owned or majority-owned subsidiaries that rely upon the exclusion from the definition of investment company under the Investment Company Act provided by Section 3(c)(1) or 3(c)(7) of the Investment Company Act. The securities issued by any wholly-owned or majority-owned subsidiary that relies on the exclusion from the definition of investment company provided by Section 3(c)(1) or 3(c)(7), together with any other investment securities we may own, may not have a value in excess of 40% of the value of our adjusted total assets on an unconsolidated basis. We monitor our compliance with the 40% Test and the operations of our subsidiaries so that we and each of our subsidiaries may maintain compliance with an exclusion from registration as an investment company under the Investment Company Act.
On August 31, 2011, the SEC issued a concept release titled “Companies Engaged in the Business of Acquiring Mortgages and Mortgage-Related Instruments” (SEC Release No. IC-29778). Under the concept release, the SEC is reviewing interpretive issues related to the Section 3(c)(5)(C) exemption. We will continue to monitor developments related to this matter.
Based on our calculations, as of December 31, 2015 and December 31, 2014, we were in compliance with the exemption from registration provided by Section 3(c)(5)(C) and 3(a)(1)(C) of the Investment Company Act.
72
As a result of the Dodd-Frank Wall Street Reform and Consumer Protection Act of 2010, the U.S. Commodity Futures Trading Commission, or CFTC, gained jurisdiction over the regulation of interest rate swaps. The CFTC has asserted that this causes the operators of mortgage real estate investment trusts that use swaps as part of their business model to fall within the statutory definition of Commodity Pool Operator, or CPO, and, absent relief from the Division or the Commission, to register as CPOs. On December 7, 2012, as a result of numerous requests for no-action relief from the CPO registration requirement for operators of mortgage real estate investment trusts, the Division of Swap Dealer and Intermediary Oversight of the CFTC issued no-action relief entitled “No-Action Relief from the Commodity Pool Operator Registration Requirement for Commodity Pool Operators of Certain Pooled Investment Vehicles Organized as Mortgage Real Estate Investment Trusts” that permits a CPO to receive relief by filing a claim to perfect the use of the relief. A claim submitted by a CPO will be effective upon filing, so long as the claim is materially complete. The conditions that must be met to claim the relief are that the mortgage real estate investment trust must:
|
|
·
|
Limit the initial margin and premiums required to establish its commodity interest positions to no more than five percent of the fair market value of the mortgage real estate investment trust’s total assets;
|
|
|
·
|
Limit the net income derived annually from its commodity interest positions that are not qualifying hedging transactions to less than five percent of the mortgage real estate investment trust’s gross income;
|
|
|
·
|
Ensure that interests in the mortgage real estate investment trust are not marketed to the public as or in a commodity pool or otherwise as or in a vehicle for trading in the commodity futures, commodity options, or swaps markets; and
|
|
|
·
|
Either:
|
|
|
|
|
o
|
identify itself as a “mortgage REIT” in Item G of its last U.S. income tax return on Form 1120-REIT; or
|
|
|
o
|
if it has not yet filed its first U.S. income tax return on Form 1120-REIT, disclose to its shareholders that it intends to identify itself as a “mortgage REIT” in its first U.S. income tax return on Form 1120-REIT.
|
While we disagree that the CFTC’s position that mortgage real estate investment trusts that use swaps as part of their business model fall within the statutory definition of a CPO, we have submitted a claim for the relief set forth in the no-action relief entitled “No-Action Relief from the Commodity Pool Operator Registration Requirement for Commodity Pool Operators of Certain Pooled Investment Vehicles Organized as Mortgage Real Estate Investment Trusts” and believe we meet the criteria for such relief set forth therein.
Critical Accounting Policies and Estimates
Accounting policies are integral to understanding our Management’s Discussion and Analysis of Financial Condition and Results of Operations. The preparation of financial statements in accordance with GAAP requires management to make certain judgments and assumptions, on the basis of information available at the time of the financial statements, in determining accounting estimates used in the preparation of these statements. Our significant accounting policies and accounting estimates are described in Note 2 to the Consolidated Financial Statements. Critical accounting policies are described in this section. An accounting policy is considered critical if it requires management to make assumptions or judgments about matters that are highly uncertain at the time the accounting estimate was made or require significant management judgment in interpreting the accounting literature. If actual results differ from our judgments and assumptions, or other accounting judgments were made, this could have a significant and potentially adverse impact on our financial condition, results of operations and cash flows. These critical accounting policies were developed by management, and reviewed by our auditors, prior to being presented to and discussed with the Audit Committee of the Board of Directors.
The consolidated financial statements include, on a consolidated basis, our accounts, the accounts of our wholly-owned subsidiaries, and variable interest entities, or VIEs, for which we are the primary beneficiary. All significant intercompany balances and transactions have been eliminated in consolidation.
Use of Estimates
The preparation of financial statements in conformity with GAAP requires management to make estimates and assumptions that affect the reported amounts of assets and liabilities and disclosure of contingent assets and liabilities at the date of the financial statements and the reported amounts of revenues and expenses during the reporting period. Although our estimates contemplate current conditions and how we expect them to change in the future, it is reasonably possible that actual conditions could be different than anticipated in those estimates, which could materially adversely impact our results of operations and our financial condition. Management has made significant estimates in several areas, including OTTI of Non-Agency RMBS, valuation of Agency and Non-Agency RMBS and interest rate swaps and income recognition on Non-Agency RMBS. Actual results could differ materially from those estimates.
73
Interest Income and Impairment on Non-Agency and Agency Residential Mortgage-Backed Securities
We invest in RMBS representing interests in obligations backed by pools of mortgage loans. We delineate between (1) Agency RMBS and (2) Non-Agency RMBS as follows: The Agency RMBS are mortgage pass-through certificates, collateralized mortgage obligations (“CMOs”), and other RMBS representing interests in or obligations backed by pools of mortgage loans issued or guaranteed as to principal and/or interest repayment by agencies of the U.S. Government or federally chartered corporations such as Ginnie Mae, Freddie Mac or Fannie Mae. The Non-Agency RMBS are not issued or guaranteed by Fannie Mae, Freddie Mac, or Ginnie Mae and are therefore subject to credit risk.
We hold our RMBS as available-for-sale, record these investments at estimated fair value as described in Note 5 of our consolidated financial statements, and include unrealized gains and losses considered to be temporary in Other comprehensive income in our Consolidated Statements of Operations and Comprehensive Income. From time to time, as part of the overall management of our portfolio, we may sell any of our RMBS investments and recognize a realized gain or loss as a component of earnings in our Consolidated Statements of Operations and Comprehensive Income utilizing the specific identification method.
Our accounting policies for recognition of interest income and OTTI related to RMBS are described in Note 2 of the consolidated financial statements. As noted therein, there are three different accounting models that may be applicable for purposes of the recognition of interest income and OTTI on RMBS, and include the following:
ASC 310-20,
Nonrefundable Fees and Other Costs
(ASC 310-20) – applies to all Agency RMBS and certain Non-Agency RMBS of high credit quality that, at the time of purchase, we expect to collect all contractual cash flows and the security cannot be contractually prepaid in such a way that we would not recover substantially all of our recorded investment.
ASC 310-30,
Loans and Debt Securities Acquired with Deteriorated Credit Quality
(ASC 310-30) – applies to Non-Agency RMBS where there is evidence of deterioration in credit quality and we do not expect to collect all contractual cash flows of the security.
ASC 325-40,
Beneficial Interests in Securitized Financial Assets
(ASC 325-40) – applies to certain Non-Agency RMBS not within the scope of ASC 310-20 or ASC 310-30. These include Non-Agency RMBS which is not of high credit quality at the time of purchase or that can be contractually prepaid or otherwise settled in such a way that we would not recover substantially all of our recorded investment.
The determination of which accounting model to apply will have a significant impact on the amounts of interest income and OTTI losses reflected in the results of operations because each accounting model has different requirements regarding the cash flows used to calculate interest income and impairments (i.e., contractual cash flows vs. expected cash flows) and the manner of such calculations, and the impact of changes in prepayment assumptions on interest income or OTTI losses.
For Agency and Non-Agency RMBS accounted for under ASC 310-20, the amount of interest income recorded over the life of a security will be equal to the contractual cash flows of the security and the accretion/amortization of any purchase discount or premium. The amount of interest income reported in any particular financial reporting period will, however, vary depending on the actual and estimated prepayments on the security. For Agency RMBS purchased at a premium to the principal amount, increases in prepayment speeds will generally result in a reduction of the recorded amount of interest income in a particular financial reporting period whereas decreases in prepayment speeds will generally result in an increase in the amount of interest income in a particular financial reporting period. The opposite is generally the case for Agency RMBS purchased at a discount to the principal amount. That is, as prepayment speeds increase, interest income reported in a particular financial reporting period will generally increase, whereas interest income reported in a particular financial reporting period will generally decrease when prepayment speeds decline. However, volatility in the reported amount of interest income will result when there are significant changes in actual or future expected prepayment speeds regardless of the direction of those changes. This volatility is because the accounting model that we apply under ASC 310-20 requires us to record a cumulative adjustment, on a retrospective basis from the acquisition date of the security, when there are changes in prepayment speeds. That cumulative adjustment at each reporting date is intended to reflect the most current estimate of the timing of prepayments over the life of the security (both actual prepayments that have occurred in the past and the timing of prepayments that will occur in the future).
74
Agency RMBS and Non-Agency RMBS accounted for under ASC 310-20 may experience an OTTI loss. The OTTI loss recognized in earnings will be calculated based on the present value of the contractual cash flows expected to be collected. Subsequent to recognition of an OTTI loss, we recognize income on these securities under ASC 310-30 as further described below.
For Non-Agency RMBS accounted for under ASC 310-30 or ASC 325-40, the reported amounts of interest income and OTTI are significantly impacted by management judgments around both the amount and timing of credit losses (defaults) and prepayments. Interest income on these Non-Agency RMBS is recognized initially and in subsequent periods based on the timing and amount of cash flows expected to be collected, as opposed to being based on contractual cash flows. The accounting models in ASC 310-30 and ASC 325-40 do not provide for delineations between individual changes in cash flow estimates based on expected defaults or prepayments. Accordingly, we are required to consider the overall impact on the amount and timing of future cash flows whether due to changes in default expectations or prepayments to determine the amount of interest income to recognize. Furthermore, the overall impact on the amount and timing of future cash flows whether due to changes in default expectations or prepayments also impacts the amount of OTTI losses recognized in earnings.
Non-Agency RMBS accounted for under ASC 310-30 or ASC 325-40 is generally purchased at a discount to the principal amount. At the original acquisition date, we estimate the timing and amount of cash flows expected to be collected and calibrate the present value of those amounts to our purchase price. In each subsequent financial reporting period, we are required to revise our estimates of the remaining timing and amount of cash flows expected to be collected. Depending on the nature of the changes in the timing or amount of cash flows expected to be collected, whether due to changes in default expectations or prepayment assumptions, the following will occur:
|
|
·
|
If there is a positive change in the amount and timing of future cash flows expected to be collected from the previous estimate used for accounting purposes, the effective interest rate in future accounting periods may increase resulting in an increase in the reported amount of interest income in future periods. A positive change in the amount and timing of future cash flows expected to be collected from the previous estimate used for accounting purposes must be considered significant for Non-Agency RMBS accounted for under ASC 310-30 for the effective interest rate in future accounting periods to increase. A positive change in the amount and timing of future cash flows expected to be collected is considered to have occurred when the net present value of future cash flows expected to be collected has increased from the previous estimate. This can occur from a change in either the timing of when cash flows are expected to be collected (i.e., from changes in prepayment speeds or the timing of estimated defaults) or in the amount of cash flows expected to be collected (i.e., from reductions in estimates of future defaults). Furthermore, a positive change could occur on an overall basis in situations where the positive impact of a change in the timing of cash flows exceeds the negative impact of increased defaults, or when the positive impact of a decline in estimated defaults exceeds the negative impact of an extension of the timing of receipt of cash flows.
|
|
|
·
|
If there is a negative (or adverse) change in the amount and timing of future cash flows expected to be collected from the previous estimate used for accounting purposes, and the securities’ fair value is below its amortized cost, an OTTI loss equal to the adverse change in cash flows expected to be collected, discounted using the securities’ effective rate before impairment, is required to be recorded in current period earnings. For Non-Agency RMBS accounted for under ASC 310-30, while the effective interest rate used to accrete interest income after an OTTI has been recognized will be the same, the amount of interest income recorded in future periods will decline because of the reduced balance of the amortized cost basis of the investment to which such effective interest rate is applied. Additionally, for Non-Agency RMBS accounted for under ASC 325-40, while the effective interest rate used to accrete interest income during the period directly after an OTTI has been recognized will be the same, the amount of interest income recorded in such future period will decline, absent an increase in cash flows expected to be collected, because of the reduced amount of the amortized cost basis of the investment to which such effective interest rate is applied. An adverse change in the amount and timing of future cash flows expected to be collected is considered to have occurred when the net present value of future cash flows expected to be collected has decreased from the most previous estimate. This change can occur from a change in either the timing of when cash flows are expected to be collected (i.e., from changes in prepayment speeds or the timing of estimated defaults) or in the amount of cash flows expected to be collected (i.e., from increases in estimates of future defaults). Furthermore, an adverse change could occur on an overall basis in situations where the negative impact of a change in the timing of cash flows exceeds the positive impact of a decline in estimated defaults, or when the negative impact of an increase in estimated defaults exceeds the positive impact of a shortening of the timing of receipt of cash flows.
|
75
The accounting models in ASC 310-30 and ASC 325-40 are impacted by both assumptions of prepayments and assumptions of credit losses (defaults) and, accordingly, changes in the amounts of recorded interest income or OTTI losses over financial reporting periods cannot be considered to result solely from the impact of changes in the credit profile of the investment or solely from the impact of changes in prepayment speeds. Furthermore, while there may be some level of correlation between assumptions for defaults and prepayments as general market interest rates change, in the recent market conditions that correlation has not been direct or predictable.
Determination of appropriate accounting model for Non-Agency RMBS
As discussed in Note 2 to the consolidated financial statements, the determination of the appropriate accounting model for Non-Agency RMBS is dependent on management’s assessment and judgment related to the following factors made as of the acquisition date:
|
|
·
|
Our assessment of the credit quality of the asset, including its credit rating at the acquisition date and whether the security has experienced deterioration in credit quality since its inception.
|
|
|
·
|
Our assessment of the probability of collection of all contractual cash flows.
|
|
|
·
|
Our assessment of whether the security can be contractually prepaid such that we would not recover our initial investment.
|
The most critical judgment inherent in the determination of the appropriate accounting model is our assessment of the cash flows expected to be collected at the acquisition date. In making this accounting judgment, we consider expected defaults and prepayments as further described below.
Impact of prepayment assumptions on RMBS accounted for under ASC 310-20
Changes in actual prepayments will impact the amount of interest income recognized in each financial reporting period for RMBS accounted for under ASC 310-20. We estimate expected prepayment as further described below.
Impact of default and prepayment assumptions on Non-Agency RMBS accounted for under ASC 310-30 and ASC 325-40
In determining the OTTI related to credit losses for Non-Agency RMBS securities accounted for under ASC 310-30 and ASC 325-40, we compare the present value of the remaining cash flows expected to be collected at the purchase date (or last date previously revised) against the present value of the cash flows expected to be collected at the current financial reporting date. The discount rate used to calculate the present value of expected future cash flows is the effective interest rate or effective yield used for income recognition purposes.
Variable Interest Entities
VIEs are defined as entities in which equity investors (i) do not have the characteristics of a controlling financial interest, and/or (ii) do not have sufficient equity at risk for the entity to finance its activities without additional subordinated financial support from other parties. The entity that consolidates a VIE is known as its primary beneficiary, and is generally the entity with (i) the power to direct the activities that most significantly impact the VIE’s economic performance, and (ii) the right to receive benefits from the VIE or the obligation to absorb losses of the VIE that could be significant to the VIE. For VIEs’ that do not have substantial on-going activities, the power to direct the activities that most significantly impact the VIEs’ economic performance may be determined by an entity’s involvement with the design of the VIE.
76
Our Consolidated Statements of Financial Condition contain the assets and liabilities related to seventeen consolidated variable interest entities, or VIEs. Due to the non-recourse nature of these VIEs our net exposure to loss from investments in these entities is limited to our retained beneficial interests.
We currently consolidate twelve residential mortgage loan securitizations and five RMBS re-securitization transactions which are VIEs. The residential mortgage loan securitizations contain jumbo prime residential mortgage loans we purchased during 2007 and 2008 and securitized shortly thereafter. The RMBS re-securitization transactions contain Non-Agency RMBS comprised of primarily what we classify as collateral backed by Alt-A first lien mortgages of 2005-2007 vintages. We categorize collateral as Alt-A regardless of whether the loans were originally described as “prime” if the behavior of the collateral when we purchased the security more resembles typical Alt-A collateral. We define Alt-A collateral characteristics to be evidenced by the 60+ day delinquency bucket of the pool being greater than 5% and the weighted average FICO scores at the time of origination as greater than 650.
Our determination to consolidate these seventeen VIEs was significantly influenced by management’s judgment related to the activities that most significantly impact the economic performance of these entities and the identification of the party with the power over such activities. For the residential mortgage loan securitizations, we determined that our ability to replace defaulting loans with performing loans resulted in us having the power that most significantly impacts the economic performance of the VIE. For the five consolidated RMBS re-securitization transactions, we determined that no party has power over any ongoing activities of the entities and therefore the determination of the primary beneficiary should be based on involvement with the initial design of the entity. Since we transferred the RMBS to the securitization entities, we determined we had the power over the design of the entity, which resulted in us being considered the primary beneficiary. This determination was influenced by the amount of economic exposure to the financial performance of the entity and required a significant management judgment in determining that we should consolidate these five entities.
Due to the consolidation of these VIEs, our actual ownership interests in the securitization and re-securitizations have been eliminated in consolidation and the Consolidated Statements of Financial Condition reflect both the assets held and non-recourse debt issued to third parties by these VIEs. In addition, our operating results and cash flows include the gross amounts related to the assets and liabilities of the VIEs as opposed to the actual economic interests we own in these VIEs. Our interest in these VIEs is restricted to the beneficial interests we retained in these transactions. We are not obligated to provide any financial support to these VIEs.
Our Consolidated Statements of Financial Condition separately present: (i) our direct assets and liabilities, and (ii) the assets and liabilities of our consolidated securitization vehicles. Assets of all consolidated VIEs can only be used to satisfy the obligations of those VIEs, and the liabilities of consolidated VIEs are non-recourse to us.
We have aggregated all the assets and liabilities of the consolidated securitization vehicles due to our determination that these entities are substantively similar and therefore a further disaggregated presentation would not be more meaningful. The notes to our consolidated financial statements describe our direct assets and liabilities and the assets and liabilities of our consolidated securitization vehicles. See Note 8 to our consolidated financial statements for additional information related to our investments in VIEs.
Fair Value Measurements
The Financial Accounting Standards Board, or FASB, defines fair value, establishes a framework for measuring fair value, and requires certain disclosures about fair value measurements under GAAP. Specifically, this guidance defines fair value based on exit price, or the price that would be received upon the sale of an asset or the transfer of a liability in an orderly transaction between market participants at the measurement date. Valuation techniques for RMBS are based on models that consider the estimated cash flows expected to be collected from the underlying collateral and an estimated market-based yield reflective of the unique attributes of the tranche including, but not limited to, assumptions related to prepayment speeds, the frequency and severity of defaults and attributes of the collateral underlying such securities. Estimates of the fair value of RMBS are particularly sensitive to assumptions related to the expected timing of prepayments, the extent of defaults, and the severity of expected losses. Management reviews the fair values generated by the model to determine whether prices are reflective of the current market. Management indirectly corroborates its estimates of the fair value using pricing models by comparing its results to independent prices provided by third party pricing services.
77
To the extent the inputs used to estimate fair value are observable, the values would be categorized in Level 2 of the fair value hierarchy; otherwise they would be categorized as Level 3. The Company’s fair value estimation process utilizes inputs other than quoted prices that are observed in the market. The Company’s estimate of prepayment, default and severity curves all involve adjustments that are deemed to be significant to the fair value measurement process, which renders the resulting Non-Agency fair value estimates Level 3 inputs in the fair value hierarchy. Level 3 assets represent approximately 55% and 49% of total assets measured at fair value on a recurring basis as of December 31, 2015 and 2014, respectively. Level 3 liabilities represent approximately 88% and 97%of total liabilities measured at fair value on a recurring basis as of December 31, 2015 and 2014. None of the liabilities measured at fair value on a recurring basis as of December 31, 2013 are Level 3.
Our assets and liabilities which are measured at fair value are discussed in Note 5 to our consolidated financial statements.
Recent Accounting Pronouncements
Refer to Note 2(p) in the Notes to Consolidated Financial Statements for a discussion of accounting guidance recently adopted by the Company or expected to be adopted by the Company in the future.
The primary components of our market risk are related to credit risk, interest rate risk, prepayment risk, market value risk and real estate risk. While we do not seek to avoid risk completely, we believe the risk can be quantified from historical experience and we seek to actively manage that risk, to earn sufficient compensation to justify taking those risks and to maintain capital levels consistent with the risks we undertake.
Credit Risk
We are subject to credit risk in connection with our investments in Non-Agency RMBS and residential mortgage loans and face more credit risk on assets we own which are rated below ‘‘AAA.’’ The credit risk related to these investments pertains to the ability and willingness of the borrowers to pay, which is assessed before credit is granted or renewed and periodically reviewed throughout the loan or security term. We believe that residual loan credit quality, and thus the quality of our assets, is primarily determined by the borrowers’ credit profiles and loan characteristics. We use a comprehensive credit review process. Our analysis of loans includes borrower profiles, as well as valuation and appraisal data. We use compensating factors such as liquid assets, low loan to value ratios and regional unemployment statistics in evaluating loans. Our resources include a proprietary portfolio management system, as well as third party software systems. We may utilize a third party due diligence firm to perform an independent underwriting review to ensure compliance with existing guidelines. In addition to statistical sampling techniques, we create adverse credit and valuation samples, which we individually review. We reject loans that fail to conform to our standards and do not meet our underwriting criteria. Once we own a loan, our surveillance process includes ongoing analysis through our proprietary data and servicer files. Additionally, the Non-Agency RMBS and other ABS which we acquire for our portfolio are reviewed by us to ensure that they satisfy our risk based criteria. Our review of Non-Agency RMBS and other ABS includes utilizing a proprietary portfolio management system. Our review of Non-Agency RMBS and other ABS is based on quantitative and qualitative analysis of the risk-adjusted returns on Non-Agency RMBS and other ABS. This analysis includes an evaluation of the collateral characteristics supporting the RMBS such as borrower payment history, credit profiles, geographic concentrations, credit enhancement, seasoning, and other pertinent factors.
Interest Rate Risk
Interest rate risk is highly sensitive to many factors, including governmental, monetary and tax policies, domestic and international economic and political considerations and other factors beyond our control. We are subject to interest rate risk in connection with our investments and our related debt obligations, which are generally repurchase agreements, warehouse facilities and securitization/re-securitization vehicles. Our repurchase agreements and warehouse facilities may be of limited duration that is periodically refinanced at current market rates. We intend to mitigate this risk through utilization of derivative contracts, primarily interest rate swap agreements, swaptions, futures and mortgage options.
78
Interest Rate Effects on Net Interest Income
Our operating results depend, in large part, on differences between the income from our investments and our borrowing costs. Most of our warehouse facilities and repurchase agreements provide financing based on a floating rate of interest calculated on a fixed spread over LIBOR. The fixed spread varies depending on the type of underlying asset which collateralizes the financing. Accordingly, the portion of our portfolio which consists of floating interest rate assets will be match-funded utilizing our expected sources of short-term financing, while our fixed interest rate assets will not be match-funded. During periods of rising interest rates, the borrowing costs associated with our investments tend to increase while the income earned on our fixed interest rate investments may remain substantially unchanged. This will result in a narrowing of the net interest spread between the related assets and borrowings and may even result in losses. Further, during this portion of the interest rate and credit cycles, defaults could increase and result in credit losses to us, which could adversely affect our liquidity and operating results. Such delinquencies or defaults could also have an adverse effect on the spread between interest-earning assets and interest-bearing liabilities. Hedging techniques are partly based on assumed levels of prepayments of our fixed-rate and hybrid adjustable-rate mortgage loans and RMBS. If prepayments are slower or faster than assumed, the life of the mortgage loans and RMBS will be longer or shorter, which would reduce the effectiveness of any hedging strategies we may use and may cause losses on such transactions.
Interest Rate Effects on Fair Value
Another component of interest rate risk is the effect changes in interest rates will have on the fair value of the assets we acquire. We face the risk that the fair value of our assets will increase or decrease at different rates than that of our liabilities, including our hedging instruments. We primarily assess our interest rate risk by estimating the duration of our assets and the duration of our liabilities. Duration essentially measures the market price volatility of financial instruments as interest rates change. We generally calculate duration using various financial models and empirical data. Different models and methodologies can produce different duration numbers for the same securities.
It is important to note that the impact of changing interest rates on fair value can change significantly when interest rates change beyond 100 basis points from current levels. Therefore, the volatility in the fair value of our assets could increase significantly when interest rates change beyond 100 basis points. In addition, other factors impact the fair value of our interest rate-sensitive investments and hedging instruments, such as the shape of the yield curve, market expectations as to future interest rate changes and other market conditions. Accordingly, in the event of changes in actual interest rates, the change in the fair value of our assets would likely differ from that shown below and such difference might be material and adverse to our stockholders.
Interest Rate Cap Risk
We may also invest in adjustable-rate mortgage loans and RMBS. These are mortgages or RMBS in which the underlying mortgages are typically subject to periodic and lifetime interest rate caps and floors, which limit the amount by which the security’s interest yield may change during any given period. However, our borrowing costs pursuant to our financing agreements will not be subject to similar restrictions. Therefore, in a period of increasing interest rates, interest rate costs on our borrowings could increase without limitation by caps, while the interest-rate yields on our adjustable-rate mortgage loans and RMBS would effectively be limited. This problem will be magnified to the extent we acquire adjustable-rate RMBS that are not based on mortgages which are fully indexed. In addition, the mortgages or the underlying mortgages in an RMBS may be subject to periodic payment caps that result in some portion of the interest being deferred and added to the principal outstanding. This could result in our receipt of less cash income on our adjustable-rate mortgages or RMBS than we need in order to pay the interest cost on our related borrowings. These factors could lower our net interest income or cause a net loss during periods of rising interest rates, which would harm our financial condition, cash flows and results of operations.
79
Interest Rate Mismatch Risk
We fund a substantial portion of our acquisitions of RMBS with borrowings that, after the effect of hedging, have interest rates based on indices and re-pricing terms similar to, but of somewhat shorter maturities than, the interest rate indices and re-pricing terms of the mortgages and RMBS. In most cases the interest rate indices and re-pricing terms of our mortgage assets and our funding sources will not be identical, thereby creating an interest rate mismatch between assets and liabilities. Our cost of funds would likely rise or fall more quickly than would our earnings rate on assets. During periods of changing interest rates, such interest rate mismatches could negatively impact our financial condition, cash flows and results of operations. To mitigate interest rate mismatches, we may utilize the hedging strategies discussed above. Our analysis of risks is based on our experience, estimates, models and assumptions. These analyses rely on models which utilize estimates of fair value and interest rate sensitivity. Actual economic conditions or implementation of investment decisions by our management may produce results that differ significantly from the estimates and assumptions used in our models and the projected results shown in this Form 10-K.
Our profitability and the value of our portfolio (including derivatives) may be adversely affected during any period as a result of changing interest rates. The following table quantifies the potential changes in net interest income and portfolio value for our Agency MBS portfolio should interest rates go up or down 50 and 100 basis points, assuming parallel movements in the yield curves. All changes in income and value are measured as percentage changes from the projected net interest income and portfolio value at the base interest rate scenario. The base interest rate scenario assumes interest rates at December 31, 2015 and various estimates regarding prepayment and all activities are made at each level of rate change. Actual results could differ significantly from these estimates.
|
December 31, 2015
|
||||||||
|
Change in Interest Rate
|
Projected Percentage Change
in Net Interest Income (1)
|
Projected Percentage Change in
Portfolio Value with Effect of
Interest Rate Swaps and Other
Hedging Transactions (2)
|
||||||
|
-100 Basis Points
|
(11.58 | %) | 1.05 | % | ||||
|
-50 Basis Points
|
(6.33 | %) | 0.67 | % | ||||
|
Base Interest Rate
|
- | - | ||||||
|
+50 Basis Points
|
4.95 | % | (1.14 | %) | ||||
|
+100 Basis Points
|
8.72 | % | (2.43 | %) | ||||
|
(1)
Change in annual economic net interest income. Includes interest expense on interest rate swaps.
|
||||||||
|
(2) Projected Percentage Change in Portfolio Value is based on instantaneous moves in interest rates.
|
||||||||
Prepayment Risk
As we receive prepayments of principal on these investments, premiums and discounts on such investments will be amortized or accreted into interest income. In general, an increase in prepayment rates will accelerate the amortization of purchase premiums, thereby reducing the interest income earned on the investments. Conversely, discounts on such investments are accelerated and accreted into interest income increasing interest income.
Extension Risk
Management computes the projected weighted-average life of our investments based on assumptions regarding the rate at which the borrowers will prepay the underlying mortgages. In general, when fixed-rate or hybrid adjustable-rate mortgage loans or RMBS are acquired via borrowings, we may, but are not required to, enter into an interest rate swap agreement or other hedging instrument that effectively fixes our borrowing costs for a period close to the anticipated average life of the fixed-rate portion of the related assets. This strategy is designed to protect us from rising interest rates as the borrowing costs are effectively fixed for the duration of the fixed-rate portion of the related assets. However, if prepayment rates decrease in a rising interest rate environment, the life of the fixed-rate portion of the related assets could extend beyond the term of the swap agreement or other hedging instrument. This could have a negative impact on our results from operations, as borrowing costs would no longer be fixed after the end of the hedging instrument while the income earned on the fixed and hybrid adjustable-rate assets would remain fixed. In extreme situations, we may be forced to sell assets to maintain adequate liquidity, which could cause us to incur losses.
80
Basis Risk
We seek to limit our interest rate risk by hedging portions of our portfolio through interest rate swaps and other types of hedging instruments. Interest rate swaps are generally tied to underlying Treasury benchmark interest rates. Basis risk relates to the risk of the spread between our RMBS and underlying hedges widening. Such a widening may cause a decline in the fair value of our RMBS that is greater than the increase in fair value of our hedges resulting in a net decline in book value. The widening of mortgage-backed securities yields and Treasury benchmark interest rates may result from a variety of factors such as anticipated or actual monetary policy actions or other market factors.
Market Risk
Market Value Risk
Our available-for-sale securities are reflected at their estimated fair value with unrealized gains and losses excluded from earnings and reported in other comprehensive income if no OTTI has been recognized in earnings. The estimated fair value of these securities fluctuates primarily due to changes in interest rates, prepayment speeds, market liquidity, credit quality, and other factors. Generally, in a rising interest rate environment, the estimated fair value of these securities would be expected to decrease; conversely, in a decreasing interest rate environment, the estimated fair value of these securities would be expected to increase. As market volatility increases or liquidity decreases, the fair value of our investments may be adversely impacted.
Real Estate Market Risk
We own assets secured by real property and may own real property directly in the future. Residential property values are subject to volatility and may be affected adversely by a number of factors, including, but not limited to, national, regional and local economic conditions (which may be adversely affected by industry slowdowns and other factors); local real estate conditions (such as an oversupply of housing); changes or continued weakness in specific industry segments; construction quality, age and design; demographic factors; and retroactive changes to building or similar codes. In addition, decreases in property values reduce the value of the collateral and the potential proceeds available to a borrower to repay our loans, which could also cause us to incur losses.
Risk Management
To the extent consistent with maintaining our REIT status, we seek to manage risk exposure to protect our portfolio of residential mortgage loans, RMBS, and other assets and related debt against the effects of major interest rate changes. We generally seek to manage risk by:
|
|
·
|
monitoring and adjusting, if necessary, the reset index and interest rate related to our RMBS and our financings;
|
|
|
·
|
attempting to structure our financing agreements to have a range of different maturities, terms, amortizations and interest rate adjustment periods;
|
|
|
·
|
using derivatives, financial futures, swaps, options, caps, floors and forward sales to adjust the interest rate sensitivity of our investments and our borrowings;
|
|
|
·
|
using securitization financing to lower average cost of funds relative to short-term financing vehicles further allowing us to receive the benefit of attractive terms for an extended period of time in contrast to short term financing and maturity dates of the investments not included in the securitization; and
|
|
|
·
|
actively managing, on an aggregate basis, the interest rate indices, interest rate adjustment periods, and gross reset margins of our investments and the interest rate indices and adjustment periods of our financings.
|
81
Our efforts to manage our assets and liabilities are concerned with the timing and magnitude of the re-pricing of assets and liabilities. We attempt to control risks associated with interest rate movements. Methods for evaluating interest rate risk include an analysis of our interest rate sensitivity “gap,” which is the difference between interest-earning assets and interest-bearing liabilities maturing or re-pricing within a given time period. A gap is considered positive when the amount of interest-rate sensitive assets exceeds the amount of interest-rate sensitive liabilities. A gap is considered negative when the amount of interest-rate sensitive liabilities exceeds interest-rate sensitive assets. During a period of rising interest rates, a negative gap would tend to adversely affect net interest income, while a positive gap would tend to result in an increase in net interest income. During a period of falling interest rates, a negative gap would tend to result in an increase in net interest income, while a positive gap would tend to affect net interest income adversely. Because different types of assets and liabilities with the same or similar maturities may react differently to changes in overall market rates or conditions, changes in interest rates may affect net interest income positively or negatively even if an institution were perfectly matched in each maturity category.
The following table sets forth the estimated maturity or re-pricing of our interest-earning assets and interest-bearing liabilities at December 31, 2015. The amounts of assets and liabilities shown within a particular period were determined in accordance with the contractual terms of the assets and liabilities, except adjustable-rate loans, and securities are included in the period in which their interest rates are first scheduled to adjust and not in the period in which they mature and includes the effect of the interest rate swaps. The interest rate sensitivity of our assets and liabilities in the table could vary substantially based on actual prepayments.
|
December 31, 2015
|
||||||||||||||||||||
|
(dollars in thousands)
|
||||||||||||||||||||
|
Within 3 Months
|
3-12 Months
|
1 Year to 3 Years
|
Greater than 3 Years
|
Total
|
||||||||||||||||
|
Rate sensitive assets
|
$ | 1,006,140 | $ | 3,366,402 | $ | 348,372 | $ | 22,912,280 | $ | 27,633,194 | ||||||||||
|
Cash equivalents
|
114,062 | - | - | - | 114,062 | |||||||||||||||
|
Total rate sensitive assets
|
1,120,202 | 3,366,402 | 348,372 | 22,912,280 | 27,747,256 | |||||||||||||||
|
Rate sensitive liabilities
|
4,886,614 | 2,148,383 | 9,941 | 153,405 | 7,198,343 | |||||||||||||||
|
Interest rate sensitivity gap
|
$ | (3,766,412 | ) | $ | 1,218,020 | $ | 338,431 | $ | 22,758,875 | $ | 20,548,913 | |||||||||
|
Cumulative rate sensitivity gap
|
$ | (3,766,412 | ) | $ | (2,548,393 | ) | $ | (2,209,962 | ) | $ | 20,548,913 | |||||||||
|
Cumulative interest rate sensitivity gap as a
|
||||||||||||||||||||
|
percentage of total rate sensitive assets
|
-14 | % | -9 | % | -8 | % | 74 | % | ||||||||||||
Our analysis of risks is based on our management’s experience, estimates, models and assumptions. These analyses rely on models which utilize estimates of fair value and interest rate sensitivity. Actual economic conditions or implementation of investment decisions by our management may produce results that differ significantly from the estimates and assumptions used in our models and the projected results shown in the above tables and in this Form 10-K. These analyses contain certain forward-looking statements and are subject to the safe harbor statement set forth under the heading, “Special Note Regarding Forward-Looking Statements.”
Our consolidated financial statements and the related notes, together with the Report of Independent Registered Public Accounting Firm thereon, are set forth beginning on page F-1 of this 2015 Form 10-K.
None
82
a) Evaluation of Disclosure Controls and Procedures
Disclosure controls and procedures (as defined in Rules 13a-15(e) and 15d-15(e) of the Exchange Act) are designed to ensure that information required to be disclosed in reports filed or submitted under the Exchange Act is recorded, processed, summarized and reported within the time periods specified in SEC rules and forms and that such information is accumulated and communicated to management, including the Chief Executive Officer and Chief Financial Officer, to allow timely decisions regarding required disclosures.
Our management, including our Chief Executive Officer and Chief Financial Officer, reviewed and evaluated the effectiveness of the design and operation of our disclosure controls and procedures covering the preparation and review of this 2015 annual report. As described below, in 2014 management identified a material weakness in a component of our internal control over financial reporting, which is an integral component of our disclosure controls and procedures. The material weakness identified in 2014 was remediated in 2015. Based on the review and evaluation discussed above, and in light of the remediation of the material weakness, our Chief Executive Officer and Chief Financial Officer have concluded that the disclosure controls and procedures were effective as of December 31, 2015.
(b) Management’s Report on Internal Control Over Financial Reporting
Our management is responsible for establishing and maintaining adequate internal control over financial reporting, as such term is defined in Exchange Act Rules 13a-15(f) and 15d-15(f). Under the supervision and with the participation of our management, including our Chief Executive Officer and Chief Financial Officer, we conducted an evaluation of the effectiveness of our internal control over financial reporting as of December 31, 2015 based on the framework in Internal Control—Integrated Framework issued by the Committee of Sponsoring Organizations of the Treadway Commission (2013 Framework) (COSO). Based on that evaluation, our management concluded our internal controls over financial reporting and disclosure was effective as of December 31, 2015.
Material Weaknesses in Internal Control Over Financial Reporting
A material weakness is a deficiency, or a combination of deficiencies, in internal control over financial reporting such that there is a reasonable possibility that a material misstatement of our annual or interim financial statements will not be prevented or detected on a timely basis. As previously disclosed in Item 9A of our Annual Report on Form 10-K for the period ended December 31, 2014, we reported material weaknesses in our internal control over financial reporting (as defined in Rule 13a-15(f) and 15d-15(f) under the Exchange Act). The material weakness has been remediated as described below.
Management has remediated the following material weakness in our internal control over financial reporting as of December 31, 2014:
|
●
|
2014 Weakness:
|
|
●
|
We have identified an overreliance on spreadsheets consisting of manual inputs and complex calculations used to record transactions and estimates supporting the financial statement amounts and disclosures. Our controls over this electronic data were not performed at a level of precision sufficient to rely on the completeness and accuracy of the source data or manual input. The safeguarding and management of electronic data were insufficient to evidence the existence or extent of management's review and validation over the complex spreadsheets by a person with the necessary competency and authority.
|
83
|
●
|
Remediation:
|
We implemented a portfolio accounting system that performs complex calculations required for financial reporting purposes. The system improved our control environment and eliminated certain spreadsheets previously used to manage portfolio data and financial reporting information. The system has data validation, access controls and audit trails which have improved controls over portfolio accounting information. Remaining spreadsheets have appropriate evidence of review and safeguards sufficient to validate the completeness and accuracy of the data in the spreadsheets. Therefore, the previously identified material weakness for an overreliance on complex spreadsheets has been remediated.
The effectiveness of our internal control over financial reporting as of December 31, 2015 has been audited by Ernst & Young LLP, an independent registered public accounting firm, as stated in their report which is included herein.
(c) Changes in Internal Control over Financial Reporting
Other than the ongoing remediation efforts described above, there have been no changes in our internal control over financial reporting that have materially affected, or are reasonably likely to materially affect, our internal control over financial reporting.
None.
84
We expect to file with the SEC, in April 2015 (and, in any event, not later than 120 days after the close of our last fiscal year), a definitive proxy statement (the “Proxy Statement”), pursuant to SEC Regulation 14A in connection with our Annual Meeting of Stockholders to be held on or about June 07, 2016. The information to be included in the Proxy Statement regarding the Company’s directors, executive officers, and certain other matters required by Item 401 of Regulation S-K is incorporated herein by reference.
The information to be included in the Proxy Statement regarding compliance with Section 16(a) of the 1934 Act required by Item 405 of Regulation S-K is incorporated herein by reference.
The information to be included in the Proxy Statement regarding the Company’s Code of Business Conduct and Ethics required by Item 406 of Regulation S-K is incorporated herein by reference.
The information to be included in the Proxy Statement regarding certain matters pertaining to the Company’s corporate governance required by Item 407(c)(3), (d)(4) and (d)(5) of Regulation S-K is incorporated by reference.
Corporate Governance
We have adopted a set of Corporate Governance Guidelines, which together with the charters of the three standing committees of our Board of Directors (Audit, Compensation, and Nominating and Corporate Governance), and our Code of Business Conduct and Ethics (which constitutes the Company’s code of ethics), provide the framework for the governance of the Company. A complete copy of our Corporate Governance Guidelines, the charters of each of the Board committees and the Code of Business Conduct and Ethics (which applies not only to our Chief Executive Officer, Chief Financial Officer and Chief Accounting Officer, but also to all other employees of the Company) may be found by clicking on the “Company Information” link found at the top of our homepage at www.chimerareit.com and then clicking on the “Corporate Governance” link. (Information from such site is not incorporated by reference into this Annual Report on Form 10-K.) You may also obtain free copies of these materials by writing to our General Counsel at the Company’s headquarters.
The information to be included in the Proxy Statement regarding executive compensation and other compensation related matters required by Items 402 and 407(e)(4) and (e)(5) of Regulation S-K is incorporated herein by reference.
The tables to be included in the Proxy Statement, which will contain information relating to the Company’s equity compensation and beneficial ownership of the Company required by Items 201(d) and 403 of Regulation S-K, are incorporated herein by reference.
The information to be included in the Proxy Statement regarding transactions with related persons, promoters and certain control persons and director independence required by Items 404 and 407(a) of Regulation S-K is incorporated herein by reference.
The information to be included in the Proxy Statement concerning principal accounting fees and services and the Audit Committee’s pre-approval policies and procedures required by Item 14 is incorporated herein by reference.
85
(a) Documents filed as part of this report:
1. Financial Statements.
2. Schedules to Financial Statements.
All financial statement schedules have been omitted because they are either inapplicable or the information required is provided in our Financial Statements and Notes thereto, included in Part II, Item 8, of this Annual Report on Form 10-K.
3. Exhibits:
|
EXHIBIT INDEX
|
|
|
Exhibit
Number
|
Description
|
|
2.1
|
Transition Services Agreement, dated as of August 5, 2015, by and between the Company and Fixed Income Discount Advisory Company (filed as Exhibit 2.1 to the Company’s Report on Form 8-K filed on August 5, 2015 and incorporated herein by reference)
|
|
2.2
|
|
|
3.1
|
Articles of Amendment and Restatement of Chimera Investment Corporation (filed as Exhibit 3.1 to the Company’s Registration Statement on Amendment No. 1 to Form S-11 (File No. 333-145525) filed on September 27, 2007 and incorporated herein by reference)
|
|
3.2
|
Articles of Amendment of Chimera Investment Corporation (filed as Exhibit 3.1 to the Company’s Report on Form 8-K filed on May 28, 2009 and incorporated herein by reference)
|
|
3.3
|
Articles of Amendment of Chimera Investment Corporation (filed as Exhibit 3.1 to the Company’s Report on Form 8-K filed on November 5, 2010 and incorporated herein by reference)
|
|
3.4
|
|
|
3.5
|
Certificate of Amendment to the Company's Articles of Incorporation (filed as Exhibit 3.2 to the Company’s Report on Form 8-K filed on April 6, 2015 and incorporated herein by reference)
|
|
3.6
|
Amended and Restated Bylaws of Chimera Investment Corporation (filed as Exhibit 3.1 to the Company’s Report on Form 8-K filed on October 23, 2015 and incorporated herein by reference)
|
|
4.1
|
Specimen Common Stock Certificate of Chimera Investment Corporation (filed as Exhibit 4.1 to the Company’s Registration Statement on Amendment No. 1 to Form S-11 (File No. 333-145525) filed on September 27, 2007 and incorporated herein by reference)
|
|
10.1†
|
Form of Amended and Restated Equity Incentive Plan (filed as Exhibit 10.1 to the Company’s Report on Form 8-K filed on December 11, 2015 and incorporated herein by reference)
|
|
10.2†
|
Form of Restricted Common Stock Award (filed as Exhibit 10.3 to the Company’s Registration Statement on Amendment No. 1 to Form S-11 (File No. 333-145525) filed on September 27, 2007 and incorporated herein by reference)
|
|
10.3†
|
Form of Stock Option Grant (filed as Exhibit 10.4 to the Company’s Registration Statement on Amendment No. 1 to Form S-11 (File No. 333-145525) filed on September 27, 2007 and incorporated herein by reference)
|
|
10.4†
|
Form of Performance Share Unit Agreement
|
|
10.5†
|
Form of Restricted Stock Unit Award Agreement
|
|
10.6†
|
Stock Award Deferral Program
|
|
10.7†
|
Employment Agreement, dated August 5, 2015, between the Company and Matthew Lambiase (filed as Exhibit 10.1 to the Company’s Report on Form 10-Q filed on November 5, 2015 and incorporated herein by reference)
|
86
|
10.8†
|
Employment Agreement, dated August 5, 2015, between the Company and Choudhary Yarlagadda (filed as Exhibit 10.2 to the Company’s Report on Form 10-Q filed on November 5, 2015 and incorporated herein by reference)
|
|
10.9†
|
Employment Agreement, dated August 5, 2015, between the Company and Mohit Marria (filed as Exhibit 10.3 to the Company’s Report on Form 10-Q filed on November 5, 2015 and incorporated herein by reference)
|
|
10.10†
|
Employment Agreement, dated August 5, 2015, between the Company and Robert Colligan (filed as Exhibit 10.4 to the Company’s Report on Form 10-Q filed on November 5, 2015 and incorporated herein by reference)
|
|
10.11†
|
Employment Agreement, dated August 5, 2015, between the Company and Phillip J. Kardis, II, Esq. (filed as Exhibit 10.5 to the Company’s Report on Form 10-Q filed on November 5, 2015 and incorporated herein by reference)
|
|
10.12†
|
Amendment No. 1 to Employment Agreement, dated January 20, 2016, between the Company and Matthew Lambiase
|
|
10.13†
|
Amendment No. 1 to Employment Agreement, dated January 20, 2016, between the Company and Choudhary Yarlagadda
|
|
10.14†
|
Amendment No. 1 to Employment Agreement, dated January 20, 2016, between the Company and Mohit Marria
|
|
10.15†
|
Amendment No. 1 to Employment Agreement, dated January 20, 2016, between the Company and Robert Colligan
|
|
10.16†
|
Form of Director and Officer Indemnification Agreement (filed as Exhibit 10.6 to the Company’s Report on Form 10-Q filed on November 5, 2015 and incorporated herein by reference)
|
|
10.17
|
Form of Master Securities Repurchase Agreement (filed as Exhibit 10.5 to the Company’s Registration Statement on Amendment No. 3 to Form S-11 (File No. 333-145525) filed on November 13, 2007 and incorporated herein by reference)
|
|
12.1
|
Computation of Ratio of Earnings to Fixed Charges
|
|
21.1
|
Subsidiaries of Registrant
|
| 23.1 | Consent of Independent Registered Public Accounting Firm |
|
31.1
|
Certification of Matthew Lambiase, Chief Executive Officer and President of the Registrant, pursuant to Section 302 of the Sarbanes-Oxley Act of 2002.
|
|
31.2
|
Certification of Robert Colligan, Chief Financial Officer of the Registrant, pursuant to Section 302 of the Sarbanes-Oxley Act of 2002.
|
|
32.1
|
Certification of Matthew Lambiase, Chief Executive Officer and President of the Registrant, pursuant to 18 U.S.C. Section 1350 as adopted pursuant to Section 906 of the Sarbanes-Oxley Act of 2002.
|
|
32.2
|
Certification of Robert Colligan, Chief Financial Officer of the Registrant, pursuant to 18 U.S.C. Section 1350 as adopted pursuant to Section 906 of the Sarbanes-Oxley Act of 2002.
|
† Represents a management contract or compensatory plan or arrangement
87
FINANCIAL STATEMENTS
| Reports of Independent Registered Public Accounting Firm | F-2 |
| Consolidated Financial Statements | |
| F-4 | |
| F-5 | |
| F-6 | |
| F-7 | |
| F-8 |
F-1
The Board of Directors and Stockholders of
Chimera Investment Corporation
We have audited the accompanying consolidated statements of financial condition of
Chimera Investment Corporation
(the “Company”) as of December 31, 2015 and 2014, and the related consolidated statements of operations and comprehensive income, changes in stockholders’ equity and cash flows for each of the three years in the period ended December 31, 2015. These financial statements are the responsibility of the Company's management. Our responsibility is to express an opinion on these financial statements based on our audits.
We conducted our audits in accordance with the standards of the Public Company Accounting Oversight Board (United States). Those standards require that we plan and perform the audit to obtain reasonable assurance about whether the financial statements are free of material misstatement. An audit includes examining, on a test basis, evidence supporting the amounts and disclosures in the financial statements. An audit also includes assessing the accounting principles used and significant estimates made by management, as well as evaluating the overall financial statement presentation. We believe that our audits provide a reasonable basis for our opinion.
In our opinion, the financial statements referred to above present fairly, in all material respects, the consolidated financial position of the Company at December 31, 2015 and 2014, and the consolidated results of its operations and its cash flows for each of the three years in the period ended December 31, 2015, in conformity with U.S. generally accepted accounting principles.
As discussed in Note 2(p) to the consolidated financial statements, the Company changed its method for accounting for certain consolidated variable interest entities holding securitized loans held for investment and the related securitized debt which qualified as collateralized financing entities effective January 1, 2015.
We also have audited, in accordance with the standards of the Public Company Accounting Oversight Board (United States), the Company’s internal control over financial reporting as of December 31, 2015, based on criteria established in Internal Control-Integrated Framework issued by the Committee of Sponsoring Organizations of the Treadway Commission (2013 Framework) and our report dated February 25, 2016 expressed an unqualified opinion thereon.
/s/
E
rnst
& Y
oung
LLP
New York, New York
February 25, 2016
F-2
REPORT OF INDEPENDENT REGISTERED PUBLIC ACCOUNTING FIRM
To The Board of Directors and Stockholders of
Chimera Investment Corporation
We have audited Chimera Investment Corporation’s internal control over financial reporting as of December 31, 2015, based on criteria established in Internal Control—Integrated Framework issued by the Committee of Sponsoring Organizations of the Treadway Commission (2013 Framework) (the COSO criteria). Chimera Investment Corporation’s management is responsible for maintaining effective internal control over financial reporting, and for its assessment of the effectiveness of internal control over financial reporting included in the accompanying Management’s Report on Internal Control Over Financial Reporting. Our responsibility is to express an opinion on the Company’s internal control over financial reporting based on our audit.
We conducted our audit in accordance with the standards of the Public Company Accounting Oversight Board (United States). Those standards require that we plan and perform the audit to obtain reasonable assurance about whether effective internal control over financial reporting was maintained in all material respects. Our audit included obtaining an understanding of internal control over financial reporting, assessing the risk that a material weakness exists, testing and evaluating the design and operating effectiveness of internal control based on the assessed risk, and performing such other procedures as we considered necessary in the circumstances. We believe that our audit provides a reasonable basis for our opinion.
A company’s internal control over financial reporting is a process designed to provide reasonable assurance regarding the reliability of financial reporting and the preparation of financial statements for external purposes in accordance with generally accepted accounting principles. A company’s internal control over financial reporting includes those policies and procedures that (1) pertain to the maintenance of records that, in reasonable detail, accurately and fairly reflect the transactions and dispositions of the assets of the company; (2) provide reasonable assurance that transactions are recorded as necessary to permit preparation of financial statements in accordance with generally accepted accounting principles, and that receipts and expenditures of the company are being made only in accordance with authorizations of management and directors of the company; and (3) provide reasonable assurance regarding prevention or timely detection of unauthorized acquisition, use, or disposition of the company’s assets that could have a material effect on the financial statements.
Because of its inherent limitations, internal control over financial reporting may not prevent or detect misstatements. Also, projections of any evaluation of effectiveness to future periods are subject to the risk that controls may become inadequate because of changes in conditions, or that the degree of compliance with the policies or procedures may deteriorate.
In our opinion, Chimera Investment Corporation maintained, in all material respects, effective internal control over financial reporting as of December 31, 2015, based on the COSO criteria.
We also have audited, in accordance with the standards of the Public Company Accounting Oversight Board (United States), the consolidated statements of financial condition of Chimera Investment Corporation as of December 31, 2015 and 2014, the related consolidated statements of operations and comprehensive income, changes in stockholders’ equity and cash flows for each of the three years in the period ended December 31, 2015 of Chimera Investment Corporation and our report dated February 25, 2016 expressed an unqualified opinion thereon.
/s/
E
rnst
& Y
oung
LLP
New York, New York
February 25, 2016
F-3
|
CONSOLIDATED STATEMENTS OF FINANCIAL CONDITION
|
||||||||
|
(dollars in thousands, except share and per share data)
|
||||||||
|
December 31, 2015
|
December 31, 2014
|
|||||||
|
Assets:
|
||||||||
|
Cash and cash equivalents
|
$ | 114,062 | $ | 164,620 | ||||
|
Non-Agency RMBS, at fair value
|
3,675,841 | 3,404,149 | ||||||
|
Agency RMBS, at fair value
|
6,514,824 | 8,441,522 | ||||||
|
Securitized loans held for investment, net of allowance for loan losses of $0 million and $7 million, respectively
|
- | 626,112 | ||||||
|
Securitized loans held for investment, at fair value
|
4,768,416 | 4,699,215 | ||||||
|
Receivable for investments sold
|
- | 1,572,056 | ||||||
|
Accrued interest receivable
|
66,247 | 71,099 | ||||||
|
Other assets
|
189,796 | 172,601 | ||||||
|
Derivatives, at fair value, net
|
15,460 | 3,631 | ||||||
|
Total assets
(1)
|
$ | 15,344,646 | $ | 19,155,005 | ||||
|
Liabilities:
|
||||||||
|
Repurchase agreements, RMBS ($8.8 billion and $9.3 billion pledged as collateral, respectively)
|
$ | 7,439,339 | $ | 8,455,381 | ||||
|
Securitized debt, collateralized by Non-Agency RMBS ($2.1 billion and $2.5 billion pledged as collateral, respectively)
|
529,415 | 704,915 | ||||||
|
Securitized debt, collateralized by loans held for investment ($0 million and $626 million pledged as collateral, respectively)
|
- | 521,997 | ||||||
|
Securitized debt at fair value, collateralized by loans held for investment ($4.8 billion and $4.7 billion pledged as collateral, respectively)
|
3,720,496 | 3,868,366 | ||||||
|
Payable for investments purchased
|
560,641 | 1,845,282 | ||||||
|
Accrued interest payable
|
37,432 | 31,888 | ||||||
|
Dividends payable
|
90,097 | 92,483 | ||||||
|
Accounts payable and other liabilities
|
11,404 | 2,469 | ||||||
|
Investment management fees payable
|
- | 10,357 | ||||||
|
Derivatives, at fair value
|
9,634 | 14,177 | ||||||
|
Total liabilities
(1)
|
12,398,458 | 15,547,315 | ||||||
|
Commitments and Contingencies (See Note 16)
|
||||||||
|
Stockholders' Equity:
|
||||||||
|
Preferred Stock: par value $0.01 per share; 100,000,000 shares authorized, 0 shares issued and outstanding, respectively
|
$ | - | $ | - | ||||
|
Common stock: par value $0.01 per share; 300,000,000 shares authorized, 187,711,868 and 205,546,144 shares issued and outstanding, respectively
|
1,877 | 2,055 | ||||||
|
Additional paid-in-capital
|
3,366,568 | 3,614,411 | ||||||
|
Accumulated other comprehensive income
|
773,791 | 1,046,680 | ||||||
|
Accumulated deficit
|
(1,196,048 | ) | (1,055,456 | ) | ||||
|
Total stockholders' equity
|
$ | 2,946,188 | $ | 3,607,690 | ||||
|
Total liabilities and stockholders' equity
|
$ | 15,344,646 | $ | 19,155,005 | ||||
|
(1) The Company's consolidated statements of financial condition include assets of consolidated variable interest entities ("VIEs") that can only be used to settle obligations and liabilities of the VIE for which creditors do not have recourse to the primary beneficiary (Chimera Investment Corp.). As of December 31, 2015 and 2014, total assets of consolidated VIEs were $7,031,278 and $7,924,232, respectively, and total liabilities of consolidated VIEs were $4,262,017 and $5,111,348, respectively. See Note 8 for further discussion.
|
|
See accompanying notes to consolidated financial statements.
|
F-4
|
CONSOLIDATED STATEMENTS OF OPERATIONS AND COMPREHENSIVE INCOME
|
||||||||||||
|
(dollars in thousands, except share and per share data)
|
||||||||||||
|
Net Interest Income:
|
December 31, 2015
|
December 31, 2014
|
December 31, 2013
|
|||||||||
|
Interest income
(1)
|
$ | 872,737 | $ | 687,795 | $ | 511,783 | ||||||
|
Interest expense
(2)
|
259,365 | 147,785 | 101,999 | |||||||||
|
Net interest income
|
613,372 | 540,010 | 409,784 | |||||||||
|
Other-than-temporary impairments:
|
||||||||||||
|
Total other-than-temporary impairment losses
|
(8,700 | ) | (8,713 | ) | (4,356 | ) | ||||||
|
Portion of loss recognized in other comprehensive income
|
(58,744 | ) | (55,279 | ) | (40,811 | ) | ||||||
|
Net other-than-temporary credit impairment losses
|
(67,444 | ) | (63,992 | ) | (45,167 | ) | ||||||
|
Other investment gains (losses):
|
||||||||||||
|
Net unrealized gains (losses) on derivatives
|
67,385 | (103,496 | ) | 34,369 | ||||||||
|
Realized gains (losses) on terminations of interest rate swaps
|
(98,949 | ) | - | - | ||||||||
|
Net realized gains (losses) on derivatives
|
(83,073 | ) | (82,852 | ) | (7,713 | ) | ||||||
|
Net gains (losses) on derivatives
|
(114,637 | ) | (186,348 | ) | 26,656 | |||||||
|
Net unrealized gains (losses) on financial instruments at fair value
|
(158,433 | ) | 193,534 | (44,277 | ) | |||||||
|
Net realized gains (losses) on sales of investments
|
77,074 | 91,709 | 68,107 | |||||||||
|
Gain (loss) on deconsolidation
|
(256 | ) | 47,846 | - | ||||||||
|
Gains (losses) on Extinguishment of Debt
|
(5,930 | ) | (2,184 | ) | - | |||||||
|
Realized losses on principal write-downs of Non-Agency RMBS
|
- | - | (18,316 | ) | ||||||||
|
Total other gains (losses)
|
(202,182 | ) | 144,557 | 32,170 | ||||||||
|
Other expenses:
|
||||||||||||
|
Management fees
|
24,609 | 32,514 | 25,952 | |||||||||
|
Expense recoveries from Manager
|
(6,906 | ) | (8,936 | ) | (6,788 | ) | ||||||
|
Net management fees
|
17,703 | 23,578 | 19,164 | |||||||||
|
Provision for loan losses, net
|
- | (232 | ) | (1,799 | ) | |||||||
|
Compensation and benefits
|
10,544 | - | - | |||||||||
|
General and administrative expenses
|
31,633 | 20,403 | 14,085 | |||||||||
|
Servicing Fees of consolidated VIEs
|
25,244 | 10,004 | 2,649 | |||||||||
|
Deal Expenses
|
8,272 | 1,398 | - | |||||||||
|
Other (income) expense
|
- | (23,783 | ) | - | ||||||||
|
Total other expenses
|
93,396 | 31,368 | 34,099 | |||||||||
|
Income (loss) before income taxes
|
250,350 | 589,207 | 362,688 | |||||||||
|
Income taxes
|
1 | 2 | 2 | |||||||||
|
Net income (loss)
|
$ | 250,349 | $ | 589,205 | $ | 362,686 | ||||||
|
Net income (loss) per share available to common shareholders:
|
||||||||||||
|
Basic
|
$ | 1.25 | $ | 2.87 | $ | 1.77 | ||||||
|
Diluted
|
$ | 1.25 | $ | 2.87 | $ | 1.76 | ||||||
|
Weighted average number of common shares outstanding:
|
||||||||||||
|
Basic
|
199,563,196 | 205,450,095 | 205,418,876 | |||||||||
|
Diluted
|
199,650,177 | 205,508,769 | 205,514,069 | |||||||||
|
Comprehensive income (loss):
|
||||||||||||
|
Net income (loss)
|
$ | 250,349 | $ | 589,205 | $ | 362,686 | ||||||
|
Other comprehensive income:
|
||||||||||||
|
Unrealized gains (losses) on available-for-sale securities, net
|
(263,049 | ) | 134,113 | 23,807 | ||||||||
|
Reclassification adjustment for net losses included in net income for other-than-temporary credit impairment losses
|
67,444 | 63,992 | 45,167 | |||||||||
|
Reclassification adjustment for net realized losses (gains) included in net income
|
(77,284 | ) | (94,382 | ) | (68,107 | ) | ||||||
|
Reclassification adjustment for gain on deconsolidation included in net income
|
- | (47,846 | ) | - | ||||||||
|
Other comprehensive income (loss)
|
(272,889 | ) | 55,877 | 867 | ||||||||
|
Comprehensive income (loss)
|
$ | (22,540 | ) | $ | 645,082 | $ | 363,553 | |||||
|
(1) Includes interest income of consolidated VIEs of $575,715, $428,992 and $371,559 for the years ended December 31, 2015,
2014, and 2013 respectively. See Note 8 for further discussion.
|
|
(2) Includes interest expense of consolidated VIEs of $191,922, $119,103 and $95,229 for the years ended December 31, 2015,
2014, and 2013 respectively. See Note 8 for further discussion.
|
|
See accompanying notes to consolidated financial statements.
|
F-5
|
CONSOLIDATED STATEMENTS OF CHANGES IN STOCKHOLDERS' EQUITY
|
||||||||||||||||||||
|
(dollars in thousands, except per share data)
|
||||||||||||||||||||
|
Common
Stock Par
Value
|
Additional
Paid-in Capital
|
Accumulated
Other
Comprehensive
Income
|
Accumulated Deficit
|
Total
|
||||||||||||||||
|
Balance, December 31, 2012
|
$ | 2,054 | $ | 3,612,768 | $ | 989,936 | $ | (1,062,279 | ) | $ | 3,542,479 | |||||||||
|
Net income (loss)
|
- | - | - | 362,686 | 362,686 | |||||||||||||||
|
Other comprehensive income (loss)
|
- | - | 867 | - | 867 | |||||||||||||||
|
Proceeds from restricted stock grants
|
1 | 690 | - | - | 691 | |||||||||||||||
|
Common dividends declared
|
- | - | - | (575,213 | ) | (575,213 | ) | |||||||||||||
|
Balance, December 31, 2013
|
$ | 2,055 | $ | 3,613,458 | $ | 990,803 | $ | (1,274,806 | ) | $ | 3,331,510 | |||||||||
|
Balance, December 31, 2013
|
$ | 2,055 | $ | 3,613,458 | $ | 990,803 | $ | (1,274,806 | ) | $ | 3,331,510 | |||||||||
|
Net income
|
- | - | - | 589,205 | 589,205 | |||||||||||||||
|
Other comprehensive income (loss)
|
- | - | 55,877 | - | 55,877 | |||||||||||||||
|
Proceeds from stock grants
|
0 | 953 | - | - | 953 | |||||||||||||||
|
Common dividends declared
|
- | - | - | (369,855 | ) | (369,855 | ) | |||||||||||||
|
Balance, December 31, 2014
|
$ | 2,055 | $ | 3,614,411 | $ | 1,046,680 | $ | (1,055,456 | ) | $ | 3,607,690 | |||||||||
|
Balance, December 31, 2014
|
$ | 2,055 | $ | 3,614,411 | $ | 1,046,680 | $ | (1,055,456 | ) | $ | 3,607,690 | |||||||||
|
Net income (loss)
|
- | - | - | 250,349 | 250,349 | |||||||||||||||
|
Cumulative effect of accounting change (1)
|
- | - | - | (12,137 | ) | (12,137 | ) | |||||||||||||
|
Other comprehensive income (loss)
|
- | - | (272,889 | ) | - | (272,889 | ) | |||||||||||||
|
Proceeds from restricted stock grants
|
2 | 1,977 | - | - | 1,979 | |||||||||||||||
|
Repurchase of common stock
|
(180 | ) | (249,820 | ) | - | - | (250,000 | ) | ||||||||||||
|
Common dividends declared
|
- | - | - | (378,804 | ) | (378,804 | ) | |||||||||||||
|
Balance, December 31, 2015
|
$ | 1,877 | $ | 3,366,568 | $ | 773,791 | $ | (1,196,048 | ) | $ | 2,946,188 | |||||||||
|
(1) Adoption of ASU No. 2014-13,
Measuring the Financial Assets and the Financial Liabilities of a Consolidated Collateralized Financing Entity
. See Note 2(p), Recent Accounting Pronouncements for further discussion.
|
|
See accompanying notes to consolidated financial statements.
|
F-6
|
CHIMERA INVESTMENT CORPORATION
|
||||||||||||
|
|
||||||||||||
|
(dollars in thousands)
|
||||||||||||
|
For the Year Ended
|
||||||||||||
|
December 31, 2015
|
December 31, 2014
|
December 31, 2013
|
||||||||||
|
Cash Flows From Operating Activities:
|
||||||||||||
|
Net income
|
$ | 250,349 | $ | 589,205 | $ | 362,686 | ||||||
|
Adjustments to reconcile net income to net cash provided by (used in) operating activities:
|
||||||||||||
|
(Accretion) amortization of investment discounts/premiums, net
|
3,813 | (72,569 | ) | (80,586 | ) | |||||||
|
Accretion (amortization) of deferred financing costs and
|
||||||||||||
|
securitized debt discounts/premiums, net
|
17,145 | 11,552 | 17,671 | |||||||||
|
Net unrealized losses (gains) on derivatives
|
(67,385 | ) | 103,496 | (34,369 | ) | |||||||
|
Net realized losses (gains) on option contracts settled
|
- | 1,246 | - | |||||||||
|
Proceeds (payments) for derivative sales and settlements
|
(13,495 | ) | (6,923 | ) | - | |||||||
|
Margin (paid) received on derivatives
|
82,671 | (186,462 | ) | - | ||||||||
|
Net unrealized losses (gains) on financial instruments at fair value
|
158,433 | (193,534 | ) | 44,277 | ||||||||
|
Net realized losses (gains) on sales of investments
|
(77,074 | ) | (91,709 | ) | (68,107 | ) | ||||||
|
(Gains) losses on deconsolidation
|
256 | (47,846 | ) | - | ||||||||
|
Net other-than-temporary credit impairment losses
|
67,444 | 63,992 | 45,167 | |||||||||
|
(Gain) loss on extinguishment of debt
|
5,930 | 2,184 | - | |||||||||
|
Provision for loan losses, net
|
- | (232 | ) | (1,799 | ) | |||||||
|
Equity-based compensation expense
|
1,979 | 956 | 691 | |||||||||
|
Changes in operating assets:
|
||||||||||||
|
Decrease (increase) in accrued interest receivable, net
|
4,852 | (37,570 | ) | 6,336 | ||||||||
|
Decrease (increase) in other assets
|
(42,738 | ) | 16,471 | (13 | ) | |||||||
|
Changes in operating liabilities:
|
||||||||||||
|
Increase (decrease) in accounts payable and other liabilities
|
8,935 | 608 | 691 | |||||||||
|
Increase (decrease) in investment management fees and expenses payable to affiliate
|
(10,357 | ) | 4,699 | (2,017 | ) | |||||||
|
Increase (decrease) in accrued interest payable, net
|
5,544 | 25,213 | (4,124 | ) | ||||||||
|
Net cash provided by (used in) operating activities
|
$ | 396,302 | $ | 182,777 | $ | 304,820 | ||||||
|
Cash Flows From Investing Activities:
|
||||||||||||
|
Agency RMBS portfolio:
|
||||||||||||
|
Purchases
|
$ | (6,590,731 | ) | $ | (8,860,042 | ) | $ | (2,068,870 | ) | |||
|
Sales
|
7,563,771 | 2,555,570 | 1,037,371 | |||||||||
|
Principal payments
|
1,061,193 | 512,202 | 479,650 | |||||||||
|
Non-Agency RMBS portfolio:
|
||||||||||||
|
Purchases
|
(850,750 | ) | (365,240 | ) | (317,299 | ) | ||||||
|
Sales
|
158,404 | 513,030 | 191,437 | |||||||||
|
Principal payments
|
385,988 | 323,900 | 475,127 | |||||||||
|
Securitized loans held for investment:
|
||||||||||||
|
Purchases
|
(281,811 | ) | - | - | ||||||||
|
Principal payments
|
699,118 | 316,372 | 507,683 | |||||||||
|
Acquisition of investments in consolidated VIEs
|
(109,872 | ) | (774,350 | ) | - | |||||||
|
Disposition of investments in consolidated VIEs
|
2,601 | - | - | |||||||||
|
Net cash provided by (used in) investing activities
|
$ | 2,037,911 | $ | (5,778,558 | ) | $ | 305,099 | |||||
|
Cash Flows From Financing Activities:
|
||||||||||||
|
Proceeds from repurchase agreements
|
$ | 41,644,280 | $ | 27,128,227 | $ | 7,879,361 | ||||||
|
Payments on repurchase agreements
|
(42,660,323 | ) | (20,331,406 | ) | (7,748,825 | ) | ||||||
|
Payments on repurchase of common stock
|
(250,000 | ) | - | - | ||||||||
|
Payment of deferred financing costs
|
- | - | - | |||||||||
|
Proceeds from securitized debt borrowings, collateralized by loans held for investment
|
1,483,301 | 43,981 | - | |||||||||
|
Payments on securitized debt borrowings, collateralized by loans held for investment
|
(2,138,623 | ) | (341,313 | ) | (499,549 | ) | ||||||
|
Payments on securitized debt borrowings, collateralized by Non-Agency RMBS
|
(182,217 | ) | (185,369 | ) | (414,690 | ) | ||||||
|
Repurchase of securitized debt borrowings, collateralized by Non-Agency RMBS
|
- | (56,072 | ) | - | ||||||||
|
Common dividends paid
|
(381,189 | ) | (575,276 | ) | (369,740 | ) | ||||||
|
Net cash provided by (used in) financing activities
|
$ | (2,484,771 | ) | $ | 5,682,772 | $ | (1,153,443 | ) | ||||
|
Net increase (decrease) in cash and cash equivalents
|
(50,558 | ) | 86,991 | (543,524 | ) | |||||||
|
Cash and cash equivalents at beginning of period
|
164,620 | 77,629 | 621,153 | |||||||||
|
Cash and cash equivalents at end of period
|
$ | 114,062 | $ | 164,620 | $ | 77,629 | ||||||
|
Supplemental disclosure of cash flow information:
|
||||||||||||
|
Interest received
|
$ | 881,403 | $ | 577,123 | $ | 437,533 | ||||||
|
Interest paid
|
$ | 236,676 | $ | 111,020 | $ | 88,455 | ||||||
|
Management fees and expenses paid
|
$ | 34,966 | $ | 27,815 | $ | 27,969 | ||||||
|
Non-cash investing activities:
|
||||||||||||
|
Receivable for investments sold
|
$ | - | $ | 1,572,056 | $ | 253,541 | ||||||
|
Payable for investments purchased
|
$ | (560,641 | ) | $ | (1,845,282 | ) | $ | - | ||||
|
Net change in unrealized gain (loss) on available-for sale securities
|
$ | (272,889 | ) | $ | 55,877 | $ | 867 | |||||
|
Acquisition of investments in consolidated VIEs
|
||||||||||||
|
Securitized loans held for investment, at fair value
|
$ | 295,225 | $ | 4,722,825 | $ | - | ||||||
|
Other assets
|
$ | - | $ | 84,830 | $ | - | ||||||
|
Securitized debt at fair value
|
$ | (185,353 | ) | $ | 4,033,304 | $ | - | |||||
|
Disposition of investments in consolidated VIEs
|
||||||||||||
|
Non-agency RMBS, at fair value
|
$ | 49,118 | $ | - | $ | - | ||||||
|
Securitized loans held for investment, at fair value
|
$ | (287,806 | ) | $ | - | $ | - | |||||
|
Securitized debt at fair value
|
$ | 236,087 | $ | - | $ | - | ||||||
|
Non-cash financing activities:
|
||||||||||||
|
Common dividends declared, not yet paid
|
$ | 90,097 | $ | 92,483 | $ | 297,904 | ||||||
|
See accompanying notes to consolidated financial statements.
|
||||||||||||
F-7
NOTES TO CONSOLIDATED FINANCIAL STATEMENTS
1. Organization
Chimera Investment Corporation (the “Company”) was organized in Maryland on June 1, 2007. The Company commenced operations on November 21, 2007 when it completed its initial public offering. The Company elected to be taxed as a real estate investment trust (“REIT”) under the Internal Revenue Code of 1986, as amended, and regulations promulgated thereunder (the “Code”).
The Company conducts its operations through various subsidiaries including subsidiaries it treats as taxable REIT subsidiaries (“TRS”). In general, a TRS may hold assets and engage in activities that the Company cannot hold or engage in directly and generally may engage in any real estate or non-real estate related business. The Company currently has six wholly owned direct subsidiaries: Chimera RMBS Whole Pool LLC, and Chimera RMBS LLC, both qualified REIT subsidiaries (“QRS”) formed in June 2009; CIM Trading Company LLC (“CIM Trading”), a TRS formed in July 2010; Chimera Funding TRS LLC, TRS formed in October 2013, Chimera CMBS Whole Pool LLC, a QRS formed in March 2015; and Chimera Insurance Company, LLC, a TRS formed in July 2015.
Until August 5, 2015, the Company was externally managed by Fixed Income Discount Advisory Company (“FIDAC” or “Manager”), a wholly-owned subsidiary of Annaly Capital Management, Inc. (“Annaly”), under the terms of a management agreement (“Management Agreement”). On August 5, 2015, the Company announced it had internalized its management and would continue to be led by its key professionals. In connection with the internalization, the Company and FIDAC agreed to terminate the Management Agreement, without the payment of a termination fee effective immediately. As part of the termination, the Company entered into a transition services agreement with FIDAC through the end of 2015 (the “Transition Services Agreement”).
In addition, during the third quarter of 2015, the Company purchased the 4.4% stake in the Company held by Annaly as a part of the new $250 million share repurchase program (“Repurchase Program”) authorized by the Company’s Board.
2. Summary of the Significant Accounting Policies
(a) Basis of Presentation and Consolidation
The accompanying consolidated financial statements and related notes of the Company have been prepared in accordance with accounting principles generally accepted in the United States ("GAAP"). In the opinion of management, all adjustments considered necessary for a fair presentation of the Company's financial position, results of operations and cash flows have been included. Certain prior year amounts have been reclassified to conform to the current year’s presentation. All per share amounts, common shares outstanding and restricted shares for the current period and all prior periods reflect the Company's 1-for-5 reverse stock split, which was effective April 6, 2015.
The consolidated financial statements include, on a consolidated basis, the Company’s accounts, the accounts of its wholly-owned subsidiaries, and variable interest entities (“VIEs”) in which the Company is the primary beneficiary. All intercompany balances and transactions have been eliminated in consolidation.
The Company uses securitization trusts considered to be VIEs in its securitization and re-securitization transactions. VIEs are defined as entities in which equity investors (i) do not have the characteristics of a controlling financial interest, or (ii) do not have sufficient equity at risk for the entity to finance its activities without additional subordinated financial support from other parties. The entity that consolidates a VIE is known as its primary beneficiary, and is generally the entity with (i) the power to direct the activities that most significantly impact the VIEs’ economic performance, and (ii) the right to receive benefits from the VIE or the obligation to absorb losses of the VIE that could be significant to the VIE. For VIEs that do not have substantial on-going activities, the power to direct the activities that most significantly impact the VIEs’ economic performance may be determined by an entity’s involvement with the design and structure of the VIE.
F-8
The trusts are structured as pass through entities that receive principal and interest on the underlying collateral and distribute those payments to the certificate holders. The assets held by the securitization entities are restricted in that they can only be used to fulfill the obligations of the securitization entity. The Company’s risks associated with its involvement with these VIEs are limited to its risks and rights as a certificate holder of the bonds it has retained. There have been no recent changes to the nature of risks associated with the Company’s involvement with VIEs.
Determining the primary beneficiary of a VIE requires significant judgment. The Company determined that for the securitizations it consolidates, its ownership of substantially all subordinate interests provides the Company with the obligation to absorb losses or the right to receive benefits from the VIE that could be significant to the VIE. In addition, the Company has the power to direct the activities of the VIEs that most significantly impact the VIEs’ economic performance (“power”) such as rights to direct servicer activity or the Company was determined to have power in connection with its involvement with the purpose and design of the VIE.
The Company’s interest in the assets held by these securitization vehicles, which are consolidated on the Company’s Statements of Financial Condition, is restricted by the structural provisions of these entities, and a recovery of the Company’s investment in the vehicles will be limited by each entity’s distribution provisions. The liabilities of the securitization vehicles, which are also consolidated on the Company’s Statements of Financial Condition, are non-recourse to the Company, and can generally only be satisfied from each securitization vehicle’s respective asset pool.
The securitization entities are comprised of senior classes of residential mortgage backed securities (“RMBS”) and residential mortgage loans. See Notes 3, 4 and 8 for further discussion of the characteristics of the securities and loans in the Company’s portfolio.
The Company’s Consolidated Statements of Financial Condition include both the Company’s direct assets and liabilities and the assets and liabilities of consolidated securitization vehicles. Assets of each consolidated VIE can only be used to satisfy the obligations of that VIE, and the liabilities of consolidated VIEs are non-recourse to the Company. The Company is not obligated to provide, nor does it intend to provide, any financial support to these consolidated securitization vehicles. The notes to the consolidated financial statements describe the Company’s assets and liabilities including the assets and liabilities of consolidated securitization vehicles. See Note 8 for additional information related to the Company’s investments in consolidated securitization vehicles.
(c) Cash and Cash Equivalents
Cash and cash equivalents include cash on hand and cash deposited overnight in money market funds, which are not bank deposits and are not insured or guaranteed by the Federal Deposit Insurance Corporation. There were no restrictions on cash and cash equivalents at December 31, 2015 and December 31, 2014.
(d) Agency and Non-Agency Mortgage-Backed Securities
The Company invests in mortgage backed securities (“MBS”) representing interests in obligations backed by pools of mortgage loans. The Company delineates between Agency MBS and Non-Agency MBS as follows: Agency MBS are mortgage pass-through certificates, collateralized mortgage obligations (“CMOs”), and other MBS representing interests in or obligations backed by pools of mortgage loans issued or guaranteed by agencies of the U.S. Government, such as Ginnie Mae, or federally chartered corporations such as Freddie Mac or Fannie Mae where principal and interest repayments are guaranteed by the respective agency of the U.S. Government or federally chartered corporation. Non-Agency MBS are not issued or guaranteed by a U.S. Government Agency or other institution and are subject to credit risk. Repayment of principal and interest on Non-Agency MBS is subject to the performance of the mortgage loans or MBS collateralizing the obligation.
F-9
The Company also invests in Interest Only Agency MBS strips and Non-Agency RMBS strips (“IO MBS strips”). IO MBS strips represent the Company’s right to receive a specified proportion of the contractual interest flows of the collateral. Interest income on IO MBS strips is accrued based on the outstanding notional balance and the security’s contractual terms, and amortization of any premium is calculated in accordance with the Financial Accounting Standards Board (“FASB”) Accounting Standards Codification (“ASC”) 325-40,
Beneficial Interests in Securitized Financial Assets
(“ASC 325-40”). The Company accounts for IO MBS strips at fair value with changes in fair value recognized in the Company’s Consolidated Statements of Operations and Comprehensive Income.
The Company classifies the majority of its MBS as available-for-sale and records investments at estimated fair value as described in Note 5 of these consolidated financial statements. The Company includes unrealized gains and losses considered to be temporary on all MBS in Other comprehensive income (“OCI”) in the Consolidated Statements of Operations and Comprehensive Income. For IO strips and certain other MBS investments, the Company carries these investments at fair value with changes in fair value included in earnings in the Consolidated Statements of Operations and Comprehensive Income. From time to time, as part of the overall management of its portfolio, the Company may sell any of its investments and recognize a realized gain or loss as a component of earnings in the Consolidated Statements of Operations and Comprehensive Income utilizing the average cost method.
The Company’s accounting policy for interest income and impairment related to its MBS is as follows:
Interest Income Recognition
The recognition of interest income on MBS securities varies depending on the characteristics of the security as follows:
Agency MBS and Non-Agency RMBS of High Credit Quality
FASB ASC 310-20,
Nonrefundable Fees and Other Costs
(“ASC 310-20”) is applied to the recognition of interest income for the following securities:
|
|
·
|
Agency MBS
|
|
|
·
|
Non-Agency RMBS that meet all of the following conditions at the acquisition date (referred to hereafter as “Non-Agency RMBS of High Credit Quality”):
|
|
|
1.
|
Rated AA or higher by a nationally recognized credit rating agency using the lowest rating available.
|
|
|
2.
|
The Company expects to collect all of the security’s contractual cash flows.
|
|
|
3.
|
The security cannot be contractually prepaid such that the Company would not recover substantially all of its recorded investment.
|
Under ASC 310-20, interest income, including premiums and discounts associated with the acquisition of these securities, is recognized over the life of such securities using the interest method based on the contractual cash flows of the security. In applying the interest method, the Company considers estimates of future principal prepayments in the calculation of the effective yield. Differences that arise between previously anticipated prepayments and actual prepayments received, as well as changes in future prepayment assumptions, result in a recalculation of the effective yield on the security on a quarterly basis. This recalculation results in the recognition of an adjustment to the carrying amount of the security based on the revised prepayment assumptions and a corresponding increase or decrease in reported interest income.
Non-Agency RMBS Not of High Credit Quality
Non-Agency RMBS purchased at a discount and not of high credit quality at the time of purchase are accounted for under ASC 310-30,
Loans and Debt Securities Acquired with Deteriorated Credit Quality
(“ASC 310-30”) or ASC 325-40 (referred to hereafter as “Non-Agency RMBS Not of High Credit Quality”).
F-10
Non-Agency RMBS are accounted for under ASC 310-30 if the following conditions are met as of the acquisition date:
|
|
1.
|
There is evidence of deterioration in credit quality of the security from its inception.
|
|
|
2.
|
It is probable that the Company will be unable to collect all contractual cash flows of the security.
|
Non-Agency RMBS that are not within the scope of ASC 310-30 are accounted for under ASC 325-40 if at the acquisition date:
|
|
1.
|
The security is not of high credit quality (defined as rated below AA or is unrated), or
|
|
|
2.
|
The security can contractually be prepaid or otherwise settled in such a way that the Company would not recover substantially all of its recorded investment.
|
Interest income on Non-Agency RMBS Not of High Credit Quality is recognized using the interest method based on management’s estimates of cash flows expected to be collected. The effective interest rate on these securities is based on management’s estimate for each security of the projected cash flows, which are estimated based on observation of current market information and include assumptions related to fluctuations in prepayment speeds and the timing and amount of credit losses. On a quarterly basis, the Company reviews and, if appropriate, makes adjustments to its cash flow projections based on inputs and analyses received from external sources, internal models, and the Company’s judgments about prepayment rates, the timing and amount of credit losses, and other factors. Changes in the amount or timing of cash flows from those originally projected, or from those estimated at the last evaluation date, are considered to be either positive changes or adverse changes. For securities accounted for under ASC 325-40, any positive or adverse change in cash flows that does not result in the recognition of an other-than-temporary impairment (“OTTI”) results in a prospective increase or decrease in the effective interest rate used to recognize interest income. For securities accounted for under ASC 310-30, only significant positive changes are reflected prospectively in the effective interest rate used to recognize interest income. Adverse changes in cash flows expected to be collected are generally treated consistently for Non-Agency RMBS accounted for under ASC 325-40 and ASC 310-30, and generally result in recognition of an OTTI with no change in the effective interest rate used to recognize interest income.
Impairment
Considerations Applicable to all MBS
When the fair value of an available-for-sale MBS is less than its amortized cost the security is considered impaired. On a quarterly basis the Company evaluates its securities for OTTI. If the Company intends to sell an impaired security, or it is more-likely-than-not that the Company will be required to sell an impaired security before its anticipated recovery, then the Company must recognize an OTTI through a charge to earnings equal to the entire difference between the investment’s amortized cost and its fair value at the measurement date. If the Company does not intend to sell an impaired security and it is not more-likely-than-not that it would be required to sell an impaired security before recovery, the Company must further evaluate the security for impairment due to credit losses. The credit component of OTTI is recognized in earnings and the remaining component is recorded as a component of OCI. Following the recognition of an OTTI through earnings, a new amortized cost basis is established for the security and subsequent recovery in fair value may not be adjusted through current earnings. Subsequent recoveries are amortized into income over the remaining life of the security as an adjustment to yield.
When evaluating whether the Company intends to sell an impaired security or will more-likely-than-not be required to sell an impaired security before recovery, the Company makes judgments that consider among other things, its liquidity, leverage, contractual obligations, and targeted investment strategy to determine its intent and ability to hold the investments that are deemed impaired. The determination as to whether an OTTI exists is subjective as such determinations are based on factual information available at the time of assessment as well as the Company’s estimates of future conditions. As a result, the determination of OTTI and its timing and amount is based on estimates that may change materially over time.
F-11
The Company’s estimate of the amount and timing of cash flows for its MBS is based on its review of the underlying securities or mortgage loans securing the MBS. The Company considers historical information available and expected future performance of the underlying securities or mortgage loans, including timing of expected future cash flows, prepayment rates, default rates, loss severities, delinquency rates, percentage of non-performing loans, extent of credit support available, Fair Isaac Corporation (“FICO”) scores at loan origination, year of origination, loan-to-value ratios, geographic concentrations, as well as reports by credit rating agencies, general market assessments and dialogue with market participants. As a result, substantial judgment is used in the Company’s analysis to determine the expected cash flows for its MBS.
Considerations Applicable to Non-Agency RMBS of High Credit Quality
The impairment assessment for Non-Agency RMBS of High Credit Quality involves comparing the present value of the remaining cash flows expected to be collected to the amortized cost of the security at the assessment date. The discount rate used to calculate the present value of the expected future cash flows is based on the security’s effective interest rate as calculated under ASC 310-20 (i.e., the discount rate implicit in the security as of the last measurement date). If the present value of the remaining cash flows expected to be collected is less than the amortized cost basis, an OTTI is recognized in earnings for the difference. This amount is considered to be the credit loss component; the remaining difference between amortized cost and the fair value of the security is considered to be the portion of loss recognized in other comprehensive income.
Considerations Applicable to Non-Agency RMBS Not of High Credit Quality
Non-Agency RMBS within the scope of ASC 325-40 or ASC 310-30 are considered other-than-temporarily impaired when the following two conditions exist: (1) the fair value is less than the amortized cost basis, and (2) there has been an adverse change in cash flows expected to be collected from the last measurement date (i.e. adverse changes in either the amount or timing of cash flows from those previously expected).
The OTTI is separated into a credit loss component that is recognized in earnings and the portion of loss recognized in other comprehensive income. The credit component is comprised of the impact of the fair value decline due to changes in assumptions related to default (collection) risk and prepayments. The portion of loss recognized in other comprehensive income comprises the change in fair value of the security due to all other factors, including changes in benchmark interest rates and market liquidity. In determining the OTTI related to credit losses for securities, the Company compares the present value of the remaining cash flows adjusted for prepayments expected to be collected at the current financial reporting date to the present value of the remaining cash flows expected to be collected at the original purchase date (or the last date those estimates were revised for accounting purposes). The discount rate used to calculate the present value of expected future cash flows is the effective interest rate used for income recognition purposes as determined under ASC 325-40 or ASC 310-30.
The determination of whether an OTTI exists and, if so, the extent of the credit component is subject to significant judgment and management’s estimates of both historical information available at the time of assessment, the current market environment, as well as the Company’s estimates of the future performance and projected amount and timing of cash flows expected to be collected on the security. As a result, the timing and amount of OTTI constitutes an accounting estimate that may change materially over time.
Investments for which the Company has elected the fair value option are not evaluated for OTTI as all changes in fair value are reflected in earnings.
(e) Securitized Loans Held for Investment
Prime residential mortgage loans:
A portion of the securitized loan portfolio is comprised of non-conforming, single family, owner occupied, jumbo, prime loans that are not guaranteed as to repayment of principal or interest. These securitized loans are serviced and may be modified, in the event of a default, by a third-party servicer. The Company generally has the ability to approve certain loan modifications and determine the course of action to be taken as it relates to certain loans in default, including whether or not to proceed with foreclosure. These mortgage loans are designated as held for investment. Interest income on loans held for investment is recognized over the expected life of the loans using the interest method with changes in yield reflected in earnings on a prospective basis. As of January 1, 2015, the securitized loan portfolio comprised of non-conforming, single family, owner occupied, jumbo, prime loans is carried at fair value with changes in fair value recorded in earnings. Prior to January 1, 2015, this loan portfolio was carried at amortized cost, net of the allowance for loan losses.
F-12
The allowance for loan losses as of December 31, 2014 was $7 million. As all loans are carried at fair value since the beginning of 2015, there is no longer an allowance for losses as of December 31, 2015. The allowance for loan losses consists of a general reserve and a specific reserve. The general reserve is based on historical loss rates for pools of loans with similar credit characteristics, adjusted for current trends and market conditions, including current trends in delinquencies and severities. The specific reserve reflects consideration of loans more than 60 days delinquent, loans in foreclosure and borrowers that have declared bankruptcy. The specific loan loss provision related to these loans is primarily the difference between the unpaid principal balance and the estimated fair value of the property securing the mortgage, less estimated costs to sell.
The Company estimates the fair value of securitized loans as described in Note 5 of these consolidated financial statements.
Seasoned sub-prime residential mortgage loans:
A portion of the securitized loan portfolio is comprised of seasoned sub-prime residential mortgage loans that are not guaranteed as to repayment of principal or interest. These securitized loans are serviced and may be modified, in the event of default, by a third-party servicer. The Company generally has the ability to approve certain loan modifications and determine the course of action to be taken as it relates to certain loans in default, including whether or not to proceed with foreclosure. These mortgage loans are designated as held for investment. Interest income on loans held for investment is recognized over the expected life of the loans using the interest method with changes in yield reflected in earnings on a prospective basis. The securitized loan portfolio comprised primarily of seasoned sub-prime residential mortgage loans is carried at fair value with changes in fair value recorded in earnings. As these loans are carried at fair value since their purchase, no allowance for loan losses is required.
The Company estimates the fair value of securitized loans as described in Note 5 of these consolidated financial statements.
All residential mortgage loans:
Interest is accrued on all securitized loans held for investment when due. Interest which is not received at the due date is written off when it becomes delinquent. Nonrefundable fees and costs related to acquiring the Company’s securitized residential mortgage loans are recognized as expenses in the Statement of operations and comprehensive income. Income recognition is suspended for loans when, based on information from the servicer, a full recovery of interest or principal becomes doubtful.
Real estate owned (“REO”) represents properties which the Company has received the legal title of the property to satisfy the outstanding loan. REO is re-categorized from loan to REO when the Company takes legal title of the property. REO assets are measured and reported at the estimated fair value less the estimated cost to sell at the end of each reporting period. At the time the asset is re-categorized, any difference between the previously recorded loan balance and the carrying value of the REO at the time the Company takes legal title of the property, is recognized as a loss. The Company recognized a loss of $8 million for the year ended December 31, 2015 related to REO which is presented in Net unrealized gains (losses) on financial instruments at fair value on the Consolidated Statement of Operations and Comprehensive Income. All REO assets of the Company are held-for-sale and it is the Company’s intention to sell the property in the shortest time possible to maximize their return and recovery on the previously recorded loan. The carrying value of REO assets at December 31, 2015 and December 31, 2014 was $18 million and $8 million, respectively, and were recorded in Other Assets on the Company’s consolidated statements of financial condition.
F-13
(f) Repurchase Agreements
The Company finances the acquisition of a significant portion of its mortgage-backed securities with repurchase agreements. The Company has evaluated each agreement and has determined that each of the repurchase agreements be accounted for as secured borrowings.
(g) Securitized Debt, collateralized by Non-Agency RMBS and Securitized Debt, collateralized by loans held for investment
Certain re-securitization transactions classified as Securitized Debt, collateralized by Non-Agency RMBS reflect the transfer to a trust of fixed or adjustable rate MBS which are classified as Non-Agency RMBS that pay interest and principal to the debt holders of that re-securitization. Re-securitization transactions completed by the Company that did not qualify as sales are accounted for as secured borrowings. The associated securitized debt is carried at amortized cost, net of any unamortized premiums or discounts.
Certain transactions involving residential mortgage loans are accounted for as secured borrowings, and are recorded as Securitized loans held for investment and the corresponding debt as Securitized debt, collateralized by loans held for investment in the Consolidated Statements of Financial Condition. These securitizations are collateralized by residential adjustable or fixed rate mortgage loans that have been placed in a trust and pay interest and principal to the debt holders of that securitization. As of January 1, 2015, securitized debt, collateralized by loans held for investment, is carried at fair value. Prior to January 1, 2015, securitized debt, collateralized by loans held for investment, was carried at amortized cost.
The Company recognizes interest expense on securitized debt over the expected life of the debt using the interest method with changes in yield reflected in earnings on a prospective basis. Fees associated with the debt issuance of jumbo prime residential mortgage loans are also amortized using the interest method. Unamortized fees associated with debt issuance are included in other assets.
The Company estimates the fair value of its securitized debt as described in Note 5 to these consolidated financial statements.
(h) Fair Value
Interest-Only MBS:
The Company accounts for the IO MBS strips at fair value with changes in fair value reported in earnings. The IO MBS strips are included in MBS, at fair value, on the accompanying Consolidated Statements of Financial Condition.
Included in Non-Agency RMBS, at fair value on the Consolidated Statements of Financial Condition are IO MBS strips carried at fair value with changes in fair value reflected in earnings of $245 million and $214 million as of December 31, 2015 and December 31, 2014. Included in Agency MBS, at fair value on the Consolidated Statements of Financial Condition are IO MBS strips carried at fair value with changes in fair value reflected in earnings of $273 million and $186 million as of December 31, 2015 and December 31, 2014. Interest income reported on all IO securities was $49 million and $30 million for the years ended December 31, 2015 and 2014, respectively.
Non-Agency RMBS:
The Company has elected the fair value option for certain interests in MBS which we refer to as the overcollateralization class of the MBS pass through structure. The cash flows for these holdings are generally subordinate to all other interests of the trusts and generally only pay out funds when certain ratios are met and excess cash holdings, as determined by the trustee, are available for distribution to the overcollateralization class. Many of the investments in this group have no current cash flows and may not ever pay cash flows, depending on the loss experience of the collateral group supporting the investment. Estimating future cash flows for this group of MBS investments is highly judgmental and uncertain; therefore, the Company has elected to carry these holdings at fair value with changes in fair value reflected in earnings.
F-14
Changes in fair value are presented in Net unrealized gains (losses) on financial instruments at fair value on the Consolidated Statement of Operations and Comprehensive Income. The fair value of the Non-Agency RMBS carried at fair value with changes in fair value reflected in earnings is $20 million as of December 31, 2015. There were no Non-Agency RMBS carried at fair value with changes in fair value reflected in earnings as of December 31, 2014.
Securitized Loans Held for Investment:
Upon the adoption of ASU 2014-13,
Measuring the Financial Assets and the Financial Liabilities of a Consolidated Collateralized Financing Entity
on January 1, 2015, the Company’s securitized loans held for investment comprised primarily of non-conforming, single family, owner occupied, jumbo, prime loans were carried at fair value. Therefore, as of January 1, 2015, all securitized loans held for investment are carried at fair value with changes in fair value reflected in earnings. The Company carries securitized loans held for investment at fair value as it may resecuritize these loans in the future. Additionally, the fair value option allows both the loans and related financing to be consistently reported at fair value and to achieve operational and valuation simplifications.
Changes in fair value of securitized loans held for investment are presented in Net unrealized gains (losses) on financial instruments at fair value on the Consolidated Statement of Operations and Comprehensive Income.
As of December 31, 2014, $626 million of securitized loans held for investment comprised primarily of non-conforming, single family, owner occupied, jumbo, prime loans were carried at amortized cost, net of an allowance for loan losses.
Securitized Debt, Collateralized by Loans Held for Investment:
As of January 1, 2015, the Company has elected the fair value option for all of the Company’s securitized debt, collateralized by loans held for investment. The Company has elected fair value option for these financings as it may call or restructure these debt financings in the future. Additionally, the fair value option allows both the loans and related financing to be consistently reported at fair value and to achieve operational and valuation simplifications.
As of December 31, 2014, $522 million of securitized debt collateralized primarily by non-conforming, single family, owner occupied, jumbo, prime loans were carried at amortized cost. Upon the adoption of ASU 2014-13 on January 1, 2015, the securitized debt collateralized primarily by non-conforming, single family, owner occupied, jumbo, prime loans were carried at fair value.
Changes in fair value of securitized loans held for investment are presented in Net unrealized gains (losses) on financial instruments at fair value on the Consolidated Statement of Operations and Comprehensive Income.
(i) Derivative Financial Instruments
The Company’s investment policies permit it to enter into derivative contracts, including interest rate swaps, swaptions, mortgage options, futures, and interest rate caps to manage its interest rate risk and, from time to time, enhance investment returns. The Company’s derivatives are recorded as either assets or liabilities in the Consolidated Statements of Financial Condition and measured at fair value. These derivative financial instrument contracts are not designated as hedges for GAAP; therefore, all changes in fair value are recognized in earnings. The Company estimates the fair value of its derivative instruments as described in Note 5 of these consolidated financial statements. Net payments on derivative instruments are included in the Consolidated Statements of Cash Flows as a component of net income. Unrealized gains (losses) on derivatives are removed from net income to arrive at cash flows from operating activities.
The Company elects to net the fair value of its derivative contracts by counterparty when appropriate. These contracts contain legally enforceable provisions that allow for netting or setting off of all individual derivative receivables and payables with each counterparty and therefore, the fair value of those derivative contracts are reported net by counterparty. The credit support annex provisions of the Company’s derivative contracts allow the parties to mitigate their credit risk by requiring the party which is in a net payable position to post collateral. As the Company elects to net by counterparty the fair value of derivative contracts, it also nets by counterparty any cash collateral exchanged as part of the derivative. Refer to Note 9 Derivative Instruments for further details.
F-15
(j) Fair Value Disclosure
A complete discussion of the methodology utilized by the Company to estimate the fair value of its financial instruments is included in Note 5 to these consolidated financial statements.
(k) Sales, Securitizations, and Re-Securitizations
The Company periodically enters into transactions in which it sells financial assets, such as MBS, and mortgage loans. Gains and losses on sales of assets are calculated using the average cost method whereby the Company records a gain or loss on the difference between the average amortized cost of the asset and the proceeds from the sale. In addition, the Company from time to time securitizes or re-securitizes assets and sells tranches in the newly securitized assets. These transactions may be recorded as either sales and the assets contributed to the securitization are removed from the Consolidated Statements of Financial Condition and a gain or loss is recognized, or as secured borrowings whereby the assets contributed to the securitization are not derecognized but rather the debt issued by the securitization entity are recorded to reflect the term financing of the assets. In these securitizations and re-securitizations, the Company may retain senior or subordinated interests in the securitized or re-securitized assets. In transfers that are considered secured borrowings, no gain or loss is recognized. Any difference in the proceeds received and the carrying value of the transferred asset is recorded as a premium or discount and amortized into earnings as an adjustment to yield.
(l) Income Taxes
The Company has elected to be taxed as a REIT and intends to comply with the provision of the Code, with respect thereto. Accordingly, the Company will not be subject to federal, state or local income taxes to the extent that qualifying distributions are made to stockholders and as long as certain asset, income, distribution and stock ownership tests are met. If the Company failed to qualify as a REIT and did not qualify for certain statutory relief provisions, the Company would be subject to federal, state and local income taxes and may be precluded from qualifying as a REIT for the subsequent four taxable years following the year in which the REIT qualification was lost. The Company, CIM Trading and CIM Funding TRS made joint elections to treat CIM Trading and CIM Funding TRS as TRS’s. As such, CIM Trading and CIM Funding TRS are taxable as domestic C corporations and subject to federal, state, and local income taxes based upon their respective taxable income.
A tax position is recognized only when, based on management’s judgment regarding the application of income tax laws, it is more likely than not that the tax position will be sustained upon examination. The Company does not have any unrecognized tax positions that would affect its financial statements or require disclosure. No accruals for penalties and interest were necessary as of December 31, 2015 or 2014.
(m) Net Income per Share
The Company calculates basic net income per share by dividing net income for the period by the basic weighted-average shares of its common stock outstanding for that period. Diluted net income per share takes into account the effect of dilutive instruments such as unvested restricted stock. All per share amounts, common shares outstanding and restricted shares for the year ended December 31, 2015 and all prior periods reflect the Company's 1-for-5 reverse stock split, which was effective April 6, 2015.
(n) Stock-Based Compensation
Until August 5, 2015 the Company accounted for stock-based compensation awards granted to the employees of FIDAC and FIDAC’s affiliates at the fair value of the stock-based compensation provided. The Company measured the fair value of the equity instrument using the stock prices and other measurement assumptions as of the earlier of either the date at which a performance commitment by the recipient is reached or the date at which the recipient’s performance is complete. Stock compensation expense related to the grants of stock was recognized over the vesting period of such grants based on the fair value of the stock on each vesting date at which the recipient’s performance is complete.
F-16
Compensation expense for equity based awards granted to the Company’s independent directors and stock based compensation awards granted to employees of the Company beginning on August 5, 2015, is recognized pro-rata over the vesting period of such awards, based upon the fair value of such awards at the grant date.
(o) Use of Estimates
The preparation of financial statements in conformity with GAAP requires management to make estimates and assumptions that affect the reported amounts of assets and liabilities and disclosure of contingent assets and liabilities at the date of the financial statements and the reported amounts of revenues and expenses during the reporting period. Although the Company’s estimates contemplate current conditions and how it expects them to change in the future, it is reasonably possible that actual conditions could be materially different than anticipated in those estimates, which could have a material adverse impact on the Company’s results of operations and its financial condition. Management has made significant estimates in accounting for income recognition and OTTI on Agency and Non-Agency RMBS and IO MBS (Note 3), valuation of Agency MBS and Non-Agency RMBS (Notes 3 and 5), residential mortgage loans (Note 4), securitized debt (Note 7) and derivative instruments (Notes 5 and 9). Actual results could differ materially from those estimates.
(p) Recent Accounting Pronouncements
Financial Instruments—Overall (Subtopic 825-10)
In January 2016, the FASB issued ASU No. 2016-01,
Recognition and Measurement of Financial Assets and Financial Liabilities
. This update changes how the Company will present changes in the fair value of financial liabilities measured under the fair value option that are attributable to our own credit. Under the updated guidance, the Company will record changes in instrument-specific credit risk for financial liabilities measured under the fair value option in other comprehensive income. The update also requires fair value measurement for equity investments that do not result in consolidation and are not accounted for under the equity method
to be measured at fair value with any changes in fair value recognized in net income. The update also eliminates the requirement to disclose the methods and significant assumptions used to estimate the fair value of financial instruments measured at amortized cost. In addition, the Company will have to use the exit price notion when measuring the fair value of financial instruments measured at amortized cost for disclosure purposes. The guidance in the ASU is effective for the Company as of January 1, 2018. Early adoption for certain provisions of the update is allowed. Any adjustment as a result of the adoption of this standard will be recorded as a cumulative-effect adjustment to beginning retained earnings as of the first period in which the guidance is adopted. The Company is currently evaluating what impact this update will have on the consolidated financial statements.
Interest—Imputation of Interest (Subtopic 835-30)
In April 2015, the FASB issued ASU No. 2015-03,
Simplifying the Presentation of Debt Issue Costs
. This update changes the presentation of debt issuance costs in financial statements. Under the ASU, an entity presents such costs in the balance sheet as a direct deduction from the related debt liability rather than as an asset. Amortization of the costs is reported as interest expense. The guidance in the ASU is effective for the Company as of January 1, 2016. Early adoption is allowed. The guidance would be applied retrospectively to all prior periods. As the unamortized debt issuance costs are not significant, the guidance in this ASU will not have a significant impact on the consolidated financial statements.
Consolidations (Subtopic 810)
In February 2015, the FASB issued ASU No. 2015-02,
Amendments to the Consolidation Analysis
. This update affects the following areas of the consolidation analysis: limited partnerships and similar entities, evaluation of fees paid to a decision maker or service provider as a variable interest and in determination of the primary beneficiary, effect of related parties on the primary beneficiary determination and for certain investment funds. The guidance in this ASU did not change the consolidation conclusion for any of our interests in VIEs and, therefore, will not significantly impact the consolidated financial statements.
F-17
Presentation of Financial Statements—Going Concern (Subtopic 205-40)
In August 2014, the FASB issued ASU No. 2014-15,
Disclosure of Uncertainties about an Entity’s Ability to Continue as a Going Concern
. This update provides guidance on determining when and how to disclose going-concern uncertainties in the financial statements. The new standard requires the Company to perform interim and annual assessments of its ability to continue as a going concern within one year of the date the financial statements are issued. The Company must provide certain disclosures if conditions or events raise substantial doubt about its ability to continue as a going concern. The ASU applies to all entities and is effective for the Company beginning January 1, 2017. Early adoption is permitted. The Company does not expect this update to have any impact as we do not expect to have the conditions or events which would raise substantial doubt about the Company’s ability to continue as a going concern.
Consolidations (Subtopic 810)
In August 2014, the FASB issued ASU No. 2014-13,
Measuring the Financial Assets and the Financial Liabilities of a Consolidated Collateralized Financing Entity
. This update provides a measurement alternative for consolidated qualifying collateralized financing entities (CFEs). The update defines a CFE as a variable interest entity that holds financial assets, issues beneficial interests in those assets and has no more than nominal equity. The beneficial interests have contractual recourse only to the related assets of the CFE and are classified as financial liabilities. Under the alternative, the Company may elect to measure both the CFE’s financial assets and financial liabilities using the fair value of either the CFE’s financial assets or financial liabilities, whichever is more observable. The guidance is aimed at eliminating the measurement difference that sometimes arises when a CFE’s financial assets and financial liabilities are independently measured at fair value, as required by ASC 820. The Company adopted the guidance in this standard beginning January 1, 2015.
Upon adoption of this guidance, the Company elected the fair value option for certain consolidated VIEs holding securitized loans held for investment and the related securitized debt which qualified as CFEs. As the fair value of the securitized debt of these CFEs is more observable, the fair value of the securitized loans will be based on the fair value of the securitized debt. The adoption of this update resulted in a net reduction in equity of $12 million as of January 1, 2015. A complete discussion of the methodology utilized by the Company to estimate the fair value of its financial instruments impacted by this standard is included in Note 5 to these consolidated financial statements.
The following table summarized the adjustments made to the Company's consolidated assets, liabilities and equity as of January 1, 2015:
|
Effect of accounting standard
|
||||||||||||||||
|
Balance
|
Reclass to fair value
|
Fair value
adjustment
|
Total
|
|||||||||||||
|
Assets:
|
(dollars in thousands) | |||||||||||||||
|
Securitized loans held for investment, net of allowance for loan losses
|
$ | 626,112 | $ | (626,112 | ) | $ | - | $ | - | |||||||
|
Securitized loans held for investment, at fair value
|
4,699,215 | 626,112 | (19,283 | ) | 5,306,501 | |||||||||||
|
Total Securitized loans held for investment
|
$ | 5,325,327 | $ | - | $ | (19,283 | ) | $ | 5,306,501 | |||||||
|
Liabilities:
|
||||||||||||||||
|
Securitized debt, collateralized by loans held for investment
|
$ | 521,997 | $ | (521,997 | ) | $ | - | $ | - | |||||||
|
Securitized debt at fair value, collateralized by loans held for investment
|
3,868,366 | 521,997 | (7,146 | ) | 4,383,217 | |||||||||||
|
Total Securitized debt
|
$ | 4,390,363 | $ | - | $ | (7,146 | ) | $ | 4,383,217 | |||||||
|
Total effect of accounting standard on retained earnings
|
$ | (12,137 | ) | |||||||||||||
Transfers and Servicing (Subtopic 860)
In June 2014, the FASB issued ASU No. 2014-11,
Repurchase-to-Maturity Transactions, Repurchase Financings, and Disclosures
. This update makes limited amendments to the guidance in ASC 860 on accounting for certain repurchase agreements. The ASU requires entities to account for repurchase-to-maturity transactions as secured borrowings, rather than as sales with forward repurchase agreements. The ASU defines a repurchase-to-maturity transaction as a repo that (1) settles at the maturity of the transferred financial asset and (2) does not require the transferor to reacquire the transferred financial asset. In addition, the ASU eliminates accounting guidance on linked repurchase financing transactions. The ASU also expands disclosure requirements related to certain transfers of financial assets that are accounted for as sales and certain transfers accounted for as secured borrowings. The guidance in this update was effective for the Company beginning January 1, 2015, except for the disclosure requirements for transactions accounted for as secured borrowings, which are required to be presented by the Company in the third quarter of 2015. The adoption of this standard did not have any impact on the consolidated financial statements of the Company.
F-18
Receivables—Troubled Debt Restructurings by Creditors (Subtopic 310-40)
In January 2014, the FASB issued ASU No. 2014-04,
Reclassification of Residential Real Estate Collateralized Consumer Mortgage Loans Upon Foreclosure
. This update clarifies when the Company is considered to have obtained physical possession, from an in-substance possession or foreclosure, of a residential real estate property collateralizing a mortgage loan. Current guidance indicates that the Company should reclassify a collateralized mortgage loan such that the loan should be derecognized and the collateral asset recognized when it determines that there has been an in-substance repossession or foreclosure by the Company. This update defines the term
in substance repossession or foreclosure
to reduce diversity in interpretation of when such an event occurs. The guidance in this update was effective for the Company beginning January 1, 2015 and did not have a significant impact on the consolidated financial statements of the Company.
3. Mortgage-Backed Securities
The Company classifies its Non-Agency RMBS as senior, senior IO, subordinated, or subordinated IO. The Company also invests in residential and commercial Agency MBS. Senior interests in Non-Agency RMBS are considered to be entitled to the first principal repayments in their pro-rata ownership interests at the acquisition date.
|
December 31, 2015
|
||||||||||||||||||||||||||||||||
|
(dollars in thousands)
|
||||||||||||||||||||||||||||||||
|
Principal or
Notional Value
|
Total Premium
|
Total Discount
|
Amortized Cost
|
Fair Value
|
Gross Unrealized
Gains
|
Gross
Unrealized
Losses
|
Net Unrealized
Gain/(Loss)
|
|||||||||||||||||||||||||
|
Non-Agency RMBS
|
||||||||||||||||||||||||||||||||
|
Senior
|
$ | 3,651,869 | $ | 309 | $ | (1,553,317 | ) | $ | 2,098,860 | $ | 2,826,121 | $ | 736,040 | $ | (8,779 | ) | $ | 727,261 | ||||||||||||||
|
Senior, interest-only
|
5,426,029 | 268,515 | - | 268,515 | 234,171 | 18,113 | (52,457 | ) | (34,344 | ) | ||||||||||||||||||||||
|
Subordinated
|
762,466 | 23,635 | (258,128 | ) | 527,975 | 604,295 | 83,896 | (7,577 | ) | 76,319 | ||||||||||||||||||||||
|
Subordinated, interest-only
|
284,931 | 15,226 | - | 15,226 | 11,254 | 62 | (4,035 | ) | (3,973 | ) | ||||||||||||||||||||||
|
Agency MBS
|
||||||||||||||||||||||||||||||||
|
Residential
|
5,045,418 | 255,837 | - | 5,301,255 | 5,267,848 | 18,593 | (52,001 | ) | (33,408 | ) | ||||||||||||||||||||||
|
Commercial
|
952,091 | 24,815 | (3,170 | ) | 973,736 | 973,787 | 8,052 | (8,001 | ) | 51 | ||||||||||||||||||||||
|
Interest-only
|
6,722,472 | 280,073 | - | 280,073 | 273,189 | 2,756 | (9,640 | ) | (6,884 | ) | ||||||||||||||||||||||
| $ | 22,845,276 | $ | 868,410 | $ | (1,814,615 | ) | $ | 9,465,640 | $ | 10,190,665 | $ | 867,512 | $ | (142,490 | ) | $ | 725,022 | |||||||||||||||
|
December 31, 2014
|
||||||||||||||||||||||||||||||||
|
(dollars in thousands)
|
||||||||||||||||||||||||||||||||
|
Principal or
Notional Value
|
Total Premium
|
Total Discount
|
Amortized Cost
|
Fair Value
|
Gross Unrealized
Gains
|
Gross
Unrealized
Losses
|
Net Unrealized
Gain/(Loss)
|
|||||||||||||||||||||||||
|
Non-Agency RMBS
|
||||||||||||||||||||||||||||||||
|
Senior
|
$ | 3,435,362 | $ | - | $ | (1,542,907 | ) | $ | 1,892,455 | $ | 2,735,780 | $ | 843,680 | $ | (355 | ) | $ | 843,325 | ||||||||||||||
|
Senior, interest-only
|
5,221,937 | 227,305 | - | 227,305 | 207,216 | 17,378 | (37,467 | ) | (20,089 | ) | ||||||||||||||||||||||
|
Subordinated
|
690,599 | - | (344,033 | ) | 346,566 | 454,348 | 108,091 | (309 | ) | 107,782 | ||||||||||||||||||||||
|
Subordinated, interest-only
|
216,403 | 9,577 | - | 9,577 | 6,805 | 194 | (2,966 | ) | (2,772 | ) | ||||||||||||||||||||||
|
Agency MBS
|
||||||||||||||||||||||||||||||||
|
Residential
|
7,774,266 | 387,174 | (1,624 | ) | 8,159,816 | 8,255,419 | 108,802 | (13,199 | ) | 95,603 | ||||||||||||||||||||||
|
Interest-only
|
3,884,523 | 189,797 | - | 189,797 | 186,103 | 1,326 | (5,020 | ) | (3,694 | ) | ||||||||||||||||||||||
| $ | 21,223,090 | $ | 813,853 | $ | (1,888,564 | ) | $ | 10,825,516 | $ | 11,845,671 | $ | 1,079,471 | $ | (59,316 | ) | $ | 1,020,155 | |||||||||||||||
The table below presents changes in Accretable Yield, or the excess of the security’s cash flows expected to be collected over the Company’s investment, solely as it pertains to the Company’s Non-Agency RMBS portfolio accounted for according to the provisions of ASC 310-30.
F-19
|
For the Year Ended
|
||||||||
|
December 31, 2015
|
December 31, 2014
|
|||||||
| (dollars in thousands) | ||||||||
|
Balance at beginning of period
|
$ | 1,534,497 | $ | 1,794,577 | ||||
|
Purchases
|
277,922 | 110,694 | ||||||
|
Accretion
|
(249,898 | ) | (294,395 | ) | ||||
|
Reclassification (to) from non-accretable difference
|
238,348 | 123,181 | ||||||
|
Sales and deconsolidation
|
(58,125 | ) | (199,560 | ) | ||||
|
Balance at end of period
|
$ | 1,742,744 | $ | 1,534,497 | ||||
The table below presents the outstanding principal balance and related amortized cost at December 31, 2015 and December 31, 2014 as it pertains to the Company’s Non-Agency RMBS portfolio accounted for according to the provisions of ASC 310-30.
|
For the Year Ended
|
For the Year Ended
|
|||||||
|
December 31, 2015
|
December 31, 2014
|
|||||||
|
(dollars in thousands)
|
||||||||
|
Outstanding principal balance:
|
||||||||
|
Beginning of period
|
$ | 3,325,335 | $ | 3,949,664 | ||||
|
End of period
|
$ | 3,550,698 | $ | 3,325,335 | ||||
|
Amortized cost:
|
||||||||
|
Beginning of period
|
$ | 1,741,780 | $ | 2,027,738 | ||||
|
End of period
|
$ | 1,958,726 | $ | 1,741,780 | ||||
The following tables present the gross unrealized losses and estimated fair value of the Company’s RMBS by length of time that such securities have been in a continuous unrealized loss position at December 31, 2015 and December 31, 2014. All securities in an unrealized loss position have been evaluated by the Company for OTTI as discussed in Note 2(d).
|
December 31, 2015
|
||||||||||||||||||||||||||||||||||||
|
(dollars in thousands)
|
||||||||||||||||||||||||||||||||||||
|
Unrealized Loss Position for Less than 12 Months
|
Unrealized Loss Position for 12 Months or More
|
Total
|
||||||||||||||||||||||||||||||||||
|
Estimated Fair Value
|
Unrealized Losses
|
Number of
Securities
|
Estimated Fair Value
|
Unrealized Losses
|
Number of
Securities
|
Estimated Fair
Value
|
Unrealized Losses
|
Number of
Securities
|
||||||||||||||||||||||||||||
|
Non-Agency RMBS
|
||||||||||||||||||||||||||||||||||||
|
Senior
|
$ | 294,520 | $ | (8,779 | ) | 20 | $ | - | $ | - | - | $ | 294,520 | $ | (8,779 | ) | 20 | |||||||||||||||||||
|
Senior, interest-only
|
$ | 81,919 | $ | (18,715 | ) | 83 | 64,058 | (33,742 | ) | 47 | 145,977 | (52,457 | ) | 130 | ||||||||||||||||||||||
|
Subordinated
|
$ | 138,257 | $ | (7,577 | ) | 22 | - | - | - | 138,257 | (7,577 | ) | 22 | |||||||||||||||||||||||
|
Subordinated, interest-only
|
$ | 6,455 | $ | (1,039 | ) | 1 | 3,635 | (2,996 | ) | 2 | 10,090 | (4,035 | ) | 3 | ||||||||||||||||||||||
|
Agency MBS
|
||||||||||||||||||||||||||||||||||||
|
Residential
|
$ | 4,468,717 | $ | (44,687 | ) | 116 | 290,926 | (7,314 | ) | 4 | 4,759,643 | (52,001 | ) | 120 | ||||||||||||||||||||||
|
Commercial
|
$ | 393,058 | $ | (7,969 | ) | 140 | 4,986 | (32 | ) | 4 | 398,044 | (8,001 | ) | 144 | ||||||||||||||||||||||
|
Interest-only
|
$ | 94,969 | $ | (3,457 | ) | 24 | 39,707 | (6,183 | ) | 7 | 134,676 | (9,640 | ) | 31 | ||||||||||||||||||||||
|
Total
|
$ | 5,477,895 | $ | (92,223 | ) | 406 | $ | 403,312 | $ | (50,267 | ) | 64 | $ | 5,881,207 | $ | (142,490 | ) | 470 | ||||||||||||||||||
|
December 31, 2014
|
||||||||||||||||||||||||||||||||||||
|
(dollars in thousands)
|
||||||||||||||||||||||||||||||||||||
|
Unrealized Loss Position for Less than 12 Months
|
Unrealized Loss Position for 12 Months or More
|
Total
|
||||||||||||||||||||||||||||||||||
|
Estimated Fair Value
|
Unrealized Losses
|
Number of
Securities
|
Estimated Fair Value
|
Unrealized Losses
|
Number of
Securities
|
Estimated Fair
Value
|
Unrealized Losses
|
Number of
Securities
|
||||||||||||||||||||||||||||
|
Non-Agency RMBS
|
||||||||||||||||||||||||||||||||||||
|
Senior
|
$ | 29,789 | $ | (355 | ) | 3 | $ | - | $ | - | - | $ | 29,789 | $ | (355 | ) | 3 | |||||||||||||||||||
|
Senior, interest-only
|
23,479 | (3,066 | ) | 24 | 96,754 | (34,401 | ) | 53 | 120,233 | (37,467 | ) | 77 | ||||||||||||||||||||||||
|
Subordinated
|
19,380 | (7 | ) | 2 | 11,605 | (302 | ) | 4 | 30,985 | (309 | ) | 6 | ||||||||||||||||||||||||
|
Subordinated, interest-only
|
4,373 | (2,709 | ) | 2 | 1,074 | (257 | ) | 2 | 5,447 | (2,966 | ) | 4 | ||||||||||||||||||||||||
|
Agency MBS
|
||||||||||||||||||||||||||||||||||||
|
Residential
|
219,808 | (198 | ) | 7 | 701,442 | (13,001 | ) | 11 | 921,250 | (13,199 | ) | 18 | ||||||||||||||||||||||||
|
Interest-only
|
112,014 | (3,616 | ) | 12 | 10,467 | (1,404 | ) | 3 | 122,481 | (5,020 | ) | 15 | ||||||||||||||||||||||||
|
Total
|
$ | 408,843 | $ | (9,951 | ) | 50 | $ | 821,342 | $ | (49,365 | ) | 73 | $ | 1,230,185 | $ | (59,316 | ) | 123 | ||||||||||||||||||
At December 31, 2015, the Company did not intend to sell any of its RMBS that were in an unrealized loss position, and it was not more likely than not that the Company would be required to sell these RMBS before recovery of their amortized cost basis, which may be at their maturity. With respect to RMBS held by consolidated VIEs, the ability of any entity to cause the sale by the VIE prior to the maturity of these RMBS is either expressly prohibited, not probable, or is limited to specified events of default, none of which have occurred as of December 31, 2015.
F-20
Gross unrealized losses on the Company’s Agency pass-through and Commercial Agency MBS were $60 million and $13 million as of December 31, 2015 and December 31, 2014, respectively. Given the inherent credit quality of Agency MBS, the Company does not consider any of the current impairments on its Agency pass-through MBS to be credit related. In evaluating whether it is more likely than not that it will be required to sell any impaired security before its anticipated recovery, which may be at their maturity, the Company considers the significance of each investment, the amount of impairment, the projected future performance of such impaired securities, as well as the Company’s current and anticipated leverage capacity and liquidity position. Based on these analyses, the Company determined that at December 31, 2015 and December 31, 2014, unrealized losses on its Agency MBS were temporary.
Gross unrealized losses on the Company’s Non-Agency RMBS (excluding Non-Agency RMBS IO strips which are reported at fair value with changes in fair value recorded in earnings) were $16 million and $1 million at December 31, 2015 and December 31, 2014, respectively. Based upon the most recent evaluation, the Company does not consider these unrealized losses to be indicative of OTTI and does not believe that these unrealized losses are credit related, but rather are due to other factors. The Company has reviewed its Non-Agency RMBS that are in an unrealized loss position to identify those securities with losses that are other-than-temporary based on an assessment of changes in cash flows expected to be collected for such RMBS, which considers recent bond performance and expected future performance of the underlying collateral.
A summary of the OTTI included in earnings for the years ended December 31, 2015, 2014 and 2013 is presented below.
|
For the Year Ended
|
||||||||||||
|
December 31, 2015
|
December 31, 2014
|
December 31, 2013
|
||||||||||
| (dollars in thousands) | ||||||||||||
|
Total other-than-temporary impairment losses
|
$ | (8,700 | ) | $ | (8,713 | ) | $ | (4,356 | ) | |||
|
Portion of loss recognized in other comprehensive income (loss)
|
(58,744 | ) | (55,279 | ) | (40,811 | ) | ||||||
|
Net other-than-temporary credit impairment losses
|
$ | (67,444 | ) | $ | (63,992 | ) | $ | (45,167 | ) | |||
The following table presents a roll forward of the credit loss component of OTTI on the Company’s Non-Agency RMBS for which a portion of loss was previously recognized in OCI. The table delineates between those securities that are recognizing OTTI for the first time as opposed to those that have previously recognized OTTI.
|
For the Year Ended
|
||||||||||||
|
December 31, 2015
|
December 31, 2014
|
December 31, 2013
|
||||||||||
|
(dollars in thousands)
|
||||||||||||
|
Cumulative credit loss beginning balance
|
$ | 507,548 | $ | 524,432 | $ | 510,089 | ||||||
|
Additions:
|
||||||||||||
|
Other-than-temporary impairments not previously recognized
|
41,233 | 63,123 | 39,098 | |||||||||
|
Reductions for securities sold or deconsolidated during the period
|
(19,746 | ) | (61,854 | ) | (14,038 | ) | ||||||
|
Increases related to other-than-temporary impairments on securities with previously recognized other-than-temporary impairments
|
26,138 | 869 | 6,069 | |||||||||
|
Reductions for increases in cash flows expected to be collected over the remaining life of the securities
|
(26,061 | ) | (19,022 | ) | (16,786 | ) | ||||||
|
Cumulative credit impairment loss ending balance
|
$ | 529,112 | $ | 507,548 | $ | 524,432 | ||||||
Cash flows generated to determine net other-than-temporary credit impairment losses recognized in earnings are estimated using significant unobservable inputs. The significant inputs used to measure the component of OTTI recognized in earnings for the Company’s Non-Agency RMBS are summarized as follows:
F-21
|
For the Year Ended
|
||
|
December 31, 2015
|
December 31, 2014
|
|
|
Loss Severity
|
||
|
Weighted Average
|
57%
|
72%
|
|
Range
|
0% - 92%
|
35% - 93%
|
|
60+ days delinquent
|
||
|
Weighted Average
|
22%
|
30%
|
|
Range
|
2% - 41%
|
0% - 47%
|
|
Credit Enhancement (1)
|
||
|
Weighted Average
|
8%
|
6%
|
|
Range
|
0% - 67%
|
0% - 35%
|
|
3 Month CPR
|
||
|
Weighted Average
|
9%
|
9%
|
|
Range
|
3% - 27%
|
2% - 25%
|
|
12 Month CPR
|
||
|
Weighted Average
|
8%
|
11%
|
|
Range
|
3% - 20%
|
5% - 22%
|
|
(1) Calculated as the combined credit enhancement to the Re-REMIC and underlying from each of their respective capital structures.
|
||
The following tables present a summary of unrealized gains and losses at December 31, 2015 and December 31, 2014. IO MBS included in the tables below represent the right to receive a specified portion of the contractual interest cash flows of the underlying principal balance of specific securities. At December 31, 2015, IO MBS had a net unrealized loss of $45 million and had an amortized cost of $564 million. At December 31, 2014, IO MBS had a net unrealized loss of $27 million and had an amortized cost of $427 million. The fair value of IOs at December 31, 2015 and December 31, 2014 was $519 million, and $400 million, respectively. All changes in fair value of IOs are reflected in Net Income in the Consolidated Statements of Operations and Comprehensive Income.
F-22
|
December 31, 2015
|
||||||||||||||||||||||||
|
(dollars in thousands)
|
||||||||||||||||||||||||
|
Gross Unrealized Gain
Included in Accumulated
Other Comprehensive
Income
|
Gross Unrealized Gain
Included in Accumulated
Deficit
|
Total Gross
Unrealized Gain
|
Gross Unrealized Loss
Included in Accumulated
Other Comprehensive
Income
|
Gross Unrealized Loss
Included in Accumulated
Deficit
|
Total Gross
Unrealized Loss
|
|||||||||||||||||||
|
Non-Agency RMBS
|
||||||||||||||||||||||||
|
Senior
|
$ | 736,040 | $ | - | $ | 736,040 | $ | (8,779 | ) | $ | - | $ | (8,779 | ) | ||||||||||
|
Senior, interest-only
|
- | 18,113 | 18,113 | - | (52,457 | ) | (52,457 | ) | ||||||||||||||||
|
Subordinated
|
81,588 | 2,309 | 83,896 | (1,971 | ) | (5,606 | ) | (7,577 | ) | |||||||||||||||
|
Subordinated, interest-only
|
- | 62 | 62 | - | (4,035 | ) | (4,035 | ) | ||||||||||||||||
|
Agency MBS
|
||||||||||||||||||||||||
|
Residential
|
18,593 | - | 18,593 | (52,001 | ) | - | (52,001 | ) | ||||||||||||||||
|
Commercial
|
8,052 | - | 8,052 | (8,001 | ) | - | (8,001 | ) | ||||||||||||||||
|
Interest-only
|
- | 2,756 | 2,756 | - | (9,640 | ) | (9,640 | ) | ||||||||||||||||
| Total | $ | 844,273 | $ | 23,240 | $ | 867,512 | $ | (70,752 | ) | $ | (71,738 | ) | $ | (142,490 | ) | |||||||||
|
December 31, 2014
|
||||||||||||||||||||||||
|
(dollars in thousands)
|
||||||||||||||||||||||||
|
Gross Unrealized Gain
Included in Accumulated
Other Comprehensive
Income
|
Gross Unrealized Gain
Included in Accumulated
Deficit
|
Total Gross
Unrealized Gain
|
Gross Unrealized Loss
Included in Accumulated
Other Comprehensive
Income
|
Gross Unrealized Loss
Included in Accumulated
Deficit
|
Total Gross
Unrealized Loss
|
|||||||||||||||||||
|
Non-Agency RMBS
|
||||||||||||||||||||||||
|
Senior
|
$ | 843,680 | $ | - | $ | 843,680 | $ | (355 | ) | $ | - | $ | (355 | ) | ||||||||||
|
Senior, interest-only
|
- | 17,378 | 17,378 | - | (37,467 | ) | (37,467 | ) | ||||||||||||||||
|
Subordinated
|
108,091 | - | 108,091 | (309 | ) | - | (309 | ) | ||||||||||||||||
|
Subordinated, interest-only
|
- | 194 | 194 | - | (2,966 | ) | (2,966 | ) | ||||||||||||||||
|
Agency MBS
|
||||||||||||||||||||||||
|
Residential
|
108,802 | - | 108,802 | (13,199 | ) | - | (13,199 | ) | ||||||||||||||||
|
Interest-only
|
- | 1,326 | 1,326 | - | (5,020 | ) | (5,020 | ) | ||||||||||||||||
| Total | $ | 1,060,573 | $ | 18,898 | $ | 1,079,471 | $ | (13,863 | ) | $ | (45,453 | ) | $ | (59,316 | ) | |||||||||
Changes in prepayments, actual cash flows, and cash flows expected to be collected, among other items, are affected by the collateral characteristics of each asset class. The Company chooses assets for the portfolio after carefully evaluating each investment’s risk profile.
The following tables provide a summary of the Company’s RMBS portfolio at December 31, 2015 and December 31, 2014.
F-23
|
December 31, 2015
|
||||||||||||||||||||
|
Principal or
Notional Value
at Period-End
(dollars in
thousands)
|
Weighted
Average
Amortized
Cost Basis
|
Weighted
Average
Fair
Value
|
Weighted
Average
Coupon
|
Weighted
Average
Yield at
Period-End
(1)
|
||||||||||||||||
|
Non-Agency RMBS
|
||||||||||||||||||||
|
Senior
|
$ | 3,651,869 | $ | 57.47 | $ | 77.39 | 3.8 | % | 13.7 | % | ||||||||||
|
Senior, interest-only
|
5,426,029 | 4.95 | 4.32 | 1.7 | % | 12.9 | % | |||||||||||||
|
Subordinated
|
762,466 | 69.25 | 79.26 | 3.2 | % | 8.8 | % | |||||||||||||
|
Subordinated, interest-only
|
284,931 | 5.34 | 3.95 | 1.2 | % | 10.9 | % | |||||||||||||
|
Agency MBS
|
||||||||||||||||||||
|
Residential pass-through
|
5,045,418 | 105.07 | 104.41 | 3.7 | % | 2.8 | % | |||||||||||||
|
Commercial pass-through
|
952,091 | 102.27 | 102.28 | 3.4 | % | 2.9 | % | |||||||||||||
|
Interest-only
|
6,722,472 | 4.17 | 4.06 | 0.8 | % | 3.4 | % | |||||||||||||
|
(1) Bond Equivalent Yield at period end.
|
||||||||||||||||||||
|
December 31, 2014
|
||||||||||||||||||||
|
Principal or
Notional Value
at Period-End
(dollars in
thousands)
|
Weighted
Average
Amortized
Cost Basis
|
Weighted
Average Fair
Value
|
Weighted
Average
Coupon
|
Weighted
Average
Yield at
Period-End
(1)
|
||||||||||||||||
|
Non-Agency RMBS
|
||||||||||||||||||||
|
Senior
|
$ | 3,435,362 | $ | 55.09 | $ | 79.63 | 4.3 | % | 15.9 | % | ||||||||||
|
Senior, interest-only
|
5,221,937 | 4.35 | 3.97 | 1.6 | % | 14.4 | % | |||||||||||||
|
Subordinated
|
690,599 | 50.18 | 65.79 | 3.1 | % | 10.6 | % | |||||||||||||
|
Subordinated, interest-only
|
216,403 | 4.43 | 3.14 | 0.9 | % | 9.2 | % | |||||||||||||
|
Agency MBS
|
||||||||||||||||||||
|
Pass-through
|
7,774,266 | 104.96 | 106.19 | 4.0 | % | 3.2 | % | |||||||||||||
|
Interest-only
|
3,884,523 | 4.89 | 4.79 | 0.9 | % | 3.1 | % | |||||||||||||
|
(1) Bond Equivalent Yield at period end.
|
||||||||||||||||||||
The following table presents the weighted average credit rating, based on the lowest rating available, of the Company’s Non-Agency RMBS portfolio at December 31, 2015 and December 31, 2014.
|
December 31, 2015
|
December 31, 2014
|
|
|
AAA
|
0.5%
|
0.9%
|
|
AA
|
0.4%
|
0.4%
|
|
A
|
0.8%
|
0.0%
|
|
BBB
|
0.4%
|
0.4%
|
|
BB
|
5.2%
|
1.9%
|
|
B
|
3.0%
|
5.6%
|
|
Below B or not rated
|
89.7%
|
90.8%
|
|
Total
|
100.0%
|
100.0%
|
Actual maturities of MBS are generally shorter than the stated contractual maturities. Actual maturities of the Company’s MBS are affected by the contractual lives of the underlying mortgages, periodic payments of principal and prepayments of principal. The following tables provide a summary of the fair value and amortized cost of the Company’s MBS at December 31, 2015 and December 31, 2014 according to their estimated weighted-average life classifications. The weighted-average lives of the MBS in the tables below are based on lifetime expected prepayment rates using an industry prepayment model for the Agency MBS portfolio and the Company’s prepayment assumptions for the Non-Agency RMBS. The prepayment model considers current yield, forward yield, steepness of the interest rate curve, current mortgage rates, mortgage rates of the outstanding loan, loan age, margin, and volatility.
F-24
|
December 31, 2015
|
||||||||||||||||||||
|
(dollars in thousands)
|
||||||||||||||||||||
|
Weighted Average Life
|
||||||||||||||||||||
|
Less than one year
|
Greater than
one year and
less than five years
|
Greater than
five years and
less than ten years
|
Greater than
ten years
|
Total
|
||||||||||||||||
|
Fair value
|
||||||||||||||||||||
|
Non-Agency RMBS
|
||||||||||||||||||||
|
Senior
|
$ | - | $ | 374,462 | $ | 1,629,564 | $ | 822,095 | $ | 2,826,121 | ||||||||||
|
Senior interest-only
|
1,458 | 41,862 | 123,538 | 67,313 | 234,171 | |||||||||||||||
|
Subordinated
|
2,229 | 108,728 | 212,003 | 281,335 | 604,295 | |||||||||||||||
|
Subordinated interest-only
|
- | - | 11,254 | - | 11,254 | |||||||||||||||
|
Agency MBS
|
||||||||||||||||||||
|
Residential
|
- | 150,357 | 5,117,491 | - | 5,267,848 | |||||||||||||||
|
Commercial
|
- | - | 29,176 | 944,611 | 973,787 | |||||||||||||||
|
Interest-only
|
- | 106,069 | 161,413 | 5,707 | 273,189 | |||||||||||||||
|
Total fair value
|
$ | 3,687 | $ | 781,478 | $ | 7,284,439 | $ | 2,121,060 | $ | 10,190,665 | ||||||||||
|
Amortized cost
|
||||||||||||||||||||
|
Non-Agency RMBS
|
||||||||||||||||||||
|
Senior
|
$ | - | $ | 281,255 | $ | 1,235,528 | $ | 582,077 | $ | 2,098,860 | ||||||||||
|
Senior interest-only
|
2,440 | 59,823 | 135,359 | 70,893 | 268,515 | |||||||||||||||
|
Subordinated
|
2,208 | 86,728 | 168,403 | 270,636 | 527,975 | |||||||||||||||
|
Subordinated interest-only
|
- | - | 15,226 | - | 15,226 | |||||||||||||||
|
Agency MBS
|
||||||||||||||||||||
|
Residential
|
- | 149,111 | 5,152,144 | - | 5,301,255 | |||||||||||||||
|
Commercial
|
- | - | 29,156 | 944,580 | 973,736 | |||||||||||||||
|
Interest-only
|
- | 106,708 | 167,646 | 5,719 | 280,073 | |||||||||||||||
|
Total amortized cost
|
$ | 4,648 | $ | 683,625 | $ | 6,903,462 | $ | 1,873,905 | $ | 9,465,640 | ||||||||||
|
December 31, 2014
|
||||||||||||||||||||
|
(dollars in thousands)
|
||||||||||||||||||||
|
Weighted Average Life
|
||||||||||||||||||||
|
Less than one year
|
Greater than
one year and less than five years |
Greater than
five years and less than ten years |
Greater than
ten years |
Total
|
||||||||||||||||
|
Fair value
|
||||||||||||||||||||
|
Non-Agency RMBS
|
||||||||||||||||||||
|
Senior
|
$ | 1,656 | $ | 306,309 | $ | 1,678,226 | $ | 749,589 | $ | 2,735,780 | ||||||||||
|
Senior interest-only
|
515 | 60,403 | 110,800 | 35,498 | 207,216 | |||||||||||||||
|
Subordinated
|
- | 80,414 | 245,438 | 128,496 | 454,348 | |||||||||||||||
|
Subordinated interest-only
|
- | - | 5,447 | 1,358 | 6,805 | |||||||||||||||
|
Agency MBS
|
||||||||||||||||||||
|
Residential
|
- | 4,237,658 | 3,781,890 | 235,871 | 8,255,419 | |||||||||||||||
|
Interest-only
|
- | 82,994 | 103,109 | - | 186,103 | |||||||||||||||
|
Total fair value
|
$ | 2,171 | $ | 4,767,778 | $ | 5,924,910 | $ | 1,150,812 | $ | 11,845,671 | ||||||||||
|
Amortized cost
|
||||||||||||||||||||
|
Non-Agency RMBS
|
||||||||||||||||||||
|
Senior
|
$ | 1,205 | $ | 255,009 | $ | 1,129,932 | $ | 506,309 | $ | 1,892,455 | ||||||||||
|
Senior interest-only
|
1,294 | 65,291 | 124,996 | 35,724 | 227,305 | |||||||||||||||
|
Subordinated
|
- | 58,448 | 188,502 | 99,616 | 346,566 | |||||||||||||||
|
Subordinated interest-only
|
- | - | 8,413 | 1,164 | 9,577 | |||||||||||||||
|
Agency MBS
|
||||||||||||||||||||
|
Residential
|
- | 4,173,986 | 3,750,831 | 234,999 | 8,159,816 | |||||||||||||||
|
Interest-only
|
- | 83,659 | 106,138 | - | 189,797 | |||||||||||||||
|
Total amortized cost
|
$ | 2,499 | $ | 4,636,393 | $ | 5,308,812 | $ | 877,812 | $ | 10,825,516 | ||||||||||
F-25
The Non-Agency RMBS portfolio is subject to credit risk. The Company seeks to mitigate credit risk through its asset selection process. The Non-Agency RMBS portfolio is primarily collateralized by what the Company classifies as Alt-A first lien mortgages. An Alt-A mortgage is a type of U.S. mortgage that, for various reasons, is considered riskier than A-paper, or prime, and less risky than subprime, the riskiest category. Alt-A interest rates, which are determined by credit risk, therefore tend to be between those of prime and subprime home loans. Typically, Alt-A mortgages are characterized by borrowers with less than full documentation, lower credit scores and higher loan-to-value ratios. The Company defines Alt-A mortgage securities as Non-Agency RMBS where (i) the underlying collateral has weighted average FICO scores between 680 and 720 or (ii) for instances where FICO scores are greater than 720, RMBS have 30% or less of the underlying collateral composed of full documentation loans. At December 31, 2015 and December 31, 2014, 64% and 65% of the Non-Agency RMBS collateral was classified as Alt-A, respectively. At December 31, 2015 and December 31, 2014, 17% and 24% of the Non-Agency RMBS collateral was classified as prime, respectively. The remaining Non-Agency RMBS collateral is classified as sub-prime.
The Non-Agency RMBS in the Portfolio have the following collateral characteristics at December 31, 2015 and December 31, 2014.
|
December 31, 2015
|
December 31, 2014
|
|||
|
Weighted average maturity (years)
|
22.0
|
22.5
|
||
|
Weighted average amortized loan to value (1)
|
67.9%
|
67.5%
|
||
|
Weighted average FICO (2)
|
671
|
679
|
||
|
Weighted average loan balance (in thousands)
|
$ 330
|
$ 332
|
||
|
Weighted average percentage owner occupied
|
82.7%
|
83.0%
|
||
|
Weighted average percentage single family residence
|
65.9%
|
65.5%
|
||
|
Weighted average current credit enhancement
|
2.4%
|
1.7%
|
||
|
Weighted average geographic concentration of top four states
|
CA
|
30.4%
|
CA
|
31.7%
|
|
FL
|
8.0%
|
FL
|
8.4%
|
|
|
NY
|
8.0%
|
NY
|
7.8%
|
|
|
NJ
|
2.5%
|
NJ
|
2.9%
|
|
|
(1) Value represents appraised value of the collateral at the time of loan origination.
|
||||
|
(2) FICO as determined at the time of loan origination.
|
||||
The table below presents the origination year of the underlying loans related to the Company’s portfolio of Non-Agency RMBS at December 31, 2015 and December 31, 2014.
|
Origination Year
|
December 31, 2015
|
December 31, 2014
|
|
1998
|
0.0%
|
0.0%
|
|
1999
|
0.1%
|
0.2%
|
|
2000
|
0.6%
|
0.6%
|
|
2001
|
1.6%
|
2.1%
|
|
2002
|
0.5%
|
0.4%
|
|
2003
|
2.2%
|
2.5%
|
|
2004
|
3.7%
|
3.9%
|
|
2005
|
21.7%
|
20.4%
|
|
2006
|
32.9%
|
28.5%
|
|
2007
|
34.2%
|
37.6%
|
|
2008
|
1.9%
|
2.1%
|
|
2013
|
0.5%
|
0.9%
|
|
2014
|
0.1%
|
0.8%
|
|
2015
|
0.0%
|
0.0%
|
|
Total
|
100.0%
|
100.0%
|
Gross realized gains and losses are recorded in “Net realized gains (losses) on sales of investments” on the Company’s Consolidated Statements of Operations and Comprehensive Income. The proceeds and gross realized gains and gross realized losses from sales of investments for the years ended December 31, 2015, 2014 and 2013 are as follows:
F-26
|
For the Year Ended
|
||||||||||||
|
December 31, 2015
|
December 31, 2014
|
December 31, 2013
|
||||||||||
|
(dollars in thousands)
|
||||||||||||
|
Proceeds from sales
|
$ | 6,244,613 | $ | 4,036,033 | $ | 1,079,649 | ||||||
|
Gross realized gains
|
94,618 | 98,656 | 72,946 | |||||||||
|
Gross realized losses
|
(17,544 | ) | (6,947 | ) | (4,839 | ) | ||||||
|
Net realized gain
|
$ | 77,074 | $ | 91,709 | $ | 68,107 | ||||||
Included in the gross realized gains for the year ended December 31, 2015 are exchanges of securities with a fair value of $95 million, where the Company exchanged its investment in a re-remic security for the underlying collateral supporting the group related to the exchanged asset. These exchanges were treated as non-cash sales and purchases and resulted in a realized gain of $24 million for the year ended December 31, 2015 reflected in earnings. For the year ended December 31, 2014 the fair value of these exchanges of securities was $89 million and resulted in realized gain of $23 million.
4. Securitized Loans Held for Investment
The Securitized loans held for investment is comprised of two portfolios. The first portfolio is comprised of loans collateralized by non-conforming, single family, owner occupied, jumbo, prime residential mortgages. The second portfolio is comprised primarily of loans collateralized by seasoned sub-prime residential mortgages.
At December 31, 2015, all securitized loans held for investment are carried at fair value. See Note 5 to our Consolidated Financial Statements for a discussion on how the Company determines the fair values of the securitized loans held for investment. As changes in the fair value of these securitized loans are reflected in earnings, the Company does not estimate or record a loan loss provision. At December 31, 2014, $626 million of securitized loans held for investment comprised primarily of non-conforming, single family, owner occupied, jumbo, prime loans were carried at amortized cost, net of an allowance for loan losses.
The following table provides a summary of the changes in the carrying value of securitized loans held for investment at fair value at December 31, 2015 and December 31, 2014:
|
For the Year Ended
|
For the Year Ended
|
|||||||
|
December 31, 2015
|
December 31, 2014
|
|||||||
|
(dollars in thousands)
|
||||||||
|
Balance, beginning of period
(1)
|
$ | 5,306,501 | $ | - | ||||
|
Purchases
|
577,036 | 4,722,824 | ||||||
|
Principal paydowns
|
(707,996 | ) | (173,597 | ) | ||||
|
Sales and settlements
|
(9,638 | ) | - | |||||
|
Net periodic acrretion (amortization)
|
(19,100 | ) | 5,028 | |||||
|
Change in fair value
|
(90,581 | ) | 144,960 | |||||
|
Transfer due to deconsolidation
|
(287,806 | ) | - | |||||
|
Balance, end of period
|
$ | 4,768,416 | $ | 4,699,215 | ||||
|
(1) Includes Securitized loans held for investment of $607 million for which the fair value option election was
made beginning January 1, 2015.
|
||||||||
The primary cause of the change in fair value is due to changes in credit risk of the portfolio.
F-27
Jumbo prime residential mortgage loans
The securitized loan portfolio collateralized by jumbo prime residential mortgages was originated during the following years:
|
Origination Year
|
December 31, 2015
|
December 31, 2014
|
|
2004
|
0.1%
|
0.9%
|
|
2007
|
8.5%
|
8.1%
|
|
2008
|
7.4%
|
7.0%
|
|
2009
|
0.3%
|
0.2%
|
|
2010
|
5.1%
|
6.3%
|
|
2011
|
33.1%
|
35.4%
|
|
2012
|
45.5%
|
42.1%
|
|
Total
|
100.0%
|
100.0%
|
A summary of key characteristics of the loan portfolio collateralized primarily of non-conforming, single family, owner occupied, jumbo, prime mortgages follows:
|
December 31, 2015
|
December 31, 2014
|
|||
|
Number of loans
|
657
|
869
|
||
|
Weighted average maturity (years)
|
25.5
|
26.4
|
||
|
Weighted average loan to value (1)
|
70.7%
|
71.6%
|
||
|
Weighted average FICO (2)
|
765
|
766
|
||
|
Weighted average loan balance (in thousands)
|
$ 682
|
$ 716
|
||
|
Weighted average percentage owner occupied
|
94.3%
|
95.0%
|
||
|
Weighted average percentage single family residence
|
70.1%
|
71.0%
|
||
|
Weighted average geographic concentration of top five states
|
CA
|
32.4%
|
CA
|
34.8%
|
|
VA
|
6.4%
|
NJ
|
5.6%
|
|
|
NJ
|
6.3%
|
VA
|
5.5%
|
|
|
MD
|
6.2%
|
MD
|
5.1%
|
|
|
TX
|
5.1%
|
NY
|
5.1%
|
|
|
(1) Value represents appraised value of the collateral at the time of loan origination.
|
||||
|
(2) FICO as determined at the time of loan origination.
|
||||
The following table summarizes the outstanding principal balance of the jumbo prime loans which are 30 days delinquent and greater as reported by the servicer at December 31, 2015 and December 31, 2014.
|
30 Days
Delinquent
|
60 Days
Delinquent
|
90+ Days
Delinquent
|
Bankruptcy
|
Foreclosure
|
REO
|
Total
|
||||||||||||||||||||||
|
(dollars in thousands)
|
||||||||||||||||||||||||||||
|
December 31, 2015
|
$ | 3,079 | $ | - | $ | 2,915 | $ | - | $ | 2,875 | $ | 2,312 | $ | 11,181 | ||||||||||||||
|
December 31, 2014
|
$ | 2,621 | $ | 565 | $ | 988 | $ | - | $ | 7,152 | $ | - | $ | 11,326 | ||||||||||||||
The fair value of the jumbo prime residential mortgage loans 90 days or more past due is $2 million as of December 31, 2015.
F-28
Seasoned sub-prime residential mortgage loans
The securitized loan portfolio collateralized by seasoned sub-prime residential mortgages originated during the following years:
|
Origination Year
|
December 31, 2015
|
December 31, 2014
|
|
2002 and prior
|
11.2%
|
6.0%
|
|
2003
|
4.0%
|
4.4%
|
|
2004
|
11.1%
|
12.3%
|
|
2005
|
19.3%
|
20.6%
|
|
2006
|
17.4%
|
18.2%
|
|
2007
|
25.4%
|
26.3%
|
|
2008
|
9.5%
|
9.9%
|
|
2009
|
1.1%
|
1.2%
|
|
2010 and later
|
1.0%
|
1.1%
|
|
Total
|
100.0%
|
100.0%
|
A summary of key characteristics of the loan portfolio collateralized by seasoned sub-prime residential mortgages follows:
|
December 31, 2015
|
December 31, 2014
|
|||
|
Number of loans
|
56,870
|
58,170
|
||
|
Weighted average maturity (years)
|
21.5
|
22.2
|
||
|
Weighted average loan to value (1)
|
80.7%
|
80.3%
|
||
|
Weighted average FICO (1)
|
625
|
629
|
||
|
Weighted average loan balance (in thousands)
|
$ 76
|
$ 79
|
||
|
Weighted average percentage owner occupied
|
96.0%
|
95.8%
|
||
|
Weighted average percentage single family residence
|
72.5%
|
73.6%
|
||
|
Weighted average geographic concentration of top five states
|
CA
|
8.8%
|
CA
|
9.3%
|
|
FL
|
7.2%
|
FL
|
7.0%
|
|
|
NC
|
7.1%
|
NC
|
7.0%
|
|
|
VA
|
6.3%
|
VA
|
6.4%
|
|
|
OH
|
6.1%
|
OH
|
6.0%
|
|
|
(1) As provided by the Trustee
|
||||
The following table summarizes the outstanding principal balance of the loan portfolio consisting of seasoned sub-prime residential mortgage loans which are 30 days delinquent and greater as reported by the servicer at December 31, 2015 and December 31, 2014.
|
30 Days
Delinquent
|
60 Days
Delinquent
|
90+ Days
Delinquent
|
Bankruptcy
|
Foreclosure
|
REO
|
Total
|
|
|
(dollars in thousands)
|
|||||||
|
December 31, 2015
|
$ 189,816
|
$ 66,429
|
$ 125,897
|
$ 117,308
|
$ 218,493
|
$ 36,124
|
$ 754,067
|
|
December 31, 2014
|
$ 226,154
|
$ 92,363
|
$ 192,245
|
$ 154,279
|
$ 80,148
|
$ 16,556
|
$ 761,745
|
The fair value of seasoned sub-prime residential mortgage loans 90 days or more past due is $341 million as of December 31, 2015.
Securitized loans held for investment, net of allowance for loan losses
As of December 31, 2014, $626 million of securitized loans held for investment comprised primarily of non-conforming, single family, owner occupied, jumbo, prime loans were carried at amortized cost, net of an allowance for loan losses of $7 million.
The prime jumbo securitized loans held for investment for which the Company has not elected the fair value option are carried at amortized cost which is their principal balance outstanding, plus unamortized premiums, less unaccreted discounts and an allowance for loan losses. The following table provides a summary of the changes in the carrying value of these securitized loans held for investment at December 31, 2014:
F-29
|
December 31, 2014
|
||||
|
Balance, beginning of period
|
$ | 783,484 | ||
|
Principal paydowns
|
(153,063 | ) | ||
|
Net periodic (amortization) accretion
|
(4,541 | ) | ||
|
Change to loan loss provision
|
232 | |||
|
Balance, end of period
|
$ | 626,112 | ||
The following table represents the Company’s prime jumbo securitized residential mortgage loans held for investment which are carried at amortized cost at December 31, 2014:
|
December 31, 2014
|
||||
|
Securitized loans, at amortized cost
|
$ | 633,386 | ||
|
Less: allowance for loan losses
|
7,274 | |||
|
Securitized loans held for investment
|
$ | 626,112 | ||
The following table summarizes the changes in the allowance for loan losses for the securitized mortgage loan portfolio carried at amortized cost at December 31, 2014:
|
December 31, 2014
|
||||
|
Balance, beginning of period
|
$ | 9,063 | ||
|
Provision for loan losses
|
(232 | ) | ||
|
Charge-offs
|
(1,557 | ) | ||
|
Balance, end of period
|
$ | 7,274 | ||
The Company established an allowance for loan losses related to jumbo prime securitized loans carried at amortized cost that is composed of a general and specific reserve. The balance in the allowance for loan losses related to the general reserve and specific reserve at December 31, 2014 was $3 million and $4 million, respectively.
The Company is not involved with the servicing or modification of the jumbo prime loans held for investments except for its ability to approve certain loan modifications. The servicer of the respective securitization is responsible for servicing and modifying these loans. The Company is required to make certain assumptions in accounting for these loans due to the limitation of information available to the Company.
As all loans are carried at fair value as of December 31, 2015, there is no longer a reserve for losses as of December 31, 2015.
The following table displays the loan product type and accompanying loan characteristic of residential loans recorded on our consilidated balance sheets as of December 31, 2015 and 2014.
F-30
|
December 31, 2015
|
||||||||||||||||||
|
(dollars in thousands)
|
||||||||||||||||||
|
Loan Balance
|
Number of
Loans
|
Interest Rate
|
Maturity Date
|
Total
Principal
|
30-89 Days
Delinquent
|
90+ Days
Delinquent
|
||||||||||||
|
Held-for-Investment at fair value:
|
||||||||||||||||||
|
Adjustable rate loans:
|
||||||||||||||||||
|
$1 to $250
|
2,119 |
1.7% to 15.2%
|
2/1/2003 - 10/1/2055
|
138,321 | 11,140 | 5,292 | ||||||||||||
|
$250 to $500
|
66 |
2% to 10.375%
|
1/1/2030 - 9/1/2055
|
23,021 | 1,201 | 2,277 | ||||||||||||
|
$500 to $750
|
29 |
2% to 5.75%
|
2/1/2032 - 4/1/2038
|
17,186 | - | 1,688 | ||||||||||||
|
$750 to $1,000
|
7 |
2.875% to 2.875%
|
1/1/2038 - 4/1/2038
|
5,867 | - | - | ||||||||||||
|
Over $1,000
|
6 |
2.875% to 4%
|
12/1/2037 - 4/1/2038
|
8,402 | - | 1,730 | ||||||||||||
| 2,227 | 192,797 | 12,341 | 10,986 | |||||||||||||||
|
Hybrid loans:
|
||||||||||||||||||
|
$1 to $250
|
2 |
6.67% to 6.83%
|
8/1/2037 - 9/1/2037
|
193 | - | - | ||||||||||||
|
$250 to $500
|
2 |
5.762% to 5.875%
|
7/1/2037 - 4/1/2038
|
908 | - | - | ||||||||||||
|
$500 to $750
|
8 |
4% to 7.188%
|
7/1/2037 - 3/1/2038
|
4,751 | 1,081 | 1,744 | ||||||||||||
|
$750 to $1,000
|
2 |
5.625% to 5.75%
|
4/1/2037 - 4/1/2038
|
1,730 | - | - | ||||||||||||
| 14 | 7,582 | 1,081 | 1,744 | |||||||||||||||
|
Fixed loans:
|
||||||||||||||||||
|
$1 to $250
|
52,774 |
0% to 24%
|
1/1/1999 - 5/1/2062
|
3,540,447 | 245,151 | 359,559 | ||||||||||||
|
$250 to $500
|
1,957 |
2% to 11.93%
|
12/1/2019 - 10/1/2065
|
645,347 | 33,405 | 58,336 | ||||||||||||
|
$500 to $750
|
374 |
2% to 9.75%
|
6/1/2022 - 9/1/2057
|
226,481 | 3,205 | 4,005 | ||||||||||||
|
$750 to $1,000
|
130 |
3.75% to 7%
|
7/1/2037 - 10/1/2042
|
112,490 | 1,729 | 1,892 | ||||||||||||
|
Over $1,000
|
51 |
2.25% to 7.125%
|
3/1/2013 - 10/1/2042
|
62,773 | - | - | ||||||||||||
| 55,286 | 4,587,538 | 283,490 | 423,792 | |||||||||||||||
|
Total
|
57,527 | 4,787,918 | 296,912 | 436,521 | ||||||||||||||
F-31
|
December 31, 2014
|
||||||||||||||||||
|
(dollars in thousands)
|
||||||||||||||||||
|
Loan Balance
|
Number of
Loans
|
Interest Rate
|
Maturity Date
|
Total Principal
|
30-89 Days Delinquent
|
90+ Days Delinquent
|
||||||||||||
|
Held-for-Investment:
|
||||||||||||||||||
|
Adjustable rate loans:
|
||||||||||||||||||
|
$250 to $500
|
7 |
2.00% to 3.00%
|
8/1/2037 - 2/1/2042
|
3,131 | - | - | ||||||||||||
|
$500 to $750
|
12 |
2.00% to 4.00%
|
1/1/2038 - 4/1/2038
|
7,497 | 565 | - | ||||||||||||
|
$750 to $1,000
|
5 |
2.75% to 2.875%
|
1/1/2038 - 4/1/2038
|
4,328 | - | - | ||||||||||||
|
Over $1,000
|
4 |
2.875% to 4.00%
|
12/1/2037 - 3/1/2038
|
5,879 | - | 1,730 | ||||||||||||
| 28 | 20,835 | 565 | 1,730 | |||||||||||||||
|
Hybrid loans:
|
||||||||||||||||||
|
$0 to $250
|
3 |
6.50% to 6.83%
|
8/1/2037 - 1/1/2038
|
283 | - | - | ||||||||||||
|
$250 to $500
|
11 |
2.125% to 6.875%
|
6/1/2037 - 4/1/2038
|
5,123 | - | 498 | ||||||||||||
|
$500 to $750
|
31 |
2.75% to 7.188%
|
5/1/2037 - 4/1/2038
|
18,817 | 1,154 | 1,709 | ||||||||||||
|
$750 to $1,000
|
5 |
5.625% to 6.35%
|
4/1/2037 - 4/1/2038
|
4,327 | - | - | ||||||||||||
|
Over $1,000
|
3 |
3.00% to 5.75%
|
2/1/2038 - 4/1/2038
|
4,170 | - | 1,629 | ||||||||||||
| 53 | 32,720 | 1,154 | 3,836 | |||||||||||||||
|
Fixed loans:
|
||||||||||||||||||
|
$0 to $250
|
2 |
4.375% to 6.75%
|
6/1/2037 - 8/1/2042
|
85 | - | - | ||||||||||||
|
$250 to $500
|
137 |
2.00% to 7.875%
|
7/1/2022 - 10/1/2042
|
61,868 | - | 958 | ||||||||||||
|
$500 to $750
|
371 |
2.00% to 7.875%
|
9/1/2022 - 10/1/2042
|
230,894 | 506 | 1,616 | ||||||||||||
|
$750 to $1,000
|
190 |
3.50% to 7.00%
|
9/1/2037 - 10/1/2042
|
165,065 | 961 | - | ||||||||||||
|
Over $1,000
|
88 |
2.25% to 7.125%
|
1/1/2038 - 10/1/2042
|
110,440 | - | - | ||||||||||||
| 788 | 568,352 | 1,467 | 2,574 | |||||||||||||||
|
Total
|
869 | 621,907 | 3,186 | 8,140 | ||||||||||||||
|
Held-for-Investment at fair value:
|
||||||||||||||||||
|
Adjustable rate loans:
|
||||||||||||||||||
|
$0 to $250
|
570 |
1.625% to 13.99%
|
5/1/2017 - 11/1/2054
|
57,908 | 1,451 | 3,663 | ||||||||||||
|
$250 to $500
|
61 |
1.875% to 9.375%
|
3/1/2034 - 5/1/2054
|
19,641 | 395 | 3,138 | ||||||||||||
|
$500 to $750
|
4 |
4.29% to 5.75%
|
2/1/2032 - 6/1/2035
|
2,210 | - | 547 | ||||||||||||
| 635 | 79,759 | 1,846 | 7,348 | |||||||||||||||
|
Fixed loans:
|
||||||||||||||||||
|
$0 to $250
|
55,300 |
0.00% to 24.00%
|
7/1/2012 - 5/1/2062
|
3,789,721 | 275,076 | 356,916 | ||||||||||||
|
$250 to $500
|
2,128 |
0.00% to 11.93%
|
6/1/2014 - 11/1/2065
|
688,464 | 37,387 | 75,661 | ||||||||||||
|
$500 to $750
|
106 |
2.00% to 9.75%
|
6/1/2022 - 9/1/2057
|
60,445 | 3,405 | 3,303 | ||||||||||||
|
$750 to $1,000
|
1 |
5.50% to 5.50%
|
7/1/2037 - 7/1/2037
|
804 | 804 | - | ||||||||||||
| 57,535 | 4,539,434 | 316,672 | 435,880 | |||||||||||||||
|
Total
|
58,170 | 4,619,193 | 318,518 | 443,228 | ||||||||||||||
5. Fair Value Measurements
The Company applies fair value guidance in accordance with GAAP to account for its financial instruments. The Company categorizes its financial instruments, based on the priority of the inputs to the valuation technique, into a three-level fair value hierarchy. The fair value hierarchy gives the highest priority to quoted prices in active markets for identical assets or liabilities (Level 1) and the lowest priority to unobservable inputs (Level 3). If the inputs used to measure the financial instruments fall within different levels of the hierarchy, the categorization is based on the lowest level input that is significant to the fair value measurement of the instrument. Financial assets and liabilities recorded at fair value on the Consolidated Statements of Financial Condition or disclosed in the related notes are categorized based on the inputs to the valuation techniques as follows:
Level 1 – inputs to the valuation methodology are quoted prices (unadjusted) for identical assets and liabilities in active markets.
Level 2 – inputs to the valuation methodology include quoted prices for similar assets and liabilities in active markets, and inputs that are observable for the asset or liability, either directly or indirectly, for substantially the full term of the financial instrument.
Level 3 – inputs to the valuation methodology are unobservable and significant to fair value.
F-32
Fair value measurements categorized within Level 3 are sensitive to changes in the assumptions or methodology used to determine fair value and such changes could result in a significant increase or decrease in the fair value. Any changes to the valuation methodology are reviewed by management to ensure the changes are appropriate. As markets and products evolve and the pricing for certain products becomes more transparent, the Company will continue to refine its valuation methodologies. The methodology utilized by the Company for the periods presented is unchanged. The methods used to produce a fair value calculation may not be indicative of net realizable value or reflective of future fair values. Furthermore, while the Company believes its valuation methods are appropriate and consistent with other market participants. Using different methodologies, or assumptions, to determine the fair value of certain financial instruments could result in a different estimate of fair value at the reporting date. The Company uses inputs that are current as of the measurement date, which may include periods of market dislocation, during which price transparency may be reduced.
During times of market dislocation, the observability of prices and inputs can be difficult for certain investments. If third party pricing services are unable to provide a price for an asset, or if the price provided by them is deemed unreliable by the Company, then the asset will be valued at its fair value as determined by the Company without validation to third-party pricing. Illiquid investments typically experience greater price volatility as an active market does not exist. Observability of prices and inputs can vary significantly from period to period and may cause instruments to change classifications within the three level hierarchy.
A description of the methodologies utilized by the Company to estimate the fair value of its financial instruments by instrument class follows:
Agency MBS and Non-Agency RMBS
The Company determines the fair value of all of its investment securities based on discounted cash flows utilizing an internal pricing model that incorporates factors such as coupon, prepayment speeds, loan size, collateral composition, borrower characteristics, expected interest rates, life caps, periodic caps, reset dates, collateral seasoning, delinquency, expected losses, expected default severity, credit enhancement, and other pertinent factors. To corroborate that the estimates of fair values generated by these internal models are reflective of current market prices, the Company compares the fair values generated by the model to non-binding independent prices provided by two independent third party pricing services. For certain highly liquid asset classes, such as Agency fixed-rate pass-through bonds, the Company’s valuations are also compared to quoted prices for To-Be-Announced (“TBA”) securities.
Each quarter the Company develops thresholds which are determined utilizing current bid/ask spreads, liquidity, price volatility and other factors as appropriate. If internally developed model prices differ from the independent prices provided by greater than a market derived predetermined threshold for the period, the Company highlights these differences for further review, both internally and with the third party pricing service. The Company obtains the inputs used by the third party pricing services and compares them to the Company’s inputs. The Company updates its own inputs if the Company determines the third party pricing inputs more accurately reflect the current market environment. If the Company believes that its internally developed inputs more accurately reflect the current market environment, it will request that the third party pricing service review market factors that may not have been considered by the third party pricing service and provide updated prices. The Company reconciles and resolves all pricing differences in excess of the predetermined thresholds before a final price is established.
The Company’s estimate of prepayment, default and severity curves all involve judgment and assumptions that are deemed to be significant to the fair value measurement process, which renders the resulting Non-Agency RMBS fair value estimates Level 3 inputs in the fair value hierarchy. As the fair values of Agency MBS are more observable, these investments are classified as level 2 in the fair value hierarchy.
F-33
Securitized Loans Held for Investment
Securitized loans consisting of seasoned sub-prime residential mortgage loans:
The Company estimates the fair value of its securitized loans held for investment consisting of seasoned sub-prime residential mortgage loans on a loan by loan basis using an internally developed model which compares the loan held by the Company with a loan currently offered in the market. The loan price is adjusted in the model by considering the loan factors which would impact the value of a loan. These loan factors include: loan coupon as compared to coupon currently available in the market, FICO, loan-to-value ratios, delinquency history, owner occupancy, and property type, among other factors. A baseline is developed for each significant loan factor and adjusts the price up or down depending on how that factor for each specific loan compares to the baseline rate. Generally, the most significant impact on loan value is the loan interest rate as compared to interest rates currently available in the market and delinquency history. These two factors are based on relevant observable inputs.
The Company also monitors market activity to identify trades which may be used to compare internally developed prices; however, as the portfolio of loans held at fair value is a seasoned sub-prime pool of mortgage loans, comparable loan pools are not common or directly comparable. There are limited transactions in the market place to develop a comprehensive direct range of values. However, if market data becomes available, the Company will compare this data to the internally developed prices to ensure reasonableness of the valuation.
The Company reviews the fair values generated by the model to determine whether prices are reflective of the current market by corroborating its estimates of fair value by comparing the results to non-binding independent prices provided by two independent third party pricing services for the loan portfolio. Each quarter the Company develops thresholds which are determined utilizing a senior securitization market for a similar pool of loans.
If the internally developed fair values of the loan pools differ from the independent prices provided by greater than a predetermined threshold for the period, the Company highlights these differences for further review, both internally and with the third party pricing service. The Company obtains certain inputs used by the third party pricing services and evaluates them for reasonableness. The Company updates its own model if the Company determines the third party pricing inputs more accurately reflect the current market environment or observed information from the third party vendors. If the Company believes that its internally developed inputs more accurately reflect the current market environment, it will request that the third party pricing service review market factors that may not have been considered by the third party pricing service. The Company reconciles and resolves all pricing differences in excess of the predetermined thresholds before a final price is established.
The Company’s estimates of fair value of securitized loans held for investment involve management judgment and assumptions that are deemed to be significant to the fair value measurement process, which renders the resulting fair value estimates level 3 inputs in the fair value hierarchy.
Securitized loans collateralized by jumbo, prime residential mortgages
:
The securitized loans collateralized by jumbo, prime residential mortgages are carried at fair value as of December 31, 2015. The securitized loans are held as part of a consolidated CFE. A CFE is a variable interest entity that holds financial assets, issues beneficial interests in those assets and has no more than nominal equity and the beneficial interests have contractual recourse only to the related assets of the CFE. Accounting guidance for CFEs allow the Company to elect to measure the CFE’s financial assets using the fair value of the CFE’s financial liabilities as the fair values of the financial liabilities of the CFE are more observable. Therefore, the fair value of the securitized loans collateralized by jumbo, prime residential mortgages is based on the fair value of the securitized debt. See discussion of the fair value of Securitized Debt, collateralized by Loans Held for Investment at fair value below.
As the more observable Securitized debt, collateralized by loans held for investment are considered level 3 in the fair value hierarchy, the Securitized loans collateralized by jumbo, prime residential mortgages are also level 3 in the fair value hierarchy.
F-34
Securitized Debt, collateralized by Non-Agency RMBS
The Company carries securitized debt, collateralized by Non-Agency RMBS at the principal balance outstanding plus unamortized premiums, less unaccreted discounts recorded in connection with the financing of the loans or RMBS with third parties. The Company estimates the fair value of securitized debt, collateralized by Non-Agency RMBS by estimating the future cash flows associated with the underlying assets collateralizing the secured debt outstanding. The Company models the fair value of each underlying asset by considering, among other items, the structure of the underlying security, coupon, servicer, delinquency, actual and expected defaults, actual and expected default severities, reset indices, and prepayment speeds in conjunction with market research for similar collateral performance and management’s expectations of general economic conditions in the sector and other economic factors. This process, including the review process, is consistent with the process used for Agency MBS and Non-Agency RMBS using internal models. See the further discussion of the valuation process and benchmarking process in the
Agency MBS and Non-Agency RMBS
discussion of fair value.
The Company’s estimates of fair value of securitized debt, collateralized by Non-Agency RMBS involve management’s judgment and assumptions that are deemed to be significant to the fair value measurement process, which renders the resulting fair value estimates level 3 inputs in the fair value hierarchy.
Securitized Debt, collateralized by Loans Held for Investment
The Company determines the fair value of securitized debt, collateralized by loans held for investment based on discounted cash flows utilizing an internal pricing model that incorporates factors such as coupon, prepayment speeds, loan size, collateral composition, borrower characteristics, expected interest rates, life caps, periodic caps, reset dates, collateral seasoning, expected losses, expected default severity, credit enhancement, and other pertinent factors. This process, including the review process, is consistent with the process used for Agency MBS and Non-Agency RMBS using internal models. See the further discussion of the valuation process and benchmarking process in the
Agency MBS and Non-Agency RMBS
discussion of fair value.
The Company’s estimates of fair value of securitized debt, collateralized by loans held for investment involve management’s judgment and assumptions that are deemed to be significant to the fair value measurement process, which renders the resulting fair value estimates level 3 inputs in the fair value hierarchy.
Derivatives
Interest Rate Swaps and Swaptions
The Company uses clearing exchange market prices to determine the fair value of its exchange cleared interest rate swaps. For bi-lateral swaps, the Company determines the fair value based on the net present value of expected future cashflows on the swap. The Company uses option pricing model to determine the fair value of its swaptions. The Company compares its own estimate of fair value to clearing market prices to evaluate for reasonableness. The clearing exchange pricing quotes incorporate common market pricing methods, including a spread measurement to the Treasury yield curve or interest rate swap curve as well as underlying characteristics of the particular contract. Interest rate swaps and swaptions are modeled by the Company by incorporating such factors as the term to maturity, swap curve, overnight index swap rates, and the payment rates on the fixed portion of the interest rate swaps. The Company has classified the characteristics used to determine the fair value of interest rate swaps as Level 2 inputs in the fair value hierarchy.
Treasury Futures
The fair value of Treasury futures is determined by quoted market prices for similar financial instruments in an active market. The Company has classified the characteristics used to determine the fair value of Treasury futures as Level 1 inputs in the fair value hierarchy.
Mortgage Options
Mortgage options are valued using an option pricing model which considers the strike price of the option, the price of the underlying security, settle date, a discount rate and the implied volatility. The implied volatility is determined from the daily price of the underlying security as well as prices on similar financial instruments. The Company has classified the characteristics used to determine the fair value of mortgage options as Level 3 inputs in the fair value hierarchy.
F-35
Repurchase Agreements
Repurchase agreements are collateralized financing transactions utilized by the Company to acquire investment securities. Due to the short term nature of these financial instruments, the Company estimates the fair value of these repurchase agreements using the contractual obligation plus accrued interest payable at maturity.
Short-term Financial Instruments
The carrying value of cash and cash equivalents, accrued interest receivable, receivable for securities sold, dividends payable, payable for securities purchased and accrued interest payable are considered to be a reasonable estimate of fair value due to the short term nature and low credit risk of these short-term financial instruments.
The Company’s financial assets and liabilities carried at fair value on a recurring basis, including the level in the fair value hierarchy, at December 31, 2015 and December 31, 2014 is presented below.
|
December 31, 2015
|
||||||||||||||||||||
|
(dollars in thousands)
|
||||||||||||||||||||
|
Level 1
|
Level 2
|
Level 3
|
Counterparty and
Cash Collateral,
netting
|
Total
|
||||||||||||||||
|
Assets:
|
||||||||||||||||||||
|
Non-Agency RMBS, at fair value
|
$ | - | $ | - | 3,675,841 | $ | - | $ | 3,675,841 | |||||||||||
|
Agency RMBS, at fair value
|
- | 6,514,824 | - | - | 6,514,824 | |||||||||||||||
|
Securitized loans held for investment, at fair value
|
- | - | 4,768,416 | - | 4,768,416 | |||||||||||||||
|
Derivatives
|
1,599 | 18,987 | - | (5,126 | ) | 15,460 | ||||||||||||||
|
Liabilities:
|
||||||||||||||||||||
|
Securitized debt at fair value, collateralized by loans held for investment
|
- | - | (3,720,496 | ) | - | (3,720,496 | ) | |||||||||||||
|
Derivatives
|
(192 | ) | (57,042 | ) | - | 47,600 | (9,634 | ) | ||||||||||||
|
Total
|
$ | 1,407 | $ | 6,476,769 | $ | 4,723,761 | $ | 42,474 | $ | 11,244,411 | ||||||||||
|
December 31, 2014
|
||||||||||||||||||||
|
(dollars in thousands)
|
||||||||||||||||||||
|
Level 1
|
Level 2
|
Level 3
|
Counterparty and
Cash Collateral,
netting
|
Total
|
||||||||||||||||
|
Assets:
|
||||||||||||||||||||
|
Non-Agency RMBS, at fair value
|
$ | - | $ | - | $ | 3,404,149 | $ | - | $ | 3,404,149 | ||||||||||
|
Agency RMBS, at fair value
|
- | 8,441,522 | - | - | 8,441,522 | |||||||||||||||
|
Securitized loans held for investment, at fair value
|
- | - | 4,699,215 | - | 4,699,215 | |||||||||||||||
|
Derivatives
|
4,798 | (1,167 | ) | 3,631 | ||||||||||||||||
|
Liabilities:
|
||||||||||||||||||||
|
Securitized debt at fair value, collateralized by loans held for investment
|
- | - | (3,868,366 | ) | - | (3,868,366 | ) | |||||||||||||
|
Derivatives
|
(7,227 | ) | (113,679 | ) | (71 | ) | 106,800 | (14,177 | ) | |||||||||||
|
Total
|
$ | (7,227 | ) | $ | 8,332,641 | $ | 4,234,927 | $ | 105,633 | $ | 12,665,974 | |||||||||
The table below provides a summary of the changes in the fair value of securities classified as Level 3 at December 31, 2015 and December 31, 2014.
F-36
|
Fair Value Reconciliation, Level 3
|
||||||||||||||||||||
|
For the Year Ended
|
||||||||||||||||||||
|
December 31, 2015
|
||||||||||||||||||||
|
(dollars in thousands)
|
||||||||||||||||||||
|
Non-Agency RMBS
|
Derivatives
|
Securitized Loans
(1)
|
Securitized Debt
|
Total
|
||||||||||||||||
|
Beginning balance Level 3 assets
|
$ | 3,404,149 | $ | (71 | ) | $ | 5,306,501 | $ | (4,383,217 | ) | $ | 4,327,362 | ||||||||
|
Transfers in to Level 3 assets
|
- | - | - | - | - | |||||||||||||||
|
Transfers out of Level 3 assets
|
- | - | - | - | - | |||||||||||||||
|
Transfer due to consolidation/deconsolidation
|
(59,646 | ) | - | (287,806 | ) | 243,732 | (105,870 | ) | ||||||||||||
|
Purchases
|
1,045,534 | - | 577,036 | (1,668,654 | ) | (46,084 | ) | |||||||||||||
|
Principal payments
|
(385,822 | ) | - | (707,996 | ) | 743,329 | (350,489 | ) | ||||||||||||
|
Sales and Settlements
|
(252,532 | ) | (597 | ) | (9,638 | ) | 1,395,292 | 1,132,526 | ||||||||||||
|
Accretion (amortization) of purchase discounts
|
117,836 | - | (19,100 | ) | (6,344 | ) | 94,542 | |||||||||||||
|
Gains (losses) included in net income
|
||||||||||||||||||||
|
Other than temporary credit impairment losses
|
(67,444 | ) | - | - | - | (67,444 | ) | |||||||||||||
|
Realized gains (losses) on sales and settlements
|
28,724 | 443 | - | (5,930 | ) | 23,236 | ||||||||||||||
|
Net unrealized gains (losses) included in income
|
(18,874 | ) | 225 | (90,581 | ) | (38,704 | ) | (147,934 | ) | |||||||||||
|
Gains (losses) included in other comprehensive income
|
- | - | ||||||||||||||||||
|
Total unrealized gains (losses) for the period
|
(136,084 | ) | - | - | - | (136,084 | ) | |||||||||||||
|
Ending balance Level 3 assets
|
$ | 3,675,841 | $ | - | $ | 4,768,416 | $ | (3,720,496 | ) | $ | 4,723,761 | |||||||||
| (1) Includes securitized loans held for investment of $607 million for which the fair value option election was made beginning January 1, 2015. | ||||||||||||||||||||
|
Fair Value Reconciliation, Level 3
|
||||||||||||||||||||
|
For the Year Ended
|
||||||||||||||||||||
|
December 31, 2014
|
||||||||||||||||||||
|
(dollars in thousands)
|
||||||||||||||||||||
|
Non-Agency RMBS
|
Derivatives
|
Securitized Loans
|
Securitized Debt
|
Total
|
||||||||||||||||
|
Beginning balance Level 3 assets
|
$ | 3,774,463 | $ | - | $ | - | $ | - | $ | 3,774,463 | ||||||||||
|
Transfers in to Level 3 assets
|
- | - | - | - | - | |||||||||||||||
|
Transfers out of Level 3 assets
|
- | - | - | - | - | |||||||||||||||
|
Purchases
|
454,506 | - | 4,722,824 | (4,309,055 | ) | 868,275 | ||||||||||||||
|
Principal payments
|
(324,768 | ) | - | (173,597 | ) | 412,652 | (85,713 | ) | ||||||||||||
|
Sales and Settlements
|
(602,573 | ) | (8,479 | ) | - | - | (611,052 | ) | ||||||||||||
|
Accretion of purchase discounts
|
99,512 | - | 5,028 | 2,026 | 106,566 | |||||||||||||||
|
Gains (losses) included in net income
|
||||||||||||||||||||
|
Other than temporary credit impairment losses
|
(63,992 | ) | - | - | - | (63,992 | ) | |||||||||||||
|
Realized gains (losses) on sales and settlements
|
62,634 | 8,749 | - | - | 71,383 | |||||||||||||||
|
Realized gain on deconsolidation
|
47,846 | - | - | - | 47,846 | |||||||||||||||
|
Net unrealized gains (losses) included in income
|
25,271 | (341 | ) | 144,960 | 26,011 | 195,901 | ||||||||||||||
|
Gains (losses) included in other comprehensive income
|
||||||||||||||||||||
|
Total unrealized gains (losses) for the period
|
(68,750 | ) | - | - | - | (68,750 | ) | |||||||||||||
|
Ending balance Level 3 assets
|
$ | 3,404,149 | $ | (71 | ) | $ | 4,699,215 | $ | (3,868,366 | ) | $ | 4,234,927 | ||||||||
There were no transfers to or from Level 3 for the years ended December 31, 2015 and 2014. The primary cause of the changes in fair value of the securitized loans and the securitized debt included in the tables above are due to changes in credit risk of the portfolio.
Sensitivity of Significant Inputs – Non-Agency RMBS and securitized debt, collateralized by loans held for investment
The significant unobservable inputs used in the fair value measurement of the Company’s Non-Agency RMBS and securitized debt are the weighted average discount rates, constant prepayment speed (“CPR”), cumulative default rate, and the loss severity.
F-37
Prepayment speeds, as reflected by the CPR, vary according to interest rates, the type of financial instrument, conditions in financial markets, and other factors, none of which can be predicted with any certainty. In general, when interest rates rise, it is relatively less attractive for borrowers to refinance their mortgage loans, and as a result, prepayment speeds tend to decrease. When interest rates fall, prepayment speeds tend to increase. For RMBS investments purchased at a premium, as prepayment speeds increase, the amount of income the Company earns decreases as the purchase premium on the bonds amortizes faster than expected. Conversely, decreases in prepayment speeds result in increased income and can extend the period over which the Company amortizes the purchase premium. For RMBS investments purchased at a discount, as prepayment speeds increase, the amount of income the Company earns increases from the acceleration of the accretion of the discount into interest income. Conversely, decreases in prepayment speeds result in decreased income as the accretion of the purchase discount into interest income occurs over a longer period.
For securitized debt carried at fair value issued at a premium, as prepayment speeds increase, the amount of interest expense the Company recognizes decreases as the issued premium on the debt amortizes faster than expected. Conversely, decreases in prepayment speeds result in increased expense and can extend the period over which the Company amortizes the premium.
For debt issued at a discount, as prepayment speeds increase, the amount of interest the Company expenses increases from the acceleration of the accretion of the discount into interest expense. Conversely, decreases in prepayment speeds result in decreased expense as the accretion of the discount into interest expense occurs over a longer period.
Cumulative default rates represent an annualized rate of default on a group of mortgages. The constant default rate (“CDR”) represents the percentage of outstanding principal balances in the pool that are in default, which typically equates to the home being past 60-day and 90-day notices and in the foreclosure process. When default rates increase, expected cash flows on the underlying collateral decreases. When default rates decrease, expected cash flows on the underlying collateral increases.
Loss severity rates reflect the amount of loss expected from a foreclosure and liquidation of the underlying collateral in the mortgage loan pool. When a mortgage loan is foreclosed the collateral is sold and the resulting proceeds are used to settle the outstanding obligation. In many circumstances, the proceeds from the sale do not fully repay the outstanding obligation. In these cases a loss is incurred by the lender. Loss severity is used to predict how costly future losses are likely to be. An increase in loss severity results in a decrease in expected future cash flows. A decrease in loss severity results in an increase in expected future cash flows.
The discount rate refers to the interest rate used in the discounted cash flow analysis to determine the present value of future cash flows. The discount rate takes into account not just the time value of money, but also the risk or uncertainty of future cash flows. An increased uncertainty of future cash flows results in a higher discount rate. The discount rate used to calculate the present value of the expected future cash flows is based on the discount rate implicit in the security as of the last measurement date. As discount rates move up, the discounted cash flows are reduced.
A summary of the significant inputs used to estimate the fair value of Non-Agency RMBS held for investment at fair value as of December 31, 2015 and December 31, 2014 follows:
|
December 31, 2015
|
December 31, 2014
|
|||||||||||||||||||||||||||||||
|
Significant Inputs
|
Significant Inputs
|
|||||||||||||||||||||||||||||||
|
Weighted
Average
Discount Rate
|
CPR
|
CDR
|
Loss
Severity
|
Weighted
Average
Discount Rate
|
CPR
|
CDR
|
Loss
Severity
|
|||||||||||||||||||||||||
|
Range
|
Range
|
|||||||||||||||||||||||||||||||
|
Non-Agency RMBS
|
||||||||||||||||||||||||||||||||
|
Senior
|
5.5% | 1% -17% | 0% -22% | 35% -95% | 4.7% | 1% - 12% | 0% - 29% | 50% - 85% | ||||||||||||||||||||||||
|
Senior interest-only
|
13.1% | 3% -25% | 0% -23% | 1% -95% | 14.4% | 1% - 25% | 0% - 32% | 50% - 85% | ||||||||||||||||||||||||
|
Subordinated
|
6.6% | 1% -22% | 0% -20% | 5% -91% | 5.8% | 1% - 16% | 0% - 19% | 10% - 78% | ||||||||||||||||||||||||
|
Subordinated interest-only
|
17.4% | 6% -13% | 0% -10% | 1% -64% | 22.0% | 1% - 10% | 0% - 14% | 50% - 65% | ||||||||||||||||||||||||
F-38
A summary of the significant inputs used to estimate the fair value of securitized debt at fair value as of December 31, 2015 and December 31, 2014 follows:
|
December 31, 2015
|
|||||||||
|
Significant Inputs
|
|||||||||
|
CPR
|
CDR
|
Loss Severity
|
|||||||
|
Range
|
Range
|
Range
|
|||||||
|
Securitized debt at fair value, collateralized by loans held for investment
|
4% - 32% | 0% - 6% | 35% - 65% | ||||||
|
December 31, 2014
|
|||||||||
|
Significant Inputs
|
|||||||||
|
CPR
|
CDR
|
Loss Severity
|
|||||||
|
Range
|
Range
|
Range
|
|||||||
|
Securitized debt at fair value, collateralized by loans held for investment
|
3% - 8% | 0% - 9% | 50% - 73% | ||||||
All of the significant inputs listed have some degree of market observability, based on the Company’s knowledge of the market, information available to market participants, and use of common market data sources. Collateral default and loss severity projections are in the form of “curves” that are updated quarterly to reflect the Company’s collateral cash flow projections. Methods used to develop these projections conform to industry conventions. The Company uses assumptions it considers its best estimate of future cash flows for each security.
The discount rates applied to the expected cash flows to determine fair value are derived from a range of observable prices on securities backed by similar collateral. As the market becomes more or less liquid, the availability of these observable inputs will change.
The prepayment speed specifies the percentage of the collateral balance that is expected to prepay at each point in the future. The prepayment speed is based on factors such as collateral FICO score, loan-to-value ratio, debt-to-income ratio, and vintage on a loan level basis and is scaled up or down to reflect recent collateral-specific prepayment experience as obtained from remittance reports and market data services.
Default vectors are determined from the current “pipeline” of loans that are more than 30 days delinquent, in foreclosure, bankruptcy, or are REO. These delinquent loans determine the first 30 months of the default curve. Beyond month 30, the default curve transitions to a value that is reflective of a portion of the current delinquency pipeline.
The curve generated to reflect the Company’s expected loss severity is based on collateral-specific experience with consideration given to other mitigating collateral characteristics. Characteristics such as seasoning are taken into consideration because severities tend to initially increase on newly originated securities, before beginning to decline as the collateral ages and eventually stabilize. Collateral characteristics such as loan size, loan-to-value, and geographic location of collateral also effect loss severity.
Sensitivity of Significant Inputs – Securitized loans held for investment
The significant unobservable inputs used to estimate the fair value of the securitized loans held for investment collateralized by seasoned sub-prime residential mortgage loans, as of December 31, 2015 and December 31, 2014 include coupon, FICO score at origination, loan-to-value ratios (LTV), owner occupancy status, and property type. A summary of the significant inputs used to estimate the fair value of Securitized loans held for investment at fair value as of December 31, 2015 and December 31, 2014 follows:
F-39
|
December 31, 2015
|
December 31, 2014
|
|||||||||||||||
|
Significant Inputs
|
Significant Inputs
|
|||||||||||||||
|
Base Rate
|
Weighted
Average/Percent
of loan pool
|
Base Rate
|
Weighted
Average/Percent
of loan pool
|
|||||||||||||
|
Factor:
|
||||||||||||||||
|
Coupon
|
||||||||||||||||
|
Clean
|
4.4 | % | 6.9 | % | 4.4 | % | 6.6 | % | ||||||||
|
Reperforming
|
5.3 | % | 6.7 | % | 5.3 | % | 6.6 | % | ||||||||
|
FICO
|
620 | 625 | 620 | 637 | ||||||||||||
|
Loan-to-value (LTV)
|
90 | % | 81 | % | 90 | % | 81 | % | ||||||||
|
Occupancy
|
||||||||||||||||
|
Owner Occupied
|
N/A | 96 | % | N/A | 96 | % | ||||||||||
|
Investor
|
N/A | 4 | % | N/A | 4 | % | ||||||||||
|
Secondary
|
N/A | 0 | % | N/A | 0 | % | ||||||||||
|
Property Type
|
||||||||||||||||
|
Single family
|
N/A | 77 | % | N/A | 79 | % | ||||||||||
|
Manufactured housing
|
N/A | 11 | % | N/A | 15 | % | ||||||||||
|
Multi-family/mixed use/other
|
N/A | 12 | % | N/A | 6 | % | ||||||||||
The loan factors are generally not observable for the individual loans and the base rates developed by the Company’s internal model are subjective and change as market conditions change. The impact of the loan coupon on the value of the loan is dependent on whether the loan is clean or reperforming. A clean loan, with no history of delinquent payments and a relatively high loan interest rate would result in a higher overall value than a reperforming loan which has a history of delinquency. Similarly, a higher FICO score and a lower LTV ratio results in increases in the fair market value of the loan and a lower FICO score and a higher LTV ratio results in a lower value.
Property types also affect the overall loan values. Property types include single family, manufactured housing and multi-family/mixed use and other types of properties. Single family homes represent properties which house only one family unit. Manufactured homes include mobile homes and modular homes. Loan value for properties that are investor or secondary homes have a reduced value as compared to the baseline loan value. Additionally, single family homes will result in an increase to the loan value where manufactured and multi-family/mixed use and other properties will result in a decrease to the loan value, as compared to the baseline.
The following table presents the carrying value and fair value, as described above, of the Company’s financial instruments not carried at fair value on a recurring basis at December 31, 2015 and December 31, 2014.
F-40
|
December 31, 2015
|
|||||||||||
|
(dollars in thousands)
|
|||||||||||
|
Level in Fair Value
Hierarchy
|
Carrying Amount
|
Fair Value
|
|||||||||
|
Repurchase agreements
|
2 | (7,439,339 | ) | (7,466,409 | ) | ||||||
|
Securitized debt, collateralized by Non-Agency RMBS
|
3 | (529,415 | ) | (518,941 | ) | ||||||
|
December 31, 2014
|
|||||||||||
|
(dollars in thousands)
|
|||||||||||
|
Level in Fair Value
Hierarchy
|
Carrying Amount
|
Fair Value
|
|||||||||
|
Securitized loans held for investment
|
3 | 626,112 | 626,100 | ||||||||
|
Repurchase agreements
|
2 | (8,455,381 | ) | (8,473,836 | ) | ||||||
|
Securitized debt, collateralized by Non-Agency RMBS
|
3 | (704,915 | ) | (708,623 | ) | ||||||
|
Securitized debt, collateralized by loans held for investment
|
3 | (521,997 | ) | (514,851 | ) | ||||||
6. Repurchase Agreements
The interest rates of the Company’s repurchase agreements are generally indexed to the one-month, three-month and twelve-month LIBOR rates and re-price accordingly. The repurchase agreements outstanding, weighted average borrowing rates, weighted average remaining maturities, average daily balances and the fair value of collateral pledged as of December 31, 2015 and December 31, 2014 is:
|
December 31, 2015
|
December 31, 2014
|
|||||||
|
Repurchase agreements outstanding secured by:
|
||||||||
|
Agency MBS (in thousands)
|
$ | 5,324,729 | $ | 7,422,040 | ||||
|
Non-agency MBS (in thousands)
|
2,114,610 | 1,033,341 | ||||||
|
Total:
|
$ | 7,439,339 | $ | 8,455,381 | ||||
|
Average daily balance of Repurchase agreements secured by:
|
||||||||
|
Agency MBS (in thousands)
|
$ | 5,776,980 | $ | 4,862,939 | ||||
|
Non-agency MBS (in thousands)
|
$ | 1,627,909 | 329,716 | |||||
|
Total:
|
$ | 7,404,889 | $ | 5,192,655 | ||||
|
Weighted average borrowing rate of Repurchase agreements secured by:
|
||||||||
|
Agency MBS
|
0.64 | % | 0.44 | % | ||||
|
Non-agency MBS
|
2.44 | % | 1.98 | % | ||||
|
Weighted average maturity of Repurchase agreements secured by:
|
||||||||
|
Agency MBS
|
53 Days
|
94 Days
|
||||||
|
Non-agency MBS
|
137 Days
|
146 Days
|
||||||
|
MBS pledged as collateral at fair value on Repurchase agreements:
|
||||||||
|
Agency MBS (in thousands)
|
$ | 5,655,410 | $ | 7,822,554 | ||||
|
Non-agency MBS (in thousands)
|
3,117,875 | 1,487,184 | ||||||
|
Total:
|
$ | 8,773,285 | $ | 9,309,738 | ||||
At December 31, 2015 and December 31, 2014, the repurchase agreements collateralized by RMBS had the following remaining maturities.
F-41
|
December 31, 2015
|
December 31, 2014
|
|||||||
|
(dollars in thousands)
|
||||||||
|
Overnight
|
$ | - | $ | - | ||||
|
1 to 29 days
|
3,312,902 | 2,652,717 | ||||||
|
30 to 59 days
|
2,501,513 | 1,371,856 | ||||||
|
60 to 89 days
|
246,970 | 656,915 | ||||||
|
90 to 119 days
|
430,026 | 2,068,740 | ||||||
|
Greater than or equal to 120 days
|
947,928 | 1,705,153 | ||||||
|
Total
|
$ | 7,439,339 | $ | 8,455,381 | ||||
At December 31, 2015 and December 31, 2014, the Company had an amount at risk with Credit Suisse First Boston of 10% of its equity related to the collateral posted on repurchase agreements. As of December 31, 2015 the weighted average maturity of the repurchase agreements with Credit Suisse First Boston was 25 days and the amount at risk was $303 million. As of December 31, 2014 the weighted average maturity of the repurchase agreements with Credit Suisse First Boston was 156 days and the amount at risk was $367 million. There were no other amounts at risk with any other counterparties greater than 10% of the Company’s equity as of December 31, 2015 and December 31, 2014.
7. Securitized Debt
All of the Company’s securitized debt is collateralized by residential mortgage loans or Non-Agency RMBS. For financial reporting purposes, the Company’s securitized debt is accounted for as secured borrowings. Thus, the residential mortgage loans or RMBS held as collateral are recorded in the assets of the Company as securitized loans held for investment or Non-Agency RMBS transferred to consolidated VIEs and the securitized debt is recorded as a non-recourse liability in the accompanying Consolidated Statements of Financial Condition.
Securitized Debt Collateralized by Non-Agency RMBS
At December 31, 2015 and December 31, 2014 the Company’s securitized debt collateralized by Non-Agency RMBS is carried at amortized cost and had a principal balance of $545 million and $727 million, respectively. At December 31, 2015 and December 31, 2014, the debt carried a weighted average cost of financing equal to 4.49% and 4.28%, respectively. The debt matures between the years 2035 and 2047. None of the Company’s securitized debt collateralized by Non-Agency RMBS is callable.
During 2014, the Company acquired securitized debt collateralized by Non-Agency RMBS with an outstanding principal balance of $54 million for $56 million. This transaction resulted in a loss on the extinguishment of debt of $2 million. This loss is reflected in earnings for the year ended December 31, 2014.
The following table presents the estimated principal repayment schedule of the securitized debt at December 31, 2015 and December 31, 2014, based on expected cash flows of the residential mortgage loans or RMBS, as adjusted for projected losses on the underlying collateral of the debt. All of the securitized debt recorded in the Company’s Consolidated Statements of Financial Condition is non-recourse to the Company.
|
December 31, 2015
|
December 31, 2014
|
|||||||
|
(dollars in thousands)
|
||||||||
|
Within One Year
|
$ | 137,642 | $ | 175,713 | ||||
|
One to Three Years
|
178,191 | 220,995 | ||||||
|
Three to Five Years
|
60,872 | 112,779 | ||||||
|
Greater Than Five Years
|
52,280 | 96,266 | ||||||
|
Total
|
$ | 428,985 | $ | 605,753 | ||||
F-42
Maturities of the Company’s securitized debt are dependent upon cash flows received from the underlying loans. The estimate of their repayment is based on scheduled principal payments on the underlying loans. This estimate will differ from actual amounts to the extent prepayments or loan losses are experienced. See Notes 3 for a more detailed discussion of the securities collateralizing the securitized debt.
Securitized Debt Collateralized by Loans Held for Investment
At December 31, 2015 and December 31, 2014 the Company’s securitized debt collateralized by loans held for investment had a principal balance of $3.8 billion and $4.5 billion, respectively. During the year ended December 31, 2015 and 2014, the company recognized a loss of $39 million and a gain of $26 million, respectively, on the securitized debt carried at fair value in Net unrealized gains (losses) on financial instruments at fair value.
During the year ended 2015, the Company acquired securitized debt collateralized by loans with an outstanding principal balance of $1.4 billion for $1.4 billion. This transaction resulted in a net loss on the extinguishment of debt of $6 million. This loss is reflected in earnings for the year ended December 31, 2015.
At December 31, 2015 and December 31, 2014 the total securitized debt collateralized by loans held for investment carried a weighted average cost of financing equal to 3.24% and 3.47% respectively. The debt matures between the years 2023 and 2065.
The following table presents the estimated principal repayment schedule of the securitized debt at December 31, 2015 and December 31, 2014, based on expected cash flows of the residential mortgage loans or RMBS, as adjusted for projected losses on the underlying collateral of the debt. All of the securitized debt recorded in the Company’s Consolidated Statements of Financial Condition is non-recourse to the Company.
|
December 31, 2015
|
December 31, 2014
|
|||||||
|
(dollars in thousands)
|
||||||||
|
Within One Year
|
$ | 591,171 | $ | 704,654 | ||||
|
One to Three Years
|
941,704 | 1,206,241 | ||||||
|
Three to Five Years
|
734,291 | 828,196 | ||||||
|
Greater Than Five Years
|
1,502,663 | 1,577,368 | ||||||
|
Total
|
$ | 3,769,829 | $ | 4,316,459 | ||||
Maturities of the Company’s securitized debt are dependent upon cash flows received from the underlying loans. The estimate of their repayment is based on scheduled principal payments on the underlying loans. This estimate will differ from actual amounts to the extent prepayments or loan losses are experienced. See Note 4 for a more detailed discussion of the loans collateralizing the securitized debt.
Certain of the securitized debt collateralized by loans held for investment contain call provisions and are callable at par, at the option of the Company. The following table presents the par value of the callable debt by year at December 31, 2015.
|
December 31, 2015
|
||||
|
(dollars in thousands)
|
||||
|
Year
|
Principal
|
|||
|
2016
|
$ | 1,861,864 | ||
|
2017
|
217,308 | |||
|
2018
|
1,334,964 | |||
|
Total
|
$ | 3,414,136 | ||
8. Consolidated Securitization Vehicles and Other Variable Interest Entities
Since its inception, the Company has utilized VIEs for the purpose of securitizing whole mortgage loans or re-securitizing RMBS and obtaining permanent, non-recourse term financing. The Company evaluated its interest in each VIE to determine if it is the primary beneficiary.
F-43
As of December 31, 2015, the Company’s Consolidated Statement of Financial Condition includes assets of consolidated VIEs with a carrying value of $7.0 billion and liabilities with a carrying value of $4.3 billion. As of December 31, 2014, the Company’s Consolidated Statement of Financial Condition includes consolidated VIEs with $7.9 billion of assets and $5.1 billion of liabilities.
During the third quarter of 2015, the Company acquired the rights to approximately $295 million of seasoned sub-prime residential mortgage loans through the purchase of certain subordinate tranches in CSMC 2015-RPL4 trust, a VIE. The company evaluated the CSMC 2015-RPL4 trust and concluded that its interests in the trust gave the Company the power to direct the activity of the trust. Therefore, the Company concluded that it was the primary beneficiary of the CSMC 2015-RPL4 trust and consolidated the assets and liabilities of the CSMC 2015-RPL4 trust.
During the fourth quarter of 2015, the Company sold certain tranches and re-evaluated the CSMC 2015-RPL4 trust for consolidation and concluded that its remaining interests in the trust no longer gave the Company the power to direct the activity of the trust. Therefore, the Company concluded that it was no longer the primary beneficiary of the CSMC 2015-RPL4 trust and de-consolidated the assets and liabilities of the CSMC 2015-RPL4 trust.
VIEs for Which the Company is the Primary Beneficiary
The retained beneficial interests in VIEs for which the Company is the primary beneficiary are typically the subordinated tranches of these re-securitizations and in some cases the Company may hold interests in additional tranches. The table below reflects the assets and liabilities recorded in the Consolidated Statements of Financial Condition related to the consolidated VIEs as of December 31, 2015 and December 31, 2014.
|
December 31, 2015
|
December 31, 2014
|
|||||||
|
(dollars in thousands)
|
||||||||
|
Assets
|
||||||||
|
Non-Agency RMBS, at fair value
|
$ | 2,140,494 | $ | 2,473,467 | ||||
|
Securitized loans held for investment, net of allowance for loan losses
|
- | 626,112 | ||||||
|
Securitized loans held for investment, at fair value
|
4,768,416 | 4,699,215 | ||||||
|
Accrued interest receivable
|
35,916 | 39,558 | ||||||
|
Other Assets
|
86,452 | 85,880 | ||||||
|
Liabilities
|
||||||||
|
Securitized debt, collateralized by Non-Agency RMBS
|
$ | 529,415 | $ | 704,915 | ||||
|
Securitized debt, collateralized by loans held for investment
|
- | 521,997 | ||||||
|
Securitized debt at fair value, collateralized by loans held for investment
|
3,720,496 | 3,868,366 | ||||||
|
Accrued interest payable
|
12,106 | 16,070 | ||||||
Income and expense and OTTI amounts related to consolidated VIEs recorded in the Consolidated Statements of Operations and Comprehensive Income is presented in the table below.
|
December 31, 2015
|
December 31, 2014
|
December 31, 2013
|
||||||||||
|
(dollars in thousands)
|
||||||||||||
|
Interest income, Assets of consolidated VIEs
|
$ | 575,715 | $ | 428,992 | $ | 371,559 | ||||||
|
Interest expense, Non-recourse liabilities of VIEs
|
(191,922 | ) | (119,103 | ) | (95,229 | ) | ||||||
|
Net interest income
|
$ | 383,793 | $ | 309,889 | $ | 276,330 | ||||||
|
Total other-than-temporary impairment losses
|
$ | (2,066 | ) | (3,374 | ) | (4,170 | ) | |||||
|
Portion of loss recognized in other comprehensive income (loss)
|
(55,552 | ) | (55,392 | ) | (33,749 | ) | ||||||
|
Net other-than-temporary credit impairment losses
|
$ | (57,618 | ) | $ | (58,766 | ) | $ | (37,919 | ) | |||
F-44
VIEs for Which the Company is Not the Primary Beneficiary
The Company is not required to consolidate VIEs in which it has concluded it does not have a controlling financial interest, and thus is not the primary beneficiary. In such cases, the Company does not have both the power to direct the entities’ most significant activities and the obligation to absorb losses or right to receive benefits that could potentially be significant to the VIEs. The Company’s investments in these unconsolidated VIEs are carried in Non-Agency RMBS on the Consolidated Statements of Financial Condition and include senior and subordinated bonds issued by the VIEs. The fair value of the Company’s investments in each unconsolidated VIEs at December 31, 2015, ranged from less than $1 million to $54 million, with an aggregate amount of $1.5 billion. The fair value of the Company’s investments in each unconsolidated VIEs at December 31, 2014, ranged from less than $1 million to $46 million, with an aggregate amount of $931 million. The Company’s maximum exposure to loss from these unconsolidated VIEs was $1.5 billion at December 31, 2015 and $822 million at December 31, 2014. The maximum exposure to loss was determined as the amortized cost of the unconsolidated VIE, which represents the purchase price of the investment adjusted by any unamortized premiums or discounts as of the reporting date.
9. Derivative Instruments
In connection with the Company’s interest rate risk management strategy, the Company economically hedges a portion of its interest rate risk by entering into derivative financial instrument contracts in the form of interest rate swaps, swaptions, and Treasury futures. The Company’s swaps are used to lock in a fixed rate related to a portion of its current and anticipated payments on its repurchase agreements. The Company typically agrees to pay a fixed rate of interest (“pay rate”) in exchange for the right to receive a floating rate of interest (“receive rate”) over a specified period of time. Treasury futures are derivatives which track the prices of specific Treasury securities and are traded on an active exchange. It is generally the Company’s policy to close out any Treasury futures positions prior to taking delivery of the underlying security. The Company uses Treasury futures to lock in prices on the purchase or sale of Agency MBS and to hedge changes in interest rates on its existing portfolio.
In addition to interest rate swaps, from time to time the Company purchases and sells mortgage options. Mortgage options give the Company the right, but not the obligation, to buy or sell mortgage backed securities at a future date for a fixed price. The Company uses mortgage options to lock in prices on the purchase or sale of Agency MBS and to enhance investment returns.
The use of derivatives creates exposure to credit risk relating to potential losses that could be recognized if the counterparties to these instruments fail to perform their obligations under the contracts. In the event of a default by the counterparty, the Company could have difficulty obtaining its RMBS or cash pledged as collateral for these derivative instruments. The Company periodically monitors the credit profiles of its counterparties to determine if it is exposed to counterparty credit risk. See Note 14 for further discussion of counterparty credit risk.
The table below summarizes the location and fair value of the derivatives reported in the Consolidated Statements of Financial Condition after counterparty netting and posting of cash collateral as of December 31, 2015 and December 31, 2014.
F-45
|
December 31, 2015
|
||||||||||||||
|
Derivative Assets
|
Derivative Liabilities
|
|||||||||||||
|
Derivative Instruments
|
Notional Amount
Outstanding
|
Location on Consolidated
Statements of Financial
Condition
|
Net Estimated Fair
Value/Carrying
Value
|
Location on Consolidated
Statements of Financial
Condition
|
Net Estimated Fair
Value/Carrying Value
|
|||||||||
|
(dollars in thousands)
|
||||||||||||||
|
Interest Rate Swaps
|
$ | 4,555,400 |
Derivatives, at fair value, net
|
$ | 1,232 |
Derivatives, at fair value, net
|
$ | (6,369 | ) | |||||
|
Mortgage Options
|
- |
Derivatives, at fair value, net
|
- |
Derivatives, at fair value, net
|
- | |||||||||
|
Swaptions
|
779,000 |
Derivatives, at fair value, net
|
12,821 |
Derivatives, at fair value, net
|
(3,265 | ) | ||||||||
|
Treasury Futures
|
752,200 |
Derivatives, at fair value, net
|
1,407 |
Derivatives, at fair value, net
|
- | |||||||||
|
Total
|
$ | 6,086,600 | $ | 15,460 | $ | (9,634 | ) | |||||||
|
December 31, 2014
|
||||||||||||||
|
Derivative Assets
|
Derivative Liabilities
|
|||||||||||||
|
Derivative Instruments
|
Notional Amount
Outstanding
|
Location on Consolidated
Statements of Financial
Condition
|
Net Estimated Fair
Value/Carrying
Value
|
Location on Consolidated
Statements of Financial
Condition
|
Net Estimated Fair
Value/Carrying Value
|
|||||||||
|
(dollars in thousands)
|
||||||||||||||
|
Interest Rate Swaps
|
$ | 3,573,000 |
Derivatives, at fair value, net
|
$ | - |
Derivatives, at fair value, net
|
(14,061 | ) | ||||||
|
Mortgage Options
|
200,000 |
Derivatives, at fair value, net
|
- |
Derivatives, at fair value, net
|
(71 | ) | ||||||||
|
Swaptions
|
242,000 |
Derivatives, at fair value, net
|
2,889 |
Derivatives, at fair value, net
|
(45 | ) | ||||||||
|
Treasury Futures
|
1,240,000 |
Derivatives, at fair value, net
|
- |
Derivatives, at fair value, net
|
- | |||||||||
|
Total
|
$ | 5,255,000 | $ | 2,889 | $ | (14,177 | ) | |||||||
As of December 31, 2014, the Company had a net TBA position of $742 thousand which settled in January of 2015. This amount is included in Derivative assets on the Consolidated Statements of Financial Condition as of December 31, 2014.
The effect of the Company’s derivatives on the Consolidated Statements of Operations and Comprehensive Income is presented below.
|
Net gains (losses) on derivatives
|
|||||||||||||
|
For the Year Ended
|
|||||||||||||
|
Derivative Instruments
|
Location on Consolidated Statements of
Operations and Comprehensive Income
|
December 31, 2015
|
December 31, 2014
|
December 31, 2013
|
|||||||||
|
(dollars in thousands)
|
|||||||||||||
|
Interest Rate Swaps
|
Net unrealized gains (losses) on derivatives
|
$ | 64,819 | $ | (84,913 | ) | $ | 23,740 | |||||
|
Interest Rate Swaps
|
Net realized gains (losses) on derivatives (1)
|
(146,173 | ) | (52,523 | ) | (21,857 | ) | ||||||
|
Mortgage Options
|
Net unrealized gains (losses) on derivatives
|
225 | 340 | - | |||||||||
|
Mortgage Options
|
Net realized gains (losses) on derivatives
|
443 | 7,505 | 12,115 | |||||||||
|
Treasury Futures
|
Net unrealized gains (losses) on derivatives
|
8,634 | (17,856 | ) | 10,629 | ||||||||
|
Treasury Futures
|
Net realized gains (losses) on derivatives
|
(35,523 | ) | (38,552 | ) | 2,029 | |||||||
|
Swaptions
|
Net unrealized gains (losses) on derivatives
|
(6,294 | ) | (1,067 | ) | - | |||||||
|
Swaptions
|
Net realized gains (losses) on derivatives
|
(353 | ) | (24 | ) | - | |||||||
|
Other Derivative Assets
|
Net unrealized gains (losses) on derivatives
|
- | - | - | |||||||||
|
Other Derivative Assets
|
Net realized gains (losses) on derivatives
|
(415 | ) | 742 | - | ||||||||
|
Total
|
$ | (114,637 | ) | $ | (186,348 | ) | $ | 26,656 | |||||
|
(1) Includes loss on termination of interest rate swap of $99 million for the year ended December 31, 2015
|
|||||||||||||
The Company paid $99 million to terminate interest rate swaps with a notional value of $1.5 billion during the year ended December 31, 2015. The terminated swaps had original maturities ranging from 2019 to 2044. This amount represented the fair value of the terminated interest rate swaps, not counting any accrued interest at the time of settlement.
F-46
The weighted average pay rate on the Company’s interest rate swaps at December 31, 2015 was 1.51% and the weighted average receive rate was 0.36%. The weighted average pay rate on the Company’s interest rate swaps at December 31, 2014 was 2.26% and the weighted average receive rate was 0.24%. The weighted average pay rate on the Company’s interest rate swaps at December 31, 2013 was 1.81% and the weighted average receive rate was 0.17%.The weighted average maturity on the Company’s interest rate swaps at December 31, 2015, 2014 and 2013 is 4 years, 6 years and 2 years, respectively.
Certain of the Company’s derivative contracts are subject to International Swaps and Derivatives Association Master Agreements or other similar agreements which may contain provisions that grant counterparties certain rights with respect to the applicable agreement upon the occurrence of certain events such as (i) a decline in stockholders’ equity in excess of specified thresholds or dollar amounts over set periods of time, (ii) the Company’s failure to maintain its REIT status, (iii) the Company’s failure to comply with limits on the amount of leverage, and (iv) the Company’s stock being delisted from the New York Stock Exchange (NYSE). Upon the occurrence of any one of items (i) through (iv), or another default under the agreement, the counterparty to the applicable agreement has a right to terminate the agreement in accordance with its provisions. Certain of the Company’s interest rate swaps are cleared through a registered commodities exchange. Each of the Company’s ISDAs and clearing exchange agreements contains provisions under which the Company is required to fully collateralize its obligations under the interest rate swap agreements if at any point the fair value of the swap represents a liability greater than the minimum transfer amount contained within the agreements. The Company is also required to post initial collateral upon execution of certain of its swap transactions. If the Company breaches any of these provisions, it will be required to settle its obligations under the agreements at their termination values, which approximates fair value. The Company uses clearing exchange market prices to determine the fair value of its interest rate swaps. The aggregate fair value of all derivative instruments with credit-risk-related contingent features that are in a net liability position at December 31, 2015 is approximately $57 million including accrued interest, which represents the maximum amount the Company would be required to pay upon termination, which is fully collateralized.
10. Common Stock
On March 12, 2015, The Company's board of directors approved a 1-for-5 reverse stock split of its common stock. The reverse stock split was effective after the close of trading on April 6, 2015, and the shares of the Company's common stock began trading on a reverse split-adjusted basis on the New York Stock Exchange beginning at the opening of trading on April 7, 2015. As a result of the reverse stock split, every five shares of the Company’s common stock was converted into one share of common stock, reducing the number of issued and outstanding shares of the Company’s common stock from approximately 1.0 billion to approximately 206 million and reducing the number of authorized shares from 1.5 billion to approximately 300 million. No fractional shares were issued in connection with the reverse stock split. Each stockholder who was otherwise entitled to receive a fractional share of the Company’s common stock was entitled to receive a cash payment in lieu of a fractional share. The reverse stock split was not subject to stockholder approval and did not change the par value of the Company's common stock. All common shares, outstanding options and per share amounts for all periods were retroactively adjusted to reflect the reverse stock split.
On August 5, 2015, our Board of Directors adopted a program that authorizes repurchases of our common stock up to $250 million. Shares of our common stock may be purchased in the open market, including through block purchases, or through privately negotiated transactions, or pursuant to any trading plan that may be adopted in accordance with Rule 10b5-1 of the Securities Exchange Act of 1934, as amended. The timing, manner, price and amount of any repurchases will be determined at our discretion and the program may be suspended, terminated or modified at any time for any reason. Among other factors, we intend to only consider repurchasing shares of our common stock when the purchase price is less than our estimate of our current net asset value per common share. Generally, when we repurchase our common stock at a discount to our net asset value, the net asset value of our remaining shares of common stock outstanding increases. In addition, we do not intend to repurchase any shares from directors, officers or other affiliates. The program does not obligate us to acquire any specific number of shares, and all repurchases will be made in accordance with Rule 10b-18, which sets certain restrictions on the method, timing, price and volume of stock repurchases.
F-47
Pursuant to our share repurchase program, during the third and fourth quarter of 2015, we repurchased approximately 18 million shares of our common stock at an average repurchase price of $13.94 per share for a total of $250 million.
During the years ended December 31, 2015, 2014 and 2013, the Company declared dividends to common shareholders totaling $379 million, $370 million and $575 million, respectively, or $1.92, $1.80 and $2.80 per share, respectively.
Earnings per share for the years ended December 31, 2015, 2014 and 2013, respectively, are computed as follows:
|
For the Year Ended
|
||||||||||||
|
December 31, 2015
|
December 31, 2014
|
December 31, 2013
|
||||||||||
|
(dollars in thousands)
|
||||||||||||
|
Numerator:
|
||||||||||||
|
Net income
|
$ | 250,349 | $ | 589,205 | $ | 362,686 | ||||||
|
Effect of dilutive securities:
|
- | - | - | |||||||||
|
Dilutive net income available to stockholders
|
$ | 250,349 | $ | 589,205 | $ | 362,686 | ||||||
|
Denominator:
|
||||||||||||
|
Weighted average basic shares
|
199,563,196 | 205,450,095 | 205,418,876 | |||||||||
|
Effect of dilutive securities
|
86,981 | 58,674 | 95,193 | |||||||||
|
Weighted average dilutive shares
|
199,650,177 | 205,508,769 | 205,514,069 | |||||||||
|
Net income per average share attributable to common stockholders - Basic
|
$ | 1.25 | $ | 2.87 | $ | 1.77 | ||||||
|
Net income per average share attributable to common stockholders - Diluted
|
$ | 1.25 | $ | 2.87 | $ | 1.76 | ||||||
11. Accumulated Other Comprehensive Income
The following table presents the changes in the components of Accumulated Other Comprehensive Income (“AOCI”) for the years ended December 31, 2015 and 2014:
F-48
|
December 31, 2015
|
||||||||
|
(dollars in thousands)
|
||||||||
|
Unrealized gains
(losses) on available-
for-sale securities, net
|
Total Accumulated
OCI Balance
|
|||||||
|
Balance as of December 31, 2014
|
$ | 1,046,680 | $ | 1,046,680 | ||||
|
OCI before reclassifications
|
(263,049 | ) | (263,049 | ) | ||||
|
Amounts reclassified from AOCI
|
(9,840 | ) | (9,840 | ) | ||||
|
Net current period OCI
|
(272,889 | ) | (272,889 | ) | ||||
|
Balance as of December 31, 2015
|
$ | 773,791 | $ | 773,791 | ||||
|
December 31, 2014
|
||||||||
|
(dollars in thousands)
|
||||||||
|
Balance as of December 31, 2013
|
$ | 990,803 | $ | 990,803 | ||||
|
OCI before reclassifications
|
134,113 | 134,113 | ||||||
|
Amounts reclassified from AOCI
|
(78,236 | ) | (78,236 | ) | ||||
|
Net current period OCI
|
55,877 | 55,877 | ||||||
|
Balance as of December 31, 2014
|
$ | 1,046,680 | $ | 1,046,680 | ||||
The following table presents the details of the reclassifications from AOCI for the years ended December 31, 2015 and 2014:
|
December 31, 2015
|
December 31, 2014
|
||||||||
|
Details about Accumulated OCI Components
|
Amounts Reclassified
from Accumulated OCI
|
Amounts Reclassified
from Accumulated OCI
|
Affected Line on the Consolidated
Statements Of Operations And
Comprehensive Income
|
||||||
| Unrealized gains and losses on available-for-sale securities | (dollars in thousands) | ||||||||
| $ | 77,284 | $ | 94,382 |
Net realized gains (losses) on sales of investments
|
|||||
| - | 47,846 |
Realized gain on deconsolidation
|
|||||||
| (67,444 | ) | (63,992 | ) |
Net other-than-temporary credit impairment losses
|
|||||
| $ | 9,840 | $ | 78,236 |
Income before income taxes
|
|||||
| - | - |
Income taxes
|
|||||||
| $ | 9,840 | $ | 78,236 |
Net of tax
|
|||||
12. Equity Compensation, Employment Agreements and other Benefit Plans
In accordance with the terms of the Company’s 2007 Equity Incentive Plan (as amended and restated on December 10, 2015), directors, officers and employees of the Company are eligible to receive restricted stock grants.
These awards generally have a restriction period lasting between two to ten years depending on the award, after which time the awards fully vest. During the vesting period, these shares may not be sold. Restricted stock may be granted to all employees. There were 7.4 million shares available for future grants under the 2007 Equity Incentive Plan as of December 31, 2015.
In January, 2016, the Compensation Committee of the Board of Directors of the Company approved the Stock Award Deferral Program. Under the program, non-employee directors and certain executive officers can elect to defer payment of certain stock awards made pursuant to the 2007 Equity Incentive Plan (as amended and restated on December 10, 2015). Deferred awards are credited as deferred stock units and are paid at the earlier of separation from service or a date elected by the participant. Payments are generally made in a lump sum or, if elected by the participant, in five annual installments if paid upon separation from service. Deferred awards receive dividend equivalents during the deferral period credited as additional deferred stock units. Amounts are paid at the end of the deferral period by delivery of shares from the 2007 Equity Incentive Plan (plus cash for any fractional deferred stock units), less any applicable tax withholdings. Deferral elections do not alter any vesting requirements applicable to the underlying stock award.
F-49
At December 31, 2015, the Company had employment agreements with five of its officers, with varying terms that provide for, among other things, base salary, bonus and change-in-control payments upon the occurrence of certain triggering events.
On January 2, 2008, the Company granted restricted stock awards in the amount of 260,200 shares, adjusted for the 1-for-5 split, to employees of FIDAC and its affiliates and the Company’s independent directors. The awards to the independent directors vested on the date of grant and the awards to FIDAC’s employees, which are now Chimera’s employees vest quarterly over a period of 10 years.
On February 2, 2015, the Company granted restricted stock awards in the amount of 84,700 shares to employees of FIDAC and its affiliates. One third of the awards vested on grant date and the remainder will vest pro-rata over a period of two years.
On August 5, 2015, in connection with the management internalization, 15,000 unvested restricted stock awards granted to FIDAC employees who did not become employees of the Company, vested immediately on that date. The remaining 70,000 unvested restricted stock awards granted to original FIDAC employees that are now employees of the Company were remeasured on August 5, 2015 based on the Company’s stock price on that date and will continue to be amortized over the remaining vesting period, based on their fair value as of August 5, 2015.
The following table presents information with respect to the Company’s restricted stock awards during the years ended December 31, 2015 and 2014:
|
For the Year Ended
|
||||||||||||||||
|
December 31, 2015
|
December 31, 2014
|
|||||||||||||||
|
Number of Shares
|
Weighted
Average Grant
Date Fair Value
|
Number of Shares
|
Weighted
Average Grant
Date Fair Value
|
|||||||||||||
|
Unvested shares outstanding - beginning of period
|
39,480 | 88.60 | 76,800 | 88.60 | ||||||||||||
|
Granted
|
84,692 | 15.35 | 44,579 | 16.60 | ||||||||||||
|
Vested
|
(50,988 | ) | 88.60 | (58,217 | ) | 88.60 | ||||||||||
|
Forfeited
|
(2,184 | ) | 88.60 | (23,682 | ) | 88.60 | ||||||||||
|
Unvested shares outstanding - end of period
|
71,000 | 28.39 | 39,480 | 88.60 | ||||||||||||
The Company recognized stock based compensation expenses of $1 million, $166 thousand and $324 thousand for the years ended December 31, 2015, 2014 and 2013, respectively. As of December 31, 2015 there was approximately $1 million of total unrecognized compensation costs related to non-vested share-based compensation arrangements granted under the long term incentive plan. That cost is expected to be recognized over a weighted average period of approximately 2 years.
The Company’s independent directors receive a fixed dollar amount of the Company’s common stock in return for services provided to the Company. Equity based awards granted to the independent director’s vest during the year of service. For the years ended December 31, 2015, 2014 and 2013, the Company recognized $975 thousand, $740 thousand and $300 thousand, of stock based compensation to independent directors, respectively. In 2014, $320 thousand of the $895 thousand granted was related to independent directors electing to receive their cash retainer in the form of common stock.
Subsequent to December 31, 2015, the executive officers of the Company were granted 266,000 shares of stock as compensation related to services provided in 2015. These shares had a market value at the grant date of $3 million and vest equally over a three year period beginning one year from the grant date and will fully vest in in 2019.
The Company also maintains a qualified 401(k) plan. The plan is a voluntary contributory plan that allows eligible employees to defer compensation for federal income tax purposes under Section 401(k) of the Internal Revenue Code of 1986, as amended. Employees may contribute, through payroll deductions, up to 25% of eligible compensation. The Company matches 100% of the first 3% of the eligible compensation deferred by employee contributions and 50% of the next 2% of such compensation. The 401(k) matching contributions are made in the form of cash, whereby participants may direct the Company match to an investment of their choice. The benefit of the Company’s contributions vest immediately. Generally, a participating employee is entitled to distributions from the plans upon termination of employment, retirement, death or disability. Participants who qualify for distribution may receive a series of specified installment payments. The 401(k) expense related to the Company’s qualified plan for the year ended December 31, 2015 was $82 thousand. As we were externally managed prior to 2015, there was no 401(k) expense in 2014 or 2013.
F-50
13. Income Taxes
For the years ended December 31, 2015 and December 31, 2014, the Company was qualified to be taxed as a REIT under Code Sections 856 through 860. As a REIT, the Company is not subject to federal income tax to the extent that it makes qualifying distributions of taxable income to its stockholders. To maintain qualification as a REIT, the Company must distribute at least 90% of its annual REIT taxable income to its shareholders and meet certain other requirements such as assets it may hold, income it may generate and its shareholder composition. It is generally the Company’s policy to distribute to its shareholders all of the Company’s taxable income.
The state and local tax jurisdictions for which the Company is subject to tax-filing obligations recognize the Company’s status as a REIT, and therefore, the Company generally does not pay income tax in such jurisdictions. The Company may, however, be subject to certain minimum state and local tax filing fees and its TRSs are subject to federal, state and local taxes. There were no significant income tax expenses for the years ended December 31, 2015, 2014 and 2013.
The Company recorded a deferred tax asset of $4 million for the year ended December 31, 2015, relating to activities of its TRSs. Of this amount, $3 million related to cumulative net operating losses as of December 31, 2015 and $1 million related to losses which were disallowed under Code Section 267(a) during the year ended December 31, 2015. The Company evaluates, based on both positive and negative evidence, the likelihood of realizing its deferred tax assets and established a valuation allowance of $4 million for the year ended December 31, 2015. The Company did not record a deferred tax asset or establish a valuation allowance for the year ended December 31, 2014.
In general, common stock cash dividends declared by the Company will be considered ordinary income to stockholders for income tax purposes. From time to time, a portion of the Company’s dividends may be characterized as capital gains or return of capital distributions.
The Company’s effective tax rate differs from its combined federal, state and city corporate statutory tax rate primarily due to the deduction of dividend distributions required to be paid under Code Section 857(a).
The Company’s 2014, 2013 and 2012 federal, state and local tax returns remain open for examination.
14. Credit Risk and Interest Rate Risk
The Company’s primary components of market risk are credit risk and interest rate risk. The Company is subject to interest rate risk in connection with its investments in Agency MBS and Non-Agency RMBS, residential mortgage loans, and borrowings under repurchase agreements. When the Company assumes interest rate risk, it attempts to minimize interest rate risk through asset selection, hedging and matching the income earned on mortgage assets with the cost of related liabilities. The Company attempts to minimize credit risk through due diligence and asset selection by purchasing loans underwritten to agreed-upon specifications of selected originators as well as on-going portfolio monitoring. The Company has established a whole loan target market including prime and sub-prime borrowers, Alt-A documentation, geographic diversification, owner-occupied property, and moderate loan-to-value ratios. These factors are considered to be important indicators of credit risk.
By using derivative instruments and repurchase agreements, the Company is exposed to counterparty credit risk if counterparties to the contracts do not perform as expected. If a counterparty fails to perform on a derivative hedging instrument, the Company’s counterparty credit risk is equal to the amount reported as a derivative asset on its balance sheet to the extent that amount exceeds collateral obtained from the counterparty or, if in a net liability position, the extent to which collateral posted exceeds the liability to the counterparty. The amounts reported as a derivative asset/(liability) are derivative contracts in a gain/(loss) position, and to the extent subject to master netting arrangements, net of derivatives in a loss/(gain) position with the same counterparty and collateral received/(pledged). If the counterparty fails to perform on a repurchase agreement, the Company is exposed to a loss to the extent that the fair value of collateral pledged exceeds the liability to the counterparty. The Company attempts to minimize counterparty credit risk by evaluating and monitoring the counterparty’s credit, executing master netting arrangements and obtaining collateral, and executing contracts and agreements with multiple counterparties to reduce exposure to a single counterparty, where appropriate.
F-51
Our repurchase agreements and derivative transactions are governed by underlying agreements that provide for a right of setoff under master netting arrangements, including in the event of default or in the event of bankruptcy of either party to the transactions. We present our assets and liabilities subject to such arrangements on a net basis in our consolidated statements of financial condition. The following table presents information about our liabilities that are subject to such arrangements and can potentially be offset on our consolidated statements of financial condition as of December 31, 2015 and December 31, 2014.
|
December 31, 2015
|
||||||||||||||||||||||||
|
(dollars in thousands)
|
||||||||||||||||||||||||
|
Gross Amounts of Recognized Assets (Liabilities)
|
Gross Amounts Offset
in the Consolidated Statements of Financial Position
|
Net Amounts Offset
in the Consolidated Statements of Financial Position
|
Gross Amounts Not Offset with Financial
Assets (Liabilities) in the Consolidated
Statements of Financial Position
|
|||||||||||||||||||||
|
Financial
Instruments
|
Cash Collateral (Received) Pledged (1)
|
Net Amount
|
||||||||||||||||||||||
|
Repurchase Agreements
|
$ | (7,439,339 | ) | $ | - | $ | (7,439,339 | ) | $ | 8,773,285 | $ | 37,296 | $ | 1,371,242 | ||||||||||
|
Interest Rate Swaps - Gross Assets
|
6,166 | (4,934 | ) | 1,232 | - | - | 1,232 | |||||||||||||||||
|
Interest Rate Swaps - Gross Liabilities
|
(53,777 | ) | 47,408 | (6,369 | ) | 8,589 | 51,424 | 53,644 | ||||||||||||||||
|
Treasury Futures
|
1,599 | (192 | ) | 1,407 | - | 6,420 | 7,827 | |||||||||||||||||
|
Swaptions - Gross Assets
|
12,821 | - | 12,821 | - | - | 12,821 | ||||||||||||||||||
|
Swaptions - Gross Liabilities
|
(3,265 | ) | - | (3,265 | ) | - | - | (3,265 | ) | |||||||||||||||
|
Total Liabilities
|
$ | (7,475,795 | ) | $ | 42,282 | $ | (7,433,513 | ) | $ | 8,781,874 | $ | 95,140 | $ | 1,443,501 | ||||||||||
|
(1) Included in other assets
|
||||||||||||||||||||||||
|
December 31, 2014
|
||||||||||||||||||||||||
|
(dollars in thousands)
|
||||||||||||||||||||||||
|
Gross Amounts of Recognized Assets (Liabilities)
|
Gross Amounts Offset
in the Consolidated Statements of Financial Position
|
Net Amounts Offset
in the Consolidated Statements of Financial Position
|
Gross Amounts Not Offset with Financial
Assets (Liabilities) in the Consolidated
Statements of Financial Position
|
|||||||||||||||||||||
|
Financial
Instruments
|
Cash Collateral (Received) Pledged (1)
|
Net Amount
|
||||||||||||||||||||||
|
Repurchase Agreements
|
$ | (8,455,381 | ) | $ | - | $ | (8,455,381 | ) | $ | 9,309,738 | $ | - | $ | 854,357 | ||||||||||
|
Interest Rate Swaps
|
(113,597 | ) | 99,536 | (14,061 | ) | 19,340 | 64,796 | 70,075 | ||||||||||||||||
|
Treasury Futures
|
(7,227 | ) | 7,227 | - | - | 12,595 | 12,595 | |||||||||||||||||
|
Mortgage Options
|
(71 | ) | - | (71 | ) | - | - | (71 | ) | |||||||||||||||
|
Swaptions - Gross Asset
|
2,889 | - | 2,889 | - | - | 2,889 | ||||||||||||||||||
|
Swaptions - Gross Liability
|
(45 | ) | - | (45 | ) | - | - | (45 | ) | |||||||||||||||
|
Total Liabilities
|
$ | (8,573,432 | ) | $ | 106,763 | $ | (8,466,669 | ) | $ | 9,329,078 | $ | 77,391 | $ | 939,800 | ||||||||||
|
(1) Included in other assets
|
||||||||||||||||||||||||
15. Management Agreement
Until August 5, 2015, the Company was externally managed by a whole-owned subsidiary of Annaly Capital Management, Inc., FIDAC under the terms of a management agreement. On August 5, 2015, the Company announced it had internalized its management and would continue to be led by its key professionals. In connection with the internalization, the Company and FIDAC agreed to terminate the Management Agreement, without the payment of a termination fee effective immediately. As part of the termination, the Company entered into a transition services agreement with FIDAC through the end of 2015 (the “Transition Services Agreement”). In addition, FIDAC will continue to provide the Company a number of services previously provided under the Management Agreement at the same level, quality and time frame until December 31, 2015, at which time the Company will have the option to extend the term of the Transition Services Agreement for up to three one-month extension periods. Upon expiration of the term, FIDAC will not provide any further management services to the Company. For the year ended December 31, 2015, the Company incurred $7 million on transition services expenses, which is reported as a part of general and administrative expenses on income statement.
F-52
On August 8, 2014, the management agreement was amended and restated. Effective August 8, 2014, the management fee was increased to 1.20% of gross stockholders’ equity from 0.75% of gross stockholders’ equity. The Company incurred management fee expenses of $25 million, $33 million and $26 million for each of the years ended December 31, 2015, 2014 and 2013, respectively.
The Company is obligated to reimburse FIDAC for costs incurred on the Company’s behalf under the management agreement. In addition, the management agreement permits FIDAC to require the Company to pay for its pro-rata portion of rent, telephone, utilities, office furniture, equipment, machinery and other office, internal and overhead expenses that FIDAC incurred in connection with the Company’s operations. These expenses are allocated between FIDAC and the Company based on the ratio of the Company’s proportion of gross assets compared to the gross assets managed by FIDAC as calculated at each quarter end. FIDAC and the Company will modify this allocation methodology, subject to the approval of the Company’s Board of Directors if the allocation becomes inequitable (i.e., if the Company becomes very highly leveraged compared to FIDAC’s other funds and accounts). During the years ended December 31, 2015, 2014 and 2013, reimbursements to FIDAC were not significant.
The management agreement provide that FIDAC will pay all past and future expenses that the Company or the Audit Committee of the Company incur to: (1) evaluate the Company’s accounting policy related to the application of GAAP to its Non-Agency RMBS portfolio (the “Evaluation”); (2) restate the Company’s financial statements for the period covering 2008 through 2011 as a result of the Evaluation (the “Restatement Filing”); and (3) investigate and evaluate any shareholder derivative demands arising from the Evaluation or the Restatement Filing (the “Investigation”); provided, however, that FIDAC’s obligation to pay expenses applies only to expenses not paid by the Company’s insurers under its insurance policies. Expenses shall include, without limitation, fees and costs incurred with respect to auditors, outside counsel, and consultants engaged by the Company or the Audit Committee of the Company for the Evaluation, Restatement Filing and the Investigation. The amount paid by FIDAC related to these expenses for each of the year ended December 31, 2015, 2014 and 2013 is $7 million, $32 million and $7 million, respectively.
None of the reimbursement payments is attributable to the compensation of our named executive officers. Included in the $32 million of reimbursements received in 2014 is a one-time reimbursement of $24 million to resolve issues raised in derivative demand letters sent to Chimera’s Board of Directors. This $24 million is included as an Other (income) expense in the consolidated statement of operations and comprehensive income of 2014.
16. Commitments and Contingencies
From time to time, the Company may become involved in various claims and legal actions arising in the ordinary course of business. In connection with certain re-securitization transactions engaged in by the Company, the Company has the obligation under certain circumstances to repurchase assets from the VIE upon breach of certain representations and warranties. Management is not aware of any contingencies that require accrual or disclosure as of December 31, 2015 and December 31, 2014.
17. Subsequent Events
Subsequent to December 31, 2015, the Company increased its existing share buyback program by $100 million from $250 million to $350 million.
The Audit Committee also pursued additional remedies against other parties regarding the facts and circumstances relating to our accounting for Non-Agency RMBS and the restatement of our financial statements, which were resolved in the first quarter of 2016 and we expect to recover $95 million which will be characterized as taxable income in 2016.
The following is a presentation of the results of operations for the quarters ended December 31, 2015, September 30, 2015, June 30, 2015 and March 31, 2015.
F-53
|
For the Quarter Ended
|
||||||||||||||||
|
December 31, 2015
|
September 30, 2015
|
June 30, 2015
|
March 31, 2015
|
|||||||||||||
|
(dollars in thousands, except per share data)
|
||||||||||||||||
|
Net Interest Income:
|
||||||||||||||||
|
Interest income
|
$ | 201,912 | $ | 211,876 | $ | 215,804 | $ | 243,145 | ||||||||
|
Interest expense
|
64,955 | 67,910 | 66,044 | 60,456 | ||||||||||||
|
Net interest income
|
136,957 | 143,966 | 149,760 | 182,689 | ||||||||||||
|
Other-than-temporary impairments:
|
||||||||||||||||
|
Total other-than-temporary impairment losses
|
(2,311 | ) | (3,129 | ) | (2,208 | ) | (1,052 | ) | ||||||||
|
Portion of loss recognized in other comprehensive income
|
(12,385 | ) | (14,703 | ) | (24,893 | ) | (6,763 | ) | ||||||||
|
Net other-than-temporary credit impairment losses
|
(14,696 | ) | (17,832 | ) | (27,101 | ) | (7,815 | ) | ||||||||
|
Net gains (losses) on derivatives
|
44,546 | (92,700 | ) | 40,127 | (106,610 | ) | ||||||||||
|
Net unrealized gains (losses) on financial instruments at fair value
|
(69,793 | ) | (40,955 | ) | (37,260 | ) | (10,425 | ) | ||||||||
|
Gain (loss) on deconsolidation
|
(256 | ) | - | - | - | |||||||||||
|
Gain (loss) on Extinguishment of Debt
|
8,906 | (19,915 | ) | 5,079 | - | |||||||||||
|
Net realized gains (losses) on sales of investments
|
34,285 | 3,539 | 9,685 | 29,565 | ||||||||||||
|
Total other expenses
|
24,569 | 24,362 | 24,103 | 20,362 | ||||||||||||
|
Net income
|
$ | 115,380 | $ | (48,259 | ) | $ | 116,187 | $ | 67,042 | |||||||
|
Net income per share-basic
|
$ | 0.61 | $ | (0.24 | ) | $ | 0.57 | $ | 0.33 | |||||||
|
For the Quarter Ended
|
||||||||||||||||
|
December 31, 2014
|
September 30, 2014
|
June 30, 2014
|
March 31, 2014
|
|||||||||||||
|
(dollars in thousands, except per share data)
|
||||||||||||||||
|
Net Interest Income:
|
||||||||||||||||
|
Interest income
|
$ | 242,455 | $ | 190,355 | $ | 134,318 | $ | 120,667 | ||||||||
|
Interest expense
|
65,794 | 38,886 | 20,680 | 22,425 | ||||||||||||
|
Net interest income
|
176,661 | 151,469 | 113,638 | 98,242 | ||||||||||||
|
Other-than-temporary impairments:
|
||||||||||||||||
|
Total other-than-temporary impairment losses
|
(3,774 | ) | (726 | ) | (3,813 | ) | (400 | ) | ||||||||
|
Portion of loss recognized in other comprehensive income
|
(51,347 | ) | (1,264 | ) | (1,534 | ) | (1,134 | ) | ||||||||
|
Net other-than-temporary credit impairment losses
|
(55,121 | ) | (1,990 | ) | (5,347 | ) | (1,534 | ) | ||||||||
|
Net gains (losses) on derivatives
|
(125,936 | ) | (10,177 | ) | (42,289 | ) | (7,946 | ) | ||||||||
|
Net unrealized gains (losses) on financial instruments at fair value
|
9,812 | 162,921 | 5,791 | 15,010 | ||||||||||||
|
Gain of deconsolidation
|
- | - | 47,846 | - | ||||||||||||
|
Loss on Extinguishment of Debt
|
- | - | - | (2,184 | ) | |||||||||||
|
Net realized gains (losses) on sales of investments
|
23,564 | 64,107 | (4,339 | ) | 8,377 | |||||||||||
|
Total other expenses
|
22,494 | (11,250 | ) | 10,531 | 9,597 | |||||||||||
|
Net income
|
$ | 6,486 | $ | 377,580 | $ | 104,769 | $ | 100,368 | ||||||||
|
Net income per share-basic
|
$ | 0.03 | $ | 1.85 | $ | 0.50 | $ | 0.49 | ||||||||
F-54
Pursuant to the requirements of Section 13 or 15(d) of the Securities Exchange Act of 1934, the registrant has duly caused this report to be signed on its behalf by the undersigned, thereunto duly authorized, in the city of New York, State of New York.
|
CHIMERA INVESTMENT CORPORATION
|
|||
|
Date
|
By:
|
/s/ Matthew Lambiase | |
|
Matthew Lambiase
Chief Executive Officer and President
February 25, 2016
|
|||
Pursuant to the requirements of the Securities Exchange Act of 1934, this report has been signed below by the following persons on behalf of the registrant and in the capacities and on the date indicated.
|
Signatures
|
Title
|
Date
|
|
|
/s/ Matthew Lambiase
|
Chief Executive Officer, President, and
Director (Principal Executive Officer)
|
February 25, 2016
|
|
|
Matthew Lambiase
|
|||
|
/s/ Robert Colligan
|
Chief Financial Officer (Principal Financial
and Accounting Officer)
|
February 25, 2016
|
|
|
Robert Colligan
|
|||
|
/s/ Mark Abrams
|
Director
|
February 25, 2016
|
|
|
Mark Abrams
|
|||
|
/s/ Paul A. Keenan
|
Director
|
February 25, 2016
|
|
|
Paul A. Keenan
|
|||
|
/s/ Paul Donlin
|
Director
|
February 25, 2016
|
|
|
Paul Donlin
|
|||
|
/s/ Gerard Creagh
|
Director
|
February 25, 2016
|
|
|
Gerard Creagh
|
|||
|
/s/ Dennis Mahoney
|
Director
|
February 25, 2016
|
|
|
Dennis Mahoney
|
|||
|
/s/ John P. Reilly
|
Director
|
February 25, 2016
|
|
|
John P. Reilly
|
S-1
TABLE OF CONTENTS
Part IItem 1. BusinessItem 1A. Risk FactorsItem 1B. Unresolved Staff CommentsItem 2. PropertiesItem 3. Legal ProceedingsItem 4. Mine Safety DisclosuresPart IIItem 5. Market For Registrant's Common Equity, Related Stockholder Matters and Issuer Purchases Of Equity SecuritiesItem 6. Selected Financial DataItem 7. Management's Discussion and Analysis Of Financial Condition and Results Of OperationsItem 7A. Quantitative and Qualitative Disclosures About Market RiskItem 8 . Financial Statements and Supplementary DataItem 9. Changes in and Disagreements with Accountants on Accounting and Financial DisclosureItem 9A. Controls and ProceduresItem 9B. Other InformationPart IIIItem 10. Directors, Executive Officers and Corporate GovernanceItem 11. Executive CompensationItem 12. Security Ownership Of Certain Beneficial Owners and Management and Related Stockholder MattersItem 13. Certain Relationships and Related Transactions and Director IndependenceItem 14. Principal Accountant Fees and ServicesPart IVItem 15. Exhibits and Financial Statement Schedules