COLGATE PALMOLIVE CO
10-Ks and 10-Qs
|
|
|
|
|
|
|
|
|
|
|
|
|
|
|
|
|
|
|
|
|
|
|
|
|
|
|
|
|
|
|
|
|
|
|
|
|
|
|
|
|
|
|
|
|
|
|
|
|
|
|
|
|
|
|
|
UNITED STATES SECURITIES AND EXCHANGE COMMISSION
WASHINGTON, D.C. 20549
FORM 10-K
(Mark One)
|
x
|
ANNUAL REPORT PURSUANT TO SECTION 13 OR 15(d) OF THE SECURITIES EXCHANGE ACT OF 1934
|
For the fiscal year ended December 31, 2011
or
|
¨
|
TRANSITION REPORT PURSUANT TO SECTION 13 OR 15(d) OF THE SECURITIES EXCHANGE ACT OF 1934
|
For the transition period from
to
.
Commission File Number 1-644

(Exact name of registrant as specified in its charter)
Registrant’s telephone number, including area code 212-310-2000
|
DELAWARE
|
13-1815595
|
|
(State or other jurisdiction of incorporation or organization)
|
(I.R.S. Employer Identification No.)
|
|
300 Park Avenue, New York, New York
|
10022
|
|
(Address of principal executive offices)
|
(Zip Code)
|
Securities registered pursuant to Section 12(b) of the Act:
|
Title of each class
|
Name of each exchange on which registered
|
|
Common Stock, $1.00 par value
4.75% Notes due 2014
|
New York Stock Exchange
New York Stock Exchange
|
Indicate by check mark if the registrant is a well-known seasoned issuer, as defined in Rule 405 of the Securities Act. Yes
x
No
¨
Indicate by check mark if the registrant is not required to file reports pursuant to Section 13 or Section 15(d) of the Act. Yes
¨
No
x
Indicate by check mark whether the registrant: (1) has filed all reports required to be filed by Section 13 or 15(d) of the Securities Exchange Act of 1934 during the preceding 12 months (or for such shorter period that the registrant was required to file such reports), and (2) has been subject to such filing requirements for the past 90 days. Yes
T
No
£
Indicate by check mark whether the registrant has submitted electronically and posted on its corporate Web site, if any, every Interactive Data File required to be submitted and posted pursuant to Rule 405 of Regulation S-T (§232.405) during the preceding 12 months (or for such shorter period that the registrant was required to submit and post such files). Yes
T
No
£
Indicate by check mark if disclosure of delinquent filers pursuant to Item 405 of Regulation S-K (§229.405) is not contained herein, and will not be contained, to the best of registrant’s knowledge, in definitive proxy or information statements incorporated by reference in Part III of this Form 10-K or any amendment to this Form 10-K.
£
Indicate by check mark whether the registrant is a large accelerated filer, an accelerated filer, a non-accelerated filer, or a smaller reporting company. See the definitions of “large accelerated filer,” “accelerated filer” and “smaller reporting company” in Rule 12b-2 of the Exchange Act.
|
Large accelerated filer
T
|
Accelerated filer
£
|
|
Non-accelerated filer
£
(Do not check if a smaller reporting company)
|
Smaller reporting company
£
|
Indicate by check mark whether the registrant is a shell company (as defined in Rule 12b-2 of the Exchange Act). Yes
¨
No
x
The aggregate market value of Colgate-Palmolive Company Common Stock held by non-affiliates as of June 30, 2011 (the last business day of its most recently completed second quarter) was approximately $42.4 billion.
There were 479,577,590 shares of Colgate-Palmolive Company Common Stock outstanding as of January 31, 2012.
DOCUMENTS INCORPORATED BY REFERENCE:
|
Documents
|
Form 10-K Reference
|
|
Portions of Proxy Statement for the 2012 Annual Meeting of Stockholders
|
Part III, Items 10 through 14
|
Colgate-Palmolive Company
Table of Contents
|
Part I
|
|
Page
|
|
|
|
|
|
Item 1.
|
Business
|
|
|
Item 1A.
|
Risk Factors
|
|
|
Item 1B.
|
Unresolved Staff Comments
|
|
|
Item 2.
|
Properties
|
|
|
Item 3.
|
Legal Proceedings
|
|
|
Item 4.
|
Mine Safety Disclosures
|
|
|
|
|
|
|
Part II
|
|
|
|
Item 5.
|
Market for Registrant’s Common Equity, Related Stockholder Matters and Issuer Purchases of Equity Securities
|
|
|
Item 6.
|
Selected Financial Data
|
|
|
Item 7.
|
Management’s Discussion and Analysis of Financial Condition and Results of Operations
|
|
|
Item 7A.
|
Quantitative and Qualitative Disclosures About Market Risk
|
|
|
Item 8.
|
Financial Statements and Supplementary Data
|
|
|
Item 9.
|
Changes in and Disagreements with Accountants on Accounting and Financial Disclosure
|
|
|
Item 9A.
|
Controls and Procedures
|
|
|
Item 9B.
|
Other Information
|
|
|
|
|
|
|
Part III
|
|
|
|
Item 10.
|
Directors, Executive Officers and Corporate Governance
|
|
|
Item 11.
|
Executive Compensation
|
|
|
Item 12.
|
Security Ownership of Certain Beneficial Owners and Management and Related Stockholder Matters
|
|
|
Item 13.
|
Certain Relationships and Related Transactions and Director Independence
|
|
|
Item 14.
|
Principal Accountant Fees and Services
|
|
|
|
|
|
|
Part IV
|
|
|
|
Item 15.
|
Exhibits and Financial Statement Schedules
|
|
|
|
|
|
|
Signatures
|
||
i
(a) General Development of the Business
Colgate-Palmolive Company (together with its subsidiaries, the “Company” or “Colgate”) is a leading consumer products company whose products are marketed in over 200 countries and territories throughout the world. Colgate was founded in 1806 and incorporated under the laws of the State of Delaware in 1923.
For recent business developments and other information, refer to the information set forth under the captions “Executive Overview and Outlook,” “Results of Operations” and “Liquidity and Capital Resources” in Part II, Item 7 of this report.
(b) Financial Information about Segments
Worldwide Net sales and Operating profit by business segment and geographic region during the last three years appear under the caption “Results of Operations” in Part II, Item 7 of this report and in Note 14 to the Consolidated Financial Statements.
(c) Narrative Description of the Business
The Company manages its business in two product segments: Oral, Personal and Home Care; and Pet Nutrition. Colgate is a global leader in Oral Care with the leading toothpaste and manual toothbrush brands throughout many parts of the world according to value share data provided by ACNielsen. Colgate’s Oral Care products include Colgate Total, Colgate Sensitive Pro-Relief and Colgate Max Fresh toothpastes, Colgate 360° manual toothbrushes and Colgate and Colgate Plax mouth rinses. Colgate’s Oral Care business also includes dental floss and pharmaceutical products for dentists and other oral health professionals.
Colgate is a leader in many product categories of the Personal Care market with global leadership in liquid hand soap, which it sells under the Palmolive, Protex and Softsoap brands. Colgate’s Personal Care products also include Palmolive, Softsoap and Sanex brand shower gels, Palmolive, Irish Spring and Protex bar soaps and Speed Stick, Lady Speed Stick and Sanex deodorants and antiperspirants. Colgate is the market leader in liquid hand soap in the U.S. with its line of Softsoap brand products according to value share data provided by ACNielsen. Colgate’s Personal Care business outside the U.S. also includes Palmolive and Caprice shampoo and conditioners.
Colgate manufactures and markets a wide array of products for Home Care, including Palmolive and Ajax dishwashing liquids, Fabuloso and Ajax household cleaners and Murphy’s Oil Soap. Colgate is a market leader in fabric conditioners with leading brands including Suavitel in Latin America and Soupline in Europe.
Sales of Oral, Personal and Home Care products accounted for 43%, 22% and 22%, respectively, of the Company's total worldwide sales in 2011. Geographically, Oral Care is a significant part of the Company’s business in Greater Asia/Africa,
comprising approximately 73% of sales in that region for 2011.
Colgate, through its Hill’s Pet Nutrition segment (Hill’s), is a world leader in specialty pet nutrition products for dogs and cats with products marketed in over 95 countries around the world. Hill’s markets pet foods primarily under two trademarks: Hill's Science Diet, which is sold by authorized pet supply retailers and veterinarians for everyday nutritional needs; and Hill's Prescription Diet, a range of therapeutic products sold by veterinarians and authorized pet supply retailers to help nutritionally manage disease conditions in dogs and cats. Sales of Pet Nutrition products accounted for 13% of the Company’s total worldwide sales in 2011.
For more information regarding the Company’s worldwide sales by product categories, refer to Notes 1 and 14 to the Consolidated Financial Statements.
1
Research and Development
Strong research and development capabilities and alliances enable Colgate to support its many brands with technologically sophisticated products to meet consumers’ oral, personal, home care and pet nutrition needs. The Company’s spending related to research and development activities was $262 million in 2011 and $256 million in each of 2010 and 2009.
Distribution; Raw Materials; Competition; Trademarks and Patents
The Company’s products are marketed by a direct sales force at individual operating subsidiaries or business units and by distributors or brokers. No single customer accounts for 10% or more of the Company’s sales.
Most raw and packaging materials are purchased from other companies and are available from several sources. No single raw or packaging material represents, and no single supplier provides, a significant portion of the Company’s total material requirements. For certain materials, however, new suppliers may have to be qualified under industry, government and Colgate standards, which can require additional investment and take some period of time. Raw and packaging material commodities such as resins, tropical oils, essential oils, tallow, corn and soybeans are subject to market price variations.
The Company’s products are sold in a highly competitive global marketplace, which has experienced increased trade concentration and the growing presence of large-format retailers and discounters. Products similar to those produced and sold by the Company are available from competitors in the U.S. and overseas. Certain of the Company’s competitors are larger and have greater resources than the Company. In addition, private label brands sold by retail trade chains are a source of competition for certain product lines of the Company. Product quality and innovation, brand recognition, marketing capability and acceptance of new products largely determine success in the Company’s business segments.
Trademarks are considered to be of material importance to the Company’s business. The Company follows a practice of seeking trademark protection in the U.S. and throughout the world where the Company’s products are sold. Principal global and regional trademarks include Colgate, Palmolive, Mennen, Speed Stick, Lady Speed Stick, Softsoap, Irish Spring, Protex, Sorriso, Kolynos, elmex, Tom’s of Maine, Ajax, Axion, Fabuloso, Soupline, Suavitel, Sanex, Hill’s Science Diet and Hill’s Prescription Diet. The Company’s rights in these trademarks endure for as long as they are used and/or registered. Although the Company actively develops and maintains a portfolio of patents, no single patent is considered significant to the business as a whole.
Environmental Matters
The Company has programs that are designed to ensure that its operations and facilities meet or exceed standards established by applicable environmental rules and regulations. Capital expenditures for environmental control facilities totaled
$21 million for 2011. For future years, expenditures are currently expected to be of a similar magnitude. For additional information regarding environmental matters refer to Note 12 to the Consolidated Financial Statements.
Employees
As of December 31, 2011, the Company employed approximately 38,600 employees.
2
Executive Officers of the Registrant
The following is a list of executive officers as of February 23, 2012:
|
Name
|
Age
|
Date First Elected Officer
|
Present Title
|
|||
|
Ian Cook
|
59
|
1996
|
Chairman of the Board
|
|||
|
|
|
|
President and Chief Executive Officer
|
|||
|
Fabian T. Garcia
|
52
|
2003
|
Chief Operating Officer
|
|||
|
|
|
|
Global Innovation & Growth/Europe
|
|||
|
Franck J. Moison
|
58
|
2002
|
Chief Operating Officer
|
|||
|
|
|
|
Emerging Markets
|
|||
|
Dennis J. Hickey
|
63
|
1998
|
Chief Financial Officer
|
|||
|
Andrew D. Hendry
|
64
|
1991
|
Chief Legal Officer and Secretary
|
|||
|
Victoria L. Dolan
|
52
|
2011
|
Vice President and Corporate Controller
|
|||
|
Elaine C. Paik
|
47
|
2010
|
Vice President and Corporate Treasurer
|
|||
|
Ronald T. Martin
|
63
|
2001
|
Vice President
|
|||
|
|
|
|
Global Sustainability and Social Responsibility
|
|||
|
John J. Huston
|
57
|
2002
|
Senior Vice President
|
|||
|
|
|
|
Office of the Chairman
|
|||
|
Delia H. Thompson
|
62
|
2002
|
Senior Vice President
|
|||
|
|
|
|
Investor Relations
|
|||
|
Hector I. Erezuma
|
67
|
2005
|
Vice President
|
|||
|
|
|
|
Taxation
|
|||
|
Daniel B. Marsili
|
51
|
2005
|
Senior Vice President
|
|||
|
|
|
|
Global Human Resources
|
|||
|
Gregory P. Woodson
|
60
|
2007
|
Vice President
|
|||
|
|
|
|
Chief Ethics and Compliance Officer
|
|||
|
Alexandre de Guillenchmidt
|
66
|
2008
|
President
|
|||
|
|
|
|
Colgate – Europe
|
|||
|
Rosemary Nelson
|
64
|
2008
|
Vice President
|
|||
|
|
|
|
Deputy General Counsel, Operations and South Pacific
|
|||
|
P. Justin Skala
|
52
|
2008
|
President
|
|||
|
|
|
|
Colgate – Latin America
|
|||
|
Noel R. Wallace
|
47
|
2009
|
President
|
|||
|
|
|
|
Colgate North America and Global Sustainability
|
|||
|
Neil Thompson
|
56
|
2009
|
President and Chief Executive Officer
|
|||
|
|
|
|
Hill’s Pet Nutrition, Inc.
|
|||
|
Francis M. Williamson
|
64
|
2010
|
Vice President
Finance and Strategic Planning
Latin America
|
|||
|
Katherine Hargrove Ramundo
|
44
|
2011
|
Vice President
|
|||
|
|
|
|
Deputy General Counsel, Specialty Groups and North America and Assistant Secretary
|
|||
|
Thomas W. Greene
|
45
|
2011
|
Vice President
Chief Information Officer
|
|||
|
Patricia Verduin
|
52
|
2011
|
Vice President
Chief Technology Officer
|
|||
Each of the executive officers listed above has served the registrant or its subsidiaries in various executive capacities for the past five years with the exception of Victoria L. Dolan, who joined the Company in 2008 as Vice President, Finance and Strategic Planning, Colgate Europe. Ms. Dolan joined Colgate from Marriott International, Inc. (“Marriott”), where she served as Executive Vice President, Finance and Chief Financial Officer of its vacation ownership division. Prior to joining Marriott
3
in 2000, Ms. Dolan spent nine years at The Coca-Cola Company in several leadership positions that included Chief Financial Officer and Executive Vice President for the Japan division.
Under the Company’s By-Laws, the officers of the corporation hold office until their respective successors are chosen and qualified or until they have resigned, retired or been removed by the affirmative vote of a majority of the Board of Directors. There are no family relationships between any of the executive officers, and there is no arrangement or understanding between any executive officer and any other person pursuant to which the executive officer was elected.
(d) Financial Information about Geographic Areas
For financial data by geographic region, refer to the information set forth under the caption “Results of Operations” in Part II, Item 7, of this report and in Note 14 to the Consolidated Financial Statements. For a discussion of risks associated with our international operations, see Item 1A, “Risk Factors.”
(e) Available Information
The Company’s web site address is
www.colgatepalmolive.com
. The information contained on the Company’s web site is not included as a part of, or incorporated by reference into, this Annual Report on Form 10-K. The Company makes available, free of charge, on its web site its annual reports on Form 10-K, its quarterly reports on Form 10-Q, its interactive data files posted pursuant to Rule 405 of Regulation S-T, its current reports on Form 8-K and amendments to such reports filed or furnished pursuant to Section 13(a) or 15(d) of the Securities Exchange Act of 1934 (the Exchange Act) as soon as reasonably practicable after the Company has electronically filed such material with, or furnished it to, the United States Securities and Exchange Commission (the SEC). Also available on the Company’s web site are the Company’s Code of Conduct and Corporate Governance Guidelines, the charters of the Committees of the Board of Directors, reports under Section 16 of the Exchange Act of transactions in Company stock by directors and officers and its proxy statements.
Set forth below is a summary of the material risks to an investment in our securities. These risks are not the only ones we face. Additional risks not presently known to us or that we currently deem immaterial may also have an adverse effect on us. If any of the below risks actually occur, our business, results of operations, cash flows or financial condition could suffer, which might cause the value of our securities to decline.
We face risks associated with significant international operations, including exposure to foreign currency fluctuations.
We operate on a global basis with approximately
80%
of our net sales coming from markets outside the U.S. While geographic diversity helps to reduce the Company’s exposure to risks in any one country or part of the world, it also means that we are subject to the full range of risks associated with significant international operations, including, but not limited to:
|
▪
|
changes in exchange rates for foreign currencies, which may reduce the U.S. dollar value of revenues, profits and cash flows we receive from non-U.S. markets or increase our supply costs, as measured in U.S. dollars, in those markets,
|
|
▪
|
exchange controls and other limits on our ability to repatriate earnings from overseas,
|
|
▪
|
political or economic instability or changing macroeconomic conditions in our major markets,
|
|
▪
|
lack of well-established or reliable legal systems in certain countries where the Company operates,
|
|
▪
|
foreign ownership restrictions and the potential for nationalization or expropriation of property or other resources, and
|
|
▪
|
foreign or domestic legal and regulatory requirements, including those resulting in potentially adverse tax consequences or the imposition of onerous trade restrictions, price controls or other government controls.
|
These risks could have a significant impact on our ability to sell our products on a competitive basis in international markets and may have a material adverse effect on our results of operations, cash flows and financial condition.
In an effort to minimize the impact on earnings of foreign currency rate movements, the Company engages in a combination of cost-containment measures, selling price increases and selective hedging of foreign currency transactions. However, these measures may not succeed in offsetting any negative impact of foreign currency rate movements on our business and results of operations.
4
For example, in 2010 our results of operations were adversely impacted by the designation of Venezuela as hyperinflationary and the subsequent currency devaluations in Venezuela. Also, in November 2011, a new price control law came into effect in Venezuela. While it is not yet clear how the new law will be implemented, it could adversely affect the Company's current pricing strategies in Venezuela. Going forward, additional currency devaluations or continued or worsening foreign exchange or price controls in Venezuela could have an adverse impact on our business and results of operations. For additional information regarding the risks associated with our operations in Venezuela, refer to Item 7 “Management’s Discussion and Analysis of Financial Condition and Results of Operations – Executive Overview and Outlook” and Note 13 to the Consolidated Financial Statements.
Uncertain global economic conditions and disruptions in the credit markets may adversely affect our business.
Uncertain global economic conditions could adversely affect our business. Recent global economic trends pose challenges to our business and could result in declining revenues, profitability and cash flow. Although we continue to devote significant resources to support our brands, during periods of economic uncertainty consumers may switch to economy brands, which could reduce sales volumes of our products or result in a shift in our product mix from higher margin to lower margin product offerings. Additionally, retailers may increase pressure on our selling prices or increase promotional activity for lower-priced or value offerings as they seek to maintain sales volumes and margins. For example, continuing economic uncertainty in Europe, and a worsening of the debt crisis there, could negatively affect consumer confidence globally.
While we currently generate significant cash flows from our ongoing operations and have access to global credit markets through our various financing activities, any disruption in the credit markets, including in Europe, could limit the availability of credit or the ability or willingness of financial institutions to extend credit, which could adversely affect our liquidity and capital resources or significantly increase our cost of capital. If any financial institutions that are parties to our revolving credit facility supporting our commercial paper program or other financing arrangements, such as interest rate or foreign exchange hedging instruments, were to declare bankruptcy or become insolvent, they may be unable to perform under their agreements with us. This could leave us with reduced borrowing capacity or unhedged against certain interest rate or foreign currency exposures. In addition, tighter credit markets may lead to business disruptions for certain of our suppliers, contract manufacturers or trade customers which could, in turn, adversely impact our business.
Significant competition in our industry could adversely affect our business.
We face vigorous competition around the world, including from other large, multinational companies, some of which have greater resources than we do. We face this competition in several aspects of our business, including, but not limited to, the pricing of products, promotional activities and new product introductions. Such competition also extends to administrative and legal challenges of product claims and advertising. Our ability to compete also depends on the strength of our brands and on our ability to defend our patent, trademark and trade dress rights against legal challenges brought by competitors.
We may be unable to anticipate the timing and scale of such initiatives or challenges by competitors or to successfully counteract them, which could harm our business. In addition, the cost of responding to such initiatives and challenges, both in terms of management time and out-of-pocket expenses, may affect our performance in the relevant period. A failure to compete effectively could adversely affect our growth and profitability.
Changes in the policies of our retail trade customers and increasing dependence on key retailers in developed markets may adversely affect our business.
Our products are sold in a highly competitive global marketplace which has experienced increased trade concentration and the growing presence of large-format retailers and discounters. With the growing trend toward retail trade consolidation, we are increasingly dependent on key retailers, and some of these retailers, including large-format retailers, may have greater bargaining strength than we do. They may use this leverage to demand higher trade discounts, allowances or slotting fees, which could lead to reduced sales or profitability. Also, tighter credit or capital markets could negatively affect our retail customers and as a result, affect our working capital. We may also be negatively affected by changes in the policies of our retail trade customers, such as inventory de-stocking, limitations on access to shelf space, delisting of our products, environmental or sustainability initiatives and other conditions. In addition, private label products sold by retail trade chains, which are typically sold at lower prices than branded products, are a source of competition for certain of our product lines, including liquid hand soaps and shower gels.
5
The growth of our business depends on the successful development and introduction of innovative new products.
Our growth depends on the continued success of existing products as well as the successful development and introduction of innovative new products and line extensions, which face the uncertainty of retail and consumer acceptance and reaction from competitors. In addition, our ability to create new products and line extensions and to sustain existing products is affected by whether we can successfully:
|
▪
|
develop and fund technological innovations,
|
|
▪
|
obtain and maintain necessary patent and trademark protection and avoid infringing intellectual property rights of others,
|
|
▪
|
obtain approvals and registrations of regulated products, including from the U.S. Food and Drug Administration (FDA) and other regulatory bodies in the U.S. and abroad, and
|
|
▪
|
anticipate consumer needs and preferences.
|
The failure to develop and launch successful new products could hinder the growth of our business and any delay in the development or launch of a new product could result in the Company not being the first to market, which could compromise our competitive position.
Volatility in material and other costs and our increasing dependence on key suppliers could adversely impact our profitability.
Raw and packaging material commodities such as resins, tropical oils, essential oils, tallow, corn and soybeans are subject to wide price variations. Increases in the costs and availability of these commodities and the costs of energy, transportation and other necessary services may adversely affect our profit margins if we are unable to pass along any higher costs in the form of price increases or otherwise achieve cost efficiencies such as in manufacturing and distribution. In addition, our move to global suppliers for materials and other services in order to achieve cost reductions and simplify our business has resulted in an increasing dependence on key suppliers. For certain materials, new suppliers may have to be qualified under industry, government and Colgate standards, which can require additional investment and take some period of time. While we believe that the supplies of raw materials needed to manufacture our products are adequate, global economic conditions, supplier capacity constraints and other factors could affect the availability of, or prices for, those raw materials.
Damage to our reputation could have an adverse effect on our business.
Maintaining our strong reputation with consumers and our trade partners globally is critical to selling our branded products. Accordingly, we devote significant time and resources to programs designed to protect and preserve our reputation, such as our Ethics and Compliance, Sustainability, Brand Protection and Product Safety, Regulatory and Quality initiatives.
In addition, from time to time, third parties sell counterfeit versions of our products, which are inferior or may pose safety risks. As a result, consumers of our brands could confuse our products with these counterfeit products, which could cause them to refrain from purchasing our brands in the future and in turn could impair our brand equity and adversely affect our business.
Similarly, adverse publicity regarding our responses to health concerns, our environmental impacts, including packaging, energy and water use and waste management, or other sustainability issues, whether or not deserved, could jeopardize our reputation. Damage to our reputation or loss of consumer confidence in our products for any of these reasons could have a material adverse effect on our business, as well as require resources to rebuild our reputation.
Our business is subject to product liability claims.
From time to time the Company may be subject to product liability claims alleging, among other things, that its products cause damage to property or persons, provide inadequate instructions or warnings regarding their use or contain design or manufacturing defects or contaminants. For example, the Company has been named in product liability actions alleging that certain talc products it sold prior to 1996 were contaminated with asbestos, causing harm to consumers. In addition, if one of the Company's products, or a raw material contained in our products, is perceived or found to be defective or unsafe, we may need to recall some of our products. Whether or not a product liability claim is successful, or a recall required, such assertions could have an adverse effect on our business and the negative publicity surrounding them could harm our reputation and brand image.
6
Our business is subject to regulation in the U.S. and abroad.
Our business is subject to extensive regulation in the U.S. and abroad. Such regulation applies to most aspects of our products, including their development, ingredients, manufacture, packaging, labeling, storage, transportation, distribution, export, import, advertising and sale. Also, our selling practices are regulated by competition law authorities in the U.S. and abroad. U.S. federal authorities, including the Food and Drug Administration (FDA), the Federal Trade Commission, the Consumer Product Safety Commission and the Environmental Protection Agency (EPA), regulate different aspects of our business, along with parallel authorities at the state and local level and comparable authorities overseas.
While it is our policy and practice to comply with all regulatory requirements applicable to our business, a finding that we are in violation of, or out of compliance with, applicable laws or regulations could subject us to civil remedies, including fines, damages, injunctions or product recalls, or criminal sanctions, any of which could have a material adverse effect on our business. Even if a claim is unsuccessful, is without merit or is not fully pursued, the negative publicity surrounding such assertions regarding our products, processes or business practices could adversely affect our reputation and brand image. For information regarding our European competition matters, see Item 3, “Legal Proceedings” and Note 12 to the Consolidated Financial Statements.
In addition, new or more stringent regulations, or more restrictive interpretations of existing regulations, could have a material adverse impact on our business. For example, from time to time, various regulatory authorities and consumer groups in Europe, the U.S. and other countries request or conduct reviews of the use of various ingredients in consumer products. Triclosan, an ingredient used primarily in Colgate Total toothpaste as well as certain other oral care products and soaps, is an example of an ingredient that has undergone reviews by various regulatory authorities around the world. A finding by a regulatory authority that triclosan, or any other of our ingredients, should not be used in certain consumer products or should otherwise be newly regulated, could have a material adverse impact on our business, as could negative reactions by our consumers, trade customers or non-governmental organizations to our use of such ingredients. Additionally, an inability to timely obtain regulatory approval of new or reformulated products containing alternative ingredients could likewise have a material adverse effect on our business.
Our business is subject to the risks inherent in global manufacturing and sourcing activities.
The Company is engaged in manufacturing and sourcing of products and materials on a global scale. We are subject to the risks inherent in such activities, including, but not limited to:
|
▪
|
industrial accidents or other occupational health and safety issues,
|
|
▪
|
environmental events,
|
|
▪
|
strikes and other labor disputes,
|
|
▪
|
disruptions in logistics,
|
|
▪
|
loss or impairment of key manufacturing sites,
|
|
▪
|
raw material and product quality or safety issues,
|
|
▪
|
the impact on our suppliers of tighter credit or capital markets, and
|
|
▪
|
natural disasters, acts of war or terrorism and other external factors over which we have no control.
|
While we have business continuity and contingency plans for key manufacturing sites and the supply of raw materials, significant disruption of manufacturing for any of the above reasons could interrupt product supply and, if not remedied, have an adverse impact on our business.
A failure of a key information technology system could adversely impact the Company’s ability to conduct business.
The Company relies extensively on information technology systems, including some which rely on third-party service providers, in order to conduct its business. These systems include, but are not limited to, programs and processes relating to communicating within the Company and with other parties, ordering and managing materials from suppliers, converting materials to finished products, shipping products to customers, processing transactions, summarizing and reporting results of operations, complying with regulatory legal or tax requirements and other processes involved in managing the business. Although the Company has network security measures in place, the systems may be vulnerable to computer viruses,
7
security breaches and other similar disruptions from unauthorized users. While the Company has business continuity plans in place, if the systems are damaged or cease to function properly due to any number of causes, including the poor performance or failure of third-party service providers, catastrophic events, power outages, security breaches, network outages, failed upgrades or other similar events, and if the business continuity plans do not effectively resolve such issues on a timely basis, the Company may suffer interruptions in the ability to manage or conduct business which may adversely impact the Company’s business.
Our success depends upon our ability to attract and retain key employees and the succession of senior management.
Our success largely depends on the performance of our management team and other key employees. If we are unable to attract and retain talented, highly qualified senior management and other key people, our future operations could be adversely affected. In addition, if we are unable to effectively provide for the succession of senior management, including our Chief Executive Officer, our business may be materially adversely affected. While we follow a disciplined, ongoing succession planning process and have succession plans in place for senior management and other key executives, these do not guarantee that the services of qualified senior executives will continue to be available to us at particular moments in time.
None.
The Company owns or leases approximately 330 properties which include manufacturing, distribution, research and office facilities worldwide. Our corporate headquarters is located in leased property at 300 Park Avenue, New York, New York.
In the U.S., the Company operates approximately 60 properties, of which 15 are owned. Major U.S. manufacturing and warehousing facilities used by the Oral, Personal and Home Care segment of our business are located in Morristown, New Jersey; Morristown, Tennessee; and Cambridge, Ohio. The Pet Nutrition segment has major facilities in Bowling Green, Kentucky; Topeka, Kansas; Emporia, Kansas; and Richmond, Indiana. The primary research center for Oral, Personal and Home Care products is located in Piscataway, New Jersey and the primary research center for Pet Nutrition products is located in Topeka, Kansas. Our global data center is also located in Piscataway, New Jersey.
Overseas, the Company operates approximately 270 properties, of which 73 are owned, in over 70 countries. Major overseas facilities used by the Oral, Personal and Home Care segment of our business are located in Australia, Brazil, China, Colombia, France, Italy, Mexico, Poland, South Africa, Thailand, Venezuela, Vietnam and elsewhere throughout the world. The Pet Nutrition segment has a major facility in the Czech Republic.
All of the facilities we operate are well maintained and adequate for the purpose for which they are intended.
As a global company serving consumers in more than 200 countries and territories, the Company is routinely subject to a wide variety of legal proceedings. These include disputes relating to intellectual property, contracts, product liability, marketing, advertising, foreign exchange controls, antitrust and trade regulation, as well as labor and employment, environmental and tax matters. Management proactively reviews and monitors the Company’s exposure to, and the impact of, environmental matters. The Company is party to various environmental matters and, as such, may be responsible for all or a portion of the cleanup, restoration and post-closure monitoring of several sites.
8
As a matter of course, the Company is regularly audited by the Internal Revenue Service (IRS) and other tax authorities around the world in countries where it conducts business. In this regard, all U.S. federal income tax returns through December 31, 2007 have been audited by the IRS and there are limited matters in administrative appeals for years 2002 through 2007, the settlement of which is not expected to have a material adverse effect on the Company's results of operations, cash flows or financial condition. With a few exceptions, the Company is no longer subject to U.S., state and local income tax examinations for the years prior to 2007. In addition, the Company has subsidiaries in various foreign jurisdictions that have statutes of limitations for tax audits generally ranging from three to six years. Estimated incremental tax payments related to potential disallowances for subsequent periods are not expected to be material.
The Company establishes accruals for loss contingencies when it has determined that a loss is probable and that the amount of loss, or range of loss, can be reasonably estimated. Any such accruals are adjusted thereafter as appropriate to reflect changes in circumstances.
The Company also determines estimates of reasonably possible losses or ranges of reasonably possible losses in excess of related accrued liabilities, if any, when it has determined that a loss is reasonably possible and it is able to determine such estimates. For those matters disclosed below, the Company currently estimates that the aggregate range of reasonably possible losses in excess of any accrued liabilities is $
0
to approximately $
200
million (based on current exchange rates). The estimates included in this amount are based on the Company’s analysis of currently available information and, as new information is obtained, these estimates may change. Due to the inherent subjectivity of the assessments and the unpredictability of outcomes of legal proceedings, any amounts accrued or included in this aggregate amount may not represent the ultimate loss to the Company from the matters in question. Thus, the Company’s exposure and ultimate losses may be higher or lower, and possibly significantly so, than the amounts accrued or the range disclosed above.
Based on current knowledge, management does not believe that the ultimate resolution of loss contingencies arising from the matters discussed herein will have a material effect on the Company’s consolidated financial position or its ongoing results of operations or cash flows. However, in light of the inherent uncertainties noted above, an adverse outcome in one or more of these matters could be material to the Company’s results of operations or cash flows for any particular quarter or year.
Brazilian Matters
In 2001, the Central Bank of Brazil sought to impose a substantial fine on the Company’s Brazilian subsidiary based on alleged foreign exchange violations in connection with the financing of the Company’s 1995 acquisition of the Kolynos oral care business from Wyeth (formerly American Home Products) (the Seller), as described in the Company’s Form 8-K dated January 10, 1995. The Company appealed the imposition of the fine to the Brazilian Monetary System Appeals Council (the Council), and on January 30, 2007, the Council decided the appeal in the Company’s favor, dismissing the fine entirely. However, certain tax and civil proceedings that began as a result of this Central Bank matter are still outstanding as described below.
The Brazilian internal revenue authority has disallowed interest deductions and foreign exchange losses taken by the Company’s Brazilian subsidiary for certain years in connection with the financing of the Kolynos acquisition. The tax assessments with interest, at the current exchange rate, approximate $
113
million. The Company has been disputing the disallowances by appealing the assessments within the internal revenue authority’s appellate process with the following results to date:
|
▪
|
In June 2005, the First Board of Taxpayers ruled in the Company’s favor and allowed all of the previously claimed deductions for 1996 through 1998. In March 2007, the First Board of Taxpayers ruled in the Company’s favor and allowed all of the previously claimed deductions for 1999 through 2001. The tax authorities appealed these decisions to the next administrative level.
|
|
▪
|
In August 2009, the First Taxpayers’ Council (the next and final administrative level of appeal) overruled the decisions of the First Board of Taxpayers, upholding the majority of the assessments, disallowing a portion of the assessments and remanding a portion of the assessments for further consideration by the First Board of Taxpayers.
|
The Company has filed a motion for clarification with a special appeals chamber of the Taxpayers’ Council and further appeals are available within the Brazilian federal courts. The Company intends to challenge these assessments vigorously. Although there can be no assurances, management believes, based on the opinion of its Brazilian legal counsel and other advisors, that the disallowances are without merit and that the Company should ultimately prevail on appeal, if necessary, in the Brazilian federal courts.
9
In 2002, the Brazilian Federal Public Attorney filed a civil action against the federal government of Brazil, Laboratorios Wyeth-Whitehall Ltda. (the Brazilian subsidiary of the Seller) and the Company, as represented by its Brazilian subsidiary, seeking to annul an April 2000 decision by the Brazilian Board of Tax Appeals that found in favor of the Seller’s Brazilian subsidiary on the issue of whether it had incurred taxable capital gains as a result of the divestiture of Kolynos. The action seeks to make the Company’s Brazilian subsidiary jointly and severally liable for any tax due from the Seller’s Brazilian subsidiary. Although there can be no assurances, management believes, based on the opinion of its Brazilian legal counsel, that the Company should ultimately prevail in this action. The Company intends to challenge this action vigorously.
In December 2005, the Brazilian internal revenue authority issued to the Company’s Brazilian subsidiary a tax assessment with interest and penalties of approximately $
67
million, at the current exchange rate, based on a claim that certain purchases of U.S. Treasury bills by the subsidiary and their subsequent disposition during the period 2000 to 2001 were subject to a tax on foreign exchange transactions. The Company is disputing the assessment within the internal revenue authority’s administrative appeals process. In October 2007, the Second Board of Taxpayers, which has jurisdiction over these matters, ruled in favor of the internal revenue authority. In January 2008, the Company appealed this decision, and in January 2012, a special appeals chamber of the Taxpayers’ Council denied the Company's appeal. Although there can be no assurances, management believes, based on the advice of its Brazilian legal counsel, that the tax assessment is without merit and that the Company should prevail on appeal, if not at the administrative level, in the Brazilian federal courts. The Company intends to challenge this assessment vigorously.
European Competition Matters
Since February 2006, the Company has learned that investigations relating to potential competition law violations involving the Company’s subsidiaries had been commenced by governmental authorities in a number of European countries and by the European Commission. The Company understands that substantially all of these investigations also involve other consumer goods companies and/or retail customers. The status of the various pending matters is discussed below.
Fines have been imposed on the Company in the following matters, although the Company is appealing these fines:
|
▪
|
In December 2009, the Swiss competition law authority imposed a fine of $
5
million on the Company’s GABA subsidiary for alleged violations of restrictions on parallel imports into Switzerland. The Company is appealing the fine in the Swiss courts.
|
|
▪
|
In January 2010, the Spanish competition law authority found that four suppliers of shower gel had entered into an agreement regarding product down-sizing, for which Colgate’s Spanish subsidiary was fined $
3
million. The Company is appealing the fine in the Spanish courts.
|
|
▪
|
In December 2010, the Italian competition law authority found that 16 consumer goods companies, including the Company’s Italian subsidiary, exchanged competitively sensitive information in the cosmetics sector, for which the Company’s Italian subsidiary was fined $
3
million. The Company is appealing the fine in the Italian courts.
|
|
▪
|
In December 2011, the French competition law authority found that four consumer goods companies had entered into agreements on pricing and promotion of heavy duty detergents for which Colgate's French subsidiary was fined $46 million in connection with a divested business. The Company is appealing the fine in the French courts.
|
Currently, formal claims of violations, or statements of objections, are pending against the Company as follows:
|
▪
|
The French competition law authority alleges violations of competition law by three pet food producers, including the Company’s Hill’s France subsidiary, focusing on exclusivity arrangements and parallel trade restrictions.
|
|
▪
|
The German competition law authority alleges that 17 branded goods companies, including the Company’s German subsidiary, exchanged sensitive information related to the German market.
|
The Company has responded to each of these formal claims of violations. Investigations are ongoing in Belgium, France and Greece, but no formal claims of violations have been filed in these jurisdictions except in France as noted above.
During 2011, the following matters have been resolved:
|
▪
|
In April 2011, the investigation by the European Commission was resolved with no formal claims of violations or decisions made against the Company. To the Company’s knowledge, there are no other investigations by the European Commission relating to potential competition law violations involving the Company or its subsidiaries.
|
10
|
▪
|
In May 2011, the Dutch competition authority closed its investigation and no decision was made against the Company or its Dutch subsidiary.
|
The Company’s policy is to comply with antitrust and competition laws and, if a violation of any such laws is found, to take appropriate remedial action and to cooperate fully with any related governmental inquiry. The Company has undertaken a comprehensive review of its selling practices and related competition law compliance in Europe and elsewhere and, where the Company has identified a lack of compliance, it has undertaken remedial action. Competition and antitrust law investigations often continue for several years and can result in substantial fines for violations that are found. While the Company cannot predict the final financial impact of these competition law issues as these matters may change, the Company evaluates developments in these matters quarterly and accrues liabilities as and when appropriate.
ERISA Matters
In October 2007, a putative class action claiming that certain aspects of the cash balance portion of the Colgate-Palmolive Company Employees’ Retirement Income Plan (the Plan) do not comply with the Employee Retirement Income Security Act was filed against the Plan and the Company in the United States District Court for the Southern District of New York. Specifically,
Proesel, et al. v. Colgate-Palmolive Company Employees’ Retirement Income Plan, et al.
alleges improper calculation of lump sum distributions, age discrimination and failure to satisfy minimum accrual requirements, thereby resulting in the underpayment of benefits to Plan participants. Two other putative class actions filed earlier in 2007,
Abelman, et al. v. Colgate-Palmolive Company Employees’ Retirement Income Plan, et al.
, in the United States District Court for the Southern District of Ohio, and
Caufield v. Colgate-Palmolive Company Employees’ Retirement Income Plan
, in the United States District Court for the Southern District of Indiana, both alleging improper calculation of lump sum distributions and, in the case of
Abelman
, claims for failure to satisfy minimum accrual requirements, were transferred to the Southern District of New York and consolidated with
Proesel
into one action,
In re Colgate-Palmolive ERISA Litigation
. The complaint in the consolidated action alleges improper calculation of lump sum distributions and failure to satisfy minimum accrual requirements, but does not include a claim for age discrimination. The relief sought includes recalculation of benefits in unspecified amounts, pre- and post-judgment interest, injunctive relief and attorneys’ fees. This action has not been certified as a class action as yet. The parties are in discussions via non-binding mediation to determine whether the action can be settled. The Company and the Plan intend to contest this action vigorously should the parties be unable to reach a settlement.
Not Applicable.
11
|
ITEM 5.
|
MARKET FOR REGISTRANT'S COMMON EQUITY, RELATED STOCKHOLDER MATTERS AND ISSUER PURCHASES OF EQUITY SECURITIES
|
For information regarding the market for the Company’s common stock, including quarterly market prices and dividends, refer to “Market and Dividend Information.” For information regarding the number of common shareholders of record refer to “Historical Financial Summary.” For information regarding the securities authorized for issuance under our equity compensation plans, refer to “Security Ownership of Certain Beneficial Owners and Management and Related Stockholder Matters” included in Item 12 of this report.
Issuer Purchases of Equity Securities
On September 8, 2011, the Company’s Board of Directors authorized a new share repurchase program (the 2011 Program) that replaced the Company’s previous share repurchase program which had been approved in 2010. The 2011 Program authorizes the repurchase of up to 50 million shares of the Company’s common stock. The Board also has authorized share repurchases on an on-going basis to fulfill certain requirements of the Company’s compensation and benefit programs. The shares will be repurchased from time to time in open market transactions or privately negotiated transactions at the Company’s discretion, subject to market conditions, customary blackout periods and other factors.
The following table shows the stock repurchase activity for each of the three months in the quarter ended
December 31, 2011:
|
Month
|
Total Number of Shares Purchased
(1)
|
Average Price Paid per Share
|
Total Number of Shares Purchased
as Part of Publicly Announced Plans or Programs
(2)
|
Maximum
Number of Shares that May Yet Be Purchased Under the Plans or Programs
|
|||||||||
|
October 1 through 31, 2011
|
556,000
|
|
$
|
90.00
|
|
520,000
|
|
48,179,489
|
|
||||
|
November 1 through 30, 2011
|
2,047,281
|
|
$
|
88.45
|
|
2,030,000
|
|
46,149,489
|
|
||||
|
December 1 through 31, 2011
|
2,123,388
|
|
$
|
91.21
|
|
2,100,000
|
|
44,049,489
|
|
||||
|
Total
|
4,726,669
|
|
$
|
89.87
|
|
4,650,000
|
|
|
|
||||
_______
|
(1)
|
Includes share repurchases under the 2011 Program and those associated with certain employee elections under the Company’s compensation and benefit programs.
|
|
(2)
|
The difference between the total number of shares purchased and the total number of shares purchased as part of publicly announced plans or programs is
76,669
shares, all of which relate to shares deemed surrendered to the Company to satisfy certain employee elections under its compensation and benefit programs.
|
Refer to the information set forth under the caption “Historical Financial Summary.”
12
(Dollars in Millions Except Per Share Amounts)
|
ITEM 7.
|
MANAGEMENT'S DISCUSSION AND ANALYSIS OF FINANCIAL CONDITION AND RESULTS OF OPERATIONS
|
Executive Overview and Outlook
Colgate-Palmolive Company seeks to deliver strong, consistent business results and superior shareholder returns by providing consumers globally with products that make their lives healthier and more enjoyable.
To this end, the Company is tightly focused on two product segments: Oral, Personal and Home Care; and Pet Nutrition. Within these segments, the Company follows a closely defined business strategy to develop and increase market leadership positions in key product categories. These product categories are prioritized based on their capacity to maximize the use of the organization’s core competencies and strong global equities and to deliver sustainable long-term growth.
Operationally, the Company is organized along geographic lines with management teams having responsibility for the business and financial results in each region. The Company competes in more than 200 countries and territories worldwide with established businesses in all regions contributing to the Company’s sales and profitability. Approximately
80%
of our net sales are generated from markets outside the U.S., with approximately
50%
of our net sales coming from emerging markets (which consist of Latin America, Greater Asia/Africa (excluding Japan) and Central Europe). This geographic diversity and balance help to reduce the Company’s exposure to business and other risks in any one country or part of the world.
The Oral, Personal and Home Care segment is operated through four reportable operating segments: North America, Latin America, Europe/South Pacific and Greater Asia/Africa, all of which sell to a variety of retail and wholesale customers and distributors. The Company, through Hill’s Pet Nutrition, also competes on a worldwide basis in the pet nutrition market, selling its products principally through specialty pet retailers and the veterinary profession.
On an ongoing basis, management focuses on a variety of key indicators to monitor business health and performance. These indicators include market share, sales (including volume, pricing and foreign exchange components), organic sales growth (Net sales growth excluding the impact of foreign exchange, acquisitions and divestments), gross profit margin, operating profit, net income and earnings per share, as well as measures used to optimize the management of working capital, capital expenditures, cash flow and return on capital. The monitoring of these indicators, and the Company’s corporate governance practices (including the Company’s Code of Conduct), help to maintain business health and strong internal controls.
To achieve its business and financial objectives, the Company focuses the organization on initiatives to drive and fund growth. The Company seeks to capture significant opportunities for growth by identifying and meeting consumer needs within its core categories, through its focus on innovation and the deployment of valuable consumer and shopper insights in the development of successful new products regionally, which are then rolled out on a global basis. To enhance these efforts, the Company has developed key initiatives to build strong relationships with consumers, dental and veterinary professionals and retail customers. Growth opportunities are greater in those areas of the world in which economic development and rising consumer incomes expand the size and number of markets for the Company’s products.
The investments needed to support this growth are developed through continuous, Company-wide initiatives to lower costs and increase effective asset utilization through which the Company seeks to become even more effective and efficient throughout its businesses, which are referred to as the Company’s funding-the-growth initiatives. The Company also continues to prioritize its investments toward its higher margin businesses, specifically Oral Care, Personal Care and Pet Nutrition.
On June 20, 2011, the Company, Colgate-Palmolive Europe Sàrl, Unilever N.V. and Unilever PLC (together with Unilever N.V., “Unilever”) finalized the Company’s acquisition from Unilever of the Sanex personal care business in accordance with a Business and Share Sale and Purchase Agreement for an aggregate purchase price of
€676
(
$966
), subject to certain post-closing purchase price adjustments. The acquisition was financed with available cash, proceeds from the sale of the Company’s Euro-denominated investment portfolio and the issuance of commercial paper.
On July 29, 2011, in connection with the Sanex acquisition, Colgate sold its laundry detergent business in Colombia to Unilever for
$215
resulting in a pretax gain of
$207
(
$135
aftertax gain). This gain was more than offset by pretax costs of
$224
(
$177
aftertax costs) associated with the implementation of various business realignment and other cost-saving initiatives, the sale of land in Mexico and a competition law matter in France related to a divested detergent business, as discussed further below.
The various business realignment and other cost-saving initiatives include the integration of Sanex, the right-sizing of the Colombia business and the closing of an oral care facility in Mississauga, Canada and a Hill’s facility in Los Angeles, CA.
13
(Dollars in Millions Except Per Share Amounts)
On September 13, 2011, the Company’s Mexican subsidiary entered into an agreement to sell to the United States of America the Mexico City site on which its commercial operations, technology center and soap production facility are located. The sale price is payable in three installments, with the final installment due upon the transfer of the property, which is expected to occur in 2014. The Company intends to re-invest these payments to relocate its soap production to a new state-of-the-art facility to be constructed at its Mission Hills, Mexico site, to relocate its commercial and technology operations within Mexico City and to prepare the existing site for transfer. As a result, over the next three years, the Company expects to make capital improvements and incur costs to exit the site. These exit costs will primarily be related to staff leaving indemnities, accelerated depreciation and demolition.
As disclosed in Item 1A, “Risk Factors”, with over
80%
of its Net sales generated outside of the United States, the Company is exposed to changes in economic conditions and foreign currency exchange rates, as well as political uncertainty in some countries, all of which could impact future operating results. For example, as discussed in detail below, the operating environment in Venezuela is challenging, with economic uncertainty fueled by currency devaluations and high inflation and governmental restrictions in the form of import authorization controls, currency exchange controls, price controls and the possibility of expropriation of property or other resources.
In particular, as a result of the devaluations of the Venezuelan bolivar fuerte described more fully in Note 13 “Venezuela” to the Consolidated Financial Statements, the local currency operations of the Company’s Venezuelan subsidiary (CP Venezuela) now translate into fewer U.S. dollars. The Company has taken, and continues to take, actions to mitigate the impact of both devaluations on its operations, although its ability to do so in the future may be limited due to new price controls instituted by the Venezuelan government. As a result, the Company may be unable to implement its pricing strategy to offset the effects of inflation in Venezuela.
Additionally, the Venezuelan government continues to impose import authorization controls and currency exchange and payment controls. During 2010, a new currency market was established and the government closed the free-floating parallel market. Under existing regulations, CP Venezuela is not permitted to access the new currency market, but continues to have limited access to U.S. dollars at the official rate, and currently only for imported goods. As a result, CP Venezuela funds its requirements for imported goods through a combination of U.S. dollars obtained from the government at the official rate, intercompany borrowings and existing U.S. dollar cash balances, which were obtained previously through parallel market transactions and through the prior liquidation of its U.S. dollar-denominated bond portfolio.
The Company’s business in Venezuela, and the Company's ability to repatriate its earnings, continue to be negatively affected by these difficult conditions and would be further negatively affected by additional devaluations or the imposition of additional or more stringent controls on foreign currency exchange, pricing or imports or other governmental actions. For the year ended
December 31, 2011
, CP Venezuela represented approximately
5%
of the Company’s consolidated Net sales. At
December 31, 2011
, CP Venezuela’s local currency monetary net asset position was approximately $
311
.
Looking forward, we expect global macroeconomic and market conditions to remain highly challenging. While the global marketplace in which we operate has always been highly competitive, the Company continues to experience heightened competitive activity in certain markets from other large multinational companies, some of which have greater resources than we do. Such activities have included more aggressive product claims and marketing challenges, as well as increased promotional spending. Additionally, we continue to experience volatile foreign currency fluctuations and high commodity costs. While the Company has taken, and will continue to take, measures to mitigate the effect of these conditions, should they persist, they could adversely affect the Company’s future results.
The Company believes it is well prepared to meet the challenges ahead due to its strong financial condition, experience operating in challenging environments and continued focus on the Company’s recently updated strategic initiatives: engaging to build our brands; innovation for growth; effectiveness and efficiency; and leading to win. This focus, together with the strength of the Company’s global brand names and its broad international presence in both mature and emerging markets, should position the Company well to increase shareholder value over the long term.
Results of Operations
Net Sales
Worldwide Net sales were
$16,734
in 2011, up
7.5%
from 2010, driven by volume growth of
3.5%
, net selling price increases of
1.0%
and a positive foreign exchange impact of
3.0%
. Excluding the impact of the divestment of the non-core laundry detergent business in Colombia, volume increased
4.0%
. The Sanex business contributed
1.0%
to worldwide Net sales and volume growth in 2011. Organic sales (Net sales excluding foreign exchange, acquisitions and divestments) increased
4.0%
, on organic volume growth of
3.0%
in 2011. Organic volume growth excludes the impact of acquisitions and divestments.
14
(Dollars in Millions Except Per Share Amounts)
Net sales in the Oral, Personal and Home Care segment were
$14,562
in 2011, up
8.0%
from 2010, driven by volume growth of
4.0%
, net selling price increases of
1.0%
and a positive foreign exchange impact of
3.0%
. Excluding the impact of the divestment of the non-core detergent business in Colombia, volume increased
4.5%
. The Sanex business contributed
1.0%
to sales and volume growth in 2011. Organic sales in the Oral, Personal and Home Care segment increased
4.5%
on organic volume growth of
3.5%
in 2011.
Net sales for Hill’s Pet Nutrition increased
4.5%
in 2011 to
$2,172
driven by net selling price increases of
1.5%
, and a positive foreign exchange impact of
3.0%
, while volume remained flat. Organic sales in Hill’s Pet Nutrition increased
1.5%
in 2011.
Worldwide Net sales were
$15,564
in 2010, up 1.5% from 2009 as volume growth of 3.0% and level selling prices were partially offset by a negative foreign exchange impact of 1.5%. Worldwide organic sales increased 3.0% in 2010.
Gross Profit
Worldwide Gross profit margin decreased to
57.3%
in 2011 from
59.1%
in 2010. Excluding the impact of costs associated with various business realignment and other cost-saving initiatives of
30
basis points (bps), gross profit margin was
57.6%
in 2011. The decrease in 2011 was primarily due to higher raw and packaging material costs driven by global commodity cost increases (
390
bps), partially offset by cost savings from the Company’s funding-the-growth initiatives (
190
bps) and by higher pricing (
50
bps).
Worldwide Gross profit margin increased to
59.1%
in 2010 from 58.8% in 2009. The increase in 2010 was primarily driven by cost savings from the Company’s funding-the-growth initiatives (170 bps) and by higher pricing (10 bps), partially offset by higher raw and packaging material costs driven by global commodity cost increases (140 bps).
Selling, General and Administrative Expenses
Selling, general and administrative expenses as a percentage of Net sales were
34.4%
in 2011,
34.8%
in 2010 and
34.5%
in 2009. Excluding the impact of costs associated with various business realignment and other cost saving initiatives, Selling, general and administrative expenses were 34.3% in 2011. The 50 bps decrease in 2011 was primarily due to lower advertising spending (
20
bps) and lower overhead expenses (30 bps). In 2011, advertising increased
4.7%
to
$1,734
as compared with
$1,656
in 2010, but decreased as a percentage of Net sales from
10.6%
in 2010 to
10.4%
in 2011. The 30 bps increase in 2010 was primarily due to higher advertising spending (60 bps), partially offset by the impact of cost-saving initiatives.
Other (Income) Expense, Net
Other (income) expense, net was
($9)
,
$301
and $111 in 2011, 2010 and 2009, respectively. The components of Other (income) expense, net are presented below:
|
Other (income) expense, net
|
2011
|
2010
|
2009
|
|||||||||
|
Amortization of intangible assets
|
$
|
28
|
|
$
|
22
|
|
$
|
22
|
|
|||
|
Gain on sales of non-core product lines
|
(207
|
)
|
(50
|
)
|
(5
|
)
|
||||||
|
Business realignment and other cost-saving initiatives
|
136
|
|
—
|
|
—
|
|
||||||
|
Costs related to the sale of land in Mexico
|
13
|
|
—
|
|
—
|
|
||||||
|
Charge for a French competition law matter
|
21
|
|
—
|
|
—
|
|
||||||
|
Sanex acquisition transaction costs
|
12
|
|
—
|
|
—
|
|
||||||
|
Venezuela hyperinflationary transition charge
|
—
|
|
271
|
|
—
|
|
||||||
|
Gain from remeasurement of Venezuelan balance sheet
|
—
|
|
(10
|
)
|
—
|
|
||||||
|
Remeasurement of certain liabilities in Venezuela
|
—
|
|
—
|
|
27
|
|
||||||
|
Termination benefits
|
—
|
|
86
|
|
—
|
|
||||||
|
Legal and environmental matters
|
11
|
|
(3
|
)
|
27
|
|
||||||
|
Asset impairments
|
—
|
|
5
|
|
16
|
|
||||||
|
Equity (income)
|
(6
|
)
|
(5
|
)
|
(5
|
)
|
||||||
|
Other, net
|
(17
|
)
|
(15
|
)
|
29
|
|
||||||
|
Total Other (income) expense, net
|
$
|
(9
|
)
|
$
|
301
|
|
$
|
111
|
|
|||
15
(Dollars in Millions Except Per Share Amounts)
Operating Profit
In 2011, Operating profit increased
10%
to $
3,841
from
$3,489
in 2010. In 2010, Operating profit decreased
3%
to
$3,489
from
$3,615
in 2009.
In 2011, Operating profit was impacted by the gain on the sale of the detergent business in Colombia, costs associated with various business realignment and other cost-saving initiatives, costs related to the sale of land in Mexico and a charge for a competition law matter in France related to a divested detergent business. In 2010, Operating profit was impacted by a one-time charge related to the transition to hyperinflationary accounting in Venezuela, termination benefits and the gain on sales of non-core product lines. Excluding these items in both years, Operating profit increased
2%
in 2011 and
5%
in 2010 as follows:
|
2011
|
2010
|
% Change
|
2009
|
% Change
|
||||||||||||||
|
Operating profit, GAAP
|
$
|
3,841
|
|
$
|
3,489
|
|
10
|
%
|
$
|
3,615
|
|
(3
|
)%
|
|||||
|
Gain on sales of non-core product lines
|
(207
|
)
|
(50
|
)
|
—
|
|
—
|
|
—
|
|
||||||||
|
Business realignment and other cost-saving initiatives
|
190
|
|
—
|
|
—
|
|
—
|
|
—
|
|
||||||||
|
Costs related to the sale of land in Mexico
|
13
|
|
—
|
|
—
|
|
—
|
|
—
|
|
||||||||
|
Charge for a French competition law matter
|
21
|
|
—
|
|
—
|
|
—
|
|
—
|
|
||||||||
|
Venezuela hyperinflationary transition charge
|
—
|
|
271
|
|
—
|
|
—
|
|
—
|
|
||||||||
|
Termination benefits
|
—
|
|
86
|
|
—
|
|
—
|
|
—
|
|
||||||||
|
Operating profit, non-GAAP
|
$
|
3,858
|
|
$
|
3,796
|
|
2
|
%
|
$
|
3,615
|
|
5
|
%
|
|||||
Interest Expense, Net
Interest expense, net was
$52
in 2011 compared with
$59
in 2010 and
$77
in 2009. The decrease in Interest expense, net from 2010 to 2011 was mainly due to lower average interest rates, partially offset by higher debt balances. The decrease in Interest expense, net from 2009 to 2010 was due to lower average interest rates.
Income Taxes
The effective income tax rate was
32.6%
in 2011,
32.6%
in 2010 and 32.2% in 2009 and all years benefited from global tax strategies. The impact on the Company’s effective income tax rate of the items described above was as follows:
|
2011
|
2010
|
||||
|
Effective income tax rate, as reported
|
32.6
|
%
|
32.6
|
%
|
|
|
Gain on sales of non-core product lines
|
(0.1
|
)%
|
—
|
%
|
|
|
Business realignment and other cost-saving initiatives
|
(0.5
|
)%
|
—
|
%
|
|
|
Charge for a French competition law matter
|
(0.2
|
)%
|
—
|
%
|
|
|
Transition to hyperinflationary accounting in Venezuela
|
—
|
%
|
(2.4
|
)%
|
|
|
Termination benefits
|
—
|
%
|
(0.1
|
)%
|
|
|
Reorganization of an overseas subsidiary
|
—
|
%
|
0.8
|
%
|
|
|
Effective income tax rate, Non-GAAP
|
31.8
|
%
|
30.9
|
%
|
|
The Non-GAAP effective income tax rate of 31.8% in 2011 includes a benefit of 40 bps related to a change in state tax law. The Non-GAAP effective income tax rate of 30.9% in 2010 includes a benefit of 140 bps related to the remeasurement of the Venezuelan balance sheet and lower taxes on unpaid remittances.
Net Income attributable to Colgate-Palmolive Company
Net income attributable to Colgate-Palmolive Company was
$2,431
, or
$4.94
per share on a diluted basis, in 2011 compared with
$2,203
, or
$4.31
per share on a diluted basis, in 2010 and
$2,291
, or
$4.37
per share on a diluted basis, in 2009. In 2011, Net income attributable to Colgate-Palmolive Company included an aftertax gain on the sale of the laundry detergent business in Colombia of
$135
(
$0.27
per diluted share), which was more than offset by aftertax costs of
$177
(
$0.36
per diluted share) associated with the implementation of various business realignment and other cost-saving initiatives, the sale of land in Mexico and a competition law matter in France related to a divested detergent business.
16
(Dollars in Millions Except Per Share Amounts)
In 2010, Net income attributable to Colgate-Palmolive Company included a one-time charge of
$271
(
$0.53
per diluted share) related to the transition to hyperinflationary accounting in Venezuela,
$61
(
$0.12
per diluted share) in aftertax charges for termination benefits, a
$30
(
$0.06
per diluted share) aftertax gain from the sale of non-core product lines in Latin America and a
$31
(
$0.06
per diluted share) aftertax gain related to the reorganization of an overseas subsidiary.
Excluding the items described above, Net income attributable to Colgate-Palmolive Company in 2011 was
$2,473
as compared to
$2,474
in 2010 and earnings per common share on a diluted basis increased
4%
to
$5.03
. Excluding the items described above, Net income attributable to Colgate-Palmolive Company in 2010 increased
8%
to
$2,474
and earnings per share on a diluted basis increased
11%
to
$4.84
.
Segment Results
The Company markets its products in over 200 countries and territories throughout the world in two distinct business segments: Oral, Personal and Home Care; and Pet Nutrition. The Company evaluates segment performance based on several factors, including Operating profit. The Company uses Operating profit as a measure of the operating segment performance because it excludes the impact of corporate-driven decisions related to interest expense and income taxes.
North America
|
|
2011
|
2010
|
% Change
|
2009
|
% Change
|
||||||||||||||
|
Net sales
|
$
|
2,995
|
|
$
|
3,005
|
|
(0.5
|
)
|
%
|
$
|
2,950
|
|
2.0
|
|
%
|
||||
|
Operating profit
|
$
|
791
|
|
$
|
884
|
|
(11
|
)
|
%
|
$
|
843
|
|
5
|
|
%
|
||||
|
% of Net sales
|
26.4
|
%
|
29.4
|
%
|
(300
|
)
|
bps
|
28.6
|
%
|
80
|
|
bps
|
|||||||
Net sales in North America decreased
0.5%
in 2011 to
$2,995
, as volume growth of
2.0%
and a positive foreign exchange impact of
0.5%
were more than offset by net selling price decreases of
3.0%
. Organic sales in North America decreased
1.0%
in 2011.
Net sales in North America increased
2.0%
in 2010 to
$3,005
as a result of 3.5% volume growth and a 1.0% positive impact of foreign exchange, partially offset by 2.5% net selling price decreases. Organic sales in North America grew 1.0% in 2010.
Operating profit in North America decreased
11%
in 2011 to
$791
, or
26.4%
of Net sales. This decrease in Operating profit as a percentage of Net sales was driven by a decrease in Gross profit as a percentage of Net sales and by an increase in Selling, general and administrative expenses as a percentage of Net sales. The decrease in Gross profit as a percentage of Net sales was a result of lower pricing due to increased promotional investments and higher raw and packaging material costs reflecting global commodity cost increases, which were partially offset by cost savings from the Company’s funding-the-growth initiatives. Selling, general and administrative expenses as a percentage of Net sales increased due to higher overhead expenses, which were partially offset by lower advertising expenses as a percentage of Net sales.
Operating profit in North America increased
5%
in 2010 to
$884
, or
29.4%
of Net sales. The increase in Operating profit as a percentage of Net sales was driven by a decrease in Selling, general and administrative expenses as a percentage of Net sales due to lower overhead expenses and advertising expenses as a percentage of Net sales. Gross profit as a percentage of Net sales was flat as higher raw and packaging material costs and increased promotional investments were fully offset by cost savings from the Company’s funding-the-growth initiatives.
Latin America
|
|
2011
|
2010
|
% Change
|
2009
|
% Change
|
||||||||||||||
|
Net sales
|
$
|
4,778
|
|
$
|
4,261
|
|
12.0
|
|
%
|
$
|
4,319
|
|
(1.5
|
)
|
%
|
||||
|
Operating profit
|
$
|
1,414
|
|
$
|
1,295
|
|
9
|
|
%
|
$
|
1,360
|
|
(5
|
)
|
%
|
||||
|
% of Net sales
|
29.6
|
%
|
30.4
|
%
|
(80
|
)
|
bps
|
31.5
|
%
|
(110
|
)
|
bps
|
|||||||
Net sales in Latin America increased
12.0%
in 2011 to
$4,778
, driven by volume growth of
3.0%
, net selling price increases of
7.0%
and a positive foreign exchange impact of
2.0%
. Organic sales in Latin America increased
11.5%
. Excluding the impact of the divested detergent business in Colombia, volume increased
4.5%
in 2011. Volume gains were led by Mexico, Brazil and Argentina.
17
(Dollars in Millions Except Per Share Amounts)
Net sales in Latin America decreased 1.5% in 2010 to
$4,261
, as 2.0% volume growth and net selling price increases of 5.5% were more than offset by a 9.0% negative impact of foreign exchange. Organic sales in Latin America grew 7.5% in 2010.
While Operating profit in Latin America increased
9%
in 2011 to
$1,414
, driven by strong sales growth, it decreased as a percentage of Net sales to
29.6%
. This decrease in Operating profit as a percentage of Net sales was due to an increase in Selling, general and administrative expenses as a percentage of Net sales which was partially offset by an increase in Gross profit as a percentage of Net sales. The increase in Gross profit as a percentage of Net sales was driven by higher pricing and cost savings from the Company’s funding-the-growth initiatives, partially offset by higher raw and packaging material costs reflecting global commodity cost increases. The increase in Selling, general and administrative expenses as a percentage of Net sales was primarily due to higher overhead expenses and higher advertising investments supporting volume growth.
Operating profit in Latin America decreased
5%
in 2010 to
$1,295
, or
30.4%
as a percentage of Net sales. This decrease in Operating profit as a percentage of Net sales was due to a decrease in Gross profit as a percentage of Net sales and an increase in Selling, general and administrative expenses as a percentage of Net sales. The decrease in Gross profit as a percentage of Net sales was driven by higher raw and packaging material costs, which were partially offset by higher pricing and cost savings from the Company’s funding-the-growth initiatives. The increase in Selling, general and administrative expenses as a percentage of Net sales was due to higher advertising spending and higher overhead expenses, partially offset by cost savings from the Company’s funding-the-growth initiatives.
Europe/South Pacific
|
|
2011
|
2010
|
% Change
|
2009
|
% Change
|
||||||||||||||
|
Net sales
|
$
|
3,508
|
|
$
|
3,220
|
|
9.0
|
|
%
|
$
|
3,271
|
|
(1.5
|
)
|
%
|
||||
|
Operating profit
|
$
|
715
|
|
$
|
742
|
|
(4
|
)
|
%
|
$
|
748
|
|
(1
|
)
|
%
|
||||
|
% of Net sales
|
20.4
|
%
|
23.0
|
%
|
(260
|
)
|
bps
|
22.9
|
%
|
10
|
|
bps
|
|||||||
Net sales in Europe/South Pacific increased
9.0%
in 2011 to
$3,508
, as volume growth of
5.0%
and the positive impact of foreign exchange of
7.0%
were partially offset by net selling price decreases of
3.0%
. The Sanex business contributed
4.0%
to Europe/South Pacific sales and volume growth in 2011. Organic sales in Europe/South Pacific decreased by
2.0%
as organic volume growth of
1.0%
was more than offset by net selling price decreases of
3.0%
in 2011. Volume gains were led by the United Kingdom, Spain, France, Denmark and the GABA business.
Net sales in Europe/South Pacific decreased 1.5% in 2010 to
$3,220
as volume growth of 2.0% was more than offset by net selling price decreases of 3.0% and a 0.5% negative impact of foreign exchange. Organic sales in Europe/South Pacific declined 1.0% in 2010.
Operating profit in Europe/South Pacific decreased
4%
in 2011 to
$715
, or
20.4%
of Net sales. This decrease in Operating profit as a percentage of Net sales was due to a decrease in Gross profit as a percentage of Net sales and an increase in Selling, general and administrative expenses as a percentage of Net sales. The decrease in Gross profit as a percentage of Net sales was due to lower pricing and higher raw and packaging material costs reflecting global commodity cost increases, which were partially offset by cost savings from the Company’s funding-the-growth initiatives. Selling, general and administrative expenses as a percentage of Net sales increased due to higher overhead expenses and higher advertising investments.
While Operating profit in Europe/South Pacific decreased
1%
in 2010 to
$742
, it increased as a percentage of Net sales to
23.0%
. This increase in Operating profit as a percentage of Net sales was driven by an increase in Gross profit as a percentage of Net sales due to a continued focus on cost-saving initiatives, partially offset by increased promotional investments. Selling, general and administrative expenses as a percentage of Net sales remained flat as higher advertising spending as a percentage of Net sales was offset by a reduction of overhead expenses as a percentage of Net sales.
Greater Asia/Africa
|
|
2011
|
2010
|
% Change
|
2009
|
% Change
|
||||||||||||||
|
Net sales
|
$
|
3,281
|
|
$
|
2,998
|
|
9.5
|
|
%
|
$
|
2,655
|
|
13.0
|
|
%
|
||||
|
Operating profit
|
$
|
807
|
|
$
|
767
|
|
5
|
|
%
|
$
|
631
|
|
22
|
|
%
|
||||
|
% of Net sales
|
24.6
|
%
|
25.6
|
%
|
(100
|
)
|
bps
|
23.8
|
%
|
180
|
|
bps
|
|||||||
18
(Dollars in Millions Except Per Share Amounts)
Net sales in Greater Asia/Africa increased
9.5%
in 2011 to
$3,281
, driven by volume growth of
6.5%
, net selling price increases of
1.0%
and a
2.0%
positive impact of foreign exchange. The Sanex business contributed
0.5%
to Greater Asia/Africa sales and volume growth in 2011. Organic sales in Greater Asia/Africa grew
7.0%
on organic volume growth of
6.0%
in 2011. Volume gains were led by India, the Greater China region, Russia, and South Africa.
Net sales in Greater Asia/Africa increased 13.0% in 2010 to
$2,998
as volume growth of 10.5% and a 4.0% positive impact of foreign exchange were partially offset by net selling price decreases of 1.5%. Organic sales in Greater Asia/Africa grew 9.0% in 2010.
While Operating profit in Greater Asia/Africa increased
5%
in 2011 to
$807
, driven by strong sales growth, it decreased as a percentage of Net sales to
24.6%
. This decrease in Operating profit as a percentage of Net sales was due to a decrease in Gross profit as a percentage to Net sales which was partially offset by a decrease in Selling, general and administrative expenses as a percentage of Net sales. The decrease in Gross profit as a percentage of Net sales was due to higher raw and packaging material costs reflecting global commodity cost increases, partially offset by higher pricing and cost savings from the Company’s funding-the-growth initiatives. Selling, general and administrative expenses as a percentage of Net sales decreased due to lower advertising expenses and lower overhead expenses as a percentage of Net sales.
Operating profit in Greater Asia/Africa increased
22%
in 2010 to
$767
, or
25.6%
as a percentage of Net sales. This increase in Operating profit as a percentage of Net sales was due to an increase in Gross profit as a percentage to Net sales which was partially offset by an increase in Selling, general and administrative expenses as a percentage of Net sales. The increase in Gross profit as a percentage of Net sales was due to a continued focus on cost-saving initiatives, partially offset by increased promotional investments. Selling, general and administrative expenses as a percentage of Net sales increased due to higher advertising expenses, partially offset by a reduction of overhead expenses as a percentage of Net sales.
Hill's Pet Nutrition
|
|
2011
|
2010
|
% Change
|
2009
|
% Change
|
||||||||||||||
|
Net sales
|
$
|
2,172
|
|
$
|
2,080
|
|
4.5
|
|
%
|
$
|
2,132
|
|
(2.5
|
)
|
%
|
||||
|
Operating profit
|
$
|
560
|
|
$
|
559
|
|
—
|
|
%
|
$
|
555
|
|
1
|
|
%
|
||||
|
% of Net sales
|
25.8
|
%
|
26.9
|
%
|
(110
|
)
|
bps
|
26.0
|
%
|
90
|
|
bps
|
|||||||
Net sales for Hill’s Pet Nutrition increased
4.5%
in 2011 to
$2,172
. Net selling prices increased
1.5%
, foreign exchange was positive
3.0%
and volume was flat. Organic sales in Hill’s Pet Nutrition increased
1.5%
in 2011. Volume gains, driven by Russia, South Africa, Brazil and Canada, were offset by volume declines in the United States and Japan.
Net sales for Hill's Pet Nutrition decreased 2.5% in 2010 to
$2,080
, as 2.0% volume declines and 1.5% net selling price decreases were partially offset by a 1.0% positive impact of foreign exchange. Organic sales in Hill's Pet Nutrition declined 3.5% in 2010.
While Operating profit in Hill’s Pet Nutrition was flat in 2011 at
$560
, it decreased as a percentage of Net sales to
25.8%
. This decrease in Operating profit as a percentage of Net sales was due to a decrease in Gross profit as a percentage of Net sales, which was partially offset by a decrease in Selling, general and administrative expenses as a percentage of Net sales. The decrease in Gross profit as a percentage of Net sales was due to higher raw and packaging material costs reflecting global commodity cost increases and increased manufacturing overhead expenses due to increased investments in capacity, partially offset by cost savings from the Company’s funding-the-growth initiatives and higher pricing. Selling, general and administrative expenses decreased as a percentage of Net sales due to lower advertising, partially offset by an increase in overhead expenses as a percentage of Net sales.
Operating profit in Hill’s Pet Nutrition increased
1%
in 2010 to
$559
, or
26.9%
of Net sales. This increase in Operating profit as a percentage of Net sales was due to an increase in Gross profit as a percentage of Net sales and a decrease in Selling, general and administrative expenses as a percentage of Net sales. The increase in Gross profit as a percentage of Net sales was due to lower raw and packaging material costs and cost savings from the Company’s funding-the-growth initiatives, partially offset by increased promotional investments. Selling, general and administrative expenses decreased as a percentage of Net sales due to lower overhead and advertising expenses.
Corporate
|
|
2011
|
2010
|
% Change
|
2009
|
% Change
|
|||||||||||||
|
Operating profit
|
$
|
(446
|
)
|
$
|
(758
|
)
|
(41
|
)
|
%
|
$
|
(522
|
)
|
45
|
%
|
||||
19
(Dollars in Millions Except Per Share Amounts)
Corporate operations include Corporate overhead costs, research and development costs, stock-based compensation expense related to stock options and restricted stock awards, restructuring and related implementation costs and gains and losses on sales of non-core product lines and assets. The components of Operating profit (loss) for the Corporate segment are presented below:
|
|
2011
|
2010
|
2009
|
|||||||||
|
Gain on sales of non-core product lines
|
$
|
207
|
|
$
|
50
|
|
$
|
—
|
|
|||
|
Business realignment and other cost-saving initiatives
|
(190
|
)
|
—
|
|
—
|
|
||||||
|
Costs related to the sale of land in Mexico
|
(13
|
)
|
—
|
|
—
|
|
||||||
|
Charge for a French competition law matter
|
(21
|
)
|
—
|
|
—
|
|
||||||
|
Sanex acquisition transaction costs
|
(12
|
)
|
—
|
|
—
|
|
||||||
|
Venezuela hyperinflationary transition charge
|
—
|
|
(271
|
)
|
—
|
|
||||||
|
Termination benefits
|
—
|
|
(86
|
)
|
—
|
|
||||||
|
Corporate overhead costs and other, net
|
(417
|
)
|
(451
|
)
|
(522
|
)
|
||||||
|
Total Corporate Operating profit (loss)
|
$
|
(446
|
)
|
$
|
(758
|
)
|
$
|
(522
|
)
|
|||
Non-GAAP Financial Measures
This Annual Report on Form 10-K discusses organic sales growth (Net sales growth excluding the impact of foreign exchange, acquisitions and divestments) (non-GAAP). Management believes this measure provides investors with useful supplemental information regarding the Company’s underlying sales trends by presenting sales growth excluding the external factor of foreign exchange, as well as the impact of acquisitions and divestments. A reconciliation of organic sales growth to Net sales growth for the years ended December 31, 2011 and 2010 is provided below.
Worldwide Gross profit margin, Selling, general and administrative expenses, Operating profit, effective tax rate, Net income attributable to Colgate-Palmolive Company and earnings per share on a diluted basis are discussed in this Annual Report on Form 10-K both on a GAAP basis and excluding the impacts of the gains on the sales of non-core product lines, costs associated with various business realignment and other cost-saving initiatives, costs related to the sale of land in Mexico, a charge for a competition law matter in France related to a divested detergent business, the one-time charge related to the transition to hyperinflationary accounting in Venezuela, termination benefits and the gain related to the reorganization of an overseas subsidiary (non-GAAP). Management believes these non-GAAP financial measures provide investors with useful supplemental information regarding the performance of the Company’s ongoing operations. A reconciliation of these non-GAAP financial measures to the most directly comparable GAAP financial measures for the years ended December 31, 2011 and 2010 is presented below.
The Company uses the above financial measures internally in its budgeting process and as a factor in determining compensation. While the Company believes that these non-GAAP financial measures are useful in evaluating the Company’s business, this information should be considered as supplemental in nature and is not meant to be considered in isolation or as a substitute for the related financial information prepared in accordance with GAAP. In addition, these non-GAAP financial measures may not be the same as similar measures presented by other companies.
The following table provides a quantitative reconciliation of organic sales growth to Net sales growth for each of the years ended December 31, 2011 and 2010 versus the prior year:
|
Year ended December 31, 2011
|
Organic
Sales Growth
(Non-GAAP)
|
Foreign
Exchange
Impact
|
Acquisitions and Divestments
Impact
|
Net Sales Growth
(GAAP)
|
|
Oral, Personal and Home Care
|
|
|
|
|
|
North America
|
(1.0)%
|
0.5%
|
0.0%
|
(0.5)%
|
|
Latin America
|
11.5%
|
2.0%
|
(1.5)%
|
12.0%
|
|
Europe/South Pacific
|
(2.0)%
|
7.0%
|
4.0%
|
9.0%
|
|
Greater Asia/Africa
|
7.0%
|
2.0%
|
0.5%
|
9.5%
|
|
Total Oral, Personal and Home Care
|
4.5%
|
3.0%
|
0.5%
|
8.0%
|
|
Pet Nutrition
|
1.5%
|
3.0%
|
0.0%
|
4.5%
|
|
Total Company
|
4.0%
|
3.0%
|
0.5%
|
7.5%
|
20
(Dollars in Millions Except Per Share Amounts)
|
Year ended December 31, 2010
|
Organic
Sales Growth
(Non-GAAP)
|
Foreign
Exchange
Impact
|
Acquisitions and Divestments
Impact
|
Net Sales Growth
(GAAP)
|
|
Oral, Personal and Home Care
|
|
|
|
|
|
North America
|
1.0%
|
1.0%
|
0.0%
|
2.0%
|
|
Latin America
|
7.5%
|
(9.0)%
|
0.0%
|
(1.5)%
|
|
Europe/South Pacific
|
(1.0)%
|
(0.5)%
|
0.0%
|
(1.5)%
|
|
Greater Asia/Africa
|
9.0%
|
4.0%
|
0.0%
|
13.0%
|
|
Total Oral, Personal and Home Care
|
4.0%
|
(2.0)%
|
0.0%
|
2.0%
|
|
Pet Nutrition
|
(3.5)%
|
1.0%
|
0.0%
|
(2.5)%
|
|
Total Company
|
3.0%
|
(1.5)%
|
0.0%
|
1.5%
|
The following table provides a quantitative reconciliation of various (Non-GAAP) financial measures to the most directly comparable GAAP financial measures for the years ended December 31, 2011 and 2010:
|
2011
|
2010
|
||||||||||||||||||||||||||||||||||||
|
As
Reported (GAAP)
|
Gain on Sale of Colombia Detergent Business
|
Business Realignment Initiatives
|
Mexico Land Sale
|
French Competition Law Matter
|
As Adjusted
(Non-
GAAP )
|
As
Reported
1
(GAAP)
|
Venezuela Hyper-inflationary
|
Termination Benefits
|
Gain on Sale of Non-Core Product Lines
|
Tax Initiatives
2
|
As Adjusted(Non-GAAP
1
)
|
||||||||||||||||||||||||||
|
Cost of sales
|
$
|
7,144
|
|
$
|
44
|
|
$
|
7,100
|
|
||||||||||||||||||||||||||||
|
Gross profit
|
9,590
|
|
(44
|
)
|
9,634
|
|
|||||||||||||||||||||||||||||||
|
Gross profit margin
|
57.3
|
%
|
57.6
|
%
|
|||||||||||||||||||||||||||||||||
|
Selling, general and administrative expenses
|
5,758
|
|
10
|
|
5,748
|
|
|||||||||||||||||||||||||||||||
|
Other (income) expense, net
|
(9
|
)
|
$
|
(207
|
)
|
$
|
136
|
|
$
|
13
|
|
$
|
21
|
|
28
|
|
$
|
301
|
|
$
|
271
|
|
$
|
86
|
|
$
|
(50
|
)
|
$
|
—
|
|
$
|
(6
|
)
|
|||
|
Operating profit
|
3,841
|
|
207
|
|
(190
|
)
|
(13
|
)
|
(21
|
)
|
3,858
|
|
3,489
|
|
(271
|
)
|
(86
|
)
|
50
|
|
—
|
|
3,796
|
|
|||||||||||||
|
Operating profit margin
|
23.0
|
%
|
23.1
|
%
|
22.4
|
%
|
24.4
|
%
|
|||||||||||||||||||||||||||||
|
Income before income taxes
|
3,789
|
|
207
|
|
(190
|
)
|
(13
|
)
|
(21
|
)
|
3,806
|
|
3,430
|
|
(271
|
)
|
(86
|
)
|
50
|
|
—
|
|
3,737
|
|
|||||||||||||
|
Provision for income taxes
|
1,235
|
|
72
|
|
(42
|
)
|
(4
|
)
|
—
|
|
1,209
|
|
1,117
|
|
—
|
|
(25
|
)
|
20
|
|
(31
|
)
|
1,153
|
|
|||||||||||||
|
Effective tax rate
|
32.6
|
%
|
31.8
|
%
|
32.6
|
%
|
30.9
|
%
|
|||||||||||||||||||||||||||||
|
Net income including noncontrolling interests
|
2,554
|
|
135
|
|
(148
|
)
|
(9
|
)
|
(21
|
)
|
2,597
|
|
2,313
|
|
(271
|
)
|
(61
|
)
|
30
|
|
31
|
|
2,584
|
|
|||||||||||||
|
Net income attributable to Colgate-Palmolive Company
|
$
|
2,431
|
|
$
|
135
|
|
$
|
(147
|
)
|
$
|
(9
|
)
|
$
|
(21
|
)
|
$
|
2,473
|
|
$
|
2,203
|
|
$
|
(271
|
)
|
$
|
(61
|
)
|
$
|
30
|
|
$
|
31
|
|
$
|
2,474
|
|
|
|
Earnings per common share
3
|
|||||||||||||||||||||||||||||||||||||
|
Basic
|
$
|
4.98
|
|
$
|
0.28
|
|
$
|
(0.30
|
)
|
$
|
(0.02
|
)
|
$
|
(0.04
|
)
|
$
|
5.06
|
|
$
|
4.45
|
|
$
|
(0.56
|
)
|
$
|
(0.13
|
)
|
$
|
0.06
|
|
$
|
0.06
|
|
$
|
5.00
|
|
|
|
Diluted
|
$
|
4.94
|
|
$
|
0.27
|
|
$
|
(0.30
|
)
|
$
|
(0.02
|
)
|
$
|
(0.04
|
)
|
$
|
5.03
|
|
$
|
4.31
|
|
$
|
(0.53
|
)
|
$
|
(0.12
|
)
|
$
|
0.06
|
|
$
|
0.06
|
|
$
|
4.84
|
|
|
|
1
|
Includes a $46 pretax gain ($59 aftertax gain, $0.12 diluted earnings per share) related to the remeasurement of the Venezuelan balance sheet and lower taxes on accrued but unpaid remittances resulting from the currency devaluation in January 2010 and a $36 pretax loss ($2 aftertax gain) related to the remeasurement of the Venezuelan balance sheet and lower taxes on accrued but unpaid remittances resulting from the currency devaluation announced in December 2010.
|
|
2
|
Includes a gain related to a tax initiative involving the reorganization of an overseas subsidiary.
|
|
3
|
The impact of Non-GAAP adjustments on the basic and diluted earnings per share may not necessarily equal the difference between "As Reported (GAAP)" and "As Adjusted (Non-GAAP)" as a result of rounding.
|
21
(Dollars in Millions Except Per Share Amounts)
Liquidity and Capital Resources
The Company expects cash flow from operations and debt issuances will be sufficient to meet foreseeable business operating and recurring cash needs (including for debt service, dividends, capital expenditures and stock repurchases). The Company believes its strong cash generation and financial position should continue to allow it broad access to global credit and capital markets.
Cash Flow
Net cash provided by operations in 2011 was
$2,896
as compared with
$3,211
in 2010 and
$3,277
in 2009. The decrease in 2011 as compared to 2010 was primarily due to an increase in voluntary benefit plan contributions. The decrease in 2010 as compared to 2009 was due to increased working capital.
The Company defines working capital as the difference between current assets (excluding cash and cash equivalents and marketable securities, the latter of which is reported in Other current assets) and current liabilities (excluding short-term debt). The Company’s working capital increased to
0.7%
of Net sales in 2011 as compared with
0.3%
in 2010. The increase in working capital as a percentage of Net sales in 2011 versus 2010 was primarily due to higher levels of accounts receivable and inventories. Although higher in absolute dollars, accounts receivable and inventory levels were in line with prior year levels of days sales outstanding for receivables and months coverage of inventory.
Investing activities used
$1,213
in 2011, compared with
$658
and
$841
during 2010 and 2009, respectively. The increase was primarily due to the purchase of the Sanex business for
$966
which was funded with available cash, including the proceeds from the sale of the Company’s Euro-denominated investment portfolio, and the issuance of commercial paper, partially offset by the sale of the Company’s laundry detergent business in Colombia for $215. Additionally, in 2011, the Company’s Mexican subsidiary entered into an agreement to sell the Mexico City site on which its commercial operations, technology center and soap production facility are located. The sale price is payable in three installments, with the final installment due upon the transfer of the property, which is expected to occur in 2014. During 2011, the Company received the first installment of $24. Capital expenditures were
$537
,
$550
and
$575
for 2011, 2010 and 2009, respectively. Capital expenditures continue to focus primarily on projects that are expected to yield high aftertax returns. Capital expenditures for 2012 are expected to be at an annual rate of approximately 3.5% of Net sales.
Financing activities used
$1,242
of cash during 2011 compared to
$2,624
and
$2,270
during 2010 and 2009. This difference was primarily due to higher net proceeds from the issuance of debt and a lower level of share repurchases. The increase in 2010 was primarily due to higher repurchases of common stock and dividends paid, partially offset by higher net proceeds from issuances of debt.
Long-term debt, including the current portion, increased to
$4,776
as of December 31, 2011, as compared to
$3,376
as of December 31, 2010, and total debt increased to
$4,810
as of December 31, 2011, as compared to
$3,424
as of December 31, 2010. During the fourth quarter of 2011, the Company issued $300 of U.S. dollar-denominated three-year notes at a fixed rate of 0.6%, $400 of U.S. dollar-denominated five-year notes at a fixed rate of 1.3% and $300 of U.S. dollar-denominated ten-year notes at a fixed rate of 2.45% under the Company’s shelf registration statement. Proceeds from the debt issuances were used to reduce commercial paper borrowings and to repay outstanding indebtedness under a €408 credit facility. During the second quarter of 2011, the Company issued $250 of U.S. dollar-denominated three-year notes at a fixed rate of 1.250% and
$250
of U.S. dollar-denominated six-year notes at a fixed rate of
2.625%
under the Company’s shelf registration statement. During the fourth quarter of 2010, the Company issued $250 of ten-year notes at a fixed rate of 2.95% and $188 of five-year notes at a fixed rate of 1.375% under the Company’s shelf registration statement. During the third quarter of 2009, the Company issued $300 of U.S. dollar-denominated six-year notes at a fixed rate of 3.15% under the Company’s shelf registration statement. Proceeds from the debt issuances in the second quarter of 2011, fourth quarter of 2010 and third quarter of 2009 were used to reduce commercial paper borrowings.
At December 31, 2011, the Company had access to unused domestic and foreign lines of credit of $
2,705
(including under the two facilities discussed below) and could also issue medium-term notes pursuant to an effective shelf registration statement. In November 2011, the Company entered into a new five-year revolving credit facility with a capacity of $
1,850
with a syndicate of banks. The facility, which expires in
November 2016
, replaced an existing credit facility with a capacity of $
1,600
which was due to expire in
November 2012
. The Company also has the ability to draw
$145
from a revolving credit facility that expires in
November 2012
. Commitment fees related to credit facilities are not material.
Domestic and foreign commercial paper outstanding was $671 and $214 as of December 31, 2011 and 2010, respectively. The average daily balances outstanding for commercial paper in 2011 and 2010 were $1,497 and $1,146, respectively. The
22
(Dollars in Millions Except Per Share Amounts)
maximum daily balance outstanding for commercial paper during 2011 and 2010 was $1,897 and $1,628, respectively. The Company regularly classifies commercial paper and certain current maturities of notes payable as long-term debt as it has the intent and ability to refinance such obligations on a long-term basis, including, if necessary, by utilizing its line of credit that expires in 2016.
Following is a summary of the Company’s commercial paper and global short-term borrowings as of December 31, 2011 and 2010:
|
|
2011
|
2010
|
||||||||||||||||
|
|
Weighted Average Interest Rate
|
Maturities
|
Outstanding
|
Weighted Average
Interest Rate
|
Maturities
|
Outstanding
|
||||||||||||
|
Payable to banks
|
0.9
|
%
|
2012
|
$
|
34
|
|
3.1
|
%
|
2011
|
$
|
48
|
|
||||||
|
Commercial paper
|
0.1
|
%
|
2012
|
671
|
|
0.2
|
%
|
2011
|
214
|
|
||||||||
|
Total
|
$
|
705
|
|
$
|
262
|
|
||||||||||||
Certain of the facilities with respect to the Company’s bank borrowings contain financial and other covenants as well as cross-default provisions. Noncompliance with these requirements could ultimately result in the acceleration of amounts owed. The Company is in full compliance with all such requirements and believes the likelihood of noncompliance is remote. See Note 5 to the Consolidated Financial Statements for further information about the Company’s long-term debt and credit facilities.
Dividend payments in 2011 were $
1,203
, an increase from
$1,142
in 2010 and
$981
in 2009. Common stock dividend payments increased to $
2.27
per share in 2011 from $2.03 per share in 2010 and $1.72 per share in 2009. The Series B Preference stock dividend payments were $16.24 per share in 2010 and $13.76 per share in 2009. The Series B Preference Stock was converted to common stock on December 29, 2010. On February 24, 2011, the Company’s Board of Directors increased the quarterly common stock cash dividend to $0.58 per share, effective as of the second quarter 2011.
The Company repurchases shares of its common stock in the open market and in private transactions to maintain its targeted capital structure and to fulfill certain requirements of its compensation and benefit plans. On September 8, 2011 the Company’s Board of Directors authorized a new share repurchase program (the 2011 Program) that replaced the Company’s previous share repurchase program which had been approved in 2010 (the 2010 Program). The 2011 Program authorizes the repurchase of up to 50 million shares of the Company’s common stock. The Board also has authorized share repurchases on an ongoing basis to fulfill certain requirements of the Company’s compensation and benefit programs.
Aggregate repurchases in 2011 consisted of 20.4 million common shares under both the 2011 Program and the 2010 Program, and 0.9 million common shares to fulfill the requirements of compensation and benefit plans, for a total purchase price of $
1,806
. Aggregate repurchases in 2010 consisted of 24.4 million common shares under both the 2010 Program and the 2008 Program, and 1.0 million common shares to fulfill the requirements of compensation and benefit plans, for a total purchase price of $2,020. Aggregate repurchases in 2009 consisted of 13.9 million common shares under the 2008 Program and 1.0 million common shares to fulfill the requirements of compensation and benefit plans, for a total purchase price of $1,063.
The following represents the scheduled maturities of the Company’s contractual obligations as of December 31, 2011:
|
|
Payments Due by Period
|
|||||||||||||||||||||||||||
|
|
Total
|
2012
|
2013
|
2014
|
2015
|
2016
|
Thereafter
|
|||||||||||||||||||||
|
Long-term debt including current portion
|
$
|
4,776
|
|
$
|
1,017
|
|
$
|
264
|
|
$
|
882
|
|
$
|
493
|
|
$
|
254
|
|
$
|
1,866
|
|
|||||||
|
Net cash interest payments on long-term debt
(1)
|
618
|
|
86
|
|
81
|
|
72
|
|
59
|
|
49
|
|
271
|
|
||||||||||||||
|
Leases
|
1,282
|
|
201
|
|
174
|
|
153
|
|
141
|
|
123
|
|
490
|
|
||||||||||||||
|
Purchase obligations
(2)
|
460
|
|
196
|
|
161
|
|
57
|
|
31
|
|
15
|
|
—
|
|
||||||||||||||
|
Total
|
$
|
7,136
|
|
$
|
1,500
|
|
$
|
680
|
|
$
|
1,164
|
|
$
|
724
|
|
$
|
441
|
|
$
|
2,627
|
|
|||||||
_______
|
(1)
|
Includes the net interest payments on fixed and variable rate debt and associated interest rate swaps. Interest payments associated with floating rate instruments are based on management’s best estimate of projected interest rates for the remaining term of variable rate debt.
|
|
(2)
|
The Company had outstanding contractual obligations with suppliers at the end of 2011 for the purchase of raw, packaging and other materials and services in the normal course of business. These purchase obligation amounts represent only those items which are based on agreements that are legally binding and that specify minimum quantity, price and term and do not represent total anticipated purchases.
|
23
(Dollars in Millions Except Per Share Amounts)
Long-term liabilities associated with the Company’s postretirement plans are excluded from the table above due to the uncertainty of the timing of these cash disbursements. The amount and timing of cash funding related to these benefit plans will generally depend on local regulatory requirements, various economic assumptions (the most significant of which are detailed in “Critical Accounting Policies and Use of Estimates” below) and voluntary Company contributions. Based on current information, the Company does not anticipate having to make any mandatory contributions to its qualified U.S. pension plan until 2013. Management’s best estimate of voluntary contributions to the U.S. pension plans for the year ending December 31, 2012 is approximately
$100
. In addition, total benefit payments to be paid to participants for the year ending December 31, 2012 from the Company's assets is estimated to be approximately $87.
Additionally, liabilities for unrecognized income tax benefits are excluded from the table above as the Company is unable to reasonably predict the ultimate amount or timing of a settlement of such liabilities. See Note 10 to the Consolidated Financial Statements for more information.
As more fully described in Note 12 to the Consolidated Financial Statements, the Company is contingently liable with respect to lawsuits, environmental matters, taxes and other matters arising in the ordinary course of business.
Off-Balance Sheet Arrangements
The Company does not have off-balance sheet financing or unconsolidated special purpose entities.
Managing Foreign Currency, Interest Rate and Commodity Price Exposure
The Company is exposed to market risk from foreign currency exchange rates, interest rates and commodity price fluctuations. Volatility relating to these exposures is managed on a global basis by utilizing a number of techniques, including working capital management, selling price increases, selective borrowings in local currencies and entering into selective derivative instrument transactions, issued with standard features, in accordance with the Company’s treasury and risk management policies. The Company’s treasury and risk management policies prohibit the use of derivatives for speculative purposes and leveraged derivatives for any purpose.
The sensitivity of our financial instruments to market fluctuations is discussed below. See Notes 2 and 6 to the Consolidated Financial Statements for further discussion of derivatives and hedging policies and fair value measurements.
Foreign Exchange Risk
As the Company markets its products in over 200 countries and territories, it is exposed to currency fluctuations related to manufacturing and selling its products in currencies other than the U.S. dollar. The Company manages its foreign currency exposures through a combination of cost-containment measures, selling price increases and the hedging of certain costs in an effort to minimize the impact on earnings of foreign currency rate movements. See the “Results of Operations” section above for discussion of the foreign exchange impact on Net sales in each segment.
The assets and liabilities of foreign subsidiaries, other than those operating in highly inflationary environments, are translated into U.S. dollars at year-end exchange rates with resulting translation gains and losses accumulated in a separate component of shareholders’ equity. Income and expense items are translated into U.S. dollars at average rates of exchange prevailing during the year.
For subsidiaries operating in highly inflationary environments (currently, Venezuela), inventories, prepaid expenses, goodwill and property, plant and equipment are remeasured at their historical exchange rates, while other assets and liabilities are remeasured at year-end exchange rates. Remeasurement adjustments for these operations are included in Net income attributable to Colgate-Palmolive Company.
The Company primarily utilizes foreign currency contracts, including forward, option and swap contracts, local currency deposits and local currency borrowings to hedge portions of its exposures relating to foreign currency purchases, assets and liabilities created in the normal course of business and the net investment in certain foreign subsidiaries. The duration of foreign currency contracts generally does not exceed 12 months and the contracts are valued using observable market rates.
24
(Dollars in Millions Except Per Share Amounts)
The Company’s foreign currency forward contracts that qualify for cash flow hedge accounting resulted in net unrealized gains of $1 at December 31, 2011 and net unrealized losses of $3 at December 31, 2010. Changes in the fair value of cash flow hedges are recorded in Other comprehensive income (loss) and are reclassified into earnings in the same period or periods during which the underlying hedged transaction is recognized in earnings. At the end of 2011, an unfavorable 10% change in exchange rates would have resulted in a net unrealized loss of $42.
Interest Rate Risk
The Company manages its mix of fixed and floating rate debt against its target with debt issuances and by entering into interest rate swaps in order to mitigate fluctuations in earnings and cash flows that may result from interest rate volatility. The notional amount, interest payment and maturity date of the swaps match the principal, interest payment and maturity date of the related debt in all cases, and the swaps are valued using observable benchmark rates.
Based on year-end 2011 variable rate debt levels, a 1-percentage-point increase in interest rates would have increased Interest expense, net by $18 in 2011.
Commodity Price Risk
The Company is exposed to price volatility related to raw materials used in production, such as resins, tropical oils, essential oils, tallow, corn and soybeans. The Company manages its raw material exposures through a combination of cost containment measures, ongoing productivity initiatives and the limited use of commodity hedging contracts. Futures contracts are used on a limited basis, primarily in the Pet Nutrition segment, to manage volatility related to anticipated raw material inventory purchases of certain traded commodities.
The Company’s open commodity derivative contracts, which qualify for cash flow hedge accounting, resulted in net unrealized losses of $1 and net unrealized gains of $4 for the years ended December 31, 2011 and 2010, respectively. At the end of 2011, an unfavorable 10% change in commodity futures prices would have increased the net unrealized loss to $3.
Credit Risk
The Company is exposed to the risk of credit loss in the event of nonperformance by counterparties to financial instrument contracts; however, nonperformance is considered unlikely and any nonperformance is unlikely to be material as it is the Company’s policy to contract with highly rated, diverse counterparties.
Recent Accounting Pronouncements
In June 2011, the Financial Accounting Standards Board (FASB) issued Accounting Standards Update (ASU) No. 2011-05, “Presentation of Comprehensive Income” ASU No. 2011-05 eliminates the current option to disclose other comprehensive income and its components in the statement of changes in equity. As permitted under ASU No. 2011-05, the Company has elected to present items of net income and other comprehensive income in two separate consecutive statements beginning in the first quarter of 2012. This standard will not have a material impact on the Company's financial position or results of operations.
Critical Accounting Policies and Use of Estimates
The preparation of financial statements requires management to use judgment and make estimates. The level of uncertainty in estimates and assumptions increases with the length of time until the underlying transactions are completed. Actual results could ultimately differ from those estimates. The accounting policies that are most critical in the preparation of the Company’s Consolidated Financial Statements are those that are both important to the presentation of the Company’s financial condition and results of operations and require significant or complex judgments and estimates on the part of management. The Company’s critical accounting policies are reviewed periodically with the Audit Committee of the Board of Directors.
In certain instances, accounting principles generally accepted in the United States of America allow for the selection of alternative accounting methods. The Company’s significant policies that involve the selection of alternative methods are accounting for shipping and handling costs and inventories.
|
▪
|
Shipping and handling costs may be reported as either a component of cost of sales or selling, general and administrative expenses. The Company reports such costs, primarily related to warehousing and outbound freight, in the Consolidated Statements of Income as a component of Selling, general and administrative expenses. Accordingly, the Company’s gross profit margin is not comparable with the gross profit margin of those companies that include shipping and handling charges in cost of sales. If such costs had been included in cost of sales, gross profit margin as a
|
25
(Dollars in Millions Except Per Share Amounts)
percent of sales would have decreased by 750 bps, from 57.3% to 49.8% in 2011 and decreased by 730 bps in 2010 and 2009, with no impact on reported earnings.
|
▪
|
The Company accounts for inventories using both the first-in, first-out (FIFO) method (80% of inventories) and the last-in, first-out (LIFO) method (20% of inventories). There would have been no material impact on reported earnings for 2011, 2010 and 2009 had all inventories been accounted for under the FIFO method.
|
The areas of accounting that involve significant or complex judgments and estimates are pensions and other postretirement benefits, stock options, asset impairments, uncertain tax positions, tax valuation allowances and legal and other contingencies.
|
▪
|
In pension accounting, the most significant actuarial assumptions are the discount rate and the long-term rate of return on plan assets. The discount rate for U.S. defined benefit plans was 4.90%, 5.30% and 5.75% as of December 31, 2011, 2010 and 2009, respectively. The discount rate for other U.S. postretirement plans was 5.26%, 5.30% and 5.75% as of December 31, 2011, 2010 and 2009, respectively. Discount rates used for the U.S. defined benefit and other postretirement plans are based on a yield curve constructed from a portfolio of high-quality bonds for which the timing and amount of cash outflows approximate the estimated payouts of the U.S. plans. For the Company’s international plans, the discount rates are set by benchmarking against investment-grade corporate bonds rated AA. The assumed long-term rate of return on plan assets for U.S. plans was 7.75% as of December 31, 2011 and 8.00% as of December 31, 2010 and 2009. In determining the long-term rate of return, the Company considers the nature of the plans’ investments, an expectation for the plans’ investment strategies and the historical rate of return.
|
Average annual rates of return for the U.S. plans for the most recent 1-year, 5-year, 10-year, 15-year and 25-year periods were
3%
,
3%
,
6%
,
7%
, and
8%
, respectively. In addition, the current rate of return assumption for the U.S. plans is based upon a targeted asset allocation of approximately 40% in fixed income securities, 52% in equity securities and 8% in real estate and alternative investments. A 1% change in the assumed rate of return on plan assets of the U.S. pension plans would impact future Net income attributable to Colgate-Palmolive Company by approximately $9. A 1% change in the discount rate for the U.S. pension plans would impact future Net income attributable to Colgate-Palmolive Company by approximately $5. A third assumption is the long-term rate of compensation increase, a change in which would partially offset the impact of a change in either the discount rate or the long-term rate of return. This rate was 4.0% as of December 31, 2011, 2010 and 2009. Refer to Note 9 to the Consolidated Financial Statements for further discussion of the Company’s pension and other postretirement plans.
|
▪
|
The assumption requiring the most judgment in accounting for other postretirement benefits is the medical cost trend rate. The Company reviews external data and its own historical trends for health care costs to determine the medical cost trend rate. The assumed rate of increase is 8.0% for 2012, declining to 5.0% by 2018 and remaining at 5.0% for the years thereafter. The effect of a 1% increase in the assumed long-term medical cost trend rate would decrease Net income attributable to Colgate-Palmolive Company by $5.
|
|
▪
|
The Company recognizes the cost of employee services received in exchange for awards of equity instruments, such as stock options and restricted stock, based on the fair value of those awards at the date of grant. The Company uses the Black-Scholes-Merton (Black-Scholes) option pricing model to determine the fair value of stock-option awards. The weighted-average estimated fair value of each stock option granted for the year ended December 31, 2011 was $11.93. The Black-Scholes model uses various assumptions to determine the fair value of options. These assumptions include the expected term of options, expected volatility, risk-free interest rate and expected dividend yield. While these assumptions do not require significant judgment, as the significant inputs are determined from historical experience or independent third-party sources, changes in these inputs could result in significant changes in fair value. A one-year change in term would result in a change in fair value of approximately 7%. A one percent change in volatility would change fair value by approximately 6%.
|
|
▪
|
The asset impairment analysis performed for goodwill and intangible assets requires several estimates, including future cash flows, growth rates and the selection of a discount rate. Except for the intangible assets acquired in the recent Sanex acquisition, the estimated fair value of the Company’s intangible assets substantially exceeds the recorded book value. The estimated fair value of the Company’s reporting units also substantially exceeds the recorded book value. Therefore, it is not reasonably likely that significant changes in these estimates would occur that would result in an impairment charge related to these assets.
|
|
▪
|
The recognition and measurement of uncertain tax positions involves consideration of the amounts and probabilities of various outcomes that could be realized upon ultimate resolution.
|
26
(Dollars in Millions Except Per Share Amounts)
|
▪
|
Tax valuation allowances are established to reduce deferred tax assets such as tax loss carryforwards, to net realizable value. Factors considered in estimating net realizable value include historical results by tax jurisdiction, carryforward periods, income tax strategies and forecasted taxable income.
|
|
▪
|
Legal and other contingency reserves are based on management’s assessment of the risk of potential loss, which includes consultation with outside legal counsel and advisors. Such assessments are reviewed each period and revised, based on current facts and circumstances, if necessary. While it is possible that the Company’s cash flows and results of operations in a particular quarter or year could be materially affected by the impact of such contingencies, it is the opinion of management that these matters will not have a material impact on the Company’s financial position, or its ongoing results of operations or cash flows. Refer to Note 12 to the Consolidated Financial Statements for further discussion of the Company’s contingencies.
|
The Company generates revenue through the sale of well-known consumer products to trade customers under established trading terms. While the recognition of revenue and receivables requires the use of estimates, there is a short time frame (typically less than 60 days) between the shipment of product and cash receipt, thereby reducing the level of uncertainty in these estimates. Refer to Note 2 to the Consolidated Financial Statements for further description of the Company’s significant accounting policies.
Cautionary Statement on Forward-Looking Statements
This Annual Report on Form 10-K may contain forward-looking statements as that term is defined in the Private Securities Litigation Reform Act of 1995 or by the SEC in its rules, regulations and releases. Such statements may relate, for example, to sales or volume growth, organic sales growth, profit or profit margin growth, earnings growth, financial goals, the impact of currency devaluations and exchange and price controls, including in Venezuela, cost-reduction plans, tax rates, new product introductions or commercial investment levels, among other matters. These statements are made on the basis of the Company’s views and assumptions as of this time and the Company undertakes no obligation to update these statements. Moreover, the Company does not, nor does any other person, assume responsibility for the accuracy and completeness of those statements. The Company cautions investors that any such forward-looking statements are not guarantees of future performance and that actual events or results may differ materially from those statements. Actual events or results may differ materially because of factors that affect international businesses and global economic conditions, as well as matters specific to us and the markets we serve, including the uncertain economic environment in different countries and its effect on consumer spending habits, increased competition and evolving competitive practices, currency rate fluctuations, exchange and price controls, changes in foreign or domestic laws or regulations or their interpretation, political and fiscal developments, the availability and cost of raw and packaging materials, our ability to maintain or increase selling prices as needed, changes in the policies of retail trade customers and our ability to continue lowering costs. For information about these and other factors that could impact our business and cause actual results to differ materially from forward-looking statements, refer to Item 1A, “Risk Factors”.
See “Managing Foreign Currency, Interest Rate and Commodity Price Exposure” in Item 7.
See “Index to Financial Statements.”
|
ITEM 9.
|
CHANGES IN AND DISAGREEMENTS WITH ACCOUNTANTS ON ACCOUNTING AND FINANCIAL DISCLOSURE
|
None.
27
Evaluation of Disclosure Controls and Procedures
The Company’s management, under the supervision and with the participation of the Company’s Chairman of the Board, President and Chief Executive Officer and Chief Financial Officer, carried out an evaluation of the effectiveness of the design and operation of the Company’s disclosure controls and procedures as of
December 31, 2011
(the Evaluation). Based upon the Evaluation, the Company’s Chairman of the Board, President and Chief Executive Officer and Chief Financial Officer concluded that the Company’s disclosure controls and procedures (as defined in Rule 13a-15(e) of the Exchange Act) are effective.
Management’s Annual Report on Internal Control over Financial Reporting
The Company’s management is responsible for establishing and maintaining adequate internal control over financial reporting, as defined in Rules 13a-15(f) and 15d-15(f) under the Exchange Act. Management, under the supervision and with the participation of the Company’s Chairman of the Board, President and Chief Executive Officer and Chief Financial Officer, conducted an evaluation of the Company’s internal control over financial reporting based upon the framework in Internal Control – Integrated Framework issued by the Committee of Sponsoring Organizations of the Treadway Commission and concluded that it is effective as of
December 31, 2011
.
The Company’s independent registered public accounting firm, PricewaterhouseCoopers LLP, has audited the effectiveness of the Company’s internal control over financial reporting as of
December 31, 2011
, and has expressed an unqualified opinion in their report, which appears in this report.
Changes in Internal Control over Financial Reporting
There were no changes in the Company’s internal control over financial reporting that occurred during the Company’s most recent fiscal quarter that have materially affected, or are reasonably likely to materially affect, the Company’s internal control over financial reporting.
None.
28
See “Executive Officers of the Registrant” in Part I of this report.
Additional information required by this Item relating to directors, executive officers and corporate governance of the registrant and information regarding compliance with Section 16(a) of the Exchange Act is incorporated herein by reference to the Company’s Proxy Statement for its 2012 Annual Meeting of Stockholders (the 2012 Proxy Statement).
Code of Ethics
The Company’s Code of Conduct promotes the highest ethical standards in all of the Company’s business dealings. The Code of Conduct satisfies the SEC’s requirements for a Code of Ethics for senior financial officers and applies to all Company employees, including the Chairman, President and Chief Executive Officer, the Chief Financial Officer and the Chief Accounting Officer, and the Company’s directors. The Code of Conduct is available on the Company’s web site at
www.colgatepalmolive.com
. Any amendment to the Code of Conduct will promptly be posted on the Company’s web site. It is the Company’s policy not to grant waivers of the Code of Conduct. In the extremely unlikely event that the Company grants an executive officer a waiver from a provision of the Code of Conduct, the Company will promptly disclose such information by posting it on its web site or by using other appropriate means in accordance with SEC rules.
The information regarding executive compensation set forth in the 2012 Proxy Statement is incorporated herein by reference.
|
ITEM 12.
|
SECURITY OWNERSHIP OF CERTAIN BENEFICIAL OWNERS AND MANAGEMENT AND RELATED STOCKHOLDER MATTERS
|
|
(a)
|
The information regarding security ownership of certain beneficial owners and management set forth in the 2012 Proxy Statement is incorporated herein by reference.
|
|
(b)
|
The registrant does not know of any arrangements that may at a subsequent date result in a change in control of the registrant.
|
|
(c)
|
Equity compensation plan information as of December 31, 2011:
|
|
|
(a)
|
|
(b)
|
|
(c)
|
|
|||||
|
Plan Category
|
Number of securities to be issued upon exercise of outstanding options, warrants and rights
(in thousands)
|
|
Weighted-average exercise price of outstanding options, warrants and rights
|
|
Number of securities remaining available for future issuance under equity compensation plans (excluding securities reflected in column (a))
(in thousands)
|
|
|||||
|
Equity compensation plans approved by security holders
|
25,331
|
|
(1)
|
$
|
67
|
|
(2)
|
18,402
|
|
(3)
|
|
|
Equity compensation plans not approved by security holders
|
Not applicable
|
|
|
Not applicable
|
|
|
Not applicable
|
|
|
||
|
Total
|
25,331
|
|
|
$
|
67
|
|
|
18,402
|
|
|
|
_______
|
(1)
|
Consists of
22,294
options outstanding and
3,037
restricted shares awarded but not yet vested under the Company’s Stock Option and Executive Incentive Compensation Plans, respectively, which are more fully described in Note 7 to the Consolidated Financial Statements.
|
|
(2)
|
Includes the weighted-average exercise price of stock options outstanding of $
76
and restricted shares of $0.
|
|
(3)
|
Amount includes
9,092
options available for issuance under the Company’s Stock Option Plans and
9,310
of restricted shares available for issuance under the Company’s Executive Incentive Compensation Plan.
|
29
The information regarding certain relationships and related transactions and director independence set forth in the 2012 Proxy Statement is incorporated herein by reference.
The information regarding auditor fees and services set forth in the 2012 Proxy Statement is incorporated herein by reference.
30
|
(a)
|
Financial Statements and Financial Statement Schedules
|
See “Index to Financial Statements.”
|
(b)
|
Exhibits
|
See “Exhibits to Form 10-K.”
31
COLGATE-PALMOLIVE COMPANY
SIGNATURES
Pursuant to the requirements of Section 13 or 15(d) of the Securities Exchange Act of 1934, the registrant has duly caused this report to be signed on its behalf by the undersigned, thereunto duly authorized.
|
|
Colgate-Palmolive Company
(Registrant)
|
|
|
|
|
|
|
Date: February 23, 2012
|
By
|
/s/ Ian Cook
|
|
|
|
Ian Cook
Chairman of the Board, President and
Chief Executive Officer
|
Pursuant to the requirements of the Securities Exchange Act of 1934, this report has been signed below on February 23, 2012, by the following persons on behalf of the registrant and in the capacities indicated.
|
(a) Principal Executive Officer
|
|
(d) Directors:
|
|
|
|
|
|
/s/ Ian Cook
|
|
John T. Cahill,
|
|
Ian Cook
Chairman of the Board, President and
Chief Executive Officer
|
|
Helene D. Gayle, Ellen M. Hancock
Joseph Jimenez, Richard J. Kogan
Delano E. Lewis, J. Pedro Reinhard
|
|
|
|
Stephen I. Sadove
|
|
|
|
|
|
(b) Principal Financial Officer
|
|
|
|
|
|
|
|
/s/ Dennis J. Hickey
|
|
/s/ Andrew D. Hendry
|
|
Dennis J. Hickey
Chief Financial Officer
|
|
Andrew D. Hendry
As Attorney-in-Fact
|
|
|
|
|
|
(c) Principal Accounting Officer
|
|
|
|
|
|
|
|
/s/ Victoria L. Dolan
|
|
|
|
Victoria L. Dolan
Vice President and
Corporate Controller
|
|
|
32
Index to Financial Statements
|
|
Page
|
|
Consolidated Financial Statements
|
|
|
|
|
|
Report of Independent Registered Public Accounting Firm
|
|
|
|
|
|
Consolidated Statements of Income for the years ended December 31, 2011, 2010 and 2009
|
|
|
|
|
|
Consolidated Balance Sheets as of December 31, 2011 and 2010
|
|
|
|
|
|
Consolidated Statements of Changes in Shareholders’ Equity for the years ended December 31, 2011, 2010 and 2009
|
|
|
|
|
|
Consolidated Statements of Comprehensive Income for the years ended December 31, 2011, 2010 and 2009
|
|
|
|
|
|
Consolidated Statements of Cash Flows for the years ended December 31, 2011, 2010 and 2009
|
|
|
|
|
|
Notes to Consolidated Financial Statements
|
|
|
|
|
|
Financial Statement Schedule
|
|
|
|
|
|
Schedule II - Valuation and Qualifying Accounts for the years ended December 31, 2011, 2010 and 2009
|
|
|
|
|
|
Selected Financial Data
|
|
|
|
|
|
Market and Dividend Information
|
|
|
|
|
|
Historical Financial Summary
|
|
All other financial statements and schedules not listed have been omitted since the required information is included in the financial statements or the notes thereto or is not applicable or required.
33
Report of Independent Registered Public Accounting Firm
To the Board of Directors and Shareholders of
Colgate-Palmolive Company
In our opinion, the consolidated financial statements listed in the accompanying index present fairly, in all material respects, the financial position of Colgate-Palmolive Company and its subsidiaries (the Company) at December 31, 2011 and 2010, and the results of their operations and their cash flows for each of the three years in the period ended December 31, 2011 in conformity with accounting principles generally accepted in the United States of America. In addition, in our opinion, the financial statement schedule listed in the accompanying index presents fairly, in all material respects, the information set forth therein when read in conjunction with the related consolidated financial statements. Also in our opinion, the Company maintained, in all material respects, effective internal control over financial reporting as of December 31, 2011, based on criteria established in
Internal Control - Integrated Framework
issued by the Committee of Sponsoring Organizations of the Treadway Commission (COSO). The Company's management is responsible for these financial statements and the financial statement schedule, for maintaining effective internal control over financial reporting and for its assessment of the effectiveness of internal control over financial reporting, included in Management's Annual Report on Internal Control over Financial Reporting, appearing under Item 9A. Our responsibility is to express opinions on these financial statements, on the financial statement schedule, and on the Company's internal control over financial reporting based on our integrated audits. We conducted our audits in accordance with the standards of the Public Company Accounting Oversight Board (United States). Those standards require that we plan and perform the audits to obtain reasonable assurance about whether the financial statements are free of material misstatement and whether effective internal control over financial reporting was maintained in all material respects. Our audits of the financial statements included examining, on a test basis, evidence supporting the amounts and disclosures in the financial statements, assessing the accounting principles used and significant estimates made by management, and evaluating the overall financial statement presentation. Our audit of internal control over financial reporting included obtaining an understanding of internal control over financial reporting, assessing the risk that a material weakness exists, and testing and evaluating the design and operating effectiveness of internal control based on the assessed risk. Our audits also included performing such other procedures as we considered necessary in the circumstances. We believe that our audits provide a reasonable basis for our opinions.
A company's internal control over financial reporting is a process designed to provide reasonable assurance regarding the reliability of financial reporting and the preparation of financial statements for external purposes in accordance with generally accepted accounting principles. A company's internal control over financial reporting includes those policies and procedures that (i) pertain to the maintenance of records that, in reasonable detail, accurately and fairly reflect the transactions and dispositions of the assets of the company; (ii) provide reasonable assurance that transactions are recorded as necessary to permit preparation of financial statements in accordance with generally accepted accounting principles, and that receipts and expenditures of the company are being made only in accordance with authorizations of management and directors of the company; and (iii) provide reasonable assurance regarding prevention or timely detection of unauthorized acquisition, use, or disposition of the company's assets that could have a material effect on the financial statements.
Because of its inherent limitations, internal control over financial reporting may not prevent or detect misstatements. Also, projections of any evaluation of effectiveness to future periods are subject to the risk that controls may become inadequate because of changes in conditions, or that the degree of compliance with the policies or procedures may deteriorate.
|
/s/ P
RICEWATERHOUSE
C
OOPERS
LLP
|
|
|
New York, New York
February 23, 2012
|
|
34
COLGATE-PALMOLIVE COMPANY
For the years ended December 31,
(Dollars in Millions Except Per Share Amounts)
|
2011
|
2010
|
2009
|
||||||||||
|
Net sales
|
$
|
16,734
|
|
$
|
15,564
|
|
$
|
15,327
|
|
|||
|
Cost of sales
|
7,144
|
|
6,360
|
|
6,319
|
|
||||||
|
Gross profit
|
9,590
|
|
9,204
|
|
9,008
|
|
||||||
|
Selling, general and administrative expenses
|
5,758
|
|
5,414
|
|
5,282
|
|
||||||
|
Other (income) expense, net
|
(9
|
)
|
301
|
|
111
|
|
||||||
|
Operating profit
|
3,841
|
|
3,489
|
|
3,615
|
|
||||||
|
Interest expense, net
|
52
|
|
59
|
|
77
|
|
||||||
|
Income before income taxes
|
3,789
|
|
3,430
|
|
3,538
|
|
||||||
|
Provision for income taxes
|
1,235
|
|
1,117
|
|
1,141
|
|
||||||
|
Net income including noncontrolling interests
|
2,554
|
|
2,313
|
|
2,397
|
|
||||||
|
Less: Net income attributable to noncontrolling interests
|
123
|
|
110
|
|
106
|
|
||||||
|
Net income attributable to Colgate-Palmolive Company
|
$
|
2,431
|
|
$
|
2,203
|
|
$
|
2,291
|
|
|||
|
Earnings per common share, basic
|
$
|
4.98
|
|
$
|
4.45
|
|
$
|
4.53
|
|
|||
|
Earnings per common share, diluted
|
$
|
4.94
|
|
$
|
4.31
|
|
$
|
4.37
|
|
|||
See Notes to Consolidated Financial Statements.
35
COLGATE-PALMOLIVE COMPANY
As of December 31,
(Dollars in Millions Except Per Share Amounts)
|
2011
|
2010
|
||||||
|
Assets
|
|
|
|||||
|
Current Assets
|
|
|
|||||
|
Cash and cash equivalents
|
$
|
878
|
|
$
|
490
|
|
|
|
Receivables (net of allowances of $49 and $53, respectively)
|
1,675
|
|
1,610
|
|
|||
|
Inventories
|
1,327
|
|
1,222
|
|
|||
|
Other current assets
|
522
|
|
408
|
|
|||
|
Total current assets
|
4,402
|
|
3,730
|
|
|||
|
Property, plant and equipment, net
|
3,668
|
|
3,693
|
|
|||
|
Goodwill, net
|
2,657
|
|
2,362
|
|
|||
|
Other intangible assets, net
|
1,341
|
|
831
|
|
|||
|
Deferred income taxes
|
115
|
|
84
|
|
|||
|
Other assets
|
541
|
|
472
|
|
|||
|
Total assets
|
$
|
12,724
|
|
$
|
11,172
|
|
|
|
Liabilities and Shareholders’ Equity
|
|
|
|
|
|||
|
Current Liabilities
|
|
|
|
|
|||
|
Notes and loans payable
|
$
|
34
|
|
$
|
48
|
|
|
|
Current portion of long-term debt
|
346
|
|
561
|
|
|||
|
Accounts payable
|
1,244
|
|
1,165
|
|
|||
|
Accrued income taxes
|
392
|
|
272
|
|
|||
|
Other accruals
|
1,700
|
|
1,682
|
|
|||
|
Total current liabilities
|
3,716
|
|
3,728
|
|
|||
|
Long-term debt
|
4,430
|
|
2,815
|
|
|||
|
Deferred income taxes
|
252
|
|
108
|
|
|||
|
Other liabilities
|
1,785
|
|
1,704
|
|
|||
|
Total liabilities
|
10,183
|
|
8,355
|
|
|||
|
Commitments and contingent liabilities
|
—
|
|
—
|
|
|||
|
Shareholders’ Equity
|
|
|
|
|
|||
|
Common stock, $1 par value (2,000,000,000 shares authorized, 732,853,180 shares issued)
|
733
|
|
733
|
|
|||
|
Additional paid-in capital
|
1,336
|
|
1,132
|
|
|||
|
Retained earnings
|
15,649
|
|
14,329
|
|
|||
|
Accumulated other comprehensive income (loss)
|
(2,475
|
)
|
(2,115
|
)
|
|||
|
|
15,243
|
|
14,079
|
|
|||
|
Unearned compensation
|
(60
|
)
|
(99
|
)
|
|||
|
Treasury stock, at cost
|
(12,808
|
)
|
(11,305
|
)
|
|||
|
Total Colgate-Palmolive Company shareholders’ equity
|
2,375
|
|
2,675
|
|
|||
|
Noncontrolling interests
|
166
|
|
142
|
|
|||
|
Total shareholders’ equity
|
2,541
|
|
2,817
|
|
|||
|
Total liabilities and shareholders’ equity
|
$
|
12,724
|
|
$
|
11,172
|
|
|
See Notes to Consolidated Financial Statements.
36
COLGATE-PALMOLIVE COMPANY
Consolidated Statements of Changes in Shareholders’ Equity
(Dollars in Millions)
|
|
Colgate-Palmolive Company Shareholders’ Equity
|
|
||||||||||||||||||||||||||||||
|
|
Preference Stock
|
Common Stock
|
Additional Paid-In Capital
|
Unearned Compensation
|
Treasury Stock
|
Retained Earnings
|
Accumulated Other Comprehensive Income (Loss)
|
Noncontrolling Interests
|
||||||||||||||||||||||||
|
Balance, January 1, 2009
|
$
|
181
|
|
$
|
733
|
|
$
|
1,610
|
|
$
|
(187
|
)
|
$
|
(9,697
|
)
|
$
|
11,760
|
|
$
|
(2,477
|
)
|
$
|
121
|
|
||||||||
|
Net income
|
|
|
|
|
|
|
|
|
|
|
2,291
|
|
|
|
106
|
|
||||||||||||||||
|
Other comprehensive income, net of tax
|
|
|
|
|
|
|
|
|
|
|
|
|
381
|
|
1
|
|
||||||||||||||||
|
Dividends declared:
|
|
|
|
|
|
|
|
|
|
|
|
|
|
|
|
|
||||||||||||||||
|
Series B Convertible Preference stock, net of taxes
|
|
|
|
|
|
|
|
|
|
|
(30
|
)
|
|
|
|
|
||||||||||||||||
|
Common stock
|
|
|
|
|
|
|
|
|
|
|
(864
|
)
|
|
|
|
|
||||||||||||||||
|
Noncontrolling interests in Company’s subsidiaries
|
|
|
|
|
|
|
|
|
|
|
|
|
|
|
(87
|
)
|
||||||||||||||||
|
Stock-based compensation expense
|
|
|
|
|
117
|
|
|
|
|
|
|
|
|
|
|
|
||||||||||||||||
|
Shares issued for stock options
|
|
|
|
|
92
|
|
|
|
175
|
|
|
|
|
|
|
|
||||||||||||||||
|
Shares issued for restricted stock awards
|
(47
|
)
|
47
|
|
||||||||||||||||||||||||||||
|
Treasury stock acquired
|
|
|
|
|
|
|
|
|
(1,063
|
)
|
|
|
|
|
|
|
||||||||||||||||
|
Preference stock conversion
|
(12
|
)
|
|
|
(48
|
)
|
|
|
60
|
|
|
|
|
|
|
|
||||||||||||||||
|
Other
|
|
|
|
|
40
|
|
54
|
|
|
|
|
|
|
|
||||||||||||||||||
|
Balance, December 31, 2009
|
$
|
169
|
|
$
|
733
|
|
$
|
1,764
|
|
$
|
(133
|
)
|
$
|
(10,478
|
)
|
$
|
13,157
|
|
$
|
(2,096
|
)
|
$
|
141
|
|
||||||||
|
Net income
|
|
|
|
|
|
|
|
|
|
|
2,203
|
|
|
|
110
|
|
||||||||||||||||
|
Other comprehensive income, net of tax
|
|
|
|
|
|
|
|
|
|
|
|
|
(19
|
)
|
2
|
|
||||||||||||||||
|
Dividends declared:
|
|
|
|
|
|
|
|
|
|
|
|
|
|
|
|
|
||||||||||||||||
|
Series B Convertible Preference stock, net of taxes
|
|
|
|
|
|
|
|
|
|
|
(34
|
)
|
|
|
|
|
||||||||||||||||
|
Common stock
|
|
|
|
|
|
|
|
|
|
|
(997
|
)
|
|
|
|
|
||||||||||||||||
|
Noncontrolling interests in Company’s subsidiaries
|
|
|
|
|
|
|
|
|
|
|
|
|
|
|
(111
|
)
|
||||||||||||||||
|
Stock-based compensation expense
|
|
|
|
|
121
|
|
|
|
|
|
|
|
|
|
|
|
||||||||||||||||
|
Shares issued for stock options
|
|
|
|
|
56
|
|
|
|
153
|
|
|
|
|
|
|
|
||||||||||||||||
|
Shares issued for restricted stock awards
|
(60
|
)
|
60
|
|
||||||||||||||||||||||||||||
|
Treasury stock acquired
|
|
|
|
|
|
|
|
|
(2,020
|
)
|
|
|
|
|
|
|
||||||||||||||||
|
Preference stock conversion
|
(169
|
)
|
|
|
(813
|
)
|
|
|
982
|
|
|
|
|
|
|
|
||||||||||||||||
|
Other
|
|
|
|
|
64
|
|
34
|
|
(2
|
)
|
|
|
|
|
|
|
||||||||||||||||
|
Balance, December 31, 2010
|
$
|
—
|
|
$
|
733
|
|
$
|
1,132
|
|
$
|
(99
|
)
|
$
|
(11,305
|
)
|
$
|
14,329
|
|
$
|
(2,115
|
)
|
$
|
142
|
|
||||||||
|
Net income
|
|
|
|
|
|
|
|
|
|
|
2,431
|
|
|
|
123
|
|
||||||||||||||||
|
Other comprehensive income, net of tax
|
|
|
|
|
|
|
|
|
|
|
|
|
(360
|
)
|
(7
|
)
|
||||||||||||||||
|
Dividends
|
|
|
|
|
|
|
|
|
|
|
(1,111
|
)
|
|
|
(92
|
)
|
||||||||||||||||
|
Stock-based compensation expense
|
|
|
|
|
122
|
|
|
|
|
|
|
|
|
|
|
|
||||||||||||||||
|
Shares issued for stock options
|
|
|
|
|
88
|
|
|
|
251
|
|
|
|
|
|
|
|
||||||||||||||||
|
Shares issued for restricted stock awards
|
(53
|
)
|
53
|
|
||||||||||||||||||||||||||||
|
Treasury stock acquired
|
|
|
|
|
|
|
|
|
(1,806
|
)
|
|
|
|
|
|
|
||||||||||||||||
|
Other
|
|
|
|
|
47
|
|
39
|
|
(1
|
)
|
|
|
|
|
|
|
||||||||||||||||
|
Balance, December 31, 2011
|
$
|
—
|
|
$
|
733
|
|
$
|
1,336
|
|
$
|
(60
|
)
|
$
|
(12,808
|
)
|
$
|
15,649
|
|
$
|
(2,475
|
)
|
$
|
166
|
|
||||||||
37
COLGATE-PALMOLIVE COMPANY
Consolidated Statements of Comprehensive Income
(Dollars in Millions)
|
|
Colgate-Palmolive Company
|
Noncontrolling
Interests
|
Total
|
|||||||||
|
For the year ended December 31, 2009:
|
|
|
|
|||||||||
|
Net income
|
$
|
2,291
|
|
$
|
106
|
|
$
|
2,397
|
|
|||
|
Other comprehensive income, net of tax:
|
|
|
|
|||||||||
|
Cumulative translation adjustment
|
346
|
|
1
|
|
347
|
|
||||||
|
Retirement Plan and other retiree benefit adjustments
|
8
|
|
—
|
|
8
|
|
||||||
|
Other
|
27
|
|
—
|
|
27
|
|
||||||
|
Total Other comprehensive income, net of tax
|
381
|
|
1
|
|
382
|
|
||||||
|
Total comprehensive income
|
$
|
2,672
|
|
$
|
107
|
|
$
|
2,779
|
|
|||
|
For the year ended December 31, 2010:
|
|
|
|
|||||||||
|
Net income
|
$
|
2,203
|
|
$
|
110
|
|
$
|
2,313
|
|
|||
|
Other comprehensive income, net of tax:
|
|
|
|
|||||||||
|
Cumulative translation adjustment
|
162
|
|
2
|
|
164
|
|
||||||
|
Retirement Plan and other retiree benefit adjustments
|
(143
|
)
|
—
|
|
(143
|
)
|
||||||
|
Other
|
(38
|
)
|
—
|
|
(38
|
)
|
||||||
|
Total Other comprehensive income, net of tax
|
(19
|
)
|
2
|
|
(17
|
)
|
||||||
|
Total comprehensive income
|
$
|
2,184
|
|
$
|
112
|
|
$
|
2,296
|
|
|||
|
For the year ended December 31, 2011:
|
|
|
|
|||||||||
|
Net income
|
$
|
2,431
|
|
$
|
123
|
|
$
|
2,554
|
|
|||
|
Other comprehensive income, net of tax:
|
|
|
|
|||||||||
|
Cumulative translation adjustment
|
(298
|
)
|
(7
|
)
|
(305
|
)
|
||||||
|
Retirement Plan and other retiree benefit adjustments
|
(108
|
)
|
—
|
|
(108
|
)
|
||||||
|
Other
|
46
|
|
—
|
|
46
|
|
||||||
|
Total Other comprehensive income, net of tax
|
(360
|
)
|
(7
|
)
|
(367
|
)
|
||||||
|
Total comprehensive income
|
$
|
2,071
|
|
$
|
116
|
|
$
|
2,187
|
|
|||
See Notes to Consolidated Financial Statements.
38
COLGATE-PALMOLIVE COMPANY
For the years ended December 31,
(Dollars in Millions Except Per Share Amounts)
|
|
2011
|
2010
|
2009
|
||||||||
|
Operating Activities
|
|
|
|||||||||
|
Net income including noncontrolling interests
|
$
|
2,554
|
|
$
|
2,313
|
|
$
|
2,397
|
|
||
|
Adjustments to reconcile net income including noncontrolling interests to net cash provided by operations:
|
|
|
|
|
|||||||
|
Depreciation and amortization
|
421
|
|
376
|
|
351
|
|
|||||
|
Restructuring and termination benefits, net of cash
|
103
|
|
86
|
|
(18
|
)
|
|||||
|
Venezuela hyperinflationary transition charge
|
—
|
|
271
|
|
—
|
|
|||||
|
Gain before tax on sales of non-core product lines
|
(207
|
)
|
(50
|
)
|
(5
|
)
|
|||||
|
Voluntary benefit plan contributions
|
(178
|
)
|
(35
|
)
|
(73
|
)
|
|||||
|
Stock-based compensation expense
|
122
|
|
121
|
|
117
|
|
|||||
|
Deferred income taxes
|
88
|
|
29
|
|
(23
|
)
|
|||||
|
Cash effects of changes in:
|
|
|
|||||||||
|
Receivables
|
(130
|
)
|
40
|
|
57
|
|
|||||
|
Inventories
|
(130
|
)
|
(10
|
)
|
44
|
|
|||||
|
Accounts payable and other accruals
|
199
|
|
(65
|
)
|
294
|
|
|||||
|
Other non-current assets and liabilities
|
54
|
|
135
|
|
136
|
|
|||||
|
Net cash provided by operations
|
2,896
|
|
3,211
|
|
3,277
|
|
|||||
|
Investing Activities
|
|
|
|
|
|||||||
|
Capital expenditures
|
(537
|
)
|
(550
|
)
|
(575
|
)
|
|||||
|
Sale of property and non-core product lines
|
263
|
|
42
|
|
17
|
|
|||||
|
Purchases of marketable securities and investments
|
(356
|
)
|
(308
|
)
|
(289
|
)
|
|||||
|
Proceeds from sale of marketable securities and investments
|
423
|
|
167
|
|
—
|
|
|||||
|
Payment for acquisitions, net of cash acquired
|
(966
|
)
|
—
|
|
—
|
|
|||||
|
Other
|
(40
|
)
|
(9
|
)
|
6
|
|
|||||
|
Net cash used in investing activities
|
(1,213
|
)
|
(658
|
)
|
(841
|
)
|
|||||
|
Financing Activities
|
|
|
|
|
|||||||
|
Principal payments on debt
|
(4,429
|
)
|
(4,719
|
)
|
(3,950
|
)
|
|||||
|
Proceeds from issuance of debt
|
5,843
|
|
5,015
|
|
3,424
|
|
|||||
|
Dividends paid
|
(1,203
|
)
|
(1,142
|
)
|
(981
|
)
|
|||||
|
Purchases of treasury shares
|
(1,806
|
)
|
(2,020
|
)
|
(1,063
|
)
|
|||||
|
Proceeds from exercise of stock options and excess tax benefits
|
353
|
|
242
|
|
300
|
|
|||||
|
Net cash used in financing activities
|
(1,242
|
)
|
(2,624
|
)
|
(2,270
|
)
|
|||||
|
Effect of exchange rate changes on Cash and cash equivalents
|
(53
|
)
|
(39
|
)
|
(121
|
)
|
|||||
|
Net increase (decrease) in Cash and cash equivalents
|
388
|
|
(110
|
)
|
45
|
|
|||||
|
Cash and cash equivalents at beginning of year
|
490
|
|
600
|
|
555
|
|
|||||
|
Cash and cash equivalents at end of year
|
$
|
878
|
|
$
|
490
|
|
$
|
600
|
|
||
|
Supplemental Cash Flow Information
|
|
|
|
|
|||||||
|
Income taxes paid
|
$
|
1,007
|
|
$
|
1,123
|
|
$
|
1,098
|
|
||
|
Interest paid
|
58
|
|
70
|
|
98
|
|
|||||
|
Principal payments on ESOP debt, guaranteed by the Company
|
—
|
|
—
|
|
74
|
|
|||||
See Notes to Consolidated Financial Statements.
39
COLGATE-PALMOLIVE COMPANY
Notes to Consolidated Financial Statements
(Dollars in Millions Except Share and Per Share Amounts)
1. Nature of Operations
The Company manufactures and markets a wide variety of products in the U.S. and around the world in
two
distinct business segments: Oral, Personal and Home Care; and Pet Nutrition. Oral, Personal and Home Care products include toothpaste, toothbrushes and mouth rinses, bar and liquid hand soaps, shower gels, shampoos, conditioners, deodorants and antiperspirants, laundry and dishwashing detergents, fabric conditioners, household cleaners, bleaches and other similar items. These products are sold primarily to wholesale and retail distributors worldwide. Pet Nutrition products include specialty pet nutrition products manufactured and marketed by Hill’s Pet Nutrition. The principal customers for Pet Nutrition products are veterinarians and specialty pet retailers. Principal global and regional trademarks include Colgate, Palmolive, Mennen, Speed Stick, Lady Speed Stick, Softsoap, Sanex, Irish Spring, Protex, Sorriso, Kolynos, elmex, Tom’s of Maine, Ajax, Axion, Fabuloso, Soupline, Suavitel, Hill’s Science Diet and Hill’s Prescription Diet.
The Company’s principal classes of products accounted for the following percentages of worldwide sales for the past three years:
|
|
2011
|
2010
|
2009
|
||||||
|
Oral Care
|
43
|
%
|
43
|
%
|
41
|
%
|
|||
|
Home Care
|
22
|
%
|
22
|
%
|
23
|
%
|
|||
|
Personal Care
|
22
|
%
|
22
|
%
|
22
|
%
|
|||
|
Pet Nutrition
|
13
|
%
|
13
|
%
|
14
|
%
|
|||
|
Total
|
100
|
%
|
100
|
%
|
100
|
%
|
|||
2. Summary of Significant Accounting Policies
Principles of Consolidation
The Consolidated Financial Statements include the accounts of Colgate-Palmolive Company and its majority-owned subsidiaries. Intercompany transactions and balances have been eliminated. The Company’s investments in consumer products companies with interests ranging between
20%
and
50%
, where the Company has significant influence over the investee, are accounted for using the equity method. Net income (loss) from such investments is recorded in Other (income) expense, net in the Consolidated Statements of Income. As of December 31, 2011 and 2010, equity method investments included in Other assets were
$20
and
$17
, respectively. Unrelated third parties hold the remaining ownership interests in these investments. Investments with less than a
20%
interest are accounted for using the cost method.
Use of Estimates
The preparation of financial statements in accordance with accounting principles generally accepted in the United States of America requires management to use judgment and make estimates that affect the reported amounts of assets and liabilities and disclosure of contingent gains and losses at the date of the financial statements and the reported amounts of revenues and expenses during the reporting period. The level of uncertainty in estimates and assumptions increases with the length of time until the underlying transactions are completed. As such, the most significant uncertainty in the Company’s assumptions and estimates involved in preparing the financial statements includes pension and other retiree benefit cost assumptions, stock-based compensation, asset impairment, uncertain tax positions, tax valuation allowances and legal and other contingency reserves. Additionally, the Company uses available market information and other valuation methodologies in assessing the fair value of financial instruments and retirement plan assets. Judgment is required in interpreting market data to develop the estimates of fair value and, accordingly, changes in assumptions or the estimation methodologies may affect the fair value estimates. Actual results could ultimately differ from those estimates.
Revenue Recognition
Sales are recorded at the time products are shipped to trade customers and when risk of ownership transfers. Net sales reflect units shipped at selling list prices reduced by sales returns and the cost of current and continuing promotional programs. Current promotional programs, such as product listing allowances and co-operative advertising arrangements, are recorded in the period incurred. Continuing promotional programs are predominantly consumer coupons and volume-based sales incentive
40
COLGATE-PALMOLIVE COMPANY
Notes to Consolidated Financial Statements (continued)
(Dollars in Millions Except Share and Per Share Amounts)
arrangements with trade customers. The redemption cost of consumer coupons is based on historical redemption experience and is recorded when coupons are distributed. Volume-based incentives offered to trade customers are based on the estimated cost of the program and are recorded as products are sold.
Shipping and Handling Costs
Shipping and handling costs are classified as Selling, general and administrative expenses and were
$1,250
,
$1,142
and
$1,116
for the years ended December 31, 2011, 2010 and 2009, respectively.
Marketing Costs
The Company markets its products through advertising and other promotional activities. Advertising costs are included in Selling, general and administrative expenses and are expensed as incurred. Certain consumer and trade promotional programs, such as consumer coupons, are recorded as a reduction of sales.
Cash and Cash Equivalents
The Company considers all highly liquid investments with original maturities of three months or less to be cash equivalents.
Inventories
Inventories are stated at the lower of cost or market. The cost of approximately
80%
of inventories is determined using the first-in, first-out (FIFO) method. The cost of all other inventories, predominantly in the U.S. and Mexico, is determined using the last-in, first-out (LIFO) method.
Property, Plant and Equipment
Land, buildings and machinery and equipment are stated at cost. Depreciation is provided, primarily using the straight-line method, over estimated useful lives ranging from
3
to
15
years for machinery and equipment and up to
40
years for buildings. Depreciation attributable to manufacturing operations is included in Cost of sales. The remaining component of depreciation is included in Selling, general and administrative expenses.
Goodwill and Other Intangibles
Goodwill and indefinite life intangible assets, such as the Company’s global brands, are subject to impairment tests at least annually. These tests were performed and did not result in an impairment charge. Other intangible assets with finite lives, such as local brands and trademarks, customer relationships and non-compete agreements, are amortized over their useful lives, ranging from
5
to
40
years. Amortization expense related to intangible assets is included in Other (income) expense, net, which is included in Operating profit.
Income Taxes
The provision for income taxes is determined using the asset and liability method. Under this method, deferred tax assets and liabilities are recognized based upon the differences between the financial statement and tax bases of assets and liabilities using enacted tax rates that will be in effect at the time such differences are expected to reverse. Deferred tax assets are reduced by a valuation allowance when, in the opinion of management, it is more likely than not that some portion or all of the deferred tax assets will not be realized. Provision is made currently for taxes payable on remittances of overseas earnings; no provision is made for taxes on overseas retained earnings that are deemed to be permanently reinvested.
The Company uses a comprehensive model to recognize, measure, present and disclose in its financial statements uncertain tax positions that the Company has taken or expects to take on an income tax return. The Company recognizes interest expense and penalties related to unrecognized tax benefits within income tax expense.
41
COLGATE-PALMOLIVE COMPANY
Notes to Consolidated Financial Statements (continued)
(Dollars in Millions Except Share and Per Share Amounts)
Financial Instruments
Derivative instruments are recorded as assets and liabilities at estimated fair value based on available market information. The Company’s derivative instruments that qualify for hedge accounting are designated as either fair value hedges, cash flow hedges or net investment hedges. For fair value hedges, changes in fair value of the derivative, as well as the offsetting changes in fair value of the hedged item, are recognized in earnings each period. For cash flow hedges, changes in fair value of the derivative are recorded in Other comprehensive income (loss) and are recognized in earnings when the offsetting effect of the hedged item is also recognized in earnings. For hedges of the net investment in foreign subsidiaries, changes in fair value of the derivative are recorded in Other comprehensive income (loss) to offset the change in the value of the net investment being hedged. Cash flows related to hedges are classified in the same category as the cash flows from the hedged item in the Consolidated Statements of Cash Flows.
The Company may also enter into certain foreign currency and interest rate instruments that economically hedge certain of its risks but do not qualify for hedge accounting. Changes in fair value of these derivative instruments, based on quoted market prices, are recognized in earnings each period. The Company’s derivative instruments and other financial instruments are more fully described in Note 6, along with the related fair value measurement considerations.
Stock-Based Compensation
The Company recognizes the cost of employee services received in exchange for awards of equity instruments, such as stock options and restricted stock, based on the fair value of those awards at the date of grant over the requisite service period. The Company uses the Black-Scholes-Merton (Black-Scholes) option pricing model to determine the fair value of stock option awards. Stock-based compensation plans, related expenses and assumptions used in the Black-Scholes option pricing model are more fully described in Note 7.
Currency Translation
The assets and liabilities of foreign subsidiaries, other than those operating in highly inflationary environments, are translated into U.S. dollars at year-end exchange rates with resulting translation gains and losses accumulated in a separate component of shareholders’ equity. Income and expense items are translated into U.S. dollars at average rates of exchange prevailing during the year.
For subsidiaries operating in highly inflationary environments, non-monetary assets, such as inventories, prepaid expenses, goodwill and property, plant and equipment are remeasured at their historical exchange rates, while monetary assets and liabilities are remeasured at year-end exchange rates. Remeasurement adjustments for these operations are included in Net income attributable to Colgate-Palmolive Company.
Recent Accounting Pronouncements
In June 2011, the Financial Accounting Standards Board (FASB) issued Accounting Standards Update (ASU) No. 2011-05, “Presentation of Comprehensive Income”. ASU No. 2011-05 eliminates the current option to disclose other comprehensive income and its components in the statement of changes in equity. As permitted under ASU No. 2011-05, the Company has elected to present items of net income and other comprehensive income in two separate consecutive statements beginning in the first quarter of 2012. This standard will not have a material impact on the Company's financial position or results of operations.
Reclassifications
Certain prior year amounts have been reclassified to conform to the current year presentation.
3. Acquisitions and Divestitures
2011
Sanex Acquisition
On June 20, 2011, the Company, Colgate-Palmolive Europe Sàrl, Unilever N.V. and Unilever PLC (together with Unilever
42
COLGATE-PALMOLIVE COMPANY
Notes to Consolidated Financial Statements (continued)
(Dollars in Millions Except Share and Per Share Amounts)
N.V., “Unilever”) finalized the Company’s acquisition from Unilever of the Sanex personal care business in accordance with a Business and Share Sale and Purchase Agreement (the “Purchase Agreement”) for an aggregate purchase price of
€676
(
$966
), subject to certain post-closing purchase price adjustments. The acquisition was financed with available cash, proceeds from the sale of the Company’s Euro-denominated investment portfolio and the issuance of commercial paper.
Sanex is a personal care brand with a distinct positioning around healthy skin with strong market share positions and net sales of
$140
in 2011 since the acquisition date, primarily in Western Europe. This strategic acquisition is expected to strengthen Colgate’s personal care business in Europe, primarily in the liquid body cleansing and deodorants businesses.
Total purchase price consideration of
$966
has been allocated to the net assets acquired based on their respective fair values at June 20, 2011, as follows:
|
Recognized amounts of assets acquired and liabilities assumed:
|
|
||
|
Inventories
|
$
|
26
|
|
|
Property, plant and equipment, net
|
3
|
|
|
|
Other intangible assets, net
|
596
|
|
|
|
Goodwill, net
|
411
|
|
|
|
Accrued income taxes
|
(48
|
)
|
|
|
Long-term deferred income taxes
|
(18
|
)
|
|
|
Long-term other liabilities
|
(4
|
)
|
|
|
Fair value of net assets acquired
|
$
|
966
|
|
Other intangible assets acquired include trademarks of
$403
with an indefinite useful life and customer relationships of
$193
with useful lives ranging from
15
to
18
years.
Goodwill of
$411
was allocated between the Europe/South Pacific segment (
90%
) and the Greater Asia/Africa segment (
10%
). The Company expects that substantially all of the goodwill will be deductible for tax purposes.
Pro forma results of operations have not been presented, as the impact on the Company’s consolidated financial statements is not material. In 2011, Other (income) expense, net includes
$12
in transaction costs related to the acquisition.
Sale of Detergent Business in Colombia
In connection with the Sanex acquisition, Colgate sold its laundry detergent business in Colombia to Unilever for
$215
. The detergent sale closed on July 29, 2011 and, as a result of the sale, the Company recognized a pretax gain of
$207
(
$135
aftertax gain) in the third quarter. These operations were not material to the Company’s annual Net sales, Net income or Earnings per share.
Sale of Land in Mexico
On September 13, 2011, the Company's Mexican subsidiary entered into an agreement to sell to the United States of America the Mexico City site on which its commercial operations, technology center and soap production facility are located. The sale price is payable in three installments, with the final installment due upon the transfer of the property, which is expected to occur in 2014. During the third quarter of 2011, the Company received the first installment of
$24
upon signing the agreement. The Company intends to re-invest these payments to relocate its soap production to a new state-of-the-art facility to be constructed at its Mission Hills, Mexico site, to relocate its commercial and technology operations within Mexico City and to prepare the existing site for transfer. As a result, over the next three years, the Company expects to make capital improvements and incur costs to exit the site. These exit costs will primarily be related to staff leaving indemnities, accelerated depreciation and demolition. In 2011, the Company recorded
$13
of pretax costs (
$9
of aftertax costs) related to the sale in Other (income) expense, net.
43
COLGATE-PALMOLIVE COMPANY
Notes to Consolidated Financial Statements (continued)
(Dollars in Millions Except Share and Per Share Amounts)
2010
Sale of Non-core Product Lines in Latin America
During the fourth quarter of 2010, consistent with the Company’s strategy to prioritize its higher-margin businesses, the Company sold certain non-core product lines in Latin America, resulting in a pretax gain of
$50
(
$30
aftertax gain) included in Other (income) expense, net. These operations were not material to the Company’s annual Net sales, Net income or Earnings per share.
4. Goodwill and Other Intangible Assets
The net carrying value of Goodwill as of
December 31, 2011
and 2010, by segment is as follows:
|
|
2011
|
2010
|
||||||
|
Oral, Personal and Home Care
|
|
|
||||||
|
North America
|
$
|
370
|
|
$
|
375
|
|
||
|
Latin America
|
597
|
|
655
|
|
||||
|
Europe/South Pacific
|
1,450
|
|
1,123
|
|
||||
|
Greater Asia/Africa
|
225
|
|
194
|
|
||||
|
Total Oral, Personal and Home Care
|
2,642
|
|
2,347
|
|
||||
|
Pet Nutrition
|
15
|
|
15
|
|
||||
|
Total Goodwill
|
$
|
2,657
|
|
$
|
2,362
|
|
||
The change in the amount of Goodwill during 2011 is primarily due to the acquisition of Sanex (see Note 3) and the impact of foreign currency translation. The change in the amount of Goodwill during 2010 is primarily due to the impact of foreign currency translation.
Other intangible assets as of
December 31, 2011
and 2010 are comprised of the following:
|
|
2011
|
2010
|
||||||||||||||||||||||
|
|
Gross Carrying Amount
|
Accumulated Amortization
|
Net
|
Gross Carrying Amount
|
Accumulated Amortization
|
Net
|
||||||||||||||||||
|
Trademarks
|
$
|
457
|
|
$
|
(157
|
)
|
$
|
300
|
|
$
|
545
|
|
$
|
(221
|
)
|
$
|
324
|
|
||||||
|
Other finite life intangible assets
|
205
|
|
(18
|
)
|
187
|
|
35
|
|
(16
|
)
|
19
|
|
||||||||||||
|
Indefinite life intangible assets
|
854
|
|
—
|
|
854
|
|
488
|
|
—
|
|
488
|
|
||||||||||||
|
Total Other intangible assets
|
$
|
1,516
|
|
$
|
(175
|
)
|
$
|
1,341
|
|
$
|
1,068
|
|
$
|
(237
|
)
|
$
|
831
|
|
||||||
The changes in the net carrying amounts of Other intangible assets during 2011, 2010 and 2009 were partially due to amortization expense of
$28
,
$22
and
$22
, respectively, as well as the impact of foreign currency translation. In addition, in 2011, Indefinite life intangible assets included trademarks of
$403
and Other finite life intangible assets included customer relationships of
$193
acquired in connection with the Sanex acquisition (see Note 3). Annual estimated amortization expense for each of the next five years is expected to be approximately
$29
.
44
COLGATE-PALMOLIVE COMPANY
Notes to Consolidated Financial Statements (continued)
(Dollars in Millions Except Share and Per Share Amounts)
Long-term debt consists of the following at December 31:
|
|
Weighted Average Interest Rate
|
Maturities
|
2011
|
2010
|
||||||||||
|
Notes
|
2.4%
|
2012
|
-
|
2078
|
$
|
4,089
|
|
$
|
2,603
|
|
||||
|
Payable to banks
|
4.7%
|
2012
|
-
|
2013
|
16
|
|
559
|
|
||||||
|
Commercial paper
|
0.1%
|
2012
|
671
|
|
214
|
|
||||||||
|
|
|
4,776
|
|
3,376
|
|
|||||||||
|
Less: Current portion of long-term debt
|
|
346
|
|
561
|
|
|||||||||
|
Total
|
|
$
|
4,430
|
|
$
|
2,815
|
|
|||||||
The weighted-average interest rate on short-term borrowings of
$34
in 2011 and
$48
in 2010 included in Notes and loans payable in the Consolidated Balance Sheets as of December 31, 2011 and 2010 was
0.9%
and
3.1%
, respectively.
Commercial paper is classified as long-term debt as the Company has the intent and ability to refinance such obligations on a long-term basis. Excluding commercial paper reclassified as long-term debt, scheduled maturities of long-term debt and capitalized leases outstanding as of December 31, 2011, are as follows:
|
Years Ended December 31,
|
|||
|
2012
|
$
|
346
|
|
|
2013
|
264
|
|
|
|
2014
|
882
|
|
|
|
2015
|
493
|
|
|
|
2016
|
254
|
|
|
|
Thereafter
|
1,866
|
|
|
The Company has entered into interest rate swap agreements and foreign exchange contracts related to certain of these debt instruments. See Note 6 for further information about the Company’s financial instruments.
During the
fourth quarter of 2011
, the Company issued $
300
of U.S. dollar-denominated
three-year
notes at a fixed rate of
0.6%
, $
400
of U.S. dollar-denominated
five-year
notes at a fixed rate of
1.3%
and $
300
of U.S. dollar-denominated
ten-year
notes at a fixed rate of
2.45%
under the Company’s shelf registration statement. During the
second quarter of 2011
, the Company issued $
250
of U.S. dollar-denominated
three-year
notes at a fixed rate of
1.25%
and $
250
of U.S. dollar-denominated
six-year
notes at a fixed rate of
2.625%
under the Company’s shelf registration statement. Proceeds from the debt issuances were used to reduce commercial paper borrowings and, in the case of the fourth quarter 2011 debt issuance, to repay outstanding indebtedness under a €
408
credit facility.
At December 31, 2011, the Company had access to unused domestic and foreign lines of credit of $
2,705
(including under the two facilities discussed below) and could also issue medium-term notes pursuant to an effective shelf registration statement. In November 2011, the Company entered into a new five-year revolving credit facility with a capacity of $
1,850
with a syndicate of banks. The facility, which expires in
November 2016
, replaced an existing credit facility with a capacity of $
1,600
which was due to expire in
November 2012
. The Company also has the ability to draw
$145
from a revolving credit facility that expires in
November 2012
. Commitment fees related to credit facilities are not material.
During the
fourth quarter of 2010
, the Company issued $
188
of
five-year
notes at a fixed rate of
1.375%
and $
250
of
ten-year
notes at a fixed rate of
2.95%
under the Company’s shelf registration statement. Proceeds from the debt issuances were used to reduce commercial paper borrowings.
Certain of the facilities with respect to the Company’s bank borrowings contain financial and other covenants as well as cross-default provisions. Noncompliance with these requirements could ultimately result in the acceleration of amounts owed. The Company is in full compliance with all such requirements and believes the likelihood of noncompliance is remote.
45
COLGATE-PALMOLIVE COMPANY
Notes to Consolidated Financial Statements (continued)
(Dollars in Millions Except Share and Per Share Amounts)
6. Fair Value Measurements and Financial Instruments
The Company is exposed to market risk from foreign currency exchange rates, interest rates and commodity price fluctuations. Volatility relating to these exposures is managed on a global basis by utilizing a number of techniques, including working capital management, selling price increases, selective borrowings in local currencies and entering into selective derivative instrument transactions, issued with standard features, in accordance with the Company’s treasury and risk management policies, which prohibit the use of derivatives for speculative purposes and leveraged derivatives for any purpose. It is the Company’s policy to enter into derivative instrument contracts with terms that match the underlying exposure being hedged. Hedge ineffectiveness, if any, is not material for any period presented. Provided below are details of the Company’s exposures by type of risk and derivative instruments by type of hedge designation.
Valuation Considerations
Assets and liabilities carried at fair value are classified as follows:
Level 1: Based upon quoted market prices in active markets for identical assets or liabilities.
Level 2: Based upon observable market-based inputs or unobservable inputs that are corroborated by market data.
Level 3: Based upon unobservable inputs reflecting the reporting entity’s own assumptions.
Foreign Exchange Risk
As the Company markets its products in over
200
countries and territories, it is exposed to currency fluctuations related to manufacturing and selling its products in currencies other than the U.S. dollar. The Company manages its foreign currency exposures through a combination of cost-containment measures, selling price increases and the hedging of certain costs in an effort to minimize the impact on earnings of foreign currency rate movements.
The Company primarily utilizes foreign currency contracts, including forward, option and swap contracts, local currency deposits and local currency borrowings to hedge portions of its exposures relating to foreign currency purchases, assets and liabilities created in the normal course of business and the net investment in certain foreign subsidiaries. The duration of foreign currency contracts generally does not exceed 12 months and the contracts are valued using observable market rates (Level 2 valuation).
Interest Rate Risk
The Company manages its targeted mix of fixed and floating rate debt with debt issuances and by entering into interest rate swaps in order to mitigate fluctuations in earnings and cash flows that may result from interest rate volatility. The notional amount, interest payment and maturity date of the swaps match the principal, interest payment and maturity date of the related debt in all cases, and the swaps are valued using observable benchmark rates (Level 2 valuation).
Commodity Price Risk
The Company is exposed to price volatility related to raw materials used in production, such as resins, tropical oils, essential oils, tallow, corn and soybeans. The Company manages its raw material exposures through a combination of cost containment measures, ongoing productivity initiatives and the limited use of commodity hedging contracts. Futures contracts are used on a limited basis, primarily in the Pet Nutrition segment, to manage volatility related to raw material inventory purchases of certain traded commodities, and these contracts are measured using quoted commodity exchange prices (Level 1 valuation). The duration of the commodity contracts generally does not exceed 12 months.
Credit Risk
The Company is exposed to the risk of credit loss in the event of nonperformance by counterparties to financial instrument contracts; however, nonperformance is considered unlikely and any nonperformance is unlikely to be material as it is the Company’s policy to contract with highly rated, diverse counterparties.
46
COLGATE-PALMOLIVE COMPANY
Notes to Consolidated Financial Statements (continued)
(Dollars in Millions Except Share and Per Share Amounts)
The following summarizes the fair value of the Company’s derivative instruments and other financial instruments at
December 31, 2011
and
December 31, 2010
:
|
|
Assets
|
Liabilities
|
|||||||||||||||||
|
|
Account
|
Fair Value
|
Account
|
Fair Value
|
|||||||||||||||
|
Designated derivative instruments
|
|
12/31/11
|
12/31/10
|
|
12/31/11
|
12/31/10
|
|||||||||||||
|
Interest rate swap contracts
|
Other current assets
|
$
|
2
|
|
$
|
—
|
|
Other accruals
|
$
|
—
|
|
$
|
—
|
|
|||||
|
Interest rate swap contracts
|
Other assets
|
40
|
|
22
|
|
Other liabilities
|
2
|
|
7
|
|
|||||||||
|
Foreign currency contracts
|
Other current assets
|
8
|
|
10
|
|
Other accruals
|
6
|
|
10
|
|
|||||||||
|
Foreign currency contracts
|
Other assets
|
28
|
|
—
|
|
Other liabilities
|
—
|
|
—
|
|
|||||||||
|
Commodity contracts
|
Other current assets
|
—
|
|
4
|
|
Other accruals
|
1
|
|
—
|
|
|||||||||
|
Total designated
|
|
$
|
78
|
|
$
|
36
|
|
|
$
|
9
|
|
$
|
17
|
|
|||||
|
Derivatives not designated
|
|
|
|
|
|
|
|
|
|
|
|||||||||
|
Foreign currency contracts
|
Other assets
|
$
|
3
|
|
$
|
—
|
|
Other accruals
|
$
|
—
|
|
$
|
2
|
|
|||||
|
Total not designated
|
|
$
|
3
|
|
$
|
—
|
|
|
$
|
—
|
|
$
|
2
|
|
|||||
|
Total derivative instruments
|
|
$
|
81
|
|
$
|
36
|
|
|
$
|
9
|
|
$
|
19
|
|
|||||
|
Other financial instruments
|
|
|
|
|
|
|
|
|
|
|
|||||||||
|
Marketable securities
|
Other current assets
|
$
|
72
|
|
$
|
74
|
|
|
|
|
|
|
|||||||
|
Available-for-sale securities
|
Other assets
|
236
|
|
228
|
|
|
|
|
|
|
|||||||||
|
Total other financial instruments
|
|
$
|
308
|
|
$
|
302
|
|
|
|
|
|
|
|||||||
The carrying amount of cash, cash equivalents, accounts receivable and short-term debt approximated fair value as of
December 31, 2011
and 2010. The estimated fair value of the Company’s long-term debt, including the current portion, as of
December 31, 2011
and 2010, was
$5,121
and
$3,613
, respectively, and the related carrying value was
$4,776
and
$3,376
, respectively. The estimated fair value of long-term debt was derived principally from quoted prices on the Company’s outstanding fixed-term notes (Level 2 valuation).
Fair value hedges
The Company has designated all interest rate swap contracts and certain foreign currency forward and option contracts as fair value hedges, for which the gain or loss on the derivative and the offsetting loss or gain on the hedged item are recognized in current earnings. The impact of foreign currency contracts is primarily recognized in Selling, general and administrative expenses and the impact of interest rate swap contracts is recognized in Interest expense, net. Activity related to fair value hedges recorded during each period presented was as follows:
|
|
2011
|
2010
|
|||||||||||||||||||||
|
|
Foreign
Currency
Contracts
|
Interest
Rate
Swaps
|
Total
|
Foreign
Currency
Contracts
|
Interest
Rate
Swaps
|
Total
|
|||||||||||||||||
|
Notional Value at December 31,
|
$
|
670
|
|
$
|
1,668
|
|
$
|
2,338
|
|
$
|
769
|
|
$
|
788
|
|
$
|
1,557
|
|
|||||
|
Gain (loss) on derivative
|
5
|
|
25
|
|
30
|
|
—
|
|
(2
|
)
|
(2
|
)
|
|||||||||||
|
Gain (loss) on hedged items
|
(5
|
)
|
(25
|
)
|
(30
|
)
|
—
|
|
2
|
|
2
|
|
|||||||||||
47
COLGATE-PALMOLIVE COMPANY
Notes to Consolidated Financial Statements (continued)
(Dollars in Millions Except Share and Per Share Amounts)
Cash flow hedges
All of the Company’s commodity contracts and certain foreign currency forward contracts have been designated as cash flow hedges, for which the effective portion of the gain or loss is reported as a component of Other comprehensive income (OCI) and reclassified into earnings in the same period or periods during which the hedged transaction affects earnings. Activity related to cash flow hedges recorded during each period presented was as follows:
|
|
2011
|
2010
|
|||||||||||||||||||||
|
|
Foreign
Currency
Contracts
|
Commodity
Contracts
|
Total
|
Foreign
Currency
Contracts
|
Commodity
Contracts
|
Total
|
|||||||||||||||||
|
Notional Value at December 31,
|
$
|
403
|
|
$
|
32
|
|
$
|
435
|
|
$
|
371
|
|
$
|
18
|
|
$
|
389
|
|
|||||
|
Gain (loss) recognized in OCI
|
(9
|
)
|
(1
|
)
|
(10
|
)
|
(3
|
)
|
5
|
|
2
|
|
|||||||||||
|
Gain (loss) reclassified into Cost of sales
|
(13
|
)
|
4
|
|
(9
|
)
|
3
|
|
1
|
|
4
|
|
|||||||||||
The net gain (loss) recognized in OCI for both foreign currency contracts and commodity contracts is expected to be recognized in Cost of sales within the next twelve months.
Net investment hedges
The Company has designated certain foreign currency forward and option contracts and certain foreign currency-denominated debt as net investment hedges, for which the gain or loss on the instrument is reported as a component of Currency translation adjustments within OCI, along with the offsetting gain or loss on the hedged items. Activity related to net investment hedges recorded during each period presented was as follows:
|
|
2011
|
2010
|
|||||||||||||||||||||
|
|
Foreign
Currency
Contracts
|
Foreign
Currency
Debt
|
Total
|
Foreign
Currency
Contracts
|
Foreign
Currency
Debt
|
Total
|
|||||||||||||||||
|
Notional Value at December 31,
|
$
|
485
|
|
$
|
194
|
|
$
|
679
|
|
$
|
131
|
|
$
|
312
|
|
$
|
443
|
|
|||||
|
Gain (loss) on instruments
|
8
|
|
1
|
|
9
|
|
(8
|
)
|
2
|
|
(6
|
)
|
|||||||||||
|
Gain (loss) on hedged items
|
(8
|
)
|
(1
|
)
|
(9
|
)
|
8
|
|
(2
|
)
|
6
|
|
|||||||||||
Derivatives Not Designated as Hedging Instruments
Derivatives not designated as hedging instruments for each period consist of a cross-currency swap that serves as an economic hedge of a foreign currency deposit, for which the gain or loss on the instrument and the offsetting gain or loss on the hedged item are recognized in Other (income) expense, net for each period. The cross-currency swap outstanding at
December 31, 2010
was settled during the second quarter of 2011, resulting in a realized loss of
$6
which was offset by a corresponding gain on an underlying deposit. A new cross-currency swap with similar terms and an underlying foreign currency deposit was entered into during June 2011. Activity related to these contracts during each period presented was as follows:
|
|
2011
|
2010
|
|||||
|
|
Cross-currency
Swap
|
Cross-currency
Swap
|
|||||
|
Notional Value at December 31,
|
$
|
96
|
|
$
|
90
|
|
|
|
Gain (loss) on instrument
|
(1
|
)
|
4
|
|
|||
|
Gain (loss) on hedged item
|
1
|
|
(4
|
)
|
|||
The cross-currency swap outstanding at December 31, 2010 replaced a swap with similar terms that settled in June 2010, resulting in a realized gain of
$9
.
48
COLGATE-PALMOLIVE COMPANY
Notes to Consolidated Financial Statements (continued)
(Dollars in Millions Except Share and Per Share Amounts)
Other Financial Instruments
Marketable securities consist of bank deposits with original maturities greater than 90 days (Level 1 valuation).
Available-for-sale securities consist of the fixed income investments discussed below.
In 2010, the Company invested in a portfolio of euro-denominated investment grade fixed income securities, including corporate bonds, with maturities generally ranging from one to three years. During the second quarter of 2011, the Company liquidated the investment portfolio as part of the cash management strategy to fund the acquisition of the Sanex business. The portfolio was considered a Level 1 investment as all of the securities had quoted prices on an active exchange with daily liquidity. At
December 31, 2010
, the portfolio’s fair value was
$132
and was reported in Other assets in the Consolidated Balance Sheet.
Through its subsidiary in Venezuela, the Company has also invested in U.S. dollar-linked, devaluation-protected bonds issued by the Venezuelan government. As of December 31, 2010, these bonds were considered Level 3 as there was no trading activity in the market at the end of 2010 and their value was determined using unobservable inputs reflecting the Company’s own assumptions. As of December 31, 2011, these bonds are actively traded and, therefore, are considered Level 2 as their value is determined based upon observable market-based inputs or unobservable inputs that are corroborated by market data. The following table presents a reconciliation of the Venezuelan investments at fair value for the years ended December 31:
|
|
2011
|
2010
|
|||||
|
Beginning balance as of January 1
|
$
|
96
|
|
$
|
46
|
|
|
|
Unrealized gain (loss) on investment
|
61
|
|
(17
|
)
|
|||
|
Purchases and sales during the period
|
79
|
|
67
|
|
|||
|
Ending balance as of December 31
|
$
|
236
|
|
$
|
96
|
|
|
As a result of the Venezuelan government’s elimination of the two-tier exchange rate structure effective January 1, 2011, these bonds have revalued and the Company recorded an unrealized gain of $
62
in the first quarter of 2011. For further information regarding Venezuela, refer to Note 13.
7. Capital Stock and Stock-Based Compensation Plans
Preference Stock
The Company has the authority to issue
50,000,000
shares of Preference stock. In 1989, the Company approved the issuance of
6,315,149
shares of Series B Convertible Preference stock (the Preference stock) without par value. Each share of Preference stock, which was convertible into
eight
shares of common stock, had a redemption price of $
65
per share and paid cumulative dividends equal to the higher of $
2.44
or the current dividend paid on eight common shares for the comparable six-month period. As a result of rules issued by the IRS related to employer stock held in defined contribution plans, the Company issued a notice of redemption with respect to the
2,405,192
shares of Preference stock outstanding on December 29, 2010. At the direction of the Company’s Employee Stock Ownership Plan trustee, the shares of Preference Stock were converted into
19,241,536
shares of common stock. The common stock for the conversion was issued from treasury shares. As of December 31, 2011 and 2010, there were
17,102,005
and
19,225,073
shares of common stock, respectively, outstanding and issued to the Company’s Employee Stock Ownership Plan. See Note 8 for further information about the Company’s Employee Stock Ownership Plan.
49
COLGATE-PALMOLIVE COMPANY
Notes to Consolidated Financial Statements (continued)
(Dollars in Millions Except Share and Per Share Amounts)
Stock Repurchases
The Company repurchased its common stock at a cost of $
1,806
during 2011 under share repurchase programs that were approved by the Board of Directors and publicly announced in September 2011 and February 2010 (the 2011 Program and the 2010 Program, respectively). Under the 2010 Program, the Company was authorized to purchase up to
40 million
shares of the Company’s common stock. The 2011 Program, which replaced the 2010 Program, authorizes the Company to repurchase up to
50 million
shares of its common stock. The Board also has authorized share repurchases on an ongoing basis to fulfill certain requirements of the Company’s compensation and benefit programs. The shares may be repurchased in open market or privately negotiated transactions at the Company’s discretion, subject to market conditions, customary blackout periods and other factors.
The Company may use either authorized and unissued shares or treasury shares to meet share requirements resulting from the exercise of stock options and the vesting of restricted stock awards.
A summary of common stock and treasury stock activity for the three years ended December 31, is as follows:
|
|
Common Stock Outstanding
|
Treasury Stock
|
||||
|
Balance, January 1, 2009
|
501,412,580
|
|
231,440,600
|
|
||
|
Common stock acquired
|
(14,916,340
|
)
|
14,916,340
|
|
||
|
Shares issued for stock options
|
5,455,317
|
|
(5,455,317
|
)
|
||
|
Shares issued for restricted stock and other
|
800,388
|
|
(800,388
|
)
|
||
|
Preference stock conversion
|
1,413,072
|
|
(1,413,072
|
)
|
||
|
Balance, December 31, 2009
|
494,165,017
|
|
238,688,163
|
|
||
|
Common stock acquired
|
(25,401,785
|
)
|
25,401,785
|
|
||
|
Shares issued for stock options
|
4,233,775
|
|
(4,233,775
|
)
|
||
|
Shares issued for restricted stock and other
|
993,132
|
|
(993,132
|
)
|
||
|
Preference stock conversion
|
20,860,328
|
|
(20,860,328
|
)
|
||
|
Balance, December 31, 2010
|
494,850,467
|
|
238,002,713
|
|
||
|
Common stock acquired
|
(21,320,936
|
)
|
21,320,936
|
|
||
|
Shares issued for stock options
|
5,758,879
|
|
(5,758,879
|
)
|
||
|
Shares issued for restricted stock and other
|
729,665
|
|
(729,665
|
)
|
||
|
Balance, December 31, 2011
|
480,018,075
|
|
252,835,105
|
|
||
Stock-Based Compensation
The Company recognizes the cost of employee services received in exchange for awards of equity instruments, such as stock options and restricted stock, based on the fair value of those awards at the date of grant. The value of restricted stock awards, based on market prices, is amortized on a straight-line basis over the requisite service period. The estimated fair value of stock options on the date of grant is amortized on a straight-line basis over the requisite service period for each separately vesting portion of the award. Awards to employees eligible for retirement prior to the award becoming fully vested are recognized as compensation cost over the period through the date that the employee first becomes eligible to retire and is no longer required to provide service to earn the award.
50
COLGATE-PALMOLIVE COMPANY
Notes to Consolidated Financial Statements (continued)
(Dollars in Millions Except Share and Per Share Amounts)
The Company has two types of stock-based compensation plans, which are described below. The total stock-based compensation expense charged against pretax income for these plans was $
122
, $
121
and $
117
for the years ended December 31, 2011, 2010 and 2009, respectively. The total income tax benefit recognized on stock-based compensation was approximately $
40
for each of the years ended December 31, 2011, 2010 and 2009.
Stock-based compensation expense is recorded within Selling, general and administrative expenses in the Corporate segment as these amounts are not included in internal measures of segment operating performance.
The Company uses the Black-Scholes option pricing model to determine the fair value of stock-option awards. The weighted-average estimated fair value of stock options granted in the years ended December 31, 2011, 2010 and 2009 was $
11.93
, $
11.00
and $
12.06
, respectively. Fair value is estimated using the Black-Scholes option pricing model with the assumptions summarized in the following table:
|
|
2011
|
2010
|
2009
|
||||||
|
Expected Term of Options
|
4.5 years
|
|
4.5 years
|
|
4.5 years
|
|
|||
|
Expected Volatility Rate
|
21.3
|
%
|
22.5
|
%
|
22.1
|
%
|
|||
|
Risk-Free Rate
|
0.8
|
%
|
1.3
|
%
|
2.3
|
%
|
|||
|
Expected Dividend Yield
|
2.6
|
%
|
2.8
|
%
|
2.4
|
%
|
|||
The weighted-average expected term of options granted each year was determined with reference to historical exercise and post-vesting cancellation experience, the vesting period of the awards and contractual term of the awards, among other factors. Expected volatility incorporates implied share-price volatility derived from exchange traded options on the Company’s common stock. The risk-free rate for the expected term of the option is based on the U.S. Treasury implied yield at the time of grant.
Incentive Stock Plan
The Company has a plan that provides for grants of restricted stock awards for officers and other employees. The Personnel and Organization Committee of the Board of Directors, comprised entirely of independent directors, administers the plan. Awards are made in common stock and vest at the end of the restriction period, which is generally three years. As of December 31, 2011,
9,310,000
shares of common stock were available for future restricted stock awards.
A summary of restricted stock award activity during 2011 is presented below:
|
|
Shares
(in thousands)
|
Weighted Average Grant Date Fair Value Per Award
|
|||||
|
Restricted stock awards as of January 1, 2011
|
2,777
|
|
$
|
73
|
|
||
|
Activity:
|
|
|
|
|
|||
|
Granted
|
986
|
|
84
|
|
|||
|
Vested
|
(690
|
)
|
76
|
|
|||
|
Forfeited
|
(36
|
)
|
71
|
|
|||
|
Restricted stock awards as of December 31, 2011
|
3,037
|
|
76
|
|
|||
As of December 31, 2011, there was $
65
of total unrecognized compensation expense related to nonvested restricted stock awards, which will be recognized over a weighted-average period of
2.2
years. The total fair value of shares vested during the years ended December 31, 2011, 2010 and 2009 was $
50
, $
69
and $
48
, respectively.
Stock Option Plans
The Company’s stock option plans provide for the issuance to directors, officers and other employees of non-qualified stock options that generally have a contractual term of six years and vest over three years. As of December 31, 2011,
9,092,000
shares of common stock were available for future stock option grants.
51
COLGATE-PALMOLIVE COMPANY
Notes to Consolidated Financial Statements (continued)
(Dollars in Millions Except Share and Per Share Amounts)
A summary of stock option plan activity during 2011 is presented below:
|
|
Shares
(in thousands)
|
Weighted Average Exercise Price
|
Weighted Average Remaining Contractual Life
(in years)
|
Value of Unexercised
In-the-Money Options
|
||||||||||
|
Options outstanding, January 1, 2011
|
24,517
|
|
$
|
69
|
|
|
|
|||||||
|
Granted
|
4,841
|
|
90
|
|
|
|
||||||||
|
Exercised
|
(6,846
|
)
|
62
|
|
|
|
||||||||
|
Forfeited or expired
|
(218
|
)
|
78
|
|
|
|
||||||||
|
Options outstanding, December 31, 2011
|
22,294
|
|
76
|
|
4
|
|
$
|
360
|
|
|||||
|
Options exercisable, December 31, 2011
|
13,121
|
|
$
|
71
|
|
3
|
|
$
|
276
|
|
||||
As of December 31, 2011, there was $
40
of total unrecognized compensation expense related to options, which will be recognized over a weighted-average period of
1.5
years. The total intrinsic value of options exercised during the years ended December 31, 2011, 2010 and 2009 was $
162
, $
133
and $
120
, respectively.
The benefits of tax deductions in excess of grant date fair value resulting from the exercise of stock options and vesting of restricted stock awards for the years ended December 31, 2011, 2010 and 2009 was $
32
, $
31
and $
16
, respectively, and was reported as a financing cash flow. Cash proceeds received from options exercised for the years ended December 31, 2011, 2010 and 2009 were $
332
, $
211
and $
284
, respectively.
8. Employee Stock Ownership Plan
In 1989, the Company expanded its Employee Stock Ownership Plan (ESOP) through the introduction of a leveraged ESOP that funds certain benefits for employees who have met eligibility requirements. The ESOP issued
$410
of long-term notes due through July 2009 bearing an average interest rate of
8.7%
. The notes, which were guaranteed by the Company, were repaid in July 2009. The ESOP used the proceeds from the notes issuance to purchase
6,315,149
shares of Preference stock from the Company. The Preference stock, each share of which was convertible into
eight
shares of common stock, had a redemption price of
$65
per share and paid semiannual dividends equal to the higher of
$2.44
or the current dividend paid on
eight
common shares for the comparable six-month period. As a result of rules issued by the IRS related to employer stock held in defined contribution plans, the Company issued a notice of redemption with respect to the
2,405,192
shares of Preference stock outstanding on
December 29, 2010
. At the direction of the Company’s ESOP trustee, the shares of Preference stock were converted into
19,241,536
shares of common stock. The common stock for the conversion was issued from treasury shares, see Note 7.
During 2000, the ESOP entered into a loan agreement with the Company under which the benefits of the ESOP may be extended through 2035. Advances from the Company of
$60
remain outstanding at
December 31, 2011
.
Dividends on stock held by the ESOP, are paid to the ESOP trust and, together with cash contributions and advances from the Company, are used by the ESOP to repay principal and interest. Stock is allocated to participants based upon the ratio of the current year’s debt service to the sum of total principal and interest payments over the life of the debt. As of December 31, 2011,
10,304,813
common shares were released and allocated to participant accounts and
6,797,192
common shares were available for future allocation to participant accounts.
Dividends on the stock are deductible for income tax purposes and, accordingly, are reflected net of their tax benefit in the Consolidated Statements of Changes in Shareholders’ Equity.
Annual expense related to the leveraged ESOP, determined as interest incurred on the original notes, plus the higher of either principal payments or the historical cost of Preference stock allocated, less dividends received on the shares held by the ESOP and advances from the Company, was
$0
in 2011,
$6
in 2010 and
$22
in 2009. Unearned compensation, which is shown as a reduction in Shareholders’ equity, is the amount of ESOP debt due to the Company.
52
COLGATE-PALMOLIVE COMPANY
Notes to Consolidated Financial Statements (continued)
(Dollars in Millions Except Share and Per Share Amounts)
Interest incurred on the ESOP notes was
$0
in 2011 and 2010, and
$2
in 2009. The Company paid dividends on the shares held by the ESOP of
$42
in 2011,
$41
in 2010 and
$37
in 2009. Company contributions to the ESOP were
$0
in 2011,
$6
in 2010 and
$22
in 2009.
9. Retirement Plans and Other Retiree Benefits
Retirement Plans
The Company and certain of its U.S. and overseas subsidiaries maintain defined benefit retirement plans. Benefits under these plans are based primarily on years of service and employees’ career earnings.
Effective September 1, 2010, the Company adopted certain amendments to its retirement benefit programs in the U.S. The plan amendments provide for higher contributions to the Company’s defined contribution plan while reducing future pay credits to the Company’s defined benefit plan for participants, simplification of the formula for calculating monthly pay-based credits to the defined benefit plan and certain pension enhancements depending on years of service. The incremental impact to the Company’s net income due to the plan amendments for 2010 was not significant. The incremental impact of
$58
to the Company’s benefit obligations is reflected in the table below.
In the Company’s principal U.S. plans and certain funded overseas plans, funds are contributed to trusts in accordance with regulatory limits to provide for current service and for any unfunded projected benefit obligation over a reasonable period. The target asset allocation for the Company’s defined benefit plans are as follows:
|
|
United States
|
International
|
||||
|
Asset Category
|
|
|
||||
|
Equity securities
|
52
|
%
|
43
|
%
|
||
|
Debt securities
|
40
|
|
46
|
|
||
|
Real estate and alternative investments
|
8
|
|
11
|
|
||
|
Total
|
100
|
%
|
100
|
%
|
||
53
COLGATE-PALMOLIVE COMPANY
Notes to Consolidated Financial Statements (continued)
(Dollars in Millions Except Share and Per Share Amounts)
At December 31, 2011 the allocation of the Company’s plan assets and the level of valuation input for each major asset category was as follows:
|
|
Level of Valuation
Input
|
Pension Plans
|
|
|||||||||||
|
|
United States
|
International
|
Other Retiree
Benefits
|
|||||||||||
|
Investments:
|
|
|
|
|
||||||||||
|
Cash & cash equivalents
|
Level 1
|
$
|
67
|
|
$
|
12
|
|
$
|
2
|
|
||||
|
U.S. common stocks
|
Level 1
|
209
|
|
—
|
|
5
|
|
|||||||
|
International common stocks
|
Level 1
|
47
|
|
—
|
|
1
|
|
|||||||
|
Fixed income securities (a)
|
Level 2
|
145
|
|
—
|
|
—
|
|
|||||||
|
Common/collective trust funds (b):
|
Level 2
|
|||||||||||||
|
Equity index funds
|
|
405
|
|
158
|
|
10
|
|
|||||||
|
Emerging market equity index funds
|
|
54
|
|
17
|
|
1
|
|
|||||||
|
Other common stock funds
|
|
34
|
|
28
|
|
1
|
|
|||||||
|
Fixed income funds: U.S. or foreign government and agency securities
|
|
268
|
|
82
|
|
7
|
|
|||||||
|
Fixed income funds: investment grade corporate bonds
|
|
58
|
|
75
|
|
1
|
|
|||||||
|
Fixed income funds: high yield corporate bonds and other
|
|
75
|
|
1
|
|
2
|
|
|||||||
|
Guaranteed investment contracts (c)
|
Level 2
|
2
|
|
46
|
|
—
|
|
|||||||
|
Real estate (d)
|
Level 3
|
62
|
|
18
|
|
2
|
|
|||||||
|
Total Investments at fair value
|
|
$
|
1,426
|
|
$
|
437
|
|
$
|
32
|
|
||||
At December 31, 2010 the allocation of the Company’s plan assets and the level of valuation input for each major asset category was as follows:
|
|
Level of Valuation
Input |
Pension Plans
|
|
|||||||||||
|
|
United States
|
International
|
Other Retiree
Benefits
|
|||||||||||
|
Investments:
|
|
|
|
|
||||||||||
|
Cash & cash equivalents
|
Level 1
|
$
|
84
|
|
$
|
14
|
|
$
|
2
|
|
||||
|
U.S. common stocks
|
Level 1
|
223
|
|
—
|
|
6
|
|
|||||||
|
International common stocks
|
Level 1
|
55
|
|
—
|
|
1
|
|
|||||||
|
Fixed income securities (a)
|
Level 2
|
142
|
|
—
|
|
—
|
|
|||||||
|
Common/collective trust funds (b):
|
Level 2
|
|
|
|
|
|
|
|||||||
|
Equity index funds
|
|
314
|
|
166
|
|
8
|
|
|||||||
|
Emerging market equity index funds
|
|
61
|
|
18
|
|
2
|
|
|||||||
|
Other common stock funds
|
|
95
|
|
13
|
|
3
|
|
|||||||
|
Fixed income funds: U.S. or foreign government and agency securities
|
|
222
|
|
88
|
|
6
|
|
|||||||
|
Fixed income funds: investment grade corporate bonds
|
|
59
|
|
71
|
|
2
|
|
|||||||
|
Fixed income funds: high yield corporate bonds and other
|
|
67
|
|
1
|
|
2
|
|
|||||||
|
Guaranteed investment contracts (c)
|
Level 2
|
—
|
|
47
|
|
—
|
|
|||||||
|
Real estate (d)
|
Level 3
|
55
|
|
16
|
|
—
|
|
|||||||
|
Total Investments at fair value
|
|
$
|
1,377
|
|
$
|
434
|
|
$
|
32
|
|
||||
54
COLGATE-PALMOLIVE COMPANY
Notes to Consolidated Financial Statements (continued)
(Dollars in Millions Except Share and Per Share Amounts)
_______
|
(a)
|
The fixed income securities are traded over the counter and a small portion of the securities lack daily pricing or liquidity and as such are classified as Level 2. As of December 31, 2011 and 2010, approximately
75%
of the fixed income portfolio was invested in U.S. treasury or agency securities, with the remainder invested in corporate bonds.
|
|
(b)
|
Interests in common/collective trust funds are valued using the net asset value (NAV) per unit in each fund. The NAV is based on the value of the underlying investments owned by each trust, minus its liabilities, divided by the number of shares outstanding.
|
|
(c)
|
The guaranteed investment contracts (GICs) represent contracts with insurance companies measured at the cash surrender value of each contract. The Level 2 valuation reflects that the cash surrender value is based principally on a referenced pool of investment funds with active redemption.
|
|
(d)
|
Real estate is valued using the NAV per unit of funds that are invested in real property, and the real property is valued using independent market appraisals. Since the appraisals include unobservable inputs, the investments in each fund are classified as Level 3.
|
The following table presents a reconciliation of Level 3 plan assets measured at fair value for the year ended December 31:
|
|
2011
|
2010
|
||||||||||||||
|
|
United States Real Estate Fund
|
International Real Estate Fund
|
United States Real Estate Fund
|
International Real Estate Fund
|
||||||||||||
|
Beginning balance as of January 1
|
$
|
55
|
|
$
|
16
|
|
$
|
48
|
|
$
|
11
|
|
||||
|
Earned income, net of management expenses
|
9
|
|
—
|
|
4
|
|
—
|
|
||||||||
|
Unrealized gain (loss) on investment
|
2
|
|
1
|
|
3
|
|
1
|
|
||||||||
|
Purchases, sales, issuances and settlements, net
|
(2
|
)
|
1
|
|
—
|
|
4
|
|
||||||||
|
Ending balance as of December 31
|
$
|
64
|
|
$
|
18
|
|
$
|
55
|
|
$
|
16
|
|
||||
Equity securities in the U.S. plans include investments in the Company’s common stock representing
11%
and
9%
of U.S. plan assets at December 31, 2011 and 2010, respectively. No shares of the Company’s common stock were purchased or sold by the plans in 2011 or 2010. The plans received dividends on the Company’s common stock of
$3
in each of 2011 and 2010.
Other Retiree Benefits
The Company and certain of its subsidiaries provide health care and life insurance benefits for retired employees to the extent not provided by government-sponsored plans. The Company utilizes a portion of its leveraged ESOP to reduce its obligation to provide these other retiree benefits and to offset its current service cost.
Effective September 1, 2010, the Company adopted certain amendments to its retirement benefit programs in the U.S. Effective with the plan amendments, future retirees of the Company who do not meet certain age and service requirements will begin to share in the cost of retiree medical coverage through monthly payments rather than paying a lump sum contribution at retirement. In addition, the Company will generally no longer use its leveraged ESOP to make retiree medical coverage allocations. The incremental impact to the Company’s net income due to the plan amendments for 2010 was not significant. The incremental impact of
$31
to the Company’s benefit obligations is reflected in the following table.
55
COLGATE-PALMOLIVE COMPANY
Notes to Consolidated Financial Statements (continued)
(Dollars in Millions Except Share and Per Share Amounts)
The Company uses a December 31 measurement date for its defined benefit and other retiree benefit plans. Summarized information for the Company’s defined benefit and other retiree benefit plans are as follows:
|
|
Pension Benefits
|
Other Retiree Benefits
|
||||||||||||||||||||||
|
|
2011
|
2010
|
2011
|
2010
|
2011
|
2010
|
||||||||||||||||||
|
|
United States
|
International
|
|
|
||||||||||||||||||||
|
Change in Benefit Obligations
|
|
|
|
|
|
|
||||||||||||||||||
|
Benefit obligations at beginning of year
|
$
|
1,952
|
|
$
|
1,703
|
|
$
|
736
|
|
$
|
706
|
|
$
|
762
|
|
$
|
603
|
|
||||||
|
Service cost
|
24
|
|
42
|
|
19
|
|
17
|
|
10
|
|
7
|
|
||||||||||||
|
Interest cost
|
100
|
|
94
|
|
36
|
|
|
35
|
|
39
|
|
|
38
|
|
||||||||||
|
Participants’ contributions
|
1
|
|
1
|
|
4
|
|
3
|
|
—
|
|
—
|
|
||||||||||||
|
Acquisitions/plan amendments
|
—
|
|
58
|
|
1
|
|
2
|
|
—
|
|
31
|
|
||||||||||||
|
Actuarial loss (gain)
|
126
|
|
150
|
|
21
|
|
24
|
|
(1
|
)
|
97
|
|
||||||||||||
|
Foreign exchange impact
|
—
|
|
—
|
|
(10
|
)
|
(10
|
)
|
(6
|
)
|
3
|
|
||||||||||||
|
Termination benefits
|
—
|
|
23
|
|
—
|
|
—
|
|
—
|
|
8
|
|
||||||||||||
|
Curtailments and settlements
|
—
|
|
—
|
|
(14
|
)
|
(5
|
)
|
1
|
|
—
|
|
||||||||||||
|
Benefit payments
|
(178
|
)
|
(119
|
)
|
(33
|
)
|
(36
|
)
|
(29
|
)
|
(25
|
)
|
||||||||||||
|
Benefit obligations at end of year
|
$
|
2,025
|
|
$
|
1,952
|
|
$
|
760
|
|
$
|
736
|
|
$
|
776
|
|
$
|
762
|
|
||||||
|
Change in Plan Assets
|
|
|
|
|
|
|
|
|
||||||||||||||||
|
Fair value of plan assets at beginning of year
|
$
|
1,377
|
|
$
|
1,300
|
|
$
|
434
|
|
$
|
401
|
|
$
|
32
|
|
$
|
28
|
|
||||||
|
Actual return on plan assets
|
28
|
|
145
|
|
2
|
|
30
|
|
—
|
|
4
|
|
||||||||||||
|
Company contributions
|
198
|
|
50
|
|
45
|
|
36
|
|
29
|
|
25
|
|
||||||||||||
|
Participants’ contributions
|
1
|
|
1
|
|
4
|
|
3
|
|
—
|
|
—
|
|
||||||||||||
|
Foreign exchange impact
|
—
|
|
—
|
|
(3
|
)
|
4
|
|
—
|
|
—
|
|
||||||||||||
|
Settlements
|
—
|
|
—
|
|
(12
|
)
|
(4
|
)
|
—
|
|
—
|
|
||||||||||||
|
Benefit payments
|
(178
|
)
|
(119
|
)
|
(33
|
)
|
(36
|
)
|
(29
|
)
|
(25
|
)
|
||||||||||||
|
Fair value of plan assets at end of year
|
$
|
1,426
|
|
$
|
1,377
|
|
$
|
437
|
|
$
|
434
|
|
$
|
32
|
|
$
|
32
|
|
||||||
|
Funded Status
|
|
|
|
|
|
|
|
|
||||||||||||||||
|
Benefit obligations at end of year
|
$
|
2,025
|
|
$
|
1,952
|
|
$
|
760
|
|
$
|
736
|
|
$
|
776
|
|
$
|
762
|
|
||||||
|
Fair value of plan assets at end of year
|
1,426
|
|
1,377
|
|
437
|
|
434
|
|
32
|
|
32
|
|
||||||||||||
|
Net amount recognized
|
$
|
(599
|
)
|
$
|
(575
|
)
|
$
|
(323
|
)
|
$
|
(302
|
)
|
$
|
(744
|
)
|
$
|
(730
|
)
|
||||||
|
Amounts Recognized in Balance Sheet
|
|
|
|
|
|
|
|
|
|
|
||||||||||||||
|
Noncurrent assets
|
$
|
—
|
|
$
|
—
|
|
$
|
—
|
|
$
|
4
|
|
$
|
—
|
|
$
|
—
|
|
||||||
|
Current liabilities
|
(15
|
)
|
(13
|
)
|
(29
|
)
|
(13
|
)
|
(40
|
)
|
(41
|
)
|
||||||||||||
|
Noncurrent liabilities
|
(584
|
)
|
(562
|
)
|
(294
|
)
|
(293
|
)
|
(704
|
)
|
(689
|
)
|
||||||||||||
|
Net amount recognized
|
$
|
(599
|
)
|
$
|
(575
|
)
|
$
|
(323
|
)
|
$
|
(302
|
)
|
$
|
(744
|
)
|
$
|
(730
|
)
|
||||||
|
Amounts recognized in Accumulated other comprehensive income consist of
|
|
|
|
|
|
|
|
|
|
|
||||||||||||||
|
Actuarial loss
|
$
|
855
|
|
$
|
693
|
|
$
|
174
|
|
$
|
142
|
|
$
|
323
|
|
$
|
343
|
|
||||||
|
Transition/prior service cost
|
73
|
|
81
|
|
6
|
|
8
|
|
32
|
|
32
|
|
||||||||||||
|
|
$
|
928
|
|
$
|
774
|
|
$
|
180
|
|
$
|
150
|
|
$
|
355
|
|
$
|
375
|
|
||||||
|
Accumulated benefit obligation
|
$
|
1,892
|
|
$
|
1,808
|
|
$
|
688
|
|
$
|
654
|
|
$
|
—
|
|
$
|
—
|
|
||||||
56
COLGATE-PALMOLIVE COMPANY
Notes to Consolidated Financial Statements (continued)
(Dollars in Millions Except Share and Per Share Amounts)
|
|
Pension Benefits
|
Other Retiree Benefits
|
||||||||||
|
|
2011
|
2010
|
2011
|
2010
|
2011
|
2010
|
||||||
|
|
United States
|
International
|
|
|
||||||||
|
Weighted-Average Assumptions Used to Determine Benefit Obligations
|
|
|
|
|
|
|
||||||
|
Discount rate
|
4.90%
|
5.30%
|
4.59%
|
5.04%
|
5.26%
|
5.30%
|
||||||
|
Long-term rate of return on plan assets
|
7.75%
|
8.00%
|
5.91%
|
6.23%
|
7.75%
|
8.00%
|
||||||
|
Long-term rate of compensation increase
|
4.00%
|
4.00%
|
2.87%
|
3.05%
|
—%
|
—%
|
||||||
|
ESOP growth rate
|
—%
|
—%
|
—%
|
—%
|
10.00%
|
10.00%
|
||||||
The overall investment objective of the plans is to balance risk and return so that obligations to employees are met. The Company evaluates its long-term rate of return on plan assets on an annual basis. In determining the long-term rate of return, the Company considers the nature of the plans’ investments, an expectation for the plans’ investment strategies and the historical rates of return. The assumed rate of return for 2011 for the U.S. plans was
7.75%
. Average annual rates of return for the U.S. plans for the most recent 1-year, 5-year, 10-year, 15-year and 25-year periods were
3%
,
3%
,
6%
,
7%
, and
8%
, respectively. Similar assessments were performed in determining rates of return on international pension plan assets to arrive at the Company’s 2011 weighted-average rate of return of
5.91%
.
Plans with projected benefit obligations in excess of plan assets and plans with accumulated benefit obligations in excess of plan assets as of December 31 consist of the following:
|
|
Years Ended December 31,
|
|||||||
|
|
2011
|
2010
|
||||||
|
Benefit Obligation Exceeds Fair Value of Plan Assets
|
|
|
||||||
|
Projected benefit obligation
|
$
|
2,770
|
|
$
|
2,664
|
|
||
|
Fair value of plan assets
|
1,809
|
|
1,749
|
|
||||
|
Accumulated benefit obligation
|
2,525
|
|
2,268
|
|
||||
|
Fair value of plan assets
|
1,773
|
|
1,571
|
|
||||
The medical cost trend rate of increase assumed in measuring the expected cost of benefits is projected to decrease from
8.0%
in 2012 to
5.0%
by
2018
, remaining at
5.0%
for the years thereafter. Changes in the assumed rate can have a significant effect on amounts reported. A
1%
change in the assumed medical cost trend rate would have the following approximate effect:
|
|
One percentage point
|
|||||||
|
|
Increase
|
Decrease
|
||||||
|
Accumulated postretirement benefit obligation
|
$
|
89
|
|
$
|
(74
|
)
|
||
|
Annual expense
|
8
|
|
(6
|
)
|
||||
57
COLGATE-PALMOLIVE COMPANY
Notes to Consolidated Financial Statements (continued)
(Dollars in Millions Except Share and Per Share Amounts)
Summarized information regarding the net periodic benefit costs for the Company’s defined benefit and other retiree benefit plans is as follows:
|
|
Pension Benefits
|
Other Retiree Benefits
|
||||||||||||||||||||||||||||||||||
|
|
2011
|
2010
|
2009
|
2011
|
2010
|
2009
|
2011
|
2010
|
2009
|
|||||||||||||||||||||||||||
|
|
United States
|
International
|
|
|
|
|||||||||||||||||||||||||||||||
|
Components of Net Periodic Benefit Cost
|
|
|
|
|
|
|
|
|
|
|||||||||||||||||||||||||||
|
Service cost
|
$
|
24
|
|
|
$
|
42
|
|
$
|
42
|
|
$
|
19
|
|
$
|
17
|
|
$
|
15
|
|
$
|
12
|
|
$
|
13
|
|
$
|
10
|
|
||||||||
|
Interest cost
|
100
|
|
|
94
|
|
95
|
|
36
|
|
|
35
|
|
37
|
|
39
|
|
|
38
|
|
36
|
|
|||||||||||||||
|
Annual ESOP allocation
|
—
|
|
—
|
|
—
|
|
—
|
|
—
|
|
—
|
|
(2
|
)
|
(6
|
)
|
(7
|
)
|
||||||||||||||||||
|
Expected return on plan assets
|
(110
|
)
|
(99
|
)
|
(89
|
)
|
(27
|
)
|
(26
|
)
|
(23
|
)
|
(3
|
)
|
(2
|
)
|
(2
|
)
|
||||||||||||||||||
|
Amortization of transition & prior service costs (credits)
|
9
|
|
5
|
|
4
|
|
3
|
|
3
|
|
3
|
|
2
|
|
1
|
|
—
|
|
||||||||||||||||||
|
Amortization of actuarial loss
|
46
|
|
52
|
|
50
|
|
9
|
|
9
|
|
5
|
|
16
|
|
19
|
|
13
|
|
||||||||||||||||||
|
Net periodic benefit cost
|
$
|
69
|
|
$
|
94
|
|
$
|
102
|
|
$
|
40
|
|
$
|
38
|
|
$
|
37
|
|
$
|
64
|
|
$
|
63
|
|
$
|
50
|
|
|||||||||
|
Other postretirement charges
|
—
|
|
23
|
|
—
|
|
3
|
|
1
|
|
—
|
|
1
|
|
8
|
|
—
|
|
||||||||||||||||||
|
Total pension cost
|
$
|
69
|
|
$
|
117
|
|
$
|
102
|
|
$
|
43
|
|
$
|
39
|
|
$
|
37
|
|
$
|
65
|
|
$
|
71
|
|
$
|
50
|
|
|||||||||
|
Weighted-Average Assumptions Used to Determine Net Periodic Benefit Cost
|
|
|
|
|
|
|
|
|
|
|
|
|
|
|
|
|
|
|
||||||||||||||||||
|
Discount rate
|
5.30
|
%
|
5.75
|
%
|
(1)
|
6.30
|
%
|
5.04
|
%
|
5.41
|
%
|
5.88
|
%
|
5.30
|
%
|
5.75
|
%
|
(1)
|
5.80
|
%
|
||||||||||||||||
|
Long-term rate of return on plan assets
|
8.00
|
%
|
8.00
|
%
|
8.00
|
%
|
6.23
|
%
|
6.58
|
%
|
6.70
|
%
|
8.00
|
%
|
8.00
|
%
|
8.00
|
%
|
||||||||||||||||||
|
Long-term rate of compensation increase
|
4.00
|
%
|
4.00
|
%
|
4.00
|
%
|
3.05
|
%
|
3.35
|
%
|
3.33
|
%
|
—
|
%
|
—
|
%
|
—
|
%
|
||||||||||||||||||
|
ESOP growth rate
|
—
|
%
|
—
|
%
|
—
|
%
|
—
|
%
|
—
|
%
|
—
|
%
|
10.00
|
%
|
10.00
|
%
|
10.00
|
%
|
||||||||||||||||||
_______
|
(1)
|
Effective with the plan amendments on September 1, 2010, the Company was required to remeasure the benefit obligations and plan assets of the affected plans, and a new discount rate of
4.75%
was used to determine net periodic benefit cost through the end of 2011.
|
Other postretirement charges in 2010 primarily relate to one-time termination benefits incurred pursuant to a voluntary early retirement program for selected individuals in the U.S.
The Company made voluntary contributions of
$178
,
$35
and
$73
in 2011, 2010 and 2009, respectively, to its U.S. postretirement plans.
Amounts recognized in Other Comprehensive Income during the year ended December 31, 2011 were as follows:
|
|
Before-Tax Amount
|
Net-of-Tax Amount
|
||||||
|
Net actuarial loss & prior service costs arising during the period
|
$
|
249
|
|
$
|
163
|
|
||
|
Amortization of net actuarial loss, transition & prior service costs
|
(85
|
)
|
(55
|
)
|
||||
|
Total
|
$
|
164
|
|
$
|
108
|
|
||
58
COLGATE-PALMOLIVE COMPANY
Notes to Consolidated Financial Statements (continued)
(Dollars in Millions Except Share and Per Share Amounts)
The estimated actuarial loss and the estimated transition/prior service cost for defined benefit and other retiree benefit plans that will be amortized from accumulated other comprehensive income into net periodic benefit cost over the next fiscal year is as follows:
|
|
Pension Benefits
|
Other Retiree Benefits
|
||||||
|
Net actuarial loss
|
$
|
69
|
|
$
|
16
|
|
||
|
Net transition & prior service cost
|
10
|
|
2
|
|
||||
Expected Contributions & Benefit Payments
Management’s best estimate of voluntary contributions to U.S. pension plans for the year ending December 31, 2012 is approximately
$100
. Actual funding may differ from current estimates depending on the variability of the market value of the assets as compared to the obligation and other market or regulatory conditions.
Total benefit payments to be paid to participants for the year ending December 31, 2012 from the Company's assets is estimated to be approximately
$87
. Total benefit payments expected to be paid to participants from plan assets, or payments directly from the Company’s assets to participants in unfunded plans, are as follows:
|
|
Pension Benefits
|
|
||||||||||||||
|
Years Ended December 31,
|
United States
|
International
|
Other Retiree Benefits
|
Total
|
||||||||||||
|
2012
|
$
|
137
|
|
$
|
59
|
|
$
|
41
|
|
$
|
237
|
|
||||
|
2013
|
125
|
|
41
|
|
42
|
|
208
|
|
||||||||
|
2014
|
124
|
|
44
|
|
43
|
|
211
|
|
||||||||
|
2015
|
126
|
|
45
|
|
44
|
|
215
|
|
||||||||
|
2016
|
125
|
|
47
|
|
44
|
|
216
|
|
||||||||
|
2017-2021
|
663
|
|
222
|
|
232
|
|
1,117
|
|
||||||||
10. Income Taxes
The components of income before income taxes are as follows for the three years ended December 31:
|
|
2011
|
2010
|
2009
|
|||||||||
|
United States
|
$
|
1,098
|
|
$
|
1,252
|
|
$
|
1,173
|
|
|||
|
International
|
2,691
|
|
2,178
|
|
2,365
|
|
||||||
|
Total Income before income taxes
|
$
|
3,789
|
|
$
|
3,430
|
|
$
|
3,538
|
|
|||
The provision for income taxes consists of the following for the three years ended December 31:
|
|
2011
|
2010
|
2009
|
|||||||||
|
United States
|
$
|
360
|
|
$
|
427
|
|
$
|
399
|
|
|||
|
International
|
875
|
|
690
|
|
742
|
|
||||||
|
Total Provision for income taxes
|
$
|
1,235
|
|
$
|
1,117
|
|
$
|
1,141
|
|
|||
59
COLGATE-PALMOLIVE COMPANY
Notes to Consolidated Financial Statements (continued)
(Dollars in Millions Except Share and Per Share Amounts)
Temporary differences between accounting for financial statement purposes and accounting for tax purposes result in the current provision for taxes being higher (lower) than the total provision for income taxes as follows:
|
|
2011
|
2010
|
2009
|
|||||||||
|
Goodwill and intangible assets
|
$
|
(1
|
)
|
$
|
(11
|
)
|
$
|
15
|
|
|||
|
Property, plant and equipment
|
(19
|
)
|
(29
|
)
|
(24
|
)
|
||||||
|
Pension and other retiree benefits
|
(47
|
)
|
4
|
|
27
|
|
||||||
|
Stock-based compensation
|
11
|
|
12
|
|
18
|
|
||||||
|
Tax loss and tax credit carryforwards
|
(14
|
)
|
(28
|
)
|
(27
|
)
|
||||||
|
Valuation allowances
|
—
|
|
1
|
|
3
|
|
||||||
|
Other, net
|
32
|
|
122
|
|
7
|
|
||||||
|
Total deferred tax provision
|
$
|
(38
|
)
|
$
|
71
|
|
$
|
19
|
|
|||
In 2010, Other, net includes a non-recurring tax benefit related to the reorganization of an overseas subsidiary.
The difference between the statutory U.S. federal income tax rate and the Company’s global effective tax rate as reflected in the Consolidated Statements of Income is as follows:
|
Percentage of Income before income taxes
|
2011
|
2010
|
2009
|
||||||
|
Tax at United States statutory rate
|
35.0
|
%
|
35.0
|
%
|
35.0
|
%
|
|||
|
State income taxes, net of federal benefit
|
0.4
|
|
1.1
|
|
0.5
|
|
|||
|
Earnings taxed at other than United States statutory rate
|
(1.7
|
)
|
(4.6
|
)
|
(2.5
|
)
|
|||
|
Venezuela hyperinflationary transition charge
|
—
|
|
2.8
|
|
—
|
|
|||
|
Other, net
|
(1.1
|
)
|
(1.7
|
)
|
(0.8
|
)
|
|||
|
Effective tax rate
|
32.6
|
%
|
32.6
|
%
|
32.2
|
%
|
|||
The components of deferred tax assets (liabilities) are as follows at December 31:
|
|
2011
|
2010
|
||||||
|
Deferred tax liabilities:
|
|
|
||||||
|
Goodwill and intangible assets
|
$
|
(471
|
)
|
$
|
(463
|
)
|
||
|
Property, plant and equipment
|
(345
|
)
|
(344
|
)
|
||||
|
Other
|
(104
|
)
|
(116
|
)
|
||||
|
|
(920
|
)
|
(923
|
)
|
||||
|
Deferred tax assets:
|
|
|
|
|
||||
|
Pension and other retiree benefits
|
480
|
|
471
|
|
||||
|
Tax loss and tax credit carryforwards
|
106
|
|
130
|
|
||||
|
Accrued liabilities
|
176
|
|
145
|
|
||||
|
Stock-based compensation
|
115
|
|
108
|
|
||||
|
Other
|
111
|
|
163
|
|
||||
|
Valuation allowance
|
(1
|
)
|
(1
|
)
|
||||
|
|
987
|
|
1,016
|
|
||||
|
Net deferred income taxes
|
$
|
67
|
|
$
|
93
|
|
||
60
COLGATE-PALMOLIVE COMPANY
Notes to Consolidated Financial Statements (continued)
(Dollars in Millions Except Share and Per Share Amounts)
|
2011
|
2010
|
|||||||
|
Deferred taxes included within:
|
|
|
||||||
|
Assets:
|
|
|
||||||
|
Other current assets
|
$
|
204
|
|
$
|
117
|
|
||
|
Deferred income taxes
|
115
|
|
84
|
|
||||
|
Liabilities:
|
|
|
|
|
||||
|
Deferred income taxes
|
(252
|
)
|
(108
|
)
|
||||
|
Net deferred income taxes
|
$
|
67
|
|
$
|
93
|
|
||
Applicable U.S. income and foreign withholding taxes have not been provided on approximately
$3,500
of undistributed earnings of foreign subsidiaries at December 31, 2011. These earnings have been and currently are considered to be indefinitely reinvested and currently are not subject to such taxes. Determining the tax liability that would arise if these earnings were remitted is not practicable.
In addition, net tax benefits of
$79
in 2011,
$124
in 2010 and
$18
in 2009 recorded directly through equity predominantly include current and future tax benefits related to employee equity compensation and benefit plans.
The Company uses a comprehensive model to recognize, measure, present and disclose in its financial statements uncertain tax positions that the Company has taken or expects to take on an income tax return.
Unrecognized tax benefits activity for the years ended December 31, 2011, 2010 and 2009 is summarized below:
|
|
2011
|
2010
|
2009
|
|||||||||
|
Unrecognized tax benefits:
|
|
|
|
|||||||||
|
Balance, January 1
|
$
|
171
|
|
$
|
187
|
|
$
|
171
|
|
|||
|
Increases as a result of tax positions taken during the current year
|
76
|
|
38
|
|
30
|
|
||||||
|
Decreases of tax positions taken during prior years
|
(46
|
)
|
(63
|
)
|
(9
|
)
|
||||||
|
Increases of tax positions taken during prior years
|
10
|
|
16
|
|
18
|
|
||||||
|
Decreases as a result of settlements with taxing authorities and the expiration of statutes of limitations
|
(30
|
)
|
(3
|
)
|
(24
|
)
|
||||||
|
Effect of foreign currency rate movements
|
(5
|
)
|
(4
|
)
|
1
|
|
||||||
|
Balance, December 31
|
$
|
176
|
|
$
|
171
|
|
$
|
187
|
|
|||
If all of the unrecognized tax benefits for 2011 above were recognized, approximately
$140
would impact the effective tax rate. Although it is possible that the amount of unrecognized benefits with respect to our uncertain tax positions will increase or decrease in the next 12 months, the Company does not expect material changes.
The Company recognized approximately
$0
,
($4)
and
($1)
of interest (income) expense related to the above unrecognized tax benefits within income tax expense in 2011, 2010 and 2009, respectively. The Company had accrued interest of approximately
$15
and
$19
as of December 31, 2011 and 2010, respectively.
The Company and its subsidiaries file U.S. federal income tax returns as well as income tax returns in many state and foreign jurisdictions. All U.S. federal income tax returns through December 31, 2007 have been audited by the IRS and there are limited matters in administrative appeals for years 2002 through 2007, the settlement of which is not expected to have a material adverse effect on the Company's results of operations, cash flows or financial condition. With a few exceptions, the Company is no longer subject to U.S., state and local income tax examinations for the years prior to 2007. In addition, the Company has subsidiaries in various foreign jurisdictions that have statutes of limitations for tax audits generally ranging from three to six years.
61
COLGATE-PALMOLIVE COMPANY
Notes to Consolidated Financial Statements (continued)
(Dollars in Millions Except Share and Per Share Amounts)
11. Earnings Per Share
|
|
For the Year Ended 2011
|
For the Year Ended 2010
|
For the Year Ended 2009
|
|||||||||||||||||||||||||||||
|
|
Income
|
Shares
(millions)
|
Per
Share
|
Income
|
Shares
(millions)
|
Per
Share
|
Income
|
Shares
(millions)
|
Per
Share
|
|||||||||||||||||||||||
|
Net income attributable to Colgate-Palmolive Company
|
$
|
2,431
|
|
|
$
|
2,203
|
|
|
|
$
|
2,291
|
|
|
|
||||||||||||||||||
|
Preferred dividends
|
—
|
|
|
(34
|
)
|
|
(30
|
)
|
|
|
||||||||||||||||||||||
|
Basic EPS
|
2,431
|
|
488.3
|
|
$
|
4.98
|
|
2,169
|
|
487.8
|
|
$
|
4.45
|
|
2,261
|
|
499.5
|
|
$
|
4.53
|
|
|||||||||||
|
Stock options and restricted stock
|
3.7
|
|
|
|
|
|
3.3
|
|
|
|
|
|
3.8
|
|
|
|
||||||||||||||||
|
Convertible preference stock
|
—
|
|
—
|
|
|
|
34
|
|
19.8
|
|
|
|
30
|
|
21.3
|
|
|
|
||||||||||||||
|
Diluted EPS
|
$
|
2,431
|
|
492.0
|
|
$
|
4.94
|
|
$
|
2,203
|
|
510.9
|
|
$
|
4.31
|
|
$
|
2,291
|
|
524.6
|
|
$
|
4.37
|
|
||||||||
Basic earnings per common share is computed by dividing net income available for common stockholders by the weighted-average number of common shares outstanding for the period.
Diluted earnings per common share is computed using the treasury stock method on the basis of the weighted-average number of shares of common stock plus the dilutive effect of potential common shares outstanding during the period. Dilutive potential common shares include outstanding stock options and restricted stock awards.
As of
December 31, 2011
, 2010 and 2009, the average number of stock options that were anti-dilutive and not included in diluted earnings per share calculations were
1,531,768
,
67,565
and
5,794,326
, respectively.
As a result of rules issued by the IRS related to employer stock held in defined contribution plans, the Company issued a notice of redemption with respect to the
2,405,192
shares of preference stock outstanding on December 29, 2010. At the direction of the Company’s ESOP trustee, the shares of preference stock were converted into
19,241,536
shares of common stock.
12. Commitments and Contingencies
Minimum rental commitments under noncancellable operating leases, primarily for office and warehouse facilities, are
$201
in 2012,
$174
in 2013,
$153
in 2014,
$141
in 2015,
$123
in 2016 and
$490
thereafter. Rental expense amounted to
$245
in 2011,
$220
in 2010 and
$212
in 2009. Capital leases included in fixed assets, contingent rentals and sublease income are not significant. The Company has various contractual commitments to purchase raw, packaging and other materials totaling approximately
$460
at December 31, 2011.
As a global company serving consumers in more than 200 countries and territories, the Company is routinely subject to a wide variety of legal proceedings. These include disputes relating to intellectual property, contracts, product liability, marketing, advertising, foreign exchange controls, antitrust and trade regulation, as well as labor and employment, environmental and tax matters. Management proactively reviews and monitors the Company’s exposure to, and the impact of, environmental matters. The Company is party to various environmental matters and, as such, may be responsible for all or a portion of the cleanup, restoration and post-closure monitoring of several sites.
As a matter of course, the Company is regularly audited by the IRS and other tax authorities around the world in countries where it conducts business. In this regard, all U.S. federal income tax returns through December 31, 2007 have been audited by the IRS and there are limited matters in administrative appeals for years 2002 through 2007, the settlement of which is not expected to have a material adverse effect on the Company's results of operations, cash flows or financial condition. With a few exceptions, the Company is no longer subject to U.S., state and local income tax examinations for the years prior to 2007. In addition, the Company has subsidiaries in various foreign jurisdictions that have statutes of limitations for tax audits generally ranging from three to six years. Estimated incremental tax payments related to potential disallowances for subsequent periods are not expected to be material.
62
COLGATE-PALMOLIVE COMPANY
Notes to Consolidated Financial Statements (continued)
(Dollars in Millions Except Share and Per Share Amounts)
The Company establishes accruals for loss contingencies when it has determined that a loss is probable and that the amount of loss, or range of loss, can be reasonably estimated. Any such accruals are adjusted thereafter as appropriate to reflect changes in circumstances.
The Company also determines estimates of reasonably possible losses or ranges of reasonably possible losses in excess of related accrued liabilities, if any, when it has determined that a loss is reasonably possible and it is able to determine such estimates. For those matters disclosed below, the Company currently estimates that the aggregate range of reasonably possible losses in excess of any accrued liabilities is $
0
to approximately $
200
(based on current exchange rates). The estimates included in this amount are based on the Company’s analysis of currently available information and, as new information is obtained, these estimates may change. Due to the inherent subjectivity of the assessments and the unpredictability of outcomes of legal proceedings, any amounts accrued or included in this aggregate amount may not represent the ultimate loss to the Company from the matters in question. Thus, the Company’s exposure and ultimate losses may be higher or lower, and possibly significantly so, than the amounts accrued or the range disclosed above.
Based on current knowledge, management does not believe that the ultimate resolution of loss contingencies arising from the matters discussed herein will have a material effect on the Company’s consolidated financial position or its ongoing results of operations or cash flows. However, in light of the inherent uncertainties noted above, an adverse outcome in one or more of these matters could be material to the Company’s results of operations or cash flows for any particular quarter or year.
Brazilian Matters
In 2001, the Central Bank of Brazil sought to impose a substantial fine on the Company’s Brazilian subsidiary based on alleged foreign exchange violations in connection with the financing of the Company’s 1995 acquisition of the Kolynos oral care business from Wyeth (formerly American Home Products) (the Seller), as described in the Company’s Form 8-K dated January 10, 1995. The Company appealed the imposition of the fine to the Brazilian Monetary System Appeals Council (the Council), and on January 30, 2007, the Council decided the appeal in the Company’s favor, dismissing the fine entirely. However, certain tax and civil proceedings that began as a result of this Central Bank matter are still outstanding as described below.
The Brazilian internal revenue authority has disallowed interest deductions and foreign exchange losses taken by the Company’s Brazilian subsidiary for certain years in connection with the financing of the Kolynos acquisition. The tax assessments with interest, at the current exchange rate, approximate
$113
. The Company has been disputing the disallowances by appealing the assessments within the internal revenue authority’s appellate process with the following results to date:
|
▪
|
In June 2005, the First Board of Taxpayers ruled in the Company’s favor and allowed all of the previously claimed deductions for 1996 through 1998. In March 2007, the First Board of Taxpayers ruled in the Company’s favor and allowed all of the previously claimed deductions for 1999 through 2001. The tax authorities appealed these decisions to the next administrative level.
|
|
▪
|
In August 2009, the First Taxpayers’ Council (the next and final administrative level of appeal) overruled the decisions of the First Board of Taxpayers, upholding the majority of the assessments, disallowing a portion of the assessments and remanding a portion of the assessments for further consideration by the First Board of Taxpayers.
|
The Company has filed a motion for clarification with a special appeals chamber of the Taxpayers’ Council and further appeals are available within the Brazilian federal courts. The Company intends to challenge these assessments vigorously. Although there can be no assurances, management believes, based on the opinion of its Brazilian legal counsel and other advisors, that the disallowances are without merit and that the Company should ultimately prevail on appeal, if necessary, in the Brazilian federal courts.
In 2002, the Brazilian Federal Public Attorney filed a civil action against the federal government of Brazil, Laboratorios Wyeth-Whitehall Ltda. (the Brazilian subsidiary of the Seller) and the Company, as represented by its Brazilian subsidiary, seeking to annul an April 2000 decision by the Brazilian Board of Tax Appeals that found in favor of the Seller’s Brazilian subsidiary on the issue of whether it had incurred taxable capital gains as a result of the divestiture of Kolynos. The action seeks to make the Company’s Brazilian subsidiary jointly and severally liable for any tax due from the Seller’s Brazilian
63
COLGATE-PALMOLIVE COMPANY
Notes to Consolidated Financial Statements (continued)
(Dollars in Millions Except Share and Per Share Amounts)
subsidiary. Although there can be no assurances, management believes, based on the opinion of its Brazilian legal counsel, that the Company should ultimately prevail in this action. The Company intends to challenge this action vigorously.
In December 2005, the Brazilian internal revenue authority issued to the Company’s Brazilian subsidiary a tax assessment with interest and penalties of approximately $
67
, at the current exchange rate, based on a claim that certain purchases of U.S. Treasury bills by the subsidiary and their subsequent disposition during the period 2000 to 2001 were subject to a tax on foreign exchange transactions. The Company is disputing the assessment within the internal revenue authority’s administrative appeals process. In October 2007, the Second Board of Taxpayers, which has jurisdiction over these matters, ruled in favor of the internal revenue authority. In January 2008, the Company appealed this decision, and in January 2012, a special appeals chamber of the Taxpayers’ Council denied the Company's appeal. Although there can be no assurances, management believes, based on the advice of its Brazilian legal counsel, that the tax assessment is without merit and that the Company should prevail on appeal, if not at the administrative level, in the Brazilian federal courts. The Company intends to challenge this assessment vigorously.
European Competition Matters
Since February 2006, the Company has learned that investigations relating to potential competition law violations involving the Company’s subsidiaries had been commenced by governmental authorities in a number of European countries and by the European Commission. The Company understands that substantially all of these investigations also involve other consumer goods companies and/or retail customers. The status of the various pending matters is discussed below.
Fines have been imposed on the Company in the following matters, although the Company is appealing these fines:
|
▪
|
In December 2009, the Swiss competition law authority imposed a fine of $
5
on the Company’s GABA subsidiary for alleged violations of restrictions on parallel imports into Switzerland. The Company is appealing the fine in the Swiss courts.
|
|
▪
|
In January 2010, the Spanish competition law authority found that four suppliers of shower gel had entered into an agreement regarding product down-sizing, for which Colgate’s Spanish subsidiary was fined $
3
. The Company is appealing the fine in the Spanish courts.
|
|
▪
|
In December 2010, the Italian competition law authority found that 16 consumer goods companies, including the Company’s Italian subsidiary, exchanged competitively sensitive information in the cosmetics sector, for which the Company’s Italian subsidiary was fined $
3
. The Company is appealing the fine in the Italian courts.
|
|
▪
|
In December 2011, the French competition law authority found that four consumer goods companies had entered into agreements on pricing and promotion of heavy duty detergents for which Colgate's French subsidiary was fined $46 million in connection with a divested business. The Company is appealing the fine in the French courts.
|
Currently, formal claims of violations, or statements of objections, are pending against the Company as follows:
|
▪
|
The French competition law authority alleges violations of competition law by three pet food producers, including the Company’s Hill’s France subsidiary, focusing on exclusivity arrangements and parallel trade restrictions.
|
|
▪
|
The German competition law authority alleges that 17 branded goods companies, including the Company’s German subsidiary, exchanged sensitive information related to the German market.
|
The Company has responded to each of these formal claims of violations. Investigations are ongoing in Belgium, France and Greece, but no formal claims of violations have been filed in these jurisdictions except in France as noted above.
During 2011, the following matters have been resolved:
|
▪
|
In April 2011, the investigation by the European Commission was resolved with no formal claims of violations or decisions made against the Company. To the Company’s knowledge, there are no other investigations by the European Commission relating to potential competition law violations involving the Company or its subsidiaries.
|
|
▪
|
In May 2011, the Dutch competition authority closed its investigation and no decision was made against the Company or its Dutch subsidiary.
|
64
COLGATE-PALMOLIVE COMPANY
Notes to Consolidated Financial Statements (continued)
(Dollars in Millions Except Share and Per Share Amounts)
The Company’s policy is to comply with antitrust and competition laws and, if a violation of any such laws is found, to take appropriate remedial action and to cooperate fully with any related governmental inquiry. The Company has undertaken a comprehensive review of its selling practices and related competition law compliance in Europe and elsewhere and, where the Company has identified a lack of compliance, it has undertaken remedial action. Competition and antitrust law investigations often continue for several years and can result in substantial fines for violations that are found. While the Company cannot predict the final financial impact of these competition law issues as these matters may change, the Company evaluates developments in these matters quarterly and accrues liabilities as and when appropriate.
ERISA Matters
In October 2007, a putative class action claiming that certain aspects of the cash balance portion of the Colgate-Palmolive Company Employees’ Retirement Income Plan (the Plan) do not comply with the Employee Retirement Income Security Act was filed against the Plan and the Company in the United States District Court for the Southern District of New York. Specifically,
Proesel, et al. v. Colgate-Palmolive Company Employees’ Retirement Income Plan, et al.
alleges improper calculation of lump sum distributions, age discrimination and failure to satisfy minimum accrual requirements, thereby resulting in the underpayment of benefits to Plan participants. Two other putative class actions filed earlier in 2007,
Abelman, et al. v. Colgate-Palmolive Company Employees’ Retirement Income Plan, et al.
, in the United States District Court for the Southern District of Ohio, and
Caufield v. Colgate-Palmolive Company Employees’ Retirement Income Plan
, in the United States District Court for the Southern District of Indiana, both alleging improper calculation of lump sum distributions and, in the case of
Abelman
, claims for failure to satisfy minimum accrual requirements, were transferred to the Southern District of New York and consolidated with
Proesel
into one action,
In re Colgate-Palmolive ERISA Litigation
. The complaint in the consolidated action alleges improper calculation of lump sum distributions and failure to satisfy minimum accrual requirements, but does not include a claim for age discrimination. The relief sought includes recalculation of benefits in unspecified amounts, pre- and post-judgment interest, injunctive relief and attorneys’ fees. This action has not been certified as a class action as yet. The parties are in discussions via non-binding mediation to determine whether the action can be settled. The Company and the Plan intend to contest this action vigorously should the parties be unable to reach a settlement.
13. Venezuela
Effective January 1, 2010, Venezuela was designated as hyperinflationary and therefore the functional currency for the Company’s Venezuelan subsidiary (CP Venezuela) became the U.S. dollar. As a result, the impact of Venezuelan currency fluctuations is reported in income. The change in the reporting currency from the Venezuelan bolivar fuerte to the U.S. dollar resulted in a one-time charge of $
271
recorded within Other (income) expense, net in the first quarter of 2010. This charge primarily represented the premium paid to acquire U.S. dollar-denominated cash
($150)
and bonds
($152)
at the parallel market rate, offset by $
31
for U.S. dollar-denominated payables. Previously these items had been remeasured at the parallel market rate and then translated for financial reporting purposes at the official rate of
2.15
.
On January 8, 2010, the Venezuelan government announced its decision to devalue its currency and implement a two-tier exchange rate structure. As a result, the official exchange rate changed from
2.15
to
2.60
for essential goods and
4.30
for non-essential goods. The devaluation resulted in a one-time pretax gain of
$46
recorded in Other (income) expense and an aftertax gain of
$59
in the first quarter of 2010 related to the remeasurement of the local balance sheet and lower taxes on accrued but unpaid remittances from Venezuela. In December 2010, the Venezuelan government announced that, effective January 1, 2011, the
2.60
exchange rate for essential goods would be abolished. As a result, CP Venezuela incurred an aftertax loss of
$36
in the fourth quarter of 2010 related to the remeasurement of certain local balance sheet items for which the
2.60
exchange rate would no longer be received. This loss was offset by lower taxes on accrued but unpaid remittances.
The Company remeasures the financial statements of CP Venezuela at the rate at which it expects to remit future dividends, which currently is
4.30
. As a result of the devaluations of the Venezuelan bolivar fuerte, the local currency operations of CP Venezuela now translate into fewer U.S. dollars. For the year ended December 31, 2011, CP Venezuela represented approximately
5%
of the Company’s consolidated Net sales. At December 31, 2011, CP Venezuela’s bolivar fuerte-denominated monetary net asset position was approximately $
311
which does not include $
236
of devaluation-protected bonds issued by the Venezuelan government, as these bonds provide protection against devaluations by adjusting the amount of bolivares fuertes received at maturity for any devaluation subsequent to issuance. As described in Note 6, these bonds are considered a Level 2 investment.
65
COLGATE-PALMOLIVE COMPANY
Notes to Consolidated Financial Statements (continued)
(Dollars in Millions Except Share and Per Share Amounts)
14. Segment Information
The Company operates in two product segments: Oral, Personal and Home Care; and Pet Nutrition. The operations of the Oral, Personal and Home Care segment are managed geographically in four reportable operating segments: North America, Latin America, Europe/South Pacific and Greater Asia/Africa. Management evaluates segment performance based on several factors, including Operating profit. The Company uses Operating profit as a measure of the operating segment performance because it excludes the impact of corporate-driven decisions related to interest expense and income taxes.
The accounting policies of the operating segments are generally the same as those described in Note 2. Intercompany sales have been eliminated. Corporate operations include stock-based compensation related to stock options and restricted stock awards, research and development costs, Corporate overhead costs, restructuring and related implementation costs, and gains and losses on sales of non-core product lines and assets. The Company reports these items within Corporate operations as they relate to Corporate-based responsibilities and decisions and are not included in the internal measures of segment operating performance used by the Company to measure the underlying performance of the business segments.
In 2011, Corporate Operating profit includes a gain on the sale of the laundry detergent business in Colombia of
$207
, costs of
$190
associated with various business realignment and other cost-saving initiatives, costs of
$13
related to the sale of land in Mexico, and a charge of
$21
for a competition law matter in France related to a divested detergent business. The various business realignment and other cost-saving initiatives include the integration of Sanex, the right-sizing of the Colombia business and the closing of an oral care facility in Mississauga, Canada and a Hill’s facility in Los Angeles, California. For further information regarding the sale of land in Mexico, refer to Note 3. In 2010, Corporate Operating profit also includes the one-time
$271
charge of transitioning to hyperinflationary accounting in Venezuela as of January 1, 2010, a fourth quarter
$86
pretax charge for termination benefits and a fourth quarter
$50
pretax gain on sale of non-core product lines. For further information regarding Venezuela, refer to Note 13.
|
|
2011
|
2010
|
2009
|
|||||||||
|
Net sales
|
|
|
||||||||||
|
Oral, Personal and Home Care
|
|
|
||||||||||
|
North America
(1)
|
$
|
2,995
|
|
$
|
3,005
|
|
$
|
2,950
|
|
|||
|
Latin America
|
4,778
|
|
4,261
|
|
4,319
|
|
||||||
|
Europe/South Pacific
|
3,508
|
|
3,220
|
|
3,271
|
|
||||||
|
Greater Asia/Africa
|
3,281
|
|
2,998
|
|
2,655
|
|
||||||
|
Total Oral, Personal and Home Care
|
14,562
|
|
13,484
|
|
13,195
|
|
||||||
|
Pet Nutrition
(2)
|
2,172
|
|
2,080
|
|
2,132
|
|
||||||
|
Total Net sales
|
$
|
16,734
|
|
$
|
15,564
|
|
$
|
15,327
|
|
|||
_________
|
(1)
|
Net sales in the U.S. for Oral, Personal and Home Care were
$2,567
,
$2,591
and
$2,577
in 2011, 2010 and 2009, respectively.
|
|
(2)
|
Net sales in the U.S. for Pet Nutrition were
$1,032
,
$1,025
and
$1,071
in 2011, 2010 and 2009, respectively.
|
66
COLGATE-PALMOLIVE COMPANY
Notes to Consolidated Financial Statements (continued)
(Dollars in Millions Except Share and Per Share Amounts)
|
2011
|
2010
|
2009
|
||||||||||
|
Operating profit
|
|
|
||||||||||
|
Oral, Personal and Home Care
|
|
|
|
|
||||||||
|
North America
|
$
|
791
|
|
$
|
884
|
|
$
|
843
|
|
|||
|
Latin America
|
1,414
|
|
1,295
|
|
1,360
|
|
||||||
|
Europe/South Pacific
|
715
|
|
742
|
|
748
|
|
||||||
|
Greater Asia/Africa
|
807
|
|
767
|
|
631
|
|
||||||
|
Total Oral, Personal and Home Care
|
3,727
|
|
3,688
|
|
3,582
|
|
||||||
|
Pet Nutrition
|
560
|
|
559
|
|
555
|
|
||||||
|
Corporate
|
(446
|
)
|
(758
|
)
|
(522
|
)
|
||||||
|
Total Operating profit
|
$
|
3,841
|
|
$
|
3,489
|
|
$
|
3,615
|
|
|||
|
2011
|
2010
|
2009
|
||||||||||
|
Capital expenditures
|
|
|
||||||||||
|
Oral, Personal and Home Care
|
|
|
|
|
||||||||
|
North America
|
$
|
54
|
|
$
|
57
|
|
$
|
62
|
|
|||
|
Latin America
|
194
|
|
138
|
|
105
|
|
||||||
|
Europe/South Pacific
|
64
|
|
80
|
|
86
|
|
||||||
|
Greater Asia/Africa
|
119
|
|
111
|
|
91
|
|
||||||
|
Total Oral, Personal and Home Care
|
431
|
|
386
|
|
344
|
|
||||||
|
Pet Nutrition
|
32
|
|
81
|
|
156
|
|
||||||
|
Corporate
|
74
|
|
83
|
|
75
|
|
||||||
|
Total Capital expenditures
|
$
|
537
|
|
$
|
550
|
|
$
|
575
|
|
|||
|
2011
|
2010
|
2009
|
||||||||||
|
Depreciation and amortization
|
|
|
||||||||||
|
Oral, Personal and Home Care
|
|
|
|
|
||||||||
|
North America
|
$
|
57
|
|
$
|
57
|
|
$
|
59
|
|
|||
|
Latin America
|
91
|
|
84
|
|
77
|
|
||||||
|
Europe/South Pacific
|
82
|
|
67
|
|
67
|
|
||||||
|
Greater Asia/Africa
|
79
|
|
69
|
|
63
|
|
||||||
|
Total Oral, Personal and Home Care
|
309
|
|
277
|
|
266
|
|
||||||
|
Pet Nutrition
|
51
|
|
45
|
|
36
|
|
||||||
|
Corporate
|
61
|
|
54
|
|
49
|
|
||||||
|
Total Depreciation and amortization
|
$
|
421
|
|
$
|
376
|
|
$
|
351
|
|
|||
|
Identifiable assets
|
2011
|
2010
|
2009
|
|||||||||
|
Oral, Personal and Home Care
|
|
|
|
|||||||||
|
North America
|
$
|
2,288
|
|
$
|
2,231
|
|
$
|
2,271
|
|
|||
|
Latin America
|
3,636
|
|
3,092
|
|
3,278
|
|
||||||
|
Europe/South Pacific
|
3,555
|
|
2,775
|
|
2,647
|
|
||||||
|
Greater Asia/Africa
|
2,069
|
|
1,943
|
|
1,760
|
|
||||||
|
Total Oral, Personal and Home Care
|
11,548
|
|
10,041
|
|
9,956
|
|
||||||
|
Pet Nutrition
|
1,078
|
|
1,081
|
|
1,127
|
|
||||||
|
Corporate
(3)
|
98
|
|
50
|
|
51
|
|
||||||
|
Total Identifiable assets
(4)
|
$
|
12,724
|
|
$
|
11,172
|
|
$
|
11,134
|
|
|||
67
COLGATE-PALMOLIVE COMPANY
Notes to Consolidated Financial Statements (continued)
(Dollars in Millions Except Share and Per Share Amounts)
____________
|
(3)
|
In 2011, Corporate identifiable assets primarily consist of derivative instruments (
73%
) and investments in equity securities (
22%
). In 2010, Corporate identifiable assets primarily consist of derivative instruments (
44%
) and investments in equity securities (
48%
). In 2009, Corporate identifiable assets primarily consist of derivative instruments (
44%
) and investments in equity securities (
46%
).
|
|
(4)
|
Long-lived assets in the U.S., primarily property, plant and equipment and goodwill and other intangibles represented approximately one-third of total long-lived assets of $
7,926
,
$7,116
and
$6,795
in 2011, 2010 and 2009, respectively.
|
15. Supplemental Income Statement Information
|
Other (income) expense, net
|
2011
|
2010
|
2009
|
|||||||||
|
Amortization of intangible assets
|
$
|
28
|
|
$
|
22
|
|
$
|
22
|
|
|||
|
Gain on sales of non-core product lines
|
(207
|
)
|
(50
|
)
|
(5
|
)
|
||||||
|
Business realignment and other cost-saving initiatives
|
136
|
|
—
|
|
—
|
|
||||||
|
Costs related to the sale of land in Mexico
|
13
|
|
—
|
|
—
|
|
||||||
|
Charge for a French competition law matter
|
21
|
|
—
|
|
—
|
|
||||||
|
Sanex acquisition transaction costs
|
12
|
|
—
|
|
—
|
|
||||||
|
Venezuela hyperinflationary transition charge
|
—
|
|
271
|
|
—
|
|
||||||
|
Gain from remeasurement of Venezuelan balance sheet
|
—
|
|
(10
|
)
|
—
|
|
||||||
|
Remeasurement of certain liabilities in Venezuela
|
—
|
|
—
|
|
27
|
|
||||||
|
Termination benefits
|
—
|
|
86
|
|
—
|
|
||||||
|
Legal and environmental matters
|
11
|
|
(3
|
)
|
27
|
|
||||||
|
Asset impairments
|
—
|
|
5
|
|
16
|
|
||||||
|
Equity (income)
|
(6
|
)
|
(5
|
)
|
(5
|
)
|
||||||
|
Other, net
|
(17
|
)
|
(15
|
)
|
29
|
|
||||||
|
Total Other (income) expense, net
|
$
|
(9
|
)
|
$
|
301
|
|
$
|
111
|
|
|||
|
Interest expense, net
|
2011
|
2010
|
2009
|
|||||||||
|
Interest incurred
|
$
|
59
|
|
$
|
69
|
|
$
|
102
|
|
|||
|
Interest capitalized
|
(1
|
)
|
(4
|
)
|
(14
|
)
|
||||||
|
Interest income
|
(6
|
)
|
(6
|
)
|
(11
|
)
|
||||||
|
Total Interest expense, net
|
$
|
52
|
|
$
|
59
|
|
$
|
77
|
|
|||
|
|
2011
|
2010
|
2009
|
|||||||||
|
Research and development
|
$
|
262
|
|
$
|
256
|
|
$
|
256
|
|
|||
|
Advertising
|
$
|
1,734
|
|
$
|
1,656
|
|
$
|
1,534
|
|
|||
68
COLGATE-PALMOLIVE COMPANY
Notes to Consolidated Financial Statements (continued)
(Dollars in Millions Except Share and Per Share Amounts)
Other Comprehensive Income
Other Comprehensive Income components attributable to Colgate-Palmolive Company before tax and respective tax impacts during the years ended December 31 were as follows:
|
|
Before-Tax Amount
|
Tax (Expense) Benefit
|
Net-of-Tax Amount
|
|||||||||
|
For the year ended December 31, 2009:
|
|
|
|
|||||||||
|
Cumulative translation adjustment
|
$
|
351
|
|
$
|
(5
|
)
|
$
|
346
|
|
|||
|
Retirement Plan and other retiree benefit adjustments
|
11
|
|
(3
|
)
|
8
|
|
||||||
|
Other
|
41
|
|
(14
|
)
|
27
|
|
||||||
|
Total Other comprehensive income
|
$
|
403
|
|
$
|
(22
|
)
|
$
|
381
|
|
|||
|
For the year ended December 31, 2010:
|
|
|
|
|||||||||
|
Cumulative translation adjustment
|
$
|
166
|
|
$
|
(4
|
)
|
$
|
162
|
|
|||
|
Retirement Plan and other retiree benefit adjustments
|
(220
|
)
|
77
|
|
(143
|
)
|
||||||
|
Other
|
(46
|
)
|
8
|
|
(38
|
)
|
||||||
|
Total Other comprehensive income
|
$
|
(100
|
)
|
$
|
81
|
|
$
|
(19
|
)
|
|||
|
For the year ended December 31, 2011:
|
|
|
|
|||||||||
|
Cumulative translation adjustment
|
$
|
(291
|
)
|
$
|
(7
|
)
|
$
|
(298
|
)
|
|||
|
Retirement Plan and other retiree benefit adjustments
|
(164
|
)
|
56
|
|
(108
|
)
|
||||||
|
Other
|
59
|
|
(13
|
)
|
46
|
|
||||||
|
Total Other comprehensive income
|
$
|
(396
|
)
|
$
|
36
|
|
$
|
(360
|
)
|
|||
There were no tax impacts on other comprehensive income attributable to Noncontrolling interests.
16. Supplemental Balance Sheet Information
Inventories by major class are as follows:
|
Inventories
|
2011
|
2010
|
|||||
|
Raw materials and supplies
|
$
|
319
|
|
$
|
295
|
|
|
|
Work-in-process
|
54
|
|
50
|
|
|||
|
Finished goods
|
954
|
|
877
|
|
|||
|
Total Inventories
|
$
|
1,327
|
|
$
|
1,222
|
|
|
Inventories valued under LIFO amounted to
$271
and
$263
at
December 31, 2011
and 2010, respectively. The excess of current cost over LIFO cost at the end of each year was
$30
and
$52
, respectively. The liquidations of LIFO inventory quantities had no material effect on income in 2011, 2010 and 2009.
|
Property, plant and equipment, net
|
2011
|
2010
|
||||||
|
Land
|
$
|
240
|
|
$
|
187
|
|
||
|
Buildings
|
1,342
|
|
1,319
|
|
||||
|
Manufacturing machinery and equipment
|
4,673
|
|
4,599
|
|
||||
|
Other equipment
|
1,069
|
|
1,055
|
|
||||
|
|
7,324
|
|
7,160
|
|
||||
|
Accumulated depreciation
|
(3,656
|
)
|
(3,467
|
)
|
||||
|
Total Property, plant and equipment, net
|
$
|
3,668
|
|
$
|
3,693
|
|
||
69
COLGATE-PALMOLIVE COMPANY
Notes to Consolidated Financial Statements (continued)
(Dollars in Millions Except Share and Per Share Amounts)
|
Other accruals
|
2011
|
2010
|
||||||
|
Accrued advertising and coupon redemption
|
$
|
555
|
|
$
|
551
|
|
||
|
Accrued payroll and employee benefits
|
293
|
|
381
|
|
||||
|
Accrued taxes other than income taxes
|
35
|
|
107
|
|
||||
|
Pension and other retiree benefits
|
84
|
|
67
|
|
||||
|
Accrued interest
|
22
|
|
21
|
|
||||
|
Derivatives
|
6
|
|
12
|
|
||||
|
Other
|
705
|
|
543
|
|
||||
|
Total Other accruals
|
$
|
1,700
|
|
$
|
1,682
|
|
||
|
Other liabilities
|
2011
|
2010
|
||||||
|
Pension and other retiree benefits
|
$
|
1,582
|
|
$
|
1,544
|
|
||
|
Other
|
203
|
|
160
|
|
||||
|
Total Other liabilities
|
$
|
1,785
|
|
$
|
1,704
|
|
||
Accumulated Other Comprehensive Income
Accumulated other comprehensive income is comprised of cumulative foreign currency translation gains and losses, unrecognized pension and other retiree benefit costs, unrealized gains and losses from derivative instruments designated as cash flow hedges and unrealized gains and losses on available for sale securities. At
December 31, 2011
and 2010, Accumulated other comprehensive income consisted primarily of aftertax unrecognized pension and other retiree benefit costs of
$908
and
$800
, respectively, and cumulative foreign currency translation adjustments of
$1,589
and
$1,291
, respectively. Foreign currency translation adjustments in 2011 primarily reflect losses due to the weakening of the Brazilian real, the Mexican peso and the Euro. Foreign currency translation adjustments in 2010 primarily reflect gains due to the strengthening of the Brazilian real and the Swiss franc.
70
COLGATE-PALMOLIVE COMPANY
Notes to Consolidated Financial Statements (continued)
(Dollars in Millions Except Share and Per Share Amounts)
17. Quarterly Financial Data (Unaudited)
|
|
Total
|
|
First
Quarter
|
|
Second
Quarter
|
Third
Quarter
|
Fourth
Quarter
|
|
||||||||||||
|
2011
|
|
|
|
|
|
|
|
|
||||||||||||
|
Net sales
|
$
|
16,734
|
|
|
$
|
3,994
|
|
|
$
|
4,185
|
|
$
|
4,383
|
|
$
|
4,172
|
|
|
||
|
Gross profit
|
9,590
|
|
|
2,331
|
|
|
2,404
|
|
2,462
|
|
2,393
|
|
||||||||
|
Net income including noncontrolling interests
|
2,554
|
|
(1)
|
607
|
|
646
|
|
676
|
|
(2)
|
625
|
|
(3)
|
|||||||
|
Net income attributable to Colgate-Palmolive Company
|
2,431
|
|
(1)
|
576
|
|
622
|
|
643
|
|
(2)
|
590
|
|
(3)
|
|||||||
|
Earnings per common share:
|
|
|
|
|
||||||||||||||||
|
Basic
|
4.98
|
|
(1)
|
1.17
|
|
1.27
|
|
1.32
|
|
(2)
|
1.22
|
|
(3)
|
|||||||
|
Diluted
|
4.94
|
|
(1)
|
1.16
|
|
1.26
|
|
1.31
|
|
(2)
|
1.21
|
|
(3)
|
|||||||
|
2010
|
|
|
|
|
|
|
|
|
|
|
|
|
||||||||
|
Net sales
|
$
|
15,564
|
|
|
$
|
3,829
|
|
$
|
3,814
|
|
$
|
3,943
|
|
$
|
3,978
|
|
||||
|
Gross profit
|
9,204
|
|
|
2,268
|
|
2,242
|
|
2,344
|
|
2,350
|
|
|||||||||
|
Net income including noncontrolling interests
|
2,313
|
|
(4)
|
387
|
|
(5)
|
630
|
|
645
|
|
651
|
|
(6)
|
|||||||
|
Net income attributable to Colgate-Palmolive Company
|
2,203
|
|
(4)
|
357
|
|
(5)
|
603
|
|
619
|
|
624
|
|
(6)
|
|||||||
|
Earnings per common share:
|
|
|
|
|
|
|
|
|
|
|
||||||||||
|
Basic
|
4.45
|
|
(4)
|
0.71
|
|
(5)
|
1.21
|
|
1.26
|
|
1.28
|
|
(6)
|
|||||||
|
Diluted
|
4.31
|
|
(4)
|
0.69
|
|
(5)
|
1.17
|
|
1.21
|
|
1.24
|
|
(6)
|
|||||||
____________
|
Note:
|
Basic and diluted earnings per share are computed independently for each quarter presented. Accordingly, the sum of the quarterly earnings per share may not agree with the calculated full year earnings per share.
|
|
(1)
|
Net income including noncontrolling interests, Net income attributable to Colgate-Palmolive Company and earnings per share for the full year of 2011 include a
$135
aftertax gain resulting from the sale of the Company's laundry detergent business in Colombia,
$147
of aftertax charges for the implementation of various business realignment and other cost-saving initiatives,
$9
of aftertax charges related to the sale of land in Mexico and a
$21
charge for a competition law matter in France related to a divested detergent business.
|
|
(2)
|
Net income including noncontrolling interests, Net income attributable to Colgate-Palmolive Company and earnings per share for the third quarter of 2011 include a
$135
aftertax gain resulting from the sale of the Company's laundry detergent business in Colombia,
$128
of aftertax charges for the implementation of various business realignment and other cost-saving initiatives and
$5
of aftertax charges related to the sale of land in Mexico.
|
|
(3)
|
Net income including noncontrolling interests, Net income attributable to Colgate-Palmolive Company and earnings per share for the fourth quarter of 2011 includes
$19
of aftertax charges for the implementation of various business realignment and other cost-saving initiatives,
$4
of aftertax charges related to the sale of land in Mexico and a
$21
charge for a competition law matter in France related to a divested detergent business.
|
|
(4)
|
Net income including noncontrolling interests, Net income attributable to Colgate-Palmolive Company and earnings per share for the full year of 2010 include a
$271
one-time charge related to the transition to hyperinflationary accounting in Venezuela, a
$61
aftertax charge for termination benefits related to overhead reduction initiatives, a
$30
aftertax gain on sales of non-core product lines and a
$31
benefit related to the reorganization of an overseas subsidiary.
|
|
(5)
|
Net income including noncontrolling interests, Net income attributable to Colgate-Palmolive Company and earnings per share for the first quarter of 2010 include a
$271
one-time charge related to the transition to hyperinflationary accounting in Venezuela.
|
|
(6)
|
Net income including noncontrolling interests, Net income attributable to Colgate-Palmolive Company and earnings per share for the fourth quarter of 2010 include
$61
of aftertax charges for termination benefits related to overhead reduction initiatives, a
$30
aftertax gain on sales of non-core product lines and a
$31
benefit related to the reorganization of an overseas subsidiary.
|
71
COLGATE-PALMOLIVE COMPANY
SCHEDULE II - VALUATION AND QUALIFYING ACCOUNTS
(Dollars in Millions)
|
Column A
|
Column B
|
Column C
|
Column D
|
Column E
|
||||||||||||||||
|
|
|
Additions
|
|
|
||||||||||||||||
|
|
Balance at Beginning of Period
|
Charged to Costs and Expenses
|
Other
|
Deductions
|
Balance at End of Period
|
|||||||||||||||
|
Year Ended December 31, 2011
|
|
|
|
|
|
|||||||||||||||
|
Allowance for doubtful accounts and estimated returns
|
$
|
53
|
|
$
|
6
|
|
$
|
—
|
|
$
|
10
|
|
$
|
49
|
|
|||||
|
Valuation allowance for deferred tax assets
|
$
|
1
|
|
$
|
—
|
|
$
|
—
|
|
$
|
—
|
|
$
|
1
|
|
|||||
|
Year Ended December 31, 2010
|
|
|
|
|
|
|
|
|
|
|
||||||||||
|
Allowance for doubtful accounts and estimated returns
|
$
|
52
|
|
$
|
1
|
|
$
|
—
|
|
$
|
—
|
|
$
|
53
|
|
|||||
|
Valuation allowance for deferred tax assets
|
$
|
2
|
|
$
|
—
|
|
$
|
—
|
|
$
|
1
|
|
(1)
|
$
|
1
|
|
||||
|
Year Ended December 31, 2009
|
|
|
|
|
|
|
|
|
|
|
||||||||||
|
Allowance for doubtful accounts and estimated returns
|
$
|
47
|
|
$
|
9
|
|
$
|
—
|
|
$
|
4
|
|
$
|
52
|
|
|||||
|
Valuation allowance for deferred tax assets
|
$
|
5
|
|
$
|
—
|
|
$
|
—
|
|
$
|
3
|
|
(1)
|
$
|
2
|
|
||||
____________
(1)
Decrease in allowance due to utilization of tax loss and tax credit carryforwards.
72
COLGATE-PALMOLIVE COMPANY
Market and Dividend Information
The Company’s common stock is listed on the New York Stock Exchange and its trading symbol is CL. Dividends on the common stock have been paid every year since 1895, and the Company’s regular common stock dividend payments have increased for 49 consecutive years.
|
Market Price of Common Stock
|
|
|
|
|
||||||||||||
|
|
2011
|
2010
|
||||||||||||||
|
Quarter Ended
|
High
|
Low
|
High
|
Low
|
||||||||||||
|
March 31
|
$
|
81.21
|
|
$
|
75.93
|
|
$
|
85.46
|
|
$
|
79.07
|
|
||||
|
June 30
|
89.11
|
|
79.90
|
|
85.81
|
|
76.93
|
|
||||||||
|
September 30
|
93.96
|
|
80.18
|
|
84.59
|
|
73.84
|
|
||||||||
|
December 31
|
93.92
|
|
86.48
|
|
81.18
|
|
73.75
|
|
||||||||
|
Year-end Closing Price
|
$92.39
|
$80.37
|
||||||||||||||
Dividends Paid Per Common Share
|
Quarter Ended
|
2011
|
2010
|
||||||
|
March 31
|
$
|
0.53
|
|
$
|
0.44
|
|
||
|
June 30
|
0.58
|
|
0.53
|
|
||||
|
September 30
|
0.58
|
|
0.53
|
|
||||
|
December 31
|
0.58
|
|
0.53
|
|
||||
|
Total
|
$
|
2.27
|
|
$
|
2.03
|
|
||
Stock Price Performance Graphs
The following graphs compare cumulative total stockholder returns on Colgate-Palmolive Company common stock against the S&P Composite-500 Stock Index and a peer company index for the twenty-year, ten-year and five-year periods each ending December 31, 2011. The peer company index is comprised of consumer products companies that have both domestic and international businesses. These companies are: Avon Products, Inc., The Clorox Company, Kimberly-Clark Corporation, The Procter & Gamble Company and Unilever (N.V. and plc).
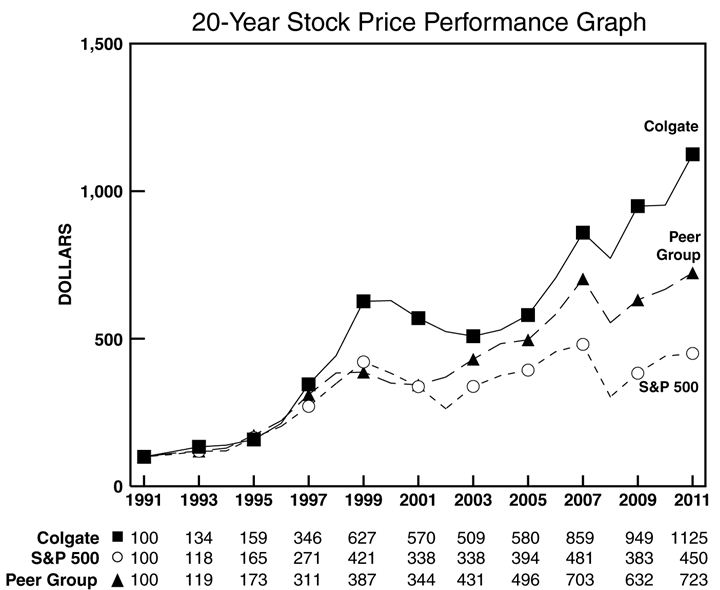
|
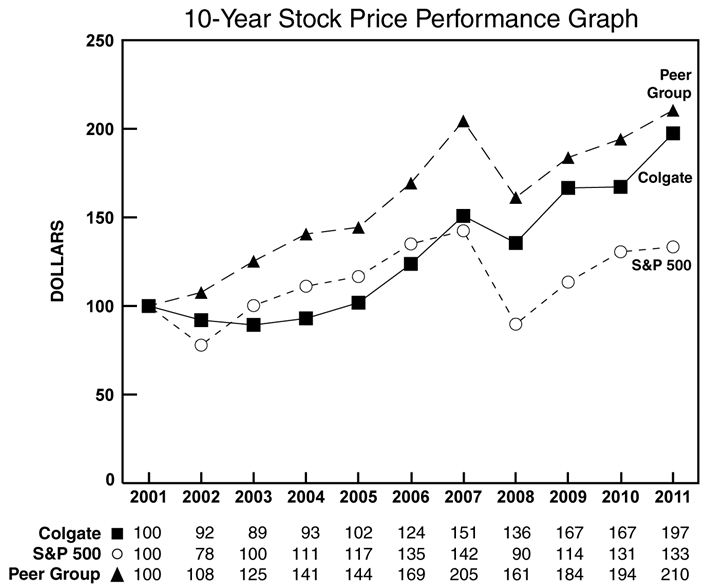
|
73
COLGATE-PALMOLIVE COMPANY
Market and Dividend Information
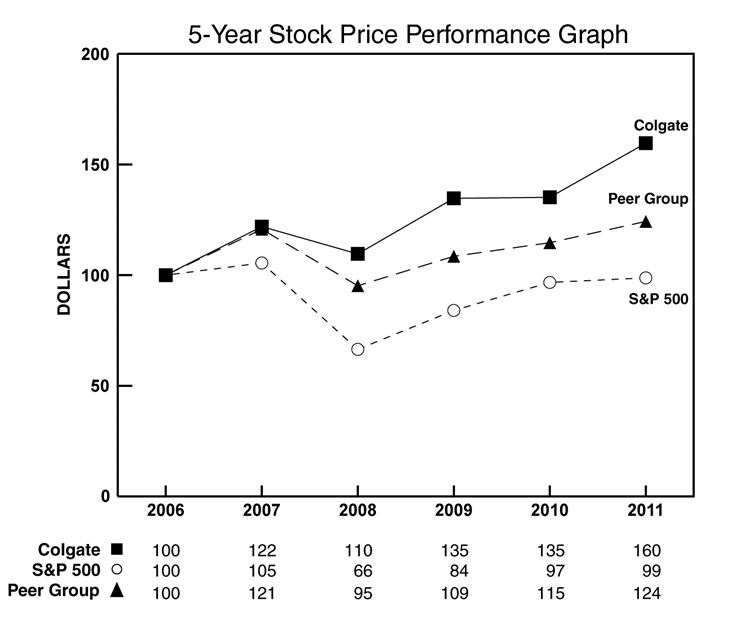
These performance graphs do not constitute soliciting material, are not deemed filed with the Securities and Exchange Commission and are not incorporated by reference in any of the Company’s filings under the Securities Act of 1933 or the Exchange Act, whether made before or after the date of this Annual Report on Form 10-K and irrespective of any general incorporation language in any such filing, except to the extent the Company specifically incorporates these performance graphs by reference therein.
74
COLGATE-PALMOLIVE COMPANY
Historical Financial Summary
For the years ended December 31,
(Dollars in Millions Except Per Share Amounts)
(Unaudited)
|
|
2011
|
2010
|
|
2009
|
2008
|
|
2007
|
|
2006
|
|
2005
|
|
2004
|
|
2003
|
2002
|
||||||||||||||||||||||||
|
Continuing Operations
|
|
|
|
|
|
|
|
|
|
|
|
|
|
|
|
|||||||||||||||||||||||||
|
Net sales
|
$
|
16,734
|
|
$
|
15,564
|
|
|
$
|
15,327
|
|
$
|
15,330
|
|
|
$
|
13,790
|
|
|
$
|
12,238
|
|
|
$
|
11,397
|
|
|
$
|
10,584
|
|
|
$
|
9,903
|
|
$
|
9,294
|
|
||||
|
Results of operations:
|
|
|
|
|
|
|
|
|
|
|
|
|
|
|
|
|
|
|
|
|
|
|
|
|
||||||||||||||||
|
Net income attributable to Colgate-Palmolive Company
|
2,431
|
|
(1)
|
2,203
|
|
(2)
|
2,291
|
|
1,957
|
|
(3)
|
1,737
|
|
(4)
|
1,353
|
|
(5)
|
1,351
|
|
(6)
|
1,327
|
|
(7)
|
1,421
|
|
1,288
|
|
|||||||||||||
|
Per share, basic
|
4.98
|
|
(1)
|
4.45
|
|
(2)
|
4.53
|
|
3.81
|
|
(3)
|
3.35
|
|
(4)
|
2.57
|
|
(5)
|
2.54
|
|
(6)
|
2.45
|
|
(7)
|
2.60
|
|
2.33
|
|
|||||||||||||
|
Per share, diluted
|
4.94
|
|
(1)
|
4.31
|
|
(2)
|
4.37
|
|
3.66
|
|
(3)
|
3.20
|
|
(4)
|
2.46
|
|
(5)
|
2.43
|
|
(6)
|
2.33
|
|
(7)
|
2.46
|
|
2.19
|
|
|||||||||||||
|
Depreciation and amortization expense
|
421
|
|
376
|
|
|
351
|
|
348
|
|
|
334
|
|
|
329
|
|
|
329
|
|
|
328
|
|
|
316
|
|
297
|
|
||||||||||||||
|
Financial Position
|
|
|
|
|
|
|
|
|
|
|
|
|
|
|
|
|
|
|
|
|
|
|
|
|
||||||||||||||||
|
Current ratio
|
1.2
|
|
1.0
|
|
|
1.1
|
|
1.3
|
|
|
1.1
|
|
|
1.0
|
|
|
1.0
|
|
|
1.0
|
|
|
1.0
|
|
1.0
|
|
||||||||||||||
|
Property, plant and equipment, net
|
3,668
|
|
3,693
|
|
|
3,516
|
|
3,119
|
|
|
3,015
|
|
|
2,696
|
|
|
2,544
|
|
|
2,648
|
|
|
2,542
|
|
2,491
|
|
||||||||||||||
|
Capital expenditures
|
537
|
|
550
|
|
|
575
|
|
684
|
|
|
583
|
|
|
476
|
|
|
389
|
|
|
348
|
|
|
302
|
|
344
|
|
||||||||||||||
|
Total assets
|
12,724
|
|
11,172
|
|
|
11,134
|
|
9,979
|
|
|
10,112
|
|
|
9,138
|
|
|
8,507
|
|
|
8,673
|
|
|
7,479
|
|
7,087
|
|
||||||||||||||
|
Long-term debt
|
4,430
|
|
2,815
|
|
|
2,821
|
|
3,585
|
|
|
3,222
|
|
|
2,720
|
|
|
2,918
|
|
|
3,089
|
|
|
2,685
|
|
3,211
|
|
||||||||||||||
|
Colgate-Palmolive Company shareholders’ equity
|
2,375
|
|
2,675
|
|
|
3,116
|
|
1,923
|
|
|
2,286
|
|
|
1,411
|
|
|
1,350
|
|
|
1,245
|
|
|
887
|
|
350
|
|
||||||||||||||
|
Share and Other
|
|
|
|
|
|
|
|
|
|
|
|
|
|
|
|
|
|
|
|
|
|
|
|
|
||||||||||||||||
|
Book value per common share
|
5.42
|
|
5.89
|
|
|
6.52
|
|
4.09
|
|
|
4.75
|
|
|
3.03
|
|
|
2.87
|
|
|
2.84
|
|
|
2.11
|
|
1.08
|
|
||||||||||||||
|
Cash dividends declared and paid per common share
|
2.27
|
|
2.03
|
|
|
1.72
|
|
1.56
|
|
|
1.40
|
|
|
1.25
|
|
|
1.11
|
|
|
0.96
|
|
|
0.90
|
|
0.72
|
|
||||||||||||||
|
Closing price
|
92.39
|
|
80.37
|
|
|
82.15
|
|
68.54
|
|
|
77.96
|
|
|
65.24
|
|
|
54.85
|
|
|
51.16
|
|
|
50.05
|
|
52.43
|
|
||||||||||||||
|
Number of common shares outstanding (in millions)
|
480.0
|
|
494.9
|
|
|
494.2
|
|
501.4
|
|
|
509.0
|
|
|
512.7
|
|
|
516.2
|
|
|
526.6
|
|
|
533.7
|
|
536
|
|
||||||||||||||
|
Number of common shareholders of record
|
28,900
|
|
29,900
|
|
|
30,600
|
|
31,400
|
|
|
32,200
|
|
|
33,400
|
|
|
35,000
|
|
|
36,500
|
|
|
37,700
|
|
38,800
|
|
||||||||||||||
|
Number of employees
|
38,600
|
|
39,200
|
|
|
38,100
|
|
36,600
|
|
|
36,000
|
|
|
34,700
|
|
|
35,800
|
|
|
36,000
|
|
|
36,600
|
|
37,700
|
|
||||||||||||||
_________
|
(1)
|
Net income attributable to Colgate-Palmolive Company and earnings per share in 2011 include an aftertax gain of $135 on the sale of the Company's laundry detergent business in Colombia, offset by $147 aftertax charges for the implementation of various business realignment and other cost-saving initiatives, $9 of aftertax charges related to the sale of land in Mexico and a $21 charge for a competition law matter in France related to a divested detergent business.
|
|
(2)
|
Net income attributable to Colgate-Palmolive Company and earnings per share in 2010 includes a $271 one-time charge related to the transition to hyperinflationary accounting in Venezuela, $61 of aftertax charges for termination benefits related to overhead reduction initiatives, a $30 aftertax gain on sales of non-core product lines and a $31 benefit related to the reorganization of an overseas subsidiary.
|
|
(3)
|
Net income attributable to Colgate-Palmolive Company and earnings per share in 2008 include $113 of aftertax charges associated with the 2004 Restructuring Program.
|
|
(4)
|
Net income attributable to Colgate-Palmolive Company and earnings per share in 2007 include a gain for the sale of the Company’s household bleach business in Latin America of $29 aftertax and an income tax benefit of $74 related to the reduction of a tax loss carryforward valuation allowance in Brazil, partially offset by tax provisions for the recapitalization of certain overseas subsidiaries. These gains were more than offset by $184 of aftertax charges associated with the 2004 Restructuring Program, $10 of pension settlement charges and $8 of charges related to the limited voluntary recall of certain Hill’s Pet Nutrition feline products.
|
75
COLGATE-PALMOLIVE COMPANY
Historical Financial Summary
For the years ended December 31,
(Dollars in Millions Except Per Share Amounts)
(Unaudited)
|
(5)
|
Net income attributable to Colgate-Palmolive Company and earnings per share in 2006 include a gain for the sale of the Company’s household bleach business in Canada of $38 aftertax. This gain was more than offset by $287 of aftertax charges associated with the 2004 Restructuring Program and $48 of aftertax charges related to the adoption of the update to the Stock Compensation Topic of the FASB Codification.
|
|
(6)
|
Net income attributable to Colgate-Palmolive Company and earnings per share in 2005 include a gain for the sale of heavy-duty laundry detergent brands in North America and Southeast Asia of $93 aftertax. This gain was more than offset by $145 of aftertax charges associated with the 2004 Restructuring Program, $41 of income taxes for incremental repatriation of foreign earnings related to the American Jobs Creation Act and $23 aftertax of non-cash pension and other retiree benefit charges.
|
|
(7)
|
Net income attributable to Colgate-Palmolive Company and earnings per share in 2004 include $48 of aftertax charges associated with the 2004 Restructuring Program.
|
76
COLGATE-PALMOLIVE COMPANY
EXHIBITS TO FORM 10-K
YEAR ENDED DECEMBER 31, 2011
Commission File No. 1-644
|
Exhibit No.
|
Description
|
|
|
|
|
|
|
3-A
|
|
Restated Certificate of Incorporation, as amended. (Registrant hereby incorporates by reference Exhibit 3-A to its Quarterly Report on Form 10-Q for the quarter ended June 30, 2008, File No. 1-644.)
|
|
|
|
|
|
3-B
|
|
By-laws, as amended. (Registrant hereby incorporates by reference Exhibit 3-A to its Current Report on Form 8-K filed on June 7, 2007, File No. 1-644.)
|
|
|
|
|
|
4
|
a)
|
Indenture, dated as of November 15, 1992, between the Company and The Bank of New York Mellon (formerly known as The Bank of New York) as Trustee. (Registrant hereby incorporates by reference Exhibit 4.1 to its Registration Statement on Form S-3 and Post-Effective Amendment No. 1 filed on June 26, 1992, Registration No. 33-48840.)*
|
|
|
|
|
|
|
b)
|
Colgate-Palmolive Company Employee Stock Ownership Trust Agreement dated as of June 1, 1989, as amended. (Registrant hereby incorporates by reference Exhibit 4-B (b) to its Quarterly Report on Form 10-Q for the quarter ended June 30, 2000, File No. 1-644.)
|
|
|
|
|
|
|
c)
|
Form of 4.75% Notes Due 2014 of Colgate-Palmolive Company. (Registrant hereby incorporates by reference Exhibit 99(B) to its Registration Statement on Form 8-A filed on June 8, 2007, File No. 1-644.)
|
|
|
|
|
|
10-A
|
a)
|
Colgate-Palmolive Company 2009 Executive Incentive Compensation Plan. (Registrant hereby incorporates by reference Appendix A to its 2009 Notice of Meeting and Proxy Statement.)
|
|
|
|
|
|
|
b)
|
Colgate-Palmolive Company Executive Incentive Compensation Plan Trust, as amended. (Registrant hereby incorporates by reference Exhibit 10-B (b) to its Annual Report on Form 10-K for the year ended December 31, 1987, File No. 1-644.)
|
|
|
|
|
|
|
c)
|
Amendment, dated as of October 29, 2007, to the Colgate-Palmolive Company Executive Incentive Compensation Plan Trust. (Registrant hereby incorporates by reference Exhibit 10-A (b) to its Quarterly Report on Form 10-Q for the quarter ended September 30, 2007, File No. 1-644.)
|
|
|
|
|
|
10-B
|
a)
|
Colgate-Palmolive Company Supplemental Salaried Employees’ Retirement Plan, amended and restated as of September 1, 2010. (Registrant hereby incorporates by reference Exhibit 10-A to its Quarterly Report on Form 10-Q for the quarter ended September 30, 2010, File No. 1-644.)
|
|
|
b)
|
Amended and Restated Colgate-Palmolive Company Supplemental Salaried Employees’ Retirement Plan Trust, dated August 2, 1990. (Registrant hereby incorporates by reference Exhibit 10-B (b) to its Quarterly Report on Form 10-Q for the quarter ended September 30, 2007, File No. 1-644.)
|
|
|
|
|
|
|
c)
|
Amendment, dated as of October 29, 2007, to the Amended and Restated Colgate-Palmolive Company Supplemental Salaried Employee Trust. (Registrant hereby incorporates by reference Exhibit 10-B (c) to its Quarterly Report on Form 10-Q for the quarter ended September 30, 2007, File No. 1-644.)
|
|
10-C
|
a)
|
Colgate-Palmolive Company Executive Severance Plan, as amended and restated as of July 8, 2010. (Registrant hereby incorporates by reference Exhibit 10-A to its Current Report on Form 8-K filed on July 9, 2010, File No. 1-644.)
|
77
|
Exhibit No.
|
Description
|
|
|
|
|
|
|
|
b)
|
Colgate-Palmolive Company Executive Severance Plan Trust. (Registrant hereby incorporates by reference Exhibit 10-E (b) to its Annual Report on Form 10-K for the year ended December 31, 1987, File No. 1-644.)
|
|
|
|
|
|
|
c)
|
Amendment, dated as of October 29, 2007, to the Colgate-Palmolive Company Executive Severance Plan Trust. (Registrant hereby incorporates by reference Exhibit 10-C to its Quarterly Report on Form 10-Q for the quarter ended September 30, 2007, File No. 1-644.)
|
|
10-D
|
|
Colgate-Palmolive Company Pension Plan for Outside Directors, as amended and restated. (Registrant hereby incorporates by reference Exhibit 10-D to its Annual Report on Form 10-K for the year ended December 31, 1999, File No. 1-644.)
|
|
|
|
|
|
10-E
|
a)
|
Colgate-Palmolive Company 2007 Stock Plan for Non-Employee Directors, amended and restated as of September 12, 2007. (Registrant hereby incorporates by reference Exhibit 10-D to its Quarterly Report on Form 10-Q for the quarter ended September 30, 2007, File No. 1-644.)
|
|
|
||
|
b)
|
Amendment, dated as of January 13, 2011, to the Colgate-Palmolive Company 2007 Stock Plan for Non-Employee Directors. (Registrant hereby incorporates by reference Exhibit 10-A to its Quarterly Report on Form 10-Q for the quarter ended March 31, 2011, File No. 1-644.)
|
|
|
|
|
|
|
10-F
|
|
Colgate-Palmolive Company Stock Plan for Non-Employee Directors, amended and restated as of September 12, 2007. (Registrant hereby incorporates by reference Exhibit 10-E to its Quarterly Report on Form 10-Q for the quarter ended September 30, 2007, File No. 1-644.)
|
|
|
|
|
|
10-G
|
a)
|
Colgate-Palmolive Company Restated and Amended Deferred Compensation Plan for Non-Employee Directors, as amended. (Registrant hereby incorporates by reference Exhibit 10-H to its Annual Report on Form 10-K for the year ended December 31, 1997, File No. 1-644.)
|
|
|
|
|
|
|
b)
|
Amendment, dated as of September 12, 2007, to the Colgate-Palmolive Company Restated and Amended Deferred Compensation Plan for Non-Employee Directors. (Registrant hereby incorporates by reference Exhibit 10-F to its Quarterly Report on Form 10-Q for the quarter ended September 30, 2007, File No. 1-644.)
|
|
10-H
|
|
Colgate-Palmolive Company Deferred Compensation Plan, amended and restated as of September 12, 2007. (Registrant hereby incorporates by reference Exhibit 10-G to its Quarterly Report on Form 10-Q for the quarter ended September 30, 2007, File No. 1-644.)
|
|
|
|
|
|
10-I
|
|
Colgate-Palmolive Company Above and Beyond Plan – Officer Level. (Registrant hereby incorporates by reference Exhibit 10-A to its Quarterly Report on Form 10-Q for the quarter ended September 30, 2004, File No. 1-644.)
|
|
|
|
|
|
10-J
|
a)
|
Colgate-Palmolive Company Non-Employee Director Stock Option Plan, as amended. (Registrant hereby incorporates by reference Exhibit 10-L to its Annual Report on Form 10-K for the year ended December 31, 1997, File No. 1-644.)
|
|
|
|
|
|
|
b)
|
Amendment, dated as of December 29, 2005, to the Colgate-Palmolive Company Non-Employee Director Stock Option Plan, as amended. (Registrant hereby incorporates by reference Exhibit 10-J (b) to its Annual Report on Form 10-K for the year ended December 31, 2005, File No. 1-644.)
|
|
|
|
|
|
|
c)
|
Amendment, dated as of December 7, 2006, to the Colgate-Palmolive Company Non-Employee Director Stock Option Plan, as amended. (Registrant hereby incorporates by reference Exhibit 10-J(c) to its Annual Report on Form 10-K for the year ended December 31, 2006, File No. 1-644.)
|
|
|
d)
|
Amendment, dated as of October 29, 2007, to the Colgate-Palmolive Company Non-Employee Director Stock Option Plan. (Registrant hereby incorporates by reference Exhibit 10-K to its Quarterly Report on Form 10-Q for the quarter ended September 30, 2007, File No. 1-644.)
|
78
|
Exhibit No.
|
Description
|
|
|
10-K
|
a)
|
U.S. $1,800,000,000 Five Year Credit Agreement dated as of November 4, 2011, among Colgate-Palmolive Company as Borrower, the Banks named therein as Banks, HSBC Bank USA, National Association and JPMorgan Chase Bank, N.A. as Co-Syndication Agents, Citibank, N.A. as Administrative Agent and Citigroup Global Markets Inc. as Arranger. **
|
|
|
|
|
|
|
b)
|
Assumption Agreement, dated as of November 9, 2011, among Colgate-Palmolive Company as Borrower, Citibank, N.A. as Administrative Agent and Sovereign Bank. **
|
|
10-L
|
a)
|
Colgate-Palmolive Company 1997 Stock Option Plan. (Registrant hereby incorporates by reference appendix A to its 1997 Notice of Meeting and Proxy Statement.)
|
|
|
b)
|
Amendment, dated as of December 29, 2005, to the Colgate-Palmolive Company 1997 Stock Option Plan. (Registrant hereby incorporates by reference Exhibit 10-M(b) to its Annual Report on Form 10-K for the year ended December 31, 2005, File No. 1-644.)
|
|
|
|
|
|
|
c)
|
Amendment, dated as of December 7, 2006, to the Colgate-Palmolive Company 1997 Stock Option Plan. (Registrant hereby incorporates by reference Exhibit 10-M (c) to its Annual Report on Form 10-K for the year ended December 31, 2006, File No. 1-644.)
|
|
|
|
|
|
|
d)
|
Action, dated as of October 29, 2007, taken pursuant to the Colgate-Palmolive Company 2005 Employee Stock Option Plan and Colgate-Palmolive Company 1997 Stock Option Plan. (Registrant hereby incorporates by reference Exhibit 10-I to its Quarterly Report on Form 10-Q for the quarter ended September 30, 2007, File No. 1-644.)
|
|
|
|
|
|
10-M
|
|
Colgate-Palmolive Company Supplemental Savings and Investment Plan, amended and restated as of September 1, 2010. (Registrant hereby incorporates by reference Exhibit 10-B to its Quarterly Report on Form 10-Q for the quarter ended September 30, 2010, File No. 1-644.)
|
|
|
|
|
|
10-N
|
|
Form of Indemnification Agreement between Colgate-Palmolive Company and its directors, executive officers and certain key employees. (Registrant hereby incorporates by reference Exhibit 10-B to its Quarterly Report on Form 10-Q for the quarter ended June 30, 2004, File No. 1-644.)
|
|
|
|
|
|
10-O
|
|
Form of Stock Incentive Agreement used in connection with grants to employees under the Colgate-Palmolive Company 1997 Stock Option Plan. (Registrant hereby incorporates by reference Exhibit 10-O to its Current Report on Form 8-K dated September 8, 2004, File No. 1-644.)
|
|
10-P
|
|
Form of Restricted Stock Award Agreement used in connection with grants to employees under the 2009 Colgate-Palmolive Company Executive Incentive Compensation Plan. (Registrant hereby incorporates by reference Exhibit 10-P to its Annual Report on Form 10-K for the year ended December 31, 2009, File No. 1-644.)
|
|
|
|
|
|
10-Q
|
a)
|
Colgate-Palmolive Company 2005 Non-Employee Director Stock Option Plan. (Registrant hereby incorporates by reference appendix C to its 2005 Notice of Meeting and Proxy Statement.)
|
|
|
|
|
|
|
b)
|
Form of Award Agreement used in connection with grants to non-employee directors under the Colgate-Palmolive Company 2005 Non-Employee Director Stock Option Plan. (Registrant hereby incorporates by reference Exhibit 10-B to its Current Report on Form 8-K dated May 4, 2005, File No. 1-644.)
|
|
|
|
|
|
|
c)
|
Amendment, dated as of September 7, 2006, to the Colgate-Palmolive Company 2005 Non-Employee Director Stock Option Plan. (Registrant hereby incorporates by reference Exhibit 10-B to its Quarterly Report on Form 10-Q for the quarter ended September 30, 2006, File No. 1-644.)
|
|
d)
|
Amendment, dated as of December 7, 2006, to the Colgate-Palmolive Company 2005 Non-Employee Director Stock Option Plan. (Registrant hereby incorporates by reference Exhibit 10-S (d) to its Annual Report on Form 10-K for the year ended December 31, 2006, File No. 1-644.)
|
|
79
|
Exhibit No.
|
Description
|
|
|
|
|
|
|
|
e)
|
Amendment, dated as of October 29, 2007, to the Colgate-Palmolive Company 2005 Non-Employee Director Stock Option Plan. (Registrant hereby incorporates by reference Exhibit 10-J to its Quarterly Report on Form 10-Q for the quarter ended September 30, 2007, File No. 1-644.)
|
|
|
|
|
|
|
f)
|
Amendment, dated as of January 13, 2011, to the Colgate-Palmolive Company 2005 Non-Employee Director Stock Option Plan. (Registrant hereby incorporates by reference Exhibit 10-B to its Quarterly Report on Form 10-Q for the quarter ended March 31, 2011, File No. 1-644.)
|
|
|
|
|
|
|
g)
|
Amendment, dated as of July 14, 2011, to the Colgate-Palmolive Company 2005 Non-Employee Director Stock Option Plan. (Registrant hereby incorporates by reference Exhibit 10-A to its Quarterly Report on Form 10-Q for the quarter ended September 30, 2011, File No. 1-644.)
|
|
10-R
|
a)
|
Colgate-Palmolive Company 2005 Employee Stock Option Plan. (Registrant hereby incorporates by reference appendix B to its 2005 Notice of Meeting and Proxy Statement.)
|
|
|
|
|
|
|
b)
|
Form of Award Agreement used in connection with grants to employees under the Colgate-Palmolive Company 2005 Employee Stock Option Plan. (Registrant hereby incorporates by reference Exhibit 10-A to its Current Report on Form 8-K dated May 4, 2005, File No. 1-644.)
|
|
|
|
|
|
|
c)
|
Amendment, dated as of September 7, 2006, to the Colgate-Palmolive Company 2005 Employee Stock Option Plan. (Registrant hereby incorporates by reference Exhibit 10-A to its Quarterly Report on Form 10-Q for the quarter ended September 30, 2006, File No. 1-644.)
|
|
|
|
|
|
|
d)
|
Amendment, dated as of December 7, 2006, to the Colgate-Palmolive Company 2005 Employee Stock Option Plan. (Registrant hereby incorporates by reference Exhibit 10-T (d) to its Annual Report on Form 10-K for the year ended December 31, 2006, File No. 1-644.)
|
|
|
|
|
|
|
e)
|
Action, dated as of October 29, 2007, taken pursuant to the Colgate-Palmolive Company 2005 Employee Stock Option Plan and Colgate-Palmolive Company 1997 Stock Option Plan. (Registrant hereby incorporates by reference Exhibit 10-I to its Quarterly Report on Form 10-Q for the quarter ended September 30, 2007, File No. 1-644.)
|
|
|
|
|
|
|
f)
|
Amendment, dated as of February 26, 2009, to the Colgate-Palmolive Company 2005 Employee Stock Option Plan. (Registrant hereby incorporates by reference Exhibit 10-S(f) to its Annual Report on Form 10-K for the year ended December 31, 2008, File No. 1-644.)
|
|
|
|
|
|
|
g)
|
Amendment, dated as of July 14, 2011, to the Colgate-Palmolive Company 2005 Employee Stock Option Plan. (Registrant hereby incorporates by reference Exhibit 10-B to its Quarterly Report on Form 10-Q for the quarter ended September 30, 2011, File No. 1-644.)
|
|
10-S
|
Business and Share Sale and Purchase Agreement dated as of March 22, 2011 among Unilever N.V., Unilever plc, Colgate-Palmolive Company Sarl and Colgate-Palmolive Company relating to the Sanex personal care business. (Registrant hereby incorporates by reference Exhibit 10-C to its Quarterly Report on Form 10-Q for the quarter ended March 31, 2011, File No. 1-644.)
|
|
|
12 |
|
Computation of Ratio of Earnings to Fixed Charges.**
|
80
|
Exhibit No.
|
Description
|
|
21
|
|
Subsidiaries of the Registrant.**
|
|
|
|
|
|
23
|
|
Consent of Independent Registered Public Accounting Firm.**
|
|
|
|
|
|
24
|
|
Powers of Attorney.**
|
|
|
|
|
|
31-A
|
|
Certificate of the Chairman of the Board, President and Chief Executive Officer of Colgate-Palmolive Company pursuant to Rule 13a-14(a) under the Securities Exchange Act of 1934.**
|
|
|
|
|
|
31-B
|
|
Certificate of the Chief Financial Officer of Colgate-Palmolive Company pursuant to Rule 13a-14(a) under the Securities Exchange Act of 1934.**
|
|
|
|
|
|
32
|
|
Certificate of the Chairman of the Board, President and Chief Executive Officer and the Chief Financial Officer of Colgate-Palmolive Company pursuant to Rule 13a-14(b) under the Securities Exchange Act of 1934 and 18 U.S.C. § 1350.**
|
|
|
|
|
|
101
|
|
The following materials from Colgate-Palmolive Company’s Annual Report on Form 10-K for the year ended December 31, 2011, formatted in eXtensible Business Reporting Language (XBRL): (i) the Consolidated Statements of Income, (ii) the Consolidated Balance Sheets, (iii) the Consolidated Statements of Changes in Shareholders’ Equity, (iv) the Consolidated Statements of Comprehensive Income, (v) the Consolidated Statements of Cash Flows, (vi) Notes to Consolidated Financial Statements, and (vii) Financial Statement Schedule.
|
___________
|
*
|
Registrant hereby undertakes upon request to furnish the Commission with a copy of any instrument with respect to long-term debt where the total amount of securities authorized thereunder does not exceed 10% of the total assets of the registrant and its subsidiaries on a consolidated basis.
|
|
**
|
Filed herewith.
|
The exhibits indicated above that are not included with the Form 10-K are available upon request and payment of a reasonable fee approximating the registrant’s cost of providing and mailing the exhibits. Inquiries should be directed to:
|
|
Colgate-Palmolive Company
|
|
|
Office of the Secretary (10-K Exhibits)
|
|
|
300 Park Avenue
|
|
|
New York, New York 10022-7499
|
81
TABLE OF CONTENTS
Part IItem 1. BusinessItem 1A. Risk FactorsItem 1B. Unresolved Staff CommentsItem 2. PropertiesItem 3. Legal ProceedingsItem 4. Mine Safety DisclosuresPart IIItem 5. Market For Registrant's Common Equity, Related Stockholder Matters and Issuer Purchases Of Equity SecuritiesItem 6. Selected Financial DataItem 7. Management's Discussion and Analysis Of Financial Condition and Results Of OperationsItem 7A. Quantitative and Qualitative Disclosures About Market RiskItem 8. Financial Statements and Supplementary DataItem 9. Changes in and Disagreements with Accountants on Accounting and Financial DisclosureItem 9A. Controls and ProceduresItem 9B. Other InformationPart IIIItem 10. Directors, Executive Officers and Corporate GovernanceItem 11. Executive CompensationItem 12. Security Ownership Of Certain Beneficial Owners and Management and Related Stockholder MattersItem 13. Certain Relationships and Related Transactions and Director IndependenceItem 14. Principal Accountant Fees and ServicesPart IVItem 15. Exhibits and Financial Statement Schedules