UNITED STATES
SECURITIES AND EXCHANGE COMMISSION
Washington, D.C. 20549
___________________________________________________________________
FORM 20-F
o
Registration statement pursuant to Section 12(b) or (g) of the Securities Exchange Act of 1934
or
ý
Annual report pursuant to Section 13 or 15(d) of the Securities Exchange Act of 1934
For the fiscal year ended
December 31, 2018
or
o
Transition report pursuant to Section 13 or 15(d) of the Securities Exchange Act of 1934
For the transition period from
to
or
o
Shell company report pursuant to Section 13 or 15(d) of the Securities Exchange Act of 1934
Date of event requiring this shell company report:
Commission file number: 1-14832
___________________________________________________________________
CELESTICA INC.
(Exact name of registrant as specified in its charter)
Ontario, Canada
(Jurisdiction of incorporation or organization)
844 Don Mills Road
Toronto, Ontario, Canada M3C 1V7
(Address of principal executive offices)
Curtis Cheam
416-448-2211
clsir@celestica.com
844 Don Mills Road
Toronto, Ontario, Canada M3C 1V7
(Name, Telephone, E-mail and/or Facsimile number and Address of Company Contact Person)
___________________________________________________________________
SECURITIES REGISTERED OR TO BE REGISTERED
PURSUANT TO SECTION 12(b) OF THE ACT:
|
Title of each class:
|
Name of each exchange on which registered:
|
|
Subordinate Voting Shares
|
The Toronto Stock Exchange
New York Stock Exchange
|
___________________________________________________________________
SECURITIES REGISTERED OR TO BE REGISTERED
PURSUANT TO SECTION 12(g) OF THE ACT:
N/A
__________________________________________________________________
SECURITIES FOR WHICH THERE IS A REPORTING OBLIGATION
PURSUANT TO SECTION 15(d) OF THE ACT:
N/A
___________________________________________________________________
Indicate the number of outstanding shares of each of the issuer's classes of capital or common stock as of the close of the period covered by the annual report.
|
117,692,169 Subordinate Voting Shares
|
0 Preference Shares
|
|
18,600,193 Multiple Voting Shares
|
|
Indicate by check mark if the registrant is a well-known seasoned issuer, as defined in Rule 405 of the Securities Act. Yes
ý
No
o
If this report is an annual or transition report, indicate by check mark if the registrant is not required to file reports pursuant to Section 13 or 15(d) of the Securities Exchange Act of 1934. Yes
o
No
ý
Indicate by check mark whether the registrant (1) has filed all reports required to be filed by Section 13 or 15(d) of the Securities Exchange Act of 1934 during the preceding 12 months (or for such shorter period that the registrant was required to file such reports), and (2) has been subject to such filing requirements for the past 90 days. Yes
ý
No
o
Indicate by check mark whether the registrant has submitted electronically every Interactive Data File required to be submitted pursuant to Rule 405 of Regulation S-T (§232.405 of this chapter) during the preceding 12 months (or for such shorter period that the registrant was required to submit such files). Yes
ý
No
o
Indicate by check mark whether the registrant is a large accelerated filer, an accelerated filer, a non-accelerated filer, or an emerging growth company. See definition of "large accelerated filer," "accelerated filer," and "emerging growth company" in Rule 12b-2 of the Exchange Act.
Large accelerated filer
ý
Accelerated filer
o
Non-accelerated filer
o
Emerging growth company
o
If an emerging growth company that prepares its financial statements in accordance with U.S. GAAP, indicate by check mark if the registrant has elected not to use the extended transition period for complying with any new or revised financial accounting standards† provided pursuant to Section 13(a) of the Exchange Act.
o
†The term "new or revised financial accounting standard" refers to any update issued by the Financial Accounting Standards Board to its Accounting Standards Codification after April 5, 2012.
Indicate by check mark which basis of accounting the registrant has used to prepare the statements included in this filing:
U.S. GAAP
o
International Financial Reporting Standards as issued by the International Accounting Standards Board
ý
Other
o
If "Other" has been checked in response to the previous question, indicate by check mark which financial statement item the registrant has elected to follow. Item 17
o
Item 18
o
If this is an annual report, indicate by check mark whether the registrant is a shell company (as defined in Rule 12b-2 of the Exchange Act). Yes
o
No
ý
TABLE OF CONTENTS
|
Page
|
|||
|
A.
|
|||
|
B.
|
|||
|
C.
|
|||
|
D.
|
|||
|
A.
|
|||
|
B.
|
|||
|
C.
|
|||
|
D.
|
|||
|
A.
|
|||
|
B.
|
|||
|
C.
|
|||
|
D.
|
|||
|
E.
|
|||
|
A.
|
|||
|
B.
|
|||
|
C.
|
|||
|
A.
|
|||
|
B.
|
|||
|
A.
|
|||
|
B.
|
|||
|
C.
|
|||
|
D.
|
|||
|
E.
|
|||
|
F.
|
|||
|
A.
|
|||
|
B.
|
|||
|
C.
|
|||
|
D.
|
|||
|
E.
|
|||
|
Page
|
|||
|
F.
|
|||
|
G.
|
|||
|
H.
|
|||
|
I.
|
|||
|
A.
|
|||
|
B.
|
|||
|
C.
|
|||
|
D.
|
|||
i
In this Annual Report on Form 20-F for the year ended
December 31, 2018
(referred to herein as "this Annual Report"), "Celestica," the "Corporation," the "Company," "we," "us" and "our" refer to Celestica Inc. and its subsidiaries.
In this Annual Report, all dollar amounts are expressed in United States dollars, except where we state otherwise. All references to "U.S.$" or "$" are to United States dollars and all references to "C$" are to Canadian dollars. Unless we indicate otherwise, any reference in this Annual Report to a conversion between U.S.$ and C$ is a conversion at the average of the exchange rates in effect for the year ended
December 31, 2018
. During that period, based on the relevant noon buying rates in New York City for cable transfers in Canadian dollars, as certified for customs purposes by the Board of Governors of the U.S. Federal Reserve Bank, the average daily exchange rate was U.S.$1.00 = C$1.2957.
Unless we indicate otherwise, all information in this Annual Report is stated as of February 13, 2019.
Forward-Looking Statements
Item 3, "Key Information — Risk Factors," Item 4, "Information on the Company," Item 5, "Operating and Financial Review and Prospects" and other sections of this Annual Report contain forward-looking statements within the meaning of Section 27A of the U.S. Securities Act of 1933, as amended, or the U.S. Securities Act, Section 21E of the U.S. Securities Exchange Act of 1934, as amended, or the U.S. Exchange Act, and forward-looking information within the meaning of applicable Canadian securities laws (collectively, forward-looking statements), including, without limitation, statements related to: our future growth, including in our Advanced Technology Solutions (ATS) segment; the potential for increased expansion and integration costs in our ATS segment; our priorities, intended areas of focus, objectives, targets and goals (including, but not limited to, those set forth under the caption "Celestica's Strategy" in Item 4B., and the caption "Operating Goals and Principles" in Item 5); trends in the electronics manufacturing services (EMS) industry, generally and in relation to our business, including the anticipated continuation and impact of adverse market conditions, particularly in our Connectivity and Cloud Solutions (CCS) segment; adverse market conditions in, and the cyclical nature of, our capital equipment business, in particular our semiconductor business; our anticipated financial and/or operational results; the anticipated impact, range and timing of, our cost efficiency initiative; the anticipated impact of our comprehensive CCS segment portfolio review (CCS Review); our growth and diversification strategies and plans (and potential hindrances thereto); the expected continuation, and adverse impact on our business, of materials constraints; supplier lead times; the anticipated impact of completed acquisitions and program wins, transfers, losses or disengagements on our business; the timing of the valuation of certain recently-acquired assets and the finalization of the related purchase price allocations; anticipated expenses, restructuring actions and charges, capital expenditures, and other anticipated working capital requirements, including the anticipated amounts, timing, impact and funding thereof; the anticipated impact on our operations of any new significant tariffs on items imported into the U.S. and related countermeasures; the anticipated repatriation of undistributed earnings from foreign subsidiaries; the impact of tax and litigation outcomes; our anticipated ability to use certain net operating losses; intended investments in our business and associated risks; the anticipated impact of the pace of technological changes, customer outsourcing, program transfers, and the global economic environment on our business; raw materials prices; the timing, quantity and intended method of funding subordinate voting share repurchases; our intention to settle outstanding equity awards with subordinate voting shares; the impact of outstanding indebtedness under our credit facility on our business; the anticipated aggregate cost of relocating our Toronto manufacturing operations and corporate headquarters; the timing of relocating our corporate headquarters; our expectation that the costs of our Toronto manufacturing and corporate office relocations will be more than offset by the cash proceeds from the property sale; the anticipated impact of recent U.S. tax reform on our business; transition activities related to, and the anticipated impact of, newly-issued accounting standards; the impact of price reductions and longer-term contracts on our business; the potential use of cash, securities issuances and further increases in third-party indebtedness to fund our operations or acquisitions, and the anticipated and potential adverse impacts of such uses and/or increase; the potential adverse impacts of Britain's intention to leave the European Union (Brexit) and/or policies or legislation proposed or instituted by the current administration in the U.S.; our expectations with respect to future pioneer incentives for limited portions of our Malaysian business; the timing of, and potential true-up premium on, annuities purchased for our U.K pension plans; our intentions with respect to our U.K Supplementary pension plan; the expected impact of the expiration of one of our income tax incentives in Thailand; our intention to sell a lower amount of accounts receivable under a customer's supplier financing program; our future warranty obligations; our expectations with respect to cybersecurity threats; our intentions with respect to environmental assessments for newly-leased or acquired properties; our expectations with respect to expiring leases; anticipated insignificant hedge ineffectiveness of our interest rate swap agreements; the pay-for-performance alignment of our executive compensation program; our intention to retain earnings for general corporate purposes; our pension obligations; the expectation of continued adverse impacts from costs incurred in connection with our pursuit of acquisitions and strategic transactions; and the anticipated impact of the integration of Impakt Holdings, LLC on our internal controls. Such forward-looking statements may, without limitation, be preceded by, followed by, or include words such as "believes," "expects," "anticipates," "estimates," "intends," "plans," "continues," "project," "potential," "possible," "contemplate," "seek," or
1
similar expressions, or may employ such future or conditional verbs as "may," "might," "will," "could," "should" or "would," or may otherwise be indicated as forward-looking statements by grammatical construction, phrasing or context. For those statements, we claim the protection of the safe harbor for forward-looking statements contained in the U.S. Private Securities Litigation Reform Act of 1995, where applicable, and applicable Canadian securities laws.
Forward-looking statements are provided to assist readers in understanding management's current expectations and plans relating to the future. Readers are cautioned that such information may not be appropriate for other purposes. Forward-looking statements are not guarantees of future performance and are subject to risks that could cause actual results to differ materially from those expressed or implied in such forward-looking statements, including, among others, as is described in more detail in Item 3(D), "Key Information — Risk Factors" and elsewhere in this Annual Report, risks related to:
|
•
|
our customers' ability to compete and succeed with our products and services;
|
|
•
|
customer and segment concentration;
|
|
•
|
challenges of replacing revenue from completed or lost programs or customer disengagements;
|
|
•
|
changes in our mix of customers and/or the types of products or services we provide;
|
|
•
|
the impact on gross profit of higher concentration of lower margin programs;
|
|
•
|
price, margin pressures, and other competitive factors affecting, and the highly competitive nature of, the EMS industry in general and our CCS segment in particular;
|
|
•
|
the cyclical nature of our capital equipment business, in particular our semiconductor business;
|
|
•
|
delays in the delivery and availability of components, services and materials;
|
|
•
|
the expansion or consolidation of our operations;
|
|
•
|
defects or deficiencies in our products, services or designs;
|
|
•
|
integrating acquisitions and "operate-in-place" arrangements, and achieving the anticipated benefits therefrom;
|
|
•
|
negative impacts on our business resulting from recent increases in third-party indebtedness;
|
|
•
|
our response to changes in demand, rapidly evolving and changing technologies, and changes in our customers' business and outsourcing strategies;
|
|
•
|
customer, competitor and/or supplier consolidation;
|
|
•
|
compliance with social responsibility initiatives;
|
|
•
|
challenges associated with new customers or programs, or the provision of new services;
|
|
•
|
the impact of our restructuring actions;
|
|
•
|
the incurrence of future restructuring charges, impairment charges or other write-downs of assets;
|
|
•
|
managing our operations, growth initiatives and our working capital performance during uncertain market and economic conditions;
|
|
•
|
disruptions to our operations, or those of our customers, component suppliers and/or logistics partners, including as a result of global or local events outside of our/their control and the impact of significant tariffs on items imported into the U.S.;
|
|
•
|
changes to our operating model;
|
|
•
|
changing commodity, materials and component costs as well as labor costs and conditions;
|
|
•
|
retaining or expanding our business due to execution and quality issues (including our ability to successfully resolve these challenges);
|
2
|
•
|
non-performance by counterparties (including the financial institutions party to our purchased annuities and other financial counterparties, key suppliers and/or customers);
|
|
•
|
maintaining sufficient financial resources and working capital to fund currently anticipated financial obligations and to pursue desirable business opportunities;
|
|
•
|
negative impacts on our business resulting from any significant uses of cash, securities issuances, and/or additional third-party indebtedness for acquisitions or to otherwise fund our operations;
|
|
•
|
our financial exposure to foreign currency volatility;
|
|
•
|
recruiting or retaining skilled talent;
|
|
•
|
our dependence on industries affected by rapid technological change;
|
|
•
|
increasing taxes, tax audits, and challenges of defending our tax positions;
|
|
•
|
obtaining, renewing or meeting the conditions of tax incentives and credits;
|
|
•
|
the relocation of our corporate headquarters;
|
|
•
|
computer viruses, malware, hacking attempts or outages that may disrupt our operations;
|
|
•
|
the management of our IT systems and our ability to protect confidential information;
|
|
•
|
the variability of revenue and operating results;
|
|
•
|
compliance with applicable laws, regulations, and government grants;
|
|
•
|
our pension obligations;
|
|
•
|
interest rate fluctuations and changes to LIBOR; and
|
|
•
|
current or future litigation, governmental actions, and/or changes in legislation.
|
The foregoing and other material risks and uncertainties are discussed in our public filings, which can be found at
www.sedar.com
and
www.sec.gov
, including in this Annual Report, and subsequent reports on Form 6-K furnished to, the U.S. Securities and Exchange Commission, and as applicable, the Canadian Securities Administrators.
Our forward-looking statements contained in this Annual Report are based on various assumptions, many of which involve factors that are beyond our control. Our material assumptions include those related to the following:
|
•
|
fluctuation of production schedules from our customers in terms of volume and mix of products or services;
|
|
•
|
the timing and execution of, and investments associated with, ramping new business;
|
|
•
|
the successful pursuit, completion and integration of acquisitions;
|
|
•
|
the success of our customers' products;
|
|
•
|
our ability to retain programs and customers;
|
|
•
|
the stability of general economic and market conditions, currency exchange rates and interest rates;
|
|
•
|
supplier performance, pricing and terms;
|
|
•
|
compliance by third parties with their contractual obligations and the accuracy of their representations and warranties;
|
|
•
|
the costs and availability of components, materials, services, equipment, labor, energy and transportation;
|
|
•
|
that our customers will retain liability for recently-imposed tariffs and countermeasures;
|
|
•
|
our ability to keep pace with rapidly changing technological developments;
|
3
|
•
|
the impact of recent U.S. tax reform on our operations;
|
|
•
|
the timing, execution and effect of our restructuring actions, including our cost efficiency initiative;
|
|
•
|
the successful resolution of quality issues that arise from time to time;
|
|
•
|
our having sufficient financial resources and working capital to fund currently anticipated financial obligations and to pursue desirable business opportunities;
|
|
•
|
our ability to successfully diversify our customer base and develop new capabilities;
|
|
•
|
the availability of cash resources for repurchases of outstanding subordinate voting shares;
|
|
•
|
that we achieve the expected benefits from our recent acquisitions;
|
|
•
|
the impact of the CCS Review on our business; and
|
|
•
|
the magnitude of anticipated losses in our capital equipment business in the first quarter of 2019.
|
While management believes these assumptions to be reasonable under current circumstances, they may prove to be inaccurate, which could cause actual results to differ materially (and adversely) from those that would have been achieved had such assumptions been accurate.
Forward-looking statements speak only as of the date on which they are made, and we disclaim any intention or obligation to update or revise any forward-looking statements, whether as a result of new information, future events or otherwise, except as required by applicable law. You should read this Annual Report, and the documents, if any, that we incorporate herein by reference, with the understanding that our actual results may be materially different from what we expect.
All forward-looking statements attributable to us are expressly qualified by the cautionary statements included in this Annual Report.
Not applicable.
Not applicable.
4
A. Selected Financial Data
You should read the following selected financial data together with Item 5, "Operating and Financial Review and Prospects," the Consolidated Financial Statements in Item 18, and the other information in this Annual Report. The selected financial data presented below is derived from our Consolidated Financial Statements, which are prepared in accordance with International Financial Reporting Standards (IFRS) as issued by the International Accounting Standards Board (IASB). See Item 18. No dividends have been declared by the Corporation.
|
Year ended December 31
|
|||||||||||||||||||
|
2014
|
2015
|
2016
|
2017
|
2018
|
|||||||||||||||
|
(restated)*
|
(restated)*
|
||||||||||||||||||
|
(in millions, except per share amounts)
|
|||||||||||||||||||
|
Consolidated Statements of Operations Data
(1)
:
|
|||||||||||||||||||
|
Revenue
(1)
|
$
|
5,631.3
|
|
$
|
5,639.2
|
|
$
|
6,046.6
|
|
$
|
6,142.7
|
|
$
|
6,633.2
|
|
||||
|
Cost of sales
(1)
|
5,225.9
|
|
5,248.1
|
|
5,617.0
|
|
5,724.2
|
|
6,202.7
|
|
|||||||||
|
Gross profit
(1)
|
405.4
|
|
391.1
|
|
429.6
|
|
418.5
|
|
430.5
|
|
|||||||||
|
Selling, general and administrative expenses (SG&A), including research and development
(2)
|
230.0
|
|
230.7
|
|
236.0
|
|
229.4
|
|
247.8
|
|
|||||||||
|
Amortization of intangible assets
|
10.6
|
|
9.2
|
|
9.4
|
|
8.9
|
|
15.4
|
|
|||||||||
|
Other charges
(3)
|
37.1
|
|
35.8
|
|
25.5
|
|
37.0
|
|
61.0
|
|
|||||||||
|
Earnings from operations
(1)
|
127.7
|
|
115.4
|
|
158.7
|
|
143.2
|
|
106.3
|
|
|||||||||
|
Refund interest income
(4)
|
—
|
—
|
(14.3
|
)
|
—
|
|
—
|
|
|||||||||||
|
Finance costs
(5)
|
3.1
|
|
6.3
|
|
10.0
|
|
10.1
|
|
24.4
|
|
|||||||||
|
Earnings before income taxes
(1)
|
124.6
|
|
109.1
|
|
163.0
|
|
133.1
|
|
81.9
|
|
|||||||||
|
Income tax expense (recovery)
(1)
|
16.4
|
|
42.2
|
|
24.7
|
|
27.6
|
|
(17.0
|
)
|
|||||||||
|
Net earnings
(1)
|
$
|
108.2
|
|
$
|
66.9
|
|
$
|
138.3
|
|
$
|
105.5
|
|
$
|
98.9
|
|
||||
|
Other Financial Data
(1)
:
|
|||||||||||||||||||
|
Basic earnings per share
(1)
|
$
|
0.61
|
|
$
|
0.43
|
|
$
|
0.98
|
|
$
|
0.74
|
|
$
|
0.71
|
|
||||
|
Diluted earnings per share
(1)
|
$
|
0.60
|
|
$
|
0.42
|
|
$
|
0.96
|
|
$
|
0.73
|
|
$
|
0.70
|
|
||||
|
Property, plant and equipment and computer software cash expenditures
|
$
|
61.3
|
|
$
|
62.8
|
|
$
|
64.1
|
|
$
|
102.6
|
|
$
|
82.2
|
|
||||
|
Shares used in computing per share amounts (in millions):
|
|||||||||||||||||||
|
Basic
|
178.4
|
|
155.8
|
|
141.8
|
|
143.1
|
|
139.4
|
|
|||||||||
|
Diluted
|
180.4
|
|
157.9
|
|
143.9
|
|
145.2
|
|
140.6
|
|
|||||||||
5
|
As of December 31
|
|||||||||||||||||||
|
2014
|
2015
|
2016
|
2017
|
2018
|
|||||||||||||||
|
(restated)*
|
(restated)*
|
||||||||||||||||||
|
(in millions)
|
|||||||||||||||||||
|
Consolidated Balance Sheet Data
(1)
|
|||||||||||||||||||
|
Cash and cash equivalents
|
$
|
565.0
|
|
$
|
545.3
|
|
$
|
557.2
|
|
$
|
515.2
|
|
$
|
422.0
|
|
||||
|
Working capital
(1)(
6
)
|
1,049.9
|
|
990.6
|
|
1,121.5
|
|
1,210.1
|
|
1,203.2
|
|
|||||||||
|
Property, plant and equipment
|
312.4
|
|
314.6
|
|
302.7
|
|
323.9
|
|
365.3
|
|
|||||||||
|
Total assets
(1)
|
2,583.6
|
|
2,612.0
|
|
2,841.9
|
|
2,964.2
|
|
3,737.7
|
|
|||||||||
|
Borrowings under credit facility
(7)
|
—
|
262.5
|
|
227.5
|
|
187.5
|
|
757.3
|
|
||||||||||
|
Capital stock
|
2,609.5
|
|
2,093.9
|
|
2,048.2
|
|
2,048.3
|
|
1,954.1
|
|
|||||||||
|
Total equity
(1)
|
1,394.9
|
|
1,091.0
|
|
1,257.8
|
|
1,370.2
|
|
1,332.3
|
|
|||||||||
|
*
|
Financial information for 2016 and 2017 has been restated to reflect our January 1, 2018 adoption of IFRS 15. See footnote (1) below.
|
|
(1)
|
Changes in accounting policies:
|
Effective January 1, 2014, we adopted IFRIC Interpretation 21, Levies, which clarified when the liability for certain levies should be recognized and required retroactive adoption, and IAS 32, Financial Instruments — Presentation (revised), which clarified the requirements for offsetting financial assets and liabilities. The adoption of these standards did not have a material impact on our Consolidated Financial Statements.
Effective January 1, 2018, we adopted IFRS 15, Revenue from Contracts with Customers, which established a comprehensive framework for determining whether, how much, and when revenue should be recognized. In connection with the adoption of this standard, we elected to apply the retrospective method, and recognized the transitional adjustments through equity at January 1, 2016, the start of the first comparative reporting period included in our Consolidated Financial Statements in Item 18 of this Annual Report. The new standard changed the timing of our revenue recognition for a significant portion of our business, resulting in the recognition of revenue for certain customer contracts earlier than under the previous revenue recognition rules (which was generally upon delivery of final products to our end customer). The new standard has materially impacted our Consolidated Financial Statements, primarily in relation to inventory and accounts receivable balances. See note 2 to the Consolidated Financial Statements in Item 18 for the transitional impacts of adopting IFRS 15.
Effective January 1, 2018, we adopted IFRS 9, Financial Instruments, which introduced a new model for the classification and measurement of financial assets, a single expected credit loss (ECL) model for the measurement of the impairment of financial assets, and a new model for hedge accounting that is aligned with a company's risk management activities. In connection with the adoption of IFRS 9, we also complied with the transitional rules of IAS 1, Presentation of Financial Statements and IFRS 7, Financial Instruments Disclosures. In accordance with the transitional provisions of the rule, we have applied the changes of IFRS 9 retrospectively, with the exception of the hedge accounting policies, which we have applied prospectively as required by the standard. The adoption of this standard did not result in any adjustments to our Consolidated Financial Statements.
|
(2)
|
SG&A expenses include research and development costs of
$28.8 million
in
2018
,
$26.2 million
in
2017
,
$24.9 million
in
2016
, $23.2 million in
2015
, and $19.7 million in
2014
.
|
|
(3)
|
Other charges in
2014
totaled
$37.1
million, comprised primarily of: (a) a non-cash impairment of $40.8 million against the goodwill of our semiconductor business resulting from our annual impairment assessment; and (b) a non-cash settlement loss of $6.4 million relating to the purchase of annuities for the defined benefit component of a certain pension plan, offset in part by: (i) an $8.0 million recovery of damages resulting from the settlement of class action lawsuits in which we were a plaintiff; and (ii) a $2.1 million net reversal of restructuring charges.
|
Other charges in
2015
totaled
$35.8
million, comprised primarily of: (a) $23.9 million in restructuring charges, and (b) an aggregate non-cash impairment of $12.2 million against the property, plant and equipment of our CGUs (defined herein) in Japan and Spain (recorded in the fourth quarter of 2015).
Other charges in
2016
totaled
$25.5 million
, comprised of: (a)
$31.9 million
in restructuring charges, offset in part by (b) $6.4 million, consisting primarily of net legal recoveries. See note 16 to the Consolidated Financial Statements in Item 18.
Other charges in
2017
totaled
$37.0 million
, comprised of: (a)
$28.9 million
in restructuring charges, (b) a
$1.9 million
non-cash loss incurred on the purchase of pension annuities, (c)
$1.6 million
in transition costs relating to the relocation of our Toronto manufacturing operations, and (d)
$4.6 million
, primarily for acquisition-related costs and activities. See note 16 to the Consolidated Financial Statements in Item 18.
Other charges in
2018
totaled
$61.0 million
, comprised of: (a)
$35.4 million
in restructuring charges pertaining to our cost efficiency initiative, (b)
$13.2 million
in transition costs relating to the relocation of our Toronto manufacturing operations and corporate headquarters, (c)
$1.2 million
of accelerated amortization of unamortized deferred financing costs and (d)
$11.2 million
, primarily for acquisition-related costs and activities. See note 16 to the Consolidated Financial Statements in Item 18.
|
(4)
|
Refund interest income represents the refund of interest on cash then-held on account with tax authorities in connection with the resolution of certain previously-disputed tax matters in 2016. See notes 17 and 20 to the Consolidated Financial Statements in Item 18.
|
6
|
(5)
|
Finance costs are comprised primarily of interest expenses and fees related to our credit facility (including our term loans commencing in 2015), our interest rate swaps (commencing in 2018), our accounts receivable sales program, and a customer supplier financing program. See notes 5, 12 and 17 to the Consolidated Financial Statements in Item 18.
|
|
(6)
|
Calculated as current assets less current liabilities.
|
|
(7)
|
Borrowings under our credit facility do not include our finance lease obligations.
|
B. Capitalization and Indebtedness
Not applicable.
C. Reasons for the Offer and Use of Proceeds
Not applicable.
D. Risk Factors
Any of the following risk factors, or any combination of them, could have a material adverse effect on our business, financial condition, and/or operating results. Our shareholders and prospective investors should carefully consider each of the following risks and all of the other information set forth in this Annual Report.
We are dependent on our customers' ability to compete and succeed in the marketplace with the products and services we provide.
Our operating results are highly dependent upon our customers' ability to compete and succeed in the marketplace with the services we provide and the products we manufacture. Factors that may adversely affect our customers include: rapid changes in technology, evolving industry standards, and short product life cycles; seasonal demand; our customers' failure to successfully market their products; a lack of widespread commercial acceptance of their products; supply chain issues; dramatic shifts in demand which may cause our customers to lose market share or exit businesses; and/or recessionary periods in our customers' markets. In addition, certain of our customers have experienced, and may in the future experience, severe revenue erosion, pricing, margin and cash flow pressures, and excess inventories that, in turn, have adversely affected (and in the future may adversely affect) our operating results. If technologies or standards supported by our customers' products and services or their business models become obsolete, fail to gain widespread acceptance or are canceled, our business would be adversely affected.
Demand patterns are volatile across our end markets, particularly in our CCS segment and our semiconductor business. Rapid shifts in technology, model obsolescence, commoditization of certain products, the emergence of new business models, shifting demand, including from traditional network infrastructures to highly virtualized and cloud-based environments, the prevalence of solid state or flash memory technology as a replacement for hard disk drives, as well as the proliferation of software-defined technologies enabling the disaggregation of software and hardware, increased competition, the oversupply of products, pricing pressures, and the volatility of the economy, all contribute to the complexity of managing our operations and fluctuations in our financial results. In our CCS segment, cloud-based service providers have increased their use of our products in recent periods. These customers and markets are cyclically different from our traditional original equipment manufacturer (OEM) customers, creating more volatility and unpredictability in our revenue patterns as we adjust to this shift, and additional challenges with respect to the management of our working capital requirements.
See
"
Our customers may be negatively affected by rapid technological changes, shifts in business strategy and/or the emergence of new business models, and new entrants/competition with disruptive products and/or services
"
below.
We are dependent on a limited number of customers and end markets. A decline in revenue from, or the loss of, any significant customer, could have a material adverse effect on our financial condition and operating results.
Our customers include OEMs, service providers (including cloud-based service providers) and other companies in a wide range of industries. We depend upon a small number of customers for a significant portion of our revenue. During each of 2016, 2017 and
2018
,
two
customers individually represented more than 10% of our total revenue, and our top 10 customers in 2018 represented 70% (
2017
— 71%; 2016 — 68%) of our total revenue. We also remain dependent upon revenue from our CCS segment (consisting of our Communications and Enterprise end markets), which represented 67% of our consolidated revenue in
2018
and 68% of our consolidated revenue in each of
2017
and
2016
. To reduce our reliance on any one customer or end market (including the concentration of our revenues in our CCS segment), we continue to target new customers and services, including a continued focus on the expansion of our ATS segment (which in 2018 consisted of our aerospace and defense, industrial, smart
7
energy, healthtech, and capital equipment businesses), including through acquisitions. However, see
"
We may encounter difficulties expanding or consolidating our operations or introducing new competencies or new offerings, which could adversely affect our operating results
"
below. Notwithstanding our expansion efforts, we remain dependent on our CCS segment for a large portion of our revenue, which is subject to the various factors described above and continues to experience slower growth rates, increased pricing pressures and a highly competitive marketplace, including from original design manufacturers (ODMs).
A decline in revenue from, or the loss of, any significant customer could have a material adverse effect on our financial condition and operating results. We cannot assure the replacement of completed, delayed, cancelled or reduced orders with new business. In addition, the ramping of new programs can range from several months to over a year before production starts, and often requires significant up-front investments and increased working capital. During this start-up period, these programs may generate losses or may not achieve the expected financial performance due to production ramp inefficiencies, lower than expected volume, or delays in ramping to volume. Our customers may significantly change these programs, or even cancel them altogether, due to decreases in their end-market demand or in the actual or anticipated success of their products in the marketplace.
There can be no assurance that our efforts to secure new customers and programs in our traditional or new markets, including through acquisitions, will succeed in reducing our customer concentration. Acquisitions are also subject to integration risk, and revenues and margins could be lower than we anticipate. Failure to secure business from existing or new customers in any of our end markets would adversely impact our operating results.
Any of the foregoing may adversely affect our margins, cash flow, and our ability to grow our revenue, and may increase the variability of our operating results from period to period. See
"
Our revenue and operating results may vary significantly from period to period
"
below.
A change in the mix of customers and/or the types of products or services we provide could have a material adverse effect on our financial condition and operating results.
The mix of our customers and the type of products or services we provide may have an impact on our financial condition and operating results from period-to-period. For example, in 2018, a higher concentration of fulfillment services (that contribute significantly lower gross profit than our historical full-service traditional EMS programs), as well as adverse market conditions (mostly significantly in our CCS segment and our semiconductor business), negatively impacted our margins and operating results for such year. As a result of the high concentration of our business in our CCS segment (67% of total revenue in 2018), we expect this demand shift, as well as competitive pressures and aggressive pricing, to continue to negatively impact this segment in future periods to the extent we cannot offset such impacts with increases in higher-margin services, cost reductions or otherwise. In addition, certain customer agreements in both of our segments require us to provide specific price reductions over the contract term, which may also negatively impact our financial condition and operating results if they cannot be offset. We also expect the weaker semiconductor demand environment that we experienced during the second half of 2018 to continue throughout 2019. See Item 5, "Operating and Financial Review and Prospects — Management's Discussion and Analysis of Financial Condition and Results of Operations — Overview —
Celestica's business
" for a discussion of a comprehensive review of our CCS business intended to improve operating results in this segment, as well as actions we are taking to address the current semiconductor demand environment.
We operate in an industry comprised of numerous competitors and aggressive pricing dynamics.
We operate in a highly competitive industry. Our competitors include Benchmark Electronics, Inc., Flex Ltd., Hon Hai Precision Industry Co., Ltd., Jabil Circuit, Inc., Plexus Corp., and Sanmina Corporation, as well as ODMs and smaller EMS companies that often have a regional, product, service or industry-specific focus. In recent years, we have expanded our joint design and manufacturing (JDM) offering, which encompasses advanced technology design solutions that customers can tailor to their specific platform applications. We also
face increased competition from ODMs, who also specialize in providing internally designed products and manufacturing services, as well as component and sub-system suppliers, distributors and/or systems integrators. As part of our JDM offering, we also provide complete hardware platform solutions, which may compete with those of our customers. Offering products or services to customers that compete with the offerings of other customers may negatively impact our relationship with, or result in a loss of business from, such other customers. We face indirect competition from the manufacturing operations of our current and prospective customers who may choose to manufacture products internally rather than outsource to EMS providers, or who may decide to insource previously outsourced business, particularly where internal excess capacity exists. In addition to the foregoing, we may face competition from distribution and logistics providers expanding their services across the supply chain.
The competitive environment in our industry is intense and aggressive pricing is a common business dynamic. Some of our competitors have greater scale and offer a broader range of services. While we have increased our capacity in lower-cost regions to reduce our costs, these regions may not provide the same operational benefits that they have in the past due to rising costs and a continued aggressive pricing environment. Additionally, our current or potential competitors may: increase or shift their presence
8
in new lower-cost regions to try to offset continuous competitive pressure and increasing labor costs or to secure new business; develop or acquire services comparable or superior to ours; consolidate to form larger competitors; or adapt more quickly than we do to new technologies, evolving industry trends and changing customer requirements. In addition, our competitors may be more effective than we are in investing in IT solutions to differentiate their offerings to capture a larger share of the market. Some of our competitors have increased their vertical capabilities by manufacturing modules or components used in the products they assemble, such as metal or plastic parts and enclosures, backplanes, circuit boards, cabling and related products. Although we have also expanded our capabilities, including through our acquisitions of Lorenz, Inc. and Suntek Manufacturing Technologies, SA de CV, collectively known as Karel Manufacturing (Karel), Atrenne Integrated Solutions, Inc. (Atrenne) and Impakt Holdings, LLC (Impakt), as well as recent "operate-in-place" arrangements, our competitors' expansion efforts may be more successful than ours. Competition may cause pricing pressures, reduced profits or a loss of market share (for example, from program losses or customer disengagements). We may not be able to compete successfully against our current and future competitors. See "Overview —
Celestica's business"
and "Recent developments —
Segment Reorganization and Segment Environment"
in Item 5, "Operating and Financial Review and Prospects — Management's Discussion and Analysis of Financial Condition and Results of Operations.
We are dependent on third parties to supply certain materials, and our results can be negatively affected by the availability and cost of such materials.
The purchase of materials and electronic components represents a significant portion of our costs. We rely on third parties to provide such items. Although our customers often dictate the materials to be used in their products, materials shortages or other issues affecting timely access to these materials (which often occur in our industry) may impact our ability to successfully complete a program. A delay or interruption in supply from a component supplier, especially for single-sourced components, could have a significant impact on our operations and on our customers if we are unable to deliver finished products in a timely manner. If the amount we are required to pay for equipment and supplies exceeds what we have estimated, especially in a fixed price contract, we may suffer losses on these contracts. If a supplier or manufacturer fails to provide supplies or equipment as required under a contract for any reason, we may be required to source these items from other third parties on a delayed basis or on less favorable terms, which could impact our profitability. Additionally, quality or reliability issues at any of our component providers, or financial difficulties that affect their production and ability to supply us with components, could halt or delay production of a customer's product, or result in claims against us for failure to meet required customer specifications, which could materially adversely impact our operating results. Shortages may also result in our carrying higher levels of inventory and extended lead-times, or result in increased component prices, which may require price increases in the products and services that we provide. Any increase in our costs that we are unable to recover would negatively impact our margins and operating results. Changes in forecasted volumes or in our customers' requirements can also negatively affect our ability to obtain components and adversely impact our operating results. We continue to experience materials constraints from certain suppliers in both of our segments, due in part to industry-wide shortages for certain electronic components. These shortages caused delays in the production of customer products in both of our segments, and required us to carry higher than expected levels of inventory, commencing in 2017 and continuing throughout 2018. The shortages, in combination with volatile market demand, negatively impacted our margins for each such year. Although we expect these materials constraints and resulting adverse impacts to continue in the near term, we have begun to see improvements in the availability of certain previously constrained items. Nonetheless, only minor improvements in supplier lead times are currently expected.
We may encounter difficulties expanding or consolidating our operations or introducing new competencies or new offerings, which could adversely affect our operating results.
As we expand our business, open new sites, enter into new markets, products and technologies, invest in research, design and development, acquire new businesses or capabilities, transfer business from one location to another location within our network, consolidate certain operations, and/or introduce new business models or programs, we may encounter difficulties that result in higher than expected costs associated with such activities. Potential difficulties related to such activities include our ability: to manage growth effectively; to maintain existing business relationships during periods of transition; to anticipate disruptions in our operations that may impact our ability to deliver to customers on time, produce quality products and ensure overall customer satisfaction; and to respond rapidly to changes in customer demand or volumes.
We may also encounter difficulties in ramping and executing new programs. We may require significant investments to support these new programs, including increased working capital requirements, and may generate lower margins or losses during and/or following the ramp period. For example, we incurred higher costs in 2017 and 2018 with respect to ramping new programs, including aerospace and defense programs, as well as programs that required the establishment of infrastructures in multiple jurisdictions. We may incur similar additional ramping costs as we further expand our ATS segment and integrate new acquisitions. There can be no assurance that our increased investments will benefit us or result in business growth. As we pursue opportunities in new markets or technologies, we may encounter challenges due to our limited knowledge or experience in these areas. In addition, the success of new business models or programs depends on a number of factors including: understanding the new business or markets; timely and successful product development; market acceptance; the effective management of purchase
9
commitments and inventory levels in line with anticipated demand; the development or acquisition of appropriate intellectual property and capital investments, to the extent required; the availability of materials in adequate quantities and at appropriate costs to meet anticipated demand; and the risk that new offerings may have quality or other defects in the early stages of introduction. Any of these factors could prevent us from realizing the anticipated benefits of growth in new markets or technologies, which could materially adversely affect our business and operating results.
For example, we made the decision in the fourth quarter of 2016 to exit the solar panel manufacturing business. In connection therewith, we recorded $21.2 million in restructuring charges in the fourth quarter of 2016 to close our solar panel manufacturing operations at our two locations, including $19.0 million in impairment charges to write down the carrying value of our solar panel manufacturing equipment to then-recoverable amounts. During 2017, we incurred operating losses related to the wind-down of our solar panel manufacturing operations, and we recorded a net aggregate of $5.2 million in additional provisions/impairment charges to write down our inventory, accounts receivable and solar panel manufacturing equipment to recoverable amounts.
As part of our strategy to enhance our end-to-end service offerings, we intend to continue to expand our design and engineering capabilities (including our JDM capabilities). Providing these services may expose us to different or greater potential risks than those we face when providing our manufacturing services. Our design services offerings require significant investments in research and development, technology licensing, testing and tooling equipment, patent applications and talent recruitment. Our margins may be adversely impacted if we incur higher than expected investment costs, or if our customers are not satisfied with our progress, or do not approve our completed designs. In addition, our design activities often require the purchase of inventory for initial production runs before we have a firm purchase commitment from a customer. Furthermore, we may face increased competition with respect to this offering from ODMs and other companies providing similar services, including our own customers. As we anticipate continuing to grow this business, costs required to support our design and engineering capabilities may adversely affect our profitability. In addition, some of the products we design and develop must satisfy safety and regulatory standards and some must receive government certifications. If we fail to obtain these approvals or certifications on a timely basis, we would be unable to sell these products, which would harm our revenues, profitability and reputation.
There can be no assurance that our expansion into new markets or new business will be successful, or that we will achieve the anticipated benefits.
There may be problems with the products we design or manufacture that could result in liability/warranty claims against us, which may reduce demand for our services, damage our reputation, and/or cause us to incur significant costs.
In most of our sales contracts, we provide warranties against defects or deficiencies in our products, services, or designs. The extent of the warranties varies by customer, and warranties generally range from one to three years. However, the warranty period for our JDM designs, and our solar panel products (which remain in force notwithstanding our exit from this business), are generally longer. We generally design and manufacture products to our customers' specifications, many of which are highly complex, and include products for industries, such as healthcare, aerospace and defense, that tend to have higher risk profiles. The customized design solutions that form a part of our JDM offering also subject us to the risk of liability claims if defects are discovered or alleged. Despite our quality control and quality assurance efforts, problems may occur, or may be alleged, in or resulting from the design and/or manufacturing of these products. Whether or not we are responsible, problems in the products we design and/or manufacture, or in products which include components we manufacture, whether real or alleged, whether caused by faulty customer specifications, the design or manufacturing processes or a component defect, may result in increased costs to us, as well as delayed shipments to our customers, and/or reduced or canceled customer orders. These potential claims may include damages for the recall of a product and/or injury to person or property, including consequential and/or punitive damages.
Even if customers or third parties, such as component suppliers, are responsible for defects, they may not, or may not be able to, assume responsibility for any such costs or required payments to us. While we seek to insure against many of these risks, insurance coverage may be inadequate, not cost effective or unavailable, either in general or for particular types of products or issues.
As we expand our service offerings (including our JDM offerings) and pursue business in new end markets, our warranty obligations are likely to increase and we may not be successful in pricing our products to appropriately cover our warranty costs. A successful claim for damages arising from defects or deficiencies for which we are not adequately insured, and for which indemnification from a third party is not timely (or otherwise) available, could have a material adverse effect on our reputation and/or our operating results and financial condition.
We may encounter integration and other significant challenges with respect to our acquisitions and strategic transactions which could adversely affect our operating results.
We intend to continue to expand our capabilities and presence in new end markets, some of which have (and may in the future) occur through acquisitions. These transactions may involve acquisitions of selected assets or entire companies. We have also completed numerous strategic transactions, including multi-year "operate-in-place" arrangements, where we manage certain
10
production, assembly or other services for customers directly from their locations, acquire their inventory, equipment and/or other assets, hire their employees, and lease or acquire their manufacturing sites. Potential challenges related to these acquisitions and transactions include: integrating acquired operations, systems and businesses (which may include transferring production from acquired operations to our existing network, or downsizing or closing acquired locations, in each case to obtain anticipated operational synergies); meeting customers' expectations as to volume, product quality and timeliness; supporting legacy contractual obligations; retaining customer, supplier, employee or other business relationships of acquired operations; addressing unforeseen liabilities of acquired businesses; limited experience with new technologies and markets; failure to realize anticipated benefits, such as cost savings and revenue enhancements; failure to achieve anticipated business volumes or operating margins; valuation methodologies not accurately capturing the value of the acquired business; the effects of diverting management's attention from day-to-day operations to matters involving the integration of acquired businesses; incurring potentially substantial transaction costs associated with these transactions; increased burdens on our staff and on our administrative, internal control and operating systems, which may hinder our legal and regulatory compliance activities; overpayment for an acquisition; and potential impairments resulting from post-acquisition deterioration in, or reduced benefit from, an acquired business. While we often obtain indemnification rights from the sellers of acquired businesses, such rights may be difficult to enforce, the losses may exceed any dedicated escrow funds, and the indemnitors may not have the ability to financially support the indemnity. Any of these factors may prevent us from realizing the anticipated benefits of an acquisition, including additional revenue, operational synergies and economies of scale. Any delay or failure to realize the anticipated benefits of acquisitions may adversely affect our business and operating results and may require us to write-down the carrying value of any related goodwill and intangible assets in periods subsequent to the acquisitions.
In addition, there is no assurance that we will find suitable new acquisition targets, that we will be able to consummate any such transactions on terms and conditions acceptable to us, or that we will be able to fund any such acquisitions with existing cash resources or through financing provided by external lenders. We may require additional capital to grow our business through acquisitions. We may be unable to obtain additional capital if and when required on terms acceptable to us or at all. We may pursue sources of additional capital through various financing transactions or arrangements, including debt financing, equity financing or other means. We may not be successful in consummating suitable financing transactions in the time period required or at all, and we may not be able to obtain the capital we require by other means. If the amount of capital we are able to raise from financing activities, together with the cash from our operations, is not sufficient to consummate an acquisition we have deemed desirable, we may not be able to implement our intended business plan, which could adversely affect our business, results of operations and financial condition. See "
We have incurred substantial third-party debt in recent periods, which has increased our debt service requirements, reduced our ability to fund future acquisitions and/or to respond to unexpected capital requirements, and may have other adverse impacts on our business" and "We may use cash on hand, issue debt or equity securities, and/or incur additional third-party debt (or any combination thereof) to complete future acquisitions or otherwise fund our operations, which may adversely affect our liquidity, credit ratings, financial condition and/or results of operations
"
below.
Acquisitions may also involve businesses we are not familiar with, and expose us to additional business risks that are different than those we have traditionally experienced or anticipated at the time of acquisition. In addition, we may incur costs to support our pursuit of acquisitions and/or other strategic opportunities, which may not result in the consummation of any such transactions, and are expected to continue to adversely impact our operating results.
We have incurred substantial third-party debt in recent periods, which has increased our debt service requirements, reduced our ability to fund future acquisitions and/or to respond to unexpected capital requirements, and may have other adverse impacts on our business.
We have recently incurred an aggregate of approximately $757.3 million of debt under our credit facility to fund our acquisitions of Atrenne and Impakt, and for general working capital purposes. As a result, our debt leverage and debt service requirements have each increased. See Item 5, "Operating and Financial Review and Prospects — Management's Discussion and Analysis of Financial Condition and Results of Operations — Liquidity — Cash requirements." We do not believe that the current aggregate amounts outstanding under our credit facility have had (or will have) a significant adverse impact on our liquidity, our results of operations or financial condition. However, our increased indebtedness, together with the mandatory prepayment provisions of our credit facility, have reduced our ability to fund future acquisitions and/or to respond to unexpected capital requirements. Such increases may also: require us to pursue additional term financing for potential investments, which may not be available on acceptable terms or at all; limit our ability to obtain additional financing for working capital, business activities, and other general corporate requirements; limit our ability to refinance our indebtedness on terms acceptable to us or at all; limit our flexibility to plan for and adjust to changing business and market conditions, increase our vulnerability to general adverse economic and industry conditions; and will require us to dedicate a portion of our cash flow to make interest and principal payments on such indebtedness, thereby limiting the availability of our cash flow for other purposes. In addition, such increased indebtedness could have a variety of other adverse effects, including: (i) default and foreclosure on our assets if we have insufficient funds to repay the debt obligations; (ii) acceleration of such indebtedness or cross-defaults if we breach financial or other covenants under
11
applicable debt agreements; (iii) increased vulnerability to adverse changes in competitive conditions or government regulation; and (iv) other disadvantages compared to our competitors who have less debt.
In addition, our credit ratings impact the cost and availability of future borrowings and, accordingly, our cost of capital. Our ratings reflect the opinions of the ratings agencies of our financial strength, operating performance and ability to meet our debt obligations. There can be no assurance that we will achieve a particular rating or maintain a particular rating in the future, which could place us at a competitive disadvantage compared to our competitors and prevent us from taking actions that could benefit us in the long term. See "
Our credit rating may be downgraded
" below. We may not be able to obtain financing arrangements on acceptable terms or in amounts sufficient to meet our needs in the future, which could harm our ability to grow our business, internally or through acquisitions.
Inherent challenges in managing unanticipated changes in customer demand may impact our planning, supply chain execution and manufacturing, and may adversely affect our operating performance and results.
Our customers expect rapid response times to meet changes in their volume requirements. Although we generally enter into master supply agreements with our customers, the level of business to be transacted under those agreements is not guaranteed. Instead, we bid on a program-by-program basis and typically receive customer purchase orders for specific quantities and timing of products. Most of our customers typically do not commit to production schedules for more than 30 to 90 days in advance and we often experience volatility in customer orders and inventory levels. There can be no assurance that present or future customers will not terminate their manufacturing or service arrangements with us, or that they will not significantly change, reduce or delay the volume of manufacturing or other services they order from us, any of which would adversely affect our operating results
.
Customers may also shift business to our competitors, in-source programs, or adjust the concentration of their supplier base. The global economic environment, political pressures, negative sentiment from our customers' customers or changes made by local governments (such as tax benefits or income tax rate reductions) may also impact our customers' business decisions. These and other factors could adversely affect the rate of outsourcing generally, or to EMS providers like Celestica. Additionally, a significant portion of our revenue can occur in the last month of the quarter, and purchase orders may be subject to change or cancellation, all of which affect our operating results when they occur. In the second half of 2018, we experienced weaker-than-expected demand in our capital equipment business, in particular from our semiconductor customers, which negatively impacted our operating results in 2018. Although we expect these adverse market conditions to continue throughout 2019, we cannot predict their exact impact.
Accordingly, our forecasts of customer orders may be inaccurate, and may make it difficult to order appropriate levels of materials, schedule production, and maximize utilization of our manufacturing capacity and resources.
Our customers may change their forecasts, production quantities or product type requirements, or may accelerate, delay or cancel production quantities for various reasons. When customers change production volumes or request different products to be manufactured from those in their original forecast, the unavailability of components and materials for such changes could also adversely impact our revenue and working capital performance. See
"
We are dependent on third parties to supply certain materials, and our results can be negatively affected by the availability and cost of such materials"
above.
Further, to guarantee continuity of supply for many of our customers, we are required to manufacture and warehouse specified quantities of finished goods. The uncertainty of demand in our customers' end markets, intense competition in our customers' industries and general order volume volatility may result in customers delaying or canceling the delivery of products we manufacture for them or placing purchase orders for lower volumes of products than previously anticipated.
Order cancellations, or changes or delays in production, may result in higher than expected levels of inventory, which could in turn have a material adverse impact on our operating results and working capital performance. Although we required additional inventory to support new program ramps during 2017 and 2018, we also experienced demand volatility and significant product mix changes in our CCS segment during each such year, including late changes from certain customers, as well as materials constraints from suppliers, all of which resulted in us carrying higher than expected levels of inventory at each of December 31, 2017 and 2018. We may not be able to return or re-sell this inventory, or we may be required to hold the inventory for a period of time, any of which may result in our having to record additional reserves for the inventory if it becomes excess or obsolete. For example, unprecedented declines in the pricing of solar panels, a slowing of demand, and related deferred and cancelled orders from customers resulted in us recording aggregate net inventory provisions of $12.0 million in 2016, primarily to write down our solar panel inventory to applicable market prices. In addition, increased levels of overall aged inventory in 2018 compared to 2017 resulted in approximately $10 million in higher inventory provisions in 2018. Order cancellations and delays could also lower our asset utilization, resulting in higher levels of unproductive assets, lower inventory turns, and lower margins.
Our customers may be negatively affected by rapid technological changes, shifts in business strategy and/or the emergence of new business models, and new entrants/competition with disruptive products and/or services.
Many of our customers compete in markets that are characterized by rapidly changing technology, evolving industry standards, continuous improvements in products and services, commoditization of certain products, changes in preferences by end
12
customers or other changes in demand, and the emergence of new entrants or competitors with disruptive products, services, or new business models that deemphasize traditional OEM distribution channels. These conditions frequently result in shorter product lifecycles and may lead to shifts in our customers' business strategies. Our success will depend on the success achieved by our customers in developing, marketing and selling their products.
For example, declines in end-market demand for customer-specific proprietary systems in favor of open systems with standardized technologies has had an adverse impact on our customers, and consequently, our business. Other examples are described in
"
We are dependent on our customers' ability to compete and succeed in the marketplace with our products and services"
above. The highly competitive nature of our customers' products and services could also drive further consolidation among OEMs, and result in product line consolidation that could adversely impact our customer relationships and our revenue.
Consolidation within the EMS industry, or among our customers or suppliers, may adversely affect our business relationships or the volume of business we conduct with our customers.
Our customers, competitors and/or suppliers may be subject to consolidation. Increasing consolidation in industries that utilize our services may occur as companies combine to achieve economies of scale and other synergies, which could result in an increase in excess manufacturing capacity as companies seek to divest manufacturing operations or eliminate product lines. Excess manufacturing capacity may increase pricing and competitive pressures in our industry as a whole and for us in particular. Consolidation could also result in an increasing number of very large companies offering products in multiple industries. The significant purchasing power and market power of these large companies could increase pricing and competitive pressures for us. If one of our customers is acquired by another company that does not rely on us to provide services, has its own production services, or relies on another provider of similar services, we may lose that customer's business. Such consolidation may reduce the number of customers from which we generate a significant percentage of our revenue, and further expose us to increased risks relating to our dependence on a small number of customers. Any of the foregoing results of industry consolidation could adversely affect our business. Consolidation among our competitors may create a competitive advantage over us, which may also result in a loss of business and revenue if customers shift their production. Such consolidation may also result in pricing pressures, which could negatively impact our profit margins. Changes in OEM strategies, including the divestiture or exit from certain of their businesses, may also result in a loss of business for us.
Any failure to comply with customer-driven policies and standards, and third party certification requirements, including those related to social responsibility, could adversely affect our business and reputation.
In addition to government regulations and industry standards, our customers may require us to comply with their own social responsibility, conflict minerals, quality or other business policies or standards, which may be more restrictive than current laws and regulations and our pre-existing policies, before they commence, or continue, doing business with us. Such policies or standards may be customer-driven, established by the industries in which we operate, or imposed by third party organizations. For example, we are a member of the Responsible Business Alliance (RBA), formerly known as the Electronic Industry Citizenship Coalition. The RBA is a non-profit coalition of electronics companies that, among other things, establishes standards for its members in responsible and ethical practices in the areas of labor, environmental compliance, employee health and safety, ethics and social responsibility. Our compliance with these policies, standards and third-party certification requirements could be costly, and our failure to comply could adversely affect our operations, customer relationships, reputation and profitability.
Challenges associated with new customers or programs, or the provision of new services, could adversely affect our operations and financial results.
In determining whether to pursue a potential new customer, program or service, we evaluate whether it fits with our value proposition as well as its potential end-market success. Where we proceed, our goal is to ensure that our terms of engagement appropriately reflect anticipated costs, risks and rewards. The failure to make prudent engagement decisions or to establish appropriate contractual terms could adversely affect our profitability and margins.
There are also risks associated with the timing and ultimate realization of anticipated revenue from a new program or service. Certain new programs or services require us to devote significant capital and personnel to new technologies and competencies. We may not meet customer expectations, which could damage our relationships with such customers and impact our ability to timely deliver conforming products or services. The success of new programs may also depend heavily on factors including product reliability, market acceptance, regulatory approvals and/or economic conditions. Any failure to meet expectations on these factors could adversely affect our results of operations.
13
We have incurred significant restructuring charges in recent periods, and expect to incur further significant restructuring charges during 2019 in connection with our cost efficiency initiative (CEI); we may not achieve some or all of the expected benefits from our CEI and other restructuring activities, these activities may adversely affect our business, and we may implement additional restructuring actions subsequent to the completion of our CEI.
We perform ongoing evaluations of our business, operational efficiency and cost structure, and implement restructuring actions as we deem necessary. We are currently implementing restructuring actions (which commenced in the fourth quarter of 2017) under our CEI, including actions related to our CCS segment portfolio review and in response to the demand environment in our capital equipment business. We estimate that we will incur aggregate restructuring charges under the CEI within the previously disclosed range of between $50.0 million and $75.0 million (consisting primarily of cash charges), and that such actions will continue through the end of 2019. See Item 5, "Operating and Financial Review and Prospects — Management's Discussion and Analysis of Financial Condition and Results of Operations — Operating results — Other charges." Implementation of our CEI may be costly and disruptive to our business, and we may not be able to achieve the cost savings and benefits that we anticipate in connection therewith. We may not be able to retain or expand existing business due to execution issues relating to anticipated headcount reductions, plant closures or product/service transfers, and we may incur higher operating expenses during the periods of transition. Additionally, restructuring actions related to the CEI may result in a loss of continuity and accumulated knowledge in our workforce and related operational inefficiencies, as well as negative publicity. Headcount reductions can also have a negative impact on morale and our ability to attract and hire new qualified personnel in the future. Our CEI is expected to require a significant amount of management and other employees’ time and focus, which may divert attention from operating and growing our business.
We recorded restructuring charges of $35.4 million in 2018, $28.9 million in 2017 and $31.9 million in 2016. See Item 5, "Operating and Financial Review and Prospects — Management's Discussion and Analysis of Financial Condition and Results of Operations — Operating results —
Other charges
" for detail.
Any failure to achieve some or all of the expected benefits of our CEI or any other restructuring activities, including any delay in implementing planned related restructuring actions, may have a material adverse effect on our competitive position and operating results. In addition, we may implement additional future restructuring actions or divestitures as a result of changes in our business, the marketplace and/or our exit from less profitable, under-performing, non-core or non-strategic operations.
We have incurred significant impairment charges and operating losses in recent periods, and may incur such charges and losses in future periods.
We have recorded charges in recent periods relating to the impairment of property, plant and equipment, goodwill and other intangible assets, and have incurred operating losses for certain of our businesses (including operating losses in 2017 resulting from the wind-down of our solar panel manufacturing business, and an operating loss in our semiconductor capital equipment business in the fourth quarter of 2018). These amounts have varied from period to period.
We evaluate the recoverability of the carrying amount of our goodwill, intangible assets, and property, plant and equipment on an ongoing basis, and we may incur impairment charges, which could be substantial and could adversely affect our financial results. Impairment assessments inherently involve judgment as to assumptions about expected future cash flows and the impact of market conditions on those assumptions. Future events and changing market conditions may impact our assumptions as to prices, costs, or other factors that may result in changes in our estimates of future cash flows. Factors that might reduce the recoverable amount of goodwill, intangible assets, and property, plant and equipment below their respective carrying values include declines in our stock price and market capitalization, reduced future cash flow estimates, and slower growth rates in any of our businesses. During 2016, we recorded impairment charges of $21.2 million (through restructuring charges), primarily to write down our solar panel manufacturing equipment to estimated recoverable amounts. During 2017, we recorded net impairment charges of $3.8 million (through restructuring charges) to further write down the carrying value of such solar panel manufacturing equipment based on executed sale agreements (such equipment has all been sold). See notes 8, 9 and 16(a) to the Consolidated Financial Statements in Item 18.
Sustained market price decreases, demand softness, and/or failure to realize future revenue at an appropriate profit margin in any cash generating unit (CGU) could negatively impact our operating results, including restructuring actions and/or impairment losses for such CGU, in future periods.
We continue to operate in an uncertain global economic and political environment.
Concerns over global economic conditions and geopolitical issues, energy costs, inflation, the availability and cost of credit, and the European, Asian and the U.S. financial markets have contributed to increased global economic and political uncertainty. Brexit, the current U.S. administration, and tensions between the U.S. and North Korea, China, Russia and/or other countries have contributed to such uncertainty. See
"Our operations could be adversely affected by global or local events outside our control" and "Policies or legislation proposed or instituted by the current U.S. administration could have a material adverse effect on our business, results of operations and financial condition"
below. Changes in policies by the U.S. or other governments could
14
negatively affect our operating results due to changes in duties, tariffs or taxes, or limitations on currency or fund transfers, as well as government-imposed restrictions on producing certain products in, or shipping them to, specific countries. See Item 5, "Operating and Financial Review and Prospects — Management's Discussion and Analysis of Financial Condition and Results of Operations — Overview —
Overview of the business environment.
" Uncertain global economies have adversely impacted, and may continue to unpredictably impact, currency exchange rates. See
"
We are exposed to translation and transaction risks associated with foreign currency exchange rate fluctuations; hedging instruments may not be effective in mitigating such risks
"
below. Financial market instability may result in lower returns on our financial investments, and lower values on some of our assets. Alternately, inflation may lead to higher costs for labor and materials and/or increase our costs of borrowing and raising capital. Uncertainty surrounding the global economic environment and geopolitical outlook may impact current and future demand for some of the products we manufacture or services we provide, the financial condition of our customers and/or suppliers, as well as the number and pace of customer consolidations. If any of the foregoing impacts the financial condition of our customers, they may delay payments to us or request extended payment terms, which could have an adverse effect on our financial condition and working capital. If any of the foregoing impacts the financial condition of our suppliers, this may have an adverse effect on our operations, financial condition and/or customer relationships.
We cannot predict the precise nature, extent, or duration of these economic or political conditions or if they will have any impact on our financial results. A deterioration in the economic environment may accelerate the effect of the various risk factors described in this Annual Report and could result in other unforeseen events that may adversely impact our business and financial condition.
Our operations could be adversely affected by global or local events outside our control.
Our operations and those of our customers, component suppliers and/or our logistics partners may be disrupted by global or local events outside our control, including: natural disasters and related disruptions; political instability; terrorism; armed conflict; labor or social unrest; criminal activity; disease or illness that affects local, national or international economies; unusually adverse weather conditions; and other risks present in the jurisdictions in which we, our customers, our suppliers and/or our logistics partners operate. These types of events could disrupt operations at one or more of our sites or those of our customers, component suppliers and/or our logistics partners. Any such disruption could lead to higher costs, supplier shortages, delays in the delivery of components to us, and/or our inability to provide finished products or services to our customers, any of which could adversely affect our operating results materially. We carry insurance to cover damage to our sites and interruptions to our operations, including those that may occur as a result of natural disasters, such as flooding, earthquakes or other events. Our insurance policies, however, are subject to deductibles, coverage limitations and exclusions, and may not provide adequate (or any) coverage should such events occur.
Increased international political volatility, including changes to previously accepted trading or other government policies or legislation in the United States and Europe, instability in parts of the Middle East, as well as the ongoing refugee crisis, anti-immigrant activities, social unrest and fears of terrorism, enhanced national security measures, armed conflicts, security issues at the U.S./Mexico border related to illegal immigration or criminal activities associated with illegal drug activities, labor or social unrest, strained international relations, including tensions between the United States and North Korea, China, Russia and/or other countries, and any related decline in consumer confidence arising from these and other factors may materially hinder our ability to conduct business, or may reduce demand for our products or services. Any escalation in these events or similar future events may disrupt our operations or those of our customers and suppliers and could adversely affect the availability of materials needed to manufacture our products or the means to transport those materials to manufacturing sites and finished products to customers.
The June 2016 Brexit referendum led to, among other things, volatility in currency exchange rates that resulted in the strengthening of the U.S. dollar against foreign currencies in which we conduct business. Given the lack of comparable precedent, it is unclear what financial, trade and legal implications the withdrawal of the United Kingdom from the European Union will have and how such withdrawal will affect us, our customers and their demand for our services. We cannot predict changes in currency exchange rates, the impact of exchange rate changes on our operating results, nor the degree to which we will be able to manage the impact of currency exchange rate changes, and any of these effects of Brexit, among others, could materially adversely affect our business, results of operations and financial condition. Also see
"Policies or legislation proposed or instituted by the current U.S. administration could have a material adverse effect on our business, results of operations and financial condition"
below for a discussion of uncertainties, and potential adverse impacts on our business, that may arise out of actions of the current U.S. administration.
We rely on a variety of common carriers for the transportation of materials and products and for their ability to route these materials and products through various international ports and other transportation hubs. A work stoppage, strike or shutdown of any important supplier's site or operations, or at any major port or airport, or the inability to access any such site for any reason, could result in manufacturing and shipping delays or expediting charges, which could have a material adverse effect on our operating results.
15
Such events have had and may in the future have an adverse impact on the U.S. and global economy in general, and on consumer confidence and spending, which may adversely affect our revenue and financial results. Such events could increase the volatility of the market price of our securities and may limit the capital resources available to us and our customers and suppliers.
Policies or legislation proposed or instituted by the current U.S. administration could have a material adverse effect on our business, results of operations and financial condition.
The current U.S. administration has created uncertainty with respect to, among other things, existing and proposed trade agreements, free trade generally, and significant increases on tariffs on goods imported into the U.S. from specified countries. The United States, Canada and Mexico have agreed on a revised trade deal (USMCA) to replace the North American Free Trade Agreement. The USMCA was executed at the end of 2018, but is subject to ratification by the legislatures of the three countries. We cannot currently quantify the impact on our business of the USMCA, if ratified. In addition, the current U.S. administration has increased tariffs on certain items imported into the U.S. from several countries, including China, Canada, Mexico, and the European Union (many of which are not addressed by the USMCA). Each of these countries has imposed retaliatory tariffs on specified items, which have been challenged by the U.S. These actions, or other governmental actions related to tariffs or international trade agreements, could increase the cost to our U.S. customers who use our non-U.S. manufacturing sites and components, and vice versa, which may materially and adversely impact demand for our services, our results of operations or our financial condition. We currently ship a significant portion of our worldwide production to customers in the U.S. from other countries. Increased tariffs, and/or changes to international trade agreements, may cause our U.S. customers to insource programs previously outsourced to us, transfer manufacturing to locations within our global network that are not impacted by such actions (potentially increasing production costs), and/or shift their business to other EMS providers. Additionally, tariffs on imported components for use in our U.S. production could have an adverse impact on demand for such production. Retaliatory tariffs could reduce demand for our U.S.-based production or make such production less profitable. Given the uncertainty regarding the scope and duration of these trade actions by the U.S. and other governments, whether trade tensions will escalate further, and whether our customers will bear the cost of the tariffs, their impact on our operations and results cannot be currently quantified, but may be material.
The U.S. Tax Cuts and Jobs Act (U.S. Tax Reform) became effective January 1, 2018.
The legislative changes are extensive, and uncertainties remain as to how such changes will be implemented.
We do not currently expect the U.S. Tax Reform to have a significant impact on our future global tax rate, but we will continue to assess additional impacts, if any, throughout 2019 as they become known due to changes in our interpretations and assumptions, as well as applicable changes in our business and additional regulatory guidance that may be issued.
In general, tax reform efforts, including with respect to tax base or rate, transfer pricing, inter-company dividends, cross border transactions, controlled corporations, and limitations on tax relief allowed on the interest on inter-company debt, require us to continually assess our organizational structure against tax policy trends, and could lead to an increased risk of international tax disputes and an increase in our effective tax rate, and could adversely affect our financial results.
It is unknown at this time to what extent other new laws will be passed or pending or new regulatory proposals will be adopted, if any, or the effect that such passage or adoption may have on the economy and/or our business. However, changes in U.S. social, political, regulatory and economic conditions or in laws and policies governing foreign trade, taxes, manufacturing, clean energy, the healthcare industry, development and investment in the jurisdictions in which we and/or our customers or suppliers operate, could materially adversely affect our business, results of operations and financial condition.
Changes to our operating model may adversely affect our business.
We continuously work to improve our productivity, quality, delivery performance and flexibility. In connection therewith, we are implementing our CEI to further streamline our business and improve our margin performance. Charges related to these initiatives may adversely impact our financial condition and results of operations in the periods incurred. In addition, we commenced a comprehensive review of our CCS revenue portfolio in the second half of 2018 to address under-performing programs and to disengage from customer programs that do not meet our strategic objectives. This review is currently expected to result in a decline in our CCS segment revenue of approximately $500 million over the next 12 to 18 months, and a corresponding decline in overall company revenue in the single digit percentage range in 2019 (subject to change based on the growth or contraction of CCS programs not subject to the review). The review is substantially complete and the customer programs that comprise the approximate $500 million in revenue have been identified. We expect to complete the majority of the related actions in 2019, including the intended restructuring activities (which have been built into our CEI) and changes to our global manufacturing network. See "Operating Results —
Other Charges
" and "Overview —
Celestica's business
" in Item 5, "Operating and Financial Review and Prospects — Management's Discussion and Analysis of Financial Condition and Results of Operations."
Implementation of these initiatives presents a number of risks, including: (i) actual or perceived disruption of service or reduction in service levels to customers; (ii) potential adverse effects on our internal control environment with respect to general
16
and administrative functions during transitions resulting from such initiatives; (iii) actual or perceived disruption to suppliers, distribution networks and other important operational relationships and the inability to resolve potential conflicts in a timely manner; (iv) diversion of management attention from ongoing business activities and strategic objectives; and (v) failure to retain key employees. Because of these and other factors, we cannot predict whether we will fully realize the purpose and anticipated benefits or cost savings of these initiatives and, if we do not, our business and results of operations may be adversely affected. Furthermore, adverse changes to our business may require additional restructuring or reorganization activities in the future. See
"
We have incurred significant restructuring charges in recent periods, and expect to incur further significant restructuring charges during 2019 in connection with our cost efficiency initiative (CEI); we may not achieve some or all of the expected benefits from our CEI and other restructuring activities, these activities may adversely affect our business, and we may implement additional restructuring actions subsequent to completion of our CEI"
above.
Our results may be negatively affected by rising labor costs.
There is some uncertainty with respect to the pace of rising labor costs in various regions in which we operate. Any increase in labor costs that we are unable to recover in our pricing to our customers would negatively impact our margins and operating results.
Volatility in commodity prices may negatively impact our operating results.
We rely on various energy sources in our production and transportation activities. The price of commodities can be volatile. Increases in prices for energy and other commodities could result in higher raw material and component costs and transportation costs. Any increase in our costs that we are unable to recover in our pricing to our customers would negatively impact our margins and operating results.
Quality and execution issues may reduce demand for our services, damage our reputation, and/or have a material adverse effect on our business and operating results.
In any given quarter, we can experience quality and process variances related to materials, testing, or other manufacturing or supply chain activities. Although we are successful in resolving the majority of such issues (including those that arose in 2018), the existence of these variances could cause us to incur significant costs in relation to corrective actions, have a material adverse impact on the demand for our services in future periods from any affected customers, damage our reputation, and/or have a material adverse effect on our business and operating results.
We may experience increased financial and reputational risk due to non-performance by counterparties.
A failure by counterparties, including customers, suppliers, financial institutions (including the issuers of our purchased annuities), or other third parties with whom we conduct business, to fulfill their contractual obligations, may result in financial loss to us and may have adverse effects on our business.
We have key suppliers that are important to our sourcing activities. If a key supplier, or any company within that supplier's supply chain, were to experience financial difficulties, it may affect their ability to supply us with materials, components or services, which could halt or delay the production of a customer's products, which could in turn have a material adverse impact on our operations, financial results, and customer relationships.
Our ability to collect outstanding accounts receivable is contingent, in part, on the financial strength of our customers. We provide flexible payment terms to most of our customers (generally ranging from 30 to 90 days), however, we extend or provide longer payment terms from time to time when deemed commercially reasonable. Longer payment terms, which have become more prevalent, could adversely impact our working capital requirements, and increase our financial exposure and credit risk. Our accounts receivable balance at
December 31, 2018
was
$1,206.6 million
(December 31, 2017 — $1,023.7 million), with
two
customers individually representing more than 10% of total accounts receivable (December 31, 2017 — two customers). Customers having financial difficulties may result in payment delays, defaults in payments, or requests for extended payment terms, any of which could adversely impact our short-term cash flows, financial performance and/or operating results. In addition, customer financial difficulties may result in purchase order cancellations or volume reductions, resulting in increased inventory levels, which could have a material adverse impact on our operating results and working capital performance. We may not be able to return or resell this inventory, or we may be required to hold the inventory for an extended period of time, which may result in inventory obsolescence and the need to record additional inventory reserves. We may also be unable to recover all of the amounts owed to us by a customer, including amounts to cover unused inventory or capital investments incurred to support a customer's business. Furthermore, if a customer bankruptcy occurs, our profitability may be adversely impacted if affected accounts receivable are in excess of our allowance for doubtful accounts. Additionally, our future revenues could be adversely impacted by a customer bankruptcy. Inability to collect accounts receivable and/or the loss of one or more major customers could adversely impact our operating results, financial position and cash flows. We cannot reasonably determine the extent to which a customer or supplier
17
may have financial difficulties, or whether we will be required to adjust customer pricing, payment terms and/or the amounts we pay to suppliers for materials and components.
To mitigate the actuarial and investment risks of our defined benefit pension plans, we purchase annuities (using existing plan assets) from time to time from third party insurance companies for certain, or all, of our obligations under specified pension plans. See note 19 to the Consolidated Financial Statements in Item 18. Although these annuities substantially hedge the financial investment risk associated with the related pension obligations, failure by the insurance companies to fulfill their contractual obligations would result in a financial loss to us, as we retain ultimate responsibility for the payment of benefits to plan participants unless and until such pension plans are wound-up.
We may use cash on hand, issue debt or equity securities, and/or incur additional third-party debt (or any combination thereof) to complete future acquisitions or otherwise fund our operations, which may adversely affect our liquidity, credit ratings, financial condition and/or results of operations
.
Any significant use of cash (for future acquisitions or otherwise) would adversely impact our cash position and liquidity. In addition, we may choose to issue debt securities or otherwise incur additional debt, to fund future acquisitions or otherwise fund our operations. Any additional incurrence of debt (either through the issuance of debt securities or through a new or refinanced credit facility) would increase our debt leverage and debt service requirements, and could have a variety of additional effects, including, but not limited to, those described in "
We have incurred substantial third-party debt in recent periods, which has increased our debt service requirements, reduced our ability to fund future acquisitions and/or to respond to unexpected capital requirements, and may have other adverse impacts on our business"
above, as well as the potential imposition of additional restrictive covenants on our operations. To the extent we sell equity or convertible debt securities, the issuance of these securities (the pricing of which would be subject to market conditions at the time of issuance) could result in material dilution to our stockholders. Sales of our equity securities or convertible debt, or the perception that these sales could occur, could also cause the market price for our subordinate voting shares to fall, and new securities could have rights, preferences and privileges senior to the holders of our subordinate voting shares.
We are exposed to translation and transaction risks associated with foreign currency exchange rate fluctuations; hedging instruments may not be effective in mitigating such risks.
Global currency markets can be volatile. Although we conduct the majority of our business in U.S. dollars (our functional currency), our global operations subject us to translation and transaction risks associated with fluctuations in currency exchange rates that could have a material adverse impact on our operating results and/or financial condition. A significant portion of our operational costs (including payroll, pensions, site costs, costs of locally sourced supplies and inventory, and income taxes) are denominated in various currencies other than the U.S. dollar. Fluctuations in currency exchange rates may significantly increase the amount of translated U.S. dollars required for costs incurred in other currencies or significantly decrease the U.S. dollars received from non-U.S. dollar revenues. Our non-U.S. currency exposures include the Canadian dollar, Thai baht, Malaysian ringgit, Mexican peso, British pound sterling, Chinese renminbi, Euro, Romanian leu, Korean won, and Singapore dollar.
Although our functional currency is the U.S. dollar, currency risk on our income tax expense arises as we are generally required to file our tax returns in the local currency for each country in which we have operations. A weakening of the local currency against the U.S. dollar could have a negative impact on our income taxes payable (related to increased local-currency taxable profits) and on our deferred tax costs (primarily related to the revaluation of non-monetary foreign assets from historical average exchange rates to the period-end exchange rates). See note 21 to the Consolidated Financial Statements in Item 18. While our hedging programs are designed to mitigate currency risk vis-à-vis the U.S. dollar, we remain subject to taxable foreign exchange impacts in our translated local currency financial results relevant for tax reporting purposes.
As part of our risk management program, we enter into foreign exchange forward contracts to lock in the exchange rates for future foreign currency transactions, which is intended to reduce the variability of our operating costs and future cash flows denominated in local currencies. While these contracts are intended to reduce the effects of fluctuations in foreign currency exchange rates, our hedging strategy does not mitigate the longer-term impacts of changes to foreign exchange rates. We do not enter into these contracts for trading purposes or speculation, and our management believes all such contracts are entered into as hedges of underlying transactions. Nonetheless, these instruments involve costs and risks of their own in the form of transaction costs, credit requirements and counterparty risk. If our hedging program is not successful, or if we change our hedging activities in the future, we may experience significant unexpected expenses from fluctuations in exchange rates.
Our financial results have, in prior periods, been adversely impacted by negative foreign currency translation effects, and such adverse effects, some of which may be substantial, are likely to recur in the future.
18
Our ability to successfully manage unexpected changes or risks inherent in our global operations and supply chain may adversely impact our financial performance.
We have sites in the following countries: Canada, the United States, China, Ireland, Japan, Laos, Malaysia, Mexico, Romania, Singapore, South Korea, Spain and Thailand. During
2018
, approximately 80% of our revenue was produced at locations outside of North America. We also purchase the majority of our components and materials from international suppliers.
Global operations are subject to inherent risks which may adversely affect us, including:
•
changes in local tax rates and tax incentives and the adverse tax consequences of repatriating earnings;
|
•
|
labor unrest and differences in regulations and statutes governing employee relations, including increased scrutiny of labor practices within our industry;
|
•
cultural differences and/or differences in local business customs;
•
negative impacts, or ineffectiveness, of executing restructuring activities;
•
changes in regulatory requirements;
•
inflationary trends and rising costs;
•
changes in international political relations;
•
difficulty in staffing (including skilled labor availability and cost) and managing foreign operations;
•
challenges in building and maintaining infrastructure to support operations;
•
compliance with a variety of foreign laws, including import and export tariffs and regulations;
•
adverse changes in trade policies and/or agreements between countries in which we maintain operations;
•
changes in logistics costs;
•
changes in the availability, lead time, and cost of components and materials;
•
weaker laws protecting intellectual property rights and/or greater difficulty enforcing such rights;
•
global economic, political and/or social instability;
•
potential restrictions on the transfer of funds and/or other restrictive actions by foreign governments;
•
the effects of terrorist activity, armed conflict, natural disasters and epidemics; and
•
global currency fluctuations.
Any of these risks could disrupt the supply of our components or materials, slow or stop our production, and/or increase our costs. Compliance with trade and foreign tax laws may increase our costs and actual or alleged violations of such laws could result in enforcement actions or financial penalties that could result in substantial costs. In addition, the introduction or expansion of certain social programs in foreign jurisdictions may increase our costs, and certain supplier's costs, of doing business.
We currently ship a significant portion of our worldwide production into the U.S. from other countries. Changes to, among other things, laws or policies in the U.S. regarding foreign trade, import/export duties, tariffs or taxes, manufacturing and/or investments, could materially adversely affect our U.S. and foreign operations. See
"Policies or legislation proposed or instituted by the current U.S. administration could have a material adverse effect on our business, results of operations and financial condition"
above
.
If we are unable to recruit or retain highly skilled talent, our business could be adversely affected.
The recruitment of personnel in the EMS industry is highly competitive. We believe that our future success depends, in part, on our ability to attract and retain highly skilled executive, technical and management talent in the various geographies in which we operate. The time required to replace or redistribute responsibilities related to the loss of the services of certain executive, management and technical employees, individually or in the aggregate, could have a material adverse effect on our operations, and there can be no assurance that we will be able to retain their services. Organizational changes may impact our relationships with customers, vendors, and employees, potentially resulting in loss of business, loss of vendor relationships, and the loss of key employees or declines in employee productivity. Uncertainties associated with any senior management transitions could lead to concerns from current and potential third parties with whom we do business, any of which could hurt our business prospects.
19
Turnover in key leadership positions within the Company, or any failure to successfully integrate key new hires or promoted employees, may adversely impact our ability to manage the Company efficiently and effectively, could be disruptive and distracting to management and may lead to additional departures of existing personnel, any of which could have a material adverse effect on our business, operating results, financial results and internal controls over financial reporting.
We may not keep pace with rapidly evolving technology.
Many of the markets for our manufacturing and engineering services are characterized by rapidly changing technology and evolving process development. We believe our future success depends, in part, upon our ability to: continually develop and deliver electronic and complex mechanical manufacturing services that meet our customers' evolving needs; hire, retain and expand our qualified engineering and technical personnel; maintain and continually improve our technological expertise; and successfully anticipate or respond to technological changes in manufacturing processes on a cost-effective and timely basis.
Although we believe that our operations use the assembly and testing technologies, equipment and processes that are currently required by our customers, we cannot be certain that we will maintain or develop the capabilities required by our customers in the future. The emergence of new technologies, industry standards or customer requirements may render our equipment, designs, inventory or processes obsolete or noncompetitive. In addition, we may have to invest in new processes, capabilities or equipment to support new technologies used in our customers' current or future products, and to support their supply chain processes. Additionally, as we expand our service offerings or pursue business in new markets where our experience may be limited, we may be less effective in adapting to technological change. Our manufacturing, engineering, supply chain processes, and test development efforts and design capabilities may not be successful due to rapid technological shifts in any of these areas. The acquisition and implementation of new technologies and equipment and the offering of new or additional services to our customers may require significant expense or capital investment, which could reduce our operating margins and our operating results. Our failure to anticipate and adapt to our customers' changing technological needs and requirements or to hire and retain a sufficient number of engineers and maintain our engineering, technological and manufacturing expertise could have a material adverse effect on our operations.
Various industry-specific standards, qualifications and certifications are required to produce certain types of products for our customers. Failure to obtain or maintain those certifications may adversely affect our ability to maintain existing levels of business or win new business.
We may not adequately protect our intellectual property or the intellectual property of others.
We believe that certain of our proprietary intellectual property rights and information provide us with a competitive advantage. Accordingly, we take steps to protect this proprietary information, including entering into non-disclosure agreements with customers, suppliers, employees and other parties, and by implementing security measures. However, our protection measures may not be sufficient to prevent or detect the misappropriation or unauthorized use or disclosure of our property or information.
There is also a risk that claims of intellectual property infringement could be brought against us, our customers and/or our suppliers. If such claims are successful, we may be required to spend significant time and financial resources to develop processes that do not infringe upon the rights of another person or to obtain licenses for the technology, process or information from the owner. We may not be successful in such development, or any such licenses may not be available on commercially acceptable terms, if at all. In addition, any litigation could be lengthy and costly and could adversely affect us even if we are successful. As we expand our JDM and other service offerings and pursue business in new end markets, we may be less effective in anticipating or mitigating the intellectual property risks related to new manufacturing, design and other services, which could be significant.
We are subject to the risk of increasing income and other taxes, tax audits, and the challenges of successfully defending our tax positions, and obtaining, renewing or meeting the conditions of tax incentives and credits, any of which may adversely affect our financial performance.
We conduct business operations in a number of countries, including countries where tax incentives have been extended to encourage foreign investment or where income tax rates are low. Our income tax expense could increase significantly if certain tax incentives from which we benefit are retracted. A retraction could occur if we fail to satisfy the conditions on which these tax incentives are based, or if they are not renewed or replaced upon expiration. Our income tax expense could also increase if tax rates applicable to us in such jurisdictions are otherwise increased, or due to changes in legislation or administrative practices. Changes in our outlook in any particular country could impact our ability to meet the required conditions. See Item 5 "Operating and Financial Review and Prospects — Management's Discussion and Analysis of Financial Condition and Results of Operations — Income taxes" and note 20 to the Consolidated Financial Statements in Item 18 for a discussion of recently expired tax incentives, the status of existing tax incentives, and a challenge to our Brazilian sales tax levy rates.
20
We develop our tax filing positions based upon the anticipated nature and structure of our business and the tax laws, administrative practices and judicial decisions currently in effect in the jurisdictions in which we have assets or conduct business, all of which are subject to change or differing interpretations, possibly with retroactive effect.
Certain of our subsidiaries provide financing or products and services to, and may from time-to-time undertake certain significant transactions with, other subsidiaries in different jurisdictions. Moreover, several jurisdictions in which we operate have tax laws with detailed transfer pricing rules which require that all transactions with non-resident related parties be priced using arm's-length pricing principles, and that contemporaneous documentation must exist to support such pricing.
We are subject to tax audits globally by various tax authorities, which could result in additional tax expense in future periods relating to prior results. Any such increase in our income tax expense and related interest and/or penalties could have a significant adverse impact on our future earnings and future cash flows. The successful pursuit of assertions made by any taxing authority could result in our owing significant amounts of tax, interest, and possibly penalties. We believe we adequately accrue for any probable potential adverse tax ruling. However, there can be no assurance as to the final resolution of any claims and any resulting proceedings. If any claims and any ensuing proceedings are determined adversely to us, the amounts we may be required to pay could be material, and could be in excess of amounts accrued.
As at
December 31, 2018
, a significant portion of our cash and cash equivalents was held by foreign subsidiaries outside of Canada, a large part of which may be subject to withholding taxes upon repatriation under current tax laws. We currently expect to repatriate approximately $30 million from various foreign subsidiaries in the near term, and have recognized any applicable deferred tax liabilities with respect thereto. At
December 31, 2018
, we had approximately $355 million (
December 31, 2017
— $351.0 million) of cash and cash equivalents held by foreign subsidiaries outside of Canada that we do not intend to repatriate in the foreseeable future.
Our operations and our customer relationships may be adversely affected by disruptions to our information technology (IT) systems, including disruptions from cybersecurity breaches of our IT infrastructure.
We rely on information technology networks and systems, including those of third-party service providers, to process, transmit and store electronic information. In particular, we depend on our IT infrastructure for a variety of functions, including worldwide financial reporting, inventory and other data management, procurement, invoicing and email communications. Any of these systems may be susceptible to outages due to fire, floods, power loss, telecommunications failures, terrorist attacks, sabotage and similar events. Global cybersecurity threats and incidents can range from uncoordinated individual attempts to gain unauthorized access to our IT systems to sophisticated and targeted measures known as 'advanced persistent threats'. The ever-increasing use and evolution of technology, including cloud-based computing and the rise of the 'Internet of Things,' creates opportunities for the unintentional dissemination or intentional destruction of confidential information stored in our systems or in non-encrypted portable media or storage devices. We could also experience a business interruption, information theft of confidential data, or reputational damage from industrial espionage attacks, malware or other cyber-attacks, which may compromise our system infrastructure or lead to data leakage, either internally or at our third-party providers. Despite the implementation of advanced threat protection, information and network security measures and disaster recovery plans, our systems and those of third parties on which we rely may also be vulnerable to computer viruses, break-ins and similar disruptions. If we or our vendors are unable (or are perceived as unable) to prevent or promptly identify and remedy such outages and breaches, our operations may be disrupted, our business reputation could be adversely affected, and there could be a negative impact on our financial condition and results of operations.
We expect that risks and exposures related to cybersecurity attacks will remain high for the foreseeable future due to the rapidly evolving nature and sophistication of these threats.
We may not be able to prevent or detect all errors or fraud.
Due to the inherent limitations of internal control systems, misstatements due to error or fraud may occur and may not be detected in a timely manner or at all. Accordingly, we cannot provide absolute assurance that all control issues, errors or instances of fraud, if any, within (or otherwise impacting) the Corporation have been or will be prevented or detected. In addition, over time, certain aspects of a control system may become inadequate because of changes in conditions, or the degree of compliance with the policies or procedures may deteriorate, which we may not be able to address quickly enough to prevent all instances of error or fraud.
Our revenue and operating results may vary significantly from period to period.
Our quarterly and annual results may vary significantly depending on various factors, certain of which are described below, and many of which are beyond our control.
|
•
|
the volume and timing of customer demand relative to our capacity;
|
21
|
•
|
the typical short life cycle of our customers' products and success in the marketplace of our customers' products;
|
|
•
|
the cyclical nature of customer demand in several of our businesses;
|
|
•
|
customers' financial condition;
|
|
•
|
changes to our mix of customers, programs and/or end market demand;
|
|
•
|
how well we execute on our operational strategies, and the impact of changes to our business model;
|
|
•
|
varying revenues and gross margins among geographies and programs for the products or services we provide;
|
|
•
|
pricing pressures, the competitive environment and contract terms and conditions;
|
|
•
|
upfront investments and challenges associated with the ramping of programs for new or existing customers;
|
|
•
|
provisions or charges resulting from unexpected changes in market conditions impacting our industry or the end markets we serve;
|
|
•
|
customer disengagements or terminations of customer programs;
|
|
•
|
the timing of expenditures in anticipation of future orders;
|
|
•
|
our effectiveness in planning production and managing inventory, fixed assets and manufacturing processes;
|
|
•
|
operational inefficiencies and disruptions in production at individual sites;
|
|
•
|
changes in cost and availability of commodities, materials, components, services and labor;
|
|
•
|
current or future litigation;
|
|
•
|
seasonality in quarterly revenue patterns across some of our businesses;
|
|
•
|
governmental actions or changes in legislation;
|
|
•
|
currency fluctuations; and
|
|
•
|
changes in U.S. and global economic and political conditions and world events.
|
Our mix of revenue by end market is also impacted by, among other factors, overall end market demand, the timing and extent of new program wins, program completions or losses, customer disengagements, or follow-on business from customers and from acquisitions. Changes to our mix of revenue by end market, and the conditions that are specific to each end market, could lead to volatility in our revenue and margins from period to period and adversely impact our financial position and cash flows.
Materials constraints from certain suppliers throughout 2017 and 2018 led to volatility in our revenue and margins, and resulted in us carrying higher than expected levels of inventory at each of December 31, 2017 and 2018. Although we expect these materials constraints and resulting adverse impacts to continue in the near term, we have begun to see improvements in the availability of certain previously constrained items. Nonetheless, only minor improvements in supplier lead times are currently expected.
Compliance with governmental laws and obligations could be costly and may negatively impact our financial performance.
We are subject to various federal/national, state/provincial, local, foreign and supra-national environmental laws and regulations. Our environmental management systems and practices have been designed to provide for compliance with these laws and regulations. Maintaining compliance with and responding to increasingly stringent regulations requires a significant investment of time and resources and may restrict our ability to modify or expand our manufacturing sites or to continue production. Any failure to comply with these laws and regulations may potentially result in significant fines and penalties, our operations may be suspended or subjected to increased oversight, and our cost of related investigations could be material in any period.
More complex and stringent environmental legislation continues to be imposed, including laws that place increased responsibility and requirements on the "producers" of electronic equipment and, in turn, their providers and suppliers. Such laws may relate to product inputs (such as hazardous substances and energy consumption), product use (such as energy efficiency and waste management/recycling), and/or operational outputs/by-products from our manufacturing processes that can result in environmental contamination (such as waste water, air emissions and hazardous waste). Noncompliance with these requirements could result in substantial costs, including fines and penalties, and we may incur liability to our customers and consumers.
22
Where compliance responsibility rests primarily with our customers rather than with EMS companies, they may turn to EMS companies like Celestica for assistance in meeting their obligations. Our customers remain focused on issues such as waste management (including recycling), climate change (including the reduction of carbon emissions) and product stewardship, and expect their EMS providers to be environmental leaders. We strive to meet such customer expectations, although these demands may extend beyond our regulatory obligations and require significant investments of time and resources to attract and retain customers.
We generally conduct environmental assessments, or review assessment reports undertaken by others, for our manufacturing sites at the time of acquisition or leasing. However, such assessments may not reveal all environmental liabilities, and assessments have not been obtained for all sites. In addition, some of our operations involve the use of hazardous substances that could cause environmental impacts. While we have operational systems to provide environmental management, we cannot rule out all risk of non-compliance and could incur substantial costs to comply. Although if deemed necessary, we may investigate, remediate or monitor emissions and site conditions at some of our owned or leased sites (such as air, soil and/or groundwater conditions), we may not be aware of, or adequately address, all such emissions and conditions, and we may incur significant costs should such work be required. In many jurisdictions in which we operate, environmental laws impose liability for the costs of removal, remediation or risk assessment of hazardous or toxic substances on an owner, occupier or operator of real estate, even if such person or company was unaware of or not responsible for the discharge or migration of such substances. In some instances where soil or groundwater contamination existed prior to our ownership or occupation, landlords or former owners may have retained some contractual responsibility or regulatory liability, but this may not provide sufficient protection to reduce or eliminate our liability. Third-party claims for damages or personal injury are also possible and could result in significant costs to us. If more stringent compliance or cleanup standards under environmental laws or regulations are imposed, or the results of future testing and analyses at our current or former operating sites indicate that we are responsible for the release of hazardous substances into the air, ground and/or water, we may be subject to additional liability. Additional environmental matters may arise in the future at sites where no problem is currently known or at sites that we may acquire in the future.
Our healthtech business is subject to regulation by the U.S. Food and Drug Administration (FDA), Health Canada, the European Medicines Agency, the Brazilian Health Surveillance Agency, and similar regulatory bodies in other jurisdictions, relating to the medical devices and hardware we manufacture for our customers. Our sites that deliver products to the healthcare business are certified or registered in quality management standards applicable to the healthcare industry. We are required to comply with various statutes and regulations related to the design, development, testing, manufacturing and labeling of our medical devices in addition to reporting of certain information with respect to the safety of such products. Any failure to comply with these regulations could result in fines, injunctions, product recalls, import detentions, additional regulatory controls, suspension of production, and/or the shutting down of one or more of our sites, among other adverse outcomes. Failure to comply with these regulations may also materially affect our reputation and/or relationships with customers and regulators.
We provide design, engineering and manufacturing related services to our customers in the aerospace and defense end market. As part of these services, we are subject to substantial regulation from government agencies including the U.S. Department of Defense (DOD) and the U.S. Federal Aviation Administration. Our aerospace and defense sites are certified in quality management standards applicable to the aerospace and defense industry. Failure to comply with these regulations or the loss of any of our quality management certifications may result in fines, penalties and injunctions, and could prevent us from executing on current or winning future contracts, any of which may materially adversely affect our financial condition and operating results. In addition to quality management standards, there are several other U.S. regulations with which we are required to comply, including the Federal Acquisition Regulations (FAR), which provides uniform policies and procedures for acquisition; the Defense Federal Acquisition Regulation Supplement, a DOD agency supplement to the FAR that provides DOD-specific acquisition regulations that DOD government acquisition officials, and those contractors doing business with DOD, must comply with in the procurement process for goods and services; and the Truth in Negotiations Act, which requires full and fair disclosure by contractors in the conduct of negotiations with the government and its prime contractors. These rules are complex, our performance under them is subject to audit by the U.S. Defense Contract Audit Agency, the U.S. Office of Federal Contract Compliance Programs and other government regulators, and in most cases must be complied with by our suppliers. If an audit or investigation reveals a failure to comply with regulations, we could become subject to civil or criminal penalties and administrative sanctions by either the government or the prime customer, including government pre-approval of our government contracting activities, termination of the contract, payment of fines and suspension or debarment from doing further business with the U.S. government. Any of these actions could increase our expenses, reduce our revenue and damage our reputation as a reliable U.S. government supplier. We are also subject to the export control laws and regulations of the countries in which we operate, including, but not limited to, the U.S. International Traffic in Arms Regulations (ITAR) and the Export Administration Regulations (EAR).
Our international operations require us to comply with various anti-bribery laws, including the U.S. Foreign Corrupt Practices Act (FCPA) and the Corruption of Foreign Public Officials Act (Canada) (CFPOA). In some countries in which we operate, it may be customary for businesses to engage in business practices that are prohibited by the FCPA, CFPOA or other laws and regulations. Although we have implemented policies and procedures designed to ensure compliance with the FCPA, CFPOA and similar laws
23
in other jurisdictions, there can be no assurance that all of our employees and agents, as well as those companies to which we outsource certain business operations, will not be in violation of these laws and our policies or procedures. In addition to the difficulty of monitoring compliance, any suspected or alleged activity would require a costly investigation by us and may result in the diversion of management's time, resources and attention. Failure to comply with these laws may subject us to, among other things, adverse publicity, penalties and legal expenses that may harm our reputation and have a material adverse effect on our business, financial condition and operating results.
As a public company, we are subject to stringent laws, regulations and other requirements, including the U.S. Sarbanes-Oxley Act and the U.S. Dodd-Frank Wall Street Reform and Consumer Protection Act (Dodd-Frank), affecting, among other areas, our accounting, internal controls, corporate governance practices, securities disclosures and reporting. For example, Dodd-Frank contains provisions concerning specified minerals originating from the Democratic Republic of Congo or adjoining countries (referred to as "conflict minerals"). As required by Dodd-Frank, the U.S. Securities and Exchange Commission (SEC) has adopted due diligence, disclosure and reporting requirements for companies that manufacture, or contract to manufacture, products that include conflict minerals. We manufacture such products for our customers. Due to our complex supply chain, compliance with these rules is time-consuming and costly. If we are unable to ascertain the origins of all such minerals used in the manufacturing of our products through the due diligence procedures we implement, we may be unable to satisfy our customers' certification requirements. This may harm our reputation, damage our customer relationships and result in a loss of revenue. If the SEC rules or other new social or environmental standards limit our pool of suppliers in order to produce "conflict free" or "socially responsible" products, or otherwise adversely affect the sourcing, supply and pricing of materials used in our products, we could also experience cost increases and a material adverse impact on our operating results.
In addition, whenever we pursue business in new end markets, or our customers pursue new technologies or businesses, we are required to navigate the potentially heavy regulatory and legislative burdens of such end markets or technologies, as well as applicable quality standards with respect thereto.
The regulatory climate can itself affect the demand for our services. For example, government reimbursement rates and other regulations, as well as the financial health of healthcare providers, changes in how healthcare in the U.S. is structured, including as a result of the U.S. Affordable Care Act (or any successor legislation), and how medical devices are taxed, could affect the willingness and ability of end customers to purchase the products of our customers in this market as well as impact our margins.
Our customers are also required to comply with various government regulations, legal requirements and industry standards, including many of the industry-specific regulations discussed above. Our customers' failure to comply could affect their businesses, which in turn would affect our sales to them. In addition, if our customers are required by regulation or other requirements to make changes in their product lines, these changes could significantly disrupt particular programs for these customers and create inefficiencies in our business.
In addition, a failure by a supplier or manufacturer to comply with applicable laws, regulations or customer requirements could negatively impact our business, and for governmental customers, could result in fines, penalties, suspension or even debarment being imposed on us, which could have a material adverse impact on our business, financial condition and results of operations.
Also see
"
Policies or legislation proposed or instituted by the current U.S. administration could have a material adverse effect on our business, results of operations and financial condition"
above for a discussion of potential adverse impacts on our business that may result from changes to U.S. laws, regulations and/or policies proposed or implemented by the current U.S. administration.
Compliance or the failure to comply with employment laws and regulations may negatively impact our financial performance.
We are subject to a variety of domestic and foreign employment laws, including those related to: workplace safety, discrimination, harassment, whistle-blowing, wages and overtime, personal taxation, classification of employees, work authorizations and severance. Compliance with such laws may increase our costs. In addition, such laws are subject to change, and enforcement activity relating to these laws, particularly outside of the United States, may increase as a result of greater media attention due to alleged violations by other companies, changes in law, political and other factors. There can be no assurance that, in the future, we will not be found to have violated elements of such laws. Any such violations could lead to the assessment of fines or damages against us by regulatory authorities or claims by employees, any of which could adversely affect our operating results and/or our reputation.
An inability to successfully manage the procurement, development, implementation or execution of IT systems, or to adequately maintain these systems and their security, as well as to protect data and other confidential information, may adversely affect our business and reputation.
24
As a complex, global company, we are heavily dependent on our IT systems to support our customers' requirements and to successfully manage our business. Any inability to successfully manage the procurement, development, implementation, execution or maintenance of such systems, including matters related to system and data security, cybersecurity, privacy, reliability, compliance, performance and access, as well as any inability of these systems to fulfill their intended purpose, could have an adverse effect on our business. See “
Our operations and our customer relationships may be adversely affected by disruptions to our information technology (IT) systems, including disruptions from cybersecurity breaches of our IT infrastructure
” above.
In addition, we must comply with increasingly complex and rigorous regulatory standards enacted to protect business and personal data in various jurisdictions. For example, the European Union recently adopted the General Data Protection Regulation (GDPR). The GDPR imposes additional obligations on companies regarding the handling of personal data and provides certain individual privacy rights to persons whose data is stored. Compliance with existing, proposed and recently enacted laws and regulations can be costly; any failure to comply with these regulatory standards could subject us to legal and reputational risks. Misuse of or failure to secure personal information could also result in violation of data privacy laws and regulations, proceedings against the Company by governmental entities or others, fines and penalties, damage to our reputation and credibility and could have a negative impact on our business and results of operations.
We may be required to make larger contributions to our defined benefit pension and other pension plans in the future.
We maintain defined benefit and defined contribution pension plans, as well as other pension plans globally. Our pension funding policy for our defined benefit and defined contribution pension plans is to contribute amounts sufficient, at minimum, to meet local statutory funding requirements that are based on actuarial calculations. Our obligations are based on certain assumptions relating to plan asset performance, salary changes, employee turnover, retirement ages, life expectancy, expected healthcare costs, the performance of the financial markets, future interest rates, and plan and legislative changes. If actual results or future expectations differ from these assumptions or if statutory funding requirements change, the amounts we are obligated to contribute to the pension plans may increase and such increase could be significant. We are also required to contribute amounts to our other pension plans to meet local statutory or such pension plans' funding requirements. The amounts we are obligated to contribute may increase due to legislative and other changes.
Failure to comply with the conditions of government grants may lead to grant repayments and adversely impact our financial performance.
We have received grants from government organizations or other third parties as incentives related to capital investments or other expenditures. These grants often have future conditions with which we must comply. If we do not meet these future conditions, we could be obligated to repay all or a portion of the grant, which could adversely affect our financial position and operating results.
There are inherent uncertainties involved in the estimates, judgments and assumptions used in the preparation of our financial statements. Any changes in estimates, judgments and assumptions could have a material adverse effect on our financial position and results of operations.
Our Consolidated Financial Statements are prepared in accordance with IFRS. The preparation of our financial statements in conformity with IFRS requires management to make estimates, judgments and assumptions that affect the reported amounts of our assets, liabilities and related reserves, revenues and expenses. Estimates, judgments and assumptions are inherently subject to change in future periods, which could have a material adverse effect on our financial position and results of operations.
Our credit agreement contains restrictive covenants that may impair our ability to conduct business, and the failure to comply with such covenants could cause our outstanding debt to become immediately payable.
Our credit agreement contains restrictive covenants that limit our management's discretion with respect to certain business matters. Among other factors, these covenants limit our ability and our subsidiaries' ability to incur additional debt, create liens or other encumbrances, change the nature of our business, sell or otherwise dispose of assets, merge or consolidate with other entities, or effect specified changes in control. This agreement also contains certain financial covenants related to indebtedness and interest coverage. If we are not able to comply with these covenants, our outstanding debt could become immediately due and payable, and the incurrence of additional debt under our revolving credit facility would not be allowed, either of which could have a material adverse effect on our liquidity and ability to conduct our business. Acquisitions are part of our diversification strategy and we have, and may in the future, incur additional debt to finance these transactions, at least in part. See "
We have incurred substantial third-party debt in recent periods, which has increased our debt service requirements, reduced our ability to fund future acquisitions and/or to respond to unexpected capital requirements, and may have other adverse impacts on our business" and
"
We may use cash on hand, issue debt or equity securities, and/or incur additional third-party debt (or any combination thereof) to complete future acquisitions or otherwise fund our operations, which may adversely affect our liquidity, credit ratings, financial condition and/or results of operations"
above for a discussion of potential negative impacts resulting from the incurrence of additional debt.
25
We are subject to interest rate fluctuations.
In June 2018, we entered into an $800.0 million credit facility (New Credit Facility), which consists of a $350.0 million term loan (June Term Loan) that matures in June 2025, and a $450.0 million revolving credit facility (New Revolver) that matures in June 2023. In November 2018, we added an incremental $250.0 million term loan (November Term Loan) under the New Credit Facility, maturing in June 2025. Borrowings under the New Revolver bear interest at LIBOR, Canadian Prime, or Base Rate (each as defined in the New Credit Facility), plus a specified margin, or in the case of any bankers' acceptance, at the B/A Discount Rate (as defined in the New Credit Facility). The margin for borrowings under the New Revolver ranges from 0.75% to 2.5%, depending on the rate we select and our consolidated leverage ratio. The June Term Loan currently bears interest at LIBOR plus 2.125%. The November Term Loan currently bears interest at LIBOR plus 2.5%. Borrowings under the New Credit Facility expose us to interest rate risks due to fluctuations in these rates and margins. Because the amounts we have borrowed under our credit facility has increased in recent periods, an increase in interest rates would have a more pronounced impact on our interest expense than in prior periods. At
December 31, 2018
, we had an aggregate of
$598.3 million
outstanding under the June Term Loan and the November Term Loan, and other than ordinary course letters of credit, $159.0 million outstanding under the New Revolver. To partially hedge against our exposures to interest rate variability on our term loans, we entered into 5-year agreements with a syndicate of third-party banks in August and December 2018 to swap the variable interest rates with fixed rates of interest on $350.0 million of the total borrowings thereunder. See Item 5, "Operating and Financial Review and Prospects — Management's Discussion and Analysis of Financial Condition and Results of Operations — Liquidity — Cash requirements and Capital Resources." Significant interest rate fluctuations may adversely affect our business, operating results and financial condition.
Changes to LIBOR may negatively impact us.
LIBOR, the London interbank offered rate, is the basic rate of interest used in lending between banks on the London interbank market and is widely used as a reference for setting the interest rate on loans globally. Our term loans currently bear interest based on LIBOR, and the New Revolver bears interest at specified rates (at our option) which include LIBOR. The U.K. Financial Conduct Authority, which regulates LIBOR, has announced that it intends to stop encouraging or requiring banks to submit LIBOR rates after 2021, and it is unclear if LIBOR will cease to exist or if new methods of calculating LIBOR will evolve. If LIBOR ceases to exist or if the methods of calculating LIBOR change from their current form, interest rates on our current or future indebtedness may increase, and we may need to renegotiate our New Credit Facility to replace LIBOR with a new standard. In addition, the issues that may lead to the discontinuation or unavailability of LIBOR may make one or more of the alternative methods impossible or impracticable to determine. Further, there can be no guarantee that a transition from LIBOR to an alternative will not result in financial market disruptions, significant increases in benchmark rates, or borrowing costs to borrowers, any of which could have an adverse effect on our liquidity, results of operations or financial condition.
Deterioration in financial markets or in the macro-economic environment may adversely affect our ability to raise funds or increase the cost of raising funds.
We currently have access to the New Revolver, which matures in June 2023. We may also issue or wish to incur additional debt or issue equity securities to fund our operations or make additional acquisitions. Our ability to borrow or raise capital, or renew or increase the New Credit Facility, may be impacted if financial markets are unstable. Disruptions in the capital and credit markets could adversely affect our ability to draw on our New Revolver (or any successor or additional facility). Our access to funds under the New Credit Facility (or any successor or additional facility) will be dependent on the ability of our senior lenders to meet their funding commitments. They may not be able to meet their funding commitments to us if they experience shortages of capital and liquidity or if they experience excessive volumes of borrowing requests from us and other borrowers within a short period of time. Longer term disruptions in the capital and credit markets as a result of uncertainty, changing or increased regulation, reduced alternatives, or failures of significant financial institutions could adversely affect our access to liquidity needed for our business. Any disruption could require us to take measures to conserve cash until the markets stabilize or until alternative credit arrangements or other funding sources can be arranged. Such measures could include deferring capital expenditures, and reducing or eliminating discretionary uses of cash.
Our credit rating may be downgraded.
Any negative change in our credit rating or outlook may make it more expensive for us to raise additional capital in the future on terms that are acceptable to us, if at all. See "
We have incurred substantial third-party debt in recent periods, which has increased our debt service requirements, reduced our ability to fund future acquisitions and/or to respond to unexpected capital requirements, and may have other adverse impacts on our business."
26
The interest of our controlling shareholder, Onex Corporation, with an approximate 80% voting interest, may conflict with the interests of other shareholders.
Onex Corporation (Onex) beneficially owns all of our outstanding multiple voting shares and less than 1% of our outstanding subordinate voting shares. The number of subordinate voting shares and multiple voting shares beneficially owned by Onex represents approximately 80% of the voting interest in Celestica. Accordingly, Onex has the ability to exercise significant influence over our business and affairs and generally has the power to determine all matters submitted to a vote of our shareholders where our shares vote together as a single class. Onex may make decisions regarding Celestica and our business that are opposed to other shareholders' interests or with which other shareholders may disagree. Onex's voting power could have the effect of deterring or preventing a change in control of our Corporation that might otherwise be beneficial to our other shareholders.
Through its shareholdings, Onex has the power to elect our directors and its approval is required for significant corporate transactions such as certain amendments to our Restated Articles of Incorporation (Articles), the sale of all or substantially all of our assets and plans of arrangement. The directors so elected have the authority, subject to applicable laws, to appoint or replace senior management, cause us to issue additional subordinate voting shares or multiple voting shares or repurchase subordinate voting shares or multiple voting shares, declare dividends or take other actions.
Gerald W. Schwartz, the Chairman of the Board, President and Chief Executive Officer of Onex, indirectly owns shares representing the majority of the voting rights of the shares of Onex. The interests of Onex and Mr. Schwartz may differ from the interests of the remaining holders of subordinate voting shares. For additional information about shareholder rights and restrictions relative to our subordinate voting shares and multiple voting shares, see Item 10(B), "Memorandum and Articles of Incorporation." For additional information about our principal shareholders, see Item 7(A), "Major Shareholders." Also see Item 7(B), "Related Party Transactions" for a description of Mr. Schwartz's ownership interest in the Property Purchaser, and the post-assignment option to obtain a non-voting interest in the assignee of the Property Sale Agreement granted by such assignee to the Property Purchaser.
Onex has, from time-to-time, issued debentures exchangeable and redeemable under certain circumstances for our subordinate voting shares, entered into forward equity agreements with respect to our subordinate voting shares, sold our subordinate voting shares (after exchanging multiple voting shares for subordinate voting shares), or redeemed these debentures through the delivery of our subordinate voting shares, and could take similar actions in the future. These sales may impact our share price or have consequences on our debt and ownership structure.
We are subject to litigation, which may result in substantial litigation expenses, settlement costs or judgments, require the time and attention of key management resources, and result in adverse publicity, any of which may negatively impact our financial performance.
We are from time to time party to various copyright, patent and trademark infringement, unfair competition, breach of contract, customs, employment and other legal actions incidental to our business, as plaintiff or defendant, as well as various other claims, suits, investigations and legal proceedings (including securities class action and shareholder derivative lawsuits which have been settled or dismissed). Additional legal claims or regulatory matters may arise in the future and could involve matters relating to commercial disputes, government regulation and compliance, intellectual property, antitrust, tax, employment or shareholder issues, product liability claims and other issues on a global basis. Regardless of the merits of the claims, litigation may be both time-consuming and disruptive to our business. The defense and ultimate outcome of any lawsuits or other legal proceedings may result in higher operating expenses and a decrease in our margins, which could have a material adverse effect on our business, financial condition, or results of operations. We cannot predict the final outcome of such lawsuits or the likelihood that other proceedings will be instituted against us. Accordingly, the cost of defending against such lawsuits or any future lawsuits or proceedings may be high and, in any event, these legal proceedings may result in the diversion of our management's time and attention away from our business. In the event that there is an adverse ruling in any legal proceeding, we may be required to make payments to third parties that could have a material adverse effect on our reputation, financial condition and results of operations.
Changes in accounting standards enacted by the relevant standard-setting bodies may adversely affect our reported operating results, profitability and financial performance.
Accounting standards are revised periodically and/or expanded upon by applicable standard-setting bodies. We are required to adopt new or revised accounting standards and to comply with revised interpretations issued from time-to-time by these authoritative bodies, including the Canadian Accounting Standards Board (CASB), the IASB, and the SEC. While these accounting changes do not typically affect the economics of our business, such standards could have a significant effect on our accounting methods and reported results. For example, the IASB issued a new revenue recognition standard and amended the standard relating to the classification, measurement and impairment of financial assets and hedge accounting; both of these standards became effective as of January 1, 2018. The new revenue recognition standard changed the timing of revenue recognition for a significant portion of our business, and the adoption of such standard had a material impact on our Consolidated Financial Statements, primarily
27
in relation to inventory and accounts receivable. See note 2(y) to the Consolidated Financial Statements in Item 18. Additionally, the standard relating to leases was also amended to bring most leases onto the balance sheet for lessees, eliminating the distinction between operating and finance leases. This standard became effective January 1, 2019. Although we are completing our analysis of the impact of adopting this standard, we anticipate that its initial application will have a material impact on our Consolidated Financial Statements. See note 2(x) to the Consolidated Financial Statements in Item 18. Changes in accounting standards could materially affect (either positively or negatively) our reported operating results or financial condition. Our Consolidated Financial Statements are prepared in accordance with IFRS. Our reported financial information may not be comparable to the information reported by our competitors or other public companies that use different accounting standards.
Shares eligible for public sale may adversely affect our share price.
Future sales of our subordinate voting shares in the public market, or the issuance of subordinate voting shares in connection with our equity-based compensation plans or otherwise, could adversely affect the market price of the subordinate voting shares.
At
February 13, 2019
, we had approximately 118.1 million subordinate voting shares and approximately 18.6 million multiple voting shares outstanding. In addition, as of such date, there were approximately 10.5 million subordinate voting shares reserved for issuance from treasury for outstanding awards under our employee and director equity-based compensation plans, including approximately 0.3 million subordinate voting shares underlying stock options (vested and unvested), approximately 0.4 million subordinate voting shares underlying unvested restricted share units, approximately 0.7 million subordinate voting shares underlying unvested performance share units (assuming vesting of 100% of the target amount granted), and approximately 0.04 million subordinate voting shares underlying deferred share units (granted prior to January 1, 2017) that have not been settled.
Moreover, pursuant to our Articles, we may issue an unlimited number of additional subordinate voting shares without further shareholder approval (subject to any required stock exchange approvals). Sales of a substantial number of our subordinate voting shares in the public market by holders of exercised vested options or vested share units settled in or exercised for subordinate voting shares may lower the prevailing market price for such shares and could impair our ability to raise capital through the future sale of our equity securities. Additionally, if we issue additional subordinate voting shares, or if holders of outstanding vested options exercise those options or if vested shares units are settled in newly-issued subordinate voting shares, our shareholders will incur dilution. See "
We may use cash on hand, issue debt or equity securities, and/or incur additional third-party debt (or any combination thereof) to complete future acquisitions or otherwise fund our operations, which may adversely affect our liquidity, credit ratings, financial condition and/or results of operations"
above.
The exercise price of all options is subject to adjustment upon stock dividends, splits and combinations, if any, as well as anti-dilution adjustments as set forth in the relevant award agreement.
The market price of our stock may be volatile.
Volatility in our business can result in significant price and volume fluctuations in the market price of our stock. Factors such as changes in our operating results, announcements by our customers, competitors or other events affecting companies in the electronics industry, currency fluctuations, general market fluctuations, and macro-economic conditions may cause the market price of our subordinate voting shares to decline. In addition, if our operating results do not meet the expectations of securities analysts or investors, the price of our stock could decline. Furthermore, the existence of our normal course issuer bid (NCIB) could cause our subordinate voting share price to be higher than it would be in the absence of such a program, and repurchases under the NCIB expose us to risks resulting from a reduction in the size of our "public float," which may reduce our trading volume as well as our stock price.
There can be no assurance that we will continue to repurchase subordinate voting shares for cancellation.
Although we currently have an NCIB in effect, whether we repurchase shares under such NCIB for cancellation and the amount and timing of any such share repurchases, is subject to capital availability and periodic determinations by our Board that share repurchases are in the best interest of our shareholders and are in compliance with all applicable laws and agreements. Future share repurchases, including their timing and amount, may be affected by, among other factors: our views on potential future capital requirements for strategic transactions, including acquisitions; debt service requirements; our credit rating; changes to applicable tax laws or corporate laws; and changes to our business model. In addition, the amount we spend and the number of shares we are able to repurchase under our NCIB and any future substantial issuer bid may further be affected by a number of other factors, including the shares we repurchase to satisfy stock-based compensation awards, the price of our subordinate voting shares and blackout periods in which we are restricted from repurchasing shares. Our share repurchases may change from time to time, and we cannot provide assurance that we will continue to repurchase subordinate voting shares for cancellation in any particular amounts or at all. A reduction in or elimination of our share repurchases could have a negative effect on our stock price.
Potential unenforceability of judgments.
We are incorporated under the laws of the Province of Ontario, Canada. Our controlling persons, a majority of our directors, and several of our officers are residents of (or are organized in) Canada. Also, a substantial portion of our assets and the assets of
28
these person are located outside of the United States. As a result, it may be difficult to effect service of process within the United States upon those directors, officers, or controlling persons who are not residents of the United States, or to enforce judgments in the United States obtained in courts of the United States. It may also be difficult for shareholders to enforce a U.S. judgment in Canada predicated upon the civil liability provisions of U.S. federal or state securities laws or to succeed in a lawsuit in Canada based only on U.S. federal or state securities laws.
Negative publicity could adversely affect our reputation as well as our business, financial results and share price.
Unfavorable media related to our industry, company, brand, marketing, personnel, operations, business performance, or prospects may affect our share price and the performance of our business, regardless of its accuracy or inaccuracy. The speed at which negative publicity can be disseminated has increased dramatically with the capabilities of electronic communication, including social media outlets, websites, blogs, and newsletters. Our success in maintaining, extending, and expanding our brand image depends on our ability to adapt to this rapidly changing media environment. Adverse publicity or negative commentary from any media outlet could damage our reputation and reduce the demand for our products, which would adversely affect our business.
Our business could be negatively impacted as a result of actions by activist shareholders or others.
Although Onex controls a substantial majority of the voting power of our securities, we may be subject to challenges in the operation of our business due to actions instituted by activist shareholders or others. Responding to such actions could be costly and time-consuming, may not align with our business strategies and could divert the attention of our Board and senior management from the pursuit of our business strategies. Perceived uncertainties as to our future direction as a result of shareholder activism may lead to the perception of a change in the direction of the business or other instability and may make it more difficult to attract and retain qualified personnel and business partners and may adversely affect our relationships with vendors, customers and other third parties.
Our business and operations could be adversely impacted by climate change initiatives.
Concern over climate change has led to international legislative and regulatory initiatives directed at limiting carbon dioxide and other greenhouse gas emissions. Proposed and existing efforts to address climate change by reducing greenhouse gas emissions could directly or indirectly affect our costs of energy, materials, manufacturing, distribution, packaging and other operating costs, which could adversely impact our business and financial results.
A. History and Development of the Company
We were incorporated in Ontario, Canada on September 27, 1996. Our legal and commercial name is Celestica Inc. We are a corporation domiciled in the Province of Ontario, Canada and operate under the
Business Corporations Act
(Ontario) ("OBCA"
)
. Our principal executive offices are currently located at 844 Don Mills Road, Toronto, Ontario, Canada M3C 1V7, and as of April 1, 2019, will be located at 5140 Yonge Street, Suite 1900, Toronto, Ontario, Canada M2N 6L7. Our telephone number is (416) 448-5800, and our internet address is
www.celestica.com
. Information on our website is not incorporated by reference into this Annual Report.
Prior to our incorporation, we were an IBM manufacturing unit that provided manufacturing services to IBM for more than 75 years. In 1993, we began providing electronics manufacturing services to non-IBM customers. In October 1996, we were purchased from IBM by an investor group led by Onex, and in 1998, we completed our initial public offering.
A description of our acquisition activities (including our 2018 acquisitions of Atrenne and Impakt), our principal capital expenditures (including property, plant and equipment), and financing activities, over the last three fiscal years is set forth in notes 3, 4, 5, 12, 13, 22, and 24 to the Consolidated Financial Statements in Item 18, and Item 5, "Operating and Financial Review and Prospects — Management's Discussion and Analysis of Financial Condition and Results of Operations." A description of our divestiture activities (including our restructuring activities) over the last three fiscal years is set forth in notes 4, 7, 8, and 16 to the Consolidated Financial Statements in Item 18, and Item 5, "Operating and Financial Review and Prospects — Management's Discussion and Analysis of Financial Condition and Results of Operations," including a discussion of the consummation of the sale of our real property located in Toronto, Ontario, and related transition matters.
See Item 5, "Operating and Financial Review and Prospects — Management's Discussion and Analysis of Financial Condition and Results of Operations — Liquidity — Additional Commitments" for a description of our significant commitments for capital expenditures as at
December 31, 2018
and those planned for
2019
.
29
See "Business Overview" below for a description of the reorganization of our reporting structure, including our sales, operations and management systems, into two operating and reporting segments, commencing in the first quarter of 2018.
See "Overview —
Celestica's business"
and
"Recent Developments" of Item 5,
"Operating and Financial Review and Prospects — Management's Discussion and Analysis of Financial Condition and Results of Operations" for a discussion of our comprehensive review of our CCS segment revenue portfolio, commenced in the second half of 2018, recent adverse trends impacting our semiconductor capital equipment customers, and the status of our CEI.
There were no public takeover offers by third parties in respect of the Corporation's subordinate voting shares or multiple voting shares or by the Corporation in respect of other companies' shares which occurred during the last or current financial year.
The U.S. Securities and Exchange Commission (SEC) maintains an internet site that contains reports, proxy and information statements, and other information regarding issuers that file electronically with the SEC. The address of that site is http://www.sec.gov.
B. Business Overview
General
As previously disclosed, during the first quarter of 2018, we completed a reorganization of our reporting structure, including our sales, operations and management systems, into two operating and reporting segments: ATS and CCS. Prior to this reorganization, we operated in one reportable segment (Electronic Manufacturing Services), which was comprised of multiple end markets (ATS, Communications and Enterprise during 2017). See note 25 to our Consolidated Financial Statements in Item 18.
Our ATS segment consists of our ATS end market, and is comprised of our aerospace and defense, industrial, smart energy, healthtech, and capital equipment businesses. Our capital equipment business is comprised of our semiconductor, display, and power & signal distribution equipment businesses. Our CCS segment consists of our Communications and Enterprise end markets, and is comprised of our enterprise communications, telecommunications, servers and storage businesses. All period percentages and financial information in this Annual Report reflect the current presentation.
We believe our services and solutions create value for our customers by accelerating their time-to-market, and by providing higher quality, lower cost, and reduced cycle times in our customers' supply chains as compared to their insourcing of these activities. We believe this results in lower total cost of ownership, greater flexibility, higher return on invested capital and improved competitive advantage for our customers in their respective markets.
Our global headquarters is located in Toronto, Canada. We operate a network of sites and centers of excellence (discussed below) strategically located in North America, Europe and Asia, with specialized end-to-end supply chain capabilities tailored to meet specific market and customer product lifecycle requirements.
We offer a comprehensive range of product manufacturing and related supply chain services to our customers in both of our segments, including design and development, new product introduction, engineering services, component sourcing, electronics manufacturing and assembly, testing, complex mechanical assembly, systems integration, precision machining, order fulfillment, logistics, asset management, product licensing, and after-market repair and return services. Within design and development, our JDM offering includes the creation of hardware platforms and design solutions in collaboration with customers, as well as the management of aspects of the supply chain and manufacturing.
Although we supply products and services to over 100 customers, we depend upon a small number of customers for a substantial portion of our revenue. In the aggregate, our top 10 customers represented 70% of our total
2018
revenue. In
2018
, we had
two
customers that individually represented more than 10% of total revenue (Cisco Systems, Inc. and Dell Technologies accounted for 14% and 10%, respectively, of our total revenue for
2018
). Significant reductions in, or the loss of, revenue from these or any of our major customers may have a material adverse effect on us. See Item 3(D) — Key Information — Risk Factors — "
We are dependent on a limited number of customers and end markets. A decline in revenue from, or the loss of, any significant customer, could have a material adverse effect on our financial condition and operating results.
"
Revenue from our ATS segment currently represents approximately one-third of our aggregate revenue but generated just under one-half of our total segment income in 2018. Products and services in this segment are extensive and are often more regulated than in our CCS segment, and can include the following: government-certified and highly-specialized manufacturing, electronic and enclosure-related services for aerospace and defense-related customers; high-precision equipment and integrated subsystems used in the manufacture of semiconductors and displays; a wide range of industrial automation, controls, test and measurement
30
devices; advanced solutions for surgical instruments, diagnostic imaging and patient monitoring; and efficiency products to help manage and monitor the energy and power industries. Our ATS segment businesses typically have a higher margin profile and longer product life cycles than the businesses in our CCS segment. Revenue from our CCS segment currently represents approximately two-thirds of our aggregate revenue and generated just over one-half of our total segment income in 2018. Products and services in this segment consist predominantly of enterprise-level data communications and information processing infrastructure products, and can include routers, switches, servers and storage-related products used by a wide range of businesses and cloud-based service providers to manage digital connectivity, commerce and social media applications. Our CCS segment businesses typically have a lower margin profile and higher volumes than the businesses in our ATS segment, and have been impacted in recent periods (and continue to be impacted) by aggressive pricing, rapid shifts in technology, model obsolescence and the commoditization of certain products.
To increase the value we deliver to our customers, we continue to make investments in people, value-added service offerings, new capabilities, capacity, technology, IT systems, software and tools. We continuously work to improve our productivity, quality, delivery performance and flexibility in our efforts to be recognized as a leading company in the EMS industry. We have invested in automation and the "Digital Factory" to streamline our processes and reduce costs. Our current CEI, and related restructuring actions, are also intended to further streamline our business, increase operational efficiencies and improve our productivity.
Our current priorities are focused on evolving our revenue portfolio; expanding our non-IFRS operating margin and segment margins; and maintaining a balanced approach to capital allocation. See Item 5, "Operating and Financial Review and Prospects — Management's Discussion and Analysis of Financial Condition and Results of Operations — Operating Goals and Principals" for further detail. Operating margin is a non-IFRS measure without a standardized meaning, and may not be comparable to similar measures presented by other companies. See "Non-IFRS measures" in Item 5 — Operating and Financial Review and Prospects, for a discussion of this and other non-IFRS measures included in this Annual Report, and a reconciliation of our non-IFRS measures to the most directly comparable IFRS measures.
We believe that continued investments in these areas support our long-term growth strategy, and will strengthen our competitive position, enhance customer satisfaction, and increase long-term shareholder value. We intend to continue to focus on expanding our revenue base in our higher-value-added services, such as design and development, engineering, and after-market services. However, as we are experiencing slower growth rates and increased pricing pressures in our traditional markets, which account for a substantial portion of our revenue, we will also focus on expanding our business beyond our traditional end markets, including by pursuing new customers and acquisition opportunities in our ATS segment to expand our end market penetration, to diversify our end market mix, and to enhance and add new technologies and capabilities to our offerings.
Electronics Manufacturing Services Industry
Overview
Leading EMS companies manage global networks that are capable of delivering customized supply chain solutions. They offer end-to-end services for the entire product lifecycle, including design and engineering services, manufacturing, assembly and test, systems integration, fulfillment and after-market services. Our customers, which include OEMs, service providers (including cloud-based service providers) and other companies in a wide range of industries, use these services to enhance their competitive positions. Outsourcing manufacturing and related services can help our customers to address their business challenges related to cost, asset utilization, quality, time-to-market, demand volatility, customer support, and rapidly changing technologies.
We believe outsourcing by these companies will continue across a number of industries as a means to:
Reduce Operating Costs and Invested Capital.
Companies that use our services are under continuous pressure to reduce total product lifecycle costs, and property, plant and equipment expenditures. The manufacturing process for electronics products has become increasingly automated, requiring greater levels of investment in property, plant and equipment. EMS companies help enable such companies to gain access to a global network of manufacturing sites with supply chain management expertise, advanced engineering capabilities, flexible capacity and economies of scale. By working with EMS companies, they can reduce their overall product lifecycle and operating costs, working capital and property, plant and equipment investment requirements, and thereby improve their financial performance.
Focus Resources on Core Competencies.
Our customers operate in highly competitive environments, characterized by rapid technological change and short product lifecycles. As a result, many customers prioritize their resources on their core competencies of product development, sales, marketing and customer service, by outsourcing design, engineering, manufacturing, supply chain, product lifecycle management, and other product support requirements to their EMS partners.
31
Improve Time-to-Market.
Electronic products generally experience short lifecycles, requiring companies that use our services to continually reduce the time and cost of bringing products to market. We believe that such companies can significantly improve their product development cycles and enhance time-to-market by benefiting from the expertise and infrastructure of EMS providers, including their capabilities relating to design and engineering services, prototyping and the rapid ramp-up of new products to high-volume production, all with the critical support of global supply chain management and manufacturing networks.
Utilize EMS Companies' Procurement, Inventory Management and Logistics Expertise.
We believe that the successful manufacturing of electronic products requires significant resources to manage the complexities in planning, procurement and inventory management, frequent design changes, short product lifecycles and product demand fluctuations. Companies can help manage these complexities by outsourcing to those EMS providers that (i) possess sophisticated IT systems and global supply chain management capabilities and (ii) can leverage significant component procurement advantages to lower product costs.
Access Leading Engineering Capabilities and Technologies.
Electronic products and the electronics manufacturing technology needed to support them are complex and require significant investment. As a result, some companies rely on EMS providers for design and engineering services, supply chain management, and manufacturing and technological expertise. Through their design and engineering services, and through the knowledge gained from manufacturing and repairing products, EMS providers can assist such companies in the development of new product concepts, or the re-design of existing products, as well as assist with improvements in the performance, cost and time required to bring products to market. In addition, companies can gain access to high-quality manufacturing expertise and capabilities in the areas of advanced process, interconnect and test technologies.
Improve Access to Global Markets.
Some of our customers provide products or services to a global customer base. EMS companies with global infrastructure and support capabilities help to provide customers with efficient world-wide manufacturing solutions, distribution capabilities and after-market services.
Access Value-Added Service Offerings.
EMS providers strive to expand their offerings to include services such as design, fulfillment and after-market services, including repair and recycling, to encourage companies to outsource more of their cost of goods sold.
Celestica's Strategy
We are focused on building solid partnerships and delivering informed, flexible solutions intended to contribute to our customers' success. To achieve this, we collaborate with our customers in an effort to identify and meet their current and future requirements. We offer a range of services designed to deliver lower costs, increased flexibility and predictability, improved quality and responsive service. We constantly seek to advance our quality, engineering, manufacturing and supply chain capabilities to help our customers achieve a competitive advantage. We will continue to focus on our pursuit of the following, intended to strengthen our competitive position and enhance customer satisfaction and shareholder value:
Increase Penetration in our End Markets.
We strive to establish a diverse customer base across several industries. We believe our expertise in technology, quality and supply chain management, in addition to our service offerings and centers of excellence, have positioned us as an attractive partner to companies across various markets. Our goal is to grow across our end markets, with particular emphasis on expanding our ATS segment, both organically and through acquisitions. Revenue dollars from our ATS segment increased by 13% from 2016 to 2018, while representing 33% of our total revenue over the same period.
Our revenue by end market as a percentage of total revenue is as follows:
|
2016
|
2017
|
2018
|
|||
|
ATS
|
32%
|
32%
|
33%
|
||
|
Communications
|
42%
|
43%
|
41%
|
||
|
Enterprise
|
26%
|
25%
|
26%
|
||
Selectively Pursue Acquisitions and Strategic Transactions.
We will continue to selectively seek acquisition opportunities and strategic transactions in order to (i) profitably grow our revenue, (ii) further develop strategic relationships with customers in our end markets and (iii) enhance the scope of our capabilities and service offerings. See Item 5, "Operating and Financial Review and Prospects — Management's Discussion and Analysis of Financial Condition and Results of Operations — Recent developments" for a discussion of our recent acquisitions of Atrenne and Impakt in our ATS segment.
Continuously Improve Operational Performance.
We will continue to focus on (i) managing our mix and volume of business and service offerings to improve our overall margins, (ii) leveraging our supply chain practices globally to lower materials costs,
32
minimize lead times and improve our planning cycle to better meet volatility in customer demand and improve asset utilization and inventory levels, and (iii) improving operating efficiencies to reduce costs and improve margins, including through our CEI and our CCS portfolio review. In order to help us streamline our processes, we have been increasing our investments in the "Digital Factory", and automating and connecting our equipment, people and systems throughout our global network, including our customers and suppliers. Nonetheless, the mix of our business can impact our revenue and overall margins. Although our revenues increased in 2018 compared to 2017, our mix of programs negatively impacted our gross margins, as certain new programs contributed lower gross profit than past programs (including a higher concentration of fulfillment services in 2018 that contributed significantly lower gross profit than our historical full-service traditional EMS programs). We also intend to continue to invest in higher margin services (including our JDM offering), continue our focus on driving better inventory performance in the constrained materials environment, and completing our CEI. Although revenue from our ATS segment in 2018 increased by 13% compared to 2017, ATS segment income increased 6% for the same period, impacted in part by sharp demand decreases in the cyclical semiconductor market we experienced in the second half of 2018. Our CEI includes actions to align this business to the current demand environment to improve its profitability. See Item 5, "Operating and Financial Review and Prospects."
Develop and Grow Trusted Relationships with Leading Customers.
We continue to seek to build profitable, strategic relationships with industry leaders that we believe can benefit from our services and solutions. We strive to respond to our customers' needs with speed, flexibility and predictability in delivering results. We have established and maintain strong relationships with a diverse mix of leading OEMs, service providers (including cloud-based service providers) and other companies across our end markets. We believe that our customer base is a strong potential source of growth for us as we seek to strengthen these relationships through the delivery of additional services.
Expand Range of Service Offerings and Continue to Invest in Developing New Technology, Quality Products and Supply Chain Solutions and Services.
We continually seek to expand the services we offer to our customers, and we are committed to meeting our customers' needs in the areas of technology, quality and supply chain management. We believe our expertise in these areas enables us to meet the rigorous demands of our customers, allows us to produce a variety of electronic products ranging from high-volume electronics to highly complex technology infrastructure products used in a broad array of end markets, and allows us to deliver consistently reliable products to our customers. We also believe the systems and collaborative processes associated with our expertise in supply chain management help us to adjust our operations to meet the lead time requirements of our customers, and quickly and effectively deliver products directly to end customers. We collaborate with our suppliers to influence component design for the benefit of our customers. As a result of the successes that we have had in these areas, we have been recognized with numerous customer and industry achievement awards.
See Item 5, "Operating and Financial Review and Prospects — Management's Discussion and Analysis of Financial Condition and Results of Operations — Operating Goals and Principals" for a discussion of our current priorities and areas of focus pertaining to evolving our revenue portfolio, expanding our non-IFRS operating margin and segment margins, and maintaining a balanced approach to capital allocation.
Celestica's Business
Innovative Supply Chain Solutions and Services
We are a global provider of innovative supply chain solutions. We offer a range of services including design and development , engineering services, supply chain management, new product introduction, component sourcing, electronics manufacturing, assembly and test, complex mechanical assembly, systems integration, precision machining, order fulfillment, logistics, asset management, product licensing, and after-market repair and return services. Our design and development services include our JDM offering, which consists of developing hardware platforms and design solutions in collaboration primarily with CCS segment customers, as well as managing aspects of the supply chain and manufacturing. We believe that our JDM offering differentiates us from other EMS providers, by encompassing advanced technology design solutions that customers can tailor to their specific platform applications. We execute our business in our global network of sites, including our designated centers of excellence, strategically located in North America, Europe and Asia. We leverage these sites and centers of excellence, information technology, and our supply chain expertise using collaborative processes and a team of highly skilled, customer-focused employees. We believe that our ability to deliver a range of supply chain solutions, including hardware platforms, to our customers provides them with a competitive lead time, and advantages in quality, flexibility and total cost of ownership.
The objective of our centers of excellence program is to help ensure that our operations reflect a solid understanding of the markets we serve, have current capabilities and standardized practices, and are positioned to provide efficiency, consistency, and value to our customers around the globe. To obtain "center of excellence" status, our sites must meet our defined criteria pertaining
33
to quality, supply chain capabilities, Lean and Six Sigma, market specific certifications (to the extent applicable), and other matters regarding their operations.
Quality, Lean and Six Sigma Culture
We believe one of our strengths is our ability to consistently deliver high-quality services and products. We have an extensive quality management system that focuses on continual process improvement and achieving high levels of customer satisfaction. We employ a variety of advanced statistical engineering techniques and other tools to assist in improving product and service quality. Most of our principal sites are ISO 9001 and ISO 14001 certified (international quality management standards), and have other required industry-specific certifications.
In addition to these standards, we deploy Lean and Six Sigma initiatives throughout our operations network to deliver customer value and eliminate defects and waste. Implementing Lean initiatives across our manufacturing processes helps drive efficiencies, cycle times velocities and improve product quality. We use Six Sigma extensively in an effort to reduce process variation and to drive root cause problem-solving. Lean and Six Sigma methods are also used in non-production areas to streamline our processes and eliminate waste. For example, our completed Global Business Services (GBS) initiative focused on integrating, standardizing and optimizing our end-to-end business processes throughout our organization. We apply the knowledge we gain in our after-market services to help improve the quality and reliability of next-generation products. Success in these areas helps our customers to lower their costs, positioning them more competitively in their respective markets.
Design and Engineering Services
Our global design teams are focused on delivering flexible solutions and expertise, intended to help customers reduce overall product costs, improve time-to-market, and introduce competitively differentiated products. For customer-owned designs, we partner with our customers to augment their design teams, and utilize our proprietary design analysis tools to minimize design revisions and to achieve improved manufacturing yields. Our JDM service involves developing hardware platforms and design solutions in collaboration with customers, managing aspects of the supply chain, and manufacturing their products. We continue to invest in leading-edge product roadmaps and design capabilities aligned with both market standards and emerging technologies in support of our JDM offering. We are currently delivering both partially customized JDM products, and complete hardware platform solutions to customers in the storage, servers, communications, and industrial markets. These products are intended to help our customers reach their markets faster, while reducing product costs and building valuable IP for their product portfolios. Through our collective experience with common technologies across multiple industries and product groups, we believe we provide quality and cost-focused solutions for a wide range of our customers' design needs. Revenue attributable to our JDM business grew approximately 30% in 2018 as compared to the prior year.
We collaborate with some of our core customers' product designers in the early stages of product development, using advanced tools to enable new product ideas to progress from electrical and application-specific integrated circuit design, to simulation, physical layout and design review, all intended to ensure readiness for manufacturing. We leverage our design expertise to create innovative technologies and hardware product solutions, and leverage key ecosystem partners to drive both innovation and supply chain leverage. Our JDM offerings encompass advanced technology hardware design solutions that customers can tailor to their specific platform applications. We believe that collaboration between our customers' teams, key ecosystem partners, and our design and manufacturing groups helps to ensure that new designs are released rapidly, smoothly and cohesively into production.
Our engineering services team works with our customers throughout the product life-cycle. We believe our engineering expertise and experience in design review, product test solutions, assembly technology, automation, quality and reliability, position us to deliver the services required to address the challenges facing our customers. We maintain ties with key industry associations and engineering firms to help us stay apprised of advances in technical knowledge.
Prototyping and New Product Introduction
Prototyping is a critical early-stage process in the development of new products. Our engineers collaborate with our customers' engineers to provide quick responses in the early stages of the product development lifecycle.
Supply Chain Management and Services
We use advanced planning, analytics, enterprise resource planning, and supply chain management systems to optimize materials management from suppliers to our customers' customers. We believe that the effective management of the supply chain is critical to our customers' success, as it directly impacts the time and cost required to deliver products to market and the capital requirements associated with carrying inventory.
34
We strive to reduce our customers' total cost of ownership by providing lower costs and reduced cycle times in their supply chain, and by delivering higher quality products. We also strive to align our preferred suppliers in close proximity to our centers of excellence to increase the speed and flexibility of our supply chain, to deliver higher quality products and to reduce time-to-market. We believe we deliver a differentiated supply chain offering.
Through our global supply chain management processes and integrated IT tools, we endeavor to provide our customers with enhanced visibility to balance their global demand and supply requirements, including inventory and order management.
Manufacturing Services
Printed Circuit Board Assembly
Printed circuit board assembly includes the attachment of electronic components, such as capacitors, microprocessors, resistors and memory modules, to printed circuit boards. Our global network of engineers helps us to provide our customers with full printed circuit board ("PCB") assembly technology capabilities. These capabilities include design for manufacturing, PCB layout, packaging, assembly (circuit card assembly or CCA), lead-free soldering, test development, and data analytics for complex flexible and rigid-flex circuits and hybrid PCBs.
Complex Mechanical Assembly
We provide systems integration and precision machined components to our capital equipment customers. Complex mechanical systems integration consists of multiple interconnected subsystems that interact with various materials, e.g., fluids, solids, particles and rigid bodies. Such systems are often used in advanced manufacturing applications such as semiconductor manufacturing, display manufacturing (including LCD, OLED, QLED and other displays), medical applications using robotics, and other applications such as cash handling machines where precise standards are required.
As a result of our acquisition of the assets of Karel, we now also provide complex mechanical assembly primarily to our aerospace customers, including wire harness assembly, systems integration, sheet metal fabrication, welding and machining.
Precision Machining
We utilize specialized computer-controlled machines to manufacture high quality components to tight tolerance requirements. Such components are often used in applications similar to those noted above for complex mechanical assembly.
Smart Energy Services
We provide integrated smart energy solutions and services to our renewable energy customers in the areas of power generation, conversion and monitoring. We deliver complete product lifecycle solutions, including design, manufacturing and reliability services for power inverters, metering and controls electronics, and energy storage subsystems. Although we have exited the solar panel manufacturing business, we remain committed to growing the other areas within our smart energy market portfolio, which include power inverters, energy storage products, smart meters and other electronic componentry.
Systems Assembly and Test
We use sophisticated technologies in the assembly and testing of our products. We continue to make investments in the development of automated solutions, as well as new assembly and test process techniques intended to enhance product quality, reduce cost and improve delivery time to customers. We work independently and also collaborate with customers and suppliers to develop assembly and test technologies. Systems assembly and testing require sophisticated logistics capabilities to rapidly procure components, assemble products, perform complex testing and distribute products to customers around the world. Our full systems assembly services involve combining and testing a wide range of sub-assemblies and components before shipping them to their final destination. Increasingly, customers require custom build-to-order system solutions with very short lead times and we are focused on using our advanced supply chain management capabilities to respond to our customers' needs.
Quality and Product Assurance
We provide complete product reliability testing, inspection and qualification capabilities to support our customers' full product lifecycle requirements. Our quality and product assurance teams perform product testing to ensure that designs meet or exceed required specifications. We are capable of testing to various industry standards, and we work closely with our customers to execute unique test protocols. We believe that this service allows our customers to assess certification risks early in the product development lifecycle, reducing cost and time-to-market.
35
Failure Analysis and After-Market Services
Our extensive failure analysis capabilities concentrate on identifying the root cause of product failures and determining corrective actions. The root causes of failures typically relate to inherent component defects and/or deficiencies in design specifications. Products are subjected to various environmental extremes, including temperature, humidity, vibration, voltage and contamination. Field conditions are simulated in failure analysis laboratories which employ electron microscopes, spectrometers and other advanced equipment. Our engineers work proactively in partnership with suppliers and customers in an effort to discover product failures before products are shipped, and to develop and implement resolutions if required.
We also seek to provide value to our customers through our after-market services offerings which include repair, fulfillment, reverse logistics, asset management, reclamation and returns processing and prevention. Our fulfillment offering includes the design and management of integrated supply chain and materials management for light manufacturing and final assembly and reclamation. Our reverse logistics offering includes the design and management of transportation networks, warehousing and distribution of products, asset recovery services, and transportation and supply chain event monitoring. Our returns processing and prevention offering provides our customers with product screening and testing and product design and process analysis. Our reclamation offering includes product disassembly, reassembly and re-use, as well as certified scrap disposition processing. We offer these services individually or integrated through a 'Control Tower' model which coordinates our people, systems and processes with those of our customers to improve service levels by providing an increased level of visibility and analytics throughout the entire after-market value chain.
Geographies
For each of
2016
,
2017
and
2018
, approximately 70% of our revenue was produced in Asia and approximately 20% of our revenue was produced in North America. Revenue produced in Canada represented 9% of revenue in
2018
(
2017
— 8%;
2016
— 8%). Our property, plant and equipment in Canada represented 9% of our property, plant and equipment at
December 31, 2018
(
December 31, 2017
— 6%;
December 31, 2016
— 7%). A listing of our principal locations is included in Item 4(D), "Information on the Company — Property, Plants and Equipment." Certain geographic information for countries exceeding 10% of our external revenue, property, plant and equipment, and intangible assets and goodwill is set forth in note 25 to the Consolidated Financial Statements in Item 18.
Marketing and Customer Experience
We structure our business development teams by end market, with a focus on offering market insight and expertise, and complete manufacturing and supply chain solutions to our customers. We have customer-focused teams, each headed by a group general manager who oversees the global relationship with our key customers. These teams work with our Solutions Architects to meet the requirements of each customer's product or supply chain. Our global network is comprised of customer-focused teams, operational and project managers, and supply chain management teams, as well as senior executives.
Our goal is to effectively collaborate with our customers, and towards that end, we provide comprehensive support before, during and after the delivery of our products and services. We seek to deepen and grow our customer relationships by providing consistent, high-quality implementation and customer support services, which we believe drives higher customer retention and additional opportunities within our existing customer base.
Customer Concentration and Relationship Management
As stated above, we supply products and services to over 100 customers. We target industry-leading customers in each of our segments. Our CCS segment customers include Cisco Systems, Inc., Dell Technologies, Hewlett-Packard Enterprise, Hewlett-Packard Inc., IBM Corporation, Juniper Networks, Inc., NEC Corporation, Oracle Corporation, Polycom, Inc., and Western Digital Corporation. Our ATS segment customers include Applied Materials, Inc. and Honeywell Inc. We are focused on strengthening our relationships with these and other strategic customers through the delivery of new and expanding end-to-end solutions.
During
2018
,
two
customers (Cisco Systems, Inc., which accounted for 14% of total
2018
revenue, and Dell Technologies, which accounted for 10% of total
2018
revenue) individually represented more than 10% of total revenue (
2017
— two customers: Cisco Systems, Inc., (18%) and Juniper Networks, Inc. (13%);
2016
— two customers: Cisco Systems, Inc. (19%) and Juniper Networks, Inc. (11%)). Each of these customers are in our CCS segment. Our top 10 customers represented 70%, 71% and 68% of total revenue for
2018
,
2017
and
2016
, respectively.
We generally enter into master supply agreements with our customers that provide the framework for our overall relationship, although the level of business under those agreements is not guaranteed. Instead, we bid on a program-by-program basis and typically receive customer purchase orders for specific quantities and timing of products. A majority of these agreements also
36
require the customer to purchase unused inventory that we have purchased to fulfill that customer's forecasted manufacturing demand. Some of these agreements require us to provide specific price reductions to our customers over the term of the contracts. We expect such price reductions to become more prevalent as customers increasingly seek longer-term contracts to lock in their supply, terms and pricing. This has, and could continue to, adversely impact our operating results in future periods.
Research and Technology Development
We use advanced technology to design, assemble and test the products we manufacture. We continue to increase investment in our global design services and capabilities to conceive differentiated JDM product solutions for our customers.
We believe that our customer-focused factories are flexible and can be reconfigured as needed to meet customer-specific product requirements and fluctuations in volumes (although we do incur increased production costs from time to time in connection with unexpected demand changes). We have extensive capabilities across a broad range of specialized assembly, configuration and test processes. We work with a variety of substrates based on the products we build for our customers, from thin, flexible printed circuit boards to highly complex, dense multi-layer printed circuit boards, as well as a broad array of advanced component and attachment technologies employed in our customers' products and our own product designs. We believe that increasing demand for full-system assembly solutions continues to drive technical advancement in complex mechanical assembly and configuration. We also develop and manufacture sub-components, such as optical modules and complex machined parts, intended to drive targeted technical advancements to support these opportunities.
Our automated electronics assembly lines are continuously refreshed with the latest generation technology, with a focus on flexible lines with quick changeover, large board capability, and small component capability. Our assembly capabilities are complemented by advanced test capabilities. The technologies we use include high-speed functional testing, optical, burn-in, vibration, radio frequency, and in-circuit and in-situ dynamic thermal cycling stress testing. Our inspection technology includes X-ray computed tomography, advanced automated optical inspection, three-dimensional paste volumetric inspection and scanning electron microscopy. We work directly with leaders in the equipment industry to optimize their products and solutions or to jointly design solutions to meet the needs of our customers. We apply automation solutions for higher volume products, where possible, to help improve product quality, lower product costs, and increase manufacturing efficiencies.
Our ongoing research and development activities include the development of processes and test technologies, as well as focused product development and technology building blocks that can be used by customers in the development of their products, or to accelerate their products' time-to-market. Our JDM offering is focused on developing these design solutions and subsequently managing the other aspects of the supply chain, including manufacturing of the products. We focus our solutions on developing current and next generation storage, server and communications products (in particular, elements of data centers, which include the development of complete hardware platf
orm solutions to reduce product costs and accelerate time to market, and which we believe will continue to grow). We work directly with our customers to understand their product roadmaps and to develop technology solutions intended to meet the
ir particular needs. We are proactive in developing manufacturing techniques that take advantage of the latest component, product and packaging designs. We have worked with, and have taken leadership roles in, industry and academic groups that strive to advance the state of technology in the industry. As we continue to pursue deeper relationships with our customers, and participate in additional services and revenue opportunities with them, we anticipate an increase in our spending in these development areas.
Supply Chain Management
We share data electronically with our key suppliers, and help ensure speed of supply through strong relationships with our component suppliers and logistics partners. We view the size and scale of our procurement activities, including our IT systems, as an important competitive advantage, as they enhance our ability to obtain better pricing, influence component packaging and designs, and obtain a supply of components in constrained markets. We procure substantially all of our materials and components on behalf of our customers pursuant to individual purchase orders that are generally short-term in nature.
Components and raw materials are sourced globally, with a majority of electronic components originating from Asian countries. We continue to experience materials constraints from certain suppliers in both our segments, due in part to industry-wide shortages for certain electronic components. These shortages caused delays in the production of customer products, and required us to carry higher than expected levels of inventory, commencing in 2017 and continuing throughout 2018. Although we expect these materials constraints and resulting adverse impacts to continue in the near term, we have begun to see improvements in the availability of certain previously constrained items. Nonetheless, only minor improvements in supplier lead times are currently expected. See Item 3(D) — "Key Information — Risk Factors" for a discussion of various risks related to our foreign operations. All of the products we manufacture or assemble require one or more components. In many cases, there may be only one supplier of a particular component. Some of these components could be rationed in response to supply shortages. We work with our suppliers
37
and customers to attempt to ensure continuity in the supply of these components. In cases where unanticipated customer demand or supply shortages occur, we attempt to arrange for alternative sources of supply, where available, or defer planned production in response to the availability of the critical components. Notwithstanding these efforts, however, materials constraints from certain suppliers caused delays in the production of customer products during
2018
. See Item 3(D) Key Information — Risk Factors,
"
We are dependent on third parties to supply certain materials, and our results can be negatively affected by the availability and cost of such materials.
"
We utilize our enterprise systems, as well as specific supply chain IT tools, to provide comprehensive information on our logistics, financial and engineering support functions. These systems provide management with the data and analytics required to manage the logistical complexities of our business and are augmented by and integrated with other applications, such as shop floor controls, component and product database management, and design tools.
To minimize the risk associated with inventory, we primarily order materials and components only to the extent necessary to satisfy existing customer orders and forecasts covered by the applicable customer contract terms and conditions. We have implemented specific inventory management strategies with certain suppliers, such as "supplier managed inventory" (pulling inventory at the production line on an as-needed basis) and on-site stocking programs. Our initiatives in Lean and Six Sigma also focus on eliminating excess inventory throughout the supply chain. Notwithstanding the foregoing, however, as a result of demand volatility from our customers and the materials constraints from certain suppliers discussed above, we carried higher than expected levels of inventory at
December 31, 2018
. We expect these adverse market conditions to continue in the near term.
Intellectual Property
We hold licenses to various technologies which we have acquired in connection with acquisitions. In addition, we believe that we have secured access to all required technology that is material to the current conduct of our business.
We regard our manufacturing processes and certain designs as proprietary trade secrets and confidential information. We rely largely upon a combination of trade secret laws, non-disclosure agreements with our customers, suppliers, employees and other parties, and upon our internal security systems, confidentiality procedures and employee confidentiality agreements to maintain the trade secrecy of our designs and manufacturing processes. Although we take steps to protect our trade secrets, there can be no assurance that misappropriation will not occur. See Item 3(D) Key Information — Risk Factors,
"We may not adequately protect our intellectual property or the intellectual property of others."
We currently have a limited number of patents and patent applications pending to protect our intellectual property. However, we believe that the rapid pace of technological change makes patent protection less significant than such factors as the knowledge and experience of management and personnel, and our ability to develop, enhance and market electronics manufacturing services.
Each of our customers typically provides us with a license to its technology for use in providing electronics manufacturing services to such customer. Generally, the agreements governing such technology grant to us non-exclusive, worldwide licenses with respect to the subject technologies, are typically provided without charge, and terminate upon a material breach by us of the terms of such agreements, or termination of the program to which such licenses relate.
We also license some technology from third parties that we use in providing electronics manufacturing services to our customers. We believe that such licenses are generally available on commercial terms from a number of licensors. Generally, the agreements governing such technology grant to us non-exclusive, worldwide licenses with respect to the subject technologies and terminate upon expiration, or a material breach by us of the terms, of such agreements.
Competition
The EMS industry is highly competitive with multiple global EMS providers competing for customers and programs. Our competitors include Benchmark Electronics, Inc., Flex Ltd., Hon Hai Precision Industry Co., Ltd., Jabil Circuit, Inc., Plexus Corp., and Sanmina Corporation, as well as smaller EMS companies that often have a regional, product, service or industry-specific focus, and ODMs that provide internally designed products and manufacturing services. As part of our JDM offering, we also provide complete hardware platform solutions, which may compete with those of our customers. Offering products or services to customers that compete with the offerings of other customers may negatively impact our relationship with, or result in a loss of business from, such other customers.
We also face indirect competition from current and prospective customers who evaluate our capabilities and commercial models against the merits of manufacturing products internally, and from distribution and logistics providers expanding their services across the supply chain, including assembly, fulfillment, logistics and in some cases, engineering services. We compete with different companies depending on the type of service or geographic area. Some of our competitors have greater scale and
38
provide a broader range of services than we provide. We believe our competitive advantage is our track record in manufacturing technology, quality, complexity, responsiveness and cost-effective, value-added services. To remain competitive, we believe we must continue to provide technologically advanced manufacturing services and solutions, maintain quality levels, offer flexible delivery schedules, deliver finished products and services on time and compete favorably on price.
The competitive landscape in the CCS area remains aggressive, as demand growth continues to move from traditional enterprise network infrastructure providers to cloud-based service providers, resulting in aggressive bidding from EMS providers and increased competition from ODMs as they further penetrate these markets. As a result of the high concentration of our business in the CCS marketplace, we expect continued competitive pressures, aggressive pricing and technology-driven demand shifts, as well as certain materials constraints, to negatively impact our CCS businesses in future periods. We intend to continue to monitor these dynamics and focus on cost management in response to these factors. To enhance our competitiveness, we continue to focus on expanding our service offerings and capabilities beyond our traditional areas of EMS expertise.
See Item 3(D) Key Information — Risk Factors —
"We operate in an industry comprised of numerous competitors and aggressive pricing dynamics"
and Item 5, "Operating and Financial Review and Prospects — Management's Discussion and Analysis of Financial Condition and Results of Operations — Recent developments —
Segment Reorganization and Segment Environment.
"
Environmental Matters
We are subject to various federal/national, state/provincial, local, foreign and supra-national laws and regulations, including environmental measures relating to the release, use, storage, treatment, transportation, discharge, disposal and remediation of contaminants, hazardous substances and waste, and health and safety measures related to practices and procedures applicable to the construction and operation of our sites. We have management systems in place designed to maintain compliance with such laws and regulations.
Our past operations and the historical operation by others of our sites may have resulted in soil and groundwater contamination on our sites, and in many jurisdictions in which we operate, environmental laws impose liability for the costs of removal, remediation or risk assessment of hazardous or toxic substances on an owner, occupier or operator of real property even if such person or company was unaware of or not responsible for the discharge or migration of such substances. From time-to-time we investigate, remediate and monitor soil and groundwater contamination at certain operating sites. We generally obtain Phase I or similar environmental assessments (which involve general inspections without soil sampling or groundwater analysis), or review assessment reports undertaken by others, for our manufacturing sites at the time of acquisition or leasing. However, such assessments may not reveal all environmental liabilities (due, for example, to limited available information about prior operations at the properties or other gaps in information at the time we acquire or lease such sites), and assessments have not been obtained for all sites. Where contamination is suspected at sites being acquired or leased, Phase II intrusive environmental assessments (that can include soil and/or groundwater testing) are usually performed. We expect to conduct Phase I or similar environmental assessments in respect of future property acquisitions or leases and intend to perform Phase II assessments where appropriate. Past environmental assessments have not revealed any environmental liability that we believe will have a material adverse effect on our operating results or financial condition, in part because of contractual retention of liability by landlords and former owners at certain sites. However, any such contractual retention of liability may not provide sufficient protection to reduce or eliminate our liability. Third‑party claims for damages or personal injury are also possible and could result in significant costs to us. If more stringent compliance or cleanup standards under environmental laws or regulations are imposed, or the results of future testing and analyses at our current or former sites indicate that we are responsible for the release of hazardous substances into the air, ground and/or water, we may be subject to additional liability. Environmental matters may arise in the future at sites where no problem is currently known or at sites that we may acquire in the future. See Item 3(D) Key Information — Risk Factors —
"
Compliance with governmental laws and obligations could be costly and may negatively impact our financial performance.
"
Environmental legislation also occurs at the product level. Celestica works with its customers in connection with compliance with applicable product-level environmental legislation in the jurisdictions where products are manufactured and/or offered for use and sale by our customers.
Backlog
Although we obtain purchase orders from our customers, they typically do not commit to delivery of products more than 30 to 90 days in advance. We do not believe that the backlog of expected product sales covered by purchase orders is a meaningful measure of future sales, since generally orders may be rescheduled or canceled.
39
Seasonality
Seasonality is reflected in the mix of products we manufacture from quarter-to-quarter. From time to time, we experience some level of seasonality in our quarterly revenue patterns across certain of our businesses. The addition of new customers may also introduce different demand cycles than our existing businesses. For example, cloud-based service providers have increased their use of products in our CCS segment in recent periods. These customers and markets are cyclically different from our traditional OEM customers, creating more volatility and unpredictability in our revenue patterns as we adjust to this shift, and additional challenges with respect to the management of our working capital requirements. The pace of technological change, the frequency of customers transferring business among EMS competitors and the constantly changing dynamics of the global economy will also continue to impact us. As a result of these factors, the impact of new program wins or program losses, overall demand variability, and limited visibility in technology end markets, it is difficult to isolate the impact of seasonality on our business. In recent periods, revenue from the storage component of our CCS segment has increased in the fourth quarter of the year compared to the third quarter, and then decreased in the first quarter of the following year, reflecting the increase in customer demand we typically experience in this business in the fourth quarter. In addition, we typically experience our lowest overall revenue levels during the first quarter of each year. There is no assurance that these patterns will continue. See also Item 3D Key Information — Risk Factors —
"Our revenue and operating results may vary significantly from period to period."
Controlling Shareholder Interest
Onex is our controlling shareholder with an approximate 80% voting interest in Celestica. Accordingly, Onex has the ability to exercise a significant influence over our business and affairs and generally has the power to determine all matters submitted to a vote of our shareholders where the subordinate voting shares and multiple voting shares vote together as a single class. Such matters include electing our Board and thereby influencing significant corporate transactions, including mergers, acquisitions, divestitures and financing arrangements. Gerald W. Schwartz, the Chairman of the Board, President and Chief Executive Officer of Onex, indirectly owns shares representing the majority of the voting rights of the shares of Onex. For further details, refer to Item 3D Key Information — Risk Factors —
"The interest of our controlling shareholder, Onex Corporation, with an approximate 80% voting interest, may conflict with the interests of other shareholders"
and footnotes 2 and 3 of Item 7(A) "Major Shareholders and Related Party Transactions — Major Shareholders."
Government Regulation
Information regarding material effects of government regulations on Celestica's business is provided in the risk factors entitled
"We are subject to the risk of increasing income and other taxes, tax audits and the challenges of successfully defending our tax positions, and obtaining, renewing or meeting the conditions of tax incentives and credits, any of which may adversely affect our financial performance
,
"
"Compliance with governmental laws and obligations could be costly and may negatively impact our financial performance
,
"
"Compliance or the failure to comply with employment laws and regulations may negatively impact our financial performance," and "Policies or legislation proposed or instituted by the current U.S. administration could have a material adverse effect on our business, results of operations and financial condition"
in Item 3(D) Key Information — Risk Factors.
Sustainability
Celestica’s strategy in regard to sustainability is to integrate the elements of our sustainability program into every aspect of our business. The five elements of our strategy are employee sustainability, environmental sustainability, materials stewardship, sustainable solutions and sustainable communities.
Our guiding policies and principles include:
|
•
|
Our Values, developed with input from our employees to reflect the characteristics and behaviors that are core to Celestica;
|
|
•
|
Our Business Conduct Governance Policy, which outlines the ethics and practices we consider necessary for a positive working environment and the high legal and ethical standards to which our employees are held accountable; and
|
|
•
|
The Code of Conduct of the RBA, of which we were a founding (and remain a) member. The RBA's Code of Conduct outlines industry standards intended to ensure that working conditions in the supply chain are safe, workers are treated with respect and dignity, and manufacturing processes are environmentally responsible. We are continually working to implement, manage and audit our compliance with the RBA's Code of Conduct.
|
40
We publish a Sustainability Report and a Business Conduct Governance Policy, both of which are available (along with our Values) on our corporate website at
www.celestica.com
. These documents outline our sustainability strategy, our high standards for business ethics, the policies we value and uphold, the progress we have made as a socially responsible organization and the key milestones we are working to achieve in 2019 and beyond.
Financial Information Regarding Geographic Areas
Details of our financial information regarding geographic areas are disclosed in note 25 to the Consolidated Financial Statements in Item 18, in Item 4(B) "Information on the Company — Business Overview — Geographies," and in Item 4(D) "Information on the Company — Property, Plants and Equipment." Risks associated with our foreign operations are disclosed in Item 3(D) "Key Information — Risk Factors", including "
Our ability to successfully manage unexpected changes or risks inherent in our global operations and supply chain may adversely impact our financial performance
."
C. Organizational Structure
Onex, an Ontario corporation, is the Corporation's controlling shareholder with an approximate
80
% voting interest in Celestica (via its direct and indirect beneficial ownership of approximately 18.6 million (100%) of the Corporation's multiple voting shares, and approximately 0.4 million of the Corporation's subordinate voting shares). Gerald W. Schwartz is the Chairman of the Board, President, and Chief Executive Officer of Onex, and indirectly owns multiple voting shares of Onex carrying the right to elect a majority of the Onex Board of Directors (see footnotes 2 and 3 to the Major Shareholders Table in Item 7(A) below).
Celestica conducts its business through subsidiaries operating on a worldwide basis. The following companies are considered significant subsidiaries of Celestica, and each of them is wholly-owned, directly or indirectly, by Celestica:
Celestica Cayman Holdings 1 Limited, a Cayman Islands corporation;
Celestica Cayman Holdings 9 Limited, a Cayman Islands corporation;
Celestica (Dongguan-SSL) Technology Limited, a China corporation;
Celestica Holdings Pte Limited, a Singapore corporation;
Celestica Hong Kong Limited, a Hong Kong corporation;
Celestica LLC, a Delaware, U.S. limited liability company;
Celestica (Suzhou) Technology Co. Ltd, a China corporation;
Celestica (Thailand) Limited, a Thailand corporation;
Celestica (USA) Inc., a Delaware, U.S. corporation;
Impakt Holdings LLC, a Delaware, U.S. limited liability company; and
2480333 Ontario Inc., an Ontario, Canada corporation.
D. Property, Plants and Equipment
The following table summarizes our principal owned and leased properties as of February 13, 2019. These sites are used to provide manufacturing services and solutions, such as the manufacture of printed circuit boards, assembly and configuration of final systems, complex mechanical assembly, precision machining as well as other related services and customer support activities, including design and development, warehousing, distribution, fulfillment and after-market services.
41
|
Major locations
|
Square Footage
(1)
(in thousands)
|
Owned/Leased (2)
|
Lease Expiration Dates
|
||
|
Canada
(5)
|
888
|
Owned
|
N/A
|
||
|
Canada
(3)(5)
|
341
|
Leased
|
between 2020 and 2028
|
||
|
Arizona
|
111
|
Leased
|
2027
|
||
|
California
(3)
|
506
|
Leased
|
between 2019 and 2023
|
||
|
Oregon
|
188
|
Leased
|
2021
|
||
|
Massachusetts
|
55
|
Owned
|
N/A
|
||
|
Minnesota
(3)
|
60
|
Leased
|
between 2019 and 2021
|
||
|
Mexico
(3)
|
476
|
Leased
|
between 2019 and 2023
|
||
|
Ireland
(3)
|
171
|
Leased
|
between 2020 and 2024
|
||
|
Spain
|
109
|
Owned
|
N/A
|
||
|
Romania
|
297
|
Owned
|
N/A
|
||
|
China
(3)(4)
|
1,147
|
Owned/Leased
|
between 2020 and 2056
|
||
|
Malaysia
(3)(4)
|
1,350
|
Owned/Leased
|
between 2019 and 2060
|
||
|
Thailand
(3)(4)
|
903
|
Owned/Leased
|
between 2019 and 2048
|
||
|
Singapore
(3)
|
202
|
Leased
|
between 2019 and 2021
|
||
|
South Korea
(3)
|
279
|
Owned/Leased
|
between 2019 and 2024
|
||
|
Japan
(3)
|
563
|
Owned/Leased
|
between 2020 and 2022
|
||
|
Laos
|
121
|
Leased
|
between 2021 and 2023
|
||
|
(1)
|
Represents estimated square footage being used.
|
|
(2)
|
No owned or leased real properties are pledged as security under the New Credit Facility.
|
|
(3)
|
Represents multiple locations.
|
|
(4)
|
With respect to these locations, the land is leased, and the buildings are either owned or leased by us.
|
|
(5)
|
On July 23, 2015, we entered into an agreement (which was amended in September of 2018) to sell our real property located in Toronto, Ontario, which includes the site of our corporate headquarters and our Toronto manufacturing operations. The closing of the transaction occurred on March 7, 2019. In anticipation of the sale, in November 2017, we entered into a long-term lease in the Greater Toronto area for our new manufacturing operations. We completed this relocation in February 2019. As part of the sale, we will enter into a long-term lease for our new corporate headquarters on commercially reasonable arm’s-length terms. In connection therewith, we are relocating our corporate headquarters to a temporary location while space in a new office building (to be built by the purchaser of the property on the site of our current location) is under construction, and entered into a three-year lease for such temporary offices in September 2018. The temporary office relocation is currently expected to be completed by the end of the first half of 2019. We have incurred significant capitalized and transition costs throughout the transition period (which commenced in the fourth quarter of 2017) in connection with these relocations. We incurred approximately $17 million in capitalized building improvement and equipment costs for the new manufacturing location through February 13, 2019, and expect to incur: (i) approximately $6 million in capitalized building improvement costs in connection with our temporary office relocation (approximately $1 million of which has been incurred through February 13, 2019), and (ii) up to approximately $20 million in transition costs through the end of the second quarter of 2019 (approximately $16 million of which has been incurred through February 13, 2019). All of such costs have been, and the remainder are expected to be, funded from cash on hand. See Item 5, "Operating and Financial Review and Prospects — Management's Discussion and Analysis of Financial Condition and Results of Operations — Liquidity —
Toronto Real Property and Related Transactions.
"
|
We consider each of the properties in the table above to be adequate for its purpose and suitably utilized according to the individual nature and requirements of the relevant operations. We currently expect to be able to extend the terms of expiring leases or to find replacement sites on commercially acceptable terms. Also see "Environmental Matters" in Item 4(B) above.
Our principal executive office is currently located at 844 Don Mills Road, Toronto, Ontario, Canada M3C 1V7, and as of April 1, 2019, will be located at 5140 Yonge Street, Suite 1900, Toronto, Ontario, Canada M2N 6L7.
Our material tangible fixed assets are described in note 8 to the Consolidated Financial Statements in Item 18.
None.
42
CELESTICA INC.
MANAGEMENT’S DISCUSSION AND ANALYSIS
OF FINANCIAL CONDITION AND RESULTS OF OPERATIONS
FOR THE
YEAR ENDED
DECEMBER 31, 2018
The following Management
’
s Discussion and Analysis of Financial Condition and Results of Operations (MD&A) should be read in conjunction with our
2018
audited consolidated financial statements (2018 AFS), which we prepared in accordance with International Financial Reporting Standards (IFRS) as issued by the International Accounting Standards Board (IASB). Unless otherwise noted, all dollar amounts are expressed in U.S. dollars. The information in this discussion is provided as of
February 13, 2019
unless we indicate otherwise.
Certain statements contained in this MD&A constitute forward-looking statements within the meaning of Section 27A of the U.S. Securities Act of 1933, as amended, and Section 21E of the U.S. Securities Exchange Act of 1934, as amended (U.S. Exchange Act), and contain forward-looking information within the meaning of Canadian securities laws. Such forward-looking information includes, without limitation, statements related to: our priorities, intended areas of focus, targets, objectives and goals; trends in the electronics manufacturing services (EMS) industry and our segments; the anticipated continuation and impact of adverse market conditions, particularly in our Connectivity & Cloud Solutions (CCS) segment; adverse market conditions in, and the cyclical nature of, our capital equipment business, in particular our semiconductor business; our anticipated financial and/or operational results; benefits anticipated from, and the range and timing of, our cost efficiency initiative; the anticipated impact of our comprehensive CCS segment portfolio review (CCS Review) on our business; the timing, quantity, and intended method of funding of purchases of subordinate voting shares under our current normal course issuer bid (NCIB); the timing of the valuation of certain recently-acquired assets and finalization of the related purchase price allocations; our growth and diversification strategies and plans (and potential hindrances thereto); the expected continuation, and adverse impact on our business, of materials constraints; supplier lead times; the anticipated impact of completed acquisitions (Atrenne Integrated Solutions, Inc. (Atrenne) and Impakt Holdings, LLC (Impakt)) and program wins, transfers, losses or disengagements on our business;
anticipated expenses, restructuring actions and charges, capital expenditures and other anticipated working capital requirements, including the anticipated amounts, timing, impact and funding thereof; the anticipated impact on our operations of any new significant tariffs on items imported into the U.S. and related countermeasures; the anticipated repatriation of undistributed earnings from foreign subsidiaries; the impact of tax and litigation outcomes; our anticipated ability to use certain net operating losses; intended investments in our business and associated risks; the anticipated impact of the pace of technological changes, customer outsourcing, program transfers, and the global economic environment on our business; raw materials prices; the impact of outstanding indebtedness under our credit facility on our business; our intention to settle outstanding equity awards with subordinate voting shares; the anticipated aggregate cost of relocating our Toronto manufacturing operations and corporate headquarters; the timing of relocating our corporate headquarters; our expectation that the costs of our Toronto manufacturing and corporate office relocations will be more than offset by the cash proceeds from the property sale; the anticipated impact of recent U.S. tax reform on our business; transition activities related to, and the anticipated impact of, newly-issued accounting standards; the impact of price reductions and longer-term contracts on our business; our intention to sell a lower amount of accounts receivable under a customer's supplier financing program; the potential use of cash, securities issuances and further increases in third-party indebtedness to fund our operations or acquisitions, and the anticipated and potential adverse impacts of such uses and/or increase; the potential adverse impacts of Britain's intention to leave the European Union (Brexit) and/or policies or legislation proposed or instituted by the current administration in the U.S.; our pension obligations; our intentions with respect to our U.K. supplemental pension plan; the potential true-up premium on annuities purchased for our U.K. pension plans; the anticipated impact of the integration of Impakt on our internal controls; and the expected impact of the expiration of one of our income tax incentives in Thailand. Such forward-looking statements may, without limitation, be preceded by, followed by, or include words such as “believes,” “expects,” “anticipates,” “estimates,” “intends,” “plans,” “continues,” “project,” “potential,” “possible,” “contemplate,” “seek,” or similar expressions, or may employ such future or conditional verbs as “may,” “might,” “will,” “could,” “should” or “would,” or may otherwise be indicated as forward-looking statements by grammatical construction, phrasing or context. For those statements, we claim the protection of the safe harbor for forward-looking statements contained in the U.S. Private Securities Litigation Reform Act of 1995 and applicable Canadian securities laws.
Forward-looking statements are provided to assist readers in understanding management’s current expectations and plans relating to the future. Readers are cautioned that such information may not be appropriate for other purposes. Forward-looking statements are not guarantees of future performance and are subject to risks that could cause actual results to differ materially from those expressed or implied in such forward-looking statements, including, among others, risks related to: our
43
customers' ability to compete and succeed with our products and services; customer and segment concentration; challenges of replacing revenue from completed or lost programs or customer disengagements; changes in our mix of customers and/or the types of products or services we provide; the impact on gross profit of higher concentrations of lower margin programs; price, margin pressures, and other competitive factors affecting, and the highly competitive nature of, the EMS industry in general and our CCS segment in particular; the cyclical nature of our capital equipment business, in particular our semiconductor business; delays in the delivery and availability of components, services and materials; the expansion or consolidation of our operations; defects or deficiencies in our products, services or designs; integrating acquisitions and "operate-in-place" arrangements, and achieving the anticipated benefits therefrom; negative impacts on our business resulting from recent increases in third-party indebtedness; our response to changes in demand, rapidly evolving and changing technologies, and changes in our customers' business and outsourcing strategies; customer, competitor and/or supplier consolidation; compliance with social responsibility initiatives; challenges associated with new customers or programs, or the provision of new services; the impact of our restructuring actions; the incurrence of future restructuring charges, impairment charges or other write-downs of assets; managing our operations, growth initiatives, and our working capital performance during uncertain market and economic conditions; disruptions to our operations, or those of our customers, component suppliers and/or logistics partners, including as a result of global or local events outside our/their control and the impact of significant tariffs on items imported into the U.S; changes to our operating model; changing commodity, materials and component costs as well as labor costs and conditions; retaining or expanding our business due to execution or quality issues (including our ability to successfully resolve these challenges); non-performance by counterparties (including the financial institutions party to our purchased annuities and other financial counterparties, key suppliers and/or customers); maintaining sufficient financial resources and working capital to fund currently anticipated financial obligations and to pursue desirable business opportunities; negative impacts on our business resulting from any significant uses of cash, securities issuances, and/or additional increases in third-party indebtedness for additional acquisitions or to otherwise fund our operations; our financial exposure to foreign currency volatility;
r
ecruiting or retaining skilled talent; our dependence on industries affected by rapid technological change; increasing taxes, tax audits, and challenges of defending our tax positions; obtaining, renewing or meeting the conditions of tax incentives and credits; the relocation of our corporate headquarters; computer viruses, malware, hacking attempts or outages that may disrupt our operations; the management of our IT systems and our ability to protect confidential information; the variability of revenue and operating results; compliance with applicable laws, regulations, and government grants; our pension obligations; interest rate fluctuations and changes to LIBOR; and current or future litigation, governmental actions, and/or changes in legislation. The foregoing and other material risks and uncertainties are discussed in our public filings at www.sedar.com and www.sec.gov, including in this MD&A, our most recent Annual Report on Form 20-F filed with, and subsequent reports on Form 6-K furnished to, the U.S. Securities and Exchange Commission (SEC), and as applicable, the Canadian Securities Administrators.
Our forward-looking statements are based on various assumptions, many of which involve factors that are beyond our control. Our material assumptions include those related to the following: fluctuation of production schedules from our customers in terms of volume and mix of products or services; the timing and execution of, and investments associated with, ramping new business; the successful pursuit, completion and integration of acquisitions; the success of our customers’ products; our ability to retain programs and customers; the stability of general economic and market conditions, currency exchange rates, and interest rates; supplier performance, pricing and terms; compliance by third parties with their contractual obligations and the accuracy of their representations and warranties; the costs and availability of components, materials, services, equipment, labor, energy and transportation; that our customers will retain liability for recently-imposed tariffs and countermeasures; our ability to keep pace with rapidly changing technological developments; the impact of the recent U.S. tax reform on our operations; the timing, execution, and effect of restructuring actions; the successful resolution of quality issues that arise from time to time; our having sufficient financial resources and working capital to fund currently anticipated financial obligations and to pursue desirable business opportunities; our ability to successfully diversify our customer base and develop new capabilities; the availability of cash resources for repurchases of outstanding subordinate voting shares; that we achieve the expected benefits from our acquisitions of Atrenne and Impakt; the impact of the CCS Review on our business; and the magnitude of anticipated losses in our capital equipment business in the first quarter of 2019. Although management believes its assumptions to be reasonable under the current circumstances, they may prove to be inaccurate, which could cause actual results to differ materially (and adversely) from those that would have been achieved had such assumptions been accurate. Forward-looking statements speak only as of the date on which they are made, and we disclaim any intention or obligation to update or revise any forward-looking statements, whether as a result of new information, future events or otherwise, except as required by applicable law.
All forward-looking statements attributable to us are expressly qualified by these cautionary statements.
44
Overview
Celestica's business:
We deliver innovative supply chain solutions globally to customers in two operating and reportable segments: Advanced Technology Solutions (ATS) and Connectivity & Cloud Solutions (CCS). Our ATS segment consists of our ATS end market, and is comprised of our aerospace and defense, industrial, smart energy, healthtech, and capital equipment businesses. Our capital equipment business is comprised of our semiconductor, display, and power & signal distribution equipment businesses. Our CCS segment consists of our Communications and Enterprise end markets and is comprised of our enterprise communications, telecommunications, servers and storage businesses. Our customers include original equipment manufacturers (OEMs), service providers (including cloud-based service providers) and other companies in a wide range of industries. All period percentages and financial information herein reflect the current presentation. Information regarding our reportable segments is included in note 25 to our 2018 AFS.
Our global headquarters is located in Toronto, Ontario, Canada. We operate a network of sites and centers of excellence strategically located in North America, Europe and Asia, with specialized end-to-end supply chain capabilities tailored to meet specific market and customer product lifecycle requirements.
We offer a comprehensive range of product manufacturing and related supply chain services to customers in both of our segments, including design and development, new product introduction, engineering services, component sourcing, electronics manufacturing and assembly, testing, complex mechanical assembly, systems integration, precision machining, order fulfillment, logistics, asset management, product licensing, and after-market repair and return services. Within design and development, our Joint Design and Manufacturing (JDM) offering includes the creation of hardware platforms and design solutions in collaboration with customers, as well as management of aspects of the supply chain and manufacturing.
Revenue from our ATS segment currently represents approximately one-third of our aggregate revenue but generated just under one-half of our total segment income in 2018. Products and services in this segment are extensive and are often more regulated than in our CCS segment, and can include the following: government-certified and highly-specialized manufacturing, electronic and enclosure-related services for aerospace and defense-related customers; high-precision equipment and integrated subsystems used in the manufacture of semiconductors and displays; a wide range of industrial automation, controls, test and measurement devices; advanced solutions for surgical instruments, diagnostic imaging and patient monitoring; and efficiency products to help manage and monitor the energy and power industries. Our ATS segment businesses typically have a higher margin profile and longer product life cycles than the businesses in our CCS segment. Revenue from our CCS segment currently represents approximately two-thirds of our aggregate revenue and generated just over one-half of our total segment income in 2018. Products and services in this segment consist predominantly of enterprise-level data communications and information processing infrastructure products, and can include routers, switches, servers and storage-related products used by a wide range of businesses and cloud-based service providers to manage digital connectivity, commerce and social media applications. Our CCS segment businesses typically have a lower margin profile and higher volumes than the businesses in our ATS segment, and have been impacted in recent periods (and continue to be impacted) by aggressive pricing, rapid shifts in technology, model obsolescence and the commoditization of certain products.
Our CCS segment generally experiences a high degree of volatility in terms of revenue and product/service mix, and has been affected by sustained negative pricing pressures, which have significantly impacted our profitability in recent quarters. These factors, which are characteristic of the highly competitive nature of this market, are not expected to abate.
As part of our strategy to continue to diversify our business and improve shareholder returns, we commenced a comprehensive review of our CCS revenue portfolio (CCS Review) in the second half of 2018, with the intention of addressing under-performing programs, as well as better aligning our investments with our strategic and financial priorities. As a result of this review, we intend to disengage from certain CCS customer programs that are not anticipated to contribute to improved consistency in our revenues and CCS segment margin. The review of our CCS business, which generated $4.4 billion of revenue in 2018, is currently expected to result in a decline in our CCS segment revenue of approximately $500 million over the next 12 to 18 months, and a corresponding decline in overall company revenue in the single digit percentage range in 2019 (subject to change based on the growth or contraction of CCS programs not subject to the review). The CCS Review is substantially complete, and the customer programs that comprise the approximate $500 million in revenue have been identified. We expect to complete the majority of related actions in 2019, including the intended restructuring actions (which have been built into our current cost efficiency initiative), and changes to our global manufacturing network. Although we expect reduced revenue in our CCS business as a result of the CCS Review, we intend to maintain a significant majority of our CCS business, and continue to invest in areas we believe are key to the long-term success of our CCS segment, including our JDM offering, to help drive improved CCS financial performance in future periods.
Revenue attributable to our JDM business grew approximately 30% in 2018 as compared to 2017.
45
Within our capital equipment business, revenue from our semiconductor capital equipment customers has been adversely impacted by cyclical decreases in demand, primarily in the second half of 2018. The swift decrease in demand in the fourth quarter of 2018 drove lower utilization, resulting in operating losses in our capital equipment business in the mid-single digit million dollar range for that quarter. We expect the weaker semiconductor demand to continue throughout 2019 and have estimated a single digit million dollar operating loss in our capital equipment business for the first quarter of 2019. In response to this demand softness, we are undertaking actions (as part of our current cost efficiency initiative) to align this business to the current demand environment and to improve profitability. However, despite the current soft demand environment, we believe that new program wins, anticipated market share gains, anticipated growth in electronic content and connectivity, and our recent acquisition of Impakt Holdings, LLC (Impakt) position us favorably to benefit from potential growth in this business in the future. More generally, we continue to pursue new customers and acquisition opportunities in our ATS segment to expand our end market penetration, to diversify our end market mix, and to enhance and add new technologies and capabilities to our offerings.
Within both our CCS and ATS segments, we are focused on higher-value added services, including design and development, engineering, and after-market services. In support of our expansion efforts, we have executed two “operate-in-place” outsourcing agreements with existing aerospace and defense customers, pursuant to which we provide manufacturing and after-market repair services for specific product lines at such customers' sites. In addition, in our ATS segment, we completed the acquisitions of Lorenz, Inc. and Suntek Manufacturing Technologies, SA de CV, collectively known as Karel Manufacturing (Karel) in November 2016, Atrenne Integrated Solutions, Inc. (Atrenne) in April 2018, and Impakt in November 2018 (see “Recent developments” and “Operating Results —
Acquisition Activity and Program Transfer
” below).
To increase the value we deliver to our customers, we continue to make investments in people, value-added service offerings, new capabilities, capacity, technology, IT systems, software and tools. We continuously work to improve our productivity, quality, delivery performance and flexibility in our efforts to be recognized as a leading company in the EMS industry. We have invested in automation and the "Digital Factory" to streamline our processes and reduce costs. Our current cost efficiency initiative, and related restructuring actions, are also intended to further streamline our business, increase operational efficiencies and improve our productivity.
As we expand our business, open new sites, or transfer business within our network to accommodate growth or achieve synergies, however, we may encounter difficulties that result in higher than expected costs associated with such activities. Potential difficulties related to such activities include our ability: to manage growth effectively; to maintain existing business relationships during periods of transition; to anticipate disruptions in our operations that may impact our ability to deliver to customers on time, produce quality products and ensure overall customer satisfaction; and to respond rapidly to changes in customer demand or volumes. We may also encounter difficulties in ramping and executing new programs. We may require significant investments in additional capabilities and increased working capital to support these new programs, including those associated with business acquisitions, and may generate lower margins or losses during and/or following the ramp period. There can be no assurance that our increased investments will benefit our financial performance or result in business growth. As we pursue opportunities in new markets or technologies, we may encounter challenges due to our limited knowledge or experience in these areas. In addition, the success of new business models or programs depends on a number of factors including: understanding the new business or markets; timely and successful product development; market acceptance; the effective management of purchase commitments and inventory levels in line with anticipated demand; the development or acquisition of appropriate intellectual property and capital investments, to the extent required; the availability of materials in adequate quantities and at appropriate costs to meet anticipated demand; and the risk that new offerings may have quality or other defects in the early stages of introduction. Any of these factors could prevent us from realizing the anticipated benefits of growth in our business, including in new markets or technologies, which could materially adversely affect our business and operating results.
Operating Goals and Principles:
Our current priorities are focused on evolving our revenue portfolio; expanding our non-IFRS operating margin* and segment margins; and maintaining a balanced approach to capital allocation. Management believes that each of these goals and principles is reasonable.
Evolving our Revenue Portfolio
—
To evolve our revenue portfolio, we intend to continue to focus on: (i) realigning our portfolio towards more diversified revenue, (ii) driving sustainable profitable revenue growth, (iii) growing our ATS segment revenue organically by an average of 10% per year over the long term, (iv) supplementing our organic growth with disciplined and targeted acquisitions intended to expand capabilities, and (v) optimizing and reshaping our portfolio to drive more consistent returns and profitability.
46
Expanding Margins
—
With respect to expanding margins, we intend to focus on achieving, by the first half of 2020: (i) non-IFRS operating margin* in the target range of 3.75% to 4.5%, (ii) ATS segment margin in the target range of 5.0% to 6.0%, and CCS segment margin in the target range of 2.0% to 3.0%, and (iii) greater than 50% of total segment income from our ATS segment. Our non-IFRS operating margin* target range reflects anticipated benefits from our CCS Review, completion of our cost efficiency initiative (CEI), and ongoing expansion of our ATS segment revenue portfolio, both organically and through recent strategy-aligned acquisitions. See “Recent Developments” below.
Balanced Approach to Capital Allocation
— In terms of capital allocation, we are focused on: (i) returning approximately 50% of non-IFRS free cash flow* to shareholders annually, on average, over the long term, (ii) investing 1.5% to 2.0% of annual revenue in capital expenditures to support our organic growth, and (iii) executing on strategic acquisitions as part of a disciplined capital allocation framework. We are also focused on maintaining a strong balance sheet.
The foregoing priorities and areas of intended focus constitute our objectives and goals, and are not intended to be projections or forecasts of future performance. Our future performance is subject to risks, uncertainties and other factors that could cause actual outcomes and results to differ materially from the goals and priorities described above.
* Operating margin and free cash flow are non-IFRS measures without standardized meanings and may not be comparable to similar measures presented by other companies. See “Non-IFRS measures” below for a discussion of the non-IFRS measures included herein, and a reconciliation of our non-IFRS measures to the most directly comparable IFRS measures. We do not provide reconciliations for forward-looking non-IFRS financial measures, as we are unable to provide a meaningful or accurate calculation or estimation of reconciling items and the information is not available without unreasonable effort. This is due to the inherent difficulty of forecasting the timing or amount of various events that have not yet occurred, are out of our control and/or cannot be reasonably predicted, and that would impact the most directly comparable forward-looking IFRS financial measure. For these same reasons, we are unable to address the probable significance of the unavailable information. Forward-looking non-IFRS financial measures may vary materially from the corresponding IFRS financial measures.
Segment performance is evaluated based on segment revenue, segment income and segment margin (segment income as a percentage of segment revenue), each of which is defined in “Operating Results — Segment income and margin” below.
Overview of business environment:
The EMS industry is highly competitive, with multiple global EMS providers competing for customers and programs. In addition, demand can be volatile from period to period, and aggressive pricing is a common business dynamic, particularly in our CCS segment. As a result, customer and CCS segment revenue and mix, and overall profitability, are difficult to forecast.
Product lifecycles in the markets we serve, production lead times required by our customers, rapid shifts in technology, model obsolescence, commoditization of certain products, the emergence of new business models, shifting patterns of demand, such as the shift from traditional network infrastructures to highly virtualized and cloud-based environments, the prevalence of solid state or flash memory technology as a replacement for hard disk drives, as well as the proliferation of software-defined technologies enabling the disaggregation of software and hardware, increased competition, oversupply of products, pricing pressures, and the volatility of the economy all contribute to the complexity of managing our operations and fluctuations in our financial results. For example, declines in end-market demand for customer-specific proprietary systems in favor of open systems with standardized technologies has adversely impacted some of our CCS segment customers, and consequently, our CCS business. Capacity utilization, customer mix and the types of products and services we provide are important factors affecting our financial performance. The number of sites, the location of qualified personnel, the manufacturing capacity, and the mix of business through that capacity are vital considerations for EMS providers in terms of supporting their customers and generating appropriate returns. Because the EMS industry is working capital intensive, we believe that non-IFRS adjusted ROIC, which is primarily based on non-IFRS operating earnings (each discussed in “Non-IFRS measures” below) and investments in working capital and equipment, is an important metric for measuring an EMS provider’s financial performance.
In addition, uncertainty in the global economy and financial markets may impact current and future demand for our customers’ products and services, and consequently, our operations. We continue to monitor the dynamics and impacts of the global economic and financial environment and work to manage our priorities, costs and resources to anticipate and prepare for any changes we deem necessary.
External factors that could adversely impact the EMS industry and our business include natural disasters and related disruptions, political instability, terrorism, armed conflict, labor or social unrest, criminal activity, disease or illness that affects local, national or international economies, unusually adverse weather conditions, and other risks present in the jurisdictions in which we, our customers, our suppliers, and/or our logistics partners operate. These types of events could disrupt operations at one or more of our sites or those of our customers, component suppliers and/or our logistics partners. These events could also lead
47
to higher costs or supply shortages or may disrupt the delivery of components to us, or our ability to provide finished products or services to our customers, any of which could adversely affect our operating results. In addition, uncertainties resulting from Brexit (given the lack of comparable precedent) and/or policies or legislation proposed or instituted by the current administration in the U.S., and/or increased tensions between the U.S. and North Korea, China, Russia and/or other countries, may adversely affect our business, results of operations and financial condition.
The United States, Canada and Mexico have agreed on a revised trade deal (USMCA) to replace the North American Free Trade Agreement. The USMCA was signed on November 30, 2018, but is subject to ratification by the legislatures of all three countries. We cannot currently quantify the impact on our business of the USMCA, if ratified. In addition, the current U.S. administration has increased tariffs on certain items imported into the U.S. from several countries, including China, Canada, Mexico, and the European Union (many of which are not addressed by the USMCA). Each of these countries has imposed retaliatory tariffs on specified items, which have been challenged by the U.S. These actions, or other governmental actions related to tariffs or international trade agreements, could increase the cost to our U.S. customers who use our non-U.S. manufacturing sites and components, and vice versa, which may materially and adversely impact demand for our services, our results of operations or our financial condition. We currently ship a significant portion of our worldwide production to customers in the U.S. from other countries. Increased tariffs, and/or changes to international trade agreements, may cause our U.S. customers to insource programs previously outsourced to us, transfer manufacturing to locations within our global network that are not impacted by such actions (potentially increasing production costs), and/or shift their business to other EMS providers. Additionally, tariffs on imported components for use in our U.S. production could have an adverse impact on demand for such production. Retaliatory tariffs could reduce demand for our U.S.-based production or make such production less profitable. Given the uncertainty regarding the scope and duration of these trade actions by the U.S. and other governments, whether trade tensions will escalate further, and whether our customers will bear the cost of the tariffs, their impact on our operations and results cannot be currently quantified, but may be material. Discussions with impacted customers on our recoverability of tariff costs, and/or the potential of transferring their production from China to other sites within our network, are ongoing.
In general, changes in U.S. social, political, regulatory and economic conditions or in laws and policies governing foreign trade, taxation, manufacturing, clean energy, the healthcare industry, development and investment in the jurisdictions in which we, and/or our customers or suppliers operate, could materially adversely affect our business, results of operations and financial condition.
We have significant suppliers that are important to our sourcing activities. If a key supplier (or any company within such supplier's supply chain) experiences financial or other difficulties, this may affect its ability to supply us with materials, components or services, which could halt or delay the production of a customer's products, and/or have a material adverse impact on our operations, financial results and customer relationships. We continue to experience materials constraints from certain suppliers in both our segments, due in part to industry-wide shortages for certain electronic components. These shortages caused delays in the production of customer products, and required us to carry higher than expected levels of inventory in 2017 and 2018. Although we expect these materials constraints and resulting adverse impacts to continue in the near term, we have begun to see improvements in the availability of certain previously constrained items. Nonetheless, only minor improvements in supplier lead times are currently expected. These supply constraints may result in higher materials costs, adversely impacting our financial results if we are unable to recover such increases from our customers.
Our ability to collect our accounts receivable and achieve future sales depends, in part, on the financial strength of our customers. If any of our customers have insufficient liquidity, we could encounter significant delays or defaults in payments owed to us by such customers, or we may extend our payment terms, which could adversely impact our short-term cash flows, financial condition and/or operating results. From time to time, we have extended the payment terms applicable to certain customers, which has adversely impacted our working capital requirements, and increased our financial exposure and credit risk. In addition, customer financial difficulties or changes in demand for our customers' products may result in order cancellations and higher than expected levels of inventory, which could in turn have a material adverse impact on our operating results and working capital performance. We may not be able to return or re-sell this inventory, or we may be required to hold the inventory for a period of time, any of which may result in our having to record additional reserves for the inventory. We also may be unable to recover all of the amounts owed to us by a customer, including amounts to cover unused inventory or capital investments we incurred to support that customer's business. Furthermore, if a customer bankruptcy occurs, our profitability may be adversely impacted by our failure to collect our accounts receivable in excess of our estimated allowance for uncollectible accounts or amounts insured. Our failure to collect accounts receivable and/or the loss of one or more major customers could have an adverse effect on our operating results, financial position and cash flows.
Our business is dependent on the award of new programs. Customers may shift production between EMS providers for a number of reasons, including changes in demand for their products, pricing concessions, more favorable terms and conditions, execution or quality issues, their preference or need to consolidate their supply chain capacity or change their supply chain partners,
48
tax benefits, new trade policies or legislation, or consolidation among customers. Customers may also choose to increase the amount of business they outsource, insource previously outsourced business, or change the concentration or location of their EMS suppliers to better manage their supply continuity risk. These customer decisions may impact, among other items, our revenue and margins, the need for future restructuring, the level of capital expenditures and our cash flows.
While the demand environment remains volatile, driven largely by technology shifts and increased competition in our CCS segment, we remain committed to making the investments we believe are required to support our long-term objectives and to create shareholder value. These efforts include a focus on the diversification of our customer mix and product portfolios to address changing needs, including a larger emphasis on after-market services, as well as broadening our ATS segment capabilities, and continuing to expand the breadth of our JDM offerings in the areas of network switching and converged storage and servers. The costs of investments that we deem desirable may be prohibitive, however, and therefore prevent us from achieving these diversification objectives. In addition, the ramping activities associated with investments that we do make may be significant and could negatively impact our margins in the short and medium term. Simultaneously, we intend to continue to manage our costs and resources to maximize our efficiency and productivity.
Recent developments:
Segment Reorganization and Segment Environment:
During the first quarter of 2018, we completed a reorganization of our reporting structure, including our sales, operations and management systems, into two operating and reportable segments: ATS and CCS. Our prior period financial information has been reclassified to reflect the reorganized segment structure and to conform to the current presentation. The changes to our segment structure had no impact on our historical consolidated financial position, results of operations or cash flows as previously reported. See “Overview — Celestica's business” above for a description of the products, services and characteristics of each of our ATS and CCS segments.
The competitive landscape in our CCS segment remains aggressive, as demand growth continues to move from traditional enterprise network infrastructure providers to cloud-based service providers, resulting in aggressive bidding from EMS providers and increased competition from original design manufacturers as they further penetrate these markets. In addition, although we offer a broad range of services to our CCS customers, we have experienced a shift in the mix of our programs, including growth in our lower-margin fulfillment services, particularly in the first half of 2018. This shift in mix, combined with the pricing pressures described above, demand volatility, and investments we have made to grow our higher-value added after-market services, resulted in lower segment income and margins in our CCS segment for
2018
as compared to prior years. See “Operating Results” below. As a result of the high concentration of our business in the CCS marketplace, we expect continued competitive pressures, aggressive pricing and technology-driven demand shifts, as well as certain materials constraints, to continue to negatively impact our CCS businesses and overall profitability in future periods. In addition, cloud-based service providers have increased their use of products in our CCS segment in recent periods. These customers and markets are cyclically different from our traditional OEM customers, creating more volatility and unpredictability in our revenue patterns as we adjust to this shift, and additional challenges with respect to the management of our working capital requirements.
With respect to our ATS segment, see "Overview —
Celestica's business
" above for a discussion of recent adverse trends impacting our semiconductor capital equipment customers and our capital equipment business, including our estimation of a single digit million dollar operating loss in our capital equipment business for the first quarter of 2019.
CCS Revenue Portfolio Review:
See “Overview —
Celestica's business
” above for a discussion of our CCS Review, undertaken to address under-performing programs and to identify opportunities to improve our returns, as well as anticipated impacts of this review on our operations and financial results.
Refinancing:
In June 2018, we entered into an $800 million credit agreement with Bank of America, N.A., as Administrative Agent, and the other lenders party thereto (New Credit Facility), which provides for a $350 million term loan (June Term Loan) that matures in June 2025, and a $450 million revolving credit facility (New Revolver) that matures in June 2023. The net proceeds from the June Term Loan were used primarily to repay all amounts outstanding under our previous credit facility (Prior Facility), which was terminated on such repayment. In November 2018, we utilized the accordion feature under our New Credit Facility to add an incremental term loan of $250 million (November Term Loan), maturing in June 2025. The June Term Loan and the November Term Loan are collectively referred to as the New Term Loans. The Prior Facility consisted of a $250 million term loan
49
(Prior Term Loan) and a $300 million revolving credit facility (Prior Revolver), each of which was scheduled to mature in May 2020. As of
December 31, 2018
, an aggregate of
$598.3 million
was outstanding under the New Term Loans, and other than ordinary course letters of credit (described below),
$159.0 million
was outstanding under the New Revolver.
Impakt Acquisition:
In November 2018, we completed the acquisition of U.S.-based Impakt, a highly-specialized, vertically integrated company providing manufacturing solutions for leading OEMs in the display (including LCD and Organic Light Emitting Diode (OLED)) and semiconductor industries, as well as other markets requiring complex fabrication services, with operations in California and South Korea. The purchase price was $325.4 million, net of cash acquired, subject to a net working capital adjustment (which has not yet been finalized). The purchase was funded with borrowings under the New Revolver, $245.0 million of which was repaid with proceeds of the November Term Loan. Through this acquisition,
we have gained significant new capabilities in large-format, complex, high-mix manufacturing solutions for multiple industries within our ATS segment, and have broadened our precision component manufacturing, full system assembly, integration and machining capabilities. In addition, we expect to benefit from Impakt’s full spectrum of specialized vertical services, including its South Korea-based machining and manufacturing expertise. We recorded $111.2 million of goodwill in connection with this acquisition. We expect to finalize our purchase price allocation in the first half of 2019.
Atrenne Acquisition:
On April 4, 2018, we completed the acquisition of U.S.-based Atrenne, a designer and manufacturer of ruggedized electromechanical solutions, primarily for the aerospace and defense market. Atrenne's capabilities include connectors, machining, and the thermal and mechanical design and manufacture of ruggedized chassis and enclosures, primarily for military and commercial aerospace applications. We also believe that Atrenne's capabilities in the design and manufacture of value-added mechanical solutions will expand our service offerings for our industrial customers. The purchase price for Atrenne was $141.7 million, net of cash acquired, including a net working capital adjustment of $3.8 million (which is subject to finalization). The purchase was funded with borrowings under the Prior Revolver. We recorded $64.0 million of goodwill in connection with the acquisition. We expect to finalize our purchase price allocation in the first quarter of 2019, once the net working capital adjustment has been finalized.
Toronto Real Property and Related Transactions Update:
In September 2018, the agreement governing the sale of our Toronto real property (Property Sale Agreement), which includes our corporate headquarters and Toronto manufacturing operations, was assigned to a new purchaser (the Assignee), although the original purchaser was not released from its obligations under the Property Sale Agreement.
In connection with such assignment, the Property Sale Agreement was amended to provide for the remaining proceeds of $122 million Canadian dollars (approximately $89 million at year-end exchange rates) to be paid in one lump sum cash payment at closing (previously, we were to receive one-half of the purchase price in the form of a two-year, interest-free, first-ranking mortgage). Other terms of the Property Sale Agreement remained unchanged. On January 21, 2019, the required municipal zoning approval was obtained. On March 7, 2019, we completed the sale of the real property and received total proceeds of approximately $110 million, including a high density bonus and an early vacancy incentive related to the temporary relocation of our corporate headquarters. The gain on sale of this property will be recorded as recoveries through other charges (recoveries) in 2019. No net tax impact is anticipated from this sale, as the gain will be offset by the utilization of currently unrecognized tax losses. See “Liquidity — Toronto Real Property and Related Transactions” and note 8 of the 2018 AFS for a discussion of our Toronto property sale and related transactions, as well as transition and capital costs incurred in connection with related relocations.
Restructuring Update:
We have recorded $45 million in restructuring charges from the commencement of our CEI (described herein) through February 13, 2019. Our restructuring actions under the CEI include, among others, actions identified as part of our CCS Review, as well as actions in response to the demand environment in our capital equipment business.
We continue to estimate total restructuring charges for the CEI to be within the previously disclosed range of between $50.0 million and $75.0 million, however we are extending the program by six months and expect the remainder of the charges to be recorded by the end of 2019.
See "Operating Results —
Other charges
."
50
Board Member Addition:
Robert Cascella was appointed to Celestica's Board of Directors effective February 1, 2019. Mr. Cascella is currently an Executive Vice President and Executive Committee member of Royal Philips, a public Dutch multinational healthcare company. He is also the Chief Executive Officer (CEO) of Royal Philips' Diagnosis and Treatment businesses. He was formerly the President and CEO of Hologic, Inc., a public medical device and diagnostics company, from 2003 to 2013. He has also held senior leadership positions at CFG Capital, NeoVision Corporation, and Fischer Imaging Corporation.
Share Repurchases:
Since the commencement in November 2017 of an NCIB (2017 NCIB) through its expiry on November 12, 2018, we paid an aggregate of $95.4 million (including transaction fees) to repurchase and cancel 8.7 million subordinate voting shares. We also purchased 1.1 million subordinate voting shares in the open market during the term of the 2017 NCIB, and 1.3 million shares after its expiration (during 2018), in order to satisfy delivery obligations under our stock-based compensation plans.
In December 2018, the TSX accepted our notice to launch a new NCIB (2018 NCIB), which allows us to repurchase, at our discretion, until the earlier of December 17, 2019 or the completion of the purchases thereunder, up to approximately 9.5 million subordinate voting shares in the open market, or as otherwise permitted. We have not repurchased or canceled any subordinate voting shares under the 2018 NCIB from its commencement through
February 13, 2019
.
Adoption of IFRS 15:
We adopted IFRS 15, Revenue from Contracts with Customers, effective January 1, 2018. We elected to apply the retrospective approach and as a result, have restated each of the required comparative reporting periods presented herein. A description of the impact of our transition to IFRS 15 is included in note 2 to our
2018
AFS.
Summary of Key Operating Results and Financial Information
Our consolidated financial statements have been prepared in accordance with IFRS as issued by the IASB and accounting policies we adopted in accordance with IFRS. Such consolidated financial statements reflect all adjustments that are, in the opinion of management, necessary to present fairly our financial position as at
December 31, 2018
and
2017
and the financial performance, comprehensive income and cash flows for each of the years in the three-year period ended
December 31, 2018
. See “Critical Accounting Policies and Estimates” below.
The following tables set forth certain key operating results and financial information for the periods indicated (in millions, except per share amounts and percentages). Financial information for 2016 and 2017 has been restated to reflect our January 1, 2018 adoption of IFRS 15.
|
|
Year ended December 31
|
||||||||||||||||
|
|
2016
|
2017
|
2018
|
% Change 2017 v. 2016
|
% Change 2018 v. 2017
|
||||||||||||
|
(restated)
|
(restated)
|
||||||||||||||||
|
Revenue
|
$
|
6,046.6
|
|
$
|
6,142.7
|
|
$
|
6,633.2
|
|
2
|
%
|
8
|
%
|
||||
|
Gross profit
|
429.6
|
|
418.5
|
|
430.5
|
|
(3
|
)%
|
3
|
%
|
|||||||
|
Selling, general and administrative expenses (SG&A)
|
211.1
|
|
203.2
|
|
219.0
|
|
(4
|
)%
|
8
|
%
|
|||||||
|
Other charges
|
25.5
|
|
37.0
|
|
61.0
|
|
45
|
%
|
65
|
%
|
|||||||
|
Net earnings
|
138.3
|
|
105.5
|
|
98.9
|
|
(24
|
)%
|
(6
|
)%
|
|||||||
|
Diluted earnings per share
|
$
|
0.96
|
|
$
|
0.73
|
|
$
|
0.70
|
|
(24
|
)%
|
(4
|
)%
|
||||
|
Segment revenue* as a percentage of total revenue:
|
Year ended December 31
|
||||
|
|
2016
|
2017
|
2018
|
||
|
ATS revenue (% of total revenue)
|
32%
|
32%
|
33%
|
||
|
CCS revenue (% of total revenue)
|
68%
|
68%
|
67%
|
||
51
|
Year ended December 31
|
||||||||||||||
|
Segment income and segment margin*:
|
2016
|
2017
|
2018
|
|||||||||||
|
Segment Margin
|
Segment Margin
|
Segment Margin
|
||||||||||||
|
ATS segment
|
$
|
73.9
|
|
3.8%
|
$
|
96.8
|
|
4.9%
|
$
|
102.5
|
|
4.6%
|
||
|
CCS segment
|
149.3
|
|
3.6%
|
120.4
|
|
2.9%
|
111.4
|
|
2.5%
|
|||||
* Segment performance is evaluated based on segment revenue, segment income and segment margin (segment income as a percentage of segment revenue), each of which are defined in "Operating Results — Segment income and margin" below.
|
December 31
2017 |
December 31
2018 |
|||||||
|
Cash and cash equivalents
|
$
|
515.2
|
|
$
|
422.0
|
|
||
|
Total assets
|
2,964.2
|
|
3,737.7
|
|
||||
|
Borrowings under applicable term loans
|
187.5
|
|
598.3
|
|
||||
|
Borrowings under applicable revolving credit facility
|
—
|
|
159.0
|
|
||||
|
Year ended December 31
|
|||||||||||
|
2016
|
2017
|
2018
|
|||||||||
|
Cash provided by operating activities
|
$
|
173.3
|
|
$
|
127.0
|
|
$
|
33.1
|
|
||
|
Shares repurchased for cancellation — aggregate price (including transaction costs)
|
$
|
34.3
|
|
$
|
19.9
|
|
$
|
75.5
|
|
||
|
— # (in millions)
|
3.2
|
|
1.9
|
|
6.8
|
|
|||||
|
Shares repurchased for delivery under stock-based plans — aggregate price (including transaction costs)
|
$
|
18.2
|
|
$
|
16.7
|
|
$
|
22.4
|
|
||
|
— # (in millions)
|
1.6
|
|
1.4
|
|
2.1
|
|
|||||
A discussion of the foregoing information is set forth under "Operating Results" below.
Other performance indicators:
In addition to the key operating results and financial information described above, management reviews the following measures (which are not measures defined under IFRS)*:
|
|
1Q17
|
2Q17
|
3Q17
|
4Q17
|
1Q18
|
2Q18
|
3Q18
|
4Q18
|
|||||||
|
Cash cycle days:
|
(restated)*
|
(restated)*
|
(restated)*
|
(restated)*
|
|||||||||||
|
Days in A/R
|
61
|
57
|
58
|
58
|
62
|
57
|
60
|
62
|
|||||||
|
Days in inventory
|
47
|
47
|
50
|
51
|
57
|
56
|
59
|
61
|
|||||||
|
Days in A/P
|
(58)
|
(56)
|
(56)
|
(56)
|
(62)
|
(60)
|
(65)
|
(65)
|
|||||||
|
Cash cycle days
|
50
|
48
|
52
|
53
|
57
|
53
|
54
|
58
|
|||||||
|
Inventory turns
|
7.8x
|
7.7x
|
7.3x
|
7.2x
|
6.4x
|
6.6x
|
6.2x
|
6.0x
|
|||||||
*
2017 periods have been restated to reflect the adoption of IFRS 15.
|
|
2017
|
2018
|
|||||||||||||||||||||||
|
|
March
31
|
June
30
|
September 30
|
December 31
|
March
31 |
June
30 |
September 30
|
December 31
|
|||||||||||||||||
|
A/R Sales (in millions)
|
$
|
50.0
|
|
$
|
50.0
|
|
$
|
50.0
|
|
$
|
80.0
|
|
$
|
113.0
|
|
$
|
113.0
|
|
$
|
113.0
|
|
$
|
130.0
|
|
|
|
Supplier Financing* (in millions)
|
44.5
|
|
65.4
|
|
55.1
|
|
52.3
|
|
77.8
|
|
76.0
|
|
81.0
|
|
50.0
|
|
|||||||||
|
Total (in millions)
|
$
|
94.5
|
|
$
|
115.4
|
|
$
|
105.1
|
|
$
|
132.3
|
|
$
|
190.8
|
|
$
|
189.0
|
|
$
|
194.0
|
|
$
|
180.0
|
|
|
* Represents A/R sold to a third party bank in connection with a customer's uncommitted supplier financing program that we joined in the fourth quarter of 2016.
52
Days in A/R is defined as the average A/R for the quarter divided by the average daily revenue. Days in inventory is defined as the average inventory for the quarter divided by the average daily cost of sales. Days in accounts payable (A/P) is defined as the average A/P for the quarter divided by average daily cost of sales. Cash cycle days is defined as the sum of days in A/R and days in inventory minus the days in A/P. Inventory turns is determined by dividing 365 by the number of days in inventory. A lower number of days in A/R, days in inventory, and cash cycle days, and a higher number of days in A/P and inventory turns generally reflect improved cash management performance.
A/R days increased 4 days from the fourth quarter of 2017 (Q4 2017) to 62 days for the fourth quarter of 2018 (Q4 2018) primarily due to the timing of collections. Inventory days increased 10 days from Q4 2017 to 61 days for Q4 2018 primarily due to the higher inventory levels resulting from acquisitions and a constrained materials environment, as well as requirements to support new programs. A/P days increased 9 days from Q4 2017 to 65 days in Q4 2018 primarily due to higher levels and timing of purchases, as well as the timing of payments. A/R and inventory days each increased 2 days sequentially due to the timing of collections and the impact of the Impakt acquisition, respectively.
We believe that cash cycle days (and the components thereof) and inventory turns are useful measures in providing investors with information regarding our cash management performance and are accepted measures of working capital management efficiency in our industry. These are not measures of performance under IFRS, and may not be defined and calculated in the same manner by other companies. These measures should not be considered in isolation or as an alternative to working capital as an indicator of performance.
Management also reviews other non-IFRS measures including adjusted net earnings, operating margin, adjusted ROIC and free cash flow. See “Non-IFRS measures” below.
Critical Accounting Policies and Estimates
The preparation of financial statements in conformity with IFRS requires management to make judgments, estimates and assumptions that affect the application of accounting policies and the reported amounts of assets and liabilities, revenue and expenses, and the related disclosures of contingent assets and liabilities. We base our judgments, estimates and assumptions on current facts, historical experience and various other factors that we believe are reasonable under the circumstances. The economic environment could also impact certain estimates necessary to prepare our consolidated financial statements, including estimates related to the recoverable amounts used in our impairment testing of our non-financial assets (see notes 8 and 9 to our
2018
AFS), and the discount rates applied to our net pension and non-pension post-employment benefit assets or liabilities (see note
19
to our
2018
AFS). Our assessment of these factors forms the basis for our judgments on the carrying values of our assets and liabilities and the accrual of our costs and expenses. Actual results could differ materially from these estimates and assumptions. We review our estimates and underlying assumptions on an ongoing basis and make revisions as determined necessary by management. Revisions are recognized in the period in which the estimates are revised and may impact future periods as well. Significant accounting policies and methods used in the preparation of our consolidated financial statements are described in note 2 to our
2018
AFS. The following is a discussion of those accounting policies which management considers to be “critical,” defined as accounting policies that management believes are both most important to the portrayal of our financial condition and results and require application of management’s most difficult, subjective or complex judgments, often as a result of the need to make estimates about the effects of matters that are inherently uncertain. On January 1, 2018, we adopted IFRS 9 and IFRS 15. See "Recently adopted accounting standards" in note 2 to our 2018 AFS.
Key sources of estimation uncertainty and judgment:
We have applied significant estimates, judgment and assumptions in the following areas which we believe could have a significant impact on our reported results and financial position: our determination of the timing of revenue recognition, measures of work in progress and estimates and timing of expected returns, revenues and related costs; valuations of inventory, assets held for sale and income taxes; the amount of our restructuring charges or recoveries; the measurement of the recoverable amounts of our cash generating units (or CGUs, which are the smallest identifiable group of assets that cannot be tested individually and generate cash inflows that are largely independent of those of other assets or groups of assets), which includes estimating future growth, profitability, discount and terminal growth rates, and the fair value of our real property; our valuations of financial assets and liabilities, pension and non-pension post-employment benefit costs; employee stock-based compensation expense, provisions and contingencies; and the allocation of the purchase price and other valuations related to our business acquisitions.
53
We have also applied significant judgment in the following areas: the determination of our CGUs (which can be comprised of a single site, a group of sites, or a line of business) and whether events or changes in circumstances during the relevant period are indicators that a review for impairment should be conducted, the timing of the recognition of charges or recoveries associated with our restructuring actions, and the decisions and timing of our pension annuity purchases.
Revenue recognition and deferred investment costs:
Under IFRS 15, which we adopted on January 1, 2018, where products are custom-made to meet a customer's specific requirements, and such customer is obligated to compensate us for the work performed to date, we will recognize revenue over time as production progresses to completion, or as services are rendered. We generally estimate revenue for our work in progress based on costs incurred to date plus a reasonable profit margin for eligible products for which we do not have alternative uses. We apply significant estimates, judgment and assumptions in determining the timing of revenue recognition, measuring work in progress, and estimating the amount and timing of expected returns, revenues and related costs. Judgment is also applied in determining the recoverability of deferred investment costs, comprised of contract acquisition or fulfillment costs, and in determining the amortization period for such costs, which is based on the projected period of expected future economic benefits. We review sales and profitability forecasts to determine the likelihood of recovery, as well as applicable contractual recoverability arrangements with customers in the event volumes do not materialize. We monitor these deferred costs for potential impairment on a regular basis. Adverse changes to these assumptions may result in impairment of these costs in future periods.
Inventory valuation:
We procure inventory and manufacture based on specific customer orders and forecasts and value our inventory on a first-in, first-out basis at the lower of cost and net realizable value. The cost of our finished goods and work in progress includes direct materials, labor and overhead. We may require valuation adjustments to these items if actual market conditions or demand for our customers' products or services are less favorable than originally projected. The determination of net realizable value involves significant management judgment. We consider factors such as shrinkage, the aging of the inventory, our estimates of future demand for the inventory, and our contractual arrangements with customers. We attempt to utilize excess inventory in other products we manufacture or return inventory to the relevant suppliers or customers. We use future sales volume forecasts to estimate excess inventory on-hand. A change to these assumptions may impact our inventory valuation and our gross margins. Should our estimates change based on a change in circumstances, we may adjust our previous write-downs in our consolidated statement of operations in the period a change in estimate occurs.
Assets classified as held for sale:
Assets classified as held for sale are measured at the lower of their carrying amount and fair value less costs of disposal, and are no longer depreciated. The determination of fair value less costs of disposal involves judgment by management of the probability and timing of disposition and the expected amount of recoveries and costs. We may engage third parties to assist in the determination of the estimated fair values less costs of disposal for assets classified as held for sale. At the end of each reporting period, we evaluate the appropriateness of our estimates and assumptions. We may require adjustments to reflect actual experience or changes in estimates.
Income taxes:
We record income tax expense or recovery based on taxable income earned or loss incurred in each tax jurisdiction where we operate at the enacted or substantively enacted tax rate applicable to that income or loss. In the ordinary course of business, we engage in many transactions for which the ultimate tax outcome is uncertain and therefore estimates are required for exposures related to potential and actual examinations by taxation authorities. We review these transactions and exposures and record tax liabilities for open years based on our assessment of many factors, including past experience and interpretations of tax law applied to the facts of each matter. Management periodically evaluates the positions taken in our tax returns with respect to situations in which applicable tax rules are subject to interpretation. We establish provisions related to tax uncertainties where appropriate, based on our estimate of the amount that ultimately will be paid to or received from the tax authorities. The various judgments and estimates by management in establishing provisions related to tax uncertainties significantly affect the amounts we recognize in our consolidated financial statements. The determination of tax liabilities is subjective and generally involves a significant amount of judgment. We believe that our income tax liability reflects the probable outcome of our income tax obligations based on known facts and circumstances; however, the final income tax outcome may be different from our estimates. A change to these estimates could impact our income tax provision.
54
We recognize deferred income tax assets to the extent we believe it is probable, based on management’s estimates, that future taxable profit will be available against which the deductible temporary differences as well as unused tax losses and tax credit carryforwards can be utilized. We consider factors such as the reversal of taxable temporary differences, projected future taxable income, the character of the income tax asset, tax planning strategies, changes in tax laws and other factors. A change to these factors could impact the amount of deferred income tax assets we recognize. We review our deferred income tax assets at each reporting date and reduce them to the extent it is no longer probable that we will realize the related tax benefits.
The U.S. Tax Cuts and Jobs Act (U.S. Tax Reform) was enacted on December 22, 2017 and became effective January 1, 2018. We believe all significant one-time impacts resulting from the enactment of the U.S. Tax Reform were recorded in the fourth quarter of 2017, but we will continue to assess additional impacts, if any, as they become known due to changes in our interpretations and assumptions, as well as applicable changes in our business and additional regulatory guidance that may be issued.
Goodwill, intangible assets and property, plant and equipment:
We estimate the useful lives of intangible assets and property, plant and equipment based on the nature of the asset
,
historical experience, the projected period of expected future economic benefits to be provided by the asset, the terms of any related customer contract, and expected changes in technology. We review the carrying amounts of goodwill, intangible assets and property, plant and equipment for impairment whenever events or changes in circumstances (triggering events) indicate that the carrying amount of such assets (or the related CGU or group of CGUs) may not be recoverable. In addition to an assessment of triggering events during the year, we conduct an annual goodwill impairment assessment of our CGUs with goodwill in the fourth quarter of the year. Judgment is required in the determination of our CGUs and whether a review for impairment should be conducted.
We recognize an impairment loss when the carrying amount of an asset, CGU or group of CGUs exceeds its recoverable amount. The recoverable amount of an asset, CGU or group of CGUs is measured as the greater of its expected value-in-use and its fair value less costs of disposal. The process of determining the recoverable amount is subjective and requires management to exercise significant judgment in estimating future growth, profitability, discount and terminal growth rates, and in projecting future cash flows, among other factors. Our expected value-in-use is determined based on a discounted cash flow analysis. Determining the estimated fair value less costs of disposal requires valuations and use of appraisals. Where applicable, we engage independent brokers to obtain market prices to estimate our real property and other asset values. At each reporting date, we review for indicators that could change the estimates we used to determine the recoverable amount of the relevant assets.
Restructuring charges:
The recognition of restructuring charges (relating to workforce reductions, site consolidations, and costs associated with businesses we are downsizing or exiting) requires management to make certain judgments and estimates regarding the nature, timing and amounts associated with our restructuring actions. Our major assumptions include the timing of employee terminations, the measurement of termination costs, the timing and amount of lease obligations and any anticipated sublease recoveries from exited sites, and the timing of disposition and estimated fair values less costs of disposal for assets we no longer use and which are available for sale. For owned sites and equipment that are no longer in use and are available for sale, we recognize an impairment loss based on their fair value less costs of disposal, with fair value estimated based on market prices for similar assets. We may engage third parties to assist in the determination of the estimated fair values less costs of disposal for these assets. For leased sites that we intend to exit, we discount future contractual lease payments and cancellation fees, if any, less any estimated sublease recoveries, if any. To estimate future sublease recoveries, we engage independent brokers to determine the estimated tenant rents we can expect to realize. At the end of each reporting period, we evaluate the appropriateness of our restructuring charges and balances. Adjustments to the recorded amounts may be required to reflect actual experience or changes in estimates for future periods.
Legal and other contingencies:
We recognize a provision for loss contingencies, including legal claims, based on management’s estimate of the probable outcome. Judgment is required when there is a range of possible outcomes. Management considers the degree of probability of the outcome and the ability to make a reasonable estimate of the loss. We may also use third party advisors in making our determination. The ultimate outcome, including the amount and timing of any payments required, may vary significantly from our original estimates. Potential material legal and other material contingent obligations that have not been recognized as provisions, as the outcome is remote or not probable, or the amount cannot be reliably estimated, are disclosed as contingent liabilities.
55
Warranty:
We offer product and service warranties to our customers. We record a provision for future warranty costs based on management’s estimate of probable claims under these warranties. In determining the amount of the provision, we consider several factors including the terms of the warranty (which vary by customer, product or service), the current volume of products sold or services rendered during the warranty period, and historical warranty information. We review and adjust these estimates as necessary to reflect our experience and new information. The amount and aging of our provision will vary depending on various factors including the length of the warranty offered, the remaining life of the warranty and the extent and timing of warranty claims.
Financial assets and financial liabilities:
We review financial assets at each reporting date. Financial assets are deemed to be impaired when objective evidence resulting from one or more events subsequent to the initial recognition of the asset indicates the estimated future cash flows of the asset have decreased. We use a forward-looking expected credit loss (ECL) model in determining our allowance for doubtful accounts as it relates to trade receivables, contract assets (under IFRS 15), and other financial assets. Our allowance is based on historical experience, and includes consideration of the aging of the balances, the customer's creditworthiness, current economic conditions, expectation of bankruptcies, and political and economic volatility in the markets/location of our customers, among other factors. We measure an impairment loss as the excess of the carrying amount over the present value of the estimated future cash flows discounted using the financial asset’s original discount rate, and we recognize this loss in our consolidated statement of operations. A financial asset is written off or written down to its net realizable value as soon as it is known to be impaired. We will adjust previous write-downs to reflect changes in estimates or actual experience.
We value our derivative assets and liabilities based on inputs that are either readily available in public markets or derived from information available in public markets. The inputs we use include discount rates, forward exchange rates, interest rate yield curves and volatility, and credit risk adjustments. Changes in these inputs can cause significant volatility in the fair value of our financial instruments in the short-term.
Derivatives and hedge accounting:
We enter into forward exchange contracts and swaps to hedge the cash flow risk associated with firm purchase commitments and forecasted transactions in foreign currencies that are considered highly probable and to hedge foreign-currency denominated balances. We use estimates to forecast future cash flows and the future financial position of net monetary assets or liabilities denominated in foreign currencies. We enter into interest rate swap agreements to mitigate a portion of the interest rate risk on our term loan borrowings. We use judgment in determining the amount and timing of such swap agreements. We apply hedge accounting to those hedge transactions that are considered effective. Management assesses the effectiveness of hedges by comparing actual outcomes against our estimates on a regular basis. Subsequent revisions in estimates of future cash flow forecasts, if significant, may result in the discontinuation of hedge accounting for that hedge.
Pension and non-pension post-employment benefits:
We have pension and non-pension post-employment benefit costs and liabilities that are determined from actuarial valuations. Actuarial valuations require management to make certain judgments and estimates relating to salary escalation, compensation levels at the time of retirement, retirement ages, the discount rate used in measuring the net interest on the net defined benefit asset or liability, and expected healthcare costs (as applicable). These actuarial assumptions could change from period-to-period and actual results could differ materially from the estimates originally made by management. We evaluate our assumptions on a regular basis, taking into consideration current market conditions and historical data. Market driven changes may affect the actual rate of return on plan assets compared to our assumptions, as well as our discount rates and other variables which could cause actual results to differ materially from our estimates. Changes in assumptions could impact our defined benefit pension plan valuations and our future defined benefit pension expense and required funding.
To mitigate the actuarial and investment risks of our defined benefit pension plans, we from time to time purchase annuities (using existing plan assets) from third party insurance companies for certain, or all, plan participants. The purchase of annuities by the pension plan substantially hedges the financial investment risks associated with the pension obligations. See note 19(a) to our 2018 AFS.
56
Employee stock-based compensation:
IFRS requires grants of share-based compensation to employees to be measured at fair value and expensed in our consolidated statement of operations over the service period (generally the vesting period) of the grant. We measure the fair value of options using the Black-Scholes option pricing model. Measurement inputs include the price of our subordinate voting shares on the grant date, the exercise price of the option, and our estimates of the following: expected price volatility of our subordinate voting shares (based on weighted average historic volatility), weighted average expected life of the option (based on historical experience and general option holder behavior), and the risk-free interest rate. We adjust compensation expense to reflect the estimated number of options that we expect to vest at the end of the vesting period.
The fair value of restricted share units (RSUs) is based on the market value of our subordinate voting shares at the time of grant.
For performance share units (PSUs) that vest based on non-market performance conditions (related to the achievement of pre-determined financial targets over a specified period), the fair value is based on the market value of our subordinate voting shares at the time of grant, and our estimate of the outcome of such performance condition. We adjust the cost of these PSUs as new facts and circumstances arise; the timing of these adjustments is subject to judgment (but is generally in the final year of their three-year term) based on management's estimate of the expected level of achievement of the relevant performance conditions. For PSUs that vest based on our relative total shareholder return (TSR) performance over a three-year period, a market performance condition, the fair value is based on a Monte Carlo simulation model. The number of awards expected to vest is factored into the grant date Monte Carlo valuation. For PSU grants which vest based on a non-market performance measurement in the final year of the three-year performance period, subject to modification by a separate non-market financial target and our relative TSR performance over the three-year vesting period, the fair value of the TSR modifier is based on a Monte Carlo simulation model, and the fair value of the non-TSR-based performance measurement and modifier are based on the market value of our subordinate voting shares at the time of grant and may be adjusted in subsequent periods to reflect a change in the estimated level of achievement related to the applicable non-market performance condition. We do not adjust the grant date fair value based on the eventual number of PSUs that vest based on the level of achievement of the market performance condition. We adjust compensation expense for PSU awards that are not expected to vest because the employment conditions are not expected to be satisfied.
Business combinations:
All identifiable assets and liabilities acquired in business combinations are recorded at fair value as of the acquisition date. Potential obligations for contingent consideration and other contingencies are also recorded at fair value as of the acquisition date. We record subsequent changes in the fair value of such potential obligations from the date of acquisition to the settlement date in our consolidated statement of operations.
We use judgment to determine the estimates used to value identifiable net assets and the fair value of contingent consideration and other contingencies, if applicable, at the acquisition date. We may engage third parties to determine the fair value of certain inventory, property, plant and equipment and intangible assets. We use estimates to determine cash flow projections, including the period of expected future benefit, and future growth and discount rates, among other factors, to value intangible assets and contingent consideration. The fair value of acquired tangible assets are measured by applying market, cost or replacement costs, or the income approach, as applicable, using discounted cash flows and forecasts by management.
Operating Results
Financial information for 2016 and 2017 throughout this "Operating Results" section has been restated to reflect our January 1, 2018 adoption of IFRS 15.
Our annual and quarterly operating results are affected by, among other items: the level and timing of customer orders; our mix of customers and the types of products or services we provide; the rate at which, the costs associated with, and the execution of, new program wins; demand volumes and the seasonality of our business; price competition and other competitive factors; the mix of manufacturing or service value-add; manufacturing efficiency; the degree of automation used in the assembly process; the
57
availability of components or labor; costs and inefficiencies of transferring programs between sites; program completions or losses, or customer disengagements and the timing and the margin of follow-on business or any replacement business; the impact of foreign exchange fluctuations; the performance of third-party providers; our ability to manage inventory, production location and equipment effectively; our ability to manage changing labor, component, energy and transportation costs effectively; fluctuations in variable compensation costs; the timing of our expenditures in anticipation of forecasted sales levels; and the timing of any acquisitions and related integration costs. Significant period-to-period variations can also result from the timing of new programs reaching full production or programs reaching end-of-life, the timing of follow-on or next generation programs and/or the timing of existing programs being fully or partially transferred internally or to a competitor.
See "Overview —
Overview of business environment
and
Recent developments
" above for a discussion of recent market conditions impacting our business.
Operating results expressed as a percentage of revenue
:
|
|
Year ended December 31
|
|||||||
|
|
2016
|
2017
|
2018
|
|||||
|
(restated)
|
(restated)
|
|||||||
|
Revenue
|
100.0
|
%
|
100.0
|
%
|
100.0
|
%
|
||
|
Cost of sales
|
92.9
|
|
93.2
|
|
93.5
|
|
||
|
Gross profit
|
7.1
|
|
6.8
|
|
6.5
|
|
||
|
SG&A
|
3.5
|
|
3.3
|
|
3.3
|
|
||
|
Research and development costs
|
0.4
|
|
0.4
|
|
0.5
|
|
||
|
Amortization of intangible assets
|
0.1
|
|
0.1
|
|
0.2
|
|
||
|
Other charges
|
0.4
|
|
0.6
|
|
0.9
|
|
||
|
Finance costs, net of refund interest income
|
—
|
|
0.2
|
|
0.4
|
|
||
|
Earnings before income tax
|
2.7
|
|
2.2
|
|
1.2
|
|
||
|
Income tax expense (recovery)
|
0.4
|
|
0.5
|
|
(0.3
|
)
|
||
|
Net earnings
|
2.3
|
%
|
1.7
|
%
|
1.5
|
%
|
||
Revenue:
Revenue of
$6.6 billion
for
2018
increased
8%
compared to
2017
. ATS segment revenue increased
13%
in 2018 compared to 2017, and CCS segment revenue increased
6%
in 2018 compared to 2017.
Revenue of
$6.1 billion
for
2017
increased 2% compared to
2016
. CCS segment revenue increased 2% in 2017 compared to 2016, and ATS segment revenue was relatively flat in 2017 compared to 2016.
The following table sets forth revenue from our reportable segments, as well as segment revenue as a percentage of our total revenue for the periods indicated (in millions, except percentages):
|
2016
|
2017
|
2018
|
|||||||||||||||
|
% of total
|
% of total
|
% of total
|
|||||||||||||||
|
ATS revenue
|
$
|
1,954.2
|
|
32
|
%
|
$
|
1,958.6
|
|
32
|
%
|
$
|
2,209.7
|
|
33
|
%
|
||
|
CCS revenue
|
$
|
4,092.4
|
|
$
|
4,184.1
|
|
$
|
4,423.5
|
|
||||||||
|
Communications
|
2,544.9
|
42
|
%
|
2,654.6
|
43
|
%
|
2,724.2
|
41
|
%
|
||||||||
|
Enterprise
|
1,547.5
|
26
|
%
|
1,529.5
|
25
|
%
|
1,699.3
|
26
|
%
|
||||||||
|
Revenue
|
$
|
6,046.6
|
|
100
|
%
|
$
|
6,142.7
|
|
100
|
%
|
$
|
6,633.2
|
|
100
|
%
|
||
58
Our product and service volumes, revenue and operating results vary from period-to-period depending on various factors, as discussed above. See “Overview.”
ATS segment revenue represented
33%
of total revenue for
2018
, compared to
32%
for
2017
and
32%
for
2016
. ATS segment revenue for
2018
increased
$251.1 million
(
13%
) compared to
2017
, reflecting new aerospace and defense programs, including from our acquisition of Atrenne and our September 2017 “operate-in-place” program (described below), demand strength in our industrial business, higher year-over-year revenue in our capital equipment business, primarily from a strong first half of 2018, and to a lesser extent, revenue from our acquisition of Impakt. Revenue from our semiconductor capital equipment customers however, was weaker than expected for the second half of 2018, adversely impacted by cyclical decreases in demand, which we expect will continue throughout 2019. See "Overview —
Celestica's business
" above for a discussion of recent trends impacting our semiconductor capital equipment customers. ATS segment revenue for 2018 was also adversely impacted by a $24 million decrease, as compared to the prior year, due to our exit from the solar panel manufacturing business (accounting for approximately 1% of our ATS segment revenue in 2017).
ATS segment revenue for 2017 was relatively flat compared to 2016, as growth in our capital equipment business and from new programs was offset by a 7% decrease in revenue due to our exit from the solar panel manufacturing business, and a decrease in revenue due to the completion of programs with one of our then-largest consumer customers during the third quarter of 2016. ATS segment revenue for 2017 benefited from a new “operate-in-place” program outsourced to us from one our aerospace and defense customers in September 2017, as well as our November 2016 Karel acquisition.
CCS segment revenue represented
67%
of total revenue for
2018
, compared to
68%
for
2017
and
68%
for
2016
. CCS segment revenue for 2018 increased
$239.4 million
(
6%
) compared to 2017. Communications end market revenue for 2018 increased
3%
compared to 2017, as increased demand and new programs (including JDM programs) were partially offset by decreased demand from certain of our legacy customers. Enterprise end market revenue for 2018 increased
11%
compared to 2017, primarily driven by strong demand in our storage business. Notwithstanding the increase in CCS segment revenue in 2018 as compared to 2017, we continued to be impacted by adverse pricing pressures in this segment in 2018, and expect these adverse conditions to continue in future periods. See “Overview — Recent developments —
Segment reorganization and segment environment
” above.
CCS segment revenue for 2017 increased 2% compared to 2016. Communications end market revenue in 2017
increased
4% compared to 2016, primarily due to demand strength in certain existing programs and new program growth (including with respect to our fulfillment services and JDM programs). Although Communications revenue
increased
compared to 2016, we experienced slower growth rates (particularly in the second half of 2017) compared to the prior year primarily due to programs reaching their full production levels, and increased pricing pressures and late changes in demand from certain customers in 2017. Enterprise end market revenue for 2017 decreased 1% compared to 2016, as growth from new programs primarily in the first half of 2017 was more than offset by softer demand in the second half of 2017.
Although we supply products and services to over 100 customers, we depend upon a small number of customers for a substantial portion of our revenue. In the aggregate, our top 10 customers represented
70%
of total revenue for
2018
(
2017
—
71%
;
2016
—
68%
). For
2018
, we had two customers that individually represented more than 10% of total revenue (
2017
and
2016
— two customers). Cisco Systems and Dell Technologies accounted for 14% and 10%, respectively, of our total revenue for
2018
(
2017
— Cisco Systems (18%) and Juniper Networks (13%);
2016
— Cisco Systems (19%) and Juniper Networks (11%)), in each case from our CCS segment.
Whether any of our customers individually account for more than 10% of our total revenue in any period depends on various factors affecting our business with that customer and with other customers, including overall changes in demand for our customers' products, the extent and timing of new program wins, follow-on business, program completions or losses, the phasing in or out of programs, the relative growth rate or decline of our business with our various customers, price competition and changes in our customers' supplier base or supply chain strategies, and the impact of seasonality on our business.
We are dependent to a significant degree upon continued revenue from our largest customers. We generally enter into master supply agreements with our customers that provide the framework for our overall relationship. These agreements typically do not guarantee a particular level of business or fixed pricing. Instead, we bid on a program-by-program basis and typically receive customer purchase orders for specific quantities and timing of products. There can be no assurance that revenue from any of our major customers will continue at historical levels or will not decrease in absolute terms or as a percentage of total revenue. A significant revenue decrease or pricing pressures from these or other customers, or a loss of a major customer or program, could
59
have a material adverse impact on our business, our operating results and our financial position. Changes in the types of product or services we provide to our customers in a particular period may also adversely impact our margins and operating results for such period. For example, providing a relatively higher concentration of fulfillment services (which commenced in 2017 as compared to prior years) negatively impacts our operating results for our CCS segment, as our fulfillment services generally have significantly lower margins than our traditional value-added services in that segment. Some of our customer agreements require us to provide specific price reductions to our customers over the term of the contracts, which has significantly impacted revenue and margins in our CCS segment. In addition, as longer-term contracts are becoming more prevalent, we anticipate that these adverse effects will increasingly impact our business in future periods.
In the EMS industry, customers may cancel contracts and volume levels can be changed or delayed. Customers may also shift business to a competitor or bring programs in-house to improve their own utilization or to adjust the concentration of their supplier base to manage supply continuity risk, or for other reasons. We cannot assure the replacement of completed, delayed, cancelled or reduced orders with new business. In addition, we cannot assure that any of our current customers will continue to utilize our services. Changes in demand, order cancellations, and changes or delays in production could have a material adverse impact on our results of operations and working capital performance, including requiring us to carry higher than expected levels of inventory. Materials constraints, primarily impacting our CCS segment (which commenced in 2017 and are expected to continue) can also cause delays in production and could have a material adverse impact on our operations and our inventory levels. In addition, in any given quarter, we can experience quality and process variances related to materials, testing or other manufacturing or supply chain activities. Although we were successful in resolving the majority of such issues that arose in 2018, the existence of these variances could have a material adverse impact on the demand for our services in future periods from any affected customers, which could in turn have a material adverse effect on our business and operating results. Order cancellations and delays could also lower our asset utilization, resulting in lower margins. Significant period-to-period changes in margins can also result if new program wins or follow-on business are more competitively priced than past programs. In addition, customers from time to time shift programs to us from other service providers, including some for lower complexity, light touch programs that are aggressively priced, which can adversely impact future operating results.
Gross profit:
The following table shows gross profit and gross margin (gross profit as a percentage of total revenue) for the periods indicated:
|
|
Year ended December 31
|
||||||||||
|
|
2016
|
2017
|
2018
|
||||||||
|
(restated)
|
(restated)
|
||||||||||
|
Gross profit (in millions)
|
$
|
429.6
|
|
$
|
418.5
|
|
$
|
430.5
|
|
||
|
Gross margin
|
7.1
|
%
|
6.8
|
%
|
6.5
|
%
|
|||||
Gross profit for
2018
increased
3%
, or $12.0 million, compared to
2017
. The increase in gross profit was attributable to higher revenue levels in both our CCS and ATS segments. Despite the increase in revenue for 2018, gross margin decreased from
6.8%
in 2017 to
6.5%
for
2018
. The decrease in gross margin resulted primarily from unfavorable changes in overall program mix (including as a result of demand softness in our capital equipment business), increased pricing pressures primarily in our CCS segment, approximately $10 million in higher provisions we recorded for certain aged inventory during 2018 (Inventory Provisions), and the recognition of a $1.6 million fair value adjustment with respect to the inventory acquired from Atrenne (Atrenne FVA) through cost of sales in the second quarter of 2018. The Inventory Provisions for
2018
of
$13.5 million
(
2017
—
$3.3 million
) resulted primarily from an increase in our overall aged inventory levels, more than half of which related to customers in our ATS segment. These negative impacts more than offset the increase in gross profit in
2018
as compared to 2017 described above.
Gross profit for
2017
decreased
3%
compared to
2016
. Gross margin decreased from 7.1% in 2016 to
6.8%
in 2017. Gross profit and gross margin for 2017 were negatively impacted by unfavorable changes in program mix, increased pricing pressures and higher ramping costs, offset in part by margin improvements in our ATS segment. During 2017, our CCS segment faced increased pricing pressures, and was also negatively impacted by a higher concentration than in 2016 of new programs, including fulfillment services, that contributed significantly lower gross profit than our historical full-service traditional EMS programs. We also incurred additional ramping costs with respect to new programs, including aerospace and defense programs, as well as programs that required the establishment of infrastructures in multiple jurisdictions. Gross profit and gross margin attributable to our ATS segment businesses in 2017 increased compared to the prior year, as a result of increases in each of our
60
semiconductor and former solar businesses (the latter as a result of lower provisions recorded in 2017), offset in part by the completion of consumer programs which benefited gross margin in 2016. The gross margin for our former solar business was negatively impacted in 2016 by higher provisions (accounting for 15 basis points in 2016), primarily to write-down the carrying value of our solar panel inventory to then-recoverable amounts).
In general, multiple factors cause gross margin to fluctuate including, among others: volume and mix of products or services; higher/lower revenue concentration in lower gross margin products and businesses; pricing pressures; contract terms and conditions; production management; utilization of manufacturing capacity; changing material and labor costs, including variable labor costs associated with direct manufacturing employees; manufacturing and transportation costs; start-up and ramp-up activities; new product introductions; disruption in production at individual sites, including as a result of program transfers; cost structures at individual sites; foreign exchange volatility; and the availability of components and materials. Our gross profit and SG&A (discussed below) are also impacted by the level of variable compensation expense (including awards under our incentive and stock-based compensation plans) we record in each period.
Selling, general and administrative expenses:
SG&A for
2018
of
$219.0 million
(
3.3%
of total revenue) increased
$15.8 million
compared to
$203.2 million
(
3.3%
of total revenue) for
2017
, primarily due to higher variable expenses, including $3.2 million in higher employee stock-based compensation expense (described below) in 2018, and $10.5 million in SG&A attributable to acquisitions completed in 2018.
SG&A for
2017
of
203.2 million
(
3.3%
of total revenue) decreased $7.9 million compared to
$211.1 million
(
3.5%
of total revenue) for
2016
, primarily due to $2.5 million of lower foreign exchange losses, $2.5 million of lower stock-based compensation expense in 2017 (discussed below), and lower variable expenses, including costs associated with our Organizational Design (OD) initiative incurred in
2017
compared to 2016. As part of the wind down of our solar panel business, we recorded a provision of $0.5 million in SG&A expenses during the second quarter of
2017
to write down our solar accounts receivable, primarily as a result of a solar customer's bankruptcy.
Segment income and margin:
Segment performance is evaluated based on segment revenue (set forth above), segment income and segment margin (segment income as a percentage of segment revenue). Revenue is attributed to the segment in which the product is manufactured or the service is performed. Segment income is defined as a segment’s net revenue less its cost of sales and its allocable portion of selling, general and administrative expenses and research and development expenses (collectively, Segment Costs). Identifiable Segment Costs are allocated directly to the applicable segment while other Segment Costs, including indirect costs and certain corporate charges, are allocated to our segments based on an analysis of the relative usage or benefit derived by each segment from such costs. Segment income excludes finance costs (net of refund interest, when applicable), amortization of intangible assets (excluding computer software), employee stock-based compensation expense, other solar charges, the Atrenne FVA (recognized in the second quarter of 2018), and net restructuring, impairment and other charges (recoveries) (each of which exclusions is quantified herein) as these costs and charges are managed and reviewed by our CEO at the company level. Net restructuring, impairment and other charges (recoveries) include, in applicable periods, restructuring charges (recoveries), impairment charges (recoveries), acquisition-related consulting, transaction and integration costs (Acquisition Costs), legal settlements (recoveries), Toronto transition costs (recoveries), and the accelerated amortization of unamortized deferred financing costs (as described under “Non-IFRS measures” below). See the reconciliation of segment income to our earnings before income taxes in note 25 to the 2018 AFS. Our segments do not record inter-segment revenue. Although segment income and segment margin are used to evaluate the performance of our segments, we may incur operating costs in one segment that may also benefit the other segment. Our accounting policies for segment reporting are the same as those applied to the company as a whole.
The following table shows segment income (in millions) and segment margin for the periods indicated:
|
Year ended December 31
|
||||||||||||||
|
Segment income and segment margin:
|
2016
|
2017
|
2018
|
|||||||||||
|
Segment Margin
|
Segment Margin
|
Segment Margin
|
||||||||||||
|
ATS segment
|
$
|
73.9
|
|
3.8%
|
$
|
96.8
|
|
4.9%
|
$
|
102.5
|
|
4.6%
|
||
|
CCS segment
|
149.3
|
|
3.6%
|
120.4
|
|
2.9%
|
111.4
|
|
2.5%
|
|||||
61
ATS segment income for 2018 increased
$5.7 million
(
6%
) compared to
2017
. ATS segment margin decreased from
4.9%
in 2017 to
4.6%
in 2018. The increase in ATS segment income for 2018 was primarily due to higher ATS segment revenue in 2018, as described above, including higher year-over-year revenue in our capital equipment business, primarily during the first half of 2018. The decrease in ATS segment margin was attributable primarily to the weaker than expected demand from our capital equipment business (primarily with respect to our semiconductor customers) in the second half of 2018, resulting in operating losses in this business in Q4 2018 in the mid-single digit million dollar range, due to the high level of associated fixed costs, which more than offset segment margin improvement from acquisitions and new ATS programs in other businesses. We expect the demand softness in our capital equipment business to continue into 2019, and have estimated a single digit million dollar operating loss in this business for the first quarter of 2019.
ATS segment income for 2017 increased
$22.9 million
(
31%
) compared to 2016. ATS segment margin increased from
3.8%
in 2016 to
4.9%
in 2017. Despite ATS revenue for 2017 being relatively flat compared to 2016, ATS segment income and margin for 2017 increased primarily due to increases in each of our capital equipment and former solar businesses (the latter as a result of approximately $10 million in lower inventory provisions recorded in 2017 compared to 2016), offset in part by the completion of consumer programs which benefited segment margin in 2016.
CCS segment income for 2018 decreased
$9.0 million
(
7%
) compared to
2017
. CCS segment margin decreased from
2.9%
in 2017 to
2.5%
in 2018. Despite the increase in our overall CCS segment revenue for 2018 as compared to 2017, CCS segment income and margin for 2018, as compared to 2017, were negatively impacted by increased pricing pressures from some of our significant customers, unfavorable changes in program mix, including a higher concentration of lower margin business compared to the prior year (particularly in the first quarter of 2018), and the Inventory Provisions recorded in 2018 (discussed above). These decreases were partially offset by CCS segment income contributions from our JDM business in 2018 as compared to the prior year. The performance of our CCS segment in recent periods resulted in the implementation of our CEI in October 2017 (and related restructuring actions) in order to reduce our cost structure (see “Other charges” below). In addition, as part of our strategy to diversify our business and improve shareholder returns, we commenced the CCS Review in the second half of 2018, with the intention of addressing under-performing programs.
See
"Overview — Celestica's business"
above for a discussion of our CCS Review, as well as anticipated impacts of this review on our operations and financial results.
CCS segment income for 2017 decreased
$28.9 million
(
19%
) compared to 2016. CCS segment margin decreased from
3.6%
in 2016 to
2.9%
in 2017. Despite the increase in our CCS segment revenue for 2017 compared to 2016, CCS segment income and margin for 2017, as compared to 2016, were negatively impacted by unfavorable changes in program mix, increased pricing pressures and higher ramping costs. During 2017, our CCS segment faced increased pricing pressures, and was also negatively impacted by a higher concentration than in 2016 of new programs, including fulfillment services, that contributed significantly lower gross profit than our historical full-service traditional EMS programs.
Stock-based compensation:
Our employee stock-based compensation expense, which excludes deferred share unit (DSU) expense, varies each period. The portion of our expense that relates to performance-based compensation generally varies depending on our level of achievement of pre-determined performance goals and financial targets. In
2018
, we recorded employee stock-based compensation expense of $14.7 million (
2017
— $14.6 million;
2016
—$15.0 million) in cost of sales and $18.7 million (
2017
— $15.5 million;
2016
— $18.0 million) in SG&A.
The following table shows employee stock-based compensation for the periods indicated:
|
|
Year ended December 31
|
||||||||||
|
|
2016
|
2017
|
2018
|
||||||||
|
Employee stock-based compensation (in millions)
|
$
|
33.0
|
|
$
|
30.1
|
|
$
|
33.4
|
|
||
Compared to
2017
, our employee stock-based compensation expense for
2018
increased by
$3.3 million
, reflecting $2.4 million in higher reversals we recorded during 2017 in connection with forfeited awards, and additional expenses related to new grants made during 2018 as compared to 2017.
62
Compared to
2016
, our employee stock-based compensation expense for
2017
decreased by $2.9 million, (predominately through SG&A), primarily due to lower adjustments recorded in 2017 to reflect the reduced level of achievement related to our performance based compensation. In addition, the increase in forfeited awards during 2017 decreased our stock-based compensation by a further $2.4 million in 2017, which offset a $2.0 million increase in the accelerated recognition of stock-based compensation expense for employees eligible for retirement in 2017.
Management currently intends to settle all outstanding RSUs and PSUs with subordinate voting shares purchased in the open market by a broker or by issuing subordinate voting shares from treasury. Accordingly, we have accounted for these share unit awards as equity-settled awards. See “Cash requirements” below.
In
2018
, we recorded DSU expense of
$2.0 million
(
2017
—
$2.2 million
;
2016
—
$2.1 million
) through SG&A. During 2017, we paid $1.7 million in cash to a director that resigned in July 2017 to settle his outstanding DSUs, and we settled the outstanding DSUs of a director that resigned in November 2017 with 14,098 subordinate voting shares that we purchased in the open market, in each case in accordance with the provisions of the Directors' Share Compensation Plan.
Other charges:
(i) Restructuring charges:
We have recorded the following restructuring charges for the periods indicated (in millions):
|
Year ended December 31
|
||||||||||||
|
2016
|
2017
|
2018
|
||||||||||
|
Restructuring charges
|
$
|
31.9
|
|
$
|
28.9
|
|
$
|
35.4
|
|
|||
We perform ongoing evaluations of our business, operational efficiency and cost structure, and implement restructuring actions as we deem necessary. In connection therewith, we are currently implementing restructuring actions under the CEI, including actions related to our CCS Review and anticipated continued demand softness in our capital equipment business. This initiative includes reductions to our workforce, as well as the potential consolidation of certain sites to better align capacity and infrastructure with current and anticipated customer demand, related transfers of customer programs and production, re-alignment of business processes, management reorganizations, and other associated activities.
We continue to estimate total restructuring charges for the CEI to be within the previously disclosed range of between $50.0 million and $75.0 million, however we are extending the program by six months and expect the remainder of the charges to be recorded by the end of 2019.
We have recorded $43.4 million in restructuring charges from the commencement of our CEI through the end of 2018, including the
$35.4 million
of restructuring charges recorded in 2018. The majority of the charges through December 31, 2018 pertained to workforce reductions at sites associated primarily with our CCS segment.
We recorded restructuring charges of
$35.4 million
in
2018
, consisting of cash charges of
$35.2 million
, primarily for consultant costs, employee and lease termination costs, and non-cash charges of
$0.2 million
, representing losses on the sale of surplus equipment. Our restructuring provision at
December 31, 2018
was
$10.3 million
, the majority of which we currently expect to pay in 2019. All cash outlays have been, and the balance is expected to be, funded with cash on hand.
We recorded restructuring charges of
$28.9 million
in
2017
, consisting of cash charges of
$25.1 million
, comprised of employee termination costs resulting from the implementation of our previous OD and Global Business Services (GBS) initiatives (each of which were completed in 2017, and pertained to both of our segments), as well as from the rationalization of our operations in the third quarter of
2017
, and $8.0 million of charges in connection with our CEI (described above) in the fourth quarter of
2017
, as well as net non-cash impairment charges of
$3.8 million
to write down the carrying value of our solar panel manufacturing equipment (in our ATS segment) to its fair value less costs of disposal, based on executed sales agreements (2017 Solar Write-down). Our restructuring provision at
December 31, 2017
was
$12.7 million
, comprised primarily of employee termination costs, which were paid with cash on hand.
Our aggregate restructuring charges of
$31.9 million
for
2016
consisted of cash charges of
$10.7 million
, primarily for employee termination costs relating to our GBS and OD initiatives, as well as our solar panel manufacturing and other exited operations, and non-cash charges of
$21.2 million
, to write down certain plant assets and equipment to recoverable amounts,
63
including $19.0 million related to our solar panel manufacturing equipment at our two locations (2016 Solar Write-down). The majority of these charges were associated with our ATS segment. See note 4 of our 2018 AFS for a description of our decision in the fourth quarter of 2016 to exit the solar panel manufacturing business, and associated write-downs of assets. Our restructuring provision at
December 31, 2016
was
$6.6 million
, comprised primarily of employee termination costs, which were all paid with cash on hand.
We may also propose additional future restructuring actions or divestitures as a result of changes in our business, the marketplace and/or our exit from less profitable, under-performing, non-core or non-strategic operations. In addition, an increase in the frequency of customers transferring business to our EMS competitors, changes in the volumes they outsource, pricing pressures, or requests to transfer their programs among our sites or to lower-cost locations, may also result in our taking future restructuring actions. We may incur higher operating expenses during periods of transitioning programs within our network or to our competitors. Any such restructuring activities, if undertaken at all, could adversely impact our operating and financial results, and may require us to further adjust our operations.
The recognition of restructuring charges requires us to make certain judgments and estimates regarding the nature, timing and amounts associated with our restructuring actions. See note 2(m) to our 2018 AFS.
(ii) Asset impairment:
We review the carrying amounts of goodwill, intangible assets and property, plant and equipment whenever events or changes in circumstances (triggering events) indicate that the carrying amount of such assets (or the related CGU or group of CGUs) may exceed their recoverable amount. If any such indication exists, we test the carrying amount of such assets or CGUs for impairment. In addition to an assessment of triggering events during the year, we conduct an annual goodwill impairment assessment (Annual Impairment Assessment) of our CGUs with goodwill in the fourth quarter of the year to correspond with our annual planning cycle. Judgment is required in the determination of our CGUs and whether events or changes in circumstances during the year are indicators that a review for impairment should be conducted. We recognize an impairment loss when the carrying amount of an asset, CGU or a group of CGUs exceeds its recoverable amount, which is measured as the greater of its expected value-in-use and its fair value less costs of disposal. We did not identify any triggering event during the course of
2018
indicating that the carrying amount of our assets or CGUs may not be recoverable. In the fourth quarter of
2018
, we performed our Annual Impairment Assessment of our CGUs with goodwill and determined that there was no goodwill impairment as the recoverable amount of such CGUs exceeded their respective carrying values as of
December 31, 2018
.
We did not identify any triggering event during the course of
2017
indicating that the carrying amount of our assets or CGUs may not be recoverable, other than with respect to our exit from the solar panel manufacturing business. In connection therewith, we recorded the 2017 Solar Write-down (through restructuring charges). In the fourth quarter of
2017
, we performed our Annual Impairment Assessment of our CGUs with goodwill and determined that there was no impairment as the recoverable amount of such CGUs exceeded their respective carrying values as of
December 31, 2017
.
We did not identify any triggering event during the course of
2016
indicating that the carrying amount of our assets or CGUs may not be recoverable, other than the 2016 Solar Write-down (recorded through restructuring charges). In the fourth quarter of
2016
, we performed our Annual Impairment Assessment of our CGUs with goodwill and determined that there was no impairment as the recoverable amount of such CGUs exceeded their respective carrying values as of
December 31, 2016
.
The process of determining the recoverable amount of an asset, CGU or group of CGUs is subjective and requires management to exercise significant judgment in estimating future growth, profitability, and discount and terminal growth rates, among other factors. Where applicable, including with respect to the 2017 Solar Write-down and the 2016 Solar Write-down, we engage independent brokers to obtain market prices to estimate our real property and other asset values. The assumptions used in each of our 2017 and 2016 interim impairment assessments were determined based on past experiences adjusted for expected changes in future conditions. See note 9 of our 2018 AFS for a discussion of how we determine our cash flow projections for our impairment assessments, as well as the cash flow projection periods, growth rates, and discount rates used in our Annual Impairment Assessments for each of 2018, 2017 and 2016.
64
Our goodwill balance is allocated to the following CGUs (in millions):
|
December 31
|
|||||||||
|
2016
|
2017
|
2018
|
|||||||
|
Capital equipment
(1)
|
$
|
19.5
|
|
$
|
19.5
|
|
$
|
130.7
|
|
|
A&D
(2)
|
3.7
|
|
3.7
|
|
3.7
|
|
|||
|
Atrenne
(3)
|
—
|
|
—
|
|
64.0
|
|
|||
|
$
|
23.2
|
|
$
|
23.2
|
|
$
|
198.4
|
|
|
|
(1)
|
Consists of: (i) in 2018, $111.2 million of goodwill attributable to our acquisition of Impakt, and $19.5 million attributable to a prior acquisition (Prior Goodwill); and (ii) in 2017 and 2016, the Prior Goodwill.
|
|
(2)
|
Consists of $3.7 million of goodwill attributable to our acquisition of Karel completed in 2016.
|
|
(3)
|
Consists of $64.0 million of goodwill attributable to our acquisition of Atrenne completed in 2018.
|
As part of our goodwill assessment, we also perform sensitivity analyses for the relevant CGUs in order to identify the impact of changes in key assumptions, including projected growth rates, profitability, and discount and terminal growth rates. We did not identify any key assumptions where a reasonable possible change would result in material impairments to the above goodwill balances in any of 2016, 2017 or 2018. Impairment assessments inherently involve judgment as to assumptions about expected future cash flows and the impact of market conditions on those assumptions. Future events and changing market conditions may impact our assumptions as to prices, costs or other factors that may result in changes in our estimates of future cash flows. Failure to realize the assumed revenues at an appropriate profit margin of a CGU could result in impairment losses in such CGU in future periods.
(iii) Pension annuity purchases:
In March 2017, the Trustees of our U.K. Main pension plan entered into an agreement with a third party insurance company to purchase an annuity for participants in such plan who have retired. The purchase of this annuity resulted in a non-cash loss of $17.0 million which we recorded in other comprehensive income (OCI) and simultaneously re-classified to deficit during the first quarter of 2017. In April 2017, the Trustees of our U.K. Supplementary pension plan entered into an agreement with a third party insurance company to purchase an annuity for all participants of this plan, all of whom are retired. The purchase of this annuity resulted in a non-cash loss of
$1.9 million
, which we recorded during the second quarter of 2017 in other charges in our consolidated statement of operations, as we anticipate winding up this plan during the first half of 2019 (see note 16 of our 2018 AFS).
In June 2018, the Trustees of the U.K. Main pension plan entered into an agreement with a third party insurance company to purchase an annuity for participants in such plan who have not yet retired.
The purchase of this annuity resulted in a non-cash loss of $63.3 million during the second quarter of 2018 which we recorded in OCI and simultaneously re-classified to deficit. The cost of the annuities are generally subject to true-up adjustments, and we may be required to pay additional premium amounts to the insurance company after completion of data verification of the participants.
(iv) Toronto transition costs:
In
2018
, we recorded
$13.2 million
of such transition costs (
2017
—
$1.6 million
), consisting primarily of utility costs related to idle premises, depreciation charges and personnel costs incurred in the operation of duplicate production lines in advance of the transition, duplicate rent expenses, and relocation costs. See "Liquidity — Toronto Real Property and Related Transactions" below for a discussion of the sale of our Toronto real property and related relocations, including transition and capital costs incurred through
December 31, 2018
and expected in connection therewith. See "Recent developments —
Toronto Real Property and Related Transactions Update
" above for a discussion of the consummation of this transaction.
(v) Accelerated amortization of unamortized deferred financing costs:
During the second quarter of 2018, we recorded a $1.2 million charge to accelerate the amortization of unamortized deferred financing costs related to the extinguishment of the Prior Facility in June 2018.
65
(vi) Other:
During
2018
, we recorded $11.0 million (
2017
— $4.5 million;
2016
— $1.4 million) in Acquisition Costs. See note 3 of our 2018 AFS. Additionally, during 2017 and 2016, we received recoveries of damages of $1.1 million and $12.0 million, respectively, in connection with the settlement of class action lawsuits in which we were a plaintiff, related to certain purchases we made in prior periods. These recoveries were partially offset by costs we recorded in each year for unrelated legal matters.
Refund interest income in 2016:
In 2016, we received refund interest income totaling $14.3 million in connection with the resolution of certain previously disputed tax matters. See “Income taxes” below.
Income taxes:
For
2018
, we had a net income tax recovery of
$17.0 million
on earnings before tax of
$81.9 million
, compared to a net income tax expense of
$27.6 million
on earnings before tax of
$133.1 million
for
2017
and a net income tax expense of
$24.7 million
on earnings before tax of
$163.0 million
for
2016
.
Our net income tax recovery for
2018
of
$17.0 million
was favorably impacted by the recognition of $3.7 million and $49.6 million of previously unrecognized deferred tax assets in our U.S. group of subsidiaries as a result of our acquisitions of Atrenne and Impakt, respectively (the benefit pertaining to Impakt is referred to as the Impakt Benefit), which partially offset the $56.6 million in net deferred tax liabilities that arose in connection with such acquisitions, as well as the reversal of $6.0 million of previously accrued Mexican taxes (described below). These favorable impacts were offset, in part, by adverse taxable foreign exchange impacts resulting from the weakening of the Malaysian ringgit and Chinese renminbi relative to the U.S. dollar, our functional currency (Currency Impacts). Our functional and reporting currency is the U.S. dollar; however, our income tax expense is based primarily on taxable income determined in the currency of the country of origin. As a result, foreign currency translation differences impact our income tax expense from period to period. During the second quarter of 2018, we received a favorable conclusion to our application for a bi-lateral advance pricing arrangement (BAPA) between the United States and Mexican tax authorities, and reversed $6.0 million of Mexican income taxes previously accrued to reflect the approved BAPA terms.
Our net income tax expense for 2017 of $27.6 million
was favorably impacted by the
recognition of a $4.3 million deferred income tax benefit (Solar Benefit) related to our solar assets (discussed below), as well as taxable foreign exchange benefits resulting from the strengthening of the Malaysian ringgit and Chinese renminbi relative to the U.S. dollar, which was offset in part by $4.0 million in deferred income tax expense related to taxable temporary differences associated with the then-anticipated repatriation of undistributed earnings from certain of our Chinese subsidiaries, and a $2.0 million deferred income tax expense related to recently enacted U.S. Tax Reform (discussed below). In connection with our exit from the solar panel manufacturing business, we withdrew one of our tax incentives in Thailand (which related solely to such operations) during the second quarter of 2017. The withdrawal of this incentive allowed us to apply tax losses arising from the disposition of our solar assets against other taxable profits in Thailand, resulting in the recognition of the Solar Benefit in 2017 and ultimately realized in 2018.
The U.S. Tax Reform was enacted on December 22, 2017 and became effective January 1, 2018. We believe that we recorded all significant one-time impacts resulting from enactment of the U.S. Tax Reform in the fourth quarter of 2017 (consisting of a non-cash increase to our deferred income tax expense of $2.0 million), but will continue to assess additional impacts, if any, throughout 2019 as they become known due to changes in our interpretations and assumptions, as well as applicable changes in our business and additional regulatory guidance that may be issued. No significant amounts resulting from the U.S. Tax Reform were recorded in 2018. Based on currently available information, we estimate that the U.S. Tax Reform may have an annual adverse impact on our tax expense of approximately $1 million starting in 2019.
Our net income tax expense for 2016 of
$24.7 million
was favorably impacted by a reversal of provisions previously recorded for tax uncertainties related to the final reassessments and settlement of tax accounts in connection with the resolution of a transfer pricing matter for one of our Canadian subsidiaries. In connection therewith, we recorded aggregate income tax recoveries of $45 million Canadian dollars (approximately $34 million at the exchange rates at the time of recording), as well as aggregate refund interest income of $14.3 million. Our net income tax expense for 2016 was negatively impacted by withholding taxes of $1.5 million pertaining to the repatriation of $50.0 million from a U.S. subsidiary, deferred income tax expense of $8.0 million related to taxable temporary differences associated with the then-anticipated repatriation of undistributed earnings from certain of our Chinese subsidiaries, as well as adverse Currency Impacts of $7.3 million. There was no tax impact recorded in
66
2016 associated with the $21.2 million in non-cash impairment charges (recorded through restructuring), however, as discussed above, we recorded the Solar Benefit of $4.3 million in 2017, which was ultimately realized in 2018.
We conduct business operations in a number of countries, including countries where tax incentives have been extended to encourage foreign investment or where income tax rates are low. Our effective tax rate can vary significantly from period to period for various reasons, including as a result of the mix and volume of business in various tax jurisdictions, and in jurisdictions with tax holidays and tax incentives that have been negotiated with the respective tax authorities (see discussion below). Our effective tax rate can also vary as a result of restructuring charges, foreign exchange fluctuations, operating losses, cash repatriations, certain tax exposures, the time period in which losses may be used under tax laws and whether management believes it is probable that future taxable profit will be available to allow us to recognize deferred income tax assets.
Certain countries in which we do business grant tax incentives to attract and retain our business. Our tax expense could increase significantly if certain tax incentives from which we benefit are retracted. A retraction could occur if we fail to satisfy the conditions on which these tax incentives are based, or if they are not renewed or replaced upon expiration. Our tax expense could also increase if tax rates applicable to us in such jurisdictions are otherwise increased, or due to changes in legislation or administrative practices. Changes in our outlook in any particular country could impact our ability to meet the required conditions.
We have multiple income tax incentives in Thailand with varying exemption periods. These incentives initially allow for a 100% income tax exemption (including distribution taxes), which after eight years transition to a 50% income tax exemption for the next five years (excluding distribution taxes). Upon full expiry of each of the incentives, taxable profits associated with such expired tax incentives become fully taxable. As a result of our exit from the solar panel manufacturing business, we withdrew our tax incentive related to our solar panel manufacturing operations in Thailand during the second quarter of 2017 (see above). One of our remaining three Thailand tax incentives expires in 2019, another expires in 2020, and the third incentive will transition to the 50% exemption in 2022, and expire in 2027. Upon expiry of the first tax incentive in 2019, we estimate an additional annual tax expense of approximately $1.5 million based on current levels of profit, without accounting for the potential to shift certain Thailand production to incentives that do not expire in 2019.
In certain jurisdictions, primarily in the Americas and Europe, we currently have significant net operating losses and other deductible temporary differences, which we expect will be used to reduce taxable income in these jurisdictions in future periods, although not all are currently recognized as deferred tax assets.
We develop our tax filing positions based upon the anticipated nature and structure of our business and the tax laws, administrative practices and judicial decisions currently in effect in the jurisdictions in which we have assets or conduct business, all of which are subject to change or differing interpretations, possibly with retroactive effect. We are subject to tax audits of historical information by tax authorities in various jurisdictions which could result in additional tax expense in future periods relating to prior results. Reviews by tax authorities generally focus on, but are not limited to, the validity of our inter-company transactions, including financing and transfer pricing policies which generally involve subjective areas of taxation and a significant degree of judgment. Any such increase in our income tax expense and related interest and/or penalties could have a significant adverse impact on our future earnings and future cash flows.
In 2017, the Brazilian Ministry of Science, Technology, Innovation and Communications (MCTIC) issued assessments seeking to disqualify certain amounts of research and development (R&D) expenses for the years 2006 to 2009, which entitled our Brazilian subsidiary (which ceased operations in 2009) to charge reduced sales tax levies to its customers. The assessments against our Brazilian subsidiary (including interest and penalties) total approximately 39 million Brazilian real (approximately $10 million at year-end exchange rates) for such years. Although we cannot predict the outcome of this matter, we believe that our R&D activities for the period are supportable, and it is probable that our position will be sustained upon full examination by the appropriate Brazilian authorities and, if necessary, upon consideration by the Brazilian judicial courts. Our position is supported by our Brazilian legal advisers.
The successful pursuit of assertions made by any taxing authority could result in our owing significant amounts of tax, interest and possibly penalties. We believe we adequately accrue for any probable potential adverse tax ruling. However, there can be no assurance as to the final resolution of any claims and any resulting proceedings. If any claims and any ensuing proceedings are determined adversely to us, the amounts we may be required to pay could be material, and could be in excess of amounts accrued.
67
Net earnings:
Net earnings for
2018
decreased
$6.6 million
compared to
2017
. The decrease was primarily due to $24.0 million in higher other charges (primarily restructuring charges, Acquisition Costs and Toronto transition costs), $14.3 million in higher finance costs, (see "Liquidity —
Cash provided by (used in) financing activities
" below) and $6.5 million in higher amortization of intangibles in 2018 as compared to the prior year, offset in part by $44.6 million in lower income taxes in 2018 compared to 2017 (primarily due to the $49.6 million Impakt Benefit).
Net earnings for
2017
decreased
$32.8 million
compared to
2016
. The decrease was primarily due to lower gross profit in 2017, as well as the receipt of legal recoveries ($12.0 million) and refund interest income ($14.3 million) that benefited 2016 compared to 2017.
Acquisition Activity and Program Transfer:
In November 2016, we acquired the business assets of Karel. The Karel acquisition supported our strategy to accelerate our growth in the aerospace and defense market through the addition of value-add capabilities and services. In 2018, we completed the acquisitions of Atrenne and Impakt. See “Overview — Recent developments” above. Our acquisitions of Karel, Atrenne and Impakt pertain to our ATS segment.
In September 2017, one of our existing aerospace and defense customers outsourced certain operations to us under a 10-year “operate-in-place” agreement, pursuant to which we provide manufacturing and after-market repair services for electromechanical and electronic assemblies across a wide array of technologies at such customers' site. This agreement further expanded our relationship with this customer, enhanced our ability to provide end-to-end product lifecycle solutions to our customers, and supported our strategy of growing our aerospace and defense business.
We may, at any time, be engaged in ongoing discussions with respect to possible acquisitions or strategic transactions that could expand our revenue base and/or service offerings, increase our penetration in various industries, establish strategic relationships with new or existing customers, enhance our competitiveness, and/or enhance our global supply chain network. There can be no assurance that any of these discussions will result in a definitive purchase agreement and, if they do, what the terms or timing of any such agreement would be. There can also be no assurance that any acquisition or other strategic transactions will be successfully integrated or will generate the returns we expect. We may fund acquisitions from cash on hand, third-party borrowings, the issuance of securities, or a combination thereof.
Liquidity and Capital Resources
Liquidity
The following tables set forth key liquidity metrics for the periods indicated (in millions):
|
December 31
|
|||||||||||
|
2016
|
2017
|
2018
|
|||||||||
|
Cash and cash equivalents
|
$
|
557.2
|
|
$
|
515.2
|
|
$
|
422.0
|
|
||
|
Borrowings under credit facility
|
227.5
|
|
187.5
|
|
757.3
|
|
|||||
68
|
Year-ended December 31
|
|||||||||||
|
|
2016
|
2017
|
2018
|
||||||||
|
(restated)*
|
(restated)*
|
||||||||||
|
Cash provided by operating activities
|
$
|
173.3
|
|
$
|
127.0
|
|
$
|
33.1
|
|
||
|
Cash used in investing activities
|
(64.0
|
)
|
(89.3
|
)
|
(545.6
|
)
|
|||||
|
Cash generated from (used in) financing activities
|
(97.4
|
)
|
(79.7
|
)
|
419.3
|
|
|||||
|
Changes in non-cash working capital items (included in operating activities above):
|
|||||||||||
|
A/R
|
$
|
(134.6
|
)
|
$
|
(6.3
|
)
|
$
|
(155.4
|
)
|
||
|
Inventories
|
(61.5
|
)
|
(139.6
|
)
|
(224.0
|
)
|
|||||
|
Other current assets
|
(5.3
|
)
|
(2.0
|
)
|
7.6
|
|
|||||
|
A/P, accrued and other current liabilities and provisions
|
75.4
|
|
51.8
|
|
227.0
|
|
|||||
|
Working capital changes
|
$
|
(126.0
|
)
|
$
|
(96.1
|
)
|
$
|
(144.8
|
)
|
||
* Restated to reflect the impact of our adoption of IFRS 15 as of January 1, 2018 on net earnings and changes in non-cash working capital.
Cash provided by operating activities:
In
2018
, we generated
$33.1 million
of cash from operating activities compared to
$127.0 million
in
2017
. The decrease of $93.9 million was primarily due to a $48.7 million increase in working capital requirements and $51.2 million in lower earnings before income taxes in 2018 as compared to 2017. Higher working capital requirements for 2018 as compared to the prior year were driven primarily by increases in accounts receivable ($149.1 million) and inventory ($84.4 million) balances, offset in part by increases in accounts payable balances ($175.2 million). Although part of the $84.4 million in additional inventory in 2018 compared to 2017 was required to support new program ramps, we experienced demand reductions from certain of our customers in each of our segments, as well as materials constraints primarily from CCS segment suppliers during 2018, each of which resulted in us carrying higher than expected levels of inventory at
December 31, 2018
compared to 2017. We anticipate that these market conditions will continue to adversely impact us in 2019. The increases in accounts receivable for 2018 as compared to 2017 generally reflect the higher amounts and timing of revenue earned during 2018. The increase in accounts payable reflects increased inventory purchases during 2018.
In
2017
, we generated
$127.0 million
of cash from operating activities compared to
$173.3 million
in 2016. The decrease was primarily due to the income tax refund of $52 million related to the resolution of certain tax matters we received in the fourth quarter of 2016 (See “Operating results — Income taxes” above), and the decrease in net earnings in 2017 as compared to 2016, offset in part by $29.9 million in lower working capital requirements in 2017 as compared to 2016. Lower working capital requirements in 2017 were primarily due to improvements in A/R from the prior year ($128.3 million), offset in part by higher inventory levels ($78.1 million). Cash generated from accounts receivable improved compared to 2016, primarily due to lower revenue levels in the fourth quarter of 2017 compared to the same period in 2016, as well as $30.0 million of additional accounts receivable sold under our A/R sales program in 2017 compared to 2016, which we used as an alternative to drawing on our Prior Revolver. Our inventory levels increased compared to 2016, in part to support our new program ramps, but also as a result of demand volatility in our CCS segment, including late changes from certain customers, as well as materials constraints throughout 2017, all of which resulted in us carrying higher than expected levels of inventory at December 31, 2017 as compared to 2016.
From time to time, we extend payment terms applicable to certain customers, and/or provide longer payment terms when deemed commercially reasonable. Longer payment terms, which have become more prevalent, could adversely impact our working capital requirements, and increase our financial exposure and credit risk. Commencing in the fourth quarter of 2016, the payment terms of one of our significant customers was extended. In connection therewith, we registered for that customer's supplier financing program (SFP) pursuant to which participating suppliers may sell A/R from such customer to a third-party bank on an uncommitted basis in order to receive earlier payment. During
December 31, 2018
, we sold
$50.0 million
of accounts receivable under this program (
December 31, 2017
—
$52.3 million
;
December 31, 2016
—
$51.4 million
). We utilized the SFP to substantially offset the effect of the extended payment terms on our working capital for the period. We pay discount charges with respect to this arrangement, which we record as finance costs in our consolidated statement of operations. Due to our anticipated disengagement from a portion of this customer's programs in early 2019, we expect to sell a lower amount of A/R under the SFP in future periods.
69
Free cash flow (non-IFRS):
Non-IFRS free cash flow is defined as cash provided by or used in operations after the purchase of property, plant and equipment (net of proceeds from the sale of certain surplus equipment and property), finance lease payments, repayments from a former solar supplier, and finance costs paid. As a measure of liquidity, and consistent with the inclusion of our Toronto relocation capital expenditures and transition costs in non-IFRS free cash flow in the periods incurred, we will include the amounts received from the sale of our Toronto real property, in non-IFRS free cash flow in the period of receipt. Note, however, that non-IFRS free cash flow does not represent residual cash flow available to Celestica for discretionary expenditures. Management uses non-IFRS free cash flow as a measure, in addition to IFRS cash provided by or used in operations, to assess our operational cash flow performance. We believe non-IFRS free cash flow provides another level of transparency to our liquidity. A reconciliation of this measure to cash provided by (used in) operating activities measured under IFRS is set forth below (in millions):
|
Year ended December 31
|
||||||||||||
|
2016
|
2017
|
2018
|
||||||||||
|
IFRS cash provided by operations
|
$
|
173.3
|
|
$
|
127.0
|
|
$
|
33.1
|
|
|||
|
Purchase of property, plant and equipment, net of sales proceeds
|
(63.1
|
)
|
(101.8
|
)
|
(78.5
|
)
|
||||||
|
Finance lease payments
|
(4.5
|
)
|
(6.5
|
)
|
(17.0
|
)
|
||||||
|
Repayments from former solar supplier
|
14.0
|
|
12.5
|
|
—
|
|
||||||
|
Finance costs paid
|
(9.5
|
)
|
(10.2
|
)
|
(36.0
|
)
|
||||||
|
Non-IFRS free cash flow
|
$
|
110.2
|
|
$
|
21.0
|
|
$
|
(98.4
|
)
|
|||
Our non-IFRS free cash flow of negative
$98.4 million
for
2018
decreased
$119.4 million
compared to
2017
, primarily due to lower cash generated from operating activities in
2018
(discussed above) as compared to
2017
, as well as the payment of approximately $13 million of debt issuance costs incurred in connection with the arrangement of our New Credit Facility and New Term Loans, higher interest costs incurred on our higher borrowings in 2018, and $11.3 million of finance lease payments (including accrued interest and fees) we made to settle our outstanding solar equipment leases in the first quarter of
2018
. These decreases were offset by $20.4 million in lower capital expenditures in 2018 as compared to 2017 (see “Cash used in investing activities” below). In addition, 2017 benefited from the repayment of $12.5 million of advances from a former solar supplier.
Our non-IFRS free cash flow of
$21.0 million
for
2017
decreased
$89.2 million
compared to
2016
, primarily due to lower cash generated from operating activities in
2017
(discussed above) and $38.5 million of higher capital expenditures in
2017
as compared to
2016
.
Cash used in investing activities:
Our capital expenditures for
2018
were
$82.2 million
(
2017
—
$102.6 million
;
2016
—
$64.1 million
), primarily to enhance our manufacturing capabilities in various geographies and to support new customer programs (with approximately two-thirds of the equipment additions to support our ATS segment). See footnote (iii) to the "Additional Commitments" table below for further detail. As a result of the demand volatility experienced with certain CCS segment customers during 2018, and the shift in production to our other sites due to the impact of newly-imposed tariffs, certain of our planned CCS segment expenditures have been deferred. Our capital expenditures for
2018
included approximately $15 million in building improvements and new machinery at our new Toronto manufacturing site. The expenditures in 2017 included expanding one of our production sites in Romania to support new ATS customers. We fund our capital expenditures from cash on hand. From time-to-time, we receive cash proceeds from the sale of surplus equipment and property (2018 — $3.7 million; 2017 — $0.8 million; 2016 — $1.0 million).
In 2015, we entered into a supply agreement with a solar supplier (which was terminated in the fourth quarter of 2016) that included a commitment by us to provide cash advances to help secure our solar cell supply. All such cash advances were repaid in full by the second quarter of 2017. We received cash advance repayments of $12.5 million from this solar supplier in the first half of 2017 ($14.0 million in 2016).
In November 2016, we completed the acquisition of Karel. The purchase price of $14.9 million was financed with cash on hand. In April 2018, we completed the acquisition of Atrenne. The purchase price of $141.7 million was funded with borrowings under the Prior Revolver. In November 2018, we completed the acquisition of Impakt. The purchase price of $325.4 million was funded with available borrowings under our New Revolver, $245.0 million of which was repaid with the proceeds of the November Term Loan. See “Overview — Recent developments.”
70
Cash provided by (used in) financing activities:
Share repurchases:
During
2018
, we paid
$75.5 million
(including transaction fees) (
2017
—
$19.9 million
;
2016
—
$34.3 million
) to repurchase and cancel
6.8 million
subordinate voting shares (
2017
—
1.9 million
;
2016
—
3.2 million
) under our 2017 NCIB at a weighted average price of $11.10 per share (
2017
— $10.58;
2016
— $10.69).
During
2018
, we paid
$22.4 million
(including transaction fees) (
2017
—
$16.7 million
;
2016
—
$18.2 million
) for a broker's purchase of
2.1 million
subordinate voting shares (
2017
—
1.4 million
;
2016
—
1.6 million
) in the open market to satisfy obligations under our stock-based compensation plans.
Financing:
In June 2018, we entered into the $800.0 million New Credit Facility, which provides for the $350.0 million June Term Loan that matures in June 2025, and the $450.0 million New Revolver that matures in June 2023. The net proceeds from the June Term Loan were used to repay all amounts outstanding under our Prior Facility ($175.0 million under the Prior Term Loan and $163.0 million under the Prior Revolver), which was terminated on such repayment, as well as costs related to the arrangement of the New Credit Facility. In November 2018, we utilized the accordion feature under our New Credit Facility to add the incremental $250.0 million November Term Loan, maturing in June 2025.
During the second half of 2018, we made two scheduled quarterly principal repayments of $0.875 million under the June Term Loan. In each quarter of 2016 and 2017, and the first two quarters of 2018, we made scheduled principal repayments of $6.25 million under the Prior Term Loan. We also made a $15.0 million repayment under the Prior Revolver during the first quarter of 2017.
During the fourth quarter of 2018, we borrowed $339.5 million under the New Revolver to fund the Impakt acquisition in November 2018 ($245.0 million of which was repaid with the proceeds from the November Term Loan). During the third quarter of 2018, we borrowed $55.0 million under the New Revolver for working capital purposes. During the second quarter of 2018, we borrowed $163.0 million under the Prior Revolver, primarily to fund the Atrenne acquisition in April 2018, as well as for working capital requirements.
During 2017, no amounts were borrowed under the Prior Revolver. As at December 31, 2016, the Prior Revolver had a balance of $15.0 million, which was repaid during the first quarter of 2017.
During 2018, we paid finance costs of
$36.0 million
(
2017
—
$10.2 million
;
2016
— $9.5 million). During 2018, these payments included higher interest expense as compared to 2017 due to an increase in borrowings to fund our acquisitions in 2018, higher fees associated with the increased sale of A/R in 2018 as compared to 2017, and higher interest costs in 2018 as compared to 2017 due to rising interest rates (as a result of increases in LIBOR). During 2018, finance costs also included approximately $13 million (
2017
— nil;
2016
— nil) of debt issuance costs related to the arrangement of the New Credit Facility and our New Term Loans.
Finance lease payments:
During
2018
, we paid $17.0 million (
2017
—
$6.5 million
;
2016
—
$4.5 million
) under our finance lease agreements (see “Cash Requirements” below). Finance lease payments during 2018 included $11.3 million (including fees and accrued interest) we paid in January 2018 to settle and terminate our solar panel equipment leases in anticipation of the sale of such equipment. At
December 31, 2018
, we had a total of
$10.4 million
finance lease obligations outstanding (
December 31, 2017
—
$17.7 million
;
December 31, 2016
—
$18.4 million
).
71
Cash requirements:
We maintain the New Revolver, uncommitted bank overdraft facilities, and an A/R sales program, and we participate in the SFP, to provide short-term liquidity and to have funds available for working capital and other investments to support our strategic priorities. See "Capital Resources" below for a discussion of swing line and letter of credit sub-limits under the New Revolver, as well as the accordion feature of the New Credit Facility. Our working capital requirements can vary significantly from month-to-month due to a range of business factors, including the ramping of new programs, expansion of our services and business operations, timing of purchases, higher levels of inventory for new programs and anticipated customer demand, timing of payments and A/R collections, and customer forecasting variations. The international scope of our operations may also create working capital requirements in certain countries while other countries generate cash in excess of working capital needs. Moving cash between countries on a short-term basis to fund working capital is not always expedient due to local currency regulations, tax considerations, and other factors. To meet our working capital requirements and to provide short-term liquidity, we may draw on the New Revolver, sell A/R through our A/R sales program or participate in the SFP, while available. The timing and the amounts we borrow or repay under these facilities can vary significantly from month-to-month depending upon our cash requirements. As at
December 31, 2018
, other than ordinary course letters of credit,
$159.0 million
was outstanding under the New Revolver for working capital purposes and to partially fund our acquisition of Impakt (
December 31, 2017
— nil;
December 31, 2016
— other than ordinary course letters of credit, $15.0 million outstanding under the Prior Revolver). We have also increased the amounts sold under our A/R sales program in recent years (
2018
— $130.0 million;
2017
— $80.0 million;
2016
— $50.0 million), as a cost-effective alternative to drawing additional amounts on our revolving facility to meet our ordinary course cash requirements. However, since our A/R sales program and the SFP are both on an uncommitted basis, there can be no assurance that any participant bank will purchase the accounts receivable we wish to sell to them under these programs. In addition, due to our anticipated disengagement from a portion of this customer's programs in early 2019, we expect to sell a lower amount of A/R under the SFP in future periods. See “Capital Resources” below.
We do not believe that the aggregate amounts outstanding under our New Credit Facility as at
December 31, 2018
(described under "Capital Resources" below) have had (or will have) a significant adverse impact on our liquidity, our results of operations or financial condition. Our quarterly principal repayment requirements under the New Credit Facility are $1.5 million (or $6 million annually) compared to quarterly principal repayments of $6.25 million (or $25 million annually) under our Prior Facility (see below for a description of required prepayments under the New Credit Facility). We estimate our aggregate interest expense, based on interest rates and amounts outstanding as of
December 31, 2018
, and including the impact of our interest rate swap agreements, to be approximately $10 million per quarter, as compared to approximately $2 million per quarter for 2016 and 2017, based on interest rates and amounts outstanding under the Prior Facility at the applicable year-end. At
December 31, 2018
, we had
$269.7 million
available under our revolving facility for future borrowings, reflecting outstanding borrowings and letters of credit (
December 31, 2017
—
$276.8 million
available;
December 31, 2016
—
$259.2 million
available). We believe that our current level of leverage is acceptable for a company of our size and that we will remain in compliance with the financial covenants under the New Credit Facility. In addition, we believe that cash flow from operating activities, together with cash on hand, remaining availability under the New Revolver, intra-day and overnight bank overdraft facilities, and cash from the sale of A/R, will continue to be sufficient to fund our currently anticipated working capital needs and planned capital spending (including the commitments described elsewhere herein).
Notwithstanding the foregoing, however, our increased indebtedness, together with the mandatory prepayment provisions of the New Credit Agreement (described below), has reduced our ability to fund future acquisitions and/or to respond to unexpected capital requirements, and will require us to use an increased amount of our cash flow to service such debt, and may also: require us to pursue additional term loan financing for potential investments, which may not be available on acceptable terms, or at all; limit our ability to obtain additional financing for working capital, business activities, and other general corporate requirements; limit our ability to refinance our indebtedness on terms acceptable to us or at all; limit our flexibility to plan for and adjust to changing business and market conditions, and increase our vulnerability to general adverse economic and industry conditions. In addition, the New Credit Facility contains restrictive covenants that limit our ability to engage in specified types of transactions and require us to maintain specified financial ratios (described in "Capital Resources" below). Our ability to meet those financial ratios will depend on our ongoing financial and operating performance, which, in turn, will be subject to economic conditions and to financial, market, and competitive factors, many of which are beyond our control. A breach of any of such covenants could result in a default under the instruments governing such indebtedness.
In addition to required aggregate quarterly principal repayments on the New Term Loans of $1.5 million, commencing in 2020, we will be required to make an annual prepayment of outstanding obligations under the New Credit Facility (applied first to the New Term Loans, then to the New Revolver, in the manner set forth in the New Credit Facility) ranging from 0% — 50% (based on a defined leverage ratio) of specified excess cash flow (as defined in the New Credit Facility) for the prior fiscal year. Proceeds from the sale of our Toronto real property will be taken into account in the determination of excess cash flow. In addition, prepayments of outstanding obligations under the New Credit Facility (applied as described above) may also be required in the
72
amount of specified net cash proceeds received above a specified annual threshold (including proceeds from the disposal of certain assets, but excluding the net proceeds from the sale of our Toronto real property). Repaid amounts on the New Term Loans may not be re-borrowed. Repaid amounts on the New Revolver may be re-borrowed.
Interest expense under the New Credit Facility, based on interest rates and amounts outstanding as at
December 31, 2018
, and including the impact of our interest rate swap agreements, is approximately $10 million per quarter. Any increase in prevailing interest rates, margins, or amounts outstanding, would cause this amount to increase (see discussion below).We also recorded $0.5 million of quarterly non-cash charges in Q4 2018 to amortize the $13.4 million in deferred financing costs incurred in connection with the arrangement of the New Credit Facility and New Term Loans. Commitment fees paid during
2018
were
$1.3 million
(
2017
—
$1.3 million
;
2016
—
$1.4 million
).
We may use cash on hand, issue debt (including convertible debt) or equity securities, or further increase our levels of third-party indebtedness to fund operations and/or make additional acquisitions (or any combination of the foregoing). Any significant use of cash would adversely impact our cash position and liquidity. Any issuance or incurrence of additional debt would increase our debt leverage, increase our interest expense, and may reduce our debt agency ratings. In addition, any issuance of equity or convertible debt securities (the pricing of which would be subject to market conditions at the time of issuance) could dilute current shareholders’ positions; debt or convertible debt securities could have rights and privileges senior to those of equity holders; and the terms of debt securities could impose restrictions on our operations. Sales of our equity securities or convertible debt, or the perception that these sales could occur, could also cause the market price of our subordinate voting shares to decline. Any further increase in our overall debt levels would further adversely impact our ability to fund future acquisitions and/or respond to unexpected capital requirements, and may: limit our ability to obtain additional financing for working capital, business activities, and other general corporate requirements; limit our ability to refinance our indebtedness on terms acceptable to us or at all; limit our flexibility to plan for and adjust to changing business and market conditions, and increase our vulnerability to general adverse economic and industry conditions; and require us to dedicate an additional portion of our cash flow to make interest payments, principal repayments and potential principal prepayments on such indebtedness, thereby limiting the availability of our cash flow for other purposes.
As at
December 31, 2018
, a significant portion of our cash and cash equivalents was held by foreign subsidiaries outside of Canada, a large part of which may be subject to withholding taxes upon repatriation under current tax laws. Cash and cash equivalents held by subsidiaries related to undistributed earnings that are considered indefinitely reinvested outside of Canada (which we do not intend to repatriate in the foreseeable future) are not subject to these withholding taxes. We currently expect to repatriate approximately $30 million from various foreign subsidiaries in the near term, and have recorded the anticipated future withholding taxes as deferred income tax liabilities, if applicable. While some of our subsidiaries are subject to local governmental restrictions on the flow of capital into and out of their jurisdictions (including in the form of cash dividends, loans or advances to us), which is required or desirable from time to time to meet our international working capital needs and other business objectives (as described above), these restrictions have not had a material impact on our ability to meet our cash obligations. At
December 31, 2018
, we had approximately $355 million (
December 31, 2017
— $351 million) of cash and cash equivalents held by foreign subsidiaries outside of Canada that we do not intend to repatriate in the foreseeable future.
As at
December 31, 2018
, we had known contractual obligations that require future payments as follows (in millions):
|
Total
|
2019
|
2020
|
2021
|
2022
|
2023
|
Thereafter
|
||||||||||||||||||||||
|
Borrowings under New Credit Facility
(i)
|
$
|
757.3
|
|
$
|
6.0
|
|
$
|
6.0
|
|
$
|
6.0
|
|
$
|
6.0
|
|
$
|
165.0
|
|
$
|
568.3
|
|
|||||||
|
Operating leases
|
107.4
|
|
31.5
|
|
23.7
|
|
14.5
|
|
9.5
|
|
6.6
|
|
21.6
|
|
||||||||||||||
|
Finance leases
|
11.7
|
|
3.8
|
|
3.3
|
|
2.8
|
|
1.4
|
|
0.4
|
|
—
|
|
||||||||||||||
|
Pension plan contributions
(ii)
|
12.0
|
|
12.0
|
|
—
|
|
—
|
|
—
|
|
—
|
|
—
|
|
||||||||||||||
|
Non-pension post-employment plan payments
|
35.8
|
|
3.6
|
|
2.4
|
|
2.6
|
|
2.8
|
|
3.4
|
|
21.0
|
|
||||||||||||||
|
Binding purchase order obligations
(iii)
|
1,075.1
|
|
1,075.1
|
|
—
|
|
—
|
|
—
|
|
—
|
|
—
|
|
||||||||||||||
|
Purchase obligations under IT support
agreements
(iv)
|
120.8
|
|
19.7
|
|
19.7
|
|
16.5
|
|
13.7
|
|
13.5
|
|
37.7
|
|
||||||||||||||
|
Total
(v)
|
$
|
2,120.1
|
|
$
|
1,151.7
|
|
$
|
55.1
|
|
$
|
42.4
|
|
$
|
33.4
|
|
$
|
188.9
|
|
$
|
648.6
|
|
|||||||
73
|
(i)
|
Represents mandatory principal repayment obligations for our borrowings under the New Revolver and New Term Loans (based on amounts outstanding as of
December 31, 2018
), which mature in June 2023 and June 2025, respectively, and excludes related interest and fees. The Term Loans require mandatory aggregate quarterly principal repayments of $1.5 million until their maturity (when remaining amounts outstanding are due), and borrowings under the New Revolver are due upon maturity. Borrowings under the New Revolver bear interest for the period of the draw at LIBOR, Canadian Prime, or Base Rate (each as defined in the New Credit Facility) plus a specified margin, or in the case of any bankers' acceptance, at the B/A Discount Rate (as defined in the New Credit Facility). The margin for borrowings under the New Revolver ranges from 0.75% to 2.5%, depending on the rate we select and our consolidated leverage ratio. As a result of our use of the accordion feature of the New Credit Facility in November 2018, interest on the June Term Loan increased from LIBOR plus 2.0% to LIBOR plus 2.125%. The November Term Loan currently bears interest at LIBOR plus 2.5%. Based on the rates and the principal amount outstanding under the New Term Loans (
$598.3 million
) and the New Revolver (other than $21.3 million in letters of credit, $159.0 million) as of
December 31, 2018
, and including the impact of our interest rate swap agreements, interest and fees are estimated to be approximately $10 million per quarter. Actual amounts could differ materially from these estimates. Payment defaults under the credit facility will incur interest on unpaid amounts at an annual rate equal to the sum of (i) 2%, plus (ii) the rate per annum otherwise applicable to such unpaid amounts, or if no rate is specified or available, the rate per annum applicable to Base Rate revolving loans. If an event of default occurs and is continuing, the administrative agent may declare all advances on the facility to be immediately due and payable, and may cancel the lenders' commitments to make further advances thereunder. See “Capital Resources” below and note
12
to our
2018
AFS for a description of our credit facility, including amounts outstanding thereunder, repayment dates and interest obligations.
|
|
(ii)
|
Based on our latest actuarial valuations, we estimate our funding requirement for
2019
to be
$12.0 million
(
2018
— $13.3 million;
2017
— $11.9 million). See note
19
to our
2018
AFS. A significant deterioration in the asset values or asset returns could lead to higher than expected future contributions. Risks and uncertainties associated with actuarial valuation measurements may also result in higher future cash contributions. We fund our pension contributions from cash on hand. Although we have defined benefit plans that are currently in a net unfunded position, we do not expect our pension obligations will have a material adverse impact on our future results of operations, cash flows or liquidity.
|
|
(iii)
|
Represents outstanding purchase orders with suppliers to acquire inventory. These purchase orders are generally short-term in nature and legally binding. However, a substantial portion of these purchase orders are for standard inventory items which we have procured for specific customers based on their purchase orders or forecasts, under which such customers have contractually assumed liability for such material, if not consumed.
|
|
(iv)
|
Represents obligations under IT support agreements.
|
|
(v)
|
This table excludes $25.5 million of long-term deferred income tax liabilities and $20.6 million of provisions and other non-current liabilities primarily pertaining to warranties and asset retirement obligations, as we are unable to reliably estimate the timing of any future payments related thereto. However, long-term liabilities included in our consolidated balance sheet include these items. In addition, our interest rate swap agreements require us to pay a fixed rate of interest with respect to an aggregate of $350.0 million outstanding under the New Term Loans. These payments, however, are partially offset by related interest we receive, based on the variable interest rates swapped. As the offsets are not determinable and vary from quarter to quarter, this table also excludes the interest payments on our interest rate swap agreements.
|
Additional Commitments:
As at
December 31, 2018
, we had additional commitments that expire as follows (in millions):
|
Total
|
2019
|
2020
|
2021
|
2022
|
2023
|
Thereafter
|
||||||||||||||||||||||
|
Foreign currency contracts
(i)
|
$
|
544.2
|
|
$
|
544.2
|
|
$
|
—
|
|
$
|
—
|
|
$
|
—
|
|
$
|
—
|
|
$
|
—
|
|
|||||||
|
Letters of credit, letters of guarantee and
surety bonds
(ii)
|
35.7
|
|
29.1
|
|
1.6
|
|
0.3
|
|
—
|
|
—
|
|
4.7
|
|
||||||||||||||
|
Capital expenditures
(iii)
|
33.6
|
|
33.6
|
|
—
|
|
—
|
|
—
|
|
—
|
|
—
|
|
||||||||||||||
|
Total
|
$
|
613.5
|
|
$
|
606.9
|
|
$
|
1.6
|
|
$
|
0.3
|
|
$
|
—
|
|
$
|
—
|
|
$
|
4.7
|
|
|||||||
(i) Represents the aggregate notional amounts of our forward currency contracts and swaps.
(ii) Includes $21.3 million in letters of credit issued under our Revolving Facility.
|
(iii)
|
Our capital spending varies each period based on the timing of new business wins and forecasted sales levels. Based on our current operating plans, we anticipate capital spending for
2019
to be approximately 1.5% to 2.0% of revenue, and expect to fund these expenditures from cash on hand and through the financing agreements described below under “Capital Resources.” As at
December 31, 2018
, we had committed
$33.6 million
for capital expenditures, principally for machinery and equipment to support new customer programs. Of such amount, approximately 25% is committed for Asia, approximately 25% is committed for North America (excluding Canada), approximately 30% is committed for Europe, and approximately 20% is committed for Canada (primarily for building improvements related to our temporary corporate headquarters).
|
Customer or program transfers between EMS providers are part of the competitive nature of our industry. From time-to-time, we make commitments to purchase assets, primarily inventory, or fund certain costs, as part of transitioning programs from a customer or a competitor. In September 2017, we purchased $5 million of inventory and assumed the relevant workforce in connection with a program transferred to us under an "operate-in-place" arrangement.
74
We have entered into financing agreements for the lease of machinery and equipment. For leases where the risks and rewards of ownership have substantially transferred to us, we capitalize the leased asset and record a corresponding liability on our consolidated balance sheet. See “Finance leases” in the contractual obligations table above
.
See note 2(x) of our 2018 AFS for a discussion of a new IFRS standard pertaining to leases which we adopted January 1, 2019, eliminating the distinction between operating and finance leases.
Toronto Real Property and Related Transactions:
On July 23, 2015, we entered into the Property Sale Agreement with a special purpose entity (Property Purchaser) for a purchase price of approximately $137 million Canadian dollars (approximately $100 million at year-end exchange rates), exclusive of applicable taxes and subject to specified adjustments, including for certain density bonuses and other items in accordance with usual commercial practice. Upon execution of the Property Sale Agreement, we were paid a cash deposit of $15 million Canadian dollars ($11.2 million at the then-prevailing exchange rate).
In September 2018, the Property Sale Agreement was assigned to the Assignee, although the Property Purchaser was not released from its obligations under the Property Sale Agreement. In connection with the assignment, the Property Sale Agreement was amended to provide for the remaining proceeds of $122 million Canadian dollars (approximately $89 million at year-end exchange rates) to be paid in one lump sum cash payment at the closing of the transaction (previously we were to receive one-half of the purchase price in the form of a two-year, interest-free, first-ranking mortgage). Other terms of the agreement remained unchanged. On January 21, 2019, the required municipal zoning approval was obtained. On March 7, 2019, we completed the sale of the real property and received total proceeds of approximately $110 million, including a high density bonus and an early vacancy incentive related to the temporary relocation of our corporate headquarters. The gain on the sale of this property will be recorded as recoveries through other charges (recoveries). See "Related Party Transactions" below for a description of the ownership of the Property Purchaser and its option to obtain an interest in the Assignee.
In connection with the anticipated sale, we have moved our Toronto manufacturing operations to another location in the Greater Toronto area and in connection therewith, entered into a long-term lease in November 2017, with occupancy commenced in March 2018. We completed the transition to this new manufacturing location in February 2019. In addition, we will enter into a long-term lease with the Assignee for our new corporate headquarters. In connection therewith, we are relocating our corporate headquarters to a temporary location while space in a new office building (to be built by the Assignee on the site of our former location) is under construction. In connection therewith, in September 2018, we entered into a 3-year lease for such temporary offices, and such relocation is currently expected to be completed by the end of the first half of 2019. We have incurred (and will continue to incur) significant costs throughout the transition period (which commenced in the fourth quarter of 2017) to relocate our corporate headquarters and to transfer our Toronto manufacturing operations to its new location, and as we prepare and customize the new site to meet our manufacturing needs. These costs consist of building improvements and new equipment which we will capitalize, as well as transition-related costs which we record in other charges. Transition costs are comprised of direct relocation costs, duplicate costs (such as rent expense, utility costs, depreciation charges, and personnel costs) incurred during the transition period, as well as cease-use costs incurred in connection with idle or vacated portions of the relevant premises that we would not have incurred but for these relocations. We incurred approximately $17 million in capitalized costs through February 13, 2019 (2018 — $15 million) for the new manufacturing location, funded from cash on hand. We also expect to incur approximately $6 million ($1 million of which has been incurred through February 13, 2019; 2018 — nil) of capitalized building improvements in connection with our temporary corporate headquarters. We expect to incur total transition costs (including in connection with the relocation of our corporate headquarters) of up to $20 million through the end of the second quarter of 2019. We incurred approximately $16 million of such costs through
February 13, 2019
, consisting primarily of utility costs related to idle premises, depreciation charges and personnel costs incurred in the operation of duplicate production lines in advance of the transition, duplicate rent expenses, and relocation costs.
Share Repurchases:
We have funded and intend to continue to fund our share repurchases from cash on hand, borrowings under our New Revolver, or a combination thereof. See "Cash provided by (used in) financing activities" above.
Indemnities:
We provide routine indemnifications, the terms of which range in duration and often are not explicitly defined. These may include indemnifications against third-party intellectual property infringement claims and certain third-party negligence claims for property damage. We have also provided indemnifications in connection with the sale of certain businesses and real property. The maximum potential liability from these indemnifications cannot be reasonably estimated. In some cases, we have recourse
75
against other parties to mitigate our risk of loss from these indemnifications. Historically, we have not made significant payments relating to these types of indemnifications.
Litigation and contingencies:
In the normal course of our operations, we may be subject to lawsuits, investigations and other claims, including environmental, labor, product, customer disputes and other matters. Management believes that adequate provisions have been recorded where required. Although it is not always possible to estimate the extent of potential costs, if any, management believes that the ultimate resolution of all such pending matters will not have a material adverse impact on our financial performance, financial position or liquidity. See "Operating Results — Income Taxes" above for a description of certain tax matters.
Capital Resources
Our capital resources consist of cash provided by operating activities, access to a revolving facility, intraday and overnight bank overdraft facilities, an A/R sales program, the SFP, and our ability to issue debt or equity securities. We regularly review our borrowing capacity and make adjustments, as permitted, for changes in economic conditions and changes in our requirements. As part of our strategic initiatives to scale and diversify our ATS revenue base and expand our capabilities in our ATS segment, we have increased our levels of third-party indebtedness and A/R sales in order to fund acquisitions and working capital needs. In addition, we may use cash on hand, issue equity or debt, or further increase our levels of third-party indebtedness in order to fund operations or additional acquisitions (or any combination of the foregoing). See “Liquidity —
Cash requirements
” above for a discussion of expected and potential adverse impacts from such actions. We centrally manage our funding and treasury activities in accordance with corporate policies, the main objectives of which are to ensure appropriate levels of liquidity, to have funds available for working capital or other investments we determine are required to grow our business, to comply with debt covenants, to maintain adequate levels of insurance, and to balance our exposures to market risks.
At
December 31, 2018
, we had cash and cash equivalents of
$422.0 million
(
December 31, 2017
—
$515.2 million
), of which approximately 97% was cash and 3% was cash equivalents, consisting of bank deposits. The majority of our cash and cash equivalents was denominated in U.S. dollars, and the remainder was held primarily in Chinese renminbi and the Euro. We also held cash and cash equivalents in the following currencies: British pound sterling, Brazilian real, Canadian dollar, Czech koruna, Hong Kong dollar, Indian rupee, Japanese yen, Korean won, Lao kip, Malaysian ringgit, Mexican peso, Philippines peso, Romanian leu, Singapore dollar, Taiwan dollar and Thai baht. Our cash and cash equivalents are subject to intra-quarter swings, generally related to the timing of A/R collections, inventory purchases and payments, and other capital uses.
Until June 27, 2018, we were party to the Prior Facility, that consisted of the $300.0 million Prior Revolver and the fully drawn $250.0 million Prior Term Loan, each of which was scheduled to mature in May 2020. The Prior Revolver had an accordion feature that allowed us to increase the $300.0 million limit by an additional $150.0 million on an uncommitted basis upon satisfaction of certain terms and conditions. The Prior Revolver also included a $25.0 million swing line, subject to the overall revolving credit limit, that provided for short-term borrowings up to a maximum of seven days. Borrowings under the Prior Revolver bore interest at various base rates selected by us consisting of LIBOR, Prime, Base Rate Canada, and Base Rate (each as defined in the Prior Facility), plus a specified margin. The margin for borrowings under the Prior Revolver ranged from 0.6% to 1.4% (except in the case of the LIBOR loans, in which case, the margin ranged from 1.6% to 2.4%), based on a specified financial ratio based on indebtedness. Outstanding amounts under the Prior Revolver were due at maturity (but were required to be repaid prior thereto under specified circumstances). The Prior Term Loan bore interest at LIBOR plus a margin ranging from 2.0% to 3.0% based on the same financial ratio. The Prior Term Loan required quarterly principal repayments of $6.25 million, with the remainder due at maturity. Prepayments on the Prior Term Loan were required under certain circumstances. We were required to comply with certain restrictive covenants under the Prior Facility, including those relating to the incurrence of senior ranking indebtedness, the sale of assets, a change of control, and certain financial covenants related to indebtedness and interest coverage. Certain of our assets were pledged as security for borrowings under the Prior Facility.
In June 2018, we entered into the $800.0 million New Credit Facility, providing for the $350.0 million June Term Loan and the $450 million New Revolver. In November 2018, we added the $250.0 million November Term Loan. As of
December 31, 2018
, an aggregate of
$598.3 million
was outstanding under the New Term Loans, and other than ordinary course letters of credit,
$159.0 million
was outstanding under the New Revolver (
December 31, 2017
—
$187.5 million
outstanding under the Prior Term Loan and other than ordinary course letters of credits, no amounts outstanding under the Prior Revolver). See "Liquidity
—
Cash provided by (used in) financing activities — Financing
" above for a discussion of amounts borrowed and repaid under our credit facilities during 2016 to 2018.
The June Term Loan requires quarterly principal repayments of $0.875 million commencing September 30, 2018 and the November Term Loan requires quarterly principal repayments of $0.625 million, commencing March 31, 2019, and in each case
76
a lump sum repayment of the remainder outstanding at maturity. See "Liquidity —
Cash requirements
" above for a description of mandatory prepayments required under the New Credit Facility. Except under specified circumstances, and subject to the payment of breakage costs (if any), we are generally permitted to make voluntary prepayments of outstanding amounts under the New Revolver and the New Term Loans without any other premium or penalty. Repaid amounts on the New Term Loans may not be re-borrowed. Repaid amounts on the New Revolver may be re-borrowed.
The New Credit Facility has an accordion feature that allows us to increase the term loans and/or revolving loan commitments by approximately $110 million, plus an unlimited amount to the extent that a specified leverage ratio on a pro forma basis does not exceed specified limits, in each case on an uncommitted basis and subject to the satisfaction of certain terms and conditions. The New Revolver also includes a $50.0 million sub-limit for swing line loans, providing for short-term borrowings up to a maximum of ten business days, as well as a $150.0 million sub-limit for letters of credit, in each case subject to the overall New Revolver credit limit. The New Revolver permits us and certain designated subsidiaries to borrow funds (subject to specified conditions) for general corporate purposes, including for capital expenditures, certain acquisitions, and working capital needs. Borrowings under the New Revolver bear interest at LIBOR, Canadian Prime, or Base Rate (each as defined in the New Credit Facility) plus a specified margin, or in the case of any bankers' acceptance, at the B/A Discount Rate (as defined in the New Credit Facility). The margin for borrowings under the New Revolver ranges from 0.75% to 2.5%, depending on the rate we select and our consolidated leverage ratio. As a result of our use of the accordion feature of the New Credit Facility in November 2018, interest on the June Term Loan increased from LIBOR plus 2.0% to LIBOR plus 2.125%. The November Term Loan currently bears interest at LIBOR plus 2.5%.
As part of our risk management program, we attempt to mitigate interest rate risk through interest rate swaps. In order to partially hedge against our exposure to interest rate variability on the New Term Loans, we entered into 5-year agreements with a syndicate of third-party banks in August and December 2018 to swap the variable interest rate with a fixed rate of interest on $175.0 million of the total borrowings outstanding under each of the June Term Loan and the November Term Loan (for an aggregate of $350.0 million). The swap agreements include an option that allows us to cancel up to $75.0 million of the notional amount of each of the original swap agreements starting in August 2021 for the June Term Loan and December 2020 for the November Term Loan. The cancellable option in the swap agreements is aligned with our risk management strategy for our New Term Loans as it allows us to make voluntary prepayments of outstanding amounts without premium or penalty, subject to certain conditions. Our unhedged borrowings under the New Credit Facility at
December 31, 2018
are $407.3 million (comprised of $248.3 million under the New Term Loans and $159 million under the New Revolver). A one-percentage point increase in relevant interest rates would increase interest expense, based on the outstanding unhedged borrowings at
December 31, 2018
, by $4.1 million annually. See note 21(b) of our 2018 AFS for further information regarding our interest rate swaps.
We are required to comply with certain restrictive covenants under the New Credit Facility, including those relating to
the incurrence of certain indebtedness, the existence of certain liens, the sale of certain assets (excluding real property then held for sale), specified investments and payments, sale and leaseback transactions, and certain financial covenants relating to a defined interest coverage ratio and leverage ratio that are tested on a quarterly basis. At
December 31, 2018
, we were in compliance with all restrictive and financial covenants under the New Credit Facility. The obligations under the New Credit Facility are guaranteed by us and certain specified subsidiaries. Subject to specified exemptions and limitations, all assets of the guarantors are pledged as security for the obligations under the New Credit Facility. The New Credit Facility contains customary events of default. If an event of default occurs and is continuing, the administrative agent may declare all amounts outstanding under the New Credit Facility to be immediately due and payable and may cancel the lenders’ commitments to make further advances thereunder. In the event of a payment or other specified defaults, outstanding obligations accrue interest at a specified default rate.
We incurred debt issuance costs of $4.9 million in connection with the June Term Loan, and $5.4 million in connection with the November Term Loan, which we recorded as an offset against the proceeds therefrom. Such costs have been deferred (as long-term debt on our consolidated balance sheet) and will be amortized over the term of the term loans using the effective interest rate method. We incurred debt issuance costs of $3.1 million in connection with the New Revolver, which have been deferred (as other assets on our consolidated balance sheet) and will be amortized over the term of the New Revolver. We accelerated the amortization of the remaining $1.2 million of unamortized deferred financing costs related to the Prior Facility upon its termination ($0.6 million related to our Prior Revolver recorded in other assets and $0.6 million related to our Prior Term Loan recorded in long-term debt), and recorded it to other charges in our consolidated financial statements in June 2018.
Commitment fees paid during
2018
were
$1.3 million
(
2017
—
$1.3 million
;
2016
—
$1.4 million
). At
December 31, 2018
, we had $
21.3 million
outstanding in letters of credit under the New Revolver (
December 31, 2017
—
$23.2 million
). We
77
also arrange letters of credit and surety bonds outside our revolving facility. At
December 31, 2018
, we had $14.4 million of such letters of credit and surety bonds outstanding (
December 31, 2017
— $13.6 million).
At
December 31, 2018
, we also had a total of
$132.8 million
of uncommitted bank overdraft facilities available for intraday and overnight operating requirements (
December 31, 2017
—
$73.5 million
). There were no amounts outstanding under these overdraft facilities at
December 31, 2018
or
December 31, 2017
.
At
December 31, 2018
, we had $269.7 million available under the New Revolver for future borrowings, reflecting outstanding borrowings and letters of credit (
December 31, 2017
—
$276.8 million
available under the Prior Revolver).
We have an agreement to sell up to $250.0 million (increased from $200 million in November 2018 based on a review of our requirements) in accounts receivable on an uncommitted basis (subject to pre-determined limits by customer) to two third-party banks. The term of this agreement has been annually extended in recent years (including in November 2018) for additional one-year periods (and is currently extendable to November 2020 under specified circumstances), but may be terminated earlier as provided in the agreement. At
December 31, 2018
,
$130.0 million
(
December 31, 2017
—
$80.0 million
) of A/R were sold under this program, and de-recognized from our accounts receivable balance. As our A/R sales program is on an uncommitted basis, there can be no assurance that any of the banks will purchase the A/R we intend to sell to them under this program.
We have entered into the SFP, pursuant to which participating suppliers may sell accounts receivable from such customer to a third-party bank on an uncommitted basis in order to receive earlier payment. The third-party bank collects the relevant receivables directly from the customer. At
December 31, 2018
, we sold
$50.0 million
of accounts receivable under the SFP (
December 31, 2017
—
$52.3 million
). We utilized the SFP to substantially offset the effect of extended payment terms required by such customer on our working capital for the period. As the SFP is on an uncommitted basis, there can be no assurance that the bank will purchase the A/R we intend to sell to them thereunder. Due to our anticipated disengagement from a portion of this customer's programs in early 2019, we expect to sell a lower amount of A/R under the SFP in future periods.
The timing and the amounts we borrow and repay under our revolving credit and overdraft facilities, or sell under the SFP or our A/R sales program, can vary significantly from month-to-month depending upon our working capital and other cash requirements.
Our strategy on capital risk management has not changed significantly since the end of 2017. Other than the restrictive and financial covenants associated with our New Credit Facility noted above, we are not subject to any contractual or regulatory capital requirements. While some of our international operations are subject to government restrictions on the flow of capital into and out of their jurisdictions, these restrictions have not had a material impact on our operations or cash flows.
Financial instruments:
Our short-term investment objectives are to preserve principal and to maximize yields without significantly increasing risk, while at the same time not materially restricting our short-term access to cash.
The majority of our cash balances are held in U.S. dollars. We price the majority of our products in U.S. dollars and the majority of our materials costs are also denominated in U.S. dollars. However, a significant portion of our non-materials costs (including payroll, pensions, site costs and costs of locally sourced supplies and inventory) are denominated in various other currencies. As a result, we may experience foreign exchange gains or losses on translation or transactions due to currency fluctuations.
We have a foreign exchange risk management policy in place to govern our hedging activities. We do not enter into speculative trades. Our current hedging activity is designed to reduce the variability of our foreign currency costs where we have local manufacturing operations. We enter into foreign exchange forward contracts to hedge our cash flow exposures and foreign currency swaps to hedge our balance sheet exposures. Balance sheet hedges are based on our forecasts of the future position of net monetary assets or liabilities denominated in foreign currencies and, therefore, may not mitigate the full impact of any translation impacts in the future. There can be no assurance that our hedging transactions will be successful in mitigating our foreign exchange risk.
78
At
December 31, 2018
, we had foreign exchange forwards and swaps to trade U.S. dollars in exchange for the following currencies:
|
Currency
|
Contract amount in
U.S. dollars (in millions)
|
Weighted
average
exchange rate
in U.S. dollars
|
Maximum
period in
months
|
Fair value
gain (loss) (in millions)
|
|||||||||
|
Canadian dollar
|
$
|
210.2
|
|
$
|
0.76
|
|
12
|
$
|
(10.3
|
)
|
|||
|
Thai baht
|
81.1
|
|
0.03
|
|
12
|
(0.7
|
)
|
||||||
|
Malaysian ringgit
|
53.4
|
|
0.24
|
|
12
|
(0.8
|
)
|
||||||
|
Mexican peso
|
25.6
|
|
0.05
|
|
12
|
0.2
|
|
||||||
|
British pound
|
5.3
|
|
1.27
|
|
4
|
—
|
|
||||||
|
Chinese renminbi
|
66.8
|
|
0.15
|
|
12
|
(1.6
|
)
|
||||||
|
Euro
|
35.8
|
|
1.17
|
|
12
|
0.3
|
|
||||||
|
Romanian leu
|
40.4
|
|
0.25
|
|
12
|
(0.9
|
)
|
||||||
|
Singapore dollar
|
22.1
|
|
0.74
|
|
12
|
(0.3
|
)
|
||||||
|
Other
|
3.5
|
|
0.01
|
|
1
|
(0.1
|
)
|
||||||
|
Total
|
$
|
544.2
|
|
|
|
|
$
|
(14.2
|
)
|
||||
These contracts, which generally extend for periods of up to 12 months, will expire by the end of the fourth quarter of
2019
. The fair value of the outstanding contracts at
December 31, 2018
was a net unrealized loss of
$14.2 million
(
December 31, 2017
— net unrealized gain of $10.3 million). The unrealized gains or losses are a result of fluctuations in foreign exchange rates between the date the currency forward or swap contracts were entered into and the valuation date at period end.
Financial risks:
We are exposed to a variety of risks associated with financial instruments and otherwise.
Currency risk: Due to the global nature of our operations, we are exposed to exchange rate fluctuations on our financial instruments denominated in various currencies. The majority of our currency risk is driven by operational costs, including income tax expense, incurred in local currencies by our subsidiaries. As part of our risk management program, we attempt to mitigate currency risk through a hedging program using forecasts of our anticipated future cash flows and balance sheet exposures denominated in foreign currencies. We enter into foreign exchange forward contracts and swaps, generally for periods up to 12 months, to lock in the exchange rates for future foreign currency transactions, which is intended to reduce the variability of our operating costs and future cash flows denominated in local currencies. While these contracts are intended to reduce the effects of fluctuations in foreign currency exchange rates, our hedging strategy does not mitigate the longer-term impacts of changes to foreign exchange rates. Although our functional currency is the U.S. dollar, currency risk on our income tax expense arises as we are generally required to file our tax returns in the local currency for each particular country in which we have operations. While our hedging program is designed to mitigate currency risk vis-à-vis the U.S. dollar, we remain subject to taxable foreign exchange impacts in our translated local currency financial results relevant for tax reporting purposes. We do not use derivative financial instruments for speculative purposes.
We cannot predict changes in currency exchange rates, the impact of exchange rate changes on our operating results, nor the degree to which we will be able to manage the impact of currency exchange rate changes. Such changes, including as a result of Brexit or other global events impacting currency exchange rates could materially adversely affect our business, results of operations and financial condition.
Interest rate risk: Borrowings under the New Credit Facility bear interest at specified rates, plus specified margins (as described above). We have entered into 5-year interest rate swap agreements with a syndicate of third-party banks in each of August and December 2018 to partially hedge against our exposures to interest rate variability on our New Term Loans. The derivative instruments swap the variable rate of interest for a fixed rate of interest on an aggregate of
$350.0 million
of the outstanding borrowings under the New Term Loans. The swap agreements include an option that allows us to cancel up to $75.0 million of the notional amount of each swap agreement, starting in August 2021 with respect to the June Term Loan and December 2020 with respect to the November Term Loan.
79
Our unhedged borrowings under the New Credit Facility at
December 31, 2018
were
$407.3 million
(
December 31, 2017
— $187.5 million under the Prior Credit Facility). Unhedged borrowings expose us to interest rate risk due to the potential variability in market interest rates. A one-percentage point increase in applicable rates would increase interest expense, based on the outstanding unhedged borrowings at
December 31, 2018
, by $4.1 million annually. Without accounting for the interest rate swap agreements described above, a one-percentage point increase in applicable rates would increase interest expense, based on our outstanding borrowings of $757.3 million under the New Credit Facility as at
December 31, 2018
, by $7.6 million annually.
Credit risk: Credit risk refers to the risk that a counterparty may default on its contractual obligations resulting in a financial loss to us. We believe our credit risk of counterparty non-performance is relatively low, however, if a key supplier (or any company within such supplier's supply chain) or customer experiences financial difficulties or fails to comply with their contractual obligations, this could result in a financial loss to us. If an institution from which we purchased annuities for our pension plans defaults on their contractual obligations, this would result in a financial loss to us, as we retain ultimate responsibility for the payment of benefits to plan participants unless and until such pension plans are wound-up. With respect to our financial market activities, we have adopted a policy of dealing only with credit-worthy counterparties to help mitigate the risk of financial loss from defaults. We monitor the credit risk of the counterparties with whom we conduct business, through a combined process of credit rating reviews and portfolio reviews.
We also provide unsecured credit to our customers in the normal course of business. Customer exposures that potentially subject us to credit risk include our accounts receivable, inventory on hand, and non-cancellable purchase orders in support of customer demand. From time to time, we extend the payment terms applicable to certain customers, and/or provide longer payment terms when deemed commercially reasonable. Longer payment terms, which have become more prevalent, could adversely impact our working capital requirements, and increase our financial exposure and credit risk. We attempt to mitigate customer credit risk by monitoring our customers’ financial condition and performing ongoing credit evaluations as appropriate. In certain instances, we may obtain letters of credit or other forms of security from our customers. We may also purchase credit insurance from a financial institution to reduce our credit exposure to certain customers. We consider credit risk in determining our allowance for doubtful accounts and we believe our allowances, as adjusted from time to time, are adequate. The carrying amount of financial assets recorded in our consolidated financial statements, net of our allowance for doubtful accounts, represents our estimate of maximum exposure to credit risk. At
December 31, 2018
, approximately 1% of our gross accounts receivable are over 90 days past due. Accounts receivable are net of an allowance for doubtful accounts of $5.3 million at
December 31, 2018
(
December 31, 2017
— $4.3 million).
Liquidity risk: Liquidity risk is the risk that we may not have cash available to satisfy our financial obligations as they come due. The majority of our financial liabilities recorded in accounts payable, accrued and other current liabilities and provisions are due within 90 days. We manage liquidity risk by maintaining a portfolio of liquid funds and investments and having access to a revolving credit facility, intraday and overnight bank overdraft facilities, an accounts receivable sales program and the SFP. Since our accounts receivable sales program and the SFP are each on an uncommitted basis, there can be no assurance that any participant bank will purchase all the accounts receivable that we wish to sell thereunder. However, we believe that cash flow from operating activities, together with cash on hand, cash from the sale of accounts receivable, and borrowings available under the New Revolver and intraday and overnight bank overdraft facilities are sufficient to fund our currently anticipated financial obligations.
See note
21
to our
2018
AFS for further details.
80
Related Party Transactions
Onex Corporation (Onex) beneficially owns or controls, directly or indirectly, all of our outstanding multiple voting shares. Accordingly, Onex has the ability to exercise significant influence over our business and affairs and generally has the power to determine all matters submitted to a vote of our shareholders where the subordinate voting shares and multiple voting shares vote together as a single class. Mr. Gerald Schwartz, the Chairman of the Board, President and Chief Executive Officer of Onex, indirectly owns shares representing the majority of the voting rights of Onex.
Onex has entered into an agreement with Celestica and with Computershare Trust Company of Canada (as successor to the Montreal Trust Company of Canada), as trustee for the benefit of the holders of the subordinate voting shares, for the purpose of ensuring that the holders of subordinate voting shares will not be deprived of any rights under applicable take-over bid legislation to which they would be otherwise entitled in the event of a take-over bid (as that term is defined in applicable securities legislation) if multiple voting shares and subordinate voting shares were of a single class of shares. Subject to certain permitted forms of sale, such as identical or better offers to all holders of subordinate voting shares, Onex has agreed that it, and any of its affiliates that may hold multiple voting shares from time to time, will not sell any multiple voting shares, directly or indirectly, pursuant to a take-over bid (as that term is defined under applicable securities legislation) under circumstances in which any applicable securities legislation would have required the same offer or a follow-up offer to be made to holders of subordinate voting shares if the sale had been a sale of subordinate voting shares rather than multiple voting shares, but otherwise on the same terms.
In January 2009, we entered into a Services Agreement with Onex for the services of Mr. Schwartz (amended in 2017 to replace references to Mr. Schwartz with references to Mr. Tawfiq Popatia, also an officer of Onex) as a director of Celestica, pursuant to which Onex receives compensation for such services. This agreement automatically renews for successive one-year terms unless either party provides a notice of intent not to renew. Under such agreement, as amended, the annual fee payable to Onex is $235,000 payable in DSUs in equal quarterly installments in arrears. The Services Agreement terminates automatically and the rights of Onex to receive compensation (other than accrued and unpaid compensation) will terminate (a) 30 days after the first day on which Onex ceases to hold at least one multiple voting share of Celestica or any successor company or (b) the date Mr. Popatia ceases to be a director of Celestica for any reason.
The original parties to the Property Sale Agreement were the Company and the Property Purchaser, a consortium of four real estate partnerships. Approximately 27% of the interests in the Property Purchaser were at the time of execution of the Property Sale Agreement, and are, held by a privately-held partnership in which Mr. Schwartz has a material interest; and approximately 25% of the interests in the Property Purchaser were at the time of execution of the Property Sale Agreement, and are, held by a partnership in which Mr. Schwartz has a non-voting interest. In September 2018, the Property Sale Agreement was assigned to the Assignee, although the Property Purchaser was not released from its obligations under the Property Sale Agreement. At the time of execution of such assignment, the Assignee was unrelated to us or the Property Purchaser. Subsequent to the execution of such assignment, the Assignee granted the Property Purchaser an option to obtain a 5% non-voting interest in the Assignee. See “Overview —
Recent developments
and
Liquidity
—
Toronto Real Property and Related Transactions
” above.
Outstanding Share Data
As of
February 13, 2019
, we had 118,079,397 outstanding subordinate voting shares and 18,600,193 outstanding multiple voting shares. As of such date, we also had 345,577 outstanding stock options, 5,085,274 outstanding RSUs, 4,223,278 outstanding PSUs (assuming vesting of 100% of the target amount granted (amounts that will vest range from 0% to 200% of the target amount granted)), and 1,627,598 outstanding DSUs; each vested option or unit entitling the holder thereof to receive one subordinate voting share (or in certain cases, cash) pursuant to the terms thereof, subject to certain time or performance-based vesting conditions.
81
Controls and Procedures
Evaluation of disclosure controls and procedures:
Our management is responsible for establishing and maintaining a system of disclosure controls and procedures (as defined in Rules 13a-15(e) and 15d-15(e) under the U.S. Exchange Act) designed to ensure that information we are required to disclose in the reports that we file or submit under the U.S. Exchange Act is recorded, processed, summarized and reported within the time periods specified in the U.S. Securities and Exchange Commission’s rules and forms. Disclosure controls and procedures include, without limitation, controls and procedures designed to ensure that information required to be disclosed by an issuer in the reports that it files or submits under the U.S. Exchange Act is accumulated and communicated to the issuer’s management, including its principal executive officer or officers and principal financial officer or officers, or persons performing similar functions, as appropriate, to allow timely decisions regarding required disclosure.
Under the supervision of and with the participation of management, including our principal executive officer and principal financial officer, we have evaluated the effectiveness of the design and operation of our disclosure controls and procedures as of
December 31, 2018
. Based on that evaluation, our principal executive officer and principal financial officer have concluded that, as of
December 31, 2018
, our disclosure controls and procedures are effective to meet the requirements of Rules 13a-15(e) and 15d-15(e) under the U.S. Exchange Act.
A control system, no matter how well conceived and operated, can provide only reasonable, not absolute, assurance that its objectives are met. Due to inherent limitations in all such systems, no evaluation of controls can provide absolute assurance that all control issues within a company have been detected. Accordingly, our disclosure controls and procedures are designed to provide reasonable, not absolute, assurance that the objectives of our disclosure control system are met.
Changes in internal control over financial reporting:
We did not identify any change in our internal control over financial reporting in connection with our evaluation thereof that occurred during the year ended
December 31, 2018
that has materially affected, or is reasonably likely to materially affect, our internal control over financial reporting.
On April 4, 2018, we completed the acquisition of Atrenne, and, as a result, have integrated the processes and controls relating to Atrenne into our existing system of internal control over financial reporting. The integration of Atrenne did not result in changes that would materially affect, or would be reasonably likely to materially affect, our internal control over financial reporting. On November 9, 2018, we completed the acquisition of Impakt, and are in the process of assessing its processes and internal controls. Although this assessment may result in changes to our internal control over financial reporting, we do not currently anticipate that the integration of Impakt will result in changes that would materially affect, or would be reasonably likely to materially affect, our internal control over financial reporting. In addition, there were no significant changes to our internal control over financial reporting as a result of our preparation for the adoption of IFRS 16 (Leases) effective January 1, 2019.
Management’s report on internal control over financial reporting:
Reference is made to our Management’s Report on Internal Control over Financial Reporting on page F-1 of our Annual Report on Form 20-F for the year ended
December 31, 2018
. Our auditors, KPMG LLP, an independent registered public accounting firm, have issued an audit report on our internal control over financial reporting as of
December 31, 2018
, which appears on page F-2 of such Annual Report.
82
Unaudited Quarterly Financial Highlights
(in millions, except percentages and per share amounts):
|
|
2017*
|
2018
|
||||||||||||||||||||||||
|
|
First
Quarter |
Second
Quarter |
Third
Quarter |
Fourth
Quarter |
First
Quarter |
Second
Quarter |
Third
Quarter |
Fourth
Quarter |
||||||||||||||||||
|
Revenue
|
$1,482.1
|
$1,557.6
|
$1,532.8
|
$1,570.2
|
$1,499.7
|
$1,695.2
|
$1,711.3
|
$1,727.0
|
||||||||||||||||||
|
Gross margin
|
6.9
|
%
|
7.0
|
%
|
6.9
|
%
|
6.5
|
%
|
6.2
|
%
|
6.2
|
%
|
6.6
|
%
|
6.9
|
%
|
||||||||||
|
Net earnings
|
$
|
22.5
|
|
$
|
34.6
|
|
$
|
34.8
|
|
$
|
13.6
|
|
$
|
14.1
|
|
$
|
16.1
|
|
$
|
8.6
|
|
$
|
60.1
|
|
||
|
Weighted average # of basic shares
|
142.1
|
|
143.4
|
|
143.7
|
|
143.3
|
|
142.2
|
|
139.6
|
|
139.0
|
|
136.8
|
|
||||||||||
|
Weighted average # of diluted shares
|
144.0
|
|
145.5
|
|
145.7
|
|
145.5
|
|
143.5
|
|
140.7
|
|
140.3
|
|
138.0
|
|
||||||||||
|
# of shares outstanding
|
143.2
|
|
143.6
|
|
143.7
|
|
141.8
|
|
139.6
|
|
139.3
|
|
137.4
|
|
136.3
|
|
||||||||||
|
IFRS EPS:
|
||||||||||||||||||||||||||
|
basic
|
$
|
0.16
|
|
$
|
0.24
|
|
$
|
0.24
|
|
$
|
0.09
|
|
$
|
0.10
|
|
$
|
0.12
|
|
$
|
0.06
|
|
$
|
0.44
|
|
||
|
diluted
|
$
|
0.16
|
|
$
|
0.24
|
|
$
|
0.24
|
|
$
|
0.09
|
|
$
|
0.10
|
|
$
|
0.11
|
|
$
|
0.06
|
|
$
|
0.44
|
|
||
* 2017 quarterly results have been restated to reflect the adoption of IFRS15.
All quarters in the table above have been impacted by our restructuring charges, the amounts of which vary from quarter to quarter.
Q4 2018 compared to Q4 2017:
Revenue of
$1.7 billion
for the Q4
2018
increased
10%
compared to Q4
2017
. Compared to Q4
2017
, revenue dollars in Q4
2018
from our CCS segment increased 10%. Communications end market revenue increased 7% in Q4 2018 as compared to the prior year period, as increased demand and new programs (including JDM programs) were partially offset by demand softness from certain of our legacy customers. Enterprise end market revenue increased 14% in Q4
2018
compared to the prior year period, primarily driven by strong demand in our storage business. ATS segment revenue increased 11% in Q4
2018
compared to Q4 2017, driven by demand strength and new programs in our industrial business and revenue from our Atrenne acquisition, offset in part by weaker than expected demand in our capital equipment business. Gross profit increased $18.4 million in Q4 2018 as compared to Q4 2017, and gross margin for Q4
2018
increased to 6.9% of total revenue compared to 6.5% of total revenue for Q4
2017
. The increases in gross profit and gross margin were primarily due to higher revenue (primarily in our Enterprise end market and our ATS segment businesses other than capital equipment), changes in CCS program mix, including higher JDM revenues, offset in part by lower utilization and operating losses in our capital equipment business, particularly in our semiconductor business. CCS segment margin for Q4 2018 increased to 3.3% of segment revenue, compared to 2.2% for Q4 2017. ATS segment margin decreased from 5.2% for Q4 2017 to 3.7% for Q4 2018, attributable primarily to the weaker than expected demand from our capital equipment business, resulting in operating losses in this business in Q4 2018 in the mid single-digit million dollar range. Net earnings for Q4
2018
of $60.1 million were $46.5 million higher compared to Q4 2017, primarily due to the Impakt Benefit in the fourth quarter of 2018. In addition, the improvement in gross profit was offset in part by $8.5 million in higher SG&A, $3.9 million in higher amortization of intangible asset charges (primarily due to our recent acquisitions), and $6.6 million in higher finance costs in Q4 2018 as compared to Q4 2017.
Q4
2018
compared to the
third
quarter
2018
(Q3 2018):
Revenue for Q4
2018
increased 1% compared to Q3
2018
. Compared to the previous quarter, CCS segment revenues were relatively flat, as demand strength from our Enterprise end market (including from JDM), was offset by revenue declines primarily from legacy customers in our Communications end market. ATS segment revenue increased 2% sequentially, as revenue from our recent acquisitions were offset, in part, by a sequential revenue decline in our capital equipment business, as weaker than expected demand resulted in lower utilization and losses for the quarter in this business (discussed above), due to its high fixed cost infrastructure. Gross margin for Q4
2018
increased to 6.9% of total revenue compared to 6.6% of total revenue for Q3
2018
. The increase in gross margin was due primarily to improvements in our CCS segment, reflecting favorable changes in customer and program mix, including higher levels of JDM business. CCS segment margin for Q4 2018 increased to 3.3% of segment revenue compared to 2.7% for Q3 2018, while ATS segment margin decreased from 4.6% in Q3 2018 to 3.7% for Q4 2018 (for the reasons discussed above). Net earnings for Q4
2018
of $60.1 million were $51.5 million higher compared to Q3 2018, primarily due to the Impakt Benefit.
83
Selected fourth quarter 2018 IFRS results:
|
Actual
|
|
|
IFRS revenue (in billions)
|
$1.7
|
|
IFRS EPS (diluted)*
|
$0.44
|
|
IFRS earnings before income taxes as a % of revenue
|
1.2%
|
|
IFRS SG&A (in millions)
|
$59.6
|
* IFRS EPS for the
fourth
quarter of
2018
of
$0.44
on a diluted basis included an aggregate charge of
$0.18
(pre-tax) per share for employee stock-based compensation expense, amortization of intangible assets (excluding computer software), Toronto transition costs (described below) and restructuring charges. This aggregate charge is within the range we provided on October 24, 2018 of an aggregate charge of between $0.14 to $0.20 per share for these items.
Fourth
quarter
2018
actual compared to guidance
|
|
Q4 2018
|
||
|
|
Guidance
|
Actual
|
|
|
IFRS revenue (in billions)
|
$1.70 to $1.80
|
$1.7
|
|
|
Non-IFRS operating margin
|
3.5% at the mid-point of our revenue and non-IFRS adjusted EPS guidance ranges
|
3.5%
|
|
|
Non-IFRS adjusted SG&A (in millions)
|
$49.0 to $51.0
|
$55.0
|
|
|
Non-IFRS adjusted EPS (diluted)
|
$0.27 to $0.33
|
$0.29
|
|
For Q4 2018, our revenue was within our guidance range, but slightly below our guidance mid-point as lower than expected demand in our Communications end market and demand softness from our capital equipment business were partially offset by stronger than expected demand in our Enterprise end market. Non-IFRS operating margin for Q4 2018 met our guidance. Non-IFRS adjusted SG&A for Q4 2018 was higher than our guidance range primarily due to higher than expected variable expenses and SG&A costs incurred in connection with our Impakt acquisition. Our non-IFRS adjusted EPS results for Q4
2018
were within our guidance range.
Our guidance includes a range for adjusted EPS (which is a non-IFRS measure and is defined below). Management considers non-IFRS adjusted EPS to be an important measure for investors to understand our core operating performance. A reconciliation of non-IFRS adjusted net earnings to IFRS net earnings is set forth below.
Non-IFRS measures:
Management uses adjusted net earnings and the other non-IFRS measures described herein (i) to assess operating performance and the effective use and allocation of resources, (ii) to provide more meaningful period-to-period comparisons of operating results, (iii) to enhance investors’ understanding of the core operating results of our business, and (iv) to set management incentive targets. We believe the non-IFRS measures we present herein are useful to investors, as they enable investors to evaluate and compare our results from operations in a more consistent manner (by excluding specific items that we do not consider to be reflective of our ongoing operating results), to evaluate cash resources that we generate each period, and to provide an analysis of operating results using the same measures our chief operating decision makers use to measure performance. In addition, management believes that the use of a non-IFRS adjusted tax expense and a non-IFRS adjusted effective tax rate provides improved insight into the tax effects of our ongoing business operations, and is useful to management and investors for historical comparisons and forecasting. These non-IFRS financial measures result largely from management’s determination that the facts and circumstances surrounding the excluded charges or recoveries are not indicative of the ordinary course of the ongoing operation of our business.
We believe investors use both IFRS and non-IFRS measures to assess management’s past, current and future decisions associated with our priorities and our allocation of capital, as well as to analyze how our business operates in, or responds to, swings in economic cycles or to other events that impact our core operations.
Non-IFRS measures do not have any standardized meaning prescribed by IFRS and therefore may not be comparable to similar measures presented by other companies. Non-IFRS measures are not measures of performance under IFRS and should not be considered in isolation or as a substitute for any standardized measure under IFRS. The most significant limitation to
84
management’s use of non-IFRS financial measures is that the charges or credits excluded from the non-IFRS measures are nonetheless charges or credits that are recognized under IFRS and that have an economic impact on us. Management compensates for these limitations primarily by issuing IFRS results to show a complete picture of our performance, and reconciling non-IFRS results back to the most directly comparable IFRS results.
In addition to cash cycle days (including the components thereof) and inventory turns (each described under the caption “Other Performance Indicators” above), which have no defined meanings under IFRS, we use the following non-IFRS measures: adjusted gross profit, adjusted gross margin (adjusted gross profit as a percentage of revenue), adjusted SG&A, adjusted SG&A as a percentage of revenue, operating earnings (adjusted EBIAT), operating margin (operating earnings or adjusted EBIAT as a percentage of revenue), adjusted net earnings, adjusted EPS, adjusted ROIC, free cash flow, adjusted tax expense and adjusted effective tax rate. Adjusted EBIAT, adjusted ROIC, free cash flow, adjusted tax expense and adjusted effective tax rate are further described in the tables below. In calculating these non-IFRS financial measures, management excludes the following items, where applicable: employee stock-based compensation expense, amortization of intangible assets (excluding computer software), restructuring and other charges, net of recoveries (as defined below), impairment charges, other solar charges (as defined below), and acquisition inventory fair value adjustments, all net of the associated tax adjustments (which are set forth in the table below), and non-core tax impacts (tax adjustments related to acquisitions, and certain other tax costs or recoveries related to restructuring actions or restructured sites).
The economic substance of these exclusions and management’s rationale for excluding them from non-IFRS financial measures is provided below:
Employee stock-based compensation expense, which represents the estimated fair value of stock options, RSUs and PSUs granted to employees, is excluded because grant activities vary significantly from quarter-to-quarter in both quantity and fair value. In addition, excluding this expense allows us to better compare core operating results with those of our competitors who also generally exclude employee stock-based compensation expense in assessing their operating performance, who may have different granting patterns and types of equity awards, and who may use different valuation assumptions than we do.
Amortization charges (excluding computer software) consist of non-cash charges against intangible assets that are impacted by the timing and magnitude of acquired businesses. Amortization of intangible assets varies among our competitors, and we believe that excluding these charges permits a better comparison of core operating results with those of our competitors who also generally exclude amortization charges in assessing operating performance.
Restructuring and other charges, net of recoveries, consist of costs relating to employee severance, lease terminations, site closings and consolidations, write-downs of owned property and equipment which are no longer used and are available for sale, reductions in infrastructure, Toronto transition costs (recoveries) (defined below), acquisition-related consulting, transaction and integration costs (Acquisition Costs), legal settlements (recoveries), and the accelerated amortization of $1.2 million in unamortized deferred financing costs recorded on the extinguishment of our Prior Facility during the second quarter of 2018. We exclude these restructuring and other charges, net of recoveries, because we believe that they are not directly related to ongoing operating results and do not reflect expected future operating expenses after completion of these activities. We believe these exclusions permit a better comparison of our core operating results with those of our competitors who also generally exclude these charges, net of recoveries, in assessing operating performance.
Toronto transition costs (recoveries) are costs (recoveries) recorded in connection with the sale of our Toronto real property, the relocation of our Toronto manufacturing operations, the move of our corporate headquarters to a temporary location while space in a new office building for such headquarters at our current location is under construction, as well as the move to such new office space upon its completion. Toronto transition costs consist of direct relocation costs, duplicate costs (such as rent expense, utility costs, depreciation charges, and personnel costs) incurred during the transition period, as well as cease-use costs incurred in connection with idle or vacated portions of the relevant premises that we would not have incurred but for these relocations. Toronto transition recoveries will consist of amounts received from the purchaser of the Toronto real property or gains we record in connection with its sale. We believe that excluding these costs and recoveries permits a better comparison of our core operating results from period-to-period, as these costs will not reflect our ongoing operations once these relocations are complete.
Impairment charges, which consist of non-cash charges against goodwill, intangible assets and property, plant and equipment, result primarily when the carrying value of these assets exceeds their recoverable amount. Our competitors may record impairment charges at different times, and we believe that excluding these charges permits a better comparison of our core operating results with those of our competitors who also generally exclude these charges in assessing operating performance.
Other solar charges, consisting of non-cash charges to further write-down the carrying value of our then-remaining solar panel inventory and the write-down of solar accounts receivable (A/R) (primarily as a result of a solar customer's bankruptcy) to
85
estimated recoverable amounts, were recorded in the second quarter of 2017 through cost of sales and SG&A expenses, respectively. These impairment charges, which were identified during the wind-down of our solar operations, were excluded as they pertained to a business we had exited, and therefore were no longer directly related to our ongoing core operating results. Although we recorded significant impairment charges to write down our solar panel inventory in the third quarter of 2016, those charges were not excluded in the determination of our non-IFRS financial measures for such period, as we were then still engaged in the solar panel manufacturing business. In connection with this wind-down, we also recorded net non-cash impairment charges to write down the carrying value of our solar panel manufacturing equipment held for sale to its estimated sales value less costs of disposal, which we recorded through other charges during 2017.
Acquisition inventory fair value adjustments relate to the write-up of the inventory acquired in connection with our acquisitions, representing the difference between the cost and fair value of such inventory. Acquired assets and liabilities are recorded on our balance sheet at their fair values as of the date of acquisition. Fair value adjustments are recognized through cost of sales in the period during which the acquired inventory is sold. We recognized the full $1.6 million adjustment related to inventory acquired from Atrenne during the second quarter of 2018 (as all of the inventory was sold during that quarter), which negatively impacted our gross profit and net earnings for such period. No such adjustment was recorded with respect to inventory acquired from Impakt. We exclude the impact of the recognition of these adjustments, when incurred, because we believe such exclusion permits a better comparison of our core operating results from period-to-period, as their impact is not indicative of our ongoing operating performance.
Non-core tax impacts are excluded, as we believe that these costs or recoveries do not reflect core operating performance and vary significantly among those of our competitors who also generally exclude these charges or recoveries in assessing operating performance.
The following table sets forth, for the periods indicated, the various non-IFRS measures discussed above, and a reconciliation of non-IFRS measures to the most directly comparable IFRS measures, (in millions, except percentages and per share amounts). 2017 financial information has been restated to reflect our adoption, effective January 1, 2018, of IFRS 15.
86
|
Three months ended December 31
|
Year ended December 31
|
||||||||||||||||||
|
|
2017
|
2018
|
2017
|
2018
|
|||||||||||||||
|
(restated)
|
(restated)
|
||||||||||||||||||
|
|
|
% of
|
|
% of
|
% of
|
% of
|
|||||||||||||
|
|
revenue
|
|
revenue
|
revenue
|
revenue
|
||||||||||||||
|
IFRS revenue
|
$
|
1,570.2
|
|
|
$
|
1,727.0
|
|
|
$
|
6,142.7
|
|
$
|
6,633.2
|
|
|||||
|
IFRS gross profit
|
$
|
101.6
|
|
6.5%
|
$
|
120.0
|
|
6.9%
|
$
|
418.5
|
|
6.8%
|
$
|
430.5
|
|
6.5%
|
|||
|
Employee stock-based compensation expense
|
3.2
|
|
3.8
|
|
|
14.6
|
|
|
14.7
|
|
|
||||||||
|
Other solar charges (inventory write-down)
|
—
|
|
—
|
|
0.9
|
|
—
|
|
|||||||||||
|
Acquisition inventory fair value adjustment
|
—
|
|
—
|
|
—
|
|
1.6
|
|
|||||||||||
|
Non-IFRS adjusted gross profit
|
$
|
104.8
|
|
6.7%
|
$
|
123.8
|
|
7.2%
|
$
|
434.0
|
|
7.1%
|
$
|
446.8
|
|
6.7%
|
|||
|
IFRS SG&A
|
$
|
51.1
|
|
3.3%
|
$
|
59.6
|
|
3.5%
|
$
|
203.2
|
|
3.3%
|
$
|
219.0
|
|
3.3%
|
|||
|
Employee stock-based compensation expense
|
(4.2
|
)
|
|
(4.6
|
)
|
|
(15.5
|
)
|
|
(18.7
|
)
|
|
|||||||
|
Other solar charges (A/R write-down)
|
—
|
|
—
|
|
(0.5
|
)
|
—
|
|
|||||||||||
|
Non-IFRS adjusted SG&A
|
$
|
46.9
|
|
3.0%
|
$
|
55.0
|
|
3.2%
|
$
|
187.2
|
|
3.0%
|
$
|
200.3
|
|
3.0%
|
|||
|
IFRS earnings before income taxes
|
$
|
21.3
|
|
1.4%
|
$
|
20.1
|
|
1.2%
|
$
|
133.1
|
|
2.2%
|
$
|
81.9
|
|
1.2%
|
|||
|
Finance costs
|
2.6
|
|
9.2
|
|
10.1
|
|
24.4
|
|
|||||||||||
|
Employee stock-based compensation expense
|
7.4
|
|
8.4
|
|
30.1
|
|
33.4
|
|
|||||||||||
|
Amortization of intangible assets (excluding computer software)
|
1.1
|
|
|
5.1
|
|
5.5
|
|
11.6
|
|
||||||||||
|
Net restructuring, impairment and other charges (recoveries)
(1)
|
17.5
|
|
|
16.9
|
|
37.0
|
|
61.0
|
|
||||||||||
|
Other solar charges (inventory and A/R write-down)
|
—
|
|
—
|
|
1.4
|
|
—
|
|
|||||||||||
|
Acquisition inventory fair value adjustment
|
—
|
|
—
|
|
—
|
|
1.6
|
|
|||||||||||
|
Non-IFRS operating earnings (adjusted EBIAT)
(1)
|
$
|
49.9
|
|
3.2%
|
$
|
59.7
|
|
3.5%
|
$
|
217.2
|
|
3.5%
|
$
|
213.9
|
|
3.2%
|
|||
|
IFRS net earnings
|
$
|
13.6
|
|
0.9%
|
$
|
60.1
|
|
3.5%
|
$
|
105.5
|
|
1.7%
|
$
|
98.9
|
|
1.5%
|
|||
|
Employee stock-based compensation expense
|
7.4
|
|
|
8.4
|
|
|
30.1
|
|
33.4
|
|
|
||||||||
|
Amortization of intangible assets (excluding computer software)
|
1.1
|
|
|
5.1
|
|
|
5.5
|
|
11.6
|
|
|
||||||||
|
Net restructuring, impairment and other charges (recoveries)
(1)
|
17.5
|
|
|
16.9
|
|
|
37.0
|
|
61.0
|
|
|
||||||||
|
Other solar charges (inventory and A/R write-down)
|
—
|
|
—
|
|
1.4
|
|
—
|
|
|||||||||||
|
Acquisition inventory fair value adjustment
|
—
|
|
—
|
|
—
|
|
1.6
|
|
|||||||||||
|
Adjustments for taxes
(2)
|
(0.5
|
)
|
|
(50.8
|
)
|
|
(6.5
|
)
|
(56.7
|
)
|
|
||||||||
|
Non-IFRS adjusted net earnings
|
$
|
39.1
|
|
$
|
39.7
|
|
$
|
173.0
|
|
$
|
149.8
|
|
|||||||
|
Diluted EPS
|
|||||||||||||||||||
|
Weighted average # of shares (in millions)
|
145.5
|
|
138.0
|
|
145.2
|
|
140.6
|
|
|||||||||||
|
IFRS earnings per share
|
$
|
0.09
|
|
|
$
|
0.44
|
|
$
|
0.73
|
|
$
|
0.70
|
|
||||||
|
Non-IFRS adjusted earnings per share
|
$
|
0.27
|
|
|
$
|
0.29
|
|
$
|
1.19
|
|
$
|
1.07
|
|
||||||
|
# of shares outstanding at period end (in millions)
|
141.8
|
|
|
136.3
|
|
141.8
|
|
136.3
|
|
||||||||||
|
IFRS cash provided by (used in) operations
|
$
|
43.7
|
|
|
$
|
(1.9
|
)
|
$
|
127.0
|
|
$
|
33.1
|
|
||||||
|
Purchase of property, plant and equipment, net of sales proceeds
|
(20.6
|
)
|
|
(18.8
|
)
|
(101.8
|
)
|
(78.5
|
)
|
||||||||||
|
Finance lease payments
|
(1.7
|
)
|
(0.9
|
)
|
(6.5
|
)
|
(17.0
|
)
|
|||||||||||
|
Repayments from former solar supplier
|
—
|
|
—
|
|
12.5
|
|
—
|
|
|||||||||||
|
Finance costs paid
|
(2.6
|
)
|
|
(14.3
|
)
|
(10.2
|
)
|
(36.0
|
)
|
||||||||||
|
Non-IFRS free cash flow
(3)
|
$
|
18.8
|
|
|
$
|
(35.9
|
)
|
|
$
|
21.0
|
|
$
|
(98.4
|
)
|
|||||
|
IFRS ROIC %
(4)
|
7.0
|
%
|
5.0
|
%
|
11.5
|
%
|
5.8
|
%
|
|||||||||||
|
Non-IFRS Adjusted ROIC %
(4)
|
16.4
|
%
|
15.0
|
%
|
18.8
|
%
|
15.1
|
%
|
|||||||||||
(1) Management uses non-IFRS operating earnings (adjusted EBIAT) as a measure to assess performance related to our core operations. Non-IFRS adjusted EBIAT is defined as earnings before income taxes, finance costs (consisting of interest and fees related to our credit facility, our accounts receivable sales program, and the SFP), amortization of intangible assets (excluding computer software), and in applicable periods, employee stock-based compensation expense, net restructuring and other charges (recoveries) (consisting of restructuring charges (recoveries), Acquisition Costs, legal settlements (recoveries), Toronto transition costs (recoveries), and the accelerated amortization of unamortized deferred financing costs), impairment charges (recoveries), other solar charges, and acquisition inventory fair value adjustments. See "Operating Results -- Other charges" for separate quantification and discussion of impairment charges, and the components of net restructuring and other charges (recoveries).
(2) The adjustments for taxes, as applicable, represent the tax effects of our non-IFRS adjustments and non-core tax impacts (described below).
87
The following table sets forth a reconciliation of our IFRS tax expense and IFRS effective tax rate to our non-IFRS adjusted tax expense and our non-IFRS adjusted effective tax rate for the periods indicated, in each case determined by excluding the tax benefits or costs associated with the listed items (in millions, except percentages) from our IFRS tax expense for such periods:
|
Three months ended
|
Year ended
|
||||||||||||||||||||||
|
December 31
|
December 31
|
||||||||||||||||||||||
|
2017
|
Effective tax rate
|
2018
|
Effective tax rate
|
2017
|
Effective tax rate
|
2018
|
Effective tax rate
|
||||||||||||||||
|
(restated)
|
|
(restated)
|
|
||||||||||||||||||||
|
IFRS tax expense and IFRS effective tax rate
|
$
|
7.7
|
|
36
|
%
|
$
|
(40.0
|
)
|
(199
|
)%
|
$
|
27.6
|
|
21
|
%
|
$
|
(17.0
|
)
|
(21
|
)%
|
|||
|
Tax costs (benefits) of the following items excluded from IFRS tax expense:
|
|||||||||||||||||||||||
|
Employee stock-based compensation expense
|
0.9
|
|
1.1
|
|
1.7
|
|
2.3
|
|
|||||||||||||||
|
Amortization of intangible assets (excluding
computer software)
|
—
|
|
—
|
|
—
|
|
—
|
|
|||||||||||||||
|
Net restructuring, impairment and other charges
|
(0.4
|
)
|
0.7
|
|
1.0
|
|
1.4
|
|
|||||||||||||||
|
Other solar charges (inventory and A/R write-down)
|
—
|
|
—
|
|
0.4
|
|
—
|
|
|||||||||||||||
|
Non-core tax impact related to fair value adjustment on acquisitions*
|
—
|
|
49.6
|
|
—
|
|
53.3
|
|
|||||||||||||||
|
Non-core tax impacts related to restructured sites**
|
—
|
|
(0.6
|
)
|
3.4
|
|
(0.3
|
)
|
|||||||||||||||
|
Non-IFRS adjusted tax expense/Non-IFRS adjusted effective tax rate
|
$
|
8.2
|
|
17
|
%
|
$
|
10.8
|
|
21
|
%
|
$
|
34.1
|
|
16
|
%
|
$
|
39.7
|
|
21
|
%
|
|||
* Consists of deferred tax assets attributable to our acquisitions of Atrenne (recorded in the second quarter of 2018) and Impakt (recorded in the fourth quarter of 2018)
** Includes the Solar Benefit recorded in the second quarter of 2017.
(3) Management uses non-IFRS free cash flow as a measure, in addition to IFRS cash provided by (used in) operations, to assess our operational cash flow performance. We believe non-IFRS free cash flow provides another level of transparency to our liquidity. Non-IFRS free cash flow is defined as cash provided by (used in) operations after the purchase of property, plant and equipment (net of proceeds from the sale of certain surplus equipment and property), finance lease payments, repayments from a former solar supplier, and finance costs paid. As a measure of liquidity, and consistent with the inclusion of our Toronto relocation capital expenditures and transition costs in non-IFRS free cash flow in the periods incurred, we will include amounts we receive from the sale of our Toronto real property in non-IFRS free cash flow in the period of receipt. Note that non-IFRS free cash flow, however, does not represent residual cash flow available to Celestica for discretionary expenditures.
(
4
) Management uses non-IFRS adjusted ROIC as a measure to assess the effectiveness of the invested capital we use to build products or provide services to our customers, by quantifying how well we generate earnings relative to the capital we have invested in our business. Our non-IFRS adjusted ROIC measure reflects non-IFRS operating earnings, working capital management and asset utilization. Non-IFRS adjusted ROIC is calculated by dividing non-IFRS adjusted EBIAT by average net invested capital. Net invested capital (calculated in the table below) consists of the following IFRS measures: total assets less cash, accounts payable, accrued and other current liabilities and provisions, and income taxes payable. We use a two-point average to calculate average net invested capital for the quarter and a five-point average to calculate average net invested capital for the year. A comparable measure under IFRS would be determined by dividing IFRS earnings before income taxes by net invested capital (which we have set forth in the charts above and below), however, this measure (which we have called IFRS ROIC), is not a measure defined under IFRS.
88
The following table sets forth, for the periods indicated, our calculation of IFRS ROIC % and non-IFRS adjusted ROIC % (in millions, except IFRS ROIC % and non-IFRS adjusted ROIC %). 2017 financial information has been restated to reflect our adoption, effective January 1, 2018, of IFRS 15.
|
Three months ended
|
Year ended
|
||||||||||||||||||
|
December 31
|
December 31
|
||||||||||||||||||
|
2017
|
2018
|
2017
|
2018
|
||||||||||||||||
|
(restated)
|
(restated)
|
||||||||||||||||||
|
IFRS earnings before income taxes
|
$
|
21.3
|
|
$
|
20.1
|
|
$
|
133.1
|
|
$
|
81.9
|
|
|||||||
|
Multiplier to annualize earnings
|
4
|
|
4
|
|
1
|
|
1
|
|
|||||||||||
|
Annualized IFRS earnings before income taxes
|
$
|
85.2
|
|
$
|
80.4
|
|
$
|
133.1
|
|
$
|
81.9
|
|
|||||||
|
Average net invested capital for the period
|
$
|
1,216.5
|
|
$
|
1,594.1
|
|
$
|
1,152.9
|
|
$
|
1,413.6
|
|
|||||||
|
IFRS ROIC %
(1)
|
7.0
|
%
|
5.0
|
%
|
11.5
|
%
|
5.8
|
%
|
|||||||||||
|
Three months ended
|
Year ended
|
||||||||||||||||||
|
December 31
|
December 31
|
||||||||||||||||||
|
|
2017
|
2018
|
2017
|
2018
|
|||||||||||||||
|
(restated)
|
(restated)
|
||||||||||||||||||
|
Non-IFRS operating earnings (adjusted EBIAT)
|
$
|
49.9
|
|
$
|
59.7
|
|
$
|
217.2
|
|
$
|
213.9
|
|
|||||||
|
Multiplier to annualize earnings
|
4
|
|
4
|
|
1
|
|
1
|
|
|||||||||||
|
Annualized non-IFRS adjusted EBIAT
|
$
|
199.6
|
|
$
|
238.8
|
|
$
|
217.2
|
|
$
|
213.9
|
|
|||||||
|
Average net invested capital for the period
|
$
|
1,216.5
|
|
$
|
1,594.1
|
|
$
|
1,152.9
|
|
$
|
1,413.6
|
|
|||||||
|
Non-IFRS adjusted ROIC %
(1)
|
16.4
|
%
|
15.0
|
%
|
18.8
|
%
|
15.1
|
%
|
|||||||||||
|
|
December 31, 2017
|
March 31, 2018
|
June 30, 2018
|
September 30, 2018
|
December 31, 2018
|
||||||||||||||
|
(restated)
|
|||||||||||||||||||
|
Net invested capital consists of:
|
|||||||||||||||||||
|
Total assets
|
$
|
2,964.2
|
|
$
|
2,976.0
|
|
$
|
3,212.2
|
|
$
|
3,316.1
|
|
$
|
3,737.7
|
|
||||
|
Less: cash
|
515.2
|
|
435.7
|
|
401.4
|
|
457.7
|
|
422.0
|
|
|||||||||
|
Less: accounts payable, accrued and other current liabilities, provisions and income taxes payable
|
1,228.6
|
|
1,278.1
|
|
1,413.8
|
|
1,473.3
|
|
1,512.6
|
|
|||||||||
|
Net invested capital at period end
(1)
|
$
|
1,220.4
|
|
$
|
1,262.2
|
|
$
|
1,397.0
|
|
$
|
1,385.1
|
|
$
|
1,803.1
|
|
||||
|
|
December 31, 2016
|
March 31, 2017
|
June 30, 2017
|
September 30, 2017
|
December 31, 2017
|
||||||||||||||
|
(restated)
|
(restated)
|
(restated)
|
(restated)
|
(restated)
|
|||||||||||||||
|
Net invested capital consists of:
|
|||||||||||||||||||
|
Total assets
|
$
|
2,841.9
|
|
$
|
2,833.5
|
|
$
|
2,876.7
|
|
$
|
2,892.0
|
|
$
|
2,964.2
|
|
||||
|
Less: cash
|
557.2
|
|
558.0
|
|
582.7
|
|
527.0
|
|
515.2
|
|
|||||||||
|
Less: accounts payable, accrued and other current liabilities, provisions and income taxes payable
|
1,189.7
|
|
1,165.2
|
|
1,167.9
|
|
1,152.4
|
|
1,228.6
|
|
|||||||||
|
Net invested capital at period end
(1)
|
$
|
1,095.0
|
|
$
|
1,110.3
|
|
$
|
1,126.1
|
|
$
|
1,212.6
|
|
$
|
1,220.4
|
|
||||
(1) See footnote
4
of the previous table.
89
Recently issued accounting pronouncements:
IFRS 16, Leases:
In January 2016, the IASB issued this standard, which brings most leases on-balance sheet for lessees under a single model, eliminating the distinction between operating and finance leases. IFRS 16 supersedes IAS 17,
Leases
, and related interpretations, and is effective for periods beginning on or after January 1, 2019. We adopted this standard effective January 1, 2019 applying the modified retrospective approach, whereby the cumulative effect of adopting IFRS 16 will be recognized as an adjustment to the opening retained deficit balance as of January 1, 2019, without restatement of prior period comparative information. We have implemented changes to our business processes, systems and controls to enable the preparation of our consolidated financial statements in accordance with IFRS 16. We will recognize new right-of-use assets and lease liabilities related to the majority of our operating leases on our consolidated balance sheet as of January 1, 2019 upon initial application of IFRS 16. The amortization of these assets will be recognized as a depreciation charge, and the interest expense on the lease liabilities will be recognized as finance costs in our consolidated statement of operations. Previously, we recognized operating lease expenses on a straight-line basis over the lease term generally in cost of sales or SG&A in our consolidated statement of operations. No significant changes are expected for our existing finance leases nor for any leases in which we are a lessor. Although we are completing our analysis of the impact of adopting IFRS 16, we anticipate that the initial application of the new standard will have a material impact on our consolidated financial statements, and we currently estimate that we will recognize right-of-use assets and lease liabilities on our consolidated financial statements of approximately $113 million as of January 1, 2019. The opening retained deficit adjustment is not expected to be material.
Research and development, patents and licenses, etc.
The information required by this item is set forth above in Item 4(B) "Information on the Company — Business Overview — Research and Technology Development."
Trend Information
The information required by this item is set forth above in "Overview," "Operating Results," and "Liquidity and Capital Resources," in Item 3(D) "Key Information — Risk Factors," and in Item 4(B) "Information on the Company — Business Overview."
Off-Balance Sheet Arrangements
Not applicable.
90
A. Directors and Senior Management
Each director of Celestica is elected by the shareholders to serve until the close of the next annual meeting of shareholders or until a successor is elected or appointed, unless such office is earlier vacated in accordance with the Corporation's by-laws. The following table sets forth certain information regarding the current directors and executive officers of Celestica as of
February 13, 2019
.
|
Name
|
Age
|
Director
Since
|
Position with Celestica
|
Residence
|
|||
|
William A. Etherington
(1)
|
77
|
|
2001
|
Chair of the Board
|
Ontario, Canada
|
||
|
Robert A. Cascella
(2)
|
64
|
2019
|
Director
|
Florida, U.S.
|
|||
|
Deepak Chopra
(3)
|
55
|
2018
|
Director
|
Ontario, Canada
|
|||
|
Daniel P. DiMaggio
|
68
|
|
2010
|
Director
|
Georgia, U.S.
|
||
|
Laurette T. Koellner
|
64
|
|
2009
|
Director
|
Florida, U.S.
|
||
|
Carol S. Perry
|
68
|
|
2013
|
Director
|
Ontario, Canada
|
||
|
Tawfiq Popatia
|
44
|
|
2017
|
Director
|
Ontario, Canada
|
||
|
Eamon J. Ryan
|
73
|
|
2008
|
Director
|
Ontario, Canada
|
||
|
Michael M. Wilson
|
67
|
|
2011
|
Director
|
Alberta, Canada
|
||
|
Robert A. Mionis
|
55
|
|
2015
|
Director, President and Chief Executive Officer
|
New Hampshire, U.S.
|
||
|
Name
|
Age
|
Executive
Officer
Since
|
Position with Celestica
|
Residence
|
|||
|
Mandeep Chawla
|
42
|
2017
|
Chief Financial Officer
|
Ontario, Canada
|
|||
|
Todd C. Cooper
(4)
|
49
|
2018
|
Chief Operations Officer
|
Connecticut, U.S.
|
|||
|
Elizabeth L. DelBianco
|
59
|
1998
|
Chief Legal and Administrative Officer and Corporate Secretary
|
Ontario, Canada
|
|||
|
John ("Jack") J. Lawless
|
58
|
2015
|
President, ATS
|
Georgia, U.S.
|
|||
|
Jason Phillips
(5)
|
44
|
2019
|
President, CCS
|
North Carolina, U.S.
|
|||
|
Michael P. McCaughey
|
56
|
2007
|
Advisor
|
Québec, Canada
|
|||
|
Nicolas Pujet
|
46
|
2016
|
Chief Strategy Officer
|
Colorado, U.S.
|
|||
|
(1)
|
Chair of the Board since April 2012.
|
|
(2)
|
Director since February 1, 2019.
|
|
(3)
|
Director since April 27, 2018.
|
(4) Executive Officer since January 4, 2018.
(5) Executive Officer since January 1, 2019.
91
The following is a brief biography of each of Celestica's directors, director nominees and executive officers:
William A. Etherington.
Mr. Etherington is a corporate director. In addition to being the Chair of the Board of Celestica, he is also a director of Onex* (a public company). He is a former director and non-executive Chairman of the board of directors of the Canadian Imperial Bank of Commerce (a public company), and a former director of St. Michael's Hospital. In 2001, Mr. Etherington retired as Senior Vice President and Group Executive, Sales and Distribution, IBM Corporation (a public company), and as Chairman, President and Chief Executive Officer of IBM World Trade Corporation. He holds a Bachelor of Science degree in Electrical Engineering and a Doctor of Laws (Hon.) from Western University.
|
*
|
Onex holds an approximate
80
% voting interest in Celestica. See "Controlling Shareholder Interest" under Item 4(B) above.
|
Robert A. Cascella.
Mr. Cascella is currently an Executive Vice President and Executive Committee member of Royal Philips, a public Dutch multinational healthcare company. He is also the Chief Executive Officer (CEO) of their Diagnosis and Treatment businesses. He served as the President and CEO of Hologic, Inc., a public medical device and diagnostics company, from 2003 to 2013. He has also held senior leadership positions at CFG Capital, NeoVision Corporation and Fischer Imaging Corporation. Mr. Cascella served on Hologic, Inc.’s board of directors from 2008 to 2013. He also previously served on the board of Tegra Medical and acted as chair of the boards of Dysis Medical and Miranda Medical. He holds a Bachelor’s degree in Accounting from Fairfield University.
Deepak Chopra
. Mr. Chopra most recently served as President and Chief Executive Officer of Canada Post Corporation from February 2011 to March 2018. He has more than 30 years of global experience in the financial services, technology, logistics and supply-chain industries. Mr. Chopra worked for Pitney Bowes Inc., a NYSE-traded technology company known for postage meters, mail automation and location intelligence services, for more than 20 years. He served as President of Pitney Bowes Canada and Latin America from 2006 to 2010. He held a number of increasingly senior executive roles internationally, including President of its new Asia Pacific and Middle East region from 2001 to 2006 and Chief Financial Officer for the Europe, Africa and Middle East (EAME) region from 1998 to 2001. He has previously served on the boards of Canada Post Corporation, Purolator Inc., SCI Group, the Canada Post Community Foundation, the Toronto Region Board of Trade and the Conference Board of Canada. He currently sits on the board of The North West Company Inc., a TSX-traded retailer. Mr. Chopra is a Fellow of the Institute of Chartered Professional Accountants of Canada and has a Bachelor’s degree in Commerce (Honours) and a Master’s Degree in Business Management (PGDBM).
Daniel P. DiMaggio.
Mr. DiMaggio is a corporate director. Prior to retiring in 2006, he spent 35 years with United Parcel Services (UPS) (a public company), most recently as Chief Executive Officer of the UPS Worldwide Logistics Group. Prior to leading UPS' Worldwide Logistics Group, Mr. DiMaggio held a number of positions at UPS with increasing responsibility, including leadership roles for the UPS International Marketing Group, as well as the Industrial Engineering function. In addition to his senior leadership roles at UPS, Mr. DiMaggio was a member of the board of directors of Greatwide Logistics Services, Inc.* and CEVA Logistics (a public company). He holds a Bachelor of Science degree from the Lowell Technological Institute (now the University of Massachusetts Lowell).
|
*
|
Mr. DiMaggio was serving as a director of Greatwide Logistics Services, Inc., a privately held company, when that entity filed for bankruptcy in 2008.
|
Laurette T. Koellner.
Ms. Koellner is a corporate director. She most recently served as Executive Chairman of International Lease Finance Corporation, an aircraft leasing subsidiary of American International Group, Inc. (AIG) from 2012 until its sale in 2014. Ms. Koellner retired as President of Boeing International, a division of The Boeing Company, in 2008. While at Boeing, she was a member of the Office of the Chairman and served as the Executive Vice President, Internal Services, Chief Human Resources and Administrative Officer, President of Shared Services, and Corporate Controller. Ms. Koellner currently serves on the board of directors of Papa John's International, Inc., The Goodyear Tire & Rubber Company, and Nucor Corporation, all public companies. Ms. Koellner previously served on the board of directors and was the Chair of the Audit Committee of Hillshire Brands Company (a public company, formerly Sara Lee Corporation and now merged with Tyson Foods, Inc.), and on the board of directors of AIG (a public company). She holds a Bachelor of Science degree in Business Management from the University of Central Florida and a Master of Business Administration from Stetson University, as well as a Certified Professional Contracts Manager designation from the National Contracts Management Association.
92
Carol S. Perry.
Ms. Perry is a corporate director. She is Chair of the Independent Review Committee of the mutual funds managed by 1832 Asset Management L.P., a mutual fund manager and wholly-owned affiliate of The Bank of Nova Scotia. She also serves as Chair of the Independent Review Committees of investment funds managed by Jarislowsky Fraser Limited and MD Financial Management Inc., which are subsidiaries of The Bank of Nova Scotia. Previously, she was a Commissioner of the Ontario Securities Commission, and has served on adjudicative panels and acted as a director and Chair of its Governance and Nominating Committee. With over 20 years of experience in the investment industry as an investment banker, Ms. Perry held senior positions with leading financial services companies including RBC Capital Markets, Richardson Greenshields of Canada Limited and CIBC World Markets and later founded MaxxCap Corporate Finance Inc., a financial advisory firm. She is a former director of Softchoice Corporation, Atomic Energy of Canada Limited and DALSA Corporation. Ms. Perry has a Bachelor of Engineering Science (Electrical) degree from the University of Western Ontario and a Master of Business Administration degree from the University of Toronto. She also holds the professional designation ICD.D from the Institute of Corporate Directors.
Tawfiq Popatia.
Mr. Popatia has been a Managing Director of Onex* since 2014 and leads its efforts in automation, aerospace and other transportation-focused industries, having joined the firm in 2007. Prior to joining Onex, Mr. Popatia worked at the private equity firm of Hellman & Friedman LLC and in the Investment Banking Division of Morgan Stanley & Co. Mr. Popatia currently serves on the boards of Advanced Integration Technology, an aerospace automation company, and BBAM, a provider of commercial jet aircraft leasing, financing and management. He previously served on the board of Spirit Aerosystems (a public company), and is a former Employer Trustee of the International Association of Machinists National Pension Fund. Mr. Popatia holds a Bachelor of Science degree in Microbiology and a Bachelor of Commerce degree in Finance from the University of British Columbia.
|
*
|
Onex holds an approximate
80
% voting interest in Celestica. See "Controlling Shareholder Interest" under Item 4(B) above.
|
Eamon J. Ryan.
Mr. Ryan is a corporate director. He is the former Vice President and General Manager, Europe, Middle East and Africa for Lexmark International Inc. (a public company). Prior to that, he was the Vice President and General Manager, Printing Services and Solutions Manager, Europe, Middle East and Africa. Mr. Ryan joined Lexmark International Inc. in 1991 as the President of Lexmark Canada. Prior to that, he spent 22 years at IBM Canada, where he held a number of sales and marketing roles in its Office Products and Large Systems divisions. Mr. Ryan's last role at IBM Canada was Director of Operations for its Public Sector, a role he held from 1986 to 1990. He holds a Bachelor of Arts degree from the University of Western Ontario.
Michael M. Wilson.
Mr. Wilson is a corporate director. Until his retirement in December 2013, he was the President and Chief Executive Officer, and a director, of Agrium Inc. (a public agricultural crop inputs company that has subsequently merged with Potash Corporation of Saskatchewan Inc. to form Nutrien Ltd.), and has over 30 years of international and executive management experience. Prior to joining Agrium Inc., Mr. Wilson served as President of Methanex Corporation (a public company), and held various senior positions in North America and Asia during his 18 years with The Dow Chemical Company (a public company). Mr. Wilson also currently serves on the board of directors of Air Canada and Suncor Energy Inc., and previously served on the board of directors of Finning International Inc. (each a public company), and was also the past Chair of the Calgary Prostate Cancer Centre. He holds a degree in Chemical Engineering from the University of Waterloo.
Robert A. Mionis.
Mr. Mionis has been President and Chief Executive Officer of the Corporation since August 1, 2015. From July 2013 until August 2015, he was an Operating Partner at Pamplona Capital Management (Pamplona), a global private equity firm focused on companies in the industrial, aerospace, healthcare and automotive segments. Before joining Pamplona, Mr. Mionis spent over six years as the President and CEO of StandardAero, a global aerospace maintenance, repair and overhaul company. Before StandardAero, Mr. Mionis held senior leadership roles at Honeywell, most recently as the head of the Integrated Supply Chain Organization for Honeywell Aerospace. Prior to Honeywell, Mr. Mionis held a variety of progressively senior leadership roles with General Electric (GE) and Axcelis Technologies (each a public company) and AlliedSignal. Mr. Mionis has been serving on the board of directors of Shawcor Ltd., a TSX-listed energy company, since 2018. He holds a Bachelor of Science in Electrical Engineering from the University of Massachusetts.
Mandeep Chawla.
Mr. Chawla has been Chief Financial Officer of the Corporation since October 2017. As Chief Financial Officer, Mr. Chawla is responsible for overseeing Celestica's financial strategy, as well as its accounting, financial and investor relations functions. Mr. Chawla joined Celestica in 2010 and has held a variety of roles, including most recently Senior Vice President, Finance and Interim Chief Financial Officer. Prior to joining Celestica, he held financial management roles
with MDS Inc., Tyco International, and General Electric. Mr. Chawla holds a Master of Finance degree from Queen's University and
a Bachelor of Commerce degree from McMaster University.
He holds a CPA, CMA of Ontario, Canada designation.
Todd C. Cooper.
Mr. Cooper joined Celestica as Chief Operations Officer in 2018 with over 25 years of experience in operations leadership and advisory roles. Prior to joining Celestica, Mr. Cooper led Supply Chain, Procurement, Logistics, and Sustainability value creation efforts across the portfolio companies of KKR, a leading global investment firm, from 2008 to 2018. Prior to that, he was the Vice President of Global Sourcing in Honeywell's Aerospace Division from 2005 to 2008. Before Honeywell, Mr. Cooper held various management roles at Storage Technology Corporation, McKinsey & Company, and served as a Captain in the U.S. Army.
93
Elizabeth L. DelBianco.
Ms. DelBianco is Chief Legal and Administrative Officer and Corporate Secretary. In this role, she oversees legal, contracts, brand and communications, human resources and sustainability. Ms. DelBianco joined Celestica in 1998 and since that time has been responsible for managing legal, governance, and compliance matters for Celestica on a global basis. Prior to joining Celestica, Ms. DelBianco was a senior corporate legal advisor in the telecommunications industry. She holds a Bachelor of Arts degree from the University of Toronto, a Bachelor of Laws degree from Queen's University, and a Master of Business Administration degree from Western University. She is admitted to practice in Ontario and New York.
John ("Jack") J. Lawless.
Mr. Lawless is President, ATS. In this role, he is responsible for the strategy and execution of Celestica's aerospace and defense, industrial, healthtech, smart energy, and capital equipment businesses. He has served in this role since joining Celestica in October 2015; however, his title changed in October 2016 from Executive Vice President, Diversified Markets in order to reflect organizational developments made to better align with the Corporation's business strategy and operational model. From 2009 to 2014, Mr. Lawless was the CEO of Associated Air Center, a subsidiary of StandardAero, one of the world's largest independent global aerospace maintenance, repair and overhaul companies. He also held the role of Chief Operating Officer of StandardAero, where he was responsible for operations, supply chain, quality, IT, and engineering. Prior to StandardAero, Mr. Lawless held a number of Vice President-level roles with Honeywell. Before joining Honeywell, he held progressively senior positions with Axcelis Technologies, General Cable and AlliedSignal.
Jason Phillips.
Mr. Phillips was appointed President, CCS, effective January 1, 2019. In this role, he is responsible for the Corporation's enterprise and communications businesses and customers. From 2014 to 2018, he served as Senior Vice President for the Corporation’s enterprise and cloud solutions businesses, where he was central to building the Corporation's JDM business. From 2008 to 2014, he held various positions within the Corporation’s enterprise and communications business. Prior to joining Celestica, Mr. Phillips held various leadership roles with global EMS companies. He holds a BSBA from the University of North Carolina at Chapel Hill - Kenan-Flagler Business School.
Michael P. McCaughey.
Mr. McCaughey became an Advisor to the Corporation, effective January 1, 2019. In this role, he provides strategic advice to the Corporation and transitional support. From 2012 through 2018, he served as President, CCS and was responsible for strategic direction of the Corporation's enterprise and communications businesses, including its managed services businesses. From 2005 to 2012, he held senior positions within the Corporation's enterprise and communications businesses. Prior to joining Celestica in 2005, Mr. McCaughey held the role of Senior Vice President, Wireline Network Systems, at Sanmina-SCI. Before joining Sanmina-SCI, Mr. McCaughey held senior roles at Hyperchip Inc. and SCI Systems (prior to that company's merger with Sanmina). He holds a DEC in Electrotechnology from Vanier College and studied Electrical Engineering at McGill University.
Nicolas Pujet.
Mr. Pujet has been Chief Strategy Officer since July 2016. In this role, he leads Celestica's strategy and corporate development including the design and development of the Company's vision, strategic framework and planning activities in support of the Company's business objectives, as well as mergers and acquisitions. Prior to joining Celestica, Mr. Pujet spent more than 16 years in various strategic and leadership roles. From 2003 to 2016, he served in various strategy positions at Level 3 Communications. Most recently, he was the Senior Vice President, Corporate Strategy and was responsible for that company's strategic outlook and strategic planning and analyses worldwide. From 1999 to 2003, Mr. Pujet served as a management consultant with McKinsey & Company, a global management consulting firm. He holds a Ph.D. in Aeronautics and Astronautics from MIT.
There are no family relationships among any of the foregoing persons, and there are no arrangements or understandings with any person pursuant to which any of our directors or executive officers were selected.
None of the directors of the Corporation during 2018, or current directors or nominees serve together as directors of other corporations.
94
The following table identifies the functional competencies, expertise and qualifications of the Corporation's current directors and nominees pursuant to a skills matrix developed by the Nominating and Governance Committee to identify functional competencies, expertise and qualifications that our Board would ideally possess:
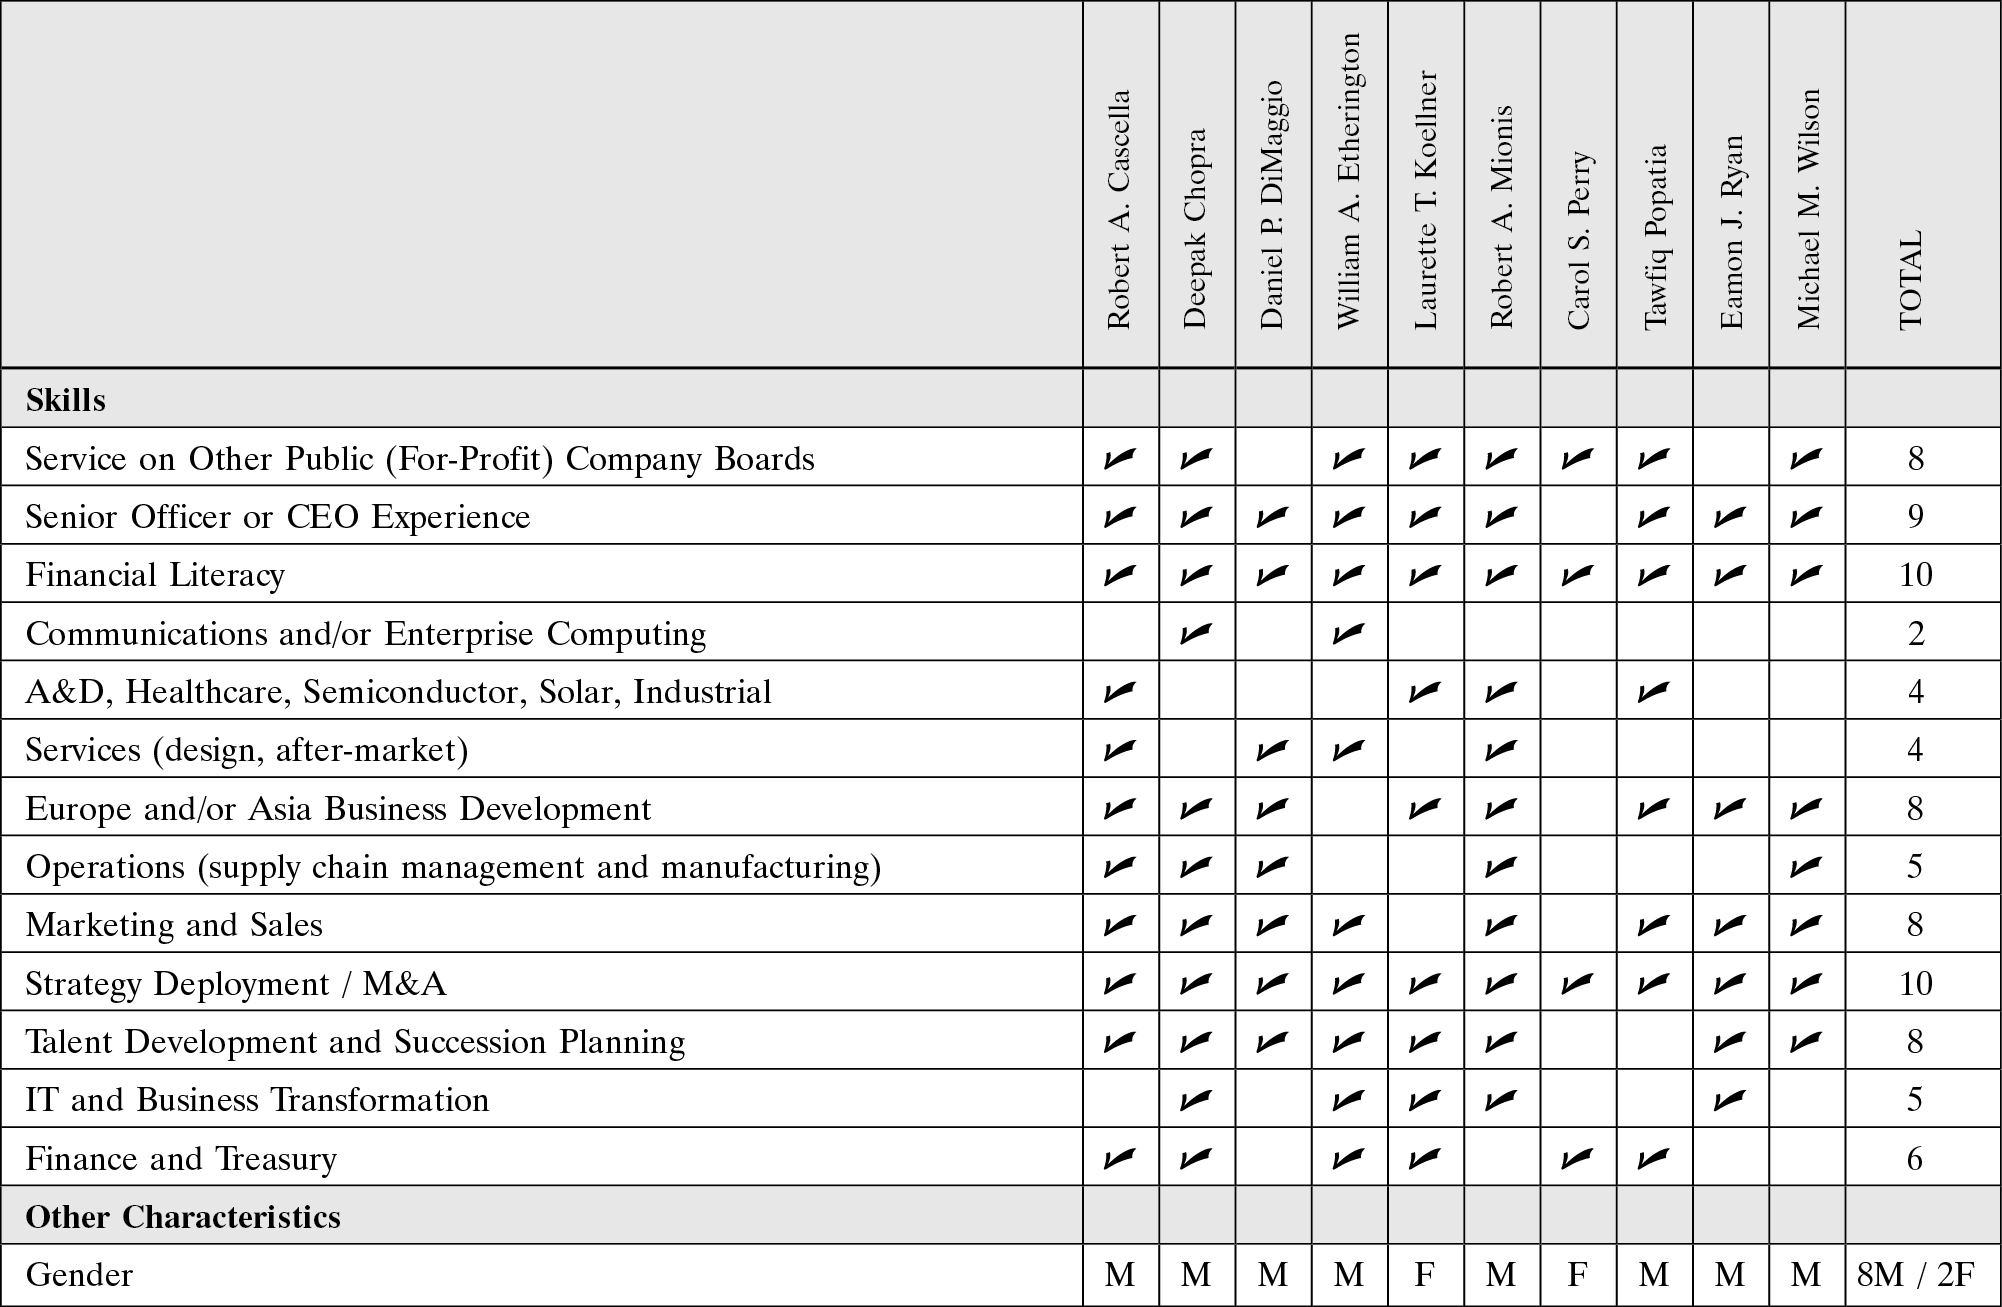
95
B. Compensation
Director Compensation
Director compensation is set by the Board on the recommendation of the Compensation Committee and in accordance with director compensation guidelines and principles established by the Nominating and Corporate Governance Committee. Under these guidelines and principles, the Board seeks to maintain director compensation at a level that is competitive with director compensation at comparable companies, and requires a substantial portion of such compensation to be taken in the form of DSUs. The director fee structure for 2018 is set forth in Table 1 below.
Table 1: Directors’ Fees
(1)
|
Element
|
Director Fee Structure
for 2018 (2) |
|
Annual Board Retainer
(3)
|
$360,000 – Board Chair
$235,000 – Directors
|
|
Travel Fees
(4)
|
$2,500
|
|
Annual Retainer for the Audit Committee Chair
|
$20,000
|
|
Annual Retainer for the Compensation Committee Chair
|
$15,000
|
|
Annual Retainer for the Nominating and Corporate Governance Committee Chair
(5)
|
–
|
|
DSU Election
(6)
|
Directors must elect to be paid either 100% or 75% of their aggregate annual retainers (including committee Chair retainers) and travel fees in the form of DSUs
|
|
(1)
|
Does not include Mr. Mionis, President and Chief Executive Officer (“CEO”) of the Corporation, whose compensation is set out in Table 15. Does not include fees payable to Onex for the service of Mr. Popatia as a director, which is described in footnote 7 to Table 2.
|
|
(2)
|
Directors may also receive further retainers and meeting fees for participation on
ad hoc
committees. No fees were paid for participation on the Director Search Committee (an
ad hoc
committee formed to identify potential new directors) during 2018. The Board has the discretion to grant supplemental equity awards to individual directors as deemed appropriate (no such discretion was exercised in 2018).
|
|
(3)
|
Paid on a quarterly basis.
|
|
(4)
|
The travel fee is available only to directors who travel outside of their home state or province to attend a Board or Committee meeting.
|
|
(5)
|
The Chair of the Board also served as the Chair of the Nominating and Corporate Governance Committee in 2018, for which no additional fee was paid.
|
|
(6)
|
Credited on a quarterly basis. The number of DSUs granted are calculated by dividing the notional cash amount for the quarter by the closing price of SVS on the NYSE on the last business day of such quarter. If no election is made, 100% of a director’s aggregate annual retainer and travel fees will be paid in DSUs.
|
Subject to the terms of the Directors’ Share Compensation Plan, each DSU represents the right to receive one SVS or an equivalent value in cash (at the Corporation’s discretion) when the director (a) ceases to be a director of the Corporation and (b) is not an employee of the Corporation or a director or employee of any corporation that does not deal at arm’s‑length with the Corporation (collectively, “Retires”). The date used in valuing the DSUs for settlement is the date that is 45 days following the date on which the director Retires, or as soon as practicable thereafter. DSUs are redeemed and payable on or prior to the 90
th
day following the date on which the director Retires. The number of DSUs granted is calculated by dividing the fee that would otherwise be payable by the closing price of SVS on the NYSE on the last business day of the quarter.
As part of the Compensation Committee’s 2018 competitive review of director compensation (the “2018 Review”), the Compensation Committee engaged Willis Towers Watson (the “Compensation Consultant”) to provide market information on director compensation policies and practices. The 2018 Review included a review of the mix of the elements of director compensation. As a result of the 2018 Review, amendments to director compensation and related changes to the Directors’ Share Compensation Plan were approved effective January 1, 2019 by the Compensation Committee and the Board. Specifically, directors who are paid for their service on the Board were previously required to elect to receive either 75% or 100% of their annual board fees, committee chair retainer fees and travel fees (collectively,
“Annual Fees”) in DSUs. Effective January 1, 2019, each such director may elect to receive 0%, 25% or 50% of their Annual Fees
in cash, with the balance in DSUs, until such director has
96
satisfied the requirements of the Director Share Ownership Guidelines described (and defined) under
Director Share Ownership Guidelines
below. Once a director has satisfied the requirements of the Director Share Ownership Guidelines, the director may then elect to receive 0%, 25% or 50% of their Annual Fees
in cash, with the balance in either DSUs or RSUs. If a director does not make an election
,
100% of such director’s Annual Fees will be paid in DSUs.
|
2019 Director Elections
|
||||
|
Prior to Satisfaction of Director Share Ownership Guidelines
|
After Satisfaction of Director
Share Ownership Guidelines |
|||
|
Option 1
|
Option 2
|
Option 1
|
Option 2
|
Option 3
|
|
100% DSUs
|
(i) 25% Cash + 75% DSUs
or
(ii) 50% Cash + 50% DSUs
|
(i) 100% DSUs
or
(ii) 100% RSUs
|
(i) 25% Cash + 75% DSUs
or
(ii) 50% Cash + 50% DSUs
|
(i) 25% Cash + 75% RSUs
or
(ii) 50% Cash + 50% RSUs
|
RSUs granted to directors will be governed by the terms of the Corporation’s Long-Term Incentive Plan (“LTIP”). Grants of RSUs will be credited quarterly in arrears. The number of RSUs to be granted to a director will be determined by multiplying the amount of such director’s Annual Fees for the quarter by the percentage of the Annual Fees that the director elected to receive in the form of RSUs and dividing the product by the closing price of the SVS on the NYSE on the last business day of the quarter. Each quarterly grant of RSUs will vest in installments of one-third per year on the first, second and third anniversary dates of the grant. Each vested RSU will entitle the holder thereof to one SVS. Unvested RSUs will vest immediately on the date that the director Retires. These changes were made in order to provide additional payment options for directors who have already met or exceeded the requirements of the Director Share Ownership Guidelines and to provide an option for greater liquidity to our long-serving Board members. See
Directors’ Ownership of Securities – Director Share Ownership Guidelines
.
Directors’ Fees Earned in 2018
All compensation paid in 2018 by the Corporation to its directors is set out in Table 2, except for the compensation of Mr. Mionis, President and CEO of the Corporation, which is set out in Table 15, and Mr. Cascella, who was appointed to the Board effective February 1, 2019. In 2018, the Board (excluding Mr. Popatia – see footnote 7 to Table 2) earned total Annual Fees in the amount of $1,776,250, including total grants of DSUs in the amount of $1,542,187.
Table 2: Director Fees Earned in Respect of 2018
|
Name
|
Annual Fees Earned
|
Allocation of Annual Fees
( 1)
|
||||
|
Annual Board
Retainer |
Annual Committee
Chair Retainer |
Travel Fees
|
Total Fees
|
DSUs
(2)
|
Cash
(3)
|
|
|
Deepak Chopra
(4)
|
$176,250
|
–
|
–
|
$176,250
|
$132,187
|
$44,063
|
|
Daniel P. DiMaggio
|
$235,000
|
–
|
$10,000
|
$245,000
|
$183,750
|
$61,250
|
|
William A. Etherington
(5)
|
$360,000
|
–
|
–
|
$360,000
|
$360,000
|
–
|
|
Laurette T. Koellner
|
$235,000
|
$20,000
(6)
|
$10,000
|
$265,000
|
$198,750
|
$66,250
|
|
Carol S. Perry
|
$235,000
|
–
|
–
|
$235,000
|
$235,000
|
–
|
|
Tawfiq Popatia
(7)
|
–
|
–
|
–
|
–
|
–
|
–
|
|
Eamon J. Ryan
|
$235,000
|
$15,000
(8)
|
–
|
$250,000
|
$187,500
|
$62,500
|
|
Michael M. Wilson
|
$235,000
|
–
|
$10,000
|
$245,000
|
$245,000
|
–
|
|
(1)
|
Directors were required to elect to receive either 75% or 100% of their 2018 Annual Fees (set forth in the “Total Fees” column above) in DSUs (i.e., at least 75% of such fees were payable in DSUs in 2018). The Annual Fees received by directors in DSUs for 2018 were credited quarterly, and the number of DSUs granted in respect of the amounts credited quarterly was determined using the closing price of the SVS on the NYSE on the last business day of each quarter, which was $10.35
on March 29, 2018, $11.87
on June 29, 2018, $10.83 on September 28, 2018 and $8.77 on December 31, 2018.
|
|
(2)
|
Amounts in this column for each of Messrs. Chopra, DiMaggio and Ryan and Ms. Koellner (who elected to receive 75% of their 2018 Annual Fees in DSUs), represent the grant date fair value of DSUs issued in respect of 75% of their 2018 Annual Fees. Amounts in this column for each of Messrs. Etherington and Wilson and Ms. Perry (who elected to receive 100% of their Annual Fees paid in DSUs), represent the grant date fair value of DSUs issued in respect of 100% of their 2018 Annual Fees. The grant date fair value of the grants is the same as their accounting value.
|
|
(3)
|
Amounts in this column for Messrs. Chopra, DiMaggio and Ryan and Ms. Koellner represent the portion of their 2018 Annual Fees (25%), which they elected to have paid in cash.
|
97
|
(4)
|
Mr. Chopra was elected to the Board of Directors effective April 27, 2018.
|
|
(5)
|
During 2018, Mr. Etherington was the Chair of the Board and the Chair of the Nominating and Corporate Governance Committee. Mr. Etherington received an annual Board Chair retainer fee in the amount of $360,000. He did not receive a committee chair annual retainer in his capacity as Chair of the Nominating and Corporate Governance Committee.
|
|
(6)
|
Represents the annual retainer for the Chair of the Audit Committee.
|
|
(7)
|
Mr. Popatia is an officer of Onex and did not receive any compensation in his capacity as a director of the Corporation in 2018; however, Onex received compensation for providing the services of Mr. Popatia as a director in 2018 pursuant to a Services Agreement between the Corporation and Onex, entered into on January 1, 2009 (as amended January 1, 2017, the “Services Agreement”). The Services Agreement automatically renews for successive one year terms unless the Corporation or Onex provide notice of intent not to renew. The Services Agreement terminates automatically and the rights of Onex to receive compensation (other than accrued and unpaid compensation) will terminate (a) 30 days after the first day on which Onex ceases to hold at least one MVS of Celestica or any successor company or (b) the date Mr. Popatia ceases to be a director of Celestica, for any reason. Onex receives compensation under the Services Agreement in an amount equal to $235,000 per year (consistent with current annual Board retainer fees), payable in DSUs in equal quarterly installments in arrears. The number of DSUs is determined using the closing price of the SVS on the NYSE on the last day of the fiscal quarter in respect of which the instalment is to be credited.
|
|
(8)
|
Represents the annual retainer for the Chair of the Compensation Committee.
|
Directors’ Ownership of Securities
Outstanding Share‑Based Awards
Information concerning all outstanding share‑based awards as of December 31, 2018 made by the Corporation to each director proposed for election at the Meeting (other than Mr. Mionis, whose information is set out in Table 16, and Mr. Cascella, who was appointed to the Board effective February 1, 2019), including awards granted prior to 2018, is set out in Table
3. Such awards consist solely of DSUs. DSUs that were granted prior to January 1, 2007 may be settled in the form of SVS issued from treasury, SVS purchased in the open market, or an equivalent value in cash (at the discretion of the Corporation). DSUs granted after January 1, 2007 may only be settled in SVS purchased in the open market or an equivalent value in cash (at the discretion of the Corporation). In 2005, the Corporation amended the LTIP to prohibit grants to directors of options to acquire SVS. There are no options granted to directors (or former directors) prior to the foregoing amendment that remain outstanding.
Table 3: Outstanding Share‑Based Awards
|
Name
|
Number of
Outstanding DSUs (1) (#) |
Market Value of
Outstanding DSUs (2) ($) |
|
Deepak Chopra
(3)
|
12,804
|
$112,291
|
|
Daniel P. DiMaggio
|
186,932
|
$1,639,394
|
|
William A. Etherington
|
419,552
|
$3,679,471
|
|
Laurette T. Koellner
|
212,688
|
$1,865,274
|
|
Carol S. Perry
|
123,702
|
$1,084,867
|
|
Tawfiq Popatia
(4)
|
–
|
–
|
|
Eamon J. Ryan
|
262,768
|
$2,304,475
|
|
Michael M. Wilson
|
190,013
|
$1,666,414
|
|
(1)
|
Represents all outstanding DSUs, including the regular quarterly grant of DSUs issued on January 1, 2019 in respect of the fourth quarter of 2018.
|
|
(2)
|
The market value of DSUs was determined using a share price of $8.77, which was the closing price of the SVS on the NYSE on December 31, 2018.
|
|
(3)
|
Mr. Chopra was elected to the Board of Directors effective April 27, 2018.
|
|
(4)
|
Mr. Popatia had no share-based awards from the Corporation outstanding as of December 31, 2018; however 219,139 DSUs have been issued to Onex (and are outstanding) pursuant to the Services Agreement since its inception, including 22,749 DSUs issued to Onex for the services of Mr. Popatia as a director of the Corporation in 2018. For further information see footnote 7 to Table 2.
|
98
Changes in Directors’ Equity Interest
The following table sets out, for each director proposed for election at the Meeting (other than Mr. Mionis, whose information is set out in Table 16), such director’s direct or indirect beneficial ownership of, or control or direction over, shares and share-based awards in the Corporation as of February 13, 2019, and any changes therein since February 14, 2018, the date of disclosure in the Corporation’s 2017 Annual Report on Form 20-F (the “2017 Annual Report”).
Table 4: Changes in Directors’ Equity Interest
(1)
|
Name
|
Date
|
SVS
(#) |
Share-Based Awards (DSUs)
(#)
|
Total
(#) |
|
Robert A. Cascella
(2)
|
Feb. 14, 2018
Feb. 13, 2019
Change
|
–
–
– |
N/A
N/A
N/A
|
–
–
– |
|
Deepak Chopra
(2)
|
Feb. 14, 2018
Feb. 13, 2019
Change
|
–
–
– |
–
12,804
12,804 |
–
12,804
12,804 |
|
Daniel P. DiMaggio
|
Feb. 14, 2018
Feb. 13, 2019
Change
|
–
–
– |
169,144
186,932
17,788
|
169,144
186,932
17,788
|
|
William A. Etherington
(3)
|
Feb. 14, 2018
Feb. 13, 2019
Change
|
10,000
10,000
–
|
384,702
419,552
34,850 |
394,702
429,552
34,850
|
|
Laurette T. Koellner
|
Feb. 14, 2018
Feb. 13, 2019
Change
|
–
–
– |
193,448
212,688
19,240
|
193,448
212,688
19,240
|
|
Carol S. Perry
|
Feb. 14, 2018
Feb. 13, 2019
Change
|
–
–
– |
100,953
123,702
22,749 |
100,953
123,702
22,749
|
|
Tawfiq Popatia
(3)(4)
|
Feb. 14, 2018
Feb. 13, 2019
Change
|
–
–
– |
–
–
– |
–
–
– |
|
Eamon J. Ryan
|
Feb. 14, 2018
Feb. 13, 2019
Change
|
–
–
– |
244,617
262,768
18,151 |
244,617
262,768
18,151
|
|
Michael M. Wilson
|
Feb. 14, 2018
Feb. 13, 2019
Change
|
–
–
– |
166,296
190,013
23,717 |
166,296
190,013
23,717
|
|
(1)
|
Information as to SVS beneficially owned, or controlled or directed, directly or indirectly, is not within the Corporation’s knowledge and therefore has been provided by each individual set forth in the table.
|
|
(2)
|
Mr. Cascella was appointed to the Board of Directors effective February 1, 2019. Mr. Chopra was elected to the Board of Directors effective April 27, 2018.
|
|
(3)
|
As of February 13, 2019, Mr. Etherington also owned 10,000 subordinate voting shares of Onex and Mr. Popatia owned 8,894 subordinate voting shares of Onex. Other than Messrs. Etherington and Popatia, no director of the Corporation during 2018 owned, and no current director nominee owns, shares of Onex.
|
|
(4)
|
22,749 DSUs were issued to Onex for the services of Mr. Popatia as a director of the Corporation in 2018. 219,139 DSUs have been issued to Onex (and are outstanding) pursuant to the Services Agreement since its inception. Onex’s beneficial ownership of securities of the Corporation (which does not include DSUs) is set forth in footnote 2 to the Major Shareholder’s Table in Item 7(A).
|
Director Share Ownership Guidelines
The Corporation has minimum shareholding requirements (the “Director Share Ownership Guidelines”) for directors who are not employees or officers of the Corporation or Onex (see
Executive Share Ownership
for share ownership guidelines applicable to Mr. Mionis in his role as President and CEO of the Corporation). Subject to the amendment described below, the Director Share Ownership Guidelines require that a director hold SVS and/or DSUs with an aggregate value equal to 150% of the annual retainer and that the Chair of the Board hold SVS and/or DSUs with an aggregate value equal to 187.5% of the annual retainer. Directors have five years from January 1, 2016 or from the time of their appointment to the Board, as applicable, to comply with the Director Share Ownership Guidelines. Effective January 1, 2019, directors may elect to receive 0%, 25% or 50% of their Annual Fees in
99
cash, with the balance in DSUs, until the director has satisfied the requirements of the Director Share Ownership Guidelines. Once a director has satisfied the requirements of the Director Share Ownership Guidelines, the director may then elect to receive the non-cash portion of their Annual Fees in either DSUs or RSUs. See
Director Compensation
above. As a result, the Director Share Ownership Guidelines were amended effective January 1, 2019 to include the value of any unvested RSUs held by a director in determining whether such director has maintained compliance with such guidelines after initial satisfaction. Although directors subject to the Director Share Ownership Guidelines will not be deemed to have breached such Guidelines by reason of a decrease in the market value of the Corporation’s securities, such directors are required to purchase further securities within a reasonable period of time after such occurrence to comply with the Director Share Ownership Guidelines. Each director’s holdings of securities are reviewed annually as of December 31. The following table sets out, for each applicable director proposed for election at the Meeting, whether such director was in compliance with the Director Share Ownership Guidelines as of December 31, 2018.
Table 5: Shareholding Requirements
|
Director
(1)
|
Shareholding Requirements
|
||
|
Target Value as of
December 31, 2018
|
Value as of
December 31, 2018 (2) |
Met Target as of
December 31, 2018 |
|
|
Deepak Chopra
(3)
|
$352,500
|
$112,291
|
Not yet applicable
|
|
Daniel P. DiMaggio
|
$352,500
|
$1,639,394
|
Yes
|
|
William A. Etherington
|
$675,000
|
$3,679,471
|
Yes
|
|
Laurette T. Koellner
|
$352,500
|
$1,865,274
|
Yes
|
|
Carol S. Perry
|
$352,500
|
$1,084,867
|
Yes
|
|
Eamon J. Ryan
|
$352,500
|
$2,304,475
|
Yes
|
|
Michael M. Wilson
|
$352,500
|
$1,666,414
|
Yes
|
|
(1)
|
As President and CEO of the Corporation, Mr. Mionis is subject to the Executive Share Ownership Guidelines. As an officer of Onex, Mr. Popatia is not subject to the Director Share Ownership Guidelines. Mr. Cascella will be required to comply with the Director Share Ownership Guidelines within five years of his appointment to the Board.
|
|
(2)
|
The value of the aggregate number of SVS and DSUs held by each director is determined using a share price of $8.77, which was the closing price of the SVS on the NYSE on December 31, 2018.
|
|
(3)
|
Mr. Chopra was elected to the Board of Directors effective April 27, 2018 and he is required to comply with the Director Share Ownership Guidelines within five years of his election.
|
Attendance of Directors at Board and Committee Meetings
The following table sets forth the attendance of directors at Board meetings and at meetings of those standing committees of which they are members, from January 1, 2018 to February 13, 2019. All then-members of the Board attended the Corporation’s last annual meeting of shareholders.
Table 6: Directors’ Attendance at Board and Committee Meetings
|
Meetings Attended %
|
||||||
|
Director
|
Board
|
Audit
|
Compensation
|
Nominating and Corporate Governance
|
Board
|
Committee
|
|
Robert A. Cascella
(1)
|
–
|
1 of 1
|
–
|
–
|
–
|
100%
|
|
Deepak Chopra
(1)
|
5 of 5
|
4 of 4
|
4 of 4
|
2 of 2
|
100%
|
100%
|
|
Daniel P. DiMaggio
|
10 of 10
|
6 of 7
|
6 of 6
|
4 of 4
|
100%
|
94%
|
|
William A. Etherington
|
10 of 10
|
7 of 7
|
6 of 6
|
4 of 4
|
100%
|
100%
|
|
Laurette T. Koellner
|
10 of 10
|
7 of 7
|
6 of 6
|
4 of 4
|
100%
|
100%
|
|
Robert A. Mionis
|
10 of 10
|
–
|
–
|
–
|
100%
|
–
|
|
Carol S. Perry
|
10 of 10
|
7 of 7
|
6 of 6
|
4 of 4
|
100%
|
100%
|
|
Tawfiq Popatia
|
10 of 10
|
–
|
–
|
–
|
100%
|
–
|
|
Eamon J. Ryan
|
10 of 10
|
7 of 7
|
6 of 6
|
4 of 4
|
100%
|
100%
|
|
Michael M. Wilson
|
10 of 10
|
6 of 7
|
6 of 6
|
4 of 4
|
100%
|
94%
|
|
(1)
|
Mr. Cascella was appointed to the Board of Directors effective February 1, 2019. Mr. Chopra was elected to the Board of Directors effective April 27, 2018.
|
100
COMPENSATION DISCUSSION AND ANALYSIS
This Compensation Discussion and Analysis sets out the policies of the Corporation for determining compensation paid to the Corporation’s CEO, its Chief Financial Officer (“CFO”), and the three other most highly compensated executive officers (collectively, the “Named Executive Officers” or “NEOs”). The NEOs who are the subject of this Compensation Discussion and Analysis are:
• Robert A. Mionis – President and CEO;
• Mandeep Chawla – CFO;
|
•
|
Michael P. McCaughey – President, CCS (effective January 1, 2019, Mr. McCaughey’s title was changed to Advisor);
|
|
•
|
John “Jack” J. Lawless – President, ATS; and
|
• Todd C. Cooper – Chief Operations Officer.
A description and explanation of the significant elements of compensation awarded to the foregoing NEOs during 2018 is set out in the section
Compensation Discussion and Analysis – 2018 Compensation Decisions
.
Note Regarding Non-IFRS Measures
This Compensation Discussion and Analysis contains references to operating margin, adjusted return on invested capital (“adjusted ROIC”), and adjusted earnings per share (“EPS”), each of which are non-International Financial Reporting Standards (“IFRS”) measures. With respect to all references to these measures, please note the following:
|
•
|
Non-IFRS operating margin is defined as non-IFRS operating earnings divided by revenue. Non-IFRS operating earnings is defined as earnings before income taxes, finance costs (consisting of interest and fees relating to the Corporation’s credit facility, accounts receivable sales program and a customer’s supplier financing program), amortization of intangible assets (excluding computer software), and in applicable periods, employee stock based compensation expense, net restructuring and other charges (recoveries) (consisting of restructuring charges (recoveries), acquisition-related consulting, transaction, and integration costs, legal settlements (recoveries), Toronto transition costs (recoveries), and the accelerated amortization of unamortized deferred financing costs), impairment charges (recoveries), charges relating to the Corporation’s solar panel manufacturing business (“Solar Charges”) and acquisition inventory fair value adjustments (“FVAs”).
|
|
•
|
Adjusted ROIC is determined by dividing non-IFRS operating earnings by average net invested capital, where net invested capital consists of the following IFRS measures: total assets less cash, accounts payable, accrued and other current liabilities and provisions, and income taxes payable, using a five-point average to calculate average net invested capital for the year.
|
|
•
|
Adjusted EPS is determined by dividing non-IFRS adjusted net earnings by the weighted average number of diluted shares for the applicable period. Non-IFRS adjusted net earnings is defined as net earnings before amortization of intangible assets (excluding computer software), and in applicable periods, employee stock based compensation expense, net restructuring and other charges (recoveries) (as defined above), impairment charges (recoveries), Solar Charges, FVAs, the tax impact of the foregoing items, and non-core tax impacts (tax adjustments related to acquisitions, and certain other tax costs or recoveries related to restructuring actions or restructured sites).
|
See “Non-IFRS measures” in the Corporation’s Management’s Discussion and Analysis for the first three quarters of 2018 (available at
www.sec.gov
) and in Item 5 of this Annual Report for, among other things, a discussion of the exclusions used to determine these non-IFRS measures, how these non-IFRS measures are used, as well as a reconciliation of historical non-IFRS operating margin, non-IFRS adjusted ROIC, and non-IFRS adjusted EPS to the most directly comparable IFRS measures. These non-IFRS measures do not have any standardized meanings prescribed by IFRS and therefore may not be comparable to similar measures presented by other companies.
101
Compensation Objectives
The Corporation’s executive compensation philosophies and practices are designed to attract, motivate and retain the leaders who drive the success of the Corporation. The Compensation Committee reviews compensation policies and practices regularly, considers related risks, and makes any adjustments it deems necessary to ensure the compensation policies are not reasonably likely to have a material adverse effect on the Corporation.
A substantial portion of the compensation of our executives is linked to the Corporation’s performance. The Compensation Committee establishes target compensation with reference to the median compensation of a comparator group of Celestica’s competitors, major suppliers, customers, and other major international technology companies that generally fall in the range of 50% to 200% of Celestica’s revenue (such group, the “Comparator Group”). However, neither each element of compensation nor total compensation is expected to match the median of such Comparator Group exactly. NEOs have the opportunity for higher compensation for performance that exceeds target performance goals, and will receive lower compensation for performance that is below target performance goals.
The 2018 compensation package was designed to:
|
•
|
ensure executives are compensated fairly and in a way that does not result in the Corporation incurring undue risk or encouraging executives to take inappropriate risks;
|
|
•
|
provide competitive fixed compensation (
i.e.
, base salary and benefits), as well as a substantial amount of at-risk pay through our annual and equity‑based incentive plans;
|
|
•
|
reward executives, through both annual cash incentives and long-term equity‑based incentives, for achieving operational and financial results that meet or exceed the Corporation’s business plan and that are superior to those of direct competitors in the electronics manufacturing services (“EMS”) industry;
|
|
•
|
align the interests of executives and shareholders through long-term equity‑based compensation;
|
|
•
|
recognize tenure and utilize a multi-year approach for setting and transitioning target compensation for executives who are new in their role;
|
|
•
|
reflect internal equity, recognize fair and appropriate compensation levels relative to differing roles and responsibilities, and encourage executives to work as a team to achieve corporate results; and
|
|
•
|
ensure direct accountability for the annual operating results and the long-term financial performance of the Corporation.
|
Independent Advice
The Compensation Committee, which has the sole authority to retain and terminate an executive compensation consultant, has engaged the Compensation Consultant since October 2006 as its independent compensation consultant to assist in identifying appropriate comparator companies against which to evaluate the Corporation’s compensation levels, to provide data about those companies, and to provide observations and advice with respect to the Corporation’s compensation practices versus those of the Comparator Group and the market in general.
The Compensation Consultant also provides advice (upon request) to the Compensation Committee on the policy recommendations prepared by management and keeps the Compensation Committee apprised of market trends in executive compensation. The Compensation Consultant attended portions of all Compensation Committee meetings held in 2018, in person or by telephone, as requested by the Chair of the Compensation Committee. At each of its meetings, the Compensation Committee held an
in camera
session with the Compensation Consultant without any member of management being present. Decisions made by the Compensation Committee, however, are the responsibility of the Compensation Committee and may reflect factors and considerations supplementary to the information and advice provided by the Compensation Consultant.
Each year, the Compensation Committee reviews the scope of activities of the Compensation Consultant and, if it deems appropriate, approves the corresponding budget. During such review, the Compensation Committee also considers the independence
102
factors required to be considered by the NYSE prior to the selection or receipt of advice from a compensation consultant. After consideration of such independence factors and prior to engaging the Compensation Consultant in 2018, the Compensation Committee determined that the Compensation Consultant was independent. The Compensation Consultant meets with the Chair of the Compensation Committee and management at least annually to identify any initiatives requiring external support and agenda items for each Compensation Committee meeting throughout the year. The Compensation Consultant reports directly to the Chair of the Compensation Committee and is not engaged by management. The Compensation Consultant may, with the approval of the Compensation Committee, assist management in reviewing and, where appropriate, developing and recommending compensation programs to align the Corporation’s practices with competitive practices. Any such service in excess of $25,000 provided by the Compensation Consultant relating to executive compensation must be pre‑approved by the Chair of the Compensation Committee. In addition, any non-executive compensation consulting service in excess of $25,000 must be submitted by management to the Compensation Committee for pre-approval, and any services that will cause total non‑executive compensation consulting fees to exceed $25,000 in aggregate in a calendar year must also be pre‑approved by the Compensation Committee.
The following table sets out the fees paid by the Corporation to the Compensation Consultant in each of the past two years:
Table 7: Fees of the Compensation Consultant
|
Year Ended
December 31 |
||
|
2018
|
2017
|
|
|
Executive Compensation-Related Fees
(1)
|
C$328,828
|
C$246,859
|
|
All Other Fees
|
C$
–
|
C$
–
|
|
(1)
|
Services for 2018 and 2017 included support on executive compensation matters that are part of its annual agenda (
e.g.
, executive compensation competitive market analysis, review of trends in executive compensation, peer group review, pay-for-performance analysis and assistance with executive compensation-related disclosure), annual valuation of PSUs for accounting purposes, TSR peer group analysis, attendance at all Compensation Committee meetings, and support with ad-hoc executive compensation issues that arose throughout the year. Services for 2018 also included a compensation risk assessment and the 2018 Review of director compensation. Services for 2017 also included advice on incentive plan design changes and research and commentary on strategic incentive awards.
|
Compensation Process
Executive compensation is determined as part of an annual process followed by the Compensation Committee, as supported by the Compensation Consultant, as follows:
|
Before/At Commencement of the Performance Period
|
During the Performance Period
|
After the Performance Period
|
||
|
• Review and approve Comparator Group
• Review of Comparator Group compensation and pay positioning
• Establish target compensation levels
• Review trends in executive compensation
• Establish performance objectives
• Conduct risk assessment of compensation programs
|
• Review of pay-for-performance alignment relative to Comparator Group
• Evaluate interim performance relative to objectives
• Approve appointments to designated positions and any related compensation changes
• Reevaluate Comparator Group and update for the next performance period
• Review management succession plans, including retention value of unvested equity awards
|
• Evaluate individual performance relative to objectives
• Determine achievement of performance criteria for annual and long term incentives
|
||
The Compensation Committee reviews and approves compensation for the CEO and the other NEOs, including base salaries, target annual incentive awards under the CTI and equity‑based incentive grants. The Compensation Committee evaluates the performance of the CEO relative to financial and business goals and objectives approved by the Board from time to time for such purpose. The Compensation Committee reviews data for the Comparator Group and other competitive market data, and consults
103
with the Compensation Consultant before exercising its independent judgment to determine appropriate compensation levels. The CEO reviews the performance evaluations of the other NEOs with the Compensation Committee and provides compensation recommendations. The Compensation Committee considers these recommendations, reviews market compensation information, consults with the Compensation Consultant, and then exercises its independent judgment to determine if any adjustments are required prior to approval of the compensation of such other NEOs.
The Compensation Committee generally meets five times a year, in January, April, July, October and December. At the July meeting, the Compensation Committee, based on recommendations from the Compensation Consultant, approves the Comparator Group that will be used for the compensation review for the following year. At the October meeting, the Compensation Consultant presents a competitive analysis of the total compensation for each of the NEOs, including the CEO, with reference to the established Comparator Group as well as other competitive market data. Using this analysis, the CEO develops base salary and equity‑based incentive recommendations for the NEOs which are then reviewed with the Compensation Consultant. The CEO’s compensation is determined by the Compensation Committee in consultation with the Compensation Consultant with input from the Corporation’s chief human resources executive. At the December meeting, preliminary compensation proposals for the CEO and the NEOs for the following year are reviewed, including base salary recommendations and the value and mix of their equity‑based incentives. By reviewing the compensation proposals in advance, the Compensation Committee is afforded sufficient time to discuss and provide input regarding proposed compensation changes prior to the January meeting at which time the Compensation Committee approves the compensation proposals, revised as necessary or appropriate, based on input provided at the December meeting. Previous grants of equity‑based awards and their current retention value are reviewed and may be taken into consideration when making decisions related to equity‑based compensation. The Compensation Committee also considers the potential value of the total compensation package for the CEO, which is stress-tested at different levels of performance and different stock prices to ensure that there is an appropriate link between pay and performance, taking into consideration the range of potential total compensation. The CEO and the NEOs are not present at the Compensation Committee meetings when their respective compensation is discussed.
Based on a management plan approved by the Board, CTI targets for the relevant year are approved by the Compensation Committee at the beginning of the year. The Compensation Committee reviews the Corporation’s performance relative to these targets and the projected payment at the October and December meetings. At the January meeting of the following year, final payments under the CTI, as well as the vesting percentages for any previously granted equity‑based incentives that have performance vesting criteria, are calculated and approved by the Compensation Committee based on the Corporation’s year-end results as approved by the Audit Committee. The amounts related to the CTI are then paid in February.
The Compensation Committee may exercise its discretion to either award compensation absent attainment of a relevant performance goal or similar condition, or to reduce or increase the size of any award or payout to any NEO. The Compensation Committee did not exercise such discretion for 2018 compensation with respect to any NEO.
Compensation Risk Assessment and Governance Analysis
The Compensation Committee, in performing its duties and exercising its powers under its mandate, considers the implications of the risks associated with the Corporation’s compensation policies and practices. This includes: identifying any such policies or practices that encourage executive officers to take inappropriate or excessive risks, identifying risks arising from such policies and practices that are reasonably likely to have a material adverse effect on the Corporation, and considering the risk implications of the Corporation’s compensation policies and practices and any proposed changes to them.
The Corporation’s compensation programs are designed with a balanced approach aligned with its business strategy and risk profile. A number of compensation practices have been implemented to mitigate potential compensation policy risk.
The
Compensation Consultant completed a risk assessment in 2018. It is the Compensation Committee’s view that the Corporation’s 2018 compensation policies and practices did not promote excessive risk-taking that would be reasonably likely to have a material adverse effect on the Corporation, and that appropriate risk mitigation features are in place within the Corporation’s compensation program. In reaching its opinion, the Compensation Committee reviewed key risk-mitigating features in the Corporation’s compensation governance processes and compensation structure including the following:
104
|
Governance
|
|
|
Compensation Decision-Making Process
|
• The Corporation has formalized compensation objectives to help guide compensation decisions and incentive design and to effectively support its pay-for-performance policy (see Compensation Discussion and Analysis – Compensation Objectives).
|
|
Non-binding Shareholder Advisory Vote on Executive Compensation
|
• The Corporation annually holds an advisory vote on executive compensation, allowing shareholders to express approval or disapproval of its approach to executive compensation.
|
|
Annual Review of
Incentive Programs
|
• Each year, the Corporation reviews and sets performance measures and targets for the CTI and for PSU grants under the Celestica Share Unit Plan (“CSUP”) and the LTIP that are aligned with the business plan and the Corporation’s risk profile to ensure continued relevance and applicability.
• When new compensation programs are considered, they are stress‑tested to ensure potential payouts would be reasonable within the context of the full range of performance outcomes. CEO compensation is stress‑tested annually.
|
|
External Independent Compensation Advisor
|
• On an ongoing basis, the Compensation Committee retains the services of an independent compensation advisor, to provide an external perspective as to marketplace changes and best practices related to compensation design, governance and compensation risk management.
|
|
Overlapping
Committee Membership
|
• All of the Corporation’s independent directors sit on the Compensation Committee to provide continuity and to facilitate coordination between the Committee’s and the Board’s respective oversight responsibilities.
|
|
Compensation Program Design
|
|
|
Review of
Incentive Programs
|
• At appropriate intervals, Celestica conducts a review of its compensation strategy, including pay philosophy and program design, in light of business requirements, market practice and governance considerations.
|
|
Fixed versus Variable Compensation
|
• For the NEOs, a significant portion of target total direct compensation is delivered through variable compensation (CTI and long‑term, equity‑based incentive plans).
• The majority of the value of target variable compensation is delivered through grants under long‑term, equity‑based incentive plans which are subject to time and/or performance vesting requirements.
• The mix of variable compensation provides a strong pay-for-performance relationship.
• The NEO compensation package provides a competitive base level of compensation through salary, and mitigates the risk of encouraging the achievement of short‑term goals at the expense of creating and sustaining long‑term shareholder value, as NEOs benefit if shareholder value increases over the long‑term.
|
|
“One-company”
Annual Incentive Plan
|
• Celestica’s “one-company” annual incentive plan (the CTI) helps to mitigate risk-taking by tempering the results of any one business unit on Celestica’s overall corporate performance, and aligning executives and employees in the various business units and regions with corporate goals.
|
|
Balance of Financial Performance Metrics
as well as Absolute and Relative Performance Metrics
|
• The CTI ensures a holistic assessment of performance with ultimate payout tied to measurable corporate financial metrics.
• Individual performance is assessed based on business results, teamwork and key accomplishments, and market performance is captured through RSUs as well as PSUs (which vest based on performance relative to both absolute and relative financial targets).
|
|
Minimum Performance Requirements and Maximum Payout Caps
|
• For 2018, a specified corporate profitability requirement was established for any payout to occur under the CTI.
• Additionally, a second performance measure must be achieved for payment above target.
• Each of the CTI and PSU payouts have a maximum payout of two times target.
|
|
Share Ownership Requirement
|
• The Corporation’s share ownership guidelines require executives to hold a significant minimum amount of the Corporation’s securities to help align their interests with those of shareholders’ and the long‑term performance of the Corporation.
• This practice also mitigates against executives taking inappropriate or excessive risks to improve short‑term performance at the expense of longer-term objectives.
• In the event of the cessation of Mr. Mionis’ employment with the Corporation for any reason, he will be required to retain the share ownership level set out in the Executive Share Ownership Guidelines on his termination date for the 12 month period immediately following his termination date as set out in Mr. Mionis’ amended CEO employment agreement effective August 1, 2016 (the “CEO Employment Agreement”).
|
105
|
Anti-hedging and
Anti-pledging Policy
|
• Executives and directors are prohibited from entering into speculative transactions and transactions designed to hedge or offset a decrease in market value of equity securities of the Corporation granted as compensation or purchasing securities of the Corporation on margin, borrowing against securities of the Corporation held in a margin account, or pledging Celestica securities as collateral for a loan.
|
|
“Clawback” Policy
|
• A “clawback” policy provides for recoupment of incentive-based compensation from the CEO and CFO that was received during a specified period in the event of an accounting restatement due to material non‑compliance with financial reporting requirements as a result of misconduct, as well as any profits realized from the sale of securities during such period (see – “
Clawback” Provisions
).
• In addition, all longer‑term incentive awards made to NEOs may be subject to recoupment if certain employment conditions are breached.
|
|
“Double Trigger”
|
• The LTIP and CSUP currently provide for change of control treatment for outstanding equity based on a “double trigger” requirement.
|
|
Severance Protection
|
• NEOs’ entitlements on termination without cause are in part contingent on complying with confidentiality, non‑solicitation and non‑competition obligations (two years).
|
|
Pay-For-Performance Analysis
|
• Periodic scenario testing of the executive compensation programs is conducted, including a pay-for-performance analysis.
|
Comparator Group
The Compensation Committee establishes salary, annual incentive and equity‑based incentive awards with reference to the median of such elements for the Comparator Group, but is not bound to any target percentile for any element of compensation of the Comparator Group. The Comparator Group is comprised of a selection of the Corporation’s competitors, major suppliers, customers, and other international technology companies that generally fall in the range of 50% to 200% of the Corporation’s revenues and is approved annually by the Compensation Committee. The Compensation Committee also considers the Corporation’s business objectives and its participation in global markets when approving the Comparator Group. While the Corporation is incorporated and headquartered in Canada, our business is global and we compete for executive talent worldwide with companies in the technology industry. Our global recruiting strategy has been evidenced by the fact that several of our executive officers were not recruited from Canada; and in fact, the Corporation’s three most recent CEOs have come from the United States. There are no EMS competitor companies in the Comparator Group that are headquartered in Canada. For non-EMS companies, competitors of similar size and scope within Canada would not provide the desired global perspective. As a result, the determination of the Comparator Group is not bound by geographic limitations and instead includes a representation from a broad group of relevant companies which are publicly traded and against which the Corporation competes for executive leaders. Most of the companies in the current Comparator Group are based in the United States. The Comparator Group chosen in 2017 was used to establish 2018 executive compensation. In 2018, Level 3 Communications was acquired by another company and was subsequently removed from the Comparator Group. Applied Materials Inc. was also removed from the Comparator Group since its revenue was outside of an acceptable range for comparison. The Comparator Group chosen in 2018 to establish 2019 executive compensation was reviewed and approved by the Compensation Committee, and is set out in Table 8 below.
106
Table 8: Comparator Group
(1)
|
Industry
Company Name |
2017 Annual Revenue
(billions) |
Industry
Company Name |
2017 Annual Revenue
(billions) |
Industry
Company Name |
2017 Annual Revenue
(billions) |
|
Electronic Manufacturing Services
|
Communications
|
Technology Hardware, Storage, Peripherals
|
|||
|
Flex Ltd.
|
$23.9
|
Harris Corp.
|
$5.9
|
NCR Corp.
|
$6.5
|
|
Jabil Circuit, Inc.
|
$19.1
|
Juniper Networks, Inc.
|
$5.0
|
NetApp, Inc.
|
$5.5
|
|
Sanmina Corporation
|
$6.9
|
Motorola Solutions
|
$6.4
|
||
|
Benchmark
|
$2.5
|
ARRIS International
|
$6.6
|
||
|
Plexus Corp.
|
$2.5
|
||||
|
Electronic Components
|
Diversified Markets
|
Semiconductor
|
|||
|
Corning Inc.
|
$10.1
|
Agilent Technologies Inc.
|
$4.5
|
Advanced Micro Devices Inc.
|
$5.3
|
|
Amphenol Corporation
|
$7.0
|
Lam Research
|
$8.0
|
||
|
NVIDIA Corp.
|
$6.9
|
||||
|
Overall
|
|||||
|
25th Percentile
|
$5.3
|
||||
|
50th Percentile
|
$6.5
|
||||
|
75th Percentile
|
$7.0
|
||||
|
Celestica Inc.
|
$6.1
|
||||
|
Percentile
|
40
th
percentile
|
||||
|
(1)
|
All data was provided by the Compensation Consultant (sourced by it from Standard & Poor’s Capital IQ), reflecting fiscal year 2017 revenue for each company, and is presented in U.S. dollars.
|
Additionally, broader market compensation survey data for other similarly‑sized organizations as well as Canadian market data provided by the Compensation Consultant is analyzed in accordance with a process approved by the Compensation Committee. The Compensation Committee considered such survey data, among other matters, in making compensation decisions. In addition to the survey data, proxy disclosure of the Comparator Group companies for the most recently completed fiscal year was considered when determining the compensation of the CEO and the other NEOs.
Anti-Hedging and Anti-Pledging Policy
The Insider Trading Policy prohibits executives from, among other things, entering into speculative transactions and transactions designed to hedge or offset a decrease in market value of equity securities of the Corporation granted as compensation. Accordingly, executive officers may not sell short the Corporation’s securities, buy or sell put or call options on the Corporation’s securities, or purchase financial instruments (including prepaid variable contracts, equity swaps, collars or units of exchange funds) which are designed to hedge or offset a decrease in market value of the Corporation’s securities. Executive officers are also prohibited from purchasing the Corporation’s securities on margin, borrowing against the Corporation’s securities held in a margin account, or pledging the Corporation’s securities as collateral for a loan. The directors of the Corporation also must comply with the provisions of the Insider Trading policy which prohibit hedging and/or pledging of the Corporation’s securities
.
“Clawback” Provisions
The Corporation is subject to the “clawback” provisions of the Sarbanes‑Oxley Act of 2002. Accordingly, if the Corporation is required to restate financial results due to material non‑compliance with financial reporting requirements as a result of misconduct, the CEO and CFO would be required to reimburse the Corporation for any bonuses or incentive‑based compensation they had received during the 12‑month period following the first public issuance or filing with the SEC (whichever is earlier) of a financial document embodying such financial reporting requirement, as well as any profits they had realized from the sale of securities of the Corporation during that 12-month period.
In addition, under the terms of the stock option grants and the PSU and RSU grants made under the LTIP and the CSUP, a NEO may be required by the Corporation to repay an amount equal to the market value of the shares (or in the case of options, the intrinsic value realized by the executive) at the time of release, net of taxes, if, within 12 months of the release date, the executive:
107
|
•
|
accepts employment with, or accepts an engagement to supply services, directly or indirectly to, a third party that is in competition with the Corporation or any of its subsidiaries; or
|
|
•
|
fails to comply with, or otherwise breaches, the terms and conditions of a confidentiality agreement or non‑disclosure agreement with, or confidentiality obligations to, the Corporation or any of its subsidiaries; or
|
|
•
|
on his or her behalf or on another’s behalf, directly or indirectly recruits, induces or solicits, or attempts to recruit, induce or solicit any current employee or other individual who is/was supplying services to the Corporation or any of its subsidiaries.
|
Executives who are terminated for cause also forfeit all unvested RSUs, PSUs and stock options as well as all vested and unexercised stock options.
Compensation Elements for the Named Executive Officers
The compensation of the NEOs in 2018 was comprised of the following elements:
|
Elements
|
Rationale
|
|
Base Salary
|
Provides a fixed level of compensation intended to reflect the scope of an executive’s responsibilities and level of experience and to reward sustained performance over time, as well as to approximate competitive base salary levels
|
|
Annual Cash Incentives
|
Aligns executive performance with the Corporation’s annual goals and objectives
|
|
Equity-Based Incentives
|
|
|
• RSUs
• PSUs |
Provides a strong incentive for long-term executive retention
Aligns executives’ interests with shareholder interests and provides incentives for long-term performance |
|
Benefits
|
Designed to help ensure the health and wellness of executives
|
|
Pension
|
Designed to assist executives in saving for their retirement
|
|
Perquisites
|
Perquisites are provided to executives on a case-by-case basis as considered appropriate and in the interests of the Corporation
|
Compensation Element Mix
In order to ensure that our executive compensation program is market competitive, we annually review the program design and pay levels of companies in the Comparator Group and other competitive market data. We assess total target direct compensation (base salary, annual cash incentive and equity grants) as well as specific elements of compensation when reviewing market information relative to our executive compensation program. The Compensation Committee uses the median of the Comparator Group as a guideline when determining total target direct compensation but is not bound to any target percentile for any specific element of compensation. In addition to the Comparator Group, we also consider executive compensation relative to internal peers where responsibilities and experience vary. In determining appropriate positioning relative to the Comparator Group and internal peers, we utilize a multi-year approach for setting and transitioning target compensation for executives who are new in their role.
The at‑risk portion of total compensation varies by role and executive level, but has the highest weighting at the most senior levels of management. CTI awards and certain equity‑based incentive plan awards are contingent upon the Corporation’s financial and operational performance and are therefore at-risk. With a significant portion of total target direct compensation delivered through variable compensation, the Corporation intends to continue to align NEO compensation with shareholder interests. The relative weighting of the compensation elements for the CEO and the other NEOs (average) for 2018 is set forth below.
108
|
Compensation Element Mix for CEO
|
Compensation Element Mix for NEOs (Average)
|
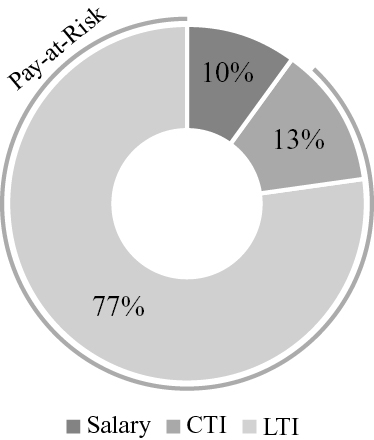
|
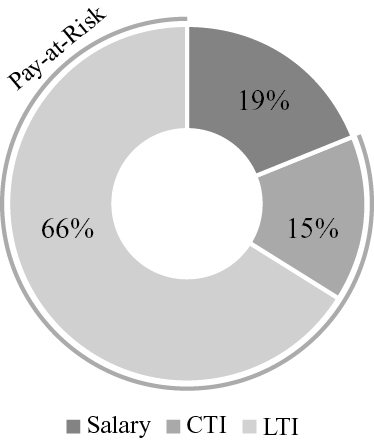
|
Base Salary
The objective of base salary is to attract, reward and retain top talent. Base salaries for executive positions are determined with consideration given to the market median of the Comparator Group. Base salaries are reviewed annually and adjusted if appropriate, to reflect individual performance, relevant knowledge, experience and the executive’s level of responsibility within the Corporation.
Celestica Team Incentive Plan
The objective of the CTI is to reward all eligible employees, including the NEOs, for the achievement of annual objectives. CTI awards for the NEOs are based on the achievement of pre‑determined corporate and individual goals, and are paid in cash. Payouts can vary from 0% for performance below a threshold up to a maximum capped at 200% of the Target Award (defined below). Awards are determined in accordance with the following formula:
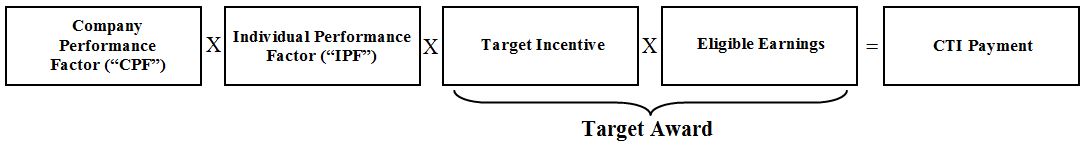
109
|
Target Award
|
The target award is calculated as each NEO’s Eligible Earnings (
i.e.
, base salary) multiplied by the Target Incentive (expressed as a percentage of base salary in the applicable plan year) (the “Target Award”). The maximum CTI payment is two times the Target Award.
|
|
CPF
|
The CPF is based on certain corporate financial targets (described for 2018 in more detail in Table 10 below) established at the beginning of the performance period and approved by the Compensation Committee and can vary from 0% to 200% of target.
Actual results relative to the targets, as described above, determine the amount of the annual incentive and for 2018, were subject to the following two parameters (the “CTI Parameters”):
(1) a minimum corporate profitability requirement must be achieved for the CPF to exceed zero; and
(2) target non-IFRS operating margin must be achieved for other measures under the CPF to pay above target.
The CTI Parameters were set in addition to the CPF thresholds in order to ensure challenging limits reflective of our current business environment.
The CPF must be greater than zero for an executive to be entitled to any CTI payment.
|
|
IPF
|
Individual contribution is recognized through the IPF component of the CTI. The IPF is determined through the annual performance review process and is based on an evaluation of the NEO’s performance measured against specific criteria established at the beginning of each year. The criteria may include factors such as the NEO’s individual performance relative to business results, teamwork and the executive’s key accomplishments. The IPF can increase an NEO’s CTI award by a factor of up to 1.5x or reduce an NEO’s CTI award to zero depending on individual performance. An IPF of less than 1.0 will result in a reduction of the CTI award otherwise payable. The CTI payment is subject to an overall maximum cap of 200% of the Target Award.
|
Equity‑Based Incentives
The Corporation’s equity‑based incentives for the NEOs consist of RSUs, PSUs and/or stock options. The objectives of equity‑based compensation are to:
|
•
|
align the NEOs’ interests with those of shareholders and incent appropriate behaviour for long‑term performance;
|
|
•
|
reward the NEOs’ contributions to the Corporation’s long‑term success; and
|
|
•
|
enable the Corporation to attract, motivate and retain qualified and experienced employees.
|
At the January meeting, the Compensation Committee determines the dollar value and mix of the equity‑based grants to be awarded to the NEOs, if any. On the grant date, the dollar value is converted into the number of units that will be granted using the closing price of the SVS on the day prior to the grant date. The annual grants are made following the blackout period that ends not less than 48 hours after the Corporation’s year‑end results have been released. The mix of equity-based incentives is reviewed and approved by the Compensation Committee each year, and is based on factors including competitive grant practices, balance between performance incentive and retention value, and the effectiveness of each equity vehicle for motivating and retaining critical leaders.
Target equity‑based incentives are determined using the median awards of the Comparator Group as a guideline; however, consideration is also given to individual performance and contribution when determining actual awards. In establishing the grant value of the annual equity awards for each of the NEOs, we start by assessing the median total target direct compensation of the equivalent position at companies in the Comparator Group. This data is then compared over a number of years for additional context and market trends. The Compensation Committee also considers individual performance, the need to retain experienced and talented leaders to execute the Corporation’s business strategies and the executive’s potential to contribute to long-term shareholder value. Also considered are the executive’s role and responsibilities, internal equity and the level of previous long-term incentive awards. Once all of these factors are taken into consideration, the grant value of the annual equity-based awards for the NEOs is set.
The CEO has the discretion to issue equity‑based awards throughout the year to attract new hires and to retain current employees (excluding executive officers) within limits set by the Compensation Committee. The number of units available throughout the year for these grants is pre‑approved by the Compensation Committee at the January meeting. Subject to the Corporation’s blackout periods, these grants typically take place at the beginning of a month. Any such grants to NEOs must be
110
reviewed with the Compensation Committee at the next meeting following such grant and typically are reviewed in advance with the Chair of the Compensation Committee. No such grants were made to NEOs in 2018.
RSUs
NEOs may be granted RSUs under either the LTIP or the CSUP as part of the Corporation’s annual equity grant. Such awards may be subject to vesting requirements, including time-based or other conditions as may be determined by the Compensation Committee in its discretion. RSUs granted by the Corporation generally vest in instalments of one-third per year, over three years, based on continued employment with the Corporation. Each vested RSU entitles the holder to one SVS on the release date. The payout value of the award is based on the number of RSUs being released and the market price of the SVS at the time of release. The Corporation has the right under the CSUP to settle RSUs in either cash or SVS. Under the LTIP, the Corporation may, at the time of grant, authorize grantees to settle RSUs either in cash or in SVS. Absent such permitted election, grants under the LTIP will be settled in SVS. If the Corporation has authorized a settlement in SVS or cash, the holder can choose which of these the holder receives. See
Compensation of Named Executive Officers – Equity Compensation Plans
.
PSUs
NEOs may be granted PSUs under the LTIP or the CSUP as part of the Corporation’s annual equity grant. The vesting of such awards requires the achievement of specified performance‑based conditions over a specified time period, as determined by the Compensation Committee in its discretion. PSUs granted by the Corporation generally vest at the end of a three‑year performance period subject to pre‑determined performance criteria. Each vested PSU entitles the holder to receive one SVS on the applicable release date. The payout value of the award is based on the number of PSUs that vest (which ranges from 0% to 200% of the target amount granted) and the market price of the SVS at the time of release. The Corporation has the right under the CSUP to settle the PSUs in either cash or SVS. Under the LTIP, the Corporation may, at the time of grant, authorize grantees to settle PSUs either in cash or in SVS. Absent such permitted election, grants under the LTIP will be settled in SVS. If the Corporation has authorized a settlement in SVS or cash, the holder can choose which of these the holder receives. See
Compensation of Named Executive Officers – Equity Compensation Plans
.
Stock Options
NEOs may be granted stock options under the LTIP. The exercise price of a stock option is the closing market price on the business day prior to the date of the grant. Stock options granted by the Corporation generally vest at a rate of 25% annually on each of the first four anniversaries of the date of grant and expire after a ten‑year term. The LTIP is not an evergreen plan and no stock options have been re‑priced.
Other Compensation
Benefits
NEOs participate in the Corporation’s health, dental, pension, life insurance and long-term disability programs. Benefit programs are determined with consideration given to market median levels in the local geographic region.
Perquisites
Perquisites are provided to executives on a case-by-case basis as considered appropriate in the interests of the Corporation. NEOs are entitled to an annual comprehensive medical examination at a private health clinic. Where applicable, tax equalization is provided to NEOs as an integral part of the Corporation’s Short Term Business Travel Program and is designed to maintain an individual’s tax burden at approximately the same level it would have otherwise been had they remained in their home country. Due largely to variables such as timing and tax rate differences between Canada and the U.S., tax equalization amounts may vary from year to year. While the Corporation is incorporated and headquartered in Canada, our business is global, we compete for executive talent worldwide and our executives are often required to travel extensively. As a result, we believe it is appropriate to make tax equalization payments in order to attract and retain non-Canadian executive officers with specific capabilities as well as to ensure that our executives do not incur any additional tax burden as a result of the business travel necessitated by the global nature of our business.
111
Tax Deductibility of Executive Compensation for U.S. Tax Purposes
Prior to December 22, 2017, when the U.S. Tax Cuts and Jobs Act of 2017 (the “U.S. Tax Reform”) became law, Section 162(m) of the U.S. Internal Revenue Code, which did not apply to foreign private issuers, generally disallowed a tax deduction to public companies for compensation paid to specified executive officers in excess of $1 million per officer in any year that did not qualify as performance-based compensation. Pursuant to the U.S. Tax Reform, however, foreign private issuers who, like the Corporation, have securities registered under Section 12 of the
United States Securities Exchange Act of 1934
, as amended, have become subject to Section 162(m), to the extent they have U.S-based executive officers for whose compensation they take a deduction for U.S. tax purposes. Under the revisions to Section 162(m) implemented by the U.S. Tax Reform, the performance-based exception has been repealed and the $1 million deduction limit now applies to anyone serving as the chief executive officer or the chief financial officer at any time during the taxable year and the top three other highest compensated executive officers serving at fiscal year-end (if relevant deductions for such executives are taken for U.S. tax purposes). The new rules generally apply to taxable years beginning after December 31, 2017, but do not apply to remuneration provided pursuant to a written binding contract in effect on November 2, 2017 that has not been modified in any material respect after that date. Because of ambiguities and uncertainties as to the scope of the foregoing exception, no assurance can be given that the compensation of our CEO and Mr. Lawless will be so exempted
.
In addition, although the Compensation Committee intends to consider the potential tax deductibility of executive compensation under Section 162(m) for applicable executive officers, the primary goal of our compensation programs is to meet the objectives set forth in this Compensation Discussion and Analysis. Accordingly, the Compensation Committee reserves the right to use its business judgment to authorize compensation payments that may be subject to the Section 162(m) deduction limit if it believes such payments are appropriate and in the best interests of the Corporation and its shareholders.
2018 Compensation Decisions
Each element of compensation is considered independently of the other elements. However, the total package is reviewed to ensure that the achievement of target levels of corporate and individual performance will result in total compensation that is generally comparable to the median total compensation of the Comparator Group.
Key 2018 Executive Compensation Program Design Changes
During 2017, a comprehensive review of our incentive plans was undertaken in light of the Corporation’s long-term strategic plan and then-recent organizational design changes. Following this review, the Compensation Committee approved the following design changes to the Corporation’s incentive plans which were implemented for 2018 executive compensation (collectively, the “2018 Incentive Plan Design Changes”):
|
•
|
non-IFRS adjusted ROIC was eliminated as a performance measure for the CPF portion of the CTI. Instead, 50% of the CPF was based on the achievement of specified revenue goals and 50% of the CPF was based on the achievement of specified non-IFRS operating margin goals;
|
|
•
|
the equity mix changed to 40% RSUs and 60% PSUs (the previous mix was 50% RSUs and 50% PSUs); and
|
|
•
|
the number of PSUs that will actually vest continues to range from 0% to 200% of the target number granted. The vesting level will be primarily based on the Corporation’s non-IFRS operating margin (in the final year of the three-year performance period (“EBIAT Result”), and subject to modification by the Corporation’s average annual non-IFRS adjusted ROIC achievement over the performance period (“ROIC Factor”) and relative TSR achievement (“TSR Factor”) over the performance period. See
NEO Equity Awards and Mix
below.
|
The 2018 Incentive Plan Design Changes were implemented to further improve the alignment of the incentive-based compensation of our executives with the Corporation’s strategic goals and pay-for-performance objectives, and also to promote long-term shareholder value. In particular, we believe that the greater emphasis on non-IFRS operating margin as a performance measure for payouts under the CPF of the CTI, and introduction of this measure as the primary vesting criterion for our PSUs, strongly correlates with our current focus on margin improvement across all of our businesses. We believe that maintaining close alignment between our strategic objectives and our executive incentive compensation programs demonstrates our commitment to a pay-for-performance philosophy, which commitment requires adjustment to our performance criteria from time to time as our business goals and objectives evolve. Similarly, our decision to shift our equity grants to include a larger percentage of PSUs also demonstrates this commitment, as PSUs vest based on the level of achievement relative to business performance objectives. We eliminated the comparative nature of non-IFRS adjusted ROIC performance from our PSU vesting calculation as we believe our
112
own results over the relevant period will represent a more meaningful measure of our financial performance. The decision to approve the 2018 Incentive Plan Design Changes was made upon the recommendation of management and after consultation with the Compensation Consultant. In reaching this decision, the Compensation Committee took into account competitive trends and practices as well as the Corporation’s focus on retaining key leaders to effectively execute our strategic business goals.
Base Salary
The base salaries for the NEOs were reviewed during 2018, taking into account individual performance and experience, level of responsibility and median competitive data. No NEO base salaries were increased in 2018.
The following table sets forth the annual base salary for the NEOs for the years ended December 31, 2016 through December 31, 2018:
Table 9: NEO Base Salary Changes
|
NEO
|
Year
|
Salary
($) |
|
Robert A. Mionis
|
2018
|
$950,000
|
|
2017
|
$950,000
|
|
|
2016
|
$850,000
|
|
|
Mandeep Chawla
|
2018
|
$450,000
|
|
2017
|
$450,000
|
|
|
2016
|
$246,000
|
|
|
Michael P. McCaughey
|
2018
|
$475,000
|
|
2017
|
$475,000
|
|
|
2016
|
$475,000
|
|
|
Jack J. Lawless
|
2018
2017
2016
|
$460,000
$460,000 $410,000 |
|
Todd C. Cooper
|
2018
|
$460,000
|
|
2017
|
-
|
|
|
2016
|
-
|
|
Prior to his appointment as CFO on October 19, 2017, Mr. Chawla served as interim CFO of the Corporation at which time his annual base salary did not change from his prior role; however, in recognition of his significantly expanded responsibilities, he received a one-time cash award of C$260,000 paid in two equal instalments during 2017. Upon his appointment as CFO, the Compensation Committee approved an annual base salary of $450,000 for Mr. Chawla. When setting the base salary for Mr. Chawla, the Compensation Committee considered his experience and the responsibilities and duties connected with the CFO position, as well as variable incentive compensation and median aggregate compensation. The Compensation Committee also reviewed salaries for CFOs within the Comparator Group, median competitive data and historical data concerning CFO base salaries at the Corporation.
Mr. Cooper’s base salary was determined upon his appointment as Chief Operations Officer of the Corporation effective January 4, 2018 and reflects the scope of his responsibilities, his level of experience and competitive base salary levels. In connection with his appointment as Chief Operations Officer, Mr. Cooper was granted a one-time cash award of $200,000 during 2018. This one-time cash award was made in order to incentivize Mr. Cooper to join the Corporation when we deemed expedient for him to transition seamlessly into a key leadership position and in recognition of the related forfeiture of his eligibility to receive a short-term incentive award from his previous employer.
Annual Incentive Award (CTI)
2018 Company Performance Factor
The CPF component of the CTI calculation for 2018 was based on the achievement by the Corporation relative to specified financial targets as set forth in Table 10
below. These measures were approved by the Compensation Committee as they were determined to be aligned with the Corporation’s key objectives of driving profitable growth, on both a “top line” and “bottom line”
113
basis. The 2018 financial targets were established at levels consistent with the Corporation’s Annual Operating Plan for 2018, which was approved by the Board. The financial targets for non-IFRS operating margin and revenue for 2018 were unchanged from 2017 and were not set lower than the actual results achieved in 2017. As described above, no minimum CTI payments are guaranteed. See
Key 2018 Executive Compensation Program Design Changes
for a discussion of the changes to the performance measures for the CTI that were implemented in 2018.
Before the CPF for 2018 was calculated, the Compensation Committee reviewed the CTI Parameters and determined that: (1) the minimum corporate profitability requirement was met and, therefore, a CTI payment for 2018 would be made; and (2) as non-IFRS operating margin did not meet target, in accordance with the provisions of the CTI, the revenue metric would be capped at target performance (notwithstanding that the actual performance of the revenue metric was in excess of target). The percentage achievement for each measure was then determined by interpolating between the factor that corresponds to threshold, target and maximum, as applicable. Each achievement factor was then multiplied by its weight (50%) in order to determine the weighted achievement.
The CPF for 2018 was 80% based on the results in the following table:
Table 10: Company Performance Factor
|
Measure
|
Weight
|
Threshold
|
Target
|
Maximum
|
Achieved Results
|
Weighted Achievement
|
|
Non-IFRS operating margin
|
50%
|
2.8%
|
3.7%
|
4.6%
|
3.2%
|
30%
|
|
Revenue
(1)
|
50%
|
$5,700M
|
$6,200M
|
$6,700M
|
$6,633M
(2)
|
50%
|
|
CPF
|
80%
|
|||||
|
(1)
|
Revenue means the Corporation’s annual revenue.
|
|
(2)
|
Notwithstanding that the performance of the revenue measure was in excess of target, that metric was capped at target performance based on the design of the CTI plan, which limits payment on the revenue measure if non-IFRS operating margin is below target performance.
|
2018 Individual Performance Factor
The IPF can increase an executive’s CTI award by a factor of up to 1.5x or reduce the CTI award to zero depending on individual performance (an IPF of less than 1.0 will result in a reduction of the CTI award otherwise payable). Notwithstanding the foregoing, CTI payments are subject to an overall maximum cap of 200% of the Target Award. The IPF is determined through the annual performance review process.
At the beginning of each year, the Compensation Committee and the CEO agree on performance goals for the CEO that are then approved by the Board. Goals for the other NEOs that align with the CEO’s goals are then established and agreed to between the CEO and the respective NEOs. The performance of the CEO and the NEOs is measured against the established goals, but also contains subjective elements, such that criteria for, and the amount of, the IPF remains at the discretion of the Compensation Committee. However, the CPF must be greater than zero for an executive to be entitled to any CTI payment.
CEO
In assessing Mr. Mionis’ individual performance, the Compensation Committee considers the Corporation’s objectives and results achieved, personal performance objectives as determined annually, as well as other factors the Committee considers relevant to the role of CEO. Key results that were considered in determining Mr. Mionis’ IPF for 2018 are included below:
114
|
Objective
|
Metric
|
Result
|
|
Profitable Growth
|
Revenue
|
$6.6 billion in revenue for 2018, including revenue of $2.2 billion from our ATS segment (13% growth year-over-year) and revenue of $4.4 billion from our CCS segment (6% growth year over year).
|
|
Customer Satisfaction
|
Customer satisfaction was strong overall. Celestica was named as “supplier of the year” by a key customer for execution excellence and recognized for superior performance by several other important customers.
|
|
|
Expand Capabilities
|
Expand Market Offerings
|
Expanded our aerospace and defense and healthtech lifecycle capabilities.
|
|
Enhance Internal Capabilities
|
Continued progress in developing Celestica’s commercial excellence program.
|
|
|
Pursue Strategic M&A
|
Through the acquisitions of Atrenne and Impakt, Celestica grew its aerospace and defense and capital equipment businesses. These acquisitions bolstered capabilities and reach by improving design competency, expanding our ability to serve important customers, and establishing the Corporation in new markets (Organic Light Emitting Diode (OLED)) and geographies (South Korea).
|
|
|
Financial Strength
|
Deliver Financial Results
|
Delivered continued sequential non-IFRS operating margin improvements each quarter of 2018; however, full-year non-IFRS operating margin of 3.2% and non-IFRS adjusted EPS of $1.07 were down year-over-year, due in part to the adverse impact of cyclical decreased demand in our capital equipment business.
|
|
Transform Enterprise Productivity
|
Execution of cost efficiency initiatives helping to achieve sequential non-IFRS operating margin expansion throughout 2018.
|
|
|
People Driven
|
Mobilize Talent
|
Developed our “Grow Together” talent strategy with the objective of attracting, engaging and developing our talent. Talent and succession plans for all organizations were completed in 2018. Global employee engagement survey was launched in 2018 with a strong participation rate of 86%.
|
The Compensation Committee determined that, in 2018, Mr. Mionis made meaningful progress in advancing Celestica’s strategic goals and driving future margin expansion by completing two strategic acquisitions, launching our cost efficiency initiatives, expanding our capabilities and implementing various people initiatives. Overall financial results for 2018 were below expectations partly as a result of demand softness from our capital equipment business; however, the Celestica team, under Mr. Mionis’ leadership, has remained consistent in executing a strategy focused on growing our ATS segment while maintaining our strong and differentiated CCS segment. As a result, the Compensation Committee and the Board believe that an IPF of 0.95 for 2018 for Mr. Mionis appropriately reflects Celestica’s overall performance in 2018, as well as Mr. Mionis’ leadership in executing the Corporation’s key strategic initiatives. As a result of his 2018 IPF and the CPF for 2018, Mr. Mionis received less than his Target Award, which reduced his realized compensation for 2018.
Other NEOs
The performance of the NEOs (other than the CEO) are assessed at year-end relative to objective measures that align with the targets for the CEO. The CEO assesses each NEO’s contributions to the Corporation’s results, including such NEO’s contributions as a part of the senior leadership team. Based on the CEO’s assessment, the Compensation Committee considered each NEO to have either substantially met expectations or exceeded expectations for 2018 based on his individual performance and contribution to corporate goals and objectives.
115
Factors considered in the evaluation of each NEO’s IPF included the following:
|
Mr. Chawla
|
• Provided strong support for the acquisitions of Atrenne and Impakt
• Drove capital allocation priorities, including negotiating new term loans, introducing interest rate swaps and executing the Corporation’s normal course issuer bid
• Strengthened relationships with both the investment and financial community
|
|
Mr. McCaughey
|
• Strong leadership of our CCS segment during a transformational period
• CCS segment revenue increased 6% year-over-year, led by increased demand and new programs, including JDM programs, in our Communications end market, as well as strong demand in our storage business
|
|
Mr. Lawless
|
• Led the expansion of our ATS segment, both organically, and through the Atrenne and Impakt acquisitions
• ATS segment revenue increased 13% year-over-year, driven primarily by solid performance in our aerospace and defense and industrial markets, partially offset by cyclical decreased demand in our capital equipment business
|
|
Mr. Cooper
|
• Developed a comprehensive global operations strategy with a focus on people, quality, shop floor operations and supply chain as well as related key performance indicators
• Deployed Celestica’s new global operating system, which improved operational performance by driving quality, delivery and cost productivity throughout our operations and supply chain
|
Target Award
The following table sets forth information with respect to the potential and actual awards under the CTI for participating NEOs during 2018:
Table 11: 2018 CTI Awards
|
Name
|
Target Incentive %
(1)
|
Potential Award for Below Threshold Performance
|
Potential Award for Threshold Performance
(2)
|
Potential Award for Target Performance
(2)
|
Potential Maximum Award
(2)
|
Amount Awarded
|
Amount Awarded as a % of Base Salary
|
|
Robert A. Mionis
|
125%
|
$0
|
$296,875
|
$1,187,500
|
$2,375,000
|
$902,500
|
95%
|
|
Mandeep Chawla
|
80%
|
$0
|
$90,000
|
$360,000
|
$720,000
|
$316,800
|
70%
|
|
Michael P. McCaughey
|
80%
|
$0
|
$95,000
|
$380,000
|
$760,000
|
$304,000
|
64%
|
|
Jack J. Lawless
|
80%
|
$0
|
$92,000
|
$368,000
|
$736,000
|
$323,840
|
70%
|
|
Todd C. Cooper
(3)
|
80%
|
$0
|
$90,992
|
$363,967
|
$727,934
|
$291,980
|
64%
|
|
(1)
|
The Target Incentive for each of Messrs. Mionis, Chawla, McCaughey and Lawless was not changed from 2017. Mr. Cooper’s Target Incentive was determined upon his appointment as Chief Operations Officer effective January 4, 2018 based on the scope of his responsibilities.
|
|
(2)
|
Award amounts in these columns are calculated based on an IPF of 1.0.
|
|
(3)
|
As Mr. Cooper was appointed on January 4, 2018, his Target Award is equal to his Target Incentive multiplied by the prorated amount of his annualized salary for 2018.
|
NEO Equity Awards and Mix
Target equity-based incentives were determined for the NEOs with reference to the median awards of the Comparator Group and, for 2018, were set lower than such median awards. Consideration was also given to individual performance, the roles and responsibilities of the NEOs, retention value and market trends. Under the 2018 Incentive Plan Design Changes, the equity mix for 2018 was changed to 40% RSUs and 60% PSUs (the previous mix was 50% RSUs and 50% PSUs). See
Compensation Elements for the Named Executive Officers – Equity Based Incentives
for a general description of the process for determining the amounts of these awards and
Key 2018 Executive Compensation Program Design Changes
for a discussion of the changes to the equity mix that were implemented pursuant to the 2018 Incentive Plan Design Changes.
116
The following table sets forth equity awards granted to the NEOs on January 30, 2018 as part of their 2018 compensation:
Table 12: NEO Equity Awards
|
Name
|
RSUs
(#) (1) |
PSUs
(#) (2) |
Stock Options
(#) |
Value of Equity
Award (3) |
|
Robert A. Mionis
|
274,024
|
411,037
|
-
|
$7,200,000
|
|
Mandeep Chawla
|
55,185
|
82,778
|
-
|
$1,450,000
|
|
Michael P. McCaughey
|
64,700
|
97,050
|
-
|
$1,700,000
|
|
Jack J. Lawless
|
62,797
|
94,196
|
-
|
$1,650,000
|
|
Todd C. Cooper
|
60,894
|
91,341
|
-
|
$1,600,000
|
|
(1)
|
Grants were based on a share price of $10.51, which was the closing price of the SVS on the NYSE on January 29, 2018 (the last business day before the date of grant).
|
(2) Assumes achievement of 100% of target level performance.
(3) Represents the aggregate grant date fair value of the RSUs and PSUs.
The RSUs vest ratably over a three-year period, commencing on the first anniversary of the date of grant. The value of the RSUs granted on January 30, 2018 was determined at the January 2018 meeting of the Compensation Committee. The number of RSUs granted was determined using the closing price of the SVS on January 29, 2018 (the day prior to the date of grant) on the NYSE of $10.51.
PSUs granted as set forth in the table above vest at the end of a three-year performance period subject to pre-determined performance criteria. For such awards, each NEO was granted a target number of PSUs (“Target Grant”). The number of PSUs that will actually vest ranges from 0% to 200% of the Target Grant and will be primarily based on the EBIAT Result for the final year of the three-year performance period, subject to modification by the ROIC Factor and the TSR Factor over the performance period in accordance with the following:
117
|
Formula
|
Description
|
|
Preliminary Vesting % based on EBIAT Result
|
The percentage of PSUs that will vest based on the EBIAT Result (the “Preliminary Vesting %”) can range between 0% and 200% of the Target Grant. The Preliminary Vesting % will be subject to initial adjustment based on the ROIC Factor and further adjustment based on the TSR Factor, as described below, provided that the maximum number of PSUs that may vest will not exceed 200% of the Target Grant.
|
|
Preliminary Vesting % subject to modification by a factor of either -25%, 0% or +25% based on ROIC Factor
|
The Corporation’s ROIC Factor will be measured relative to a pre-determined non-IFRS adjusted ROIC range approved by the Board. The Preliminary Vesting % will not be modified if the ROIC Factor is within that pre-determined range. The Preliminary Vesting % will be increased or decreased by 25 percentage points if the ROIC Factor is above or below that predetermined range, respectively (as so adjusted, the “Secondary Vesting %”). The ROIC Factor cannot increase the actual number of PSUs that vest to more than 200% of the Target Grant.
|
|
Secondary Vesting % subject to modification by a factor ranging from -25% to +25% based on TSR Factor
|
TSR measures the performance of a company’s shares over time. It combines share price appreciation and dividends, if any, paid over the period to determine the total return to the shareholder expressed as a percentage of the share price at the beginning of the performance period. With respect to each TSR Comparator (as defined below), TSR is calculated as the change in share price over the three year performance period (plus any dividends) divided by the share price at the beginning of the period, where the average of the daily closing share price for the month of December 2017 is the beginning share price and the average of the daily closing price for the month of December 2020 will be the ending share price. The TSR of the Corporation is calculated in the same manner in respect of the SVS (the Corporation does not currently pay dividends).
For purposes of determining modifications to the Secondary Vesting % based on the TSR Factor, the Corporation’s TSR will be measured relative to the information technology companies within the S&P 1500 Index as at January 1, 2018, with the addition of Flex Ltd. (the only EMS-peer company not already included in the S&P 1500 Index), that remain publicly traded on an established U.S. stock exchange for the entire performance period (the “TSR Comparators”). The Corporation’s market capitalization is positioned around the median of the TSR Comparators.
After calculating the percentile rank for each TSR Comparator (by arranging the TSR results from highest to lowest), the Corporation’s TSR will be ranked against that of each of the TSR Comparators. The Secondary Vesting % will then be subject to modification (ranging from a decrease of 25 percentage points to an increase of 25 percentage points) by interpolating between the corresponding percentages immediately above and immediately below Celestica’s percentile position as set out in the table below, provided that the Corporation’s TSR performance cannot increase the actual number of PSUs that will vest to more than 200% of the Target Grant.
|
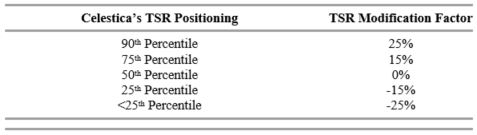
|
|
|
Summary
|
Total PSU Vesting Percentage =
(1) Preliminary Vesting % based on EBIAT Result;
(2) Preliminary Vesting % is subject to modification by a factor of either -25%, 0% or +25% based on ROIC Factor and results in the Secondary Vesting %; and
(3) Secondary Vesting % is subject to modification by a factor ranging from -25% to +25% based on TSR Factor.
|
Realized and Realizable Compensation
CEO Realized and Realizable Compensation
The following table is a look back at CEO compensation that compares the total target direct compensation awarded to Mr. Mionis for the financial years ended December 31, 2016 through December 31, 2018 to his realized and realizable compensation for each such year. The total target direct compensation value represents Mr. Mionis’ salary, target CTI award and the target value
118
of share-based awards. The realized and realizable value represents actual salary paid, actual CTI award paid and share-based awards at vest date value or, if the vest date is after December 31, 2018, at $8.77 per share, the closing price of the SVS on the NYSE on December 31, 2018.
Table 13: CEO Realized and Realizable Compensation
|
2016
|
2017
|
2018
|
|
|
Total Target Direct Compensation
|
$6,912,500
|
$7,582,021
|
$9,337,500
|
|
Realized and Realizable Compensation
|
$7,629,976
|
$5,457,729
|
$7,860,485
|
NEO Realized and Realizable Compensation and Total Shareholder Return
The following graph compares the five
-
year trend in the Corporation’s TSR versus compensation for the NEOs as reported in each year’s Annual Report on Form 20-F. The comparison also demonstrates the difference between total target direct compensation and the realized and realizable compensation for the NEOs related to each year. The total target direct compensation value represents salary, target CTI award and the target value of share-based awards and option awards (if applicable) for all NEOs reported in the Corporation’s Annual Report on Form 20-F each year. The realized and realizable value represents: actual salary paid; actual CTI award paid; share-based awards at vest date value or if the vest date is after December 31, 2018, at $8.77 per share, the closing price of the SVS on the NYSE on December 31, 2018; and option awards (if applicable) at their intrinsic value. This look back at compensation demonstrates the comparison between actual pay and total target compensation intended at the time of grant. The difference between total target direct compensation and realized and realizable compensation was driven by the performance of the SVS and achievement relative to CTI and PSU performance measures, as well as changes in the reported NEOs in applicable years.
We believe that our TSR for 2018 was negatively impacted as a result of a highly competitive and volatile market environment and was further negatively impacted by volatility in North American equity markets in the fourth quarter of 2018. Although we compete in a turbulent competitive environment, we continue to include TSR as an element for measuring the Corporation’s performance; however, we also assess our performance based on various other measures, including revenue and non-IFRS operating margin, and utilize such other measures in aligning our pay for performance. We also measure our performance against how well we have achieved our objectives through a complex and necessary business transformation strategy designed to diversify the Corporation’s business and drive more sustainable, long-term revenue and profitable growth. We believe that progress towards our business transformation will have a positive impact on our TSR.
A significant portion of NEO compensation is provided in the form of long-term incentives and for 2018, we increased the proportion of PSUs to 60% (from 50% in 2017) and the value of such PSUs will not be realizable by the NEOs until the end of the performance period in 2021. We believe the realized value of the long-term incentives granted to NEOS, and the performance of the PSUs in particular, will more closely mirror the trend in share price movement and serve to align the interests of management with those of our shareholders. PSU payouts made in January 2018 (with respect to PSUs issued in 2015) reflect that the Corporation’s relative non-IFRS adjusted ROIC performance (40% weight) resulted in 140% achievement and the Corporation’s relative TSR ranking (60% weight) resulted in zero achievement for an overall vesting level of 56%.
119

Table 14: NEOs Realized and Realizable Compensation
|
2014
|
2015
|
2016
|
2017
|
2018
|
|
|
Celestica Total Shareholder Return (1 year)
|
13%
|
-6%
|
7%
|
-12%
|
-16%
|
|
Total Target Direct Compensation
|
$17,095,810
|
$8,727,784
|
$16,375,500
|
$16,088,075
|
$19,049,426
|
|
Realized and Realizable Compensation
|
$15,606,638
|
$7,376,294
|
$16,453,863
|
$12,075,011
|
$16,277,477
|
120
EXECUTIVE COMPENSATION
This section contains references to operating margin and adjusted ROIC, each of which are non-IFRS measures. See
Compensation Discussion and Analysis – Note Regarding Non-IFRS Measures
for definitions of such non-IFRS measures, and where to find a discussion of the exclusions used to determine such measures, how they are used, as well as a reconciliation of historical non-IFRS operating margin and non-IFRS adjusted ROIC to the most directly comparable IFRS measures. These non-IFRS measures do not have any standardized meaning prescribed by IFRS and therefore may not be comparable to similar measures presented by other companies.
Summary Compensation Table
The following table sets forth the compensation of the NEOs for the financial years ended December 31, 2016 through December 31, 2018.
Table 15: Summary Compensation Table
|
Non-equity
Incentive Plan Compensation |
||||||||||||||||||||
|
Name & Principal Position
|
Year
|
Salary
($) |
Share‑
based Awards ($) (1)(2) |
Option‑
based Awards ($) (3) |
Annual
Incentive Plans ($) (4) |
Pension
Value ($) (5) |
All Other
Compensation ($) (6) |
Total
Compensation ($) |
||||||||||||
|
Robert A. Mionis
(7)
|
2018
|
|
$950,000
|
|
|
$7,200,000
|
|
–
|
|
$902,500
|
|
|
$132,613
|
|
|
$1,051,189
|
|
|
$10,236,302
|
|
|
President and Chief Executive
|
2017
|
|
$925,342
|
|
|
$5,500,000
|
|
–
|
|
$912,041
|
|
|
$155,821
|
|
|
$721,898
|
|
|
$8,215,102
|
|
|
Officer
|
2016
|
|
$850,000
|
|
|
$5,000,000
|
|
–
|
|
$1,227,188
|
|
|
$141,262
|
|
|
$265,623
|
|
|
$7,484,073
|
|
|
Mandeep Chawla
(8)
|
2018
|
|
$450,000
|
|
|
$1,450,000
|
|
–
|
|
$316,800
|
|
|
$48,692
|
|
|
$479
|
|
|
$2,265,971
|
|
|
Chief Financial Officer
|
2017
|
|
$287,359
|
|
|
$1,025,000
|
|
–
|
|
$359,161
|
|
|
$47,234
|
|
|
$493
|
|
|
$1,719,247
|
|
|
2016
|
|
$210,196
|
|
|
$285,000
|
|
–
|
|
$103,966
|
|
|
$21,008
|
|
|
$48
|
|
|
$620,218
|
|
|
|
Michael P. McCaughey
(9)
|
2018
|
|
$475,000
|
|
|
$1,700,000
|
|
–
|
|
$304,000
|
|
|
$61,992
|
|
|
$3,254
|
|
|
$2,544,246
|
|
|
President, CCS
|
2017
|
|
$475,000
|
|
|
$1,550,000
|
|
–
|
|
$299,630
|
|
|
$78,586
|
|
|
$6,201
|
|
|
$2,409,417
|
|
|
2016
|
|
$475,000
|
|
|
$1,550,000
|
|
–
|
|
$498,750
|
|
|
$62,510
|
|
|
$1,018
|
|
|
$2,587,278
|
|
|
|
Jack J. Lawless
(10)
President, ATS |
2018
2017 2016 |
$460,000
$447,671 $410,000 |
|
$1,650,000
$1,500,000 $1,350,000 |
|
–
–
–
|
$323,840
$297,254 $447,720 |
|
$44,230
$52,975 $31,914 |
|
$41,194
$34,522 $2,738 |
|
$2,519,264
$2,332,422 $2,242,372 |
|
||||||
|
Todd C. Cooper
(11)
|
2018
|
|
$454,959
|
|
|
$1,600,000
|
|
–
|
|
$491,980
|
|
|
$27,568
|
|
|
$10,477
|
|
|
$2,584,984
|
|
|
Chief Operations Officer
|
2017
|
–
|
|
|
$2,750,000
|
|
–
|
–
|
|
–
|
|
–
|
|
|
$2,750,000
|
|
||||
|
2016
|
–
|
|
–
|
|
–
|
–
|
|
–
|
|
–
|
|
–
|
|
|||||||
|
(1)
|
All amounts in this column represent the grant date fair value of share-based awards. Amounts in this column for 2018 represent RSU and PSU grants made on January 30, 2018 to all NEOs. Grants were based on a share price of $10.51, which was the closing price of the SVS on the NYSE on January 29, 2018 (the day prior to the date of the grant). Amounts in this column for 2017 represent: (i) RSU and PSU grants made on January 31, 2017 to all NEOs; (ii) for Mr. Chawla, includes the additional one-time RSU grant made on June 5, 2017; and (iii) for Mr. Cooper, includes a one-time RSU grant made on December 15, 2017. The one-time RSU grant to Mr. Cooper was made following the acceptance of his employment terms with Celestica in recognition of the forfeiture of his unvested equity with his previous employer and to incentivize Mr. Cooper to join Celestica in a timely fashion. Grants for 2017 were based on a share price of $13.66, which was the closing price of the SVS on the NYSE on January 30, 2017 (the day prior to the date of the grant), except for (i) the one-time additional grant made to Mr. Chawla, which was based on a share price of $14.01, which was the closing price of the SVS on the NYSE on June 2, 2017 (the last business day prior to the date of the grant); and (ii) the one-time grant made to Mr. Cooper, which was based on a share price of $10.32, which was the closing price of the SVS on the NYSE on December 14, 2017 (the last business day prior to the date of the grant). Amounts in this column for 2016 represent
RSU and PSU grants made on February 1, 2016 under the CSUP. Grants were based on a share price of $9.06, which was the closing price of the SVS on the NYSE on January 29, 2016 (the day prior to the date of grant). See
Compensation Discussion and Analysis – Compensation Elements for the Named Executive Officers – Equity‑Based Incentives
for a description of the process followed in determining the grants for 2018, and see
Compensation Discussion and Analysis – 2018 Compensation Decisions – Equity‑Based Incentives
for a description of the vesting terms of the RSU and PSU awards. Commencing with the annual equity grants made in 2016, grants made in-year are reported for such year rather than the most recently completed year.
|
|
(2)
|
The estimated accounting fair value of the share‑based awards is calculated using the market price of SVS as defined under each of the plans and various fair value pricing models. The grant date fair value of the RSU portion of the share‑based awards in Table 15 is the same as the accounting fair value of such awards. The accounting fair values for the PSU portion of the 2016, 2017 and 2018 share‑based awards reflects various assumptions as to estimated vesting for such awards in accordance with applicable accounting standards. The grant date fair value for the PSU portion of the share‑based awards reflects the dollar amount of the award intended for compensation purposes, based on the market value of the underlying shares on the grant dates based on an assumption of the vesting of 100% of the target number of PSUs granted. The accounting fair value for all share-based awards in the table assumed a zero
|
121
forfeiture rate. The number of PSUs granted in 2018 that will actually vest will range from 0% to 200% of the target number granted and will be primarily based on the Corporation’s EBIAT Result in the final year of the three-year performance period, and then potentially modified by the Corporation’s ROIC Factor and TSR Factor over the performance period, as described in detail under
NEO Equity Awards and Mix
above. The Corporation estimated the grant date fair value of the TSR Factor using a Monte Carlo simulation model. The accounting grant date fair value is not subsequently adjusted regardless of the eventual number of awards that are earned based on TSR. The grant date fair value for the non-TSR-based performance measurement and modifier was based on the market value of our subordinate voting shares at the time of grant and may be adjusted in subsequent periods to reflect a change in the estimated level of achievement related to the applicable performance condition. 60% of the PSUs granted with respect to 2016 and 2017 performance vest depending on the level of TSR achievement over a three-year period relative to the TSR of a pre-defined comparator group. The comparator group was based on the S&P 1500 Technology Index for each of 2016 and 2017 with the addition of Flex Ltd., and which remain publicly traded on an established U.S. stock exchange for the entire performance period. The cost the Corporation recorded for these PSUs was determined using a Monte Carlo simulation model. The number of awards expected to be earned is factored into the grant date Monte Carlo valuation for the award. The accounting grant date fair value is not subsequently adjusted regardless of the eventual number of awards that are earned based on the market performance condition. 40% of the PSUs granted with respect to 2016 and 2017 vest depending on the Corporation’s non-IFRS adjusted ROIC performance (a non-market performance condition), in the final year of a three-year vesting period, relative to the non-IFRS adjusted ROIC of a pre-determined EMS competitor group. The cost the Corporation recorded for these PSUs was determined based on the market value of SVS at the time of grant, and such cost may be adjusted (usually during the last year of the three-year performance period) based on management’s estimate of the relative level of achievement of non-IFRS adjusted ROIC, as outlined above.
|
(3)
|
There were no stock options granted to the NEOs in 2016, 2017 or 2018.
|
|
(4)
|
Amounts in this column represent CTI incentive payments made to NEOs. See
Compensation Discussion and Analysis – Compensation Elements for the Named Executive Officers – Celestica Team Incentive Plan
for a description of the CTI. Amounts in this column for Mr. Cooper for 2018 also include the one-time cash award of $200,000 paid to him in connection with his appointment as Chief Operations Officer. Amounts in this column for Mr. Chawla for 2017 also include the one-time cash award of C$260,000 paid to him (in two equal instalments) in connection with his appointment as interim CFO.
|
|
(5)
|
Amounts in this column represent Celestica’s contributions to defined contribution pension plans on behalf of the NEOs. Pension values for Messrs. Mionis, Lawless and Cooper are reported in U.S. dollars. For 2018 and 2017, Mr. Mionis’ pension values include $132,613 and $155,821, respectively, in U.S. dollars representing the pension value from the U.S. pension plans. For 2016, his pension values include $8,088 in U.S. dollars representing the pension value from the U.S. pension plans and $133,174 having been converted from Canadian dollars representing the pension value from the Canadian Pension Plans (as defined below). See
Pension Plans
for a full description of the plans Mr. Mionis participated in during 2018. Pension values for Messrs. Chawla and McCaughey are reported in U.S. dollars, having been converted from Canadian dollars. Amounts were converted to U.S. dollars at the average exchange rate for 2018 of $1.00 equals C$1.2957.
|
|
(6)
|
Amounts in this column for Mr. Mionis represent amounts for items provided for under the CEO Employment Agreement, which for 2018 consisted of tax equalization payments of $948,353, housing expenses of $76,261 while in Canada, group life insurance premiums of $7,482, a 401(k) contribution of $16,500, a tax preparation fee of $500 and a comprehensive medical exam at a private clinic of $2,093. For 2017, the amount in this column for Mr. Mionis consisted of tax equalization payments of $624,011, housing expenses of $73,669 while in Canada, group life insurance premiums of $1,177, a 401(k) contribution of $16,200, travel expenses between Toronto and Arizona of $4,346, a tax preparation fee of $500 and the cost of a comprehensive medical exam at a private health clinic of $1,995. For 2016, the amount in this column for Mr. Mionis consisted of tax equalization payments of $124,548, housing expenses of $75,916 while in Canada, group life insurance premiums of $1,089, a 401(k) contribution of $10,298, travel expenses between Toronto and Arizona of $28,795, tax preparation fees of $23,168 and the cost of a comprehensive medical exam at a private health clinic of $1,809. Amounts in this column for Mr. Lawless for 2018 consisted of tax equalization payments of $25,013, a 401(k) contribution of $15,681 and a tax preparation fee of $500. Amounts in this column for Mr. Lawless for 2017 consisted of tax equalization payments of $17,610 and a 401(k) contribution of $16,200.
Amounts in this column for Mr. Cooper for 2018 consisted of a 401(k) contribution of $8,250 and a comprehensive medical exam at a private clinic of $2,227.
In accordance with the Corporation’s Short Term Business Travel Program, the Compensation Committee approved tax equalization payments for Messrs. Mionis and Lawless in order to cover taxes on their compensation in excess of the taxes they would have incurred in the United States. Due largely to variables such as timing and tax rate differences between Canada and the U.S., tax equalization amounts may vary from one year to the next and the net benefit may be positive or negative in the year. While the Corporation is incorporated and headquartered in Canada, our business is global and we compete for executive talent worldwide. As a result, we believe it is appropriate to make tax equalization payments in order to attract and retain non-Canadian executive officers with specific capabilities.
|
|
(7)
|
In January 2017, the Compensation Committee approved an increase in Mr. Mionis’ annual base salary from $850,000 to $950,000 effective April 1, 2017 in order to align his salary to the median of the Corporation’s competitive benchmark. As such, annualized amounts for 2017 were pro-rated to reflect actual compensation paid, awarded or earned.
|
|
(8)
|
Mr. Chawla was appointed as interim CFO of the Corporation effective May 23, 2017 and CFO of the Corporation effective October 19, 2017 and, accordingly, annualized amounts for 2017 have been pro-rated to reflect actual compensation paid, awarded or earned.
|
|
(9)
|
Effective January 1, 2019, Mr. McCaughey’s title was changed to Advisor.
|
|
(10)
|
In January 2017, the Compensation Committee approved an increase in Mr. Lawless’ annual base salary from $410,000 to $460,000 effective April 1, 2017 in order to align his salary to the median of the Corporation’s competitive benchmark. As such, annualized amounts for 2017 were pro-rated to reflect actual compensation paid, awarded or earned.
|
(11) Mr. Cooper was appointed as Chief Operations Officer of the Corporation effective January 4, 2018.
122
Option-Based and Share-Based Awards
The following table provides details of each stock option grant outstanding (vested and unvested) and the aggregate number of unvested share-based awards for each of the NEOs as of December 31, 2018.
Table 16: Outstanding Option‑Based and Share‑Based Awards
(1)
|
Option‑Based Awards
|
Share‑Based Awards
|
||||||||||||||||
|
Name
|
Number of
Securities Underlying Unexercised Options (#) |
Option
Exercise Price ($) |
Option
Expiration Date |
Value of
Unexercised In-the-Money Options ($) (2) |
Number of
Shares or Units that have not Vested (#) (3) |
Payout
Value of Share-Based Awards that have not Vested at Minimum ($) (4) |
Payout
Value of Share-Based Awards that have not Vested at Target ($) (4) |
Payout
Value of Share-Based Awards that have not Vested at Maximum ($) (4) |
Payout
Value of Vested Share‑Based Awards Not Paid Out or Distributed ($) |
||||||||
|
Robert A. Mionis
|
|||||||||||||||||
|
Aug. 1, 2015
|
298,954
|
|
C$17.52
|
|
Aug. 1, 2025
|
–
|
–
|
–
|
|
–
|
|
–
|
|
–
|
|||
|
Feb. 1, 2016
|
–
|
–
|
|
–
|
–
|
275,938
|
–
|
|
|
$2,547,054
|
|
|
$5,094,109
|
|
–
|
||
|
Jan. 31, 2017
|
–
|
–
|
|
–
|
–
|
335,528
|
$1,177,030
|
|
$2,942,581
|
|
$4,708,131
|
|
–
|
||||
|
Jan. 30, 2018
|
–
|
–
|
|
–
|
–
|
685,061
|
$2,403,190
|
|
$6,007,985
|
|
$9,612,779
|
|
–
|
||||
|
Total
|
298,954
|
–
|
|
–
|
–
|
1,296,527
|
$3,580,221
|
|
$11,497,620
|
|
$19,415,019
|
|
–
|
||||
|
Mandeep Chawla
|
|||||||||||||||||
|
Feb. 1, 2016
|
–
|
–
|
|
–
|
–
|
10,209
|
–
|
|
|
$94,234
|
|
|
$188,469
|
|
–
|
||
|
Aug. 1, 2016
|
–
|
–
|
|
–
|
–
|
6,017
|
|
$55,540
|
|
|
$55,540
|
|
|
$55,540
|
|
–
|
|
|
Jan. 31, 2017
|
–
|
–
|
|
–
|
–
|
21,352
|
|
$78,838
|
|
|
$197,090
|
|
|
$315,343
|
|
–
|
|
|
Jun. 5, 2017
|
–
|
–
|
|
–
|
–
|
32,120
|
$296,485
|
|
$296,485
|
|
$296,485
|
|
–
|
||||
|
Jan. 30, 2018
|
–
|
–
|
|
–
|
–
|
137,963
|
$509,387
|
|
$1,273,472
|
|
$2,037,557
|
|
–
|
||||
|
Total
|
–
|
–
|
|
–
|
–
|
207,661
|
|
$940,250
|
|
|
$1,916,821
|
|
|
$2,893,393
|
|
–
|
|
|
Michael P. McCaughey
|
|||||||||||||||||
|
Feb. 1, 2016
|
–
|
–
|
|
–
|
–
|
85,540
|
–
|
|
|
$789,580
|
|
|
$1,579,159
|
|
–
|
||
|
Jan. 31, 2017
|
–
|
–
|
|
–
|
–
|
94,557
|
$349,126
|
|
$872,811
|
|
$1,396,496
|
|
–
|
||||
|
Jan. 30, 2018
|
–
|
–
|
|
–
|
–
|
161,750
|
$597,215
|
|
$1,493,039
|
|
$2,388,862
|
|
–
|
||||
|
Total
|
–
|
–
|
|
–
|
–
|
341,847
|
|
$946,342
|
|
|
$3,155,430
|
|
|
$5,364,517
|
|
–
|
|
|
Jack J. Lawless
|
|||||||||||||||||
|
Feb. 1, 2016
|
–
|
–
|
|
–
|
–
|
74,503
|
–
|
|
|
$653,391
|
|
|
$1,306,783
|
|
–
|
||
|
Jan. 31, 2017
|
–
|
–
|
|
–
|
–
|
91,507
|
$321,008
|
|
$802,516
|
|
$1,284,024
|
|
–
|
||||
|
Jan. 30, 2018
|
–
|
–
|
|
–
|
–
|
156,993
|
$550,730
|
|
$1,376,829
|
|
$2,202,928
|
|
–
|
||||
|
Total
|
–
|
–
|
|
–
|
–
|
323,003
|
|
$871,738
|
|
|
$2,832,736
|
|
|
$4,793,735
|
|
–
|
|
|
Todd C. Cooper
|
|||||||||||||||||
|
Dec. 15, 2017
|
–
|
–
|
|
–
|
–
|
266,473
|
$2,336,968
|
|
$2,336,968
|
|
$2,336,968
|
|
–
|
||||
|
Jan. 30, 2018
|
–
|
–
|
|
–
|
–
|
152,235
|
$534,040
|
|
$1,335,101
|
|
$2,136,162
|
|
–
|
||||
|
Total
|
–
|
–
|
|
–
|
–
|
418,708
|
|
$2,871,009
|
|
|
$3,672,069
|
|
|
$4,473,130
|
|
–
|
|
|
(1)
|
See
Compensation Discussion and Analysis – 2018 Compensation Decisions – Equity‑Based Incentives
for a discussion of the equity grants.
|
|
(2)
|
The value of unexercised in‑the‑money stock options was determined using a share price of C$11.96, which was the closing price of the SVS on the TSX on December 31, 2018, converted to U.S. dollars at the average exchange rate for 2018 of $1.00 equals C$1.2957.
|
|
(3)
|
Includes unvested RSUs, as well as PSUs assuming achievement of 100% of target level performance.
|
|
(4)
|
Payout values at minimum vesting include the value of RSUs only, as the minimum value of PSUs would be $0.00
if the minimum performance condition is not met. Payout value at target vesting is determined assuming vesting of 100% of the target number of PSUs granted and payout values at maximum vesting is determined assuming vesting of 200% of the target number of PSUs granted. Payout values for Messrs. Chawla and McCaughey and the February 1, 2016 grants for Mr. Mionis were determined using a share price of C$11.96, which was the closing price of the SVS on the TSX on December 31, 2018, converted to U.S. dollars at the average exchange rate for 2018 of $1.00 equals C$1.2957. Payout values for Mr. Lawless and the payout value for Mr. Mionis’ January 31, 2017 grant were determined using a share price of $8.77, which was the closing price of the SVS on the NYSE on December 31, 2018.
|
123
The following table provides details for each NEO of the value of option‑based and share‑based awards that vested during 2018 and the value of annual incentive awards earned in respect of 2018 performance.
Table 17: Incentive Plan Awards – Value Vested or Earned in 2018
|
Name
|
Option‑based Awards –
Value Vested During the Year ($) |
Share‑based Awards –
Value Vested During the Year ($) (1) |
Non-equity Incentive
Plan Compensation – Value Earned During the Year ($) (2) |
|
Robert A. Mionis
|
–
|
$3,734,824
|
$902,500
|
|
Mandeep Chawla
|
–
|
$576,767
|
$316,800
|
|
Michael P. McCaughey
|
–
|
$1,915,465
|
$304,000
|
|
Jack J. Lawless
|
–
|
$683,482
|
$323,840
|
|
Todd C. Cooper
|
–
|
–
|
$291,980
|
|
(1)
|
Amounts in this column reflect: (i) share‑based awards released in 2018 for Messrs. Mionis and Lawless
based on the price of the SVS on the NYSE as follows:
|
|
Type of Award
|
Vesting Date
|
Price
|
|
RSU
|
January 31, 2018
|
$10.17
|
|
RSU
|
February 1, 2018
|
$10.11
|
|
RSU
|
December 3, 2018
|
$9.92
|
and (ii) share‑based awards released in 2018 for Messrs. Mionis, Chawla, and McCaughey
based on the price of the SVS on the TSX as follows:
|
Type of Award
|
Vesting Date
|
Price
|
|
PSU
|
January 23, 2018
|
$13.75
|
|
RSU
|
January 31, 2018
|
$12.50
|
|
RSU
|
February 1, 2018
|
$12.42
|
|
RSU
|
February 5, 2018
|
$12.84
|
|
RSU
|
December 3, 2018
|
$13.19
|
Certain values in this column were converted to U.S. dollars from Canadian dollars at the average exchange rate for 2018 of $1.00 equals C$1.2957. With respect to previously-issued PSUs subject to vesting in 2018, the Corporation’s relative TSR (determinative for 60% of such PSUs) ranked 6
th
among the TSR Comparators, resulting in zero achievement for such PSUs and the Corporation’s relative non-IFRS adjusted ROIC (determinative for 40% of such PSUs) ranked 2
nd
among the ROIC Competitors resulting in 140% achievement for an overall vesting level of 56%, i.e. ((60% * 0%) + (40% * 140%)).
|
(2)
|
Consists of payments under the CTI made on February 22, 2019 in respect of 2018 performance. See
Compensation Discussion and Analysis – 2018 Compensation Decisions – Annual Incentive Award – Target Award
. These are the same amounts as disclosed in Table 15 under the column “Non-equity Incentive Plan Compensation – Annual Incentive Plans”.
|
No gains were realized by NEOs from exercising stock options in 2018.
124
Securities Authorized for Issuance Under Equity Compensation Plans
Table 18: Equity Compensation Plans as at December 31, 2018
(1)
|
Plan Category
|
Securities to be Issued Upon Exercise of Outstanding Options, Warrants and Rights
(#) |
Weighted‑Average
Exercise Price of Outstanding Options, Warrants and Rights ($) |
Securities Remaining
Available for Future Issuance Under Equity Compensation Plans (2) (#) |
|
|
Equity Compensation Plans Approved by Securityholders
|
LTIP (Options)
|
345,577
|
C$16.27
|
N/A
(2)
|
|
LTIP (RSUs)
|
772,719
|
N/A
|
N/A
(3)
|
|
|
LTIP (PSUs)
(4)
|
1,380,858
|
N/A
|
N/A
(3)
|
|
|
Total
(5)
|
2,499,154
|
C$16.27
|
8,572,065
|
|
|
(1)
|
This table sets forth information, as of December 31, 2018, with respect to subordinate voting shares of the Corporation authorized for issuance under the LTIP, and does not include subordinate voting shares of the Corporation purchased (or to be purchased) in the open market to settle equity awards under the LTIP or the Corporation’s other equity compensation plans. The LTIP, which was approved by the Corporation’s shareholders, is the only equity compensation plan pursuant to which the Corporation may issue new subordinate voting shares to settle equity awards.
|
|
(2)
|
Excluding securities that may be issued upon exercise of outstanding stock options, warrants and rights.
|
|
(3)
|
The LTIP provides for a maximum number of securities that may be issued from treasury, but does not provide separate maximums for each type of award thereunder.
|
|
(4)
|
Assumes the maximum payout for all outstanding PSUs (200% of target).
|
|
(5)
|
The total number of securities issuable upon the exercise/settlement of outstanding grants under all equity compensation plans approved by shareholders represents 1.834% of the total number of outstanding shares at December 31, 2018 (LTIP (Options) – 0.254%; LTIP (RSUs) – 0.567%; and LTIP (PSUs) – 1.013%).
|
Equity Compensation Plans
Long-Term Incentive Plan
The LTIP (which was approved by the Corporation’s shareholders) is the only securities‑based compensation plan providing for the issuance of securities from treasury under which grants have been made and continue to be made by the Corporation since the company was listed on the TSX and the NYSE. Under the LTIP, the Board of Directors may in its discretion from time to time grant stock options, share units (in the form of RSUs and PSUs) and stock appreciation rights (“SARs”) to employees and consultants of the Corporation and affiliated entities.
Up to 29,000,000 SVS may be issued from treasury pursuant to the LTIP. The number of SVS that may be issued from treasury under the LTIP to directors is limited to 2,000,000; however, the Corporation decided in 2004 that stock option grants under the LTIP would no longer be made to directors. Under the LTIP, as of February 13, 2019, 18,544,730 SVS have been issued from treasury, 345,577 SVS are issuable under outstanding stock options, 385,491 SVS are issuable under outstanding RSUs, and 690,429 SVS are issuable under outstanding PSUs assuming vesting at 100% of target (1,380,858 SVS are issuable under outstanding PSUs assuming vesting at 200% of target). Accordingly, as of February 13, 2019, 10,455,270 SVS are reserved for issuance from treasury pursuant to current and potential future grants of securities‑based compensation under the LTIP (including PSUs assuming vesting at 100% of target). In addition, the Corporation may satisfy obligations under the LTIP by acquiring SVS in the open market.
As of February 13, 2019, the Corporation had a “gross overhang” of 7.1% under the LTIP. “Gross overhang” refers to the total number of shares reserved for issuance from treasury under equity plans at any given time relative to the total number of shares outstanding, including shares reserved for outstanding stock options, RSUs and PSUs (assuming vesting at 100% of target). The Corporation’s “net overhang” (
i.e.
the total number of shares that have been reserved for issuance from treasury to satisfy outstanding equity grants to employees relative to the total number of shares outstanding) was 1.0% (including PSUs assuming vesting at 100% of target) .
125
As of December 31, 2018, the Corporation had an “overhang” for stock options of 6.54%, representing the number of shares reserved for outstanding stock options as at such date, together with shares reserved for potential future grants of stock options, relative to the total number of shares outstanding as at such date.
The Corporation had a “burn rate” for the LTIP for each of the years 2018, 2017, and 2016 of 0.0%, 1.6%, and 0.5%, respectively. “Burn rate” is calculated by dividing the number of awards granted during the applicable year (including the target amount of PSUs granted), by the weighted average number of securities outstanding for the applicable year.
The LTIP limits the number of SVS that may be (a) reserved for issuance to insiders (as defined under TSX rules for this purpose), and (b) issued within a one‑year period to insiders pursuant to stock options, rights or share units granted pursuant to the LTIP, together with SVS reserved for issuance under any other employee‑related plan of the Corporation or stock options for services granted by the Corporation, in each case to 10% of the aggregate issued and outstanding SVS and MVS of the Corporation. The LTIP also limits the number of SVS that may be reserved for issuance to any one participant pursuant to stock options, SARs or share units granted pursuant to the LTIP, together with SVS reserved for issuance under any other employee‑related equity plan of the Corporation or stock options for services granted by the Corporation, to 5% of the aggregate issued and outstanding SVS and MVS.
Vested stock options issued under the LTIP may be exercised during a period determined as provided in the LTIP, which may not exceed ten years. The LTIP also provides that, unless otherwise determined by the Board of Directors, stock options will terminate within specified time periods following the termination of employment of an eligible participant with the Corporation or affiliated entities, including in connection with a change of control. The exercise price for stock options issued under the LTIP is the closing price for SVS on the last business day prior to the grant. The TSX closing price is used for Canadian employees and the NYSE closing price is used for all other employees. The exercise of stock options may be subject to vesting conditions, including specific time schedules for vesting and performance‑based conditions such as share price and financial results. The grant of stock options to, or exercise of stock options by, an eligible participant may also be subject to certain share ownership requirements.
The interest of any participant under the LTIP is generally not transferable or assignable. However, the LTIP does provide that a participant may assign his or her rights to a spouse, or a personal holding company or family trust controlled by the participant, of which any combination of the participant, the participant’s spouse, minor children or grandchildren are shareholders or beneficiaries, as applicable.
Under the LTIP, eligible participants may be granted SARs, a right to receive a cash amount equal to the amount, if any, by which the market price of the SVS at the time of exercise of the SAR exceeds the market price of the SVS at the time of the grant. The market price used for this purpose is the weighted average price for SVS during the five trading days preceding the date of determination. The TSX market price is used for Canadian employees and the NYSE market price is used for all other employees. Such amounts may also be payable by the issuance of SVS (at the discretion of the Corporation). The exercise of SARs may also be subject to conditions similar to those which may be imposed on the exercise of stock options. To date, the Corporation has not granted any SARs under the LTIP.
Under the LTIP, eligible participants may be allocated share units in the form of PSUs or RSUs. Each vested RSU and PSU entitles the holder to receive one SVS on the applicable release date (however, the number of PSUs that may vest range from 0% to 200% of a target amount). The issuance of such shares may be subject to vesting requirements similar to those described above with respect to the exercisability of stock options and SARs, including such time or performance‑based conditions as may be determined by the Board of Directors in its discretion. The number of SVS that may be issued to any one person pursuant to the share unit program shall not exceed 1% of the aggregate issued and outstanding SVS and MVS. The number of SVS that may be issued under share units in the event of termination of employment without cause, death or long term disability is subject to pro-ration, unless otherwise determined by the Corporation. The LTIP provides for the express designation of share units as either RSUs (restricted share units), which have time-based vesting conditions or PSUs (performance share units), which have performance-based vesting conditions over a specified period. In the event a holder of PSUs retires, unless otherwise determined by the Corporation, the pro-rated vesting of such PSUs shall be determined based on the actual performance achieved during the period specified for the grant by the Corporation.
The following types of amendments to the LTIP or the entitlements granted under it require the approval of the holders of the voting securities by a majority of votes cast by shareholders present or represented by proxy at a meeting:
|
(a)
|
increasing the maximum number of SVS that may be issued under the LTIP;
|
126
|
(b)
|
reducing the exercise price of an outstanding stock option (including cancelling and, in conjunction therewith, regranting a stock option at a reduced exercise price);
|
|
(c)
|
extending the term of any outstanding stock option or SAR;
|
|
(d)
|
expanding the rights of participants to assign or transfer a stock option, SAR or share unit beyond that currently contemplated by the LTIP;
|
|
(e)
|
amending the LTIP to provide for other types of security‑based compensation through equity issuance;
|
|
(f)
|
permitting a stock option to have a term of more than ten years from the grant date;
|
|
(g)
|
increasing or deleting the percentage limit on SVS issuable or issued to insiders under the LTIP;
|
|
(h)
|
increasing or deleting the percentage limit on SVS reserved for issuance to any one person under the LTIP (being 5% of the Corporation’s total issued and outstanding SVS and MVS);
|
|
(i)
|
adding to the categories of participants who may be eligible to participate in the LTIP; and
|
|
(j)
|
amending the amendment provision,
|
subject to the application of the anti‑dilution or re‑organization provisions of the LTIP.
The Board may approve amendments to the LTIP or the entitlements granted under it without shareholder approval, other than those specified above as requiring approval of the shareholders, including, without limitation:
|
(a)
|
clerical changes (such as a change to correct an inconsistency or omission or a change to update an administrative provision);
|
|
(b)
|
a change to the termination provisions for the LTIP or for a stock option as long as the change does not permit the Corporation to grant a stock option with a termination date of more than ten years from the date of grant or extend an outstanding stock option’s termination date beyond such date; and
|
|
(c)
|
a change deemed necessary or desirable to comply with applicable law or regulatory requirements.
|
Celestica Share Unit Plan
The CSUP provides for the issuance of RSUs and PSUs in the same manner as provided in the LTIP, except that the Corporation may not issue shares from treasury to satisfy its obligations under the CSUP and there is no limit on the number of share units that may be issued as RSUs and PSUs under the terms of the CSUP. The share units may be subject to vesting requirements, including any time-based conditions established by the Board of Directors at its discretion. The vesting of PSUs also requires the achievement of specified performance‑based conditions as determined by the Compensation Committee. There is no “burn rate” for the CSUP because issuances under the CSUP are not from treasury and are therefore non-dilutive.
Pension Plans
The following table provides details of the amount of Celestica’s contributions to its defined contribution pension plans on behalf of the NEOs, and the accumulated value thereunder as of December 31, 2018 for each NEO.
127
Table 19: Defined Contribution Pension Plan
|
Name
|
Accumulated Value
at Start of Year ($) |
Compensatory
($) |
Accumulated Value
at End of Year (1) ($) |
|
Robert A. Mionis
|
$391,354
|
$132,613
|
$507,632
|
|
Mandeep Chawla
|
$167,375
|
$48,692
|
$215,918
|
|
Michael P. McCaughey
(2)
|
$515,797
|
$61,992
|
$585,857
|
|
Jack J. Lawless
(2)
|
$110,220
|
$44,230
|
$143,159
|
|
Todd C. Cooper
|
$ -
|
$27,568
|
$26,141
|
|
(1)
|
The difference between (i) the sum of the Accumulated Value at Start of Year column plus the Compensatory column and (ii) the Accumulated Value at End of Year column is attributable to non-compensatory changes in the Corporation’s accrued obligations during the year ended December 31, 2018.
|
|
(2)
|
The difference between the Accumulated Value at Start of Year reported here and the Accumulated Value at End of Year reported in the 2017 Annual Report for Messrs. Mionis, Chawla and McCaughey is attributable to different exchange rates used in the 2017 Annual Report and in this Annual Report. The exchange rate used in the 2017 Annual Report was $1.00 = C$1.2984.
|
Canadian Pension Plans
Messrs. Chawla and McCaughey participate in the Corporation’s registered pension plan for Canadian employees (the “Canadian Pension Plan”) which is a defined contribution plan. The Canadian Pension Plan allows employees to choose how the Corporation’s contributions are invested on their behalf within a range of investment options provided by third-party fund managers. Retirement benefits depend upon the performance of the investment options chosen. Messrs. Chawla and McCaughey also participate in an unregistered supplementary pension plan (the “Canadian Supplementary Plan”). This is also a defined contribution plan through which the Corporation provides an annual contribution of an amount equal to the difference between (i) the maximum annual contribution limit as determined in accordance with the formula set out in the Canadian Pension Plan and with Canada Revenue Agency rules and (ii) 8% of the total base salary and paid annual incentives. Notional accounts are maintained for each participant in the Canadian Supplementary Plan. Participants are entitled to select from among the investment options available in the Canadian Pension Plan for the purpose of determining the return on their Canadian Supplementary Plan notional accounts.
U.S. Pension Plans
Messrs. Mionis, Lawless and Cooper participate in the Corporation’s U.S. pension plans comprised of two defined contribution retirement programs, one of which qualifies as a deferred salary arrangement under section 401(k) of the Internal Revenue Code (United States) (the “401(k) Plan”). Under the 401(k) Plan, participating employees may defer 100% of their pre-tax earnings subject to any statutory limitations. The Corporation may make contributions for the benefit of eligible employees. The 401(k) Plan allows employees to choose how their account balances are invested on their behalf within a range of investment options provided by third-party fund managers. The Corporation contributes: (i) 3% of eligible compensation for the participant, and (ii) up to an additional 3% of eligible compensation by matching 50% of the first 6% contributed by the participant. The maximum contribution of the Corporation to the 401(k) Plan, based on the Internal Revenue Code rules and the 401(k) Plan formula for 2018 was $18,500 (plus an additional $6,000 for an individual over the age of 50). Messrs. Mionis, Lawless and Cooper also participate in a supplementary retirement plan that is also a defined contribution plan (the “U.S. Supplementary Plan”). Under the U.S. Supplementary Plan, the Corporation contributes to the participant an annual amount equal to the difference between 8% of the participant’s salary and paid incentive and the amount that Celestica would contribute to the 401(k) Plan assuming the participant contributes the amount required to receive the matching 50% contribution by Celestica. A notional account is maintained for Messrs. Mionis, Lawless and Cooper, and they are entitled to select from among the investment options available in the 401(k) Plan for the purpose of determining the return on their notional accounts.
Termination of Employment and Change in Control Arrangements with Named Executive Officers
The Corporation has entered into employment agreements with certain of its NEOs in order to provide certainty to the Corporation and such NEOs with respect to issues such as obligations of confidentiality, non‑solicitation and non‑competition after termination of employment, the amount of severance to be paid in the event of termination of the NEO’s employment, and to provide a retention incentive in the event of a change in control scenario.
128
Mr. Mionis
The CEO Employment Agreement provides that Mr. Mionis is entitled to certain severance benefits if, during a change of control period or a potential change of control period at the Corporation, he is terminated without cause or resigns for good reason as defined in his agreement (a “double trigger” provision) where good reason includes, without limitation, a material adverse change in position or duties or a specified reduction(s) in total compensation (including base salary, equity and CTI award). A change of control period is defined in his agreement as the 12-month period following a change of control. A potential change of control period is defined in his agreement as the period beginning upon the occurrence of a potential change of control and ending on the earlier of: (i) the end of the 6-month period following a potential change of control; and (ii) a change of control.
The amount of the severance payment for Mr. Mionis is equal to: (i) base salary up to and including the termination date; (ii) a lump sum amount equal to his target payment under the CTI prorated to the date of termination; (iii) a lump sum amount equal to any payments accrued under the CTI in respect of the fiscal year preceding the fiscal year during which his termination occurs, if any; (iv) a lump sum amount equal to two times his eligible earnings (such eligible earnings calculated as his annual base salary plus the lesser of (a) his target payment under the CTI for the fiscal year during which his termination occurs based on target achievement of the CPF of 1.0 and an IPF of 1.0, and (b) payment received under the CTI for the fiscal year preceding the fiscal year during which termination occurs); (v) vacation pay earned but unpaid up to and including the date of termination; (vi) a lump sum cash settlement of contributions to, or continuation of his pension and retirement plans for a two‑year period; and (vii) a one-time lump sum payment of $100,000 in lieu of all future benefits and perquisites. In addition, upon a change of control and termination without cause or for good reason (a) the stock options granted to him vest immediately, (b) the unvested PSUs granted to him vest immediately at the target level of performance specified in the terms of the PSU grant, and (c) the RSUs granted to him shall vest immediately.
Outside a change in control period, upon termination without cause or resignation for good reason as defined in his agreement, the amount of the severance payment for Mr. Mionis is equal to: (a) base salary up to and including the termination date; (ii) a lump sum amount equal to any payments accrued under the CTI in respect of the fiscal year preceding the fiscal year during which his termination occurs; (iii) a lump sum amount equal to two times his eligible earnings (as calculated in the paragraph above); (iv) vacation pay earned but unpaid up to and including the date of termination; (v) a one-time lump sum payment of $100,000 in lieu of all future benefits and perquisites; and (vi) a lump sum cash settlement of contributions to, or continuation of his pension and retirement plans for a two‑year period. In addition, (a) vested stock options may be exercised for a period of 30 days and unvested stock options are forfeited on the termination date, (b) RSUs shall vest immediately on a
pro rata
basis based on the ratio of (i) the number of full years of employment completed between the date of grant and termination of employment, to (ii) the number of years between the date of grant and the vesting date, and (c) PSUs vest based on actual performance on a
pro rata
basis based on the ratio of (i) the number of full years of employment completed between the date of grant and the termination of employment, to (ii) the number of years between the date of grant and the vesting date.
The foregoing entitlements are conferred on Mr. Mionis in part upon his fulfillment of certain confidentiality, non-solicitation and non-competition obligations for a period of two years following termination of employment. In the event of a breach of such obligations, the Corporation is entitled to seek appropriate legal, equitable and other remedies, including injunctive relief.
The following table summarizes the incremental payments and benefits to which Mr. Mionis would have been entitled upon a change in control occurring on December 31, 2018, or if his employment had been terminated on December 31, 2018 as a result of a change in control, retirement or termination without cause (or with good reason).
Table 20: Mr. Mionis’ Benefits
|
Cash
Portion |
Value of Option-Based and Share-Based Awards
(1)
|
Other
Benefits (2) |
Total
|
|
|
Termination without Cause/with Good Reason or Change in Control with Termination
|
$3,724,082
|
—
|
$398,227
|
$4,122,309
|
|
Change in Control with no Termination or Retirement
|
—
|
—
|
—
|
—
|
|
(1)
|
No incremental amount would be received in respect of accelerated vesting of options, RSUs and PSUs, if any, on the assumption that the discount rate applied to calculate the net present value of the accelerated entitlements is not greater than the rate at which the SVS would otherwise be expected to appreciate over the period of acceleration.
|
(2) Other benefits consist of group health benefits and pension plan contribution.
129
Messrs. Chawla, McCaughey, Lawless and Cooper
Messrs. Chawla, McCaughey, Lawless and Cooper are subject to the Executive Policy Guidelines which provide the following:
|
Termination without cause
|
• eligible to receive a severance payment up to two times annual base salary and the lower of target or actual annual incentive for the previous year (“Eligible Earnings”), subject to adjustment for factors including length of service, together with a portion of their annual incentive for the year, prorated to the date of termination
• (a) vested stock options may be exercised for a period of 30 days and unvested stock options are forfeited on the termination date, (b) RSUs shall vest immediately on a
pro
rata
basis based on the ratio of (i) the number of full years of employment completed between the date of grant and termination of employment, to (ii) the number of years between the date of grant and the vesting date, and (c) PSUs vest based on actual performance on a
pro rata
basis based on the ratio of (i) the number of full years of employment completed between the date of grant and the termination of employment, to (ii) the number of years between the date of grant and the vesting date
|
|
Termination without cause within two years following a change in control of the Corporation (“double trigger” provision)
|
• eligible to receive a severance payment up to two times Eligible Earnings, subject to adjustment for factors including length of service, together with a portion of their annual incentive for the year, prorated to the date of termination
• (a) all unvested stock options vest on the date of change in control, (b) all unvested RSUs vest on the date of change in control, and (c) all unvested PSUs vest on the date of change in control at target level of performance unless the terms of a PSU grant provide otherwise, or on such other more favourable terms as the Board may in its discretion provide
|
|
Termination with cause
|
• no severance benefit is payable
• all unvested equity is forfeited on the termination date
|
|
Retirement
|
• (a) stock options continue to vest and are exercisable until the earlier of three years following retirement and the original expiry date, (b) RSUs will continue to vest on their vesting dates, and (c) PSUs vest based on actual performance on a
pro rata
basis based on the percentage represented by the number of days between the date of grant and the date of retirement as compared to the total number of days from the date of grant to the scheduled release date for the issuance of shares in respect of vested PSUs
|
|
Resignation
|
• no severance benefit is payable
• (a) vested stock options may be exercised for a period of 30 days and unvested stock options are forfeited on the resignation date and (b) all unvested RSUs and PSUs are forfeited on the resignation date
|
Additionally, the Executive Policy Guidelines provide that executives whose employment has been terminated will have their pension and benefits coverage treated according to the terms of the plans in which they participate.
The entitlements described in the above table are only conferred on eligible executives who fulfill certain confidentiality, non‑solicitation and non‑competition obligations for a period of two years following termination of their employment.
The following tables summarize the incremental payments to which Messrs. Chawla, McCaughey, Lawless and Cooper would have been entitled upon a change in control occurring on December 31, 2018, or if their employment had been terminated on December 31, 2018 as a result of a change in control, retirement or termination without cause.
Table 21: Mr. Chawla’s Benefits
|
Cash
Portion (1) |
Value of Option-Based and Share-Based Awards
(2)
|
Other
Benefits |
Total
|
|
|
Termination without Cause or Change in Control with Termination
|
$1,205,522
|
—
|
—
|
$1,205,522
|
|
Change in Control with no Termination or Retirement
|
—
|
—
|
—
|
—
|
(1) Amounts in this column assume a maximum severance payment of two times Eligible Earnings but the actual amounts payable could be less.
|
(2)
|
No incremental amount would be received in respect of accelerated vesting of options, RSUs and PSUs, if any, on the assumption that the discount rate applied to calculate the net present value of the accelerated entitlements is not greater than the rate at which the SVS would otherwise be expected to appreciate over the period of acceleration.
|
130
Table 22: Mr. McCaughey’s Benefits
|
Cash
Portion (1) |
Value of Option-Based and Share-Based Awards
(2)
|
Other
Benefits |
Total
|
|
|
Termination without Cause or Change in Control with Termination
|
$1,549,260
|
—
|
—
|
$1,549,260
|
|
Change in Control with no Termination or Retirement
|
—
|
—
|
—
|
—
|
(1) Amounts in this column assume a maximum severance payment of two times Eligible Earnings but the actual amounts payable could be less.
|
(2)
|
No incremental amount would be received in respect of accelerated vesting of options, RSUs and PSUs, if any, on the assumption that the discount rate applied to calculate the net present value of the accelerated entitlements is not greater than the rate at which the SVS would otherwise be expected to appreciate over the period of acceleration.
|
Table 23: Mr. Lawless’ Benefits
|
Cash
Portion (1) |
Value of Option-Based and Share-Based Awards
(2)
|
Other
Benefits |
Total
|
|
|
Termination without Cause or Change in Control with Termination
|
$1,514,508
|
—
|
—
|
$1,514,508
|
|
Change in Control with no Termination or Retirement
|
—
|
—
|
—
|
—
|
(1) Amounts in this column assume a maximum severance payment of two times Eligible Earnings but the actual amounts payable could be less.
|
(2)
|
No incremental amount would be received in respect of accelerated vesting of options, RSUs and PSUs, if any, on the assumption that the discount rate applied to calculate the net present value of the accelerated entitlements is not greater than the rate at which the SVS would otherwise be expected to appreciate over the period of acceleration.
|
Table 24: Mr. Cooper’s Benefits
|
Cash
Portion (1) |
Value of Option-Based and Share-Based Awards
(2)
|
Other
Benefits |
Total
|
|
|
Termination without Cause or Change in Control with Termination
|
$920,000
|
—
|
—
|
$920,000
|
|
Change in Control with no Termination or Retirement
|
—
|
—
|
—
|
—
|
(1) Amounts in this column assume a maximum severance payment of two times Eligible Earnings but the actual amounts payable could be less.
|
(2)
|
No incremental amount would be received in respect of accelerated vesting of options, RSUs and PSUs, if any, on the assumption that the discount rate applied to calculate the net present value of the accelerated entitlements is not greater than the rate at which the SVS would otherwise be expected to appreciate over the period of acceleration.
|
131
Performance Graph
The SVS have been listed and posted for trading under the symbol “CLS” on the NYSE and the TSX since June 30, 1998 (except for the period commencing on November 8, 2004 and ending on May 15, 2006 during which the symbol on the TSX was CLS.SV). The following chart compares the cumulative TSR of C$100 invested in SVS with the cumulative TSR of the S&P/TSX Composite Total Return Index for the period from December 31, 2013 to December 31, 2018.
An investment in the Corporation on December 31, 2013 would have resulted in an 8.3% increase in value over the five‑year period ended December 31, 2018 compared with a 22% increase that would have resulted from an investment in the S&P/TSX Composite Total Return Index over the same period.
Over the same period, total NEO Compensation (as defined below) increased by 5.4%. In the medium to long term, compensation of the Corporation’s NEOs is directly impacted by the market value of the SVS, as a significant portion of NEO Compensation is awarded in the form of equity based incentives with payout tied to the market value of the SVS.
For the purpose of the above discussion, “NEO Compensation” is defined as aggregate annual compensation (
i.e.
the sum of actual salary paid, actual CTI awards paid and the grant date fair value of share-based awards and option-based awards (if any) but excluding all other compensation). The executive compensation values have been calculated for the NEOs based on the same methodology set out in Table 15. This is a methodology adopted by Celestica solely for the purposes of this comparison. It is not a recognized or prescribed methodology for this purpose, and may not be comparable to methodologies used by other issuers for this purpose.
EXECUTIVE SHARE OWNERSHIP
The Corporation has executive share ownership guidelines (the “Executive Share Ownership Guidelines”) which require specified executives to hold a multiple of their base salary in securities of the Corporation as shown in Table 25
.
Executives subject to the Executive Share Ownership Guidelines are expected to achieve the specified ownership within a period of five years following the later of: (i) the date of hire, or (ii) the date of promotion to a level subject to ownership guidelines. Compliance is reviewed annually as of December 31 of each year. The Compensation Committee reviewed the Executive Share Ownership Guidelines in April 2018 and determined no policy changes were required. The table below sets forth the compliance status of the applicable NEOs with the Executive Share Ownership Guidelines as of December 31, 2018:
132
Table 25: Share Ownership Guidelines
|
Name
|
Ownership Guidelines
|
Share and Share Unit Ownership
(Value) (1) |
Share and Share Unit Ownership
(Multiple of Salary) |
|
Robert A. Mionis
(2)
|
$4,750,000
(5 × salary)
|
$6,455,764
|
6.8x
|
|
Mandeep Chawla
(3)
|
$1,350,000
(3 × salary)
|
$1,089,142
|
2.4x
|
|
Michael P. McCaughey
|
$1,425,000
(3 × salary)
|
$2,330,663
|
4.9x
|
|
Jack J. Lawless
|
$1,380,000
(3 × salary)
|
$1,653,228
|
3.6x
|
|
Todd C. Cooper
|
$1,380,000
(3 × salary)
|
$2,871,009
|
6.2x
|
|
(1)
|
Includes the following, as of December 31, 2018: (i) SVS beneficially owned, (ii) all unvested RSUs, and (iii) PSUs that vested on February 1, 2019 at 50% of target, which, on December 31, 2018, was the Corporation’s anticipated payout and was in fact the resulting payout; the value of which was determined using a share price of $8.77, the closing price of SVS on the NYSE on December 31, 2018.
|
|
(2)
|
Mr. Mionis’ Share and Share Unit Ownership (Value) of $6,455,764 consists of the following holdings: (i) $1,665,555 of SVS, (ii) $3,580,221 of unvested RSUs and (iii) $1,209,988 of PSUs that vested on February 1, 2019; the value of which was determined using a share price of $8.77, being the closing price of SVS on the NYSE on December 31, 2018.
|
|
(3)
|
Mr. Chawla was appointed as CFO of the Corporation effective October 19, 2017 and has five years from that date to achieve the required share ownership.
|
The CEO Employment Agreement provides that, in the event of the cessation of Mr. Mionis’ employment with the Corporation for any reason, he will be required to retain the share ownership level set out in the Executive Share Ownership Guidelines on his termination date for the 12 month period immediately following his termination date.
C. Board Practices
Members of the Board are elected until the close of the next annual meeting of shareholders or until their successors are elected or appointed (unless such position is earlier vacated in accordance with the Corporation's by-laws). Each member of our senior management is appointed to serve at the discretion of our Board (subject to the terms and conditions of their respective employment agreements, if any). See Item 6(A), "Directors and Senior Management" for details for the period during which each director has served in his/her office. Our non-management directors meet
in camera
(
i.e.
, without our chief executive officer, chief financial officer or other members of management present) from time to time to consider such matters as they deem appropriate. In accordance with NYSE listing standards, "non-management" directors are all those who are not executive officers of the Corporation. We have designated the Chair of the Board as the presiding non-management director at all
in camera
sessions. The non-management directors can set their own agenda, maintain minutes and report back to the Board as a whole. Among the items that the non-management directors meet privately
in camera
to review is the performance of the Corporation's executive officers. Our Audit Committee, which consists solely of independent, non-management directors, met
in camera
immediately following each Audit Committee meeting in
2018
.
The Board has determined that Mr. Cascella, Mr. Chopra, Mr. DiMaggio, Mr. Etherington, Ms. Koellner, Ms. Perry, Mr. Ryan and Mr. Wilson (constituting a majority of the Board) are independent directors under applicable independence standards in Canada and under NYSE listing standards. Our independent directors hold an executive session at least once annually.
Except for the right to receive deferred compensation, no director is entitled to benefits from Celestica under any service contracts when they cease to serve as a director. See Item 6(B), "Compensation."
Communications with the Board
Shareholders and other interested parties may communicate with the Board, the Audit Committee, the Compensation Committee, any individual director, or all non-management or independent directors as a group, by writing to:
133
until April 1, 2019:
Celestica Inc.
844 Don Mills Road
Toronto, Ontario, Canada M3C 1V7
Attention: Board of Directors
after April 1, 2019:
Celestica Inc.
5140 Yonge Street, Suite 1900
Toronto, Ontario, Canada M2N 6L7
Attention: Board of Directors
If the letter is from a shareholder, the letter should state that the sender is a shareholder. Under a process approved by the Board, depending on the subject matter, management will:
|
•
|
forward the letter to the director or directors to whom it is addressed; or
|
|
•
|
attempt to handle the matter directly (where information about the Corporation or its stock is requested); or
|
|
•
|
not forward the letter if it is primarily commercial in nature or relates to an improper or irrelevant topic.
|
A summary of all relevant communications that are received after the last meeting of the full Board and which are not forwarded will be presented at each meeting of the Board, together with any specific communication requested by a director to be presented to the Board.
Shareholders and other interested parties who have concerns or complaints relating to accounting, internal accounting controls or other matters may also contact the Audit Committee by writing to the address set out above or by reporting the matter through our Ethics Hotline toll free at 1-888-312-2689. Callers outside the United States or Canada can place a collect call to 1-503-726-2457. Alternatively, concerns or complaints can be reported using a secure on-line web-based tool at
www.ethics.celestica.com
.
All communications will be handled in a confidential manner, to the degree that Canadian and U.S. laws allow. Communications may be made on an anonymous basis; however, in these cases the reporting individual must provide sufficient details for the matter to be reviewed and resolved. The Corporation will not tolerate any retaliation against an employee who makes a good faith report.
Board Committees
The Board has three standing committees, each with a specific mandate (charter): the Audit Committee, the Compensation Committee, and the Nominating and Corporate Governance Committee. All of these committees are composed solely of independent directors (as that term is defined by applicable Canadian and SEC rules and in the NYSE listing standards, as applicable).
Audit Committee
The Audit Committee in
2018
consisted of Ms. Koellner (Chair), Mr. Chopra (commencing upon his election to the Board in April 2018), Mr. DiMaggio, Mr. Etherington, Ms. Perry, Mr. Ryan and Mr. Wilson, all of whom the Board determined to be independent directors for audit committee purposes (as that term is defined by applicable Canadian and SEC rules and in the NYSE listing standards) and financially literate. Mr. Cascella, who was appointed to the committee effective February 1, 2019, meets such independence definitions and is financially literate. All of the audit committee members have held executive positions with large corporations or financial services companies. The Audit Committee has a well-defined mandate which, among other things, sets out its relationship with, and expectations of, the external auditors, including the determination of the independence of the external auditors and approval of any non-audit services of the external auditor; the engagement, evaluation, remuneration and termination of the external auditor; its relationship with, and expectations of, the internal auditor function and its oversight of internal control; and the disclosure of financial and related information. In addition to fulfilling the responsibilities as set forth in its mandate, the Audit Committee has established procedures for a formal annual review of the qualifications, expertise, resources and the overall performance of the Corporation's external auditor, including conducting a survey of each member of the Audit Committee and of certain key management personnel. The Audit Committee has direct communication channels with the internal and external auditors to discuss and review specific issues and has the authority to retain and fund such independent legal, accounting,
134
or other advisors as it may consider appropriate. The Audit Committee reviews and approves the mandate and plan of the internal audit department on an annual basis. The Audit Committee's duties include responsibility for reviewing financial statements with management and the auditors, monitoring the adequacy of Celestica's internal control procedures, and reviewing the adequacy of Celestica's processes for identifying and managing risk.
The Audit Committee has established procedures for: (i) receipt, retention, and treatment of complaints regarding accounting, internal accounting controls, or auditing matters and (ii) confidential, anonymous submission by employees of concerns regarding questionable accounting or auditing matters. A copy of the Audit Committee Mandate is available on our website at
www.celestica.com
.
Members of the Audit Committee do not serve on more than three audit committees of public companies, including that of Celestica.
See Item 16A "Audit Committee Financial Expert" for a discussion of the Corporation's Audit Committee Financial Experts.
Audit Committee Report:
The Audit Committee has reviewed and discussed the audited financial statements with management;
The Audit Committee has discussed with the independent auditors the matters required to be discussed by applicable Public Company Accounting Oversight Board Auditing Standards;
The Audit Committee has received the written disclosures and the letter from the independent auditor as required by the Public Company Accounting Oversight Board regarding the independent auditor's communications with the Audit Committee concerning independence, and has discussed with the independent auditor the independent auditor's independence; and
Based on such review and discussions, the Audit Committee recommended to the Board that the audited financial statements be included in this Annual Report for the year ended
December 31, 2018
for filing with the SEC.
The Audit Committee:
Mr. Cascella
Mr. Chopra
Mr. DiMaggio
Mr. Etherington
Ms. Koellner
Ms. Perry
Mr. Ryan
Mr. Wilson
Compensation Committee
The Compensation Committee in
2018
consisted of Mr. Ryan (Chair), Mr. Chopra (commencing upon his election to the Board in April 2018), Mr. DiMaggio, Mr. Etherington, Ms. Koellner, Ms. Perry and Mr. Wilson, all of whom the Board determined to be independent directors for compensation committee purposes pursuant to the applicable Canadian and SEC rules and the NYSE listing standards. Mr. Cascella, who was appointed to the committee effective February 1, 2019, meets such independence definitions. It is the responsibility of the Compensation Committee to define and communicate compensation policies and principles that reflect and support our strategic direction, business goals and desired culture. Pursuant to its mandate, the Compensation Committee: reviews and approves Celestica's overall reward/compensation policy, including an executive compensation policy that is consistent with competitive practice and supports organizational objectives and shareholder interests; reviews, modifies, as appropriate, and approves the elements of our incentive compensation plans and equity-based plans, including plan design, performance targets, administration and total funds/shares reserved for payment; reviews the corporate goals and objectives relevant to the compensation of the CEO, as approved by the Board, evaluates the CEO's performance in light of these goals and objectives, and sets the compensation of the CEO based on this evaluation; approves the compensation of our most senior executives; maintains and reviews our succession plans for key executive positions; reviews material changes to our organizational structure and human resource policies; and regularly reviews the risks associated with our executive compensation policies and practices. See Item 6(B), "Compensation" for details regarding our processes and procedures for the consideration and determination of executive and director compensation and the role of our compensation consultant in making recommendations to the Compensation Committee regarding executive officer and director compensation.
135
A copy of the Compensation Committee Mandate is available on our website at
www.celestica.com
.
Compensation Committee Report:
The Compensation Committee has reviewed and discussed the Compensation Discussion and Analysis with management and based on such review and discussions, the Compensation Committee recommended to the Board that the Compensation Discussion and Analysis be included in this Annual Report for the year ended
December 31, 2018
.
The Compensation Committee:
Mr. Cascella
Mr. Chopra
Mr. DiMaggio
Mr. Etherington
Ms. Koellner
Ms. Perry
Mr. Ryan
Mr. Wilson
Nominating and Corporate Governance Committee
The Nominating and Corporate Governance Committee in
2018
consisted of Mr. Etherington (Chair), Mr. Chopra (commencing upon his election to the Board in April 2018), Mr. DiMaggio, Ms. Koellner, Ms. Perry, Mr. Ryan and Mr. Wilson, all of whom were determined by the Board to be independent directors pursuant to applicable Canadian rules and NYSE listing standards. Mr. Cascella, who was appointed to the committee effective February 1, 2019, meets such independence definitions. The Nominating and Corporate Governance Committee recommends to the Board the criteria for selecting candidates for nomination to the Board and the individuals to be nominated for election by our shareholders. The committee's mandate includes making recommendations to the Board relating to the Corporation's approach to corporate governance; reviewing the Corporation's corporate governance guidelines and recommending appropriate changes to the Board; and assessing the effectiveness of the Board and its committees.
A copy of the Nominating and Corporate Governance Committee Mandate is available on our website at
www.celestica.com
.
D. Employees
As of
December 31, 2018
, we employed approximately
28,700
permanent and temporary (contract) employees worldwide (
December 31, 2017
—
27,500
;
December 31, 2016
—
26,400
). Some of our employees in China, Japan, Mexico, Romania, Singapore and Spain are represented by unions or are covered by collective bargaining agreements. We believe we have a productive and collaborative working relationship between management and the relevant unions. We believe that our employee relationships are generally positive and stable.
The following table sets forth information concerning our employees (permanent and temporary) by geographic location for the past three fiscal years:
|
|
Number of Employees
|
|||||||||
|
Date
|
Americas
|
Europe
|
Asia
|
Total
|
||||||
|
December 31, 2016
|
4,600
|
|
2,400
|
|
19,400
|
|
26,400
|
|
||
|
December 31, 2017
|
5,900
|
|
2,800
|
|
18,800
|
|
27,500
|
|
||
|
December 31, 2018
|
6,900
|
|
3,900
|
|
17,900
|
|
28,700
|
|
||
Given the variable nature of our project flow and the quick response time required by our customers, it is critical that we be able to quickly adjust our production up or down to maximize efficiency. To achieve this, our approach has been to employ a skilled temporary labor force, as required. As at
December 31, 2018
, approximately
5,100
temporary (contract) employees (
December 31, 2017
—
4,100
;
December 31, 2016
—
3,400
) were engaged by us worldwide. We used, on average for the year, approximately 4,700 temporary (contract) employees in 2018.
136
E. Share Ownership
The following table sets forth certain information concerning the direct and beneficial ownership of shares of Celestica at
February 13, 2019
by each director, each NEO, each non-NEO executive officer, and all directors and executive officers of Celestica as a group as of such date. The address of each shareholder named below is Celestica's principal executive office.
|
Name of Beneficial Owner
(1)(2)
|
Number of Shares
(3)(4)
|
|
Percentage
of Class
|
|
Percentage of
all Equity Shares
(5)
|
|
Percentage of
Voting Power
|
|
William A. Etherington
|
10,000 SVS
|
|
*
|
|
*
|
|
*
|
|
Robert A. Cascella
|
0 SVS
|
—
|
—
|
—
|
|||
|
Deepak Chopra
|
0 SVS
|
—
|
—
|
—
|
|||
|
Daniel P. DiMaggio
|
0 SVS
|
|
—
|
|
—
|
|
—
|
|
Laurette T. Koellner
|
0 SVS
|
|
—
|
|
—
|
|
—
|
|
Carol S. Perry
|
0 SVS
|
|
—
|
|
—
|
|
—
|
|
Tawfiq Popatia
|
0 SVS
|
|
—
|
|
—
|
|
—
|
|
Eamon J. Ryan
|
0 SVS
|
|
—
|
|
—
|
|
—
|
|
Michael M. Wilson
|
0 SVS
|
|
—
|
|
—
|
|
—
|
|
Robert A. Mionis
|
593,906 SVS
|
|
*
|
|
*
|
|
*
|
|
Mandeep Chawla
|
38,986 SVS
|
*
|
*
|
*
|
|||
|
Elizabeth L. DelBianco
|
161,687 SVS
|
|
*
|
|
*
|
|
*
|
|
Todd C. Cooper
|
58,553 SVS
|
|
*
|
|
*
|
|
*
|
|
John ("Jack") J. Lawless
|
92,105 SVS
|
|
*
|
|
*
|
|
*
|
|
Jason Phillips
|
48,990 SVS
|
*
|
|
*
|
|
*
|
|
|
Michael P. McCaughey
|
120,461 SVS
|
|
*
|
|
*
|
|
*
|
|
Nicolas Pujet
|
9,256 SVS
|
|
*
|
|
*
|
|
*
|
|
All directors and executive officers as a group (17 persons)
|
1,133,944 SVS
|
|
*
|
|
*
|
|
*
|
|
*
|
Less than 1%.
|
|
(1)
|
As used in this table, beneficial ownership means sole or shared power to vote or direct the voting of the security, or the sole or shared investment power with respect to a security (
i.e
., the power to dispose, or direct a disposition, of a security). A person is deemed at any date to have beneficial ownership of any security that such person has a right to acquire within 60 days of such date. More than one person may be deemed to have beneficial ownership of the same securities. Information with respect to stock options held by each NEO, including exercise price and expiration date, is included in Table 16.
|
|
(2)
|
Information as to shares beneficially owned or shares over which control or direction is exercised is not within Celestica's knowledge. Except as otherwise disclosed, such information has been provided by each individual.
|
|
(3)
|
Includes SVS subject to a total of 270,839 stock options that are currently exercisable, or will be exercisable within 60 days of
February 13, 2019
, as follows: Mr. Mionis — 224,216 stock options; Ms. DelBianco — 46,623 stock options. With respect to Mr. Mionis: all of his options have an exercise price of C$17.52 and an expiration date of August 1, 2025. With respect to Ms. DelBianco: 22,742 of her options have an exercise price of C$8.26 and an expiration date of January 31, 2022, and 23,881 of her options have an exercise price of C$8.29 and an expiration date of January 28, 2023.
|
|
(4)
|
SVS refers to subordinate voting shares.
|
|
(5)
|
Represents the percentage beneficial ownership of the Company's subordinate voting shares and multiple voting shares in the aggregate.
|
Multiple voting shares and subordinate voting shares have different voting rights. Multiple voting shares entitle the holder to 25 votes per share and subordinate voting shares entitle the holder to one vote per share. Subordinate voting shares represent approximately 20% of the aggregate voting rights attached to Celestica's shares. Multiple voting shares represent approximately 80% of the voting rights attached to Celestica's shares. See Item 10(B), "Additional Information — Memorandum and Articles of Incorporation."
At
February 13, 2019
, 2 persons (each an executive officer) held stock options to acquire an aggregate of 0.27 million subordinate voting shares (see footnote (3) in the table above). These stock options were issued pursuant to our Long-Term Incentive
137
Plan. See Item 6(B), "Compensation" and note 13(b) to the Consolidated Financial Statements in Item 18 for a discussion of the different types of equity awards, including stock options, RSUs and PSUs, issuable to our employees. The following table sets forth information with respect to stock options outstanding as at
February 13, 2019
. No other Celestica employees hold outstanding stock options.
Outstanding Options
|
Beneficial Holders
|
Number of Subordinate
Voting Shares Under Option
|
Exercise Price
|
Date of Issuance
|
Date of Expiry
|
|||
|
Executive Officers
|
22,742
|
C$8.26
|
January 31, 2012
|
January 31, 2022
|
|||
|
23,881
|
C$8.29
|
January 28, 2013
|
January 28, 2023
|
||||
|
298,954
|
C$17.52
|
August 1, 2015
|
August 1, 2025
|
||||
A. Major Shareholders
The following table sets forth certain information concerning the direct and beneficial ownership of the shares of Celestica as of
February 13, 2019
by each person known to Celestica to own beneficially, directly or indirectly, 5% or more of the subordinate voting shares or multiple voting shares. Multiple voting shares (MVS in the table below) and subordinate voting shares (SVS in the table below) have different voting rights (see Item 6(E) above). Subordinate voting shares represent approximately 20% of the aggregate voting rights attached to Celestica's shares, and multiple voting shares represent approximately 80% of the aggregate voting rights attached to Celestica's shares. See Item 4(B) "Information on the Company — Business Overview — Controlling Shareholder Interest" above for additional information regarding our controlling shareholder, and Item 10(B), "Additional Information — Memorandum and Articles of Incorporation" for additional information regarding our share capital.
|
Name of Beneficial Owner
(1)
|
Number of
Shares
|
Percentage of
Class
|
Percentage of
All Equity Shares
|
Percentage of
Voting Power
|
||
|
Onex Corporation
(2)
|
18,600,193 MVS
|
100%
|
13.6%
|
79.7%
|
||
|
397,045 SVS
|
*
|
*
|
*
|
|||
|
Gerald W. Schwartz
(3)
|
18,600,193 MVS
|
100%
|
13.6%
|
79.7%
|
||
|
517,702 SVS
|
*
|
*
|
*
|
|||
|
Letko, Brosseau & Associates Inc.
(4)
|
22,173,121 SVS
|
18.8%
|
16.2%
|
3.8%
|
||
|
Total percentage of all equity shares and total percentage of voting power
|
30.2%
|
83.6%
|
||||
|
*
|
Less than 1%.
|
|
(1)
|
As used in this table, beneficial ownership means sole or shared power to vote or direct the voting of the security, or the sole or shared investment power with respect to a security (
i.e
., the power to dispose, or direct a disposition, of a security). A person is deemed at any date to have beneficial ownership of any security that such person has a right to acquire within 60 days of such date. More than one person may be deemed to have beneficial ownership of the same securities.
|
|
(2)
|
Includes 945,010 MVS held by a wholly-owned subsidiary of Onex. 814,546 of such MVS are subject to options granted to certain officers of Onex pursuant to certain Onex management investment plans, which options may be exercised upon specified dispositions by Onex (directly or indirectly) of Celestica's securities, with respect to which Onex has the right to vote or direct the vote ("MIP Options"), including 688,807 MIP Options granted to Mr. Schwartz (each of which MVS will, upon exercise of such options, be automatically converted into an SVS). The percentage ownership of SVS beneficially owned by Onex (assuming conversion of all MVS) was 13.5% as of February 15, 2017, 13.3% as of February 14, 2018, and 13.9% as of
February 13, 2019
.
|
The Corporation's Restated Articles of Incorporation (Articles) provide "coat-tail" protection to the holders of the subordinate voting shares by providing that the multiple voting shares will be converted automatically into subordinate voting shares upon any transfer thereof, except (i) a transfer to Onex or any affiliate of Onex or (ii) a transfer of 100% of the outstanding multiple voting shares to a purchaser who also has offered to purchase all of the outstanding subordinate voting shares for a per share consideration identical to, and otherwise on the same terms as, that offered for the multiple voting shares, and the multiple voting shares held by such purchaser thereafter shall be subject to the share provisions relating to conversion (including with respect to the provisions described herein) as if all references to Onex were references to such purchaser. In addition, if (i) any holder of any multiple
138
voting shares ceases to be an affiliate of Onex, (ii) Onex and its affiliates, collectively, cease to have the right, in all cases, to exercise the votes attached to, or to direct the voting of, any of the multiple voting shares held by Onex and its affiliates, such multiple voting shares shall convert automatically into subordinate voting shares on a one-for-one basis. For these purposes, (i) Onex includes any successor corporation resulting from an amalgamation, merger, arrangement, sale of all or substantially all of its assets, or other business combination or reorganization involving Onex, provided that such successor corporation beneficially owns directly or indirectly all multiple voting shares beneficially owned directly or indirectly by Onex immediately prior to such transaction and is controlled by the same person or persons as controlled Onex immediately prior to the consummation of such transaction; (ii) a corporation shall be deemed to be a subsidiary of another corporation if, but only if, (a) it is controlled by that other, or that other and one or more corporations each of which is controlled by that other, or two or more corporations each of which is controlled by that other, or (b) it is a subsidiary of a corporation that is that other's subsidiary; (iii) "affiliate" means a subsidiary of Onex or a corporation controlled by the same person or company that controls Onex; and (iv) "control" means beneficial ownership of, or control or direction over, securities carrying more than 50% of the votes that may be cast to elect directors if those votes, if cast, could elect more than 50% of the directors. For these purposes, a person is deemed to beneficially own any security which is beneficially owned by a corporation controlled by such person. In addition, if at any time the number of outstanding multiple voting shares shall represent less than 5% of the aggregate number of the outstanding multiple voting shares and subordinate voting shares, all of the outstanding multiple voting shares shall be automatically converted at such time into subordinate voting shares on a one-for-one basis. Onex, which beneficially owns, controls or directs, directly or indirectly all of the outstanding multiple voting shares, has entered into an agreement with Computershare Trust Company of Canada (as successor to the Montreal Trust Company of Canada), as trustee for the benefit of the holders of the subordinate voting shares, for the purpose of ensuring that the holders of subordinate voting shares will not be deprived of any rights under applicable take-over bid legislation to which they would be otherwise entitled in the event of a take-over bid (as that term is defined in applicable securities legislation) if multiple voting shares and subordinate voting shares were of a single class of shares. Subject to certain permitted forms of sale, such as identical or better offers to all holders of subordinate voting shares, Onex has agreed that it, and any of its affiliates that may hold multiple voting shares from time to time, will not sell any multiple voting shares, directly or indirectly, pursuant to a take-over bid (as that term is defined under applicable securities legislation) under circumstances in which any applicable securities legislation would have required the same offer or a follow-up offer to be made to holders of subordinate voting shares if the sale had been a sale of subordinate voting shares rather than multiple voting shares, but otherwise on the same terms.
The address of Onex is: c/o Onex Corporation, 161 Bay Street, P.O. Box 700, Toronto, Ontario, Canada M5J 2S1.
|
(3)
|
The number of shares beneficially owned, or controlled or directed, directly or indirectly, by Mr. Schwartz consists of 120,657 SVS owned by a company controlled by Mr. Schwartz, and all of the 18,600,193 MVS and 397,045 SVS beneficially owned, or controlled or directed, directly or indirectly, by Onex. Of Celestica's MVS beneficially owned by Onex, 814,546 MVS are subject to MIP Options, including the 688,807 MIP Options granted to Mr. Schwartz (each of which MVS will, upon exercise of such options, be automatically converted into an SVS), and 945,010 MVS are held by a wholly-owned subsidiary of Onex. Mr. Schwartz is the Chairman of the Board, President and Chief Executive Officer of Onex. In addition, he indirectly owns multiple voting shares of Onex carrying the right to elect a majority of the Onex board of directors. Accordingly, under applicable securities laws, Mr. Schwartz is deemed to be the beneficial owner of the Celestica shares owned by Onex; Mr. Schwartz has advised Celestica, however, that he disclaims beneficial ownership of the shares held by Onex. The percentage ownership of SVS beneficially owned by Mr. Schwartz (assuming conversion of all MVS) was 13.6% as of February 15, 2017, 13.4% as of February 14, 2018, and 14.0% as of
February 13, 2019
.
|
The address of Mr. Schwartz is: 161 Bay Street, P.O. Box 700, Toronto, Ontario, Canada M5J 2S1.
|
(4)
|
Letko, Brosseau & Associates Inc. ("Letko") is the beneficial owner of
22,173,121 SVS
and has sole voting power and sole dispositive power over these shares. Clients of Letko have the right to receive or the power to direct the receipt of dividends from, or the proceeds from sale of, the SVS reported as beneficially owned by Letko. No clients of Letko beneficially own more than five percent of the SVS. The address of Letko is: 1800 McGill College Av., Suite 2510, Montréal, Québec, Canada H3A 3J6. The number of shares reported as owned by Letko in this Major Shareholders Table and the information in this footnote is based on the Schedule 13G/A filed by Letko with the SEC on February 4, 2019, reporting beneficial ownership as of December 31, 2018. The percentage ownership of SVS beneficially owned by Letko was 16.8% as of February 15, 2017, 16.4% as of February 14, 2018, and
18.8%
as of
February 13, 2019
.
|
There are no arrangements known to the Corporation, the operation of which may at a subsequent date result in a change of control of the Corporation.
Holders
As of
February 13, 2019
, based on information provided to us by our transfer agent, there were 1,630 holders of record of subordinate voting shares, of which 383 holders, holding approximately 78.5% of the outstanding subordinate voting shares, were resident in the United States and 353 holders, holding approximately 21.3% of the outstanding subordinate voting shares, were resident in Canada. These numbers are not representative of the number of beneficial holders of our subordinate voting shares nor are they representative of where such beneficial holders reside, since many of such shares are held of record by brokers or other nominees. The Corporation does not have knowledge of the identities of the beneficial owners of subordinate voting shares registered through intermediaries. No multiple voting shares are held in the United States.
B. Related Party Transactions
Onex, which beneficially owns or controls, directly or indirectly, all of our outstanding multiple voting shares, has entered into an agreement with Celestica and with Computershare Trust Company of Canada (as successor to the Montreal Trust Company of Canada), as trustee for the benefit of the holders of the subordinate voting shares, for the purpose of ensuring that the holders
139
of subordinate voting shares will not be deprived of any rights under applicable take-over bid legislation to which they would be otherwise entitled in the event of a take-over bid (as that term is defined in applicable securities legislation) if multiple voting shares and subordinate voting shares were of a single class of shares. Subject to certain permitted forms of sale, such as identical or better offers to all holders of subordinate voting shares, Onex has agreed that it, and any of its affiliates that may hold multiple voting shares from time to time, will not sell any multiple voting shares, directly or indirectly, pursuant to a take-over bid (as that term is defined under applicable securities legislation) under circumstances in which any applicable securities legislation would have required the same offer or a follow-up offer to be made to holders of subordinate voting shares if the sale had been a sale of subordinate voting shares rather than multiple voting shares, but otherwise on the same terms.
On January 1, 2009, Celestica and Onex entered into a Services Agreement for the services of Mr. Schwartz as a director of the Corporation. The initial term of the Services Agreement was for one year and it automatically renews for successive one-year terms unless either party provides a notice of intent not to renew. In connection with the retirement of Mr. Schwartz from our Board as of December 31, 2016, and the appointment of Mr. Tawfiq Popatia (also an officer of Onex) as his replacement effective January 1, 2017, the Services Agreement was amended as of such date to replace all references to Mr. Schwartz therein with references to Mr. Popatia, and to increase the annual fee payable to Onex thereunder from $200,000 per year to $235,000 per year (to be consistent with current annual Board retainer fees), payable in DSUs in equal quarterly installments in arrears. The number of DSUs is determined using the closing price of the subordinate voting shares on the NYSE on the last day of the fiscal quarter in respect of which the installment is to be credited. The Services Agreement terminates automatically and the rights of Onex to receive compensation (other than accrued and unpaid compensation) will terminate (a) 30 days after the first day on which Onex ceases to hold at least one MVS of Celestica or any successor company or (b) the date Mr. Popatia ceases to be a director of Celestica, for any reason.
See Item 5, "Operating and Financial Review and Prospects — Management's Discussion and Analysis of Financial Condition and Results of Operations — Liquidity and Capital Resources —
Toronto Real Property and Related Transactions
" above for a description of the Property Sale Agreement (and related lease arrangements) with respect to the sale of our real property in Toronto, Ontario (which includes our corporate headquarters and our Toronto manufacturing operations) to the Property Purchaser, the terms of the September 2018 assignment of such agreement to the Assignee, and the consummation of such sale on March 7, 2019.
Given the interest in the transaction at the time of execution of the Property Sale Agreement of the Property Purchaser (a related party, as described below), our Board formed a special committee (Special Committee), consisting solely of independent directors, which retained its own independent legal counsel, to review and supervise a competitive bidding process. The Special Committee, after considering, among other factors, that the purchase price for the property exceeded the valuation provided by an independent appraiser, determined that the Property Purchaser's transaction terms were in the best interests of Celestica. Our Board, at a meeting where Mr. Schwartz was not present, approved the transaction based on the unanimous recommendation of the Special Committee.
The original parties to the Property Sale Agreement were the Company and the Property Purchaser, a consortium of four real estate partnerships. Approximately 27% of the interests in the Property Purchaser were at the time of execution of the Property Sale Agreement, and are, held by a privately-held partnership in which Mr. Schwartz has a material interest; and approximately 25% of the interests in the Property Purchaser were at the time of execution of the Property Sale Agreement, and are, held by a partnership in which Mr. Schwartz has a non-voting interest. In September 2018, the Property Sale Agreement was assigned to the Assignee, although the Property Purchaser was not released from its obligations under the Property Sale Agreement. At the time of execution of the assignment, the Assignee was unrelated to us or the Property Purchaser. Subsequent to the execution of such assignment, the Assignee granted the Property Purchaser an option to obtain a 5% non-voting interest in the Assignee.
Our related party transactions are also disclosed in Item 5, "Operating and Financial Review and Prospects — Management's Discussion and Analysis of Financial Condition and Results of Operations — Liquidity and Capital Resources — Related Party Transactions."
Indebtedness of Related Parties
As at
February 13, 2019
, other than inter-company loans among Celestica and its wholly-owned subsidiaries, no related parties (as defined in Form 20-F), were indebted to Onex, Celestica or its subsidiaries.
C. Interests of Experts and Counsel
Not applicable.
140
A. Consolidated Statements and Other Financial Information
See Item 18, "Financial Statements."
Export Sales
For the year ended
December 31, 2018
, we had approximately $6.3 billion of export sales (
i.e
., sales to customers located outside of Canada), constituting approximately 95% of our
$6.6 billion
in total sales for the year. For further information regarding the allocation of our revenues by geographic region over the last three years, see Item 4, "Information on the Company — Business Overview — Geographies."
Litigation
We are party to litigation from time-to-time. We are not currently (nor in the recent past have been) party to any legal or arbitration proceedings which management expects may have significant effects on the results of operations, business, or financial condition of Celestica.There are no material proceedings in which any of our affiliates, directors, or members of senior management is either a party adverse to us or our subsidiaries or has a material interest adverse to us or our subsidiaries.
Information concerning the status of certain tax matters is disclosed in Item 5, "Operating and Financial Review and Prospects — Management's Discussion and Analysis of Financial Condition and Results of Operations — Liquidity and Capital Resources — Litigation and contingencies" and note 24 to the Consolidated Financial Statements in Item 18.
Dividend Policy
We have not declared or paid any dividends to our shareholders. We intend to retain earnings for general corporate purposes to promote future growth; as such, our Board does not anticipate paying any dividends at this time. Our Board will review this policy from time-to-time, having regard to our financial condition, financing requirements and other relevant factors.
B. Significant Changes
Except as otherwise disclosed in this Annual Report, no significant change has occurred since
December 31, 2018
.
A. Offer and Listing Details
Market Information
The subordinate voting shares are listed on the NYSE and the TSX (in each case under the symbol "CLS").
B. Plan of Distribution
Not applicable.
C. Markets
See Item 9A. — "Offer and Listing Details" above. The subordinate voting shares are listed on the NYSE and the TSX.
D. Selling Shareholders
Not applicable.
E. Dilution
Not applicable.
141
F. Expenses of the Issue
Not applicable.
A. Share Capital
Not applicable.
B. Memorandum and Articles of Incorporation
Objects and Purposes
Celestica (Ontario Corporation No. 1201522) can engage in any legal activity permitted under the OBCA. As set forth in Item 6 of our Restated Articles of Incorporation (Articles), there are no restrictions on the business we may carry on or on the powers we may exercise.
Certain Powers of Directors
Celestica's by-laws provide that the directors shall from time to time determine by resolution the remuneration to be paid to the directors, which shall be in addition to the salary paid to any officer or employee of Celestica who is also a director. The directors may also, by resolution, award special remuneration to any director in undertaking any special services on Celestica's behalf other than the normal work ordinarily required of a director of Celestica. The by-laws provide that confirmation of any such resolution by Celestica's shareholders is not required.
The Articles provide that the Board may, without shareholder authorization, from time to time in such amounts and on such terms as it deems expedient: (i) borrow money upon the credit of Celestica; (ii) issue, reissue, sell or pledge debt obligations of Celestica; (iii) give a guarantee on behalf of Celestica to secure performance of an obligation of any person; and (iv) mortgage, hypothecate, charge, pledge or otherwise create a security interest in all or any currently owned or subsequently acquired real and personal, movable and immovable, property of Celestica, including book debts, rights, powers, franchises and undertakings, to secure Celestica's obligations.
Directors do not stand for re-election at staggered intervals, and there is no provision in our Articles or by-laws imposing a requirement for retirement or non-retirement of directors under an age limit requirement. However, the Board has a retirement policy which provides that, unless the Board authorizes an exception, a director shall not stand for re-election after his or her 75
th
birthday.
Share Ownership Requirements
The OBCA provides that unless the articles of a corporation otherwise provide, a director of a corporation is not required to hold shares issued by the corporation. There is no provision in the Articles imposing a requirement that a director hold any shares issued by Celestica. Our Board, however, has established guidelines setting out minimum shareholding requirements for directors who are not employees or officers of Celestica or Onex. See the section entitled "Director Share Ownership Guidelines" under Item 6, "Directors, Senior Management and Employees — Compensation" for a summary of these minimum shareholding requirements.
No Limitation on Foreign Ownership
There are no limitations under our Articles or in the OBCA on persons who are not citizens of Canada with respect to holding or exercising their voting rights as holders of our securities.
Other Provisions of Articles and By-laws
Other than the "coat-tail provisions" described in detail in footnote (2) to the table set forth in Item 7(A), "Major Shareholders" above, there are no provisions in the Articles or By-laws: (i) delaying, deferring or preventing a change in control of our company that operate only with respect to a merger, acquisition or corporate restructuring; (ii) discriminating against any existing or prospective holder of our securities as a result of such shareholder owning a substantial number of our securities; (iii) requiring disclosure of share ownership; or (iv) governing changes in the rights of holders of our securities or our capital, where such provisions are more stringent than those required by law.
142
Shareholder Rights and Limitations
The rights and preferences attached to our subordinate voting shares and multiple voting shares are described in the section entitled "Description of Capital Stock" of our registration statement on Form F-3ASR (Reg. No. 333-221144), filed with the SEC on October 26, 2017, which section is incorporated herein by reference thereto.
Additional information concerning the rights and limitations of Celestica's shareholders is described in the section entitled "Comparison of Celestica and MSL Stockholder's Rights" of our registration statement on Form F-4/A (Reg. No. 333-110362), filed with the SEC on February 9, 2004, which information (pertaining to Celestica) is incorporated herein by reference thereto.
C. Material Contracts
Information with respect to material contracts, other than contracts entered into in the ordinary course of business, to which Celestica or its subsidiaries is a party, entered into during the two years immediately preceding the publication of this Annual Report, is included in Item 5, "Operating and Financial Review and Prospects — Liquidity and Capital Resources" and Item 6(B), "Compensation." These contracts include equity compensation plans and agreements related to our credit facility and our $250.0 million accounts receivable sales program, as well as our acquisition of Impakt, each of which is included as an exhibit to this Annual Report. See Item 19, "Exhibits."
D. Exchange Controls
Canada has no system of exchange controls. There are no Canadian restrictions on the repatriation of capital or earnings of a Canadian public company to non-resident investors. There are no laws of Canada or exchange restrictions affecting the remittance of dividends, interest, royalties or similar payments to non-resident holders of Celestica's securities, although there may be Canadian and other foreign tax considerations. See Item 10E.— "Taxation."
E. Taxation
Material Canadian Federal Income Tax Considerations
The following is a summary of the material Canadian federal income tax considerations generally applicable to a person (a "U.S. Holder"), who acquires subordinate voting shares and who, for purposes of the Income Tax Act (Canada) (the "Canadian Tax Act") and the Canada-United States Income Tax Convention (1980) (as amended, the "Tax Treaty") at all relevant times is resident in the United States and is neither resident nor deemed to be resident in Canada, is eligible for benefits under the Tax Treaty, deals at arm's length and is not affiliated with Celestica, holds such subordinate voting shares as capital property, and does not use or hold, and is not deemed to use or hold, the subordinate voting shares in carrying on business in Canada. Special rules, which are not discussed in this summary, may apply to a U.S. Holder that is a financial institution (as defined in the Canadian Tax Act), or is an insurer to whom the subordinate voting shares are designated insurance property (as defined in the Canadian Tax Act).
This summary is based on Celestica's understanding of the current provisions of the Tax Treaty, the Canadian Tax Act and the regulations thereunder, all specific proposals to amend the Canadian Tax Act or the regulations publicly announced by the Minister of Finance (Canada) prior to
February 13, 2019
, and the current published administrative policies and assessing practices of the Canada Revenue Agency.
This summary does not express an exhaustive discussion of all possible Canadian federal income tax considerations and, except as mentioned above, does not take into account or anticipate any changes in law, whether by legislative, administrative or judicial decision or action, nor does it take into account the tax legislation or considerations of any province or territory of Canada or any jurisdiction other than Canada, which may differ significantly from the considerations described in this summary.
This summary is of a general nature only and is not intended to be, nor should it be construed to be, legal or tax advice to any particular holder, and no representation with respect to the Canadian federal income tax consequences to any particular holder is made. Consequently, U.S. Holders of subordinate voting shares should consult their own tax advisors with respect to the income tax consequences to them having regard to their particular circumstances.
All amounts relevant in computing a U.S. Holder's liability under the Canadian Tax Act are to be computed in Canadian dollars.
143
Taxation of Dividends
By virtue of the Canadian Tax Act and the Tax Treaty, dividends (including stock dividends) on subordinate voting shares paid or credited or deemed to be paid or credited to a U.S. Holder who is the beneficial owner of such dividends will generally be subject to Canadian non-resident withholding tax at the rate of 15% of the gross amount of such dividends. Under the Tax Treaty, the rate of withholding tax on dividends is reduced to 5% if that U.S. Holder is a company that beneficially owns (or is deemed to beneficially own) at least 10% of the voting stock of Celestica. Moreover, under the Tax Treaty, dividends paid to certain religious, scientific, literary, educational or charitable organizations and certain pension organizations that are resident in, and generally exempt from tax in, the U.S., generally are exempt from Canadian non-resident withholding tax. Provided that certain administrative procedures are observed by such an organization, Celestica would not be required to withhold such tax from dividends paid or credited to such organization. Any such organization that has suffered withholding tax should consult its own advisors about the possibility of seeking a refund.
Disposition of Subordinate Voting Shares
A U.S. Holder will not be subject to tax under the Canadian Tax Act in respect of any capital gain realized on the disposition or deemed disposition of subordinate voting shares unless the subordinate voting shares constitute or are deemed to constitute "taxable Canadian property" other than "treaty-protected property," as defined in the Canadian Tax Act, at the time of such disposition. Generally, subordinate voting shares will not be "taxable Canadian property" to a U.S. Holder at a particular time, where the subordinate voting shares are listed on a designated stock exchange (which currently includes the TSX and NYSE) at that time, unless at any time during the 60-month period immediately preceding that time: (A) the U.S. Holder, persons with whom the U.S. Holder did not deal at arm's length, partnerships of which the U.S. Holder or persons not dealing at arm's length with the U.S. Holder holds a membership interest (directly or indirectly through another partnership) or the U.S. Holder together with all such persons or partnerships, owned 25% or more of the issued shares of any class or series of shares of the capital stock of Celestica; and (B) more than 50% of the fair market value of the subordinate voting shares was derived directly or indirectly from one or any combination of (i) real or immoveable properties situated in Canada, (ii) "Canadian resource properties", (iii) "timber resource properties" and (iv) options in respect of, or interests in, property described in (i) to (iii), in each case as defined in the Canadian Tax Act. In certain circumstances set out in the Canadian Tax Act, the subordinate voting shares of a particular U.S. Holder could be deemed to be "taxable Canadian property" to that holder. Even if the subordinate voting shares are "taxable Canadian property" to a U.S. Holder, they generally will be "treaty-protected property" to such holder by virtue of the Tax Treaty if the value of such shares at the time of disposition is not derived principally from "real property situated in Canada" as defined for these purposes under the Tax Treaty and the Canadian Tax Act. Consequently, on the basis that the value of the subordinate voting shares should not be considered derived principally from such "real property situated in Canada" at any relevant time, any gain realized by the U.S. Holder upon the disposition of the subordinate voting shares generally will be exempt from tax under the Canadian Tax Act.
Material U.S. Federal Income Tax Considerations
The following discussion describes the material U.S. federal income tax consequences to United States Holders (as defined below) of subordinate voting shares. For purposes of this discussion, a United States Holder is a citizen or resident of the United States, a corporation (or other entity taxable as a corporation for U.S. federal income tax purposes) that is created or organized in or under the laws of the United States or of any state thereof, an estate, the income of which is includible in gross income for U.S. federal income tax purposes regardless of its source, or a trust, if either (i) a court within the United States is able to exercise primary supervision over the administration of the trust and one or more "United States persons" (within the meaning of Section 7701(a)(30) of the U.S. Internal Revenue Code of 1986, as amended (Internal Revenue Code)) have the authority to control all substantial decisions of the trust, or (ii) the trust has made an election under applicable U.S. Department of the Treasury regulations (Treasury Regulations) to be treated as a domestic trust for U.S. federal income tax purposes. If a partnership (or any other entity that is treated as a partnership for U.S. federal income tax purposes) holds subordinate voting shares, the tax treatment of an equity owner of the partnership (or other entity that is treated as a partnership for U.S. federal income tax purposes) generally will depend upon the status of the equity owner and upon the activities of the partnership (or other entity that is treated as a partnership for U.S. federal income tax purposes). If you are an equity owner of a partnership (or other entity that is treated as a partnership for U.S. federal income tax purposes) holding subordinate voting shares, we suggest that you consult with your tax advisor. This summary is for general information purposes only. It does not purport to be a comprehensive description of all of the tax considerations that may be relevant to your decision to purchase, hold or dispose of subordinate voting shares. This summary considers only United States Holders who will own subordinate voting shares as capital assets within the meaning of Section 1221 of the Internal Revenue Code. In this context, the term "capital assets" means, in general, assets held for investment by a taxpayer. Certain material aspects of U.S. federal income tax relevant to non-United States Holders are also discussed below.
144
This discussion is based on current provisions of the Internal Revenue Code, current and proposed Treasury Regulations promulgated thereunder, administrative rulings and pronouncements of the U.S. Internal Revenue Service (the "IRS"), and judicial decisions, all as of
February 13, 2019
, and all of which are subject to change, possibly on a retroactive basis. This discussion does not address all aspects of U.S. federal income taxation that may be relevant to any particular United States Holder based on the United States Holder's individual circumstances. In particular, this discussion does not address the potential application of the alternative minimum tax or U.S. federal income tax consequences to United States Holders who are subject to special treatment, including, without limitation, taxpayers who are broker dealers or insurance companies, taxpayers who have elected mark-to-market accounting, individual retirement and other tax-deferred accounts, tax-exempt organizations, financial institutions or "financial services entities," real estate investment trusts, regulated investment companies, taxpayers subject to special accounting rules under Section 451(b) of the Internal Revenue Code, taxpayers who hold subordinate voting shares as part of a "straddle," "hedge" or "conversion transaction" with other investments, taxpayers owning directly, indirectly or by attribution at least 10% of the voting power or value of our share capital, and taxpayers whose functional currency (as defined in Section 985 of the Internal Revenue Code) is not the U.S. dollar.
This discussion does not address any aspect of U.S. federal gift or estate tax or state, local or non-U.S. tax laws. Additionally, the discussion does not consider the tax treatment of persons who hold subordinate voting shares through a partnership or other pass-through entity (such as an S corporation). For U.S. federal income tax purposes, income earned through a non-U.S. or domestic partnership or similar entity generally is attributed to its owners. You are advised to consult your own tax advisor with respect to the specific tax consequences to you of purchasing, holding or disposing of the subordinate voting shares.
In December 2017, the United States enacted U.S. federal income tax reform, which significantly changed the U.S. federal income tax system. Although this summary takes into account this new U.S. federal income tax law, its provisions are complex and there is limited administrative guidance about its application. United States Holders should consult their own tax advisers regarding the potential impact of this new U.S. federal income tax law on the U.S. federal income tax consequences to them in light of their particular circumstances.
Taxation of Dividends Paid on Subordinate Voting Shares
Subject to the discussion of the passive foreign investment company (PFIC) rules below, in the event that we pay a dividend, a United States Holder will be required to include in gross income as ordinary income the amount of any distribution paid on subordinate voting shares, including any Canadian taxes withheld from the amount paid, on the date the distribution is received, to the extent that the distribution is paid out of our current or accumulated earnings and profits as determined for U.S. federal income tax purposes. In addition, distributions of the Corporation's current or accumulated earnings and profits will be foreign source "passive category income" for U.S. foreign tax credit purposes and will not qualify for the dividends received deduction available to corporations. Distributions in excess of such earnings and profits will be applied against and will reduce the United States Holder's tax basis in the subordinate voting shares and, to the extent in excess of such basis, will be treated as capital gain.
Distributions of current or accumulated earnings and profits paid in Canadian dollars to a United States Holder will be includible in the income of the United States Holder in a dollar amount calculated by reference to the exchange rate on the date the distribution is received. A United States Holder who receives a distribution of Canadian dollars and converts the Canadian dollars into U.S. dollars subsequent to receipt will have foreign exchange gain or loss based on any appreciation or depreciation in the value of the Canadian dollar against the U.S. dollar. Such gain or loss will generally be ordinary income and loss and will generally be U.S. source gain or loss for U.S. foreign tax credit purposes. United States Holders should consult their own tax advisors regarding the treatment of a foreign currency gain or loss.
United States Holders will generally have the option of claiming the amount of any Canadian income taxes withheld either as a deduction from gross income or as a dollar-for-dollar credit against their U.S. federal income tax liability, subject to specified conditions and limitations. Individuals who do not claim itemized deductions, but instead utilize the standard deduction, may not claim a deduction for the amount of the Canadian income taxes withheld, but these individuals generally may still claim a credit against their U.S. federal income tax liability. The amount of foreign income taxes that may be claimed as a credit in any year is subject to complex limitations and restrictions, which must be determined on an individual basis by each shareholder. The total amount of allowable foreign tax credits in any year cannot exceed the pre-credit U.S. tax liability for the year attributable to foreign source taxable income and further limitations may apply to individuals under the alternative minimum tax. A United States Holder will be denied a foreign tax credit with respect to Canadian income tax withheld from dividends received on subordinate voting shares to the extent that he or she has not held the subordinate voting shares for at least 16 days of the 31-day period beginning on the date which is 15 days before the ex-dividend date or to the extent that he or she is under an obligation to make related payments with respect to substantially similar or related property. Instead, a deduction may be allowed. Any days during which a
145
United States Holder has substantially diminished his or her risk of loss on his or her subordinate voting shares are not counted toward meeting the 16-day holding period.
Individuals, estates or trusts who receive "qualified dividend income" (excluding dividends from a PFIC) generally will be taxed at a current maximum U.S. federal rate of 20% (rather than the higher tax rates generally applicable to items of ordinary income) provided certain holding period requirements are met. Subject to the discussion of the PFIC rules below, Celestica believes that dividends paid by it with respect to its subordinate voting shares should constitute "qualified dividend income" for United States federal income tax purposes and that holders who are individuals (as well as certain trusts and estates) should be entitled to the reduced rate of tax, as applicable. Holders are urged to consult their own tax advisors regarding the impact of the "qualified dividend income" provisions of the Internal Revenue Code on their particular situations, including related restrictions and special rules.
Dividends received by certain high-income individuals, trusts and estates will also be subject to a 3.8% unearned Medicare contribution tax on passive income.
Taxation of Disposition of Subordinate Voting Shares
Subject to the discussion of the PFIC rules below, upon the sale, exchange or other disposition of subordinate voting shares, a United States Holder will recognize capital gain or loss in an amount equal to the difference between his or her adjusted tax basis in his or her shares and the amount realized on the disposition.
A United States Holder's adjusted tax basis in the subordinate voting shares will generally be the initial cost, but may be adjusted for various reasons including the receipt by such United States Holder of a distribution that was not made up wholly of earning and profits as described above under the heading "Taxation of Dividends Paid on Subordinate Voting Shares." A United States Holder is required to calculate the dollar value of the proceeds received on the sale date as of the "trade date," rather than the date the sale settles, regardless of whether such United States Holder uses the cash method or accrual method of accounting. Capital gain from the sale, exchange or other disposition of shares held more than one year is long-term capital gain. Long-term capital gain that is recognized by non-corporate taxpayers is eligible for a current maximum 20% rate of taxation plus a 3.8% tax on passive income derived by certain high-income individuals, trusts and estates. A reduced rate does not apply to capital gains realized by a United States Holder that is a corporation. Capital losses are generally deductible only against capital gains and not against ordinary income. In the case of an individual, however, unused capital losses in excess of capital gains may offset up to $3,000 annually of ordinary income. Gain or loss recognized by a United States Holder on a sale, exchange or other disposition of subordinate voting shares generally will be treated as U.S. source income or loss for U.S. foreign tax credit purposes. A United States Holder who receives foreign currency upon disposition of subordinate voting shares and converts the foreign currency into U.S. dollars subsequent to receipt will have foreign exchange gain or loss based on any appreciation or depreciation in the value of the foreign currency against the U.S. dollar. United States Holders should consult their own tax advisors regarding the treatment of a foreign currency gain or loss.
Tax Consequences if We Are a Passive Foreign Investment Company
A non-U.S. corporation will be a passive foreign investment company, or PFIC, if, in general, either (i) 75% or more of its gross income in a taxable year, including the pro rata share of the gross income of any U.S. or foreign company in which it is considered to own 25% or more of the shares by value, is passive income or (ii) 50% or more of its assets in a taxable year, averaged over the year and ordinarily determined based on fair market value and including the pro rata share of the assets of any company in which it is considered to own 25% or more of the shares by value, are held for the production of, or produce, passive income. If Celestica were a PFIC and a United States Holder did not make an election to treat the Corporation as a "qualified electing fund" and did not make a mark-to-market election, each as described below, then:
|
•
|
"Excess distributions" by Celestica to a United States Holder would be taxed in a special way. "Excess distributions" are amounts received by a United States Holder with respect to subordinate voting shares in any taxable year that exceed 125% of the average distributions received by the United States Holder from the Corporation in the shorter of either the three previous years or his or her holding period for his or her shares before the present taxable year. Excess distributions must be allocated ratably to each day that a United States Holder has held subordinate voting shares. A United States Holder must include amounts allocated to the current taxable year and to any non-PFIC years in his or her gross income as ordinary income for that year. A United States Holder must pay tax on amounts allocated to each prior taxable PFIC year at the highest marginal tax rate in effect for that year on ordinary income and the tax is subject to an interest charge at the rate applicable to deficiencies for income tax.
|
146
|
•
|
The entire amount of gain that is realized by a United States Holder upon the sale or other disposition of shares would also be considered an excess distribution and would be subject to tax as described above.
|
|
•
|
A United States Holder's tax basis in shares that were acquired from a decedent generally would not receive a step-up to fair market value as of the date of the decedent's death but instead would be equal to the decedent's tax basis, if lower than such value.
|
The special PFIC rules do not apply to a United States Holder if the United States Holder makes an election to treat the Corporation as a "qualified electing fund" in the first taxable year in which he or she owns subordinate voting shares and if we comply with reporting requirements as described below. Instead, a shareholder of a qualified electing fund is required for each taxable year to include in income a pro rata share of the ordinary earnings of the qualified electing fund as ordinary income and a pro rata share of the net capital gain of the qualified electing fund as long-term capital gain, subject to a separate election to defer payment of taxes, which deferral is subject to an interest charge. We have agreed to supply United States Holders with the information needed to report income and gain pursuant to this election in the event that we are classified as a PFIC. The election is made on a shareholder-by-shareholder basis and may be revoked only with the consent of the IRS. A shareholder makes the election by attaching a completed IRS Form 8621, reflecting the information contained in the PFIC annual information statement, to a timely filed U.S. federal income tax return. Even if an election is not made, a shareholder in a PFIC who is a United States Holder generally must file a completed IRS Form 8621 every year.
A United States Holder who owns PFIC shares that are publicly traded could elect to mark the shares to market annually, recognizing as ordinary income or loss each year an amount equal to the difference as of the close of the taxable year between the fair market value of the PFIC shares and the United States Holder's adjusted tax basis in the PFIC shares, provided, that, in the case of any loss, it can be recognized only to the extent of any net mark-to-market income recognized in prior years. If the mark-to-market election were made, then the rules set forth above would not apply for periods covered by the election. The subordinate voting shares would be treated as publicly traded for purposes of the mark-to-market election and, therefore, such election could be made if Celestica were classified as a PFIC. A mark-to-market election is, however, subject to complex and specific rules and requirements, and United States Holders are strongly urged to consult their tax advisors concerning this election if Celestica is classified as a PFIC.
Despite the fact that we are engaged in an active business, we are unable to conclude that Celestica was not a PFIC in 2018 or in prior years, though we believe, based on our internally performed analysis, that such status is unlikely. The tests for determining PFIC status include the determination of the value of all assets of the Corporation which is highly subjective. Further, the tests for determining PFIC status are applied annually, and it is difficult to make accurate predictions of future income and assets, which are relevant to the determination as to whether we will be a PFIC in the future. Accordingly, it is possible that Celestica could be a PFIC in 2019 or in a future year. A United States Holder who holds subordinate voting shares during a period in which we are a PFIC will be subject to the PFIC rules, even if we cease to be a PFIC, unless he or she has made a qualifying electing fund election. Although we have agreed to supply United States Holders with the information needed to report income and gain pursuant to this election in the event that Celestica is classified as a PFIC, if Celestica was determined to be a PFIC with respect to a year in which we had not thought that it would be so treated, the information needed to enable United States Holders to make a qualifying electing fund election would not have been provided. United States Holders are strongly urged to consult their tax advisors about the PFIC rules, including the consequences to them of making a mark-to-market or qualifying electing fund elections with respect to subordinate voting shares in the event that Celestica is treated as a PFIC.
Tax Consequences for Non-United States Holders of Subordinate Voting Shares
Except as described in "Information Reporting and Backup Withholding" below, a holder of subordinate voting shares that is not a United States Holder ("Non-United States Holder") will not be subject to U.S. federal income or withholding tax on the payment of dividends on, and the proceeds from the disposition of, subordinate voting shares unless:
|
•
|
the item is effectively connected with the conduct by the Non-United States Holder of a trade or business in the United States and, generally, in the case of a resident of a country that has an income treaty with the United States, such item is attributable to a permanent establishment in the United States;
|
|
•
|
the Non-United States Holder is an individual who holds subordinate voting shares as a capital asset, is present in the United States for 183 days or more in the taxable year of the disposition and satisfies certain other requirements; or
|
|
•
|
the Non-United States Holder is subject to tax pursuant to the provisions of U.S. tax law applicable to U.S. expatriates who expatriated prior to June 17, 2008.
|
147
Information Reporting and Backup Withholding
Payments made within the United States, or by a U.S. payor or U.S. middleman, of dividends and proceeds arising from certain sales or other taxable dispositions of subordinate voting shares will be subject to information reporting. Backup withholding tax, at the then applicable rate, will apply if a United States Holder (a) fails to furnish the United States Holder's correct U.S. taxpayer identification number (generally on an IRS Form W-9), (b) is notified by the IRS that the United States Holder has previously failed to properly report items subject to backup withholding tax, or (c) fails to certify, under penalty of perjury, that the United States Holder has furnished the United States Holder's correct U.S. taxpayer identification number and that the IRS has not notified the United States Holder that the United States Holder is subject to backup withholding tax. However, United States Holders that are corporations generally are excluded from these information reporting and backup withholding tax rules. Any amounts withheld under the U.S. backup withholding tax rules will be allowed as a credit against a United States Holder's U.S. federal income tax liability, if any, or will be refunded, if the United States Holder follows the requisite procedures and timely furnishes the required information to the IRS. United States Holders should consult their own tax advisors regarding the information reporting and backup withholding tax rules.
U.S. individuals and "specified domestic entities" generally are required to report an interest in any "specified foreign financial asset" if the aggregate value of such assets owned by such person exceeds $50,000 on the last day of the taxable year or $75,000 at any time during the taxable year (or such higher threshold as may apply to a particular taxpayer pursuant to the instructions to IRS Form 8938). Stock issued by a non-U.S. corporation is treated as a specified foreign financial asset for this purpose.
Non-United States Holders generally are not subject to information reporting or backup withholding with respect to dividends paid on or upon the disposition of shares, provided, in some instances, that the Non-United States Holder certifies to his foreign status or otherwise establishes an exemption.
F. Dividends and Paying Agents
Not applicable.
G. Statement by Experts
Not applicable.
H. Documents on Display
Any statement in this Annual Report about any of our contracts or other documents is not exhaustive. If the contract or document is filed as an exhibit to this Annual Report or is incorporated herein by reference thereto, the contract or document is deemed to modify our description. You must review the exhibits themselves for a complete description of the contract or document.
You may access this Annual Report, including exhibits and schedules, on our website at www.celestica.com or request a copy free of charge through our website. Requests may also be directed: (i) to clsir@celestica.com; (ii) by mail to Celestica Investor Relations, until April 1, 2019, to: 844 Don Mills Road, Toronto, Ontario, Canada M3C 1V7, and after April 1, 2019, to: 5140 Yonge Street, Suite 1900, Toronto, Ontario, Canada M2N 6L7; or (iii) by telephone at 416-448-2211.
The SEC maintains a website (www.sec.gov) that contains reports, proxy and information statements and other information regarding registrants. You may access the documents we file with or furnish to the SEC at that website (for submissions commencing November 2000, the date we began to file electronically with the SEC). Our SEC filings are also available from commercial document retrieval services.
We also file reports, statements and other information with the Canadian Securities Administrators, or the CSA, and these can be accessed electronically at the CSA's System for Electronic Document Analysis and Retrieval website (www.sedar.com).
You may access other information about Celestica on our website at www.celestica.com. Information on our website is not incorporated by reference into this Annual Report.
I. Subsidiary Information
Not applicable.
148
Market Risk
Market risk is the potential loss arising from changes in market rates and market prices. Our market risk exposure results primarily from fluctuations in foreign currency exchange rates and interest rates.
We do not hold financial instruments for speculative trading purposes.
Exchange Rate Risk
Conducting business in currencies other than the U.S. dollar subjects us to translation and transaction risks associated with fluctuations in currency exchange rates. Although we conduct the majority of our business in U.S. dollars (our functional currency), our global operations subject us to foreign currency volatility. Our non-U.S. currency exposures include the Canadian dollar, Thai baht, Malaysian ringgit, Mexican peso, British pound sterling, Chinese renminbi, Euro, Romanian leu, Korean won, and Singapore dollar. As part of our risk management program, we enter into foreign exchange forward contracts and swaps, generally for periods up to 12 months, intended to hedge foreign currency transaction risk and local currency denominated balance sheet exposures. These contracts include, to varying degrees, elements of market risk. We enter into these contracts to lock in the exchange rates for future foreign currency transactions and balance sheet balances, which is intended to reduce the variability of our operating costs and future cash flows denominated in local currencies. While these contracts are intended to reduce the effects of fluctuations in foreign currency exchange rates, our hedging strategy does not mitigate the longer-term impacts of changes to foreign exchange rates.
Currency risk on our income tax expense arises because we are generally required to file our tax returns in the local currency for each particular country in which we have operations. Exchange rate volatility between the relevant local currency and the U.S. dollar will affect the recorded amounts of our foreign assets, liabilities, revenues and expenses in local currency for statutory financial statement purposes. In addition, we earn revenues and incur expenses in foreign currencies as part of our global operations. As a result, we are also exposed to foreign currency exchange transaction risk, such that fluctuations in currency exchange rates may significantly impact the amount of translated U.S. dollars required for expenses incurred in other currencies or received from non-U.S. dollar revenues. While our hedging programs are designed to mitigate currency risk vis-à-vis the U.S. dollar, we remain subject to taxable foreign exchange impacts in our translated local currency financial results relevant for tax reporting purposes.
The table below presents the notional amounts (the U.S. dollar equivalent amounts of the foreign currency buy/sell contracts at hedge rates), weighted average exchange rates by expected (contractual) maturity dates, and the fair values of our outstanding foreign exchange forward contracts and swaps at
December 31, 2018
. These notional amounts are used to calculate the contractual payments to be exchanged under the contracts. At
December 31, 2018
, we had foreign currency contracts and swaps covering various currencies in an aggregate notional amount of
$544.2 million
(
December 31, 2017
— $576.1 million). These contracts had a fair value net unrealized loss of
$14.2 million
at
December 31, 2018
(
December 31, 2017
— $10.3 million net unrealized gain).
149
At
December 31, 2018
, we had foreign exchange forward contracts and swaps to trade U.S. dollars in exchange for the following currencies:
|
Expected Maturity Date
|
|||||||||||||||||||
|
2019
|
2020
|
2021 and thereafter
|
Total
|
Fair Value
Gain (Loss)
(in millions)
|
|||||||||||||||
|
Forward Exchange Agreements
|
|||||||||||||||||||
|
(Contract amounts in millions)
|
|||||||||||||||||||
|
Receive C$/Pay U.S.$
|
|||||||||||||||||||
|
Contract amount
|
$
|
210.2
|
|
$
|
—
|
|
$
|
—
|
|
$
|
210.2
|
|
$
|
(10.3
|
)
|
||||
|
Average exchange rate
|
0.76
|
|
|||||||||||||||||
|
Receive Thai Baht/Pay U.S.$
|
|||||||||||||||||||
|
Contract amount
|
$
|
81.1
|
|
—
|
|
—
|
|
$
|
81.1
|
|
$
|
(0.7
|
)
|
||||||
|
Average exchange rate
|
0.03
|
|
|||||||||||||||||
|
Receive Malaysian Ringgit/Pay U.S.$
|
|||||||||||||||||||
|
Contract amount
|
$
|
53.4
|
|
—
|
|
—
|
|
$
|
53.4
|
|
$
|
(0.8
|
)
|
||||||
|
Average exchange rate
|
0.24
|
|
|||||||||||||||||
|
Receive Mexican Peso/Pay U.S.$
|
|||||||||||||||||||
|
Contract amount
|
$
|
25.6
|
|
—
|
|
—
|
|
$
|
25.6
|
|
$
|
0.2
|
|
||||||
|
Average exchange rate
|
0.05
|
|
|||||||||||||||||
|
Receive British Pound Sterling/Pay U.S.$
|
|||||||||||||||||||
|
Contract amount
|
$
|
5.3
|
|
—
|
|
—
|
|
$
|
5.3
|
|
$
|
—
|
|
||||||
|
Average exchange rate
|
1.27
|
|
|||||||||||||||||
|
Receive Chinese Renminbi/Pay U.S.$
|
|||||||||||||||||||
|
Contract amount
|
$
|
66.8
|
|
—
|
|
—
|
|
$
|
66.8
|
|
$
|
(1.6
|
)
|
||||||
|
Average exchange rate
|
0.15
|
|
|||||||||||||||||
|
Pay Euro/Receive U.S.$
|
|||||||||||||||||||
|
Contract amount
|
$
|
35.8
|
|
—
|
|
—
|
|
$
|
35.8
|
|
$
|
0.3
|
|
||||||
|
Average exchange rate
|
1.17
|
|
|||||||||||||||||
|
Receive Romanian Leu/Pay U.S.$
|
|||||||||||||||||||
|
Contract amount
|
$
|
40.4
|
|
—
|
|
—
|
|
$
|
40.4
|
|
$
|
(0.9
|
)
|
||||||
|
Average exchange rate
|
0.25
|
|
|||||||||||||||||
|
Receive Singapore Dollar/Pay U.S.$
|
|||||||||||||||||||
|
Contract amount
|
$
|
22.1
|
|
—
|
|
—
|
|
$
|
22.1
|
|
$
|
(0.3
|
)
|
||||||
|
Average exchange rate
|
0.74
|
|
|||||||||||||||||
|
Pay Other/Receive U.S.$
|
|||||||||||||||||||
|
Contract amount
|
$
|
3.5
|
|
—
|
|
—
|
|
$
|
3.5
|
|
$
|
(0.1
|
)
|
||||||
|
Average exchange rate
|
0.01
|
|
|||||||||||||||||
|
Total
|
$
|
544.2
|
|
|
$
|
—
|
|
|
$
|
—
|
|
|
$
|
544.2
|
|
|
$
|
(14.2
|
)
|
Interest Rate Risk
Borrowings under the New Credit Facility bear interest at specified rates, plus specified margins. See note 12 to the Consolidated Financial Statements in Item 18. Our borrowings under this facility at
December 31, 2018
totaled
$757.3 million
,
comprised of $348.3 million under the June Term Loan, $250.0 million under the November Term Loan, and other than ordinary course letters of credit,
$159.0 million
under the New Revolver. These borrowings expose us to interest rate risk due to the potential variability in market interest rates. Assuming our outstanding aggregate borrowings under the New Credit Facility as at
150
December 31, 2018
as described above (
December 31, 2017
— aggregate outstanding borrowings of
$187.5 million
under our prior credit facility), and without accounting for the interest rate swap agreements described below, a one-percentage point increase in applicable interest rates would increase our interest expense by $7.6 million annually (December 31, 2017 — an increase of $1.9 million annually). Assuming aggregate borrowings of $600.0 million under our term loans and $450.0 million under the New Revolver (the credit limit thereunder without further use of the accordion feature), and without accounting for the interest rate swap agreements described below, a one-percentage point increase in applicable interest rates would increase our interest expense by $10.5 million annually.
As part of our risk management program, we attempt to mitigate interest rate risk through interest rate swaps. In order to partially hedge against our exposure to interest rate variability on our term loans, we entered into 5-year agreements with a syndicate of third-party banks in August and December 2018 to swap the variable interest rate (based on LIBOR plus a margin) with a fixed rate of interest for an aggregate of $350.0 million of the total borrowings under our term loans. The swap agreements include options that allow us to cancel up to $150.0 million of the notional amount of the original swap agreements ($75.0 million under the November Term Loan starting in December 2020, and $75.0 million under the June Term Loan starting in August 2021). The cancellable options in the swap agreements are aligned with our risk management strategy for our term loans as they allow us to make voluntary prepayments of outstanding amounts without premium or penalty, subject to certain conditions. Our unhedged borrowings under the New Credit Facility at
December 31, 2018
were
$407.3 million
(comprised of an aggregate of $173.3 million
under the June Term Loan and $75.0 million under the November Term Loan, and other than ordinary course letters of credit, $159.0 million under the New Revolver).
A one-percentage point increase in the interest rates applicable to our unhedged borrowings outstanding as at
December 31, 2018
would increase our interest expense by $4.1 million annually (such hedge agreements were not in place as of December 31, 2017).
The change in our exposure to interest rate risk as of
December 31, 2018
as compared to
December 31, 2017
is attributable to the increased amount of borrowings under the New Credit Facility incurred in 2018 primarily to fund acquisitions in 2018 as compared to the prior year.
See note 21 to the Consolidated Financial Statements in Item 18 for further detail.
Credit and Counterparty Risk
Management monitors the institutions that hold our cash and cash equivalents. Management's emphasis is primarily on safety of principal. Management, in its discretion, has diversified our cash and cash equivalents among banking institutions to adjust our exposure to levels they deem acceptable with respect to any one of these entities. To date, we have experienced no loss or lack of access to our invested cash or cash equivalents; however, we can provide no assurances that access to these holdings will not be impacted by adverse conditions in the financial markets, or that third party institutions will retain acceptable credit ratings or investment practices.
Cash balances held at banking institutions in the United States with which we do business may exceed the Federal Deposit Insurance Corporation (FDIC) insurance limits. While management monitors the cash balances in these bank accounts, such cash balances could be impacted if the underlying banks were to become insolvent or could be subject to other adverse conditions in the financial markets.
Credit risk refers to the risk that a counterparty may default on its contractual obligations resulting in a financial loss to us. We believe our risk of counterparty non-performance is relatively low, however, if a key supplier (or any company within such supplier's supply chain) or customer experiences financial difficulties or fails to comply with their contractual obligations, this could result in a financial loss to us (see Item 5, "Operating and Financial Review and Prospects — Management's Discussion and Analysis of Financial Condition and Results of Operations — Overview of business environment" for a discussion of write-downs recorded in each of 2017 and 2016 in connection with our exit from the solar panel manufacturing business). If an institution from which we purchased annuities for our pension plans defaults on their contractual obligations, this would result in a financial loss to us, as we retain ultimate responsibility for the payment of benefits to plan participants unless and until such pension plans are wound-up. With respect to our financial market activities, we have adopted a policy of dealing only with credit-worthy counterparties to help mitigate the risk of financial loss from defaults. We monitor the credit risk of the counterparties with whom we conduct business, through a combined process of credit rating reviews and portfolio reviews. To attempt to mitigate the risk of financial loss from defaults under our foreign currency forward contracts and swaps, and our interest rate swaps, our contracts are held by counterparty financial institutions, each of which had a Standard and Poor's rating of
A-2
or above at
December 31, 2018
. In addition, we maintain cash and short-term investments in highly-rated investments or on deposit with major financial institutions. Each financial institution with which we have our A/R sales program and the SFP had a Standard and Poor's short-term rating of
151
A-2
or above and a long-term rating of
BBB+
or above at
December 31, 2018
. Each financial institution from which annuities have been purchased for the defined benefit component of our Canadian pension plan had an A.M. Best or Standard and Poor's long-term rating of A or above at
December 31, 2018
. In addition, the financial institutions from which annuities have been purchased for the defined benefit component of our U.K. pension plans are governed by local regulatory bodies.We also provide unsecured credit to our customers in the normal course of business. From time to time, we extend the payment terms applicable to certain customers and/or provide longer payment terms when deemed commercially reasonable. Longer payment terms, which have become more prevalent, could adversely impact our working capital requirements, and increase our financial exposure and credit risk. We attempt to mitigate customer credit risk by monitoring our customers' financial condition and performing ongoing credit evaluations as appropriate. In certain instances, we may obtain letters of credit or other forms of security from our customers. We may also purchase credit insurance from a financial institution to reduce our credit exposure to certain customers. We consider credit risk in determining our allowance for doubtful accounts and we believe our allowances, as adjusted from time to time, are adequate.
A. Debt Securities
Not applicable.
B. Warrants and Rights
Not applicable.
C. Other Securities
Not applicable.
D. American Depositary Shares
None.
None.
None.
The information required by this Item concerning our disclosure controls and procedures, and changes in our internal control over financial reporting, is set forth in Item 5, "Operating and Financial Review and Prospects — Management's Discussion and Analysis of Financial Condition and Results of Operations — Liquidity and Capital Resources — Controls and Procedures."
Management's Report on Internal Control over Financial Reporting is set forth on page F-1 of our Consolidated Financial Statements in Item 18. The Company completed the acquisition of Impakt in November 2018, and as a result, management has excluded Impakt's internal controls from the scope of its assessment, and conclusion on the effectiveness, of the Company's internal control over financial reporting as of December 31, 2018, and from such report. Impakt represented 10% of the Company's consolidated assets, and less than 1% of the Company's consolidated revenue as of, and for the year ended, December 31, 2018, respectively.
The attestation report from our independent auditors, KPMG LLP (KPMG) is set forth on page F-2 of our Consolidated Financial Statements in Item 18.
152
The Board has considered the extensive financial experience of Mr. Etherington, Ms. Koellner, and Ms. Perry, and has determined that each of them is an audit committee financial expert within the meaning of Item 16A(b) of Form 20-F, and each are independent directors, as that term is defined by the applicable Canadian and SEC rules and in the NYSE listing standards.
The Board has adopted a Finance Code of Professional Conduct for Celestica's Chief Executive Officer, our senior finance officers, and all personnel in its finance organization to deter wrongdoing and promote honest and ethical conduct in the practice of financial management, including the ethical handling of actual or apparent conflicts of interest between personal and professional relationships; full, fair, accurate, timely and understandable disclosure; compliance with all applicable laws, rules and regulations; prompt internal reporting of violations of the code and accountability for adherence to the code. These professionals are expected to abide by this code as well as Celestica's Business Conduct Governance policy and all of our other applicable business policies, standards and guidelines.
The Finance Code of Professional Conduct and the Business Conduct Governance policy can be accessed electronically at
www.celestica.com
. Celestica will provide a copy of such policies free of charge to any person who so requests. Requests should be directed: (i) to
clsir@celestica.com
; (ii) by mail to Celestica Investor Relations, until April 1, 2019, to: 844 Don Mills Road, Toronto, Ontario, Canada M3C 1V7, and after April 1, 2019, to: 5140 Yonge Street, Suite 1900, Toronto, Ontario, Canada M2N 6L7; or (iii) by telephone at 416-448-2211.
The external auditor is engaged to provide services pursuant to pre-approval policies and procedures established by the Audit Committee of the Board. The Audit Committee approves the external auditor's Audit Plan, the scope of the external auditor's quarterly reviews and all related fees. The Audit Committee must approve any non-audit services provided by the auditor and related fees and does so only if it considers that these services are compatible with the external auditor's independence.
Our auditors are KPMG. KPMG did not provide any financial information systems design or implementation services to us during
2017
or
2018
. The Audit Committee has determined that the provision of the non-audit services by KPMG described below does not compromise KPMG's independence.
Audit Fees
KPMG billed $2.5 million in
2018
(
2017
— $2.3 million) for audit services.
Audit-Related Fees
KPMG billed $0.3 million in
2018
(
2017
— $0.1 million) for audit-related services, including pension audits and due diligence for acquisitions.
Tax Fees
KPMG billed $0.1 million in
2018
(
2017
— $0.1 million) for tax compliance and tax advisory services.
All Other Fees
KPMG billed $0.1 million in
2018
for a regulatory performance audit related to compliance with government accounting standards (
2017
— $0.2 million).
Pre-approval Policies and Procedures — Percentage of Services Approved by Audit Committee
All KPMG services and fees are approved by the Audit Committee as follows. The Audit Committee has established an Audit and Non-Audit Services Pre-Approval Policy to pre-approve all permissible audit and non-audit services provided by our independent auditors. On an annual basis, the Audit Committee reviews and provides pre-approval for certain types of services that may be rendered by the independent auditors and a budget for audit services for the applicable fiscal year. Upon pre-approval of the services on the initial list, management may engage the auditor for specific engagements that are within the definition of
153
the pre-approved services. Any significant service engagements above a certain threshold will require separate pre-approval. The policy contains a provision delegating pre-approval authority to the Chair of the Audit Committee in instances when pre-approval is needed prior to a scheduled Audit Committee meeting. The Chair of the Audit Committee is required to report on such pre-approvals at the next scheduled Audit Committee meeting. A final detailed review of all audit and non-audit services and fees is performed by the Audit Committee prior to the issuance of the audit opinion at year-end.
Percentage of Hours Expended on KPMG's engagement not performed by KPMG's full-time, permanent employees (if greater than 50%):
Not applicable.
None.
ISSUER PURCHASES OF EQUITY SECURITIES
|
Period
|
(a) Total number
of subordinate
voting shares
purchased
(in millions)
|
(b) Average price paid
per subordinate
voting share
|
(c) Total number of
subordinate voting
shares purchased as
part of publicly
announced plans or
programs
(in millions)
|
(d) Maximum
number of
subordinate voting
shares that may
yet be purchased
under the plans
or programs
(in millions)
|
||
|
January 1 — 31, 2018
|
—
|
—
|
—
|
8.3
|
||
|
February 1 — 28, 2018
(1)
|
2.9
|
$10.57
|
2.9
|
5.4
|
||
|
March 1 — 31, 2018
(1)(2)
|
0.8
|
$11.12
|
0.8
|
4.6
|
||
|
April 1 — 30, 2018
|
—
|
—
|
—
|
4.6
|
||
|
May 1 — 31, 2018
(2)
|
0.2
|
$11.99
|
0.2
|
4.4
|
||
|
June 1 — 30, 2018
(1)(2)
|
0.5
|
$12.21
|
0.5
|
3.9
|
||
|
July 1 — 31, 2018
|
—
|
—
|
—
|
3.9
|
||
|
August 1 — 31, 2018
(1)
|
0.9
|
$12.21
|
0.9
|
3.0
|
||
|
September 1 — 30, 2018
(1)
|
1.0
|
$12.13
|
1.0
|
2.0
|
||
|
October 1 — 31, 2018
(1)
|
0.4
|
$10.27
|
0.4
|
1.6
|
||
|
November 1 — 30, 2018
(1)(2)
|
2.0
|
$10.31
|
0.9
|
—
|
||
|
December 1 — 31, 2018
(2)(3)
|
0.2
|
$10.21
|
—
|
9.5
|
||
|
Total
|
8.9
|
$11.01
|
7.6
|
|||
|
(1)
|
On November 8, 2017, the TSX accepted our notice to launch, and we announced, a normal course issuer bid (the 2017 NCIB). The 2017 NCIB allowed us to repurchase, at our discretion, until the earlier of November 12, 2018 or the completion of purchases thereunder, up to approximately 10.5 million subordinate voting shares (representing approximately 7.3% of our total outstanding subordinate voting and multiple voting shares at the time of launch) in the open market or as otherwise permitted, subject to the normal terms and limitations of such bids. During 2017, we repurchased and cancelled a total of 1.9 million subordinate voting shares under the 2017 NCIB at a weighted average price of $10.58 per share. During 2018, we repurchased and cancelled a total of 6.8 million subordinate voting shares under the 2017 NCIB at a weighted average price of $11.10 per share. The maximum number of subordinate voting shares we were permitted to repurchase for cancellation under the 2017 NCIB was reduced by 1.1 million subordinate voting shares purchased in the open market during the term of the 2017 NCIB (0.8 million subordinate voting shares in 2018) to satisfy delivery obligations under our equity-based compensation plans. See footnote (2) below. The 2017 NCIB expired on November 12, 2018.
|
|
(2)
|
From time-to-time, a broker has purchased subordinate voting shares in the open market, on our behalf, to settle vested employee awards under our equity-based compensation plans. During 2018, approximately 2.1 million subordinate voting shares were purchased on our behalf by a broker for such purpose (0.8 million of which were purchased during the term of the 2017 NCIB, and 1.3 million of which were purchased after the expiry of the 2017 NCIB and prior to the beginning of the 2018 NCIB (as defined in footnote (3) below)). Shares purchased to settle employee awards were not cancelled.
|
154
|
(3)
|
On December 14, 2018, the TSX accepted our notice to launch, and we announced, a normal course issuer bid (the 2018 NCIB). The 2018 NCIB allows us to repurchase, at our discretion, until the earlier of December 17, 2019 or the completion of purchases thereunder, up to approximately 9.5 million subordinate voting shares (representing approximately 7.0% of our total outstanding subordinate voting and multiple voting shares at the time of launch) in the open market or as otherwise permitted, subject to the normal terms and limitations of such bids. During 2018, we did not repurchase or cancel any subordinate voting shares under the 2018 NCIB . The maximum number of subordinate voting shares we are permitted to repurchase for cancellation under the 2018 NCIB will be reduced by the number of subordinate voting shares purchased in the open market during the term of the 2018 NCIB to satisfy delivery obligations under our equity-based compensation plans. See footnote (2) above.
|
Not applicable.
Corporate Governance
We are subject to a variety of corporate governance guidelines and requirements enacted by the TSX, the CSA, the NYSE and the SEC under its rules and those mandated by the United States Sarbanes Oxley Act of 2002 and the Dodd-Frank Wall Street Reform and Consumer Protection Act of 2010. We are listed on the NYSE and, although we are not required to comply with all of the NYSE corporate governance requirements to which we would be subject if we were a U.S. corporation, our governance practices differ significantly in only one respect from those required of U.S. domestic issuers by the NYSE, as described below. Celestica complies with TSX rules, which require shareholder approval of share compensation arrangements involving new issuances of shares, and of certain amendments to such arrangements, but do not require such approval if the compensation arrangements involve only shares purchased by the Corporation in the open market. NYSE rules require shareholder approval of all equity compensation plans (and material revisions thereto) regardless of whether new issuances or treasury shares are used.
Our corporate governance guidelines can be accessed electronically at www.celestica.com.
Not applicable.
Not applicable.
The following financial statements have been filed as part of this Annual Report:
|
Page
|
|
|
Management's Report on Internal Control Over Financial Reporting
|
F-1
|
|
Reports of Independent Registered Public Accounting Firm
|
F-2, F-3
|
|
Consolidated Balance Sheet as at January 1, 2017, December 31, 2017 and December 31, 2018
|
F-4
|
|
Consolidated Statement of Operations for the years ended December 31, 2016, 2017 and 2018
|
F-5
|
|
Consolidated Statement of Comprehensive Income for the years ended December 31, 2016, 2017 and 2018
|
F-6
|
|
Consolidated Statement of Changes in Equity for the years ended December 31, 2016, 2017 and 2018
|
F-7
|
|
Consolidated Statement of Cash Flows for the years ended December 31, 2016, 2017 and 2018
|
F-8
|
|
Notes to the Consolidated Financial Statements
|
F-9
|
155
The following exhibits have been filed as part of this Annual Report:
|
|
|
Incorporated by Reference
|
||||||||||
|
Exhibit
Number
|
Description
|
Form
|
File No.
|
Filing Date
|
Exhibit
No.
|
Filed
Herewith
|
||||||
|
1.1
|
20-F
|
001-14832
|
March 23, 2010
|
1.10
|
|
|||||||
|
1.2
|
20-F
|
001-14832
|
March 23, 2010
|
1.11
|
|
|||||||
|
2
|
Instruments defining rights of holders of equity securities or long-term debt:
|
|
|
|
|
|
||||||
|
2.1
|
See Certificate and Restated Articles of Incorporation identified above
|
|
|
|
|
|
||||||
|
2.2
|
F-3ASR
|
333-221144
|
October 26, 2017
|
4.1
|
|
|||||||
|
4
|
Certain Contracts:
|
|
|
|
|
|
||||||
|
4.1
|
20-F
|
001-14832
|
March 23, 2010
|
4.1
|
|
|||||||
|
4.2
|
20-F
|
001-14832
|
March 13, 2017
|
4.2
|
||||||||
|
4.3
|
20-F
|
001-14832
|
March 25, 2008
|
4.6
|
|
|||||||
|
4.4
|
6-K
|
001-14832
|
July 9, 2014
|
99.1
|
|
|||||||
|
4.5
|
6-K
|
001-14832
|
July 29, 2015
|
99.1
|
|
|||||||
|
4.6
|
20-F
|
001-14832
|
March 7, 2016
|
4.5
|
|
|||||||
|
4.7
|
20-F
|
001-14832
|
March 13, 2017
|
4.7
|
||||||||
|
4.8
|
6-K
|
001-14832
|
July 9, 2014
|
99.2
|
|
|||||||
|
4.9
|
6-K
|
001-14832
|
July 29, 2015
|
99.2
|
||||||||
|
4.10
|
20-F
|
001-14832
|
March 7, 2016
|
4.8
|
||||||||
|
4.11
|
SC TO-I
|
005-55523
|
October 29,
2012
|
(d)(1)
|
||||||||
|
4.12
|
SC TO-I
|
005-55523
|
October 29,
2012
|
(d)(3)
|
||||||||
156
|
|
|
Incorporated by Reference
|
||||||||||
|
Exhibit
Number
|
Description
|
Form
|
File No.
|
Filing Date
|
Exhibit
No.
|
Filed
Herewith
|
||||||
|
4.13
|
20-F
|
001-14832
|
March 13, 2015
|
4.12
|
||||||||
|
4.14
|
20-F
|
001-14832
|
March 13, 2017
|
4.18
|
||||||||
|
4.15
|
20-F
|
001-14832
|
March 14, 2014
|
4.14
|
||||||||
|
4.16
|
X
|
|||||||||||
|
4.17
|
20-F
|
001-14382
|
March 13, 2015
|
4.16
|
|
|||||||
|
4.18
|
20-F
|
001-14382
|
March 7, 2016
|
4.20
|
||||||||
|
4.19
|
20-F
|
001-14382
|
March 13, 2017
|
4.23
|
||||||||
|
4.20
|
20-F
|
001-14382
|
March 12, 2018
|
4.20
|
||||||||
|
4.21
|
20-F
|
001-14382
|
March 12, 2018
|
4.21
|
||||||||
|
4.22
|
20-F
|
001-14382
|
March 12, 2018
|
4.22
|
||||||||
|
4.23
|
X
|
|||||||||||
|
4.24
|
X
|
|||||||||||
|
4.25
|
20-F
|
001-14382
|
March 14, 2014
|
4.16
|
||||||||
|
4.26
|
20-F
|
001-14382
|
March 7, 2016
|
4.22
|
||||||||
|
4.27
|
X
|
|||||||||||
157
|
|
|
Incorporated by Reference
|
||||||||||
|
Exhibit
Number
|
Description
|
Form
|
File No.
|
Filing Date
|
Exhibit
No.
|
Filed
Herewith
|
||||||
|
4.28
|
|
X
|
||||||||||
|
4.29
|
|
X
|
||||||||||
|
4.30
|
X
|
|||||||||||
|
4.31
|
X
|
|||||||||||
|
4.32
|
X
|
|||||||||||
|
8.1
|
|
|
|
|
X
|
|||||||
|
11.1
|
20-F
|
001-14382
|
March 23, 2010
|
11.1
|
|
|||||||
|
11.2
|
20-F
|
001-14382
|
March 12, 2018
|
11.2
|
||||||||
|
12.1
|
|
|
|
|
|
|
|
|
|
X
|
||
|
12.2
|
|
|
|
|
|
|
|
|
|
X
|
||
|
13.1
|
|
|
|
|
|
|
|
|
|
X
|
||
|
15.1
|
|
|
|
|
|
|
|
|
|
X
|
||
|
101.INS**
|
XBRL Instance Document
|
X
|
||||||||||
|
101.SCH**
|
XBRL Taxonomy Extension Schema Document
|
X
|
||||||||||
158
|
|
|
Incorporated by Reference
|
||||||||||
|
Exhibit
Number
|
Description
|
Form
|
File No.
|
Filing Date
|
Exhibit
No.
|
Filed
Herewith
|
||||||
|
101.CAL**
|
XBRL Taxonomy Extension Calculation Linkbase Document
|
X
|
||||||||||
|
101.DEF**
|
XBRL Taxonomy Extension Definition Linkbase Document
|
X
|
||||||||||
|
101.LAB**
|
XBRL Taxonomy Extension Label Linkbase Document
|
X
|
||||||||||
|
101.PRE**
|
XBRL Taxonomy Extension Presentation Linkbase Document
|
X
|
||||||||||
____________________________________
|
*
|
Certain confidential portions of this exhibit were omitted by means of redacting a portion of the text. This exhibit has been filed separately with the Securities and Exchange Commission without redactions. Confidential treatment has been granted pursuant to our Application for an Order Granting Confidential Treatment Pursuant to Rule 24b-2 of the U.S. Exchange Act.
|
|
**
|
Will not be deemed "filed" for purposes of Section 18 of the U.S. Exchange Act, or otherwise subject to the liability of Section 18 of the U.S. Exchange Act, and will not be incorporated by reference into any filing under the U.S. Securities Act, or the U.S. Exchange Act, except to the extent that the registrant specifically incorporates it by reference.
|
|
†
|
Certain confidential portions of this exhibit were omitted by means of redacting a portion of the text. This exhibit has been filed separately with the Securities and Exchange Commission without redactions pursuant to our Application for an Order Granting Confidential Treatment Pursuant to Rule 24b-2 of the U.S. Exchange Act.
|
159
SIGNATURES
The registrant hereby certifies that it meets all of the requirements for filing on Form 20-F and that it has duly caused and authorized the undersigned to sign this annual report on its behalf.
|
CELESTICA INC.
|
|
|
By:
|
/s/ ELIZABETH L. DELBIANCO
|
|
Elizabeth L. DelBianco
|
|
|
Chief Legal and Administrative Officer
|
|
Date: March 11, 2019
160
MANAGEMENT’S REPORT ON INTERNAL CONTROL OVER FINANCIAL REPORTING
The management of Celestica Inc. (the Company) is responsible for establishing and maintaining adequate internal control over financial reporting for the Company. The Company’s internal control system was designed to provide reasonable assurance regarding the reliability of financial reporting and the preparation of financial statements for external purposes in accordance with International Financial Reporting Standards as issued by the International Accounting Standards Board. All internal control systems, no matter how well designed, have inherent limitations. Therefore, even those systems determined to be effective can provide only reasonable assurance with respect to financial statement preparation and presentation.
Our internal control over financial reporting includes those policies and procedures that: pertain to the maintenance of records that, in reasonable detail, accurately and fairly reflect the transactions and dispositions of our assets; provide reasonable assurance that transactions are recorded as necessary to permit preparation of financial statements in accordance with applicable accounting principles, and that our receipts and expenditures are being made only in accordance with authorizations of our management and directors; and provide reasonable assurance regarding prevention or timely detection of unauthorized acquisition, use or disposition of our assets that could have a material effect on our financial statements.
Management assessed the effectiveness of the Company’s internal control over financial reporting as of
December 31, 2018
based on the criteria set forth in Internal Control — Integrated Framework (2013) issued by the Committee of Sponsoring Organizations of the Treadway Commission. Based on this assessment, management has concluded that, as of
December 31, 2018
, the Company’s internal control over financial reporting is effective.
As discussed in note 3 to the Company's 2018 audited consolidated financial statements, the Company completed the acquisition of Impakt Holdings, LLC (Impakt) in November 2018. As a result, management has excluded Impakt's internal controls from the scope of its assessment, and conclusion on the effectiveness, of the Company's internal control over financial reporting as of December 31, 2018, and from this report. Impakt represented 10% of the Company's consolidated assets and less than 1% of the Company's consolidated revenue as of, and for the year ended, December 31, 2018, respectively.
The Company’s independent auditors, KPMG LLP, have audited the effectiveness of our internal control over financial reporting as of
December 31, 2018
, as stated in their report appearing on page F-2.
March 7, 2019
F-
1
REPORT OF INDEPENDENT REGISTERED PUBLIC ACCOUNTING FIRM
To the Board of Directors and Shareholders of Celestica Inc.:
Opinion on Internal Control Over Financial Reporting
We have audited Celestica Inc.’s (the Company) internal control over financial reporting as of
December 31, 2018
, based on criteria established in Internal Control — Integrated Framework (2013) issued by the Committee of Sponsoring Organizations of the Treadway Commission. In our opinion, the Company maintained, in all material respects, effective internal control over financial reporting as of
December 31, 2018
, based on criteria established in Internal Control — Integrated Framework (2013) issued by the Committee of Sponsoring Organizations of the Treadway Commission.
We also have audited, in accordance with the standards of the Public Company Accounting Oversight Board (United States) (PCAOB), the consolidated balance sheets of the Company as of
December 31, 2018
and
2017
, and the related consolidated statements of operations, comprehensive income, changes in equity and cash flows for each of the years in the three-year period ended
December 31, 2018
, and related notes (collectively, the consolidated financial statements), and our report dated
March 7, 2019
expressed an unqualified opinion on those consolidated financial statements.
The Company acquired Impakt Holdings, LLC (Impakt) in November 2018, and management excluded from its assessment of the effectiveness of the Company’s internal control over financial reporting as of December 31, 2018, Impakt's internal control over financial reporting. Impakt represented 10% of the Company’s consolidated assets, and less than 1% of the Company’s consolidated revenue as of, and for the year ended, December 31, 2018, respectively. Our audit of internal control over financial reporting of the Company also excluded an evaluation of the internal control over financial reporting of Impakt.
Basis for Opinion
The Company’s management is responsible for maintaining effective internal control over financial reporting and for its assessment of the effectiveness of internal control over financial reporting, included in the accompanying “Management’s Report on Internal Control over Financial Reporting.” Our responsibility is to express an opinion on the Company’s internal control over financial reporting based on our audit. We are a public accounting firm registered with the PCAOB and are required to be independent with respect to the Company in accordance with the U.S. federal securities laws and the applicable rules and regulations of the Securities and Exchange Commission and the PCAOB.
We conducted our audit in accordance with the standards of the PCAOB. Those standards require that we plan and perform the audit to obtain reasonable assurance about whether effective internal control over financial reporting was maintained in all material respects. Our audit of internal control over financial reporting included obtaining an understanding of internal control over financial reporting, assessing the risk that a material weakness exists, and testing and evaluating the design and operating effectiveness of internal control based on the assessed risk. Our audit also included performing such other procedures as we considered necessary in the circumstances. We believe that our audit provides a reasonable basis for our opinion.
Definition and Limitations of Internal Control Over Financial Reporting
A company’s internal control over financial reporting is a process designed to provide reasonable assurance regarding the reliability of financial reporting and the preparation of financial statements for external purposes in accordance with generally accepted accounting principles. A company’s internal control over financial reporting includes those policies and procedures that (1) pertain to the maintenance of records that, in reasonable detail, accurately and fairly reflect the transactions and dispositions of the assets of the company; (2) provide reasonable assurance that transactions are recorded as necessary to permit preparation of financial statements in accordance with generally accepted accounting principles, and that receipts and expenditures of the company are being made only in accordance with authorizations of management and directors of the company; and (3) provide reasonable assurance regarding prevention or timely detection of unauthorized acquisition, use, or disposition of the company’s assets that could have a material effect on the financial statements.
Because of its inherent limitations, internal control over financial reporting may not prevent or detect misstatements. Also, projections of any evaluation of effectiveness to future periods are subject to the risk that controls may become inadequate because of changes in conditions, or that the degree of compliance with the policies or procedures may deteriorate.
|
Toronto, Canada March 7, 2019
|
/s/ KPMG LLP
Chartered Professional Accountants,
Licensed Public Accountants
|
F-2
REPORT OF INDEPENDENT REGISTERED PUBLIC ACCOUNTING FIRM
To the Board of Directors and Shareholders of Celestica Inc.:
Opinion on the Consolidated Financial Statements
We have audited the accompanying consolidated balance sheets of Celestica Inc. (the Company) as of
December 31, 2018
and
2017
, the related consolidated statements of operations, comprehensive income, changes in equity and cash flows for each of the years in the three-year period ended
December 31, 2018
, and related notes (collectively, the consolidated financial statements). In our opinion, the consolidated financial statements present fairly, in all material respects, the financial position of the Company as of
December 31, 2018
and
2017
, and the financial performance and its cash flows for each of the years in the three-year period ended
December 31, 2018
, in conformity with International Financial Reporting Standards as issued by the International Accounting Standards Board.
We also have audited, in accordance with the standards of the Public Company Accounting Oversight Board (United States) (PCAOB), the Company’s internal control over financial reporting as of
December 31, 2018
, based on criteria established in Internal Control — Integrated Framework (2013) issued by the Committee of Sponsoring Organizations of the Treadway Commission, and our report dated
March 7, 2019
expressed an unqualified opinion on the effectiveness of the Company’s internal control over financial reporting.
Change in Accounting Principle
As discussed in note 2(y) to the consolidated financial statements, the Company has changed its method of accounting for revenue recognition in 2018 due to the adoption of IFRS 15, Revenue from Contracts with Customers and included the presentation of the consolidated balance sheet as of January 1, 2017.
Basis for Opinion
These consolidated financial statements are the responsibility of the Company’s management. Our responsibility is to express an opinion on these consolidated financial statements based on our audits. We are a public accounting firm registered with the PCAOB and are required to be independent with respect to the Company in accordance with the U.S. federal securities laws and the applicable rules and regulations of the Securities and Exchange Commission and the PCAOB.
We conducted our audits in accordance with the standards of the PCAOB. Those standards require that we plan and perform the audits to obtain reasonable assurance about whether the consolidated financial statements are free of material misstatement, whether due to error or fraud. Our audits included performing procedures to assess the risks of material misstatement of the consolidated financial statements, whether due to error or fraud, and performing procedures that respond to those risks. Such procedures included examining, on a test basis, evidence regarding the amounts and disclosures in the consolidated financial statements. Our audits also included evaluating the accounting principles used and significant estimates made by management, as well as evaluating the overall presentation of the consolidated financial statements. We believe that our audits provide a reasonable basis for our opinion.
|
Toronto, Canada March 7, 2019
|
/s/ KPMG LLP
Chartered Professional Accountants,
Licensed Public Accountants
|
|
We have served as the Company's auditor since 1997.
|
|
F-
3
CELESTICA INC.
(in millions of U.S. dollars)
|
January 1
2017 |
December 31
2017 |
December 31
2018 |
|||||||||
|
Assets
|
(restated)*
|
(restated)*
|
|||||||||
|
Current assets:
|
|||||||||||
|
Cash and cash equivalents (note 21)
|
$
|
557.2
|
|
$
|
515.2
|
|
$
|
422.0
|
|
||
|
Accounts receivable (note 5)
|
1,017.4
|
|
1,023.7
|
|
1,206.6
|
|
|||||
|
Inventories (note 6)
|
684.4
|
|
824.0
|
|
1,089.9
|
|
|||||
|
Income taxes receivable
|
5.4
|
|
1.6
|
|
5.0
|
|
|||||
|
Assets classified as held for sale (note 7)
|
28.9
|
|
30.1
|
|
27.4
|
|
|||||
|
Other current assets
|
73.9
|
|
82.0
|
|
72.6
|
|
|||||
|
Total current assets
|
2,367.2
|
|
2,476.6
|
|
2,823.5
|
|
|||||
|
Property, plant and equipment (note 8)
|
302.7
|
|
323.9
|
|
365.3
|
|
|||||
|
Goodwill (note 9)
|
23.2
|
|
23.2
|
|
198.4
|
|
|||||
|
Intangible assets (note 9)
|
25.5
|
|
21.6
|
|
283.6
|
|
|||||
|
Deferred income taxes (note 20)
|
35.3
|
|
37.6
|
|
36.7
|
|
|||||
|
Other non-current assets (note 10)
|
88.0
|
|
81.3
|
|
30.2
|
|
|||||
|
Total assets
|
$
|
2,841.9
|
|
$
|
2,964.2
|
|
$
|
3,737.7
|
|
||
|
Liabilities and Equity
|
|||||||||||
|
Current liabilities:
|
|||||||||||
|
Borrowings under credit facility & finance leases (notes 4 & 12)
|
$
|
56.0
|
|
$
|
37.9
|
|
$
|
107.7
|
|
||
|
Accounts payable
|
876.9
|
|
931.1
|
|
1,126.7
|
|
|||||
|
Accrued and other current liabilities
|
261.7
|
|
233.2
|
|
320.4
|
|
|||||
|
Income taxes payable (note 20)
|
32.4
|
|
37.7
|
|
42.3
|
|
|||||
|
Current portion of provisions (note 11)
|
18.7
|
|
26.6
|
|
23.2
|
|
|||||
|
Total current liabilities
|
1,245.7
|
|
1,266.5
|
|
1,620.3
|
|
|||||
|
Long-term portion of borrowings under credit facility & finance leases (notes 4 & 12)
|
188.7
|
|
166.5
|
|
650.2
|
|
|||||
|
Pension and non-pension post-employment benefit obligations (note 19)
|
86.0
|
|
97.8
|
|
88.8
|
|
|||||
|
Provisions and other non-current liabilities (note 11)
|
28.3
|
|
35.4
|
|
20.6
|
|
|||||
|
Deferred income taxes (note 20)
|
35.4
|
|
27.8
|
|
25.5
|
|
|||||
|
Total liabilities
|
1,584.1
|
|
1,594.0
|
|
2,405.4
|
|
|||||
|
Equity:
|
|||||||||||
|
Capital stock (note 13)
|
2,048.2
|
|
2,048.3
|
|
1,954.1
|
|
|||||
|
Treasury stock (note 13)
|
(15.3
|
)
|
(8.7
|
)
|
(20.2
|
)
|
|||||
|
Contributed surplus
|
862.6
|
|
863.0
|
|
906.6
|
|
|||||
|
Deficit
|
(1,613.0
|
)
|
(1,525.7
|
)
|
(1,481.7
|
)
|
|||||
|
Accumulated other comprehensive loss (note 14)
|
(24.7
|
)
|
(6.7
|
)
|
(26.5
|
)
|
|||||
|
Total equity
|
1,257.8
|
|
1,370.2
|
|
1,332.3
|
|
|||||
|
Total liabilities and equity
|
$
|
2,841.9
|
|
$
|
2,964.2
|
|
$
|
3,737.7
|
|
||
|
Commitments, contingencies and guarantees (note 24), Subsequent event (note 8)
|
|||||||||||
F-
4
|
Signed on behalf of the Board of Directors
|
|
|
[Signed] William A. Etherington, Director
|
[Signed] Laurette T. Koellner, Director
|
* Certain prior period figures have been restated to reflect the adoption of IFRS 15 (see note 2)
The accompanying notes are an integral part of these consolidated financial statements.
F-
5
CELESTICA INC.
(in millions of U.S. dollars, except per share amounts)
|
Year ended December 31
|
|||||||||||
|
2016
|
2017
|
2018
|
|||||||||
|
(restated)*
|
(restated)*
|
||||||||||
|
Revenue
|
$
|
6,046.6
|
|
$
|
6,142.7
|
|
$
|
6,633.2
|
|
||
|
Cost of sales (notes 6 & 15)
|
5,617.0
|
|
5,724.2
|
|
6,202.7
|
|
|||||
|
Gross profit
|
429.6
|
|
418.5
|
|
430.5
|
|
|||||
|
Selling, general and administrative expenses (SG&A) (note 15)
|
211.1
|
|
203.2
|
|
219.0
|
|
|||||
|
Research and development
|
24.9
|
|
26.2
|
|
28.8
|
|
|||||
|
Amortization of intangible assets (note 9)
|
9.4
|
|
8.9
|
|
15.4
|
|
|||||
|
Other charges (note 16)
|
25.5
|
|
37.0
|
|
61.0
|
|
|||||
|
Earnings from operations
|
158.7
|
|
143.2
|
|
106.3
|
|
|||||
|
Refund interest income (notes 17 & 20)
|
(14.3
|
)
|
—
|
|
—
|
|
|||||
|
Finance costs (note 17)
|
10.0
|
|
10.1
|
|
24.4
|
|
|||||
|
Earnings before income taxes
|
163.0
|
|
133.1
|
|
81.9
|
|
|||||
|
Income tax expense (recovery) (note 20)
|
|||||||||||
|
Current
|
14.2
|
|
39.1
|
|
39.7
|
|
|||||
|
Deferred
|
10.5
|
|
(11.5
|
)
|
(56.7
|
)
|
|||||
|
24.7
|
|
27.6
|
|
(17.0
|
)
|
||||||
|
Net earnings
|
$
|
138.3
|
|
$
|
105.5
|
|
$
|
98.9
|
|
||
|
Basic earnings per share
|
$
|
0.98
|
|
$
|
0.74
|
|
$
|
0.71
|
|
||
|
Diluted earnings per share
|
$
|
0.96
|
|
$
|
0.73
|
|
$
|
0.70
|
|
||
|
Shares used in computing per share amounts (in millions):
|
|||||||||||
|
Basic (note 23)
|
141.8
|
|
143.1
|
|
139.4
|
|
|||||
|
Diluted (note 23)
|
143.9
|
|
145.2
|
|
140.6
|
|
|||||
* Certain prior period figures have been restated to reflect the adoption of IFRS 15 (see note 2)
The accompanying notes are an integral part of these consolidated financial statements.
F-
6
CELESTICA INC.
CONSOLIDATED STATEMENT OF COMPREHENSIVE INCOME
(in millions of U.S. dollars)
|
Year ended December 31
|
|||||||||||
|
2016
|
2017
|
2018
|
|||||||||
|
(restated)*
|
(restated)*
|
||||||||||
|
Net earnings
|
$
|
138.3
|
|
$
|
105.5
|
|
$
|
98.9
|
|
||
|
Other comprehensive income (loss), net of tax (note 14)
|
|||||||||||
|
Items that will not be reclassified to net earnings:
|
|||||||||||
|
Gains (losses) on pension and non-pension post-employment benefit plans (note 19)
|
17.1
|
|
(18.2
|
)
|
(54.9
|
)
|
|||||
|
Items that may be reclassified to net earnings:
|
|||||||||||
|
Currency translation differences for foreign operations
|
—
|
|
0.7
|
|
0.1
|
|
|||||
|
Changes from currency forward derivatives designated as hedges
|
8.1
|
|
17.3
|
|
(15.5
|
)
|
|||||
|
Changes from interest rate swap derivatives designated as hedges
|
—
|
|
—
|
|
(4.4
|
)
|
|||||
|
Total comprehensive income
|
$
|
163.5
|
|
$
|
105.3
|
|
$
|
24.2
|
|
||
* Certain prior period figures have been restated to reflect the adoption of IFRS 15 (see note 2)
The accompanying notes are an integral part of these consolidated financial statements.
F-
7
CELESTICA INC.
CONSOLIDATED STATEMENT OF CHANGES IN EQUITY
(in millions of U.S. dollars)
|
Capital stock (note 13)
|
Treasury stock (note 13)
|
Contributed
surplus |
Deficit
|
Accumulated
other comprehensive income (loss) (a) |
Total
equity |
||||||||||||||||||
|
Balance — December 31, 2015
|
$
|
2,093.9
|
|
$
|
(31.4
|
)
|
$
|
846.7
|
|
$
|
(1,785.4
|
)
|
$
|
(32.8
|
)
|
$
|
1,091.0
|
|
|||||
|
Impact of change in accounting policies (note 2)
|
—
|
|
—
|
|
—
|
|
17.0
|
|
—
|
|
17.0
|
|
|||||||||||
|
Restated balance at December 31, 2015
|
2,093.9
|
|
(31.4
|
)
|
846.7
|
|
(1,768.4
|
)
|
(32.8
|
)
|
1,108.0
|
|
|||||||||||
|
Capital transactions:
|
|||||||||||||||||||||||
|
Issuance of capital stock
|
6.4
|
|
—
|
|
(2.3
|
)
|
—
|
|
—
|
|
4.1
|
|
|||||||||||
|
Repurchase of capital stock for cancellation
|
(52.1
|
)
|
—
|
|
17.8
|
|
—
|
|
—
|
|
(34.3
|
)
|
|||||||||||
|
Purchase of treasury stock for stock-based plans
|
—
|
|
(18.2
|
)
|
—
|
|
—
|
|
—
|
|
(18.2
|
)
|
|||||||||||
|
Stock-based compensation and other
|
—
|
|
34.3
|
|
0.4
|
|
—
|
|
—
|
|
34.7
|
|
|||||||||||
|
Total comprehensive income:
|
|||||||||||||||||||||||
|
Net earnings for 2016
|
—
|
|
—
|
|
—
|
|
138.3
|
|
—
|
|
138.3
|
|
|||||||||||
|
Gains on pension and non-pension post-employment benefit plans (note 19)
|
—
|
|
—
|
|
—
|
|
17.1
|
|
—
|
|
17.1
|
|
|||||||||||
|
Changes from currency forward derivatives designated as hedges
|
—
|
|
—
|
|
—
|
|
—
|
|
8.1
|
|
8.1
|
|
|||||||||||
|
Balance — December 31, 2016
|
$
|
2,048.2
|
|
$
|
(15.3
|
)
|
$
|
862.6
|
|
$
|
(1,613.0
|
)
|
$
|
(24.7
|
)
|
$
|
1,257.8
|
|
|||||
|
Capital transactions:
|
|||||||||||||||||||||||
|
Issuance of capital stock
|
30.4
|
|
—
|
|
(16.8
|
)
|
—
|
|
—
|
|
13.6
|
|
|||||||||||
|
Repurchase of capital stock for cancellation
|
(30.3
|
)
|
—
|
|
10.4
|
|
—
|
|
—
|
|
(19.9
|
)
|
|||||||||||
|
Purchase of treasury stock for stock-based plans
|
—
|
|
(16.7
|
)
|
—
|
|
—
|
|
—
|
|
(16.7
|
)
|
|||||||||||
|
Stock-based compensation and other
|
—
|
|
23.3
|
|
6.8
|
|
—
|
|
—
|
|
30.1
|
|
|||||||||||
|
Total comprehensive income:
|
|||||||||||||||||||||||
|
Net earnings for 2017
|
—
|
|
—
|
|
—
|
|
105.5
|
|
—
|
|
105.5
|
|
|||||||||||
|
Losses on pension and non-pension post-employment benefit plans (note 19)
|
—
|
|
—
|
|
—
|
|
(18.2
|
)
|
—
|
|
(18.2
|
)
|
|||||||||||
|
Currency translation differences for foreign operations
|
—
|
|
—
|
|
—
|
|
—
|
|
0.7
|
|
0.7
|
|
|||||||||||
|
Changes from currency forward derivatives designated as hedges
|
—
|
|
—
|
|
—
|
|
—
|
|
17.3
|
|
17.3
|
|
|||||||||||
|
Balance — December 31, 2017
|
$
|
2,048.3
|
|
$
|
(8.7
|
)
|
$
|
863.0
|
|
$
|
(1,525.7
|
)
|
$
|
(6.7
|
)
|
$
|
1,370.2
|
|
|||||
|
Capital transactions:
|
|||||||||||||||||||||||
|
Issuance of capital stock
|
14.9
|
|
—
|
|
(14.5
|
)
|
—
|
|
—
|
|
0.4
|
|
|||||||||||
|
Repurchase of capital stock for cancellation
|
(109.1
|
)
|
—
|
|
33.6
|
|
—
|
|
—
|
|
(75.5
|
)
|
|||||||||||
|
Purchase of treasury stock for stock-based plans
|
—
|
|
(22.4
|
)
|
—
|
|
—
|
|
—
|
|
(22.4
|
)
|
|||||||||||
|
Stock-based compensation and other
|
—
|
|
10.9
|
|
24.5
|
|
—
|
|
—
|
|
35.4
|
|
|||||||||||
|
Total comprehensive income:
|
|||||||||||||||||||||||
|
Net earnings for 2018
|
—
|
|
—
|
|
—
|
|
98.9
|
|
—
|
|
98.9
|
|
|||||||||||
|
Losses on pension and non-pension post-employment benefit plans (note 19)
|
—
|
|
—
|
|
—
|
|
(54.9
|
)
|
—
|
|
(54.9
|
)
|
|||||||||||
|
Currency translation differences for foreign operations
|
—
|
|
—
|
|
—
|
|
—
|
|
0.1
|
|
0.1
|
|
|||||||||||
|
Changes from currency forward derivatives designated as hedges
|
—
|
|
—
|
|
—
|
|
—
|
|
(15.5
|
)
|
(15.5
|
)
|
|||||||||||
|
Changes from interest rate swap derivatives designated as hedges
|
—
|
|
—
|
|
—
|
|
—
|
|
(4.4
|
)
|
(4.4
|
)
|
|||||||||||
|
Balance — December 31, 2018
|
$
|
1,954.1
|
|
$
|
(20.2
|
)
|
$
|
906.6
|
|
$
|
(1,481.7
|
)
|
$
|
(26.5
|
)
|
$
|
1,332.3
|
|
|||||
|
(a)
|
Accumulated other comprehensive income (loss) is net of tax. See note
14
.
|
The accompanying notes are an integral part of these consolidated financial statements.
F-
8
CELESTICA INC.
(in millions of U.S. dollars)
|
Year ended December 31
|
|||||||||||
|
2016
|
2017
|
2018
|
|||||||||
|
Cash provided by (used in):
|
(restated)*
|
(restated)*
|
|||||||||
|
Operating activities:
|
|||||||||||
|
Net earnings
|
$
|
138.3
|
|
$
|
105.5
|
|
$
|
98.9
|
|
||
|
Adjustments to net earnings for items not affecting cash:
|
|||||||||||
|
Depreciation and amortization
|
75.6
|
|
76.5
|
|
89.1
|
|
|||||
|
Equity-settled stock-based compensation (note 13)
|
33.0
|
|
30.1
|
|
33.4
|
|
|||||
|
Other charges (note 16)
|
21.2
|
|
5.7
|
|
1.4
|
|
|||||
|
Finance costs, net of refund interest income
|
(4.3
|
)
|
10.1
|
|
24.4
|
|
|||||
|
Income tax expense (recovery)
|
24.7
|
|
27.6
|
|
(17.0
|
)
|
|||||
|
Other
|
(1.1
|
)
|
(1.6
|
)
|
(7.5
|
)
|
|||||
|
Changes in non-cash working capital items:
|
|||||||||||
|
Accounts receivable
|
(134.6
|
)
|
(6.3
|
)
|
(155.4
|
)
|
|||||
|
Inventories
|
(61.5
|
)
|
(139.6
|
)
|
(224.0
|
)
|
|||||
|
Other current assets
|
(5.3
|
)
|
(2.0
|
)
|
7.6
|
|
|||||
|
Accounts payable, accrued and other current liabilities and provisions
|
75.4
|
|
51.8
|
|
227.0
|
|
|||||
|
Non-cash working capital changes
|
(126.0
|
)
|
(96.1
|
)
|
(144.8
|
)
|
|||||
|
Net income tax refund (paid), including related refund interest income
|
11.9
|
|
(30.8
|
)
|
(44.8
|
)
|
|||||
|
Net cash provided by operating activities
|
173.3
|
|
127.0
|
|
33.1
|
|
|||||
|
Investing activities:
|
|||||||||||
|
Acquisitions (note 3)
|
(14.9
|
)
|
—
|
|
(467.1
|
)
|
|||||
|
Purchase of computer software and property, plant and equipment
(a)
|
(64.1
|
)
|
(102.6
|
)
|
(82.2
|
)
|
|||||
|
Proceeds from sale of assets
|
1.0
|
|
0.8
|
|
3.7
|
|
|||||
|
Repayment of advances from solar supplier (note 4)
|
14.0
|
|
12.5
|
|
—
|
|
|||||
|
Net cash used in investing activities
|
(64.0
|
)
|
(89.3
|
)
|
(545.6
|
)
|
|||||
|
Financing activities:
|
|||||||||||
|
Borrowing under prior credit facility (note 12)
|
40.0
|
|
—
|
|
163.0
|
|
|||||
|
Repayments under prior credit facility (note 12)
|
(75.0
|
)
|
(40.0
|
)
|
(350.5
|
)
|
|||||
|
Borrowing under new credit facility (note 12)
|
—
|
|
—
|
|
759.0
|
|
|||||
|
Repayments under new credit facility (note 12)
|
—
|
|
—
|
|
(1.7
|
)
|
|||||
|
Finance lease payments (note 12)
|
(4.5
|
)
|
(6.5
|
)
|
(17.0
|
)
|
|||||
|
Issuance of capital stock (note 13)
|
4.1
|
|
13.6
|
|
0.4
|
|
|||||
|
Repurchase of capital stock for cancellation (note 13)
|
(34.3
|
)
|
(19.9
|
)
|
(75.5
|
)
|
|||||
|
Purchase of treasury stock for stock-based plans (note 13)
|
(18.2
|
)
|
(16.7
|
)
|
(22.4
|
)
|
|||||
|
Finance costs paid
|
(9.5
|
)
|
(10.2
|
)
|
(36.0
|
)
|
|||||
|
Net cash provided by (used in) financing activities
|
(97.4
|
)
|
(79.7
|
)
|
419.3
|
|
|||||
|
Net increase (decrease) in cash and cash equivalents
|
11.9
|
|
(42.0
|
)
|
(93.2
|
)
|
|||||
|
Cash and cash equivalents, beginning of year
|
545.3
|
|
557.2
|
|
515.2
|
|
|||||
|
Cash and cash equivalents, end of year
|
$
|
557.2
|
|
$
|
515.2
|
|
$
|
422.0
|
|
||
(a) Additional equipment of
$9.3
was acquired through finance leases in
2018
(
2017
—
$5.0
;
2016
—
$3.4
). See notes
4
, 8 and 12. Purchases of property, plant and equipment that were unpaid at
December 31, 2018
were
$14.4
(
December 31, 2017
—
$14.0
;
December 31, 2016
—
$22.6
).
* Certain prior period figures have been restated to reflect the adoption of IFRS 15 (see note 2)
F-
9
The accompanying notes are an integral part of these consolidated financial statements.
F-
10
CELESTICA INC.
NOTES TO THE CONSOLIDATED FINANCIAL STATEMENTS
(in millions of U.S. dollars, except percentages and per share amounts)
|
1.
|
REPORTING ENTITY:
|
Celestica Inc. (Celestica) is incorporated in Ontario with its corporate headquarters located in Toronto, Ontario, Canada. Celestica’s subordinate voting shares are listed on the Toronto Stock Exchange (TSX) and the New York Stock Exchange (NYSE).
Celestica delivers innovative supply chain solutions globally to customers in two operating and reportable segments: Advanced Technology Solutions (ATS) and Connectivity & Cloud Solutions (CCS). Our ATS segment consists of our ATS end market, and is comprised of our aerospace and defense, industrial, smart energy, healthtech, and capital equipment businesses. Our capital equipment business consists of our semiconductor, display, and power & signal distribution equipment businesses. Our CCS segment consists of our Communications and Enterprise end markets, and is comprised of our enterprise communications, telecommunications, servers and storage businesses. See note 25 for a discussion of the reorganization of our end markets and the division of our business into two operating and reportable segments, commencing in the first quarter of 2018. Our prior period financial information has been reclassified to reflect the reorganized segment structure and to conform to the current presentation.
|
2
.
|
BASIS OF PREPARATION AND SIGNIFICANT ACCOUNTING POLICIES:
|
Statement of compliance:
The consolidated financial statements have been prepared in accordance with International Financial Reporting Standards (IFRS) as issued by the International Accounting Standards Board (IASB).
The consolidated financial statements were authorized for issuance by our Board of Directors on
March 7, 2019
.
Functional and presentation currency:
The consolidated financial statements are presented in U.S. dollars, which is also our functional currency. Unless otherwise noted, all financial information is presented in millions of U.S. dollars (except percentages and per share amounts).
Use of estimates and judgments:
The preparation of financial statements in conformity with IFRS requires management to make judgments, estimates and assumptions that affect the application of accounting policies and the reported amounts of assets and liabilities, revenue and expenses, and the related disclosures of contingent assets and liabilities. We base our judgments, estimates and assumptions on current facts, historical experience and various other factors that we believe are reasonable under the circumstances. The economic environment could also impact certain estimates necessary to prepare our consolidated financial statements, including estimates related to the recoverable amounts used in our impairment testing of our non-financial assets, and the discount rates applied to our net pension and non-pension post-employment benefit assets or liabilities. Our assessment of these factors forms the basis for our judgments on the carrying values of our assets and liabilities, and the accrual of our costs and expenses. Actual results could differ materially from our estimates and assumptions. We review our estimates and underlying assumptions on an ongoing basis and make revisions as determined necessary by management. Revisions are recognized in the period in which the estimates are revised and may impact future periods as well.
Key sources of estimation uncertainty and judgment:
We have applied significant estimates, judgment and assumptions in the following areas which we believe could have a significant impact on our reported results and financial position: our determination of the timing of revenue recognition, measures of work in progress, and estimates and timing of expected returns, revenues and related costs; valuations of inventory, assets held for sale and income taxes; the amount of our restructuring charges or recoveries; the measurement of the recoverable amounts of our cash generating units (or CGUs, which are the smallest identifiable group of assets that cannot be tested individually and generate cash inflows that are largely independent of those of other assets or groups of assets), which includes estimating future growth, profitability, discount and terminal growth rates, and the fair value of our real property; our valuations of financial assets and liabilities, pension and non-pension post-
F-
11
CELESTICA INC.
NOTES TO THE CONSOLIDATED FINANCIAL STATEMENTS
(in millions of U.S. dollars, except percentages and per share amounts)
employment benefit costs, employee stock-based compensation expense, provisions and contingencies; and the allocation of the purchase price and other valuations related to our business acquisitions.
We have also applied significant judgment in the following areas: the determination of our CGUs (which can be comprised of a single site, a group of sites, or a line of business) and whether events or changes in circumstances during the relevant period are indicators that a review for impairment should be conducted, the timing of the recognition of charges or recoveries associated with our restructuring actions, and the decisions and timing of our pension annuity purchases.
We describe our use of judgment and estimation uncertainties in greater detail in the accounting policies described under “Significant Accounting Policies” below.
Recently adopted accounting standards:
IFRS 9, Financial Instruments:
Effective January 1, 2018, we adopted IFRS 9,
Financial Instruments
. This standard introduced a new model for the classification and measurement of financial assets, a single expected credit loss (ECL) model for the measurement of the impairment of financial assets, and a new model for hedge accounting that is aligned with a company’s risk management activities. In connection with the adoption of this standard, we also complied with the transitional rules of IAS 1,
Presentation of Financial Statements
and IFRS 7,
Financial Instruments Disclosures
. In accordance with the transitional provisions of the rule, we have applied the changes of IFRS 9 retrospectively, with the exception of the hedge accounting policies, which we have applied prospectively as required. The adoption of this standard did not result in any adjustments to our consolidated financial statements. See notes 2(q) and (r) for further detail.
Under IFRS 9, financial assets are classified as: measured at amortized cost, fair value through other comprehensive income (FVOCI), or fair value through profit or loss (FVTPL). This classification is generally based on the business model in which the financial asset is managed and its contractual cash flow characteristics. IFRS 9 eliminated the held-to-maturity, loans and receivables, and available-for-sale categories previously allowed under IAS 39. Trade and non-customer receivables, that were previously classified as loans and receivables under IAS 39, are measured at amortized cost under IFRS 9. Although the classification of such assets changed, measurement of these assets continues to be at amortized cost, and no changes to their carrying amounts were required upon adopting IFRS 9. For financial liabilities, IFRS 9 largely retains the existing IAS 39 classifications, with the exception of those designated at FVTPL. We do not currently hold any financial liabilities designated as FVTPL, or any financial assets or liabilities designated as FVOCI.
IFRS 15, Revenue from Contracts with Customers:
Effective January 1, 2018, we adopted IFRS 15,
Revenue from Contracts with Customers
. This standard provides a comprehensive five-step revenue recognition model for all contracts with customers, and prescribes when and how much revenue should be recognized. This standard replaced IAS 18,
Revenues
, IAS 11,
Construction Contracts,
and related interpretations. In accordance with the transitional provisions of the rule, we elected to apply IFRS 15 using the retrospective method, and have restated the comparative reporting periods presented herein, and recognized the transitional adjustments through equity at the start of the first comparative reporting period presented herein. The new standard changed the timing of our revenue recognition for a significant portion of our business, resulting in the recognition of revenue for certain customer contracts earlier than under the previous recognition rules (which was generally upon delivery). The new standard had a material impact on our consolidated financial statements, primarily in relation to inventory and accounts receivable balances. See note 2(y) for the transitional impacts of adopting IFRS 15.
SIGNIFICANT ACCOUNTING POLICIES:
The accounting policies below are in compliance with IFRS and have been applied consistently to all periods presented in these consolidated financial statements.
F-
12
CELESTICA INC.
NOTES TO THE CONSOLIDATED FINANCIAL STATEMENTS
(in millions of U.S. dollars, except percentages and per share amounts)
(a) Basis of measurement:
These consolidated financial statements have been prepared primarily on the historical cost basis. Other measurement bases, where used, are described in the applicable notes.
|
(b)
|
Basis of consolidation:
|
These consolidated financial statements include our direct and indirect subsidiaries, all of which are wholly-owned. Any subsidiaries that are formed or acquired during the year are consolidated from their respective dates of formation or acquisition. Inter-company transactions and balances are eliminated on consolidation.
|
(c)
|
Business combinations:
|
We use the acquisition method to account for any business combinations. All identifiable assets and liabilities are recorded at fair value as of the acquisition date. Any goodwill that arises from business combinations is tested annually for impairment (see note 2
(l)
). Potential obligations for contingent consideration and other contingencies are also recorded at fair value as of the acquisition date. We record subsequent changes in the fair value of such potential obligations from the date of acquisition to the settlement date in our consolidated statement of operations. We expense integration costs (for the establishment of business processes, infrastructure and information systems for acquired operations) and acquisition-related consulting and transaction costs as incurred in our consolidated statement of operations.
We use judgment to determine the estimates used to value identifiable net assets and the fair value of contingent consideration, if applicable, at the acquisition date. We may engage third parties to assist in determining the fair value of inventory, property, plant and equipment and intangible assets. We use estimates to determine cash flow projections, including the period of expected future benefit, and future growth and discount rates, among other factors.
|
(d)
|
Foreign currency translation:
|
The majority of our subsidiaries have a U.S. dollar functional currency, which represents the currency of the primary economic environment in which they operate. For these subsidiaries, we translate monetary assets and liabilities denominated in foreign currencies into U.S. dollars at the period-end exchange rates. We translate non-monetary assets and liabilities denominated in foreign currencies into U.S. dollars at historic rates, and we translate revenue and expenses into U.S. dollars at the average exchange rates prevailing during the month of the transaction. Exchange gains and losses also arise on the settlement of foreign-currency denominated transactions. We recognize foreign currency differences arising on translation in our consolidated statement of operations.
For our subsidiaries with a non-U.S. dollar functional currency, we translate assets and liabilities into U.S. dollars using the period-end exchange rates, and we translate revenue and expenses into U.S. dollars at the average exchange rates prevailing during the month of the transaction. We defer gains and losses arising from the translation of these operations in the foreign currency translation account included in accumulated other comprehensive income (OCI).
|
(e)
|
Cash and cash equivalents:
|
Cash and cash equivalents include cash on account and short-term investments with original maturities of three months or less. These instruments are subject to an insignificant risk of change in fair value over their terms and, as a result, we carry cash and cash equivalents at cost.
|
(f)
|
Accounts receivable:
|
We initially value our accounts receivable at fair value. We record an allowance for doubtful accounts against accounts receivable that management believes are impaired. We record specific allowances against customer receivables based on a forward-looking ECL model. Our allowance is based on historical experience, and includes consideration of the aging of the balances, the customer's creditworthiness, current economic conditions, expectation of bankruptcies, and political and economic volatility in the markets/location of our customers, among other factors. A default of accounts receivable occurs when customers are unable to pay for the goods or services provided in accordance with the contract terms and conditions. An accounts receivable
F-
13
CELESTICA INC.
NOTES TO THE CONSOLIDATED FINANCIAL STATEMENTS
(in millions of U.S. dollars, except percentages and per share amounts)
balance is written off or written down to its net realizable value as soon as it is known to be in full or partial default. We will adjust previous write-downs to reflect changes in estimates or actual experience.
|
(g)
|
Inventories:
|
We procure inventory and manufacture based on specific customer orders and forecasts and value our inventory on a first-in, first-out basis at the lower of cost and net realizable value. The cost of our finished goods and work in progress includes direct materials, labor and overhead. We may require valuation adjustments if actual market conditions or demand for our customers' products or services are less favorable than originally projected. The determination of net realizable value involves significant management judgment. We consider factors such as shrinkage, the aging of and future demand for the inventory, and contractual arrangements with customers. We attempt to utilize excess inventory in other products we manufacture or return inventory to the relevant suppliers or customers. We use future sales volume forecasts to estimate excess inventory on-hand. A change to these assumptions may impact our inventory valuation and our gross margins. Should circumstances change, we may adjust our previous write-downs in our consolidated statement of operations in the period a change in estimate occurs.
|
(h)
|
Assets classified as held for sale:
|
We classify assets as held for sale if the carrying amount will be recovered principally through a sale transaction rather than through continued use. Management must be committed to the sale transaction and the asset must be immediately available for sale in its present condition to qualify as an asset held for sale. Assets classified as held for sale are measured at the lower of their carrying amount and fair value less costs of disposal, and are no longer depreciated. The determination of fair value less costs of disposal involves judgment by management of the probability and timing of disposition and the expected amount of recoveries and costs. We may engage third parties to assist in the determination of the estimated fair value less costs of disposal for assets classified as held for sale. At the end of each reporting period, we evaluate the appropriateness of our estimates and assumptions. We may require adjustments to reflect actual experience or changes in estimates.
|
(i)
|
Property, plant and equipment:
|
We carry property, plant and equipment at cost less accumulated depreciation and accumulated impairment losses. Cost consists of expenditures directly attributable to the acquisition of the asset, including interest on qualified long-term assets. We capitalize the cost of an asset when the economic benefits associated with that asset are probable and when the cost can be measured reliably. We capitalize the costs of major renovations and we write-off the carrying amount of replaced assets. We expense all other maintenance and repair costs in our consolidated statement of operations as incurred. We do not depreciate land. We recognize depreciation expense on a straight-line basis over the estimated useful life of the asset as follows:
|
Buildings
|
Up to 40 years
|
|
Building/leasehold improvements
|
Up to 40 years or term of lease
|
|
Machinery and equipment
|
3 to 15 years
|
We estimate the useful life of property, plant and equipment based on the nature of the asset, historical experience, expected changes in technology, and the expected duration of related customer programs. When major components of an asset have a significantly different useful life than their primary asset, the components are accounted for and depreciated separately. We review our estimates of residual values, useful lives and the methods of depreciation annually at year end and, if required, adjust for these prospectively. We determine gains and losses on the disposal or retirement of property, plant and equipment by comparing the proceeds from disposal with the carrying amount of the asset and we recognize these gains and losses in our consolidated statement of operations in the period of disposal.
|
(j)
|
Leases:
|
We are the lessee of property, plant and equipment, primarily buildings and machinery. We classify leases as operating leases where the risks and rewards of ownership are retained by the lessor. We generally treat payments made under operating leases as rentals and recognize them as expenses on a straight-line basis over the term of the lease in our consolidated statement of operations. For operating leases, we do not record the leased asset or associated obligation on our consolidated balance sheet.
F-
14
CELESTICA INC.
NOTES TO THE CONSOLIDATED FINANCIAL STATEMENTS
(in millions of U.S. dollars, except percentages and per share amounts)
We classify leases as finance leases if the risks and rewards of ownership have substantially transferred to us. We capitalize finance leases at the commencement of the lease at the lower of the fair value of the leased asset and the present value of the minimum lease payments (included in property, plant and equipment on our consolidated balance sheet), and we depreciate finance leases over a period based on the useful life of the asset. We include the corresponding liabilities, net of finance costs, on our consolidated balance sheet (see note 12). We allocate each finance lease payment between the liability and finance costs.
See note 2(x), “Recently issued accounting pronouncements” for a description of a new IFRS standard on leases that we adopted as of January 1, 2019
.
|
(k)
|
Goodwill and intangible assets:
|
Goodwill:
We initially record goodwill related to acquisitions on our consolidated balance sheet in the amount of the excess of the fair value of the aggregate consideration paid (including the estimated fair value of any contingent consideration) over the fair value of the identifiable net assets acquired. In subsequent reporting periods, we measure goodwill at cost less accumulated impairment losses, if any. We do not amortize goodwill. For purposes of impairment testing, we allocate goodwill to the CGU, or group of CGUs, that we expect will benefit from the related acquisition. See note
2
(l)
, “Impairment of goodwill, intangible assets and property, plant and equipment.”
Intangible assets:
We record intangible assets on our consolidated balance sheet at fair value on the date of acquisition. We capitalize intangible assets when the economic benefits associated with the asset are probable and when the cost can be measured reliably. We estimate the useful life of intangible assets based on the nature of the asset, historical experience and the projected period of expected future economic benefits to be provided by the asset. In subsequent reporting periods, we measure intangible assets at cost less accumulated amortization and accumulated impairment losses, if any. We amortize these assets on a straight-line basis over their estimated useful lives as follows:
|
Intellectual property
|
3 to 5 years
|
|
Other intangible assets
|
4 to 15 years
|
|
Computer software assets
|
1 to 10 years
|
Intellectual property assets consist primarily of certain non-patented intellectual property and process technology. Other intangible assets consist primarily of acquired customer relationships and contract intangibles. Computer software assets consist primarily of software licenses. We review our estimates of residual values, useful lives and the methods of amortization annually at year end and, if required, adjust for these prospectively. We reflect changes in useful lives on a prospective basis.
|
(l)
|
Impairment of goodwill, intangible assets and property, plant and equipment:
|
We review the carrying amount of goodwill, intangible assets and property, plant and equipment for impairment whenever events or changes in circumstances (triggering events) indicate that the carrying amount of such assets (or the related CGU or CGUs) may not be recoverable. If any such indication exists, we test the carrying amount of such assets or CGUs for impairment. In addition to an assessment of triggering events during the year, we conduct an annual goodwill impairment assessment in the fourth quarter of the year to correspond with our annual planning cycle. Judgment is required in the determination of our CGUs and whether events or changes in circumstances during the year are indicators that a review for impairment should be conducted.
We recognize an impairment loss when the carrying amount of an asset, CGU or group of CGUs exceeds its recoverable amount. The recoverable amount of an asset, CGU or group of CGUs is measured as the greater of its expected value-in-use and its estimated fair value less costs of disposal. The process of determining the recoverable amount is subjective and requires management to exercise significant judgment in estimating future growth, profitability, discount and terminal growth rates, and in projecting future cash flows, among other factors. Determination of our value-in-use is based on a discounted cash flow
F-
15
CELESTICA INC.
NOTES TO THE CONSOLIDATED FINANCIAL STATEMENTS
(in millions of U.S. dollars, except percentages and per share amounts)
analysis of the relevant asset, CGU or group of CGUs. The process of determining the estimated fair value less costs of disposal requires valuations and use of appraisals. Where applicable, we engage independent brokers to obtain market prices to estimate our real property and other asset values. We recognize impairment losses in our consolidated statement of operations. We first allocate impairment losses in respect of a CGU or group of CGUs to reduce the carrying amount of its goodwill, and then to reduce the carrying amount of other assets in such CGU or group of CGUs generally on a pro rata basis. See notes 8,
9
and
16
(a).
We do not reverse impairment losses for goodwill in future periods. We reverse impairment losses for property, plant and equipment and intangible assets if the losses we recognized in prior periods no longer exist or have decreased as a result of changes in circumstances. At each reporting date, we review for indicators that could change the estimates we used to determine the recoverable amount of the relevant assets. The amount of the reversal will be limited to the carrying amount that would have been determined, net of depreciation or amortization, had we recognized no impairment loss in prior periods.
(m)
Provisions:
We recognize a provision for legal or constructive obligations arising from past events when the amount can be reliably estimated and it is probable that an outflow of resources will be required to settle an obligation. The nature and type of provisions vary and management judgment is required to determine the extent of an obligation and whether the outflow of resources is probable. At the end of each reporting period, we evaluate the appropriateness of the remaining balances. We may require adjustments to the recorded amounts to reflect actual experience or changes in estimates in future periods.
Restructuring:
We incur restructuring charges relating to workforce reductions, site consolidations, and costs associated with businesses we are downsizing or exiting. Our restructuring charges include employee severance and benefit costs, consultant costs, gains, losses or impairments related to owned sites and equipment we no longer use and which are available for sale, impairment of related intangible assets, and costs related to leased sites and equipment we no longer use.
The recognition of restructuring charges requires management to make certain judgments and estimates regarding the nature, timing and amounts associated with our restructuring actions. Our major assumptions include the timing of employees to be terminated, the measurement of termination costs, the timing and amount of lease obligations and any anticipated sublease recoveries from exited sites, and the timing of disposition and estimated fair values less costs of disposal for assets we no longer use and which are available for sale. We develop detailed plans and record termination costs in the period the employees are informed of their termination. For owned sites and equipment that are no longer in use and are available for sale, we recognize an impairment loss based on their estimated fair value less costs of disposal, with fair value estimated based on market prices for similar assets. We may engage third parties to assist in the determination of the fair values less costs of disposal for these assets. For leased sites that we intend to exit, we discount the lease obligation costs, which represent future contractual lease payments and cancellation fees, if any, less estimated sublease recoveries, if any. We recognize any change in provisions due to the passage of time as finance costs. To estimate future sublease recoveries, we engage independent brokers to determine the estimated tenant rents we can expect to realize. At the end of each reporting period, we evaluate the appropriateness of our restructuring charges and balances. Adjustments to the recorded amounts may be required to reflect actual experience or changes in estimates for future periods. See note
16
(a)
.
Legal and other contingencies:
In the normal course of our operations, we may be subject to lawsuits, investigations and other claims, including environmental, labor, product, customer disputes and other matters. The filing of a suit or formal assertion of a claim does not automatically trigger a requirement to record a provision. We recognize a provision for loss contingencies, including legal claims, based on management’s estimate of the probable outcome. Judgment is required when there is a range of possible outcomes. Management considers the degree of probability of the outcome and the ability to make a reasonable estimate of the loss. We may also use third party advisors in making our determination. The ultimate outcome, including the amount and timing of any payments required, may vary significantly from our original estimates. Potential material legal and other material contingent obligations that have not been recognized as provisions, as the outcome is remote or not probable, or the amount cannot be reliably estimated, are disclosed as contingent liabilities. See note
24
.
F-
16
CELESTICA INC.
NOTES TO THE CONSOLIDATED FINANCIAL STATEMENTS
(in millions of U.S. dollars, except percentages and per share amounts)
Warranty:
We offer product and service warranties to our customers. We record a provision for future warranty costs based on management’s estimate of probable claims under these warranties. In determining the amount of the provision, we consider several factors including the terms of the warranty (which vary by customer, product or service), the current volume of products sold or services rendered during the warranty period, and historical warranty information. We review and adjust these estimates as necessary to reflect our experience and new information. The amount and aging of our provision will vary depending on various factors including the length of the warranty offered, the remaining life of the warranty and the extent and timing of warranty claims. We classify the portion of our warranty provision for which payment is expected in the next 12 months as current, and the remainder as non-current.
|
(n)
|
Employee benefits:
|
Pension and non-pension post-employment benefits:
We classify pension and non-pension post-employment benefits as either defined contribution plans or defined benefit plans.
Under defined contribution plans, our obligation is to make a fixed contribution to a separate entity. The related investment risk is borne by the employee. We recognize our obligations to make contributions to defined contribution plans as an employee benefit expense in our consolidated statement of operations in the period the employee services are rendered.
Under defined benefit plans, our obligation is to provide an agreed-upon benefit to specified plan participants. We remain exposed to the actuarial and investment risks with respect to defined benefit plans. Our obligation is actuarially determined using the projected unit credit method, based on service and management’s estimates. Actuarial valuations require management to make certain judgments and estimates relating to salary escalation, compensation levels at the time of retirement, retirement ages, the discount rate used in measuring the net interest on the net defined benefit asset or liability, and expected healthcare costs (as applicable). These actuarial assumptions could change from period-to-period and actual results could differ materially from the estimates originally made by management. We evaluate our assumptions on a regular basis, taking into consideration current market conditions and historical data. Market driven changes may affect the actual rate of return on plan assets compared to our assumptions, as well as our discount rates and other variables which could cause actual results to differ materially from our estimates. Changes in assumptions could impact our defined benefit pension plan valuations and our future defined benefit pension expense and required funding.
Our obligation for each defined benefit plan consists of the present value of the defined benefit obligation less the fair value of plan assets, and is presented on a net basis on our consolidated balance sheet. When the actuarial calculation results in a benefit, the asset we recognize is restricted to the present value of economic benefits available in the form of future refunds from the plan or reductions in future contributions to the plan. To calculate the present value of economic benefits, we also consider any minimum funding requirements that apply to the plan. An economic benefit is available if it is realizable during the life of the plan, or on settlement of the plan liabilities.
We recognize past service costs or credits arising from plan amendments, whether vested or unvested, immediately in our consolidated statement of operations. We determine the net interest expense (income) on the net defined benefit liability (asset) for each year by applying the discount rate used to measure the defined benefit obligation at the beginning of the year to the net defined benefit liability (asset) position, taking into account any changes in the net defined benefit liability (asset) during the year as a result of contributions and benefit payments. Net interest expense and other expenses related to defined benefit plans are recognized in our consolidated statement of operations. The difference between the interest income on plan assets and the actual net return on plan assets is included in the re-measurement of the net defined benefit liability (asset). We recognize actuarial gains and losses on plan assets or obligations, as well as any year over year change in the impairment of the balance sheet position in OCI and we reclassify the amounts to deficit. Curtailment gains or losses may arise from significant changes to a plan. We record curtailment gains or losses in our consolidated statement of operations when the curtailment occurs.
To mitigate the actuarial and investment risks of our defined benefit pension plans, we from time to time purchase annuities (using existing plan assets) from third party insurance companies for certain, or all, plan participants. The purchase of annuities by the pension plan substantially hedges the financial risks associated with our pension obligations. Where the annuities
F-
17
CELESTICA INC.
NOTES TO THE CONSOLIDATED FINANCIAL STATEMENTS
(in millions of U.S. dollars, except percentages and per share amounts)
are purchased on behalf of, and held by the pension plan, the relevant employer retains the ultimate responsibility for the payment of benefits to plan participants, and we retain the pension assets and liabilities on our consolidated balance sheet. Our annuity purchases have resulted (and future annuity purchases may result) in losses, due to a reduction in the value of the plan assets relative to plan obligations as of the date of the annuity purchase. We record these non-cash losses in OCI on our consolidated balance sheet and simultaneously reclassify such amounts to deficit in the same period. Alternatively, where we purchase annuities from insurance companies on behalf of applicable plan participants with the intention of winding-up the relevant plan in the future (with the expectation of transferring the annuities to the individual plan members), the insurance company assumes responsibility for the payment of benefits to the relevant plan participants once the wind-up is complete. In this case, settlement accounting is applied to the purchase of the annuities and the loss (if any) is recorded in other charges in our consolidated statement of operations. In addition, both the pension assets and liabilities will be removed from our consolidated balance sheet once the wind-up of the plan is complete.
Stock-based compensation:
We generally grant performance share units (PSUs) and restricted share units (RSUs), and from time to time grant stock options, to employees under our stock-based compensation plans. Stock options and RSUs vest in installments over the vesting period. Stock options generally vest
25%
per year over a
four
-year period, and RSUs generally vest one-third per year over a
three
-year period. We treat each installment under a grant of stock options and RSUs as a separate grant in determining the compensation expense. PSUs vest at the end of their respective terms, generally
three
years from the grant date, to the extent that specified performance conditions have been met.
Stock options:
Stock options are exercisable for subordinate voting shares. We recognize the grant date fair value of stock options granted to employees as compensation expense in our consolidated statement of operations, with a corresponding charge to contributed surplus on our consolidated balance sheet, over the vesting period. We adjust compensation expense to reflect the estimated number of options we expect to vest at the end of the vesting period. When options are exercised, we credit the proceeds to capital stock on our consolidated balance sheet. We measure the fair value of stock options using the Black-Scholes option pricing model. Measurement inputs include the price of our subordinate voting shares on the grant date, the exercise price of the stock option, and our estimates of the following: expected price volatility of our subordinate voting shares (based on weighted average historic volatility), weighted average expected life of the stock option (based on historical experience and general option holder behavior), and the risk-free interest rate.
RSUs:
The cost we recorded for RSUs was based on the market value of our subordinate voting shares at the time of grant. We amortize the cost of RSUs to compensation expense in our consolidated statement of operations, with a corresponding charge to contributed surplus on our consolidated balance sheet, over the vesting period. We generally settle these awards with subordinate voting shares purchased in the open market by a broker, or by issuing subordinate voting shares from treasury.
PSUs granted in 2016 and 2017:
The cost we recorded for
40%
of PSUs granted in each of 2016 and 2017 was based on the market value of our subordinate voting shares at the time of grant. The cost we recorded for these PSUs, which vest based on a non-market performance condition related to the achievement of pre-determined financial targets over a specified period, was based on our estimate of the outcome of such performance condition. We adjust the cost of these PSUs as new facts and circumstances arise; the timing of these adjustments is subject to judgment. We generally record adjustments to the cost of these PSUs in the final year of the
three
-year term based on management's estimate of the expected level of achievement of such performance condition. We amortize the cost of these PSUs to compensation expense in our consolidated statement of operations, with a corresponding charge to contributed surplus on our consolidated balance sheet, over the vesting period. We generally settle these awards with subordinate voting shares purchased in the open market by a broker, or by issuing subordinate voting shares from treasury.
We determined the cost we recorded for
60%
of PSUs granted in each of 2016 and 2017 using a Monte Carlo simulation model. The number of awards expected to vest is factored into the grant date Monte Carlo valuation for the award. The number
F-
18
CELESTICA INC.
NOTES TO THE CONSOLIDATED FINANCIAL STATEMENTS
(in millions of U.S. dollars, except percentages and per share amounts)
of these PSUs that will vest depends on the level of achievement of total shareholder return (TSR), which is a market performance condition, relative to the TSR of a pre-defined group of companies over a three-year period. We do not adjust the grant date fair value regardless of the eventual number of awards that vest based on the level of achievement of the market performance condition. We recognize compensation expense in our consolidated statement of operations on a straight-line basis over the requisite service period and we reduce this expense for the estimated PSU awards that are not expected to vest because the employment conditions are not expected to be satisfied. We generally settle these awards with subordinate voting shares purchased in the open market by a broker, or by issuing subordinate voting shares from treasury.
PSUs granted in 2018:
The cost we recorded for the PSUs granted in 2018 was based on our estimate of the outcome of the performance conditions. The number of PSUs granted in 2018 that will actually vest will vary from
0
to
200%
of the target amount granted based on the level of achievement of a pre-determined non-market performance measurement in the final year of the
three
-year performance period, subject to modification by a separate pre-determined non-market financial target and our relative TSR performance over the 3 -year vesting period. We estimated the grant date fair value of the TSR modifier
for these awards using a Monte Carlo simulation model. The grant date fair value for the non-TSR-based performance measurement and modifier was based on the market value of our subordinate voting shares at the time of grant and may be adjusted in subsequent periods to reflect a change in the estimated level of achievement related to the applicable performance condition. We recognize compensation expense in our consolidated statement of operations on a straight-line basis over the requisite service period and we reduce this expense for the estimated PSU awards that are not expected to vest because the employment conditions are not expected to be satisfied. We generally settle these awards with subordinate voting shares purchased in the open market by a broker, or by issuing subordinate voting shares from treasury.
DSUs:
The compensation of our Board of Directors is comprised of annual Board retainer fees, annual Audit and Compensation Committee Chair retainer fees (for the Chairs of those committees) and travel fees (collectively, Annual Fees) payable in quarterly installments in arrears. In 2018, directors were required to elect to have either
75%
or
100%
of their Annual Fees paid in deferred share units (DSUs). The number of DSUs we grant is determined by dividing the elected percentage of the dollar value of the Annual Fees earned in the quarter by the closing price of our subordinate voting shares on the NYSE on the last business day of such quarter. Each DSU represents the right to receive one subordinate voting share or an equivalent value in cash after the individual ceases to serve as a director. DSUs granted prior to January 1, 2007 may be settled with subordinate voting shares issued from treasury or purchased in the open market, or with cash (at the discretion of the Company). DSUs granted after January 1, 2007 may only be settled with subordinate voting shares purchased in the open market, or with cash (at the discretion of the Company). We expense the cost of DSUs through SG&A in our consolidated statement of operations in the period the services are rendered.
(o) Deferred financing costs:
Deferred financing costs consist of costs relating to the establishment or amendment of our credit facility. We defer financing costs related to our revolving facility as other assets on our consolidated balance sheet which we amortize to our consolidated statement of operations on a straight-line basis over the term of the revolving facility. We record financing costs relating to the issuance of our term loans as a reduction to the cost of the related debt (see note
12
) which we amortize to our consolidated statement of operations using the effective interest rate method over the term of the related debt or when the debt is retired, if earlier.
|
(p)
|
Income taxes:
|
Our income tax expense for a reporting period is comprised of current and deferred income taxes. Current income taxes and deferred income taxes are recognized in our consolidated statement of operations, except to the extent that they relate to items recognized in OCI or directly in equity, in which case the taxes are also recognized in OCI or directly in equity, respectively.
In the ordinary course of business, there are many transactions for which the ultimate tax outcome is uncertain until we resolve it with the relevant tax authority, which may take many years. The final tax outcome of these matters may be different from the estimates management originally made in determining our tax provision. Management periodically evaluates the
F-
19
CELESTICA INC.
NOTES TO THE CONSOLIDATED FINANCIAL STATEMENTS
(in millions of U.S. dollars, except percentages and per share amounts)
positions taken in our tax returns with respect to situations in which applicable tax rules are subject to interpretation. We establish provisions related to tax uncertainties where appropriate, based on our estimate of the amount that ultimately will be paid to or received from the tax authorities. We recognize accrued interest and penalties relating to tax uncertainties in current income tax expense. The various judgments and estimates by management in establishing provisions related to tax uncertainties significantly affect the amounts we recognize in our consolidated financial statements.
We use the liability method of accounting for deferred income taxes. Under this method, we recognize deferred income tax assets and liabilities for future income tax consequences attributable to temporary differences between the financial statement carrying amounts of assets and liabilities and their respective income tax bases, and on unused tax losses and tax credit carryforwards. We measure deferred income taxes using tax rates and laws that have been enacted or substantively enacted at the reporting date and that we expect will apply when the related deferred income tax asset is realized or the deferred income tax liability is settled. We recognize deferred income tax assets to the extent we believe it is probable, based on management’s estimates, that future taxable profit will be available against which the deductible temporary differences as well as unused tax losses and tax credit carryforwards can be utilized. Estimates of future taxable profit in different tax jurisdictions are an area of estimation uncertainty. We review our deferred income tax assets at each reporting date and reduce them to the extent it is no longer probable that we will realize the related tax benefits. We recognize the effect of a change in income tax rates in the period of enactment or substantive enactment.
We do not recognize deferred income taxes if they arise from the initial recognition of goodwill, or for temporary differences arising from the initial recognition of an asset or a liability in a transaction that is not a business combination and that affects neither accounting nor taxable profit or loss. We also do not recognize deferred income taxes on temporary differences relating to investments in subsidiaries to the extent we are able to control the timing of the reversal of the temporary differences and it is probable that the temporary differences will not reverse in the foreseeable future.
During each period, we record current income tax expense or recovery based on taxable income earned or loss incurred in each tax jurisdiction where we operate, and for any adjustments to taxes payable in respect of previous years, using tax laws that are enacted or substantively enacted at the balance sheet date.
|
(q)
|
Financial assets and financial liabilities:
|
We recognize financial assets and financial liabilities initially at fair value and subsequently measure these at either fair value or amortized cost based on their classification as described below.
See note
2
(s)
, “Impairment of financial assets.”
Fair value through profit or loss (FVTPL):
Financial assets and any financial liabilities that we purchase or incur, respectively, with the intention of generating earnings in the near term, and derivatives other than cash flow hedges, are classified as FVTPL. This category includes short-term investments in money market funds (if applicable) that we group with cash equivalents, and derivative assets and derivative liabilities that do not qualify for hedge accounting. For investments that we classify as FVTPL, we initially recognize such financial assets on our consolidated balance sheet at fair value and recognize subsequent changes in our consolidated statement of operations. We expense transaction costs as incurred in our consolidated statement of operations. We do not currently hold any liabilities designated as FVTPL.
Amortized cost:
Financial assets that we hold with the intention of collecting the contractual cash flows (in the form of payment of principal and related interest) are measured at amortized cost, and includes our trade receivables, term deposits and non-customer receivables. We initially recognize the carrying amount of such assets on our consolidated balance sheet at fair value plus directly attributable transaction costs, and subsequently measure these at amortized cost using the effective interest rate method, less any impairment losses.
F-
20
CELESTICA INC.
NOTES TO THE CONSOLIDATED FINANCIAL STATEMENTS
(in millions of U.S. dollars, except percentages and per share amounts)
Other financial liabilities:
This category is for our financial liabilities that are not classified as FVTPL, and includes our accounts payable, the majority of our accrued liabilities and certain other provisions, as well as borrowings under our credit facility, including our term loans. We record these financial liabilities at amortized cost on our consolidated balance sheet.
|
(r)
|
Derivatives and hedge accounting:
|
We enter into forward exchange and swap contracts to hedge the cash flow risk associated with firm purchase commitments and forecasted transactions in foreign currencies that are considered highly probable and to hedge foreign-currency denominated balances. We use estimates to forecast future cash flows and the future financial position of net monetary assets or liabilities denominated in foreign currencies. We enter into interest rate swap agreements to mitigate a portion of the interest rate risk on our term loan borrowings. We apply hedge accounting to those hedge transactions that are considered effective. Management assesses the effectiveness of hedges by comparing actual outcomes against our estimates on a regular basis. Subsequent revisions in estimates of future cash flow forecasts, if significant, may result in the discontinuation of hedge accounting for that hedge. We do not enter into derivative contracts for speculative purposes.
At the inception of a hedging relationship, we formally document the relationship between our hedging instrument and the hedged item, as well as our risk management objectives and strategy for undertaking the various hedge transactions. Our process includes linking all derivatives to specific assets and liabilities on our consolidated balance sheet or to specific firm commitments or forecasted transactions. We also formally assess, both at the hedge’s inception and at the end of each quarter, whether the derivatives used in hedged transactions are highly effective in offsetting changes in the cash flows of the hedged items. We record the gain or loss from these forward contracts in the same line item where the underlying exposures are recognized in our consolidated statement of operations. For our non-designated hedges against our balance sheet exposures denominated in foreign currencies, we record the gain or loss from these forward contracts in SG&A in our consolidated statement of operations.
Forward contracts that are not designated as hedges are marked to market each period, resulting in a gain or loss in our consolidated statement of operations. We measure all derivative contracts at fair value on our consolidated balance sheet. The majority of our derivative assets and liabilities arise from the foreign currency forward contracts and interest rate swaps that we designate as cash flow hedges. In a cash flow hedge, we defer the changes in the fair value of the hedging derivative, to the extent effective, in OCI until we recognize the asset, liability or forecasted transactions being hedged in our consolidated statement of operations. Any cash flow hedge ineffectiveness is recognized in our consolidated statement of operations immediately. For hedges that we discontinue before the end of the original hedge term, we amortize the unrealized hedge gain or loss in OCI in our consolidated statement of operations over the remaining term of the hedge. If the hedged item ceases to exist before the end of the original hedge term, we recognize the unrealized hedge gain or loss in OCI immediately in our consolidated statement of operations. For our current currency forward and swap cash flow hedges, the majority of the underlying expenses we hedge are included in cost of sales. For our interest rate swaps, the underlying interest expenses that we hedge are included in finance costs in our consolidated statement of operations.
We value our derivative assets and liabilities based on inputs that are either readily available in public markets or derived from information available in public markets. The inputs we use include discount rates, forward exchange rates, interest rate yield curves and volatility, and credit risk adjustments. Changes in these inputs can cause significant volatility in the fair value of our financial instruments in the short-term.
|
(s)
|
Impairment of financial assets:
|
We review financial assets at each reporting date. Financial assets are deemed to be impaired when objective evidence resulting from one or more events subsequent to the initial recognition of the asset indicates the estimated future cash flows of the asset have decreased. We use a forward-looking ECL model in determining our allowance for doubtful accounts as it relates to trade receivables, contract assets (under IFRS 15), and other financial assets. Our allowance is based on historical experience, and includes consideration of the aging of the balances, the customer's creditworthiness, current economic conditions, expectation of bankruptcies, and political and economic volatility in the markets/location of our customers, among other factors. We measure an impairment loss as the excess of the carrying amount over the present value of the estimated future cash flows discounted using the financial asset’s original discount rate, and we recognize this loss in our consolidated statement of operations. A
F-
21
CELESTICA INC.
NOTES TO THE CONSOLIDATED FINANCIAL STATEMENTS
(in millions of U.S. dollars, except percentages and per share amounts)
financial asset is written off or written down to its net realizable value as soon as it is known to be impaired. We will adjust previous write-downs to reflect changes in estimates or actual experience.
|
(t)
|
Revenue and deferred investment costs:
|
We derive the majority of our revenue from the sale of electronic products and services that we manufacture and provide to customer specifications. We recognize revenue from the sale of products and services rendered when our performance obligations have been satisfied or when the associated control over the products has passed to the customer and no material uncertainties remain as to the collection of our receivables. Under IFRS 15, which we adopted on January 1, 2018, where products are custom-made to meet a customer's specific requirements, and such customer is obligated to compensate us for the work performed to date, we will recognize revenue over time as production progresses to completion, or as services are rendered. We generally estimate revenue for our work in progress based on costs incurred to date plus a reasonable profit margin for eligible products for which we do not have alternative uses. For other contracts that do not qualify for revenue recognition over time, we recognize revenue at the point in time where control is passed to the customer, which is generally upon shipment when no further performance obligation remains except for our standard manufacturing or service warranties. We apply significant estimates, judgment and assumptions in determining the timing of revenue recognition, measuring work in progress, and estimating the amount and timing of expected returns, revenues and related costs. As our invoices are typically issued at the time of the delivery of final products to the customers, the earlier recognition of revenue on certain custom-made products has significantly increased the amount of unbilled contract assets included in accounts receivable on our consolidated balance sheet. See “Recently adopted accounting standards” above and note 2(y) below for the impact of adopting IFRS 15 effective January 1, 2018
.
We record certain investment costs, comprised of contract acquisition or fulfillment costs, to the extent recoverability of these costs are probable, in other current and non-current assets on our consolidated balance sheet. We subsequently amortize these investment costs over the projected period of expected future economic benefits, or as recoveries are realized, from the new contracts. We monitor these deferred costs for potential impairment on a regular basis.
(u) Government grants:
We receive government grants from time to time related to equipment purchases or other expenditures. We recognize these grants when there is reasonable assurance that we will retain the benefits. If we receive a grant but cannot reasonably assure that we will comply with the conditions of the grant, we will defer the grant and record a liability on our consolidated balance sheet until the conditions are fulfilled. For grants that relate to the purchase of equipment, we reduce the cost of the asset in the period the cost is incurred or when the conditions are fulfilled, and we calculate amortization on the net amount. For grants that relate to operating expenditures, we reduce the expense in the period the cost is incurred or when the conditions are fulfilled.
|
(v)
|
Research and development:
|
We incur costs relating to research and development activities. We expense these costs as incurred in our consolidated statement of operations unless development costs meet the required criteria under IFRS for capitalization.
|
(w)
|
Earnings per share (EPS):
|
We calculate basic EPS by dividing net earnings by the weighted average number of shares (subordinate and multiple voting shares collectively) outstanding during the period. We calculate diluted EPS using the treasury stock method, which reflects the potential dilution from stock-based awards that are issued from treasury.
F-
22
CELESTICA INC.
NOTES TO THE CONSOLIDATED FINANCIAL STATEMENTS
(in millions of U.S. dollars, except percentages and per share amounts)
(x) Recently issued accounting pronouncements:
IFRS 16, Leases:
In January 2016, the IASB issued this standard, which brings most leases on-balance sheet for lessees under a single model, eliminating the distinction between operating and finance leases. IFRS 16 supersedes IAS 17,
Leases
, and related interpretations, and is effective for periods beginning on or after January 1, 2019. We adopted this standard effective January 1, 2019 applying the modified retrospective approach, whereby the cumulative effect of adopting IFRS 16 will be recognized as an adjustment to the opening retained deficit balance as of January 1, 2019, without restatement of prior period comparative information. We have implemented changes to our business processes, systems and controls to enable the preparation of our consolidated financial statements in accordance with IFRS 16. We will recognize new right-of-use assets and lease liabilities related to the majority of our operating leases on our consolidated balance sheet as of January 1, 2019 upon initial application of IFRS 16. The amortization of these assets will be recognized as a depreciation charge, and the interest expense on the lease liabilities will be recognized as finance costs in our consolidated statement of operations. Previously, we recognized operating lease expenses on a straight-line basis over the lease term generally in cost of sales or SG&A in our consolidated statement of operations. No significant changes are expected for our existing finance leases nor for any leases in which we are a lessor. Although we are completing our analysis of the impact of adopting IFRS 16, we anticipate that the initial application of the new standard will have a material impact on our consolidated financial statements, and we currently estimate that we will recognize right-of-use assets and lease liabilities on our consolidated financial statements of approximately
$113
as of January 1, 2019. The opening retained deficit adjustment is not expected to be material.
(y) Transition to IFRS 15, Revenue from Contracts with Customers:
We adopted the new revenue recognition standard effective January 1, 2018, by applying the retrospective method, and have restated the comparative reporting periods presented herein. In computing the transitional adjustments, we applied the practical expedients in accordance with IFRS 15 to exclude certain contracts that we started and completed in the same annual reporting period, or were completed prior to January 1, 2016, the beginning of the earliest period presented herein. We recognized the transitional adjustments through equity as of January 1, 2016.
Transitional impacts:
For a significant portion of our business, the timing of our revenue recognition has changed under the new standard from a point-in-time to over time, resulting in earlier recognition of revenue than under the previous recognition rules (which was generally upon delivery of final products to our end customer). The most significant financial impacts of adopting IFRS 15 on the comparative periods in our consolidated financial statements are summarized as follows:
|
Year ended
|
Year ended
|
|||||||||||||||
|
January 1, 2016
|
December 31, 2016
|
December 31,
2016 |
December 31,
2017 |
December 31, 2017
|
||||||||||||
|
Increase (decrease)
|
||||||||||||||||
|
Contract assets (included in accounts receivable)
|
$
|
196.9
|
|
—
|
|
$
|
226.9
|
|
—
|
|
$
|
258.9
|
|
|||
|
Inventories
|
(178.2
|
)
|
—
|
|
(206.2
|
)
|
—
|
|
(237.8
|
)
|
||||||
|
Deferred taxes
|
(1.7
|
)
|
—
|
|
(1.7
|
)
|
—
|
|
(1.9
|
)
|
||||||
|
Accrued and other current liabilities
|
—
|
|
—
|
|
—
|
|
—
|
|
(0.3
|
)
|
||||||
|
Deficit
|
(17.0
|
)
|
—
|
|
(19.0
|
)
|
—
|
|
(19.5
|
)
|
||||||
|
Revenue
|
—
|
|
$
|
30.1
|
|
—
|
|
$
|
32.2
|
|
—
|
|
||||
|
Cost of sales
|
—
|
|
28.1
|
|
—
|
|
31.5
|
|
—
|
|
||||||
|
Income tax expense
|
—
|
|
—
|
|
—
|
|
0.2
|
|
—
|
|
||||||
|
Net earnings
|
—
|
|
2.0
|
|
—
|
|
0.5
|
|
—
|
|
||||||
|
Diluted earnings per share
|
—
|
|
$
|
0.01
|
|
—
|
|
$
|
0.01
|
|
—
|
|
||||
F-
23
CELESTICA INC.
NOTES TO THE CONSOLIDATED FINANCIAL STATEMENTS
(in millions of U.S. dollars, except percentages and per share amounts)
Contract assets and liabilities:
Our contract assets consist of unbilled amounts recognized as revenue under IFRS 15 and deferred investment costs incurred to obtain or fulfill a contract. Contract assets are recorded in accounts receivable on our consolidated balance sheet. Deferred investment costs are recorded in other current and non-current assets on our consolidated balance sheet. Our contract liabilities consist of advance payments from customers and deferred revenue, which are recorded in accrued and other current liabilities on our consolidated balance sheet.
3
. ACQUISITIONS:
We may, at any time, be engaged in ongoing discussions with respect to possible acquisitions that could expand our revenue base and/or service offerings, increase our penetration in various industries, establish strategic relationships with new or existing customers, enhance our competitiveness and/or enhance our global supply chain network. We incur consulting, transaction and integration costs (Acquisition Costs) relating to potential and completed acquisitions. During
2018
, we recorded Acquisition Costs of
$11.0
(
2017
—
$4.5
; 2016 —
$1.4
) in other charges in our consolidated statement of operations.
In November 2016, we acquired the business assets of Lorenz, Inc. and Suntek Manufacturing Technologies, SA de CV, collectively known as Karel Manufacturing (Karel), for a cash purchase price of
$14.9
, with operations in Mexico. Karel is a manufacturing services company that specializes in complex wire harness assembly, systems integration, sheet metal fabrication, welding and machining, serving primarily aerospace and defense customers. As part of the acquisition, we acquired
$11.5
in assets, primarily for current assets, net of cash acquired, and
$3.7
of goodwill, representing the specialized knowledge of the acquired workforce and expected synergies. The goodwill arising from this acquisition is attributable to our ATS segment, and approximately two-thirds of such goodwill was tax deductible.
In April 2018, we completed the acquisition of U.S.-based Atrenne Integrated Solutions, Inc. (Atrenne), a designer and manufacturer of ruggedized electromechanical solutions, primarily for military and commercial aerospace applications, with operations in Minnesota and Massachusetts. The purchase price for Atrenne was $
141.7
, net of cash acquired, including a net working capital adjustment of
$3.8
(which is subject to finalization). The purchase was funded with borrowings under the revolving portion of our then-available credit facility. We recorded
$64.0
of goodwill as part of the acquisition, attributable primarily to the specific knowledge and capabilities of the acquired workforce and expected synergies from the combination of our operations.
Details of our preliminary purchase price allocation in the year of acquisition are as follows:
|
Atrenne
|
|||
|
Current assets, net of $1.1 of cash acquired
|
$
|
31.5
|
|
|
Property, plant and equipment
|
7.8
|
|
|
|
Customer intangible assets and computer software assets
|
51.0
|
|
|
|
Goodwill
|
64.0
|
|
|
|
Current liabilities
|
(8.5
|
)
|
|
|
Deferred income taxes and other-long-term liabilities
|
(4.1
|
)
|
|
|
$
|
141.7
|
|
|
Acquired assets and liabilities are recorded on our consolidated balance sheet at their fair values as of the date of acquisition. In connection with our purchase of Atrenne, we recorded a
$1.6
fair value adjustment to write up the value of the acquired inventory as of the acquisition date, representing the difference between the inventory's cost and its fair value. During the second quarter of 2018, we recognized the full
$1.6
fair value adjustment through cost of sales, as all such acquired inventory was sold during that quarter.
The purchase price for Atrenne includes a customary post-closing net working capital adjustment. We expect to finalize our purchase price allocation by the end of the first quarter of 2019, once such net working capital adjustment has been finalized.
F-
24
CELESTICA INC.
NOTES TO THE CONSOLIDATED FINANCIAL STATEMENTS
(in millions of U.S. dollars, except percentages and per share amounts)
Annual amortization of intangible assets increased by approximately
$6
as a result of the Atrenne acquisition. The goodwill arising from this acquisition is attributable to our ATS segment and is not tax deductible.
In November 2018, we completed the acquisition of U.S.-based Impakt Holdings, LLC (Impakt), a highly-specialized, vertically integrated company providing manufacturing solutions for leading OEMs in the display and semiconductor industries, as well as other markets requiring complex fabrication services, with operations in California and South Korea. The purchase price for Impakt was $325.4, net of cash acquired. The purchase price is subject to a net working capital adjustment, which has not yet been finalized.
The purchase was funded with borrowings under our revolving credit facility,
$245.0
of which was repaid with proceeds of a new incremental term loan under our credit facility (see note 12). We recorded
$111.2
of goodwill as part of the acquisition, attributable primarily to the specific knowledge and capabilities of the acquired workforce and expected synergies from the combination of our operations.
Details of our preliminary purchase price allocation in the year of acquisition are as follows:
|
Impakt
|
|||
|
Current assets, net of $5.9 of cash acquired
|
$
|
46.7
|
|
|
Property, plant and equipment and other long-term assets
|
20.9
|
|
|
|
Customer intangible assets and computer software assets
|
223.0
|
|
|
|
Goodwill
|
111.2
|
|
|
|
Current liabilities
|
(23.8
|
)
|
|
|
Deferred income taxes
|
(52.6
|
)
|
|
|
$
|
325.4
|
|
|
The determination of the fair value of certain assets in the table above, including customer intangible assets and working capital assets, has not been finalized. We expect to complete the valuation of these assets and to finalize the purchase price allocation for Impakt in the first half of 2019.
We expect annual amortization of intangible assets to increase by approximately
$15
as a result of the Impakt acquisition. The goodwill arising from this acquisition is attributable to our ATS segment and is not tax deductible.
Pro forma disclosure:
Consolidated revenue and net earnings for fiscal year 2018 would not have been materially different had either (or both of) the Atrenne and Impakt acquisitions occurred at the beginning of 2018.
We engaged third-party consultants to provide valuations of certain inventory, property, plant and equipment and intangible assets in connection with our purchases of Atrenne and Impakt. The fair value of the acquired tangible assets was measured based on their value in-use, by applying the market (sales comparison, brokers' quotes), cost or replacement cost, or the income (discounted cash flow) approach, as deemed appropriate. The valuation of the intangible assets by the third-party consultants was primarily based on the income approach using a discounted cash flow model and forecasts based on management's subjective estimates and assumptions. Various Level 2 and 3 data inputs of the fair value measurement hierarchy (see note 21 for definitions) were used in the valuation of the above-mentioned assets.
|
4
.
|
SOLAR PANEL MANUFACTURING BUSINESS:
|
During the fourth quarter of 2016, due to anticipated prolonged volatility in the solar panel market, we made the decision to exit the solar panel manufacturing business, and terminated (prior to its scheduled expiration) a supply agreement pursuant to which we had made specific cash advances during 2015 to an Asia-based solar cell supplier (Solar Supplier). All such cash advances were repaid in full during 2017 (cash advances outstanding at December 31, 2016 —
$12.5
). Under this supply agreement, we also manufactured and sold completed solar panels to the Solar Supplier as a customer (discussed below).
In connection with our exit from this business, we wrote down the carrying values of our inventories and our solar panel manufacturing equipment during 2016 to then-recoverable amounts (see notes
6
and
16
(a)
, respectively), and completed production of the final solar panels in the first quarter of 2017. During 2017, we recorded: (i) additional provisions of
$0.9
in
F-
25
CELESTICA INC.
NOTES TO THE CONSOLIDATED FINANCIAL STATEMENTS
(in millions of U.S. dollars, except percentages and per share amounts)
cost of sales, to further write down the carrying value of our remaining solar panel inventory to reflect lower prices obtained in then-current purchase orders, (ii) a provision of
$0.5
in SG&A, to write down the carrying value of solar accounts receivable, primarily as a result of a solar customer's bankruptcy, and (iii) net impairment charges of
$3.8
in other charges (through restructuring) to further write down the carrying value of our solar panel manufacturing equipment to its estimated fair value less costs of disposal, based on executed sales agreements (see note
16
(a)). During the third quarter of 2017, we shipped all of our remaining solar panel inventory to customers, including to the Solar Supplier. As of
December 31, 2017
, we had
$6.7
of outstanding solar accounts receivable, all from the Solar Supplier, which were repaid in full during 2018. During the second quarter of 2018, we completed the sale of our remaining solar equipment. In anticipation of such disposition, we paid
$11.3
(including fees and accrued interest) to terminate and settle our outstanding lease obligations for this equipment in January 2018. See notes
8
and
12
.
|
5
.
|
ACCOUNTS RECEIVABLE:
|
Accounts receivable sales and financing programs:
We have an agreement to sell up to
$250.0
in accounts receivable on an uncommitted basis (subject to pre-determined limits by customer) to two third-party banks. Based on a review of our requirements, we amended this agreement in November 2018 to increase its overall capacity from
$200.0
to
$250.0
. The term of this agreement has been annually extended in recent years (including in November 2018) for additional
one
-year periods (and is currently extendable to
November 2020
under specified circumstances), but may be terminated earlier as provided in the agreement. At
December 31, 2018
,
$130.0
of accounts receivable were sold under this program (
December 31, 2017
—
$80.0
). We continue to collect cash from our customers and remit the cash to the banks once it is collected.
We also participate in a customer's supplier financing program (SFP), pursuant to which we sell accounts receivable from such customer to a third-party bank on an uncommitted basis. At
December 31, 2018
, we sold
$50.0
of accounts receivable under the SFP (
December 31, 2017
—
$52.3
), in order to receive earlier payment. We utilize the SFP to substantially offset the effect of extended payment terms required by such customer on our working capital for the period. The third-party bank collects the relevant receivables directly from the customer.
The accounts receivable sold under both of these programs are de-recognized from our accounts receivable balance and removed from our consolidated balance sheet, and the proceeds are reflected as cash provided by operating activities in our consolidated statement of cash flows. Upon sale, we assign the rights to the accounts receivable to the banks. We pay discount charges which we record as finance costs in our consolidated statement of operations.
Contract assets:
At
December 31, 2018
, our accounts receivable balance included
$267.8
of contract assets (
December 31, 2017
—
$258.9
) recognized as revenue under IFRS 15. See note 2(y).
|
6
.
|
INVENTORIES:
|
Inventories are comprised of the following:
|
December 31
|
|||||||
|
2017
|
2018
|
||||||
|
(restated)
|
|||||||
|
Raw materials
|
$
|
733.2
|
|
$
|
948.8
|
|
|
|
Work in progress
|
57.6
|
|
101.5
|
|
|||
|
Finished goods
|
33.2
|
|
39.6
|
|
|||
|
$
|
824.0
|
|
$
|
1,089.9
|
|
||
We record our inventory provisions, net of valuation recoveries, in cost of sales. We record inventory provisions to reflect write-downs in the value of our inventory to net realizable value, and valuation recoveries primarily to reflect realized gains on the disposition of inventory previously written-down to net realizable value. During
2018
, we recorded net inventory provisions of
$13.5
(
2017
—
$3.3
;
2016
—
$12.0
). We regularly review our estimates and assumptions used to value our inventory
F-
26
CELESTICA INC.
NOTES TO THE CONSOLIDATED FINANCIAL STATEMENTS
(in millions of U.S. dollars, except percentages and per share amounts)
through analysis of historical performance. The increase in our inventory provisions for
2018
as compared to 2017 was a result of increases in our overall aged inventory levels, more than half of which related to customers in our ATS segment. Our inventory provisions for 2017 included provisions of
$0.9
that we recorded in the second quarter of
2017
to further write down the carrying amount of our remaining solar panel inventory (in our ATS segment) to recoverable amounts. Our inventory provisions for 2016 consisted primarily of the write down of our solar panel inventory to then-lower net realizable values. See note
4
.
7
. ASSETS CLASSIFIED AS HELD FOR SALE:
As a result of previously announced restructuring actions, we have reclassified certain assets as held for sale. These assets were reclassified at the lower of their carrying value and estimated fair value less costs of disposal at the time of such reclassification. At
December 31, 2018
, we had
$27.4
(
December 31, 2017
—
$30.1
) of assets classified as held for sale, which consisted primarily of land and buildings in Europe and North America.
See note 8 for a discussion of the sale of our Toronto real property.
|
8
.
|
PROPERTY, PLANT AND EQUIPMENT:
|
Property, plant and equipment are comprised of the following:
|
2017
|
|||||||||||
|
Cost
|
Accumulated
Depreciation and Impairment |
Net Book
Value |
|||||||||
|
Land
|
$
|
23.1
|
|
$
|
12.0
|
|
$
|
11.1
|
|
||
|
Buildings including improvements
|
344.0
|
|
202.4
|
|
141.6
|
|
|||||
|
Machinery and equipment
|
745.5
|
|
574.3
|
|
171.2
|
|
|||||
|
$
|
1,112.6
|
|
$
|
788.7
|
|
$
|
323.9
|
|
|||
|
2018
|
|||||||||||
|
Cost
|
Accumulated
Depreciation and Impairment |
Net Book
Value |
|||||||||
|
Land
|
$
|
26.8
|
|
$
|
12.0
|
|
$
|
14.8
|
|
||
|
Buildings including improvements
|
375.5
|
|
218.0
|
|
157.5
|
|
|||||
|
Machinery and equipment
|
781.2
|
|
588.2
|
|
193.0
|
|
|||||
|
$
|
1,183.5
|
|
$
|
818.2
|
|
$
|
365.3
|
|
|||
F-
27
CELESTICA INC.
NOTES TO THE CONSOLIDATED FINANCIAL STATEMENTS
(in millions of U.S. dollars, except percentages and per share amounts)
The following table details the changes to the net book value of property, plant and equipment for the years indicated:
|
Land
|
Buildings
including Improvements |
Machinery
and Equipment |
Total
|
||||||||||||
|
Balance — January 1, 2017
|
$
|
10.9
|
|
$
|
140.1
|
|
$
|
151.7
|
|
$
|
302.7
|
|
|||
|
Additions
|
—
|
|
22.8
|
|
72.1
|
|
94.9
|
|
|||||||
|
Depreciation
|
—
|
|
(21.3
|
)
|
(46.3
|
)
|
(67.6
|
)
|
|||||||
|
Write down of assets and other disposals
(i)
|
—
|
|
(0.2
|
)
|
(5.3
|
)
|
(5.5
|
)
|
|||||||
|
Foreign exchange and other
|
0.2
|
|
0.2
|
|
(1.0
|
)
|
(0.6
|
)
|
|||||||
|
Balance — December 31, 2017
(ii)
|
11.1
|
|
141.6
|
|
171.2
|
|
323.9
|
|
|||||||
|
Additions
|
—
|
|
25.4
|
|
62.3
|
|
87.7
|
|
|||||||
|
Acquisitions through business combinations (note 3)
|
3.6
|
|
10.8
|
|
13.9
|
|
28.3
|
|
|||||||
|
Depreciation
|
—
|
|
(20.4
|
)
|
(53.3
|
)
|
(73.7
|
)
|
|||||||
|
Write down of assets and other disposals
|
—
|
|
—
|
|
(0.9
|
)
|
(0.9
|
)
|
|||||||
|
Foreign exchange and other
|
0.1
|
|
0.1
|
|
(0.2
|
)
|
—
|
|
|||||||
|
Balance — December 31, 2018
(ii)
|
$
|
14.8
|
|
$
|
157.5
|
|
$
|
193.0
|
|
$
|
365.3
|
|
|||
|
(i)
|
Includes
$4.8
of solar panel manufacturing equipment that we reclassified as assets held for sale during 2017. In
2017
, we recorded net impairment losses of
$3.8
primarily to write-down solar panel manufacturing equipment. See note
16
(a)
.
|
|
(ii)
|
The net book value of property, plant and equipment at
December 31, 2018
included
$12.8
(
December 31, 2017
—
$7.3) of assets under finance leases. See note
24
for the future minimum lease payments under these finance leases.
|
We review the carrying amount of property, plant and equipment for impairment whenever events or changes in circumstances (triggering events) indicate that the carrying amount of such assets (or the related CGU or CGUs) may not be recoverable. If any such indication exists, we test the carrying amount of such assets or CGUs for impairment.We did not identify any triggering event during the course of 2018 indicating that the carrying amount of such assets or GCUs may not be recoverable. With respect to 2016 and 2017, we determined that, other than the write-down of our solar panel manufacturing equipment (in our ATS segment) in each year, discussed in notes
4
and
16
(a)
(recorded through restructuring charges), there was
no
impairment of our property, plant and equipment, as the recoverable amount of such assets and CGUs exceeded their respective carrying values. See footnote (i) to the table above and notes 9 and
16
(a)
.
Toronto Real Property and Related Transactions:
On July 23, 2015, we entered into an agreement of purchase and sale (Property Sale Agreement) to sell our real property located in Toronto, Ontario, which includes the site of our corporate headquarters and our Toronto manufacturing operations, to a special purpose entity (the Property Purchaser) formed by a consortium of four real estate partnerships (see below). If the transaction is completed, the purchase price for the property will be approximately
$137 million
Canadian dollars (approximately
$100
at year-end exchange rates), exclusive of applicable taxes and subject to specified adjustments, including for certain density bonuses and other items in accordance with usual commercial practice.
Upon execution of the Property Sale Agreement, we were paid a cash deposit of
$15 million
Canadian dollars (
$11.2
at the then-prevailing exchange rate). Prior to the assignment of the Property Sale Agreement described below, the Property Purchaser was to pay us an additional
$53.5 million
Canadian dollars in cash (approximately
$39
at year-end exchange rates) at closing, with the balance to be satisfied at closing by an interest-free, first-ranking mortgage in the amount of
$68.5 million
Canadian dollars (approximately
$50
at year-end exchange rates) to be registered on title to the property and having a term of
two
years from the closing date. As part of the Property Sale Agreement, we agreed, upon closing, to enter into a long-term lease for our new corporate headquarters on commercially reasonable arm’s-length terms.
In September 2018, the Property Sale Agreement was assigned from the Property Purchaser to a new purchaser (Assignee), although the Property Purchaser was not released from its obligations under the Property Sale Agreement
. In connection with the assignment, the Property Sale Agreement was amended to provide for the remaining proceeds of $122 million Canadian dollars (approximately $89 at year-end exchange rates) to be paid in one lump sum cash payment upon closing
F-
28
CELESTICA INC.
NOTES TO THE CONSOLIDATED FINANCIAL STATEMENTS
(in millions of U.S. dollars, except percentages and per share amounts)
of the transaction
. Other terms of the agreement remained unchanged. On January 21, 2019, the required municipal zoning approval was obtained. On March 7, 2019, we completed the sale of the real property and received total proceeds of approximately
$110
, including a high density bonus and an early vacancy incentive related to the temporary relocation of our corporate headquarters. The gain on sale of this property will be recorded as recoveries through other charges (recoveries) during 2019. No net tax impact is anticipated from this sale as the gain will be offset by the utilization of currently unrecognized tax losses.
Approximately
27%
of the interests in the Property Purchaser were at the time of execution of the Property Sale Agreement, and are, held by a privately-held partnership in which Mr. Gerald Schwartz (a controlling shareholder of Celestica) has a material interest, and approximately
25%
of the interests in the Property Purchaser were at the time of execution of the Property Sale Agreement, and are, held by a partnership in which Mr. Schwartz has a non-voting interest. At the time of execution of the assignment, the Assignee was unrelated to us and the Property Purchaser. Subsequent to such execution, the Assignee granted the Property Purchaser an option to obtain a
5%
non-voting interest in the Assignee.
In connection with the anticipated sale, we entered into a long-term lease in November 2017 (in the Greater Toronto area) for the relocation of our Toronto manufacturing operations, and commenced occupancy in March 2018. We completed this relocation in February 2019. We are also in the process of relocating our corporate headquarters to a temporary location while space in a new office building (to be built by the Assignee on the site of our former location) is under construction. In connection therewith, in September 2018, we entered into a
3
-year lease for such temporary offices, and such relocation is currently expected to be completed by the end of the first half of 2019. We have incurred, and will continue to incur, significant costs throughout the transition period (which commenced in the fourth quarter of 2017) to relocate our corporate headquarters and to transfer our Toronto manufacturing operations to its new location. These costs consist of building improvements and equipment in connection with our new manufacturing site (totaling
$17
of which approximately
$15
was incurred during 2018), which we have capitalized, as well as transition-related costs which we record in other charges. We also anticipate capitalizing building improvements (2018 — nil) in connection with our temporary corporate headquarters. Transition costs are comprised of direct relocation costs, duplicate costs (such as rent expense, utility costs, depreciation charges, and personnel costs) incurred during the transition period, as well as cease-use costs incurred in connection with idle or vacated portions of the relevant premises that we would not have incurred but for these relocations. During
2018
, we recorded
$13.2
(
2017
—
$1.6
) of such transition costs, consisting primarily of utility costs related to idle premises, depreciation charges and personnel costs incurred in the operation of duplicate production lines in advance of the transition, duplicate rent expense, and relocation costs. See note 16.
F-
29
CELESTICA INC.
NOTES TO THE CONSOLIDATED FINANCIAL STATEMENTS
(in millions of U.S. dollars, except percentages and per share amounts)
|
9
.
|
GOODWILL AND INTANGIBLE ASSETS:
|
Goodwill and intangible assets are comprised of the following:
|
2017
|
|||||||||||
|
Cost
|
Accumulated
Amortization and Impairment |
Net Book
Value |
|||||||||
|
Goodwill
|
$
|
78.6
|
|
$
|
55.4
|
|
$
|
23.2
|
|
||
|
Intellectual property
|
$
|
111.3
|
|
$
|
111.3
|
|
$
|
—
|
|
||
|
Other intangible assets
|
237.0
|
|
226.6
|
|
10.4
|
|
|||||
|
Computer software assets
|
285.3
|
|
274.1
|
|
11.2
|
|
|||||
|
$
|
633.6
|
|
$
|
612.0
|
|
$
|
21.6
|
|
|||
|
2018
|
|||||||||||
|
Cost
|
Accumulated
Amortization and Impairment |
Net Book
Value |
|||||||||
|
Goodwill
|
$
|
253.8
|
|
$
|
55.4
|
|
$
|
198.4
|
|
||
|
Intellectual property
|
$
|
111.3
|
|
$
|
111.3
|
|
$
|
—
|
|
||
|
Other intangible assets
|
508.0
|
|
238.2
|
|
269.8
|
|
|||||
|
Computer software assets
|
290.1
|
|
276.3
|
|
13.8
|
|
|||||
|
$
|
909.4
|
|
$
|
625.8
|
|
$
|
283.6
|
|
|||
The following table details the changes to the net book value of goodwill and intangible assets for the years indicated:
|
Goodwill
|
Other
Intangible Assets |
Computer
Software Assets |
Total
|
||||||||||||
|
Balance — January 1, 2017
|
$
|
23.2
|
|
$
|
15.9
|
|
$
|
9.6
|
|
$
|
48.7
|
|
|||
|
Additions
|
—
|
|
—
|
|
4.9
|
|
4.9
|
|
|||||||
|
Amortization
|
—
|
|
(5.5
|
)
|
(3.4
|
)
|
(8.9
|
)
|
|||||||
|
Foreign exchange and other
|
—
|
|
—
|
|
0.1
|
|
0.1
|
|
|||||||
|
Balance — December 31, 2017
|
23.2
|
|
10.4
|
|
11.2
|
|
44.8
|
|
|||||||
|
Additions
|
—
|
|
—
|
|
3.3
|
|
3.3
|
|
|||||||
|
Acquisitions through business combinations (note 3)
|
175.2
|
|
271.0
|
|
3.0
|
|
449.2
|
|
|||||||
|
Amortization
|
—
|
|
(11.6
|
)
|
(3.8
|
)
|
(15.4
|
)
|
|||||||
|
Foreign exchange and other
|
—
|
|
—
|
|
0.1
|
|
0.1
|
|
|||||||
|
Balance — December 31, 2018
|
$
|
198.4
|
|
$
|
269.8
|
|
$
|
13.8
|
|
$
|
482.0
|
|
|||
We review the carrying amount of goodwill and intangible assets for impairment whenever events or changes in circumstances (triggering events) indicate that the carrying amount of such assets (or the related CGU or CGUs) may not be recoverable. If any such indication exists, we test the carrying amount of such assets or CGUs for impairment. In addition to an assessment of triggering events during the year, we conduct an annual goodwill impairment assessment (Annual Impairment Assessment) of CGUs with goodwill in the fourth quarter of the year. We recorded
no
impairment charges against goodwill or intangible assets in
2018
, or as a result of our 2018 Annual Impairment Assessment, as the recoverable amount of such assets and CGUs exceeded their respective carrying values as of
December 31, 2018
. We also recorded
no
impairment charges against goodwill or intangible assets in
2017
or
2016
. See note 8 for a discussion of write-downs of our solar panel manufacturing equipment (in our ATS segment) in each of 2017 and 2016 (recorded through restructuring charges).
F-
30
CELESTICA INC.
NOTES TO THE CONSOLIDATED FINANCIAL STATEMENTS
(in millions of U.S. dollars, except percentages and per share amounts)
For our Annual Impairment Assessments, we used cash flow projections based primarily on our plan for the following year and, to a lesser extent, on our three-year strategic plan and other financial projections. Our plans, which are primarily based on financial projections submitted by our subsidiaries along with input from our customer teams, are reviewed by various levels of management as part of our annual planning cycle. The plan for
2019
(used for our
2018
Annual Impairment Assessment) was approved by management and presented to our Board of Directors in December
2018
.
The process of determining the recoverable amount of a CGU is subjective and requires management to exercise significant judgment in estimating future growth, profitability, and discount and terminal growth rates, among other factors. The assumptions used in our 2018 Annual Impairment Assessment were determined based on past experiences adjusted for expected changes in future conditions. Where applicable, we also engaged independent brokers to obtain market prices to estimate our real property and other asset values. For our
2018
Annual Impairment Assessment, we used cash flow projections over periods ranging from
4
to
5
years, and applied a perpetuity growth rate of
2%
thereafter (consistent with long-term inflation guidance).
Our goodwill balance at
December 31, 2018
was
$198.4
(
December 31, 2017
—
$23.2
;
December 31, 2016
—
$23.2
). Our capital equipment CGU consists of
$111.2
of goodwill attributable to our acquisition of Impakt in November 2018 and
$19.5
attributable to prior acquisitions. Our A&D CGU consists of goodwill of
$3.7
attributable to our November 2016 Karel acquisition. Our Atrenne CGU consists of goodwill of
$64.0
attributable to our April 2018 Atrenne acquisition. See note
3
for further details.
We used the following assumptions for purposes of our Annual Impairment Assessments of goodwill for the periods shown:
|
Assumption
|
Capital equipment CGU
|
A&D CGU
|
Atrenne CGU
|
|||
|
Annual revenue growth rate
(1)
|
2018 — 4% over 5 year period;
2017 — 9% over 6 year period;
2016 — 7% over 7 year period
|
2018 — modest growth over 5 year period;
2017 — modest growth over 4 year period;
2016 — N/A
|
2018 — 12% over 4 year period;
2017 and 2016 — N/A
|
|||
|
Average annual margins
|
2018 — above company margins;
2017 and 2016 — slightly above company margins
|
2018 — slightly above company margins;
2017 — used company margins;
2016 — N/A
|
2018 — above company margins;
2017 and 2016 — N/A
|
|||
|
Discount rate
|
2018 —13%;
2017 and 2016 —17%
|
2018 — 11%;
2017 — 9%; 2016 — N/A
|
2018 — 13%;
2017 and 2016 — N/A
|
|||
(1) Supported by new business awarded in recent years, and the expectation of future new business awards.
In our
2018
Annual Impairment Assessment, we did not identify any key assumptions where a reasonable possible change would result in material impairments to the goodwill of any of the above mentioned CGUs. Future events and market conditions may impact our assumptions as to prices, costs or other factors that may result in changes to our estimates of future cash flows. Failure to realize the assumed revenues at an appropriate profit margin of a CGU could result in impairment losses in such CGU in future periods.
|
10
.
|
OTHER NON-CURRENT ASSETS:
|
|
December 31
|
|||||||
|
2017
|
2018
|
||||||
|
Net pension assets (note 19)
|
$
|
62.9
|
|
$
|
4.5
|
|
|
|
Land rights
|
10.5
|
|
10.1
|
|
|||
|
Deferred investment costs
|
3.2
|
|
2.9
|
|
|||
|
Deferred financing costs
|
0.7
|
|
2.1
|
|
|||
|
Other
|
4.0
|
|
10.6
|
|
|||
|
$
|
81.3
|
|
$
|
30.2
|
|
||
F-
31
CELESTICA INC.
NOTES TO THE CONSOLIDATED FINANCIAL STATEMENTS
(in millions of U.S. dollars, except percentages and per share amounts)
|
11
.
|
PROVISIONS:
|
Our provisions include restructuring, warranty, legal and other provisions. We have included a description of our restructuring, warranty and legal provisions in note
2
(m)
. We include details of our restructuring provision in note
16
(a)
. The following chart details the changes in our provisions for the year indicated:
|
Restructuring
|
Warranty
|
Legal
(i)
|
Other
(ii)
|
Total
|
|||||||||||||||
|
Balance — December 31, 2017
|
$
|
12.7
|
|
$
|
21.4
|
|
$
|
2.5
|
|
$
|
6.8
|
|
$
|
43.4
|
|
||||
|
Provisions
|
35.3
|
|
10.8
|
|
—
|
|
0.7
|
|
46.8
|
|
|||||||||
|
Reversal of prior year provisions
(iii)
|
(0.1
|
)
|
(6.2
|
)
|
(0.6
|
)
|
—
|
|
(6.9
|
)
|
|||||||||
|
Payments/usage
|
(37.6
|
)
|
(7.1
|
)
|
(0.7
|
)
|
—
|
|
(45.4
|
)
|
|||||||||
|
Accretion, foreign exchange and other
|
—
|
|
(0.2
|
)
|
(0.1
|
)
|
—
|
|
(0.3
|
)
|
|||||||||
|
Balance — December 31, 2018
|
$
|
10.3
|
|
$
|
18.7
|
|
$
|
1.1
|
|
$
|
7.5
|
|
$
|
37.6
|
|
||||
|
Current
|
$
|
10.3
|
|
$
|
11.0
|
|
$
|
1.1
|
|
$
|
0.8
|
|
$
|
23.2
|
|
||||
|
Non-current
(iv)
|
—
|
|
7.7
|
|
—
|
|
6.7
|
|
14.4
|
|
|||||||||
|
December 31, 2018
|
$
|
10.3
|
|
$
|
18.7
|
|
$
|
1.1
|
|
$
|
7.5
|
|
$
|
37.6
|
|
||||
|
(i)
|
Legal represents our aggregate provisions recorded for various legal actions based on our estimates of the likely outcomes.
|
|
(ii)
|
Other represents our asset retirement obligations relating to sites that we currently lease.
|
|
(iii)
|
During
2018
, we reversed prior year warranty provisions as a result of expired warranties and changes in estimated costs based on historical experience.
|
|
(iv)
|
Non-current balances are included in provisions and other non-current liabilities on our consolidated balance sheet.
|
At the end of each reporting period, we evaluate the appropriateness of our provisions, and adjustments may be made to reflect actual experience or changes in our estimates.
|
12
.
|
|
In June 2018, we entered into an $800.0 credit agreement with Bank of America, N.A., as Administrative Agent, and the other lenders party thereto (New Credit Facility), which provides for a $350.0 term loan (June Term Loan) that matures in June 2025, and a $450.0 revolving credit facility (New Revolver) that matures in June 2023. The net proceeds from the June Term Loan were used primarily to repay all amounts outstanding under our previous credit facility (Prior Facility), which was terminated on such repayment. In November 2018, we utilized the accordion feature under our New Credit Facility to add an incremental term loan of $250.0 (November Term Loan), maturing in June 2025. The June Term Loan and the November Term Loan are collectively referred to as the New Term Loans. The Prior Facility consisted of a $250.0 term loan (Prior Term Loan) and a $300.0 revolving credit facility (Prior Revolver), both of which were scheduled to mature in May 2020.
The New Credit Facility is described below. The Prior Facility is described in note 12 to our 2017 audited consolidated financial statements.
As of December 31, 2018, an aggregate of $598.3 was outstanding under the New Term Loans, and other than ordinary course letters of credit (described below), $159.0 was outstanding under the New Revolver.
During the second quarter of 2018, we borrowed a total of
$163.0
under the Prior Revolver, used primarily to fund the Atrenne acquisition in April 2018 (see note 3). The net proceeds of the June Term Loan were used primarily to repay the outstanding amounts under the Prior Revolver (
$163.0
) and the Prior Term Loan (
$175.0
), as well as costs related to the arrangement of the New Credit Facility. During the third quarter of 2018, we borrowed
$55.0
under the New Revolver for working capital purposes. During the fourth quarter of 2018, we borrowed
$339.5
under the New Revolver to fund the Impakt acquisition in November 2018 (see note 3). The net proceeds of the November Term Loan were used to repay
$245.0
of the outstanding amounts under the New Revolver, as well as costs related to the arrangement of the November Term Loan. We made sc
F-
32
CELESTICA INC.
NOTES TO THE CONSOLIDATED FINANCIAL STATEMENTS
(in millions of U.S. dollars, except percentages and per share amounts)
heduled quarterly principal repayments of
$0.875
during the last two quarters of 2018 under the June Term Loan. We made scheduled quarterly principal repayments of
$6.25
during each quarter of 2017 and during the first two quarters of 2018 under the Prior Term Loan.
The June Term Loan requires quarterly principal repayments of
$0.875
, commencing September 30, 2018, and the November Term Loan requires quarterly principal repayments of
$0.625
, commencing March 31, 2019, and in each case a lump sum repayment of the remainder outstanding at maturity. Commencing in 2020, we are also required to make an annual prepayment of outstanding obligations under the New Credit Facility (applied first to the New Term Loans, then to the New Revolver, in the manner set forth in the New Credit Facility) ranging from
0%
—
50%
(based on a defined leverage ratio) of specified excess cash flow (as defined in the New Credit Facility) for the prior fiscal year. Proceeds from the sale of our Toronto real property (note 8) will be taken into account in the determination of excess cash flow. In addition, prepayments of outstanding obligations under the New Credit Facility (applied as described above) may also be required in the amount of specified net cash proceeds received above a specified annual threshold (including proceeds from the disposal of certain assets, but excluding the net proceeds from the sale of our Toronto real estate). Except under specified circumstances, and subject to the payment of breakage costs (if any), we are generally permitted to make voluntary prepayments of outstanding amounts under the New Revolver and the New Term Loans without any other premium or penalty. Repaid amounts on the term loans may not be re-borrowed.
The New Credit Facility has an accordion feature that allows us to increase the term loans and/or revolving loan commitments thereunder by approximately
$110
, plus an unlimited amount to the extent that a specified leverage ratio on a pro forma basis does not exceed specified limits, in each case on an uncommitted basis and subject to the satisfaction of certain terms and conditions. The New Revolver also includes a
$50.0
sub-limit for swing line loans, providing for short-term borrowings up to a maximum of
ten
business days, as well as a
$150.0
sub-limit for letters of credit, in each case subject to the overall New Revolver credit limit. The New Revolver permits us and certain designated subsidiaries to borrow funds (subject to specified conditions) for general corporate purposes, including for capital expenditures, certain acquisitions, and working capital needs. Borrowings under the New Revolver bear interest at LIBOR, Canadian Prime or Base Rate (each as defined in the New Credit Facility) plus a specified margin, or in the case of any bankers' acceptance, at the B/A Discount Rate (as defined in the New Credit Facility). The margin for borrowings under the New Revolver ranges from
0.75%
to
2.5%
, and commitment fees range between
0.35%
and
0.50%
, in each case depending on the rate we select and our consolidated leverage ratio. As a result of our use of the accordion feature of the New Credit Facility in November 2018, interest on the June Term Loan increased from LIBOR plus
2.0%
to LIBOR plus
2.125%
. The November Term Loan currently bears interest at LIBOR plus
2.5%
.
We are required to comply with certain restrictive covenants under the New Credit Facility, including those relating to the incurrence of certain indebtedness, the existence of certain liens, the sale of certain assets (excluding real property then held for sale), specified investments and payments, sale and leaseback transactions, and certain financial covenants relating to a defined interest coverage ratio and leverage ratio that are tested on a quarterly basis. At
December 31, 2018
, we were in compliance with all restrictive and financial covenants under the New Credit Facility. The obligations under the New Credit Facility are guaranteed by us and certain specified subsidiaries. Subject to specified exemptions and limitations, all assets of the guarantors are pledged as security for the obligations under the New Credit Facility. The New Credit Facility contains customary events of default. If an event of default occurs and is continuing, the administrative agent may declare all amounts outstanding under the New Credit Facility to be immediately due and payable and may cancel the lenders’ commitments to make further advances thereunder. In the event of a payment or other specified defaults, outstanding obligations accrue interest at a specified default rate.
F-
33
CELESTICA INC.
NOTES TO THE CONSOLIDATED FINANCIAL STATEMENTS
(in millions of U.S. dollars, except percentages and per share amounts)
The following table sets forth our borrowings under our credit facilities, and our finance lease obligations, as of
December 31, 2018
and
2017
:
|
December 31
2017 |
December 31
2018 |
|||||
|
Borrowings under the Prior Revolver/New Revolver
(1)
|
$
|
—
|
|
$
|
159.0
|
|
|
Borrowings under the Prior Term Loan/New Term Loans
|
187.5
|
|
598.3
|
|
||
|
Total borrowings under applicable credit facility
|
187.5
|
|
757.3
|
|
||
|
Less: unamortized debt issuance costs
(2)
|
(0.8
|
)
|
(9.8
|
)
|
||
|
Finance lease obligations (see notes 4 and 24)
(3)
|
17.7
|
|
10.4
|
|
||
|
$
|
204.4
|
|
$
|
757.9
|
|
|
|
Comprised of:
|
||||||
|
Current portion of borrowings under applicable credit facility and finance lease obligations
(3)
|
$
|
37.9
|
|
$
|
107.7
|
|
|
Long-term portion of borrowings under applicable credit facility and finance lease obligations
|
166.5
|
|
650.2
|
|
||
|
$
|
204.4
|
|
$
|
757.9
|
|
|
|
(1)
|
Debt issuance costs were incurred in connection with our Prior Revolver in 2014 (
$1.7
) and the New Revolver in 2018 (
$3.1
), which we deferred as other assets on our consolidated balance sheets and amortize over the term of the relevant revolver. See note 10 for the long-term portion of the deferred financing costs. We accelerated the amortization of
$0.6
, representing the remaining portion of the unamortized deferred financing costs related to the Prior Revolver, upon termination of the Prior Facility, and recorded it to other charges in June 2018.
|
|
(2)
|
Debt issuance costs were incurred in connection with our Prior Term Loan in 2015 (
$2.1
), the June Term Loan (
$4.9
), and the November Term Loan (
$5.4
), which we deferred as long-term debt on our consolidated balance sheets and amortize over the term of the relevant term loan using the effective interest rate method. We accelerated the amortization of
$0.6
, representing the remaining portion of the unamortized deferred financing costs related to the Prior Term Loan, upon termination of the Prior Facility, and recorded it to other charges in June 2018.
|
|
(3)
|
At
December 31, 2017
,
$11.1
of our finance lease obligations related to our solar panel manufacturing equipment (recorded as current liabilities on our consolidated balance sheet as at
December 31, 2017
). In connection with the anticipated disposition of such equipment, we terminated and settled these lease obligations in full in January 2018 for
$11.3
(including
$0.2
of fees and accrued interest). See note
4
.
|
The New Term Loans require aggregate quarterly principal repayments of
$1.5
, and a lump sum repayment of the remainder outstanding at maturity. At
December 31, 2018
, the aggregate remaining mandatory principal repayments of the New Term Loans were as follows:
|
Years ending December 31
|
Amount
|
||
|
2019
|
$
|
6.0
|
|
|
2020
|
6.0
|
|
|
|
2021
|
6.0
|
|
|
|
2022
|
6.0
|
|
|
|
2023
|
6.0
|
|
|
|
2024
|
6.0
|
|
|
|
2025 (to maturity in June 2025)
|
562.3
|
|
|
|
$
|
598.3
|
|
|
We entered into
5
-year interest rate swap agreements with a syndicate of third-party banks in August and December 2018 to partially hedge against our exposures to the interest rate variability on our New Term Loans. The derivative instruments swap the variable rate of interest for a fixed rate of interest on
$175.0
of the amounts outstanding under each of our June Term Loan and our November Term Loan, for an aggregate hedged amount of
$350.0
. See note 21.
F-
34
CELESTICA INC.
NOTES TO THE CONSOLIDATED FINANCIAL STATEMENTS
(in millions of U.S. dollars, except percentages and per share amounts)
Commitment fees paid under our relevant credit facilities in
2018
were
$1.3
(
2017
—
$1.3
;
2016
—
$1.4
). At
December 31, 2018
, we had
$21.3
outstanding in letters of credit under the New Revolver (
December 31, 2017
—
$23.2
outstanding in letters of credit under the Prior Revolver). We also arrange letters of credit and surety bonds outside of our revolving facility. At
December 31, 2018
, we had
$14.4
(
December 31, 2017
—
$13.6
) of such letters of credit and surety bonds outstanding.
At December 31, 2018, we also had a total of
$132.8
(
December 31, 2017
—
$73.5
) in uncommitted bank overdraft facilities available for intraday and overnight operating requirements under our applicable credit facility. There were
no
amounts outstanding under these overdraft facilities at
December 31, 2018
or
December 31, 2017
.
The amounts we borrow and repay under our facilities can vary significantly from month-to-month depending upon our working capital and other cash requirements.
13
. CAPITAL STOCK:
We are authorized to issue an unlimited number of subordinate voting shares, which entitle the holder to
one
vote per share, and an unlimited number of multiple voting shares, which entitle the holder to
25
votes per share. The subordinate voting shares and multiple voting shares vote together as a single class on all matters submitted to a vote of shareholders, including the election of directors, except as otherwise required by law. The holders of the subordinate voting shares and multiple voting shares are entitled to share ratably, as a single class, in any dividends declared subject to any preferential rights of any outstanding preferred shares in respect of the payment of dividends. Each multiple voting share is convertible at any time at the option of the holder thereof and automatically, under certain circumstances, into one subordinate voting share. We are also authorized to issue an unlimited number of preferred shares, issuable in series.
No
preferred shares have been issued to date.
(a) Capital transactions:
|
Number of shares (in millions)
|
Subordinate Voting Shares
|
Multiple Voting Shares
|
|||
|
Issued and outstanding at December 31, 2015
|
124.5
|
|
18.9
|
|
|
|
Issued from treasury
(i)
|
0.6
|
|
—
|
|
|
|
Cancelled under NCIB
(ii)
|
(3.2
|
)
|
—
|
|
|
|
Issued and outstanding at December 31, 2016
|
121.9
|
|
18.9
|
|
|
|
Issued from treasury
(i)
|
2.8
|
|
—
|
|
|
|
Cancelled under NCIB
(ii)
|
(1.9
|
)
|
—
|
|
|
|
Other
(iii)
|
0.35
|
|
(0.35
|
)
|
|
|
Issued and outstanding at December 31, 2017
|
123.2
|
|
18.6
|
|
|
|
Issued from treasury
(i)
|
1.3
|
|
—
|
|
|
|
Cancelled under NCIB
(ii)
|
(6.8
|
)
|
—
|
|
|
|
Issued and outstanding at December 31, 2018
|
117.7
|
|
18.6
|
|
|
|
(i)
|
During
2018
, we issued
0.1 million
(
2017
—
1.7 million
;
2016
—
0.6 million
) subordinate voting shares from treasury upon the exercise of stock options for aggregate cash proceeds of
$0.4
(
2017
—
$13.6
;
2016
—
$4.1
). We also issued
1.2 million
(
2017
—
1.1 million
;
2016
—
nil
) subordinate voting shares from treasury with ascribed values of
$14.3
(
2017
—
$9.8
;
2016
—
nil
) upon the vesting of certain RSUs and PSUs. We also settled RSUs and PSUs with subordinate voting shares purchased in the open market. Settlement of these awards is described below.
|
|
(ii)
|
NCIB stands for normal course issuer bid.
|
|
(iii)
|
During 2017, Onex Corporation converted
346,175
of our multiple voting shares into subordinate voting shares. Onex Corporation did not convert any multiple voting shares in 2016 or 2018.
|
We have repurchased subordinate voting shares in the open market and otherwise for cancellation in recent years pursuant to normal course issuer bids (NCIBs) and substantial issuer bids (SIBs), which allow us to repurchase a limited number of subordinate voting shares during a specified period. The maximum number of subordinate voting shares we are permitted to
F-
35
CELESTICA INC.
NOTES TO THE CONSOLIDATED FINANCIAL STATEMENTS
(in millions of U.S. dollars, except percentages and per share amounts)
repurchase for cancellation under each NCIB is reduced by the number of subordinate voting shares purchased in the open market during the term of such NCIB to satisfy obligations under our stock-based compensation plans. We enter into program share repurchases (PSRs) from time to time as part of the NCIB process (if permitted by the TSX), pursuant to which we make a prepayment to a broker in consideration for the right to receive a variable number of subordinate voting shares upon such PSR’s completion. Under such PSRs, the price and number of subordinate voting shares to be repurchased by us is generally determined based on a discount to the volume weighted-average market price of such shares during the term of the PSR, subject to certain terms and conditions. The subordinate voting shares repurchased under any PSR are cancelled upon such PSR's completion.
In December 2018, the TSX accepted our notice to launch a new NCIB (2018 NCIB), which allows us to repurchase, at our discretion, until the earlier of December 17, 2019 or the completion of the purchases thereunder, up to approximately 9.5 million subordinate voting shares in the open market, or as otherwise permitted. We did not repurchase or cancel any subordinate voting shares under the 2018 NCIB in 2018.
In November 2017, we launched an NCIB (2017 NCIB) which was completed in November 2018. The 2017 NCIB allowed us to repurchase, at our discretion, up to approximately
10.5 million
subordinate voting shares in the open market, or as otherwise permitted. During the term of the 2017 NCIB, we paid an aggregate of
$19.9
(including transaction fees) in 2017 to repurchase and cancel
1.9 million
subordinate voting shares at a weighted average price of
$10.58
per share, and
$75.5
to cancel
6.8 million
subordinate voting shares during 2018 at a weighted average price of
$11.10
per share. In addition, prior to its expiry, we repurchased an aggregate of
1.1 million
subordinate voting shares under the 2017 NCIB (including
0.3 million
subordinate voting shares in 2017) to satisfy delivery obligations under our stock-based compensation plans (see below).
In February 2016, we launched an NCIB (2016 NCIB) which was completed in February 2017. The 2016 NCIB allowed us to repurchase, at our discretion, up to approximately
10.5 million
subordinate voting shares in the open market, or as otherwise permitted. During 2016, we paid
$34.3
(including transaction fees) to repurchase and cancel
3.2 million
subordinate voting shares under the 2016 NCIB at a weighted average price of
$10.69
per share, including
2.8 million
subordinate voting shares repurchased under a
$30.0
PSR we funded in March 2016 (and completed in May 2016) at a weighted average price of
$10.69
per share. We did not repurchase any subordinate voting shares under the 2016 NCIB for cancellation during 2017. However, prior to its expiry, we repurchased an aggregate of
1.6 million
subordinate voting shares under the 2016 NCIB (2016 —
1.6 million
; 2017 —
nil
), to satisfy delivery obligations under our stock-based compensation plans (see below).
(b)
Employee stock-based compensation
:
Long-Term Incentive Plan (LTIP):
Under the LTIP, we may grant stock options, stock appreciation rights, RSUs and PSUs to eligible employees, consultants and directors. We may, at the time of grant, authorize the grantees to settle these awards either in cash or in subordinate voting shares. Absent such permitted election, grants under the LTIP will be settled in subordinate voting shares, which we may purchase in the open market, or issue from treasury (up to a maximum aggregate of
29.0 million
subordinate voting shares). As of
December 31, 2018
,
11.1 million
subordinate voting shares remain reserved for issuance from treasury, covering potential issuances of subordinate voting shares for outstanding awards and for potential future grants of stock-based compensation under the LTIP.
Celestica Share Unit Plan (CSUP):
Under the CSUP, we may grant RSUs and PSUs to eligible employees. We have the option to settle RSUs and PSUs issued thereunder in subordinate voting shares purchased in the open market, or in cash.
For disclosure regarding DSUs issued to eligible directors under our Directors’ Share Compensation Plan (DSC Plan), see paragraph
(c)
below.
During
2018
, we recorded aggregate employee stock-based compensation expense (excluding DSU expense) through cost of sales and SG&A, of
$33.4
(
2017
—
$30.1
;
2016
—
$33.0
). Employee stock-based compensation expense varies from period-to-period. The portion of such expense that relates to a non-market performance condition varies depending on the level of achievement of pre-determined financial targets.
F-
36
CELESTICA INC.
NOTES TO THE CONSOLIDATED FINANCIAL STATEMENTS
(in millions of U.S. dollars, except percentages and per share amounts)
(i) Stock options:
We are permitted to grant stock options under our LTIP, although
no
stock options have been granted in 2016, 2017 or 2018. When granted, stock options are granted at prices equal to the closing market price on the day prior to the grant date and are exercisable during a period not to exceed
10
years from the grant date.
Stock option transactions were as follows for the years indicated:
|
Number of
Options |
Weighted Average
Exercise Price |
|||||
|
(in millions)
|
||||||
|
Outstanding at January 1, 2016
|
2.9
|
|
$
|
8.03
|
|
|
|
Exercised
|
(0.6
|
)
|
$
|
6.46
|
|
|
|
Forfeited/Expired
|
(0.2
|
)
|
$
|
9.99
|
|
|
|
Outstanding at December 31, 2016
|
2.1
|
|
$
|
8.46
|
|
|
|
Exercised
|
(1.7
|
)
|
$
|
7.87
|
|
|
|
Outstanding at December 31, 2017
|
0.4
|
|
$
|
12.14
|
|
|
|
Exercised
|
(0.1
|
)
|
$
|
6.20
|
|
|
|
Outstanding at December 31, 2018
|
0.3
|
|
$
|
11.93
|
|
|
Outstanding stock options were exercised throughout the year. The weighted average closing market price of a subordinate voting share was
$10.92
during
2018
(
2017
—
$12.41
;
2016
—
$10.66
).
The following stock options were outstanding as at
December 31, 2018
:
|
Range of Exercise Prices
|
Outstanding
Options |
Weighted Average
Exercise Price |
Weighted Average Remaining Life
of Outstanding Options |
Exercisable
Options |
Weighted Average
Exercise Price |
|||||
|
(in millions)
|
(years)
|
(in millions)
|
||||||||
|
$6.06 - $12.85
|
0.3
|
$11.93
|
6.2
|
0.3
|
$11.68
|
|||||
We amortize the estimated grant date fair value of stock options to expense over the vesting period (generally
four
years). The grant date fair value of outstanding stock options was determined using the Black-Scholes option pricing model and the following assumptions in the year of the grant: risk-free interest rate (based on U.S. government bond yields), expected volatility of the market price of our shares (based on historical volatility of our share price), and the expected option life (in years) (based on historical option holder behavior).
(ii)
RSUs and PSUs:
We grant RSUs and PSUs to our employees pursuant to our LTIP and CSUP. Each vested unit generally entitles the holder to receive
one
subordinate voting share. Under the CSUP, we have the option to satisfy the delivery of shares upon vesting of the awards by purchasing subordinate voting shares in the open market or by settling such awards in cash. Under the LTIP, we may (at the time of grant) authorize the grantees to settle awards in either cash or subordinate voting shares (absent such permitted election, grants will be settled in subordinate voting shares, which we may purchase in the open market or issue from treasury, subject to certain limits). We have generally settled these awards with subordinate voting shares purchased in the open market by a broker, or by issuing subordinate voting shares from treasury. We amortize the grant date fair value of RSUs and PSUs to expense over the vesting period.
F-
37
CELESTICA INC.
NOTES TO THE CONSOLIDATED FINANCIAL STATEMENTS
(in millions of U.S. dollars, except percentages and per share amounts)
The following table outlines the RSU transactions during the years indicated, under each of the LTIP and CSUP.
|
Number of awards (in millions)
|
LTIP
|
CSUP
|
Total
|
|||||
|
Outstanding at January 1, 2016
|
—
|
|
3.5
|
|
3.5
|
|
||
|
Granted
|
0.8
|
|
1.5
|
|
2.3
|
|
||
|
Settled
|
—
|
|
(1.9
|
)
|
(1.9
|
)
|
||
|
Forfeited/Expired
|
—
|
|
(0.1
|
)
|
(0.1
|
)
|
||
|
Outstanding at December 31, 2016
|
0.8
|
|
3.0
|
|
3.8
|
|
||
|
Granted
|
1.4
|
|
0.5
|
|
1.9
|
|
||
|
Settled
|
(0.3
|
)
|
(2.0
|
)
|
(2.3
|
)
|
||
|
Forfeited/Expired
|
(0.2
|
)
|
—
|
|
(0.2
|
)
|
||
|
Outstanding at December 31, 2017
|
1.7
|
|
1.5
|
|
3.2
|
|
||
|
Granted
|
—
|
|
2.6
|
|
2.6
|
|
||
|
Settled
|
(0.9
|
)
|
(0.9
|
)
|
(1.8
|
)
|
||
|
Forfeited/Expired
|
(0.1
|
)
|
(0.1
|
)
|
(0.2
|
)
|
||
|
Outstanding at December 31, 2018
|
0.7
|
|
3.1
|
|
3.8
|
|
||
The grant date fair value of RSUs is based on the market value of our subordinate voting shares at the time of grant.
With respect to PSUs, employees are granted a target number of PSUs. The number of PSUs that will actually vest will vary from
0
to
200%
of the target amount granted based on the level of achievement of the relevant performance conditions. During
2018
, we granted
1.6 million
(
2017
—
0.9 million
;
2016
—
1.25 million
) PSUs (representing in each case
100%
of target), primarily granted in the first quarter of each such year. The PSUs granted in 2018 vest based on the level of achievement of a pre-determined non-market performance measurement in the final year of the
three
-year performance period, subject to modification by a separate pre-determined non-market financial target and our relative TSR performance over the
3
-year vesting period. See note
2
(n)
for a description of TSR. We estimated the grant date fair value of the TSR modifier using a Monte Carlo simulation model and a premium of
106%
. The grant date fair value of the non TSR-based performance measurement and modifier was based on the market value of our subordinate voting shares at the time of grant and may be adjusted in subsequent years to reflect a change in the estimated level of achievement related to the applicable performance condition.
60%
of the PSUs granted in 2017 and 2016 vest based on the achievement of a market performance condition tied to TSR, and the balance vest based on a pre-determined non-market performance measurement in the final year of the
three
-year performance period. We estimated the grant date fair value of the TSR-based PSUs using a Monte Carlo simulation model (
2017
grants — premium of
143%
;
2016
grants — premium of
109%
). The grant date fair value of the non TSR-based PSUs was based on the market value of our subordinate voting shares at the time of grant and may be adjusted in subsequent years to reflect a change in the estimated level of achievement related to the applicable performance condition. We expect to settle these awards with subordinate voting shares purchased in the open market by a broker or issued from treasury. During
2018
, we settled
0.4 million
(
2017
—
0.8 million
;
2016
—
1.1 million
) PSUs with subordinate voting shares. At
December 31, 2018
,
3.2 million
(
December 31, 2017
—
2.5 million
;
December 31, 2016
—
3.0 million
) PSUs were outstanding (representing
100%
of the target amounts granted). Of the total number of outstanding PSUs at
December 31, 2018
,
0.7 million
PSUs were granted pursuant to the LTIP, and
2.5 million
PSUs were granted pursuant to the CSUP.
The weighted average grant date fair value of RSUs awarded in
2018
was
$10.48
per unit (
2017
—
$13.05
;
2016
—
$9.29
). The weighted average grant date fair value of PSUs awarded in
2018
was
$11.11
per unit (
2017
—
$17.18
;
2016
—
$9.61
). As of
December 31, 2018
,
none
of the outstanding RSUs or PSUs had vested.
From time-to-time, we pay cash for the purchase by a broker of subordinate voting shares in the open market to satisfy the delivery of subordinate voting shares upon vesting of awards under our stock-based compensation plans. For accounting purposes, we classify these shares as treasury stock until they are delivered pursuant to the plans. During
2018
, we purchased
2.1 million
subordinate voting shares (
2017
—
1.4 million
;
2016
—
1.6 million
) in the open market through a broker for
$22.4
(
2017
—
$16.7
;
2016
—
$18.2
) (including transaction fees) to satisfy delivery requirements under our stock-based compensation plans.
F-
38
CELESTICA INC.
NOTES TO THE CONSOLIDATED FINANCIAL STATEMENTS
(in millions of U.S. dollars, except percentages and per share amounts)
At
December 31, 2018
, the broker held
1.9 million
(
December 31, 2017
—
0.8 million
;
December 31, 2016
—
1.4 million
) subordinate voting shares with a value of
$20.2
(
December 31, 2017
—
$8.7
;
December 31, 2016
—
$15.3
).
As management currently intends to settle all outstanding share unit awards with subordinate voting shares purchased in the open market by a broker or subordinate voting shares issued from treasury, we have accounted for these share unit awards as equity-settled awards.
(c)
Deferred share units
:
We grant DSUs to certain members of our Board of Directors under our DSC Plan. The DSUs may be settled in cash or with subordinate voting shares issued from treasury or purchased in the open market (at the Company's option). See note
2
(n)
for details. During 2017,
two
of our directors resigned from the Board and in connection therewith, we settled their outstanding DSUs in 2017 in accordance with the provisions of the DSC Plan. Specifically, we paid
$1.7
in cash to Joseph M. Natale to settle his outstanding DSUs, and we settled the outstanding DSUs of Thomas S. Gross with
14,098
subordinate voting shares that we purchased in the open market. As Celestica is permitted to, and currently intends to, settle all other DSUs with shares purchased in the open market, we have accounted for these awards as equity-settled awards. In
2018
, we recorded DSU expense of
$2.0
(
2017
—
$2.2
;
2016
—
$2.1
) through SG&A. At
December 31, 2018
,
1.6 million
(
December 31, 2017
—
1.5 million
;
December 31, 2016
—
1.3 million
) DSUs were outstanding.
14
. ACCUMULATED OTHER COMPREHENSIVE LOSS, NET OF TAX:
|
Year ended
December 31 |
|||||||||||
|
2016
|
2017
|
2018
|
|||||||||
|
Opening balance of foreign currency translation account
|
$
|
(15.2
|
)
|
$
|
(15.2
|
)
|
$
|
(14.5
|
)
|
||
|
Foreign currency translation adjustments
|
—
|
|
0.7
|
|
0.1
|
|
|||||
|
Closing balance
|
(15.2
|
)
|
(14.5
|
)
|
(14.4
|
)
|
|||||
|
Opening balance of unrealized net gain (loss) on currency forward cash flow hedges
|
$
|
(17.6
|
)
|
$
|
(9.5
|
)
|
$
|
7.8
|
|
||
|
Net gain (loss) on currency forward cash flow hedges
(i)
|
(2.2
|
)
|
27.9
|
|
(14.7
|
)
|
|||||
|
Reclassification of net loss (gain) on currency forward cash flow hedges to operations
(ii)
|
10.3
|
|
(10.6
|
)
|
(0.8
|
)
|
|||||
|
Closing balance
(iii)
|
(9.5
|
)
|
7.8
|
|
(7.7
|
)
|
|||||
|
Opening balance of unrealized net gain (loss) on interest rate swap cash flow hedges
|
$
|
—
|
|
$
|
—
|
|
$
|
—
|
|
||
|
Net loss on interest rate swap cash flow hedges
|
—
|
|
—
|
|
(4.8
|
)
|
|||||
|
Reclassification of net loss on interest rate swap cash flow hedges to operations
|
—
|
|
—
|
|
0.4
|
|
|||||
|
Closing balance
(iv)
|
—
|
|
—
|
|
(4.4
|
)
|
|||||
|
Actuarial gains (losses) on pension and non-pension post-employment benefit plans (note 19)
|
$
|
17.1
|
|
$
|
(1.2
|
)
|
$
|
8.4
|
|
||
|
Reclassification of actuarial losses (gains) to deficit
|
(17.1
|
)
|
1.2
|
|
(8.4
|
)
|
|||||
|
Loss on purchase of pension annuities (note 19)
|
—
|
|
(17.0
|
)
|
(63.3
|
)
|
|||||
|
Reclassification of loss on purchase of pension annuities to deficit
(note 19)
|
—
|
|
17.0
|
|
63.3
|
|
|||||
|
Closing balance
|
—
|
|
—
|
|
—
|
|
|||||
|
Accumulated other comprehensive loss
|
$
|
(24.7
|
)
|
$
|
(6.7
|
)
|
$
|
(26.5
|
)
|
||
|
(i)
|
Net of income tax benefit of
$1.0
for
2018
(
2017
— net of
$2.8
income tax expense;
2016
— net of
$1.2
income tax benefit).
|
F-
39
CELESTICA INC.
NOTES TO THE CONSOLIDATED FINANCIAL STATEMENTS
(in millions of U.S. dollars, except percentages and per share amounts)
|
(ii)
|
Net of release of income tax expense of
$0.7
associated with the reclassification of net hedge (gain) loss to operations for
2018
(
2017
— net of release of
$0.3
income tax expense;
2016
— net of release of
$1.1
income tax benefit).
|
|
(iii)
|
Net of income tax benefit of
$0.5
as of
December 31, 2018
(
December 31, 2017
— net of
$1.2
income tax expense;
December 31, 2016
— net of
$1.3
income tax benefit).
|
|
(iv)
|
No income tax impact as of
December 31, 2018
.
|
We expect that the majority of net gains or losses on foreign exchange cash flow hedges reported in the
2018
accumulated other comprehensive loss balance will be reclassified to operations during
2019
, primarily in cost of sales, as the underlying expenses that are being hedged are primarily included in cost of sales. The gains or losses on interest rate swap cash flow hedges will be released from OCI to finance costs in each of the respective interest payment periods during the
5
-year term of the swap agreements, which mature in 2023 if the cancellable options remain unexercised.
|
15
.
|
EXPENSES BY NATURE:
|
We have presented our consolidated statement of operations by function. Included in our cost of sales and SG&A for
2018
were employee-related costs of
$804.7
(
2017
—
$726.4
;
2016
—
$711.3
), including employee stock-based compensation expense of
$33.4
(
2017
—
$30.1
;
2016
—
$33.0
), freight and transportation costs of
$97.0
(
2017
—
$79.3
;
2016
—
$80.9
), depreciation expense of
$73.7
(
2017
—
$67.6
;
2016
—
$66.2
) and rental expense of
$35.4
(
2017
—
$28.5
;
2016
—
$27.1
).
|
16
.
|
OTHER CHARGES:
|
|
Year ended
December 31 |
|||||||||||
|
2016
|
2017
|
2018
|
|||||||||
|
Restructuring charges (a)
|
$
|
31.9
|
|
$
|
28.9
|
|
$
|
35.4
|
|
||
|
Loss on pension annuity purchase (note 19)
|
—
|
|
1.9
|
|
—
|
|
|||||
|
Toronto transition costs (note 8)
|
—
|
|
1.6
|
|
13.2
|
|
|||||
|
Accelerated amortization of unamortized deferred financing costs (b)
|
—
|
|
—
|
|
1.2
|
|
|||||
|
Other (c)
|
(6.4
|
)
|
4.6
|
|
11.2
|
|
|||||
|
$
|
25.5
|
|
$
|
37.0
|
|
$
|
61.0
|
|
|||
|
(a)
|
Restructuring:
|
Our restructuring charges were comprised of the following:
|
Year ended
December 31 |
|||||||||||
|
2016
|
2017
|
2018
|
|||||||||
|
Cash charges
|
$
|
10.7
|
|
$
|
25.1
|
|
$
|
35.2
|
|
||
|
Non-cash charges
|
21.2
|
|
3.8
|
|
0.2
|
|
|||||
|
$
|
31.9
|
|
$
|
28.9
|
|
$
|
35.4
|
|
|||
We perform ongoing evaluations of our business, operational efficiency and cost structure, and implement restructuring actions as we deem necessary. In connection therewith, we are currently implementing restructuring actions under a cost efficiency initiative (CEI), including actions identified as part of our previously-disclosed CCS segment portfolio review and actions in response to the demand environment in our capital equipment business. This initiative includes reductions to our workforce, as well as potential consolidation of certain sites to better align capacity and infrastructure with current and anticipated customer demand, related transfers of customer programs and production, re-alignment of business processes, management reorganizations, and other associated activities.
We recorded restructuring charges of
$35.4
in
2018
, all in connection with our CEI, consisting of cash charges of
$35.2
, primarily for consultant costs, and employee and lease termination costs, and non-cash charges of
$0.2
, representing losses on
F-
40
CELESTICA INC.
NOTES TO THE CONSOLIDATED FINANCIAL STATEMENTS
(in millions of U.S. dollars, except percentages and per share amounts)
the sale of surplus equipment. Our restructuring provision at
December 31, 2018
was
$10.3
(
December 31, 2017
—
$12.7
), which we recorded in current portion of provisions on our consolidated balance sheet.
We recorded restructuring charges of
$28.9
in 2017. Our restructuring charges for 2017 consisted of cash charges of
$25.1
, comprised of employee termination costs related to our Organizational Design (OD) and Global Business Services (GBS) initiatives (each of which were completed in 2017), costs in connection with the rationalization of certain operations in the third quarter of 2017, and
$8.0
of charges in connection with our CEI in the fourth quarter of 2017, and net non-cash charges of
$3.8
, to write down the carrying value of our solar panel manufacturing equipment based on executed sale agreements. See note 4.
We recorded restructuring charges of
$31.9
in
2016
, consisting of cash charges of
$10.7
, primarily for employee termination costs relating to our GBS and OD initiatives, our solar panel manufacturing operations and other exited operations, and non-cash charges of
$21.2
to write down certain plant assets and equipment to recoverable amounts, including
$19.0
related to our solar panel manufacturing equipment at our two locations. See note 4 for a description of our decision in the fourth quarter of 2016 to exit the solar panel manufacturing business.
See notes
2
(m)
and
11
for further details regarding our restructuring provisions.
|
(b)
|
Accelerated amortization of unamortized deferred financing costs:
|
During the second quarter of 2018, we recorded a
$1.2
charge to accelerate the amortization of unamortized deferred financing costs related to the extinguishment of the Prior Facility in June 2018. See note 12.
|
(c)
|
Other:
|
During
2018
, we recorded
$11.0
(
2017
—
$4.5
;
2016
—
$1.4
) in Acquisition Costs. See note
3
. Additionally, during 2017 and 2016, we received recoveries of damages of
$1.1
and
$12.0
, respectively, in connection with the settlement of class action lawsuits in which we were a plaintiff, related to certain purchases we made in prior periods. These recoveries were offset in part by costs we recorded in each year for unrelated legal matters.
|
17
.
|
FINANCE COSTS AND REFUND INTEREST INCOME:
|
Our finance costs are comprised primarily of interest expenses and fees related to our applicable credit facility, interest rate swap agreements, accounts receivable sales program and the SFP. See notes
5
and
12
.
Refund interest income represents the refund of interest on cash previously held on account with tax authorities in connection with the resolution of certain previously-disputed tax matters in 2016. See note
20
.
|
18
.
|
RELATED PARTY TRANSACTIONS:
|
Onex Corporation (Onex) beneficially owns or controls, directly or indirectly, all of our outstanding multiple voting shares. Accordingly, Onex has the ability to exercise significant influence over our business and affairs and generally has the power to determine all matters submitted to a vote of our shareholders where the subordinate voting shares and multiple voting shares vote together as a single class. Mr. Gerald Schwartz, the Chairman of the Board, President and Chief Executive Officer of Onex, indirectly owns shares representing the majority of the voting rights of Onex.
In January 2009, we entered into a Services Agreement with Onex for the services of Mr. Schwartz (amended in 2017 to replace references to Mr. Schwartz with references to Mr. Tawfiq Popatia) as a director of Celestica, pursuant to which Onex receives compensation for such services. This agreement automatically renews for successive
one
-year terms unless either party provides a notice of intent not to renew. Under such agreement, as amended, the annual fee payable to Onex is
$0.235
payable in DSUs in equal quarterly installments, in arrears. The Services Agreement terminates automatically and the rights of Onex to receive compensation (other than accrued and unpaid compensation) will terminate (a)
30
days after the first day on which Onex ceases to hold at least one multiple voting share of Celestica or any successor company or (b) the date Mr. Popatia ceases to be a director of Celestica for any reason.
F-
41
CELESTICA INC.
NOTES TO THE CONSOLIDATED FINANCIAL STATEMENTS
(in millions of U.S. dollars, except percentages and per share amounts)
See note 8 for details with respect to Mr. Schwartz's interest in the Property Purchaser, and the Property Purchaser's option to obtain a
5%
non-voting interest in the Assignee.
Compensation of key management personnel:
Our key management team consists of directors and senior executive officers. The aggregate compensation expenses we recognized under IFRS for our directors and key management team were as follows:
|
Year ended
December 31 |
|||||||||||
|
2016
|
2017
|
2018
|
|||||||||
|
Short-term employee benefits and costs
|
$
|
6.2
|
|
$
|
7.5
|
|
$
|
6.2
|
|
||
|
Post-employment and other long-term benefits
|
0.4
|
|
0.6
|
|
0.3
|
|
|||||
|
Stock-based compensation (including DSUs to eligible directors)
|
12.3
|
|
12.4
|
|
14.8
|
|
|||||
|
$
|
18.9
|
|
$
|
20.5
|
|
$
|
21.3
|
|
|||
|
19
.
|
PENSION AND NON-PENSION POST-EMPLOYMENT BENEFIT PLANS:
|
(a)
Plan summaries:
We provide pension and non-pension post-employment benefit plans for our employees. Such plans include defined benefit pension plans for our employees in the United Kingdom (U.K.) that generally provide participants with stated benefits on retirement based on their pensionable service, either in annuities and/or lump sum payments. The U.K defined benefit pension plans are comprised of a Main pension plan and a Supplementary pension plan, both of which are closed to new members. The U.K. Main pension plan is our largest defined benefit pension plan. The Supplementary pension plan does not have any active members. Approximately
1%
of the U.K. Main pension plan members remain active employees of the Company. Defined contribution pension plans are offered to certain employees, mainly in Canada and the U.S. We provide non-pension post-employment benefits (under other benefit plans) to retired and terminated employees in Canada, the U.S., Mexico and Thailand. These benefits may include one-time retirement and specified termination benefits, medical, surgical, hospitalization coverage, supplemental health, dental and/or group life insurance.
In March 2017, the Trustees of our U.K. Main pension plan entered into an agreement with a third party insurance company to purchase an annuity for participants in such plan who have retired. The cost of the annuity was
£123.7 million
(approximately
$154.3
at the exchange rate at the time of recording) and was funded with existing plan assets. The annuity is held as an asset of the Main pension plan. Although we retain ultimate responsibility for the payment of benefits to plan participants, the annuity substantially hedges the financial risk component of the associated pension obligations for such retired participants. The purchase of the annuity resulted in a non-cash loss of
$17.0
which we recorded in OCI and simultaneously re-classified to deficit during the first quarter of 2017. We also reduced the value of our pension assets by
$17.0
during the first quarter of 2017, which was recorded in other non-current assets on our consolidated balance sheet. The cost of this annuity is subject to a true-up adjustment in the near term, and we may be required to pay additional premium amounts to the insurance company after completion of data verification of all retired participants.
In April 2017, the Trustees of our U.K. Supplementary pension plan entered into an agreement with a third party insurance company to purchase an annuity for all participants of this plan, all of whom are retired. The cost of the annuity was
£9.1 million
(approximately
$11.7
at the exchange rate at the time of recording) and was funded with existing plan assets. The annuity is held as an asset of such plan. We currently anticipate transferring the pension annuity to individual plan members and winding up the Supplementary pension plan in the first half of 2019. Although we retain ultimate responsibility for the payment of benefits to plan participants until such wind-up is complete, the annuity substantially hedges the financial risk component of the associated pension obligations for such retired participants. The purchase of the annuity resulted in a non-cash loss of
$1.9
which we recorded during the second quarter of 2017 in other charges (see note
16
) in our consolidated statement of operations, with a corresponding reduction in the value of our pension assets which is recorded in other non-current assets on our consolidated balance sheet. As we anticipate winding up this plan, the non-cash loss was recorded through our consolidated statement of operations.
F-
42
CELESTICA INC.
NOTES TO THE CONSOLIDATED FINANCIAL STATEMENTS
(in millions of U.S. dollars, except percentages and per share amounts)
In June 2018, the Trustees of the U.K. Main pension plan entered into an agreement with a third party insurance company to purchase an annuity for participants in such plan who have not yet retired. The cost of the annuity was
£156.1 million
(approximately
$209.2
at the exchange rate at the time of recording) and was funded with existing plan assets. The purchase of the annuity resulted in a non-cash loss of
$63.3
for the second quarter of 2018 which we recorded in OCI and simultaneously re-classified to deficit, and the recognition of an additional pension obligation on our consolidated balance sheet after we fully reduced the pension asset to zero. The cost of this annuity is subject to a true-up adjustment within 12 months of the purchase of the annuity, and we may be required to pay additional premium amounts to the insurance company after completion of data verification for such non-retired participants.
The overall governance of our pension plans is conducted by our Global Compensation Committee which, through annual reviews, approves material plan changes, reviews funding levels, investment performance, compliance matters and plan assumptions, and ensures that the plans are administered in accordance with local statutory requirements. We have established a Pension Committee to govern our Canadian pension plans. The U.K. pension plans are governed by a Board of Trustees, composed of employee and company representation. Both the Canadian Pension Committee and the U.K. Board of Trustees review funding levels, investment performance and compliance matters for their respective plans. Our pension funding policy is to contribute amounts sufficient, at minimum, to meet local statutory funding requirements. For our defined benefit pension plans (primarily U.K.), local regulatory bodies either define the minimum funding requirement or approve the funding plans submitted by us. We may make additional discretionary contributions taking into account actuarial assessments and other factors. The contributions that we make to support ongoing plan obligations are recorded in the respective asset or liability accounts on our consolidated balance sheet.
Our U.K. plans require an actuarial valuation to be completed every three years. The actuarial valuation was completed using a measurement date of April 2016; the next valuation will have a measurement date of April 2019.
We currently fund our non-pension post-employment benefit plans as we incur benefit payment obligations thereunder. Excluding our mandatory plans, the most recent actuarial valuations for our largest non-pension post-employment benefit plans were completed using measurement dates of May 2016 (Canada) and December 2018 (U.S.). The next actuarial valuations for these plans will have measurement dates of May 2019 and December 2019, respectively. We accrue the expected costs of providing non-pension post-employment benefits during the periods in which the employees render service.
We used a measurement date of
December 31, 2018
for the accounting valuation for pension and non-pension post-employment benefits.
Our pension plans are exposed to market risks such as changes in interest rates, inflation, and fluctuations in investment values, as well as financial risks including counterparty risks of financial institutions from which annuities have been purchased for specified plans. See note
21
(c)
. Our plans are also exposed to non-financial risks, including the membership’s mortality and demographic changes, as well as regulatory changes.
We manage the funding level risk of defined benefit pension plans through our asset allocation strategy for each plan. In the U.K., we follow an active de-risking strategy and allocate a higher level of the plan assets to debt instruments if the funding level of the plan improves. Certain of the obligations under our U.K. defined benefit pension plans have been hedged with the purchase of annuities with insurance companies. See above.
Pension fund assets are invested primarily in fixed income and equity securities. Asset allocation between fixed income and equity securities is adjusted based on the expected life of the plan and the expected retirement dates of the plan participants. Our pension funds do not invest directly in our shares, but may invest indirectly as a result of the inclusion of our shares in certain investment funds. All of our plan assets are measured at their fair value using inputs described in the fair value hierarchy in note
21
. At
December 31, 2018
,
$26.5
(
December 31, 2017
—
$247.0
) of our plan assets were measured using level 1 inputs of the fair value hierarchy and
$266.5
(December 31, 2017 —
$148.5
) of our plan assets (comprised of insurance annuities) were measured using level 3 inputs of the fair value hierarchy. At
December 31, 2018
,
none
(
December 31, 2017
—
none
) of our plan assets were measured using level 2 inputs of the fair value hierarchy. Approximately
97
% of our plan assets consist of annuities purchased with insurance companies and assets held with financial institutions with a Standard and Poor’s long-term rating of A- or above at
December 31, 2018
. The annuities purchased for the U.K. pension plans are held with financial institutions that are governed by local regulatory bodies. The remaining assets are held with financial institutions where ratings are not available or are below A-. For these institutions, Celestica monitors counterparty risk based on the diversification of plan assets. These
F-
43
CELESTICA INC.
NOTES TO THE CONSOLIDATED FINANCIAL STATEMENTS
(in millions of U.S. dollars, except percentages and per share amounts)
plan assets are maintained in segregated accounts by a custodian that is independent from the fund managers. We believe that the counterparty risk is low.
Plan assets are measured at their fair values; however, the amounts we are permitted to record for defined benefit plan assets may be restricted under IFRS. See note
2
(n)
for a description of this restriction. Based on a review of the terms, conditions, and statutory minimum funding requirements of our defined benefit plans, we have determined that the present value of future pension refunds or reductions in future contributions to our pension plans exceeds the total of the fair value of plan assets net of the present value of related obligations. This determination was made on a plan-by-plan basis. As a result of our assessment, there were no reductions to the amounts we recorded for defined benefit plan assets as at
December 31, 2018
or
2017
.
(b) Plan financials:
The table below presents the market value of plan assets:
|
Fair Market
Value at December 31 |
Actual Asset
Allocation (%) at December 31 |
||||||||||||
|
2017
|
2018
|
2017
|
2018
|
||||||||||
|
Quoted market prices:
|
|||||||||||||
|
Debt investment funds
|
$
|
225.2
|
|
$
|
10.2
|
|
57
|
%
|
4
|
%
|
|||
|
Equity investment funds
|
7.0
|
|
6.6
|
|
2
|
%
|
2
|
%
|
|||||
|
Non-quoted market prices:
|
|||||||||||||
|
Insurance annuities
|
148.5
|
|
266.5
|
|
37
|
%
|
91
|
%
|
|||||
|
Other
|
14.8
|
|
9.7
|
|
4
|
%
|
3
|
%
|
|||||
|
Total
|
$
|
395.5
|
|
$
|
293.0
|
|
100
|
%
|
100
|
%
|
|||
The following tables provide a summary of the financial position of our pension and other benefit plans:
|
Pension Plans
Year ended December 31 |
Other Benefit Plans
Year ended December 31 |
||||||||||||||
|
2017
|
2018
|
2017
|
2018
|
||||||||||||
|
Plan assets, beginning of year
|
$
|
377.2
|
|
$
|
395.5
|
|
$
|
—
|
|
$
|
—
|
|
|||
|
Interest income
|
10.0
|
|
9.4
|
|
—
|
|
—
|
|
|||||||
|
Actuarial losses in other comprehensive income
(i)
|
(6.1
|
)
|
(82.2
|
)
|
—
|
|
—
|
|
|||||||
|
Administrative expenses paid from plan assets
|
(1.4
|
)
|
(1.4
|
)
|
—
|
|
—
|
|
|||||||
|
Employer contributions
|
2.4
|
|
2.7
|
|
—
|
|
—
|
|
|||||||
|
Employer direct benefit payments
|
0.1
|
|
1.0
|
|
2.5
|
|
2.3
|
|
|||||||
|
Employer direct settlement payments
|
—
|
|
—
|
|
2.0
|
|
2.5
|
|
|||||||
|
Settlement payments from employer
|
—
|
|
—
|
|
(2.0
|
)
|
(2.5
|
)
|
|||||||
|
Settlement payments from plan (see note 19(a))
|
(11.7
|
)
|
0.1
|
|
—
|
|
—
|
|
|||||||
|
Benefit payments from plan
|
(10.5
|
)
|
(12.7
|
)
|
—
|
|
—
|
|
|||||||
|
Benefit payments from employer
|
(0.1
|
)
|
(1.0
|
)
|
(2.5
|
)
|
(2.3
|
)
|
|||||||
|
Foreign currency exchange rate changes and other
|
35.6
|
|
(18.4
|
)
|
—
|
|
—
|
|
|||||||
|
Plan assets, end of year
|
$
|
395.5
|
|
$
|
293.0
|
|
$
|
—
|
|
$
|
—
|
|
|||
|
(i)
|
Actuarial gains or losses are determined based on actual return on plan assets less interest income as set forth in the table above. For 2018, includes a
$63.3
loss resulting from the purchase of annuities in June 2018. For 2017, includes a
$17.0
loss resulting from the purchase of annuities in March 2017 (see note
19
(a)
above).
|
F-
44
CELESTICA INC.
NOTES TO THE CONSOLIDATED FINANCIAL STATEMENTS
(in millions of U.S. dollars, except percentages and per share amounts)
|
Pension Plans
Year ended December 31 |
Other Benefit
Plans Year ended December 31 |
||||||||||||||
|
2017
|
2018
|
2017
|
2018
|
||||||||||||
|
Accrued benefit obligations, beginning of year
|
$
|
325.6
|
|
$
|
355.8
|
|
$
|
65.8
|
|
$
|
75.5
|
|
|||
|
Current service cost
|
2.1
|
|
1.8
|
|
2.0
|
|
2.2
|
|
|||||||
|
Past service cost and settlement/curtailment losses
|
1.9
|
|
0.1
|
|
0.6
|
|
1.2
|
|
|||||||
|
Interest cost
|
8.7
|
|
8.6
|
|
2.6
|
|
2.6
|
|
|||||||
|
Actuarial losses (gains) in other comprehensive income from:
|
|||||||||||||||
|
— Changes in demographic assumptions
|
5.4
|
|
(3.7
|
)
|
0.2
|
|
—
|
|
|||||||
|
— Changes in financial assumptions
|
2.9
|
|
(19.9
|
)
|
2.9
|
|
(3.5
|
)
|
|||||||
|
— Experience adjustments
|
0.1
|
|
0.2
|
|
0.6
|
|
(0.5
|
)
|
|||||||
|
Settlement payments from employer
|
—
|
|
—
|
|
(2.0
|
)
|
(2.5
|
)
|
|||||||
|
Settlement payments from plan
|
(11.7
|
)
|
0.1
|
|
—
|
|
—
|
|
|||||||
|
Benefit payments from plan
|
(10.5
|
)
|
(12.7
|
)
|
—
|
|
—
|
|
|||||||
|
Benefit payments from employer
|
(0.1
|
)
|
(1.0
|
)
|
(2.5
|
)
|
(2.3
|
)
|
|||||||
|
Foreign currency exchange rate changes and other
|
31.4
|
|
(19.7
|
)
|
5.3
|
|
(4.6
|
)
|
|||||||
|
Accrued benefit obligations, end of year
|
$
|
355.8
|
|
$
|
309.6
|
|
$
|
75.5
|
|
$
|
68.1
|
|
|||
|
Weighted average duration of benefit obligations (in years)
|
19
|
|
18
|
|
14
|
|
13
|
|
|||||||
The present value of the defined benefit obligations, the fair value of plan assets and the surplus or deficit in our defined benefit pension and other benefit plans are summarized as follows:
|
Pension Plans
December 31 |
Other Benefit Plans
December 31 |
||||||||||||||
|
2017
|
2018
|
2017
|
2018
|
||||||||||||
|
Accrued benefit obligations, end of year
|
$
|
(355.8
|
)
|
$
|
(309.6
|
)
|
$
|
(75.5
|
)
|
$
|
(68.1
|
)
|
|||
|
Plan assets, end of year
|
395.5
|
|
293.0
|
|
—
|
|
—
|
|
|||||||
|
Excess (deficiency) of plan assets over accrued benefit obligations
|
$
|
39.7
|
|
$
|
(16.6
|
)
|
$
|
(75.5
|
)
|
$
|
(68.1
|
)
|
|||
The following table outlines the plan balances as reported on our consolidated balance sheet:
|
December 31
|
December 31
|
||||||||||||||||||||||
|
2017
|
2018
|
||||||||||||||||||||||
|
Pension
Plans |
Other
Benefit Plans |
Total
|
Pension
Plans |
Other
Benefit Plans |
Total
|
||||||||||||||||||
|
Pension and non-pension post-employment benefit obligations
|
$
|
(23.2
|
)
|
$
|
(74.6
|
)
|
$
|
(97.8
|
)
|
$
|
(21.1
|
)
|
$
|
(67.7
|
)
|
$
|
(88.8
|
)
|
|||||
|
Current other post-employment benefit obligations
(i)
|
—
|
|
(0.9
|
)
|
(0.9
|
)
|
—
|
|
(0.4
|
)
|
(0.4
|
)
|
|||||||||||
|
Non-current net pension assets (note 10)
|
62.9
|
|
—
|
|
62.9
|
|
4.5
|
|
—
|
|
4.5
|
|
|||||||||||
|
$
|
39.7
|
|
$
|
(75.5
|
)
|
$
|
(35.8
|
)
|
$
|
(16.6
|
)
|
$
|
(68.1
|
)
|
$
|
(84.7
|
)
|
||||||
|
(i)
|
In connection with certain restructuring actions announced prior to the end of 2017, we reclassified a current portion of the accumulated post-employment benefits totaling
$0.9
to accrued and other current liabilities on our consolidated balance sheet as of December 31, 2017. The current portion of post-employment benefits as of December 31, 2018 was
$0.4
.
|
F-
45
CELESTICA INC.
NOTES TO THE CONSOLIDATED FINANCIAL STATEMENTS
(in millions of U.S. dollars, except percentages and per share amounts)
The following table outlines the net expense recognized in our consolidated statement of operations for pension and non-pension post-employment benefit plans:
|
Pension Plans
Year ended December 31 |
Other Benefit Plans
Year ended December 31 |
||||||||||||||||||||||
|
2016
|
2017
|
2018
|
2016
|
2017
|
2018
|
||||||||||||||||||
|
Current service cost
|
$
|
1.7
|
|
$
|
2.1
|
|
$
|
1.8
|
|
$
|
1.9
|
|
$
|
2.0
|
|
$
|
2.2
|
|
|||||
|
Net interest cost (income)
|
(1.6
|
)
|
(1.3
|
)
|
(0.8
|
)
|
2.6
|
|
2.6
|
|
2.6
|
|
|||||||||||
|
Past service cost and settlement/curtailment losses
|
—
|
|
1.9
|
|
0.1
|
|
—
|
|
0.6
|
|
1.2
|
|
|||||||||||
|
Plan administrative expenses and other
|
1.1
|
|
1.3
|
|
1.3
|
|
—
|
|
—
|
|
—
|
|
|||||||||||
|
1.2
|
|
4.0
|
|
2.4
|
|
4.5
|
|
5.2
|
|
6.0
|
|
||||||||||||
|
Defined contribution pension plan expense (note 19(c))
|
10.0
|
|
9.4
|
|
9.6
|
|
—
|
|
—
|
|
—
|
|
|||||||||||
|
Total expense for the year
|
$
|
11.2
|
|
$
|
13.4
|
|
$
|
12.0
|
|
$
|
4.5
|
|
$
|
5.2
|
|
$
|
6.0
|
|
|||||
We generally record the expenses for pension plans and non-pension post-employment benefits in cost of sales and SG&A expenses depending on the nature of the expenses. Our settlement loss in 2017 of
$1.9
in pension plans arose as a result of annuity purchases for our U.K. Supplementary plan in April 2017. See note 19(a) above.
The following table outlines the gains and losses, net of tax, recognized in OCI and reclassified directly to deficit:
|
Year ended December 31
|
|||||||||||
|
2016
|
2017
|
2018
|
|||||||||
|
Cumulative losses, beginning of year
|
$
|
13.0
|
|
$
|
(4.1
|
)
|
$
|
14.1
|
|
||
|
Loss on pension annuity purchases (note 19(a))
|
—
|
|
17.0
|
|
63.3
|
|
|||||
|
Actuarial losses (gains) recognized during the year
(i)
|
(17.1
|
)
|
1.2
|
|
(8.4
|
)
|
|||||
|
Cumulative losses (gains), end of year
(ii)
|
$
|
(4.1
|
)
|
$
|
14.1
|
|
$
|
69.0
|
|
||
|
(i)
|
Net of income tax recovery of
$0.1
for
2018
(
2017
—
$0.0
income tax recovery;
2016
— net of
$1.4
income tax expense).
|
|
(ii)
|
Net of income tax recovery of
$0.8
as at
December 31, 2018
(
December 31, 2017
— net of
$0.7
income tax recovery;
December 31, 2016
— net of
$0.7
income tax recovery).
|
The following percentages and assumptions were used in measuring the plans for the years indicated:
|
Pension Plans
|
Other Benefit Plans
|
|||||||||||||
|
2016
|
2017
|
2018
|
2016
|
2017
|
2018
|
|||||||||
|
Weighted average discount rate at December 31
(i)
for:
|
||||||||||||||
|
Benefit obligations
|
2.6
|
|
2.5
|
|
2.9
|
|
3.9
|
3.6
|
3.8
|
|||||
|
Net pension cost
|
3.8
|
|
2.6
|
|
2.5
|
|
4.1
|
3.9
|
3.6
|
|||||
|
Weighted average rate of compensation increase for:
|
||||||||||||||
|
Benefit obligations
|
3.9
|
|
4.0
|
|
4.1
|
|
4.6
|
4.6
|
4.2
|
|||||
|
Net pension cost
|
3.8
|
|
3.9
|
|
4.0
|
|
4.6
|
4.6
|
4.6
|
|||||
|
Healthcare cost trend rates:
|
||||||||||||||
|
Immediate trend
|
—
|
|
—
|
|
—
|
|
5.9
|
5.8
|
5.7
|
|||||
|
Ultimate trend
|
—
|
|
—
|
|
—
|
|
4.5
|
4.5
|
4.0
|
|||||
|
Year the ultimate trend rate is expected to be achieved
|
—
|
|
—
|
|
—
|
|
2030
|
2030
|
2040
|
|||||
|
(i)
|
The weighted average discount rate is determined using publicly available rates for highly-rated bonds by currency in countries where there is a pension or non-pension benefit plan. A lower discount rate would increase the present value of the benefit obligation.
|
F-
46
CELESTICA INC.
NOTES TO THE CONSOLIDATED FINANCIAL STATEMENTS
(in millions of U.S. dollars, except percentages and per share amounts)
Management applied significant judgment in determining these assumptions. We evaluate these assumptions on a regular basis taking into consideration current market conditions and historical market data. Actual results could differ materially from those estimates and assumptions.
A one percentage-point increase or decrease in one of the following actuarial assumptions, holding other assumptions constant in each case, would increase (decrease) our benefit obligations as follows:
|
Pension Plans
|
Other Benefit Plans
|
||||||||||||||
|
Year ended
December 31, 2018 |
Year ended
December 31, 2018 |
||||||||||||||
|
1% Increase
|
1% Decrease
|
1% Increase
|
1% Decrease
|
||||||||||||
|
Discount rate
|
$
|
(48.1
|
)
|
$
|
62.1
|
|
$
|
(8.0
|
)
|
$
|
9.7
|
|
|||
|
Healthcare cost trend rate
|
$
|
—
|
|
$
|
—
|
|
$
|
6.2
|
|
$
|
(5.1
|
)
|
|||
The sensitivity figures shown above were calculated by determining the change in our benefit obligations as at
December 31, 2018
due to a 100 basis point increase or decrease to each of our significant actuarial assumptions used, primarily the discount rate and healthcare cost trend rate, in isolation, leaving all other assumptions unchanged from the original calculation.
(c)
Plan contributions:
In
2018
, we made contributions to our pension plans of
$13.3
(
2017
—
$11.9
) of which
$9.6
(
2017
—
$9.4
) was for defined contribution plans and
$3.7
(
2017
—
$2.5
) was for defined benefit plans. In
2018
, we made aggregate contributions to our non-pension post-employment benefit plans of
$4.8
(
2017
—
$4.5
) to fund benefit payments.
We currently estimate that our
2019
contributions will be
$2.4
for defined benefit pension plans,
$9.6
for defined contribution pension plans, and
$3.6
for our non-pension post-employment benefit plans. Our actual contributions could differ materially from these estimates.
20
. INCOME TAXES:
|
Year ended
December 31 |
|||||||||||
|
2016
|
2017
|
2018
|
|||||||||
|
Current income tax expense:
|
(restated)
|
|
(restated)
|
|
|||||||
|
Current year
(i)
|
$
|
48.3
|
|
$
|
39.3
|
|
$
|
44.4
|
|
||
|
Adjustments for prior years, including changes to net provisions related to tax uncertainties
(ii)
|
(34.1
|
)
|
(0.2
|
)
|
(4.7
|
)
|
|||||
|
14.2
|
|
39.1
|
|
39.7
|
|
||||||
|
Deferred income tax expense (recovery):
|
|||||||||||
|
Origination and reversal of temporary differences
(i)
|
20.0
|
|
(5.6
|
)
|
6.2
|
|
|||||
|
Changes in previously unrecognized tax losses and deductible temporary differences, including adjustments for prior years
(iii)
|
(9.5
|
)
|
(5.9
|
)
|
(62.9
|
)
|
|||||
|
10.5
|
|
(11.5
|
)
|
(56.7
|
)
|
||||||
|
Income tax expense
|
$
|
24.7
|
|
$
|
27.6
|
|
$
|
(17.0
|
)
|
||
F-
47
CELESTICA INC.
NOTES TO THE CONSOLIDATED FINANCIAL STATEMENTS
(in millions of U.S. dollars, except percentages and per share amounts)
A reconciliation of income taxes calculated at the statutory income tax rate to the income tax expense at the effective tax rate is as follows:
|
Year ended
December 31 |
|||||||||||
|
2016
|
2017
|
2018
|
|||||||||
|
(restated)
|
|
(restated)
|
|
||||||||
|
Earnings before income taxes
|
$
|
163.0
|
|
$
|
133.1
|
|
$
|
81.9
|
|
||
|
Income tax expense at Celestica’s statutory income tax rate of 26.5% (2017 and 2016 — 26.5%)
|
$
|
43.2
|
|
$
|
35.3
|
|
$
|
21.7
|
|
||
|
Impact on income taxes from:
|
|||||||||||
|
Manufacturing and processing deduction
|
(0.1
|
)
|
(0.1
|
)
|
(0.1
|
)
|
|||||
|
Foreign income taxed at different rates
|
(0.1
|
)
|
(7.6
|
)
|
(9.1
|
)
|
|||||
|
Foreign exchange
|
4.8
|
|
(6.8
|
)
|
3.8
|
|
|||||
|
Other, including non-taxable/non-deductible items and changes to net provisions related to tax uncertainties
(i)(ii)
|
(25.3
|
)
|
3.4
|
|
11.3
|
|
|||||
|
Change in unrecognized tax losses and deductible temporary differences
(iii)
|
2.2
|
|
3.4
|
|
(44.6
|
)
|
|||||
|
Income tax expense
|
$
|
24.7
|
|
$
|
27.6
|
|
$
|
(17.0
|
)
|
||
|
(i)
|
These line items for 2016 and 2017 in the two tables above were negatively impacted by a deferred tax expense of
$8.0
and
$4.0
, respectively, related to taxable temporary differences associated with the then-anticipated repatriation of undistributed earnings from certain of our Chinese subsidiaries, of which
$6.0
and
$3.5
was realized as a current tax expense for withholding tax on dividends paid in 2017 and 2018, respectively.
|
|
(ii)
|
These line items for 2016 in the two tables above were favorably impacted by the reversal of provisions of
$34
previously recorded for tax uncertainties related to the resolution of a transfer pricing matter for one of our Canadian subsidiaries (discussed below).
|
|
(iii)
|
These line items for 2018 in the two tables above include the recognition of an aggregate of
$53.3
of deferred tax assets in our U.S. group of subsidiaries (discussed below).
|
Our effective income tax rate can vary significantly period-to-period for various reasons, including as a result of the mix and volume of business in various tax jurisdictions within the Americas, Europe and Asia, in jurisdictions with tax holidays and tax incentives, and in jurisdictions for which no net deferred income tax assets have been recognized because management believed it was not probable that future taxable profit would be available against which tax losses and deductible temporary differences could be utilized. Our effective income tax rate can also vary due to the impact of restructuring charges, foreign exchange fluctuations, operating losses, cash repatriations, and changes in our provisions related to tax uncertainties.
During
2018
, we recorded a net income tax recovery of
$17.0
which was favorably impacted by the recognition of
$3.7
and
$49.6
of previously unrecognized deferred tax assets in our U.S. group of subsidiaries (collectively, DTA Benefits) as a result of our Atrenne and Impakt acquisitions, respectively (which partially offset the net deferred tax liabilities of
$56.6
that arose in connection with such acquisitions), as well as the reversal of
$6.0
of previously accrued Mexican taxes (described below). These favorable impacts were offset, in part, by adverse taxable foreign exchange impacts resulting from the weakening of the Malaysian ringgit and Chinese renminbi relative to the U.S. dollar (our functional currency). During the second quarter of 2018, we received a favorable conclusion to our application for a bi-lateral advance pricing arrangement (BAPA) between the United States and Mexican tax authorities and reversed
$6.0
of Mexican income taxes previously accrued to reflect the approved BAPA terms.
During 2017, we recorded a net income tax expense of
$27.6
which was favorably impacted by the recognition of a deferred income tax benefit of
$4.3
(Solar Benefit) related to our solar assets (described below), as well as taxable foreign exchange benefits resulting from the strengthening of the Malaysian ringgit and Chinese renminbi relative to the U.S. dollar, which were offset in part by
$4.0
deferred tax expense related to taxable temporary differences associated with the then-anticipated repatriation of undistributed earnings from certain of our Chinese subsidiaries, and a
$2.0
deferred tax expense related to the U.S. Tax Reform (defined below). In connection with our exit from the solar panel manufacturing business, we withdrew one of our tax incentives in Thailand (which related solely to such operations) during the second quarter of 2017. The withdrawal
F-
48
CELESTICA INC.
NOTES TO THE CONSOLIDATED FINANCIAL STATEMENTS
(in millions of U.S. dollars, except percentages and per share amounts)
of this incentive allowed us to apply tax losses arising from the disposition of our solar assets against other taxable profits in Thailand, resulting in the recognition of the Solar Benefit in 2017 and ultimately realized in 2018.
The United States Tax Cuts and Jobs Act (U.S. Tax Reform) was enacted on December 22, 2017 and became effective January 1, 2018. We believe that we recorded all significant one-time impacts resulting from enactment of the U.S. Tax Reform in the fourth quarter of 2017 (consisting of a non-cash increase to our deferred income tax expense of
$2.0
to re-value our previously recognized net deferred tax assets), but will continue to assess additional impacts, if any, throughout 2019 as they become known due to changes in our interpretations and assumptions, as well as applicable changes in our business and additional regulatory guidance that may be issued. No significant amounts resulting from the U.S. Tax Reform were recorded during 2018.
During
2016
, we recorded a net income tax expense of
$24.7
which was favorably impacted by the reversal of provisions previously recorded for tax uncertainties related to the resolution of a transfer pricing matter for one of our Canadian subsidiaries. In connection therewith, we recorded aggregate income tax recoveries of
$45 million
Canadian dollars (approximately
$34
at the exchange rates at the time of recording), as well as aggregate refund interest income of
$14.3
(see below). Our net income tax expense for 2016 was negatively impacted by withholding taxes of
$1.5
pertaining to the repatriation of
$50.0
from a U.S. subsidiary, deferred tax expense of
$8.0
related to taxable temporary differences associated with the then-anticipated repatriation of undistributed earnings from certain of our Chinese subsidiaries, as well as taxable foreign exchange impacts of
$7.3
resulting from the weakening of the Malaysian ringgit and Chinese renminbi relative to the U.S. dollar. There was no tax impact recorded in 2016 associated with the
$21.2
non-cash impairment charges (through restructuring), however, as discussed above, we recorded the Solar Benefit in 2017 which was then realized in 2018. See note
16
(a)
.
F-
49
CELESTICA INC.
NOTES TO THE CONSOLIDATED FINANCIAL STATEMENTS
(in millions of U.S. dollars, except percentages and per share amounts)
Changes in deferred tax assets and liabilities for the periods indicated are as follows:
|
Unrealized
foreign exchange gains |
Accounting
provisions not currently deductible |
Pensions and
non-pension post-retirement benefits |
Tax
losses carried forward |
Property,
plant and equipment and intangibles |
Other
|
Reclassification
between deferred tax assets and deferred tax liabilities (i) |
Total
|
|||||||||||||||||||||||||
|
Deferred tax assets*:
|
||||||||||||||||||||||||||||||||
|
Balance — January 1, 2017
|
$
|
—
|
|
$
|
10.4
|
|
$
|
—
|
|
$
|
30.2
|
|
$
|
—
|
|
$
|
12.6
|
|
$
|
(17.9
|
)
|
$
|
35.3
|
|
||||||||
|
Credited (charged) to net earnings
|
—
|
|
(1.9
|
)
|
—
|
|
4.5
|
|
—
|
|
(14.8
|
)
|
—
|
|
(12.2
|
)
|
||||||||||||||||
|
Credited (charged) directly to equity
|
—
|
|
—
|
|
—
|
|
(1.7
|
)
|
—
|
|
—
|
|
—
|
|
(1.7
|
)
|
||||||||||||||||
|
Effects of foreign exchange
|
—
|
|
0.3
|
|
—
|
|
1.6
|
|
—
|
|
—
|
|
—
|
|
1.9
|
|
||||||||||||||||
|
Other
|
—
|
|
—
|
|
—
|
|
—
|
|
6.3
|
|
2.2
|
|
5.8
|
|
14.3
|
|
||||||||||||||||
|
Balance — December 31, 2017
|
—
|
|
8.8
|
|
—
|
|
34.6
|
|
6.3
|
|
—
|
|
(12.1
|
)
|
37.6
|
|
||||||||||||||||
|
Credited (charged) to net earnings
|
—
|
|
2.1
|
|
—
|
|
36.8
|
|
—
|
|
17.1
|
|
—
|
|
56.0
|
|
||||||||||||||||
|
Credited (charged) directly to equity
|
—
|
|
—
|
|
—
|
|
(9.8
|
)
|
—
|
|
1.7
|
|
—
|
|
(8.1
|
)
|
||||||||||||||||
|
Effects of foreign exchange
|
—
|
|
(0.1
|
)
|
—
|
|
(2.1
|
)
|
—
|
|
0.1
|
|
—
|
|
(2.1
|
)
|
||||||||||||||||
|
Other
|
—
|
|
—
|
|
—
|
|
—
|
|
(6.3
|
)
|
(4.1
|
)
|
(36.3
|
)
|
(46.7
|
)
|
||||||||||||||||
|
Balance — December 31, 2018
|
$
|
—
|
|
$
|
10.8
|
|
$
|
—
|
|
$
|
59.5
|
|
$
|
—
|
|
$
|
14.8
|
|
$
|
(48.4
|
)
|
$
|
36.7
|
|
||||||||
|
Deferred tax liabilities*:
|
||||||||||||||||||||||||||||||||
|
Balance — January 1, 2017
|
$
|
26.5
|
|
$
|
—
|
|
$
|
12.2
|
|
$
|
—
|
|
$
|
12.8
|
|
$
|
0.1
|
|
$
|
(16.2
|
)
|
$
|
35.4
|
|
||||||||
|
Charged (credited) to net earnings
|
(2.9
|
)
|
—
|
|
0.1
|
|
—
|
|
(18.7
|
)
|
(2.8
|
)
|
—
|
|
(24.3
|
)
|
||||||||||||||||
|
Charged (credited) directly to equity
|
—
|
|
—
|
|
(1.7
|
)
|
—
|
|
—
|
|
2.5
|
|
—
|
|
0.8
|
|
||||||||||||||||
|
Effects of foreign exchange
|
1.6
|
|
—
|
|
—
|
|
—
|
|
(0.4
|
)
|
—
|
|
—
|
|
1.2
|
|
||||||||||||||||
|
Other
|
—
|
|
—
|
|
—
|
|
—
|
|
6.3
|
|
4.3
|
|
4.1
|
|
14.7
|
|
||||||||||||||||
|
Balance — December 31, 2017
|
25.2
|
|
—
|
|
10.6
|
|
—
|
|
—
|
|
4.1
|
|
(12.1
|
)
|
27.8
|
|
||||||||||||||||
|
Charged (credited) to net earnings
|
1.5
|
|
—
|
|
—
|
|
—
|
|
(2.3
|
)
|
—
|
|
—
|
|
(0.8
|
)
|
||||||||||||||||
|
Charged (credited) directly to equity
|
—
|
|
—
|
|
(9.9
|
)
|
—
|
|
—
|
|
—
|
|
—
|
|
(9.9
|
)
|
||||||||||||||||
|
Additions from business combinations
|
—
|
|
—
|
|
—
|
|
—
|
|
56.6
|
|
—
|
|
—
|
|
56.6
|
|
||||||||||||||||
|
Effects of foreign exchange
|
(2.1
|
)
|
—
|
|
0.1
|
|
—
|
|
0.5
|
|
—
|
|
—
|
|
(1.5
|
)
|
||||||||||||||||
|
Other
|
—
|
|
—
|
|
—
|
|
—
|
|
(6.3
|
)
|
(4.1
|
)
|
(36.3
|
)
|
(46.7
|
)
|
||||||||||||||||
|
Balance — December 31, 2018
|
$
|
24.6
|
|
$
|
—
|
|
$
|
0.8
|
|
$
|
—
|
|
$
|
48.5
|
|
$
|
—
|
|
$
|
(48.4
|
)
|
$
|
25.5
|
|
||||||||
|
*
|
Certain of the 2017 figures have been restated to reflect the adoption of IFRS15.
|
|
(i)
|
This reclassification reflects the offsetting of deferred tax assets and deferred tax liabilities to the extent they relate to the same taxing authorities and there is a legally enforceable right to such offset.
|
The amount of deductible temporary differences and unused tax losses for which no deferred tax assets have been recognized at
December 31, 2018
is
$1,780.4
(
December 31, 2017
—
$1,977.7
). We have not recognized deferred tax assets in respect of these items because, based on management’s estimates, it is not probable that future taxable profit will be available against which we can utilize the benefits. A portion of these tax losses expires between 2019 and 2038 and a portion can be carried forward indefinitely to offset taxable profits. The deductible temporary differences do not expire under current tax legislation.
The aggregate amount of temporary differences associated with investments in subsidiaries for which we have not recognized deferred tax liabilities is
$5.8
(
December 31, 2017
—
nil
).
During 2018, we recorded deferred tax assets of
$5.0
with respect to losses incurred in our U.S. subsidiaries during such year. We recognize deferred tax assets based on our estimate of the future taxable profit we expect our U.S. group of subsidiaries to achieve based on our review of financial projections. We did not record any deferred tax assets related to losses incurred in 2017 for any of our subsidiaries.
F-
50
CELESTICA INC.
NOTES TO THE CONSOLIDATED FINANCIAL STATEMENTS
(in millions of U.S. dollars, except percentages and per share amounts)
Certain countries in which we do business grant tax incentives to attract or retain our business. Our tax expense could increase significantly if certain tax incentives from which we benefit are retracted. A retraction could occur if we fail to satisfy the conditions on which these tax incentives are based, or if they are not renewed or replaced upon expiration. Our tax expense could also increase if tax rates applicable to us in such jurisdictions are otherwise increased, or due to changes in legislation or administrative practices. Changes in our outlook in any particular country could impact our ability to meet the required conditions.
Our tax incentives currently consist of tax holidays for the profits of our Thailand and Laos subsidiaries, as well as tax incentives for dividend withholding taxes for these subsidiaries. These tax incentives are subject to certain conditions with which we intend to comply, and expire between 2019 and 2027. The aggregate tax benefit arising from all of our tax incentives was approximately
$4.7
or
$0.03
per diluted share for
2018
,
$7.6
or
$0.05
per diluted share for
2017
, and
$7.3
or
$0.05
per diluted share for
2016
.
We have multiple income tax incentives in Thailand with varying exemption periods. These incentives initially allow for a
100%
income tax exemption (including distribution taxes), which after
eight
years transition to a
50%
income tax exemption for the next
five
years (excluding distribution taxes). Upon full expiry of each of the incentives, taxable profits associated with such expired tax incentives become fully taxable. As a result of our exit from the solar panel manufacturing business, we withdrew our tax incentive related to our solar panel manufacturing operations in Thailand during the second quarter of 2017 (see above). One of our remaining
three
Thailand tax incentives expires in 2019, another expires in 2020, and the third incentive will transition to the
50%
exemption in 2022, and expire in 2027.
We were granted tax incentives for our Malaysian subsidiaries from 2010 to 2014, however, we did not benefit from any Malaysian tax incentives thereafter. While negotiations for Malaysian incentives are ongoing, we currently expect to be granted new pioneer incentives for only limited portions of our Malaysian business. As a result, we recorded Malaysian income taxes at full statutory tax rates commencing in 2015. As we continue to negotiate tax incentives with Malaysian authorities, including the activities covered, exemption levels, incentive conditions or commitments, and the effective commencement date of the incentive, we are currently unable to quantify the benefits or applicable periods of any such incentives, and there can be no assurance that any such incentives will be granted.
We recorded aggregate current income tax recoveries in the second half of 2016 of
$45 million
Canadian dollars (approximately
$34
at the exchange rates at the time of recording) to reverse previously recorded provisions for tax uncertainties related to transfer pricing, as well as aggregate refund interest income of
$19 million
Canadian dollars (approximately
$14
at the exchange rates at the time of recording) for cash held on account with Canadian tax authorities in connection with the resolution of certain transfer pricing matters (related to 2001 through 2004) and disputed benefits associated with favorable adjustments. In addition, in 2016, the Canadian tax authorities issued revised reassessments pertaining to the re-characterization of certain interest amounts deducted by one of our Canadian entities in 2002 through 2004. As the net impact of the revised reassessments was nominal, we accepted them and the matter was closed in 2016. As a result of the resolution of the foregoing matters, we received
$70 million
Canadian dollars (approximately
$52
at settlement date exchange rates) during the fourth quarter of 2016, representing the refund of cash previously deposited on account with the Canadian tax authorities and related refund interest income. We also received
$6 million
Canadian dollars (approximately
$4
at settlement date exchange rates) in January 2017. The aggregate amount of cash refunds received represented the return of all deposits and related refund interest income with respect to the Canadian tax matters.
See note
24
regarding a Brazilian sales tax contingency.
|
21
.
|
FINANCIAL INSTRUMENTS AND RISK MANAGEMENT:
|
Our financial assets are comprised primarily of cash and cash equivalents, accounts receivable, and derivatives used for hedging purposes. Our financial liabilities are comprised primarily of accounts payable, certain accrued and other liabilities and provisions, the New Term Loans, borrowings under the New Revolver, and derivatives. We record the majority of our financial assets and liabilities at amortized cost except for derivative assets and liabilities, which we measure at fair value. We classify our short-term investments in money market funds (if applicable) as FVTPL, and initially recognize such assets on our consolidated balance sheet at fair value with subsequent changes recorded in our consolidated statement of operations. The carrying value of the New Term Loans approximates their fair value as they bear interest at a variable market rate. We classify the financial assets and liabilities that we measure at fair value based on the inputs used to determine fair value at the measurement
F-
51
CELESTICA INC.
NOTES TO THE CONSOLIDATED FINANCIAL STATEMENTS
(in millions of U.S. dollars, except percentages and per share amounts)
date. See note 2 for changes to the classification of our financial assets and liabilities since December 31, 2017 as a result of our adoption of IFRS 9 as of January 1, 2018.
Cash and cash equivalents are comprised of the following:
|
December 31
|
|||||||
|
2017
|
2018
|
||||||
|
Cash................................................................................................................................................
|
$
|
401.5
|
|
$
|
409.1
|
|
|
|
Cash equivalents.............................................................................................................................
|
113.7
|
|
12.9
|
|
|||
|
$
|
515.2
|
|
$
|
422.0
|
|
||
Our current portfolio of cash equivalents consist of bank deposits. The majority of our cash and cash equivalents is held with financial institutions each of which had at
December 31, 2018
a Standard and Poor’s short-term rating of A-1 or above.
Financial risk management objectives:
We have exposures to a variety of financial risks through our operations. We regularly monitor these risks and have established policies and business practices to mitigate the adverse effects of these potential exposures. We have used derivative financial instruments, such as foreign currency forward and swap contracts, as well as interest rate swaps, to reduce the effects of some of these risks. We do not enter into or trade financial instruments, including derivative financial instruments, for speculative purposes.
|
(a)
|
Currency risk:
|
Due to the global nature of our operations, we are exposed to exchange rate fluctuations on our financial instruments denominated in various currencies. The majority of our currency risk is driven by operational costs, including income tax expense, incurred in local currencies by our subsidiaries. As part of our risk management program, we attempt to mitigate currency risk through a hedging program using forecasts of our anticipated future cash flows and balance sheet exposures denominated in foreign currencies. We enter into foreign exchange forward contracts and swaps, generally for periods up to
12 months
, to lock in the exchange rates for future foreign currency transactions, which is intended to reduce the variability of our operating costs and future cash flows denominated in local currencies. While these contracts are intended to reduce the effects of fluctuations in foreign currency exchange rates, our hedging strategy does not mitigate the longer-term impacts of changes to foreign exchange rates. Although our functional currency is the U.S. dollar, currency risk on our income tax expense arises as we are generally required to file our tax returns in the local currency for each particular country in which we have operations. While our hedging program is designed to mitigate currency risk vis-à-vis the U.S. dollar, we remain subject to taxable foreign exchange impacts in our translated local currency financial results relevant for tax reporting purposes.
Our major currency exposures at
December 31, 2018
are summarized in U.S. dollar equivalents in the following table. The local currency amounts have been converted to U.S. dollar equivalents using spot rates at
December 31, 2018
.
|
Canadian
dollar |
Romanian Leu
|
Euro
|
Thai baht
|
Chinese renminbi
|
|||||||||||||||
|
Cash and cash equivalents
|
$
|
4.1
|
|
$
|
0.4
|
|
$
|
8.2
|
|
$
|
2.3
|
|
$
|
16.3
|
|
||||
|
Accounts receivable
|
1.6
|
|
—
|
|
42.5
|
|
1.7
|
|
12.4
|
|
|||||||||
|
Income taxes and value-added taxes receivable
|
16.5
|
|
0.8
|
|
13.4
|
|
3.3
|
|
12.3
|
|
|||||||||
|
Other financial assets
|
—
|
|
0.8
|
|
1.7
|
|
0.5
|
|
0.8
|
|
|||||||||
|
Pension and non-pension post-employment liabilities
|
(70.6
|
)
|
—
|
|
(0.5
|
)
|
(13.6
|
)
|
(1.0
|
)
|
|||||||||
|
Income taxes and value-added taxes payable
|
(0.1
|
)
|
—
|
|
(0.3
|
)
|
(1.2
|
)
|
—
|
|
|||||||||
|
Accounts payable and certain accrued and other liabilities and provisions
|
(52.4
|
)
|
(12.9
|
)
|
(45.8
|
)
|
(18.9
|
)
|
(27.0
|
)
|
|||||||||
|
Net financial assets (liabilities)
|
$
|
(100.9
|
)
|
$
|
(10.9
|
)
|
$
|
19.2
|
|
$
|
(25.9
|
)
|
$
|
13.8
|
|
||||
F-
52
CELESTICA INC.
NOTES TO THE CONSOLIDATED FINANCIAL STATEMENTS
(in millions of U.S. dollars, except percentages and per share amounts)
Foreign currency risk sensitivity analysis:
The financial impact of a one-percentage point strengthening or weakening of the following currencies against the U.S. dollar for our financial instruments denominated in such non-functional currencies is summarized in the following table as at
December 31, 2018
. The financial instruments impacted by a change in exchange rates include our exposures to the above financial assets or liabilities denominated in non-functional currencies and our foreign exchange forward contracts and swaps.
|
Canadian
dollar |
Romanian Leu
|
Euro
|
Thai baht
|
Chinese renminbi
|
|||||||||||||||
|
Increase (decrease)
|
|||||||||||||||||||
|
1% Strengthening
|
|||||||||||||||||||
|
Net earnings
|
$
|
—
|
|
$
|
(0.1
|
)
|
$
|
(0.1
|
)
|
$
|
(0.1
|
)
|
$
|
0.1
|
|
||||
|
Other comprehensive income
|
1.0
|
|
0.4
|
|
0.1
|
|
0.7
|
|
0.6
|
|
|||||||||
|
1% Weakening
|
|
|
|||||||||||||||||
|
Net earnings
|
—
|
|
0.1
|
|
0.1
|
|
0.1
|
|
(0.1
|
)
|
|||||||||
|
Other comprehensive income
|
(1.0
|
)
|
(0.4
|
)
|
(0.1
|
)
|
(0.7
|
)
|
(0.6
|
)
|
|||||||||
(b) Interest rate risk:
Borrowings under the New Credit Facility bear interest at specified rates, plus specified margins. See note
12
. Our borrowings under this facility at
December 31, 2018
totaled
$757.3
, comprised of an aggregate of
$598.3
under the New Term Loans and, other than ordinary course letters of credit (described below),
$159.0
under the New Revolver (
December 31, 2017
—
$187.5
outstanding under the Prior Term Loan, and other than ordinary course letters of credit, no amounts outstanding under the Prior Revolver). Such borrowings expose us to interest rate risk due to the potential variability in market interest rates. Without accounting for the interest rate swaps described below, a one-percentage point increase in these rates would increase interest expense, based on outstanding borrowings of
$757.3
as at
December 31, 2018
, by
$7.6
annually.
As part of our risk management program, we attempt to mitigate interest rate risk through interest rate swaps. In order to partially hedge against our exposure to interest rate variability on the New Term Loans, we entered into
5
-year agreements with a syndicate of third-party banks in August and December 2018 to swap the variable interest rate (based on LIBOR plus a margin) with a fixed rate of interest for
$350.0
of the total borrowings under the New Term Loans. The terms of the interest rate swap agreements on the floating market rate and the interest payment dates match that of the underlying debt, such that any hedge ineffectiveness is not expected to be significant. The swap agreements include options that allow us to cancel up to
$150.0
of the notional amount of the original swap agreements (
$75.0
under the November Term Loan starting in December 2020, and
$75.0
under the June Term Loan starting in August 2021). The cancellable options in the swap agreements are aligned with our risk management strategy for the New Term Loans as they allow us to make voluntary prepayments of outstanding amounts without premium or penalty, subject to certain conditions. Our unhedged borrowings under the New Credit Facility at
December 31, 2018
were
$407.3
(comprised of an aggregate of
$248.3
under the New Term Loans and
$159.0
under the New Revolver). A one-percentage point increase in relevant interest rates would increase interest expense, based on the outstanding amounts of unhedged borrowings of
$407.3
as at
December 31, 2018
, by
$4.1
annually.
We obtain third-party valuations of the swaps under the interest rate swap agreements. The valuations of the swaps are primarily measured through various pricing models or discounted cash flow analyses that incorporate observable market parameters, such as interest rate yield curves and volatility, and credit risk adjustments. The valuations of the interest rate swaps are measured primarily based on Level 2 data inputs of the fair value measurement hierarchy. The unrealized portion of the hedge gain or loss of the swaps is recorded in accumulated OCI. The realized portion of the hedge gain or loss of the swap is released from OCI and recognized under finance costs in our consolidated statement of operations in the respective interest payment periods. At
December 31, 2018
, the fair value of our interest rate swap agreements was a net unrealized loss of
$4.4
which we recorded in other non-current liabilities on our consolidated balance sheet. As we have swapped
$350.0
of our borrowings under the New Term Loans from floating to fixed rates, the financial impact of a 25 basis point increase in the floating market interest rate would eliminate the net unrealized loss described above, and a 25 basis point decrease in the floating interest rate would increase our unrealized loss on the interest rate swaps by
$4.3
.
F-
53
CELESTICA INC.
NOTES TO THE CONSOLIDATED FINANCIAL STATEMENTS
(in millions of U.S. dollars, except percentages and per share amounts)
|
(c)
|
Credit risk:
|
Credit risk refers to the risk that a counterparty may default on its contractual obligations resulting in a financial loss to us. We believe the risk of counterparty non-performance is relatively low, however, if a key supplier (or any company within such supplier's supply chain) or customer experiences financial difficulties or fails to comply with their contractual obligations, this could result in a financial loss to us. With respect to our financial market activities, we have adopted a policy of dealing only with credit-worthy counterparties to help mitigate the risk of financial loss from defaults. We monitor the credit risk of the counterparties with whom we conduct business, through a combined process of credit rating reviews and portfolio reviews. To attempt to mitigate the risk of financial loss from defaults under our foreign currency forward contracts and swaps, and our interest rate swaps, our contracts are held by counterparty financial institutions, each of which had a Standard and Poor’s rating of A-2 or above at
December 31, 2018
. In addition, we maintain cash and short-term investments in highly-rated investments or on deposit with major financial institutions. Each financial institution with which we have our accounts receivable sales program and the SFP had a Standard and Poor’s short-term rating of
A-2
or above and a long-term rating of
BBB+
or above at
December 31, 2018
. Each financial institution from which annuities have been purchased for the defined benefit component of our Canadian pension plan had an A.M. Best or Standard and Poor’s long-term rating of A or above at
December 31, 2018
. In addition, the financial institutions from which annuities have been purchased for the defined benefit component of our U.K. pension plans are governed by local regulatory bodies. If an institution from which we purchased annuities for our pension plans defaults on their contractual obligations, this would result in a financial loss to us, as we retain ultimate responsibility for the payment of benefits to plan participants unless and until such pension plans are wound-up.
We also provide unsecured credit to our customers in the normal course of business. Customer exposures that potentially subject us to credit risk include our accounts receivable, inventory on hand, and non-cancellable purchase orders in support of customer demand. From time to time, we extend the payment terms applicable to certain customers and/or provide longer payment terms when deemed commercially reasonable. Longer payment terms, which have become more prevalent, could adversely impact our working capital requirements, and increase our financial exposure and credit risk. We attempt to mitigate customer credit risk by monitoring our customers’ financial condition and performing ongoing credit evaluations as appropriate. In certain instances, we may obtain letters of credit or other forms of security from our customers. We may also purchase credit insurance from a financial institution to reduce our credit exposure to certain customers. We consider credit risk in determining our allowance for doubtful accounts, and we believe that such allowance, as adjusted from time to time, is adequate. The carrying amount of financial assets recorded in our consolidated financial statements, net of our allowance for doubtful accounts, represents our estimate of maximum exposure to credit risk. At
December 31, 2018
, approximately
1
% of our gross accounts receivable are over 90 days past due. Accounts receivable are net of an allowance for doubtful accounts of
$5.3
at
December 31, 2018
(
December 31, 2017
—
$4.3
).
|
(d)
|
Liquidity risk:
|
Liquidity risk is the risk that we may not have cash available to satisfy our financial obligations as they come due. The majority of our financial liabilities recorded in accounts payable, accrued and other current liabilities and provisions are due within 90 days. We manage liquidity risk by maintaining a portfolio of liquid funds and investments and having access to a revolving credit facility, intraday and overnight bank overdraft facilities, an accounts receivable sales program and the SFP. Since our
$250.0
accounts receivable sales program and the SFP are each on an uncommitted basis, there can be no assurance that any participant bank will purchase all the accounts receivable that we wish to sell thereunder. However, we believe that cash flow from operating activities, together with cash on hand, cash from the sale of accounts receivable, and borrowings available under the New Revolver and intraday and overnight bank overdraft facilities are sufficient to fund our currently anticipated financial obligations.
Fair values:
We estimate the fair value of each class of financial instruments. The carrying values of cash and cash equivalents, accounts receivable, accounts payable, accrued liabilities and provisions, and borrowings under the New Revolver approximate the fair values of these financial instruments due to the short-term nature of these instruments. The carrying value of the New Term Loans approximate their fair value as they bear interest at a variable market rate. The fair values of foreign currency contracts are estimated using generally accepted valuation models based on a discounted cash flow analysis with inputs of observable market data, including currency rates and discount factors. Discount factors are adjusted by our own credit risk or the credit risk of the counterparty, depending on whether the fair values are in liability or asset positions, respectively. We
F-
54
CELESTICA INC.
NOTES TO THE CONSOLIDATED FINANCIAL STATEMENTS
(in millions of U.S. dollars, except percentages and per share amounts)
obtained third-party valuations of the swaps under our interest rate swap agreements. The valuations of the swaps are primarily measured through various pricing models or discounted cash flow analyses that incorporate observable market parameters, such as interest rate yield curves and volatility, and credit risk adjustments, and are based on Level 2 data inputs of the fair value measurement hierarchy.
Fair value measurements:
In the table below, we have segregated our financial assets and liabilities that are measured at fair value, based on the inputs used to determine fair value at the measurement date. The three levels within the fair value hierarchy, based on the reliability of inputs, are as follows:
|
•
|
level 1 inputs are quoted prices (unadjusted) in active markets for identical assets or liabilities;
|
|
•
|
level 2 inputs are inputs other than quoted prices included in level 1 that are observable for the asset or liability either directly (
i.e.
prices) or indirectly (
i.e.
derived from prices); and
|
|
•
|
level 3 inputs are inputs for the asset or liability that are not based on observable market data (
i.e.
unobservable inputs).
|
|
December 31, 2017
|
December 31, 2018
|
||||||||||||||||
|
Level 1
|
Level 2
|
Level 1
|
Level 2
|
||||||||||||||
|
Assets:
|
|||||||||||||||||
|
Foreign currency forwards and swaps
|
$
|
—
|
|
$
|
12.9
|
|
$
|
—
|
|
$
|
2.1
|
|
|||||
|
Liabilities:
|
|||||||||||||||||
|
Interest rate swaps
|
$
|
—
|
|
$
|
—
|
|
$
|
—
|
|
$
|
(4.4
|
)
|
|||||
|
Foreign currency forwards and swaps
|
—
|
|
(2.6
|
)
|
—
|
|
(16.3
|
)
|
|||||||||
|
$
|
—
|
|
$
|
(2.6
|
)
|
$
|
—
|
|
$
|
(20.7
|
)
|
||||||
See note
19
for the input levels used to measure the fair value of our pension assets. See note 3 for the input levels used to measure the fair value of acquired assets.
Foreign currency forward and swap contracts are valued using an income approach, by comparing the current quoted market forward rates to our contract rates and discounting the values with appropriate market observable credit risk adjusted rates. We have not valued any of the financial instruments described in the table above using level 3 (unobservable) inputs. There were no transfers of fair value measurements between level 1 and level 2 of the fair value hierarchy in
2018
or
2017
.
F-
55
CELESTICA INC.
NOTES TO THE CONSOLIDATED FINANCIAL STATEMENTS
(in millions of U.S. dollars, except percentages and per share amounts)
Currency derivatives and hedging activities:
We enter into foreign exchange forward contracts to hedge our cash flow exposures and foreign currency swaps to hedge our balance sheet exposures. At
December 31, 2018
and
2017
, we had foreign exchange forwards and swaps to trade U.S. dollars in exchange for the following currencies:
|
As at December 31, 2018
Currency
|
Contract amount
of U.S. dollars |
Weighted average
exchange rate in U.S. dollars |
Maximum
period in months |
Fair value
gain/(loss) |
||||||
|
Canadian dollar
|
$
|
210.2
|
|
$
|
0.76
|
|
12
|
$
|
(10.3
|
)
|
|
Thai baht
|
81.1
|
|
0.03
|
|
12
|
(0.7
|
)
|
|||
|
Malaysian ringgit
|
53.4
|
|
0.24
|
|
12
|
(0.8
|
)
|
|||
|
Mexican peso
|
25.6
|
|
0.05
|
|
12
|
0.2
|
|
|||
|
British pound
|
5.3
|
|
1.27
|
|
4
|
—
|
|
|||
|
Chinese renminbi
|
66.8
|
|
0.15
|
|
12
|
(1.6
|
)
|
|||
|
Euro
|
35.8
|
|
1.17
|
|
12
|
0.3
|
|
|||
|
Romanian leu
|
40.4
|
|
0.25
|
|
12
|
(0.9
|
)
|
|||
|
Singapore dollar
|
22.1
|
|
0.74
|
|
12
|
(0.3
|
)
|
|||
|
Other
|
3.5
|
|
0.01
|
|
1
|
(0.1
|
)
|
|||
|
Total
|
$
|
544.2
|
|
$
|
(14.2
|
)
|
||||
|
As at December 31, 2017
Currency
|
Contract amount
of U.S. dollars |
Weighted average
exchange rate in U.S. dollars |
Maximum
period in months |
Fair value
gain/(loss) |
||||||
|
Canadian dollar
|
$
|
204.8
|
|
0.80
|
|
12
|
$
|
4.1
|
|
|
|
Thai baht
|
79.0
|
|
0.03
|
|
12
|
2.2
|
|
|||
|
Malaysian ringgit
|
48.4
|
|
0.23
|
|
12
|
2.6
|
|
|||
|
Mexican peso
|
29.3
|
|
0.05
|
|
12
|
(0.9
|
)
|
|||
|
British pound
|
56.4
|
|
1.34
|
|
3
|
(0.5
|
)
|
|||
|
Chinese renminbi
|
71.6
|
|
0.15
|
|
12
|
1.5
|
|
|||
|
Euro
|
28.7
|
|
1.19
|
|
12
|
0.1
|
|
|||
|
Romanian leu
|
28.4
|
|
0.25
|
|
12
|
0.6
|
|
|||
|
Singapore dollar
|
25.0
|
|
0.73
|
|
12
|
0.6
|
|
|||
|
Other
|
4.5
|
|
—
|
|
||||||
|
Total
|
$
|
576.1
|
|
$
|
10.3
|
|
||||
At
December 31, 2018
, the fair value of our outstanding contracts was a net unrealized loss of
$14.2
(
December 31, 2017
— net unrealized gain of
$10.3
). Changes in the fair value of hedging derivatives to which we apply cash flow hedge accounting, to the extent effective, are deferred in other comprehensive income (loss) until the expenses or items being hedged are recognized in our consolidated statement of operations. Any hedge ineffectiveness, which at
December 31, 2018
was not significant, is recognized immediately in our consolidated statement of operations. At
December 31, 2018
, we recorded
$2.1
of derivative assets in other current assets and
$16.3
of derivative liabilities in accrued and other current liabilities (
December 31, 2017
—
$12.9
of derivative assets in other current assets and
$2.6
of derivative liabilities in accrued and other current liabilities). The unrealized gains or losses are a result of fluctuations in foreign exchange rates between the contract execution and period-end date.
Certain forward contracts to trade U.S. dollars do not qualify as hedges, most significantly certain Canadian dollar contracts, and we have marked these contracts to market each period in our consolidated statement of operations.
|
22.
|
CAPITAL DISCLOSURES:
|
Our main objectives in managing our capital resources are to ensure liquidity and to have funds available for working capital or other investments we determine are required to grow our business. Our capital resources consist of cash provided by operating activities, access to the New Revolver, intraday and overnight bank overdraft facilities, an accounts receivable sales program, the SFP (while available) and our ability to issue debt or equity securities.
We regularly review our borrowing capacity and make adjustments, as permitted, for changes in economic conditions and changes in our requirements. In June 2018, we entered into our
$800.0
New Credit Facility, which provides for the
$350.0
June Term Loan that matures in June 2025, and the
$450.0
New Revolver that matures in June 2023. In November 2018, we utilized the accordion feature under our New Credit Facility to add the incremental
$250.0
November Term Loan, maturing in June 2025. The New Credit Facility has an accordion feature that allows us to increase the term loans and/or revolving loan commitments thereunder by approximately
$110
, plus an unlimited amount to the extent that a specified leverage ratio on a pro forma basis does not exceed specified limits, in each case on an uncommitted basis and subject to the satisfaction of certain terms and conditions. The New Revolver also includes a
$50.0
sub-limit for swing line loans, providing for short-term borrowings up to a maximum of
ten
business days, as well as a
$150.0
sub-limit for letters of credit, in each case subject to the overall revolving credit limit. See note
12
for amounts outstanding under the New Credit Facility at December 31, 2018. We had
$269.7
available as of
December 31, 2018
under the New Revolver for future borrowings. We also have access to
$132.8
in intraday and overnight bank overdraft facilities, and we may sell up to
$250.0
in accounts receivable, on an uncommitted basis, under an accounts receivable sales program, and/or utilize the uncommitted SFP, if available, to provide short-term liquidity. See note
5
. At
December 31, 2018
, we sold
$130.0
of our accounts receivable under our accounts receivable sales program and
$50.0
under the SFP. The timing and amounts we may borrow and repay under these facilities can vary significantly from month-to-month depending on our working capital and other cash requirements.
We have commenced NCIBs or SIBs in the past few years, pursuant to which we are permitted to or have repurchased and canceled subordinate voting shares. See note
13
for details. In addition, we have purchased subordinate voting shares from time-to-time in the open market through a broker for delivery under our stock-based compensation plans. We have not distributed, nor do we have any current plan to distribute, any dividends to our shareholders.
Our strategy on capital risk management has not changed significantly since the end of
2017
. Other than the restrictive and financial covenants associated with the New Credit Facility described in note 12, we are not subject to any contractual or regulatory capital requirements. While some of our international operations are subject to government restrictions on the flow of capital into and out of their jurisdictions, these restrictions have not had a material impact on our operations or cash flows.
|
23
.
|
WEIGHTED AVERAGE NUMBER OF SHARES DILUTED (in millions):
|
|
2016
|
2017
|
2018
|
||||||
|
Weighted average number of shares (basic)
|
141.8
|
|
143.1
|
|
139.4
|
|
||
|
Dilutive effect of outstanding awards under stock-based compensation plans
|
2.1
|
|
2.1
|
|
1.2
|
|
||
|
Weighted average number of shares (diluted)
|
143.9
|
|
145.2
|
|
140.6
|
|
||
For the year ended
December 31, 2018
, we excluded
0.3 million
of stock options (year ended
December 31, 2017
—
0.2 million
; year ended
December 31, 2016
—
0.3 million
) from the diluted weighted average per share calculation as they were out-of-the-money.
References to shares in this note
23
are to our subordinate voting shares and our multiple voting shares taken collectively.
F-
56
CELESTICA INC.
NOTES TO THE CONSOLIDATED FINANCIAL STATEMENTS
(in millions of U.S. dollars, except percentages and per share amounts)
24
. COMMITMENTS, CONTINGENCIES AND GUARANTEES:
At
December 31, 2018
, we have commitments that require future minimum payments as follows:
|
Finance
Leases |
Operating
Leases |
Other
|
|||||||||||||
|
2019
|
$
|
3.8
|
|
$
|
31.5
|
|
$
|
19.7
|
|
||||||
|
2020
|
3.3
|
|
23.7
|
|
19.7
|
|
|||||||||
|
2021
|
2.8
|
|
14.5
|
|
16.5
|
|
|||||||||
|
2022
|
1.4
|
|
9.5
|
|
13.7
|
|
|||||||||
|
2023
|
0.4
|
|
6.6
|
|
13.5
|
|
|||||||||
|
Thereafter
|
—
|
|
21.6
|
|
37.7
|
|
|||||||||
|
Total future minimum payments
|
11.7
|
|
$
|
107.4
|
|
$
|
120.8
|
|
|||||||
|
Less: amount representing interest for finance leases
|
(1.3
|
)
|
|||||||||||||
|
Present value of future minimum finance lease payments (note 12)
|
10.4
|
|
|||||||||||||
|
Less: current portion of finance lease obligations
|
(3.2
|
)
|
|||||||||||||
|
Long-term portion of finance lease obligations
|
$
|
7.2
|
|
||||||||||||
Our operating lease commitments primarily relate to premises. Our finance lease commitments relate to equipment. See note 2 for a description of IFRS 16, which brings most leases on-balance sheet for lessees under a single model, eliminating the distinction between operating and finance leases, which became effective January 1, 2019. Other commitments represent obligations under IT support agreements, including a new
10
-year agreement that we signed with one of our IT service providers in December 2018.
As at
December 31, 2018
, we had committed
$33.6
for capital expenditures, principally for machinery and equipment to support new customer programs.
We have contingent liabilities in the form of letters of credit, letters of guarantee and surety bonds (collectively, Guarantees) which we have provided to various third parties. The foregoing Guarantees cover various payments, including customs and excise taxes, utility commitments and certain bank guarantees. At
December 31, 2018
, we had
$35.7
of Guarantees (
December 31, 2017
—
$36.8
), including
$21.3
(
December 31, 2017
—
$23.2
) of letters of credit outstanding under our applicable revolving facility.
We are required to make contributions under our pension and non-pension post-employment benefit plans (see note
19
), and quarterly mandatory principal repayments under the New Term Loans (see note
12
). See note
21
for our obligations under the foreign exchange contracts we held at
December 31, 2018
. We are also required to make interest payments on amounts outstanding under the New Credit Facility and under our interest rate swap agreements, the amounts under the swap to be determined based on market rates at the time the interest payments are due (see notes 12 and 21).
In addition to the Guarantees, we provide routine indemnifications, the terms of which range in duration and often are not explicitly defined. These may include indemnifications against third-party intellectual property infringement claims and certain third-party negligence claims for property damage. We have also provided indemnifications in connection with the sale of certain businesses and real property. The maximum potential liability from these indemnifications cannot be reasonably estimated. In some cases, we have recourse against other parties to mitigate our risk of loss from these indemnifications. Historically, we have not made significant payments relating to these types of indemnifications.
Litigation:
In the normal course of our operations, we may be subject to lawsuits, investigations and other claims, including environmental, labor, product, customer disputes and other matters. Management believes that adequate provisions have been recorded where required. Although it is not always possible to estimate the extent of potential costs, if any, management believes
F-
57
CELESTICA INC.
NOTES TO THE CONSOLIDATED FINANCIAL STATEMENTS
(in millions of U.S. dollars, except percentages and per share amounts)
that the ultimate resolution of all such pending matters will not have a material adverse impact on our financial performance, financial position or liquidity.
Income taxes:
We are subject to tax audits of historical information by tax authorities in various jurisdictions, which could result in additional tax expense in future periods relating to prior results. Reviews by tax authorities generally focus on, but are not limited to, the validity of our inter-company transactions, including financing and transfer pricing policies which generally involve subjective areas of taxation and a significant degree of judgment. If any of these tax authorities are successful with their challenges, our income tax expense may be adversely affected and we could also be subject to interest and penalty charges.
The successful pursuit of assertions made by any taxing authority could result in our owing significant amounts of tax, interest and possibly penalties. We believe we adequately accrue for any probable potential adverse tax ruling. However, there can be no assurance as to the final resolution of any claims and any resulting proceedings. If any claims and any ensuing proceedings are determined adversely to us, the amounts we may be required to pay could be material, and could be in excess of amounts accrued.
Other matters:
In 2017, the Brazilian Ministry of Science, Technology, Innovation and Communications (MCTIC) issued assessments seeking to disqualify certain amounts of research and development (R&D) expenses for the years 2006 to 2009, which entitled our Brazilian subsidiary (which ceased operations in 2009) to charge reduced sales tax levies to its customers. The assessments against our Brazilian subsidiary (including interest and penalties) total approximately
39 million
Brazilian real (approximately
$10
at year-end exchange rates) for such years. Although we cannot predict the outcome of this matter, we believe that our R&D activities for the period are supportable, and it is probable that our position will be sustained upon full examination by the appropriate Brazilian authorities and, if necessary, upon consideration by the Brazilian judicial courts. Our position is supported by our Brazilian legal advisers.
|
25.
|
SEGMENT AND GEOGRAPHIC INFORMATION:
|
Operating segments are defined as components of an enterprise that engage in business activities from which they may earn revenue and incur expenses; for which discrete financial information is available; and whose operating results are regularly reviewed by the chief operating decision maker in deciding how to allocate resources and to assess performance. No operating segments have been aggregated to determine our reportable segments.
During the first quarter of 2018, we completed a reorganization of our reporting structure, including our sales, operations and management systems, into
two
operating and reportable segments: ATS and CCS. Prior to this reorganization, we operated in one reportable segment (Electronic Manufacturing Services), which was comprised of multiple end markets (ATS, Communications and Enterprise during 2017). The change in operating and reportable segments was a result of modifications to our organizational and internal management structure which were initiated in 2017 to streamline business operations and improve profitability and competitiveness, and were completed in early 2018. As a result of these modifications, and commencing in the first quarter of 2018, our Chief Executive Officer (CEO), who is our chief operating decision maker, reviews segment revenue, segment income and segment margin (described below) to assess performance and make decisions about resource allocation. Our prior period financial information has been reclassified to reflect the reorganized segment structure and to conform to the current presentation. The foregoing changes had no impact on our historical consolidated financial position, results of operations or cash flows as previously reported.
Factors considered in determining the
two
reportable segments included the nature of applicable business activities, management structure, market strategy and margin profiles. Our ATS segment consists of our ATS end market, and is comprised of our aerospace and defense, industrial, smart energy, healthtech, and capital equipment (including semiconductor, display, and power & signal distribution equipment) businesses. Products and services in this segment are extensive and are often more regulated than in our CCS segment, and can include the following: government-certified and highly-specialized manufacturing, electronic and enclosure-related services for aerospace and defense-related customers; high-precision equipment and integrated subsystems used in the manufacture of semiconductors and displays; a wide range of industrial automation, controls, test and
F-
58
CELESTICA INC.
NOTES TO THE CONSOLIDATED FINANCIAL STATEMENTS
(in millions of U.S. dollars, except percentages and per share amounts)
measurement devices; advanced solutions for surgical instruments, diagnostic imaging and patient monitoring; and efficiency products to help manage and monitor the energy and power industries. Our ATS segment businesses typically have a higher margin profile and longer product life cycles than the businesses in our CCS segment. Our CCS segment consists of our Communications and Enterprise end markets, and is comprised of our enterprise communications, telecommunications, servers and storage businesses. Products and services in this segment consist predominantly of enterprise-level data communications and information processing infrastructure products, and can include routers, switches, servers and storage-related products used by a wide range of businesses and cloud-based service providers to manage digital connectivity, commerce and social media applications. Our CCS segment businesses typically have a lower margin profile and higher volumes than the businesses in our ATS segment, and have been impacted in recent periods (and continue to be impacted) by aggressive pricing, rapid shifts in technology, model obsolescence and the commoditization of certain products.
Segment performance is evaluated based on segment revenue, segment income and segment margin (segment income as a percentage of segment revenue). Revenue is attributed to the segment in which the product is manufactured or the service is performed. Segment income is defined as a segment’s net revenue less its cost of sales and its allocable portion of selling, general and administrative expenses and research and development expenses (collectively, Segment Costs). Identifiable Segment Costs are allocated directly to the applicable segment while other Segment Costs, including indirect costs and certain corporate charges, are allocated to our segments based on an analysis of the relative usage or benefit derived by each segment from such costs. Segment income excludes finance costs (net of refund interest), employee stock-based compensation expense, amortization of intangible assets (excluding computer software), net restructuring, impairment and other charges (recoveries), other solar charges, and recognized fair value adjustments for inventory acquired in connection with acquisitions (see note 3), as these costs and charges are managed and reviewed by the CEO at the company level. Net restructuring, impairment and other charges (recoveries) include, in applicable periods, restructuring charges (recoveries), impairment charges (recoveries), Acquisition Costs, legal settlements (recoveries), Toronto transition costs (recoveries), and the accelerated amortization of unamortized deferred financing costs. Our segments do not record inter-segment revenue. Although segment income and segment margin are used to evaluate the performance of our segments, we may incur operating costs in one segment that may also benefit the other segment. Our accounting policies for segment reporting are the same as those applied to the company as a whole.
Our revenue fluctuates from period-to-period depending on numerous factors, including but not limited to: the mix and complexity of the products or services we provide, the extent, timing and rate of new program wins, and the execution of our programs and services, follow-on business, program completions or losses, the phasing in or out of programs, the success in the marketplace of our customers’ products, changes in customer demand, and the seasonality of our business. We expect that the pace of technological change, the frequency of customers transferring business among EMS competitors, the level of outsourcing by customers (including decisions to insource), and the dynamics of the global economy will also continue to impact our business from period-to-period.
Information regarding each reportable segment for the periods indicated is set forth below:
|
Revenue by segment:
|
Year ended December 31
|
||||||||||||||||
|
2016
|
2017
|
2018
|
|||||||||||||||
|
% of total
|
% of total
|
% of total
|
|||||||||||||||
|
ATS
|
$
|
1,954.2
|
|
32
|
%
|
$
|
1,958.6
|
|
32
|
%
|
$
|
2,209.7
|
|
33
|
%
|
||
|
CCS
|
4,092.4
|
|
68
|
%
|
4,184.1
|
|
68
|
%
|
4,423.5
|
|
67
|
%
|
|||||
|
Total
|
$
|
6,046.6
|
|
$
|
6,142.7
|
|
$
|
6,633.2
|
|
||||||||
F-
59
CELESTICA INC.
NOTES TO THE CONSOLIDATED FINANCIAL STATEMENTS
(in millions of U.S. dollars, except percentages and per share amounts)
|
Segment income, segment margin, and reconciliation of segment income to IFRS earnings before income taxes:
|
Year ended December 31
|
||||||||||||||||
|
2016
|
2017
|
2018
|
|||||||||||||||
|
Segment Margin
|
Segment Margin
|
Segment Margin
|
|||||||||||||||
|
ATS segment income and margin
|
$
|
73.9
|
|
3.8
|
%
|
$
|
96.8
|
|
4.9
|
%
|
$
|
102.5
|
|
4.6
|
%
|
||
|
CCS segment income and margin
|
149.3
|
|
3.6
|
%
|
120.4
|
|
2.9
|
%
|
111.4
|
|
2.5
|
%
|
|||||
|
Total segment income
|
223.2
|
|
217.2
|
|
213.9
|
|
|||||||||||
|
Reconciling items:
|
|||||||||||||||||
|
Finance costs, net of refund interest
|
(4.3
|
)
|
10.1
|
|
24.4
|
|
|||||||||||
|
Employee stock-based compensation expense
|
33.0
|
|
30.1
|
|
33.4
|
|
|||||||||||
|
Amortization of intangible assets (excluding computer software)
|
6.0
|
|
5.5
|
|
11.6
|
|
|||||||||||
|
Net restructuring, impairment and other charges (note 16)
|
25.5
|
|
37.0
|
|
61.0
|
|
|||||||||||
|
Inventory fair value adjustment (note 3)
|
—
|
|
—
|
|
1.6
|
|
|||||||||||
|
Other solar charges (inventory and A/R write-down)
|
—
|
|
1.4
|
|
—
|
|
|||||||||||
|
IFRS earnings before income taxes
|
$
|
163.0
|
|
$
|
133.1
|
|
$
|
81.9
|
|
||||||||
The following table details our external revenue allocated by manufacturing location among countries that generated in excess of 10% of total revenue for the years indicated:
|
Year ended December 31
|
||||||||
|
2016
|
2017
|
2018
|
||||||
|
Thailand
|
36
|
%
|
34
|
%
|
32
|
%
|
||
|
China
|
21
|
%
|
21
|
%
|
20
|
%
|
||
|
Malaysia
|
13
|
%
|
12
|
%
|
12
|
%
|
||
The following table details our allocation of property, plant and equipment among countries that exceeded 10% of total property, plant and equipment for the years indicated:
|
December 31
|
|||||
|
2017
|
2018
|
||||
|
China
|
23
|
%
|
19
|
%
|
|
|
Thailand
|
19
|
%
|
16
|
%
|
|
|
Malaysia
|
16
|
%
|
13
|
%
|
|
|
Romania
|
16
|
%
|
15
|
%
|
|
|
United States
|
*
|
|
15
|
%
|
|
|
Canada
|
*
|
|
*
|
|
|
* Less than 10%.
F-
60
CELESTICA INC.
NOTES TO THE CONSOLIDATED FINANCIAL STATEMENTS
(in millions of U.S. dollars, except percentages and per share amounts)
The following table details our allocation of intangible assets and goodwill among countries that exceeded 10% of total intangible assets and goodwill for the years indicated:
|
December 31
|
|||||
|
2017
|
2018
|
||||
|
United States
|
53
|
%
|
96
|
%
|
|
|
Malaysia
|
18
|
%
|
*
|
|
|
|
Canada
|
18
|
%
|
*
|
|
|
* Less than 10%.
For purposes of the foregoing table, intangible assets and goodwill acquired as part of our Atrenne and Impakt acquisitions have been allocated to the United States in 2018, however, the Impakt intangible assets and goodwill allocation will be adjusted when the final valuation is completed in the first half of 2019.
Customers:
We had
two
customers that individually represented more than 10% of total revenue in
2018
. Cisco Systems accounted for
14%
of total revenue in
2018
(
2017
—
18%
; 2016 —
19%
) and Dell Technologies accounted for
10%
of total revenue in
2018
(
2017
and 2016 — less than 10%). At
December 31, 2018
, we had
two
customers that individually represented more than 10% of total accounts receivable. These customers are all in our CCS segment.
We had
two
customers (from our CCS segment) that individually represented more than 10% of total revenue in
2017
. In aggregate, those customers comprised
31%
of total revenue. At
December 31, 2017
, we had
two
customers (one from each of our segments) that individually represented more than 10% of total accounts receivable.
We had
two
customers (from our CCS segment) that individually represented more than 10% of total revenue in
2016
. In aggregate, those customers comprised
30%
of total revenue. At
December 31, 2016
, we had
two
customers (one from each of our segments) that individually represented more than 10% of total accounts receivable.
F-
61
TABLE OF CONTENTS
Part IItem 1. Identity Of Directors, Senior Management and AdvisersItem 2. Offer Statistics and Expected TimetableItem 3. Key InformationItem 4. Information on The CompanyItem 4A. Unresolved Staff CommentsItem 5. Operating and Financial Review and ProspectsItem 6. Directors, Senior Management and EmployeesItem 7. Major Shareholders and Related Party TransactionsItem 8. Financial InformationItem 9. The Offer and ListingItem 10. Additional InformationItem 11. Quantitative and Qualitative Disclosures About Market RiskItem 12. Description Of Securities Other Than Equity SecuritiesPart IIItem 13. Defaults, Dividend Arrearages and DelinquenciesItem 14. Material Modifications To The Rights Of Security Holders and Use Of ProceedsItem 15. Controls and ProceduresItem 16. [reserved]Item 16A. Audit Committee Financial ExpertItem 16B. Code Of EthicsItem 16C. Principal Accountant Fees and ServicesItem 16D. Exemptions From The Listing Standards For Audit CommitteesItem 16E. Purchases Of Equity Securities By The Issuer and Affiliated PurchasersItem 16F. Change in Registrant's Certifying AccountantItem 16G. Corporate GovernanceItem 16H. Mine Safety DisclosurePart IIIItem 17. Financial StatementsItem 18. Financial StatementsItem 19. Exhibits