COMMERCIAL METALS CO
10-Ks and 10-Qs
|
|
|
|
|
|
|
|
|
|
|
|
|
|
|
|
|
|
|
|
|
|
|
|
|
|
|
|
|
|
|
|
|
|
|
|
|
|
|
|
|
|
|
|
|
|
|
|
|
|
|
|
|
UNITED STATES SECURITIES AND EXCHANGE COMMISSION
Washington, D.C. 20549
Form 10-K
|
(Mark One)
|
|
|
|
þ
|
|
ANNUAL REPORT PURSUANT TO SECTION 13 OR 15(d) OF THE SECURITIES EXCHANGE ACT OF 1934
|
|
|
|
For the fiscal year ended August 31, 2017
|
|
or
|
||
|
o
|
|
TRANSITION REPORT PURSUANT TO SECTION 13 OR 15(d) OF THE SECURITIES EXCHANGE ACT OF 1934
|
|
|
|
For the transition period from to
|
Commission file number 1-4304
Commercial Metals Company
(Exact name of registrant as specified in its charter)
|
Delaware
|
|
75-0725338
|
|
(State or other jurisdiction of
incorporation or organization)
|
|
(I.R.S. Employer
Identification No.)
|
|
|
|
|
|
6565 North MacArthur Blvd,
Irving, TX
(Address of principal executive offices)
|
|
75039
(Zip Code)
|
Registrant's telephone number, including area code: (214) 689-4300
Securities registered pursuant to Section 12(b) of the Act:
|
Title of Each Class
|
|
Name of Each Exchange on Which Registered
|
|
Common Stock, $0.01 par value
|
|
New York Stock Exchange
|
Securities registered pursuant to Section 12(g) of the Act: None
Indicate by check mark if the registrant is a well-known seasoned issuer, as defined in Rule 405 of the Securities Act. Yes
þ
No
o
Indicate by check mark if the registrant is not required to file reports pursuant to Section 13 or Section 15(d) of the Act. Yes
o
No
þ
Indicate by check mark whether the registrant (1) has filed all reports required to be filed by Section 13 or 15(d) of the Securities Exchange Act of 1934 during the preceding 12 months (or for such shorter period that the registrant was required to file such reports), and (2) has been subject to such filing requirements for the past 90 days. Yes
þ
No
o
Indicate by check mark whether the registrant has submitted electronically and posted on its corporate Web site, if any, every Interactive Data File required to be submitted and posted pursuant to Rule 405 of Regulation S-T (§ 232.405 of this chapter) during the preceding 12 months (or for such shorter period that the registrant was required to submit and post such files). Yes
þ
No
o
Indicate by check mark if disclosure of delinquent filers pursuant to Item 405 of Regulation S-K (§ 229.405) is not contained herein, and will not be contained, to the best of registrant's knowledge, in definitive proxy or information statements incorporated by reference in Part III of this Form 10-K or any amendment to this Form 10-K.
þ
Indicate by check mark whether the registrant is a large accelerated filer, an accelerated filer, a non-accelerated filer, smaller reporting company, or an emerging growth company. See the definitions of "large accelerated filer," "accelerated filer," "smaller reporting company," and "emerging growth company" in Rule 12b-2 of the Exchange Act.
|
Large accelerated filer
þ
|
Accelerated filer
o
|
|
|
Non-accelerated filer
o
|
(Do not check if a smaller reporting company)
|
Smaller reporting company
o
|
|
Emerging growth company
o
|
||
If an emerging growth company, indicate by check mark if the registrant has elected not to use the extended transition period for complying with any new or revised financial accounting standards provided pursuant to Section 13(a) of the Exchange Act
o
Indicate by check mark whether the registrant is a shell company (as defined in Rule 12b-2 of the Act). Yes
o
No
þ
The aggregate market value of the common stock on
February 28, 2017
, held by non-affiliates of the registrant, based on the closing price per share on February 28, 2017, on the New York Stock Exchange was approximately
$2,420,166,134
.
As of
October 24, 2017
,
115,840,033
shares of the registrant's common stock, par value $0.01 per share, were outstanding.
DOCUMENTS INCORPORATED BY REFERENCE:
Portions of the following document are incorporated by reference into the listed Part of Form 10-K:
Registrant's definitive proxy statement for the
2018
annual meeting of stockholders — Part III
1
COMMERCIAL METALS COMPANY AND SUBSIDIARIES
TABLE OF CONTENTS
|
|
|
|
|
|
|
|
|
|
Item 7: Management's Discussion and Analysis of Financial Condition and Results of Operations
|
|
|
|
|
|
|
|
|
|
|
|
|
|
2
DISCLOSURE REGARDING FORWARD-LOOKING STATEMENTS
This Annual Report on Form 10-K contains forward-looking statements within the meaning of Section 27A of the Securities Act of 1933, as amended (the "Securities Act"), and Section 21E of the Securities Exchange Act of 1934, as amended (the "Exchange Act"). Actual results, performance or achievements could differ materially from those projected in the forward-looking statements as a result of a number of risks, uncertainties, and other factors. For a discussion of important factors that could cause our results, performance, or achievements to differ materially from any future results, performance, or achievements expressed or implied by our forward-looking statements, please refer to Part I, Item 1A "Risk Factors" and Part II, Item 7 "Management's Discussion and Analysis of Financial Condition and Results of Operations" in this Annual Report on Form 10-K.
GENERAL
Commercial Metals Company ("CMC") together with its consolidated subsidiaries (collectively, the "Company," "we," "our" or "us") manufacture, recycle and market steel and metal products, related materials and services through a network including four electric arc furnace ("EAF") mini mills, an EAF micro mill, a rerolling mill, steel fabrication and processing plants, construction-related product warehouses, metal recycling facilities and marketing and distribution offices in the United States ("U.S.") and in strategic international markets.
We were incorporated in 1946 in the State of Delaware. Our predecessor company, a metals recycling business, has existed since approximately 1915. We maintain our corporate office at 6565 North MacArthur Boulevard in Irving, Texas, 75039, telephone number (214) 689-4300. Our fiscal year ends August 31, and any reference in this Annual Report on Form 10-K to any year refers to the fiscal year ended August 31 of that year unless otherwise noted.
Our Annual Report on Form 10-K, Quarterly Reports on Form 10-Q, Current Reports on Form 8-K and all amendments to these reports are made available free of charge through the Investor Relations section of our website, http://www.cmc.com, as soon as reasonably practicable after such material is electronically filed with, or furnished to, the Securities and Exchange Commission ("SEC"). The information contained on our website or available by hyperlink from our website is not incorporated into this Annual Report on Form 10-K or other documents we file with, or furnish to, the SEC.
We have five business segments operating across two geographic divisions. Our CMC Americas Division includes three segments: Americas Recycling, Americas Mills and Americas Fabrication. Our CMC International Division includes two segments: International Mill and International Marketing and Distribution. Financial information for the last three fiscal years concerning our five business segments and the geographic areas of our operations is incorporated herein by reference from Note 21, Business Segments, to the consolidated financial statements, which are contained in Part II, Item 8 of this Annual Report on Form 10-K.
CMC AMERICAS DIVISION OPERATIONS
AMERICAS RECYCLING
Our Americas Recycling segment processes scrap metals for use as a raw material by manufacturers of new metal products. This segment operates
33
scrap metal processing facilities with
13
locations in
Texas
,
five
locations each in
Florida
and
South Carolina
,
two
locations in each of
Georgia
,
Missouri
and
North Carolina
and one location in each of
Kansas
,
Louisiana
,
Oklahoma
and
Tennessee
.
We purchase ferrous and nonferrous metals, processed and unprocessed, from a variety of sources in a variety of forms for our scrap metal processing facilities. Sources of metal for processing include manufacturing and industrial plants, metal fabrication plants, electric utilities, machine shops, factories, railroads, refineries, shipyards, ordinance depots, demolition businesses, automobile salvage firms, wrecking firms, small scrap metal collection firms and retail individuals.
Our scrap metal processing facilities typically consist of an office and a warehouse building located on several acres of land that we use for receiving, sorting, processing and storing metals. Our warehouse buildings are equipped with specialized equipment for processing both ferrous and nonferrous metal and one of our facilities has extensive equipment that segregates metallic content from large quantities of insulated wire. Several of our scrap metal processing facilities use a small portion of their site or a nearby
3
location to display and sell metal products that may be reused for their original purpose without further processing. We equip our larger scrap metal processing facilities with various equipment, such as scales, shears, baling presses, briquetting machines, conveyors, magnetic separators, presses, shredders, and hydraulic shears, which enable these facilities to efficiently process large volumes of scrap metals. We use cranes to handle scrap metals for processing and to load material for shipment. We primarily transport processed ferrous metal to consumers by open gondola railcar; therefore, many of our metal processing facilities have rail access. Additionally, we utilize a fleet of trucks that we own or lease as well as private haulers to transport processed ferrous metal to our customers and our mills.
Americas Recycling operates
five
large shredding machines,
two
in
Texas
,
one
in
Florida
,
one
in
Oklahoma
, and
one
in
South Carolina
capable of pulverizing obsolete automobiles or other sources of scrap metal. We have three additional shredders, two operated by our Americas Mills segment and one operated by our International Mill segment. With the exception of precious metals, our scrap metal processing facilities recycle and process practically all types of metal.
We sell scrap metals to steel mills and foundries, aluminum sheet and ingot manufacturers, brass and bronze ingot makers, copper refineries and mills, secondary lead smelters, specialty steel mills, high temperature alloy manufacturers and other consumers. Ferrous metal is the primary raw material for EAFs, such as those operated by our Americas Mills segment and other steel mills. Some mini mills periodically supplement purchases of ferrous metal with direct reduced iron and pig iron for certain product lines. Our Irving, Texas office coordinates the sale of substantially all scrap metals from our metal processing facilities to our customers. We negotiate export sales through our global network of offices as well as through our Irving, Texas office.
One customer represented approximately 11% of our Americas Recycling segment's net sales in fiscal
2017
, while no customers represented 10% or more of this segment's net sales in fiscal
2016
. One customer represented approximately 12% of our Americas Recycling segment's net sales in fiscal
2015
. Our recycling business competes with other scrap metal processors and primary nonferrous metal producers, both in the U.S. and internationally, for sales of nonferrous materials. Consumers of nonferrous metals frequently utilize primary or "virgin" ingot processed by mining companies instead of nonferrous metals. The prices of nonferrous metals are closely related to, but generally are less than, the prices of primary or "virgin" ingot.
AMERICAS MILLS
Our Americas Mills segment includes our
three
domestic EAF mini mills, one EAF micro mill, a rerolling mill,
two
scrap metal shredders,
nine
scrap metal processing facilities that directly support the steel mini mills, and a railroad salvage operation.
Our three EAF mini mills, located in Alabama, South Carolina and Texas, our EAF micro mill in Arizona, and our rerolling mill located in Arkansas, produce one or more of steel reinforcing bar ("rebar"), angles, flats, rounds, channels, fence post sections and other shapes. We utilize a fleet of trucks that we own or lease as well as private haulers and railcar to transport finished products from the mills to our customers and to our steel fabrication facilities. To minimize the cost of our products, to the extent feasibly consistent with market conditions and working capital demands, we prefer to operate all of our mills at or near full capacity. Market conditions such as increases in quantities of competing imported steel, production rates at U.S. competitors, customer inventory levels or a decrease in non-residential construction activity may reduce demand for our products and limit our ability to operate the mills at full capacity. Through our operations and capital improvements, we strive to increase productivity and capacity at the mills and to enhance our product mix. Because the steel mill business is capital intensive, we make substantial capital expenditures on a regular basis to remain competitive with other low cost producers. Over the past three fiscal years, we have spent approximately $350.3 million, or 71%, of our total capital expenditures on projects within our Americas Mills segment.
The following table compares the amount of steel melted, rolled and shipped by our five steel mills in the past three fiscal years.
|
Short tons (in thousands)
|
2017
|
2016
|
2015
|
||||||
|
Melted
|
2,603
|
|
2,522
|
|
2,553
|
|
|||
|
Rolled
|
2,476
|
|
2,382
|
|
2,387
|
|
|||
|
Shipped
|
2,725
|
|
2,630
|
|
2,687
|
|
|||
Descriptions of mill capacity, particularly rolling capacity, are highly dependent on the specific product mix manufactured. Our mills roll many different types and sizes of products in their range depending on market conditions including pricing and demand. Our estimated annual capacity for finished goods of approximately 3.0 million short tons assumes a typical product mix and will vary with the products we produce.
4
Our Alabama, South Carolina and Texas EAF mini mills each consist of:
|
•
|
a melt shop with an electric arc furnace;
|
|
•
|
continuous casting equipment that shapes molten metal into billets;
|
|
•
|
a reheating furnace that prepares billets for rolling;
|
|
•
|
a rolling mill that forms products from heated billets;
|
|
•
|
a mechanical cooling bed that receives hot products from the rolling mill;
|
|
•
|
finishing facilities that cut, straighten, bundle and prepare products for shipping; and
|
|
•
|
supporting facilities such as maintenance, warehouse and office areas.
|
Our Alabama mini mill primarily manufactures products that are larger in size relative to products manufactured by our other steel mini mills. These larger size products include mid-size structural steel products such as equal and unequal leg angles, channels and flats. This mini mill does not produce rebar. Our Alabama mini mill sells primarily to service centers and original equipment manufacturers; however, it also sells to customers in the construction, manufacturing and fabricating industries. Our Alabama mini mill primarily ships its products to customers located in the Southeast, Midwest and Northeast regions of the U.S.
Our South Carolina mini mill manufactures a full line of bar-sized products, including rebar, angles, channels, flats, rounds, squares, and fence post sections. Our South Carolina mini mill sells primarily to customers in the rebar fabrication industry; however, it also sells to service centers, manufacturers of original equipment, and the agricultural industry. Our South Carolina mini mill ships products to customers primarily located in the Southeast and mid-Atlantic regions of the U.S., which include the states from Florida through southern New England. In addition to the mini mill, we operate a recycling yard, a steel fence post plant, and an alloy briquetting facility located on or near the same site.
Our Texas mini mill manufactures a full line of bar-sized products, including rebar, angles, rounds, channels, flats, and other sections used primarily in building highways, reinforcing concrete structures and manufacturing. This mini mill sells primarily to the construction, energy and petrochemical industries; however, it also sells to service centers and manufacturers of original equipment. Our Texas mini mill primarily ships its products to customers located in Louisiana, Oklahoma and Texas. In addition to the mini mill, we operate a rebar fabrication facility, a shredder and downstream sorting equipment located on the same site.
Our micro mill in Arizona utilizes unique continuous process technology where metal flows uninterrupted from melting to casting to rolling. It is more compact than existing, larger capacity steel mini mills, and production is dedicated to a limited product range. This micro mill primarily produces rebar; however, it also manufactures fence post sections and other merchant sections. Our Arizona micro mill sells primarily to customers in the construction and fabricating industries, although it also sells to service centers. Our Arizona micro mill ships its products to customers located in the Southwest region of the U.S., primarily Arizona and California, as well as Colorado, Nevada and New Mexico. We also operate a rebar fabrication facility located on the same site as the micro mill.
The primary raw material that our Alabama, Arizona, South Carolina and Texas mills use is ferrous scrap metal. This segment operates
nine
metal processing facilities that directly support the mills:
three
in
South Carolina
,
four
in
Texas
, and
two
in
Alabama
. This segment also includes
two
shredders. We believe the supply of ferrous metal is adequate to meet our future needs, but it has historically been subject to significant price fluctuations which have occurred more rapidly over the last several years. All four of these mills consume large amounts of electricity and natural gas. We have not had any significant curtailments, and we believe that energy supplies are adequate. The supply and demand of regional and national energy and the extent of applicable regulatory oversight of rates charged by providers affect the prices we pay for electricity and natural gas.
Our smaller Arkansas rerolling mill does not have a melt shop or continuous casting equipment. The Arkansas rerolling mill manufacturing process begins with a reheating furnace capable of utilizing billets acquired either from our other mills or from unrelated suppliers or used rail, primarily salvaged from railroad abandonments. The remainder of the manufacturing process utilizes a rolling mill, cooling bed, finishing equipment and support facilities similar to, but on a smaller scale than, those at our other mills. The Arkansas rerolling mill primarily manufactures bed frame angles, earth bar, and other specialty flat, angle and square shapes. Our Arkansas rerolling mill primarily sells to customers in the construction and manufacturing industries. Since our Arkansas rerolling mill does not have melting facilities, the rerolling mill depends on an adequate supply of competitively priced billets or used rail. The availability of billets is impacted by both the level of excess billet production by our mills as well as the supply offered for sale by other steel producers. The supply of rail is dependent on several factors, including the pace of railroad abandonments, rail replacement by railroads, and demand for used rail from competing domestic and foreign rail rerolling mills.
One customer represented approximately 10%, 11% and 10% of our Americas Mills segment's net sales in fiscal
2017
,
2016
and 2015, respectively. Due to the nature of certain stock products we sell in the Americas Mills segment, we do not have a long lead
5
time between receipt of an order and the delivery of product. We generally fill orders for stock products from inventory or with products near completion. As a result, we do not believe that backlog, defined as the total value of unfulfilled orders, is a significant factor in the evaluation of these operations. Backlog for these mills at
August 31, 2017
was approximately $224.4 million, compared to $222.9 million at
August 31, 2016
.
In the fourth quarter of fiscal 2015, we announced a plan to build a new EAF micro mill in Durant, Oklahoma. This new micro mill will mirror the continuous process technology of the existing micro mill in Arizona. We believe that this addition to our portfolio of highly efficient, customer focused and cost effective steel production facilities should allow us to better serve a growing North Texas market and increase our presence in adjacent markets. At this facility, we plan to produce low cost, high quality steel products, which we expect will complement our existing manufacturing capability to better serve our customers. We believe that this new micro mill will also complement our existing mill, recycling and fabrication footprint, enhancing our ability to further leverage our raw material supply chain and optimize product mix within our existing operations. We expect the Oklahoma micro mill to be commissioned in the second quarter of fiscal 2018. The direct and indirect investment is expected to be in excess of approximately $250 million. This investment has been, and is expected to continue to be, funded primarily from internally generated capital.
AMERICAS FABRICATION
Our Americas Fabrication segment consists of our steel fabrication facilities that bend, weld, cut and fabricate steel, primarily rebar, and produce steel fence posts; warehouses that sell or rent products for the installation of concrete; and facilities that heat-treat steel to strengthen and provide flexibility.
Steel Fabrication
Through our Americas Fabrication segment we operate
46
facilities engaged in the various aspects of steel fabrication. Most of the facilities engage in general fabrication of reinforcing and structural steel, with three facilities fabricating only steel fence posts. We obtain steel for these facilities from our own mills and directly from third-party steel vendors. In addition, we utilize our marketing and distribution business to purchase steel from other steel manufacturers.
We conduct steel fabrication activities in
18
locations in
Texas
,
six
locations in
South Carolina
,
three
locations in
California
,
two
locations in each of
Colorado
,
Florida
,
Georgia
,
Illinois
and
Louisiana
, and one location in each of
Arizona
,
Hawaii
,
Missouri
,
New Mexico
,
Nevada
,
North Carolina
,
Tennessee
,
Virginia
and
Utah
.
Fabricated steel products are used primarily in the construction of commercial and non-commercial buildings, hospitals, convention centers, industrial plants, power plants, highways, bridges, arenas, stadiums, and dams. Generally, we sell fabricated steel in response to a bid solicitation from a construction contractor or from a project owner. Typically, the contractor or the owner of the project awards the job based on the competitive prices of the bids and does not negotiate with the bidders individually.
Backlog in our steel fabrication operations was approximately $627.8 million at
August 31, 2017
, compared to $658.1 million at
August 31, 2016
. We do not consider other backlogs in the Americas Fabrication segment to be material.
Construction Services
Our Construction Services business unit sells and rents construction-related products and equipment to concrete installers and other businesses in the construction industry. We have
18
locations in
Texas
,
five
in
Louisiana
and
one
in
Oklahoma
where we store, sell and rent these construction-related products, which, with the exception of a small portion of steel products, are purchased from third-party suppliers.
Impact Metals
We provide heat-treated steel products through CMC Impact Metals, a subsidiary of CMC. CMC Impact Metals is one of North America's premier producers of high strength steel products. We operate facilities in
Alabama
and
Pennsylvania
, which manufacture armor plate for military vehicles, high strength bar for the truck trailer industry and special bar quality steel for the energy market. CMC Impact Metals works closely with our Alabama mini mill, our distribution business and other steel mills that sell specialized heat-treated steel for customer specific use.
No single customer accounted for 10% or more of our Americas Fabrication segment's net sales in fiscal
2017
,
2016
or
2015
.
6
CMC INTERNATIONAL DIVISION OPERATIONS
INTERNATIONAL MILL
Our International Mill segment is comprised of the mill operations in Poland along with our recycling and fabrication operations located in Poland. Our subsidiary, CMC Poland Sp. z.o.o. ("CMCP"), owns an EAF mini mill and conducts its mill operations in Zawiercie, Poland. Our Poland EAF mini mill operates equipment similar to the equipment operated by our U.S. EAF mini mills. This segment's operations are conducted through: two rolling mills that produce primarily rebar and high quality merchant products; a specialty rod finishing mill; our scrap processing facilities, which include a large capacity scrap metal shredding facility similar to the largest shredder we operate in the U.S.; and four steel fabrication facilities primarily for rebar and wire mesh.
Our Poland mini mill operates a flexible rolling mill designed to allow efficient and flexible production of a range of medium section merchant bar products. This rolling mill complements the facility's other rolling mill dedicated primarily to rebar production. Either rolling mill can feed an alternative finishing end designed to produce high grade wire rod. Our Poland mini mill operation has annual rolling capacity of approximately 1.3 million short tons.
Our Poland mini mill is a significant manufacturer of rebar, merchant bar and wire rod in Central Europe, selling primarily to fabricators, manufacturers, distributors and construction companies. The majority of sales are to customers within Poland. However, the Poland mini mill also exports to the Czech Republic, Germany, Hungary, Slovakia and other countries. Ferrous metal, the principal raw material used by our Poland mini mill, electricity, natural gas and other necessary raw materials for the steel manufacturing process are generally readily available, although they can be subject to significant price fluctuations.
Our international fabrication operations have expanded downstream captive uses for a portion of the rebar and wire rod manufactured at the Poland mini mill. We conduct rebar fabrication activities in Zawiercie, Żyrardów and Głogów Małopolski, Poland. These three rebar fabrication facilities are similar to those operated by our U.S. fabrication facilities and sell fabricated rebar to contractors for incorporation into construction projects. In addition to fabricated rebar, these facilities sell fabricated mesh, assembled rebar cages and other rebar by-products.
Additionally, we operate a fabrication facility in Dąbrowa Górnicza, Poland that produces welded steel mesh, cold rolled wire rod and cold rolled rebar. This operation enables our international fabrication operations to supplement sales of fabricated rebar by also offering wire mesh to customers which include metals service centers and construction contractors. We maintain a presence in the Polish fabrication market but we also sell to neighboring countries such as the Czech Republic, Germany and Slovakia.
Backlog in our international fabrication operations was approximately $48.3 million at
August 31, 2017
compared to $26.7 million at
August 31, 2016
. Our Poland mini mill generally fills orders for stock products from inventory or with products near completion. As a result, we do not believe that backlog levels are a significant factor in the evaluation of these operations. No single customer represented 10% or more of our International Mill segment's net sales in fiscal
2017
,
2016
or
2015
.
INTERNATIONAL MARKETING AND DISTRIBUTION
On June 13, 2017, we announced a plan to exit our International Marketing and Distribution segment. As an initial step in this plan, on August 31, 2017, we completed the sale of our raw materials trading business ("CMC Cometals"), subject to customary post-closing adjustments. In addition, we announced our plan to pursue a restructuring and sale of the remaining trading operations located in the U.S., Asia and Australia. We have included the results of the sale and the activity related to CMC Cometals in discontinued operations in the consolidated statements of earnings for all periods presented. The remainder of the International Marketing and Distribution segment is expected to be classified in discontinued operations either upon meeting the criteria to be classified as held for sale or upon the wind-down of each operation.
Our International Marketing and Distribution segment includes international operations for the sales, distribution and processing of steel products, ferrous and nonferrous metals and other industrial products. Additionally, this segment includes our steel marketing and distribution division headquartered in the U.S. ("CMC Cometals Steel") and a recycling facility in Singapore. Prior to August 31, 2017, this segment also included CMC Cometals. We buy and sell primary and secondary metals, fabricated metals, semi-finished, long and flat steel products and other industrial products. During the past year, our International Marketing and Distribution facilities sold approximately 1.4 million short tons of steel products in addition to raw materials. We market and distribute these products through our global network of offices and processing facilities.
We purchase steel products, industrial minerals, ores, metal concentrates and ferroalloys from producers in the U.S. and international markets. We utilize long-term contracts, spot market purchases and trading transactions to purchase materials. To obtain favorable
7
long-term supply agreements, we occasionally offer assistance to producers by arranging structured finance transactions to suit their objectives.
We sell our products to customers, primarily manufacturers, in the steel, nonferrous metals, metal fabrication, chemical, refractory, construction and transportation industries. We sell directly to our customers through and with the assistance of our offices in Irving, Texas; Sydney and Melbourne, Australia; Singapore; Bangkok, Thailand; Luxembourg; Kürten, Germany; Hong Kong; and Beijing, Guangzhou and Shanghai, China. We have a representative office in Klang, Malaysia, and we have agents located in significant international markets. Our network of offices share information regarding the demand for our materials, assists with negotiation and performance of contracts and other services for our customers and identifies and maintains relationships with our sources of supply.
During fiscal 2017, we exited our steel trading business headquartered in Cardiff, Wales, United Kingdom. The Company's severance and exit costs incurred in connection with this decision were not material.
In most transactions, we act as a principal by taking title and ownership of the products. We are at times designated as a marketing representative, sometimes exclusively, by product suppliers, and on occasion we act as a broker for these products. We buy and sell these products in almost all major markets throughout the world where permitted by U.S. law.
As opposed to companies that trade commodity futures contracts and frequently do not take delivery, we market physical products. As a result of sophisticated global communications, our customers and suppliers often have easy access to quoted market prices, although such price quotes are not always indicative of actual transaction prices. Therefore, to distinguish ourselves, we focus on value-added services for both sellers and buyers. Our services include actual physical market pricing and trend information (in contrast to market information from more speculative metal exchange futures), technical information and assistance, financing, transportation and shipping (including chartering of vessels), storage, warehousing, just-in-time delivery, insurance, hedging and the ability to consolidate smaller purchases and sales into larger, more cost efficient transactions. We limit exposure to price fluctuations by generally offsetting purchases with concurrent sales. We also enter into foreign currency exchange contracts as economic hedges of sales and purchase commitments denominated in currencies other than the U.S. dollar or the functional currency of our international subsidiaries. In general, we do not enter into derivative contracts for speculative or trading purposes.
This segment also operates a recycling facility in Singapore. The facility is similar to those operated by our Americas Recycling segment but on a smaller scale and is operated as part of the International Marketing and Distribution segment due to its oversight by managers in this segment.
Despite focused efforts and substantial progress to stabilize and improve the results of the Australian distribution business, we determined that achieving acceptable financial returns would take additional time and investment. In the first quarter of fiscal 2015, we decided to exit our steel distribution business in Australia. In the fourth quarter of fiscal 2015, we completed the sale of six locations that were part of our Australian steel distribution business and we ceased all operations at three other locations that were part of our Australian steel distribution business. In the fourth quarter of fiscal 2016, we completed the sale of the remaining Australian steel distribution business. We have included the results of the sales and the activity related to our Australian steel distribution businesses in discontinued operations in the consolidated statements of earnings for all periods presented.
For financial data on the above segments, see Note 21, Business Segments, to the consolidated financial statements in this Annual Report on Form 10-K.
SEASONALITY
Many of our mills and fabrication facilities serve customers in the construction industry. Due to the increase in construction during the spring and summer months, our net sales are generally higher in the third and fourth quarters of our fiscal year than in the first and second quarters of our fiscal year.
8
COMPETITION
The nonferrous recycling industry is fragmented in the U.S. However, we believe our Americas Recycling segment is one of the largest entities engaged in the recycling of nonferrous metals in the U.S. We are also a major regional processor of ferrous metal. The metal processing business is subject to cyclical fluctuations based upon the availability and price of unprocessed scrap metal and the demand for steel and nonferrous metals. In our Americas Recycling segment, we compete primarily on price and on the services we provide to scrap suppliers and generators. The price offered for scrap metal is the principal competitive factor in acquiring material from smaller scrap metals collection firms. Industrial generators of scrap metal may also consider factors other than price, such as supplying appropriate collection containers, timely removal, reliable documentation including accurate and detailed purchase records with customized reports, the ability to service multiple locations, insurance coverage, and the buyer's financial strength.
Our Americas Mills segment competes with regional, national and foreign manufacturers of steel. We produce a significant percentage of the total domestic output of rebar and merchant bar. We do not produce a significant percentage of the total U.S. output of our other products. However, we are considered a substantial supplier in the geographic areas near our facilities. We compete primarily on the services we provide to our customers and on the price and quality of our products. See "Risk Factors — Risks Related to Our Industry" below.
Our Americas Fabrication segment competes with regional and national suppliers. We believe that we are among the largest fabricators of rebar in the U.S. We also believe that we are the largest manufacturer of steel fence posts in the U.S. We compete primarily on price, although we also compete based on the value added services we provide to our customers, our speed of delivery, ability to service large projects, and technical capability.
Our International Mill segment competes with several large manufacturers of rebar and wire rod in Central and Eastern Europe, primarily on the basis of price, quality and product availability. We also compete on delivery times utilizing our global supply chain of steel producers and logistic partners. We believe we are the largest producer of merchant bars for the products we produce and the second largest producer of rebar and wire rod in Poland.
Our International Marketing and Distribution segment operates in a highly competitive sector. We compete primarily on the price, quality and reliability of our products, our financing alternatives and the additional services we provide. In this business, we compete with other U.S. and international trading companies, some of which are larger and may have access to greater financial resources. In addition, some of our competitors may be able to pursue business without restriction by the laws of the U.S. We also compete with industrial consumers who purchase directly from suppliers, and from importers and manufacturers of semi-finished ferrous and nonferrous metals.
ENVIRONMENTAL MATTERS
A significant factor in our business is our compliance with environmental laws and regulations. See Part I, Item 1A, "Risk Factors — Risks Related to Our Industry" in this Annual Report on Form 10-K. Compliance with and changes in various environmental requirements and environmental risks applicable to our industry may adversely affect our business, results of operations and financial condition.
Occasionally, we may be required to clean up or take certain remediation action with regard to sites we use or formerly used in our operations. We may also be required to pay for a portion of the cleanup or remediation cost at sites we never owned or at sites which we never operated, if we are found to have arranged for treatment or disposal of hazardous substances on the sites. Under the Comprehensive Environmental Response, Compensation and Liability Act ("CERCLA" or "Superfund") and analogous state statutes, we could be responsible for both the costs of cleanup as well as for associated natural resource damages. The U.S. Environmental Protection Agency ("EPA"), or equivalent state agency, has named us as a potentially responsible party ("PRP") at several federal Superfund sites or similar state sites. In some cases, these agencies allege that we are one of many PRPs responsible for the cleanup of a site because we sold scrap metals to or otherwise disposed of materials at the site. With respect to the sale of scrap metals, we contend that an arm's length sale of valuable scrap metal for use as a raw material in a manufacturing process that we do not control should not constitute "an arrangement for disposal or treatment of hazardous substances" as defined under federal law. In 2000, the Superfund Recycling Equity Act was signed into law which, subject to the satisfaction of certain conditions, provides legitimate sellers of scrap metal for recycling with some relief from Superfund liability under federal law. Despite Congress' clarification of the intent of the federal law, some state laws and environmental agencies still seek to impose such liability. We believe efforts to impose such liability are contrary to public policy objectives and legislation encouraging recycling and promoting the use of recycled materials, and we continue to support clarification of state laws and regulations consistent with Congress' action.
9
New federal, state and local laws, regulations and the varying interpretations of such laws by regulatory agencies and the judiciary impact how much money we spend on environmental compliance. In addition, uncertainty regarding adequate control levels, testing and sampling procedures, new pollution control technology and cost benefit analysis based on market conditions impact our future expenditures in order to comply with environmental requirements. We cannot predict the total amount of capital expenditures or increases in operating costs or other expenses that may be required as a result of environmental compliance. We also do not know if we can pass such costs on to our customers through product price increases. During fiscal
2017
, we incurred environmental costs including disposal, permits, license fees, tests, studies, remediation, consultant fees and environmental personnel expense of
$29.9 million
. In addition, during fiscal
2017
, we spent approximately
$8.0 million
on capital expenditures for environmental projects. We believe that our facilities are in material compliance with currently applicable environmental laws and regulations. We anticipate capital expenditures for new environmental control facilities during fiscal
2018
to be approximately
$5.7 million
.
EMPLOYEES
As of
August 31, 2017
, the Company had the following number of employees in each reporting segment and Corporate:
|
Segment
|
Number of Employees
|
||
|
Americas Recycling
|
1,263
|
|
|
|
Americas Mills
|
1,894
|
|
|
|
Americas Fabrication
|
3,191
|
|
|
|
International Mill
|
1,845
|
|
|
|
International Marketing and Distribution
|
225
|
|
|
|
Corporate
|
379
|
|
|
|
Total
|
8,797
|
|
|
Certain of our employees belong to unions for collective bargaining purposes, including (i) employees at one metal processing facility and five fabrication facilities within the CMC Americas division and (ii) approximately 40% of the employees in our International Mill segment. We believe that our labor relations are generally good to excellent and that our work force is highly motivated.
EXECUTIVE OFFICERS OF THE REGISTRANT
Our Board of Directors typically elects officers at its first meeting after our annual meeting of stockholders. Our executive officers continue to serve for terms set from time to time by our Board of Directors in its discretion. The table below sets forth the name, current position and offices, age and period served for each of our executive officers.
|
EXECUTIVE
|
||||||
|
NAME
|
CURRENT POSITION & OFFICES
|
AGE
|
OFFICER SINCE
|
|||
|
Barbara R. Smith
|
President and Chief Executive Officer
|
58
|
2011
|
|||
|
Adam R. Hickey
|
Vice President and Chief Accounting Officer
|
42
|
2012
|
|||
|
Paul K. Kirkpatrick
|
Vice President, General Counsel and Corporate Secretary
|
46
|
2013
|
|||
|
Paul J. Lawrence
|
Treasurer and Vice President, Financial Planning and Analysis
|
47
|
2016
|
|||
|
Mary A. Lindsey
|
Senior Vice President and Chief Financial Officer
|
62
|
2016
|
|||
|
Tracy L. Porter
|
Executive Vice President, CMC Operations
|
60
|
2010
|
|||
Barbara R. Smith joined the Company in May 2011 as Senior Vice President and Chief Financial Officer. Ms. Smith was appointed Chief Operating Officer in January 2016, President and Chief Operating Officer in January 2017 and President and Chief Executive Officer in September 2017. Prior to joining the Company, Ms. Smith served as Vice President and Chief Financial Officer of Gerdau Ameristeel Corporation, a mini mill steel producer, from July 2007 to May 2011, after joining Gerdau Ameristeel as Treasurer in July 2006. From February 2005 to July 2006, she served as Senior Vice President and Chief Financial Officer of FARO Technologies, Inc., a developer and manufacturer of 3-D measurement and imaging systems. From 1981 to 2005, Ms. Smith was employed by Alcoa Inc., a producer of primary aluminum, fabricated aluminum and alumina, where she held various financial leadership positions, including Vice President of Finance for Alcoa's Aerospace, Automotive & Commercial Transportation Group, Vice President and Chief Financial Officer for Alcoa Fujikura Ltd. and Director of Internal Audit.
10
Adam R. Hickey joined the Company in February 2004 as a Senior Accountant. Since 2004, Mr. Hickey has held various positions within the Company, including Manager of Cost & Planning, Assistant Controller and Controller of CMC Americas Division. Mr. Hickey was appointed Vice President and Controller of the Company in April 2012 and Vice President and Chief Accounting Officer in January 2017.
Paul K. Kirkpatrick joined the Company in December 2009 as Assistant General Counsel and Assistant Corporate Secretary. He was appointed Vice President, Corporate Secretary and Assistant General Counsel in February 2013 and Vice President, General Counsel and Corporate Secretary in October 2013. Prior to joining the Company, Mr. Kirkpatrick was an attorney at Haynes and Boone, LLP, a law firm based in Dallas, Texas.
Paul J. Lawrence joined the Company in February 2016 as Vice President of Finance. He was appointed Vice President of Finance and Treasurer in September 2016 and Treasurer and Vice President of Financial Planning and Analysis in January 2017. Prior to joining the Company, Mr. Lawrence served as North American Information Technology Leader of Gerdau Long Steel North America, a U.S. steel producer, from 2014 to 2016, and from 2010 to 2014, he served as Gerdau Template Deployment Leader at Gerdau Long Steel North America. From 2003 to 2010, Mr. Lawrence held a variety of financial roles at Gerdau Ameristeel Corporation, including Assistant Vice President and Corporate Controller, and Deputy Corporate Controller. From 1998 to 2002, Mr. Lawrence held several financial positions with Co-Steel Inc., which was acquired by Gerdau SA.
Mary A. Lindsey joined the Company in September 2009 as Vice President-Tax. She was appointed Vice President-Tax and Investor Relations in June 2015, Vice President and Chief Financial Officer in January 2016 and Senior Vice President and Chief Financial Officer in September 2017. Prior to joining CMC, Ms. Lindsey served as Vice President Tax and Tax Counsel for Albany International Corp., a global advanced textiles and materials processing company, from March 2006 to September 2009, and from January 2005 to March 2006, Ms. Lindsey was an attorney at Baker & Hostetler LLP, a national law firm. In addition, Ms. Lindsey served in various roles, including Vice President Tax and Tax Counsel, Legal Counsel responsible for global M&A and intellectual property, and General Manager of Corporate M&A, at The Timken Company, a global manufacturer of bearings, transmissions, gearboxes, and related components, from January 1985 to January 2005.
Tracy L. Porter joined the Company in 1991 and has held various positions within the Company, including General Manager of CMC Steel Arkansas at Magnolia, Arkansas, head of the Company's Rebar Fabrication Division, and Interim President of CMC Americas Division. Mr. Porter served as Vice President of the Company and President of CMC Americas Division from April 2010 to July 2010. Mr. Porter was appointed Senior Vice President of the Company and President of CMC Americas Division in July 2010 and Executive Vice President, CMC Operations in September 2016.
There are inherent risks and uncertainties associated with our business that could adversely affect our business, results of operations and financial condition. Set forth below are descriptions of those risks and uncertainties that we currently believe to be material, but the risks and uncertainties described below are not the only risks and uncertainties that could adversely affect our business, results of operations and financial condition. If any of these risks actually occurs, our business, results of operations and financial condition could be materially adversely affected.
RISKS RELATED TO OUR INDUSTRY
Our industry and the industries we serve are vulnerable to global economic conditions, including the slow recovery from the last recession and the risk of a recession relapse.
Metals industries and commodity products have historically been vulnerable to significant declines in consumption, global overcapacity and product pricing during prolonged periods of economic downturn. Our business supports cyclical industries such as commercial, government and residential construction, energy, metals service center, petrochemical and original equipment manufacturing. We may experience significant fluctuations in demand for our products from these industries based on global or regional economic conditions, energy prices, consumer demand and decisions by governments to fund infrastructure projects such as highways, schools, energy plants and airports. Although the residential housing market is not a significant direct factor in our business, related commercial and infrastructure construction activities, such as shopping centers, schools and roads, could be adversely impacted by a prolonged slump in new housing construction. Our business, results of operations and financial condition are adversely affected when the industries we serve suffer a prolonged downturn or anemic growth. Because we do not have unlimited backlogs, our business, results of operations and financial condition are promptly affected by short-term economic fluctuations.
11
Nine years removed from the worldwide economic downturn that began in 2008, we have begun to see some improvement in general economic and manufacturing activity, but the economic outlook remains uncertain both in the U.S. and globally. In addition, uncertainties in Europe regarding the financial sector and sovereign debt and the potential impact on banks in other regions of the world have continued to weigh on global and domestic growth. These situations continue to contribute to weaker end-markets and depressed demand, which could stifle customer confidence and adversely affect demand for our products and further adversely affect our business. Although we believe that the long-term prospects for the steel industry remain bright, we are unable to predict the duration of current economic conditions that are contributing to reduced demand for our products compared to pre-recession levels. Future economic downturns or a prolonged period of slow growth or economic stagnation could materially adversely affect our business, results of operations and financial condition.
We are vulnerable to the economic conditions in the regions in which our operations are concentrated.
Our geographic concentration in the southern and southwestern U.S. as well as Central Europe, Southeast Asia and Australia exposes us to the local market conditions in these regions. Economic downturns in these areas or decisions by governments that have an impact on the level and pace of overall economic activity in one of these regions could adversely affect demand for our products and, consequently, our sales and profitability. As a result, our financial results are substantially dependent upon the overall economic conditions in these areas.
Rapid and significant changes in the price of metals could continue to adversely impact our business, results of operations and financial condition.
Prices for most metals in which we deal have experienced increased volatility over the last several years, and such increased price volatility impacts us in several ways. Some of our operations, such as our fabrication operations, may benefit from rapidly decreasing steel prices as their material cost for previously contracted fixed price work declines. Others, such as our Americas Mills and International Mill segments, would likely experience reduced margins and may be forced to liquidate high cost inventory at reduced margins or losses until prices stabilize. Sudden increases could have the opposite effect in each case. Overall, we believe that rapid substantial price changes are not to our industry's benefit. Our customer and supplier base would be impacted due to uncertainty as to future prices. A reluctance to purchase inventory in the face of extreme price decreases or to sell quickly during a period of rapid price increases would likely reduce our volume of business. Marginal industry participants or speculators may attempt to participate to an unhealthy extent during a period of rapid price escalation with a substantial risk of contract default if prices suddenly reverse. Risks of default in contract performance by customers or suppliers as well as an increased risk of bad debts and customer credit exposure could increase during periods of rapid and substantial price changes.
Excess capacity and over-production by foreign producers in our industry could increase the level of steel imports into the U.S., resulting in lower domestic prices, which would adversely affect our sales, margins and profitability.
Global steel-making capacity exceeds demand for steel products in some regions around the world. Rather than reducing employment by rationalizing capacity with consumption, steel manufacturers in these countries (often with local government assistance or subsidies in various forms) have traditionally periodically exported steel at prices significantly below their home market prices, which prices may not reflect their costs of production or capital. For example, steel production in China, the world's largest producer and consumer of steel, has continued to exceed Chinese demand. This rising excess capacity in China has resulted in a further increase in imports of artificially low-priced steel and steel products to the U.S. and world steel markets. A continuation of this trend or a significant decrease in China's rate of economic expansion could result in increasing steel imports from China. Excessive imports of steel into the U.S. have exerted, and may continue to exert, downward pressure on U.S. steel prices, which negatively affects our ability to increase our sales, margins, and profitability. The excess capacity may create downward pressure on our steel prices and lead to reduced sales volumes as imports absorb market share that would otherwise be filled by domestic supply, all of which would adversely affect our sales, margins and profitability and could subject us to possible renegotiation of contracts or increases in bad debt.
We believe the downward pressure on, and periodically depressed levels of, U.S. steel prices in some recent years have been further exacerbated by imports of steel involving dumping and subsidy abuses by foreign steel producers. While some tariffs and quotas are periodically put into effect for certain steel products imported from a number of countries that have been found to have been unfairly pricing steel imports to the U.S., there is no assurance that tariffs and quotas will always be levied, even if otherwise justified, and even when imposed many of these are short-lived. When such tariffs or duties expire or if others are further relaxed or repealed, or if relatively higher U.S. steel prices make it attractive for foreign steelmakers to export their steel products to the U.S., despite the presence of duties or tariffs, the resurgence of substantial imports of foreign steel could create downward pressure on U.S. steel prices.
Excess capacity has also led to greater protectionism as is evident in raw material and finished product border tariffs put in place
12
by China, Brazil and other countries. Such protectionism could have a material adverse effect on our business, results of operations and financial condition.
Compliance with and changes in environmental compliance requirements and remediation requirements could result in substantially increased capital requirements and operating costs; violations of environmental requirements could result in costs that have a material adverse effect on our business, results of operations and financial condition.
Existing environmental laws or regulations, as currently interpreted or reinterpreted in the future, and future laws and regulations, may have a material adverse effect on our business, results of operations and financial condition. Compliance with environmental laws and regulations is a significant factor in our business. We are subject to local, state, federal and international environmental laws and regulations concerning, among other matters, waste disposal, air emissions, waste and storm water effluent and disposal and employee health. Federal and state regulatory agencies can impose administrative, civil and criminal penalties and may seek injunctive relief impacting continuing operations for non-compliance with environmental requirements.
New facilities that we may build, especially steel mills, like the micro mill we are building in Durant, Oklahoma, are required to obtain several environmental permits before significant construction or commencement of operations. Delays in obtaining permits or unanticipated conditions in such permits could delay the project or increase construction costs or operating expenses. Our manufacturing and recycling operations produce significant amounts of by-products, some of which are handled as industrial waste or hazardous waste. For example, our EAF mills generate electric arc furnace dust ("EAF dust"), which the EPA and other regulatory authorities classify as hazardous waste. EAF dust and other industrial waste and hazardous waste require special handling, recycling or disposal.
In addition, the primary feed materials for the shredders operated by our scrap metal recycling facilities are automobile hulks and obsolete household appliances. Approximately 20% of the weight of an automobile hull consists of unrecyclable material known as shredder fluff. After the segregation of ferrous and saleable nonferrous metals, shredder fluff remains. We, along with others in the recycling industry, interpret federal regulations to require shredder fluff to meet certain criteria and pass a toxic leaching test to avoid classification as a hazardous waste. We also endeavor to remove hazardous contaminants from the feed material prior to shredding. As a result, we believe the shredder fluff we generate is not normally considered or properly classified as hazardous waste. If the laws, regulations or testing methods change with regard to EAF dust or shredder fluff or other by-products, we may incur additional significant costs.
Changes to National Ambient Air Quality Standards ("NAAQS") or other requirements on our air emissions could make it more difficult to obtain new permits or to modify existing permits and could require changes to our operations or emissions control equipment. Such difficulties and changes could result in operational delays and capital and ongoing compliance expenditures.
Legal requirements are changing frequently and are subject to interpretation. New laws, regulations and changing interpretations by regulatory authorities, together with uncertainty regarding adequate pollution control levels, testing and sampling procedures, new pollution control technology and cost/benefit analysis based on market conditions are all factors that may increase our future expenditures to comply with environmental requirements. Accordingly, we are unable to predict the ultimate cost of future compliance with these requirements or their effect on our operations. We cannot predict whether such costs would be able to be passed on to customers through product price increases. Competitors in various regions or countries where environmental regulation is less restrictive, subject to different interpretation or generally not enforced, may enjoy a competitive advantage.
We may also be required to conduct additional cleanup (and pay for associated natural resource damages) at sites where we have already participated in remediation efforts or take remediation action with regard to sites formerly used in connection with our operations. We may be required to pay for a portion or all of the costs of cleanup or remediation at sites we never owned or on which we never operated if we are found to have arranged for treatment or disposal of hazardous substances on the sites. In cases of joint and several liability, we may be obligated to pay a disproportionate share of cleanup costs if other responsible parties are financially insolvent.
We are involved and may in the future become involved in various environmental matters that may result in fines, penalties or judgments being assessed against us or liability imposed upon us which we cannot presently estimate or reasonably foresee and which may have a material impact on our business, results of operations and financial condition.
Under CERCLA or similar state statutes, we may have obligations to conduct investigation and remediation activities associated with alleged releases of hazardous substances or to reimburse the EPA (or state agencies as applicable) for such activities and to pay for natural resource damages associated with alleged releases. We have been named a PRP at several federal and state Superfund sites because the EPA or an equivalent state agency contends that we and other potentially responsible scrap metal suppliers are liable for the cleanup of those sites as a result of having sold scrap metal to unrelated manufacturers for recycling as a raw material
13
in the manufacture of new products. We are involved in litigation or administrative proceedings with regard to several of these sites in which we are contesting, or at the appropriate time may contest, our liability. In addition, we have received information requests with regard to other sites which may be under consideration by the EPA as potential CERCLA sites.
We are presently participating in PRP organizations at several sites, which are paying for certain remediation expenses. Although we are unable to estimate precisely the ultimate dollar amount of exposure to loss in connection with various environmental matters or the effect on our consolidated financial position, we make accruals as warranted. In addition, although we do not believe that a reasonably possible range of loss in excess of amounts accrued for pending lawsuits, claims or proceedings would be material to our financial statements, additional developments may occur, and due to inherent uncertainties, including evolving remediation technology, changing regulations, possible third-party contributions, the inherent shortcomings of the estimation process, the uncertainties involved in litigation and other factors, the amounts we ultimately are required to pay could vary significantly from the amounts we accrue, and this could have a material adverse effect on our business, results of operations and financial condition.
Increased regulation associated with climate change and greenhouse gas emissions could impose significant additional costs on both our steelmaking and metals recycling operations.
The U.S. government and various governmental agencies have introduced or are contemplating regulatory changes in response to the potential impact of climate change. International treaties or agreements may also result in increasing regulation of greenhouse gas emissions, including the introduction of carbon emissions trading mechanisms. Any such regulation regarding climate change and greenhouse gas ("GHG") emissions could impose significant costs on our steelmaking and metals recycling operations and on the operations of our customers and suppliers, including increased energy, capital equipment, environmental monitoring and reporting and other costs in order to comply with current or future laws or regulations concerning and limitations imposed on our operations by virtue of climate change and GHG emissions laws and regulations. The potential costs of "allowances," "offsets" or "credits" that may be part of potential cap-and-trade programs or similar future regulatory measures are still uncertain. Any adopted future climate change and GHG regulations could negatively impact our ability (and that of our customers and suppliers) to compete with companies situated in areas not subject to such limitations. From a medium and long-term perspective, as a result of these regulatory initiatives, we may see an increase in costs relating to our assets that emit significant amounts of GHGs. These regulatory initiatives will be either voluntary or mandatory and may impact our operations directly or through our suppliers or customers. Until the timing, scope and extent of any future regulation becomes known, we cannot predict the effect on our business, results of operations or financial condition, but such effect could be materially adverse to our business, results of operations and financial condition.
RISKS RELATED TO OUR COMPANY
Potential limitations on our ability to access credit, or the ability of our customers and suppliers to access credit, may adversely affect our business, results of operations and financial condition
.
If our access to credit is limited or impaired, our business, results of operations and financial condition could be adversely impacted. Our senior unsecured debt is rated by Standard & Poor's Corporation and Moody's Investors Service. In determining our credit ratings, the rating agencies consider a number of both quantitative and qualitative factors. These factors include earnings (loss), fixed charges such as interest, cash flows, total debt outstanding, off-balance sheet obligations and other commitments, total capitalization and various ratios calculated from these factors. The rating agencies also consider predictability of cash flows, business strategy and diversity, industry conditions and contingencies. Any downgrades in our credit ratings may make raising capital more difficult, increase the cost and affect the terms of future borrowings, affect the terms under which we purchase goods and services and limit our ability to take advantage of potential business opportunities. We could also be adversely affected if our banks refused to honor their contractual commitments or cease lending.
We are also exposed to risks associated with the creditworthiness of our customers and suppliers. In certain markets, we have experienced a consolidation among those entities to whom we sell. This consolidation has resulted in an increased credit risk spread among fewer customers, often without a corresponding strengthening of their financial status. If the availability of credit to fund or support the continuation and expansion of our customers' business operations is curtailed or if the cost of that credit is increased, the resulting inability of our customers or of their customers to either access credit or absorb the increased cost of that credit could adversely affect our business by reducing our sales or by increasing our exposure to losses from uncollectible customer accounts. The consequences of such adverse effects could include the interruption of production at the facilities of our customers, the reduction, delay or cancellation of customer orders, delays or interruptions of the supply of raw materials we purchase, and bankruptcy of customers, suppliers or other creditors. Any of these events may adversely affect our business, results of operations and financial condition.
14
The potential impact of our customers' non-compliance with existing commercial contracts and commitments, due to insolvency or for any other reason, may adversely affect our business, results of operations and financial condition.
Most consumers of the metals products we sell have been negatively impacted by the recession and the continued slow recovery therefrom. Due to their economic hardship or the contraction in their operations or due to the fact that the prices for many of the products we sell have declined since the customers entered into the contracts with us, some of our customers have sought to renegotiate or cancel their existing purchase commitments. In addition, some of our customers have breached previously agreed upon contracts to buy our products by refusing delivery of the products.
Where appropriate, we have and will in the future pursue litigation to recover our damages resulting from customer contract defaults. We also use credit insurance both in the U.S. and internationally to mitigate the risk of customer insolvency. However, it is possible that we may not be capable of recovering all of our insured losses if the insurers with whom our accounts receivable are insured experience significant losses threatening their viability. Additionally, credit insurance policies typically have relatively short policy periods and require pre-approval of customers with maximum insured limits established by the customer. If credit insurers incur large losses, the insurance may be more difficult and more costly to secure and may be on less favorable terms. In addition, a significant amount of our accounts receivable are considered to be open account uninsured accounts receivable. A large number of our customers defaulting on existing contractual obligations to purchase our products could have a material adverse effect on our business, results of operations and financial condition.
There can be no assurance that we will repurchase shares of our common stock at all or in any particular amounts.
During the first quarter of fiscal 2015, we announced that our Board of Directors had authorized the Company to repurchase up to $100.0 million of shares of our common stock. The stock markets in general have experienced substantial price and trading fluctuations, which have resulted in volatility in the market prices of securities that often are unrelated or disproportionate to changes in operating performance. These broad market fluctuations may adversely affect the trading price of our common stock. Price volatility over a given period may also cause the average price at which we repurchase our own common stock to exceed the stock's price at a given point in time. In addition, significant changes in the trading price of our common stock and our ability to access capital on terms favorable to us could impact our ability to repurchase shares of our common stock. The timing and amount of any repurchases will be determined by the Company's management based on its evaluation of market conditions, capital allocation alternatives and other factors beyond our control. Our share repurchase program may be modified, suspended, extended or terminated by the Company at any time and without notice. Any failure to repurchase stock after we have announced our intention to do so may negatively impact investor confidence in us, thereby negatively impacting our stock price.
The agreements governing our notes and our other debt contain financial covenants and impose restrictions on our business.
The indenture governing our 4.875% senior notes due 2023 and our 5.375% senior notes due 2027 contains restrictions on our ability to create liens, sell assets, enter into sale and leaseback transactions and consolidate or merge. In addition to these restrictions, our credit facility contains covenants that restrict our ability to, among other things, enter into transactions with affiliates and guarantee the debt of some of our subsidiaries. Our credit facility also requires that we meet certain financial tests and maintain certain financial ratios, including a maximum debt to capitalization and interest coverage ratios.
Other agreements that we may enter into in the future may contain covenants imposing significant restrictions on our business that are similar to, or in addition to, the covenants under our existing agreements. These restrictions may affect our ability to operate our business and may limit our ability to take advantage of potential business opportunities as they arise.
Our ability to comply with these covenants may be affected by events beyond our control, including prevailing economic, financial and industry conditions. The breach of any of these covenants could result in a default under the indenture governing the notes or under our other debt agreements. An event of default under our debt agreements would permit some of our lenders to declare all amounts borrowed from them to be due and payable, together with accrued and unpaid interest. If we were unable to repay debt to our secured lenders or if we incur secured debt in the future, these lenders could proceed against the collateral securing that debt. In addition, acceleration of our other indebtedness may cause us to be unable to make interest payments on the notes.
15
We may not be able to successfully identify, consummate or integrate acquisitions, and acquisitions may adversely affect our financial leverage.
Part of our business strategy includes pursuing synergistic acquisitions. We have expanded, and plan to continue to expand, our business by making strategic acquisitions and regularly seeking suitable acquisition targets to enhance our growth. We may fund such acquisitions using cash on hand, drawing under our credit facility or accessing the capital markets. To the extent we finance such acquisitions with additional debt, the incurrence of such debt may result in a significant increase in our interest expense and financial leverage, which could be further exacerbated by volatility in the debt capital markets. Further, an increase in our leverage could lead to deterioration in our credit ratings.
The pursuit of acquisitions may pose certain risks to us. We may not be able to identify acquisition candidates that fit our criteria for growth and profitability. Even if we are able to identify such candidates, we may not be able to acquire them on terms or financing satisfactory to us. We will incur expenses and dedicate attention and resources associated with the review of acquisition opportunities, whether or not we consummate such acquisitions.
Additionally, even if we are able to acquire suitable targets on agreeable terms, we may not be able to successfully integrate their operations with ours. Achieving the anticipated benefits of any acquisition will depend in significant part upon whether we integrate such acquired businesses in an efficient and effective manner. We may not be able to achieve the anticipated operating and cost synergies or long-term strategic benefits of our acquisitions within the anticipated timing or at all. For example, elimination of duplicative costs may not be fully achieved or may take longer than anticipated. The benefits from any acquisition will be offset by the costs incurred in integrating the businesses and operations. We may also assume liabilities in connection with acquisitions to which we would not otherwise be exposed. An inability to realize any or all of the anticipated synergies or other benefits of an acquisition as well as any delays that may be encountered in the integration process, which may delay the timing of such synergies or other benefits, could have an adverse effect on our business, results of operations and financial condition.
Goodwill impairment charges in the future could have a material adverse effect on our business, results of operations and financial condition.
We review the recoverability of goodwill annually, as of the first day of our fiscal fourth quarter, and whenever events or circumstances indicate that the carrying value of a reporting unit may not be recoverable. As a result of our annual goodwill impairment test for fiscal
2017
, we recorded a goodwill impairment charge of
$2.0 million
related to a reporting unit in our International Marketing and Distribution segment due to management's decision to wind-down the associated operations.
The impairment tests require us to make an estimate of the fair value of our reporting units and other long-lived assets. An impairment could be recorded as a result of changes in assumptions, estimates or circumstances, some of which are beyond our control. Factors which could result in an impairment include, but are not limited to: (i) reduced demand for our products; (ii) the cost of capital; (iii) higher material prices; (iv) slower growth rates in our industry; and (v) changes in the market based discount rates. Since a number of factors may influence determinations of fair value of goodwill, we are unable to predict whether impairments of goodwill or other indefinite-lived intangibles will occur in the future and there can be no assurance that continued conditions will not result in future impairments of goodwill. The future occurrence of a potential indicator of impairment could include matters such as (i) a decrease in expected net earnings, (ii) adverse equity market conditions, (iii) a decline in current market multiples, (iv) a decline in our common stock price, (v) a significant adverse change in legal factors or the general business climate, (vi) an adverse action or assessment by a regulator, (vii) a significant downturn in non-residential construction markets in the U.S. and (viii) continued levels of imported steel into the U.S. Any such impairment would result in us recognizing a non-cash charge in our consolidated statements of earnings, which could adversely affect our business, results of operations and financial condition and increase our effective tax rate.
Impairment of long-lived assets in the future could have a material adverse effect on our business, results of operations and financial condition.
We have a significant amount of property, plant and equipment and finite-lived intangible assets that may be subject to impairment testing. Long-lived assets are subject to an impairment assessment when certain triggering events or circumstances indicate that their carrying value may be impaired. If the net carrying value of the asset or group of assets exceeds our estimate of future undiscounted cash flows of the operations related to the asset, the excess of the net book value over estimated fair value is charged to impairment loss in the consolidated statements of earnings. The primary factors that affect estimates of future cash flows for these long-lived asset groups are (i) management's scrap price outlook, (ii) scrap demand, (iii) working capital changes, (iv) capital expenditures and (v) selling, general and administrative expenses. For the fiscal year ended
August 31, 2017
, our long-lived asset impairment charges were not material. However, there can be no assurance that continued market conditions, demand for our products, or facility utilization levels or other factors will not result in future impairment charges.
16
Increases in the value of the U.S. dollar relative to other currencies may adversely affect our business, results of operations and financial condition.
An increase in the value of the U.S. dollar may adversely affect our business, results of operations and financial condition, and in particular, the increased strength of the U.S. dollar as compared to China's renminbi or the euro could adversely affect our business, results of operations and financial condition. A strong U.S. dollar makes imported metal products less expensive, resulting in more imports of steel products into the U.S. by our foreign competitors, while a weak U.S. dollar may have the opposite impact on imports. With the exception of exports of nonferrous scrap metal by our Americas Recycling segment, we have not recently been a significant exporter of metal products from our U.S. operations. Economic difficulties in some large steel-producing regions of the world, resulting in lower local demand for steel products, have historically encouraged greater steel exports to the U.S. at depressed prices which can be exacerbated by a strong U.S. dollar. As a result, our products that are made in the U.S. may become relatively more expensive as compared to imported steel, which has had and in the future could have a negative impact on our business, results of operations and financial condition.
A strong U.S. dollar may also hamper our international marketing and distribution business. Weak local currencies limit the amount of U.S. dollar denominated products that we can import for our international operations and limit our ability to be competitive against local producers selling in local currencies.
The U.S. dollar and most global currencies are subject to daily price volatility based on several factors including changes in local government interest rates, macro events and developments, currency manipulation by governments in countries that buy or sell foreign currencies to strengthen or weaken the local currency or in those instances where local governments fix the pricing of their currencies versus having floating exchange rates.
Operating internationally carries risks and uncertainties which could adversely affect our business, results of operations and financial condition.
Our foreign operations generated approximately
24%
of our fiscal
2017
net sales. We have significant facilities in Poland. Our marketing and trading offices are located in most major markets of the world, and our suppliers and customers are located throughout the world. Our International Marketing and Distribution segment relies on substantial international shipments of materials and products in the ordinary course of its business. Our stability, growth and profitability are subject to a number of risks inherent in doing business internationally in addition to the currency exchange risk discussed above, including:
|
•
|
political, military, terrorist or major pandemic events;
|
|
•
|
local labor and social issues;
|
|
•
|
legal and regulatory requirements or limitations imposed by foreign governments (particularly those with significant steel consumption or steel-related production including China, Brazil, Russia and India), including quotas, tariffs or other protectionist trade barriers, adverse tax law changes, nationalization or currency restrictions;
|
|
•
|
disruptions or delays in shipments caused by customs compliance or government agencies; and
|
|
•
|
potential difficulties in staffing and managing local operations.
|
These factors may adversely affect our business, results of operations and financial condition.
17
We rely on the availability of large amounts of electricity and natural gas for our mill operations. Disruptions in delivery or substantial increases in energy costs, including crude oil prices, could adversely affect our business, results of operations and financial condition.
Our EAF mills melt steel scrap in electric arc furnaces and use natural gas to heat steel billets for rolling into finished products. As large consumers of electricity and gas, often the largest in the geographic area where our mills are located, we must have dependable delivery of electricity and natural gas in order to operate. Accordingly, we are at risk in the event of an energy disruption. Prolonged black-outs or brown-outs or disruptions caused by natural disasters such as hurricanes would substantially disrupt our production. While we have not suffered prolonged production delays due to our inability to access electricity or natural gas, several of our competitors have experienced such occurrences. Prolonged substantial increases in energy costs would have an adverse effect on the costs of operating our mills and would negatively impact our gross margins unless we were able to fully pass through the additional expense to our customers. Our finished steel products are typically delivered by truck. Rapid increases in the price of fuel attributable to increases in crude oil prices would increase our costs and adversely affect many of our customers' financial results, which in turn could result in reduced margins and declining demand for our products. Rapid increases in fuel costs may also negatively impact our ability to charter ships for international deliveries at anticipated freight rates, thereby decreasing our margins on those transactions or causing our customers to look for alternative sources.
The loss of or inability to hire key employees may adversely affect our ability to successfully manage our operations and meet our strategic objectives.
Our future success depends, in large part, on the continued service of our officers and other key employees and our ability to continue to attract and retain additional highly qualified personnel. These employees are integral to our success based on their expertise and knowledge of our business and products. We compete for such personnel with other companies, including public and private company competitors who may periodically offer more favorable terms of employment. The loss or interruption of the services of a number of our key employees could reduce our ability to effectively manage our operations due to the fact that we may not be able to find appropriate replacement personnel in a timely manner should the need arise.
We may have difficulty competing with companies that have a lower cost structure or access to greater financial resources.
We compete with regional, national and foreign manufacturers and traders. Consolidation among participants in the steel manufacturing and recycling industries has resulted in fewer competitors, and several of our competitors are significantly larger than us and have greater financial resources and more diverse businesses than us. Some of our foreign competitors may be able to pursue business opportunities without regard to certain of the laws and regulations with which we must comply, such as environmental regulations. These companies may have a lower cost structure and more operating flexibility, and consequently they may be able to offer better prices and more services than we can. There is no assurance that we will be able to compete successfully with these companies. Any of these factors could have a material adverse effect on our business, results of operations and financial condition.
Information technology interruptions and breaches in data security could adversely impact our business, results of operations and financial condition.
We rely on computers, information and communications technology and related systems and networks in order to operate our business, including to store sensitive data such as intellectual property, our own proprietary business information and that of our customers, suppliers and business partners and personally identifiable information of our employees. Increased global information technology security requirements, vulnerabilities, threats and a rise in sophisticated and targeted computer crime pose a risk to the security of our systems, networks and the confidentiality, availability and integrity of our data. Our systems and networks are also subject to damage or interruption from power outages, telecommunications failures, employee error and other similar events. Any of these or other events could result in system interruption, the disclosure, modification or destruction of proprietary and other key information, legal claims or proceedings, production delays or disruptions to operations including processing transactions and reporting financial results and could adversely impact our reputation and our operating results. We have taken steps to address these concerns and have implemented internal control and security measures to protect our systems and networks from security breaches; however, there can be no assurance that a system or network failure, or security breach, will not impact our business, results of operations and financial condition.
18
Our mills require continual capital investments that we may not be able to sustain.
We must make regular substantial capital investments in our steel mills to maintain the mills, lower production costs and remain competitive. We cannot be certain that we will have sufficient internally generated cash or acceptable external financing to make necessary substantial capital expenditures in the future. The availability of external financing depends on many factors outside of our control, including capital market conditions and the overall performance of the economy. If funding is insufficient, we may be unable to develop or enhance our mills, take advantage of business opportunities and respond to competitive pressures.
Scrap and other supplies for our business are subject to significant price fluctuations and limited availability, which may adversely affect our business, results of operations and financial condition.
At any given time, we may be unable to obtain an adequate supply of critical raw materials with a price and other terms acceptable to us. We depend on ferrous scrap, the primary feedstock for our steel mills, and other supplies such as graphite electrodes and ferroalloys for our steel mill operations. The price of scrap and other supplies has historically been subject to significant fluctuation, and we may not be able to adjust our product prices to recover the costs of rapid increases in material prices, especially over the short-term and in our domestic fabrication segment's fixed price contracts. The profitability of our steel mill operations and domestic fabrication segments would be adversely affected if we are unable to pass on to our customers increased raw material and supply costs. Changing processes could potentially impact the volume of scrap metal available to us and the volume and realized margins of processed metal we sell.
The purchase prices for automobile bodies and various other grades of obsolete and industrial scrap, as well as the selling prices for processed and recycled scrap metals we utilize in our own manufacturing process or resell to others, are highly volatile. A prolonged period of low scrap prices or a fall in scrap prices could reduce our ability to obtain, process and sell recycled material, which could have a material adverse effect on our metals recycling operations business, results of operations and financial condition. Our ability to respond to changing recycled metal selling prices may be limited by competitive or other factors during periods of low scrap prices, when the supply of scrap may decline considerably, as scrap generators hold onto their scrap in the hope of getting higher prices later; conversely, increased foreign demand for scrap due to economic expansion in countries such as China, India, Brazil and Turkey can result in an outflow of available domestic scrap as well as higher scrap prices that cannot always be passed on to domestic scrap consumers, further reducing the available domestic scrap flows and scrap margins, all of which could adversely affect our sales and profitability.
Our Arkansas rerolling mill does not have melting capacity, so it is dependent on an adequate supply of competitively priced semi–finished billets either from our mini mills or competitors. Occasionally, our Arkansas rerolling mill utilizes used rail as a feedstock instead of billets, primarily from railroad abandonments or replacements. The inability to source billets internally or purchase competitively priced billets from other sources could adversely affect our business, results of operations and financial condition.
The availability and process of raw materials may also be negatively affected by new laws and regulations, allocations by suppliers, interruptions in production, accidents or natural disasters, changes in exchange rates, worldwide price fluctuations, and the availability and cost of transportation. If we were unable to obtain adequate and timely deliveries of our required raw materials, we may be unable to timely manufacture significant quantities of our products.
Unexpected equipment failures may lead to production curtailments or shutdowns, which may adversely affect our business, results of operations and financial condition.
Interruptions in our production capabilities would adversely affect our production costs, steel available for sale and earnings for the affected period. Our manufacturing processes are dependent upon critical pieces of steel-making equipment, such as our furnaces, continuous casters and rolling equipment, as well as electrical equipment, such as transformers. This equipment may, on occasion, be out of service as a result of unanticipated failures. We have experienced, and may in the future experience, material plant shutdowns or periods of reduced production as a result of such equipment failures. In addition to equipment failures, our facilities are also subject to the risk of catastrophic loss due to unanticipated events such as fires, explosions or violent weather conditions.
19
Operating and start-up risks, as well as commodity and market risks associated with our new micro mill in Durant, Oklahoma could prevent us from realizing anticipated benefits and could result in a loss of all or a substantial part of our investment.
Although we have successfully commissioned and operated similar technology in Mesa, Arizona, there are technological, operational, market and start-up risks associated with the construction and start-up of our micro mill in Durant, Oklahoma. We believe this micro mill should be capable of consistently producing high-quality reinforcing bar and other products, and in sufficient quantities and at a cost that will compare favorably with other similar steel manufacturing facilities; however, there can be no assurance that these expectations will be achieved. If we encounter cost overruns, systems or process difficulties during or after start-up or quality control restrictions, our capital costs could materially increase, the expected cost benefits from the development of this micro mill could be diminished or lost, and we could lose all or a substantial portion of our investment. We could also encounter commodity market risk if, during a sustained period, the cost to manufacture is greater than projected.
Competition from other materials may have a material adverse effect on our business, results of operations and financial condition.
In many applications, steel competes with other materials, such as aluminum and plastics (particularly in the automobile industry), cement, composites, glass and wood. Increased use of or additional substitutes for steel products could adversely affect future market prices and demand for steel products.
Hedging transactions may expose us to losses or limit our potential gains.
Our product lines and worldwide operations expose us to risks associated with fluctuations in foreign currency exchange rates, commodity prices and interest rates. As part of our risk management program, we use financial instruments, including metals commodity futures, natural gas forward contracts, freight forward contracts, foreign currency exchange forward contracts and interest rate swap contracts. While intended to reduce the effects of the fluctuations, these transactions may limit our potential gains or expose us to losses. If our counterparties to such transactions or the sponsors of the exchanges through which these transactions are offered, such as the London Metal Exchange, fail to honor their obligations due to financial distress, we would be exposed to potential losses or the inability to recover anticipated gains from these transactions.
We enter into the foreign currency exchange forward contracts as economic hedges of trade commitments or anticipated commitments denominated in currencies other than the functional currency to mitigate the effects of changes in currency rates. These foreign exchange commitments are dependent on timely performance by our counterparties. Their failure to perform could result in our having to close these hedges without the anticipated underlying transaction and could result in losses if foreign currency exchange rates have changed.
We are subject to litigation and legal compliance risks which could adversely affect our business, results of operations and financial condition.
We are involved in various litigation matters, including regulatory proceedings, administrative proceedings, governmental investigations, environmental matters and construction contract disputes. The nature of our operations also exposes us to possible litigation claims in the future. Because of the uncertain nature of litigation and coverage decisions, we cannot predict the outcome of these matters. These matters could have a material adverse effect on our business, results of operations and financial condition. Litigation is very costly, and the costs associated with prosecuting and defending litigation matters could have a material adverse effect on our business, results of operations and financial condition. Although we are unable to estimate precisely the ultimate dollar amount of exposure to loss in connection with litigation matters, we make accruals as warranted. However, the amounts that we accrue could vary significantly from the amounts we actually pay, due to inherent uncertainties and the inherent shortcomings of the estimation process, the uncertainties involved in litigation and other factors. See Part I, Item 3, Legal Proceedings of this Annual Report on Form 10-K, for a description of our current significant legal proceedings.
As noted above, existing laws or regulations, as currently interpreted or reinterpreted in the future, and future laws and regulations, may have a material adverse effect on our business, results of operations and financial condition. See the risk factor "Compliance with and changes in environmental compliance requirements and remediation requirements could result in substantially increased capital requirements and operating costs; violations of environmental requirements could result in costs that have a material adverse effect on our business, results of operations, and financial condition" above for a description of such risks relating to environmental laws and regulations. In addition to such environmental laws and regulations, complex foreign and U.S. laws and regulations that apply to our international operations, including without limitation the Foreign Corrupt Practices Act and similar laws in other countries, which generally prohibit companies and those acting on their behalf from making improper payments to foreign
20
government officials for the purpose of obtaining or retaining business, regulations related to import-export controls, the Office of Foreign Assets Control sanctions program and antiboycott provisions, may increase our cost of doing business in international jurisdictions and expose us and our employees to elevated risk. While we believe that we have adopted appropriate risk management and compliance programs, the nature of our operations means that legal and compliance risks will continue to exist. A negative outcome in an unusual or significant legal proceeding or compliance investigation could adversely affect our business, results of operations and financial condition.
Some of our operations present significant risk of injury or death.
The industrial activities conducted at certain of our facilities present significant risk of serious injury or death to our employees, customers or other visitors to our operations, notwithstanding our safety precautions, including our material compliance with federal, state and local employee health and safety regulations, and we may be unable to avoid material liabilities for injuries or deaths. We maintain workers' compensation insurance to address the risk of incurring material liabilities for injuries or deaths, but there can be no assurance that the insurance coverage will be adequate or will continue to be available on the terms acceptable to us, or at all, which could result in material liabilities to us for any injuries or deaths.
Health care legislation could result in substantially increased costs and adversely affect our workforce.
The health care mandates enacted in connection with the 2010 Patient Protection and Affordable Care Act may cause us to evaluate the scope of health benefits offered to our workforce and the method in which they are delivered, and increase our and our employees' costs. If we are not able to offer a competitive level of benefits, our ability to hire and retain qualified personnel may be adversely affected. Higher health care costs may result in (i) an inability to reinvest sufficient capital in our operations, (ii) an inability to sustain dividends, (iii) lowered debt ratings and (iv) an increase in the cost of capital, all of which may have a negative effect on the price of our common stock and a material adverse effect on our business, results of operations and financial condition.
None.
21
The following table describes our principal properties as of
August 31, 2017
. These properties are owned by us and not subject to any significant encumbrances, or are leased by us. We consider all properties to be appropriately utilized, suitable and adequate to meet the requirements of our present and foreseeable future operations. Refer to Part I, Item 1 Business included in this Annual Report on Form 10-K for a discussion of the nature of our operations.
22
|
Operation
|
Location
|
Site Acreage Owned
|
Site Acreage Leased
|
Approximate Building Square Footage
|
Capacity (millions of short tons)
(1),(2)
|
|||||||||
|
Americas Recycling
|
3.8
|
|
||||||||||||
|
Recycling
|
Five locations in Florida
|
107
|
|
—
|
|
150,000
|
|
|||||||
|
Recycling
|
Two locations in Missouri
|
42
|
|
3
|
|
90,000
|
|
|||||||
|
Recycling
|
Tulsa, Oklahoma
|
29
|
|
—
|
|
50,000
|
|
|||||||
|
Recycling
|
Five locations in South Carolina
|
147
|
|
2
|
|
270,000
|
|
|||||||
|
Recycling
|
Chattanooga, Tennessee
|
19
|
|
—
|
|
160,000
|
|
|||||||
|
Recycling
|
Thirteen locations in Texas
|
225
|
|
14
|
|
390,000
|
|
|||||||
|
Americas Mills
|
3.1
|
|
||||||||||||
|
Steel Mini Mill
|
Birmingham, Alabama
|
71
|
|
1
|
|
560,000
|
|
|||||||
|
Steel Micro Mill
|
Mesa, Arizona
|
229
|
|
—
|
|
300,000
|
|
|||||||
|
Steel Rerolling Mill
|
Magnolia, Arkansas
|
123
|
|
—
|
|
280,000
|
|
|||||||
|
Steel Mini Mill
|
Cayce, South Carolina
|
142
|
|
—
|
|
760,000
|
|
|||||||
|
Steel Mini Mill
|
Seguin, Texas
|
661
|
|
—
|
|
870,000
|
|
|||||||
|
Americas Fabrication
|
1.5
|
|
||||||||||||
|
Fabrication
|
Mesa, Arizona
|
—
|
|
—
|
|
50,000
|
|
|||||||
|
Fabrication
|
Three locations in California
|
27
|
|
—
|
|
180,000
|
|
|||||||
|
Fabrication
|
Two locations in Colorado
|
8
|
|
—
|
|
120,000
|
|
|||||||
|
Fabrication
|
Two locations in Florida
|
15
|
|
—
|
|
100,000
|
|
|||||||
|
Fabrication
|
Two locations in Georgia
|
19
|
|
8
|
|
220,000
|
|
|||||||
|
Fabrication
|
Kapolei, Hawaii
|
5
|
|
—
|
|
40,000
|
|
|||||||
|
Fabrication
|
Two locations in Illinois
|
11
|
|
10
|
|
110,000
|
|
|||||||
|
Fabrication
|
Two locations in Louisiana
|
21
|
|
—
|
|
190,000
|
|
|||||||
|
Fabrication
|
Gastonia, North Carolina
|
16
|
|
—
|
|
90,000
|
|
|||||||
|
Fabrication
|
Two locations in South Carolina
|
16
|
|
—
|
|
70,000
|
|
|||||||
|
Fabrication
|
Eighteen locations in Texas
|
163
|
|
4
|
|
1,480,000
|
|
|||||||
|
Fabrication
|
Fredericksburg, Virginia
|
10
|
|
—
|
|
60,000
|
|
|||||||
|
Construction Services
|
Five locations in Louisiana
|
7
|
|
6
|
|
110,000
|
|
|||||||
|
Construction Services
|
Eighteen locations in Texas
|
24
|
|
44
|
|
250,000
|
|
|||||||
|
Impact Metals
|
Pell City, Alabama
|
20
|
|
—
|
|
220,000
|
|
|||||||
|
Impact Metals
|
Chicora, Pennsylvania
|
92
|
|
—
|
|
80,000
|
|
|||||||
|
International Mill
|
||||||||||||||
|
Steel Mini Mill
|
Zawiercie, Poland
|
517
|
|
—
|
|
2,760,000
|
|
1.3
|
|
|||||
|
Fabrication
|
Four locations in Poland
|
22
|
|
1
|
|
230,000
|
|
0.3
|
|
|||||
|
Recycling
|
Twelve locations in Poland
|
108
|
|
5
|
|
150,000
|
|
0.6
|
|
|||||
|
International Marketing and Distribution
|
||||||||||||||
|
Steel Trading
|
Carrington, Australia
|
—
|
|
3
|
|
70,000
|
|
|||||||
|
Distribution Warehouse
|
Houston, Texas
|
—
|
|
10
|
|
120,000
|
|
|||||||
|
Recycling
|
Singapore
|
—
|
|
26
|
|
20,000
|
|
|||||||
|
Alloy Briquetting
|
Cayce, South Carolina
|
—
|
|
—
|
|
40,000
|
|
|||||||
(1) Refer to Part I, Item 1 Business included in this Annual Report on Form 10-K for a discussion of the calculation of capacity for our mill-related segments.
23
(2) As our business and the mix of products are constantly changing, the extent of capacity of the facilities by our International Marketing and Distribution segment cannot be accurately stated.
We lease the office space occupied by our corporate headquarters. Our steel trading business headquartered in the U.S. is located in our corporate headquarters.
The leases on the leased properties in the table above will expire on various dates and, with the exception of the CMCP leases in the table above, generally expire over the next seven years. Several of the leases have renewal options. We have had little difficulty in the past renewing such leases prior to their expiration. We estimate our minimum annual rental obligation for all our real estate operating leases in effect at
August 31, 2017
, to be paid during fiscal
2018
, to be approximately $7.7 million.
In the ordinary course of conducting our business, we become involved in litigation, administrative proceedings and government investigations, including environmental matters.
On April 28, 2016, we were served with a lawsuit filed by Ector County, Texas and the State of Texas by and through the Texas Commission on Environmental Quality ("TCEQ") alleging violations of the Texas Solid Waste Disposal Act, the Texas Water Code, the Texas Clean Air Act, and TCEQ rules on spill prevention and control. The Plaintiffs amended their petition in February 2017 to include violations of TCEQ rules on recycling and storm water permits. The Plaintiffs further amended their petition in April 2017, broadening their allegations. The lawsuit, filed in the 201
st
Judicial District Court of Travis County, Texas, alleges improper disposal of solid waste and unauthorized outdoor burning activity at CMC’s recycling facility located in Odessa, Texas. The lawsuit seeks a penalty for each day of alleged violation under the Texas Health & Safety Code, the Texas Water Code, or the Texas Administrative Code. While we do not believe that it is probable that a loss has been incurred, the ultimate resolution of the matter could potentially result in a loss. Management’s best estimate of the low end of the range of the potential loss is zero. At this time, it is not possible to reasonably estimate the high end of the range of the potential loss, which could be material to our results of operations. Accordingly, we have not accrued a loss related to this matter. We believe that the lawsuit is without merit and are aggressively defending the action.
We have received notices from the EPA or state agencies with similar responsibility that we and numerous other parties are considered PRPs and may be obligated under CERCLA, or similar state statutes, to pay for the cost of remedial investigation, feasibility studies and ultimately remediation to correct alleged releases of hazardous substances at ten locations. The notices refer to the following locations, none of which involve real estate we ever owned or upon which we ever conducted operations: the Sapp Battery Site in Cottondale, Florida, the Interstate Lead Company Site in Leeds, Alabama, the Ross Metals Site in Rossville, Tennessee, the Li Tungsten Site in Glen Cove, New York, the Peak Oil Site in Tampa, Florida, the R&H Oil Site in San Antonio, Texas, the SoGreen/Parramore Site in Tifton, Georgia, the Jensen Drive site in Houston, Texas, the Industrial Salvage site in Corpus Christi, Texas, and the Ward Transformer site in Raleigh, North Carolina. We may contest our designation as a PRP with regard to certain sites, while at other sites we are participating with other named PRPs in agreements or negotiations that have resulted or that we expect will result in agreements to remediate the sites. During 2010, we acquired a 70% interest in the real property at Jensen Drive as part of the remediation of that site. We have periodically received information requests from government environmental agencies with regard to other sites that are apparently under consideration for designation as listed sites under CERCLA or similar state statutes. Often we do not receive any further communication with regard to these sites, and as of the date of this Annual Report on Form 10-K, we do not know if any of these inquiries will ultimately result in a demand for payment from us.
The EPA notified us and other alleged PRPs that under Section 106 of CERCLA, we and the other PRPs could be subject to a maximum fine of $25,000 per day and the imposition of treble damages if we and the other PRPs refuse to clean up the Peak Oil, Sapp Battery and SoGreen/Parramore sites as ordered by the EPA. We are presently participating in PRP organizations at these sites, which are paying for certain site remediation expenses. We do not believe that the EPA will pursue any fines against us if we continue to participate in the PRP groups or if we have adequate defenses to the EPA's imposition of fines against us in these matters.
We believe that adequate provisions have been made in the financial statements for the potential impact of any loss in connection with the above-described legal proceedings and environmental matters. Management believes that the outcome of the proceedings mentioned, and other miscellaneous litigation and proceedings now pending, will not have a material adverse effect on our business, results of operations or financial condition.
24
Not applicable.
MARKET AND DIVIDEND INFORMATION
The table below summarizes the high and low sales prices per share of CMC common stock, as reported on the New York Stock Exchange (the "NYSE"), and the quarterly cash dividends per share that CMC paid for the past two fiscal years.
PRICE RANGE
OF COMMON STOCK
|
2017
FISCAL QUARTER |
HIGH
|
LOW
|
CASH DIVIDENDS
|
|||
|
1st
|
$22.58
|
$14.58
|
$0.12
|
|||
|
2nd
|
24.64
|
19.90
|
0.12
|
|||
|
3rd
|
22.32
|
17.16
|
0.12
|
|||
|
4th
|
21.00
|
17.05
|
0.12
|
|||
|
2016
FISCAL QUARTER |
HIGH
|
LOW
|
CASH DIVIDENDS
|
|||
|
1st
|
$17.00
|
$13.24
|
$0.12
|
|||
|
2nd
|
15.08
|
12.44
|
0.12
|
|||
|
3rd
|
18.50
|
14.76
|
0.12
|
|||
|
4th
|
18.36
|
15.15
|
0.12
|
|||
CMC common stock is traded on the NYSE. The number of stockholders of record of CMC common stock at
October 24, 2017
was 3,392.
EQUITY COMPENSATION PLANS
Information about our equity compensation plans as of
August 31, 2017
was as follows:
|
A.
|
B.
|
C.
|
||||
|
PLAN CATEGORY
|
NUMBER OF SECURITIES
TO BE ISSUED UPON EXERCISE OF OUTSTANDING OPTIONS, WARRANTS AND RIGHTS |
WEIGHTED-AVERAGE
EXERCISE PRICE OF OUTSTANDING OPTIONS, WARRANTS AND RIGHTS |
NUMBER OF SECURITIES
REMAINING AVAILABLE FOR FUTURE ISSUANCE UNDER EQUITY COMPENSATION PLANS (EXCLUDING SECURITIES REFLECTED IN COLUMN (A)) |
|||
|
Equity
|
|
|
|
|||
|
Compensation plans
approved by security holders |
2,562,887
|
$15.56
|
11,144,004
|
|||
|
Equity
|
|
|
|
|||
|
Compensation plans not approved by security holders
|
—
|
—
|
—
|
|||
|
TOTAL
|
2,562,887
|
$15.56
|
11,144,004
|
|||
25
STOCK PERFORMANCE GRAPH
The following graph compares the cumulative total return of CMC common stock during the five year period beginning September 1, 2012 and ending
August 31, 2017
with the Standard & Poor's 500 Composite Stock Price Index (the "S&P 500") and the Standard & Poor's Steel Industry Group Index (the "S&P Steel Group"). Each index assumes $100 invested at the close of trading August 31, 2012, and reinvestment of dividends.
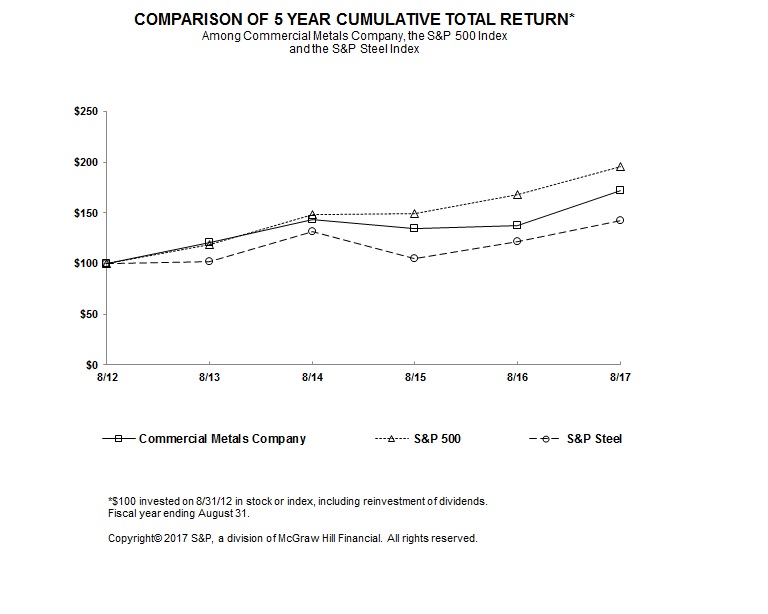
|
8/12
|
8/13
|
8/14
|
8/15
|
8/16
|
8/17
|
|||||||
|
Commercial Metals Company
|
100.00
|
120.68
|
143.77
|
134.76
|
137.50
|
171.62
|
||||||
|
S&P 500
|
100.00
|
118.70
|
148.67
|
149.38
|
168.13
|
195.43
|
||||||
|
S&P Steel
|
100.00
|
102.23
|
131.63
|
104.95
|
121.80
|
142.08
|
||||||
26
PURCHASES OF EQUITY SECURITIES BY THE ISSUER AND AFFILIATED PURCHASERS
The following table provides information about purchases by the Company during the quarter ended
August 31, 2017
of equity securities that are registered by the Company pursuant to Section 12 of the Exchange Act.
ISSUER PURCHASES OF EQUITY SECURITIES
|
Period
|
Total Number of Shares Purchased
|
Average Price Paid per Share
|
Total Number of Shares Purchased as Part of Publicly Announced Plans or Programs
|
Approximate Dollar Value of Shares that May Yet Be Purchased Under the Plans or Programs
(1)
|
|||||||||
|
June 1, 2017 - June 30, 2017
|
—
|
|
—
|
|
—
|
|
$
|
27,598,706
|
|
||||
|
July 1, 2017 - July 31, 2017
|
—
|
|
—
|
|
—
|
|
27,598,706
|
|
|||||
|
August 1, 2017 - August 31, 2017
|
—
|
|
—
|
|
—
|
|
27,598,706
|
|
|||||
|
Total
|
—
|
|
—
|
|
|||||||||
|
(1)
|
During the first quarter of fiscal 2015, the Company announced that CMC's Board of Directors had authorized a share repurchase program under which the Company may repurchase up to $100.0 million of shares of CMC common stock. The share repurchase program does not require the Company to purchase any dollar amount or number of shares of CMC common stock and may be modified, suspended, extended or terminated by the Company at any time without prior notice.
|
The following table sets forth selected consolidated financial data derived from our audited financial statements for each of the five years in the period ended
August 31, 2017
. The data presented below should be read in conjunction with "Management's Discussion and Analysis of Financial Condition and Results of Operations" set forth in Part II, Item 7 of this Annual Report on Form 10-K and the consolidated financial statements and the accompanying notes set forth in Part II, Item 8 of this Annual Report on Form 10-K.
|
Year Ended August 31,
|
||||||||||||||||||||
|
(in thousands, except per share and ratio data)
|
2017
|
2016
|
2015
|
2014
|
2013
|
|||||||||||||||
|
Net sales*
|
$
|
4,569,675
|
|
$
|
4,177,518
|
|
$
|
5,424,413
|
|
$6,196,630
|
$
|
5,757,478
|
|
|||||||
|
Earnings from continuing operations
|
32,550
|
|
57,900
|
|
63,004
|
|
104,167
|
|
62,806
|
|
||||||||||
|
Diluted earnings per share from continuing operations
|
0.27
|
|
0.50
|
0.53
|
|
0.88
|
|
0.53
|
|
|||||||||||
|
Cash dividends per share
|
0.48
|
|
0.48
|
|
0.48
|
|
0.48
|
|
0.48
|
|
||||||||||
|
Adjusted operating profit from continuing operations+
|
89,914
|
|
132,519
|
|
174,465
|
|
228,863
|
|
165,155
|
|
||||||||||
|
Capital expenditures
|
213,120
|
|
163,332
|
|
119,580
|
|
101,749
|
|
89,035
|
|
||||||||||
|
August 31,
|
||||||||||||||||||||
|
2017
|
2016
|
2015
|
2014
|
2013
|
||||||||||||||||
|
Total assets
|
$
|
2,975,131
|
|
$
|
3,130,869
|
|
$
|
3,439,951
|
|
$
|
3,833,708
|
|
$
|
3,620,370
|
|
|||||
|
Long-term debt (includes current maturities)
|
824,762
|
|
1,071,417
|
|
1,282,355
|
|
1,282,212
|
|
1,276,010
|
|
||||||||||
|
Stockholders' equity
|
1,400,757
|
|
1,367,272
|
|
1,381,225
|
|
1,472,695
|
|
1,396,522
|
|
||||||||||
__________________________
* Excludes divisions classified as discontinued operations. For additional information on discontinued operations, see Note 3, Changes in Business, to the consolidated financial statements contained in this Annual Report on Form 10-K.
+ Non-GAAP financial measure. Refer to the reconciliation of adjusted operating profit from continuing operations to earnings from continuing operations in Non-GAAP Financial Measures at the end of Item 7.
27
This Annual Report on Form 10-K contains "forward-looking statements" within the meaning of the federal securities laws with respect to general economic conditions, our financial condition, results of operations, cash flows and business and our expectations or beliefs concerning future events, including the demand for our products, the ability to operate our mills at full capacity, future supplies of raw materials and energy for our operations, share repurchases, renewing the credit facilities of our Polish subsidiary, reinvesting the undistributed earnings of our non-U.S. subsidiaries, U.S. non-residential construction activity, international trade, expectations regarding our liquidity, our capital spending, and plans for future acquisitions, the effects of the outcomes of current contingencies, the new Oklahoma micro mill and our operating plans. These forward-looking statements can generally be identified by phrases such as we or our management "expects," "anticipates," "believes," "estimates," "intends," "plans to," "ought," "could," "will," "should," "likely," "appears," "projects," "forecasts," "outlook" or other similar words or phrases. There are inherent risks and uncertainties in any forward-looking statements. We caution readers not to place undue reliance on any forward-looking statements.
Our forward-looking statements are based on management's expectations and beliefs as of the time this Annual Report on Form 10-K is filed with the SEC or, with respect to any document incorporated by reference, as of the time such document was prepared. Although we believe that our expectations are reasonable, we can give no assurance that these expectations will prove to have been correct, and actual results may vary materially. These factors include those described in Part I, Item 1A "Risk Factors" of this Annual Report on Form 10-K. Except as required by law, we undertake no obligation to update, amend or clarify any forward-looking statements to reflect changed assumptions, the occurrence of anticipated or unanticipated events, new information or circumstances or any other changes. Some of the important factors that could cause actual results to differ materially from our expectations include the following:
|
•
|
conditions, including the ongoing recovery from the last recession, continued sovereign debt problems in the Euro-zone and construction activity or lack thereof, and their impact in a highly cyclical industry;
|
|
•
|
rapid and significant changes in the price of metals, potentially impairing our inventory values due to declines in commodity prices;
|
|
•
|
excess capacity in our industry, particularly in China, and product availability from competing steel mills and other steel suppliers including import quantities and pricing;
|
|
•
|
compliance with and changes in environmental laws and regulations, including increased regulation associated with climate change and greenhouse gas emissions;
|
|
•
|
involvement in various environmental matters that may result in fines, penalties or judgments;
|
|
•
|
potential limitations in our or our customers' abilities to access credit and non-compliance by our customers with our contracts;
|
|
•
|
activity in repurchasing shares of our common stock under our repurchase program;
|
|
•
|
financial covenants and restrictions on the operation of our business contained in agreements governing our debt;
|
|
•
|
ability to successfully identify, consummate, and integrate acquisitions and the effects that acquisitions may have on our financial leverage;
|
|
•
|
impact of goodwill impairment charges;
|
|
•
|
impact of long-lived asset impairment charges;
|
|
•
|
currency fluctuations;
|
|
•
|
global factors, including political uncertainties and military conflicts;
|
|
•
|
availability of electricity and natural gas for mill operations;
|
|
•
|
ability to hire and retain key executives and other employees;
|
28
|
•
|
competition from other materials or from competitors that have a lower cost structure or access to greater financial resources;
|
|
•
|
information technology interruptions and breaches in security data;
|
|
•
|
ability to make necessary capital expenditures;
|
|
•
|
availability and pricing of raw materials and other items over which we exert little influence, including scrap metal, energy and insurance;
|
|
•
|
unexpected equipment failures;
|
|
•
|
ability to realize the anticipated benefits of our investment in our new micro mill in Durant, Oklahoma;
|
|
•
|
losses or limited potential gains due to hedging transactions;
|
|
•
|
litigation claims and settlements, court decisions, regulatory rulings and legal compliance risks;
|
|
•
|
risk of injury or death to employees, customers or other visitors to our operations; and
|
|
•
|
increased costs related to health care reform legislation.
|
This Management's Discussion and Analysis of Financial Condition and Results of Operations should be read in conjunction with our consolidated financial statements and the accompanying notes contained in this Annual Report on Form 10-K.
OVERVIEW
As a vertically integrated organization, we manufacture, recycle and market steel and metal products, related materials and services through a network including four EAF mini mills, an EAF micro mill, a rerolling mill, steel fabrication and processing plants, construction-related product warehouses, metal recycling facilities and marketing and distribution offices in the U.S. and in strategic international markets. Our operations are conducted through
five
business segments: Americas Recycling, Americas Mills, Americas Fabrication, International Mill and International Marketing and Distribution. See Part I, Item 1, Business, for further information regarding our business and segments.
OUTLOOK
Our outlook for demand from the U.S. non-residential construction market remains positive, in spite of a lack of movement on infrastructure stimulus being introduced. However, market conditions remain very challenging as a result of raw material price changes and escalating input costs. Metal margins remain under pressure due to the ongoing influx of dumped and subsidized imports. We saw a temporary pause in rebar imports after the announcement of the Section 232 review into the effect of imports on national security. However, recent data indicates another surge in rebar imports is on its way. We believe that no action taken by the current Administration to address these unfair trade practices is likely to result in imports returning to their previous high levels, negatively impacting the industry's operating results or potentially even imperiling the long-term viability of the U.S. steel industry.
Poland, however, provides a contrast to the U.S. market. Poland and the European Union ("EU") have implemented trade measures necessary to provide a level playing field. This, coupled with the fact that there is good support and financial funding for infrastructure development in Poland and the EU, provide a good demand outlook for our Polish operations.
29
RESULTS OF OPERATIONS SUMMARY
The following discussion of our results of operations is based on our continuing operations and excludes any results of our discontinued operations. In the table below, we have included financial measures that were not derived in accordance with accounting principles generally accepted in the U.S. ("GAAP"). Refer to the reconciliations of adjusted operating profit from continuing operations and adjusted EBITDA from continuing operations, each to earnings from continuing operations, in Non-GAAP Financial Measures at the end of this Item 7.
|
|
Year Ended August 31,
|
|||||||||||
|
(in thousands except per share data)
|
2017
|
2016
|
2015
|
|||||||||
|
Net sales*
|
$
|
4,569,675
|
|
$
|
4,177,518
|
|
$
|
5,424,413
|
|
|||
|
Earnings from continuing operations
|
32,550
|
|
57,900
|
|
63,004
|
|
||||||
|
Adjusted operating profit from continuing operations+
|
89,914
|
|
132,519
|
|
174,465
|
|
||||||
|
Adjusted EBITDA from continuing operations+
|
222,268
|
|
297,777
|
|
315,236
|
|
||||||
|
Diluted net earnings per share
|
0.39
|
|
0.47
|
|
0.67
|
|
||||||
_________________________
* Excludes divisions classified as discontinued operations.
+ Non-GAAP financial measure. Refer to the reconciliation of adjusted operating profit from continuing operations and adjusted EBITDA from continuing operations to earnings from continuing operations in Non-GAAP Financial Measures at the of this Item 7.
Fiscal Year
2017
Compared to Fiscal Year
2016
Summary
Net sales for fiscal
2017
increased $0.4 billion, or 9%, compared to fiscal
2016
. The increase in net sales was primarily due to increasing ferrous scrap prices throughout fiscal
2017
, strong scrap demand from increased domestic steel mill capacity utilization, improved demand in the construction and energy markets and increasing average selling prices in Poland due to lower rebar imports. Changes in the U.S. dollar relative to other currencies did not have a material impact on the change in net sales in fiscal
2017
.
Earnings from continuing operations and adjusted operating profit from continuing operations for fiscal
2017
decreased $25.4 million and $42.6 million, or 44% and 32%, respectively, compared to fiscal
2016
. These decreases were primarily due to margin pressures faced by our Americas Mills and Americas Fabrication segments from aggressive competition and continued high levels of imported rebar into the U.S. at low pricing, resulting in declines in adjusted operating profit for those segments of $40.9 million and $64.5 million, respectively. Partially offsetting these margin pressures, our Americas Recycling segment realized a $76.1 million improvement in adjusted operating profit amid rising scrap prices and margin expansion. The prior year results for the Americas Recycling segment included a $38.9 million long-lived asset impairment. Furthermore, our International Mill segment realized an $18.1 million increase in adjusted operating profit primarily from a
10%
increase in volumes, partially offset by a
2%
decrease in average metal margin. Further contributing to the decline in earnings and adjusted operating profit, we also recognized charges during fiscal
2017
, including an increase in debt extinguishment costs of $11.2 million and $5.8 million increase in severance costs. See Note 10, Credit Arrangements, to the consolidated financial statements included in this Annual Report on Form 10-K for additional information regarding debt extinguishments. Changes in the U.S. dollar relative to other currencies did not have a material impact on the changes in earnings from continuing operations or adjusted operating profit from continuing operations in fiscal
2017
.
Selling, General and Administrative Expenses
Selling, general and administrative expenses from continuing operations in fiscal
2017
increased
$12.0 million
compared to fiscal
2016
. The increase was primarily due to a $7.5 million increase in professional services, a $3.6 million increase in employee-related expenses, of which $3.1 million related to mark-to-market adjustment expenses associated with our outstanding equity awards accounted for as liability awards, and a $3.0 million increase in nonqualified benefit restoration plan ("BRP") expenses compared to fiscal 2016. The increase was partially offset by a decrease of $2.1 million in depreciation expense.
30
Interest Expense
Interest expense from continuing operations in fiscal
2017
decreased $18.1 million compared to fiscal
2016
primarily due to (i) a decrease of $7.8 million from the repayment of long-term debt during fiscal 2016 and 2017; (ii) a $4.1 million acceleration of unamortized deferred gains on interest rate swap transactions as a result of early extinguishment of long-term debt and (iii) the effect of a $6.5 million increase in capitalized interest, which decreased interest expense, related to construction of the steel micro mill in Durant, Oklahoma. See Note 10, Credit Arrangements, to the consolidated financial statements included in this Annual Report on Form 10-K for additional information regarding the repayment of long-term debt.
Income Taxes
Our effective income tax rate from continuing operations for the year ended
August 31, 2017
was
27.7%
compared to
15.7%
for the year ended August 31,
2016
. The year over year increase to our effective income tax rate is primarily due to a non-recurring $10.3 million discrete benefit recorded during fiscal 2016 related to the settlement of an audit, which reduced the fiscal 2016 effective tax rate. Our income tax rate in fiscal 2017 also increased due to a lower benefit realized under Section 199 of the Internal Revenue Code ("Section 199") compared to the benefit realized during fiscal 2016. The decrease in Section 199 benefit was primarily driven by lower income before taxes in the U.S. Despite these items which increased the effective tax rate over the prior year, our fiscal 2017 effective tax rate was less than the statutory rate of 35% because the rate benefited from a higher proportion of global income earned from operations in countries that have lower statutory income tax rates than the U.S., including Poland, which has a statutory income tax rate of 19%. Additionally, our effective income tax rate was favorably impacted by a non-taxable gain on assets related to our nonqualified BRP which was larger than the comparable non-taxable gain recognized during fiscal 2016.
We intend to indefinitely reinvest all undistributed earnings of non-U.S. subsidiaries. If a repatriation of earnings occurs in the future, we would be required to provide for income taxes on dividends from our non-U.S. subsidiaries. Determination of the unrecognized deferred income tax liability related to the undistributed earnings of our non-U.S. subsidiaries is not practicable because of the complexities related to its hypothetical calculation.
Fiscal Year
2016
Compared to Fiscal Year
2015
Summary
Net sales for fiscal 2016 decreased $1.2 billion, or 23%, compared to fiscal 2015. The decrease in net sales was primarily due to a decrease in average selling prices across all of our segments and a decrease in shipments for our Americas Recycling, Americas Mills and International Marketing and Distribution segments. Import pressure in the U.S., excess global capacity as well as weak demand from the oil and gas industry, which began during the second half of fiscal 2015 and continued throughout fiscal 2016, adversely impacted selling prices and volumes. The change in net sales for fiscal 2016 reflects unfavorable foreign currency fluctuation impacts of approximately $62.3 million due to the strengthening of the U.S. dollar in relation to the zloty, Australian dollar and British pound.
Earnings from continuing operations were
$57.9 million
and
$63.0 million
for fiscal years 2016 and 2015, respectively. Adjusted operating profit from continuing operations for fiscal 2016 decreased $41.9 million, or 24%, compared to fiscal 2015 primarily driven by our Americas Recycling and Americas Mills segments and the decrease in volumes discussed above. Our Americas Recycling segment recorded fixed asset impairment charges of $38.9 million in fiscal 2016 compared to goodwill impairment charges of $7.3 million in fiscal 2015. See Note 7, Goodwill and Other Intangible Assets, and Note 8, Long-lived Asset Impairment and Facility Closure Costs, to the consolidated financial statements in this Annual Report on Form 10-K, for additional information on these impairments. Our Americas Recycling segment was also adversely impacted by average metal margin compression for ferrous material, while average metal margin for nonferrous material remained flat. Additionally, average metal margins for our Americas Mills segment decreased 11%. In contrast, for fiscal 2016, our Americas Fabrication segment benefited from a 7% increase in average composite metal margin compared to fiscal 2015. Changes in the U.S. dollar relative to other currencies did not have a material impact on the change in adjusted operating profit from continuing operations in fiscal 2016.
Selling, General and Administrative Expenses
Selling, general and administrative expenses from continuing operations in fiscal 2016 increased
$0.5 million
compared to fiscal 2015. The increase in selling, general, and administrative expenses was primarily due to a $5.0 million increase in nonqualified BRP expenses, a $4.4 million increase in bad debt expense and a $2.4 million increase in employee-related expenses, in each case compared to fiscal 2015. These increases in selling, general, and administrative expenses were partially offset by an $8.1 million
31
reduction in net realized and unrealized losses from foreign currency transactions and foreign exchange derivative activities coupled with a decrease in depreciation expense of $2.5 million, compared to fiscal 2015.
Interest Expense
Interest expense from continuing operations in fiscal 2016 decreased
$14.3 million
compared to fiscal 2015. The partial repayment of certain long-term notes in the second quarter of fiscal 2016 reduced interest expense by $7.4 million for fiscal 2016 compared to fiscal 2015. Additionally, the decrease in usage of documentary letters of credit for our International Marketing and Distribution segment lowered interest expense by $4.0 million for fiscal 2016 compared to fiscal 2015. See Note 10, Credit Arrangements, to the consolidated financial statements included in this Annual Report on Form 10-K for additional information regarding the repayment of long-term notes.
Income Taxes
Our effective income tax rate from continuing operations for the year ended August 31, 2016 was 15.7% compared to 34.7% for the year ended August 31, 2015. In fiscal 2016, our effective income tax rate was favorably impacted by net discrete benefits totaling $10.3 million resulting from the settlement of an audit, including the release of certain unrecognized tax benefits for which the accruals were greater than the amount assessed. Our income tax rate also benefited from a higher proportion of global income earned from operations in countries that have lower statutory income tax rates than the U.S., including Poland. Additionally, we realized a benefit under Section 199 related to U.S. production activity income, which was consistent with the benefit for fiscal 2015. However, with lower income before tax for 2016, the fiscal 2016 Section 199 benefit had a larger impact on our tax rate, causing our income tax rate to decrease year over year. Additionally, during fiscal 2016 we had a non-taxable gain on assets related to our nonqualified BRP, compared to fiscal 2015, which was a non-deductible loss, and caused our effective tax rate to decrease year over year.
SEGMENTS
Unless otherwise indicated, all dollar amounts below are from continuing operations and calculated before income taxes. Financial results for our reportable segments are consistent with the basis in which we internally disaggregate financial information for the purpose of making operating decisions. See Note 21, Business Segments, to the consolidated financial statements included in this Annual Report on Form 10-K.
Fiscal Year
2017
Compared to Fiscal Year
2016
Americas Recycling
|
|
Year Ended August 31,
|
|||||||
|
(in thousands)
|
2017
|
2016
|
||||||
|
Net sales
|
$
|
1,011,500
|
|
$
|
705,754
|
|
||
|
Adjusted operating profit (loss)
|
14,822
|
|
(61,284
|
)
|
||||
|
Average selling price (per short ton)
|
||||||||
|
Ferrous
|
$
|
242
|
|
$
|
192
|
|
||
|
Nonferrous
|
2,019
|
|
1,711
|
|
||||
|
Short tons shipped (in thousands)
|
||||||
|
Ferrous
|
1,999
|
|
1,614
|
|
||
|
Nonferrous
|
234
|
|
201
|
|
||
|
Total tons shipped
|
2,233
|
|
1,815
|
|
||
Net sales in fiscal
2017
increased
$305.7 million
, or
43%
, compared to fiscal
2016
primarily due to an increase in the average ferrous selling price by
$50
per short ton coupled with a
24%
increase in ferrous tons shipped. Additionally, the average nonferrous selling price increased
$308
per short ton and nonferrous tons shipped increased
16%
. The improvements in ferrous and nonferrous tons shipped resulted from strong scrap demand due to increased domestic steel mill capacity utilization along with our acquisition of seven recycling facilities during the third quarter of fiscal
2017
. Refer to Note 3, Changes in Business, to the consolidated financial statements in this Annual Report on Form 10-K for further information regarding the acquisition of recycling facilities.
32
Adjusted operating profit in fiscal
2017
increased
$76.1 million
compared to fiscal
2016
primarily due to impairment charges of $38.9 million recorded in fiscal
2016
while no such impairment charges were recorded in fiscal 2017. See Note 8, Long-lived Asset Impairment and Facility Closure Costs, to the consolidated financial statements in this Annual Report on Form 10-K for additional information on the impairment recorded during fiscal
2016
. Adjusted operating profit was also positively affected by the increase in average ferrous metal margin of 10%, coupled with average nonferrous metal margin expansion of 15%. Furthermore, employee related expenses declined 16% per short ton due to the increases in tons shipped discussed above, offset by a 10% per short ton increase in supplies expense.
Americas Mills
|
|
Year Ended August 31,
|
|||||||
|
(in thousands)
|
2017
|
2016
|
||||||
|
Net sales
|
$
|
1,565,454
|
|
$
|
1,498,848
|
|
||
|
Adjusted operating profit
|
168,805
|
|
209,751
|
|
||||
|
Average steel mill price (per short ton)
|
||||||||
|
Finished goods selling price
|
$
|
534
|
|
$
|
534
|
|
||
|
Total sales
|
526
|
|
524
|
|
||||
|
Cost of ferrous scrap utilized
|
243
|
|
207
|
|
||||
|
Metal margin
|
283
|
|
317
|
|
||||
|
Steel mill short tons (in thousands)
|
||||||
|
Melted
|
2,603
|
|
2,522
|
|
||
|
Rolled
|
2,476
|
|
2,382
|
|
||
|
Shipped
|
2,725
|
|
2,630
|
|
||
Net sales in fiscal
2017
increased
$66.6 million
, or
4%
, compared to fiscal
2016
principally due to a
4%
increase in total shipments compared to fiscal
2016
, while average selling prices remained flat. Finished products shipments and shipments of our semi-finished products increased approximately 61 thousand and 34 thousand short tons compared to fiscal
2016
due to stronger demand in fiscal 2017.
Adjusted operating profit in fiscal
2017
decreased
$40.9 million
compared to fiscal
2016
, due in part to average metal margin decreasing $34 per short ton as average selling prices did not keep pace with ferrous scrap cost increases. Partially offsetting margin compression was a $4.1 million decrease in repairs and maintenance expenses due to variances in the timing and amounts of routine maintenance and equipment enhancements conducted in the normal course of business.
Americas Fabrication
|
|
Year Ended August 31,
|
|||||||
|
(in thousands)
|
2017
|
2016
|
||||||
|
Net sales
|
$
|
1,375,928
|
|
$
|
1,489,455
|
|
||
|
Adjusted operating profit
|
4,097
|
|
68,602
|
|
||||
|
Average selling price (excluding stock and buyout sales) (per short ton)
|
||||||||
|
Rebar
|
$
|
738
|
|
$
|
804
|
|
||
|
Structural
|
2,204
|
|
2,276
|
|
||||
|
Post
|
839
|
|
853
|
|
||||
|
Short tons shipped (in thousands)
|
||||||
|
Rebar
|
1,009
|
|
1,028
|
|
||
|
Structural
|
25
|
|
32
|
|
||
|
Post
|
87
|
|
95
|
|
||
33
Net sales in fiscal
2017
decreased
$113.5 million
, or
8%
, compared to fiscal
2016
. The decrease in net sales was primarily due to a decrease in the average composite selling price of $69 per short ton compared to fiscal
2016
as a result of aggressive competition spurred by significant imports of low cost rebar during fiscal 2017, negatively impacting the average composite selling price of projects running through our fabrication backlog, coupled with a
3%
decrease in tons shipped, compared to fiscal
2016
.
Adjusted operating profit in fiscal
2017
decreased
$64.5 million
compared to fiscal
2016
, primarily due to a decrease in average composite metal margin of 15% as the average composite selling price declined faster than the decline in average composite material cost and selling general and administrative costs, compared to fiscal
2016
.
International Mill
|
|
Year Ended August 31,
|
|||||||
|
(in thousands)
|
2017
|
2016
|
||||||
|
Net sales
|
$
|
636,562
|
|
$
|
517,186
|
|
||
|
Adjusted operating profit
|
46,977
|
|
28,892
|
|
||||
|
Average price (per short ton)
|
||||||||
|
Total sales
|
$
|
432
|
|
$
|
391
|
|
||
|
Cost of ferrous scrap utilized
|
240
|
|
195
|
|
||||
|
Metal margin
|
192
|
|
196
|
|
||||
|
Ferrous scrap purchase price
|
203
|
|
163
|
|
||||
|
Short tons (in thousands)
|
||||||||
|
Tons melted
|
1,465
|
|
1,284
|
|
||||
|
Tons rolled
|
1,286
|
|
1,243
|
|
||||
|
Tons shipped
|
1,379
|
|
1,254
|
|
||||
Net sales in fiscal
2017
increased
$119.4 million
, or
23%
, compared to fiscal
2016
primarily due to a
10%
increase in average selling price, as well as a
10%
increase in shipments. The increase in average selling price for fiscal
2017
was due to strong demand for steel as a result of manufacturing and industrial activity, coupled with a shift in product mix, including a 5% increase in higher-priced merchant shipments, compared to fiscal 2016. Changes in the U.S. dollar relative to the Polish zloty did not have a material impact on the change in this segment's net sales for fiscal
2017
.
Adjusted operating profit in fiscal
2017
increased
$18.1 million
compared to fiscal
2016
, primarily driven by the increase in volume discussed above. However, during fiscal
2017
, average metal margin decreased
2%
as a result of a
$45
per short ton increase in average cost of ferrous scrap utilized compared to fiscal 2016. This was partially offset by a
$41
per short ton increase in the average selling price over fiscal
2016
as well as reductions in utilities expense per ton of 6% resulting from lower energy rates and greater efficiencies in our production processes. Changes in the U.S. dollar relative to the Polish zloty did not have a material impact on the change in this segment's adjusted operating profit for fiscal
2017
.
International Marketing and Distribution
|
|
Year Ended August 31,
|
|||||||
|
(in thousands)
|
2017
|
2016
|
||||||
|
Net sales
|
$
|
781,364
|
|
$
|
754,958
|
|
||
|
Adjusted operating loss
|
(24,324
|
)
|
(23,690
|
)
|
||||
On June 13, 2017, we announced our plan to exit our International Marketing and Distribution segment. See Note 3, Changes in Business, for further information.
Net sales in fiscal
2017
increased
$26.4 million
, or
3%
, compared to fiscal
2016
. The increase in net sales for fiscal
2017
was primarily due to increases in volumes sold and the average selling price in our steel trading business headquartered in the U.S. driven by increased demand from the oil and gas industry and an increase in volumes sold in Australia due to strong demand from our distributor and construction end users. These increases were partially offset by a decrease in volumes sold for our European and Asian operations as a result of our decision to exit the United Kingdom steel trading business in the fourth quarter of fiscal
34
2016 and our decision to exit the Asian operations in the fourth quarter of fiscal 2017. Changes in the U.S. dollar relative to other currencies did not have a material impact on the change in this segment's net sales for fiscal
2017
.
Adjusted operating loss in fiscal
2017
increased
$0.6 million
, or
3%
, compared to fiscal
2016
. Overall, the underlying operations of this segment improved, particularly for our steel trading business headquartered in the U.S. as a result of improvements within the energy market throughout fiscal
2017
. Despite the improvement in operations, this segment recognized certain charges related to the announced plan to exit this segment, resulting in the increase in adjusted operating loss, including: (i) a $8.4 million increase in inventory write-downs, (ii) a $4.2 million impairment charge related to accumulated foreign currency translation loss for our Australian operations and (iii) a $2.0 million goodwill impairment charge. Changes in the U.S. dollar relative to other currencies did not have a material impact on the change in this segment's adjusted operating loss for fiscal
2017
.
Corporate
Corporate expenses in fiscal
2017
increased
$24.5 million
to
$119.6 million
compared to fiscal
2016
primarily due to the loss on debt extinguishment of $22.7 million in fiscal
2017
compared to $11.5 million in fiscal
2016
. See Note 10, Credit Arrangements, to the consolidated financial statements included in this Annual Report on Form 10-K for further information. Additionally, severance expense related to the exit of certain executives and professional service fees both increased $2.1 million and $6.7 million, respectively, compared to fiscal
2016
.
Discontinued Operations
On June 13, 2017, we announced a plan to exit our International Marketing and Distribution segment. As an initial step in this plan, on August 31, 2017, we completed the sale of CMC Cometals for $170.9 million, subject to customary post-closing adjustments. In addition, we announced our plan to restructure and sell the remaining trading operations, including CMC Cometals Steel and locations in Asia and Australia. We have included the results of the sale and the activity related to CMC Cometals in discontinued operations in the consolidated statements of earnings for all periods presented. The remainder of the International Marketing and Distribution segment is expected to be classified in discontinued operations either upon meeting the criteria to be classified as held for sale or upon the wind-down of each operation.
Despite focused efforts and substantial progress to stabilize and improve the results of our Australian steel distribution business, in the first quarter of fiscal 2015, we decided to exit our steel distribution business in Australia which met the definition of a discontinued operation. As a result, our steel distribution business in Australia has been presented as a discontinued operation for all periods. During the fourth quarter of fiscal 2015, we completed the sale of
six
locations that were a part of the Australian steel distribution business for proceeds of
$26.4 million
, subject to customary purchase price adjustments, which included an
$8.1 million
pre-tax gain on sale primarily associated with a currency translation gain of
$10.1 million
. In the third quarter of fiscal 2016, we recognized a combined $15.8 million in impairment losses on the remaining asset group held for sale. In the fourth quarter of fiscal 2016, we completed the sale of the one remaining Australian steel distribution location for proceeds of $4.4 million, resulting in a nominal impact to earnings from discontinued operations for fiscal year 2016. Our Australian steel distribution business was previously included in the International Marketing and Distribution segment.
See Note 3, Changes in Business, to the consolidated financial statements contained in this Annual Report on Form 10-K, for additional information.
35
Fiscal Year
2016
Compared to Fiscal Year
2015
Americas Recycling
|
|
Year Ended August 31,
|
|||||||
|
(in thousands)
|
2016
|
2015
|
||||||
|
Net sales
|
$
|
705,754
|
|
$
|
1,022,621
|
|
||
|
Adjusted operating loss
|
(61,284
|
)
|
(29,157
|
)
|
||||
|
Average selling price (per short ton)
|
||||||||
|
Ferrous
|
$
|
192
|
|
$
|
257
|
|
||
|
Nonferrous
|
1,711
|
|
2,273
|
|
||||
|
Short tons shipped (in thousands)
|
||||||
|
Ferrous
|
1,614
|
|
1,778
|
|
||
|
Nonferrous
|
201
|
|
225
|
|
||
|
Total tons shipped
|
1,815
|
|
2,003
|
|
||
Net sales in fiscal 2016 decreased $316.9 million, or 31%, compared to fiscal 2015 primarily due to a decrease in the average ferrous selling price by $65 per short ton coupled with a 9% decrease in ferrous tons shipped. Additionally, the average nonferrous selling price declined $562 per short ton and nonferrous tons shipped decreased 11%. Global steel production overcapacity, specifically in China, continued to depress the price of steel. Additionally, a strong U.S. dollar, low iron ore pricing, and weak oil prices continued to negatively affect the market.
Adjusted operating loss in fiscal 2016 increased $32.1 million compared to fiscal 2015 primarily due to an increase in impairment charges of $31.4 million compared to fiscal 2015. This segment recorded fixed asset impairment charges of $38.9 million in fiscal 2016 compared to $7.3 million of goodwill impairment charges recorded in fiscal 2015. See Note 7, Goodwill and Other Intangible Assets, and Note 8, Long-Lived Asset Impairment and Facility Closure Costs, to the consolidated financial statements in this Annual Report on Form 10-K for additional information on these impairments. Adjusted operating loss was also negatively affected by the decline in average ferrous selling prices discussed above, which outweighed a decrease in average ferrous material cost and compressed average ferrous metal margin by 4%, while average nonferrous metal margin remained flat. However, the compressed metal margin was offset by a 10% per short ton decline in freight expenses due to reduced fuel costs, and a 24% per short ton decline in supplies expense.
Americas Mills
|
|
Year Ended August 31,
|
|||||||
|
(in thousands)
|
2016
|
2015
|
||||||
|
Net sales
|
$
|
1,498,848
|
|
$
|
1,841,812
|
|
||
|
Adjusted operating profit
|
209,751
|
|
255,507
|
|
||||
|
Average steel mill price (per short ton)
|
||||||||
|
Finished goods selling price
|
$
|
534
|
|
$
|
648
|
|
||
|
Total sales
|
524
|
|
637
|
|
||||
|
Cost of ferrous scrap utilized
|
207
|
|
282
|
|
||||
|
Metal margin
|
317
|
|
355
|
|
||||
|
Steel mill short tons (in thousands)
|
||||||
|
Melted
|
2,522
|
|
2,553
|
|
||
|
Rolled
|
2,382
|
|
2,387
|
|
||
|
Total Tons Shipped
|
2,630
|
|
2,687
|
|
||
36
Net sales in fiscal 2016 decreased $343.0 million, or 19%, compared to fiscal 2015 due to a $113 per short ton decrease in the average selling price and a 2% decrease in total shipments compared to fiscal 2015. Finished products shipments decreased approximately 31 thousand short tons, while shipments of our semi-finished products decreased approximately 26 thousand short tons compared to fiscal 2015. Average selling prices and shipments of finished products decreased as a result of continued import pressures in the U.S. Shipments of our semi-finished products declined as a result of slowing demand from the oil and gas industry.
Adjusted operating profit in fiscal 2016 decreased $45.8 million compared to fiscal 2015. The decreases in average selling price discussed above more than offset a $75 per short ton decrease in the average cost of ferrous scrap utilized, and compressed average metal margins by 11% compared to fiscal 2015. Partially offsetting the margin compression were reductions in various expenses compared to fiscal 2015, largely attributable to: utilities expense of 14% per short ton due to lower utility rates and reduced consumption, freight expenses of 4% per short ton due to reduced fuel costs, supplies expenses of 11% per short ton, and repairs and maintenance expenses of $9.9 million due to variances in the timing and amounts of routine maintenance and equipment enhancements conducted in the normal course of business.
Americas Fabrication
|
|
Year Ended August 31,
|
|||||||
|
(in thousands)
|
2016
|
2015
|
||||||
|
Net sales
|
$
|
1,489,455
|
|
$
|
1,624,238
|
|
||
|
Adjusted operating profit
|
68,602
|
|
22,424
|
|
||||
|
Average selling price (excluding stock and buyout sales) (per short ton)
|
||||||||
|
Rebar
|
$
|
804
|
|
$
|
913
|
|
||
|
Structural
|
2,276
|
|
2,543
|
|
||||
|
Post
|
853
|
|
886
|
|
||||
|
Short tons shipped (in thousands)
|
||||||
|
Rebar
|
1,028
|
|
1,026
|
|
||
|
Structural
|
32
|
|
38
|
|
||
|
Post
|
95
|
|
97
|
|
||
Net sales in fiscal 2016 decreased $134.8 million, or 8%, compared to fiscal 2015. The decrease in net sales was primarily due to a decrease in the average composite selling price by $102 per short ton compared to fiscal 2015 as a result of falling steel commodity prices over the preceding twelve months.
Adjusted operating profit in fiscal 2016 increased $46.2 million compared to fiscal 2015 due to a 7% improvement in average composite metal margin, caused by a $119 per short ton decrease in material cost which outpaced the decrease in selling price discussed above. Further contributing to the increase in adjusted operating profit were reductions in various expenses compared to fiscal 2015, largely attributable to: employee-related expenses of 1% per short ton, freight expenses of 5% per short ton due to reduced fuel costs, supplies expenses of 16% per short ton, and depreciation and amortization expenses of $3.9 million due to the full amortization of certain intangible assets during fiscal 2015.
37
International Mill
|
|
Year Ended August 31,
|
|||||||
|
(in thousands)
|
2016
|
2015
|
||||||
|
Net sales
|
$
|
517,186
|
|
$
|
626,251
|
|
||
|
Adjusted operating profit
|
28,892
|
|
17,555
|
|
||||
|
Average price (per short ton)
|
||||||||
|
Total sales
|
$
|
391
|
|
$
|
480
|
|
||
|
Cost of ferrous scrap utilized
|
195
|
|
274
|
|
||||
|
Metal margin
|
196
|
|
206
|
|
||||
|
Short tons (in thousands)
|
||||||||
|
Melted
|
1,284
|
|
1,285
|
|
||||
|
Rolled
|
1,243
|
|
1,145
|
|
||||
|
Shipped
|
1,254
|
|
1,226
|
|
||||
Net sales in fiscal 2016 decreased $109.1 million, or 17%, compared to fiscal 2015 primarily due to a 19% decline in average selling price, partially offset by a 2% increase in shipments. The decrease in average selling price for fiscal 2016 was due to global steel production overcapacity, which continued to depress global steel prices during fiscal 2016 compared to fiscal 2015. Additionally, the decrease in net sales for fiscal 2016 reflects unfavorable foreign currency fluctuation impacts of approximately $41.1 million due to the strengthening of the U.S. dollar in relation to the zloty.
Adjusted operating profit in fiscal 2016 increased $11.3 million compared to fiscal 2015. During fiscal 2016, average metal margin decreased 5% as a result of an $89 per short ton decrease in average selling price, which outpaced a $79 per short ton decrease in the average cost of ferrous scrap utilized compared to fiscal 2015. The decline in average metal margin was more than offset by a reduction in utilities expenses of $13.1 million due to lower energy rates and excise taxes compared to fiscal 2015. Changes in the U.S. dollar relative to other currencies did not have a material impact on the change in this segment's adjusted operating profit in fiscal 2016.
International Marketing and Distribution
|
|
Year Ended August 31,
|
|||||||
|
(in thousands)
|
2016
|
2015
|
||||||
|
Net sales
|
$
|
754,958
|
|
$
|
1,332,364
|
|
||
|
Adjusted operating loss
|
(23,690
|
)
|
(15,443
|
)
|
||||
Net sales in fiscal
2016
decreased $577.4 million, or 43%, compared to fiscal
2015
. The decrease in net sales for fiscal
2016
was primarily due to a decrease in volumes for our raw materials and steel trading division headquartered in the U.S. and our operations in Europe coupled with a decline in average selling prices throughout our operations within this segment compared to fiscal 2015 due to the continued economic slowdown in China and weakness in global energy markets weighing on global steel and commodity pricing. The change in net sales for fiscal
2016
includes unfavorable foreign currency fluctuation impacts of approximately $13.8 million primarily due to the strengthening of the U.S. dollar in relation to the Australian dollar and British pound.
Adjusted operating loss in fiscal
2016
increased $8.3 million, or 53%, compared to fiscal
2015
. The decrease in adjusted operating profit was primarily due to decreases in volumes and average margins for our steel trading division headquartered in the U.S. and our operations in Europe decreased compared to fiscal 2015 primarily due to the factors impacting global steel, commodity and energy markets discussed above. Additionally, the decline in average margins for our operations in Australia and Asia outweighed increases in volumes for these operations. Offsetting these declines, inventory write-downs decreased $19.5 million and employee-related expenses decreased 14% per short ton, in each case, compared to fiscal 2015. This segment was also favorably impacted by a $6.2 million net positive impact from foreign currency transactions and foreign exchange derivative activities in fiscal 2016 compared to fiscal 2015. Changes in the U.S. dollar relative to other currencies did not have a material impact on the change in this segment's adjusted operating profit in fiscal 2016.
38
Corporate
Corporate expenses in fiscal 2016 increased $17.3 million to $95.1 million compared to fiscal 2015 primarily due to a $6.7 million increase in employee-related expenses due to centralization of certain shared services to the Corporate segment and the loss on debt extinguishment of $11.5 million in the second quarter of fiscal 2016. See Note 10, Credit Arrangements, to the consolidated financial statements included in this Annual Report on Form 10-K for further information.
Discontinued Operations
See the Discontinued Operations description of the "Fiscal Year 2017 Compared to Fiscal Year 2016" section above for discussion of the changes from fiscal 2016 compared to fiscal 2015.
FISCAL
2017
LIQUIDITY AND CAPITAL RESOURCES
While we believe the lending institutions participating in our credit arrangements are financially capable, it is important to note that the banking and capital markets industries periodically experience volatility that may limit our ability to raise capital. Additionally, changes to our credit rating by any rating agency may impact our ability to raise capital and manage our financing costs.
The table below reflects our sources, facilities and availability of liquidity as of
August 31, 2017
:
|
(in thousands)
|
Total Facility
|
Availability
|
||||||
|
Cash and cash equivalents
|
$
|
252,595
|
|
$
|
252,595
|
|
||
|
Notes due from 2023 to 2027
|
630,000
|
|
*
|
|
||||
|
Revolving credit facility
|
350,000
|
|
346,983
|
|
||||
|
U.S. receivables sale facility
|
200,000
|
|
39,765
|
|
||||
|
Term Loan due 2022
|
150,000
|
|
—
|
|
||||
|
International accounts receivable sales facilities
|
56,079
|
|
56,079
|
|
||||
|
Bank credit facilities — uncommitted
|
49,069
|
|
47,772
|
|
||||
|
Equipment notes and other
|
52,077
|
|
*
|
|
||||
_________________________________
* We believe we have access to additional financing and refinancing, if needed.
Sources of Liquidity and Capital Resources
See Note 10, Credit Arrangements, to the consolidated financial statements included in this Annual Report on Form 10-K for additional information.
We expect cash on hand and cash generated from operations to be sufficient to meet all interest and principal payments due within the next twelve months, and we believe we will be able to obtain additional financing or to refinance the Notes when they mature.
Our foreign operations generated approximately
24%
of our net sales in fiscal
2017
, and our foreign operations had cash and cash equivalents of approximately $243.7 million and $173.8 million at
August 31, 2017
and
2016
, respectively. In September 2017, approximately $206 million of cash in our foreign operations was used to repay intercompany debt obligations owed to CMC and one of its U.S. subsidiaries. Historically, our U.S. operations have generated the majority of our cash, which has been used to fund the cash needs of our U.S. operations as well as our foreign operations. Additionally, as of August 31 2017, our U.S. operations had access to the Credit Agreement described above and the sale of trade accounts receivable program described below. We intend to indefinitely reinvest all undistributed earnings of non-U.S. subsidiaries. If a repatriation of earnings occurs in the future, we would be required to provide for income taxes on dividends from our non-U.S. subsidiaries. Determination of the unrecognized deferred income tax liability related to the undistributed earnings of our non-U.S. subsidiaries is not practicable because of the complexities with its hypothetical calculation.
We regularly maintain a substantial amount of accounts receivable. We actively monitor our accounts receivable and, based on market conditions and customers' financial condition, we record allowances as soon as we believe accounts are uncollectible. Continued pressure on the liquidity of our customers could result in additional allowances as we make our assessments in the future. We use credit insurance for both our International Marketing and Distribution and International Mill operations to mitigate
39
the risk of customer insolvency. We estimate that the amount of credit insured receivables (and those covered by export letters of credit) was approximately
28%
of total receivables at
August 31, 2017
.
For added flexibility, we may sell certain accounts receivable both in the U.S. and internationally. See Note 5, Sales of Accounts Receivable, to the consolidated financial statements contained in this Annual Report on Form 10-K. Our U.S. sale of accounts receivable program contains certain cross-default provisions whereby a termination event could occur if we default under certain of our credit arrangements. Additionally, our U.S. sale of accounts receivable program contains covenants that are consistent with the covenants contained in the Credit Agreement. At
August 31, 2017
, the Company had $90.0 million in advance payments outstanding on the sale of its trade accounts receivable, which was repaid in September 2017.
Stock Repurchase Program
During the first quarter of fiscal 2015, CMC's Board of Directors authorized a share repurchase program under which we may repurchase up to $100.0 million of CMC's outstanding common stock. As of
August 31, 2017
, the approximate value of CMC common stock that may yet be purchased under this program is
$27.6 million
. We intend to repurchase shares from time to time for cash in the open market or privately negotiated transactions in accordance with applicable federal securities laws. The timing and the amount of repurchases, if any, are determined by management based on an evaluation of market conditions, capital allocation alternatives and other factors. The share repurchase program does not require us to purchase any dollar amount or number of shares of CMC's common stock and may be modified, suspended, extended or terminated at any time without prior notice. We
did not purchase any
shares of CMC common stock during fiscal
2017
. During fiscal
2016
, we purchased
2.3 million
shares of CMC common stock at an average purchase price of $13.57 per share.
Acquisitions
On December 12, 2016, we completed the purchase of substantially all of the assets of Continental Concrete Structures, Inc. ("CCS"), a fabricator of post-tensioning cable and related products for commercial and public construction projects with a facility in Alpharetta, Georgia. In addition, CCS provides professional design and value engineering services to the construction industry throughout North America. This acquisition complements our current rebar fabrication business and continues our strategy of creating value for customers. The operating results of this facility are included in the Americas Fabrication reporting segment.
On January 9, 2017, we completed the purchase of substantially all of the assets of Associated Steel Workers, Limited ("ASW"), a steel fabrication facility in Kapolei, Hawaii. This acquisition continues the vertical integration model of the Company by extending our geographic reach, establishing a fabrication operation in Hawaii and expanding our presence in the Hawaiian market. The operating results of this facility are included in the Americas Fabrication reporting segment.
On March 6, 2017, we completed the purchase of certain assets from OmniSource Corporation, a wholly owned subsidiary of Steel Dynamics, Inc., consisting of seven recycling facilities located in the southeast United States, which are in close proximity to our mini mill in Cayce, South Carolina. These facilities provide synergies with our other operations in the region. The operating results of these facilities will be included in the Americas Recycling reporting segment.
These acquisitions were funded through internally generated cash and did not have a material effect on our financial position or results of operations. We regularly review potential acquisitions. We believe available cash resources, bank financing or the issuance of debt or equity could be used to finance future acquisitions. There can be no assurance we will enter into new acquisitions.
Operating Cash Flow and Capital Expenditures
Our cash flows from operating activities result primarily from sales of steel and related products, and to a lesser extent, sales of nonferrous metal products and other raw materials used in steel manufacturing. We have a diverse and generally stable customer base. From time to time, we use futures or forward contracts to mitigate the risks from fluctuations in metal commodity prices, foreign currency exchange rates and interest rates. See Note 12, Derivatives and Risk Management, to the consolidated financial statements included in this Annual Report on Form 10-K.
Fiscal
2017
Compared to Fiscal
2016
Operating Activities
Net cash flows from operating activities decreased
$412.4 million
for fiscal
2017
, compared to fiscal
2016
, primarily due to changes in operating assets and liabilities ("working capital") from cyclical increases in commodity pricing and demand, as well as a decrease in net earnings, after giving effect to non-cash items. An increase in working capital for fiscal
2017
resulted in a usage of cash of $65.9 million. In general, commodity pricing and volume increases across most of our businesses are the primary
40
drivers of the working capital change. Days sales outstanding improved by two days and days sales in inventory deteriorated by two days during fiscal
2017
.
Investing Activities
Net cash flows used by investing activities decreased
$61.9 million
for fiscal
2017
primarily due to a
$159.1 million
increase in proceeds from the sale of subsidiaries, partially offset by a
$56.1 million
increase in cash used for acquisitions and a
$49.8 million
increase in capital expenditures. See Note 3, Changes in Business, to the consolidated financial statements included in this Annual Report on Form 10-K for additional information regarding dispositions and acquisitions occurring during fiscal
2017
.
We estimate that our fiscal
2018
capital budget will be between $150 million and $200 million, primarily related to the construction of our micro mill in Durant, Oklahoma. We expect that our capital spending will be funded from internally generated capital. We regularly assess our capital spending and reevaluate our requirements based on current and expected results.
Financing Activities
Net cash flows used by financing activities decreased
$53.2 million
for fiscal
2017
compared to fiscal
2016
. The primary financing activities occurring during fiscal 2017 were: (i) repayments of long-term debt, resulting in a
$500.5 million
increase in similar activity as compared to fiscal
2016
and (ii) issuance of new debt, resulting in
$475.5 million
in proceeds from long-term debt transactions during fiscal
2017
compared to no such activity in fiscal
2016
. See Note 10, Credit Arrangements, to the consolidated financial statements included in this Annual Report on Form 10-K for additional information regarding long-term debt transactions occurring during fiscal
2017
. Also contributing to the decrease in net cash flows used by financing activities was the repayment of short-term borrowings of
$20.1 million
and purchases of CMC common stock of
$30.6 million
during fiscal
2016
while no such activity occurred during fiscal
2017
. Further, cash used by documentary letters of credit decreased
$41.5 million
during fiscal
2017
compared to fiscal
2016
. We regularly evaluate the use of our cash in efforts to maximize total shareholder return, including debt repayment, capital deployment, share repurchases and dividends.
We anticipate our current cash balances, cash flows from operations and our available credit sources will be sufficient to meet our cash requirements, including our scheduled debt repayments, payments for our contractual obligations, capital expenditures, working capital needs, share repurchases, dividends and other prudent uses of our capital, such as acquisitions. However, in the event of sustained market deterioration, we may need additional liquidity, which would require us to evaluate available alternatives and take appropriate steps to obtain sufficient additional funds.
Fiscal
2016
Compared to Fiscal
2015
Operating Activities
During fiscal 2016, net cash flows from operating activities increased $273.4 million compared to fiscal 2015. Net earnings decreased $24.7 million during fiscal 2016 compared to the prior fiscal year. Net earnings for fiscal 2016 were impacted by the following non-cash items and items included in net earnings for which the cash effects did not relate to operating activities: $11.5 million loss on debt extinguishment, $55.8 million in asset impairments, and $15.6 million in write-down of inventories compared to no debt extinguishment, $14.6 million in asset impairments, and $37.7 million in write-down of inventories, respectively, during fiscal 2015. Cash from changes in operating assets and liabilities increased $251.5 million during fiscal 2016 compared to the prior fiscal year with the following significant components:
Accounts receivable
- Cash generated from accounts receivable decreased $64.1 million during fiscal 2016 compared to fiscal 2015. The decrease in cash from accounts receivable primarily relates to the change in consolidated net sales period over period as consolidated net sales from the fourth quarter of fiscal 2015 to the fourth quarter of fiscal 2016 decreased $224.8 million, and consolidated net sales from the fourth quarter of fiscal 2014 to the fourth quarter of fiscal 2015 decreased $462.3 million. However, the change in net sales was partially offset by the change in days sales outstanding, namely that days sales outstanding during fiscal 2016 remained flat while days sales outstanding during fiscal 2015 deteriorated eight days.
Advance payments on sale of accounts receivables programs, net
- Cash used by advance payments on sale of accounts receivable programs, net decreased $98.3 million during fiscal 2016 compared to fiscal 2015. As cash flows from operating activities improved during fiscal years 2015 and 2016, we reduced the usage of these facilities, thus reducing the outstanding balances by $117.8 million during fiscal year 2015 and an additional $19.5 million during fiscal year 2016.
Inventories
- Cash generated from inventories increased $82.0 million during fiscal 2016 compared to fiscal 2015. Cash generated from inventories increased as a result of improved inventory turnover, as days sales in inventories during fiscal 2016 improved six days while days sales in inventories during fiscal 2015 deteriorated three days.
41
Accounts payable, accrued expenses and other payables
- Cash used by accounts payable, accrued expenses and other payables decreased $136.9 million during fiscal 2016 compared to fiscal 2015. The decrease was primarily due to the fluctuation in commodity prices period over period as the prices paid per ton of metal fell at a greater rate during fiscal 2015 compared to fiscal 2016.
Investing Activities
Net cash flows used by investing activities increased $98.8 million during fiscal 2016 compared to the prior fiscal year. The largest factor contributing to the use of cash was an increase in capital expenditures of $43.8 million compared to fiscal 2015, primarily related to key capital projects within our Americas Mills segment. Additionally, during fiscal 2016 there was an increase in restricted cash of $21.8 million to be used for the construction of a new steel micro mill in Durant, Oklahoma. Lastly, as a part of the sale of our discontinued Australian distribution business, we received cash proceeds of $4.3 million during fiscal 2016 compared to cash proceeds of $27.8 million during fiscal 2015.
Financing Activities
Net cash flows used by financing activities increased $197.0 million during fiscal 2016 compared to the prior fiscal year. The increase primarily resulted from increases in repayments of long-term debt and debt extinguishment costs of $200.1 million and $11.1 million, respectively. Also contributing to the increase was a change in repayments of short-term borrowings, which increased $27.9 million. The increase was partially offset by the change in the level of usage of documentary letters of credit of $39.0 million and an $11.2 million decrease in purchases of CMC common stock compared to the same period in the prior fiscal year. The amount of documentary letters of credit outstanding during the period can fluctuate as a result of the level of activity and volume of materials purchased during the period as well as a result of their length and timing to maturity.
Contractual Obligations
The following table represents our contractual obligations as of
August 31, 2017
:
|
|
Payments Due By Period*
|
|||||||||||||||||||
|
Contractual Obligations (in thousands)
|
Total
|
Less than
1 Year |
1-3 Years
|
3-5 Years
|
More than
5 Years |
|||||||||||||||
|
Long-term debt
(1)
|
$
|
832,077
|
|
$
|
19,182
|
|
$
|
31,836
|
|
$
|
132,994
|
|
$
|
648,065
|
|
|||||
|
Interest
|
285,637
|
|
38,221
|
|
74,716
|
|
72,854
|
|
99,846
|
|
||||||||||
|
Operating leases
(2)
|
66,443
|
|
21,473
|
|
25,898
|
|
12,722
|
|
6,350
|
|
||||||||||
|
Purchase obligations
(3)
|
487,106
|
|
458,037
|
|
17,772
|
|
6,180
|
|
5,117
|
|
||||||||||
|
Total contractual cash obligations
|
$
|
1,671,263
|
|
$
|
536,913
|
|
$
|
150,222
|
|
$
|
224,750
|
|
$
|
759,378
|
|
|||||
__________________________________
* We have not discounted the cash obligations in this table.
|
(1)
|
Total amounts are included in the
August 31, 2017
consolidated balance sheet. See Note 10, Credit Arrangements, to the consolidated financial statements included in this Annual Report on Form 10-K for more information regarding scheduled maturities of our long-term debt.
|
|
(2)
|
Includes minimum lease payment obligations for noncancelable equipment and real estate leases in effect as of
August 31, 2017
. See Note 18, Commitments and Contingencies, to the consolidated financial statements included in this Annual Report on Form 10-K for more information regarding minimum lease commitments payable for noncancelable operating leases.
|
|
(3)
|
Approximately 55% of these purchase obligations are for inventory items to be sold in the normal course of business. Purchase obligations include all enforceable, legally binding agreements to purchase goods or services that specify all significant terms, regardless of the duration of the agreement. Agreements with variable terms are excluded because we are unable to estimate the minimum amounts. Another significant obligation relates to capital expenditures.
|
We provide certain eligible executives benefits pursuant to our nonqualified BRP equal to amounts that would have been available under the tax qualified plans under the Employee Retirement Income Security Act of 1974, as amended ("ERISA"), but for limitations of ERISA, tax laws and regulations. The deferred compensation liability under the BRP was
$73.1 million
at
August 31, 2017
, with
$50.1 million
and
$23.0 million
included in other long-term liabilities and accrued expenses and other payables, respectively, on the consolidated balance sheets. We generally expect to fund future contributions with cash flows from operating activities, but we are not required to do so. We did not include estimated payments related to the BRP in the above contractual obligation table. Refer to Note 17, Employees' Retirement Plans, to the consolidated financial statements included in this Annual Report on Form 10-K.
42
Our other noncurrent liabilities on the consolidated balance sheets include deferred tax liabilities of
$49.2 million
as of
August 31, 2017
.
Other Commercial Commitments
We maintain stand-by letters of credit to provide support for certain transactions that governmental agencies, our insurance providers and suppliers request. At
August 31, 2017
, we had committed $24.3 million under these arrangements.
Off-Balance Sheet Arrangements
For added flexibility, we sell certain accounts receivable both in the U.S. and internationally. We utilize proceeds from the sales of the trade accounts receivables as an alternative to short-term borrowings, effectively managing our overall borrowing costs and providing an additional source of working capital. We account for sales of the trade accounts receivables as true sales and the trade accounts receivable balances that are sold are removed from the consolidated balance sheets. The proceeds from cash advances and repayments of advances are reflected as cash provided by or used by, respectively, operating activities on our consolidated statements of cash flows. See Note 5, Sales of Accounts Receivable, to the consolidated financial statements included in this Annual Report on Form 10-K.
CONTINGENCIES
See Note 18, Commitments and Contingencies, to the consolidated financial statements included in this Annual Report on Form 10-K.
In the ordinary course of conducting our business, we become involved in litigation, administrative proceedings and governmental investigations, including environmental matters. We may incur settlements, fines, penalties or judgments because of some of these matters. Liabilities and costs associated with litigation-related loss contingencies require estimates and judgments based on our knowledge of the facts and circumstances surrounding each matter and the advice of our legal counsel. We record liabilities for litigation-related losses when a loss is probable and we can reasonably estimate the amount of the loss. We evaluate the measurement of recorded liabilities each reporting period based on the current facts and circumstances specific to each matter. The ultimate losses incurred upon final resolution of litigation-related loss contingencies may differ materially from the estimated liability recorded at a particular balance sheet date. Changes in estimates are recorded in earnings in the period in which such changes occur. We do not believe that any currently pending legal proceedings to which we are a party will have a material adverse effect, individually or in the aggregate, on our results of operations, cash flows or financial condition.
Environmental and Other Matters
The information set forth in Note 18, Commitments and Contingencies, to the consolidated financial statements included in this Annual Report on Form 10-K is hereby incorporated by reference.
General
We are subject to federal, state and local pollution control laws and regulations in all locations where we have operating facilities. We anticipate that compliance with these laws and regulations will involve continuing capital expenditures and operating costs.
Metals recycling was our original business, and it has been one of our core businesses for over a century. In the present era of conservation of natural resources and ecological concerns, we are committed to sound ecological and business conduct. Certain governmental regulations regarding environmental concerns, however well-intentioned, may expose us and our industry to potentially significant risks. We believe that recycled materials are commodities that are diverted by recyclers, such as us, from the solid waste streams because of their inherent value. Commodities are materials that are purchased and sold in public and private markets and commodities exchanges every day around the world. They are identified, purchased, sorted, processed and sold in accordance with carefully established industry specifications.
43
Solid and Hazardous Waste
We currently own or lease, and in the past we have owned or leased, properties that have been used in our operations. Although we have used operating and disposal practices that were standard in the industry at the time, wastes may have been disposed of or released on or under the properties or on or under locations where such wastes have been taken for disposal. We are currently involved in the investigation and remediation of several such properties. State and federal laws applicable to wastes and contaminated properties have gradually become stricter over time. Under new laws, we could be required to remediate properties impacted by previously disposed wastes. We have been named as a potentially responsible party ("PRP") at a number of contaminated sites, none of which involve real estate we ever owned or upon which we have ever conducted operations. There is no guarantee that the EPA or individual states will not adopt more stringent requirements for the handling of, or make changes to the exemptions upon which we rely for, the wastes that we generate. Any such change could result in an increase in our costs to manage and dispose of waste which could have a material adverse effect on our business, results of our operations and financial condition.
We generate wastes, including hazardous wastes, that are subject to the Federal Resource Conservation and Recovery Act and comparable state and local statutes where we operate. These statutes, regulations and laws may limit our disposal options with respect to certain wastes.
Superfund
The EPA, or an equivalent state agency, has notified us that we are considered a PRP at several sites, none of which involve real estate we ever owned or upon which we have ever conducted operations. We may be obligated under the Comprehensive Environmental Response, Compensation, and Liability Act of 1980 ("CERCLA"), or similar state statutes, to conduct remedial investigation, feasibility studies, remediation and/or removal of alleged releases of hazardous substances or to reimburse the EPA for such activities and pay costs for associated damages to natural resources. We are involved in litigation or administrative proceedings with regard to several of these sites in which we are contesting, or at the appropriate time may contest, our liability. In addition, we have received information requests with regard to other sites which may be under consideration by the EPA as potential CERCLA sites. Because of various factors, including the ambiguity of the regulations, the difficulty of identifying the responsible parties for any particular site, the complexity of determining the relative liability among them, the uncertainty as to the most desirable remediation techniques and the amount of damages and cleanup costs and the extended time periods over which such costs may be incurred, we cannot reasonably estimate our ultimate costs of compliance with CERCLA. Based on currently available information, which is in many cases preliminary and incomplete, we had
$0.7 million
accrued as of
August 31, 2017
and
2016
, respectively, in connection with CERCLA sites. We have accrued for these liabilities based upon our best estimates. The amounts paid and the expenses incurred on these sites for the years ended
August 31, 2017
,
2016
and
2015
were not material. Historically, the amounts that we have ultimately paid for such remediation activities have not been material.
Clean Water Act
The Clean Water Act ("CWA") imposes restrictions and strict controls regarding the discharge of wastes into waters of the U.S., a term broadly defined, or into publicly owned treatment works. These controls have become more stringent over time, and it is probable that additional restrictions will be imposed in the future. Permits must generally be obtained to discharge pollutants into federal waters or into publicly owned treatment works; comparable permits may be required at the state level. The CWA and many state statutes provide for civil, criminal and administrative penalties for unauthorized discharges of pollutants. In addition, the EPA's regulations and comparable state statutes may require us to obtain permits to discharge storm water runoff. In the event of an unauthorized discharge or non-compliance with permit requirements, we may be liable for penalties and costs.
Clean Air Act
Our operations are subject to regulations at the federal, state and local level for the control of emissions from sources of air pollution. New and modified sources of air pollutants are often required to obtain permits prior to commencing construction, modification or operations. Major sources of air pollutants are subject to more stringent requirements, including the potential need for additional permits and to increase scrutiny in the context of enforcement. The EPA has been implementing its stationary emission control program through expanded enforcement of the New Source Review Program. Under this program, new or modified sources may be required to construct emission sources using what is referred to as the Best Available Control Technology, or in any areas that are not meeting NAAQS, using methods that satisfy requirements for the Lowest Achievable Emission Rate. Additionally, the EPA has implemented and is continuing to implement new, more stringent standards for NAAQS including fine particulate matter. Compliance with new standards could require additional expenditures.
44
We incurred environmental expenses of $
29.9 million
,
$33.9 million
and
$31.7 million
for fiscal
2017
,
2016
and
2015
, respectively. The expenses included the cost of disposal, environmental personnel at various divisions, permit and license fees, accruals and payments for studies, tests, assessments, remediation, consultant fees, baghouse dust removal and various other expenses. In addition, during fiscal
2017
, we spent approximately $
8.0 million
in capital expenditures related to costs directly associated with environmental compliance. Our accrued environmental liabilities were
$4.3 million
and $
3.3 million
as of
August 31, 2017
and
2016
, respectively, of which
$2.1 million
were classified as other long-term liabilities as of
August 31, 2017
and
2016
, respectively.
DIVIDENDS
We have paid quarterly cash dividends in each of the past 212 consecutive quarters. We paid quarterly dividends in fiscal
2017
at the rate of $0.12 per share of CMC common stock.
CRITICAL ACCOUNTING POLICIES AND ESTIMATES
The preceding discussion and analysis of our financial condition and results of operations is based upon our consolidated financial statements, which have been prepared in accordance with U.S. GAAP. The preparation of the consolidated financial statements requires us to make estimates and assumptions that affect the reported amounts of assets, liabilities, revenue and expenses and related disclosure of contingent liabilities. We evaluate the appropriateness of these estimates and assumptions, including those related to the valuation allowances for receivables, the carrying value of inventory, long-lived assets and goodwill, reserves for litigation, environmental obligations and income taxes, on an ongoing basis. Estimates and assumptions are based on historical experience and on various other assumptions that we believe to be reasonable under the circumstances, the results of which form the basis for making judgments about the carrying value of assets and liabilities that are not readily apparent from other sources. Accordingly, actual results in future periods could differ materially from these estimates. Judgments and estimates related to critical accounting policies used in the preparation of the consolidated financial statements include the following.
Revenue Recognition and Allowance for Doubtful Accounts
We recognize sales when title passes to the customer either when goods are shipped or when they are delivered based on the terms of the sale, there is persuasive evidence of an arrangement, the price is fixed or determinable and collectability is reasonably assured. When we estimate that a contract with one of our customers will result in a loss, we accrue the calculated loss as soon as it is probable and estimable. We account for certain fabrication projects based on the percentage of completion accounting method which is based primarily on contract cost incurred to date compared to total estimated contract cost. Contracts recognized on the percentage of completion accounting method can be significantly impacted by changes in contract performance, contract delays, and contract change orders, which may affect the revenue recognition on a project. Changes in revenue attributed to the changes in the estimated total contract cost, or loss, if any, are recognized in the period in which they are determined. It is possible that there will be future and currently unforeseeable adjustments to our estimated contract revenues, costs and margins for these contracts. We maintain an allowance for doubtful accounts to reflect our estimate of the uncollectability of accounts receivable. These reserves are based on historical trends, current market conditions and customers' financial condition.
Income Taxes
We determine the income tax expense related to continuing operations to be the income tax consequences of amounts reported in continuing operations without regard to the income tax consequences of other components of the financial statements, such as other comprehensive income or discontinued operations. The amount of income tax expense or benefit to be allocated to the other components is the incremental effect that those pre-tax amounts have on the total income tax expense or benefit. If there is more than one financial statement component other than continuing operations, the allocation is made on a pro-rata basis in accordance with each component's incremental income tax effects.
The continuing operations income tax rate differs from the income tax rate for discontinued operations because income from discontinued operations includes: (1) domestic operating losses related to CMC Cometals and (2) income earned in jurisdictions that benefit from group loss sharing provisions. Such losses, which carry a full valuation allowance, are utilized to absorb the foreign discontinued operations income; thus, there is no tax expense or benefit associated with the income from discontinued operations in foreign jurisdictions.
We periodically assess the likelihood of realizing our deferred tax assets based on the amount of deferred tax assets that we believe is more likely than not to be realized. We base our judgment of the recoverability of our deferred tax assets primarily on historical earnings, our estimate of current and expected future earnings, prudent and feasible tax planning strategies, and current and future ownership changes.
45
Our effective income tax rate may fluctuate on a quarterly basis due to various factors, including, but not limited to, total earnings and the mix of earnings by jurisdiction, the timing of changes in tax laws, and the amount of income tax provided for uncertain income tax positions. We establish income tax liabilities to reduce some or all of the income tax benefit of any of our income tax positions at the time we determine that the positions become uncertain based upon one of the following: (1) the tax position is not "more likely than not" to be sustained, (2) the tax position is "more likely than not" to be sustained, but for a lesser amount, or (3) the tax position is "more likely than not" to be sustained, but not in the financial period in which the tax position was originally taken. Our evaluation of whether or not a tax position is uncertain is based on the following: (1) we presume the tax position will be examined by the relevant taxing authority that has full knowledge of all relevant information, (2) the technical merits of a tax position are derived from authorities such as legislation and statutes, legislative intent, regulations, rulings and case law and their applicability to the facts and circumstances of the tax position, and (3) each tax position is evaluated without considerations of the possibility of offset or aggregation with other tax positions taken. We adjust these income tax liabilities when our judgment changes as a result of new information. Any change will impact income tax expense in the period in which such determination is made.
Inventory Cost
We state inventories at the lower of cost or net realizable value, which is defined as estimated selling prices in the ordinary course of business, less reasonably predictable costs of completion, disposal and transportation. Adjustments to inventory may be due to changes in price levels, obsolescence, damage, physical deterioration, and other causes. Any adjustments required to reduce the carrying value of inventory to net realizable value are recorded as a charge to cost of goods sold.
Elements of cost in finished goods inventory in addition to the cost of material include depreciation, amortization, utilities, consumable production supplies, maintenance, production, wages and transportation costs. Additionally, the costs of departments that support production, including materials management and quality control, are allocated to inventory. Inventory cost for operations in the CMC Americas division and our International Mill segment is determined by the weighted average cost method. Inventory cost for our International Marketing and Distribution segment is determined by the specific identification method. At
August 31, 2017
and
2016
,
80%
and
60%
of our inventories were valued using the weighted average cost method, respectively, and
20%
and
40%
of our inventories were valued using the specific identification method, respectively.
Goodwill
Goodwill is tested for impairment at the reporting unit level annually and whenever events or circumstances indicate that the carrying value may not be recoverable. During fiscal 2017, we prospectively changed our annual quantitative goodwill impairment testing date from the last day of the fiscal fourth quarter to the first day of the fiscal fourth quarter. The change in the goodwill impairment testing date alleviates fiscal year end resource and timing constraints. This change does not represent a material change in accounting principle, and did not delay, accelerate or avoid a goodwill impairment charge.
Our reporting units represent an operating segment or one level below an operating segment. Additionally, the reporting units are aggregated based on similar economic characteristics, nature of products and services, nature of production processes, type of customers and distribution methods. We use a discounted cash flow model and a market approach to calculate the fair value of our reporting units. The discounted cash flow model includes a number of significant assumptions and estimates regarding future cash flows including discount rates, volumes, prices, capital expenditures and the impact of current market conditions. These estimates could be materially impacted by adverse changes in market conditions.
As of
August 31, 2017
and
2016
, one of our reporting units within our Americas Fabrication segment comprised
$51.6 million
of our total goodwill. As a result of our annual testing, the fair value of this reporting unit exceeded the carrying value by
13.5%
. For all other reporting units, the excess of the fair value over carrying value of each reporting unit was substantial. The future occurrence of a potential indicator of impairment could include matters such as: a decrease in expected net earnings, adverse equity market conditions, a decline in current market multiples, a decline in our common stock price, a significant adverse change in legal factors or the general business climate, an adverse action or assessment by a regulator, a significant downturn in non-residential construction markets in the U.S., and continued levels of imported steel into the U.S. In the event of significant adverse changes of the nature described above, it may be necessary for us to recognize a non-cash impairment of goodwill, which could have a material adverse effect on our consolidated business, results of operations and financial condition. Additionally, the assumptions that have the most significant impact on determination of the fabrication reporting unit fair value are the estimates of gross margin expansion, value of the terminal year, and the weighted average cost of capital (discount rate). A change in any of these assumptions, individually or in the aggregate, or future financial performance that is below management expectations may result in the carrying value of this reporting unit exceeding its fair value, and goodwill could be impaired.
46
For fiscal
2017
, we recorded a goodwill impairment charge of
$2.0 million
related to a reporting unit in our International Marketing and Distribution segment due to management's decision to wind-down the associated operations. For fiscal 2016, the annual goodwill impairment analysis did not result in any impairment charges. For fiscal 2015, we recorded a goodwill impairment charge of
$7.3 million
related to our Americas Recycling segment due to weakened demand for ferrous scrap exports coupled with a lower near term forecast of future operating results.
See Note 7, Goodwill and Other Intangible Assets, to the consolidated financial statements included in this Annual Report on Form 10-K for additional information.
Long-Lived Assets
We evaluate the carrying value of property, plant and equipment and finite-lived intangible assets whenever a change in circumstances indicates that the carrying value may not be recoverable from the undiscounted future cash flows from operations. Events or circumstances that could trigger an impairment review of a long-lived asset or asset group include, but are not limited to, a significant decrease in the market price of the asset, a significant adverse change in the extent or manner that the asset is used or in its physical condition, a significant adverse change in legal factors or in the business climate that could affect the value of the asset, an accumulation of costs significantly in excess of original expectation for the acquisition or construction of the asset, a current period operating or cash flow loss combined with a history of operating or cash flow losses or a projection or forecast of continuing losses associated with the use of the asset, and a more-likely-than-not expectation that the asset will be sold or disposed of significantly before the end of its previously estimated useful life. If an impairment exists, the net book values are reduced to fair values as warranted. Our U.S. and international steel mills, fabrication and recycling businesses are capital intensive. Some of the estimated values for assets that we currently use in our operations are based upon judgments and assumptions of future undiscounted cash flows that the assets will produce. If these assets were for sale, our estimates of their values could be significantly different because of market conditions, specific transaction terms and a buyer's different viewpoint of future cash flows. Also, we depreciate property, plant and equipment on a straight-line basis over the estimated useful lives of the assets. Depreciable lives are based on our estimate of the assets' economical useful lives. To the extent that an asset's actual life differs from our estimate, there could be an impact on depreciation expense or a gain/loss on the disposal of the asset in a later period. We expense major maintenance costs as incurred.
Based on continued margin and volume pressure in our Americas Recycling segment, which caused us to revise our estimate as to the timing of improvements in these metrics, during the fourth quarter of fiscal 2016, management concluded that a triggering event occurred. As a result, we reviewed the undiscounted future cash flows for our Americas Recycling long-lived asset groups. The results of the undiscounted future cash flow analyses indicated the carrying amounts for certain long-lived asset groups subject to testing were not expected to be recovered. Fair value for these long-lived asset groups was then estimated and compared to the carrying values of the long-lived asset groups, which resulted in a total non-cash, pre-tax impairment of $38.9 million for the fourth quarter of fiscal 2016. The primary factors that affect estimates of future cash flows for these long-lived asset groups are (i) management's scrap price outlook, (ii) scrap demand, (iii) working capital changes, (iv) capital expenditures and (v) selling, general and administrative expenses.
Contingencies
In the ordinary course of conducting our business, we become involved in litigation, administrative proceedings and governmental investigations, including environmental matters. We may incur settlements, fines, penalties or judgments in connection with some of these matters. While we are unable to estimate the ultimate dollar amount of exposure or loss in connection with these matters, we make accruals when a loss is assessed to be probable and the amount of the loss can be reasonably estimated. The amounts we accrue could vary substantially from amounts we pay due to several factors including the following: evolving remediation technology, changing regulations, possible third-party contributions, the inherent shortcomings of the estimation process, and the uncertainties involved in litigation. We believe that we have adequately provided in our consolidated financial statements for the impact of these contingencies. We also believe that the outcomes will not materially affect our results of operations, our financial position or our cash flows.
Other Accounting Policies and New Accounting Pronouncements
See Note 2, Summary of Significant Accounting Policies, to our consolidated financial statements included in this Annual Report on Form 10-K, which is incorporated by reference herein.
47
NON-GAAP FINANCIAL MEASURES
Adjusted Operating Profit from Continuing Operations
Adjusted operating profit from continuing operations is the sum of our earnings from continuing operations before interest expense, income taxes and discounts on sales of accounts receivable. Adjusted operating profit from continuing operations should not be considered as an alternative to earnings from continuing operations or net earnings, as determined by GAAP. However, we believe that adjusted operating profit from continuing operations provides relevant and useful information, which is often used by analysts, creditors and other interested parties as it allows: (i) a supplemental measure of our ongoing core performance and (ii) the assessment of period-to-period performance trends. Management uses adjusted operating profit from continuing operations to evaluate our financial performance. For added flexibility, we may sell certain trade accounts receivable both in the U.S. and internationally. We consider sales of accounts receivable as an alternative source of liquidity to finance our operations, and we believe that removing these costs provides a clearer perspective of our operating performance. Adjusted operating profit from continuing operations may be inconsistent with similar measures presented by other companies.
Reconciliations of earnings from continuing operations to adjusted operating profit from continuing operations are provided below:
|
|
Year Ended August 31,
|
|||||||||||
|
(in thousands)
|
2017
|
2016
|
2015
|
|||||||||
|
Earnings from continuing operations
|
$
|
32,550
|
|
$
|
57,900
|
|
$
|
63,004
|
|
|||
|
Interest expense
|
44,047
|
|
62,121
|
|
76,456
|
|
||||||
|
Income taxes
|
12,454
|
|
10,810
|
|
33,458
|
|
||||||
|
Discounts on sales of accounts receivable
|
863
|
|
1,688
|
|
1,547
|
|
||||||
|
Adjusted operating profit from continuing operations
|
$
|
89,914
|
|
$
|
132,519
|
|
$
|
174,465
|
|
|||
Adjusted EBITDA from Continuing Operations
Adjusted EBITDA from continuing operations is the sum of earnings from continuing operations before net earnings attributable to noncontrolling interests, interest expense and income taxes. It also excludes our largest recurring non-cash charge, depreciation and amortization, as well as long-lived asset and goodwill impairment charges, which are also non-cash charges. Adjusted EBITDA from continuing operations should not be considered as an alternative to earnings from continuing operations or net earnings, or as a better measure of liquidity than net cash flows from operating activities, as determined by GAAP. However, we believe that adjusted EBITDA from continuing operations provides relevant and useful information, which is often used by analysts, creditors and other interested parties as it allows: (i) comparison of our earnings to those of our competitors; (ii) a supplemental measure of our ongoing core performance; and (iii) the assessment of period-to-period performance trends. Additionally, adjusted EBITDA from continuing operations is the target benchmark for our annual and long-term cash incentive performance plans for management. Adjusted EBITDA from continuing operations may be inconsistent with similar measures presented by other companies.
There were no net earnings attributable to noncontrolling interests during the years ended
August 31, 2017
,
2016
and
2015
.
Reconciliations of earnings from continuing operations to adjusted EBITDA from continuing operations are provided below:
|
|
Year Ended August 31,
|
|||||||||||
|
(in thousands)
|
2017
|
2016
|
2015
|
|||||||||
|
Earnings from continuing operations
|
$
|
32,550
|
|
$
|
57,900
|
|
$
|
63,004
|
|
|||
|
Interest expense
|
44,047
|
|
62,121
|
|
76,456
|
|
||||||
|
Income taxes
|
12,454
|
|
10,810
|
|
33,458
|
|
||||||
|
Depreciation and amortization
|
125,053
|
|
126,918
|
|
132,479
|
|
||||||
|
Impairment charges
|
8,164
|
|
40,028
|
|
9,839
|
|
||||||
|
Adjusted EBITDA from continuing operations
|
$
|
222,268
|
|
$
|
297,777
|
|
$
|
315,236
|
|
|||
48
Market Risk
Approach to Mitigating Market Risk
See Note 12, Derivatives and Risk Management, to the consolidated financial statements included in this Annual Report on Form 10-K for disclosure regarding our approach to mitigating market risk and for summarized market risk information for the preceding fiscal year. Also, see Note 2, Summary of Significant Accounting Policies, to the consolidated financial statements included in this Annual Report on Form 10-K. The following types of derivative instruments were outstanding or utilized during fiscal
2017
, in accordance with our risk management program. All of the instruments are highly liquid and were not entered into for trading purposes.
Currency Exchange Forwards
We enter into currency exchange forward contracts as economic hedges of international trade commitments denominated in currencies other than the functional currency of CMC or its subsidiaries. No single foreign currency poses a primary risk to us. Fluctuations that cause temporary disruptions in one market segment tend to open opportunities in other segments.
Commodity Prices
We base pricing in some of our sales and purchase contracts on metal commodity futures exchange quotes, which we determine at the beginning of the contract. Due to the volatility of the metal commodity indices, we enter into metal commodity futures contracts for copper, aluminum and zinc. These futures mitigate the risk of unanticipated declines in gross margin due to the volatility of the commodities' prices on these contractual commitments. Physical transaction quantities will not match exactly with standard commodity lot sizes, leading to minimal gains and losses from ineffectiveness.
The following tables provide certain information regarding the foreign exchange and commodity financial instruments discussed above.
Gross foreign currency exchange contract commitments as of
August 31, 2017
:
|
Functional Currency
|
Foreign Currency
|
|
|||||||||||||||
|
Type
|
Amount
(in thousands) |
Type
|
Amount
(in thousands) |
Range of
Hedge Rates (1) |
U.S.
Equivalent (in thousands) |
||||||||||||
|
AUD
|
47
|
|
CNY
(2)
|
249
|
|
5.22
|
|
—
|
5.29
|
$
|
37
|
|
|||||
|
AUD
|
1,641
|
|
EUR
|
1,093
|
|
0.67
|
1,297
|
|
|||||||||
|
AUD
|
1,056
|
|
NZD
(3)
|
1,158
|
|
1.05
|
|
—
|
1.10
|
834
|
|
||||||
|
AUD
|
98,288
|
|
USD
|
76,410
|
|
0.74
|
|
—
|
0.80
|
76,410
|
|
||||||
|
PLN
|
474,437
|
|
EUR
|
110,190
|
|
4.19
|
|
—
|
4.59
|
125,869
|
|
||||||
|
PLN
|
6,264
|
|
USD
|
1,706
|
|
3.58
|
|
—
|
4.23
|
1,706
|
|
||||||
|
SGD
|
2,637
|
|
USD
|
1,950
|
|
1.35
|
1,950
|
|
|||||||||
|
THB
|
26,448
|
|
USD
|
795
|
|
33.27
|
795
|
|
|||||||||
|
USD
|
46,116
|
|
AUD
|
58,544
|
|
0.78
|
|
—
|
0.79
|
46,116
|
|
||||||
|
USD
|
6,697
|
|
EUR
|
5,598
|
|
1.17
|
|
—
|
1.21
|
6,697
|
|
||||||
|
USD
|
33,164
|
|
PLN
|
125,000
|
|
3.77
|
33,164
|
|
|||||||||
|
USD
|
5,535
|
|
THB
(4)
|
190,000
|
|
33.27
|
|
—
|
35.57
|
5,535
|
|
||||||
|
|
|
|
|
$
|
300,410
|
|
|||||||||||
_________________
(1) All foreign currency exchange contracts mature within one year. The range of hedge rates represents functional to foreign currency conversion rates.
(2) Chinese yuan
(3) New Zealand dollar
(4) Thai baht
49
Commodity contract commitments as of
August 31, 2017
:
|
Terminal Exchange
|
Metal
|
Long/
Short |
# of
Lots |
Standard
Lot Size |
Total
Weight |
Range or
Amount of Hedge Rates Per MT/lb. (1) |
Total Contract
Value at Inception (in thousands) |
|||||||||||||
|
London Metal Exchange
|
Aluminum
|
Long
|
202
|
|
25 MT
|
5,050 MT
|
1,906.00
|
|
—
|
2,125.50
|
$
|
10,049
|
|
|||||||
|
Aluminum
|
Short
|
106
|
|
25 MT
|
2,650 MT
|
1,909.00
|
|
—
|
2,131.50
|
5,366
|
|
|||||||||
|
New York Mercantile Exchange
|
Copper
|
Long
|
41
|
|
25,000 lbs.
|
1,025,000 lbs.
|
253.55
|
|
—
|
310.45
|
3,063
|
|
||||||||
|
Copper
|
Short
|
565
|
|
25,000 lbs.
|
14,125,000 lbs.
|
251.65
|
|
—
|
312.95
|
40,788
|
|
|||||||||
|
|
|
|
|
|
|
|
$
|
59,266
|
|
|||||||||||
_________________
MT = Metric ton
(1) All commodity contract commitments mature within one year.
50
REPORT OF MANAGEMENT ON INTERNAL CONTROL OVER FINANCIAL REPORTING
Our management is responsible for establishing and maintaining adequate internal control over financial reporting for the Company as defined in Rules 13a-15(f) and 15d-15(f) under the Exchange Act. Internal control over financial reporting is a process designed by or under the supervision of a company's principal executive and principal financial officers, or persons performing similar functions, and effected by the company's board of directors, management and other personnel, to provide reasonable assurance regarding the reliability of our financial reporting and the preparation of financial statements for external purposes in accordance with accounting principles generally accepted in the United States of America.
Management, including our Chief Executive Officer and Chief Financial Officer, conducted an evaluation of the effectiveness of our internal control over financial reporting based on the framework in
Internal Control — Integrated Framework 2013
issued by the Committee of Sponsoring Organizations of the Treadway Commission. Based on this evaluation, management concluded that the Company's internal control over financial reporting was effective as of
August 31, 2017
. Deloitte & Touche LLP has audited the effectiveness of the Company's internal control over financial reporting; their attestation report is included on page 52 of this Annual Report on Form 10-K.
51
REPORT OF INDEPENDENT REGISTERED PUBLIC ACCOUNTING FIRM
To the Board of Directors and Stockholders of
Commercial Metals Company
Irving, Texas
We have audited the internal control over financial reporting of Commercial Metals Company and subsidiaries (the "Company") as of August 31, 2017, based on criteria established in Internal Control - Integrated Framework (2013) issued by the Committee of Sponsoring Organizations of the Treadway Commission. The Company's management is responsible for maintaining effective internal control over financial reporting and for its assessment of the effectiveness of internal control over financial reporting, included in the accompanying Report of Management on Internal Control Over Financial Reporting. Our responsibility is to express an opinion on the Company's internal control over financial reporting based on our audit.
We conducted our audit in accordance with the standards of the Public Company Accounting Oversight Board (United States). Those standards require that we plan and perform the audit to obtain reasonable assurance about whether effective internal control over financial reporting was maintained in all material respects. Our audit included obtaining an understanding of internal control over financial reporting, assessing the risk that a material weakness exists, testing and evaluating the design and operating effectiveness of internal control based on the assessed risk, and performing such other procedures as we considered necessary in the circumstances. We believe that our audit provides a reasonable basis for our opinion.
A company's internal control over financial reporting is a process designed by, or under the supervision of, the company's principal executive and principal financial officers, or persons performing similar functions, and effected by the company's board of directors, management, and other personnel to provide reasonable assurance regarding the reliability of financial reporting and the preparation of financial statements for external purposes in accordance with generally accepted accounting principles. A company's internal control over financial reporting includes those policies and procedures that (1) pertain to the maintenance of records that, in reasonable detail, accurately and fairly reflect the transactions and dispositions of the assets of the company; (2) provide reasonable assurance that transactions are recorded as necessary to permit preparation of financial statements in accordance with generally accepted accounting principles, and that receipts and expenditures of the company are being made only in accordance with authorizations of management and directors of the company; and (3) provide reasonable assurance regarding prevention or timely detection of unauthorized acquisition, use, or disposition of the company's assets that could have a material effect on the financial statements.
Because of the inherent limitations of internal control over financial reporting, including the possibility of collusion or improper management override of controls, material misstatements due to error or fraud may not be prevented or detected on a timely basis. Also, projections of any evaluation of the effectiveness of the internal control over financial reporting to future periods are subject to the risk that the controls may become inadequate because of changes in conditions, or that the degree of compliance with the policies or procedures may deteriorate.
In our opinion, the Company maintained, in all material respects, effective internal control over financial reporting as of August 31, 2017, based on the criteria established in Internal Control - Integrated Framework (2013) issued by the Committee of Sponsoring Organizations of the Treadway Commission.
We have also audited, in accordance with the standards of the Public Company Accounting Oversight Board (United States), the consolidated financial statements and financial statement schedule as of and for the year ended August 31, 2017 of the Company and our report dated October 26, 2017, expressed an unqualified opinion on those financial statements and financial statement schedule.
/s/ Deloitte & Touche LLP
Dallas, Texas
October 26, 2017
52
REPORT OF INDEPENDENT REGISTERED PUBLIC ACCOUNTING FIRM
To the Board of Directors and Stockholders of
Commercial Metals Company
Irving, Texas
We have audited the accompanying consolidated balance sheets of Commercial Metals Company and subsidiaries (the "Company") as of August 31, 2017 and 2016, and the related consolidated statements of earnings, comprehensive income (loss), stockholders' equity, and cash flows for each of the three years in the period ended August 31, 2017. Our audits also included the financial statement schedule listed in the Index at Item 15. These financial statements and financial statement schedule are the responsibility of the Company's management. Our responsibility is to express an opinion on these financial statements and financial statement schedule based on our audits.
We conducted our audits in accordance with the standards of the Public Company Accounting Oversight Board (United States). Those standards require that we plan and perform the audit to obtain reasonable assurance about whether the financial statements are free of material misstatement. An audit includes examining, on a test basis, evidence supporting the amounts and disclosures in the financial statements. An audit also includes assessing the accounting principles used and significant estimates made by management, as well as evaluating the overall financial statement presentation. We believe that our audits provide a reasonable basis for our opinion.
In our opinion, such consolidated financial statements present fairly, in all material respects, the financial position of Commercial Metals Company and subsidiaries as of August 31, 2017 and 2016, and the results of their operations and their cash flows for each of the three years in the period ended August 31, 2017, in conformity with accounting principles generally accepted in the United States of America. Also, in our opinion, such financial statement schedule, when considered in relation to the basic consolidated financial statements taken as a whole, presents fairly, in all material respects, the information set forth therein.
We have also audited, in accordance with the standards of the Public Company Accounting Oversight Board (United States), the Company's internal control over financial reporting as of August 31, 2017, based on the criteria established in Internal Control-Integrated Framework (2013) issued by the Committee of Sponsoring Organizations of the Treadway Commission and our report dated October 26, 2017, expressed an unqualified opinion on the Company's internal control over financial reporting.
/s/ Deloitte & Touche LLP
Dallas, Texas
October 26, 2017
53
|
COMMERCIAL METALS COMPANY AND SUBSIDIARIES
CONSOLIDATED STATEMENTS OF EARNINGS
|
||||||||||||
|
|
Year Ended August 31,
|
|||||||||||
|
(in thousands, except share data)
|
2017
|
2016
|
2015
|
|||||||||
|
Net sales
|
$
|
4,569,675
|
|
$
|
4,177,518
|
|
$
|
5,424,413
|
|
|||
|
Costs and expenses:
|
|
|
|
|||||||||
|
Cost of goods sold
|
4,023,265
|
|
3,580,618
|
|
4,827,562
|
|
||||||
|
Selling, general and administrative expenses
|
426,523
|
|
414,561
|
|
414,094
|
|
||||||
|
Loss on debt extinguishment
|
22,672
|
|
11,480
|
|
—
|
|
||||||
|
Impairment of assets
|
8,164
|
|
40,028
|
|
9,839
|
|
||||||
|
Interest expense
|
44,047
|
|
62,121
|
|
76,456
|
|
||||||
|
4,524,671
|
|
4,108,808
|
|
5,327,951
|
|
|||||||
|
Earnings from continuing operations before income taxes
|
45,004
|
|
68,710
|
|
96,462
|
|
||||||
|
Income taxes
|
12,454
|
|
10,810
|
|
33,458
|
|
||||||
|
Earnings from continuing operations
|
32,550
|
|
57,900
|
|
63,004
|
|
||||||
|
Earnings (loss) from discontinued operations before income taxes
|
10,607
|
|
(1,469
|
)
|
29,389
|
|
||||||
|
Income taxes (benefit)
|
(3,175
|
)
|
1,669
|
|
12,950
|
|
||||||
|
Earnings (loss) from discontinued operations
|
13,782
|
|
(3,138
|
)
|
16,439
|
|
||||||
|
Net earnings
|
$
|
46,332
|
|
$
|
54,762
|
|
$
|
79,443
|
|
|||
|
Basic earnings (loss) per share:
|
||||||||||||
|
Earnings from continuing operations
|
$
|
0.28
|
|
$
|
0.50
|
|
$
|
0.54
|
|
|||
|
Earnings (loss) from discontinued operations
|
0.12
|
|
(0.02
|
)
|
0.14
|
|
||||||
|
Net earnings
|
$
|
0.40
|
|
$
|
0.48
|
|
$
|
0.68
|
|
|||
|
Diluted earnings (loss) per share:
|
|
|
|
|||||||||
|
Earnings from continuing operations
|
$
|
0.27
|
|
$
|
0.50
|
|
$
|
0.53
|
|
|||
|
Earnings (loss) from discontinued operations
|
0.12
|
|
(0.03
|
)
|
0.14
|
|
||||||
|
Net earnings
|
$
|
0.39
|
|
$
|
0.47
|
|
$
|
0.67
|
|
|||
See notes to consolidated financial statements.
54
|
COMMERCIAL METALS COMPANY AND SUBSIDIARIES
|
||||||||||||
|
Year Ended August 31,
|
||||||||||||
|
(in thousands)
|
2017
|
2016
|
2015
|
|||||||||
|
Net earnings
|
$
|
46,332
|
|
$
|
54,762
|
|
$
|
79,443
|
|
|||
|
Other comprehensive income (loss), net of income taxes:
|
|
|
|
|||||||||
|
Foreign currency translation adjustment:
|
||||||||||||
|
Foreign currency translation adjustment
|
30,509
|
|
(11,771
|
)
|
(83,063
|
)
|
||||||
|
Reclassification for translation loss (gain) realized upon liquidation of investment in foreign entity
|
968
|
|
12,597
|
|
(10,127
|
)
|
||||||
|
Foreign currency translation adjustment
|
31,477
|
|
826
|
|
(93,190
|
)
|
||||||
|
Net unrealized gain (loss) on derivatives:
|
|
|
|
|||||||||
|
Unrealized holding gain (loss)
|
756
|
|
1,618
|
|
(2,467
|
)
|
||||||
|
Reclassification for (gain) loss included in net earnings
|
(1,355
|
)
|
(1,737
|
)
|
1,758
|
|
||||||
|
Net unrealized loss on derivatives
|
(599
|
)
|
(119
|
)
|
(709
|
)
|
||||||
|
Defined benefit obligation:
|
|
|
|
|||||||||
|
Net gain (loss)
|
439
|
|
(132
|
)
|
(169
|
)
|
||||||
|
Amortization of net loss
|
154
|
|
104
|
|
99
|
|
||||||
|
Amortization of prior service credit
|
(70
|
)
|
(58
|
)
|
(57
|
)
|
||||||
|
Defined benefit obligation
|
523
|
|
(86
|
)
|
(127
|
)
|
||||||
|
Other comprehensive income (loss)
|
31,401
|
|
621
|
|
(94,026
|
)
|
||||||
|
Comprehensive income (loss)
|
$
|
77,733
|
|
$
|
55,383
|
|
$
|
(14,583
|
)
|
|||
See notes to consolidated financial statements.
55
|
COMMERCIAL METALS COMPANY AND SUBSIDIARIES
|
||||||||
|
August 31,
|
||||||||
|
(in thousands, except share data)
|
2017
|
2016
|
||||||
|
Assets
|
||||||||
|
Current assets:
|
||||||||
|
Cash and cash equivalents
|
$
|
252,595
|
|
$
|
517,544
|
|
||
|
Accounts receivable (less allowance for doubtful accounts of $8,665 and $6,427)
|
706,595
|
|
689,382
|
|
||||
|
Inventories
|
614,459
|
|
540,014
|
|
||||
|
Other current assets
|
140,251
|
|
110,464
|
|
||||
|
Current assets of businesses held for sale
|
—
|
|
190,721
|
|
||||
|
Total current assets
|
1,713,900
|
|
2,048,125
|
|
||||
|
Property, plant and equipment:
|
||||||||
|
Land
|
82,197
|
|
70,291
|
|
||||
|
Buildings and improvements
|
522,468
|
|
486,703
|
|
||||
|
Equipment
|
1,742,086
|
|
1,654,830
|
|
||||
|
Construction in process
|
258,190
|
|
111,156
|
|
||||
|
|
2,604,941
|
|
2,322,980
|
|
||||
|
Less accumulated depreciation and amortization
|
(1,543,658
|
)
|
(1,427,935
|
)
|
||||
|
|
1,061,283
|
|
895,045
|
|
||||
|
Goodwill
|
64,915
|
|
66,373
|
|
||||
|
Other assets
|
135,033
|
|
121,326
|
|
||||
|
Total assets
|
$
|
2,975,131
|
|
$
|
3,130,869
|
|
||
|
Liabilities and stockholders' equity
|
||||||||
|
Current liabilities:
|
||||||||
|
Accounts payable
|
$
|
282,127
|
|
$
|
207,875
|
|
||
|
Accrued expenses and other payables
|
307,129
|
|
263,086
|
|
||||
|
Current maturities of long-term debt
|
19,182
|
|
313,469
|
|
||||
|
Current liabilities of businesses held for sale
|
—
|
|
36,688
|
|
||||
|
Total current liabilities
|
608,438
|
|
821,118
|
|
||||
|
Deferred income taxes
|
49,197
|
|
63,021
|
|
||||
|
Other long-term liabilities
|
110,986
|
|
121,351
|
|
||||
|
Long-term debt
|
805,580
|
|
757,948
|
|
||||
|
Total liabilities
|
1,574,201
|
|
1,763,438
|
|
||||
|
Commitments and contingencies (Note 18)
|
|
|
||||||
|
Stockholders' equity:
|
||||||||
|
Common stock, par value $0.01 per share; authorized 200,000,000 shares; issued 129,060,664 shares; outstanding 115,793,736 and 114,635,596 shares
|
1,290
|
|
1,290
|
|
||||
|
Additional paid-in capital
|
349,258
|
|
358,745
|
|
||||
|
Accumulated other comprehensive loss
|
(81,513
|
)
|
(112,914
|
)
|
||||
|
Retained earnings
|
1,363,806
|
|
1,372,988
|
|
||||
|
Less treasury stock, 13,266,928 and 14,425,068 shares at cost
|
(232,084
|
)
|
(252,837
|
)
|
||||
|
Stockholders' equity
|
1,400,757
|
|
1,367,272
|
|
||||
|
Stockholders' equity attributable to noncontrolling interests
|
173
|
|
159
|
|
||||
|
Total equity
|
1,400,930
|
|
1,367,431
|
|
||||
|
Total liabilities and stockholders' equity
|
$
|
2,975,131
|
|
$
|
3,130,869
|
|
||
See notes to consolidated financial statements.
56
|
COMMERCIAL METALS COMPANY AND SUBSIDIARIES
|
||||||||||||
|
|
Year Ended August 31,
|
|||||||||||
|
(in thousands)
|
2017
|
2016
|
2015
|
|||||||||
|
Cash flows from (used by) operating activities:
|
||||||||||||
|
Net earnings
|
$
|
46,332
|
|
$
|
54,762
|
|
$
|
79,443
|
|
|||
|
Adjustments to reconcile net earnings to cash flows from (used by) operating activities:
|
||||||||||||
|
Depreciation and amortization
|
125,071
|
|
126,940
|
|
132,779
|
|
||||||
|
Share-based compensation
|
30,311
|
|
26,335
|
|
23,484
|
|
||||||
|
Loss on debt extinguishment
|
22,672
|
|
11,480
|
|
—
|
|
||||||
|
Write-down of inventory
|
21,529
|
|
15,555
|
|
37,652
|
|
||||||
|
Deferred income taxes
|
(14,184
|
)
|
(3,889
|
)
|
(13,071
|
)
|
||||||
|
Amortization of interest rate swaps termination gain
|
(11,657
|
)
|
(7,597
|
)
|
(7,597
|
)
|
||||||
|
Asset impairments
|
8,238
|
|
55,793
|
|
14,610
|
|
||||||
|
Net loss (gain) on sales of a subsidiary, assets and other
|
6,049
|
|
(2,591
|
)
|
(8,489
|
)
|
||||||
|
Provision for losses on receivables, net
|
6,049
|
|
6,878
|
|
3,481
|
|
||||||
|
Tax expense from stock plans
|
—
|
|
1,697
|
|
1,213
|
|
||||||
|
Changes in operating assets and liabilities, net of acquisitions:
|
|
|||||||||||
|
Accounts receivable
|
(78,527
|
)
|
142,510
|
|
206,633
|
|
||||||
|
Proceeds (payments) on sale of accounts receivable programs, net
|
81,731
|
|
(19,472
|
)
|
(117,753
|
)
|
||||||
|
Inventories
|
(98,835
|
)
|
209,555
|
|
127,583
|
|
||||||
|
Accounts payable, accrued expenses and other payables
|
93,478
|
|
(43,577
|
)
|
(180,517
|
)
|
||||||
|
Other operating assets and liabilities
|
(63,785
|
)
|
12,486
|
|
14,010
|
|
||||||
|
Net cash flows from operating activities
|
174,472
|
|
586,865
|
|
313,461
|
|
||||||
|
Cash flows from (used by) investing activities:
|
||||||||||||
|
Capital expenditures
|
(213,120
|
)
|
(163,332
|
)
|
(119,580
|
)
|
||||||
|
Proceeds from the sale of subsidiaries
|
163,449
|
|
4,349
|
|
27,831
|
|
||||||
|
Acquisitions
|
(56,080
|
)
|
—
|
|
—
|
|
||||||
|
Increase in restricted cash, net
|
(11,128
|
)
|
(21,777
|
)
|
—
|
|
||||||
|
Proceeds from the sale of property, plant and equipment
|
3,164
|
|
5,113
|
|
14,925
|
|
||||||
|
Net cash flows used by investing activities
|
(113,715
|
)
|
(175,647
|
)
|
(76,824
|
)
|
||||||
|
Cash flows from (used by) financing activities:
|
||||||||||||
|
Repayments of long-term debt
|
(711,850
|
)
|
(211,394
|
)
|
(11,335
|
)
|
||||||
|
Proceeds from long-term debt transactions
|
475,454
|
|
—
|
|
—
|
|
||||||
|
Cash dividends
|
(55,514
|
)
|
(55,342
|
)
|
(55,945
|
)
|
||||||
|
Debt extinguishment costs
|
(22,672
|
)
|
(11,127
|
)
|
—
|
|
||||||
|
Stock issued under incentive and purchase plans, net of forfeitures
|
(5,498
|
)
|
(6,034
|
)
|
(1,492
|
)
|
||||||
|
Debt issuance costs
|
(4,449
|
)
|
—
|
|
—
|
|
||||||
|
Increase (decrease) in documentary letters of credit, net
|
22
|
|
(41,468
|
)
|
(80,482
|
)
|
||||||
|
Contribution from noncontrolling interests
|
14
|
|
29
|
|
38
|
|
||||||
|
Treasury stock acquired
|
—
|
|
(30,595
|
)
|
(41,806
|
)
|
||||||
|
Short-term borrowings, net change
|
—
|
|
(20,090
|
)
|
7,802
|
|
||||||
|
Tax expense from stock plans
|
—
|
|
(1,697
|
)
|
(1,213
|
)
|
||||||
|
Decrease in restricted cash
|
—
|
|
1
|
|
3,742
|
|
||||||
|
Net cash flows used by financing activities
|
(324,493
|
)
|
(377,717
|
)
|
(180,691
|
)
|
||||||
|
Effect of exchange rate changes on cash
|
(1,213
|
)
|
(1,280
|
)
|
(5,548
|
)
|
||||||
|
Increase (decrease) in cash and cash equivalents
|
(264,949
|
)
|
32,221
|
|
50,398
|
|
||||||
|
Cash and cash equivalents at beginning of year
|
517,544
|
|
485,323
|
|
434,925
|
|
||||||
|
Cash and cash equivalents at end of year
|
$
|
252,595
|
|
$
|
517,544
|
|
$
|
485,323
|
|
|||
|
Supplemental information:
|
||||||||||||
|
Noncash activities-
|
||||||||||||
|
Liabilities related to additions of property, plant and equipment
|
|
$
|
51,330
|
|
|
$
|
29,763
|
|
$
|
19,921
|
|
|
See notes to consolidated financial statements.
57
|
COMMERCIAL METALS COMPANY AND SUBSIDIARIES
CONSOLIDATED STATEMENTS OF STOCKHOLDERS' EQUITY
|
|||||||||||||||||||||||||
|
|
Common Stock
|
Additional
|
Accumulated
Other |
|
Treasury Stock
|
Non-
|
|
||||||||||||||||||
|
(in thousands, except share data)
|
Number of
Shares |
Amount
|
Paid-In
Capital |
Comprehensive Loss
|
Retained
Earnings |
Number of
Shares |
Amount
|
Controlling
Interests |
Total
|
||||||||||||||||
|
Balance at September 1, 2014
|
129,060,664
|
|
$
|
1,290
|
|
$
|
359,338
|
|
$
|
(19,509
|
)
|
$
|
1,350,070
|
|
(11,231,402
|
)
|
$
|
(218,494
|
)
|
$
|
111
|
|
$
|
1,472,806
|
|
|
Net earnings
|
|
|
|
|
79,443
|
|
|
|
|
|
79,443
|
|
|||||||||||||
|
Other comprehensive loss
|
|
|
|
(94,026
|
)
|
|
|
|
|
(94,026
|
)
|
||||||||||||||
|
Cash dividends ($0.48 per share)
|
|
|
|
|
(55,945
|
)
|
|
|
|
(55,945
|
)
|
||||||||||||||
|
Treasury stock acquired
|
(2,902,218
|
)
|
(41,806
|
)
|
(41,806
|
)
|
|||||||||||||||||||
|
Issuance of stock under incentive and purchase plans, net of forfeitures
|
|
|
(15,831
|
)
|
|
|
708,294
|
|
14,339
|
|
|
(1,492
|
)
|
||||||||||||
|
Stock-based compensation
|
|
|
19,621
|
|
|
|
|
|
|
19,621
|
|
||||||||||||||
|
Tax expense from stock-based plans
|
|
|
(1,213
|
)
|
|
|
|
|
|
|
(1,213
|
)
|
|||||||||||||
|
Contribution of noncontrolling interests
|
|
|
|
|
|
|
|
|
38
|
|
38
|
|
|||||||||||||
|
Reclassification of share-based liability awards
|
3,948
|
|
3,948
|
|
|||||||||||||||||||||
|
Balance, August 31, 2015
|
129,060,664
|
|
$
|
1,290
|
|
$
|
365,863
|
|
$
|
(113,535
|
)
|
$
|
1,373,568
|
|
(13,425,326
|
)
|
$
|
(245,961
|
)
|
$
|
149
|
|
$
|
1,381,374
|
|
|
Net earnings
|
|
|
|
|
54,762
|
|
|
|
|
54,762
|
|
||||||||||||||
|
Other comprehensive income
|
|
|
|
621
|
|
|
|
|
|
621
|
|
||||||||||||||
|
Cash dividends ($0.48 per share)
|
|
|
|
|
(55,342
|
)
|
|
|
|
(55,342
|
)
|
||||||||||||||
|
Treasury stock acquired
|
(2,255,069
|
)
|
(30,595
|
)
|
(30,595
|
)
|
|||||||||||||||||||
|
Issuance of stock under incentive and purchase plans, net of forfeitures
|
|
|
(29,753
|
)
|
|
|
1,255,327
|
|
23,719
|
|
|
(6,034
|
)
|
||||||||||||
|
Stock-based compensation
|
|
|
21,278
|
|
|
|
|
|
|
21,278
|
|
||||||||||||||
|
Tax expense from stock-based plans
|
|
|
(1,697
|
)
|
|
|
|
|
|
|
(1,697
|
)
|
|||||||||||||
|
Contribution of noncontrolling interests
|
|
|
19
|
|
|
|
|
|
|
|
10
|
|
29
|
|
|||||||||||
|
Reclassification of share-based liability awards
|
|
|
3,035
|
|
|
|
|
|
|
3,035
|
|
||||||||||||||
|
Balance at August 31, 2016
|
129,060,664
|
|
$
|
1,290
|
|
$
|
358,745
|
|
$
|
(112,914
|
)
|
$
|
1,372,988
|
|
(14,425,068
|
)
|
$
|
(252,837
|
)
|
$
|
159
|
|
$
|
1,367,431
|
|
|
Net earnings
|
|
|
|
|
46,332
|
|
|
|
|
|
46,332
|
|
|||||||||||||
|
Other comprehensive income
|
|
|
|
31,401
|
|
|
|
|
|
31,401
|
|
||||||||||||||
|
Cash dividends ($0.48 per share)
|
|
|
|
|
(55,514
|
)
|
|
|
|
(55,514
|
)
|
||||||||||||||
|
Issuance of stock under incentive and purchase plans, net of forfeitures
|
|
|
(26,126
|
)
|
|
|
1,158,140
|
|
20,753
|
|
|
(5,373
|
)
|
||||||||||||
|
Stock-based compensation
|
|
|
15,001
|
|
|
|
|
|
|
15,001
|
|
||||||||||||||
|
Contribution of noncontrolling interests
|
|
|
|
|
|
|
|
|
14
|
|
14
|
|
|||||||||||||
|
Reclassification of share-based liability awards
|
|
|
1,638
|
|
|
|
|
|
|
|
1,638
|
|
|||||||||||||
|
Balance at August 31, 2017
|
129,060,664
|
|
$
|
1,290
|
|
$
|
349,258
|
|
$
|
(81,513
|
)
|
$
|
1,363,806
|
|
(13,266,928
|
)
|
$
|
(232,084
|
)
|
$
|
173
|
|
$
|
1,400,930
|
|
58
COMMERCIAL METALS COMPANY AND SUBSIDIARIES
NOTES TO CONSOLIDATED FINANCIAL STATEMENTS
Nature of Operations
As a vertically integrated organization, Commercial Metals Company ("CMC," and together with its consolidated subsidiaries, the "Company") manufactures, recycles, and markets steel and metal products, related materials and services through a network including four electric arc furnace ("EAF") mini mills, an EAF micro mill, a rerolling mill, steel fabrication and processing facilities, construction-related product warehouses, metal recycling facilities and marketing and distribution offices in the United States ("U.S.") and in strategic international markets.
The Company has
five
business segments across
two
geographic divisions. The CMC Americas Division includes
three
segments: Americas Recycling, Americas Mills and Americas Fabrication. The CMC International Division includes
two
segments: International Mill and International Marketing and Distribution.
Americas Recycling
The Americas Recycling segment processes scrap metals for use as a raw material by manufacturers of new metal products. This segment sells scrap metals to steel mills and foundries, aluminum sheet and ingot manufacturers, brass and bronze ingot makers, copper refineries and mills, secondary lead smelters, specialty steel mills, high temperature alloy manufacturers and other consumers.
Americas Mills
The Americas Mills segment, through our three EAF mini mills, micro mill, and rerolling mill, manufactures finished long steel products including reinforcing bar ("rebar"), merchant bar, light structural, and other special sections as well as semi-finished billets for re-rolling and forging applications. This segment's products are sold to the construction, service center, transportation, steel warehousing, fabrication, energy, petrochemical and original equipment manufacturing industries. The Americas Mills segment also includes
nine
scrap processing facilities and two scrap metal shredders that directly support the steel mills.
Americas Fabrication
The Americas Fabrication segment consists of the Company's rebar and structural fabrication operations, fence post manufacturing facilities, construction-related product facilities and facilities that heat-treat steel to strengthen and provide flexibility. Fabricated steel products are used primarily in the construction of commercial and non-commercial buildings, hospitals, convention centers, industrial plants, power plants, highways, bridges, arenas, stadiums and dams.
International Mill
The International Mill segment is comprised of the Company's mill operations in Poland as well as the Company's recycling and fabrication operations located in Poland. This segment manufactures rebar, merchant bar, and wire rod as well as semi-finished billets. In addition, this segment's fabrication operations sell fabricated rebar, fabricated mesh, assembled rebar cages and other rebar by-products. The International Mill's products are sold primarily to fabricators, manufacturers, distributors and construction companies.
International Marketing and Distribution
The International Marketing and Distribution segment includes international operations for the sale, distribution and processing of steel products, ferrous and nonferrous metals and other industrial products. Additionally, this segment includes the Company's steel marketing and distribution division headquartered in the U.S. ("CMC Cometals Steel") and a recycling facility in Singapore. Prior to August 31, 2017, this segment also included the Company's raw materials marketing and distribution division headquartered in the U.S. ("CMC Cometals"). See Note 3, Changes in Business, for additional details. The International Marketing and Distribution segment buys and sells primary and secondary metals, fabricated metals, semi-finished, long and flat steel products and other industrial products. This segment sells its products to customers, primarily manufacturers, in the steel, nonferrous metals, metal fabrication, chemical, refractory, construction and transportation industries.
59
Consolidation
The consolidated financial statements include the accounts of the Company and its wholly-owned and majority owned subsidiaries and certain variable interest entities ("VIEs") for which the Company is the primary beneficiary. Intercompany account balances and transactions have been eliminated.
Upon inception of an arrangement with a potential VIE, the Company performs an assessment of the contractual agreements that define the ownership structure, risks, responsibilities, indebtedness, voting rights and board representation of the respective parties when determining whether it is the primary beneficiary of the entity. The Company concludes that it is the primary beneficiary and consolidates the VIE if it has both (a) the power to direct the activities that most significantly impact the economic performance of the VIE and (b) the obligation to absorb losses of, or the right to receive benefits from, the variable interest entity that potentially could be significant to the VIE. The Company's assessment of whether it is the primary beneficiary of the VIE is continuously performed.
Use of Estimates
The preparation of the Company's consolidated financial statements in accordance with accounting principles generally accepted in the United States ("GAAP") requires management to make estimates and assumptions that affect the reported amounts of assets and liabilities and disclosure of contingent assets and liabilities at the date of the consolidated financial statements and reported amounts of net sales and expenses during the reporting period. Significant items subject to such estimates and assumptions include the valuation of assets received in acquisitions; the carrying value of inventory and long-lived assets, including goodwill; valuation allowances for receivables and deferred income taxes; percentage of completion accounting method for revenue recognition; share-based compensation; potential litigation claims and settlements; environmental liabilities; and the carrying value of assets held for sale. Actual results could differ significantly from these estimates and assumptions.
Cash and Cash Equivalents
Cash and cash equivalents include cash on deposit and short-term, highly-liquid investments with original maturities of three months or less at the date of purchase.
Revenue Recognition and Allowance for Doubtful Accounts
The Company recognizes sales when title passes to the customer either when goods are shipped or when they are delivered based upon the terms of the sale, there is persuasive evidence of an arrangement, the price is fixed or determinable and collectability is reasonably assured. When the Company estimates that a firm purchase commitment from a customer will result in a loss, the Company accrues the entire loss as soon as it is probable and estimable. The Company accounts for certain fabrication projects based on the percentage of completion accounting method, based primarily on contract cost incurred to date compared to total estimated contract cost. Changes to total estimated contract cost, or loss, if any, are recognized in the period in which they are determined. Sales recognized in excess of amounts billed of
$34.7 million
and
$19.4 million
are classified as current assets and are reflected in accounts receivable on the Company's consolidated balances sheets as of
August 31, 2017
and
2016
, respectively. Accounts receivable included retainage of
$43.2 million
and
$38.7 million
as of
August 31, 2017
and
2016
, respectively. Shipping and other transportation costs billed to customers are included in net sales and the related costs incurred are reflected in cost of goods sold in the Company's consolidated statements of earnings. The Company maintains an allowance for doubtful accounts to reflect its estimate of the uncollectability of accounts receivable. These reserves are based on historical trends, current market conditions and customers' financial condition. The Company reviews and sets credit limits for each customer. Some of the Company's divisions use credit insurance or letters of credit to ensure prompt payment in accordance with the terms of sale. Generally, collateral is not required. Approximately
28%
and
30%
of total receivables at
August 31, 2017
and
2016
, respectively, were secured by credit insurance or letters of credit.
Inventories
At
August 31, 2017
, inventories were stated at the lower of cost or net realizable value. Inventory cost for operations in the CMC Americas division and the International Mill segment is determined by the weighted average cost method. Inventory cost for the International Marketing and Distribution segment is determined by the specific identification method. At
August 31, 2017
and
2016
,
80%
and
60%
of the Company's inventories were valued using the weighted average cost method, respectively, and
20%
and
40%
of the Company's inventories were valued using the specific identification method, respectively.
60
Elements of cost in finished goods inventory in addition to the cost of material include depreciation, amortization, utilities, consumable production supplies, maintenance, production, wages and transportation costs. Additionally, the costs of departments that support production, including materials management and quality control, are allocated to inventory.
Property, Plant and Equipment
Property, plant and equipment are recorded at cost. Maintenance is expensed as incurred. Leasehold improvements are amortized over the shorter of their estimated useful lives or the lease term. Depreciation and amortization is recorded on a straight-line basis over the following estimated useful lives:
|
Buildings
|
7
|
to
|
40
|
years
|
|
Land improvements
|
3
|
to
|
25
|
years
|
|
Leasehold improvements
|
3
|
to
|
15
|
years
|
|
Equipment
|
3
|
to
|
25
|
years
|
The Company evaluates impairment of its property, plant and equipment whenever events or changes in circumstances indicate that the carrying value may not be recoverable. For each asset or group of assets held for use with indicators of impairment, the Company compares the sum of the expected future cash flows generated by the asset or group of assets with its associated net carrying value. If the net carrying value of the asset or group of assets exceeds expected undiscounted future cash flows, the excess of the net book value over estimated fair value is charged to impairment loss in the accompanying consolidated statements of earnings. Properties held for sale are reported at the lower of their carrying amount or their estimated sales price, less estimated costs to sell.
Government Assistance
Government assistance, including non-monetary grants, herein collectively referred to as grants, are not recognized until there is reasonable assurance that the Company will comply with the conditions of the grant and the Company will receive the grant.
Generally, government grants fall into two categories: grants related to assets and grants related to income. Grants related to assets are government grants for the purchase, construction or other acquisition of long-term assets. The Company accounts for grants related to assets as deferred income with the offset to an asset account, such as fixed assets, on the Consolidated Balance Sheets. Non-monetary grants are recognized at fair value. The Company recognizes the deferred income in profit or loss on a systematic basis over the useful life of the asset; which, consistent with the Company's fixed assets policy, is straight-line. The period over which grants are recognized depends on the terms of the agreement. Grants related to specific expenses already incurred are recognized in profit or loss in the period in which the grant becomes receivable. A grant related to depreciable assets is recognized in profit or loss over the life of the depreciable asset. Grants related to non-depreciable assets may require the fulfillment of certain obligations. In such cases, these grants are recognized in profit or loss over the periods that bear the cost of meeting the obligations.
Grants related to income are any grants that are not considered grants related to assets, such as grants to compensate for certain expenses. Grants related to income are recognized as a reduction in the related expense in the period that the recognition criteria are met. See Note 11, New Markets Tax Credits.
Goodwill and Other Intangible Assets
Goodwill is tested for impairment at the reporting unit level annually and whenever events or circumstances indicate that the carrying value may not be recoverable. During fiscal 2017, the Company prospectively changed its annual quantitative goodwill impairment testing date from the last day of the fourth quarter to the first day of the fourth quarter. The change in the goodwill impairment testing date alleviates fiscal year end resource and timing constraints. This change does not represent a material change in accounting principle, and did not delay, accelerate or avoid a goodwill impairment charge.
The Company utilizes a quantitative test that compares the fair value of a reporting unit with its carrying amount, including goodwill, to evaluate goodwill for impairment. If the carrying amount of a reporting unit exceeds its fair value, an impairment loss is indicated in the amount that the carrying value exceeds the fair value of the reporting unit, not to exceed the goodwill value for the reporting unit. The Company's reporting units represent an operating segment or one level below an operating segment.
The fair value of each reporting unit is estimated using an income approach based on the present value of expected future cash flows and a market approach based on valuation metrics of comparable peer companies and a reconciliation of the Company's
61
estimate of the aggregate fair value of the reporting units to the Company's market capitalization, including a control premium. The determination of fair value involves a number of significant assumptions and estimates, including discount rates, volumes, prices, capital expenditures and the impact of current market conditions. These estimates could be materially impacted by adverse changes in these assumptions.
For fiscal
2017
, the Company recorded a goodwill impairment charge of
$2.0 million
related to a reporting unit in its International Marketing and Distribution segment. For fiscal 2016, the annual goodwill impairment analysis did not result in any impairment charges at any of the Company's reporting units. For fiscal 2015, the Company recorded a goodwill impairment charge of
$7.3 million
related to its Americas Recycling segment. See Note 7, Goodwill and Other Intangible Assets, for additional details of the impairment charges. As of
August 31, 2017
and
2016
, one of the Company's reporting units within its Americas Fabrication segment comprised
$51.6 million
and
51.3 million
, respectively, of the Company's total goodwill. Goodwill at the Company's other reporting units was not material at
August 31, 2017
and
2016
.
Intangible assets with finite lives are amortized on a straight-line basis over their estimated useful lives and are reviewed for impairment whenever events or changes in circumstances indicate that the carrying value may not be recoverable. Impairment charges are recorded on finite-lived intangible assets when indicators of impairment are present and the undiscounted cash flows estimated to be generated by those assets are less than the assets' carrying amounts.
Contingencies
The Company accrues for claims and litigation, including environmental investigation and remediation costs, when they are both probable and the amount can be reasonably estimated. Environmental costs are based upon estimates regarding the sites for which the Company will be responsible, the scope and cost of work to be performed at each site, the portion of costs that will be shared with other parties and the timing of remediation. Where timing and amounts cannot be reasonably determined, a range is estimated and the lower end of the range is typically recorded.
Stock-Based Compensation
The Company recognizes stock-based equity awards and liability awards at fair value in the financial statements. The fair value of each stock-based equity award is estimated at the date of grant using the Black-Scholes or Monte Carlo pricing model. Total compensation cost of the stock-based equity award is amortized over the requisite service period using the accelerated method of amortization for grants with graded vesting or using the straight-line method for grants with cliff vesting. Stock-based liability awards are measured at fair value at the end of each reporting period and will fluctuate based on the price of CMC common stock and performance relative to the targets.
Accounts Payable — Documentary Letters of Credit
In order to facilitate certain trade transactions, the Company utilizes documentary letters of credit to provide assurance of payment to its suppliers. These letters of credit are typically for payment at a future date conditional upon the bank determining the documentation presented to be in strict compliance with all terms and conditions of the letters of credit. Banks issue these letters of credit under uncommitted lines of credit, which are in addition to and separate from the Company's contractually committed revolving credit agreement. In some cases, if the Company's suppliers choose to discount the future dated obligation, the Company may pay the fee associated with the discount.
Income Taxes
CMC and its U.S. subsidiaries file a consolidated federal income tax return. Deferred income taxes are provided for temporary differences between financial statement and income tax bases of assets and liabilities. The principal differences are described in Note 14, Income Tax. Benefits from income tax credits are reflected currently in earnings. The Company intends to indefinitely reinvest all undistributed earnings of non-U.S. subsidiaries. The Company records income tax positions based on a more likely than not threshold that the tax positions will be sustained on examination by the taxing authorities having full knowledge of all relevant information.
Foreign Currencies
The functional currencies of the Company's Australian, German, Polish, United Kingdom and certain Chinese, Singaporean and Thai operations are their local currencies. The Company's remaining international subsidiaries' functional currency is the U.S. dollar. Translation adjustments are reported as a component of accumulated other comprehensive loss. Transaction gains (losses) from transactions denominated in currencies other than the functional currencies were
$5.5 million
,
$(13.9) million
and
62
$(45.4) million
for the years ended
August 31, 2017
,
2016
and
2015
, respectively, and are primarily included in selling, general and administrative expenses in the Company's consolidated statements of earnings.
Derivative Financial Instruments
The Company recognizes all derivatives as either assets or liabilities in the consolidated balance sheets and measures those instruments at fair value. Derivatives that are not designated as hedges are adjusted to fair value through net earnings. Changes in the fair value of derivatives that are designated as hedges are recognized in two fashions depending on the nature of the hedge. In the case of fair value hedges, changes are recognized as an offset against the change in fair value of the hedged balance sheet item. When the derivative is designated as a cash flow hedge and is highly effective, changes are recognized as other comprehensive income. The ineffective portion of a change in fair value for derivatives designated as hedges is recognized in net earnings.
When a derivative instrument is sold, terminated, exercised, or expires, the gain or loss is recorded in the consolidated statement of earnings for fair value hedges, and the cumulative unrealized gain or loss, which had been recognized in the statement of comprehensive income, is reclassified to the consolidated statement of earnings for cash flow hedges. Additionally, when hedged items are sold or extinguished, or the anticipated transaction being hedged is no longer expected to occur, the Company recognizes the gain or loss on the designated hedged financial instrument.
Fair Value
The Company has established a fair value hierarchy which prioritizes the inputs to the valuation techniques used to measure fair value into
three
levels. These levels are determined based on the lowest level input that is significant to the fair value measurement. Level 1 represents unadjusted quoted prices in active markets for identical assets and liabilities. Level 2 represents quoted prices for similar assets and liabilities in active markets (other than those included in Level 1) which are observable, either directly or indirectly. Level 3 represents valuations derived from valuation techniques in which one or more significant inputs or significant value drivers are unobservable.
Recently Adopted Accounting Pronouncements
In the fourth quarter of fiscal 2017, the Company early adopted Accounting Standards Update ("ASU") 2017-04, Intangibles - Goodwill and Other: Simplifying the Test for Goodwill Impairment (Topic 805), issued by the Financial Accounting Standards Board ("FASB"). The standard simplifies the subsequent measurement of goodwill by removing the second step of the two-step impairment test. The standard was applied on a prospective basis. The adoption of this guidance did not have a material impact on the Company's consolidated financial statements.
In the second quarter of fiscal 2017, the Company adopted ASU 2016-09, Compensation - Stock Compensation (Topic 718), issued by the FASB requiring that the Company recognize all excess tax benefits and tax deficiencies as an income tax expense or benefit when stock awards vest or are settled. Additionally, the guidance allows for an increase in the threshold for net share settlement up to the maximum statutory rate in employees’ applicable jurisdictions without triggering liability classification. The adoption of this guidance had an immaterial impact on income taxes on the Company’s consolidated statement of earnings for the year ended August 31, 2017. Additionally, the Company has elected to continue to estimate forfeitures. As such, this adoption has no cumulative effect on retained earnings. The Company elected to apply the presentation requirements for cash flows related to excess tax benefits prospectively, which had an immaterial impact on both net cash from operating activities and net cash used in financing activities for the year ended August 31, 2017. The presentation requirements for cash flows related to employee taxes paid for withheld shares had no impact on any of the periods presented on the Company’s consolidated statements of cash flows since such cash flows have historically been presented as a financing activity.
In the first quarter of fiscal 2017, the Company adopted ASU 2015-16, Business Combinations (Topic 805), issued by the FASB requiring the acquirer in a business combination to recognize adjustments to provisional amounts that are identified during the measurement period in the reporting period in which the adjustment amounts are determined. The guidance was adopted on a prospective basis and did not have an impact on the Company's consolidated financial statements.
In the first quarter of fiscal 2017, the Company adopted ASU 2015-05, Intangibles - Goodwill and Other - Internal-Use Software (Subtopic 350-40), issued by the FASB requiring an entity to account for fees paid in a cloud computing arrangement as a license of internal-use software. The guidance was adopted on a prospective basis and did not have an impact on the Company's consolidated financial statements.
63
In the first quarter of fiscal 2017, the Company adopted ASU 2015-02, Consolidation (Topic 810), issued by the FASB modifying the evaluation of whether limited partnerships and similar legal entities are voting interest entities. The guidance was adopted on a retrospective basis and did not have an impact on the Company's consolidated financial statements.
In the first quarter of fiscal 2017, the Company adopted ASU 2015-01, Income Statement - Extraordinary and Unusual Items (Subtopic 225-20), issued by the FASB eliminating the concept of extraordinary items. Under this guidance, an entity is no longer allowed to separately disclose extraordinary items, net of tax, in the income statement after income from continuing operations. The guidance was adopted on a prospective basis and did not have an impact on the Company's consolidated financial statements.
In the first quarter of fiscal 2017, the Company adopted ASU 2014-13, Consolidation (Topic 810), issued by the FASB providing a measurement alternative to the existing fair value measurement guidance. When the measurement alternative is elected, the financial assets and liabilities are measured using the more observable of the fair value of the financial assets and the fair value of the financial liabilities. The guidance was adopted on a retrospective basis and did not have an impact on the Company's consolidated financial statements.
In the first quarter of fiscal 2017, the Company adopted ASU 2014-12, Compensation - Stock Compensation (Topic 718), issued by the FASB requiring entities to account for a performance target as a performance condition if the target affects vesting and could be achieved after the requisite service period. The guidance was followed by the Company prior to its adoption and therefore had no impact on the Company's consolidated financial statements upon adoption.
Recently Issued Accounting Pronouncements
In August 2017, the FASB issued ASU 2017-12, Derivatives and Hedging - Targeted Improvements to Accounting for Hedging Activities (Topic 815). The ASU better aligns accounting rules with a company's risk management activities; better reflects economic results of hedging in financial statements; and simplifies hedge accounting treatment. For public companies, this standard is effective for annual periods beginning after December 15, 2018, including interim periods within those periods, with early adoption permitted. The standard must be applied to hedging relationships existing on the date of adoption and the effect of adoption should be reflected as of the beginning of the fiscal year of adoption. The Company is currently evaluating the impact of this guidance on its consolidated financial statements as well as determining the Company's planned adoption date.
In January 2017, the FASB issued ASU 2017-01, Business Combinations: Clarifying the Definition of a Business. The standard clarifies the definition of a business with the objective of adding guidance to assist entities with evaluating whether transactions should be accounted for as acquisitions (or disposals) of assets or businesses. For public companies, this standard is effective for annual periods beginning after December 15, 2017, including interim periods within those periods. The standard must be applied prospectively on or after the effective date. Early application of the standard is allowed with certain restrictions. The adoption of this guidance is not expected to have a material impact on the consolidated financial statements.
In November 2016, the FASB issued ASU 2016-18, Statement of Cash Flows (Topic 230), requiring that the statement of cash flows explain the change in the total cash, cash equivalents, and amounts generally described as restricted cash or restricted cash equivalents. This guidance is effective for fiscal years, and interim reporting periods therein, beginning after December 15, 2017 with early adoption permitted. The provisions of this guidance are to be applied using a retrospective approach, which requires application of the guidance for all periods presented. The Company is currently evaluating the impact of this guidance on its consolidated financial statements as well as determining the Company's planned adoption date.
In February 2016, the FASB issued ASU 2016-02, Leases (Topic 842), requiring a lessee to recognize a right-of-use asset and a lease liability on its balance sheet for all leases with terms of twelve months or longer. This guidance is effective for fiscal years, and interim reporting periods therein, beginning after December 15, 2018 and will be effective for the Company beginning September 1, 2019, at which point the Company plans to adopt the standard. The provisions of this guidance are to be applied using a modified retrospective approach, with elective reliefs, which requires application of the guidance for all periods presented. The Company is currently evaluating the impact of this guidance on its consolidated financial statements.
In May 2014, the FASB issued ASU 2014-09, Revenue from Contracts with Customers (Topic 606), and has modified the standard thereafter. Under the standard, revenue is recognized when a customer obtains control of promised goods or services and is recognized in an amount that reflects the consideration to which the entity expects to be entitled in exchange for those goods or services. This guidance is effective for annual and interim reporting periods beginning after December 15, 2017 and will be effective for the Company beginning September 1, 2018, at which point the Company plans to adopt the standard. The standard permits the use of either the retrospective or cumulative effect transition method. The Company currently expects to adopt the standard using the modified retrospective approach. As part of the adoption of the standard, management assembled a cross-functional implementation team which has reviewed representative samples of contracts to analyze the impact of the standard. As
64
a result of these analyses, the Company does not anticipate that there will be a material impact on its statement of financial position, results of operations or cash flows in its Americas Mills, Americas Recycling or International Mill segments. The Company is still in the process of examining contract specific terms within the Americas Fabrication segment. In addition, the standard includes expanded disclosure requirements, which the Company continues to analyze. As part of the overall evaluation of the standard, the Company is also identifying and preparing to implement changes to its accounting policies, practices, and internal controls over financial reporting to support the standard both in the transition period as well as on an on-going basis.
Acquisitions
On December 12, 2016, the Company completed the purchase of substantially all of the assets of Continental Concrete Structures, Inc. ("CCS"), a fabricator of post-tensioning cable and related products for commercial and public construction projects with a facility in Alpharetta, Georgia. In addition, CCS provides professional design and value engineering services to the construction industry throughout North America. This acquisition complements the Company’s current rebar fabrication business and continues its strategy of creating value for customers. The operating results of this facility are included in the Americas Fabrication reporting segment.
On January 9, 2017, the Company completed the purchase of substantially all of the assets of Associated Steel Workers, Limited ("ASW"), a steel fabrication facility in Kapolei, Hawaii. This acquisition continues the vertical integration model of the Company by extending its geographic reach, establishing a fabrication operation in Hawaii and expanding its presence in the Hawaiian market. The operating results of this facility are included in the Americas Fabrication reporting segment.
On March 6, 2017, the Company completed the purchase of certain assets from OmniSource Corporation, a wholly-owned subsidiary of Steel Dynamics, Inc., consisting of seven recycling facilities located in the southeast United States (the "Recycling Assets"), which are in close proximity to CMC’s mini mill in Cayce, South Carolina. These facilities provide synergies with CMC's other operations in the region. The operating results of these facilities are included in the Americas Recycling reporting segment.
The acquisitions of CCS, ASW and the Recycling Assets are not material, individually or in the aggregate, to the Company's financial position or results of operations; therefore, pro forma operating results for the acquisitions are not presented since the results would not be significantly different than reported results.
For the years ended
August 31, 2016
and
2015
, the Company did not have any business acquisitions.
Businesses Held for Sale
The Company did not have any businesses classified as held for sale at
August 31, 2017
. As of
August 31, 2016
, CMC Cometals was classified as held for sale. Assets and liabilities of the business held for sale on the Company’s consolidated balance sheet consisted of the following:
|
Year Ended August 31,
|
||||
|
(in thousands)
|
2016
|
|||
|
Assets:
|
||||
|
Accounts receivable
|
$
|
76,402
|
|
|
|
Inventories
|
112,740
|
|
||
|
Other current assets
|
1,579
|
|
||
|
Current assets of business held for sale
|
190,721
|
|
||
|
Property, plant and equipment, net of accumulated depreciation and amortization
|
4
|
|
||
|
Long-term assets of business held for sale*
|
$
|
4
|
|
|
|
Liabilities:
|
||||
|
Accounts payable-trade
|
$
|
35,662
|
|
|
|
Accrued expenses and other payables
|
1,026
|
|
||
|
Current liabilities of business held for sale
|
$
|
36,688
|
|
|
* Included in other assets on the consolidated balance sheet.
65
Discontinued Operations
On June 13, 2017, the Company announced a plan to exit its International Marketing and Distribution segment. As an initial step in this plan, on August 31, 2017, the Company completed the sale of CMC Cometals, subject to customary post-closing adjustments. In addition, on June 13, 2017, the Company announced its plan to pursue a restructuring and sale of the remaining trading operations located in the U.S., Asia and Australia. The results of the sale and the activity related to CMC Cometals are included in discontinued operations in the consolidated statements of earnings for all periods presented. The remainder of the International Marketing and Distribution segment is expected to be classified in discontinued operations either upon meeting the criteria to be classified as held for sale or upon the wind-down of each operation.
The major classes of line items constituting earnings before income taxes for CMC Cometals, which are included in earnings (loss) from discontinued operations before income taxes in the consolidated statements of earnings for all periods presented, are presented in the table below. CMC Cometals is the only component that qualified for discontinued operations post-adoption of ASU 2014-08, Presentation of Financial Statements (Topic 205) and Property, Plant, and Equipment (Topic 360).
|
|
Year Ended August 31,
|
||||||||||||
|
(in thousands)
|
2017
|
2016
|
2015
|
||||||||||
|
Net sales
|
$
|
429,462
|
|
$
|
433,008
|
|
$
|
564,192
|
|
||||
|
Costs and expenses:
|
|||||||||||||
|
Cost of goods sold
|
389,276
|
|
393,895
|
|
484,196
|
|
|||||||
|
Selling, general and administrative expenses
|
22,774
|
|
22,523
|
|
29,179
|
|
|||||||
|
Net loss on sale of CMC Cometals
|
6,950
|
|
—
|
|
—
|
|
—
|
|
|||||
|
Interest expense
|
—
|
|
109
|
|
1,304
|
|
|||||||
|
419,000
|
|
416,527
|
|
514,679
|
|
||||||||
|
Earnings before income taxes
|
10,462
|
|
16,481
|
|
49,513
|
|
|||||||
|
Income taxes (benefit)
|
(2,935
|
)
|
3
|
|
—
|
|
|||||||
|
Earnings from CMC Cometals
|
$
|
13,397
|
|
$
|
16,478
|
|
$
|
49,513
|
|
||||
Depreciation, amortization and capital expenditures for CMC Cometals were not material for fiscal
2017
,
2016
and
2015
, respectively. Stock-based compensation was
$(0.9) million
,
$2.5 million
and
$2.2 million
for fiscal
2017
,
2016
and
2015
, respectively. Inventory write-downs were
$1.0 million
,
$1.2 million
and
$9.2 million
for fiscal
2017
,
2016
and
2015
, respectively. There were no other significant operating or investing non-cash items for CMC Cometals for fiscal
2017
,
2016
and
2015
.
During the first quarter of fiscal 2015, the Company decided to exit and sell its steel distribution business in Australia and determined that the decision to exit this business met the definition of a discontinued operation. As a result, this business has been presented as a discontinued operation for all periods presented. The Australian steel distribution business was previously included in the International Marketing and Distribution reporting segment.
Financial information for discontinued operations was as follows:
|
Year Ended August 31,
|
||||||||||||
|
(in thousands)
|
2017
|
2016
|
2015
|
|||||||||
|
Net sales
|
$
|
429,440
|
|
$
|
474,422
|
|
$
|
737,258
|
|
|||
|
Earnings (loss) before income taxes
|
10,607
|
|
(1,469
|
)
|
29,389
|
|
||||||
Dispositions
During the fourth quarter of fiscal 2017, the Company completed the sale of CMC Cometals for proceeds of
$170.9 million
, subject to customary post-closing adjustments. A portion of the proceeds totaling
$8.0 million
were deferred and recorded in accounts receivable in the consolidated balance sheet for the year ended August 31, 2017. The Company recognized a
$7.0 million
loss on the sale, which was included in discontinued operations in the consolidated statement of earnings for the year ended August 31, 2017.
66
During the fourth quarter of fiscal 2015, the Company completed the sale of
six
locations that were a part of the Australian steel distribution business for proceeds of
$26.4 million
. The Company recognized an
$8.1 million
pre-tax gain on the sale, which included a currency translation gain of
$10.1 million
. Additionally, all operations ceased at
three
other locations that were part of the Australian steel distribution business. In the fourth quarter of fiscal 2016, the Company completed the sale of the one remaining Australian steel distribution location, excluding accounts receivable, for proceeds of
$4.4 million
, resulting in an immaterial impact to earnings from discontinued operations for fiscal year 2016. The results of the sales and the activity related to the Australian steel distribution business were included in discontinued operations in the consolidated statements of earnings for all periods presented.
Accumulated other comprehensive income (loss) ("AOCI") was comprised of the following:
|
(in thousands)
|
Foreign Currency Translation
|
Unrealized Gain (Loss) on Derivatives
|
Defined Benefit Obligation
|
Total AOCI
|
||||||||||||
|
Balance at September 1, 2014
|
$
|
(19,891
|
)
|
$
|
3,014
|
|
$
|
(2,632
|
)
|
$
|
(19,509
|
)
|
||||
|
Other comprehensive loss before reclassifications
|
(83,063
|
)
|
(3,702
|
)
|
(270
|
)
|
(87,035
|
)
|
||||||||
|
Amounts reclassified from AOCI
|
(10,127
|
)
|
2,707
|
|
63
|
|
(7,357
|
)
|
||||||||
|
Income taxes
|
—
|
|
286
|
|
80
|
|
366
|
|
||||||||
|
Net other comprehensive loss
|
(93,190
|
)
|
(709
|
)
|
(127
|
)
|
(94,026
|
)
|
||||||||
|
Balance at August 31, 2015
|
(113,081
|
)
|
2,305
|
|
(2,759
|
)
|
(113,535
|
)
|
||||||||
|
Other comprehensive income (loss) before reclassifications
|
(11,771
|
)
|
2,006
|
|
(186
|
)
|
(9,951
|
)
|
||||||||
|
Amounts reclassified from AOCI
|
12,597
|
|
(2,233
|
)
|
68
|
|
10,432
|
|
||||||||
|
Income taxes
|
—
|
|
108
|
|
32
|
|
140
|
|
||||||||
|
Net other comprehensive income (loss)
|
826
|
|
(119
|
)
|
(86
|
)
|
621
|
|
||||||||
|
Balance at August 31, 2016
|
(112,255
|
)
|
2,186
|
|
(2,845
|
)
|
(112,914
|
)
|
||||||||
|
Other comprehensive income before reclassifications
|
30,509
|
|
1,003
|
|
678
|
|
32,190
|
|
||||||||
|
Amounts reclassified from AOCI
|
968
|
|
(1,845
|
)
|
115
|
|
(762
|
)
|
||||||||
|
Income taxes
|
—
|
|
243
|
|
(270
|
)
|
(27
|
)
|
||||||||
|
Net other comprehensive income (loss)
|
31,477
|
|
(599
|
)
|
523
|
|
31,401
|
|
||||||||
|
Balance at August 31, 2017
|
$
|
(80,778
|
)
|
$
|
1,587
|
|
$
|
(2,322
|
)
|
$
|
(81,513
|
)
|
||||
67
The significant items reclassified out of accumulated other comprehensive loss and the corresponding line items in the consolidated statements of earnings to which the items were reclassified were as follows:
|
Year Ended August 31,
|
||||||||||||||
|
Components of AOCI (in thousands)
|
Location
|
2017
|
2016
|
2015
|
||||||||||
|
Foreign currency translation adjustments and other:
|
|
|
|
|
|
|
|
|||||||
|
Translation loss realized upon liquidation of investment in foreign entity
|
SG&A expenses
|
$
|
(968
|
)
|
$
|
—
|
|
$
|
—
|
|
||||
|
Translation (loss) gain realized upon sale of investment in foreign entity
|
Earnings (loss) from discontinued operations before income taxes
|
—
|
|
(12,597
|
)
|
10,127
|
|
|||||||
|
$
|
(968
|
)
|
$
|
(12,597
|
)
|
$
|
10,127
|
|
||||||
|
Unrealized gain (loss) on derivatives:
|
|
|
|
|
|
|
|
|||||||
|
Commodity
|
Cost of goods sold
|
$
|
37
|
|
$
|
(443
|
)
|
$
|
(645
|
)
|
||||
|
Foreign exchange
|
Net sales
|
369
|
|
(380
|
)
|
124
|
|
|||||||
|
Foreign exchange
|
Cost of goods sold
|
158
|
|
2,283
|
|
(2,774
|
)
|
|||||||
|
Foreign exchange
|
SG&A expenses
|
446
|
|
291
|
|
76
|
|
|||||||
|
Interest rate
|
Interest expense
|
789
|
|
532
|
|
532
|
|
|||||||
|
Commodity
|
Earnings (loss) from discontinued operations before income taxes
|
46
|
|
(50
|
)
|
(20
|
)
|
|||||||
|
|
|
1,845
|
|
2,233
|
|
(2,707
|
)
|
|||||||
|
Income tax effect
|
Income taxes from continuing operations
|
(506
|
)
|
(478
|
)
|
956
|
|
|||||||
|
Income tax effect
|
Income taxes (benefit) from discontinued operations
|
16
|
|
(18
|
)
|
(7
|
)
|
|||||||
|
(490
|
)
|
(496
|
)
|
949
|
|
|||||||||
|
Net of income taxes
|
|
$
|
1,355
|
|
$
|
1,737
|
|
$
|
(1,758
|
)
|
||||
|
Defined benefit obligation:
|
|
|
|
|
|
|
|
|||||||
|
Amortization of net loss
|
SG&A expenses
|
$
|
(201
|
)
|
$
|
(140
|
)
|
$
|
(134
|
)
|
||||
|
Amortization of prior service credit
|
SG&A expenses
|
86
|
|
72
|
|
71
|
|
|||||||
|
|
|
(115
|
)
|
(68
|
)
|
(63
|
)
|
|||||||
|
Income tax effect
|
Income taxes
|
31
|
|
22
|
|
21
|
|
|||||||
|
Net of income taxes
|
|
$
|
(84
|
)
|
$
|
(46
|
)
|
$
|
(42
|
)
|
||||
Amounts in parentheses reduce earnings.
68
During the fourth quarter of fiscal 2016, the Company entered into a fifth amended
$200.0 million
U.S. sale of trade accounts receivable program which expires on August 15, 2019. In June 2017, the Company entered into a sixth amendment, which withdrew CMC Cometals and CMC Cometals Steel from the program. Under the program, CMC contributes, and certain of its subsidiaries sell without recourse, certain eligible trade accounts receivable to CMC Receivables, Inc. ("CMCRV"), a wholly-owned subsidiary of CMC. CMCRV is structured to be a bankruptcy-remote entity formed for the sole purpose of buying and selling trade accounts receivable generated by the Company. CMCRV sells the trade accounts receivable in their entirety to
two
financial institutions. Under the amended U.S. sale of trade accounts receivable program, with the consent of both CMCRV and the program's administrative agent, the amount advanced by the financial institutions can be increased to a maximum of
$300.0 million
for all trade accounts receivable sold. The remaining portion of the purchase price of the trade accounts receivable takes the form of subordinated notes from the respective financial institutions. These notes will be satisfied from the ultimate collection of the trade accounts receivable after payment of certain fees and other costs. The Company accounts for sales of the trade accounts receivable as true sales, and the trade accounts receivable balances that are sold are removed from the consolidated balance sheets. The cash advances received are reflected as cash provided by operating activities on the Company's consolidated statements of cash flows. Additionally, the U.S. sale of trade accounts receivable program contains certain cross-default provisions whereby a termination event could occur if the Company defaulted under certain of its credit arrangements. The covenants contained in the receivables purchase agreement are consistent with the credit facility described in Note 10, Credit Arrangements.
At
August 31, 2017
and
2016
, under its U.S. sale of accounts receivable program, the Company had sold
$226.9 million
and
$215.9 million
of trade accounts receivable, respectively, to the financial institutions. At
August 31, 2017
, the Company had
$90.0 million
in advance payments outstanding on the sale of its trade accounts receivable and
none
at
August 31, 2016
.
In addition to the U.S. sale of trade accounts receivable program described above, the Company's international subsidiaries in Poland sell, and previously in Australia have sold, trade accounts receivable to financial institutions without recourse. These arrangements constitute true sales, and once the trade accounts receivable are sold, they are no longer available to the Company's creditors in the event of bankruptcy and are removed from the consolidated balance sheets. The Polish program has a facility limit of
220.0 million
Polish zloty (
$61.7 million
as of
August 31, 2017
) and allows the Company's Polish subsidiaries to obtain an advance of up to
90%
of eligible trade accounts receivable sold under the terms of the arrangement. Under the Polish and Australian programs, the cash advances received were reflected as cash provided by operating activities on the Company's consolidated statements of cash flows. During the first quarter of fiscal 2017, the Company's existing Australian program expired, and the Company did not enter into a new program.
At
August 31, 2017
, under its Polish program, the Company had sold
$79.5 million
of trade accounts receivable to the third-party financial institution and had
no
advance payments outstanding on the sale of its trade accounts receivable. At
August 31, 2016
, under its Polish and Australian programs, the Company had sold
$85.7 million
of trade accounts receivable to third-party financial institutions and had
$8.3 million
in advance payments outstanding.
For the years ended
August 31, 2017
,
2016
and
2015
, cash proceeds from the U.S. and international sale of trade accounts receivable programs were
$375.4 million
,
$400.8 million
and
$596.4 million
, respectively, and cash payments to the owners of trade accounts receivable were
$293.6 million
,
$420.3 million
and
$714.2 million
, respectively. For a nominal servicing fee, the Company is responsible for servicing the trade accounts receivable for the U.S. and Australian programs. Discounts on U.S. and international sales of trade accounts receivable were
$0.9 million
,
$1.7 million
and
$2.4 million
for the years ended
August 31, 2017
,
2016
and
2015
, respectively, and are included in selling, general and administrative expenses in the Company's consolidated statements of earnings.
69
The deferred purchase price on the Company's U.S. and international sale of trade accounts receivable programs was included in accounts receivable on the Company's consolidated balance sheets, with the exception of the deferred purchase price related to the Company's businesses classified as held for sale, which were included in assets of businesses held for sale on the Company's consolidated balance sheet at August 31, 2016. The following table summarizes the activity of the deferred purchase price receivables for the U.S. and international sale of trade accounts receivable programs.
|
(in thousands)
|
Total
|
U.S.*
|
Australia**
|
Poland
|
||||||||||||
|
Balance at September 1, 2014
|
$
|
385,169
|
|
$
|
329,797
|
|
$
|
34,071
|
|
$
|
21,301
|
|
||||
|
Transfers of trade accounts receivable
|
3,574,283
|
|
2,944,627
|
|
298,179
|
|
331,477
|
|
||||||||
|
Collections
|
(3,619,905
|
)
|
(3,004,646
|
)
|
(314,212
|
)
|
(301,047
|
)
|
||||||||
|
Balance at August 31, 2015
|
$
|
339,547
|
|
$
|
269,778
|
|
$
|
18,038
|
|
$
|
51,731
|
|
||||
|
Transfers of trade accounts receivable
|
2,389,297
|
|
1,933,477
|
|
175,593
|
|
280,227
|
|
||||||||
|
Collections
|
(2,439,096
|
)
|
(1,990,493
|
)
|
(166,969
|
)
|
(281,634
|
)
|
||||||||
|
Balance at August 31, 2016
|
$
|
289,748
|
|
$
|
212,762
|
|
$
|
26,662
|
|
$
|
50,324
|
|
||||
|
Transfers of trade accounts receivable
|
2,646,513
|
|
2,251,118
|
|
16,914
|
|
378,481
|
|
||||||||
|
Collections
|
(2,596,836
|
)
|
(2,237,872
|
)
|
(9,659
|
)
|
(349,305
|
)
|
||||||||
|
Exit from Programs
|
(124,302
|
)
|
(90,385
|
)
|
(33,917
|
)
|
—
|
|
||||||||
|
Balance at August 31, 2017
|
$
|
215,123
|
|
$
|
135,623
|
|
$
|
—
|
|
$
|
79,500
|
|
||||
_________________________
* Includes the sale of trade accounts receivable activities related to CMC Cometals. See Note 3, Changes to Business, for further discussion. For the year ended
August 31, 2017
, with respect to CMC Cometals, transfers of trade accounts receivable were
$141.0 million
, collections were
$125.6 million
and redemptions of trade accounts receivable associated with the exit from the program were
$40.4 million
. For the years ended
August 31, 2016
and
2015
, with respect to CMC Cometals, transfers of trade accounts receivable were
$173.2 million
and
$286.6 million
, respectively, and collections were
$174.4 million
and
$311.4 million
, respectively.
**Includes the sale of trade accounts receivable activities related to the Australian steel distribution business. See Note 3, Changes to Business, for further discussion. For the year ended
August 31, 2017
, there were
no
transfers of trade accounts receivable, collections were
$3.7 million
and redemptions of trade accounts receivable associated with the exit from the program were
$1.6 million
. For
August 31, 2016
and
2015
, transfers of accounts receivable were
$45.8 million
and
$180.0 million
, respectively, and collections were
$61.7 million
and
$209.2 million
, respectively.
The majority of the Company's inventories are in the form of semi-finished and finished goods. The Company’s business model, with the exception of the International Marketing and Distribution segment, is such that products are sold to external customers in various stages, from semi-finished billets through fabricated steel, leading these categories to be combined. Inventories in the International Marketing and Distribution segment are sold as finished goods. As such, work in process inventories were
not material
at
August 31, 2017
and
2016
. At
August 31, 2017
and
2016
,
$116.8 million
and
$77.9 million
, respectively, of the Company's inventories were in the form of raw materials.
Inventory write-downs were
$21.5 million
,
$15.6 million
, and
$37.7 million
for the years ended August 31, 2017, 2016, and 2015.
70
The following table details the changes in the carrying amount of goodwill by reportable segment:
|
Americas
|
International
|
||||||||||||||||||||||||
|
(in thousands)
|
Recycling
|
Mills
|
Fabrication
|
Mill
|
Marketing and Distribution
|
Consolidated
|
|||||||||||||||||||
|
Goodwill, gross
|
|||||||||||||||||||||||||
|
Balance at September 1, 2015
|
$
|
9,751
|
|
$
|
4,970
|
|
$
|
57,637
|
|
$
|
2,517
|
|
$
|
1,912
|
|
$
|
76,787
|
|
|||||||
|
Foreign currency translation
|
—
|
|
—
|
|
—
|
|
(85
|
)
|
70
|
|
(15
|
)
|
|||||||||||||
|
Balance at August 31, 2016
|
9,751
|
|
4,970
|
|
57,637
|
|
2,432
|
|
1,982
|
|
76,772
|
|
|||||||||||||
|
Acquisitions
|
—
|
|
—
|
|
306
|
|
—
|
|
—
|
|
306
|
|
|||||||||||||
|
Foreign currency translation
|
—
|
|
—
|
|
—
|
|
232
|
|
—
|
|
232
|
|
|||||||||||||
|
Balance at August 31, 2017
|
$
|
9,751
|
|
$
|
4,970
|
|
$
|
57,943
|
|
$
|
2,664
|
|
$
|
1,982
|
|
$
|
77,310
|
|
|||||||
|
Accumulated impairment losses
|
|||||||||||||||||||||||||
|
Balance at September 1, 2015
|
$
|
(9,751
|
)
|
$
|
—
|
|
$
|
(493
|
)
|
$
|
(160
|
)
|
$
|
—
|
|
$
|
(10,404
|
)
|
|||||||
|
Foreign currency translation
|
—
|
|
—
|
|
—
|
|
5
|
|
—
|
|
5
|
|
|||||||||||||
|
Balance at August 31, 2016
|
(9,751
|
)
|
—
|
|
(493
|
)
|
(155
|
)
|
—
|
|
(10,399
|
)
|
|||||||||||||
|
Foreign currency translation
|
—
|
|
—
|
|
—
|
|
(14
|
)
|
—
|
|
(14
|
)
|
|||||||||||||
|
Impairment
|
—
|
|
—
|
|
—
|
|
—
|
|
(1,982
|
)
|
(1,982
|
)
|
|||||||||||||
|
Balance at August 31, 2017
|
$
|
(9,751
|
)
|
$
|
—
|
|
$
|
(493
|
)
|
$
|
(169
|
)
|
$
|
(1,982
|
)
|
$
|
(12,395
|
)
|
|||||||
|
Goodwill, net
|
|||||||||||||||||||||||||
|
Balance at September 1, 2015
|
$
|
—
|
|
$
|
4,970
|
|
$
|
57,144
|
|
$
|
2,357
|
|
$
|
1,912
|
|
$
|
66,383
|
|
|||||||
|
Foreign currency translation
|
—
|
|
—
|
|
—
|
|
(80
|
)
|
70
|
|
(10
|
)
|
|||||||||||||
|
Balance at August 31, 2016
|
—
|
|
4,970
|
|
57,144
|
|
2,277
|
|
1,982
|
|
66,373
|
|
|||||||||||||
|
Acquisitions
|
—
|
|
—
|
|
306
|
|
—
|
|
—
|
|
306
|
|
|||||||||||||
|
Foreign currency translation
|
—
|
|
—
|
|
—
|
|
218
|
|
—
|
|
218
|
|
|||||||||||||
|
Impairment
|
—
|
|
—
|
|
—
|
|
—
|
|
(1,982
|
)
|
(1,982
|
)
|
|||||||||||||
|
Balance at August 31, 2017
|
$
|
—
|
|
$
|
4,970
|
|
$
|
57,450
|
|
$
|
2,495
|
|
$
|
—
|
|
$
|
64,915
|
|
|||||||
In the fourth quarter of
2017
, the Company recorded a
$2.0 million
goodwill impairment charge related to a reporting unit in its International Marketing and Distribution segment due to management's decision to wind-down the associated operations. For fiscal
2016
, the annual goodwill impairment analysis did not result in any impairment charges at any of the Company's reporting units. For fiscal
2015
, the Company recorded a
$7.3 million
goodwill impairment charge related to its Americas Recycling segment due to weakened demand for ferrous scrap exports coupled with a lower near term forecast of future operating results.
The Company estimates the fair value of its reporting units using a weighting of fair values derived from the income and market approaches. Under the income approach, the Company determines the fair value of a reporting unit based on the present value of estimated future cash flows. Cash flow projections are based on management's estimates of revenue growth rates and operating margins, taking into account industry and market conditions. The discount rate is based on a weighted average cost of capital adjusted for the relevant risk associated with the characteristics of the Company. The market approach, on the other hand, estimates fair value based on market multiples of revenue and earnings derived from comparable publicly-traded companies with similar operating and investment characteristics as the reporting unit.
As of
August 31, 2017
and
2016
, one of the Company's reporting units within the Americas Fabrication reporting unit comprised
$51.6 million
and
$51.3 million
, respectively, of the Company's total goodwill. As a result of our annual testing, the fair value of this reporting unit exceeded the carrying value by
13.5%
. The assumptions that have the most significant impact on determination of the fabrication reporting unit fair value are the estimates of gross margin expansion, value of the terminal year, and the weighted average cost of capital (discount rate). A change in any of these assumptions, individually or in the aggregate, or future financial performance that is below management expectations may result in the carrying value of this reporting unit exceeding its fair value,
71
and goodwill could be impaired. For all other reporting units, the excess of the fair value over carrying value of each reporting unit was substantial. The future occurrence of a potential indicator of impairment could include matters such as: a decrease in expected net earnings, adverse equity market conditions, a decline in current market multiples, a decline in CMC's common stock price, a significant adverse change in legal factors or the general business climate, an adverse action or assessment by a regulator, a significant downturn in non-residential construction markets in the United States, and continued levels of imported steel into the United States. In the event of significant adverse changes of the nature described above, it may be necessary for the Company to recognize a non-cash impairment of goodwill, which could have a material adverse effect on the Company's consolidated business, results of operations and financial condition.
The following intangible assets subject to amortization are included in other noncurrent assets on the Company's consolidated balance sheets:
|
|
August 31, 2017
|
August 31, 2016
|
||||||||||||||||||||||
|
(in thousands)
|
Gross
Carrying Amount |
Accumulated Amortization
|
Net
|
Gross
Carrying Amount |
Accumulated Amortization
|
Net
|
||||||||||||||||||
|
Customer base
|
$
|
6,334
|
|
$
|
2,660
|
|
$
|
3,674
|
|
$
|
6,160
|
|
$
|
2,714
|
|
$
|
3,446
|
|
||||||
|
Favorable land leases
|
10,189
|
|
2,849
|
|
7,340
|
|
10,081
|
|
2,518
|
|
7,563
|
|
||||||||||||
|
Non-competition agreements
|
1,750
|
|
578
|
|
1,172
|
|
1,600
|
|
371
|
|
1,229
|
|
||||||||||||
|
Brand name
|
1,328
|
|
770
|
|
558
|
|
628
|
|
328
|
|
300
|
|
||||||||||||
|
Other
|
101
|
|
65
|
|
36
|
|
101
|
|
58
|
|
43
|
|
||||||||||||
|
Total
|
$
|
19,702
|
|
$
|
6,922
|
|
$
|
12,780
|
|
$
|
18,570
|
|
$
|
5,989
|
|
$
|
12,581
|
|
||||||
Excluding goodwill, there are no other significant intangible assets with indefinite lives. Amortization expense for intangible assets for the years ended
August 31, 2017
,
2016
and
2015
was
$2.3 million
,
$3.6 million
, and
$6.9 million
, respectively. At
August 31, 2017
, the weighted average remaining useful life of these intangible assets, excluding the favorable land leases was
seven years
. The weighted average life of the favorable land leases was
48 years
. Estimated amounts of amortization expense for the next five years are as follows.
|
|
|
|||
|
Year Ended August 31,
|
(in thousands)
|
|||
|
2018
|
$
|
1,578
|
|
|
|
2019
|
1,342
|
|
||
|
2020
|
1,105
|
|
||
|
2021
|
1,082
|
|
||
|
2022
|
804
|
|
||
See Note 3, Changes in Business, for discussion on the Company's plan to exit its International Marketing and Distribution segment. Expenses associated with exiting this business included severance pay in fiscal 2017. See Note 9, Severance for additional information. Also refer to Note 7, Goodwill and Other Intangible Assets, and Note 13, Fair Value, for a discussion of other impairments. There were no material long-lived asset impairment charges recorded during the year ended August 31, 2017.
During fiscal
2016
and
2017
, the Company exited its steel trading and distribution businesses headquartered in Cardiff, Wales, United Kingdom. These operations were included in the Company's International Marketing and Distribution reporting segment. The expenses associated with exiting these businesses were not material in each respective fiscal year and were included in selling, general and administrative expenses in the Company's consolidated statements of earnings.
During the first quarter of fiscal 2015, the Company decided to exit and sell its steel distribution business in Australia, which met the definition of a discontinued operation. As a result, this business is presented as a discontinued operation for all periods presented. During the third quarter of fiscal 2016, the Company recorded an impairment charge of
$15.8 million
, including the impact of an approximate
$13.5 million
accumulated foreign currency translation loss, on its remaining component of the Australian steel distribution business that was classified as held for sale
at May 31, 2016. See Note 13, Fair Value, for further discussion of this impairment charge. Other expenses associated with exiting this business were not material for the years ended
August 31, 2017
,
2016
, and
2015
.
72
Based on continued margin and volume pressure in the Company's Americas Recycling segment, which caused the Company to revise its estimate as to the timing of improvement in these metrics, during the fourth quarter of fiscal 2016, management concluded a triggering event occurred. As a result, the Company reviewed the undiscounted future cash flows for its Americas Recycling long-lived asset groups. The results of the undiscounted future cash flow analyses indicated the carrying amounts for certain long-lived asset groups subject to testing were not expected to be recovered. The Company estimated the fair value for these long-lived asset groups using market and income approaches. The fair value was then compared to the carrying values of the long-lived asset groups. The resulting impairment charges of
$38.9 million
were recorded within the Americas Recycling segment at August 31, 2016.
The Company recorded consolidated severance cost of
$25.0 million
,
$3.2 million
and
$5.8 million
for the years ended
August 31, 2017
,
2016
and
2015
, respectively. The severance cost recorded during fiscal
2017
related primarily to the Company's discontinued operations, as the closure of marketing and distribution offices resulted in involuntary employee termination benefits. As of
August 31, 2017
and 2016, the remaining liability to be paid in the future related to termination benefits was
$16.9 million
and
$0.9 million
, respectively, and is included in accrued expenses and other payables on the Company's consolidated balance sheets.
Long-term debt, which as of
August 31, 2016
included the deferred gain from the termination of the interest rate swaps, was as follows:
|
Weighted Average
Interest Rate as of August 31, 2017 |
August 31,
|
|||||||||
|
(in thousands)
|
2017
|
2016
|
||||||||
|
2027 Notes
|
5.375%
|
$
|
300,000
|
|
$
|
—
|
|
|||
|
2023 Notes
|
4.875%
|
330,000
|
|
330,000
|
|
|||||
|
Term Loan (Due 2022)
|
2.804%
|
150,000
|
|
—
|
|
|||||
|
2018 Notes
|
6.400%
|
—
|
|
408,874
|
|
|||||
|
2017 Notes
|
5.740%
|
—
|
|
302,601
|
|
|||||
|
Other, including equipment notes
|
52,077
|
|
34,166
|
|
||||||
|
Total long-term debt
|
832,077
|
|
1,075,641
|
|
||||||
|
Less: Debt issuance costs
|
7,315
|
|
4,224
|
|
||||||
|
Total long-term debt outstanding
|
824,762
|
|
1,071,417
|
|
||||||
|
Less: Current maturities of long-term debt
|
19,182
|
|
313,469
|
|
||||||
|
Long-term debt
|
$
|
805,580
|
|
$
|
757,948
|
|
||||
In July 2017, the Company issued
$300.0 million
of
5.375%
Senior Notes due July 15, 2027 (the "2027 Notes"). Interest on these notes is payable semiannually.
In May 2013, the Company issued
$330.0 million
of
4.875%
Senior Notes due May 2023 (the "2023 Notes"). Interest on these notes is payable semiannually.
On
June 26, 2014
, the Company entered into a fourth amended and restated credit agreement (the "Credit Agreement") with a revolving credit facility of
$350.0 million
and a maturity date of
June 26, 2019
. On June 23, 2017, the Company entered into a second amendment to the Credit Agreement. Among other things, the second amendment extends the maturity of the Credit Agreement to June 23, 2022 and provides for a senior secured term loan in the maximum principal amount of
$150.0 million
(the "Term Loan"). The Term Loan will mature in June 2022 and was drawn upon on July 13, 2017. The Company is required to make quarterly payments on the Term Loan equal to
1.25%
of the original principal amount. The maximum availability under the Credit Agreement, including the Term Loan, can be increased to
$750.0 million
with bank approval. The Company had no amounts drawn under the revolving portion of its Credit Agreement at
August 31, 2017
or
2016
. The Company's obligation under the Credit Agreement is collateralized by its U.S. inventory and U.S. fabrication receivables. The Credit Agreement's capacity includes
$50.0 million
for the issuance of stand-by letters of credit and was reduced by outstanding stand-by letters of credit which totaled
$3.0 million
at both
August 31, 2017
and
2016
.
73
Under the Credit Agreement, the Company is required to comply with certain financial and non-financial covenants, including covenants to maintain: (i) an interest coverage ratio (consolidated EBITDA to consolidated interest expense, as each is defined in the Credit Agreement) of not less than
2.50
to
1.00
and (ii) a debt to capitalization ratio (consolidated funded debt to total capitalization, as each is defined in the Credit Agreement) that does not exceed
0.60
to
1.00
. Loans under the Credit Agreement bear interest based on the Eurocurrency rate, a base rate, or the LIBOR rate. At
August 31, 2017
, the Company's interest coverage ratio was
5.29
to
1.00
and the Company's debt to capitalization ratio was
0.37
to
1.00
.
In
August 2008
, the Company issued
$500.0 million
of
7.35%
senior unsecured notes due
August 2018
(the "2018 Notes"). During the third quarter of fiscal 2010, the Company entered into hedging transactions which reduced the Company's effective interest rate on these notes to
6.40%
per annum. Interest on these notes is payable semiannually. In February 2016, the Company accepted for purchase approximately
$100.2 million
of the outstanding principal amount of its 2018 Notes through a cash tender offer. The Company recognized expenses of approximately
$6.1 million
related to the early extinguishment of this debt, which are included in loss on debt extinguishment in the consolidated statement of earnings for the year ended
August 31, 2016
.
In
July 2007
, the Company issued
$400.0 million
of
6.50%
senior unsecured notes due
July 2017
(the "2017 Notes"). During the third quarter of fiscal 2011, the Company entered into hedging transactions which reduced the Company's effective interest rate on these notes to
5.74%
per annum. Interest on these notes is payable semiannually. In February 2016, the Company accepted for purchase
$100.0 million
of the outstanding principal amount of its 2017 Notes though a cash tender offer. The Company recognized expenses of approximately
$5.4 million
related to the early extinguishment of this debt, which are included in loss on debt extinguishment in the consolidated statement of earnings for the year ended
August 31, 2016
.
During the
fourth
quarter of fiscal
2017
, the Company redeemed the full outstanding principal amount of its 2017 and 2018 Notes. The Company recognized expenses of
$22.7 million
related to the early extinguishment of the 2018 Notes, which are included in loss on debt extinguishment in the consolidated statements of earnings for the year ended
August 31, 2017
.
During fiscal 2012, the Company terminated its existing interest rate swap transactions and received cash proceeds of approximately
$52.7 million
, net of customary finance charges. The resulting gain was deferred and was being amortized as a reduction to interest expense over the remaining term of the respective debt tranches. At
August 31, 2016
,
$11.6 million
of the deferred gain remained unamortized, and at
August 31, 2017
,
no
gain remained unamortized. Amortization of the deferred gain was
$11.6 million
for the year ended
August 31, 2017
and
$7.6 million
for each of the years ended
August 31, 2016
and
2015
.
The Company has uncommitted credit facilities available from U.S. and international banks. In general, these credit facilities are used to support trade letters of credit (including accounts payable settled under bankers' acceptances as described in Note 2, Summary of Significant Accounting Policies), foreign exchange transactions and short-term advances which are priced at market rates.
At
August 31, 2017
and
2016
, CMC Poland Sp. z.o.o. ("CMCP") had uncommitted credit facilities with several banks of PLN
175.0 million
(
$49.1 million
) and PLN
175.0 million
(
$44.8 million
), respectively. As of
August 31, 2017
, the uncommitted credit facilities have expiration dates ranging from
November 2017
to March 2018, which CMCP intends to renew upon expiration. At
August 31, 2017
and
2016
,
no
amounts were outstanding under these facilities. During fiscal
2017
and fiscal
2016
, CMCP had
no
borrowings or repayments under its uncommitted credit facilities. During fiscal
2015
, CMCP had total borrowing and total repayments of
$49.6 million
each under its uncommitted credit facilities.
At
August 31, 2017
, the Company was in compliance with all of the covenants contained in our credit arrangements.
74
The scheduled maturities of the Company's long-term debt are as follows:
|
Year Ending August 31,
|
(in thousands)
|
|
||
|
2018
|
$
|
19,182
|
|
|
|
2019
|
18,276
|
|
||
|
2020
|
13,560
|
|
||
|
2021
|
10,648
|
|
||
|
2022
|
122,346
|
|
||
|
Thereafter
|
648,065
|
|
||
|
Total long-term debt
|
832,077
|
|
||
|
Less: Debt issuance costs
|
7,315
|
|
||
|
Total long-term debt outstanding
|
$
|
824,762
|
|
|
The Company capitalized
$9.8 million
and
$3.6 million
of interest in the cost of property, plant and equipment during fiscal years
2017
and 2016, and an immaterial amount during fiscal year
2015
. Cash paid for interest for the years ended
August 31, 2017
,
2016
and
2015
was
$65.7 million
,
$74.7 million
and
$86.7 million
, respectively.
The Company, through its wholly-owned subsidiary, CMC Steel Oklahoma, LLC ("CMC Steel OK"), is in the process of constructing a micro mill with an expected commissioning date in the second quarter of fiscal 2018 and a separate project to install a spooler with an expected commissioning date in the spring of 2018. Additionally, the Company, through its wholly-owned subsidiary, CMC Post Oklahoma, LLC ("CMC Post OK"), is in the process of constructing a T-post shop with an expected commissioning date in the summer of 2018. These projects are located in Durant, Oklahoma. In connection with these projects, the Company entered into transactions that qualified through the New Markets Tax Credit program provided for in the Community Renewal Tax Relief Act of 2000 (the "NMTC Program"), as the micro mill, spooler and T-post shop will be located in a zone designated by the IRS as eligible for the NMTC Program and are considered eligible business activities for the NMTC Program. Under the NMTC Program, an investor that makes a capital investment, which, in turn, together with leverage loan sources, is used to make a Qualifying Equity Investment (a "QEI") in an entity that (a) qualifies as a Community Development Entity ("CDE"), (b) has applied for and been granted an allocation of a portion of the total federal funds available to fund the credits (an "NMTC Allocation") and (c) uses a minimum specified portion of the QEI to make a Qualified Low Income Community Investment up to the maximum amount of the CDE’s NMTC Allocation will be entitled to claim, over a period of seven years, federal nonrefundable tax credits in an amount equal to 39% of the QEI amount (an "NMTC"). NMTCs are subject to 100% recapture for a period of seven years as provided in the Internal Revenue Code.
Micro Mill NMTC Transaction
In the second quarter of fiscal 2016, certain of the Company's subsidiaries entered into an NMTC transaction with U.S. Bancorp Community Development Corporation, a Minnesota corporation ("USBCDC"), related to the construction, development and equipping of a new micro mill in Durant, Oklahoma (the "Micro Mill Project"). To effect the transaction, USBCDC made a
$17.7 million
capital contribution ("the USBCDC Equity") to USBCDC Investment Fund 156, LLC, a Missouri limited liability company (the "Investment Fund"). Additionally, Commonwealth Acquisition Holdings, Inc., a wholly-owned subsidiary of the Company ("Commonwealth"), made a
$35.3 million
loan to the Investment Fund at an interest rate of approximately
1.08%
per year with a maturity date of December 24, 2045 (the "Commonwealth Mill Loan"). The Investment Fund used
$51.5 million
of the proceeds received from the Commonwealth Mill Loan and the USBCDC Equity to make QEIs into CDEs, which, in turn, used
$50.7 million
of the QEIs to make loans to CMC Steel OK with terms similar to the Commonwealth Mill Loan and as partial financing for the Micro Mill Project. The proceeds of the loans from the CDEs were recorded as restricted cash and included in other current assets in the accompanying consolidated balance sheets. In connection with this NMTC transaction, CMC Steel OK spent
$21.0 million
for qualified construction, development and equipping activities and for fees and costs incurred for the Micro Mill Project, including construction period interest for loan servicing, audit and tax expenses and management fees paid to the CDEs during the fiscal year ended August 31, 2017. The balance remaining in restricted cash was
$0.7 million
at August 31, 2017.
Post Shop NMTC Transaction
In the third quarter of fiscal 2017, certain of the Company's subsidiaries entered into a second NMTC transaction with USBCDC, related to the construction, development and equipping of a new T-post shop in Durant, Oklahoma (the "Post Shop Project"). To
75
effect the transaction, USBCDC made capital contributions to Twain Investment Fund 219, LLC (the "Fund 219"), and Twain Investment Fund 222 (the "Fund 222"), both Missouri limited liability companies, in the amounts of
$2.8 million
(the "USBCDC Fund 219 Equity") and
$2.2 million
(the "USBCDC Fund 222 Equity"), respectively. Additionally, Commonwealth made a
$10.4 million
loan to Fund 219 at an interest rate of approximately
1.16%
per year with a maturity date of March 23, 2047 (the "Commonwealth Post Shop Loan"). Fund 219 used
$12.8 million
of the proceeds received from the Commonwealth Post Shop Loan and the USBCDC Fund 219 Equity to make a QEI into a CDE, which, in turn, used
$12.6 million
of the QEI to make a loan to CMC Post OK with terms similar to the Commonwealth Post Shop Loan and as partial financing for the Post Shop Project. Additionally, Fund 222 used
$2.2 million
of the proceeds received from the USBCDC Fund 222 Equity to make a QEI into a CDE, which, in turn, used
$2.1 million
of the QEI to make a loan to CMC Post OK. The proceeds of the loans from the CDEs were recorded as restricted cash and included in other current assets in the accompanying consolidated balance sheet. In connection with this NMTC transaction, CMC Post OK spent
$0.8 million
for qualified construction, development and equipping activities and for fees and costs incurred for the Post Shop Project, including construction period interest for loan servicing, audit and tax expenses and management fees paid to the CDEs during the year ended August 31, 2017. The balance remaining in restricted cash was
$13.3
million at August 31, 2017.
Spooler NMTC Transaction
In the fourth quarter of fiscal 2017, certain of the Company's subsidiaries entered into a third NMTC transaction with USBCDC, related to the procurement and installation of equipment that will produce spooled rebar in the new micro mill in Durant, Oklahoma (the "Spooler Project"). To effect the transaction, USBCDC made capital contributions to Twain Investment Fund 249, LLC (the "Fund 249"), a Missouri limited liability company, in the amount of
$6.7 million
(the "USBCDC Fund 249 Equity"). Additionally, Commonwealth made a
$14.0 million
loan to Fund 249 at an interest rate of approximately
1.39%
per year with a maturity date of July 26, 2042 (the "Commonwealth Spooler Loan"). Fund 249 used
$20.0 million
of the proceeds received from the Commonwealth Spooler Loan and the USBCDC Fund 249 Equity to make a QEI into a CDE, which, in turn, used
$19.4 million
of the QEI to make loans to CMC Steel OK with terms similar to the Commonwealth Spooler Loan and as partial financing for the Spooler Project. The proceeds of the loans from the CDE, less certain transaction costs, were recorded as restricted cash and included in other current assets in the accompanying consolidated balance sheet. In connection with this NMTC transaction, CMC Steel OK had no spending for qualified procurement activities for the Spooler Project during the year ended August 31, 2017. The balance remaining in restricted cash was
$18.8 million
at August 31, 2017.
Variable Interest Entities
By virtue of its capital contributions to the Investment Fund, Fund 219, and Fund 249, (collectively the "Funds") USBCDC is entitled to substantially all of the benefits derived from the NMTCs. These transactions include a put/call provision whereby the Company may be obligated or entitled to repurchase USBCDC’s interest in the Funds at the end of a
seven
-year period, in the case of the Investment Fund and Fund 249 or an
eight
-year period, in the case of Fund 219 (each of such periods an "Exercise Period"). The Company believes USBCDC will exercise the put options following the end of the respective Exercise Periods. The value attributed to the put/call is de minimis. The Company is required to be in compliance with various regulations and contractual provisions that apply to the NMTC transactions. Non-compliance with applicable requirements could result in unrealized projected tax benefits and, therefore, could require the Company to indemnify USBCDC for any loss or recapture of NMTCs related to the financing until such time as the Company's obligation to deliver tax benefits is relieved. The Company does not anticipate any credit recaptures will be required in connection with these transactions.
The Company has determined that the Funds are VIEs, of which the Company is the primary beneficiary and has consolidated them in accordance with Accounting Standards Codification Topic 810, Consolidation. USBCDC’s contributions are included in other long-term liabilities in the accompanying consolidated balance sheets. Direct costs incurred in structuring the transactions were deferred and are recognized as expense over each Exercise Period. Incremental costs to maintain the structures during the compliance periods are recognized as incurred.
The Company has determined that Fund 222 is a VIE, of which the Company is not the primary beneficiary and has therefore not consolidated Fund 222 and treated the QEI of
$2.1 million
from Fund 222 as debt. The determination that the Company is not the primary beneficiary was partially based on the fact that no put/call provision exists whereby the Company is able to repurchase USBCDC's interest in the Fund following the end of the Exercise Period. The debt is included in long-term debt in the accompanying consolidated balance sheet as of August 31, 2017, and represents the Company's maximum exposure to loss as a result of its involvement with the VIE.
76
The Company's global operations and product lines expose it to risks from fluctuations in metal commodity prices, foreign currency exchange rates, natural gas prices and interest rates. One objective of the Company's risk management program is to mitigate these risks using derivative instruments. The Company enters into (i) metal commodity futures and forward contracts to mitigate the risk of unanticipated changes in gross margin due to the volatility of the commodities' prices and (ii) foreign currency forward contracts that match the expected settlements for purchases and sales denominated in foreign currencies.
The Company considers the total notional value of its futures and forward contracts as the best measure of the volume of derivative transactions. At
August 31, 2017
, the notional values of the Company's foreign currency contract commitments and its commodity contract commitments were
$300.4 million
and
$59.3 million
, respectively. At
August 31, 2016
, the notional values of the Company's foreign currency contract commitments and its commodity contract commitments were
$258.3 million
and
$19.8 million
, respectively.
The Company designates only those contracts which closely match the terms of the underlying transaction as hedges for accounting purposes. These hedges resulted in substantially no ineffectiveness in the Company's consolidated statements of earnings, and there were no components excluded from the assessment of hedge effectiveness for the years ended
August 31, 2017
and
2016
. Certain foreign currency and commodity contracts were not designated as hedges for accounting purposes, although management believes they are essential economic hedges.
The following tables summarize activities related to the Company's derivative instruments and hedged items recognized in the consolidated statements of earnings:
|
Year Ended August 31,
|
||||||||||||||
|
Derivatives Not Designated as Hedging Instruments (in thousands)
|
Location
|
2017
|
2016
|
2015
|
||||||||||
|
Commodity
|
Cost of goods sold
|
$
|
(9,095
|
)
|
$
|
2,675
|
|
$
|
7,746
|
|
||||
|
Foreign exchange
|
Net sales
|
—
|
|
—
|
|
3,005
|
|
|||||||
|
Foreign exchange
|
Cost of goods sold
|
(47
|
)
|
19
|
|
4,996
|
|
|||||||
|
Foreign exchange
|
SG&A expenses
|
(5,400
|
)
|
11,732
|
|
23,105
|
|
|||||||
|
Gain (loss) from continuing operations before income taxes
|
$
|
(14,542
|
)
|
$
|
14,426
|
|
$
|
38,852
|
|
|||||
The Company's fair value hedges are designated for accounting purposes with the gains or losses on the hedged items offsetting the gains or losses on the related derivative transactions. Hedged items relate to firm commitments on commercial sales and purchases and capital expenditures.
|
Amount of gain (loss) recognized in income on derivatives for the year ended August 31,
|
Amount of gain (loss) recognized in income on related hedge items for the year ended August 31,
|
||||||||||||||||||||||||
|
Location of gain (loss) recognized in income on derivatives
|
2017
|
2016
|
2015
|
Location of gain (loss) recognized in income on related hedged items
|
2017
|
2016
|
2015
|
||||||||||||||||||
|
Foreign exchange
|
Net sales
|
$
|
25
|
|
$
|
(38
|
)
|
$
|
(236
|
)
|
Net sales
|
$
|
(25
|
)
|
$
|
38
|
|
$
|
236
|
|
|||||
|
Foreign exchange
|
Cost of goods sold
|
(1,436
|
)
|
(1,075
|
)
|
888
|
|
Cost of goods sold
|
1,436
|
|
1,075
|
|
(888
|
)
|
|||||||||||
|
Gain (loss) from continuing operations before income taxes
|
$
|
(1,411
|
)
|
$
|
(1,113
|
)
|
$
|
652
|
|
$
|
1,411
|
|
$
|
1,113
|
|
$
|
(652
|
)
|
|||||||
|
Effective Portion of Derivatives Designated as Cash Flow Hedging Instruments Recognized in Accumulated Other Comprehensive Income (Loss) (in thousands)
|
August 31,
|
|||||||||||
|
2017
|
2016
|
2015
|
||||||||||
|
Commodity
|
$
|
210
|
|
$
|
(204
|
)
|
$
|
(635
|
)
|
|||
|
Foreign exchange
|
546
|
|
1,822
|
|
(1,832
|
)
|
||||||
|
Gain (loss), net of income taxes
|
$
|
756
|
|
$
|
1,618
|
|
$
|
(2,467
|
)
|
|||
Refer to Note 4, Accumulated Other Comprehensive Income (Loss), for the effective portion of derivatives designated as cash flow hedging instruments reclassified from AOCI.
77
The Company enters into derivative agreements that include provisions to allow the set-off of certain amounts. Derivative instruments are presented on a gross basis on the Company's consolidated balance sheets. The asset and liability balances in the tables below reflect the gross amounts of derivative instruments at
August 31, 2017
and
2016
. The fair value of the Company's derivative instruments on the consolidated balance sheets was as follows:
|
Derivative Assets (in thousands)
|
August 31,
|
|||||||
|
2017
|
2016
|
|||||||
|
Commodity — not designated for hedge accounting
|
$
|
767
|
|
$
|
584
|
|
||
|
Foreign exchange — designated for hedge accounting
|
81
|
|
1,398
|
|
||||
|
Foreign exchange — not designated for hedge accounting
|
1,286
|
|
750
|
|
||||
|
Derivative assets (other current assets)*
|
$
|
2,134
|
|
$
|
2,732
|
|
||
|
Commodity — designated for hedge accounting
|
$
|
—
|
|
$
|
4
|
|
||
|
Derivative assets (assets held for sale - current)*
|
$
|
—
|
|
$
|
4
|
|
||
|
Derivative Liabilities (in thousands)
|
August 31,
|
|||||||
|
2017
|
2016
|
|||||||
|
Commodity — not designated for hedge accounting
|
3,251
|
|
117
|
|
||||
|
Foreign exchange — designated for hedge accounting
|
1,549
|
|
902
|
|
||||
|
Foreign exchange — not designated for hedge accounting
|
3,710
|
|
1,161
|
|
||||
|
Derivative liabilities (accrued expenses and other payables)*
|
$
|
8,510
|
|
$
|
2,180
|
|
||
|
Commodity — designated for hedge accounting
|
$
|
—
|
|
$
|
5
|
|
||
|
Derivative liabilities (liabilities held for sale - current)*
|
$
|
—
|
|
$
|
5
|
|
||
* Derivative assets and liabilities do not include the hedged items designated as fair value hedges.
As of
August 31, 2017
and
2016
, all of the Company's derivative instruments designated to hedge exposure to the variability in future cash flows of the forecasted transactions will mature within twelve months.
All of the instruments are highly liquid and were not entered into for trading purposes.
The Company has established a fair value hierarchy which prioritizes the inputs to the valuation techniques used to measure fair value into
three
levels. These levels are determined based on the lowest level input that is significant to the fair value measurement. Levels within the hierarchy are defined as follows:
Level 1 - Unadjusted quoted prices in active markets for identical assets and liabilities;
Level 2 - Quoted prices for similar assets and liabilities in active markets (other than those included in Level 1) which are observable, either directly or indirectly; and
Level 3 - Valuations derived from valuation techniques in which one or more significant inputs or significant value drivers are unobservable.
78
The following tables summarize information regarding the Company's financial assets and financial liabilities that were measured at fair value on a recurring basis:
|
|
|
Fair Value Measurements at Reporting Date Using
|
||||||||||||||
|
(in thousands)
|
August 31, 2017
|
Quoted Prices in
Active Markets for Identical Assets (Level 1) |
Significant Other
Observable Inputs (Level 2) |
Significant
Unobservable Inputs (Level 3) |
||||||||||||
|
Assets:
|
||||||||||||||||
|
Investment deposit accounts
(1)
|
$
|
43,553
|
|
$
|
43,553
|
|
$
|
—
|
|
$
|
—
|
|
||||
|
Commodity derivative assets
(2)
|
767
|
|
767
|
|
—
|
|
—
|
|
||||||||
|
Foreign exchange derivative assets
(2)
|
1,367
|
|
—
|
|
1,367
|
|
—
|
|
||||||||
|
Liabilities:
|
||||||||||||||||
|
Commodity derivative liabilities
(2)
|
3,251
|
|
3,251
|
|
—
|
|
—
|
|
||||||||
|
Foreign exchange derivative liabilities
(2)
|
5,259
|
|
—
|
|
5,259
|
|
—
|
|
||||||||
|
|
|
Fair Value Measurements at Reporting Date Using
|
||||||||||||||
|
(in thousands)
|
August 31, 2016
|
Quoted Prices in
Active Markets for Identical Assets (Level 1) |
Significant Other
Observable Inputs (Level 2) |
Significant
Unobservable Inputs (Level 3) |
||||||||||||
|
Assets:
|
||||||||||||||||
|
Investment deposit accounts
(1)
|
$
|
278,759
|
|
$
|
278,759
|
|
$
|
—
|
|
$
|
—
|
|
||||
|
Commodity derivative assets
(2)
|
588
|
|
584
|
|
4
|
|
—
|
|
||||||||
|
Foreign exchange derivative assets
(2)
|
2,148
|
|
—
|
|
2,148
|
|
—
|
|
||||||||
|
Liabilities:
|
||||||||||||||||
|
Commodity derivative liabilities
(2)
|
122
|
|
117
|
|
5
|
|
—
|
|
||||||||
|
Foreign exchange derivative liabilities
(2)
|
2,063
|
|
—
|
|
2,063
|
|
—
|
|
||||||||
_________________
(1) Investment deposit accounts are short-term in nature, and the value is determined by principal plus interest. The investment portfolio mix can change each period based on the Company's assessment of investment options.
(2) Derivative assets and liabilities classified as Level 1 are commodity futures contracts valued based on quoted market prices in the London Metal Exchange or the New York Mercantile Exchange. Amount in Level 2 are based on broker quotes in the over-the-counter market. Further discussion regarding the Company's use of derivative instruments and the classification of the assets and liabilities is included in Note 13, Derivatives and Risk Management.
In the fourth quarter of fiscal 2017, as a result of the Company's plan to pursue a restructuring and sale of the steel trading business in Australia, the Company prepared an impairment analysis on the asset disposal groups in Australia. As a result, during the fourth quarter of fiscal 2017, the Company recorded an impairment charge of
$4.2 million
related to accumulated foreign currency translation loss. Indicators of value from other recent sales of similar businesses within the segment (Level 3) were the basis for the determination of fair value of this component. This loss was recorded within earnings from continuing operations during the year ended August 31, 2017 and is included in the asset impairments line as a non-cash add back to net earnings on the Company's consolidated statement of cash flows. See Note 3, Changes in Business, for additional discussion of the Company's plans for its International Marketing and Distribution segment.
On June 10, 2016, the Company, through its wholly-owned Australian subsidiary, G.A.M. Steel Pty. Ltd., signed a definitive asset sale agreement to sell its remaining steel distribution assets located in Australia. During the third quarter of fiscal 2016, the Company recorded an impairment charge of
$15.8 million
, including the impact of an approximate
$13.5 million
accumulated foreign currency translation loss, on this remaining component of the Australian steel distribution business that was classified as held for sale
at May 31, 2016. The signed definitive asset sale agreement (Level 3) was the basis for the determination of fair value of this component. This impairment charge was recorded in loss from discontinued operations during the year ended August 31, 2016.
In the fourth quarter of fiscal 2016, the Company prepared an impairment analysis on long-lived asset groups within the Americas Recycling segment and determined the carrying value of certain fixed assets exceeded their fair value as determined using market
79
and income approaches. Determining the fair value is judgmental in nature and requires the use of significant estimates and assumptions, considered to be level 3 inputs, including projected cash flows over the estimated projection period and the discount rate. The resulting
$38.9 million
non-cash, pre-tax impairment charges were recorded within the Americas Recycling segment. See Note 8, Long-Lived Asset Impairment and Facility Closure Costs, for additional information. After consideration of the impairment charges, the fair value of the Americas Recycling segment's fixed assets was
$82.8 million
at August 31, 2016. There were no other material non-recurring fair value remeasurements during fiscal years ended
August 31, 2017
and
2016
.
The carrying values of the Company's short-term items, including the deferred purchase price of accounts receivable, documentary letters of credit and notes payable, approximate fair value due to their short-term nature.
The carrying values and estimated fair values of the Company's financial assets and liabilities that are not required to be measured at fair value on the consolidated balance sheets are as follows:
|
|
August 31, 2017
|
August 31, 2016
|
||||||||||||||||
|
(in thousands)
|
Fair Value Hierarchy
|
Carrying Value
|
Fair Value
|
Carrying Value
|
Fair Value
|
|||||||||||||
|
2027 Notes
(1)
|
Level 2
|
$
|
300,000
|
|
$
|
314,286
|
|
$
|
—
|
|
$
|
—
|
|
|||||
|
2023 Notes
(1)
|
Level 2
|
330,000
|
|
340,052
|
|
330,000
|
|
332,010
|
|
|||||||||
|
2022 Term Loan
(2)
|
Level 2
|
150,000
|
|
150,000
|
|
—
|
|
—
|
|
|||||||||
|
2018 Notes
(1)
|
Level 2
|
—
|
|
—
|
|
408,874
|
|
432,303
|
|
|||||||||
|
2017 Notes
(1)
|
Level 2
|
—
|
|
—
|
|
302,601
|
|
311,250
|
|
|||||||||
_________________
(1) The fair value of the Notes is determined based on indicated market values.
(2) The Term Loan contains variable interest rates and its carrying value approximates fair value.
The components of earnings from continuing operations before income taxes are as follows:
|
|
Year Ended August 31,
|
|||||||||||
|
(in thousands)
|
2017
|
2016
|
2015
|
|||||||||
|
United States
|
$
|
15,739
|
|
$
|
47,076
|
|
$
|
81,619
|
|
|||
|
Foreign
|
29,265
|
|
21,634
|
|
14,843
|
|
||||||
|
Total
|
$
|
45,004
|
|
$
|
68,710
|
|
$
|
96,462
|
|
|||
The income taxes (benefit) included in the consolidated statements of earnings are as follows:
|
|
Year Ended August 31,
|
|||||||||||
|
(in thousands)
|
2017
|
2016
|
2015
|
|||||||||
|
Current:
|
|
|
|
|||||||||
|
United States
|
$
|
11,345
|
|
$
|
5,224
|
|
$
|
53,258
|
|
|||
|
Foreign
|
9,464
|
|
6,991
|
|
3,329
|
|
||||||
|
State and local
|
2,654
|
|
4,130
|
|
2,830
|
|
||||||
|
Current taxes
|
$
|
23,463
|
|
$
|
16,345
|
|
$
|
59,417
|
|
|||
|
Deferred:
|
|
|
|
|||||||||
|
United States
|
$
|
(13,548
|
)
|
$
|
(4,423
|
)
|
$
|
(14,219
|
)
|
|||
|
Foreign
|
(917
|
)
|
254
|
|
722
|
|
||||||
|
State and local
|
281
|
|
303
|
|
488
|
|
||||||
|
Deferred taxes
|
$
|
(14,184
|
)
|
$
|
(3,866
|
)
|
$
|
(13,009
|
)
|
|||
|
Total income taxes on income
|
$
|
9,279
|
|
$
|
12,479
|
|
$
|
46,408
|
|
|||
|
Income taxes (benefit) on discontinued operations
|
(3,175
|
)
|
1,669
|
|
12,950
|
|
||||||
|
Income taxes on continuing operations
|
$
|
12,454
|
|
$
|
10,810
|
|
$
|
33,458
|
|
|||
80
A reconciliation of the federal statutory rate to the Company's effective income tax rate from continuing operations is as follows:
|
|
Year Ended August 31,
|
|||||||||||
|
(in thousands)
|
2017
|
2016
|
2015
|
|||||||||
|
Income tax expense at statutory rate of 35%
|
$
|
15,751
|
|
$
|
24,050
|
|
$
|
33,761
|
|
|||
|
Change in valuation allowance
|
113,089
|
|
75,076
|
|
16,194
|
|
||||||
|
Foreign tax impairment on valuation of subsidiaries
|
(92,321
|
)
|
(60,204
|
)
|
—
|
|
||||||
|
Nontaxable foreign interest
|
(19,259
|
)
|
(16,063
|
)
|
(16,712
|
)
|
||||||
|
Foreign rate differential
|
(5,534
|
)
|
(1,522
|
)
|
(1,872
|
)
|
||||||
|
Deferred compensation
|
(2,101
|
)
|
(1,375
|
)
|
772
|
|
||||||
|
State and local taxes
|
1,698
|
|
1,950
|
|
1,802
|
|
||||||
|
Section 199 manufacturing deduction
|
(1,407
|
)
|
(4,694
|
)
|
(4,017
|
)
|
||||||
|
Audit settlement
|
(659
|
)
|
(10,264
|
)
|
—
|
|
||||||
|
Other
|
3,197
|
|
3,856
|
|
3,530
|
|
||||||
|
Income tax expense on continuing operations
|
$
|
12,454
|
|
$
|
10,810
|
|
$
|
33,458
|
|
|||
|
Effective income tax rates from continuing operations
|
27.7
|
%
|
15.7
|
%
|
34.7
|
%
|
||||||
The Company's effective income tax rate from continuing operations was
27.7%
for the year ended
August 31, 2017
, compared to the statutory rate of
35%
. Several factors influence the effective tax rate. Items that benefited the effective tax rate include:
(i) benefit for domestic production activity income under Section 199 of the Internal Revenue Code ("Section 199"),
(ii) a non-taxable gain on assets related to the Company's nonqualified Benefits Restoration Plan ("BRP"), and
(iii) the proportion of the Company's global income from operations in jurisdictions with lower statutory tax rates than the U.S., including Poland, which has a statutory income tax rate of
19%
.
Items negatively impacting the effective tax rate include:
(a) U.S. state and local taxes imposed on income from domestic operations, and
(b) losses from operations in certain jurisdictions where the Company maintains a valuation allowance, thus providing no benefit for such losses.
For the year ended
August 31, 2016
, the effective income tax rate from continuing operations was
15.7%
compared to the statutory rate of
35%
. Items that benefited the effective tax rate include:
(i) net favorable adjustments resulting from the settlement of an audit, including the release of certain unrecognized tax benefits for which the accruals were greater than the amount assessed,
(ii) benefit for domestic production activity income under Section 199,
(iii) a non-taxable gain on assets related to the Company's nonqualified BRP, and
(iv) the proportion of the Company's global income from operations in jurisdictions with lower statutory tax rates than the U.S., including Poland, which has a statutory income tax rate of
19%
.
Items negatively impacting the effective tax rate include:
(a) U.S. state and local taxes imposed on the release of unrecognized tax benefits, and
(b) losses from operations in certain jurisdictions where the Company maintains a valuation allowance, thus providing no benefit for such losses.
For the year ended
August 31, 2015
, the effective income tax rate from continuing operations was
34.7%
compared to the statutory rate of
35%
. Items that benefited the effective tax rate include:
(i) income from operations in jurisdictions with lower statutory tax rates than the U.S., including Poland, and
(ii) benefit for domestic production activity under Section 199.
Items negatively impacting the effective tax rate include:
(a) U.S. state and local taxes imposed on income from domestic operations,
(b) losses from operations in certain jurisdictions where the Company maintains a valuation allowance, thus providing no benefit for such losses, and
(c) a non-deductible loss on nonqualified BRP assets.
The Company's tax benefit from discontinued operations for the year ended
August 31, 2017
was
$3.2 million
, or an effective income tax rate of
(29.9)%
. The tax benefit in discontinued operations is largely attributed to domestic operations losses related to CMC Cometals. Additionally, income in discontinued operations from the International Marketing and Distribution segment was primarily earned in foreign jurisdictions that benefit from group loss sharing provisions. Such losses, which carry a full
81
valuation allowance, are utilized to absorb the International Marketing and Distribution income; thus there is no tax expense or benefit associated with the income from discontinued operations earned in foreign jurisdictions.
The Company’s tax expense from discontinued operations for the year ended
August 31, 2016
was
$1.7 million
, or an effective income tax rate of
(113.6)%
. The International Marketing and Distribution segment's incurred net pre-tax losses in foreign jurisdictions in excess of the pre-tax income earned in the U.S., producing a nominal pre-tax loss in discontinued operations. The tax expense associated with discontinued operations is primarily related to the tax effect of income earned in the U.S.
The Company’s tax expense from discontinued operations for the year ended
August 31, 2015
was
$13.0 million
, or an effective income tax rate of
44.1%
. Pre-tax income from CMC Cometals operations in the U.S., subject to tax at the statutory rate of 35%, is offset by net pre-tax losses in the International Marketing and Distribution segment's foreign operations. Such foreign pre-tax losses were recorded in jurisdictions where the Company maintains a full valuation allowance, thus providing no tax benefit for such losses.
The Company made net payments of
$31.0 million
,
$50.2 million
and
$61.0 million
for income taxes for the years ended
August 31, 2017
,
2016
and
2015
, respectively.
The income tax effects of significant temporary differences giving rise to deferred tax assets and liabilities are as follows:
|
|
August 31,
|
|||||||
|
(in thousands)
|
2017
|
2016
|
||||||
|
Deferred tax assets:
|
|
|
||||||
|
Deferred compensation and employee benefits
|
$
|
46,898
|
|
$
|
45,496
|
|
||
|
Net operating losses and credits
|
273,549
|
|
154,606
|
|
||||
|
Reserves and other accrued expenses
|
21,727
|
|
18,831
|
|
||||
|
Allowance for doubtful accounts
|
3,223
|
|
2,438
|
|
||||
|
Intangibles
|
3,924
|
|
6,214
|
|
||||
|
Other
|
2,314
|
|
768
|
|
||||
|
Total deferred tax assets
|
351,635
|
|
228,353
|
|
||||
|
Valuation allowance for deferred tax assets
|
(273,991
|
)
|
(153,011
|
)
|
||||
|
Deferred tax assets, net
|
$
|
77,644
|
|
$
|
75,342
|
|
||
|
Deferred tax liabilities:
|
|
|
||||||
|
Fixed assets
|
$
|
101,707
|
|
$
|
96,100
|
|
||
|
Inventory
|
12,731
|
|
30,822
|
|
||||
|
Other
|
2,455
|
|
2,799
|
|
||||
|
Total deferred tax liabilities
|
$
|
116,893
|
|
$
|
129,721
|
|
||
|
Net deferred tax liabilities
|
$
|
(39,249
|
)
|
$
|
(54,379
|
)
|
||
Net operating losses giving rise to deferred tax assets consist of
$382.9 million
of state net operating losses that expire during the tax years ending from 2018 to 2037 and foreign net operating losses of
$840.4 million
that expire in varying amounts beginning in 2018 (with certain amounts having indefinite lives). These assets will be reduced as income tax expense is recognized in future periods.
The Company maintains a valuation allowance to reduce certain deferred tax assets to amounts that are more likely than not to be realized. During the years ended
August 31, 2017
and
August 31, 2016
, the Company recorded valuation allowances of
$121.0 million
and
$73.0 million
, respectively, related to net operating loss carryforwards in certain state and foreign jurisdictions due to the uncertainty of their realization. Such valuation allowances are largely attributed to losses generated by foreign tax impairment charges on valuation of subsidiaries.
In general, it is the practice and intention of the Company to reinvest the earnings of its non-U.S. subsidiaries in those operations. As of
August 31, 2017
, the Company had not made a provision for U.S. or additional foreign withholding taxes on approximately
$578.1 million
of undistributed earnings and profits associated with the excess of the amount for financial reporting over the income tax basis of investments in foreign subsidiaries that is indefinitely reinvested. Generally, such amounts become subject to U.S. taxation upon the remittance of dividends and under certain other circumstances. It is not practicable to estimate the amount of deferred tax liability related to investments in these foreign subsidiaries.
82
The unrecognized income tax benefits as of
August 31, 2017
and
August 31, 2016
were
$9.3 million
and
$9.5 million
, respectively, all of which, if recognized, would have impacted the Company's effective income tax rate at the end of fiscal
2017
and
2016
, respectively. The unrecognized income tax benefits as of
August 31, 2015
were
$27.3 million
, of which
$12.0 million
, if recognized, would have impacted the Company's effective tax rate for the end of fiscal
2015
.
A reconciliation of the beginning and ending amounts of unrecognized income tax benefits is as follows:
|
August 31,
|
||||||||||||
|
(in thousands)
|
2017
|
2016
|
2015
|
|||||||||
|
Balance at September 1
|
$
|
9,522
|
|
$
|
27,349
|
|
$
|
27,349
|
|
|||
|
Change in tax positions of current year
|
—
|
|
—
|
|
—
|
|
||||||
|
Change for tax positions of prior years
|
—
|
|
—
|
|
—
|
|
||||||
|
Reductions due to settlements with taxing authorities
|
(239
|
)
|
(17,827
|
)
|
—
|
|
||||||
|
Balance at August 31
|
$
|
9,283
|
|
$
|
9,522
|
|
$
|
27,349
|
|
|||
The Company's policy classifies interest recognized on an underpayment of income taxes and any statutory penalties recognized on a tax position as income tax expense, and the balances at the end of a reporting period are recorded as part of the current or noncurrent liability for uncertain income tax positions. At
August 31, 2017
and
2016
, the Company had accrued interest and penalties related to uncertain tax positions of
$1.2 million
and
$1.0 million
, respectively.
During the twelve months ending
August 31,
2018
, we anticipate that the statute of limitations pertaining to positions of the Company in prior year income tax returns may lapse or that income tax audits in various taxing jurisdictions will be finalized. As a result of such statute lapses or audit settlements, it is reasonably possibly that the amount of unrecognized tax benefits may decrease by $9.3 million.
The Company files income tax returns in the U.S. and multiple foreign jurisdictions with varying statutes of limitations. In the normal course of business, the Company and its subsidiaries are subject to examination by various taxing authorities. The following is a summary of tax years subject to examination:
U.S. Federal — 2009 and forward
U.S. States — 2009 and forward
Foreign — 2011 and forward
During the fiscal year ended August 31, 2016, the Company completed an IRS exam for the years 2009 through 2011 and received confirmation from the United States Congress Joint Committee on Taxation that all matters were settled with the exception of R&D credits, which are still under review as of August 31, 2017. In addition, the Company is under examination with certain state revenue authorities for the years 2009 to 2015. Management believes the Company's recorded income tax liabilities as of
August 31, 2017
sufficiently reflect the anticipated outcome of these examinations.
The Company's stock-based compensation plans provide for the issuance of incentive and nonqualified stock options, restricted stock and units, stock appreciation rights and performance-based awards. The Compensation Committee of CMC's Board of Directors (the "Compensation Committee") approves all awards that are granted under the Company's stock-based compensation plans. Stock-based compensation expense for the years ended
August 31, 2017
,
2016
and
2015
of
$30.3 million
,
$26.4 million
and
$23.5 million
, respectively, is mainly included in selling, general and administrative expenses on the Company's consolidated statements of earnings. As of
August 31, 2017
, total unrecognized compensation cost related to unvested stock-based compensation arrangements was
$19.3 million
, which is expected to be recognized over a weighted-average period of
three
years, except for certain restricted stock units granted during fiscal 2014, which are expected to vest over a weighted-average period of
four
years.
83
The following table summarizes the total awards granted:
|
Restricted Stock
Awards/Units |
Performance
Awards |
|||||
|
2017 Grants
|
1,303,976
|
|
576,286
|
|
||
|
2016 Grants
|
1,137,000
|
|
540,295
|
|
||
|
2015 Grants
|
987,574
|
|
462,496
|
|
||
As of
August 31, 2017
, CMC had
11,144,004
shares available for future grants.
Restricted Stock Units
Restricted stock units issued under the Company's stock-based compensation plans provide that units awarded may not be sold, transferred, pledged or assigned until service-based restrictions lapse. The restricted stock units granted to U.S. employees generally vest and are converted to CMC common stock in
three
equal installments on each of the first
three
anniversaries of the date of grant. The restricted stock units granted to non-U.S. employees generally vest and are settled in cash in
three
equal installments on each of the first
three
anniversaries of the date of grant. Generally, upon termination of employment, restricted stock units that have not vested are forfeited. Upon death, disability or qualifying retirement, a pro-rata portion of the unvested restricted stock awarded will vest and become payable.
Certain restricted stock units granted during fiscal 2014 will vest and either convert to CMC common stock or settle in cash after a specified service period;
25%
vest
two years
from the date of grant;
25%
vest
three years
from the date of grant; and the remaining
50%
vest
four years
from the date of grant.
The estimated fair value of the stock-settled restricted stock units is based on the closing price of CMC common stock on the date of grant, discounted for the expected dividend yield through the vesting period. Compensation cost related to the stock-settled restricted stock units is recognized ratably over the service period and is included in equity on the Company's consolidated balance sheets. During the first quarter of fiscal 2017, certain restricted stock units and performance stock units (the "modified stock units") that were previously accounted for under the equity method were modified to allow optionality related to the net share settlement feature, which resulted in accounting for these awards under the liability method. The fair value of the cash-settled restricted stock units as well as the modified stock units is remeasured each reporting period and is recognized ratably over the service period. The liability related to the cash-settled restricted stock units and modified stock units is included in accrued expenses and other payables on the Company's consolidated balance sheets. For the year ended August 31, 2017, the Company recorded expense of
$2.8 million
as a result of the modification and the impact of the change in stock value on liability-treated awards, compared to immaterial mark-to-market adjustments for the year ended August 31, 2016.
Performance Stock Units
Performance stock units issued under the Company's stock-based compensation plans provide that units awarded may not be sold, transferred, pledged or assigned until service-based restrictions lapse and any performance objectives have been attained as established by the Compensation Committee. Recipients of these awards generally must be actively employed by and providing services to the Company on the last day of the performance period in order to receive an award payout. Upon death, disability or qualifying retirement, a pro-rata portion of the performance stock units will vest and become payable at the end of the performance period.
Compensation cost for performance stock units is accrued based on the probable outcome of specified performance conditions, net of estimated forfeitures. The Company accrues compensation cost if it is probable that the performance conditions will be met. The Company reassesses the probability of meeting the specified performance conditions at the end of each reporting period and adjusts compensation cost, as necessary, based on the probability of achieving the performance conditions. If the performance conditions are not met at the end of the performance period, the Company reverses the related compensation cost.
Performance targets established by the Compensation Committee for performance stock units awarded in fiscal years
2017
,
2016
and
2015
are weighted
75%
based on the Company's cumulative EBITDA targets and positive return on invested capital for the fiscal year in which the awards were granted and the succeeding two fiscal years, as approved by CMC's Board of Directors in the respective year's business plan, and
25%
based on a three year relative total stockholder return metric. Performance stock units awarded to U.S. participants will be settled in CMC common stock. Award payouts range from a threshold of
50%
to a maximum of
200%
for each portion of the target awards. The performance stock units awarded in fiscal years
2017
and
2016
associated with the cumulative EBITDA targets have been classified as liability awards since the final EBITDA target will not be set until the
84
third year of the performance period. Consequently, these awards are included in accrued expenses and other payables on the Company's consolidated balance sheets. The fair value of these performance stock units is remeasured each reporting period and is recognized ratably over the service period. The performance stock units associated with the total stockholder return metric were valued at fair value on the date of grant using the Monte Carlo pricing model and are included in equity on the Company's consolidated balance sheets.
Performance stock units awarded to non-U.S. participants in fiscal
2017
,
2016
and
2015
will be settled in cash. The fair value of the performance stock units is remeasured each reporting period and is recognized ratably over the service period. The liability related to these awards is included in accrued expenses and other payables on the Company's consolidated balance sheets.
Information for restricted stock units and performance stock units, excluding those expected to settle in cash, is as follows:
|
Number
|
Weighted Average
Grant-Date Fair Value |
|||||
|
Outstanding as of September 1, 2014
|
2,080,580
|
|
$
|
15.37
|
|
|
|
Granted
|
1,468,696
|
|
15.79
|
|
||
|
Vested
|
(712,279
|
)
|
14.33
|
|
||
|
Forfeited
|
(103,663
|
)
|
15.51
|
|
||
|
Outstanding as of August 31, 2015
|
2,733,334
|
|
15.86
|
|
||
|
Granted
|
1,612,772
|
|
15.83
|
|
||
|
Vested
|
(1,471,436
|
)
|
14.47
|
|
||
|
Forfeited
|
(174,440
|
)
|
17.60
|
|
||
|
Outstanding as of August 31, 2016
|
2,700,230
|
|
16.49
|
|
||
|
Granted
|
1,462,442
|
|
16.17
|
|
||
|
Vested
|
(1,385,753
|
)
|
17.62
|
|
||
|
Forfeited
|
(323,339
|
)
|
16.58
|
|
||
|
Outstanding as of August 31, 2017
|
2,453,580
|
|
$
|
15.65
|
|
|
The total fair value of shares vested during fiscal years
2017
,
2016
and
2015
was
$24.4 million
,
$21.3 million
and
$10.2 million
, respectively.
The Company granted
914,545
and
464,782
equivalent shares of restricted stock units and performance stock units accounted for as liability awards during the years ended
August 31, 2017
and
2016
, respectively. As of
August 31, 2017
, the Company had
1,752,492
equivalent shares of awards outstanding and expects
1,671,441
equivalent shares to vest.
Stock Appreciation Rights
Stock appreciation rights are awarded to certain employees with an exercise price equal to the market value of CMC common stock on the date of grant.
No
stock appreciation rights were granted during the years ended
August 31, 2017
,
2016
, and
2015
.
85
Combined activity for the Company's stock appreciation rights, excluding the cash component, is as follows:
|
Number
|
Weighted
Average Exercise Price |
Weighted
Average Remaining Contractual Life (Years) |
Aggregate
Intrinsic Value
|
|||||||||
|
Outstanding as of September 1, 2014
|
1,437,031
|
|
$
|
19.85
|
|
|||||||
|
Exercised
|
(142,604
|
)
|
11.80
|
|
||||||||
|
Forfeited/Expired
|
(452,210
|
)
|
35.10
|
|
||||||||
|
Outstanding as of August 31, 2015
|
842,217
|
|
$
|
13.04
|
|
2.7
|
$
|
2,243,765
|
|
|||
|
Exercised
|
(418,378
|
)
|
12.10
|
|
||||||||
|
Forfeited/Expired
|
(64,845
|
)
|
11.60
|
|
||||||||
|
Outstanding as of August 31, 2016
|
358,994
|
|
$
|
14.39
|
|
1.7
|
$
|
405,864
|
|
|||
|
Exercised
|
(235,687
|
)
|
14.72
|
|
|
|
||||||
|
Forfeited/Expired
|
(14,000
|
)
|
14.05
|
|
|
|
||||||
|
Outstanding as of August 31, 2017
|
109,307
|
|
$
|
13.72
|
|
1.3
|
$
|
564,826
|
|
|||
|
Exercisable at August 31, 2017
|
109,307
|
|
$
|
13.72
|
|
1.3
|
$
|
564,826
|
|
|||
|
Remaining unvested stock appreciation rights expected to vest
|
—
|
|
$
|
—
|
|
|||||||
The total intrinsic value of stock appreciation rights exercised during fiscal
2017
and
2016
was
$1.4 million
and
$2.2 million
, respectively. The total intrinsic value of stock appreciation rights exercised during fiscal
2015
was not material.
Information related to stock appreciation rights as of August 31,
2017
is summarized below:
|
Stock Appreciation Rights Outstanding and Exercisable
|
|||||||||||
|
Range of Exercise Prices
|
Number Outstanding and Exercisable
|
Weighted Average Remaining Contractual Life (In Years)
|
Weighted Average Exercise Price
|
||||||||
|
$11.60
|
-
|
14.12
|
81,307
|
|
1.6
|
$
|
12.65
|
|
|||
|
$16.83
|
-
|
16.83
|
28,000
|
|
0.4
|
$
|
16.83
|
|
|||
|
|
109,307
|
|
1.3
|
$
|
13.72
|
|
|||||
As of August 31,
2017
, the Company had
6,367
equivalent shares of cash-settled stock appreciation rights outstanding and expects
6,048
equivalent shares of cash-settled stock appreciation rights to vest.
Stock Purchase Plan
Almost all U.S. resident employees with one year of service at the beginning of each calendar year may participate in the Company's employee stock purchase plan. Each eligible employee may purchase up to
400
shares annually. The Board of Directors established the purchase discount of 15% based on market prices on specified dates for the years ended
August 31, 2017
,
2016
and
2015
. Yearly activity of the stock purchase plan is as follows:
|
2017
|
2016
|
2015
|
||||||||||
|
Shares subscribed
|
173,420
|
|
212,370
|
|
198,710
|
|
||||||
|
Price per share
|
$
|
18.99
|
|
$
|
12.03
|
|
$
|
13.73
|
|
|||
|
Shares purchased
|
166,220
|
|
156,860
|
|
172,170
|
|
||||||
|
Price per share
|
$
|
12.04
|
|
$
|
13.71
|
|
$
|
16.96
|
|
|||
|
Shares available for future issuance
|
3,517,604
|
|
|
|
||||||||
86
Treasury Stock
During the first quarter of fiscal 2015, CMC's Board of Directors authorized a share repurchase program under which the Company may repurchase up to
$100.0 million
of the outstanding shares of CMC common stock. The share repurchase program does not require the Company to acquire any dollar amount or number of shares of CMC common stock and may be modified, suspended, extended or terminated at any time without prior notice. During the year ended
August 31, 2017
, the Company
did not purchase any
shares of CMC common stock. During the year ended August 31,
2016
, the Company purchased
2.3 million
shares of CMC common stock at an average purchase price of
$13.57
per share. The Company had remaining authorization to purchase $
27.6 million
of CMC common stock at
August 31, 2017
.
Preferred Stock
Preferred stock has a par value of
$1.00
per share, with
2,000,000
shares authorized. It may be issued in series, and the shares of each series have such rights and preferences as may be fixed by CMC's Board of Directors when authorizing the issuance of that particular series. There are
no
shares of preferred stock outstanding.
Substantially all employees in the U.S. are covered by a defined contribution retirement plan. This tax qualified plan is maintained and contributions are made in accordance with the Employee Retirement Income Security Act of 1974, as amended ("ERISA"). The Company also provides certain eligible executives benefits pursuant to its BRP equal to amounts that would have been available under the tax qualified ERISA plan, but were subject to the limitations of ERISA, tax laws and regulations. Company expenses for these plans, a portion of which are discretionary, are primarily recorded in both cost of goods sold and selling, general and administrative expenses, with an immaterial portion included in earnings (loss) from discontinued operations before income taxes, and totaled
$28.3 million
,
$25.0 million
and
$9.7 million
for the years ended August 31,
2017
,
2016
and
2015
, respectively.
The deferred compensation liability under the BRP was
$73.1 million
and
$71.0 million
at
August 31, 2017
and
2016
, with
$50.1 million
and
$71.0 million
, respectively, included in other long-term liabilities on the Company's consolidated balance sheets. At August 31, 2017,
$23.0 million
of the deferred compensation liability related to the BRP was included in accrued expenses and other payables on the Company's consolidated balance sheets. Though under no obligation to fund the BRP, the Company has segregated assets in a trust with a current value of
$75.7 million
and
$69.7 million
at
August 31, 2017
and
2016
, respectively, and such assets were included in other long-term assets on the Company's consolidated balance sheets. The net holding gain on these segregated assets was
$7.5 million
and
$5.4 million
for the years ended
August 31, 2017
and 2016, respectively, and was included in net sales in the Company's consolidated statements of earnings. The net holding loss on these segregated assets was immaterial for the year ended
August 31, 2015
.
A certain number of employees, primarily outside of the U.S., participate in defined benefit plans that are maintained in accordance with local regulations. The Company's expenses for these plans were not material for the years ended
August 31, 2017
,
2016
and
2015
, respectively, and are primarily included in selling, general and administrative expenses in the Company's consolidated statements of earnings. The Company recognizes the unfunded status of the defined benefit plans as a liability with a corresponding reduction to accumulated other comprehensive income, net of income taxes. At
August 31, 2017
and
2016
, the Company's liability related to the unfunded status of the defined benefit plans was not material and was included in other long-term liabilities on the Company's consolidated balance sheets.
Because the defined benefit pension plans are not material to the Company's consolidated financial statements, disclosures that would have otherwise been required by GAAP have been omitted.
Lease Commitments
The Company has operating leases principally relating to transportation and other equipment and real estate with varying terms. Certain of the Company's lease agreements include renewal options to extend the agreements as necessary and certain leases include escalation clauses and/or purchase options. These leases do not contain any financial covenants for the Company. Minimum lease commitments payable by the Company for noncancelable operating leases are as follows:
87
|
Year Ending August 31,
|
(in thousands)
|
|||
|
2018
|
$
|
21,473
|
|
|
|
2019
|
15,889
|
|
||
|
2020
|
10,009
|
|
||
|
2021
|
7,392
|
|
||
|
2022
|
5,330
|
|
||
|
Thereafter
|
6,350
|
|
||
|
Total
|
$
|
66,443
|
|
|
Total rental expense was
$37.3 million
,
$40.7 million
and
$52.8 million
in fiscal years
2017
,
2016
and
2015
, respectively.
Legal and Environmental Matters
In the ordinary course of conducting its business, the Company becomes involved in litigation, administrative proceedings and governmental investigations, including environmental matters.
On April 28, 2016, the Company was served with a lawsuit filed by Ector County, Texas and the State of Texas by and through the Texas Commission on Environmental Quality ("TCEQ") alleging violations of the Texas Solid Waste Disposal Act, the Texas Water Code, the Texas Clean Air Act, and TCEQ rules on spill prevention and control. The Plaintiffs amended their petition in February 2017 to include violations of TCEQ rules on recycling and storm water permits. The Plaintiffs further amended their petition in April 2017, broadening their allegations. The lawsuit, filed in the 201
st
Judicial District Court of Travis County, Texas, alleges improper disposal of solid waste and unauthorized outdoor burning activity at CMC’s recycling facility located in Odessa, Texas. The lawsuit seeks a penalty for each day of alleged violation under the Texas Health & Safety Code, the Texas Water Code, or the Texas Administrative Code. While the Company does not believe that it is probable that a loss has been incurred, the ultimate resolution of the matter could potentially result in a loss. Management’s best estimate of the low end of the range of the potential loss is
zero
. At this time, it is not possible to reasonably estimate the high end of the range of the potential loss, which could be material to the Company’s results of operations. Accordingly, the Company has not accrued a loss related to this matter. The Company believes that the lawsuit is without merit and is aggressively defending the action.
The Company has received notices from the U.S. Environmental Protection Agency ("EPA") or state agencies with similar responsibility that it is considered a potentially responsible party at several sites, none owned by the Company, and may be obligated under the Comprehensive Environmental Response, Compensation, and Liability Act of 1980 ("CERCLA") or similar state statutes to conduct remedial investigations, feasibility studies, remediation and/or removal of alleged releases of hazardous substances or to reimburse the EPA for such activities. The Company is involved in litigation or administrative proceedings with regard to several of these sites in which the Company is contesting, or at the appropriate time may contest, its liability at the sites. In addition, the Company has received information requests with regard to other sites which may be under consideration by the EPA as potential CERCLA sites. Some of these environmental matters or other proceedings may result in fines, penalties or judgments being assessed against the Company. At both
August 31, 2017
and
2016
, the Company had
$0.7 million
accrued for cleanup and remediation costs in connection with CERCLA sites. The estimation process is based on currently available information, which is in many cases preliminary and incomplete. Total environmental liabilities, including CERCLA sites, were
$4.3 million
and
$3.3 million
as of
August 31, 2017
and
2016
, respectively, of which
$2.1 million
were classified as other long-term liabilities as of
August 31, 2017
and
2016
. These amounts have not been discounted to their present values. Due to evolving remediation technology, changing regulations, possible third-party contributions, the inherent shortcomings of the estimation process and other factors, amounts accrued could vary significantly from amounts paid. Historically, the amounts the Company has ultimately paid for such remediation activities have not been material.
In the third quarter of fiscal 2015, the Company recorded a
$45.5 million
benefit as a result of a termination of a contract with a customer, which is included in earnings (loss) from discontinued operations before income taxes on the Company's consolidated statements of earnings for fiscal 2015.
Management believes that adequate provisions have been made in the Company's consolidated financial statements for the potential impact of these contingencies, and that the outcomes of the suits and proceedings described above, and other miscellaneous litigation and proceedings now pending, will not have a material adverse effect on the business, results of operations or financial condition of the Company.
88
The calculations of basic and diluted earnings per share from continuing operations were as follows:
|
August 31,
|
||||||||||||
|
2017
|
2016
|
2015
|
||||||||||
|
Earnings from continuing operations
|
$
|
32,550
|
|
$
|
57,900
|
|
$
|
63,004
|
|
|||
|
Basic earnings per share:
|
||||||||||||
|
Shares outstanding for basic earnings per share
|
115,654,466
|
|
115,211,490
|
|
116,527,265
|
|
||||||
|
Basic earnings per share from continuing operations
|
$
|
0.28
|
|
$
|
0.50
|
|
$
|
0.54
|
|
|||
|
Diluted earnings per share:
|
||||||||||||
|
Shares outstanding for basic earnings per share
|
115,654,466
|
|
115,211,490
|
|
116,527,265
|
|
||||||
|
Effect of dilutive securities:
|
|
|
||||||||||
|
Stock-based incentive/purchase plans
|
1,709,942
|
|
1,412,336
|
|
1,422,633
|
|
||||||
|
Shares outstanding for diluted earnings per share
|
117,364,408
|
|
116,623,826
|
|
117,949,898
|
|
||||||
|
Diluted earnings per share from continuing operations
|
$
|
0.27
|
|
$
|
0.50
|
|
$
|
0.53
|
|
|||
|
Anti-dilutive shares not included above
|
—
|
|
274,251
|
|
371,273
|
|
||||||
Shares of CMC restricted stock is included in the number of shares of common stock issued and outstanding, but omitted from the basic earnings per share calculation until the shares vest.
Significant accrued expenses and other payables were as follows:
|
|
August 31,
|
|||||||
|
(in thousands)
|
2017
|
2016
|
||||||
|
Salaries and incentive compensation
|
$
|
95,488
|
|
$
|
107,507
|
|
||
|
Advance billings on contracts
|
38,449
|
|
28,056
|
|
||||
|
Taxes other than income taxes
|
37,279
|
|
26,721
|
|
||||
|
Insurance
|
23,540
|
|
23,480
|
|
||||
|
BRP liability
|
23,000
|
|
—
|
|
||||
|
Utilities
|
14,862
|
|
13,207
|
|
||||
89
The Company's operating segments engage in business activities from which they may earn revenues and incur expenses and for which discrete financial information is available. Operating results for the operating segments are regularly reviewed by the Company's chief operating decision maker to make decisions about resources to be allocated to the segments and to assess performance. The Company's chief operating decision maker is identified as the Chief Executive Officer. Operating segments are aggregated for reporting purposes when the operating segments are identified as similar in accordance with the basic principles and aggregation criteria in the accounting standards. The Company's reporting segments are based primarily on product lines and secondarily on geographic area. The reporting segments have different lines of management responsibility as each business requires different marketing strategies and management expertise.
The Company structures its business into the following
five
reporting segments: Americas Recycling, Americas Mills, Americas Fabrication, International Mill and International Marketing and Distribution. See Note 1, Nature of Operations, for more information about the reporting segments, including the types of products and services from which each reporting segment derives its net sales.
Corporate contains earnings on BRP assets and short-term investments as well as expenses of the Company's corporate headquarters and interest expense related to its long-term debt.
The financial information presented for the International Marketing and Distribution segment excludes the operations of the Australian steel distribution and CMC Cometals. These operations have been classified as discontinued operations in the consolidated statements of earnings. See Note 3, Changes in Business, for more information.
The Company uses adjusted operating profit from continuing operations to compare and to evaluate the financial performance of its segments. Adjusted operating profit is the sum of the Company's earnings from continuing operations before interest expense, income taxes and discounts on sales of accounts receivable. Intersegment sales are generally priced at prevailing market prices. Certain corporate administrative expenses are allocated to the segments based upon the nature of the expense. The accounting policies of the segments are the same as those described in Note 2, Summary of Significant Accounting Policies.
90
The following is a summary of certain financial information from continuing operations by reportable segment:
|
|
Americas
|
International
|
|
|
|
|||||||||||||||||||||||||||
|
(in thousands)
|
Recycling
|
Mills
|
Fabrication
|
Mill
|
Marketing and Distribution
|
Corporate
|
Eliminations
|
Continuing Operations
|
||||||||||||||||||||||||
|
2017
|
|
|
|
|
|
|
|
|
||||||||||||||||||||||||
|
Net sales-unaffiliated customers
|
$
|
865,462
|
|
$
|
917,689
|
|
$
|
1,364,826
|
|
$
|
635,691
|
|
$
|
776,382
|
|
$
|
9,625
|
|
$
|
—
|
|
$
|
4,569,675
|
|
||||||||
|
Intersegment sales
|
146,038
|
|
647,765
|
|
11,102
|
|
871
|
|
4,982
|
|
—
|
|
(810,758
|
)
|
—
|
|
||||||||||||||||
|
Net sales
|
1,011,500
|
|
1,565,454
|
|
1,375,928
|
|
636,562
|
|
781,364
|
|
9,625
|
|
(810,758
|
)
|
4,569,675
|
|
||||||||||||||||
|
Adjusted operating profit (loss)
|
14,822
|
|
168,805
|
|
4,097
|
|
46,977
|
|
(24,324
|
)
|
(119,629
|
)
|
(834
|
)
|
89,914
|
|
||||||||||||||||
|
Interest expense (income)*
|
2,979
|
|
(3,394
|
)
|
9,899
|
|
3,073
|
|
2,804
|
|
28,686
|
|
—
|
|
44,047
|
|
||||||||||||||||
|
Capital expenditures**
|
7,148
|
|
172,738
|
|
15,495
|
|
12,603
|
|
141
|
|
4,949
|
|
—
|
|
213,074
|
|
||||||||||||||||
|
Depreciation and amortization
|
15,497
|
|
49,419
|
|
13,399
|
|
25,822
|
|
941
|
|
19,975
|
|
—
|
|
125,053
|
|
||||||||||||||||
|
Asset impairment charges
|
559
|
|
—
|
|
—
|
|
150
|
|
6,742
|
|
713
|
|
—
|
|
8,164
|
|
||||||||||||||||
|
Total assets***
|
234,350
|
|
933,022
|
|
683,609
|
|
462,190
|
|
351,716
|
|
677,691
|
|
(394,006
|
)
|
2,948,572
|
|
||||||||||||||||
|
2016
|
|
|
|
|
|
|
|
|
||||||||||||||||||||||||
|
Net sales-unaffiliated customers
|
$
|
594,275
|
|
$
|
839,432
|
|
$
|
1,479,125
|
|
$
|
516,643
|
|
$
|
740,961
|
|
$
|
7,082
|
|
$
|
—
|
|
$
|
4,177,518
|
|
||||||||
|
Intersegment sales
|
111,479
|
|
659,416
|
|
10,330
|
|
543
|
|
13,997
|
|
—
|
|
(795,765
|
)
|
—
|
|
||||||||||||||||
|
Net sales
|
705,754
|
|
1,498,848
|
|
1,489,455
|
|
517,186
|
|
754,958
|
|
7,082
|
|
(795,765
|
)
|
4,177,518
|
|
||||||||||||||||
|
Adjusted operating profit (loss)
|
(61,284
|
)
|
209,751
|
|
68,602
|
|
28,892
|
|
(23,690
|
)
|
(95,085
|
)
|
5,333
|
|
132,519
|
|
||||||||||||||||
|
Interest expense*
|
2,210
|
|
1,942
|
|
8,356
|
|
2,608
|
|
1,547
|
|
45,458
|
|
—
|
|
62,121
|
|
||||||||||||||||
|
Capital expenditures**
|
4,891
|
|
110,375
|
|
14,958
|
|
27,155
|
|
94
|
|
5,587
|
|
—
|
|
163,060
|
|
||||||||||||||||
|
Depreciation and amortization
|
17,919
|
|
47,924
|
|
13,620
|
|
25,902
|
|
1,279
|
|
20,273
|
|
—
|
|
126,917
|
|
||||||||||||||||
|
Asset impairment charges
|
38,900
|
|
—
|
|
—
|
|
208
|
|
726
|
|
194
|
|
—
|
|
40,028
|
|
||||||||||||||||
|
Total assets***
|
188,873
|
|
798,481
|
|
659,165
|
|
372,492
|
|
390,969
|
|
1,034,053
|
|
(474,656
|
)
|
2,969,377
|
|
||||||||||||||||
|
2015
|
|
|
|
|
|
|
|
|
||||||||||||||||||||||||
|
Net sales-unaffiliated customers
|
$
|
887,068
|
|
$
|
1,048,063
|
|
$
|
1,612,084
|
|
$
|
626,219
|
|
$
|
1,250,127
|
|
$
|
852
|
|
$
|
—
|
|
$
|
5,424,413
|
|
||||||||
|
Intersegment sales
|
135,553
|
|
793,749
|
|
12,154
|
|
32
|
|
82,237
|
|
—
|
|
(1,023,725
|
)
|
—
|
|
||||||||||||||||
|
Net sales
|
1,022,621
|
|
1,841,812
|
|
1,624,238
|
|
626,251
|
|
1,332,364
|
|
852
|
|
(1,023,725
|
)
|
5,424,413
|
|
||||||||||||||||
|
Adjusted operating profit (loss)
|
(29,157
|
)
|
255,507
|
|
22,424
|
|
17,555
|
|
(15,443
|
)
|
(77,832
|
)
|
1,411
|
|
174,465
|
|
||||||||||||||||
|
Interest expense*
|
2,628
|
|
4,207
|
|
8,864
|
|
2,620
|
|
6,078
|
|
52,059
|
|
—
|
|
76,456
|
|
||||||||||||||||
|
Capital expenditures**
|
12,811
|
|
67,203
|
|
14,883
|
|
15,413
|
|
257
|
|
5,194
|
|
—
|
|
115,761
|
|
||||||||||||||||
|
Depreciation and amortization
|
17,460
|
|
46,780
|
|
17,509
|
|
28,087
|
|
1,903
|
|
20,739
|
|
—
|
|
132,478
|
|
||||||||||||||||
|
Asset impairment charges
|
7,494
|
|
—
|
|
1,585
|
|
124
|
|
623
|
|
13
|
|
—
|
|
9,839
|
|
||||||||||||||||
|
Total assets***
|
261,676
|
|
738,669
|
|
713,860
|
|
403,706
|
|
551,886
|
|
1,049,815
|
|
(514,496
|
)
|
3,205,116
|
|
||||||||||||||||
________________________
* Includes intercompany interest expense (income) in the segments, which is eliminated within Corporate.
** Excludes capital expenditures from discontinued operations that were immaterial for the years ended
August 31, 2017
,
2016
and
2015
.
*** Excludes total assets from discontinued operations of
$26.6 million
at
August 31, 2017
,
$161.5 million
at
August 31, 2016
, and
$240.5 million
at
August 31, 2015
.
Reconciliations of earnings from continuing operations to adjusted operating profit from continuing operations are provided below:
|
|
Year Ended August 31,
|
|||||||||||
|
(in thousands)
|
2017
|
2016
|
2015
|
|||||||||
|
Earnings from continuing operations
|
$
|
32,550
|
|
$
|
57,900
|
|
$
|
63,004
|
|
|||
|
Interest expense
|
44,047
|
|
62,121
|
|
76,456
|
|
||||||
|
Income taxes
|
12,454
|
|
10,810
|
|
33,458
|
|
||||||
|
Discounts on sales of accounts receivable
|
863
|
|
1,688
|
|
1,547
|
|
||||||
|
Adjusted operating profit from continuing operations
|
$
|
89,914
|
|
$
|
132,519
|
|
$
|
174,465
|
|
|||
91
The following represents the Company's external net sales from continuing operations by major product and geographic area:
|
|
Year Ended August 31,
|
|||||||||||
|
(in thousands)
|
2017
|
2016
|
2015
|
|||||||||
|
Major product information:
|
||||||||||||
|
Steel products
|
$
|
3,262,364
|
|
$
|
3,156,028
|
|
$
|
4,084,092
|
|
|||
|
Nonferrous scrap
|
506,220
|
|
364,690
|
|
536,856
|
|
||||||
|
Ferrous scrap
|
433,312
|
|
287,713
|
|
428,192
|
|
||||||
|
Construction materials
|
228,910
|
|
234,513
|
|
215,927
|
|
||||||
|
Nonferrous products
|
15,062
|
|
13,456
|
|
10,443
|
|
||||||
|
Other
|
123,807
|
|
121,118
|
|
148,903
|
|
||||||
|
Net sales
|
$
|
4,569,675
|
|
$
|
4,177,518
|
|
$
|
5,424,413
|
|
|||
|
|
Year Ended August 31,
|
|||||||||||
|
(in thousands)
|
2017
|
2016
|
2015
|
|||||||||
|
Geographic area:
|
||||||||||||
|
United States
|
$
|
3,268,466
|
|
$
|
2,939,630
|
|
$
|
3,808,757
|
|
|||
|
Europe
|
668,796
|
|
658,352
|
|
871,071
|
|
||||||
|
Asia
|
399,600
|
|
403,628
|
|
559,279
|
|
||||||
|
Australia/New Zealand
|
187,128
|
|
125,069
|
|
121,403
|
|
||||||
|
Other
|
45,685
|
|
50,839
|
|
63,903
|
|
||||||
|
Net sales
|
$
|
4,569,675
|
|
$
|
4,177,518
|
|
$
|
5,424,413
|
|
|||
The following table represents long-lived assets, net of accumulated depreciation and amortization, by geographic area:
|
|
August 31,
|
|||||||||||
|
(in thousands)
|
2017
|
2016
|
2015
|
|||||||||
|
United States
|
$
|
968,361
|
|
$
|
803,245
|
|
$
|
860,784
|
|
|||
|
Europe
|
183,025
|
|
177,778
|
|
189,796
|
|
||||||
|
Other
|
3,852
|
|
6,397
|
|
8,984
|
|
||||||
|
Total long-lived assets
|
$
|
1,155,238
|
|
$
|
987,420
|
|
$
|
1,059,564
|
|
|||
Summarized quarterly financial data for fiscal
2017
and
2016
was as follows:
|
|
Three Months Ended Fiscal 2017
|
|||||||||||||||
|
(in thousands except per share data)
|
Nov. 30
|
Feb. 28
|
May 31
|
Aug. 31
|
||||||||||||
|
Net sales*
|
$
|
994,091
|
|
$
|
1,053,903
|
|
$
|
1,260,700
|
|
$
|
1,260,981
|
|
||||
|
Gross profit*
|
123,814
|
|
148,239
|
|
162,772
|
|
111,585
|
|
||||||||
|
Net earnings (loss)
|
6,275
|
|
30,332
|
|
39,266
|
|
(29,540
|
)
|
||||||||
|
Basic EPS
|
0.05
|
|
0.26
|
|
0.34
|
|
(0.25
|
)
|
||||||||
|
Diluted EPS
|
0.05
|
|
0.26
|
|
0.34
|
|
(0.25
|
)
|
||||||||
92
|
|
Three Months Ended Fiscal 2016
|
|||||||||||||||
|
(in thousands except per share data)
|
Nov. 30
|
Feb. 29
|
May 31
|
Aug. 31
|
||||||||||||
|
Net sales*
|
$
|
1,050,188
|
|
$
|
913,894
|
|
$
|
1,110,790
|
|
$
|
1,102,646
|
|
||||
|
Gross profit*
|
148,221
|
|
125,935
|
|
164,339
|
|
158,405
|
|
||||||||
|
Net earnings (loss)
|
25,063
|
|
10,502
|
|
19,328
|
|
(131
|
)
|
||||||||
|
Basic EPS
|
0.22
|
|
0.09
|
|
0.17
|
|
—
|
|
||||||||
|
Diluted EPS
|
0.21
|
|
0.09
|
|
0.17
|
|
—
|
|
||||||||
_________________________
* Excludes divisions classified as discontinued operations. See Note 3, Changes in Business.
The Company had no significant related party transactions for the years ended
August 31, 2017
,
2016
and
2015
.
Not applicable.
(a)
Evaluation of Disclosure Controls and Procedures.
The term "disclosure controls and procedures" is defined in Rules 13a-15(e) and 15d-15(e) of the Exchange Act. This term refers to the controls and procedures of a company that are designed to ensure that information required to be disclosed by a company in the reports that it files under the Exchange Act is recorded, processed, summarized and reported within required time periods, including controls and disclosures designed to ensure that this information is accumulated and communicated to the company's management, including its Chief Executive Officer and Chief Financial Officer, as appropriate, to allow timely decisions regarding required disclosure. Our Chief Executive Officer and our Chief Financial Officer have evaluated the effectiveness of our disclosure controls and procedures as of the end of the period covered by this Annual Report on Form 10-K, and they have concluded that as of that date, our disclosure controls and procedures were effective.
(b)
Management's Report on Internal Control Over Financial Reporting.
Management concluded that, as of
August 31, 2017
, our internal control over financial reporting was effective. Our Management's Report on Internal Control Over Financial Reporting, as of
August 31, 2017
, can be found on page 51 of this Annual Report on Form 10-K, and the related Report of Our Independent Registered Public Accounting Firm, Deloitte & Touche LLP, on Internal Control Over Financial Reporting can be found on page 52 of this Annual Report on Form 10-K, each of which is incorporated by reference into this Item 9A.
(c)
Changes in Internal Control Over Financial Reporting.
No change to our internal control over financial reporting occurred during our last fiscal quarter that has materially affected, or is reasonably likely to materially affect, our internal control over financial reporting.
Not applicable.
93
Information required in response to this item with regard to directors is incorporated by reference into this Annual Report on Form 10-K from our definitive proxy statement for our
2018
annual meeting of stockholders (such proxy statement, the "
2018
Proxy Statement"). Such information will be included in the
2018
Proxy Statement under the captions "Proposal 1: Election of Directors," "Certain Relationships and Related Person Transactions," "Section 16(a) Beneficial Ownership Reporting Compliance," "Audit Committee Report" and "Corporate Governance; Board and Committee Matters." Information regarding the Company's executive officers is set forth under the caption "Executive Officers of the Registrant" in Part I, Item 1 of this Annual Report on Form 10-K and incorporated herein by reference.
Code of Ethics
We have adopted a Financial Code of Ethics that applies to our Chief Executive Officer, Chief Financial Officer and Chief Accounting Officer. Our Financial Code of Ethics is available on our website (www.cmc.com), and we intend to post any amendments to or waivers from our Financial Code of Ethics on our website to the extent applicable to our Chief Executive Officer, Chief Financial Officer and Chief Accounting Officer. We hereby undertake to provide to any person without charge, upon request, a copy of our Financial Code of Ethics. Requests may be directed to Commercial Metals Company, 6565 N. MacArthur Blvd., Suite 800, Irving, Texas 75039, Attention: Corporate Secretary, or by calling (214) 689-4300.
Information required in response to this Item 11 is incorporated by reference into this Annual Report on Form 10-K from our
2018
Proxy Statement. Such information will be included in the
2018
Proxy Statement under the caption "Executive Compensation," "Compensation Committee Interlocks and Insider Participation" and "Compensation Committee Report."
See Part II, Item 5, "Equity Compensation Plans" in this Annual Report on Form 10-K, which is incorporated by reference into this Item 12. The other information required in response to this Item 12 is incorporated by reference into this Annual Report on Form 10-K from the
2018
Proxy Statement. Such information will be included in the
2018
Proxy Statement under the caption "Security Ownership of Certain Beneficial Owners and Management."
To the extent applicable, information required in response to this Item 13 is incorporated by reference into this Annual Report on Form 10-K from the
2018
Proxy Statement. Such information will be included in the
2018
Proxy Statement under the caption "Certain Relationships and Related Person Transactions."
The information required in response to this Item 14 is incorporated by reference into this Annual Report on Form 10-K from the
2018
Proxy Statement. Such information will be included in the
2018
Proxy Statement under the caption "Ratification of Appointment of Independent Registered Public Accounting Firm."
94
(a) The following documents are filed as a part of this Annual Report on Form 10-K:
1. All financial statements are included in Item 8 above.
2. Financial statement schedule: The following financial statement schedule is attached to this Annual Report on Form 10-K.
Schedule II — Valuation and Qualifying Accounts
All other financial statement schedules have been omitted because they are not applicable, they are not required or the required information is shown in the financial statements or notes thereto.
3. Exhibits:
|
EXHIBIT
|
|
|
|
NO.
|
|
DESCRIPTION
|
|
2(a)†
|
|
|
|
3(i)(a)
|
|
|
|
|
|
|
|
3(i)(b)
|
|
|
|
|
|
|
|
3(i)(c)
|
|
|
|
|
|
|
|
3(i)(d)
|
|
|
|
3(i)(e)
|
||
|
|
|
|
|
3(i)(f)
|
|
|
|
|
|
|
|
3(ii)
|
|
|
|
|
|
|
|
4(i)(a)
|
|
|
|
|
|
|
95
|
4(i)(b)
|
|
|
|
4(i)(c)
|
|
|
|
4(i)(d)
|
|
|
|
4(i)(e)
|
|
|
|
10(ii)(a)
|
||
|
10(ii)(b)
|
|
|
|
10(ii)(c)
|
|
|
|
|
|
|
|
10(ii)(d)
|
|
|
|
10(ii)(e)
|
|
|
|
10(ii)(f)
|
|
|
|
10(ii)(g)
|
|
|
|
10(ii)(h)
|
||
96
|
10(ii)(i)
|
||
|
10(ii)(j)
|
|
|
|
10(ii)(k)
|
|
|
|
10(ii)(l)
|
|
|
|
10(iii)(a)*
|
|
|
|
|
|
|
|
10(iii)(b)*
|
|
|
|
|
|
|
|
10(iii)(c)*
|
|
|
|
|
|
|
|
10(iii)(d)*
|
||
|
10(iii)(e)*
|
||
|
10(iii)(f)*
|
||
|
10(iii)(g)*
|
|
|
|
10(iii)(h)*
|
||
97
|
10(iii)(i)*
|
|
|
|
10(iii)(j)*
|
||
|
10(iii)(k)*
|
||
|
10(iii)(l)*
|
||
|
10(iii)(m)*
|
||
|
|
|
|
|
10(iii)(n)*
|
|
|
|
10(iii)(o)*
|
|
|
|
10(iii)(p)*
|
|
|
|
10(iii)(q)*
|
||
|
10(iii)(r)*
|
|
|
|
10(iii)(s)*
|
|
|
|
10(iii)(t)*
|
||
|
10(iii)(u)*
|
|
|
|
12
|
||
|
21
|
||
|
23
|
||
98
|
31(a)
|
||
|
31(b)
|
||
|
32(a)
|
||
|
32(b)
|
||
|
101
|
The following financial information from Commercial Metals Company's Annual Report on Form 10-K for the fiscal year ended August 31, 2017, formatted in XBRL (eXtensible Business Reporting Language): (i) the Consolidated Statements of Earnings, (ii) the Consolidated Statements of Comprehensive Income (Loss), (iii) the Consolidated Balance Sheets, (iv) the Consolidated Statements of Cash Flows, (v) the Consolidated Statements of Stockholders' Equity and (vi) the Notes to Consolidated Financial Statements (filed herewith).
|
|
† The registrant agrees to furnish supplementally to the SEC a copy of any omitted schedule or exhibit upon the request of the SEC in accordance with Item 601(b)(2) of Regulation S-K.
|
*
|
Denotes management contract or compensatory plan.
|
99
SCHEDULE II — VALUATION AND QUALIFYING ACCOUNTS
|
|
|
Additions
|
Deductions
|
|
|||||||||||||||||||
|
Description (in thousands)
|
Balance at Beginning of Period
|
Charged to Costs and Expenses
|
Charged to Other Accounts
|
Charged to Costs and Expenses
|
Charged to Other Accounts
|
Balance at End of Period
|
|||||||||||||||||
|
Year Ended August 31, 2017
|
|
|
|
|
|
|
|
|
|||||||||||||||
|
Allowance for doubtful accounts
|
$
|
6,427
|
|
7,108
|
|
1,074
|
|
(1)
|
(1,059
|
)
|
(4,885
|
)
|
(2)
|
$
|
8,665
|
|
|||||||
|
Deferred tax valuation allowance
|
153,011
|
|
127,660
|
|
|
|
(6,680
|
)
|
|
|
273,991
|
|
|||||||||||
|
Year Ended August 31, 2016
|
|
|
|
|
|
|
|
|
|||||||||||||||
|
Allowance for doubtful accounts
|
$
|
9,033
|
|
6,878
|
|
1,007
|
|
(1)
|
—
|
|
(10,491
|
)
|
(2)
|
$
|
6,427
|
|
|||||||
|
Deferred tax valuation allowance
|
79,965
|
|
74,114
|
|
|
|
|
(1,068
|
)
|
|
|
|
153,011
|
|
|||||||||
|
Year Ended August 31, 2015
|
|
|
|
|
|
|
|
|
|||||||||||||||
|
Allowance for doubtful accounts
|
$
|
5,908
|
|
4,142
|
|
306
|
|
(1)
|
(661
|
)
|
(662
|
)
|
(2)
|
$
|
9,033
|
|
|||||||
|
Deferred tax valuation allowance
|
69,762
|
|
17,746
|
|
|
|
|
(7,543
|
)
|
|
|
|
79,965
|
|
|||||||||
|
(1)
|
Recoveries and translation adjustments.
|
|
(2)
|
Uncollectable accounts charged to the allowance. For the years ended
August 31, 2017
,
2016
and
2015
,
$(1,841)
,
$(1,401)
and
$(1,695)
were reclassified to the fair value of the deferred purchase price under our sale of accounts receivables program, respectively.
|
100
SIGNATURES
Pursuant to the requirements of Section 13 or 15(d) of the Securities Exchange Act of 1934, the registrant has caused this report to be signed on its behalf by the undersigned, thereunto duly authorized.
|
|
|
|
|
|
|
|
COMMERCIAL METALS COMPANY
|
|
||
|
|
By
|
/s/ Barbara R. Smith
|
|
|
|
|
|
Barbara R. Smith
|
|
|
|
|
|
President and Chief Executive Officer
|
|
|
|
Date: October 26, 2017
|
||||
|
|
||||
Pursuant to the requirements of the Securities Exchange Act of 1934, this report has been signed below by the following persons on behalf of the registrant and in the capacities and on the dates indicated:
|
/s/ Joseph Alvarado
|
|
/s/ Barbara R. Smith
|
|
|
|
|
|
Joseph Alvarado, October 26, 2017
|
|
Barbara R. Smith, October 26, 2017
|
|
Chairman of the Board
|
|
Director
|
|
|
|
|
|
/s/ Richard B. Kelson
|
|
/s/ J. David Smith
|
|
|
|
|
|
Richard B. Kelson, October 26, 2017
|
|
J. David Smith, October 26, 2017
|
|
Lead Director
|
|
Director
|
|
|
|
|
|
/s/ Vicki L. Avril
|
|
/s/ Charles L. Szews
|
|
|
||
|
Vicki L. Avril, October 26, 2017
|
|
Charles L. Szews, October 26, 2017
|
|
Director
|
|
Director
|
|
|
|
|
|
/s/ Rhys J. Best
|
|
/s/ Joseph C. Winkler
|
|
|
|
|
|
Rhys J. Best, October 26, 2017
|
|
Joseph C. Winkler, October 26, 2017
|
|
Director
|
|
Director
|
|
|
||
|
/s/ Robert L. Guido
|
|
/s/ Mary A. Lindsey
|
|
|
|
|
|
Robert L. Guido, October 26, 2017
|
|
Mary A. Lindsey, October 26, 2017
|
|
Director
|
|
Senior Vice President and Chief Financial Officer
|
|
/s/ Rick J. Mills
|
|
/s/ Adam R. Hickey
|
|
|
|
|
|
Rick J. Mills, October 26, 2017
|
|
Adam R. Hickey, October 26, 2017
|
|
Director
|
Vice President and Chief Accounting Officer
|
|
|
/s/ Sarah E. Raiss
|
|
|
|
|
|
|
|
Sarah E. Raiss, October 26, 2017
|
|
|
|
Director
|
|
|
101
TABLE OF CONTENTS
Part IItem 1. BusinessItem 1A. Risk FactorsItem 1B. Unresolved Staff CommentsItem 2. PropertiesItem 3. Legal ProceedingsItem 4. Mine Safety DisclosurePart IIItem 5. Market For Registrant's Common Equity, Related Stockholder Matters and Issuer Purchases Of Equity SecuritiesItem 6. Selected Financial DataItem 7. Management's Discussion and Analysis Of Financial Condition and Results Of OperationsItem 7A. Quantitative and Qualitative Disclosures About Market RiskItem 8. Financial Statements and Supplementary DataNote 1. Nature Of OperationsNote 2. Summary Of Significant Accounting PoliciesNote 3. Changes in BusinessNote 4. Accumulated Other Comprehensive Income (loss)Note 5. Sales Of Accounts ReceivableNote 6. InventoriesNote 7. Goodwill and Other Intangible AssetsNote 8. Long-lived Asset Impairment and Facility Closure CostsNote 9. SeveranceNote 10. Credit ArrangementsNote 11. New Markets Tax Credit TransactionsNote 12. Derivatives and Risk ManagementNote 13. Fair ValueNote 14. Income TaxNote 15. Stock-based Compensation PlansNote 16. Capital StockNote 17. Employees' Retirement PlansNote 18. Commitments and ContingenciesNote 19. Earnings Per ShareNote 20. Accrued Expenses and Other PayablesNote 21. Business SegmentsNote 22. Quarterly Financial Data (unaudited)Note 23. Related Party TransactionsItem 9. Changes in and Disagreements with Accountants on Accounting and Financial DisclosureItem 9A. Controls and ProceduresItem 9B. Other InformationPart IIIItem 10. Directors, Executive Officers and Corporate GovernanceItem 11. Executive CompensationItem 12. Security Ownership Of Certain Beneficial Owners and Management and Related Stockholder MattersItem 13. Certain Relationships and Related Transactions, and Director IndependenceItem 14. Principal Accountant Fees and ServicesPart IVItem 15. Exhibits and Financial Statement Schedules