COMCAST CORP
10-Ks and 10-Qs
|
|
|
|
|
|
|
|
|
|
|
|
|
|
|
|
|
|
|
|
|
|
|
|
|
|
|
|
|
|
|
|
|
|
|
|
|
|
|
|
|
|
|
|
|
|
|
|
|
|
|
|
|
|
|
|
|
|
|
UNITED STATES
SECURITIES AND EXCHANGE COMMISSION
Washington, D.C. 20549
FORM 10-K
|
(Mark One)
|
|
|
x
|
ANNUAL REPORT PURSUANT TO SECTION 13 OR 15(d) OF THE SECURITIES EXCHANGE ACT OF 1934
|
|
FOR THE FISCAL YEAR ENDED DECEMBER 31, 2017
|
|
|
OR
|
|
|
c
|
TRANSITION REPORT PURSUANT TO SECTION 13 OR 15(d) OF THE SECURITIES EXCHANGE ACT OF 1934
|
|
FOR THE TRANSITION PERIOD FROM TO
|
|

|
||||
|
Commission File Number
|
|
Registrant; State of Incorporation; Address and
Telephone Number
|
|
I.R.S. Employer Identification No.
|
|
001-32871
|
|
COMCAST CORPORATION
PENNSYLVANIA
One Comcast Center
Philadelphia, PA 19103-2838
(215) 286-1700
|
|
27-0000798
|
|
001-36438
|
|
NBCUniversal Media, LLC
DELAWARE
30 Rockefeller Plaza
New York, NY 10112-0015
(212) 664-4444
|
|
14-1682529
|
|
SECURITIES REGISTERED PURSUANT TO SECTION 12(b) OF THE ACT:
|
||
|
Comcast Corporation –
|
||
|
Title of Each Class
|
|
Name of Each Exchange on Which Registered
|
|
Class A Common Stock, $0.01 par value
2.0% Exchangeable Subordinated Debentures due 2029
5.50% Notes due 2029
9.455% Guaranteed Notes due 2022
|
|
NASDAQ Global Select Market
New York Stock Exchange
New York Stock Exchange
New York Stock Exchange
|
|
NBCUniversal Media, LLC – NONE
|
||
|
SECURITIES REGISTERED PURSUANT TO SECTION 12(g) OF THE ACT:
Comcast Corporation – NONE
NBCUniversal Media, LLC – NONE
|
||
Indicate by check mark if the registrant is a well-known seasoned issuer, as defined in Rule 405 of the Securities Act.
|
Comcast Corporation
|
|
Yes
|
x
|
|
No
|
c
|
||
|
NBCUniversal Media, LLC
|
|
Yes
|
x
|
|
No
|
c
|
||
Indicate by check mark if the registrant is not required to file reports pursuant to Section 13 or Section 15(d) of the Act.
|
Comcast Corporation
|
|
Yes
|
c
|
|
No
|
x
|
||
|
NBCUniversal Media, LLC
|
|
Yes
|
c
|
|
No
|
x
|
||
Indicate by check mark whether the registrant (1) has filed all reports required to be filed by Section 13 or 15(d) of the Securities Exchange Act of 1934 during the preceding 12 months (or for such shorter period that the registrant was required to file such reports) and (2) has been subject to such filing requirements for the past 90 days.
|
Comcast Corporation
|
|
Yes
|
x
|
|
No
|
c
|
||
|
NBCUniversal Media, LLC
|
|
Yes
|
x
|
|
No
|
c
|
||
Indicate by check mark whether the registrant has submitted electronically and posted on its corporate website, if any, every Interactive Data File required to be submitted and posted pursuant to Rule 405 of Regulation S-T during the preceding 12 months (or for such shorter period that the registrant was required to submit and post such files).
|
Comcast Corporation
|
|
Yes
|
x
|
|
No
|
c
|
||
|
NBCUniversal Media, LLC
|
|
Yes
|
x
|
|
No
|
c
|
||
Indicate by check mark if disclosure of delinquent filers pursuant to Item 405 of Regulation S-K is not contained herein, and will not be contained, to the best of registrant’s knowledge, in definitive proxy or information statements incorporated by reference in Part III of this Form 10-K or any amendments to this Form 10-K
.
|
Comcast Corporation
|
|
x
|
||||||
|
NBCUniversal Media, LLC
|
|
N/A
|
||||||
Indicate by check mark whether the registrant is a large accelerated filer, an accelerated filer, a non-accelerated filer, a smaller reporting company, or an emerging growth company. See definition of “large accelerated filer,” “accelerated filer,” “smaller reporting company” and “emerging growth company” in Rule 12b-2 of the Exchange Act:
|
Comcast Corporation
|
Large accelerated filer
|
x
|
Accelerated filer
|
c
|
Non-accelerated filer
|
c
|
Smaller reporting company
|
c
|
Emerging growth company
|
c
|
|
NBCUniversal Media, LLC
|
Large accelerated filer
|
c
|
Accelerated filer
|
c
|
Non-accelerated filer
|
x
|
Smaller reporting company
|
c
|
Emerging growth company
|
c
|
If an emerging growth company, indicate by check mark whether the registrant has elected not to use the extended transition period for complying with any new or revised financial accounting standards provided pursuant to Section 13(a) of the Exchange Act.
|
Comcast Corporation
|
c
|
|||||||
|
NBCUniversal Media, LLC
|
c
|
|||||||
Indicate by check mark whether the registrant is a shell company (as defined in Rule 12b-2 of the Act).
|
Comcast Corporation
|
|
Yes
|
c
|
|
No
|
x
|
||
|
NBCUniversal Media, LLC
|
|
Yes
|
c
|
|
No
|
x
|
||
As of June 30,
2017
, the aggregate market value of the Comcast Corporation common stock held by non-affiliates of the registrant was $
181.936 billion
.
Indicate the number of shares outstanding of each of the registrant’s classes of stock, as of the latest practicable date:
As of
December 31, 2017
, there were
4,635,063,642
shares of Comcast Corporation Class A common stock and
9,444,375
shares of Class B common stock outstanding.
Not applicable for NBCUniversal Media, LLC.
NBCUniversal Media, LLC meets the conditions set forth in General Instruction I(1)(a), (b) and (d) of Form 10-K and is therefore filing this form with the reduced disclosure format.
DOCUMENTS INCORPORATED BY REFERENCE
Comcast Corporation – Part III – The registrant’s definitive Proxy Statement for its annual meeting of shareholders presently scheduled to be held in June
2018
.
NBCUniversal Media, LLC – NONE
Comcast Corporation
2017
Annual Report on Form 10-K
Table of Contents
|
PART I
|
||
|
Item 1
|
||
|
Item 1A
|
||
|
Item 1B
|
||
|
Item 2
|
||
|
Item 3
|
||
|
Item 4
|
||
|
PART II
|
||
|
Item 5
|
||
|
Item 6
|
||
|
Item 7
|
||
|
Item 7A
|
||
|
Item 8
|
||
|
Item 9
|
||
|
Item 9A
|
||
|
Item 9B
|
||
|
PART III
|
||
|
Item 10
|
||
|
Item 11
|
||
|
Item 12
|
||
|
Item 13
|
||
|
Item 14
|
||
|
PART IV
|
||
|
Item 15
|
||
|
Item 16
|
||
Explanatory Note
This Annual Report on Form 10-K is a combined report being filed separately by Comcast Corporation (“Comcast”) and NBCUniversal Media, LLC (“NBCUniversal”). Comcast owns all of the common equity interests in NBCUniversal, and NBCUniversal meets the conditions set forth in General Instruction I(1)(a), (b) and (d) of Form 10-K and is therefore filing its information within this Form 10-K with the reduced disclosure format. Each of Comcast and NBCUniversal is filing on its own behalf the information contained in this report that relates to itself, and neither company makes any representation as to information relating to the other company. Where information or an explanation is provided that is substantially the same for each company, such information or explanation has been combined in this report. Where information or an explanation is not substantially the same for each company, separate information and explanation has been provided. In addition, separate consolidated financial statements for each company, along with notes to the consolidated financial statements, are included in this report. Unless indicated otherwise, throughout this Annual Report on Form 10-K, we refer to Comcast and its consolidated subsidiaries, including NBCUniversal and its consolidated subsidiaries, as “we,” “us” and “our;” Comcast Cable Communications, LLC and its subsidiaries as “Comcast Cable;” Comcast Holdings Corporation as “Comcast Holdings;” and NBCUniversal, LLC as “NBCUniversal Holdings.”
This Annual Report on Form 10-K is for the year ended
December 31, 2017
. This Annual Report on Form 10-K modifies and supersedes documents filed before it.
The Securities and Exchange Commission (“SEC”) allows us to “incorporate by reference” information that we file with it, which means that we can disclose important information to you by referring you directly to those documents. Information incorporated by reference is considered to be part of this Annual Report on Form 10-K. In addition, information that we file with the SEC in the future will automatically update and supersede information contained in this Annual Report on Form 10-K.
Our registered trademarks include Comcast, NBCUniversal and the Comcast and NBCUniversal logos. This Annual Report on Form 10-K also contains other trademarks, service marks and trade names owned by us, as well as those owned by others.
We are a global media and technology company with two primary businesses, Comcast Cable and NBCUniversal. We were incorporated under the laws of Pennsylvania in December 2001. Through our predecessors, we have developed, managed and operated cable systems since 1963. Through transactions in 2011 and 2013, we acquired NBCUniversal.
We present our operations for Comcast Cable in one reportable business segment, referred to as Cable Communications, and our operations for NBCUniversal in four reportable business segments: Cable Networks, Broadcast Television, Filmed Entertainment and Theme Parks (collectively, the “NBCUniversal segments”).
|
•
|
Cable Communications:
Consists of the operations of Comcast Cable, which
is one of the nation’s largest providers of video, high-speed Internet, voice, and security and automation services (“cable services”) to residential customers under the Xfinity brand
;
we also provide these and other services to business customers
and sell advertising.
|
|
•
|
Cable Networks:
Consists primarily of our national cable networks that provide a variety of entertainment, news and information, and sports content,
our regional sports and news networks, our international cable networks
,
our cable television studio production operations
, and various digital properties.
|
|
•
|
Broadcast Television:
Consists primarily of the NBC and Telemundo broadcast networks,
our NBC and Telemundo owned local broadcast television stations
, the NBC Universo national cable network,
our broadcast television studio production operations
, and various digital properties.
|
|
•
|
Filmed Entertainment:
Consists primarily of the operations of Universal Pictures, which
produces, acquires, markets and distributes filmed entertainment worldwide
; our films are also produced under the Illumination, DreamWorks Animation and Focus Features names.
|
|
•
|
Theme Parks:
Consists
primarily of our Universal theme parks in Orlando, Florida; Hollywood, California; and Osaka, Japan
.
|
Our other business interests consist primarily of
Comcast Spectacor, which owns the Philadelphia Flyers and the Wells Fargo Center arena in Philadelphia, Pennsylvania and operates arena management-related businesses
, and our wireless phone service, which we launched in mid-2017.
For financial and other information about our reportable business segments, refer to Item 7: Management’s Discussion and Analysis of Financial Condition and Results of Operations, Note 17 to Comcast’s consolidated financial statements, and Note 15 to NBCUniversal’s consolidated financial statements included in this Annual Report on Form 10-K.
Available Information and Websites
Comcast’s phone number is (215) 286-1700, and its principal executive offices are located at One Comcast Center, Philadelphia, PA 19103-2838. NBCUniversal’s phone number is (212) 664-4444, and its principal executive offices are located at 30 Rockefeller Plaza, New York, NY 10112-0015. Comcast and NBCUniversal’s Annual Reports on Form 10-K, Quarterly Reports on Form 10-Q, Current Reports on Form 8-K and any amendments to such reports filed with or furnished to the SEC under Sections 13(a) or 15(d) of the Securities Exchange Act of 1934, as amended (the “Exchange Act”), are available free of charge on the SEC’s website at www.sec.gov and on Comcast’s website at www.comcastcorporation.com as soon as reasonably practicable after such reports are electronically filed with the SEC. The information posted on our websites is not incorporated into our SEC filings. The public may read and copy any materials filed with the SEC at the SEC’s Public Reference Room at 100 F Street, NE, Washington, DC 20549. The public may obtain information on the operation of the Public Reference Room by calling the SEC at 1-800-SEC-0330.
|
Comcast 2017 Annual Report on Form 10-K
|
1
|
|
Description of Our Businesses
|
Cable Communications Segment
|
||||||
|
Customer Metrics
|
||||||
|
December 31 (in millions)
|
2017
|
|
2016
|
|
2015
|
|
|
Homes and businesses passed
(a)
|
57.2
|
56.4
|
55.7
|
|||
|
Video
(b)(c)
|
||||||
|
Residential customers
|
21.3
|
21.5
|
21.4
|
|||
|
Business services customers
|
1.1
|
1.0
|
1.0
|
|||
|
Total video customers
|
22.4
|
22.5
|
22.3
|
|||
|
Penetration
(d)
|
39.1
|
%
|
39.9
|
%
|
40.1
|
%
|
|
High-speed Internet
(c)
|
||||||
|
Residential customers
|
23.9
|
22.8
|
21.6
|
|||
|
Business services customers
|
2.0
|
1.9
|
1.7
|
|||
|
Total high-speed Internet customers
|
25.9
|
24.7
|
23.3
|
|||
|
Penetration
(d)
|
45.2
|
%
|
43.8
|
%
|
41.9
|
%
|
|
Voice
|
||||||
|
Residential customers
|
10.3
|
10.5
|
10.4
|
|||
|
Business services customers
|
1.2
|
1.1
|
1.0
|
|||
|
Total voice customers
|
11.6
|
11.7
|
11.5
|
|||
|
Penetration
(d)
|
20.2
|
%
|
20.7
|
%
|
20.6
|
%
|
|
Security and automation customers
|
1.1
|
0.9
|
0.6
|
|||
|
Customer relationships
(e)
|
||||||
|
Residential customer relationships
|
27.2
|
26.5
|
25.8
|
|||
|
Business services customer relationships
|
2.2
|
2.0
|
1.9
|
|||
|
Total customer relationships
|
29.3
|
28.6
|
27.7
|
|||
|
Residential customer relationships mix
(f)
|
||||||
|
Single product customers
|
8.2
|
7.8
|
7.6
|
|||
|
Double product customers
|
9.1
|
8.8
|
8.5
|
|||
|
Triple and quad product customers
|
9.9
|
10.0
|
9.7
|
|||
Basis of Presentation: Customer metrics include our residential and business customers. All percentages are calculated based on actual amounts. Minor differences may exist due to rounding.
|
(a)
|
Homes and businesses are considered passed if we can connect them to our distribution system without further extending the transmission lines. Homes and businesses passed is estimated based on the best available information.
|
|
(b)
|
Generally, a home or business receiving video programming from our distribution system counts as one video customer. For multiple dwelling units (“MDUs”), including buildings located on college campuses, whose residents have the ability to receive additional cable services, such as additional programming choices or our high-definition video (“HD”) or digital video recorder (“DVR”) advanced services, we count and report customers based on the number of potential billable relationships within each MDU. For MDUs whose residents are not able to receive additional cable services, the MDU is counted as a single customer.
|
|
(c)
|
In 2017, we began to offer prepaid services that allow customers to prepay for at least 30 days of service. Residential video and high-speed Internet customers as of December 31, 2017 included prepaid customers totaling approximately
3,000
and
60,000
, respectively.
|
|
(d)
|
Penetration is calculated by dividing the number of customers by the number of homes and businesses passed.
|
|
(e)
|
Customer relationships represent the number of residential and business customers that subscribe to at least one of our cable services. Beginning in 2017, we include customers subscribing to our security and automation services in customer relationship information. All periods presented have been adjusted for the inclusion of security and automation customers.
|
|
(f)
|
Single product customers, double product customers, and triple and quad product customers represent residential customers that subscribe to one, two, or three and four primary services, respectively.
|
Cable Services
We offer our video, high-speed Internet, voice, and security and automation services individually and as bundled services at a discounted rate over our cable distribution system to residential and business customers. Our bundled service offerings aim to meet the needs of the various segments of our customer base, ranging from high-speed Internet services packaged with video or streaming services that include a limited number of channels, to a quad product bundle, consisting of our video, high-speed Internet, voice, and security and automation services. We also offer our wireless phone service as a component of our bundled services,
|
2
|
Comcast 2017 Annual Report on Form 10-K
|
|
which is reported in Corporate and Other. Subscription rates and related charges vary according to the services and features customers receive
and the types of equipment they use
, and customers
are typically billed in advance on a monthly basis
.
A portion of our residential customers are subject to minimum-term contracts for their cable services, which are typically 2 years in length. Substantially all of our business customers are initially under minimum-term contracts, which typically range from 2 to 5 years. Customers with minimum-term contracts may only discontinue service in accordance with the terms of their contracts.
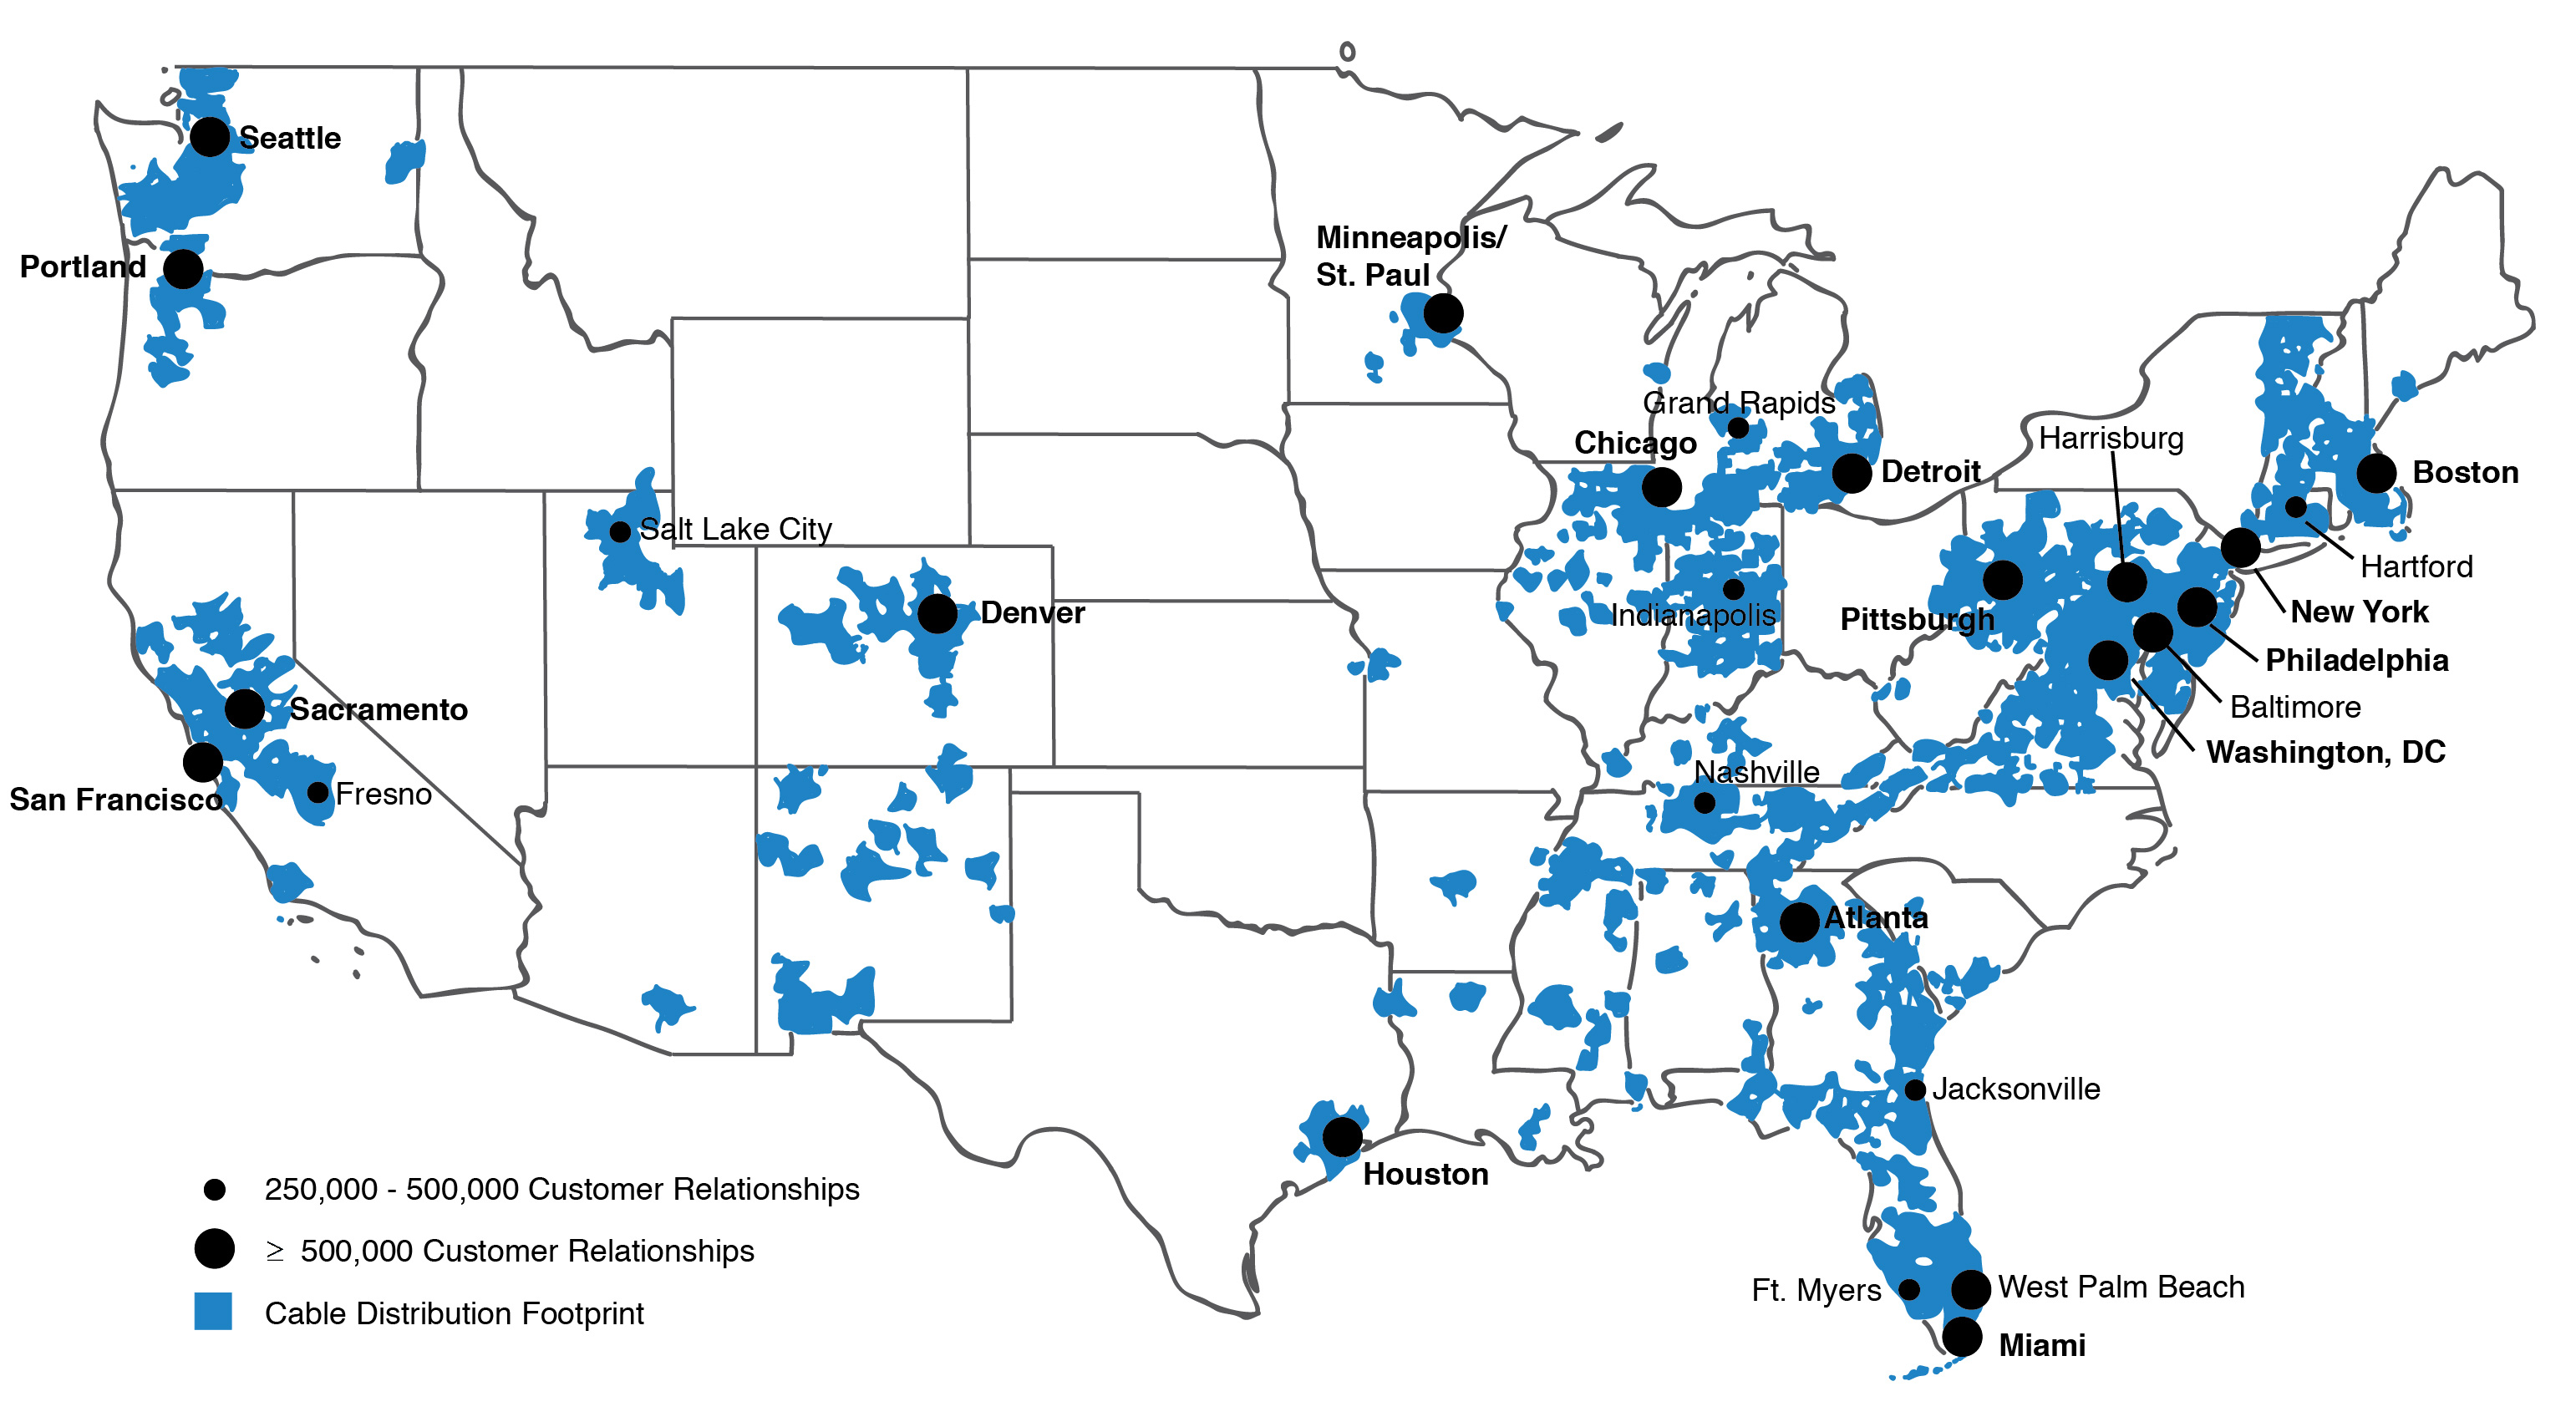
The Areas We Serve
The map below highlights our cable distribution footprint as of
December 31, 2017
and the designated market areas (“DMAs”) where we have 250,000 or more customer relationships. The locations that are bolded represent the DMAs in which we operate that were also included in the top 25 U.S. television DMAs as of
December 31, 2017
.
Video Services
We offer a broad variety of video services that provide access to hundreds of channels depending on the customer’s level of service. Our levels of service typically range from a limited basic service with access to between 20 and 40 channels to a full service with access to more than 300 channels. Our video services generally include programming provided by national broadcast networks, local broadcast stations, and national and regional cable networks, as well as government and public access programming. We also offer packages that include extensive amounts of foreign-language programming and other specialty tiers of programming with sports, family and international themes. We tailor our video services for particular programming preferences, demographics and geographic areas according to applicable local and federal regulatory requirements.
Our video customers may also subscribe to premium networks. Premium networks include networks such as HBO, Showtime, Starz and Cinemax that generally provide, without commercial interruption, movies, original programming, live and taped sporting events and concerts, and other features.
Our video services generally include access to our video on demand service (“On Demand”) and an interactive, on-screen program guide. Our On Demand service provides video customers with over 160,000 programming choices over the course of a month, including approximately 70,000 in high definition. A substantial portion of our On Demand content is available at no additional charge; other content, primarily movies and special-events programming, such as sporting events and concerts, can be rented or in some cases purchased to own digitally. We continue to increase the number of On Demand choices we offer.
Our HD service provides customers with high-resolution picture quality, improved audio quality and a wide-screen format through an HD set-top box. Our HD service includes a broad selection of HD programming choices, including major broadcast networks, national and regional cable networks, and premium networks. Our DVR service allows video customers to record and store programs
|
Comcast 2017 Annual Report on Form 10-K
|
3
|
|
and play them at whatever time is convenient. Our DVR service also provides the ability to pause and rewind live television. We refer to our HD and DVR services as “advanced services.”
Our Internet Protocol (“IP”) and cloud-enabled video platform, referred to as our X1 platform, provides customers with integrated search functionality, including the use of a voice-activated remote control, personalized recommendations and access to, and integration of content from, certain third-party Internet applications, such as Netflix and YouTube. We also offer our cloud DVR technology in substantially all of our markets. Cloud DVR technology allows our video customers to record programming via their set-top box using cloud-based servers and view those recordings on mobile devices via our mobile apps.
Certain video customers have access to streaming services through our mobile apps and online portal that allow them to view certain live programming and On Demand content and to browse program listings. Depending on the customer’s level of service, these services may require an additional monthly fee. We also launched a streaming video cable service throughout our footprint that allows our high-speed Internet customers to purchase our video cable service and stream live programming to a computer, tablet, smartphone or other device for a monthly fee.
High-Speed Internet Services
We offer high-speed Internet services with downstream speeds that range up to 1 gigabit per second (“Gbps”) and fiber-based speeds that range up to 2 Gbps. These services include access to our online portal and mobile apps, which provide email, an address book, calendars and online security features. Throughout our footprint, we are deploying wireless gateways that combine a customer’s wireless router, cable modem and voice adapter to improve the performance of multiple IP-enabled devices used at the same time within the home, provide faster Internet speeds and create an in-home Wi-Fi network. Additionally, in 2017, we launched an app allowing customers with eligible wireless gateways to personalize and manage their Wi-Fi network remotely, which includes viewing and changing their Wi-Fi password, identifying which devices are connected to their in-home network, setting parental controls and schedules, as well as other features. We are expanding our network of residential, outdoor and business Wi-Fi hotspots to allow most of our high-speed Internet customers to access our high-speed Internet services inside and outside the home. As of December 31, 2017, there were approximately 18.8 million of these hotspots.
Voice Services
We offer voice services using interconnected Voice over Internet Protocol (“VoIP”) technology. Our voice services provide either unlimited or usage-based local and domestic long-distance calling and include options for international calling plans, voicemail, voicemail transcriptions, text messaging, caller ID and call waiting. For customers with our high-speed Internet services, our voice services also include the ability to access and manage voicemail, text messaging and other account features through our online portal or mobile apps.
Business Services
We offer a variety of products and services to businesses. Our high-speed Internet services for business services customers provide downstream speeds that range up to 1 Gbps and fiber-based speeds that range up to 10 Gbps. Our small business services offerings primarily include high-speed Internet services, as well as voice and video services, similar to those that we provide to our residential customers, and also include cloud-based solutions that provide file sharing, online backup and web conferencing, among other features. We also offer Ethernet network services that connect multiple locations and provide higher downstream and upstream speed options to medium-sized customers and larger enterprises, as well as advanced voice services. In addition, we provide cellular backhaul services to mobile network operators to help these customers manage their network bandwidth.
Recently, we have expanded our enterprise service offerings to include a software-defined networking product and our managed solutions business to offer enterprise customers support related to Wi-Fi networks, router management, network security, business continuity risks and other services. We primarily offer our enterprise service offerings to Fortune 1000 companies and other large enterprises with multiple locations both within and outside of our cable distribution footprint where we have agreements with other companies to use their networks to provide coverage.
Advertising
As part of our distribution agreements with cable networks, we generally receive an allocation of scheduled advertising time on cable networks that we sell through our advertising business to local, regional and national advertisers. In most cases, the available advertising units are sold by our sales force. In some cases, we work with representation firms as an extension of our sales force to sell a portion of the advertising units allocated to us. We also represent the advertising sales efforts of other multichannel video providers in some markets. In addition, we generate revenue from the sale of advertising online and on our On Demand service.
Other
We offer security and automation services that provide home monitoring services and the ability to manage other functions within the home, such as lighting and room temperature, through our online portal or our mobile apps.
|
4
|
Comcast 2017 Annual Report on Form 10-K
|
|
Technology
Our cable distribution system uses a hybrid fiber-optic and coaxial cable network that we believe is sufficiently flexible and scalable to support our future technology requirements. This network provides the two-way transmissions that are essential to providing high-speed Internet services, interactive video services such as On Demand, voice services and security and automation services.
We continue to focus on technology initiatives to design, develop and deploy next-generation media and content delivery platforms, such as our X1 platform and related cloud DVR technology, that use IP technology and our own cloud network servers to deliver video and advanced search capabilities, including through a voice-activated remote control, and that allow access to certain third-party Internet applications.
We continue to deploy wireless gateways to improve the performance of multiple IP-enabled devices used at the same time within the home, provide faster Internet speeds and create an in-home Wi-Fi network. In addition, we continue to expand our network of residential, outdoor and business Wi-Fi hotspots.
We are deploying 1 gigabit high-speed Internet services that leverage DOCSIS 3.1 technology across our footprint and we will continue to expand the capacity of our DOCSIS 3.1 infrastructure, including the implementation of DOCSIS FDX that will enable us to launch multi-gigabit services through our existing network.
Sources of Supply
To offer our video services, we license a substantial portion of our programming from cable networks and broadcast networks, as well as from local broadcast television stations. We attempt to secure long-term programming distribution agreements with these programming providers. The fees associated with these programming distribution agreements are generally based on the number of customers who are able to watch the programming and the platforms on which we provide the content. We seek to include in our distribution agreements the rights to offer such programming through multiple delivery platforms, such as through On Demand, our online portal, our mobile apps and our streaming services.
For our high-speed Internet services, we license software products, such as email and security software, and content, such as news feeds for our online portal, from a variety of suppliers. Under our contracts with these suppliers, we generally pay on a fixed-fee basis, on a per subscriber basis in the case of software product licenses or on a video advertising revenue share basis in the case of content licenses.
For our voice services, we license software products such as voicemail and text messaging from a variety of suppliers under multiyear contracts. The fees we pay are generally based on the consumption of the related services.
We purchase from a limited number of suppliers a significant number of set-top boxes and certain other customer premise equipment, network equipment and services to provide our cable services to residential and business customers.
We use two primary vendors to provide customer billing for our cable services to our residential and business customers.
Customer and Technical Services
Our customer service call centers provide 24/7 call-answering capability, telemarketing and other services. Our technical services group performs various tasks, including installations, plant maintenance and upgrades to our cable distribution system.
Sales and Marketing
We offer our services directly to residential and business customers through our customer service call centers, our retail stores and customer service centers, our websites, door-to-door selling, telemarketing, and third-party outlets, as well as through advertising via direct mail, television and the Internet.
|
NBCUniversal Segments
|
Cable Networks
Our Cable Networks segment consists of a diversified portfolio of our national cable networks that provide a variety of entertainment, news and information, and sports content,
our regional sports and news networks, our international cable networks
, and
our cable television studio production operations
. We also own various digital properties, which include brand-aligned websites.
|
Comcast 2017 Annual Report on Form 10-K
|
5
|
|
The table below presents a summary of our national cable networks and their advertising reach to U.S. households.
|
Cable Network
|
Approximate U.S.
Households as of
December 31, 2017
(in millions)
(a)
|
|
Description of Programming
|
|
USA Network
|
91
|
|
General entertainment
|
|
E!
|
89
|
|
Entertainment and pop culture
|
|
Syfy
|
89
|
|
Imagination-based entertainment
|
|
MSNBC
|
89
|
|
News and information
|
|
CNBC
|
87
|
|
Business and financial news
|
|
Bravo
|
87
|
|
Entertainment, culture and arts
|
|
NBC Sports Network
|
84
|
|
Sports
|
|
Oxygen
|
74
|
|
Crime, mystery and suspense for women
|
|
Golf Channel
|
73
|
|
Golf competition and golf entertainment
|
|
Universal Kids
|
58
|
|
Children’s entertainment
|
|
CNBC World
|
34
|
|
Global financial news
|
|
The Olympic Channel
|
25
|
|
Olympic sports events and Olympic-themed original content
|
|
(a)
|
Household data is based on The Nielsen Company’s January 2018 report, which is derived from information available during the period from November 27, 2017 through December 25, 2017, except for The Olympic Channel, which is derived from information provided by multichannel video providers. The Nielsen report now includes estimates based on subscribers to both traditional and certain virtual multichannel video providers. The Nielsen report is not based on information provided by us and is included solely to permit comparisons between our cable networks and those operated by our peers.
|
Our regional sports and news networks together serve more than 28 million households across the United States, including in markets such as Baltimore/Washington, Boston, Chicago, Philadelphia, Portland, Sacramento and San Francisco.
We market and distribute our cable network programming in the United States and internationally to multichannel video providers, including both traditional providers of linear programming and virtual providers who provide streaming services for linear programming. We also market and distribute our cable network programming to subscription video on demand services, such as those offered by Amazon, Hulu and Netflix. These distributors may provide our content on television, including via video on demand services, online and through mobile apps.
Our cable networks produce their own programs or acquire the rights to programming from third parties, including sports programming rights that are discussed below under the heading “Broadcast Television.” Our cable television studio production operations identify, develop and produce original content for our cable networks and third parties. We license our owned content, including programming from our cable network production operations, to cable and broadcast networks and subscription video on demand services. We also sell our owned content on standard-definition DVDs and Blu-ray discs (together, “DVDs”) and through digital distribution services such as iTunes.
Broadcast Television
Our Broadcast Television segment operates the NBC and Telemundo broadcast networks, which together serve viewers and advertisers in all 50 states. Our Broadcast Television segment also includes our owned NBC and Telemundo local broadcast television stations,
the NBC Universo national cable network
,
our broadcast television studio production operations
, and
our various digital properties
, which primarily include brand-aligned websites.
NBC Network
The NBC network distributes entertainment, news and sports programming that reaches viewers in virtually all U.S. television households through more than 200 affiliated stations across the United States, including our 11 owned NBC-affiliated local broadcast television stations. The NBC network’s programming library consists of rights of varying nature to more than 100,000 episodes of popular television content, including current and classic titles, unscripted programming, sports, news, long-form and short-form programming, and locally produced programming from around the world.
The NBC network produces its own programs or acquires the rights to programming from third parties. NBCUniversal has various contractual commitments for the licensing of rights to multiyear programming, primarily sports programming. Our most significant sports programming commitments include the U.S. broadcast rights for the summer and winter Olympic Games through 2032 and agreements with the NFL to produce and broadcast a specified number of regular season and playoff games, including
Thursday Night Football
through the 2017-18 season,
Sunday Night Football
through the 2022-23 season
and two Super Bowl games, the first of which is in 2018. We also have U.S. broadcast rights to a specified number of NHL games through the 2020-21 season,
|
6
|
Comcast 2017 Annual Report on Form 10-K
|
|
English Premier League soccer through the 2021-22 season, certain NASCAR events through 2024 and certain PGA TOUR and other golf events through 2030. NBCUniversal’s sports programming agreements also include the rights to distribute content on our national cable networks, including the NBC Sports Network and Golf Channel, on our regional sports networks, and online, including through our mobile apps.
Our broadcast television studio production operations develop and produce original content, including scripted and unscripted programming series and talk shows. This original content is licensed to broadcast networks, cable networks and local broadcast television stations owned by us and third parties, as well as to subscription video on demand services, and it is sold on DVDs and through digital distribution services both in the United States and internationally. We also produce first-run syndicated shows for local markets that are broadcast on local broadcast television stations in the United States on a market-by-market basis. We currently distribute some of our television programs after their initial broadcast, as well as older television programs from our library, to local broadcast television stations and cable networks in the off-network syndication market.
NBC Local Broadcast Television Stations
As of
December 31, 2017
, we owned and operated 11 NBC-affiliated local broadcast television stations that collectively reached approximately 32 million U.S. television households, which represent approximately 29% of U.S. television households. In addition to broadcasting the NBC network’s national programming, our local broadcast television stations produce news, sports, public affairs and other programming that addresses local needs and acquire syndicated programming from other sources. The table below presents a summary of the NBC-affiliated local broadcast television stations that we owned and operated as of
December 31, 2017
.
|
DMA Served
(a)
|
Station
|
General Market Rank
(b)
|
|
Percentage of U.S.
Television Households
(c)
|
|
|
New York, NY
|
WNBC
|
1
|
|
6
|
%
|
|
Los Angeles, CA
|
KNBC
|
2
|
|
5
|
%
|
|
Chicago, IL
|
WMAQ
|
3
|
|
3
|
%
|
|
Philadelphia, PA
|
WCAU
|
4
|
|
3
|
%
|
|
Dallas-Fort Worth, TX
|
KXAS
|
5
|
|
2
|
%
|
|
Washington, D.C.
|
WRC
|
6
|
|
2
|
%
|
|
San Francisco-Oakland-San Jose, CA
|
KNTV
|
8
|
|
2
|
%
|
|
Boston, MA
|
WBTS
|
10
|
|
2
|
%
|
|
Miami-Ft. Lauderdale, FL
|
WTVJ
|
16
|
|
1
|
%
|
|
San Diego, CA
|
KNSD
|
29
|
|
1
|
%
|
|
Hartford, CT
|
WVIT
|
32
|
|
1
|
%
|
|
(a)
|
DMA served is defined by Nielsen Media Research as a geographic market for the sale of national spot and local advertising time.
|
|
(b)
|
General market rank is based on the relative size of the DMA among the 210 generally recognized DMAs in the United States based on Nielsen estimates for the 2017-18 season.
|
|
(c)
|
Based on Nielsen estimates for the 2017-18 season. The percentage of U.S. television households does not reflect the calculation of national audience reach under the Federal Communications Commission’s (“FCC”) national television ownership cap limits. See “Legislation and Regulation — Broadcast Television — Ownership Limits — National Television Ownership.”
|
Telemundo
Telemundo is a leading Hispanic media company that produces, acquires and distributes Spanish-language content in the United States and internationally. Telemundo’s operations include the Telemundo network, its 18 owned local broadcast television stations and the NBC Universo national cable network.
The Telemundo network is a leading Spanish-language broadcast network featuring original telenovelas, movies, news, specials and sporting events. Telemundo develops original programming primarily through its production studio and also acquires the rights to programming from third parties. It holds the Spanish-language U.S. broadcast rights to FIFA World Cup soccer through 2026 and the Spanish-language U.S. broadcast rights for certain NFL games that the NBC network will broadcast through the 2022-23 season.
|
Comcast 2017 Annual Report on Form 10-K
|
7
|
|
Telemundo Local Broadcast Television Stations
As of
December 31, 2017
, Telemundo owned 18 local broadcast television stations, including 17 local broadcast television stations affiliated with the Telemundo network, which collectively reached approximately 60% of U.S. Hispanic television households as of
December 31, 2017
, and an independent television station in Puerto Rico. The table below presents a summary of these local broadcast television stations.
|
DMA Served
(a)
|
Station
|
Hispanic Market Rank
(b)
|
|
Percentage of U.S.
Hispanic Television
Households
(c)
|
|
|
Los Angeles, CA
|
KVEA
|
1
|
|
13
|
%
|
|
New York, NY
|
WNJU
|
2
|
|
9
|
%
|
|
Miami-Ft. Lauderdale, FL
|
WSCV
|
3
|
|
5
|
%
|
|
Houston, TX
|
KTMD
|
4
|
|
5
|
%
|
|
Dallas-Fort Worth, TX
|
KXTX
|
5
|
|
4
|
%
|
|
Chicago, IL
|
WSNS
|
6
|
|
3
|
%
|
|
San Antonio, TX
|
KVDA
|
7
|
|
3
|
%
|
|
San Francisco-Oakland-San Jose, CA
|
KSTS
|
8
|
|
3
|
%
|
|
Phoenix, AZ
|
KTAZ
|
9
|
|
3
|
%
|
|
Harlingen-Brownsville-McAllen, TX
|
KTLM
|
10
|
|
2
|
%
|
|
Fresno-Visalia, CA
|
KNSO
(d)
|
13
|
|
2
|
%
|
|
Philadelphia, PA
|
WWSI
|
15
|
|
2
|
%
|
|
San Diego, CA
|
ONSD
|
17
|
|
2
|
%
|
|
Denver, CO
|
KDEN
|
19
|
|
2
|
%
|
|
Boston, MA
|
WNEU
|
21
|
|
1
|
%
|
|
Las Vegas, NV
|
KBLR
|
24
|
|
1
|
%
|
|
Tucson, AZ
|
KHRR
|
26
|
|
1
|
%
|
|
Puerto Rico
|
WKAQ
|
N/A
|
|
N/A
|
|
|
(a)
|
DMA served is defined by Nielsen Media Research as a geographic market for the sale of national spot and local advertising time.
|
|
(b)
|
Hispanic market rank is based on the relative size of the DMA among approximately 15 million U.S. Hispanic households based on Nielsen estimates for the 2017-18 season.
|
|
(c)
|
Based on Nielsen estimates for the 2017-18 season. The percentage of U.S. Hispanic television households does not reflect the calculation of national audience reach under the FCC’s national television ownership cap limits. See “Legislation and Regulation — Broadcast Television — Ownership Limits — National Television Ownership.”
|
|
(d)
|
Operated by a third party that provides certain non-network programming and operations services under a time brokerage agreement.
|
Filmed Entertainment
Our Filmed Entertainment segment primarily
produces, acquires, markets and distributes filmed entertainment worldwide
. We also generate revenue from Fandango, our movie ticketing and entertainment business, the sale of consumer products, the production and licensing of live stage plays, and the distribution of filmed entertainment produced by third parties.
We produce films both on our own and jointly with other studios or production companies, as well as with other entities. Our films are produced primarily under the Universal Pictures, Illumination, DreamWorks Animation and Focus Features names. Our films are marketed and distributed worldwide primarily through our own marketing and distribution operations. We also acquire distribution rights to films produced by others, which may be limited to particular geographic regions, specific forms of media or certain periods of time. Our content includes theatrical films, direct-to-video movies and our film library, which is comprised of more than 5,000 movies in a variety of genres.
We have entered into, and may continue to enter into, film cofinancing arrangements with third parties, including both studio and nonstudio entities, to jointly finance or distribute certain of our film productions. These arrangements can take various forms, but in most cases involve the grant of an economic interest in a film to an investor. Investors generally assume the full risks and rewards of ownership proportionate to their ownership in the film.
The majority of our produced and acquired films are initially distributed for exhibition in movie theaters. After their release in movie theaters, we sell and license our films through various methods. We distribute our films globally by selling them on DVDs to retail stores, rental kiosks and subscription by mail services and by selling them through digital distribution services and video on demand services provided by multichannel video providers, including our Cable Communications segment. We also license our films, including selections from our film library, to cable, broadcast and premium networks, to subscription video on demand
|
8
|
Comcast 2017 Annual Report on Form 10-K
|
|
services, and to video on demand and pay-per-view services. The number of films that we license through subscription video on demand services is increasing as consumers continue to seek additional ways to view our content.
Theme Parks
Our Theme Parks segment consists primarily of our Universal theme parks in Orlando, Florida; Hollywood, California; and Osaka, Japan. Universal Orlando includes two theme parks, Universal Studios Florida and Universal’s Islands of Adventure, our water park, Volcano Bay, which opened in May 2017, as well as Universal CityWalk Orlando, a dining, retail and entertainment complex. Universal Orlando also features on-site themed hotels in which we own a noncontrolling interest. Our Universal theme park in Hollywood, California consists primarily of Universal Studios Hollywood, as well as Universal CityWalk Hollywood. Our Universal theme park in Osaka, Japan consists primarily of Universal Studios Japan. We continue to expand our theme parks business internationally, such as through our plans to develop a Universal theme park in Beijing, China along with a consortium of Chinese state-owned companies. In addition, we license the right to use the Universal Studios brand name and other intellectual property, and also provide other services, to third parties that own and operate the Universal Studios Singapore theme park on Sentosa Island, Singapore.
Our Theme Parks segment licenses the right to use a substantial amount of intellectual property from third parties for its themed elements in rides, attractions and merchandising.
|
Corporate and Other
|
Our other business interests consist primarily of the operations of
Comcast Spectacor, which owns the Philadelphia Flyers and the Wells Fargo Center arena in Philadelphia, Pennsylvania and operates arena management-related businesses
.
We are also pursuing other business development initiatives, such as our
wireless phone service that we launched in the second quarter of 2017
using our virtual network operator rights to provide the service over Verizon’s wireless network and our existing network of in-home and outdoor Wi-Fi hotspots. We offer the wireless phone service only as part of our bundled service offerings to residential customers that subscribe to our high-speed Internet service within our cable distribution footprint and may in the future also offer wireless phone service to our small business customers on similar terms. The wireless phone service has success-based working capital requirements, primarily associated with the procurement of handsets, which customers are able to pay for upfront or finance interest-free over 24 months, and other equipment.
Competition
All of our businesses operate in intensely competitive, consumer-driven and rapidly changing environments and compete with a growing number of companies that provide a broad range of communications products and services, and entertainment, news and information products and services, to consumers. Technological changes are further intensifying and complicating the competitive landscape and challenging existing business models. In particular, consumers are increasingly turning to online sources for viewing and purchasing content, which has and likely will continue to reduce the number of our video customers and subscribers to our cable networks even as it makes our high-speed Internet services more valuable to consumers. In addition, the increasing number of entertainment choices available has intensified audience fragmentation, which has and likely will continue to adversely affect the audience ratings of our cable networks and broadcast television programming.
|
Cable Communications Segment
|
Competition for our cable services consists primarily of direct broadcast satellite (“DBS”) providers, which have a national footprint and compete in all of our service areas, and phone companies with fiber-based networks, which overlap approximately 60% of our service areas and are continuing to expand the areas they serve. Many of these competitors offer features, pricing and packaging for these services, individually and in bundles, comparable to what we offer, and some of these traditional competitors also offer smaller online-only video packages. Many of these competitors also have significant financial resources. AT&T, which owns DIRECTV, announced in 2016 a proposed merger with Time Warner Inc., a media and entertainment company, which competes with our NBCUniversal businesses.
Current and future wireless Internet services, such as 3G, 4G and 5G wireless broadband services and Wi-Fi networks, may compete with our high-speed Internet services, and our voice services are facing increased competition as customers replace wireline phones with wireless phones and Internet-based phone services such as Skype.
There also continue to be new companies, some with significant financial resources, that offer or are seeking to offer services that potentially may compete with some or all of our cable services. For example, companies continue to emerge that provide Internet
|
Comcast 2017 Annual Report on Form 10-K
|
9
|
|
streaming and downloading of video programming, some of which charge no fee or a lower fee than our traditional video packages. Additionally, Google has launched high-speed Internet and video services in a limited number of areas in which we operate.
Video Services
We compete with a number of different sources that provide news, sports, information and entertainment programming to consumers, including:
|
•
|
DBS providers, including AT&T’s DIRECTV and DISH Network, that transmit satellite signals to substantially all U.S. households to provide video programming and other information similar to our video services
|
|
•
|
phone companies, including AT&T and Verizon, that have built and continue to build fiber-based networks that provide cable services similar to ours, which overlap a substantial portion of our service areas, and that in some cases offer bundled offerings that include wireless phone services
|
|
•
|
online video distributors including:
|
|
◦
|
virtual multichannel video providers who offer streaming services for linear programming that generally involve smaller packages of programming networks at prices lower than our traditional video service package offerings
|
|
◦
|
subscription video on demand services, such as those offered by Amazon, Hulu and Netflix, that offer online services and devices that enable Internet streaming and downloading of movies, television shows and other video programming
|
|
◦
|
premium, cable and broadcast networks that provide content directly to consumers
|
|
•
|
other providers that build and operate wireline communications systems in the same communities that we serve, including those operating as franchised cable operators
|
|
•
|
satellite master antenna television systems that offer to their subscribers both improved reception of local broadcast television stations and much of the programming offered by our cable systems and generally serve MDUs, office complexes and residential developments
|
|
•
|
other companies, such as local broadcast television stations, that provide multiple channels of free over-the-air programming, as well as video rental services and home entertainment and gaming products
|
High-Speed Internet Services
We compete with a number of companies offering Internet services, including:
|
•
|
wireline phone companies and other providers of wireline Internet service
|
|
•
|
wireless phone companies and other providers of wireless Internet service
|
|
•
|
municipal broadband networks and power companies
|
|
•
|
satellite broadband providers
|
Phone companies such as AT&T, CenturyLink, Frontier and Verizon have built and are continuing to build fiber-based network infrastructure farther into their networks, which allows them to provide data transmission speeds that exceed those that can be provided with traditional digital subscriber line (“DSL”) technology, and are offering these higher-speed services in many of our service areas. Certain companies that offer DSL service have increased data transmission speeds, lowered prices or created bundled services to compete with our high-speed Internet services.
Google has launched a fiber-to-the-home network that provides high-speed Internet services in a limited number of areas in which we operate, and certain municipalities in our service areas are also building fiber-based networks.
Various wireless companies are offering Internet services using a variety of network types, including 3G and 4G, and in the near future 5G, wireless broadband services and Wi-Fi networks. These networks work with devices such as smartphones, laptops, tablets and mobile wireless routers, as well as wireless data cards. A growing number of commercial venues, such as retail malls, restaurants and airports, also offer Wi-Fi service. Numerous local governments are also considering or actively pursuing publicly subsidized Wi-Fi and other Internet access networks. The availability of these wireless offerings could negatively impact the demand for our high-speed Internet services.
Voice Services
Our voice services compete with wireline and wireless phone companies, including incumbent local exchange carriers (“ILECs”) and competitive local exchange carriers (“CLECs”), and other Internet-based and VoIP service providers. Certain phone companies,
|
10
|
Comcast 2017 Annual Report on Form 10-K
|
|
such as the ILECs AT&T and Verizon, have longstanding customer relationships, and extensive existing facilities and network rights-of-way. A few CLECs also have existing local networks and significant financial resources. In addition, we are increasingly competing with other phone service providers as customers replace traditional wireline phone services with wireless and Internet-based phone services.
Business Services
Our business services primarily compete with a variety of phone companies, including ILECs and CLECs. These companies either operate their own network infrastructure or use all or part of another carrier’s network. We also compete with satellite operators who offer video services to businesses.
|
NBCUniversal Segments
|
Cable Networks and Broadcast Television
Our cable networks, broadcast networks and owned local broadcast television stations compete for viewers’ attention and audience share with all forms of programming provided to viewers, including cable, broadcast and premium networks; subscription video on demand services; local broadcast television stations; home entertainment products; pay-per-view and video on demand services; online activities, such as social networking and viewing user-generated content; gaming products; and other forms of entertainment, news and information.
Our cable networks, broadcast networks and owned local broadcast television stations compete for the acquisition of programming and for on-air and creative talent with other cable and broadcast networks, local television stations, and subscription video on demand services. The market for programming is very competitive, particularly for sports programming, where the cost for such programming is significant.
Our cable networks compete with other cable networks and programming providers for carriage of their programming by traditional and virtual multichannel video providers and subscription video on demand services. Our broadcast networks compete with the other broadcast networks in markets across the United States to secure affiliations with independently owned television stations, which are necessary to ensure the effective distribution of broadcast network programming to a nationwide audience.
In addition, our cable television and broadcast television studio production operations compete with other production companies and creators of content for the acquisition of story properties, for creative, performing and technical personnel, and for distribution of, and consumer interest in, their content.
Filmed Entertainment
Our filmed entertainment business competes for audiences for its films and other entertainment content with other major studios and, to a lesser extent, with independent film producers, as well as with alternative forms of entertainment. Our competitive position primarily depends on the number of films we produce, their distribution and marketing success, and consumer response. Our filmed entertainment business also competes to obtain creative, performing and technical talent, including writers, actors, directors and producers, as well as scripts for films. Our filmed entertainment business also competes with the other major studios and other producers of entertainment content for the exhibition of its films in theaters and the distribution of its films on premium networks and on subscription video on demand services.
Theme Parks
Our theme parks business competes with other multi-park entertainment companies. We also compete with other providers of entertainment, lodging, tourism and recreational activities. To help maintain the competitiveness of our theme parks, we have invested and continue to invest in existing and new theme park attractions, hotels and infrastructure.
|
Advertising
|
Our cable communications business, cable networks, broadcast networks and owned local broadcast television stations compete for the sale of advertising with other television networks and stations, as well as with all other advertising platforms, such as digital, radio and print media. The willingness of advertisers to purchase advertising from us may be adversely affected by lower audience ratings at our cable networks, broadcast networks and owned local broadcast television stations. Declines in audience ratings also can be caused by increased competition for the leisure time of viewers and by audience fragmentation resulting from the increasing number of entertainment choices available, including content from subscription video on demand services and other online sources. In addition, advertising revenue is adversely affected by the growing use of technologies, such as DVRs and video on demand services, that give consumers greater flexibility to watch programming on a time-delayed or on-demand basis or to fast-forward or skip advertisements within programming.
|
Comcast 2017 Annual Report on Form 10-K
|
11
|
|
Seasonality and Cyclicality
Each of our businesses is subject to seasonal and cyclical variations. See Item 7: Management’s Discussion and Analysis of Financial Condition and Results of Operations and refer to the “Seasonality and Cyclicality” discussion within that section for additional information.
Legislation and Regulation
The Communications Act of 1934, as amended (the “Communications Act”), and FCC regulations and policies affect significant aspects of our businesses. Our businesses are also subject to other regulation by federal, state, local and foreign authorities and to agreements we enter into with local cable franchising authorities. In addition, we must comply with provisions of the consent decree entered into in connection with the acquisition of NBCUniversal (the “NBCUniversal Consent Decree”) in September 2011, which is scheduled to expire in September 2018. The conditions and commitments pursuant to the FCC Order approving the NBCUniversal transaction (“NBCUniversal Order”) expired in January 2018.
Legislators and regulators at all levels of government frequently consider changing, and sometimes do change, existing statutes, rules or regulations, or interpretations of existing statutes, rules or regulations, or prescribe new ones, any of which may significantly affect our businesses. The FCC and certain states have been active in considering rulemakings and legislation, and they, along with some state attorney generals, have also been active in conducting inquiries and reviews, regarding our services. Any future legislative, judicial, regulatory or administrative actions may increase our costs or impose additional restrictions on our businesses, some of which may be significant. Congress may consider proposals to address communications issues, including whether it should rewrite the entire Communications Act to account for changes in the communications marketplace, whether it should overrule the FCC’s action in 2017 repealing regulation of our broadband Internet access service under Title II of the Communications Act, whether it should enact new, permanent open Internet requirements, and whether it should fund new broadband infrastructure. We are unable to predict the effects of any of these or any other further legislative requirements on our businesses.
The following paragraphs summarize material existing and potential future legal and regulatory requirements affecting our businesses, although reference should be made to the Communications Act, FCC regulations, the NBCUniversal Consent Decree and other legislation and regulations for further information.
|
Cable Communications Segment
|
Video Services
Program Carriage
Cable operators and other multichannel video programming distributors (“MVPDs”) are prohibited from requiring as a condition of carriage a financial interest in, or exclusive distribution rights for, a video programming network. In addition, FCC regulations prohibit us from unreasonably restraining the ability of an unaffiliated video programming network to compete fairly by discriminating against the network on the basis of its non-affiliation in the selection, terms or conditions for its carriage. We have been involved in program carriage disputes at the FCC and may be subject to new complaints in the future.
Must-Carry/Retransmission Consent
Cable operators are required to carry, without compensation, programming transmitted by most local commercial and noncommercial broadcast television stations. As an alternative to this “must-carry” requirement, local broadcast television stations may choose to negotiate with the cable operator for “retransmission consent,” under which the station gives up its must-carry rights and instead seeks to negotiate a carriage agreement with the cable operator, which frequently will involve payments to the station. We currently pay certain local broadcast television stations in exchange for their required consent for the retransmission of the stations’ broadcast programming to our video services customers and expect to continue to be subject to demands for increased payments and other concessions from local broadcast television stations. In late 2017, the FCC adopted an order relaxing the broadcast media ownership rules and is considering additional revisions to the rules, which could lead to further broadcast television station consolidation. The FCC also adopted an order authorizing voluntary implementation of a new broadcast technical standard that permits broadcasters to seek carriage of signals using the new standard through retransmission consent. Together, these actions may impact retransmission consent negotiations and the fees we pay broadcasters. For information on must-carry and retransmission consent issues relating to our broadcast television business, see “NBCUniversal Segments - Broadcast Television” below and refer to the “Must-Carry/Retransmission Consent” discussion within that section.
|
12
|
Comcast 2017 Annual Report on Form 10-K
|
|
Pricing and Packaging
The FCC’s rate regulations create a presumption that all local communities are subject to effective competition and should no longer be subject to rate regulation that limits prices cable operators may charge for basic video service, equipment and installation. The FCC has accepted a certification from a Massachusetts franchising authority that demonstrated an absence of effective competition in a number of the communities we serve in Massachusetts, allowing for continued rate regulation in those communities. All of the other areas we serve have unregulated prices. In addition to the FCC’s rate regulation rules, certain state entities monitor and may challenge the marketing and advertising of our services. For example, in 2016, the Washington State Attorney General filed a lawsuit, currently being litigated in state court, alleging that our service protection plan, an optional plan that protects customers from incurring charges for service visits to diagnose and repair installed in-home wiring for residential cable services, violates state consumer protection laws.
Pole Attachments
The FCC regulates the rates, terms and conditions that most pole-owning utility companies charge cable operators and telecommunications carriers for allowing attachments to their poles. States are permitted to preempt FCC jurisdiction and regulate the rates, terms and conditions of attachments themselves, and many states in which we operate have done so. Most of these states have generally followed the FCC’s pole attachment rate standards, which set rates for telecommunications service pole attachments to levels at or near the rates for cable service attachments. Some municipalities have enacted “one-touch” make-ready pole attachment ordinances, which permit third parties to alter components of our network attached to utility poles in ways that could adversely affect our businesses. One of these ordinances in a state that has preempted FCC jurisdiction has been upheld by a federal district court in a challenge brought by another provider, but another ordinance in a state that did not preempt FCC jurisdiction has been vacated by a federal district court in a challenge brought by us as inconsistent with the FCC’s pole attachment rules. In 2017, the FCC initiated a rulemaking that considers amending its pole attachment rules to permit a “one-touch” like make-ready process for the poles within its jurisdiction. If adopted, these rules could have a similar effect as the municipal one-touch make-ready ordinances and adversely affect our businesses.
Franchising
Cable operators generally operate their cable systems under nonexclusive franchises granted by local or state franchising authorities. While the terms and conditions of franchises vary materially from jurisdiction to jurisdiction, franchises typically last for a fixed term, obligate the franchisee to pay franchise fees and meet service quality, customer service and other requirements, and are terminable if the franchisee fails to comply with material provisions. Franchising authorities also may establish reasonable requirements for public, educational and governmental access programming, and some of our franchises require substantial channel capacity and financial support for this programming. The Communications Act also contains provisions governing the franchising process, including renewal procedures designed to protect incumbent franchisees against arbitrary denials of renewal, including unreasonable renewal conditions. We believe that our franchise renewal prospects are generally favorable but cannot guarantee the future renewal of any individual franchise.
Approximately half of the states in which we operate provide for statewide franchising or have simplified local franchising requirements for new entrants. Some allow new entrants to operate on more favorable terms than our current operations, for instance by not requiring that the new entrant provide service to all parts of the franchise area or permitting the new entrant to designate only those portions it wishes to serve. Certain states allow incumbent cable operators such as us to opt in to the new state franchise immediately or later when a competing state franchise has been issued, although even in those states, incumbent cable operators may be required to retain certain franchise obligations that are more burdensome than the new entrant’s state franchise.
High-Speed Internet Services
We provide high-speed Internet services to our customers. Many of these services are subject to a number of regulatory obligations described below. As an Internet service provider (“ISP”), we are also subject to a requirement to implement certain network capabilities to assist law enforcement in conducting surveillance of persons suspected of criminal activity. From time to time, the FCC considers imposing new regulatory obligations on ISPs. New broadband regulations, if adopted, may have adverse effects on our businesses.
Open Internet Regulations
We have committed to be bound by “open Internet” regulations enacted by the FCC in 2010 as a condition of the NBCUniversal Consent Decree until September 2018, even though some of the rules were subsequently overturned on appeal. As a result, we are prohibited from blocking access to lawful Internet content, applications, services or non-harmful devices and unreasonably discriminating in the transmission of lawful Internet traffic. In addition, under the FCC’s 2010 transparency rule that was upheld on appeal, we are required to disclose our network management practices, performance and commercial terms of our Internet services. In addition to the commitments made as part of the NBCUniversal acquisition, we have publicly committed to not block, throttle, or discriminate against lawful Internet traffic and to be transparent with our customers about our Open Internet practices.
|
Comcast 2017 Annual Report on Form 10-K
|
13
|
|
In 2015, the FCC reclassified broadband Internet access service as a “telecommunications service” subject to new open Internet regulations and certain common carrier regulations under Title II of the Communications Act. These included, among other things, prohibiting ISPs from blocking access to lawful content; impairing or degrading lawful Internet traffic on the basis of content, applications or services (“throttling”); prioritizing certain Internet traffic in exchange for consideration (“paid prioritization”); and generally prohibiting ISPs from unreasonably interfering with or unreasonably disadvantaging consumers’ ability to access and use the lawful Internet content, applications, services or devices of their choosing or edge providers’ ability to make lawful content, applications, services or devices available to consumers (“general conduct”).
In December 2017, the FCC adopted an Order eliminating Title II regulation of broadband Internet access service, as well as its prior no-blocking, no-throttling, no paid-prioritization and general conduct rules, stating that jurisdiction to regulate ISP conduct would rest at the FTC. In addition, the Order revised the transparency rule to require ISPs to disclose any blocking and throttling practices, and any paid prioritization practices associated with their broadband offerings; the FCC retained authority to enforce compliance with the transparency rule. Accordingly, after the Order goes into effect, ISP conduct will be subject to review by the FTC; the FTC will be able to enforce the public commitments we have made to not block, throttle or discriminate against lawful Internet traffic; and the FCC will enforce compliance with its new transparency rule. The Order also preempted any state and local laws and regulations that conflict with the FCC’s deregulatory policies. Certain parties have already indicated they intend to appeal the FCC’s Order in federal court. In addition, Congress may consider legislation addressing these regulations and the classification of broadband Internet access services and legislators in numerous states have stated that they will introduce legislation to impose Open Internet protections in a variety of ways. We cannot predict whether or how the rules might be changed, the impact of potential new legislation or the outcome of any litigation.
Broadband Deployment/Infrastructure Initiatives
In 2017, the FCC initiated proceedings intended to remove barriers to deploying next-generation wireless and wireline broadband infrastructure. These proceedings may result in changes to the FCC’s rules related to the deployment of broadband infrastructure, as well as preemption of any state and local laws or regulations that may unreasonably impede the deployment of broadband infrastructure. We cannot predict whether or how any FCC rules might be changed, how state or local laws or regulations may be impacted or how such changes may affect our business.
NBCUniversal Consent Decree
The NBCUniversal Consent Decree includes various conditions requiring us to maintain a broadband Internet access service of at least 12 Mbps downstream across most of our footprint, and to avoid discrimination in how we treat “specialized services” (defined as services we provide over the same last-mile facilities as our broadband Internet access service, but not including our broadband Internet access service, video services or voice services).
Municipally Owned Broadband Networks
A number of local municipalities operate municipally owned broadband networks and there may be further efforts by local governments to expand or create government-owned networks. Certain states have enacted laws that restrict or prohibit local municipalities from operating municipally owned broadband networks, and there may be efforts in other state legislatures to restrict the development of government-owned networks, although some may choose to ease or facilitate such networks. In addition, as part of any federal infrastructure program, governmental subsidies or funding of additional Internet broadband networks may be encouraged. We cannot predict how successful those efforts will be and how they might affect our business.
Voice Services
We provide voice services using VoIP technology. The FCC has adopted a number of regulations for providers of nontraditional voice services such as ours, including regulations relating to privacy of customer proprietary network information, local number portability duties and benefits, disability access, E911, law enforcement assistance, outage reporting, Universal Service Fund contribution obligations, rural call completion, back-up power, service discontinuance and certain regulatory filing requirements. The FCC has not yet ruled on whether VoIP services such as ours should be classified as an “information service” or a “telecommunications service” under the Communications Act. The classification determination is important because telecommunications services are regulated more extensively than information services. State regulatory commissions and legislatures may continue to investigate imposing regulatory requirements on our voice services as long as the regulatory classification of VoIP remains unsettled at the federal level.
Voice Interconnection
Because the FCC has not determined the appropriate classification of our voice services, providers of VoIP services typically either secure CLEC authorization or obtain interconnection to traditional wireline phone company networks by contracting with an existing CLEC, which has the right, as a telecommunications carrier, to request and obtain interconnection with the traditional wireline phone companies. We have arranged for such interconnection rights through affiliated CLECs. If a regulatory or judicial
|
14
|
Comcast 2017 Annual Report on Form 10-K
|
|
authority were to deny our ability to interconnect through one of our affiliated CLECs, our ability to provide voice services and compete in the area in question would be negatively impacted. The FCC regulates the arrangements by which telecommunications carriers compensate one another for exchanged traffic and has affirmed the right of CLECs to collect intercarrier compensation when providing interconnection for VoIP providers.
Wireless Service
In 2017, we began offering a wireless voice and data service. We offer this service using our mobile virtual network operator (“MVNO”) rights to provide the service over Verizon’s wireless network and our existing network of in-home and outdoor Wi-Fi hotspots. MVNOs are subject to many of the same FCC regulations as facilities-based wireless carriers (e.g., E911 services, local number portability, etc.), as well as certain state or local regulations. The FCC or other regulatory authorities may adopt new or different regulations for MVNOs and/or mobile broadband providers in the future, or impose new taxes or fees, which could adversely affect our wireless phone service offering or our business generally.
Universal Service
The federal Universal Service program generally requires us and other phone service providers to pay a fee based on revenue from their interstate and international services into a fund used to subsidize the provision of voice services and broadband-capable voice networks in high-cost areas, the provision of voice services to low-income consumers, and the provision of Internet, voice and telecommunications services to schools, libraries and certain health care providers. Some states also have analogous programs that support service in high-cost areas or to low-income consumers. The FCC has long considered implementing changes to the Universal Service program, such as changing the fee calculation from a revenue-based formula to a per-user fee or per-connection fee, adopting a fee based on bandwidth and expanding the services subject to the fee to include broadband Internet access services. We are unable to predict if or how the FCC may change the Universal Service program, or the effects any such changes would have on our businesses.
The FCC recently has shifted its focus away from supporting traditional telephone service, and toward subsidizing deployment of broadband-capable networks and broadband facilities. This shift could assist some of our competitors. For example, the FCC has revised the high-cost federal Universal Service mechanism to support broadband-capable networks and substantially has revised the program that provides Universal Service support for services to schools and libraries to begin phasing out support for voice services, with greater support directed to broadband services and the deployment of Wi-Fi networks. Similarly, the FCC has expanded its Lifeline subsidy program for low-income consumers to include broadband services in addition to voice services. The FCC or Congress may revisit these subsidy programs and how they are funded. We cannot predict whether or how these programs will be changed in the future.
|
NBCUniversal Segments
|
Cable Networks
Program Access
The Communications Act and FCC regulations generally prevent cable networks affiliated with cable operators from favoring cable operators over competing MVPDs.
The FCC and Congress have considered proposals that would require companies that own multiple cable networks to make each of their networks available individually when negotiating distribution agreements with MVPDs and potentially with online video distributors. We currently offer our cable networks both on a bundled basis and, when requested, individually.
Under the terms of the NBCUniversal Consent Decree, we are required to make certain of our cable network, broadcast television and filmed entertainment programming available to bona fide online video distributors in certain circumstances. For further discussion of these conditions, see “Broadcast Television” below and refer to the “Internet Distribution” discussion within that section.
Children’s Programming
Under federal regulations, the amount of commercial content that may be shown on cable networks, broadcast networks and broadcast television stations during programming originally produced and broadcast primarily for an audience of children under 13 years of age is limited, and certain television station programming must serve the educational and informational needs of children under 17 years of age.
|
Comcast 2017 Annual Report on Form 10-K
|
15
|
|
Broadcast Television
Licensing
Local broadcast television stations may be operated only in accordance with a license issued by the FCC upon a finding that the grant of the license will serve the public interest, convenience and necessity. The FCC grants broadcast television station licenses for specific periods of time, which may be renewed with or without conditions. Substantially all of our broadcast television station licenses have pending applications for renewal, although our stations’ authority to operate is automatically extended while a renewal application is under review. Several of these applications have been opposed by third parties. Although our licenses have been renewed in the past, there can be no assurance that we will always obtain renewal grants.
Ownership Limits
FCC regulations limit the ability of individuals and entities to have “attributable interests” above specific ownership levels in local television stations. In November 2017, the FCC adopted an order eliminating certain limitations on ownership of television stations and other specified mass media entities, such as limits on the cross-ownership of broadcast television stations and newspapers in the same market. Elimination of these limits is subject to judicial appeal. In 2018, the FCC is expected to initiate its quadrennial review of its media ownership regulations.
Local Television Ownership
The FCC recently revised its rules to generally permit a licensee to own up to two broadcast stations in the same DMA as long as at least one of the stations is not among the top four-ranked stations in the DMA based on audience share. In addition, the new rules permit a licensee to own up to two stations ranked in the top four in a DMA based on a case-by-case analysis of the circumstances surrounding the proposed combination. These recent changes are subject to judicial appeal. These
ownership restrictions do not apply if the signal coverage of the stations involved do not overlap in the same market.
National Television Ownership
The Communications Act and FCC regulations limit the number of broadcast television stations one entity may own or control nationally. No entity may have an attributable interest in broadcast television stations that reach, in the aggregate, more than 39% of all U.S. television households. The FCC also has a rule that affords a 50% discount to UHF stations (channels 14 and above) in calculating the extent of an individual station owner’s holdings under the national cap. The FCC has initiated a proceeding to consider whether to retain the 50% discount and whether to modify the national television ownership limit. Our owned broadcast television station reach does not exceed the current limit even without considering the discount for UHF stations, but elimination of the 50% discount without an increase in the 39% national cap would place us closer to the national cap and limit our flexibility to acquire stations in the future.
Foreign Ownership
The Communications Act generally limits foreign ownership in a broadcast television station to 20% direct ownership and 25% indirect ownership, although the limit on indirect ownership can be waived if the FCC finds it to be in the public interest.
Dual Network Rule
Each of the four major broadcast television networks - ABC, CBS, Fox and NBC - is prohibited from being under common ownership or control with another of the four.
Must Carry/Retransmission Consent
Every three years, each commercial television station must elect for each cable system in its DMA either must carry or retransmission consent. A similar regulatory scheme applies to satellite providers. For the current three-year period, which commenced on January 1, 2018, all of our owned NBC broadcast television stations and our owned Telemundo broadcast television stations elected retransmission consent.
Internet Distribution
The NBCUniversal Consent Decree establishes certain obligations and restraints concerning distribution of our content online. We must make available certain of our cable network, broadcast television and filmed entertainment programming to bona fide online video distributors in certain circumstances, and they may invoke commercial arbitration to resolve disputes over access to such programming. We are one of four owners of Hulu, but we have no voting rights or board representation under the terms of the NBCUniversal Consent Decree. We have entered into license agreements with Hulu on substantially the same terms as its other owners.
|
16
|
Comcast 2017 Annual Report on Form 10-K
|
|
Indecency
A federal statute and FCC regulations prohibit the broadcast of obscene material on television stations at any time and indecent or profane material between the hours of 6 a.m. and 10 p.m. From time to time, we have received and may receive in the future letters of inquiry from the FCC prompted by complaints alleging that certain programming on our owned local broadcast television stations included indecent or profane material.
Filmed Entertainment
Our filmed entertainment business is subject to “trade practice laws” in effect in 25 states and Puerto Rico relating to theatrical distribution of motion pictures. In countries outside the United States, a variety of existing or contemplated laws and regulations may affect our ability to distribute and license motion picture and television products, as well as consumer merchandise products. The ability of countries to deny market access or refuse national treatment to products originating outside their territories is regulated under various international agreements.
Theme Parks
Our theme parks are subject to various regulations, including laws and regulations regarding environmental protection, privacy and data protection, consumer product safety and theme park operations, such as health, sanitation, safety and fire standards, as well as liquor licenses.
|
Other Areas of Regulation
|
Intellectual Property
Copyright, trademark, unfair competition, patent, trade secret and other proprietary-rights laws of the United States and other countries help protect our intellectual property rights. In particular, piracy of programming and films through unauthorized distribution of counterfeit DVDs, peer-to-peer file sharing and other platforms presents challenges for our cable networks, broadcast television and filmed entertainment businesses. The unauthorized reproduction, distribution or display of copyrighted material over the Internet or through other methods of distribution, such as through devices, software or websites that allow the reproduction, viewing, sharing and/or downloading of content by either ignoring or interfering with the content’s security features and copyrighted status, interferes with the market for copyrighted works and disrupts our ability to exploit our content. The extent of copyright protection and the use of technological protections, such as encryption, are controversial. Modifications to existing laws that weaken these protections could have an adverse effect on our ability to license and sell our programming.
While many legal protections exist to combat piracy, laws in the United States and internationally continue to evolve, as do technologies used to evade these laws. We have actively engaged in the enforcement of our intellectual property rights and likely will continue to expend substantial resources to protect our content. The repeal of laws intended to combat piracy and protect intellectual property or weakening of such laws or enforcement in the United States or internationally, or a failure of existing laws to adapt to new technologies, could make it more difficult for us to adequately protect our intellectual property rights, which could negatively affect their value and further increase the costs of enforcing our rights.
Copyright laws also require that we contribute a percentage of revenue to a federal copyright royalty pool in exchange for retransmitting copyrighted material in broadcast signals under a compulsory license and that we pay standard industry licensing fees for the public performance of music in the programs we distribute, such as local advertising and local origination programming on our cable systems, as well as in the content we create. The fees we pay to music performance rights organizations are typically renegotiated when we renew licenses with those organizations, while the royalties we contribute to the copyright royalty pool for broadcast signals can be challenged by copyright owners in annual audits, and we cannot predict what those fees will be in the future or if disputes will arise over them. In addition, the Copyright Office has initiated a rulemaking to consider how royalty payments to content owners are calculated under the compulsory license. We cannot predict the outcome of this rulemaking, but there is a risk that it could result in higher royalty payments to content owners. Furthermore, in response to a 2014 FCC decision eliminating the FCC’s “sports blackout” rule, which previously enabled sports teams to insist that cable operators black out sports events not available on local broadcast signals, the leading sports leagues petitioned the Copyright Royalty Board to impose a copyright surcharge on cable operators to compensate sports teams for the loss of programming exclusivity, and that proceeding is now pending.
There has been litigation related to a number of online entities that stream our broadcast television content online without the consent of, or compensation to, NBC or its affiliates. In 2014, the U.S. Supreme Court ruled that one such entity, Aereo, violated broadcasters’ exclusive right to perform their copyrighted works publicly. Subsequently, Aereo sought to operate as a cable system under the Copyright Act. Although the U.S. Copyright Office rejected its application for a compulsory copyright license, other companies have sought legislation or court rulings to obtain a compulsory license to stream broadcast programming online.
|
Comcast 2017 Annual Report on Form 10-K
|
17
|
|
Privacy and Data Security Regulation
The Communications Act generally restricts the nonconsensual collection and disclosure to third parties of cable customers’ personally identifiable information by cable operators, except for rendering service, conducting legitimate business activities related to the service, and responding to legal requests. We are also subject to various state and federal regulations that provide privacy protections for customer proprietary network information related to our voice services.
The FCC’s 2017 decision to reclassify broadband Internet access service as an “information service” has the effect of reinstating the FTC’s authority to regulate ISPs’ privacy protections and their use and disclosure of certain customer information. The FTC generally exercises oversight of consumer privacy protections by using its enforcement authority over unfair and deceptive acts or practices to apply greater restrictions on the collection and use of personally identifiable and other information relating to consumers. One court decision from a panel of judges in the Ninth Circuit has raised questions regarding the extent of FTC jurisdiction over companies like us, whose service offerings include some common carrier services as well as non-common carrier services. However, that panel’s decision is not in effect and has no precedential effect, pending a final decision from the full Ninth Circuit Court of Appeals after a rehearing
en banc.
Numerous states and localities, in response to congressional action in 2017 to rescind new ISP privacy rules adopted by the FCC regarding the use and disclosure of certain customer information, have considered legislative or other action that would impose new requirements on our collection, use and disclosure of certain customer information. The FCC’s 2017 Open Internet Order, however, contained broad preemption language that preempts state and local regulations that conflict with federal deregulatory policy, which these state and local efforts may do. We expect these efforts to continue in 2018, although we cannot predict whether such efforts will be successful or preempted, or if successful, how any new requirements may affect our business.
We are also subject to stringent data security and data retention requirements that apply to website operators and online services directed to children under 13 years of age, or that knowingly collect or post personal information from children under 13 years of age. Other privacy-oriented laws have been extended by courts to online video providers and are increasingly being used in privacy lawsuits, including class actions, against providers of video materials online.
We are also subject to state and federal “do not call” laws regarding telemarketing and state and federal laws regarding unsolicited commercial emails, as well as FCC regulations relating to automated telemarketing calls, texts and SMS messages. The FTC and state attorneys general also have initiated efforts to increase and enforce transparency requirements about the collection and use of consumer information, even in an aggregated, non-customer-identifiable form, which may require ongoing review of new and rapidly evolving technologies and methods for delivering content and advertising to ensure that appropriate notice is given to consumers and consent is obtained where required.
We are also subject to state and federal laws and regulations regarding data security that primarily apply to sensitive personal information that could be used to commit identity theft. Most states have security breach notification laws that generally require a business to give notice to consumers and government agencies when certain information has been disclosed to an unauthorized party due to a security breach, and the FCC has adopted security breach rules for voice services. Several states have also enacted general data security requirements to safeguard consumer information, including the proper disposal of consumer information.
The National Institute of Standards and Technology (“NIST”), in cooperation with other federal agencies and owners and operators of U.S. critical infrastructure, including us, have developed a voluntary framework that provides a prioritized, flexible, repeatable, performance-based and cost-effective approach to cybersecurity risk. It is a compendium of existing cross-sector cyber-defense processes, practices and protocols that can help companies identify, assess and manage their cyber risks and vulnerabilities, and several government agencies have encouraged compliance with this framework. NIST recently proposed draft updates to this voluntary framework and is currently reviewing feedback on the draft.
There are pending federal legislative proposals that, if enacted, could create new online consumer privacy protections or impose new requirements on owners and operators of critical infrastructure, including us. We cannot predict whether such legislation will be enacted and, if so, the impact of any such laws on our business.
FCC Spectrum Auction and Repacking
Congress authorized the FCC to conduct an auction to repurpose some broadcast spectrum to mobile broadband use. In this auction, the FCC offered licensees of full-power and Class A television stations the opportunity to sell some or all of their spectrum rights in exchange for cash, and it repackaged those spectrum rights and sold new licenses to wireless providers who can use them for mobile broadband services. In the auction, NBCUniversal sold broadcast spectrum rights associated with television stations in three of its markets, receiving proceeds of approximately $482 million. Those stations, which must vacate their current channels by April 23, 2018, will continue to operate by sharing channels with other NBCUniversal stations in those markets. The FCC assigned 19 of NBCUniversal’s other television stations that did not sell their spectrum rights to new channels; those stations will have to transition to their new channels in a post-auction repacking process that is scheduled to conclude in the third quarter 2020
|
18
|
Comcast 2017 Annual Report on Form 10-K
|
|
and the FCC will reimburse those stations for a portion of their reasonable relocation costs (subject to a nationwide aggregate limit of $1.75 billion). As a result of the repacking process, Comcast will have to make changes to its cable systems to accommodate broadcasters on their newly assigned channels, and will be reimbursed by the FCC for a portion of those related costs (subject to a nationwide aggregate limit of $1.75 billion).
In addition, we acquired 73 new mobile broadband licenses in this auction for $1.7 billion. We will be obligated to meet certain regulatory requirements concerning the use of these licenses over the coming years.
FCC 5G Spectrum Proceedings and Other Wireless Regulations
In three separate regulatory proceedings, the FCC is currently considering establishing and/or modifying its rules to make available large amounts of spectrum that will likely be used to provide the next generation of commercial wireless broadband services, both fixed and mobile, commonly referred to as 5G services. Some of this spectrum is currently used for satellite delivery of cable programming to cable headends, including our own, and there is a risk that such satellite delivery could be disrupted if the FCC were to adopt some of the proposals raised in these proceedings. There is also a risk that the FCC could adopt proposals that favor certain business models over others in the 5G marketplace, thereby limiting potential business opportunities for us in the future. In addition, there is potential for new legislation or FCC regulations that could enable wireless providers to offer video and other services over their networks subject to different, and possibly fewer, regulatory obligations than the services we provide. We cannot predict what rules or legislation, if any, will ultimately be adopted or how any such changes would affect our businesses.
State and Local Taxes
Some states and localities have imposed or are considering imposing, through both legislative and administrative channels, new or additional taxes or fees on, or limiting or eliminating incentives or credits earned or monetized by, the businesses operated by our Cable Communications and NBCUniversal segments, or imposing adverse methodologies by which taxes, fees, incentives or credits are computed, earned or monetized. These include combined reporting or other changes to general business taxes, central assessments for property tax and taxes and fees on the businesses operated or services provided by our Cable Communications and NBCUniversal segments. In some situations, DBS providers and other competitors that deliver their services over a high-speed Internet connection do not face the same state tax and fee burdens. Congress has also considered, and may consider again, proposals to bar or limit states from imposing taxes on these DBS providers or other competitors that are equivalent to the taxes or fees that we pay. The Internet Tax Freedom Act, which prohibits most states and localities from imposing sales and other taxes on our Internet access charges, was made permanent by 2016 legislation; however, some jurisdictions have or may assert that certain taxes akin to right-of-way fees are not preempted by Internet Tax Freedom Act.
Environmental Matters
Certain of our business operations are subject to environmental laws and regulations since they involve air emissions, wastewater discharges and the use, disposal and cleanup of toxic and hazardous substances. Any failure to comply with environmental requirements could result in monetary fines, civil or criminal sanctions, third-party claims or other costs or liabilities. Environmental requirements have become more stringent over time, and pending or proposed new regulations could impact our operations or costs.
Other Regulations
Federal regulators actively regulate other aspects of our businesses, including accessibility to our video and voice services and broadcast television programming for people with disabilities, customer service standards, inside wiring, cable equipment, leased access, loudness of commercial advertisements, advertising, Emergency Alert System, equal employment opportunity, lottery programming, recordkeeping and public file access requirements, regulatory fees and technical standards relating to the operation of cable systems and television stations. We are occasionally subject to enforcement actions at the FCC, which can result in us having to pay fines to the agency or being subject to other sanctions. We also are subject to various international regulations, including those that cover television broadcasting, programming and advertising.
Employees
As of
December 31, 2017
, we had approximately 164,000 full-time and part-time employees calculated on a full-time equivalent basis. Of these employees, approximately 91,000 and 62,000 were associated with our cable communications business and our NBCUniversal businesses, respectively. We also use freelance and temporary employees in the normal course of our business.
|
Comcast 2017 Annual Report on Form 10-K
|
19
|
|
Caution Concerning Forward-Looking Statements
The SEC encourages companies to disclose forward-looking information so that investors can better understand a company’s future prospects and make informed investment decisions. In this Annual Report on Form 10-K, we state our beliefs of future events and of our future financial performance. In some cases, you can identify these so-called “forward-looking statements” by words such as “may,” “will,” “should,” “expects,” “believes,” “estimates,” “potential,” or “continue,” or the negative of these words, and other comparable words. You should be aware that these statements are only our predictions. In evaluating these statements, you should consider various factors, including the risks and uncertainties listed in “Risk Factors” and in other reports we file with the SEC.
Additionally, we operate in a highly competitive, consumer-driven and rapidly changing environment. This environment is affected by government regulation; economic, strategic, political and social conditions; consumer response to new and existing products and services; technological developments; and, particularly in view of new technologies, the ability to develop and protect intellectual property rights. Our actual results could differ materially from our forward-looking statements as a result of any of such factors, which could adversely affect our businesses, results of operations or financial condition. We undertake no obligation to update any forward-looking statements.
Our businesses currently face a wide range of competition, and our businesses and results of operations could be adversely affected if we do not compete effectively.
All of our businesses operate in intensely competitive, consumer-driven and rapidly changing environments and compete with a growing number of companies that provide a broad range of communications products and services and entertainment, news and information content to consumers. Online distribution platforms are further intensifying and complicating the competitive landscape and influencing consumer behavior, which is discussed in the risk factor immediately below under the heading “Changes in consumer behavior driven by online distribution platforms for viewing content could adversely affect our businesses and challenge existing business models.”
Competition for our cable services consists primarily of DBS providers and phone companies with fiber-based networks that typically offer features, pricing and packaging for services comparable to ours. Some of these competitors are also offering smaller packages of channels at price points lower than our standard packages, both through traditional and online distribution platforms, which could cause us to offer more customized programming packages that may be less profitable. AT&T, our largest phone company competitor, acquired DirecTV, the nation’s largest DBS provider, in 2015 to create an even larger competitor, and in 2016, announced a proposed merger with Time Warner, a media and entertainment company. If consolidation between phone companies (which are also wireless distributors) and content providers occurs, some of our competitors may offer free or lower cost streaming services for viewing their content through unlimited data-usage plans for their Internet or wireless phone services. Additional companies, some with significant financial resources, continue to enter or are seeking to enter the video distribution market, primarily by offering Internet streaming and downloading of video programming.
Wireless Internet services, such as 3G and 4G, and in the near future 5G, wireless broadband services and Wi-Fi networks, and devices such as smartphones, tablets, wireless data cards, and mobile wireless routers that connect to such devices, may compete with our high-speed Internet services. Our wireline voice services are facing increased competition as customers replace wireline phones with wireless and Internet-based phone services.
Our cable communications business continues to seek ways to enhance the value of our cable services network, such as by growing our high-speed Internet services and business services and by launching additional services, such as our security and automation services. There can be no assurance that we can execute on these and other initiatives in a manner sufficient to grow or maintain our Cable Communications segment revenue, maintain our Cable Communications segment operating margin or to compete successfully in the future.
Each of NBCUniversal’s businesses also faces substantial and increasing competition from providers of similar types of content, as well as from other forms of entertainment and recreational activities. NBCUniversal must compete to obtain talent, content and other resources required in operating these businesses.
The ability of all of our businesses to compete effectively depends on our perceived image and reputation among our various constituencies, including our customers, consumers, advertisers, investors and government authorities. Our ability to compete may be negatively affected if we do not provide our customers with a satisfactory customer experience.
There can be no assurance that we will be able to compete effectively against existing or newer competitors or that competition will not have an adverse effect on our businesses. For a more detailed description of the competition facing our businesses, see Item 1: Business and refer to the “Competition” discussion within that section.
|
20
|
Comcast 2017 Annual Report on Form 10-K
|
|
Changes in consumer behavior driven by online distribution platforms for viewing content could adversely affect our businesses and challenge existing business models.
Distribution platforms for viewing and purchasing content over the Internet have been, and will likely continue to be, developed that further increase the number of competitors that all our businesses face and challenge existing business models. These distribution platforms are driving changes in consumer behavior as consumers seek more control over when, where and how they consume content and access communications services.
Consumers are increasingly turning to online sources for viewing and purchasing content, which has and likely will continue to reduce the number of our video customers and subscribers to our cable networks even as it makes our high-speed Internet services more important to consumers. While we are attempting to adapt our video service offerings to changing consumer behaviors, for example, by deploying our X1 platform and cloud DVR technology and adding apps such as Netflix on our X1 set-top boxes, virtual multichannel video providers, subscription video on demand services and programming networks that provide content directly to consumers over the Internet continue to gain consumer acceptance. Many of these service offerings charge no fee or a lower fee than our traditional video packages for access to their content, which could have an adverse effect on demand for our video services, including for expanded video packages, premium networks, and our DVR and On Demand services.
An increasing number of companies offering subscription video on demand services, including some that also offer exclusive high-quality original video programming, as well as programming networks offering content directly to consumers over the Internet, have increased the number of entertainment choices available to consumers, which has intensified audience fragmentation. The increase in entertainment choices adversely affects the audience ratings of our cable networks and broadcast television programming. Time-shifting technologies, such as video on demand services and DVR and cloud-based recording services, also reduce the viewing of content through traditional and virtual multichannel video providers, which has caused and likely will continue to cause audience ratings declines for our cable networks and broadcast television programming and may adversely affect the price and amount of advertising that advertisers are willing to purchase from us and the amount NBCUniversal receives for distribution of its content.
The success of any of these ongoing or future developments or our failure to effectively anticipate or adapt to emerging competitors or changes in consumer behavior, including among younger consumers, could have an adverse effect on our competitive position, businesses and results of operations.
A decline in advertisers’ expenditures or changes in advertising markets could negatively impact our businesses.
Our cable communications, cable networks and broadcast television businesses compete for the sale of advertising time with other television networks and stations, as well as with all other advertising platforms, such as digital media, radio and print. We derive substantial revenue from the sale of advertising, and a decline in expenditures by advertisers, including through traditional linear television distribution models, could negatively impact our results of operations. Declines can be caused by the economic prospects of specific advertisers or industries, increased competition for the leisure time of viewers and audience fragmentation, the growing use of new technologies and online distribution platforms, or the economy in general. In addition, advertisers’ willingness to purchase advertising from us may be adversely affected by lower audience ratings, which many of our networks have experienced and likely will continue to experience. Advertising sales and rates also are dependent on the methodology used for audience measurement and could be negatively affected if methodologies do not accurately reflect actual viewership levels. For example, certain methods of viewing content, such as viewing content through many online distribution platforms or delayed viewing on DVRs, might not be counted in audience measurements or may generate less, if any, revenue than traditional linear television distribution methods, which could have an adverse effect on our advertising revenue.
Our businesses depend on keeping pace with technological developments.
Our success is, to a large extent, dependent on our ability to acquire, develop, adopt and leverage new and existing technologies, and our competitors’ use of certain types of technology and equipment may provide them with a competitive advantage. For example, current and new wireless Internet technologies such as 4G and 5G wireless broadband services continue to evolve rapidly to allow for greater speed and reliability, and some companies and municipalities are building advanced fiber-based networks that provide very fast Internet access speeds. We expect other advances in communications technology to occur in the future. If we choose technology or equipment that is not as effective or attractive to consumers as that employed by our competitors, if we fail to employ technologies desired by consumers before our competitors do so, or if we fail to execute effectively on our technology initiatives, our businesses and results of operations could be adversely affected. We also will continue to incur additional costs as we execute our technology initiatives, such as the deployment of DOCSIS 3.1 and DOCSIS FDX and the continued development of our X1 set-top boxes, cloud DVR and wireless gateways. There can be no assurance that we can execute on these and other initiatives in a manner sufficient to grow or maintain our revenue or to compete successfully in the future. We also may generate less revenue or incur increased costs if changes in our competitors’ product offerings require that we offer certain of our existing services or enhancements at a lower or no cost to our customers or that we make additional research and development expenditures.
|
Comcast 2017 Annual Report on Form 10-K
|
21
|
|
We are subject to regulation by federal, state, local and foreign authorities, which impose additional costs and restrictions on our businesses.
Federal, state and local governments extensively regulate the video, high-speed Internet and voice services industries. Our broadcast television business is also highly regulated by federal laws and regulations. Our cable networks, filmed entertainment and theme parks businesses are also subject to various other laws and regulations at the international, federal, state and local levels. In addition, we are subject to conditions relating to the treatment of competitors and other matters set forth in the NBCUniversal Consent Decree, which is currently scheduled to expire in September 2018. The FCC and certain states also have been active in conducting inquiries
and reviews, regarding our services, and this trend may continue. Failure to comply with the laws and regulations applicable to our businesses could result in administrative enforcement actions, fines, and civil and criminal liability.
Legislators and regulators at all levels of government frequently consider changing, and sometimes do change, existing statutes, rules, regulations, or interpretations thereof, or prescribe new ones, which may significantly affect our businesses. Any future legislative, judicial, regulatory or administrative actions may increase our costs or impose additional restrictions on our businesses, some of which may be significant. Congress may consider proposals to address communications issues, including whether it should rewrite the entire Communications Act to account for changes in the communications marketplace, whether it should enact new, permanent open Internet requirements, and whether it should fund new broadband infrastructure. We are unable to predict the effects of any of these or any other further legislative requirements on our businesses. Any changes to the legal and regulatory framework applicable to any of our services or businesses could have an adverse impact on our businesses and results of operations. For a more extensive discussion of the significant risks associated with the regulation of our businesses, see Item 1: Business and refer to the “Legislation and Regulation” discussion within that section.
Programming expenses for our video services are increasing, which could adversely affect our Cable Communications segment’s video business.
We expect programming expenses for our video services to continue to be our Cable Communications segment’s largest single expense item and to increase for the foreseeable future. The multichannel video provider industry has experienced continued increases in the cost of programming, especially sports programming, which we expect will continue for the foreseeable future. Our programming expenses may also increase as we add programming to our video services or distribute existing programming to more of our customers or through additional delivery platforms, such as On Demand or streaming services. Additionally, in the past few years, we have begun paying certain local broadcast television stations in exchange for their required consent for the retransmission of broadcast network programming to our video services customers; we expect to continue to be subject to increasing demands for payment and other concessions from local broadcast television stations. These market factors may be exacerbated by increased consolidation in the media industry, which may further increase our programming expenses. If we are unable to raise our customers’ rates or offset programming cost increases through the sale of additional services or cost management initiatives, the increasing cost of programming could have an adverse effect on our Cable Communications segment’s results of operations. Moreover, as our contracts with content providers expire, there can be no assurance that they will be renewed on acceptable terms or that they will be renewed at all, in which case we may be unable to provide such content as part of our video services, and our businesses and results of operations could be adversely affected.
NBCUniversal’s success depends on consumer acceptance of its content, and its businesses may be adversely affected if its content fails to achieve sufficient consumer acceptance or the costs to create or acquire content increase.
Most of NBCUniversal’s businesses create and acquire media and entertainment content, the success of which depends substantially on consumer tastes and preferences that change in often unpredictable ways. The success of these businesses depends on our ability to consistently create, acquire, market and distribute cable network and broadcast television programming, filmed entertainment, theme park attractions and other content that meet the changing preferences of the broad domestic and international consumer markets. We have invested, and will continue to invest, substantial amounts in our content, including in the production of original content on our cable networks and broadcast television networks, in our films and for theme park attractions, before learning the extent to which it would earn consumer acceptance.
We also obtain a significant portion of our content from third parties, such as movie studios, television production companies, sports organizations and other suppliers. Competition for popular content, particularly for sports programming, is intense, and we may have to increase the price we are willing to pay or be outbid by our competitors for popular content. Entering into or renewing contracts for such programming rights or acquiring additional rights may result in significantly increased costs. Particularly with respect to long-term contracts for sports programming rights, our results of operations and cash flows over the term of a contract depend on a number of factors, including the strength of the advertising market, our audience size, the ability to secure distribution from and impose surcharges or obtain carriage on multichannel video providers for the content, and the timing and amount of our rights payments. There can be no assurance that revenue from these contracts will exceed our costs for the rights, as well as the
|
22
|
Comcast 2017 Annual Report on Form 10-K
|
|
other costs of producing and distributing the programming. If our content does not achieve sufficient consumer acceptance, or if we cannot obtain or retain rights to popular content on acceptable terms, or at all, our businesses may be adversely affected.
The loss of NBCUniversal’s programming distribution agreements, or the renewal of these agreements on less favorable terms, could adversely affect its businesses.
Our cable networks depend on their ability to secure and maintain distribution agreements with traditional and virtual multichannel video providers. Increasingly, our cable networks, broadcast television and filmed entertainment businesses are also entering into agreements to license their prior season and library content on other distribution platforms, including subscription video on demand services. If our programming does not attract sufficient viewers, traditional and virtual multichannel video providers may decide not to distribute our broadcast and cable networks, and subscription video on demand services may not license programming we create. In addition, the number of subscribers to our cable networks may be reduced as a result of multichannel video providers offering smaller packages of channels as part of their virtual or traditional television programming packages and by overall reduced viewing of television programming through multichannel video providers. Our broadcast television networks depend on their ability to secure and maintain network affiliation agreements with third-party local broadcast television stations in the markets where we do not own the affiliated local broadcast television station. In addition, every three years, each of our owned local broadcast television stations must elect, with respect to its retransmission by multichannel video providers within its DMA, either “must-carry” status, in which the distributor’s carriage of the station is mandatory and does not generate any compensation for the local station, or “retransmission consent,” in which the station gives up its right to mandatory carriage and instead seeks to negotiate the terms and conditions of carriage with the distributor, including the amount of compensation, if any, paid to the station by such distributor. For the current three-year period, which commenced on January 1, 2018, all of our owned NBC broadcast television stations and our owned Telemundo broadcast television stations elected retransmission consent. However, certain illegal online entities may stream our broadcast television content online without our consent and without paying any compensation to us. There can be no assurance that any of our distribution agreements will be renewed in the future on acceptable terms, or at all. The loss of any of these agreements, or the renewal of these agreements on less favorable terms, could reduce NBCUniversal’s revenue and the reach of our television programming and its attractiveness to advertisers, which in turn could adversely affect our cable networks, broadcast television and filmed entertainment businesses.
We rely on network and information systems and other technologies, as well as key properties, and a disruption, cyber attack, failure or destruction of such networks, systems, technologies or properties may disrupt our businesses.
Network and information systems and other technologies, including those related to our network management, customer service operations, and programming delivery, and technology embedded in our products and services, are critical to our business activities. Cyber threats and attacks are directed at both known and newly discovered software and hardware vulnerabilities and are constantly evolving, which increases the difficulty of detecting and successfully defending against them. Cyber threats and attacks can have cascading impacts that unfold with increasing speed across networks, information systems and other technologies. Network, information systems and technology-related events, including those caused by us, such as process breakdowns, security architecture or design vulnerabilities, or by third parties, such as computer hackings, cyber attacks, computer viruses, worms or other destructive or disruptive software, denial of service attacks, malicious social engineering or other malicious activities, or any combination of the foregoing, or power outages, natural disasters, infectious disease outbreaks, terrorist attacks or other similar events, could result in a degradation or disruption of our products and services, excessive call volume to call centers, theft or misuse of our intellectual property or other assets, a reduction in demand for our theme parks, disruption of the security of our internal systems and products and services, the compromise of confidential or technical business information or damage to our equipment, data, properties and reputation. These events also could result in large expenditures to repair or replace the damaged properties, products, services, networks or information systems to protect them from similar events in the future, and any such events could lead to litigation or otherwise have an adverse effect on our results of operations.
In addition, we may obtain certain confidential, proprietary and personal information about our customers, personnel and vendors, and may provide this information to third parties, in connection with our business. While we obtain assurances that these third parties will protect this information, there is a risk that this information may be compromised. Any security breaches, such as misappropriation, misuse, leakage, falsification or accidental release or loss of information maintained in our information technology systems, including customer, personnel and vendor data, could damage our reputation and require us to expend significant capital and other resources to remedy any such security breach, could lead to litigation or could cause regulators to impose fines or other remedies for failure to comply with relevant customer privacy rules.
The risk of these systems-related events and security breaches occurring continues to intensify in many of our businesses, and our businesses may be at a disproportionately heightened risk of these events occurring, due to the nature of our businesses and the fact that we maintain certain information necessary to conduct our business in digital form. In the ordinary course of our business, there are frequent attempts to cause such systems-related events and security breaches, and we have experienced minor systems-related events that, to date, have not resulted in any significant degradation or disruption to our network or information systems
|
Comcast 2017 Annual Report on Form 10-K
|
23
|
|
or our products, services or operations. While we develop and maintain systems, and operate an extensive security program, seeking to prevent systems-related events and security breaches from occurring, the development, maintenance and operation of these systems and programs is costly and requires ongoing monitoring and updating as technologies change and efforts to overcome security measures become more sophisticated. Despite our efforts to prevent these events and security breaches, there can be no assurance that they will not occur in the future or will not have an adverse effect on our businesses. Moreover, the amount and scope of insurance we maintain against losses resulting from any such events or security breaches likely would not be sufficient to cover our losses or otherwise adequately compensate us for any disruptions to our business that may result, and the occurrence of any such events or security breaches could have an adverse effect on our business.
Our businesses depend on using and protecting certain intellectual property rights and on not infringing the intellectual property rights of others.
We rely on our intellectual property, such as patents, copyrights, trademarks and trade secrets, as well as licenses and other agreements with our vendors and other third parties, to use various technologies, conduct our operations and sell our products and services. Legal challenges to our intellectual property rights and claims of intellectual property infringement by third parties could require that we enter into royalty or licensing agreements on unfavorable terms, incur substantial monetary liability, or be enjoined preliminarily or permanently from further use of the intellectual property in question, from importing into the United States hardware that uses such intellectual property or from the continuation of our businesses as currently conducted. We may need to change our business practices if any of these events occur, which may limit our ability to compete effectively and could have an adverse effect on our results of operations. Even if we believe any such challenges or claims are without merit, they can be time-consuming and costly to defend and divert management’s attention and resources away from our businesses. Moreover, if we are unable to obtain or continue to obtain licenses from our vendors and other third parties on reasonable terms, our businesses could be adversely affected.
In addition, intellectual property constitutes a significant part of the value of NBCUniversal’s businesses, and its success is highly dependent on protecting the intellectual property rights of the content it creates or acquires against third-party misappropriation, reproduction or infringement. The unauthorized reproduction, distribution or display of copyrighted material negatively affects our ability to generate revenue from the legitimate sale of our content, as well as from the sale of advertising in connection with our content, and increases our costs due to our active enforcement of our intellectual property rights.
Piracy and other unauthorized uses of content are made easier, and the enforcement of intellectual property rights more challenging, by technological advances that allow the conversion of programming, films and other content into digital formats, which facilitates the creation, transmission and sharing of high-quality unauthorized copies. In particular, piracy of programming and films through unauthorized distribution on DVDs, peer-to-peer computer networks and other platforms continues to present challenges for our cable networks, broadcast television and filmed entertainment businesses. While piracy is a challenge in the United States, it is particularly prevalent in many parts of the world that lack developed copyright laws, effective enforcement of copyright laws and technical protective measures like those in effect in the United States. If any U.S. or international laws intended to combat piracy and protect intellectual property rights are repealed or weakened or are not adequately enforced, or if the legal system fails to adapt to new technologies that facilitate piracy, we may be unable to effectively protect our rights, the value of our intellectual property may be negatively impacted and our costs of enforcing our rights may increase. See Item 1: Business and refer to the “Legislation and Regulation - Other Areas of Regulation - Intellectual Property” discussion for additional information.
We may be unable to obtain necessary hardware, software and operational support.
We depend on third-party vendors to supply us with a significant amount of the hardware, software and operational support necessary to provide certain of our services. Some of these vendors represent our primary source of supply or grant us the right to incorporate their intellectual property into some of our hardware and software products. While we actively monitor the operations and financial condition of key vendors in an attempt to detect any potential difficulties, there can be no assurance that we would timely identify any operating or financial difficulties associated with these vendors or that we could effectively mitigate our risks with respect to any such difficulties. If any of these vendors experience operating or financial difficulties, if our demand exceeds their capacity or if they are otherwise unable to meet our specifications or provide the equipment or services we need in a timely manner or at reasonable prices, our ability to provide some services may be adversely affected.
Weak economic conditions may have a negative impact on our businesses.
A substantial portion of our revenue comes from customers whose spending patterns may be affected by prevailing economic conditions. Weak economic conditions could adversely affect demand for any of our products and services and have a negative impact on our results of operations. For example, customers may reduce the level of cable services to which they subscribe, or may discontinue subscribing to one or more of our cable services. This risk may be increased by the expanded availability of free or lower cost competitive services, such as subscription video on demand services, or substitute services for our high-speed Internet and voice services, such as mobile phones, smartphones and Wi-Fi networks. Weak economic conditions also may have a negative
|
24
|
Comcast 2017 Annual Report on Form 10-K
|
|
impact on our advertising revenue, the performance of our films and home entertainment releases, and attendance and spending in our theme parks. Weak economic conditions and turmoil in the global financial markets may also impair the ability of third parties to satisfy their obligations to us, and any disruption in the global financial markets may affect our ability to obtain financing or refinance any existing debt on acceptable terms.
Acquisitions and other strategic initiatives present many risks, and we may not realize the financial and strategic goals that we had contemplated.
From time to time, we make acquisitions and investments and may pursue other strategic initiatives. In connection with such acquisitions and strategic initiatives, we may incur unanticipated expenses, fail to realize anticipated benefits, have difficulty incorporating an acquired or new line of business, disrupt relationships with current and new employees, customers and vendors, incur significant debt, or have to delay or not proceed with announced transactions or initiatives. For example, our launch of a wireless phone service in 2017 using virtual network operator rights has success-based working capital requirements, primarily associated with the procurement of handsets, which customers are able to pay for upfront or finance interest-free over 24 months, and other equipment, which could have negative effects on our cash flows. Additionally, regulatory agencies, such as the FCC or DOJ, may impose restrictions on the operation of our businesses as a result of our seeking regulatory approvals for any significant acquisitions and strategic initiatives, or may dissuade us from pursing certain transactions. The occurrence of any of these events could have an adverse effect on our businesses.
Labor disputes, whether involving employees or sports organizations, may disrupt our operations and adversely affect our businesses.
Many of NBCUniversal’s employees, including writers, directors, actors, technical and production personnel and others, as well as some of our on-air and creative talent employees, are covered by collective bargaining agreements or works councils. Most of NBCUniversal’s collective bargaining agreements are industry-wide agreements, and we may lack practical control over the negotiations and terms of the agreements. If we are unable to reach agreement with a labor union before the expiration of a collective bargaining agreement, our employees who were covered by that agreement may have a right to strike or take other actions that could adversely affect us, which could disrupt our operations and reduce our revenue, and the resolution of any disputes may increase our costs. There can be no assurance that we will renew our collective bargaining agreements as they expire or that we can renew them on favorable terms or without any work stoppages.
In addition, our cable networks and broadcast television networks have programming rights agreements of varying scope and duration with various sports organizations to broadcast and produce sporting events, including certain NFL, NHL, NBA and MLB games. Labor disputes in these and other sports organizations could have an adverse effect on our businesses.
The loss of key management personnel or popular on-air and creative talent could have an adverse effect on our businesses.
We rely on certain key management personnel in the operation of our businesses. While we maintain long-term and emergency transition plans for key management personnel and believe we could either identify internal candidates or attract outside candidates to fill any vacancy created by the loss of any key management personnel, the loss of one or more of our key management personnel could have a negative impact on our businesses. In addition, our cable networks, broadcast television and filmed entertainment businesses depend on the abilities and expertise of our on-air and creative talent. If we fail to retain our on-air or creative talent, if the costs to retain such talent increase materially, if we need to make significant termination payments, or if these individuals lose their current appeal, our businesses could be adversely affected.
We face risks relating to doing business internationally that could adversely affect our businesses.
We, primarily through NBCUniversal, operate our businesses worldwide. There are risks inherent in doing business internationally, including global financial market turmoil; economic volatility and global economic slowdown; currency exchange rate fluctuations and inflationary pressures; the requirements of local laws and customs relating to the publication and distribution of content and the display and sale of advertising; import or export restrictions and changes in trade regulations; difficulties in developing, staffing and managing foreign operations; issues related to occupational safety and adherence to diverse local labor laws and regulations; and potentially adverse tax developments. In addition, doing business internationally subjects us to risks relating to political or social unrest, as well as corruption and government regulation, including U.S. laws such as the Foreign Corrupt Practices Act, that impose stringent requirements on how we conduct our foreign operations. If any of these events occur, our businesses may be adversely affected.
|
Comcast 2017 Annual Report on Form 10-K
|
25
|
|
Our Class B common stock has substantial voting rights and separate approval rights over several potentially material transactions, and our Chairman and CEO has considerable influence over our company through his beneficial ownership of our Class B common stock.
Our Class B common stock has a non-dilutable 33
1
/
3
% of the combined voting power of our Class A and Class B common stock. This non-dilutable voting power is subject to proportional decrease to the extent the number of shares of Class B common stock is reduced below 9,444,375, which was the number of shares of Class B common stock outstanding on the date of our 2002 acquisition of AT&T Corp.’s cable business, subject to adjustment in specified situations. Stock dividends payable on the Class B common stock in the form of Class B or Class A common stock do not decrease the non-dilutable voting power of the Class B common stock. The Class B common stock also has separate approval rights over several potentially material transactions, even if they are approved by our Board of Directors or by our other shareholders and even if they might be in the best interests of our other shareholders. These potentially material transactions include mergers or consolidations involving us, transactions (such as a sale of all or substantially all of our assets) or issuances of securities that require shareholder approval, transactions that result in any person or group owning shares representing more than 10% of the combined voting power of the resulting or surviving corporation, issuances of Class B common stock or securities exercisable or convertible into Class B common stock, and amendments to our articles of incorporation or by-laws that would limit the rights of holders of our Class B common stock. Brian L. Roberts, our chairman and CEO, beneficially owns all of the outstanding shares of our Class B common stock and, accordingly, has considerable influence over our company and the potential ability to transfer effective control by selling the Class B common stock, which could be at a premium.
None.
We believe that substantially all of our physical assets were in good operating condition as of
December 31, 2017
. Our corporate headquarters and Cable Communications segment headquarters are located in Philadelphia, Pennsylvania at One Comcast Center. We own an 80% interest in an entity whose primary asset is One Comcast Center. In addition, we own an 80% interest in an entity that is currently constructing the Comcast Technology Center, which is adjacent to One Comcast Center. We also have leases for numerous business offices, warehouses and properties throughout the United States that house divisional information technology operations.
|
Cable Communications Segment
|
Our principal physical assets consist of operating plant and equipment, including cable system signal receiving, encoding and decoding devices, headends and distribution networks, and equipment at or near our customers’ homes. Our distribution network consists primarily of headends, content distribution servers, coaxial and fiber-optic cables, lasers, routers, switches and related electronic equipment. Our cable plant and related equipment generally are connected to utility poles under pole rental agreements with local public utilities, although in some areas the distribution cable is buried in underground ducts or trenches. Customer premise equipment consists primarily of set-top boxes, cable modems and wireless gateways. The physical components of cable systems require periodic maintenance and replacement.
Our cable system signal reception sites, which consist primarily of antenna towers and headends, and our microwave facilities are located on owned and leased parcels of land, and we own or lease space on the towers on which certain of our equipment is located. We own most of our service vehicles.
Our high-speed Internet network consists of fiber-optic cables owned or leased by us and related equipment. We also operate national and regional data centers with equipment that is used to provide services, such as email and web services, to our high-speed Internet and voice customers, as well as cloud services to our video customers. In addition, we maintain network operations centers with equipment necessary to monitor and manage the status of our services and network.
We own or lease buildings throughout the country that contain customer service call centers, retail stores and customer service centers, warehouses and administrative space. We also own a building that houses our digital media center. The digital media center contains equipment that we own or lease, including equipment related to network origination, video transmission via satellite and terrestrial fiber-optics, broadcast studios, post-production services and interactive television services.
|
26
|
Comcast 2017 Annual Report on Form 10-K
|
|
|
NBCUniversal Segments
|
NBCUniversal’s corporate headquarters are located in New York, New York at 30 Rockefeller Plaza. NBCUniversal owns the space it occupies at 30 Rockefeller Plaza. We also own or lease offices, studios, production facilities, screening rooms, retail operations, warehouse space, satellite transmission receiving facilities and data centers in numerous locations in the United States and around the world, including property for our owned local broadcast television stations. In addition, we own theme parks and own or lease related facilities in Orlando, Florida; Hollywood, California; and Osaka, Japan.
NBCUniversal Properties as of
December 31, 2017
|
Location
|
|
Principal Use
|
|
Principal Segment in Which Used
|
|
Owned or Leased
|
|
30 Rockefeller Plaza
New York, NY
|
|
NBCUniversal corporate
headquarters, offices and studios
|
|
Headquarters and Other, Cable Networks and Broadcast Television
|
|
Owned
|
|
10 Rockefeller Plaza
New York, NY
|
|
The Today Show
studio,
production facilities and offices
|
|
Broadcast Television
|
|
Leased
|
|
Universal City
Universal City, CA
|
|
Offices, studios, theme park and retail operations
|
|
All
|
|
Owned
|
|
1000 Universal Studios Plaza
Orlando, FL
|
|
Theme parks, production facilities, parking structures and administrative buildings
|
|
Theme Parks
|
|
Owned
|
|
2 Chome-1-33 Sakurajima, Konohana Ward, Osaka, Osaka Prefecture 554-0031, Japan
|
|
Theme park and administrative buildings
|
|
Theme Parks
|
|
Tangible properties owned on leased parcels of land
|
|
2290 W. 8th Ave.
Hialeah, FL
|
|
Telemundo headquarters and production facilities
|
|
Headquarters and Other and
Broadcast Television
|
|
Leased
|
|
Other
|
The Wells Fargo Center, a large, multipurpose arena in Philadelphia, Pennsylvania that we own, was the principal physical operating asset of our other businesses as of
December 31, 2017
.
Refer to Note 16 to Comcast’s consolidated financial statements included in this Annual Report on Form 10-K for a discussion of recent developments related to our legal proceedings.
NBCUniversal is subject to legal proceedings and claims that arise in the ordinary course of its business and it does not expect the final disposition of these matters to have a material adverse effect on its results of operations, cash flows or financial condition, although any such matters could be time-consuming and costly and could injure its reputation.
Not applicable.
|
Comcast 2017 Annual Report on Form 10-K
|
27
|
|
Comcast’s Class A common stock is listed on the NASDAQ Global Select Market under the symbol CMCSA. There is no established public trading market for Comcast’s Class B common stock. The Class B common stock can be converted, on a share for share basis, into Class A common stock.
On January 24, 2017, our Board of Directors approved a two-for-one stock split in the form of a 100% stock dividend payable on February 17, 2017 to shareholders of record as of the close of business on February 8, 2017. All share and per share amounts are presented on a post-split basis.
|
Dividends Declared
|
||||||||
|
2017
|
2016
|
|||||||
|
Month Declared:
|
Dividend Per Share
|
Month Declared:
|
Dividend Per Share
|
|
||||
|
January
|
$
|
0.1575
|
|
February
|
$
|
0.1375
|
|
|
|
May
|
$
|
0.1575
|
|
May
|
$
|
0.1375
|
|
|
|
July
|
$
|
0.1575
|
|
July
|
$
|
0.1375
|
|
|
|
October (paid in January 2018)
|
$
|
0.1575
|
|
October (paid in January 2017)
|
$
|
0.1375
|
|
|
|
Total
|
$
|
0.63
|
|
Total
|
$
|
0.55
|
|
|
We expect to continue to pay quarterly dividends, although each dividend is subject to approval by our Board of Directors.
In January 2018, our Board of Directors approved a 21% increase in our dividend to $0.76 per share on an annualized basis.
Holders of Class A common stock in the aggregate hold 66
2
/
3
% of the voting power of our common stock. The number of votes that each share of Class A common stock has at any given time depends on the number of shares of Class A common stock and Class B common stock then outstanding, with each share of Class B common stock having 15 votes per share. The Class B common stock represents 33
1
/
3
% of the combined voting power of our common stock, which percentage is generally non-dilutable under the terms of our articles of incorporation. Mr. Brian L. Roberts beneficially owns all outstanding shares of Class B common stock. Generally, including as to the election of directors, holders of Class A common stock and Class B common stock vote as one class except where class voting is required by law.
Record holders as of
December 31, 2017
are presented in the table below.
|
Stock Class
|
Record
Holders
|
|
|
Class A Common Stock
|
430,652
|
|
|
Class B Common Stock
|
3
|
|
The table below summarizes Comcast’s common stock repurchases during
2017
.
|
Period
|
Total Number of
Shares Purchased |
|
Average
Price Per Share |
|
Total Number of
Shares Purchased as Part of Publicly Announced Authorization |
|
Total Dollar
Amount Purchased Under the Publicly Announced Authorization |
|
Maximum Dollar Value
of Shares That May Yet Be Purchased Under the Publicly Announced Authorization (a) |
|
|||
|
First Quarter 2017
|
20,532,594
|
|
$
|
36.76
|
|
20,405,918
|
|
$
|
749,999,994
|
|
$
|
11,250,000,006
|
|
|
Second Quarter 2017
|
35,150,441
|
|
$
|
39.29
|
|
35,150,441
|
|
$
|
1,381,090,407
|
|
$
|
9,868,909,599
|
|
|
Third Quarter 2017
|
42,883,231
|
|
$
|
39.27
|
|
42,883,231
|
|
$
|
1,683,896,130
|
|
$
|
8,185,013,469
|
|
|
October 1-31, 2017
|
20,411,878
|
|
$
|
36.78
|
|
20,411,878
|
|
$
|
750,651,025
|
|
$
|
7,434,362,444
|
|
|
November 1-30, 2017
|
12,002,593
|
|
$
|
36.19
|
|
12,002,593
|
|
$
|
434,362,431
|
|
$
|
7,000,000,013
|
|
|
December 1-31, 2017
|
—
|
|
$
|
—
|
|
—
|
|
$
|
—
|
|
$
|
7,000,000,013
|
|
|
Total
|
130,980,737
|
|
$
|
38.21
|
|
130,854,061
|
|
$
|
4,999,999,987
|
|
$
|
7,000,000,013
|
|
|
(a)
|
Effective January 1, 2017, our Board of Directors increased our share repurchase program authorization to
$12 billion
, which does not have an expiration date. As of December 31, 2017, $7 billion remained under this authorization.
|
The total number of shares purchased during
2017
includes 126,676 shares received in the administration of employee share-based compensation plans.
|
28
|
Comcast 2017 Annual Report on Form 10-K
|
|
Under our publicly announced share repurchase program authorization, we may repurchase shares in the open market or in private transactions.
|
Comcast Common Stock Sales Price Table
|
The following table sets forth, for the indicated periods, the high and low sales prices of Comcast’s Class A common stock, on a post-split basis.
|
|
High
|
Low
|
|
2017
|
||
|
First Quarter
|
$38.44
|
$34.12
|
|
Second Quarter
|
$42.18
|
$36.99
|
|
Third Quarter
|
$41.99
|
$36.44
|
|
Fourth Quarter
|
$41.24
|
$34.78
|
|
2016
|
||
|
First Quarter
|
$30.68
|
$26.17
|
|
Second Quarter
|
$32.71
|
$29.81
|
|
Third Quarter
|
$34.18
|
$32.13
|
|
Fourth Quarter
|
$35.66
|
$30.02
|
|
Comcast 2017 Annual Report on Form 10-K
|
29
|
|
|
Stock Performance Graph
|
Comcast
The following graph compares the annual percentage change in the cumulative total shareholder return on Comcast’s Class A common stock during the five years ended December 31, 2017 with the cumulative total returns on the Standard & Poor’s 500 Stock Index and a select peer group consisting of us and other companies engaged in the cable, communications and media industries. This peer group consists of our common stock, DISH Network Corporation (Class A), Charter Communications, Inc., AT&T Inc., Verizon Communications Inc., CenturyLink, Inc., and Sprint Corporation (the “transmission and distribution subgroup”); and Time Warner Inc., Walt Disney Company, Viacom Inc. (Class B), Twenty-First Century Fox, Inc. (Class A), and CBS Corporation (Class B) (the “media subgroup”).
The peer group is constructed as a composite peer group in which the transmission and distribution subgroup is weighted 61% and the media subgroup is weighted 39% based on the respective revenue of our Cable Communications and NBCUniversal segments. The comparison assumes $100 was invested on December 31, 2012 in our Class A common stock and in each of the following indices and assumes the reinvestment of dividends.
|
Comparison of 5 Year Cumulative Total Return
|
||||
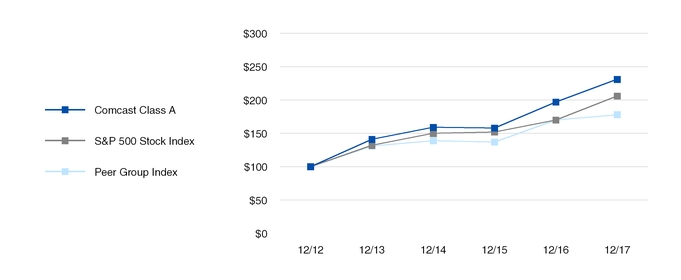
|
|
2013
|
|
2014
|
|
2015
|
|
2016
|
|
2017
|
|
|||||
|
Comcast Class A
|
|
$141
|
|
|
$159
|
|
|
$158
|
|
|
$197
|
|
|
$231
|
|
|
S&P 500 Stock Index
|
|
$132
|
|
|
$150
|
|
|
$152
|
|
|
$170
|
|
|
$206
|
|
|
Peer Group Index
|
|
$131
|
|
|
$139
|
|
|
$137
|
|
|
$170
|
|
|
$178
|
|
NBCUniversal
NBCUniversal is a wholly owned subsidiary of NBCUniversal Holdings and there is no market for its equity securities.
|
30
|
Comcast 2017 Annual Report on Form 10-K
|
|
|
Comcast
|
|
Year ended December 31 (in millions, except per share data)
|
2017
(c)
|
|
2016
|
|
2015
|
|
2014
|
|
2013
|
|
|||||
|
Statement of Income Data
|
|
|
|
|
|
||||||||||
|
Revenue
|
$
|
84,526
|
|
$
|
80,403
|
|
$
|
74,510
|
|
$
|
68,775
|
|
$
|
64,657
|
|
|
Operating income
|
17,987
|
|
16,859
|
|
15,998
|
|
14,904
|
|
13,563
|
|
|||||
|
Net income attributable to Comcast Corporation
(a)
|
22,714
|
|
8,695
|
|
8,163
|
|
8,380
|
|
6,816
|
|
|||||
|
Basic earnings per common share attributable to Comcast Corporation shareholders
(b)
|
4.82
|
|
1.80
|
|
1.64
|
|
1.62
|
|
1.30
|
|
|||||
|
Diluted earnings per common share attributable to Comcast Corporation shareholders
(b)
|
4.75
|
|
1.78
|
|
1.62
|
|
1.60
|
|
1.28
|
|
|||||
|
Dividends declared per common share
(b)
|
0.63
|
|
0.55
|
|
0.50
|
|
0.45
|
|
0.39
|
|
|||||
|
Balance Sheet Data (at year end)
|
|||||||||||||||
|
Total assets
|
$
|
186,949
|
|
$
|
180,500
|
|
$
|
166,574
|
|
$
|
159,186
|
|
$
|
158,672
|
|
|
Total debt, including current portion
|
64,556
|
|
61,046
|
|
52,621
|
|
48,081
|
|
47,706
|
|
|||||
|
Comcast Corporation shareholders’ equity
|
68,606
|
|
53,943
|
|
52,269
|
|
52,711
|
|
50,694
|
|
|||||
|
Statement of Cash Flows Data
|
|||||||||||||||
|
Net cash provided by (used in):
|
|||||||||||||||
|
Operating activities
|
21,403
|
|
19,825
|
|
19,485
|
|
17,596
|
|
14,685
|
|
|||||
|
Investing activities
|
(13,704
|
)
|
(18,385
|
)
|
(11,964
|
)
|
(8,733
|
)
|
(9,514
|
)
|
|||||
|
Financing activities
|
(7,572
|
)
|
(434
|
)
|
(9,136
|
)
|
(6,671
|
)
|
(14,404
|
)
|
|||||
|
(a)
|
For
2017
,
2016
and
2015
, refer to Item 7: Management’s Discussion and Analysis of Financial Condition and Results of Operations included in this Annual Report on Form 10-K for a discussion of the effects of items impacting net income attributable to Comcast Corporation. In
2017
,
2016
,
2015
,
2014
and
2013
, net income attributable to Comcast Corporation is stated after deducting net income attributable to noncontrolling interests of
$186 million
,
$350 million
,
$250 million
,
$212 million
and
$319 million
, respectively.
|
|
(b)
|
Per share amounts are presented on a post-split basis (see Note 1 to Comcast’s consolidated financial statements).
|
|
(c)
|
2017 net income attributable to Comcast Corporation and earnings per common share attributable to Comcast Corporation shareholders included a $12.7 billion net income tax benefit as a result of the impacts of the 2017 tax reform legislation. Refer to Item 7: Management’s Discussion and Analysis of Financial Condition and Results of Operations and Note 14 to Comcast’s consolidated financial statements for further discussion.
|
|
NBCUniversal
|
Omitted pursuant to General Instruction I(2)(a) to Form 10-K.
|
Comcast 2017 Annual Report on Form 10-K
|
31
|
|
|
Introduction and Overview
|
We are a global media and technology company with two primary businesses, Comcast Cable and NBCUniversal.
We present our operations for Comcast Cable in one reportable business segment, referred to as Cable Communications, and our operations for NBCUniversal in four reportable business segments: Cable Networks, Broadcast Television, Filmed Entertainment and Theme Parks (collectively, the “NBCUniversal segments”).
The following provides an overview of our businesses.
|
Consolidated Revenue, Net Income Attributable to Comcast Corporation and Adjusted EBITDA
(a)
|
|
(in billions)
|
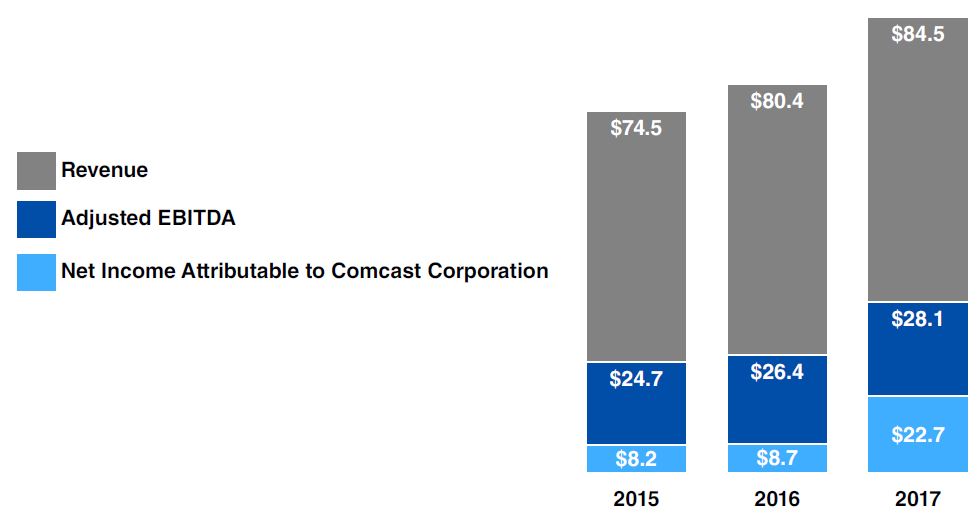
|
(a)
|
Adjusted EBITDA is a performance measure that is not defined by generally accepted accounting principles in the United States (“GAAP”). Refer to the “Non-GAAP Financial Measure” section on page
5
0 for additional information, including our definition and our use of Adjusted EBITDA, and for a reconciliation from net income attributable to Comcast Corporation to Adjusted EBITDA.
|
|
2017 Consolidated Operating Results by Segment
(a)
|
|
Revenue
|
Adjusted EBITDA
|
|||
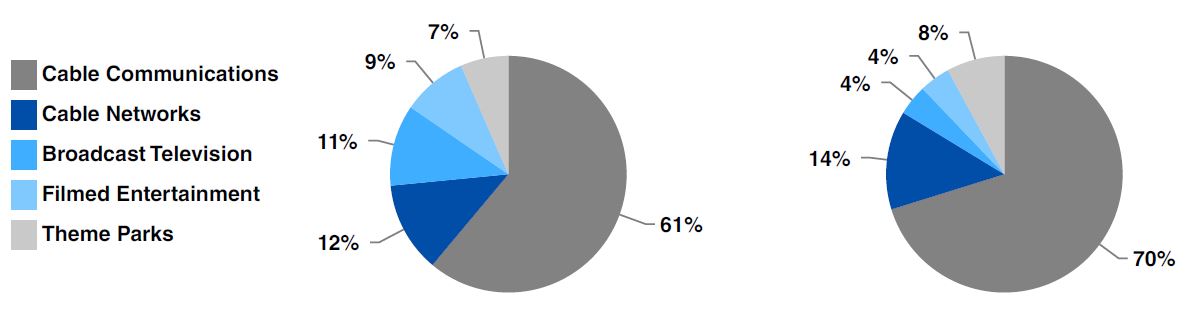
|
(a)
|
Charts exclude the results of NBCUniversal Headquarters and Other, Corporate and Other, and eliminations.
|
|
32
|
Comcast 2017 Annual Report on Form 10-K
|
|
Cable Communications Segment
Comcast Cable
is one of the nation’s largest providers of video, high-speed Internet, voice, and security and automation services (“cable services”) to residential customers under the Xfinity brand
;
we also provide these and other services to business customers
and sell advertising. As of
December 31, 2017
, our cable systems had
29.3 million
total customer relationships, including
27.2 million
residential customer relationships and
2.2 million
business customer relationships, and passed more than
57 million
homes and businesses.
Our Cable Communications segment generates revenue primarily from residential and business customers that subscribe to our cable services, which we market individually and as bundled services, and from the sale of advertising. Customers
are typically billed in advance on a monthly basis
based on the services and features they receive
and the types of equipment they use
.
A portion of our residential customers are subject to minimum-term contracts for their cable services, which are typically 2 years in length. Substantially all of our business customers are initially under minimum-term contracts, which typically range from 2 to 5 years. Customers with minimum-term contracts may only discontinue service in accordance with the terms of their contracts.
NBCUniversal Segments
NBCUniversal is one of the world’s leading media and entertainment companies that develops, produces and distributes entertainment, news and information, sports, and other content for global audiences, and owns and operates theme parks worldwide.
Cable Networks
Our Cable Networks segment consists primarily of a diversified portfolio of cable television networks. Our cable networks are comprised of our national cable entertainment networks (USA Network, E!, Syfy, Bravo, Oxygen and Universal Kids), our national cable news and information networks (MSNBC, CNBC and CNBC World), our national cable sports networks (NBC Sports Network, Golf Channel and Olympic Channel),
our regional sports and news networks, our international cable networks
,
our cable television studio production operations
, and
our various digital properties
.
Our Cable Networks segment generates revenue primarily from the distribution and licensing of its programming and from the sale of advertising on its networks and digital properties.
Broadcast Television
Our Broadcast Television segment consists primarily of the NBC and Telemundo broadcast television networks,
our NBC and Telemundo owned local broadcast television stations
,
the NBC Universo national cable network
,
our broadcast television studio production operations
, and
our various digital properties
.
Our Broadcast Television segment generates revenue primarily from the sale of advertising on its networks and digital properties, from the licensing of its programming, and from the fees received under retransmission consent agreements and associated fees received from NBC-affiliated local broadcast television stations.
Filmed Entertainment
Our Filmed Entertainment segment primarily
produces, acquires, markets and distributes filmed entertainment worldwide
. Our
films are produced primarily under the Universal Pictures, Illumination, DreamWorks Animation and Focus Features names
.
Our Filmed Entertainment segment generates revenue primarily from the worldwide distribution of films we produce or acquire for exhibition in movie theaters and from the licensing and sale of produced and acquired films.
Theme Parks
Our Theme Parks segment consists
primarily of our Universal theme parks in Orlando, Florida; Hollywood, California; and Osaka, Japan
. In addition, along with a consortium of Chinese state-owned companies, we are developing a theme park in China.
Our Theme Parks segment generates revenue primarily from ticket sales and guest spending at our Universal theme parks.
Corporate and Other
Our other business interests consist primarily of the operations of
Comcast Spectacor, which owns the Philadelphia Flyers and the Wells Fargo Center arena in Philadelphia, Pennsylvania and operates arena management-related businesses
.
We are also pursuing other business development initiatives, such as our
wireless phone service that we launched in the second quarter of 2017
using our virtual network operator rights to provide the service over Verizon’s wireless network and our existing network of in-home and outdoor Wi-Fi hotspots. We offer the wireless phone service only as part of our bundled service offerings to residential customers that subscribe to our high-speed Internet service within our cable distribution footprint and may in the future also offer wireless phone service to our small business customers on similar terms. The wireless phone service has success-based working capital requirements, primarily associated with the procurement of handsets, which customers are able to pay for upfront or finance interest-free over 24 months, and other equipment.
|
Comcast 2017 Annual Report on Form 10-K
|
33
|
|
2017
Developments
The following are the more significant developments in our businesses during
2017
:
Cable Communications Segment
|
•
|
An increase in revenue of
4.9%
to
$52.5 billion
and an increase in Adjusted EBITDA of
5.3%
to
$21.2 billion
|
|
•
|
An increase in operating margin from
40.2%
to
40.3%
that reflects increases in high-speed Internet, video and business services revenue, offset by higher programming expenses
|
|
•
|
An increase in capital expenditures of
4.7%
to
$8.0 billion
that reflects:
|
|
•
|
increased investments in scalable infrastructure to increase network capacity;
|
|
•
|
increased investments in line extensions, primarily for the expansion of our business services; and
|
|
•
|
decreased spending on customer premise equipment
|
NBCUniversal Segments
|
•
|
An increase in total NBCUniversal revenue of
4.4%
to
$33.0 billion
; total NBCUniversal revenue increased 10.1% excluding $1.6 billion of revenue associated with our broadcast of the Rio Olympics in August 2016
|
|
•
|
An increase in total NBCUniversal Adjusted EBITDA of
14.1%
to
$8.2 billion
|
|
•
|
An increase in Cable Networks segment revenue of
1.6%
and a decrease in Broadcast Television segment revenue of
5.9%
, including the impact of our broadcast of the 2016 Rio Olympics; excluding revenue associated with the Olympics, Cable Networks and Broadcast Television segments revenue increased 6.0% and 6.6%, respectively, primarily due to increases in distribution revenue
|
|
•
|
An increase in Filmed Entertainment segment revenue of
20.4%
primarily due to the success of
The
Fate of the Furious
,
Despicable Me 3 and Fifty Shades Darker
|
|
•
|
An increase in Theme Parks segment revenue of
10.0%
reflecting the continued success of
The Wizarding World of Harry Potter™
attraction in Hollywood, which opened in April 2016, and the openings of
Minion Park™
in Japan in April 2017 and
Volcano Bay™
in Orlando in May 2017
|
|
•
|
The acquisition of the remaining interests in Universal Studios Japan that we did not already own for $2.3 billion
|
Corporate and Other
|
•
|
The launch of our wireless phone service in the second quarter of 2017 to our residential cable customers
|
|
•
|
The acquisition of rights to $1.7 billion of spectrum, as well as the receipt of proceeds of $482 million related to NBCUniversal’s relinquishment of spectrum rights
|
|
•
|
Cash capital contributions to Atairos totaling
$994 million
, which brought our investment in Atairos to $2.4 billion as of December 31, 2017
|
|
•
|
The enactment of new federal tax reform legislation in December 2017 which, among other things, reduced the federal corporate tax rate to 21% from 35%, effective January 1, 2018, resulting in a $12.7 billion net income tax benefit recorded in the fourth quarter of 2017 primarily due to a reduction of our net deferred tax liability
|
Competition
The results of operations of our reportable business segments are affected by competition, as all of our businesses operate in intensely competitive, consumer-driven and rapidly changing environments and compete with a growing number of companies that provide a broad range of communications products and services and entertainment, news and information content to consumers. Technological changes are further intensifying and complicating the competitive landscape and challenging existing business models. In particular, consumers are increasingly turning to online sources for viewing and purchasing content, which has and likely will continue to reduce the number of our video customers and subscribers to our cable networks even as it makes our high-speed Internet services more valuable to consumers. In addition, the increasing number of entertainment choices available has intensified audience fragmentation, which has and likely will continue to adversely affect the audience ratings of our cable networks and broadcast television programming.
For additional information on the competition our businesses face, see Item 1: Business and Item 1A: Risk Factors. Within the Business section, refer to the “Competition” discussion, and within the Risk Factors section, refer to the risk factors entitled “Our businesses currently face a wide range of competition, and our businesses and results of operations could be adversely affected if we do not compete effectively” and “Changes in consumer behavior driven by online distribution platforms for viewing content could adversely affect our businesses and challenge existing business models.”
|
34
|
Comcast 2017 Annual Report on Form 10-K
|
|
Seasonality and Cyclicality
Each of our businesses is subject to seasonal and cyclical variations. In our Cable Communications segment, our results are impacted by the seasonal nature of residential customers receiving our cable services in college and vacation markets. This generally results in fewer net customer relationship additions in the second quarter of each year.
Revenue in our Cable Communications, Cable Networks and Broadcast Television segments is subject to cyclical advertising patterns and changes in viewership levels. Advertising revenue in the U.S. is generally higher in the second and fourth quarters of each year, due in part to increases in consumer advertising in the spring and in the period leading up to and including the holiday season. Advertising revenue in the U.S. is also cyclical, with a benefit in even-numbered years due to advertising related to candidates running for political office and issue-oriented advertising. Revenue in our Cable Networks and Broadcast Television segments fluctuates depending on the timing of when our programming is aired, which typically results in higher advertising revenue in the second and fourth quarters of each year.
Our revenue and operating costs and expenses (comprised of total costs and expenses, excluding depreciation and amortization expense and other operating gains) are cyclical as a result of our periodic broadcasts of major sporting events, such as the Olympic Games, which affect our Cable Networks and Broadcast Television segments, and the Super Bowl, which affects our Broadcast Television segment. In particular, our advertising revenue increases due to increased demand for advertising time and our distribution revenue increases in the period of these broadcasts. Our operating costs and expenses also increase as a result of our production costs for these broadcasts and the amortization of the related rights fees.
Revenue in our Filmed Entertainment segment fluctuates due to the timing, nature and number of films released in movie theaters, on standard-definition digital video discs and Blu-ray discs (together, “DVDs”), and through various other distribution platforms. Release dates are determined by several factors, including competition and the timing of vacation and holiday periods. As a result, revenue tends to be seasonal, with increases experienced each year during the summer months and around the holiday season. Content licensing revenue in our Cable Networks, Broadcast Television and Filmed Entertainment segments also fluctuates due to the timing of when our content is made available to licensees.
Revenue in our Theme Parks segment fluctuates with changes in theme park attendance that result from the seasonal nature of vacation travel and weather variations, local entertainment offerings and the opening of new attractions as well as with changes in currency exchange rates. Our theme parks generally experience peak attendance during the spring holiday period, the summer months when schools are closed and the holiday season.
|
Consolidated Operating Results
|
|
Year ended December 31 (in millions)
|
2017
|
|
2016
|
|
2015
|
|
% Change
2016 to 2017 |
|
% Change
2015 to 2016 |
|
|||
|
Revenue
|
$
|
84,526
|
|
$
|
80,403
|
|
$
|
74,510
|
|
5.1
|
%
|
7.9
|
%
|
|
Costs and Expenses:
|
|||||||||||||
|
Programming and production
|
25,384
|
|
24,463
|
|
22,550
|
|
3.8
|
|
8.5
|
|
|||
|
Other operating and administrative
|
25,013
|
|
23,416
|
|
21,325
|
|
6.8
|
|
9.8
|
|
|||
|
Advertising, marketing and promotion
|
6,317
|
|
6,107
|
|
5,957
|
|
3.4
|
|
2.5
|
|
|||
|
Depreciation
|
7,914
|
|
7,464
|
|
6,781
|
|
6.0
|
|
10.1
|
|
|||
|
Amortization
|
2,353
|
|
2,094
|
|
1,899
|
|
12.4
|
|
10.3
|
|
|||
|
Other operating gains
|
(442
|
)
|
—
|
|
—
|
|
NM
|
|
NM
|
|
|||
|
Operating income
|
17,987
|
|
16,859
|
|
15,998
|
|
6.7
|
|
5.4
|
|
|||
|
Other income (expense) items, net
|
(2,665
|
)
|
(2,506
|
)
|
(2,626
|
)
|
6.4
|
|
(4.6
|
)
|
|||
|
Income before income taxes
|
15,322
|
|
14,353
|
|
13,372
|
|
6.7
|
|
7.3
|
|
|||
|
Income tax benefit (expense)
|
7,578
|
|
(5,308
|
)
|
(4,959
|
)
|
NM
|
|
7.0
|
|
|||
|
Net income
|
22,900
|
|
9,045
|
|
8,413
|
|
153.2
|
|
7.5
|
|
|||
|
Net (income) loss attributable to noncontrolling interests and redeemable subsidiary preferred stock
|
(186
|
)
|
(350
|
)
|
(250
|
)
|
(46.6
|
)
|
39.3
|
|
|||
|
Net income attributable to Comcast Corporation
|
$
|
22,714
|
|
$
|
8,695
|
|
$
|
8,163
|
|
161.2
|
%
|
6.5
|
%
|
|
Adjusted EBITDA
(a)
|
$
|
28,062
|
|
$
|
26,417
|
|
$
|
24,678
|
|
6.2
|
%
|
7.0
|
%
|
All percentages are calculated based on actual amounts. Minor differences may exist due to rounding.
Percentage changes that are considered not meaningful are denoted with NM.
|
(a)
|
Adjusted EBITDA is a non-GAAP performance measure. Refer to the “Non-GAAP Financial Measure” section on page
5
0
for additional information, including our definition and our use of Adjusted EBITDA, and for a reconciliation from net income attributable to Comcast Corporation to Adjusted EBITDA.
|
|
Comcast 2017 Annual Report on Form 10-K
|
35
|
|
Consolidated Revenue
The following graph illustrates the contributions to the increases in consolidated revenue made by our Cable Communications and NBCUniversal segments, as well as by Corporate and Other activities including eliminations.
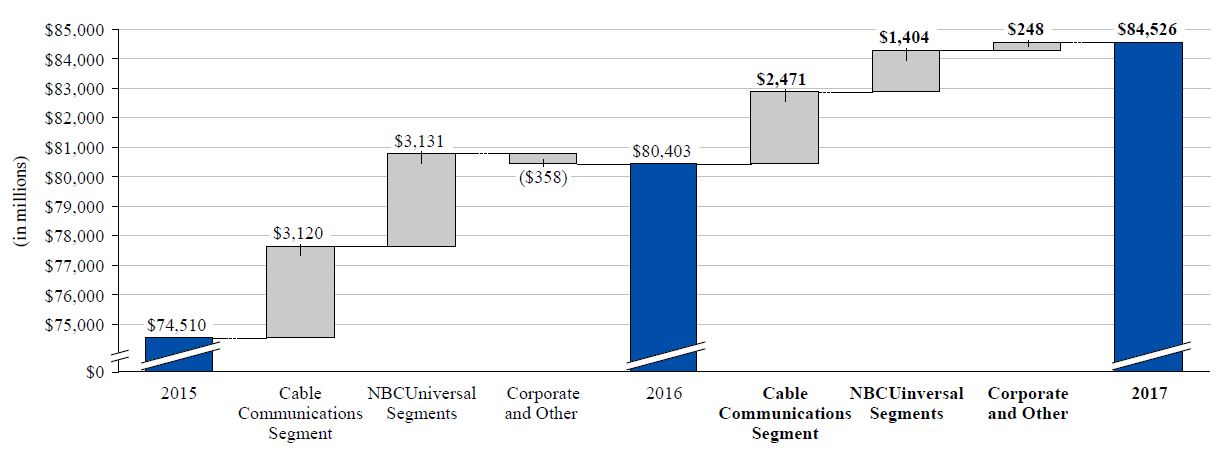
The primary drivers of the changes in revenue were as follows:
2017
|
•
|
Growth in our Cable Communications segment driven by revenue from residential high-speed Internet and video services and business services
|
|
•
|
Growth in our NBCUniversal segments driven by Filmed Entertainment and Theme Parks, partially offset by revenue in 2016 associated with our broadcast of the 2016 Rio Olympics
|
2016
|
•
|
Growth in our Cable Communications segment driven by revenue from residential high-speed Internet and video services and business services
|
|
•
|
Our broadcast of the 2016 Rio Olympics, which was reported in our NBCUniversal segments
|
Revenue for our segments is discussed separately below under the heading “Segment Operating Results.” Revenue for our other businesses and business development initiatives is discussed separately under the heading “Corporate and Other Results of Operations.”
|
36
|
Comcast 2017 Annual Report on Form 10-K
|
|
Consolidated Costs and Expenses
The following graph illustrates the contributions to the increases in consolidated operating costs and expenses made by our Cable
Communications and NBCUniversal segments, as well as by Corporate and Other activities including eliminations.
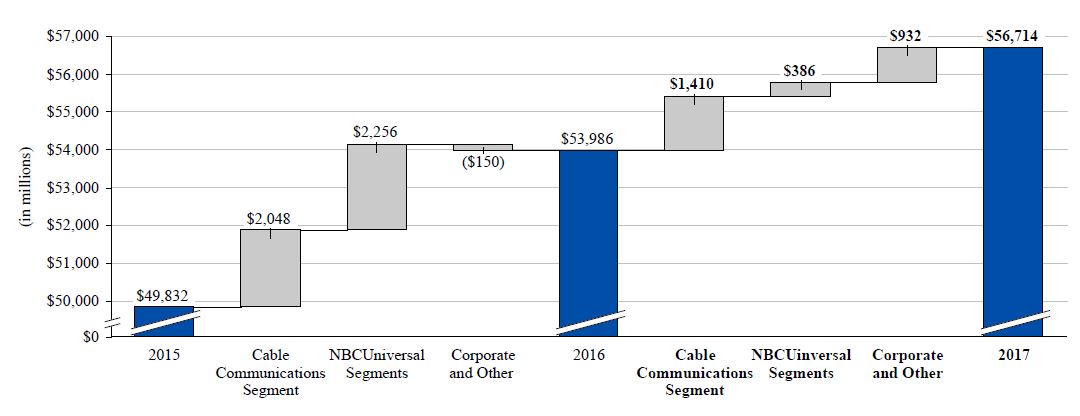
The primary drivers of the changes in operating costs and expenses were as follows:
2017
|
•
|
An increase in programming expenses in our Cable Communications segment
|
|
•
|
An increase in programming and production expenses in our Filmed Entertainment segment, partially offset by expenses in 2016 associated with our broadcast of the 2016 Rio Olympics
|
|
•
|
An increase in Corporate and Other activities driven by the launch of our wireless phone service
|
2016
|
•
|
An increase in programming expenses in our Cable Communications segment
|
|
•
|
Our broadcast of the 2016 Rio Olympics, which was reported in our NBCUniversal segments
|
Operating costs and expenses for our segments is discussed separately below under the heading “Segment Operating Results.” Operating costs and expenses for our corporate operations, other businesses and business development initiatives is discussed separately below under the heading “Corporate and Other Results of Operations.”
|
Consolidated Depreciation and Amortization Expense
|
|||||||||||||
|
Year ended December 31 (in millions)
|
2017
|
|
2016
|
|
2015
|
|
% Change
2016 to 2017 |
|
% Change
2015 to 2016 |
|
|||
|
Cable Communications
|
$
|
8,143
|
|
$
|
7,670
|
|
$
|
7,051
|
|
6.2
|
%
|
8.8
|
%
|
|
NBCUniversal
|
2,041
|
|
1,805
|
|
1,539
|
|
13.1
|
|
17.3
|
|
|||
|
Corporate and Other
|
83
|
|
83
|
|
90
|
|
(0.5
|
)
|
(7.3
|
)
|
|||
|
Comcast Consolidated
|
$
|
10,267
|
|
$
|
9,558
|
|
$
|
8,680
|
|
7.4
|
%
|
10.1
|
%
|
Consolidated depreciation and amortization expense increased in
2017
and
2016
primarily due to increases in capital expenditures, as well as expenditures for software, in our Cable Communications segment in recent years. We continue to invest to increase our network capacity and in customer premise equipment, primarily for our X1 platform, cloud DVR technology and wireless gateways. Certain of these assets in our Cable Communications segment have relatively short estimated useful lives, which increased depreciation expense in 2017 and 2016 and will continue to increase depreciation expense in
2018
. NBCUniversal depreciation and amortization expense also increased primarily due to our continued investment in new attractions in our Theme Parks segment, including for Universal Studios Japan.
|
Comcast 2017 Annual Report on Form 10-K
|
37
|
|
Consolidated Other Operating Gains
Consolidated other operating gains for
2017
included $337 million related to NBCUniversal’s relinquishment of spectrum rights (see Note 5 to Comcast’s consolidated financial statements and Note 4 to NBCUniversal
’
s consolidated financial statements) and $105 million related to the sale of a business in Corporate and Other (see Note 7 to Comcast
’
s consolidated financial statements).
|
Segment Operating Results
|
Our segment operating results are presented based on how we assess operating performance and internally report financial information. We use Adjusted EBITDA as the measure of profit or loss for our operating segments. Adjusted EBITDA is defined as net income attributable to Comcast Corporation before net (income) loss attributable to noncontrolling interests and redeemable subsidiary preferred stock, income tax benefit (expense), total other income (expense), depreciation and amortization expense, and other operating gains, and excluding impairment charges related to fixed and intangible assets and gains or losses on the sale of long-lived assets, if any. From time to time we may exclude from Adjusted EBITDA the impact of events, gains, losses or other charges (such as significant legal settlements) that affect the period-to-period comparability of our operating performance. Adjusted EBITDA for our segments is not a non-GAAP financial measure. We reconcile the aggregate amount of Adjusted EBITDA for our reportable business segments to consolidated income before income taxes in the notes to our consolidated financial statements (see Note 17 to Comcast’s consolidated financial statements and Note 15 to NBCUniversal’s consolidated financial statements).
To be consistent with our current management reporting presentation, certain 2016 and 2015 operating results were reclassified within the Cable Communications segment.
The revenue and operating costs and expenses associated with our broadcast of the 2016 Rio Olympics were reported in our Cable Networks and Broadcast Television segments. The revenue and operating costs and expenses associated with our broadcast of the 2015 Super Bowl were reported in our Broadcast Television segment.
|
Cable Communications Segment Results of Operations
|
|
Revenue and Adjusted EBITDA
|
Residential Customer Relationships
|
|
|
(in billions)
|
(in millions)
|
|
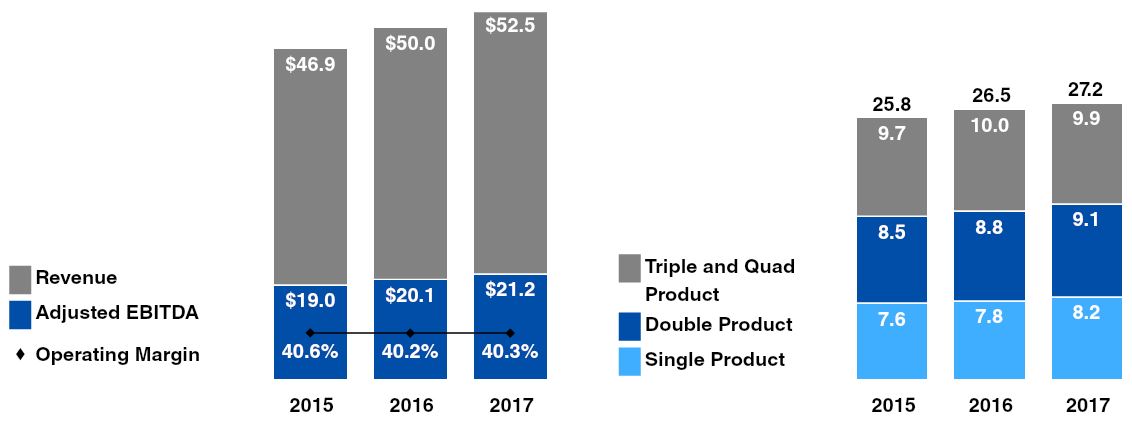
|
38
|
Comcast 2017 Annual Report on Form 10-K
|
|
|
Year ended December 31 (in millions)
|
2017
|
|
2016
|
|
2015
|
|
% Change
2016 to 2017 |
|
% Change
2015 to 2016 |
|
|||
|
Revenue
|
|||||||||||||
|
Residential:
|
|||||||||||||
|
Video
|
$
|
23,129
|
|
$
|
22,357
|
|
$
|
21,526
|
|
3.5
|
%
|
3.9
|
%
|
|
High-speed Internet
|
14,769
|
|
13,532
|
|
12,471
|
|
9.1
|
|
8.5
|
|
|||
|
Voice
|
3,391
|
|
3,540
|
|
3,608
|
|
(4.2
|
)
|
(1.9
|
)
|
|||
|
Business services
|
6,216
|
|
5,514
|
|
4,751
|
|
12.7
|
|
16.1
|
|
|||
|
Advertising
|
2,257
|
|
2,476
|
|
2,229
|
|
(8.8
|
)
|
11.1
|
|
|||
|
Other
|
2,757
|
|
2,629
|
|
2,343
|
|
4.8
|
|
12.2
|
|
|||
|
Total revenue
|
52,519
|
|
50,048
|
|
46,928
|
|
4.9
|
|
6.6
|
|
|||
|
Operating costs and expenses
|
|||||||||||||
|
Programming
|
12,907
|
|
11,576
|
|
10,516
|
|
11.5
|
|
10.1
|
|
|||
|
Technical and product support
|
6,425
|
|
6,323
|
|
5,985
|
|
1.6
|
|
5.6
|
|
|||
|
Customer service
|
2,455
|
|
2,482
|
|
2,393
|
|
(1.1
|
)
|
3.7
|
|
|||
|
Advertising, marketing and promotion
|
3,562
|
|
3,540
|
|
3,363
|
|
0.6
|
|
5.3
|
|
|||
|
Franchise and other regulatory fees
|
1,518
|
|
1,481
|
|
1,382
|
|
2.4
|
|
7.2
|
|
|||
|
Other
|
4,482
|
|
4,537
|
|
4,252
|
|
(1.2
|
)
|
6.7
|
|
|||
|
Total operating costs and expenses
|
31,349
|
|
29,939
|
|
27,891
|
|
4.7
|
|
7.3
|
|
|||
|
Adjusted EBITDA
|
$
|
21,170
|
|
$
|
20,109
|
|
$
|
19,037
|
|
5.3
|
%
|
5.6
|
%
|
|
Customer Metrics
|
|||||||||||||||
|
|
Total Customers
|
Net Additional Customers
|
|||||||||||||
|
(in thousands, except per customer amounts)
|
2017
|
|
2016
|
|
2015
|
|
2017
|
|
2016
|
|
2015
|
|
|||
|
Video
|
|||||||||||||||
|
Residential customers
|
21,303
|
|
21,488
|
|
21,385
|
|
(186
|
)
|
103
|
|
(123
|
)
|
|||
|
Business services customers
|
1,054
|
|
1,019
|
|
962
|
|
35
|
|
57
|
|
87
|
|
|||
|
Total video customers
|
22,357
|
|
22,508
|
|
22,347
|
|
(151
|
)
|
161
|
|
(36
|
)
|
|||
|
High-speed Internet
|
|||||||||||||||
|
Residential customers
|
23,863
|
|
22,827
|
|
21,610
|
|
1,036
|
|
1,218
|
|
1,202
|
|
|||
|
Business services customers
|
2,006
|
|
1,874
|
|
1,719
|
|
132
|
|
155
|
|
165
|
|
|||
|
Total high-speed Internet customers
|
25,869
|
|
24,701
|
|
23,329
|
|
1,168
|
|
1,373
|
|
1,367
|
|
|||
|
Voice
|
|||||||||||||||
|
Residential customers
|
10,316
|
|
10,546
|
|
10,436
|
|
(231
|
)
|
110
|
|
173
|
|
|||
|
Business services customers
|
1,236
|
|
1,140
|
|
1,039
|
|
96
|
|
101
|
|
109
|
|
|||
|
Total voice customers
|
11,552
|
|
11,687
|
|
11,475
|
|
(135
|
)
|
211
|
|
282
|
|
|||
|
Security and automation
|
|||||||||||||||
|
Security and automation customers
|
1,131
|
|
891
|
|
612
|
|
239
|
|
279
|
|
212
|
|
|||
|
Customer relationships
|
|||||||||||||||
|
Residential customer relationships
|
27,168
|
|
26,533
|
|
25,828
|
|
635
|
|
705
|
|
499
|
|
|||
|
Business services customer relationships
|
2,179
|
|
2,044
|
|
1,887
|
|
135
|
|
157
|
|
170
|
|
|||
|
Total customer relationships
|
29,347
|
|
28,577
|
|
27,715
|
|
770
|
|
862
|
|
670
|
|
|||
|
Residential customer relationships mix
|
|||||||||||||||
|
Single product customers
|
8,196
|
|
7,756
|
|
7,647
|
|
439
|
|
110
|
|
(101
|
)
|
|||
|
Double product customers
|
9,056
|
|
8,797
|
|
8,478
|
|
259
|
|
319
|
|
339
|
|
|||
|
Triple and quad product customers
|
9,916
|
|
9,980
|
|
9,703
|
|
(64
|
)
|
277
|
|
260
|
|
|||
|
Average monthly total revenue per customer relationship
|
$
|
151.11
|
|
$
|
148.18
|
|
$
|
142.83
|
|
|
|
|
|
|
|
Customer metrics are presented based on actual amounts. Minor differences may exist due to rounding. For multiple dwelling units (“MDUs”), including buildings located on college campuses, whose residents have the ability to receive additional cable services, such as additional programming choices or our high-definition video (“HD”) or digital video recorder (“DVR”) advanced services, we count and report customers based on the number of potential billable relationships within each MDU. For MDUs whose residents are not able to receive additional cable services, the MDU is counted as a single customer. In 2017, we began to offer prepaid services that allow customers to prepay for at least 30 days of service. Residential video and high-speed Internet customers as of December 31, 2017 included prepaid customers totaling approximately
3,000
and
60,000
, respectively. Customer relationships represent the number of residential and business customers that subscribe to at least one of our cable services. Single product, double product, and triple and quad product customers represent residential customers that subscribe to one, two, or three and four of our cable services, respectively. Beginning in 2017, we include customers subscribing to our security and automation services in customer relationship information. All periods presented have been adjusted for the inclusion of security and automation customers.
|
Comcast 2017 Annual Report on Form 10-K
|
39
|
|
Cable Communications Segment – Revenue
Video
Our Cable Communications segment offers a broad variety of video services packages that may include premium networks, pay-per-view services and our On Demand service. Our video customers may subscribe for additional fees to our HD and DVR advanced services. We continue to deploy set-top boxes for our Internet Protocol (“IP”) and cloud-enabled video platform, referred to as our X1 platform, and cloud DVR technology throughout our footprint.
Video revenue increased
3.5%
and
3.9%
in
2017
and
2016
, respectively. The increases in revenue in both years were primarily due to rate adjustments and increases in the number of residential customers subscribing to additional services such as premium channels and advanced services, which accounted for substantially all of the increases in both
2017
and
2016
. The increase in 2017 was partially offset by a decrease in the number of residential video customers. As of
December 31, 2017
, 15.0 million customers subscribed to at least one of our HD or DVR advanced services compared to 14.8 million customers and 13.9 million customers as of
December 31, 2016
and
2015
, respectively.
We have experienced, and may experience in the future, declines in the number of residential video customers due to competitive pressures and the impact of rate adjustments. Competition is intense, both from traditional multichannel video providers and from new technologies and distribution platforms for viewing content. We are responding to this competition, and have attempted to mitigate industry-wide declines in residential video customers at traditional multichannel video providers, through our X1 platform and sales and marketing programs, such as promotions, bundled service offerings and service offerings targeted at specific market segments. As of
December 31, 2017
,
39.1%
of the homes and businesses in the areas we serve subscribed to our video services, compared to
39.9%
and
40.1%
as of
December 31, 2016
and
2015
, respectively.
High-Speed Internet
We offer high-speed Internet services with downstream speeds that range up to 1 gigabit per second (“Gbps”) and fiber-based speeds that range up to 2 Gbps. Throughout our footprint, we
continue to deploy wireless gateways that combine a customer’s wireless router, cable modem and voice adapter to improve the performance of multiple IP-enabled devices used at the same time within the home, provide faster Internet speeds and create an in-home Wi-Fi network. We continue to expand our network of residential, outdoor and business Wi-Fi hotspots to allow most of our high-speed Internet customers to access our high-speed Internet services inside and outside the home. As of December 31, 2017, there were approximately 18.8 million of these hotspots
.
High-speed Internet revenue increased
9.1%
and
8.5%
in
2017
and
2016
, respectively. Increases in the number of residential customers receiving our high-speed Internet services accounted for increases in revenue of 5.1% and 5.8% in
2017
and
2016
, respectively. The remaining increases in revenue in both
2017
and
2016
were primarily due to increases in the number of customers receiving higher levels of service and the impact of rate adjustments.
We believe our customer base will continue to grow as consumers choose our high-speed Internet service and seek higher-speed offerings. As of
December 31, 2017
,
45.2%
of the homes and businesses in the areas we serve subscribed to our high-speed Internet services, compared to
43.8%
and
41.9%
as of
December 31, 2016
and
2015
, respectively.
Voice
We offer voice services that provide local and long-distance calling and other related features.
Voice revenue decreased
4.2%
and
1.9%
in
2017
and
2016
, respectively. The decreases were primarily due to the allocation of voice revenue for our customers who receive bundled services. The amount allocated to voice revenue in the rate charged for bundled services decreased in both years because video and high-speed Internet rates increased while voice rates remained relatively flat. The decrease in revenue in 2017 was also partially due to a decrease in the number of residential voice customers, which may continue to decline.
As of
December 31, 2017
,
20.2%
of the homes and businesses in the areas we serve subscribed to our voice services, compared to
20.7%
and
20.6%
as of
December 31, 2016
and
2015
, respectively.
Business Services
We offer a variety of products and services to meet the demands of businesses, with downstream speeds that range up to 1 Gbps and fiber-based speeds that range up to 10 Gbps. Our small business services offerings primarily include high-speed Internet services, as well as voice and video services, similar to those that we provide to our residential customers, and also include cloud-based solutions that provide file sharing, online backup and web conferencing, among other features. We also offer Ethernet network services that connect multiple locations and provide higher downstream and upstream speed options to medium-sized customers and larger enterprises, as well as advanced voice services. In addition, we provide cellular backhaul services to mobile network operators to help these customers manage their network bandwidth.
|
40
|
Comcast 2017 Annual Report on Form 10-K
|
|
Recently, we have expanded our enterprise service offerings to include a software-defined networking product and our managed solutions business to offer enterprise customers support related to Wi-Fi networks, router management, network security, business continuity risks and other services. We primarily offer our enterprise service offerings to Fortune 1000 companies and other large enterprises with multiple locations both within and outside of our cable distribution footprint where we have agreements with other companies to use their networks to provide coverage outside of our service areas.
Business services revenue increased
12.7%
and
16.1%
in
2017
and
2016
, respectively. The increases in
2017
and
2016
were primarily due to increases in the number of customers receiving our small business services offerings, as well as our medium-sized business services offerings. In
2017
,
2016
and
2015
, revenue from our small business services offerings represented the majority of our total business services revenue. We believe the increases in the number of business customers were primarily the result of our efforts to gain market share from competitors by offering competitive services and pricing, although the rate of growth in the number of our small business customers may slow as the business matures.
Advertising
As part of our distribution agreements with cable networks, we generally receive an allocation of scheduled advertising time on cable networks that we sell through our advertising business to local, regional and national advertisers. In most cases, the available advertising units are sold by our sales force. In some cases, we work with representation firms as an extension of our sales force to sell a portion of the advertising units allocated to us. We also represent the advertising sales efforts of other multichannel video providers in some markets. In addition, we generate revenue from the sale of advertising online and on our On Demand service.
Advertising revenue is affected by the strength of the advertising market, general economic conditions, and cyclicality related to political campaigns and issue-oriented advertising.
Advertising revenue decreased
8.8%
in
2017
primarily due to a decrease in political advertising revenue. Advertising revenue increased
11.1%
in
2016
primarily due to an increase in political advertising revenue. Excluding the impact of political advertising revenue, advertising decreased 1.6% in 2017 and increased slightly in 2016.
In
2017
, 5% of our Cable Communications segment advertising revenue was generated from our NBCUniversal segments, compared to 5% and 6% in
2016
and
2015
, respectively. These amounts are eliminated in our consolidated financial statements but are included in the amounts presented above.
Other
Other revenue primarily includes revenue related to cable franchise and other regulatory fees. We also receive revenue related to fees from other services, such as our security and automation services.
Cable franchise and other regulatory fees represent the fees we are required to pay to federal, state and local authorities that we pass through to our customers. Under the terms of our cable franchise agreements, we are generally required to pay to the cable franchising authority an amount based on our gross video revenue
. The changes in franchise and other regulatory fees collected from our cable services customers are generally due to changes in the revenue to which the fees apply.
Other revenue increased
4.8%
and
12.2%
in
2017
and
2016
, respectively, primarily due to increases in cable franchise and other regulatory fees, revenue from our security and automation services, and our X1 licensing agreements.
Cable Communications Segment – Operating Costs and Expenses
Programming Expenses
Programming expenses, which represent our most significant operating expense, are the fees we incur to provide content to our video customers. These expenses are affected by the programming license fees charged by cable networks, the fees charged for retransmission of the signals from local broadcast television stations, the number of video customers we serve and the amount of content we provide. Programming expenses increased in
2017
and
2016
primarily due to the timing of contract renewals and other increases in programming license fees, including retransmission consent fees and sports programming costs.
We anticipate that our programming expenses will continue to increase as the fees we pay increase, including retransmission consent fees and sports programming costs; as we provide additional content to our video customers; and as we deliver this content through an increasing number of platforms, including On Demand, online and through our mobile apps.
Technical and Product Support Expenses
Technical and product support expenses include costs to complete service call and installation activities, as well as costs for network operations, product development, fulfillment and provisioning. Technical and product support expenses increased in
2017
and
2016
primarily due to expenses related to the development, deployment and support of our X1 platform, cloud DVR technology and wireless gateways, and continued growth in business services and security and automation services. The increase in 2016 was also due to expenses related to investments to improve the customer experience.
|
Comcast 2017 Annual Report on Form 10-K
|
41
|
|
Customer Service Expenses
Customer service expenses include the personnel and other costs associated with handling the sale of services to customers and customer service activity. Customer service expenses remained relatively flat in 2017 primarily due to reduced call volumes, which were partially offset by increased personnel costs. Customer service expenses increased in 2016 primarily due to increased support for improving the customer experience and increases in total labor costs, which reflected sales and support activities associated with the deployment of our X1 platform and wireless gateways, and growth in business services and security and automation services.
Advertising, Marketing and Promotion Expenses
Advertising, marketing and promotion expenses include the costs associated with attracting new customers and promoting our service offerings. Advertising, marketing and promotion expenses were relatively flat in
2017
compared to
2016
. Advertising, marketing and promotion expenses in 2016 included an increase in advertising expenses associated with the 2016 Rio Olympics.
Franchise and Other Regulatory Fees
Cable franchise and other regulatory fees represent the fees we are required to pay to federal, state and local authorities under the terms of our cable franchise agreements. Franchise and other regulatory fees increased in
2017
and
2016
primarily due to increases in the revenue to which the fees apply.
Other Operating Costs and Expenses
Other operating costs and expenses remained relatively flat in 2017. Other operating costs and expenses increased in
2016
primarily due to an increase in costs to support our advertising sales business, as well as an increase in other administrative costs.
Cable Communications Segment – Operating Margin
Our Cable Communications segment operating margin is Adjusted EBITDA as a percentage of revenue. The most significant operating costs and expenses for our Cable Communications segment are the programming expenses we incur to provide content to our video customers, which increased
11.5%
and
10.1%
in 2017 and 2016, respectively. We will continue to focus on growing our revenue, particularly in our residential high-speed Internet and video services and in our business services, and on overall operating cost management.
Our Cable Communications segment operating margin was
40.3%
,
40.2%
and
40.6%
in
2017
,
2016
and
2015
, respectively.
See Note 3 to Comcast’s consolidated financial statements for information on the impact of the adoption, effective January 1, 2018, of the new revenue recognition accounting guidance on our Cable Communication segment revenue and operating margin.
|
NBCUniversal Segments Overview
|
|
2017 NBCUniversal Segments Operating Results
(a)
|
|
Revenue
|
Adjusted EBITDA
|
|||
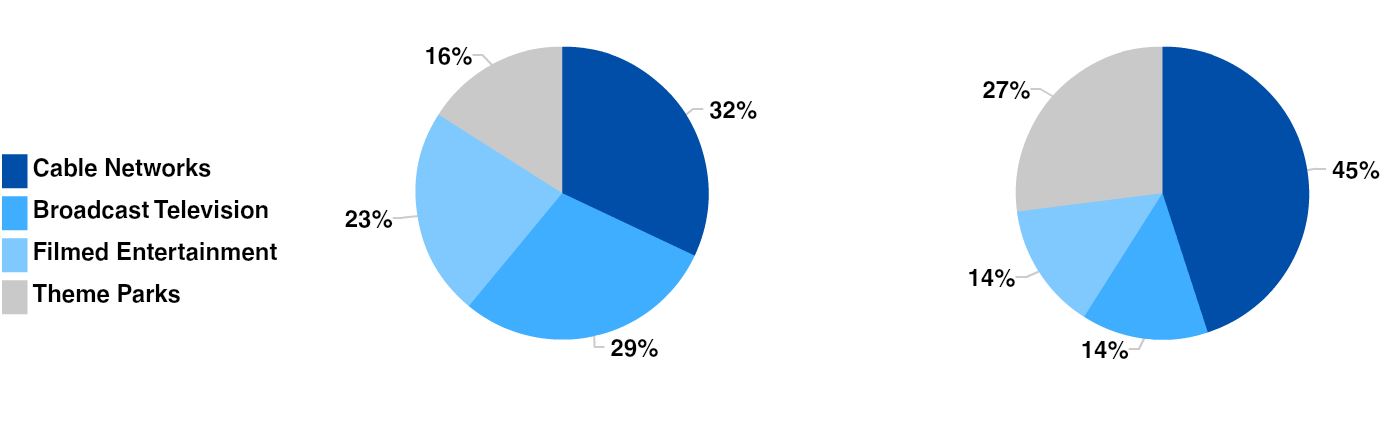
|
42
|
Comcast 2017 Annual Report on Form 10-K
|
|
|
Year ended December 31 (in millions)
|
2017
|
|
2016
|
|
2015
|
% Change
2016 to 2017 |
|
% Change
2015 to 2016
|
||||||||||||||||
|
Actual
|
|
Actual
|
|
Actual
|
|
Pro Forma
Adjustments
(a)
|
|
Pro Forma
Combined
|
|
Actual
|
|
Actual
|
|
Pro Forma
Combined
|
|
|||||||||
|
Revenue
|
||||||||||||||||||||||||
|
Cable Networks
|
$
|
10,631
|
|
$
|
10,464
|
|
$
|
9,628
|
|
$
|
—
|
|
$
|
9,628
|
|
1.6
|
%
|
8.7
|
%
|
|||||
|
Broadcast Television
|
9,546
|
|
10,147
|
|
8,530
|
|
—
|
|
8,530
|
|
(5.9
|
)
|
19.0
|
|
||||||||||
|
Filmed Entertainment
|
7,658
|
|
6,360
|
|
7,287
|
|
—
|
|
7,287
|
|
20.4
|
|
(12.7
|
)
|
||||||||||
|
Theme Parks
|
5,443
|
|
4,946
|
|
3,339
|
|
1,052
|
|
4,391
|
|
10.0
|
|
48.2
|
|
12.7
|
%
|
||||||||
|
Headquarters, other and eliminations
|
(281
|
)
|
(324
|
)
|
(322
|
)
|
—
|
|
(322
|
)
|
NM
|
|
NM
|
|
||||||||||
|
Total revenue
|
$
|
32,997
|
|
$
|
31,593
|
|
$
|
28,462
|
|
$
|
1,052
|
|
$
|
29,514
|
|
4.4
|
%
|
11.0
|
%
|
7.0
|
%
|
|||
|
Adjusted EBITDA
|
|
|
|
|
||||||||||||||||||||
|
Cable Networks
|
$
|
4,076
|
|
$
|
3,709
|
|
$
|
3,499
|
|
$
|
—
|
|
$
|
3,499
|
|
9.9
|
%
|
6.0
|
%
|
|||||
|
Broadcast Television
|
1,253
|
|
1,320
|
|
780
|
|
—
|
|
780
|
|
(5.0
|
)
|
69.1
|
|
||||||||||
|
Filmed Entertainment
|
1,277
|
|
697
|
|
1,234
|
|
—
|
|
1,234
|
|
83.3
|
|
(43.5
|
)
|
||||||||||
|
Theme Parks
|
2,384
|
|
2,190
|
|
1,464
|
|
488
|
|
1,952
|
|
8.9
|
|
49.6
|
|
12.2
|
%
|
||||||||
|
Headquarters, other and eliminations
|
(745
|
)
|
(689
|
)
|
(625
|
)
|
—
|
|
(625
|
)
|
NM
|
|
NM
|
|
||||||||||
|
Total Adjusted EBITDA
|
$
|
8,245
|
|
$
|
7,227
|
|
$
|
6,352
|
|
$
|
488
|
|
$
|
6,840
|
|
14.1
|
%
|
13.8
|
%
|
5.7
|
%
|
|||
|
(a)
|
Pro forma adjustments are presented as if the acquisition of the 51% interest of Universal Studios Japan occurred on January 1, 2014. Pro forma information does not include adjustments for transaction-related costs, costs related to integration activities, or cost savings or synergies that have been or may be achieved by the combined businesses. The pro forma amounts are primarily based on historical results of operations, adjusted for the allocation of purchase price, and are not necessarily indicative of what our results would have been had we operated Universal Studios Japan since January 1, 2014, nor of our future results.
|
|
Cable Networks Segment Results of Operations
|
|
Year ended December 31 (in millions)
|
2017
|
|
2016
|
|
2015
|
|
% Change
2016 to 2017 |
|
% Change
2015 to 2016 |
|
|||
|
Revenue
|
|||||||||||||
|
Distribution
|
$
|
6,176
|
|
$
|
6,078
|
|
$
|
5,461
|
|
1.6
|
%
|
11.3
|
%
|
|
Advertising
|
3,397
|
|
3,566
|
|
3,435
|
|
(4.7
|
)
|
3.8
|
|
|||
|
Content licensing and other
|
1,058
|
|
820
|
|
732
|
|
29.1
|
|
11.9
|
|
|||
|
Total revenue
|
10,631
|
|
10,464
|
|
9,628
|
|
1.6
|
|
8.7
|
|
|||
|
Operating costs and expenses
|
|||||||||||||
|
Programming and production
|
4,670
|
|
4,932
|
|
4,319
|
|
(5.3
|
)
|
14.2
|
|
|||
|
Other operating and administrative
|
1,354
|
|
1,310
|
|
1,270
|
|
3.4
|
|
3.2
|
|
|||
|
Advertising, marketing and promotion
|
531
|
|
513
|
|
540
|
|
3.5
|
|
(5.1
|
)
|
|||
|
Total operating costs and expenses
|
6,555
|
|
6,755
|
|
6,129
|
|
(2.9
|
)
|
10.2
|
|
|||
|
Adjusted EBITDA
|
$
|
4,076
|
|
$
|
3,709
|
|
$
|
3,499
|
|
9.9
|
%
|
6.0
|
%
|
Cable Networks Segment – Revenue
Distribution
Distribution revenue is generated from the distribution of our cable network programming to traditional and virtual multichannel video providers and is affected by the number of subscribers receiving our cable networks and the fees we charge per subscriber.
Distribution revenue increased in
2017
primarily due to increases in the contractual rates charged under distribution agreements and the timing of contract renewals, which were partially offset by revenue associated with our broadcast of the 2016 Rio Olympics and a continued decline in the number of subscribers of multichannel video providers at our cable networks. Distribution revenue increased in 2016 primarily due to increases in the contractual rates charged under distribution agreements and contract renewals, as well as revenue associated with our broadcast of the 2016 Rio Olympics, which were partially offset by a decline in the number of subscribers of multichannel video providers at our cable networks. Excluding $298 million of revenue associated with our broadcast of the 2016 Rio Olympics, distribution revenue increased 6.8% and 5.8% in
2017
and
2016
, respectively.
|
Comcast 2017 Annual Report on Form 10-K
|
43
|
|
Advertising
Advertising revenue is generated from the sale of advertising units sold on our cable networks and digital properties. Advertising revenue is primarily based on the price we charge for each advertising unit, which is generally based on audience ratings, the value of our viewer demographics to advertisers and the number of advertising units we can place in our cable networks’ programming schedules. Advertising revenue is affected by the audience ratings of our programming, the strength of the national advertising market and general economic conditions.
Advertising revenue decreased in
2017
and increased in 2016 primarily due to revenue associated with our broadcast of the 2016 Rio Olympics. Excluding $134 million of revenue associated with our broadcast of the 2016 Rio Olympics, advertising revenue decreased 1.0% in
2017
and decreased slightly in 2016 as the impact of continued declines in audience ratings at our networks were partially offset by higher prices for advertising units sold.
Content Licensing and Other
Content licensing and other revenue is generated primarily from the licensing of our owned programming in the United States and internationally to cable and broadcast networks and subscription video on demand services, as well as from the sale of our owned programming on DVDs and through digital distribution services such as iTunes. In addition, our cable television studio production operations generate revenue from programming the studio produces for third-party networks and for subscription video on demand services.
Content licensing and other revenue increased in
2017
and
2016
primarily due to the timing of content provided under our licensing agreements.
In
2017
,
2016
and
2015
,
15%
, 14% and 13%, respectively, of our Cable Networks segment revenue was generated from our Cable Communications segment. These amounts are eliminated in Comcast’s consolidated financial statements but are included in the amounts presented above.
Cable Networks Segment – Operating Costs and Expenses
Programming and Production Costs
Programming and production costs include the amortization of owned and acquired programming, sports rights, direct production costs, residual and participation payments, production overhead, costs associated with the distribution of our programming to third-party networks and other distribution platforms, and on-air talent costs.
Programming and production costs decreased in 2017 primarily due to costs associated with our broadcast of the 2016 Rio Olympics, which were partially offset by an increase in other sports programming rights costs and higher studio production costs in 2017. Programming and production costs increased in 2016 primarily due to costs associated with our broadcast of the 2016 Rio Olympics, as well as an increase in other sports programming rights costs.
Other Operating and Administrative Costs and Expenses
Other operating and administrative costs and expenses include salaries, employee benefits, rent and other overhead expenses. These expenses increased in 2017 and 2016 primarily due to increases in employee-related costs.
Advertising, Marketing and Promotion Expenses
Advertising, marketing and promotion expenses consist primarily of the costs associated with promoting programming on our cable networks and digital properties. Advertising, marketing and promotion expenses increased in 2017 primarily due to increased spending on marketing related to programming on our cable networks and our new digital platforms. Advertising, marketing and promotion expenses decreased in 2016 primarily due to increased spending on marketing in 2015 related to the launch of new programming on our cable networks.
|
44
|
Comcast 2017 Annual Report on Form 10-K
|
|
|
Broadcast Television Segment Results of Operations
|
|
Year ended December 31 (in millions)
|
2017
|
|
2016
|
|
2015
|
|
% Change
2016 to 2017 |
|
% Change
2015 to 2016 |
|
|||
|
Revenue
|
|||||||||||||
|
Advertising
|
$
|
5,654
|
|
$
|
6,834
|
|
$
|
5,747
|
|
(17.3
|
)%
|
18.9
|
%
|
|
Content licensing
|
2,098
|
|
1,899
|
|
1,784
|
|
10.5
|
|
6.4
|
|
|||
|
Distribution and other
|
1,794
|
|
1,414
|
|
999
|
|
26.9
|
|
41.5
|
|
|||
|
Total revenue
|
9,546
|
|
10,147
|
|
8,530
|
|
(5.9
|
)
|
19.0
|
|
|||
|
Operating costs and expenses
|
|||||||||||||
|
Programming and production
|
6,420
|
|
6,984
|
|
5,950
|
|
(8.1
|
)
|
17.4
|
|
|||
|
Other operating and administrative
|
1,392
|
|
1,381
|
|
1,276
|
|
0.7
|
|
8.3
|
|
|||
|
Advertising, marketing and promotion
|
481
|
|
462
|
|
524
|
|
4.2
|
|
(11.9
|
)
|
|||
|
Total operating costs and expenses
|
8,293
|
|
8,827
|
|
7,750
|
|
(6.1
|
)
|
13.9
|
|
|||
|
Adjusted EBITDA
|
$
|
1,253
|
|
$
|
1,320
|
|
$
|
780
|
|
(5.0
|
)%
|
69.1
|
%
|
Broadcast Television Segment – Revenue
Advertising
Advertising revenue is generated from the sale of advertising units sold on our broadcast networks, owned local broadcast television stations and digital properties. Advertising revenue is primarily based on the price we charge for each advertising unit, which is generally based on audience ratings and the value of our viewer demographics to advertisers, and the number of advertising units we can place in our broadcast networks’ and owned local television stations’ programming schedules. Advertising revenue is affected by the strength of the national and local advertising markets, general economic conditions, cyclicality related to political campaigns and issue-oriented advertising, and the success and ratings of our programming.
Advertising revenue decreased in
2017
and increased in 2016 primarily due to revenue associated with our broadcast of the 2016 Rio Olympics. Excluding $1.0 billion of revenue associated with our broadcast of the 2016 Rio Olympics, advertising revenue decreased 2.3% in
2017
as the impact of continued declines in audience ratings were partially offset by higher prices for advertising units sold. Excluding $1.0 billion and $376 million of revenue associated with our broadcasts of the 2016 Rio Olympics and the 2015 Super Bowl, respectively, advertising revenue increased 7.7% in
2016
as higher prices for advertising units sold, the premiere of
Thursday Night Football
and higher political advertising were partially offset by a decline in audience ratings.
Content Licensing
Content licensing revenue is generated from the licensing of our owned programming in the United States and internationally to various distribution platforms, including to cable and broadcast networks, and to subscription video on demand services. In addition, our broadcast television studio production operations develop and produce original content that they license to broadcast networks, cable networks and local broadcast television stations owned by us and third parties, as well as to subscription video on demand services. The production and distribution costs related to our owned programming generally exceed the revenue generated from the initial network license, which means the subsequent licensing of our owned programming series following the initial network license is critical to their financial success.
Content licensing revenue increased in
2017
and
2016
primarily due to the timing of content provided under our licensing agreements.
Distribution and Other
We generate distribution and other revenue primarily from fees for retransmission consent of our owned local broadcast television stations and associated fees received from NBC-affiliated local broadcast television stations, as well as from the sale of our owned programming on DVDs and through digital distribution services. The sale of our owned programming is driven primarily by the popularity of our broadcast networks and programming series and therefore fluctuates based on consumer spending and acceptance. Distribution and other revenue also includes distribution revenue associated with our periodic broadcasts of the Olympic Games.
Distribution and other revenue increased in
2017
primarily due to an increase in fees recognized under our retransmission consent agreements, which was partially offset by $140 million of revenue associated with our broadcast of the 2016 Rio Olympics. Distribution and other revenue increased in 2016 primarily due to an increase in fees recognized under our retransmission consent agreements, as well as revenue associated with our broadcast of the 2016 Rio Olympics.
|
Comcast 2017 Annual Report on Form 10-K
|
45
|
|
Broadcast Television Segment – Operating Costs and Expenses
Programming and Production Costs
Programming and production costs relate to content originating on our broadcast networks and owned local broadcast television stations, as well as owned content that is licensed to third parties. These costs include the amortization of owned and acquired programming costs, sports rights, direct production costs, residual and participation payments, production overhead, costs associated with the distribution of our programming to third-party networks and other distribution platforms, and on-air talent costs.
Programming and production costs decreased in
2017
primarily due to costs associated with our broadcast of the 2016 Rio Olympics, which were partially offset by higher studio production costs, our continued investment in original programming and increases in other sports programming rights costs in 2017. Programming and production costs increased in 2016 primarily due to costs associated with our broadcast of the 2016 Rio Olympics, as well as our broadcast of
Thursday Night Football
, which were partially offset by costs in 2015 associated with our broadcast of the 2015 Super Bowl.
Other Operating and Administrative Costs and Expenses
Other operating and administrative costs and expenses include salaries, employee benefits, rent and other overhead expenses, and these costs increased slightly in
2017
. These costs increased in 2016 primarily due to an increase in employee-related costs.
Advertising, Marketing and Promotion Expenses
Advertising, marketing and promotion expenses consist primarily of the costs associated with promoting our owned and acquired television programming, as well as the marketing of DVDs and costs associated with our digital properties. These expenses increased in
2017
primarily due to increased spending on marketing related to our entertainment and news programming. Advertising, marketing and promotion expenses decreased in
2016
primarily due to increased spending in 2015 for marketing of our NBC primetime lineup.
|
Filmed Entertainment Segment Results of Operations
|
|
Year ended December 31 (in millions)
|
2017
|
|
2016
|
|
2015
|
|
% Change
2016 to 2017 |
|
% Change
2015 to 2016 |
|
|||
|
Revenue
|
|||||||||||||
|
Theatrical
|
$
|
2,192
|
|
$
|
1,560
|
|
$
|
2,829
|
|
40.5
|
%
|
(44.9
|
)%
|
|
Content licensing
|
2,967
|
|
2,563
|
|
1,923
|
|
15.8
|
|
33.3
|
|
|||
|
Home entertainment
|
1,326
|
|
1,254
|
|
1,801
|
|
5.7
|
|
(30.4
|
)
|
|||
|
Other
|
1,173
|
|
983
|
|
734
|
|
19.3
|
|
34.1
|
|
|||
|
Total revenue
|
7,658
|
|
6,360
|
|
7,287
|
|
20.4
|
|
(12.7
|
)
|
|||
|
Operating costs and expenses
|
|||||||||||||
|
Programming and production
|
3,548
|
|
2,962
|
|
3,488
|
|
19.8
|
|
(15.1
|
)
|
|||
|
Other operating and administrative
|
1,274
|
|
1,101
|
|
872
|
|
15.7
|
|
26.3
|
|
|||
|
Advertising, marketing and promotion
|
1,559
|
|
1,600
|
|
1,693
|
|
(2.5
|
)
|
(5.5
|
)
|
|||
|
Total operating costs and expenses
|
6,381
|
|
5,663
|
|
6,053
|
|
12.7
|
|
(6.4
|
)
|
|||
|
Adjusted EBITDA
|
$
|
1,277
|
|
$
|
697
|
|
$
|
1,234
|
|
83.3
|
%
|
(43.5
|
)%
|
Filmed Entertainment Segment – Revenue
Theatrical
Theatrical revenue is generated from the worldwide theatrical release of our produced and acquired films for exhibition in movie theaters and is significantly affected by the timing of each release and the number of films we distribute, as well as their acceptance by audiences. Theatrical revenue is also affected by the number of exhibition screens, ticket prices, the percentage of ticket sale retention by the exhibitors and the popularity of competing films at the time our films are released. The success of a film in movie theaters is a significant factor in determining the revenue a film is likely to generate in succeeding distribution platforms.
Theatrical revenue increased in 2017 primarily due to the strong performances of several releases in our 2017 film slate, including
The Fate of the Furious, Despicable Me 3
and
Fifty Shades Darker.
Theatrical revenue decreased in 2016 primarily due to the strong performance of our larger 2015 film slate, including
Furious 7, Jurassic World
and
Minions
, partially offset by the strong performance of
The Secret Life of Pets
and
Sing
in 2016.
|
46
|
Comcast 2017 Annual Report on Form 10-K
|
|
Content Licensing
Content licensing revenue is generated primarily from the licensing of our produced and acquired films to cable, broadcast and premium networks, and to subscription video on demand services.
Content licensing revenue increased in
2017
primarily due to the timing of when content was made available under licensing agreements, including content from DreamWorks Animation. Content licensing revenue increased in 2016 primarily due to the timing of when content, including content related to our 2015 film slate, was made available under licensing agreements.
Home Entertainment
Home entertainment revenue is generated from the sale of our produced and acquired films on DVDs to retail stores, rental kiosks and subscription by mail services, and in digital formats. Home entertainment revenue is significantly affected by the timing and number of our releases and their acceptance by consumers. Release dates are determined by several factors, including the timing of the exhibition of a film in movie theaters, holiday periods and the timing of competitive releases. The overall DVD market continues to experience declines due to the maturation of the DVD format from increasing shifts in consumer behavior toward digital distribution services and subscription rental services, both of which generate less revenue per transaction than DVD sales, as well as due to piracy.
Home entertainment revenue increased in 2017 primarily due to strong sales of several 2017 releases, including
Sing
,
The Fate of the Furious
and
Despicable Me 3
. Home entertainment revenue decreased in 2016 primarily due to the strong performance of our releases in 2015, including
Minions
and
Jurassic World
. The decrease in 2016 was partially offset by the home entertainment sales in 2016 of
Jason Bourne
and
The Secret Life of Pets
.
Other
We also generate revenue from Fandango, our movie ticketing and entertainment business, the sale of consumer products, the production and licensing of live stage plays, and the distribution of filmed entertainment produced by third parties.
Other revenue increased in
2017
primarily due to increases in revenue from consumer products, including from DreamWorks Animation, and an increase in revenue from Fandango. Other revenue increased in 2016 primarily due to an increase in revenue from Fandango.
Filmed Entertainment Segment – Operating Costs and Expenses
Programming and Production Costs
Programming and production costs include the amortization of capitalized film production and acquisition costs, residual and participation payments, and distribution expenses. Residual payments represent amounts payable to individuals hired under collective bargaining agreements to work on productions and are calculated based on post-theatrical revenue. Participation payments are primarily based on film performance and represent contingent consideration payable to creative talent, third parties that have entered into cofinancing agreements with us and other parties involved in the production of a film. The costs associated with producing films have generally increased in recent years and may continue to increase in the future.
Programming and production costs increased in
2017
due to higher amortization of film production costs for our
2017
releases, as well as the inclusion of costs associated with DreamWorks Animation. Programming and production costs decreased in 2016 primarily due to higher amortization of film production costs in 2015 associated with our larger 2015 film slate, which included
Furious 7
,
Jurassic World
and
Minions
.
Other Operating and Administrative Costs and Expenses
Other operating and administrative costs and expenses include salaries, employee benefits, rent and other overhead expenses.
Other operating and administrative expenses increased in
2017
primarily due to increases in employee-related costs, as well as the inclusion of a full year of expenses associated with DreamWorks Animation. Other operating and administrative costs increased in 2016 primarily due to costs attributable to DreamWorks Animation, including
$61 million
of severance costs.
Advertising, Marketing and Promotion Expenses
Advertising, marketing and promotion expenses consist primarily of expenses associated with advertising for our theatrical releases and the marketing of our films on DVDs and in digital formats. We incur significant marketing expenses before and throughout the release of a film in movie theaters. As a result, we typically incur losses on a film prior to and during the film’s exhibition in movie theaters and may not realize profits, if any, until the film generates home entertainment and content licensing revenue. The costs associated with marketing films have generally increased in recent years and may continue to increase in the future.
|
Comcast 2017 Annual Report on Form 10-K
|
47
|
|
Advertising, marketing and promotion expenses decreased in
2017
due to a higher number of releases in 2016. Advertising, marketing and promotion expenses decreased in 2016 primarily due to higher promotional costs associated with our larger 2015 film slate. The decrease in 2016 was partially offset due to advertising in 2016 for our domestic and international film slate.
|
Theme Parks Segment Actual and Pro Forma Results of Operations
|
|
Year ended December 31 (in millions)
|
2017
|
|
2016
|
|
2015
|
% Change
2016 to 2017 |
|
% Change
2015 to 2016
|
||||||||||||||||
|
Actual
|
|
Actual
|
|
Actual
|
|
Pro Forma
Adjustments
(a)
|
|
Pro Forma
Combined |
|
Actual
|
|
Actual
|
|
Pro Forma
Combined |
|
|||||||||
|
Revenue
|
$
|
5,443
|
|
$
|
4,946
|
|
$
|
3,339
|
|
$
|
1,052
|
|
$
|
4,391
|
|
10.0
|
%
|
48.2
|
%
|
12.7
|
%
|
|||
|
Operating costs and expenses
|
3,059
|
|
2,756
|
|
1,875
|
|
564
|
|
2,439
|
|
11.0
|
|
47.0
|
|
13.0
|
|
||||||||
|
Adjusted EBITDA
|
$
|
2,384
|
|
$
|
2,190
|
|
$
|
1,464
|
|
$
|
488
|
|
$
|
1,952
|
|
8.9
|
%
|
49.6
|
%
|
12.2
|
%
|
|||
|
(a)
|
Pro forma adjustments are presented as if the acquisition of the 51% interest of Universal Studios Japan occurred on January 1, 2014. Pro forma information does not include adjustments for transaction-related costs, costs related to integration activities, or cost savings or synergies that have been or may be achieved by the combined businesses. The pro forma amounts are primarily based on historical results of operations, adjusted for the allocation of purchase price, and are not necessarily indicative of what our results would have been had we operated Universal Studios Japan since January 1, 2014, nor of our future results.
|
Theme Parks Segment – Revenue
Our Theme Parks segment revenue is generated primarily from ticket sales and guest spending at our Universal theme parks. Guest spending includes in-park spending on food, beverages and merchandise. Guest attendance at our theme parks and guest spending depend heavily on the general environment for travel and tourism, including consumer spending on travel and other recreational activities.
Theme Parks segment revenue increased in
2017
primarily due to increases in guest spending and higher guest attendance driven by the continued success of
The Wizarding World of Harry Potter™
attraction in Hollywood, which opened in April 2016, and the openings of
Minion Park™
in Japan in April
2017
and
Volcano Bay™
in Orlando in May 2017. Theme Parks segment revenue increased in 2016 compared to the pro forma combined revenue in 2015 primarily due to increases in guest spending and higher guest attendance driven by the successful opening of
The Wizarding World of Harry Potter™
attraction in Hollywood, as well as the positive impact of foreign currency translation due to the strengthening of the Japanese yen. The strengthening of the Japanese yen accounted for approximately one-third of the increase in revenue for 2016.
Theme Parks Segment – Operating Costs and Expenses
Our Theme Parks segment operating costs and expenses consist primarily of theme park operations, including repairs and maintenance and related administrative expenses; food, beverage and merchandise costs; labor costs; and sales and marketing costs.
Theme Parks segment operating costs and expenses increased in
2017
primarily due to higher operating costs related to higher guest attendance and new attractions, as well as additional marketing costs associated with our domestic theme parks.
Theme Parks segment operating costs and expenses increased in
2016
compared to the pro forma combined operating costs and expenses in 2015 primarily due to additional costs associated with newer attractions, such as
The Wizarding World of Harry Potter™
attraction in Hollywood and
Skull Island: Reign of Kong™
attraction in Orlando, as well as the impact of foreign currency translation due to the strengthening of the Japanese yen.
The strengthening of the Japanese yen accounted for approximately one-third of the increase in Adjusted EBITDA in 2016.
|
NBCUniversal Headquarters, Other and Eliminations
|
Headquarters and Other operating costs and expenses incurred by our NBCUniversal businesses include overhead, personnel costs and costs associated with corporate initiatives. Operating costs and expenses increased in
2017
and
2016
primarily due to higher employee-related costs.
|
48
|
Comcast 2017 Annual Report on Form 10-K
|
|
|
Corporate and Other Results of Operations
|
|
Year ended December 31 (in millions)
|
2017
|
|
2016
|
|
2015
|
|
% Change
2016 to 2017 |
|
% Change
2015 to 2016 |
|
|||
|
Revenue
|
$
|
1,060
|
|
$
|
750
|
|
$
|
713
|
|
41.5
|
%
|
5.1
|
%
|
|
Operating costs and expenses
|
2,704
|
|
1,624
|
|
1,528
|
|
66.6
|
|
6.2
|
|
|||
|
Adjustment for legal settlement
|
(250
|
)
|
—
|
|
—
|
|
NM
|
|
NM
|
|
|||
|
Adjusted EBITDA
|
$
|
(1,394
|
)
|
$
|
(874
|
)
|
$
|
(815
|
)
|
(59.5
|
)%
|
(7.1
|
)%
|
Corporate and Other – Revenue
Other revenue primarily includes revenue from
Comcast Spectacor, which owns the Philadelphia Flyers and the Wells Fargo Center arena in Philadelphia, Pennsylvania and operates arena management-related businesses
, as well as revenue from other business development initiatives, such as our wireless phone service that we launched in 2017.
Corporate and Other – Operating Costs and Expenses
Corporate and Other operating costs and expenses primarily include overhead and personnel costs, the costs of other business development initiatives, including our new wireless phone service, and the operations of Comcast Spectacor.
Corporate and Other operating costs and expenses increased in
2017
primarily due to expenses associated with our new wireless phone service and $171 million related to a one-time special cash bonus for eligible employees. Corporate and Other Adjusted EBITDA excludes $250 million of expense related to a legal settlement in 2017 (see Note 16 to Comcast’s consolidated financial statements). Corporate and Other operating costs and expenses increased in 2016 due to an increase in expenses related to corporate activities and business development initiatives, including expenses associated with our wireless phone service offering.
|
Consolidated Total Other Income (Expense)
|
|
Year ended December 31 (in millions)
|
2017
|
|
2016
|
|
2015
|
|
|||
|
Interest expense
|
$
|
(3,086
|
)
|
$
|
(2,942
|
)
|
$
|
(2,702
|
)
|
|
Investment income (loss), net
|
253
|
|
213
|
|
81
|
|
|||
|
Equity in net income (losses) of investees, net
|
107
|
|
(104
|
)
|
(325
|
)
|
|||
|
Other income (expense), net
|
61
|
|
327
|
|
320
|
|
|||
|
Total other income (expense)
|
$
|
(2,665
|
)
|
$
|
(2,506
|
)
|
$
|
(2,626
|
)
|
Interest Expense
Interest expense increased in
2017
primarily due to higher levels of debt outstanding. Interest expense increased in
2016
primarily due to higher levels of debt outstanding, including the impact of our acquisition of Universal Studios Japan.
Investment Income (Loss), Net
The change in investment income (loss), net in
2017
was not significant. The change in investment income (loss), net in 2016 was primarily due to an increase in income of certain investments and gains recorded on the sale of certain investments. The components of investment income (loss), net are presented in a table in Note 7 to Comcast’s consolidated financial statements.
Equity in Net Income (Losses) of Investees, Net
The changes in equity in net income (losses) of investees, net in
2017
and
2016
were primarily due to our equity method investments in Atairos Group, Inc. and Hulu, LLC. Atairos, which commenced operations in
2016
, follows investment company accounting and records its investments at their fair values each reporting period with the net gains or losses reflected in its statement of income. We recognize our share of these gains and losses in equity in net income (losses) of investees, net. The losses at Hulu were driven by its higher programming and marketing costs. The table below summarizes the equity in net income (losses) of Atairos and Hulu in
2017
,
2016
and 2015.
|
Year ended December 31 (in millions)
|
2017
|
|
2016
|
|
2015
|
|
|||
|
Atairos
|
$
|
281
|
|
$
|
(38
|
)
|
$
|
—
|
|
|
Hulu
|
$
|
(276
|
)
|
$
|
(168
|
)
|
$
|
(106
|
)
|
|
Comcast 2017 Annual Report on Form 10-K
|
49
|
|
The change in equity in net income (losses) of investees, net in
2016
was also due to an impairment charge related to goodwill recorded by The Weather Channel in
2015
. We recorded expenses of
$333 million
that represented NBCUniversal’s proportionate share of The Weather Channel impairment charge.
Other Income (Expense), Net
Other income (expense), net for
2017
was not significant.
Other income (expense), net for
2016
included $225 million recognized in connection with the settlement of amounts owed to us under an agency agreement that had provided for, among other things, Verizon Wireless’ sale of our cable services and
$108 million
related to the sale of our investment in The Weather Channel’s product and technology business to IBM.
Other income (expense), net for
2015
included gains of $335 million on the sales of a business and an investment, $240 million recorded on the settlement of a contingent consideration liability with The General Electric Company related to our acquisition of NBCUniversal, and $43 million related to an equity method investment. These gains were partially offset by $236 million of expenses related to fair value adjustments to a contractual obligation.
|
Consolidated Income Tax Benefit (Expense)
|
Income tax benefit (expense) reflects federal and state income taxes and adjustments associated with uncertain tax positions. Our effective income tax rate in
2017
was a benefit of
49.5%
. Excluding the impacts of the new federal tax reform legislation, our effective income tax rate in 2017 would have been an expense of 33.3%. Our effective income tax rate in
2016
and
2015
was an expense of
37.0%
and
37.1%
, respectively. The income tax benefit in 2017 was primarily driven by the enactment of new federal tax reform legislation in December 2017 (“2017 Tax Act”), partially offset by higher taxable income from operations. The 2017 Tax Act, among other things, reduces the federal corporate income tax rate to 21% from 35%, effective January 1, 2018, resulting in a net income tax benefit of $12.7 billion in 2017 primarily related to a reduction of our net deferred tax liability (see Note 14 to Comcast’s consolidated financial statements).
Additionally, in 2017, we prospectively adopted certain provisions of the new accounting guidance related to share-based compensation which resulted in an increase in income tax benefit of
$297 million
(see Note 3 to Comcast’s consolidated financial statements). Our income tax benefit also increased $121 million due to the impact of an internal legal reorganization in the third quarter of 2017, which was partially offset by a decrease of $53 million due to changes in state tax laws.
We expect our
2018
annual effective tax rate to be significantly lower than our current year effective tax rate, excluding the impacts of the new federal tax reform legislation, as a result of the reduction of the federal corporate income tax rate in the 2017 Tax Act.
|
Consolidated Net (Income) Loss Attributable to Noncontrolling Interests and Redeemable Subsidiary Preferred Stock
|
The decrease in net income attributable to noncontrolling interests and redeemable subsidiary preferred stock in 2017 was primarily due to our acquisition of the remaining interests in Universal Studios Japan that we did not already own in April 2017. The increase in net income attributable to noncontrolling interests and redeemable subsidiary preferred stock in
2016
was primarily due to NBCUniversal’s acquisition of a 51% interest in Universal Studios Japan in November 2015.
|
Non-GAAP Financial Measure
|
Consolidated Adjusted EBITDA is a non-GAAP financial measure of performance and is defined as net income attributable to Comcast Corporation before net (income) loss attributable to noncontrolling interests and redeemable subsidiary preferred stock, income tax benefit (expense), total other income (expense), depreciation and amortization expense, and other operating gains, and excluding impairment charges related to fixed and intangible assets and gains or losses on the sale of long-lived assets, if any. From time to time we may exclude from Adjusted EBITDA the impact of events, gains, losses or other charges (such as significant legal settlements) that affect the period-to-period comparability of our operating performance. This measure eliminates the significant level of noncash depreciation and amortization expense that results from the capital-intensive nature of certain of our businesses and from intangible assets recognized in business combinations. Additionally, it is unaffected by our capital and tax structures and by our investment activities. We use this measure to evaluate our consolidated operating performance and the operating performance of our operating segments and to allocate resources and capital to our operating segments. It is also a significant performance measure in our annual incentive compensation programs. We believe that this measure is useful to investors because it is one of the bases for comparing our operating performance with that of other companies in our industries, although our measure may not be directly comparable to similar measures used by other companies. We reconcile consolidated Adjusted
|
50
|
Comcast 2017 Annual Report on Form 10-K
|
|
EBITDA to net income attributable to Comcast Corporation. This measure should not be considered a substitute for operating income (loss), net income (loss), net income (loss) attributable to Comcast Corporation, or net cash provided by operating activities that we have reported in accordance with GAAP.
|
Reconciliation from Net Income Attributable to Comcast Corporation to Adjusted EBITDA
|
|||||||||
|
Year ended December 31 (in millions)
|
2017
|
|
2016
|
|
2015
|
|
|||
|
Net income attributable to Comcast Corporation
|
$
|
22,714
|
|
$
|
8,695
|
|
$
|
8,163
|
|
|
Net income (loss) attributable to noncontrolling interests and redeemable subsidiary preferred stock
|
186
|
|
350
|
|
250
|
|
|||
|
Income tax (benefit) expense
|
(7,578
|
)
|
5,308
|
|
4,959
|
|
|||
|
Total other (income) expense
|
2,665
|
|
2,506
|
|
2,626
|
|
|||
|
Depreciation
|
7,914
|
|
7,464
|
|
6,781
|
|
|||
|
Amortization
|
2,353
|
|
2,094
|
|
1,899
|
|
|||
|
Other operating gains
|
(442
|
)
|
—
|
|
—
|
|
|||
|
Adjustment for legal settlement
|
250
|
|
—
|
|
—
|
|
|||
|
Adjusted EBITDA
|
$
|
28,062
|
|
$
|
26,417
|
|
$
|
24,678
|
|
|
Liquidity and Capital Resources
|
Our businesses generate significant cash flows from operating activities. We believe that we will be able to continue to meet our current and long-term liquidity and capital requirements, including fixed charges, through our cash flows from operating activities; existing cash, cash equivalents and investments; available borrowings under our existing credit facilities; and our ability to obtain future external financing. We anticipate that we will continue to use a substantial portion of our cash flows in repaying our debt obligations, funding our capital expenditures, investing in business opportunities and returning capital to shareholders.
We also maintain significant availability under our revolving credit facilities and our commercial paper programs to meet our short-term liquidity requirements. Our commercial paper programs provide a lower-cost source of borrowing to fund our short-term working capital requirements. See Note 10 and Note 19 to Comcast’s consolidated financial statements for additional information on the Comcast and NBCUniversal Enterprise revolving credit facilities and the related guarantees. As of
December 31, 2017
,
amounts available under our consolidated revolving credit facilities, net of amounts outstanding under our commercial paper programs and outstanding letters of credit, totaled
$7.4 billion
, which included
$1.5 billion
available under the NBCUniversal Enterprise revolving credit facility.
We, NBCUniversal and Comcast Cable Communications, LLC are subject to the covenants and restrictions set forth in the indentures governing our public debt securities and in the credit agreements governing the Comcast revolving credit facility. The only financial covenant in the credit facility pertains to leverage, which is the ratio of debt to EBITDA, as defined in the credit facility. We test for compliance with this financial covenant on an ongoing basis. As of
December 31, 2017
, we met this financial covenant by a significant margin. We do not expect to have to reduce debt or improve operating results in order to continue to comply with this financial covenant. In addition, the Universal Studios Japan term loans contain certain financial covenants. As of
December 31, 2017
, Universal Studios Japan was in compliance with all of these covenants.
Operating Activities
|
Components of Net Cash Provided by Operating Activities
|
|||||||||
|
Year ended December 31 (in millions)
|
2017
|
|
2016
|
|
2015
|
|
|||
|
Operating income
|
$
|
17,987
|
|
$
|
16,859
|
|
$
|
15,998
|
|
|
Depreciation, amortization and other operating gains
|
9,825
|
|
9,558
|
|
8,680
|
|
|||
|
Noncash share-based compensation
|
751
|
|
640
|
|
567
|
|
|||
|
Changes in operating assets and liabilities
|
(510
|
)
|
(1,430
|
)
|
158
|
|
|||
|
Payments of interest
|
(2,820
|
)
|
(2,565
|
)
|
(2,443
|
)
|
|||
|
Payments of income taxes
|
(4,057
|
)
|
(3,693
|
)
|
(3,726
|
)
|
|||
|
Proceeds from investments and other
|
227
|
|
456
|
|
251
|
|
|||
|
Net cash provided by operating activities
|
$
|
21,403
|
|
$
|
19,825
|
|
$
|
19,485
|
|
The variance in changes in operating assets and liabilities in
2017
compared to
2016
was primarily due to the timing of film and television production spending and related costs, net of amortization; the recognition of deferred revenue associated with our broadcast of the 2016 Rio Olympics; the payment in 2016 of a tax receivable agreement that DreamWorks Animation entered into with one of its former stockholders; and the launch in 2017 of our wireless phone service offering. The variance in changes in
|
Comcast 2017 Annual Report on Form 10-K
|
51
|
|
operating assets and liabilities in
2016
compared to
2015
was primarily due to the timing of film and television production spending and related costs, net of amortization, including certain sports programming obligations; the recognition of deferred revenue associated with the broadcast of the 2016 Rio Olympics; an increase in certain benefit payments; and the payment in 2016 of a tax receivable agreement that DreamWorks Animation entered into with one of its former stockholders prior to our acquisition
.
The increases in interest payments in
2017
and
2016
were primarily due to higher levels of debt outstanding.
The increase in income tax payments in
2017
was primarily due to higher taxable income from operations and payments associated with tax disputes, offset by tax deductions resulting from our senior notes exchange (see Note 10 to Comcast’s consolidated financial statements) and additional depreciation deductions allowed under the 2017 Tax Act (see Note 14 to Comcast’s consolidated financial statements). The decrease in income tax payments in
2016
was primarily due to taxable losses in 2016 related to the sale of certain investments as well as taxable gains in 2015 related to the sale of businesses and investments partially offset by higher taxable income from operations in 2016. We expect income tax payments to be significantly lower in
2018
due to the reduction in the federal income tax rate, as well as additional depreciation deductions allowed under the 2017 Tax Act, partially offset by the 2017 tax deductions resulting from the senior notes exchange.
Investing Activities
Net cash used in investing activities in
2017
consisted primarily of cash paid for capital expenditures, purchases of investments and intangible assets. Net cash used in investing activities in
2016
consisted primarily of cash paid for capital expenditures, acquisitions, deposits, purchases of investments and intangible assets. Net cash used in investing activities in
2015
consisted primarily of cash paid for capital expenditures, acquisitions, intangible assets and purchases of investments.
Capital Expenditures
Our most significant recurring investing activity has been capital expenditures in our Cable Communications segment, and we expect that this will continue in the future. The table below summarizes the capital expenditures we incurred in our Cable Communications segment in
2017
,
2016
and
2015
.
|
Year ended December 31 (in millions)
|
2017
|
|
2016
|
|
2015
|
|
|||
|
Customer premise equipment
|
$
|
3,337
|
|
$
|
3,665
|
|
$
|
3,698
|
|
|
Scalable infrastructure
|
2,369
|
|
1,827
|
|
1,539
|
|
|||
|
Line extensions
|
1,367
|
|
1,208
|
|
886
|
|
|||
|
Support capital
|
879
|
|
896
|
|
917
|
|
|||
|
Total
|
$
|
7,952
|
|
$
|
7,596
|
|
$
|
7,040
|
|
Cable Communications capital expenditures increased 4.7% and 7.9% in
2017
and
2016
, respectively, primarily due to continued investment in scalable infrastructure to increase network capacity and increased investment in line extensions primarily for the expansion of business services. The increase in 2017 was partially offset by a decrease in spending on customer premise equipment and support capital.
Capital expenditures in our NBCUniversal segments increased
3.4%
to
$1.5 billion
in
2017
primarily due to continued investment at our Theme Parks segment, which was partially offset by the timing of real estate and infrastructure investment. Capital expenditures in our NBCUniversal segments increased 4.8% to
$1.5 billion
in
2016
primarily due to continued investment at our Theme Parks segment.
Our capital expenditures for
2018
are focused on continued investment in scalable infrastructure to increase network capacity; increased investment in line extensions primarily for the expansion of business services; and the continued deployment of wireless gateways, our X1 platform, and cloud DVR technology. In addition, we expect to continue to invest in existing and new attractions at our Universal theme parks. Capital expenditures for subsequent years will depend on numerous factors, including acquisitions, competition, changes in technology, regulatory changes, the timing and rate of deployment of new services, the capacity required for existing services, and the timing of new attractions at our theme parks. We continue to develop a Universal theme park in Beijing, China.
Cash Paid for Intangible Assets
In
2017
,
2016
and
2015
, cash paid for intangible assets consisted primarily of expenditures for software in our Cable Communications segment.
Acquisitions and Construction of Real Estate Properties
Acquisitions and construction of real estate properties in
2017
,
2016
and
2015
primarily included the construction of the Comcast Technology Center in Philadelphia, Pennsylvania.
|
52
|
Comcast 2017 Annual Report on Form 10-K
|
|
Acquisitions, Net of Cash Acquired
In August 2016, we acquired all of the outstanding stock of DreamWorks Animation. In November 2015, NBCUniversal acquired a 51% interest in Universal Studios Japan.
Proceeds from Sales of Businesses and Investments
Proceeds from sales of businesses and investments in
2016
were primarily related to the sale of our investment in The Weather Channel’s product and technology business to IBM.
Proceeds from sales of businesses and investments in
2015
were primarily related to the sale of our investment in TV One, LLC and the sale of a business, CTI Towers Assets I, LLC.
Purchases of Investments
Purchases of investments in
2017
were primarily related to additional capital contributions to Atairos, our investment in Snap Inc. and NBCUniversal’s additional capital contributions to Hulu. Purchases of investments in
2016
were primarily related to capital contributions to Atairos and NBCUniversal’s additional investment in BuzzFeed, Inc. Purchases of investments in
2015
were primarily related to NBCUniversal’s investments in Vox Media, Inc. and BuzzFeed.
Deposits
On April 13, 2017, the Federal Communications Commission (“FCC”) announced the results of its spectrum auction. In connection with the auction, we acquired the rights to
$1.7 billion
of spectrum. We had previously made a deposit of
$1.8 billion
to participate in the auction in 2016 and received a refund for amounts in excess of the purchase price in 2017.
Other
Other investing activities in 2017 were primarily related to proceeds of $482 million received by NBCUniversal in the FCC auction for the relinquishment of spectrum rights (see Note 5 to Comcast’s consolidated financial statements and Note 4 to NBCUniversal’s consolidated financial statements).
Financing Activities
Net cash used in financing activities in all years consisted primarily of repayments of debt, repurchases of common stock under our repurchase program and employee plans, and dividend payments, which were partially offset by proceeds from borrowings. Proceeds from borrowings fluctuate from year to year based on the amounts paid to fund acquisitions and debt repayments. Net cash used in financing activities in
2017
also included the purchase of the remaining 49% noncontrolling interests in Universal Studios Japan. Net cash used in financing activities in
2016
also included our purchase of the remaining noncontrolling interest in Comcast Spectacor.
We have made, and may from time to time in the future make, optional repayments on our debt obligations, which may include repurchases or exchanges of our outstanding public notes and debentures, depending on various factors, such as market conditions. See Note 10 to Comcast’s consolidated financial statements and Note 10 to NBCUniversal’s consolidated financial statements for additional information on our financing activities, including details of our debt repayments and borrowings and our exchange of senior notes.
Share Repurchases and Dividends
In
2017
, we repurchased a total of
131 million
shares of our Class A common stock for
$5.0 billion
under our share repurchase program authorization.
Effective January 1, 2017, our Board of Directors increased our share repurchase program authorization to a total of
$12 billion
,
which does not have an expiration date. As of December 31, 2017, $7 billion remained under this authorization. Under the authorization, we may repurchase shares in the open market or in private transactions.
We expect to repurchase at least $5 billion of our Class A common stock during
2018
, although the actual repurchase amount may differ depending on market and other conditions.
Our Board of Directors declared quarterly dividends totaling $3.0 billion in
2017
. We paid dividends of $
2.9 billion
in
2017
.
In January 2018, our Board of Directors approved a 21% increase in our dividend to $0.76 per share on an annualized basis.
We expect to continue to pay quarterly dividends, although each dividend is subject to approval by our Board of Directors.
The chart below summarizes our share repurchases under our publicly announced share repurchase program authorization and dividends paid in
2017
,
2016
and
2015
. In addition, we paid $435 million, $352 million and $425 million in 2017, 2016 and 2015, respectively, related to employee taxes associated with the administration of our share-based compensation plans.
|
Comcast 2017 Annual Report on Form 10-K
|
53
|
|
|
Share Repurchases Under Share Repurchase Program Authorization and Dividends Paid
|
|
(in billions)
|
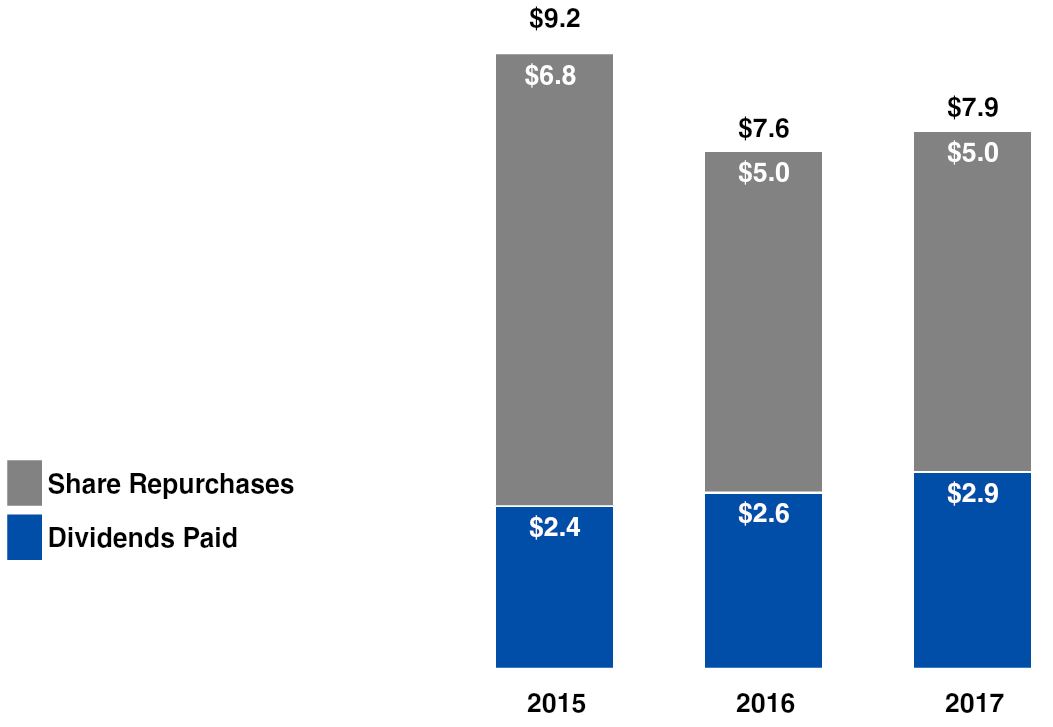
|
Contractual Obligations
|
|
|
Payment Due by Period
|
||||||||||||||
|
As of December 31, 2017 (in millions)
|
Total
|
|
Year 1
|
|
Years 2-3
|
|
Years 4-5
|
|
More than 5
|
|
|||||
|
Debt obligations
(a)
|
$
|
66,139
|
|
$
|
5,089
|
|
$
|
5,983
|
|
$
|
9,704
|
|
$
|
45,363
|
|
|
Capital lease obligations
|
360
|
|
38
|
|
72
|
|
59
|
|
191
|
|
|||||
|
Operating lease obligations
|
4,074
|
|
559
|
|
969
|
|
717
|
|
1,829
|
|
|||||
|
Purchase obligations
(b)
|
51,045
|
|
12,452
|
|
11,811
|
|
7,900
|
|
18,882
|
|
|||||
|
Other long-term liabilities reflected on the balance sheet
(c)
|
5,620
|
|
379
|
|
1,375
|
|
2,341
|
|
1,525
|
|
|||||
|
Total
(d)(e)
|
$
|
127,238
|
|
$
|
18,517
|
|
$
|
20,210
|
|
$
|
20,721
|
|
$
|
67,790
|
|
Refer to Note 10 and Note 16 to Comcast’s consolidated financial statements.
|
(a)
|
Excludes interest payments.
|
|
(b)
|
Purchase obligations consist of agreements to purchase goods and services that are legally binding on us and specify all significant terms, including fixed or minimum quantities to be purchased and price provisions. Our purchase obligations related to our Cable Communications segment and other business development initiatives include programming contracts with cable networks and local broadcast television stations; contracts with customer premise equipment manufacturers; contracts with communications vendors and multichannel video providers for which we provide advertising sales representation; contracts to acquire handsets and other equipment; and other contracts entered into in the normal course of business. Cable Communications programming contracts include amounts payable under fixed or minimum guaranteed commitments and do not represent the total fees that are expected to be paid under programming contracts, which we expect to be significantly higher because these contracts are generally based on the number of subscribers receiving the programming. Our purchase obligations related to our NBCUniversal segments consist primarily of commitments to acquire film and television programming, including the U.S. broadcast rights to future Olympic Games through 2032,
Sunday Night Football
through the 2022-23 season
, including two Super Bowl games, the first of which is in 2018, NHL games through the 2020-21 season, Spanish-language U.S. broadcast rights to FIFA World Cup games through 2022, U.S broadcast rights to English Premier League soccer games through the 2021-22 season, certain NASCAR events through 2024, and certain PGA TOUR and other golf events through 2030, as well as obligations under various creative talent agreements, including obligations to actors, producers and television personalities, and various other television commitments. Purchase obligations do not include contracts with immaterial future commitments.
|
|
(c)
|
Other long-term liabilities reflected on the balance sheet consist primarily of subsidiary preferred shares; deferred compensation obligations; and postretirement, pension and postemployment benefit obligations. A contractual obligation with a carrying value of $1.1 billion is not included in the table above because it is uncertain if the arrangement will be settled. The contractual obligation involves an interest held by a third party in the revenue of certain theme parks. The arrangement provides the counterparty with the right to periodic payments associated with current period revenue and, beginning in June 2017, the option to require NBCUniversal to purchase the interest for cash in an amount based on a contractual formula. The contractual formula is based on an average of specified historical theme park revenue at the time of exercise, which amount could be significantly higher than the carrying value. As of December 31, 2017, the value of the contractual obligation was
$1.5 billion
, based on inputs to the contractual formula as of that date. See Note 16 to Comcast’s consolidated financial statements for additional information related to this arrangement. Liabilities for uncertain tax positions of
$809 million
and the associated interest and penalties are not included in the table above because it is uncertain if or when these amounts will become payable. Payments of $2.7 billion of participations and residuals are also not included in the table above because we cannot make a reliable estimate of the period in which these obligations will be settled.
|
|
(d)
|
Our contractual obligations do not include our commitment to invest up to $4 billion at any one time as an investor in Atairos due to our inability to estimate the timing of this funding. As of December 31, 2017, our remaining commitment is $2.0 billion based on the capital calls received as of that date (see Note 7
|
|
54
|
Comcast 2017 Annual Report on Form 10-K
|
|
to Comcast’s consolidated financial statements). Our contractual obligations do not include certain expenditures related to the construction and development of the Universal Studios theme park in Beijing, China, as these commitments were not executed as of December 31, 2017.
|
(e)
|
Total contractual obligations are made up of the following components.
|
|
(in millions)
|
|
||
|
Liabilities recorded on the balance sheet
|
$
|
73,945
|
|
|
Commitments not recorded on the balance sheet
|
53,293
|
|
|
|
Total
|
$
|
127,238
|
|
|
Off-Balance Sheet Arrangements
|
As of
December 31, 2017
, we did not have any material off-balance sheet arrangements that are reasonably likely to have a current or future effect on our financial condition, results of operations, liquidity, capital expenditures or capital resources.
|
Recent Accounting Pronouncements
|
See Note 3 to each of Comcast’s and NBCUniversal’s consolidated financial statements for additional information related to recent accounting pronouncements, including the impact of the adoption of the updated accounting guidance related to revenue recognition.
|
Critical Accounting Judgments and Estimates
|
The preparation of our consolidated financial statements requires us to make estimates that affect the reported amounts of assets, liabilities, revenue and expenses, and the related disclosure of contingent assets and contingent liabilities. We base our judgments on our historical experience and on various other assumptions that we believe are reasonable under the circumstances, the results of which form the basis for making estimates about the carrying value of assets and liabilities that are not readily apparent from other sources. Actual results may differ from these estimates under different assumptions or conditions.
We believe our judgments and related estimates associated with the valuation and impairment testing of our cable franchise rights and the accounting for film and television costs are critical in the preparation of our consolidated financial statements. Management has discussed the development and selection of these critical accounting judgments and estimates with the Audit Committee of our Board of Directors, and the Audit Committee has reviewed our disclosures relating to them, which are presented below. See Notes 9 and 6 to Comcast’s consolidated financial statements for a discussion of our accounting policies with respect to these items.
Valuation and Impairment Testing of Cable Franchise Rights
Our largest asset, our cable franchise rights, results from agreements we have with state and local governments that allow us to construct and operate a cable business within a specified geographic area. The value of a franchise is derived from the economic benefits we receive from the right to solicit new customers and to market additional services, such as advanced video services and high-speed Internet and voice services, in a particular service area. The amounts we record for cable franchise rights are primarily a result of cable system acquisitions. Typically when we acquire a cable system, the most significant asset we record is the value of the cable franchise rights. Often these cable system acquisitions include multiple franchise areas. We currently serve approximately 6,400 franchise areas in the United States.
We have concluded that our cable franchise rights have an indefinite useful life since there are no legal, regulatory, contractual, competitive, economic or other factors which limit the period over which these rights will contribute to our cash flows. Accordingly, we do not amortize our cable franchise rights but we assess their carrying values annually, or more frequently whenever events or changes in circumstances indicate that the carrying amount may exceed the fair value (“impairment testing”).
For the purpose of our impairment testing, we have grouped the recorded values of our various cable franchise rights into our three Cable Communications divisions or units of account. We evaluate the unit of account periodically to ensure our impairment testing is performed at an appropriate level.
The annual impairment test for indefinite-lived intangible assets allows for the option to first assess qualitative factors to determine whether it is more likely than not that the fair value of the asset is less than its carrying amount. An entity may choose to perform the qualitative assessment or an entity may bypass the qualitative assessment and proceed directly to the quantitative impairment test. If it is determined, on the basis of qualitative factors, that the fair value of the indefinite-lived intangible asset is, more likely than not, less than its carrying value, the quantitative impairment test is required. When performing a quantitative assessment, we estimate the fair value of our cable franchise rights primarily based on a discounted cash flow analysis that involves significant
|
Comcast 2017 Annual Report on Form 10-K
|
55
|
|
judgment. When analyzing the fair values indicated under the discounted cash flow models, we also consider multiples of Adjusted EBITDA generated by the underlying assets, current market transactions and profitability information.
In
2017
, we performed a qualitative assessment of our cable franchise rights. At the time of our previous quantitative assessment in 2014, the estimated fair values of our franchise rights exceeded the carrying value in our three Cable Communications divisions by 26%, 42% and 50%, respectively. We also considered various factors that would affect the estimated fair values of our cable franchise rights in our qualitative assessment in
2017
, including changes in our projected future cash flows associated with our Cable Communications segment; market transactions and macroeconomic conditions; weighted-average cost of capital; and an increase in our market capitalization. Based on this assessment, we concluded that it was more likely than not that the estimated fair values of our cable franchise rights were higher than the carrying values and that the performance of a quantitative impairment test was not required.
Since the adoption of the accounting guidance related to goodwill and intangible assets in 2002, we have not recorded any significant impairment charges to cable franchise rights.
We could record impairment charges in the future if there are changes in long-term market conditions, in expected future operating results, or in federal or state regulations that prevent us from recovering the carrying value of these cable franchise rights. Assumptions made about increased competition and economic conditions could also impact the results of any qualitative assessment and the valuations used in future annual quantitative impairment testing and result in a reduction in the fair values of our cable franchise rights. In addition, a future change in the unit of account could result in the recognition of an impairment charge.
Film and Television Costs
We capitalize film and television production costs, including direct costs, production overhead, print costs, development costs and interest. We amortize capitalized film and television production costs, including acquired libraries, and accrue costs associated with participation and residual payments to programming and production expenses. We generally record the amortization and the accrued costs using the individual film forecast computation method, which amortizes the costs using the ratio of the current period’s revenue to estimated total remaining revenue from all sources (“ultimate revenue”). Estimates of ultimate revenue have a significant impact on how quickly capitalized costs are amortized and, therefore, are updated regularly.
Our estimates of ultimate revenue for films generally include revenue from all sources that are expected to be earned within 10 years from the date of a film’s initial release. These estimates are based on the historical performance of similar content, as well as factors unique to the content itself. The most sensitive factor affecting our estimate of ultimate revenue for a film intended for theatrical release is the film’s theatrical performance, as subsequent revenue from the licensing and sale of a film has historically exhibited a high correlation to its theatrical performance. Upon a film’s release, our estimates of revenue from succeeding markets, including from content licensing across multiple platforms and home entertainment sales, are revised based on historical relationships and an analysis of current market trends.
With respect to television series or other owned television programming, the most sensitive factor affecting our estimate of ultimate revenue is whether the series can be successfully licensed beyond its initial license. Initial estimates of ultimate revenue are limited to the amount of revenue contracted for each episode under the initial license. Once it is determined that a television series or other owned television programming can be licensed for subsequent platforms, revenue estimates for these platforms, such as U.S. and international syndication, home entertainment, and other distribution platforms, are included in ultimate revenue. Revenue estimates for produced episodes include revenue expected to be earned within 10 years of delivery of the initial episode or, if still in production, 5 years from the delivery of the most recent episode, if later.
We capitalize the costs of programming content that we license but do not own, including rights to multiyear, live-event sports programming, at the earlier of when payments are made for the programming or when the license period begins and the content is made available for use. We amortize capitalized programming costs as the associated programs are broadcast. We generally amortize multiyear, live-event sports programming rights using the ratio of the current period revenue to the estimated ultimate revenue or under the terms of the contract.
Capitalized film and television costs are subject to impairment testing when certain triggering events are identified. If the fair value of a production were to fall below its unamortized cost, we would record an adjustment for the amount by which the unamortized capitalized costs exceed the production’s fair value. The fair value assessment is generally based on estimated future discounted cash flows, which are supported by our internal forecasts. Adjustments to capitalized film production costs were not material in any of the periods presented.
|
56
|
Comcast 2017 Annual Report on Form 10-K
|
|
|
Interest Rate Risk Management
|
We maintain a mix of fixed-rate and variable-rate debt and we are exposed to the market risk of adverse changes in interest rates. In order to manage the cost and volatility relating to the interest cost of our outstanding debt, we enter into various interest rate risk management derivative transactions in accordance with our policies.
We monitor our exposure to the risk of adverse changes in interest rates through the use of techniques that include market valuation and sensitivity analyses. We do not engage in any speculative or leveraged derivative transactions.
Our interest rate derivative financial instruments, which may include swaps, rate locks, caps and collars, represent an integral part of our interest rate risk management program. Comcast’s interest rate derivative financial instruments reduced the portion of Comcast’s total consolidated debt at fixed rates as of
December 31, 2017
to 86.8% from 89.5%. As of
December 31, 2017
, NBCUniversal had no outstanding interest rate derivative financial instruments.
In
2017
,
2016
and
2015
, the effect of our interest rate derivative financial instruments was to decrease Comcast’s consolidated interest expense by $23 million, $36 million and $62 million, respectively. The effect of NBCUniversal’s interest rate derivative financial instruments was not material to NBCUniversal’s consolidated financial statements for any period presented. Interest rate derivative financial instruments may have a significant effect on Comcast’s interest expense in the future.
The table below summarizes as of
December 31, 2017
by contractual year of maturity the principal cash flows, notional amounts, fair values and contract terms of financial instruments subject to interest rate risk maintained by us.
|
(in millions)
|
2018
|
|
2019
|
|
2020
|
|
2021
|
|
2022
|
|
Thereafter
|
|
Total
|
|
Estimated
Fair Value as of
December 31, 2017
|
|
||||||||
|
Debt
|
||||||||||||||||||||||||
|
Fixed rate
|
$
|
3,346
|
|
$
|
2,242
|
|
$
|
3,434
|
|
$
|
2,048
|
|
$
|
2,892
|
|
$
|
45,554
|
|
$
|
59,516
|
|
$
|
64,664
|
|
|
Average interest rate
|
4.4
|
%
|
3.2
|
%
|
5.1
|
%
|
4.3
|
%
|
5.7
|
%
|
4.3
|
%
|
4.4
|
%
|
||||||||||
|
Variable rate
|
$
|
1,781
|
|
$
|
125
|
|
$
|
254
|
|
$
|
1,836
|
|
$
|
2,987
|
|
$
|
—
|
|
$
|
6,983
|
|
$
|
6,990
|
|
|
Average interest rate
|
2.5
|
%
|
0.8
|
%
|
0.8
|
%
|
2.4
|
%
|
1.1
|
%
|
—
|
%
|
1.8
|
%
|
||||||||||
|
Interest Rate Instruments
|
||||||||||||||||||||||||
|
Fixed to variable swaps
|
$
|
1,600
|
|
$
|
200
|
|
$
|
—
|
|
$
|
—
|
|
$
|
—
|
|
$
|
—
|
|
$
|
1,800
|
|
$
|
9
|
|
|
Average pay rate
|
4.7
|
%
|
5.4
|
%
|
—
|
%
|
—
|
%
|
—
|
%
|
—
|
%
|
4.6
|
%
|
||||||||||
|
Average receive rate
|
5.8
|
%
|
5.7
|
%
|
—
|
%
|
—
|
%
|
—
|
%
|
—
|
%
|
5.8
|
%
|
|
|||||||||
We use the notional amount of each interest rate derivative financial instrument to calculate the interest to be paid or received. The notional amounts do not represent our exposure to credit loss. The estimated fair value approximates the amount of payments to be made or proceeds to be received to settle the outstanding contracts, including accrued interest. We estimate interest rates on variable rate debt and swaps using the relevant average implied forward rates through the year of maturity based on the yield curve in effect on
December 31, 2017
, plus the applicable borrowing margin.
See Note 2 to each of Comcast’s and NBCUniversal’s consolidated financial statements for additional information on our accounting policies for derivative financial instruments.
|
Foreign Exchange Risk Management
|
NBCUniversal has significant operations in a number of countries outside the United States, and certain of NBCUniversal’s operations are conducted in foreign currencies. The value of these currencies fluctuates relative to the U.S. dollar. These changes could adversely affect the U.S. dollar equivalent value of our non-U.S. dollar revenue and operating costs and expenses and reduce international demand for our content, all of which could negatively affect our business, financial condition and results of operations in a given period or in specific territories.
As part of our overall strategy to manage the level of exposure to the risk of foreign exchange rate fluctuations, NBCUniversal enters into derivative financial instruments related to a significant portion of its foreign currency exposure for transactions denominated in other than the functional currency. NBCUniversal enters into foreign currency forward contracts that change in value as currency exchange rates fluctuate to protect the functional currency equivalent value of non-functional currency denominated assets, liabilities, commitments, and forecasted non-functional currency revenue and expenses. In accordance with
|
Comcast 2017 Annual Report on Form 10-K
|
57
|
|
our policy, NBCUniversal hedges forecasted foreign currency transactions for periods generally not to exceed 18 months. In certain circumstances, NBCUniversal enters into foreign exchange contracts with initial maturities in excess of 18 months. As of
December 31, 2017
and
2016
, NBCUniversal had foreign exchange contracts with a total notional value of $1.3 billion and $1.5 billion, respectively. As of
December 31, 2017
and
2016
, the aggregate estimated fair value of these foreign exchange contracts was not material.
We have analyzed our foreign currency exposure related to NBCUniversal’s operations as of
December 31, 2017
, including our hedging contracts, to identify assets and liabilities denominated in a currency other than their functional currency. For those assets and liabilities, we then evaluated the effect of a 10% shift in currency exchange rates between the functional currency and the U.S. dollar. Our analysis of such a shift in exchange rates indicated that it would not have a material effect on our
2017
net income attributable to Comcast Corporation. In addition, the impact of fluctuations in currencies relative to the U.S. dollar for our non-U.S. dollar functional currency operations did not have a material impact on our financial condition or results of operations in
2017
.
Comcast is also exposed to the market risks associated with fluctuations in currency exchange rates as they relate to its foreign currency denominated debt obligations. We use cross-currency swaps for foreign currency denominated debt obligations when those obligations are denominated in a currency other than the functional currency. Cross-currency swaps effectively convert fixed-rate foreign currency denominated debt to fixed-rate U.S. dollar denominated debt in order to hedge the risk that the cash flows related to annual interest payments and the payment of principal at maturity may be adversely affected by fluctuations in currency exchange rates. The gains and losses on the cross-currency swaps offset changes in the U.S. dollar equivalent value of the related exposures. As of
December 31, 2017
and
2016
, the fair value of our cross-currency swaps on our £625 million principal amount of 5.50% senior notes due 2029 was a liability of $80 million and $189 million, respectively.
|
Counterparty Credit Risk Management
|
Comcast and NBCUniversal manage the credit risks associated with our derivative financial instruments through diversification and the evaluation and monitoring of the creditworthiness of counterparties. Although we may be exposed to losses in the event of nonperformance by counterparties, we do not expect such losses, if any, to be significant. Comcast has agreements with certain counterparties that include collateral provisions. These provisions require a party with an aggregate unrealized loss position in excess of certain thresholds to post cash collateral for the amount in excess of the threshold. The threshold levels in our collateral agreements are based on our and the counterparty’s credit ratings. As of
December 31, 2017
and
2016
, Comcast was not required to post collateral under the terms of these agreements. As of
December 31, 2017
and
2016
, we did not hold any collateral under the terms of these agreements.
|
58
|
Comcast 2017 Annual Report on Form 10-K
|
|
|
Index
|
Page
|
NBCUniversal Media, LLC
See Index to NBCUniversal Media, LLC Financial Statements and Supplemental Data on page
11
6.
|
Comcast 2017 Annual Report on Form 10-K
|
59
|
|
Management’s Report on Comcast’s Financial Statements
Our management is responsible for the preparation, integrity and fair presentation of information in Comcast’s consolidated financial statements, including estimates and judgments. The consolidated financial statements presented in this report have been prepared in accordance with accounting principles generally accepted in the United States. Our management believes the Comcast consolidated financial statements and other financial information included in this report fairly present, in all material respects, Comcast’s financial condition, results of operations and cash flows as of and for the periods presented in this report. The Comcast consolidated financial statements have been audited by Deloitte & Touche LLP, an independent registered public accounting firm, as stated in their report, which is included herein.
Management’s Report on Comcast’s Internal Control Over Financial Reporting
Our management is responsible for establishing and maintaining an adequate system of internal control over financial reporting. Our system of internal control over financial reporting is designed to provide reasonable assurance regarding the reliability of financial reporting and the preparation of financial statements for external purposes in accordance with accounting principles generally accepted in the United States.
Our internal control over financial reporting includes those policies and procedures that:
|
•
|
Pertain to the maintenance of records that, in reasonable detail, accurately and fairly reflect our transactions and dispositions of our assets.
|
|
•
|
Provide reasonable assurance that our transactions are recorded as necessary to permit preparation of our financial statements in accordance with accounting principles generally accepted in the United States, and that our receipts and expenditures are being made only in accordance with authorizations of our management and our directors.
|
|
•
|
Provide reasonable assurance regarding prevention or timely detection of unauthorized acquisition, use or disposition of our assets that could have a material effect on the financial statements.
|
Because of its inherent limitations, a system of internal control over financial reporting can provide only reasonable assurance and may not prevent or detect misstatements. Further, because of changes in conditions, effectiveness of internal control over financial reporting may vary over time. Our system contains self-monitoring mechanisms, and actions are taken to correct deficiencies as they are identified.
Our management conducted an evaluation of the effectiveness of the system of internal control over financial reporting based on the framework in
Internal Control — Integrated Framework (2013)
issued by the Committee of Sponsoring Organizations of the Treadway Commission. Based on this evaluation, our management concluded that Comcast’s system of internal control over financial reporting was effective as of
December 31, 2017
. The effectiveness of Comcast’s internal controls over financial reporting of Comcast has been audited by Deloitte & Touche LLP, an independent registered public accounting firm, as stated in their report, which is included herein.
Audit Committee Oversight
The Audit Committee of the Board of Directors, which is comprised solely of independent directors, has oversight responsibility for our financial reporting process and the audits of Comcast’s consolidated financial statements and internal control over financial reporting. The Audit Committee meets regularly with management and with our internal auditors and independent registered public accounting firm (collectively, the “auditors”) to review matters related to the quality and integrity of our financial reporting, internal control over financial reporting (including compliance matters related to our Code of Conduct), and the nature, extent, and results of internal and external audits. Our auditors have full and free access and report directly to the Audit Committee. The Audit Committee recommended, and the Board of Directors approved, that the Comcast audited consolidated financial statements be included in this Form 10-K.
|
/s/ BRIAN L. ROBERTS
|
/s/ MICHAEL J. CAVANAGH
|
/s/ DANIEL C. MURDOCK
|
||
|
Brian L. Roberts
|
|
Michael J. Cavanagh
|
|
Daniel C. Murdock
|
|
Chairman and
Chief Executive Officer
|
|
Senior Executive Vice President and
Chief Financial Officer
|
|
Senior Vice President, Chief
Accounting Officer and Controller
|
|
60
|
Comcast 2017 Annual Report on Form 10-K
|
|
To the Board of Directors and Stockholders of
Comcast Corporation
Philadelphia, Pennsylvania
Opinions on the Consolidated Financial Statements and Internal Control over Financial Reporting
We have audited the accompanying consolidated balance sheets of Comcast Corporation and subsidiaries (the “Company”) as of
December 31, 2017
and
2016
, the related consolidated statements of income, comprehensive income, cash flows and changes in equity for each of the three years in the period ended
December 31, 2017
, and the related notes (collectively referred to as the “financial statements”). We also have audited the Company’s internal control over financial reporting as of
December 31, 2017
, based on criteria established in
Internal Control — Integrated Framework (2013)
issued by the Committee of Sponsoring Organizations of the Treadway Commission (COSO).
In our opinion, the financial statements referred to above present fairly, in all material respects, the financial position of the Company as of
December 31, 2017
and
2016
, and the results of its operations and its cash flows for each of the three years in the period ended
December 31, 2017
, in conformity with accounting principles generally accepted in the United States of America. Also, in our opinion, the Company maintained, in all material respects, effective internal control over financial reporting as of
December 31, 2017
, based on criteria established in
Internal Control — Integrated Framework (2013)
issued by COSO.
Basis for Opinions
The Company’s management is responsible for these financial statements, for maintaining effective internal control over financial reporting, and for its assessment of the effectiveness of internal control over financial reporting, included in the accompanying Management’s Report on Comcast’s Internal Control Over Financial Reporting. Our responsibility is to express an opinion on the Company’s financial statements and an opinion on the Company’s internal control over financial reporting based on our audits. We are a public accounting firm registered with the Public Company Accounting Oversight Board (United States) (PCAOB) and are required to be independent with respect to the Company in accordance with the U.S. federal securities laws and the applicable rules and regulations of the Securities and Exchange Commission and the PCAOB.
We conducted our audits in accordance with the standards of the PCAOB. Those standards require that we plan and perform the audits to obtain reasonable assurance about whether the financial statements are free of material misstatement, whether due to error or fraud, and whether effective internal control over financial reporting was maintained in all material respects.
Our audits of the financial statements included performing procedures to assess the risks of material misstatement of the financial statements, whether due to error or fraud, and performing procedures to respond to those risks. Such procedures included examining, on a test basis, evidence regarding the amounts and disclosures in the financial statements. Our audits also included evaluating the accounting principles used and significant estimates made by management, as well as evaluating the overall presentation of the financial statements. Our audit of internal control over financial reporting included obtaining an understanding of internal control over financial reporting, assessing the risk that a material weakness exists, and testing and evaluating the design and operating effectiveness of internal control based on the assessed risk. Our audits also included performing such other procedures as we considered necessary in the circumstances. We believe that our audits provide a reasonable basis for our opinions.
Definition and Limitations of Internal Control over Financial Reporting
A company's internal control over financial reporting is a process designed to provide reasonable assurance regarding the reliability of financial reporting and the preparation of financial statements for external purposes in accordance with generally accepted accounting principles. A company's internal control over financial reporting includes those policies and procedures that (1) pertain to the maintenance of records that, in reasonable detail, accurately and fairly reflect the transactions and dispositions of the assets of the company; (2) provide reasonable assurance that transactions are recorded as necessary to permit preparation of financial statements in accordance with generally accepted accounting principles, and that receipts and expenditures of the company are being made only in accordance with authorizations of management and directors of the company; and (3) provide reasonable assurance regarding prevention or timely detection of unauthorized acquisition, use, or disposition of the company's assets that could have a material effect on the financial statements.
Because of its inherent limitations, internal control over financial reporting may not prevent or detect misstatements. Also, projections of any evaluation of effectiveness to future periods are subject to the risk that controls may become inadequate because of changes in conditions, or that the degree of compliance with the policies or procedures may deteriorate.
/s/ Deloitte & Touche LLP
Philadelphia, Pennsylvania
January 31, 2018
We have served as the Company’s auditor since 1963.
|
Comcast 2017 Annual Report on Form 10-K
|
61
|
|
|
December 31 (in millions, except share data)
|
2017
|
|
2016
|
|
|||
|
Assets
|
|||||||
|
Current Assets:
|
|||||||
|
Cash and cash equivalents
|
$
|
3,428
|
|
$
|
3,301
|
|
|
|
Receivables, net
|
8,546
|
|
7,955
|
|
|||
|
Programming rights
|
1,613
|
|
1,250
|
|
|||
|
Deposits
|
9
|
|
1,772
|
|
|||
|
Other current assets
|
2,464
|
|
2,083
|
|
|||
|
Total current assets
|
16,060
|
|
16,361
|
|
|||
|
Film and television costs
|
7,076
|
|
7,252
|
|
|||
|
Investments
|
6,931
|
|
5,247
|
|
|||
|
Property and equipment, net
|
38,470
|
|
36,253
|
|
|||
|
Franchise rights
|
59,364
|
|
59,364
|
|
|||
|
Goodwill
|
36,780
|
|
35,980
|
|
|||
|
Other intangible assets, net
|
18,779
|
|
17,274
|
|
|||
|
Other noncurrent assets, net
|
3,489
|
|
2,769
|
|
|||
|
Total assets
|
$
|
186,949
|
|
$
|
180,500
|
|
|
|
Liabilities and Equity
|
|||||||
|
Current Liabilities:
|
|||||||
|
Accounts payable and accrued expenses related to trade creditors
|
$
|
6,926
|
|
$
|
6,915
|
|
|
|
Accrued participations and residuals
|
1,683
|
|
1,726
|
|
|||
|
Deferred revenue
|
1,552
|
|
1,132
|
|
|||
|
Accrued expenses and other current liabilities
|
6,266
|
|
6,282
|
|
|||
|
Current portion of long-term debt
|
5,134
|
|
5,480
|
|
|||
|
Total current liabilities
|
21,561
|
|
21,535
|
|
|||
|
Long-term debt, less current portion
|
59,422
|
|
55,566
|
|
|||
|
Deferred income taxes
|
24,256
|
|
34,854
|
|
|||
|
Other noncurrent liabilities
|
10,904
|
|
10,925
|
|
|||
|
Commitments and contingencies (Note 16)
|
|
|
|||||
|
Redeemable noncontrolling interests and redeemable subsidiary preferred stock
|
1,357
|
|
1,446
|
|
|||
|
Equity:
|
|||||||
|
Preferred stock—authorized, 20,000,000 shares; issued, zero
|
—
|
|
—
|
|
|||
|
Class A common stock, $0.01 par value—authorized, 7,500,000,000 shares; issued, 5,507,854,670 and 5,614,950,039; outstanding, 4,635,063,642 and 4,742,159,011
|
55
|
|
56
|
|
|||
|
Class B common stock, $0.01 par value—authorized, 75,000,000 shares; issued and outstanding, 9,444,375
|
—
|
|
—
|
|
|||
|
Additional paid-in capital
|
37,497
|
|
38,230
|
|
|||
|
Retained earnings
|
38,192
|
|
23,076
|
|
|||
|
Treasury stock, 872,791,028 Class A common shares
|
(7,517
|
)
|
(7,517
|
)
|
|||
|
Accumulated other comprehensive income (loss)
|
379
|
|
98
|
|
|||
|
Total Comcast Corporation shareholders’ equity
|
68,606
|
|
53,943
|
|
|||
|
Noncontrolling interests
|
843
|
|
2,231
|
|
|||
|
Total equity
|
69,449
|
|
56,174
|
|
|||
|
Total liabilities and equity
|
$
|
186,949
|
|
$
|
180,500
|
|
|
See accompanying notes to consolidated financial statements.
|
62
|
Comcast 2017 Annual Report on Form 10-K
|
|
|
Year ended December 31 (in millions, except per share data)
|
2017
|
|
2016
|
|
2015
|
|
|||||
|
Revenue
|
$
|
84,526
|
|
$
|
80,403
|
|
$
|
74,510
|
|
||
|
Costs and Expenses:
|
|||||||||||
|
Programming and production
|
25,384
|
|
24,463
|
|
22,550
|
|
|||||
|
Other operating and administrative
|
25,013
|
|
23,416
|
|
21,325
|
|
|||||
|
Advertising, marketing and promotion
|
6,317
|
|
6,107
|
|
5,957
|
|
|||||
|
Depreciation
|
7,914
|
|
7,464
|
|
6,781
|
|
|||||
|
Amortization
|
2,353
|
|
2,094
|
|
1,899
|
|
|||||
|
Other operating gains
|
(442
|
)
|
—
|
|
—
|
|
|||||
|
Total costs and expenses
|
66,539
|
|
63,544
|
|
58,512
|
|
|||||
|
Operating income
|
17,987
|
|
16,859
|
|
15,998
|
|
|||||
|
Other Income (Expense):
|
|||||||||||
|
Interest expense
|
(3,086
|
)
|
(2,942
|
)
|
(2,702
|
)
|
|||||
|
Investment income (loss), net
|
253
|
|
213
|
|
81
|
|
|||||
|
Equity in net income (losses) of investees, net
|
107
|
|
(104
|
)
|
(325
|
)
|
|||||
|
Other income (expense), net
|
61
|
|
327
|
|
320
|
|
|||||
|
Total other income (expense)
|
(2,665
|
)
|
(2,506
|
)
|
(2,626
|
)
|
|||||
|
Income before income taxes
|
15,322
|
|
14,353
|
|
13,372
|
|
|||||
|
Income tax benefit (expense)
|
7,578
|
|
(5,308
|
)
|
(4,959
|
)
|
|||||
|
Net income
|
22,900
|
|
9,045
|
|
8,413
|
|
|||||
|
Net (income) loss attributable to noncontrolling interests and redeemable subsidiary preferred stock
|
(186
|
)
|
(350
|
)
|
(250
|
)
|
|||||
|
Net income attributable to Comcast Corporation
|
$
|
22,714
|
|
$
|
8,695
|
|
$
|
8,163
|
|
||
|
Basic earnings per common share attributable to Comcast Corporation shareholders
|
$
|
4.82
|
|
$
|
1.80
|
|
$
|
1.64
|
|
||
|
Diluted earnings per common share attributable to Comcast Corporation shareholders
|
$
|
4.75
|
|
$
|
1.78
|
|
$
|
1.62
|
|
||
|
Dividends declared per common share
|
$
|
0.63
|
|
$
|
0.55
|
|
$
|
0.50
|
|
||
See accompanying notes to consolidated financial statements.
|
Comcast 2017 Annual Report on Form 10-K
|
63
|
|
|
Year ended December 31 (in millions)
|
2017
|
|
2016
|
|
2015
|
|
|||||
|
Net income
|
$
|
22,900
|
|
$
|
9,045
|
|
$
|
8,413
|
|
||
|
Unrealized gains (losses) on marketable securities, net of deferred taxes of $25, $(1) and $(1)
|
(42
|
)
|
—
|
|
1
|
|
|||||
|
Deferred gains (losses) on cash flow hedges, net of deferred taxes of $(35), $35 and $62
|
60
|
|
(60
|
)
|
(106
|
)
|
|||||
|
Amounts reclassified to net income:
|
|||||||||||
|
Realized (gains) losses on marketable securities, net of deferred taxes of $1, $1 and $1
|
(1
|
)
|
(1
|
)
|
(1
|
)
|
|||||
|
Realized (gains) losses on cash flow hedges, net of deferred taxes of $22, $(54) and $(38)
|
(37
|
)
|
92
|
|
64
|
|
|||||
|
Employee benefit obligations, net of deferred taxes of $(24), $(125) and $(43)
|
41
|
|
213
|
|
74
|
|
|||||
|
Currency translation adjustments, net of deferred taxes of $(40), $(14) and $34
|
147
|
|
102
|
|
(89
|
)
|
|||||
|
Comprehensive income
|
23,068
|
|
9,391
|
|
8,356
|
|
|||||
|
Net (income) loss attributable to noncontrolling interests and redeemable subsidiary preferred stock
|
(186
|
)
|
(350
|
)
|
(250
|
)
|
|||||
|
Other comprehensive (income) loss attributable to noncontrolling interests
|
(81
|
)
|
(74
|
)
|
29
|
|
|||||
|
Comprehensive income attributable to Comcast Corporation
|
$
|
22,801
|
|
$
|
8,967
|
|
$
|
8,135
|
|
||
See accompanying notes to consolidated financial statements.
|
64
|
Comcast 2017 Annual Report on Form 10-K
|
|
|
Year ended December 31 (in millions)
|
2017
|
|
2016
|
|
2015
|
|
|||||
|
Operating Activities
|
|||||||||||
|
Net income
|
$
|
22,900
|
|
$
|
9,045
|
|
$
|
8,413
|
|
||
|
Adjustments to reconcile net income to net cash provided by operating activities:
|
|||||||||||
|
Depreciation, amortization and other operating gains
|
9,825
|
|
9,558
|
|
8,680
|
|
|||||
|
Share-based compensation
|
751
|
|
640
|
|
567
|
|
|||||
|
Noncash interest expense (income), net
|
272
|
|
230
|
|
205
|
|
|||||
|
Equity in net (income) losses of investees, net
|
(107
|
)
|
104
|
|
325
|
|
|||||
|
Cash received from investees
|
95
|
|
85
|
|
168
|
|
|||||
|
Net (gain) loss on investment activity and other
|
(182
|
)
|
(169
|
)
|
(318
|
)
|
|||||
|
Deferred income taxes
|
(10,655
|
)
|
1,444
|
|
958
|
|
|||||
|
Changes in operating assets and liabilities, net of effects of acquisitions and divestitures:
|
|||||||||||
|
Current and noncurrent receivables, net
|
(888
|
)
|
(782
|
)
|
(708
|
)
|
|||||
|
Film and television costs, net
|
(197
|
)
|
(495
|
)
|
(299
|
)
|
|||||
|
Accounts payable and accrued expenses related to trade creditors
|
181
|
|
374
|
|
384
|
|
|||||
|
Other operating assets and liabilities
|
(592
|
)
|
(209
|
)
|
1,110
|
|
|||||
|
Net cash provided by operating activities
|
21,403
|
|
19,825
|
|
19,485
|
|
|||||
|
Investing Activities
|
|||||||||||
|
Capital expenditures
|
(9,550
|
)
|
(9,135
|
)
|
(8,499
|
)
|
|||||
|
Cash paid for intangible assets
|
(1,747
|
)
|
(1,686
|
)
|
(1,370
|
)
|
|||||
|
Acquisitions and construction of real estate properties
|
(418
|
)
|
(428
|
)
|
(178
|
)
|
|||||
|
Acquisitions, net of cash acquired
|
(532
|
)
|
(3,929
|
)
|
(1,786
|
)
|
|||||
|
Proceeds from sales of businesses and investments
|
150
|
|
218
|
|
433
|
|
|||||
|
Purchases of investments
|
(2,292
|
)
|
(1,697
|
)
|
(784
|
)
|
|||||
|
Deposits
|
—
|
|
(1,749
|
)
|
(18
|
)
|
|||||
|
Other
|
685
|
|
21
|
|
238
|
|
|||||
|
Net cash provided by (used in) investing activities
|
(13,704
|
)
|
(18,385
|
)
|
(11,964
|
)
|
|||||
|
Financing Activities
|
|||||||||||
|
Proceeds from (repayments of) short-term borrowings, net
|
(1,905
|
)
|
1,790
|
|
135
|
|
|||||
|
Proceeds from borrowings
|
11,466
|
|
9,231
|
|
5,486
|
|
|||||
|
Repurchases and repayments of debt
|
(6,364
|
)
|
(3,052
|
)
|
(4,378
|
)
|
|||||
|
Repurchases of common stock under repurchase program and employee plans
|
(5,435
|
)
|
(5,352
|
)
|
(7,175
|
)
|
|||||
|
Dividends paid
|
(2,883
|
)
|
(2,601
|
)
|
(2,437
|
)
|
|||||
|
Purchase of Universal Studios Japan noncontrolling interests
|
(2,299
|
)
|
—
|
|
—
|
|
|||||
|
Issuances of common stock
|
—
|
|
23
|
|
36
|
|
|||||
|
Distributions to noncontrolling interests and dividends for redeemable subsidiary preferred stock
|
(252
|
)
|
(253
|
)
|
(232
|
)
|
|||||
|
Other
|
100
|
|
(220
|
)
|
(571
|
)
|
|||||
|
Net cash provided by (used in) financing activities
|
(7,572
|
)
|
(434
|
)
|
(9,136
|
)
|
|||||
|
Increase (decrease) in cash and cash equivalents
|
127
|
|
1,006
|
|
(1,615
|
)
|
|||||
|
Cash and cash equivalents, beginning of year
|
3,301
|
|
2,295
|
|
3,910
|
|
|||||
|
Cash and cash equivalents, end of year
|
$
|
3,428
|
|
$
|
3,301
|
|
$
|
2,295
|
|
||
See accompanying notes to consolidated financial statements.
|
Comcast 2017 Annual Report on Form 10-K
|
65
|
|
|
|
Redeemable
Noncontrolling Interests and Redeemable Subsidiary Preferred Stock |
|
Common Stock
|
Additional
Paid-In Capital |
|
Retained
Earnings |
|
Treasury
Stock at Cost |
|
Accumulated
Other Comprehensive Income (Loss) |
|
Non-
controlling Interests |
|
Total
Equity |
|
||||||||||||||||||||||
|
(in millions)
|
A
|
|
A
Special |
|
B
|
|
|||||||||||||||||||||||||||||||
|
Balance, December 31, 2014
|
$
|
1,066
|
|
$
|
50
|
|
$
|
9
|
|
$
|
—
|
|
$
|
38,776
|
|
$
|
21,539
|
|
$
|
(7,517
|
)
|
$
|
(146
|
)
|
$
|
357
|
|
$
|
53,068
|
|
|||||||
|
Stock compensation plans
|
768
|
|
|
|
768
|
|
|||||||||||||||||||||||||||||||
|
Repurchases of common stock under repurchase program and employee plans
|
(2
|
)
|
(1,373
|
)
|
(5,806
|
)
|
(7,181
|
)
|
|||||||||||||||||||||||||||||
|
Employee stock purchase plans
|
136
|
|
136
|
|
|||||||||||||||||||||||||||||||||
|
Dividends declared
|
(2,483
|
)
|
(2,483
|
)
|
|||||||||||||||||||||||||||||||||
|
Other comprehensive income (loss)
|
|
(28
|
)
|
(29
|
)
|
(57
|
)
|
||||||||||||||||||||||||||||||
|
Contributions from (distributions to) noncontrolling interests, net
|
11
|
|
(146
|
)
|
(146
|
)
|
|||||||||||||||||||||||||||||||
|
Reclassification of Class A Special common stock
|
|
|
7
|
|
(7
|
)
|
|
|
—
|
|
|||||||||||||||||||||||||||
|
Acquisition of Universal Studios Japan
|
1,440
|
|
1,440
|
|
|||||||||||||||||||||||||||||||||
|
Other
|
58
|
|
183
|
|
(77
|
)
|
106
|
|
|||||||||||||||||||||||||||||
|
Net income (loss)
|
86
|
|
|
|
|
|
8,163
|
|
|
|
164
|
|
8,327
|
|
|||||||||||||||||||||||
|
Balance, December 31, 2015
|
1,221
|
|
57
|
|
—
|
|
—
|
|
38,490
|
|
21,413
|
|
(7,517
|
)
|
(174
|
)
|
1,709
|
|
53,978
|
|
|||||||||||||||||
|
Stock compensation plans
|
770
|
|
|
|
770
|
|
|||||||||||||||||||||||||||||||
|
Repurchases of common stock under repurchase program and employee plans
|
(1
|
)
|
|
(999
|
)
|
(4,376
|
)
|
(5,376
|
)
|
||||||||||||||||||||||||||||
|
Employee stock purchase plans
|
156
|
|
156
|
|
|||||||||||||||||||||||||||||||||
|
Dividends declared
|
(2,656
|
)
|
(2,656
|
)
|
|||||||||||||||||||||||||||||||||
|
Other comprehensive income (loss)
|
272
|
|
74
|
|
346
|
|
|||||||||||||||||||||||||||||||
|
Contributions from (distributions to) noncontrolling interests, net
|
(16
|
)
|
(134
|
)
|
(134
|
)
|
|||||||||||||||||||||||||||||||
|
Other
|
148
|
|
|
|
(187
|
)
|
325
|
|
138
|
|
|||||||||||||||||||||||||||
|
Net income (loss)
|
93
|
|
8,695
|
|
257
|
|
8,952
|
|
|||||||||||||||||||||||||||||
|
Balance, December 31, 2016
|
1,446
|
|
56
|
|
—
|
|
—
|
|
38,230
|
|
23,076
|
|
(7,517
|
)
|
98
|
|
2,231
|
|
56,174
|
|
|||||||||||||||||
|
Stock compensation plans
|
554
|
|
554
|
|
|||||||||||||||||||||||||||||||||
|
Repurchases of common stock under repurchase program and employee plans
|
(1
|
)
|
(832
|
)
|
(4,623
|
)
|
(5,456
|
)
|
|||||||||||||||||||||||||||||
|
Employee stock purchase plans
|
190
|
|
190
|
|
|||||||||||||||||||||||||||||||||
|
Dividends declared
|
(2,975
|
)
|
(2,975
|
)
|
|||||||||||||||||||||||||||||||||
|
Other comprehensive income (loss)
|
87
|
|
81
|
|
168
|
|
|||||||||||||||||||||||||||||||
|
Contributions from (distributions to) noncontrolling interests, net
|
(39
|
)
|
(108
|
)
|
(108
|
)
|
|||||||||||||||||||||||||||||||
|
Purchase of Universal Studios Japan noncontrolling interests
|
(696
|
)
|
194
|
|
(1,736
|
)
|
(2,238
|
)
|
|||||||||||||||||||||||||||||
|
Other
|
(123
|
)
|
51
|
|
262
|
|
313
|
|
|||||||||||||||||||||||||||||
|
Net income (loss)
|
73
|
|
|
|
|
|
22,714
|
|
|
|
113
|
|
22,827
|
|
|||||||||||||||||||||||
|
Balance, December 31, 2017
|
$
|
1,357
|
|
$
|
55
|
|
$
|
—
|
|
$
|
—
|
|
$
|
37,497
|
|
$
|
38,192
|
|
$
|
(7,517
|
)
|
$
|
379
|
|
$
|
843
|
|
$
|
69,449
|
|
|||||||
See accompanying notes to consolidated financial statements.
|
66
|
Comcast 2017 Annual Report on Form 10-K
|
|
|
Note 1: Business and Basis of Presentation
|
We are a global media and technology company with
two
primary businesses, Comcast Cable and NBCUniversal. We were incorporated under the laws of Pennsylvania in December 2001. Through our predecessors, we have developed, managed and operated cable systems since 1963.
We present our operations for Comcast Cable in one reportable business segment, referred to as Cable Communications, and our operations for NBCUniversal in four reportable business segments: Cable Networks, Broadcast Television, Filmed Entertainment and Theme Parks (collectively, the “NBCUniversal segments”).
See Note 17 for additional information on our reportable business segments.
Our Cable Communications segment primarily manages and operates cable systems that serve residential and business customers in the United States and sells advertising. As of
December 31, 2017
, our cable systems had
29.3 million
total customer relationships, including
27.2 million
residential and
2.2 million
business customer relationships, and served
22.4 million
video customers,
25.9 million
high-speed Internet customers and
11.6 million
voice customers.
Our Cable Networks segment consists primarily of a diversified portfolio of cable television networks. Our cable networks are comprised of our national cable networks that provide a variety of entertainment, news and information, and sports content; our regional sports and news networks; our international cable networks; our cable television studio production operations; and our various digital properties.
Our Broadcast Television segment consists primarily of the NBC and Telemundo broadcast networks, our NBC and Telemundo owned local broadcast television stations, the NBC Universo national cable network, our broadcast television studio production operations; and our various digital properties.
Our Filmed Entertainment segment primarily produces, acquires, markets and distributes filmed entertainment worldwide. Our films are produced primarily under the Universal Pictures, Illumination, DreamWorks Animation and Focus Features
names.
See Note 5 for additional information on the DreamWorks Animation acquisition.
Our Theme Parks segment consists primarily of our Universal theme parks in Orlando, Florida; Hollywood, California; and Osaka, Japan. See Note 5 for additional information on the Universal Studios Japan transactions.
Our other business interests, which are included in Corporate and Other, consist primarily of Comcast Spectacor, which owns the Philadelphia Flyers and the Wells Fargo Center arena in Philadelphia, Pennsylvania and operates arena management-related businesses, and our wireless phone service, which commenced operations in 2017.
Basis of Presentation
The accompanying consolidated financial statements include all entities in which we have a controlling voting interest and variable interest entities (“VIEs”) required to be consolidated in accordance with generally accepted accounting principles in the United States (“GAAP”).
We translate assets and liabilities of our foreign operations where the functional currency is the local currency, primarily the Japanese yen, euro and British pound, into U.S. dollars at the exchange rate as of the balance sheet date and translate revenue and expenses using average monthly exchange rates. The related translation adjustments are recorded as a component of accumulated other comprehensive income (loss) in our consolidated balance sheet. Any foreign currency transaction gains or losses are included in our consolidated statement of income.
Stock Split
On January 24, 2017, our Board of Directors approved a
two
-for-one stock split in the form of a 100% stock dividend that was distributed on February 17, 2017 to shareholders of record as of February 8, 2017. The stock split was in the form of one additional share for every share held and was payable in shares of Class A common stock for both the existing Class A common stock and Class B common stock. All share-based data, including the number of shares outstanding and per share amounts, have been adjusted to reflect the stock split for all periods presented.
Reclassifications
Reclassifications have been made to our consolidated financial statements for the prior periods to conform to classifications used in
2017
.
|
Comcast 2017 Annual Report on Form 10-K
|
67
|
|
Comcast Corporation
|
Note 2: Accounting Policies
|
Our consolidated financial statements are prepared in accordance with GAAP, which require us to select accounting policies, including in certain cases industry-specific policies, and make estimates that affect the reported amount of assets, liabilities, revenue and expenses, and the related disclosure of contingent assets and contingent liabilities. Actual results could differ from these estimates. We believe that the judgments and related estimates for the following items are critical in the preparation of our consolidated financial statements:
|
•
|
valuation and impairment testing of cable franchise rights (see Note 9)
|
|
•
|
film and television costs (see Note 6)
|
In addition, the following accounting policies are specific to the industries in which we operate:
|
•
|
capitalization and amortization of film and television costs (see Note 6)
|
|
•
|
installation revenue and costs for connecting customers to our cable systems (see revenue recognition below and Note 8)
|
Information on other accounting policies and methods that we use in the preparation of our consolidated financial statements are included, where applicable, in their respective footnotes that follow. Below is a discussion of accounting policies and methods used in our consolidated financial statements that are not presented within other footnotes.
Revenue Recognition
Cable Communications Segment
Our Cable Communications segment generates revenue primarily from residential and business customers that subscribe to our video, high-speed Internet, voice, and security and automation services (“cable services”), and from the sale of advertising. We recognize revenue from cable services as each service is provided. Customers are typically billed in advance on a monthly basis based on the services and features they receive and the type of equipment they use. Since installation revenue obtained from the connection of customers to our cable systems is less than the related direct selling costs, we recognize revenue as connections are completed. We manage credit risk by screening applicants through the use of internal customer information, identification verification tools and credit bureau data. If a customer’s account is delinquent, various measures are used to collect outstanding amounts, including termination of the customer’s cable services.
As part of our distribution agreements with cable networks, we generally receive an allocation of scheduled advertising time on cable networks that we sell through our advertising business to local, regional and national advertisers. We recognize advertising revenue when the advertising is aired or viewed. In most cases, the available advertising units are sold by our sales force. In some cases, we work with representation firms as an extension of our sales force to sell a portion of the advertising units allocated to us. We also represent the advertising sales efforts of other multichannel video providers in some markets. Since we are acting as the principal in these arrangements, we record the advertising that is sold in revenue and the fees paid to representation firms and multichannel video providers in other operating and administrative expenses.
Under the terms of our cable franchise agreements, we are generally required to pay to the cable franchising authority an amount based on our gross video revenue. We pass these fees through to our cable services customers and classify the fees as a component of revenue with the corresponding costs included in other operating and administrative expenses.
Cable Networks and Broadcast Television Segments
Our Cable Networks segment generates revenue primarily from the distribution of our cable network programming to traditional and virtual multichannel video providers; from the sale of advertising on our cable networks and digital properties; from the licensing of our owned programming, including programming from our cable television studio production operations, to cable and broadcast networks and subscription video on demand services; and from the sale of our owned programming on standard-definition digital video discs and Blu-ray discs (together, “DVDs”) and through digital distribution services such as iTunes. Our Broadcast Television segment generates revenue primarily from the sale of advertising on our broadcast networks, owned local broadcast television stations and digital properties; from the licensing of our owned programming by our broadcast television studio production operations to various distribution platforms, including to cable and broadcast networks as well as to subscription video on demand services; from the fees received under retransmission consent agreements and associated fees received from NBC-affiliated local broadcast television stations; and from the sale of our owned programming on DVDs and through digital distribution services.
We recognize revenue from distributors as programming is provided, generally under multiyear distribution agreements. From time to time, the distribution agreements expire while programming continues to be provided to the distributor based on interim arrangements while the parties negotiate new contract terms. Revenue recognition is generally limited to current payments being
|
68
|
Comcast 2017 Annual Report on Form 10-K
|
|
Comcast Corporation
made by the distributor, typically under the prior contract terms, until a new contract is negotiated, sometimes with effective dates that affect prior periods. Differences between actual amounts determined upon resolution of negotiations and amounts recorded during these interim arrangements are recorded in the period of resolution. Advertising revenue for our Cable Networks and Broadcast Television segments is recognized in the period in which the advertising is aired or viewed. In some instances, we guarantee audience ratings for the advertising. To the extent there is a shortfall in the ratings that were guaranteed, a portion of the revenue is deferred until the shortfall is settled, primarily by providing additional advertising units. We recognize revenue from the licensing of our owned programming, including programming produced by our studios for third parties, when the content is made available for use by the licensee and when certain other conditions are met. When license fees include advertising time, we recognize the component of revenue associated with the advertisements when they are aired or viewed.
Filmed Entertainment Segment
Our Filmed Entertainment segment generates revenue primarily from the worldwide distribution of our produced and acquired films for exhibition in movie theaters, from the licensing of produced and acquired films through various distribution platforms, and from the sale of produced and acquired films on DVDs and through digital distribution services. Our Filmed Entertainment segment also generates revenue from Fandango, our movie ticketing and entertainment business, the sale of consumer products, the production and licensing of live stage plays, and the distribution of filmed entertainment produced by third parties. We recognize revenue from the distribution of films to movie theaters when the films are exhibited. We recognize revenue from the licensing of a film when the film is made available for use by the licensee, and when certain other conditions are met. We recognize revenue from the sale of DVDs, net of estimated returns and customer incentives, on the date that the DVDs are delivered to and made available for sale by retailers.
Theme Parks Segment
Our Theme Parks segment generates revenue primarily from ticket sales and guest spending at our Universal theme parks. We recognize revenue from advance theme park ticket sales when the tickets are used. For annual passes, we recognize revenue on a straight-line basis over the period following the activation date.
Cable Communications Programming Expenses
Cable Communications programming expenses are the fees we pay to license the programming we distribute to our video customers. Programming is generally acquired under multiyear distribution agreements, with rates typically based on the number of customers that receive the programming, channel positioning and the extent of distribution. From time to time, these contracts expire and programming continues to be provided under interim arrangements while the parties negotiate new contract terms, sometimes with effective dates that affect prior periods. While payments are typically made under the prior contract’s terms, the amount of programming expenses recorded during the interim arrangement is based on our estimate of the ultimate contract terms expected to be negotiated. Differences between actual amounts determined upon resolution of negotiations and amounts recorded during these interim arrangements are recorded in the period of resolution.
When our Cable Communications segment receives incentives from a cable network for the licensing of its programming, we defer a portion of these incentives, which are included in other current and noncurrent liabilities, and recognize them over the term of the contract as a reduction to programming expenses.
Advertising Expenses
Advertising costs are expensed as incurred.
Cash Equivalents
The carrying amounts of our cash equivalents approximate their fair values. Our cash equivalents consist primarily of money market funds and U.S. government obligations, as well as commercial paper and certificates of deposit with maturities of three months or less when purchased.
Derivative Financial Instruments
We use derivative financial instruments to manage our exposure to the risks associated with fluctuations in interest rates, foreign exchange rates and equity prices. Our objective is to manage the financial and operational exposure arising from these risks by offsetting gains and losses on the underlying exposures with gains and losses on the derivatives used to economically hedge them.
Our derivative financial instruments are recorded in our consolidated balance sheet at fair value. The impact of our derivative financial instruments on our consolidated financial statements was not material in any of the periods presented.
|
Comcast 2017 Annual Report on Form 10-K
|
69
|
|
Comcast Corporation
Fair Value Measurements
The accounting guidance related to fair value measurements establishes a hierarchy based on the types of inputs used for the various valuation techniques (market approach, income approach and cost approach). The levels of the hierarchy are described below.
|
•
|
Level 1: Values are determined using quoted market prices for identical financial instruments in an active market
|
|
•
|
Level 2: Values are determined using quoted prices for similar financial instruments and valuation models whose inputs are observable
|
|
•
|
Level 3: Values are determined using pricing models that use significant inputs that are primarily unobservable, discounted cash flow methodologies or similar techniques, as well as instruments for which the determination of fair value requires significant management judgment or estimation
|
We use these levels of hierarchy to measure the fair value of certain financial instruments on a recurring basis, such as for investments; on a non-recurring basis, such as for acquisitions and impairment testing; for disclosure purposes, such as for long-term debt and redeemable subsidiary preferred stock; and for other applications, as discussed in their respective footnotes. Our assessment of the significance of a particular input to the fair value measurement requires judgment and may affect the valuation and classification within the fair value hierarchy.
Asset Retirement Obligations
Certain of our cable franchise agreements and lease agreements contain provisions requiring us to restore facilities or remove property in the event that the franchise or lease agreement is not renewed. We expect to continually renew our cable franchise agreements and therefore cannot reasonably estimate any liabilities associated with such agreements. A remote possibility exists that franchise agreements could be terminated unexpectedly, which could result in us incurring significant expense in complying with restoration or removal provisions. We do not have any material liabilities related to asset retirements recorded in our consolidated financial statements.
|
Note 3: Recent Accounting Pronouncements
|
Revenue Recognition
In May 2014, the Financial Accounting Standards Board (“FASB”) updated the accounting guidance related to revenue recognition. The updated accounting guidance provides a single, contract-based revenue recognition model to help improve financial reporting by providing clearer guidance on when an entity should recognize revenue and by reducing the number of standards to which an entity has to refer. The updated guidance also requires additional disclosures regarding the nature, timing and uncertainty of our revenue transactions. We will adopt the updated accounting guidance in the first quarter of 2018 using the full retrospective method, which requires the adjustment of all prior periods presented to reflect the impacts of the updated guidance.
The adoption of the new standard will not have a material impact to our consolidated financial position or results of operations. A summary of the changes that will be implemented in 2018 in connection with the new standard are presented below.
Changes to Presentation of Revenue and Related Costs with No Impact to the Timing of Recognition
|
•
|
Revenue from our residential video services in our Cable Communications segment will decrease with corresponding increases to high-speed Internet and voice revenue due to a change in the allocation of revenue among our cable services included in a bundle that our residential customers purchase at a discount.
|
|
•
|
Revenue from franchise and other regulatory fees, which was previously presented in other revenue, will be presented with the corresponding cable services in our Cable Communications segment. This will result in increases to video, voice and business services revenue.
|
|
•
|
Customer late fees in our Cable Communications segment will now be presented in other and in business services revenue. These fees were previously presented as a reduction to other operating and administrative expenses.
|
|
•
|
Certain costs, including costs related to the fulfillment of contracts with customers, in our Cable Communications segment will be presented as other assets and the related costs will be recognized over time in operating costs and expenses, which are comprised of total costs and expenses, excluding depreciation and amortization expense and other operating gains. These amounts were previously presented as intangible assets, and the expenses were previously presented in amortization expense. The payments related to these assets will be presented in net cash provided by operating activities rather than in cash paid for intangible assets in our consolidated statement of cash flows.
|
|
70
|
Comcast 2017 Annual Report on Form 10-K
|
|
Comcast Corporation
The table below presents the expected effects upon adoption these changes in presentation would have had on our Cable Communications segment revenue, operating costs and expenses and depreciation and amortization expense in 2017 and 2016.
|
Year ended December 31 (in millions)
|
2017
|
2016
|
||||||||||||||||
|
As Reported
|
|
Effects of
Adoption
(a)
|
|
Upon
Adoption
(a)
|
|
As Reported
|
|
Effects of
Adoption
(a)
|
|
Upon
Adoption
(a)
|
|
|||||||
|
Cable Communications segment
|
||||||||||||||||||
|
Revenue
|
$
|
52,519
|
|
$
|
482
|
|
$
|
53,001
|
|
$
|
50,048
|
|
$
|
471
|
|
$
|
50,519
|
|
|
Operating costs and expenses
|
$
|
31,349
|
|
$
|
619
|
|
$
|
31,968
|
|
$
|
29,939
|
|
$
|
602
|
|
$
|
30,541
|
|
|
Depreciation and amortization expense
|
$
|
8,143
|
|
$
|
(137
|
)
|
$
|
8,006
|
|
$
|
7,670
|
|
$
|
(131
|
)
|
$
|
7,539
|
|
(a) Certain other immaterial changes in presentation and the impacts due to changes in timing of revenue recognition and related costs described below were excluded from the table. The final effects of the adoption will differ from the amounts presented above.
Changes to the Timing of Recognition of Revenue and Related Costs
|
•
|
Installation revenue and commission expenses in our Cable Communications segment will be recognized as revenue and costs, respectively, over a period of time. These amounts were previously recognized immediately.
|
|
•
|
Content licensing revenue associated with renewals or extensions of existing program licensing agreements in our Cable Networks, Broadcast Television and Filmed Entertainment segments will be recognized as revenue when the licensed content becomes available under the renewal or extension. These renewals or extensions were previously recognized as revenue when the agreement was executed.
|
Financial Assets and Financial Liabilities
In January 2016, the FASB updated the accounting guidance related to the recognition and measurement of financial assets and financial liabilities. The updated accounting guidance, among other things, requires that all nonconsolidated equity investments, except those accounted for under the equity method, be measured at fair value and that the changes in fair value be recognized in net income. The updated guidance is effective for us as of January 1, 2018. With certain exceptions, the updated accounting guidance requires a cumulative effect adjustment to beginning retained earnings in the year the guidance is adopted.
If we had adopted the provisions of the updated guidance as of January 1, 2017 for our equity investments classified as available-for-sale securities, primarily our investment in Snap Inc. (see Note 7), net income attributable to Comcast Corporation would have decreased by
$44 million
in 2017. If we had adopted the provisions of the updated guidance as of January 1, 2017 for our equity investments classified as cost method investments, the impact on our net income attributable to Comcast Corporation would not have been material.
Leases
In February 2016, the FASB updated the accounting guidance related to leases. The updated accounting guidance requires lessees to recognize a right-of-use asset and a lease liability on the balance sheet for all leases with the exception of short-term leases. The asset and liability are initially measured based on the present value of committed lease payments. For a lessee, the recognition, measurement and presentation of expenses and cash flows arising from a lease do not significantly change from previous guidance. For a lessor, the accounting applied is also largely unchanged from previous guidance. The updated guidance is effective for us as of January 1, 2019 and early adoption is permitted. The updated accounting guidance must be adopted using a modified retrospective approach for leases that exist or are entered into after the beginning of the earliest comparative period in the financial statements. We are currently in the process of determining the impact that the updated accounting guidance will have on our consolidated financial statements.
See Note 16 for a summary of our undiscounted minimum rental commitments under operating leases as of December 31, 2017.
Share-Based Compensation
In March 2016, the FASB updated the accounting guidance that affects several aspects of the accounting for share-based compensation. The most significant change for us relates to the presentation of the income and withholding tax consequences of share-based compensation in our consolidated financial statements. Among the changes, the updated guidance requires that the excess income tax benefits or deficiencies that arise when the tax consequences of share-based compensation differ from amounts previously recognized in the statement of income be recognized as income tax benefit or expense in the statement of income rather than as additional paid-in capital in the balance sheet. The guidance also states that excess income tax benefits should not be presented separately from other income taxes in the statement of cash flows and, thus, should be classified as an operating activity rather than a financing activity as they were under the prior guidance. In addition, the updated guidance requires that, when an employer withholds shares upon exercise of options or the vesting of restricted stock for the purpose of meeting withholding tax
|
Comcast 2017 Annual Report on Form 10-K
|
71
|
|
Comcast Corporation
requirements, the cash paid for withholding taxes be classified as a financing activity. We include these amounts in the caption
“repurchases of common stock under repurchase program and employee plans” in our consolidated statement of cash flows. We previously recorded these amounts as operating activities.
We adopted the updated guidance as of January 1, 2017 and as required, we prospectively adopted the provisions that relate to the recognition of the excess income tax benefits or deficiencies in our consolidated statement of income. The excess tax benefits resulted in an increase to income tax benefit in 2017 of
$297 million
and our diluted earnings per common share attributable to Comcast Corporation shareholders in 2017 increased by
$0.04
. As required by the updated guidance, the prior year periods in our consolidated statement of income were not adjusted as a result of these provisions.
In addition, we retrospectively adopted the provisions of this guidance related to changes to the statement of cash flows for all periods presented. This resulted in increases to net cash provided by operating activities and decreases to net cash provided by (used in) financing activities of
$732 million
,
$585 million
and
$707 million
in 2017, 2016 and 2015, respectively.
|
|
|
Computation of Diluted EPS
|
||||||||||||||||||||||||
|
|
2017
|
2016
|
2015
|
|||||||||||||||||||||
|
Year ended December 31
(in millions, except per share data) |
Net Income
Attributable to Comcast Corporation |
|
Shares
|
|
Per Share
Amount |
|
Net Income
Attributable to Comcast Corporation |
|
Shares
|
|
Per Share
Amount |
|
Net Income
Attributable to Comcast Corporation |
|
Shares
|
|
Per Share
Amount |
|
||||||
|
Basic EPS attributable to
Comcast Corporation
shareholders
|
$
|
22,714
|
|
4,708
|
|
$
|
4.82
|
|
$
|
8,695
|
|
4,819
|
|
$
|
1.80
|
|
$
|
8,163
|
|
4,972
|
|
$
|
1.64
|
|
|
Effect of dilutive securities:
|
||||||||||||||||||||||||
|
Assumed exercise or issuance
of shares relating to stock
plans
|
|
78
|
|
|
|
56
|
|
|
|
63
|
|
|
||||||||||||
|
Diluted EPS attributable to
Comcast Corporation
shareholders
|
$
|
22,714
|
|
4,786
|
|
$
|
4.75
|
|
$
|
8,695
|
|
4,875
|
|
$
|
1.78
|
|
$
|
8,163
|
|
5,035
|
|
$
|
1.62
|
|
Diluted earnings per common share attributable to Comcast Corporation shareholders (“diluted EPS”) considers the impact of potentially dilutive securities using the treasury stock method. Our potentially dilutive securities include potential common shares related to our stock options and our restricted share units (“RSUs”). Diluted EPS excludes the impact of potential common shares related to our stock options in periods in which the combination of the option exercise price and the associated unrecognized compensation expense is greater than the average market price of our common stock. The amount of potential common shares related to our share-based compensation plans that were excluded from diluted EPS because their effect would have been antidilutive was not material in any of the periods presented.
|
|
2017
FCC Spectrum Auction
On April 13, 2017, the Federal Communications Commission announced the results of its spectrum auction. In the auction, NBCUniversal relinquished its spectrum rights in the New York, Philadelphia and Chicago designated market areas (“DMAs”) where NBC and Telemundo had overlapping spectrum. NBCUniversal received proceeds of
$482 million
in July 2017, which were recorded in other investing activities in our consolidated statement of cash flows. NBCUniversal recognized a pretax gain of
$337 million
in other operating gains in 2017. NBC and Telemundo stations will share broadcast signals in these DMAs. In connection with the auction, we also acquired the rights to
$1.7 billion
of spectrum in the second quarter of 2017, which were recorded to other intangible assets, net. We had previously made a deposit of
$1.8 billion
to participate in the auction in 2016 and received a refund for amounts in excess of the purchase price in 2017.
Universal Studios Japan
On April 6, 2017, we acquired the remaining interests in Universal Studios Japan that we did not already own for
$2.3 billion
. The acquisition was funded through cash on hand and borrowings under our commercial paper program. Because we maintained control
|
72
|
Comcast 2017 Annual Report on Form 10-K
|
|
Comcast Corporation
of Universal Studios Japan, the difference between the consideration transferred and the recorded value of the noncontrolling interests, as well as the related tax and accumulated other comprehensive income impacts, were recorded to additional paid-in capital.
2016
DreamWorks Animation
On August 22, 2016, we acquired all of the outstanding stock of DreamWorks Animation for $
3.8 billion
. DreamWorks Animation’s stockholders received $
41
in cash for each share of DreamWorks Animation common stock. DreamWorks Animation creates animated feature films, television series and specials, live entertainment, and related consumer products. The results of operations for DreamWorks Animation are reported in our Filmed Entertainment segment following the acquisition date.
Allocation of Purchase Price
The transaction was accounted for under the acquisition method of accounting and, accordingly, the assets and liabilities are to be recorded at their fair market values as of the acquisition date. We recorded the acquired assets and liabilities of DreamWorks Animation at their estimated fair values based on valuation analyses. In valuing acquired assets and liabilities, fair value estimates were primarily based on Level 3 inputs, including future expected cash flows, market rate assumptions and discount rates. The fair value of the assumed debt was primarily based on quoted market values. The fair value of the liability related to a tax receivable agreement that DreamWorks Animation had previously entered into with one of its former stockholders (the “tax receivable agreement”) was based on the contractual settlement provisions in the agreement. Further, we recorded deferred income taxes based on the tax basis of the acquired net assets and the valuation allowances based on the expected use of net operating loss carryforwards. The goodwill is not deductible for tax purposes. In 2017, we updated the allocation of purchase price for DreamWorks Animation based on final valuation analyses, which primarily resulted in increases to noncontrolling interests, intangible assets and goodwill, and decreases to working capital and deferred income tax assets. The changes did not have a material impact on our consolidated financial statements.
The table below presents the allocation of the purchase price to the assets and liabilities of DreamWorks Animation.
|
Allocation of Purchase Price
|
|||
|
(in millions)
|
|||
|
Film and television costs
|
$
|
838
|
|
|
Intangible assets
|
396
|
|
|
|
Working capital
|
156
|
|
|
|
Debt
|
(381
|
)
|
|
|
Tax receivable agreement
|
(146
|
)
|
|
|
Deferred income taxes
|
291
|
|
|
|
Other noncurrent assets (liabilities)
|
170
|
|
|
|
Identifiable net assets (liabilities) acquired
|
1,324
|
|
|
|
Noncontrolling interests
|
(337
|
)
|
|
|
Goodwill (see Note 9)
|
2,786
|
|
|
|
Cash consideration transferred
|
$
|
3,773
|
|
The tax receivable agreement was settled immediately following the acquisition and the payment was recorded as an operating activity in our consolidated statement of cash flows in 2016. We also repaid all of the assumed debt of DreamWorks Animation in 2016.
Revenue and net income attributable to the acquisition of DreamWorks Animation were not material for 2017 or 2016.
2015
Universal Studios Japan
On November 13, 2015, NBCUniversal acquired a
51%
economic interest in Universal Studios Japan for
$1.5 billion
. Universal Studios Japan is a consolidated subsidiary of NBCUniversal, and its operations are reported in our Theme Parks segment. The acquisition was funded through cash on hand and borrowings under our commercial paper program. In our allocation of purchase price for this acquisition, we recorded goodwill of
$5.1 billion
, long-term debt of
$3.3 billion
and noncontrolling interests of
$1.4 billion
.
|
Comcast 2017 Annual Report on Form 10-K
|
73
|
|
Comcast Corporation
Time Warner Cable Merger and Related Divestiture Transactions
On April 24, 2015, we and Time Warner Cable Inc. terminated our planned merger, and we terminated our related agreement with Charter Communications, Inc. to spin off, exchange and sell certain cable systems. In connection with these proposed transactions, we incurred incremental transaction-related expenses of
$198 million
in 2015, which was primarily in other operating and administrative expenses.
|
Note 6: Film and Television Costs
|
|
December 31 (in millions)
|
2017
|
|
2016
|
|
||
|
Film Costs:
|
||||||
|
Released, less amortization
|
$
|
1,724
|
|
$
|
1,750
|
|
|
Completed, not released
|
50
|
|
50
|
|
||
|
In production and in development
|
1,149
|
|
1,310
|
|
||
|
2,923
|
|
3,110
|
|
|||
|
Television Costs:
|
||||||
|
Released, less amortization
|
2,259
|
|
1,953
|
|
||
|
In production and in development
|
818
|
|
853
|
|
||
|
3,077
|
|
2,806
|
|
|||
|
Programming rights, less amortization
|
2,689
|
|
2,586
|
|
||
|
8,689
|
|
8,502
|
|
|||
|
Less: Current portion of programming rights
|
1,613
|
|
1,250
|
|
||
|
Film and television costs
|
$
|
7,076
|
|
$
|
7,252
|
|
Based on our current estimates of the total remaining revenue from all sources (“ultimate revenue”), in
2018
we expect to amortize approximately
$1.7 billion
of film and television costs associated with our original film and television productions that have been released, or are completed and have not been released. Through 2020, we expect to amortize approximately
86%
of unamortized film and television costs for our released productions, excluding amounts allocated to acquired libraries.
As of
December 31, 2017
, acquired film and television libraries, which are included within the “released, less amortization” captions in the table above, had remaining unamortized costs of
$475 million
. These costs are generally amortized over a period not to exceed
20
years, and approximately
44%
of these costs are expected to be amortized through 2020.
Capitalization of Film and Television Costs
We capitalize film and television production costs, including direct costs, production overhead, print costs, development costs and interest. We amortize capitalized film and television production costs, including acquired libraries, and accrue costs associated with participation and residual payments to programming and production expenses. We generally record the amortization and the accrued costs using the individual film forecast computation method, which amortizes the costs in the same ratio as the associated ultimate revenue. Estimates of ultimate revenue and total costs are based on anticipated release patterns, public acceptance and historical results for similar productions. Unamortized film and television production costs, including acquired libraries, are stated at the lower of unamortized cost or fair value. We do not capitalize costs related to the distribution of a film in movie theaters or the licensing or sale of a film or television production, which primarily include costs associated with marketing and distribution.
In determining the method of amortization and estimated life of an acquired film or television library, we generally use the method and the life that most closely follow the undiscounted cash flows over the estimated life of the asset.
When an event or a change in circumstance occurs that was known or knowable as of the balance sheet date and that indicates the fair value of a film is less than its unamortized costs, we determine the fair value of the film and record an impairment charge for the amount by which the unamortized capitalized costs exceed the film’s fair value. The estimated fair value of a production is based on Level 3 inputs that primarily use an analysis of future expected cash flows.
Adjustments to capitalized film production costs were not material in any of the periods presented.
We may enter into cofinancing arrangements with third parties to jointly finance or distribute certain of our film productions. Cofinancing arrangements can take various forms, but in most cases involve the grant of an economic interest in a film to an investor. The number of investors and the terms of these arrangements can vary, although investors generally assume the full risks and rewards for the portion of the film acquired in these arrangements. We account for the proceeds received from a third-party investor under these arrangements as a reduction to our capitalized film costs. Under these arrangements, the investor owns an undivided copyright interest in the film, and therefore in each period we record either a charge or a benefit to programming and production expenses to reflect the estimate of the third-party investor’s interest in the profit or loss of the film. The estimate of the
|
74
|
Comcast 2017 Annual Report on Form 10-K
|
|
Comcast Corporation
third-party investor’s interest in the profit or loss of a film is determined using the ratio of actual revenue earned to date to the ultimate revenue expected to be recognized over the film’s useful life.
We capitalize the costs of programming content that we license but do not own, including rights to multiyear, live-event sports programming, at the earlier of when payments are made for the programming or when the license period begins and the content is made available for use. We amortize capitalized programming costs as the associated programs are broadcast. We generally amortize multiyear, live-event sports programming rights using the ratio of the current period revenue to the estimated ultimate revenue or under the terms of the contract.
Programming costs are recorded at the lower of unamortized cost or net realizable value on a program by program, package, channel or daypart basis. A daypart is an aggregation of programs broadcast during a particular time of day or programs of a similar type. Programming acquired by our Cable Networks segment is primarily tested on a channel basis for impairment, whereas programming acquired by our Broadcast Television segment is tested on a daypart basis. If we determine that the estimates of future cash flows are insufficient or if there is no plan to broadcast certain programming, we recognize an impairment charge to programming and production expenses.
|
Note 7: Investments
|
|
December 31 (in millions)
|
2017
|
|
2016
|
|
|||
|
Fair Value Method:
|
|||||||
|
Snap
|
$
|
430
|
|
$
|
—
|
|
|
|
Other
|
167
|
|
198
|
|
|||
|
597
|
|
198
|
|
||||
|
Equity Method:
|
|||||||
|
Atairos
|
2,388
|
|
1,601
|
|
|||
|
Hulu
|
249
|
|
225
|
|
|||
|
Other
|
909
|
|
550
|
|
|||
|
3,546
|
|
2,376
|
|
||||
|
Cost Method:
|
|
||||||
|
AirTouch
|
1,614
|
|
1,599
|
|
|||
|
BuzzFeed
|
400
|
|
400
|
|
|||
|
Other
|
793
|
|
771
|
|
|||
|
2,807
|
|
2,770
|
|
||||
|
Total investments
|
6,950
|
|
5,344
|
|
|||
|
Less: Current investments
|
19
|
|
97
|
|
|||
|
Noncurrent investments
|
$
|
6,931
|
|
$
|
5,247
|
|
|
|
Investment Income (Loss), Net
|
|||||||||||
|
Year ended December 31 (in millions)
|
2017
|
|
2016
|
|
2015
|
|
|||||
|
Gains (losses) on sales of investments, net
|
$
|
12
|
|
$
|
46
|
|
$
|
12
|
|
||
|
Investment impairment losses
|
(29
|
)
|
(34
|
)
|
(59
|
)
|
|||||
|
Interest and dividend income
|
136
|
|
123
|
|
115
|
|
|||||
|
Other, net
|
134
|
|
78
|
|
13
|
|
|||||
|
Investment income (loss), net
|
$
|
253
|
|
$
|
213
|
|
$
|
81
|
|
||
Fair Value Method
We classify publicly traded investments that are not accounted for under the equity method as available-for-sale (“AFS”) or trading securities. The estimated fair value of our publicly traded investments was primarily based on Level 1 inputs that use quoted market values. For other fair value method investments, the estimated fair value was based on Level 2 inputs that use pricing models whose inputs are derived primarily from or corroborated by observable market data through correlation or other means. For AFS securities, we record unrealized gains or losses resulting from changes in fair value between measurement dates as a component of other comprehensive income (loss), except when we consider declines in value to be other than temporary. For trading securities, we record unrealized gains or losses resulting from changes in fair value between measurement dates as a component of investment income (loss), net. We recognize realized gains and losses associated with our fair value method investments using the specific identification method. We classify the cash flows related to purchases of and proceeds from the sale of trading securities based on the nature of the securities and the purpose for which they were acquired.
|
Comcast 2017 Annual Report on Form 10-K
|
75
|
|
Comcast Corporation
Snap
In March 2017, we acquired an interest in Snap Inc. for
$500 million
as part of its initial public offering, which we have classified as an available-for-sale security. Snap is a camera company whose primary product is Snapchat, a camera app that was created to help people communicate through short videos and images.
Equity Method
We use the equity method to account for investments in which we have the ability to exercise significant influence over the investee’s operating and financial policies or in which we hold a significant partnership or limited liability company interest. Equity method investments are recorded at cost and are adjusted to recognize (1) our proportionate share of the investee’s net income or loss after the date of investment, (2) amortization of the recorded investment that exceeds our share of the book value of the investee’s net assets, (3) additional contributions made and dividends received, and (4) impairments resulting from other-than-temporary declines in fair value. For some investments, we record our share of the investee’s net income or loss one quarter in arrears due to the timing of our receipt of such information. Gains or losses on the sale of equity method investments are recorded to other income (expense), net. If an equity method investee were to issue additional securities that would change our proportionate share of the entity, we would recognize the change, if any, as a gain or loss to other income (expense), net.
Atairos
On January 1, 2016, we established Atairos Group, Inc., a strategic company focused on investing in and operating companies in a range of industries and business sectors, both domestically and internationally. Atairos has a term of up to
12
years and is controlled by management companies led by our former CFO through interests that carry all of the voting rights. We are the only investor other than our former CFO and the other management company employees. We have committed to fund Atairos up to
$4 billion
in the aggregate at any one time, subject to certain offsets, and
$40 million
annually for a management fee, subject to certain adjustments. The management company investors have committed to fund up to
$100 million
, with at least
$40 million
to be funded by our former CFO, subject to his continued role with Atairos. Our economic interests do not carry voting rights and obligate us to absorb approximately
99%
of any losses and they provide us the right to receive approximately
86.5%
of any residual returns in Atairos, in either case on a cumulative basis.
We have concluded that Atairos is a VIE, that we do not have the power to direct the activities that most significantly impact the economic performance of Atairos as we have no voting rights and only certain consent rights, and that we are not a related party with our former CFO or the management companies. We therefore do not consolidate Atairos and account for our investment as an equity method investment. There are no other liquidity arrangements, guarantees or other financial commitments between Comcast and Atairos, and therefore our maximum risk of financial loss is our investment balance and remaining unfunded capital commitment.
In
2017
and 2016, we made cash capital contributions totaling
$994 million
and
$1.2 billion
, respectively, to Atairos. Atairos follows investment company accounting and records its investments at their fair values each reporting period with the net gains or losses reflected in its statement of operations. We recognize our share of these gains and losses in equity in net income (losses) of investees, net. In
2017
and
2016
, we recognized our share of Atairos income of
$281 million
and Atairos losses of
$38 million
, respectively.
In July 2017, we sold a business to a company owned by Atairos and received as consideration an investment in that company, which we account for as an equity method investment. In connection with the sale of the business, we recognized a pretax gain of
$105 million
in other operating gains in 2017.
Hulu
In 2017, 2016 and 2015, we made cash capital contributions totaling
$300 million
,
$50 million
and
$123 million
, respectively, to Hulu. In 2017, 2016 and 2015, we recognized our proportionate share of Hulu’s losses of
$276 million
,
$168 million
and
$106 million
, respectively.
In August 2016, Time Warner Inc. acquired a
10%
interest in Hulu, LLC, which diluted our interest in Hulu from
33%
to
30%
.
For a period not to exceed
3 years
, Time Warner may put its shares to Hulu or Hulu may call Time Warner’s shares under certain limited circumstances arising from regulatory review. Given the contingent nature of the put and call options, we recorded a deferred gain of
$159 million
and a corresponding increase to our investment in Hulu as a result of the dilution. The deferred gain will be recognized in other income (expense), net if and when the options expire unexercised.
The Weather Channel
In January 2016, following a legal restructuring at The Weather Channel, we and the other investors sold the entity holding The Weather Channel’s product and technology businesses to IBM. Following the close of the transaction, we continue to hold an
|
76
|
Comcast 2017 Annual Report on Form 10-K
|
|
Comcast Corporation
investment in The Weather Channel cable network through a new holding company. As a result of the sale of our investment, we recognized a pretax gain of
$108 million
in other income (expense), net.
In June and December 2015, The Weather Channel recorded impairment charges related to goodwill. In 2015, we recorded expenses of
$333 million
that represented NBCUniversal’s proportionate share of these impairment charges in equity in net income (losses) of investees, net.
Cost Method
We use the cost method to account for investments not accounted for under the fair value method or the equity method.
AirTouch
We hold
two
series of preferred stock of Verizon Americas, Inc., formerly known as AirTouch Communications, Inc., a subsidiary of Verizon Communications Inc., which are redeemable in April 2020. As of both
December 31, 2017
and
2016
, the estimated fair value of the AirTouch preferred stock was
$1.7 billion
.
The dividend and redemption activity of the AirTouch preferred stock determines the dividend and redemption payments associated with substantially all of the preferred shares issued by one of our consolidated subsidiaries, which is a VIE. The subsidiary has
three
series of preferred stock outstanding with an aggregate redemption value of
$1.75 billion
. Substantially all of the AirTouch preferred stock is redeemable in April 2020 at a redemption value of
$1.65 billion
. As of both
December 31, 2017
and
2016
, the two series of redeemable subsidiary preferred shares were recorded at
$1.6 billion
, and those amounts are included in other noncurrent liabilities. As of both
December 31, 2017
and
2016
, the liability related to the redeemable subsidiary preferred shares had an aggregate estimated fair value of
$1.7 billion
. The estimated fair values of the AirTouch preferred stock and redeemable subsidiary preferred shares are based on Level 2 inputs that use pricing models whose inputs are derived primarily from or corroborated by observable market data through correlation or other means for substantially the full term of the financial instrument. The one series of nonredeemable subsidiary preferred shares was recorded at
$100 million
as of both
December 31, 2017
and
2016
, and those amounts are included in noncontrolling interests in our consolidated balance sheet. The carrying amount of the nonredeemable subsidiary preferred shares approximates its fair value.
BuzzFeed and Vox Media
In September 2015,
NBCUniversal
acquired an interest in BuzzFeed, Inc. and made an additional investment in Vox Media, Inc. for
$200 million
each in cash. In November 2016, NBCUniversal made an additional investment of
$200 million
in Buzzfeed.
Impairment Testing of Investments
We review our investment portfolio each reporting period to determine whether there are identified events or circumstances that would indicate there is a decline in the fair value that would be considered other than temporary. For our nonpublic investments, if there are no identified events or circumstances that would have a significant adverse effect on the fair value of the investment, then the fair value is not estimated. If an investment is deemed to have experienced an other-than-temporary decline below its cost basis, we reduce the carrying amount of the investment to its quoted or estimated fair value, as applicable, and establish a new cost basis for the investment. For our
AFS
securities and our cost method investments, we record the impairment to investment income (loss), net. For our equity method investments, we record the impairment to other income (expense), net.
|
Note 8: Property and Equipment
|
|
December 31 (in millions)
|
Weighted-Average
Original Useful Life as of December 31, 2017 |
2017
|
|
2016
|
|
||||
|
Cable distribution system
|
11 years
|
$
|
36,046
|
|
$
|
34,028
|
|
||
|
Customer premise equipment
|
6 years
|
26,392
|
|
28,621
|
|
||||
|
Other equipment
|
9 years
|
10,518
|
|
9,471
|
|
||||
|
Buildings and leasehold improvements
|
30 years
|
12,346
|
|
10,653
|
|
||||
|
Construction in process
|
N/A
|
1,752
|
|
1,901
|
|
||||
|
Land
|
N/A
|
1,332
|
|
1,273
|
|
||||
|
Property and equipment, at cost
|
88,386
|
|
85,947
|
|
|||||
|
Less: Accumulated depreciation
|
|
49,916
|
|
49,694
|
|
||||
|
Property and equipment, net
|
|
$
|
38,470
|
|
$
|
36,253
|
|
||
Property and equipment are stated at cost. We capitalize improvements that extend asset lives and expense repairs and maintenance costs as incurred. We record depreciation using the straight-line method over the asset’s estimated useful life. For assets that are
|
Comcast 2017 Annual Report on Form 10-K
|
77
|
|
Comcast Corporation
sold or retired, we remove the applicable cost and accumulated depreciation and, unless the gain or loss on disposition is presented separately, we recognize it as a component of depreciation expense.
In accordance with the accounting guidance related to cable television companies, we capitalize the costs associated with the construction of and improvements to our cable transmission and distribution facilities, including scalable infrastructure and line extensions; costs associated with acquiring and deploying new customer premise equipment; and costs associated with installation of our services. Costs capitalized include all direct costs for labor and materials, as well as various indirect costs. Costs incurred in connection with subsequent disconnects and reconnects are expensed as they are incurred.
We evaluate the recoverability of our property and equipment whenever events or substantive changes in circumstances indicate that the carrying amount may not be recoverable. The evaluation is based on the cash flows generated by the underlying asset groups, including estimated future operating results, trends or other determinants of fair value. If the total of the expected future undiscounted cash flows were less than the carrying amount of the asset group, we would recognize an impairment charge to the extent the carrying amount of the asset group exceeded its estimated fair value. Unless presented separately, the impairment charge is included as a component of depreciation expense.
|
Note 9: Goodwill and Intangible Assets
|
|
Goodwill
|
|
|
|
|
|
|
|
||||||||||||||
|
|
|
NBCUniversal
|
|
|
|||||||||||||||||
|
(in millions)
|
Cable
Communications |
|
Cable
Networks |
|
Broadcast
Television |
|
Filmed
Entertainment |
|
Theme
Parks |
|
Corporate
and Other |
|
Total
|
|
|||||||
|
Balance, December 31, 2015
|
$
|
12,389
|
|
$
|
12,947
|
|
$
|
806
|
|
$
|
267
|
|
$
|
6,344
|
|
$
|
192
|
|
$
|
32,945
|
|
|
Acquisitions
(a)
|
82
|
|
232
|
|
—
|
|
2,717
|
|
—
|
|
1
|
|
3,032
|
|
|||||||
|
Adjustments
(b)
|
174
|
|
—
|
|
—
|
|
—
|
|
(250
|
)
|
(181
|
)
|
(257
|
)
|
|||||||
|
Foreign currency translation
|
—
|
|
4
|
|
—
|
|
9
|
|
247
|
|
—
|
|
260
|
|
|||||||
|
Balance, December 31, 2016
|
12,645
|
|
13,183
|
|
806
|
|
2,993
|
|
6,341
|
|
12
|
|
35,980
|
|
|||||||
|
Acquisitions
|
140
|
|
241
|
|
—
|
|
32
|
|
—
|
|
5
|
|
418
|
|
|||||||
|
Dispositions
|
—
|
|
—
|
|
—
|
|
—
|
|
—
|
|
(11
|
)
|
(11
|
)
|
|||||||
|
Adjustments
(c)
|
(1
|
)
|
1
|
|
—
|
|
185
|
|
—
|
|
1
|
|
186
|
|
|||||||
|
Foreign currency translation
|
—
|
|
2
|
|
—
|
|
2
|
|
203
|
|
—
|
|
207
|
|
|||||||
|
Balance, December 31, 2017
|
$
|
12,784
|
|
$
|
13,427
|
|
$
|
806
|
|
$
|
3,212
|
|
$
|
6,544
|
|
$
|
7
|
|
$
|
36,780
|
|
|
(a)
|
Acquisitions in 2016 in our Filmed Entertainment segment primarily included the DreamWorks Animation acquisition
(see Note 5 for additional information).
|
|
(b)
|
Adjustments in 2016 primarily included the updated allocation of the purchase price for Universal Studios Japan in our Theme Parks segment
and the reclassification of certain operations and businesses from Corporate and Other to our Cable Communications segment.
|
|
(c)
|
Adjustments in 2017 primarily included the updated allocation of the purchase price for DreamWorks Animation (see Note 5 for additional information).
|
Goodwill is calculated as the excess of the consideration transferred over the identifiable net assets acquired in a business combination and represents the future economic benefits expected to arise from anticipated synergies and intangible assets acquired that do not qualify for separate recognition, including assembled workforce, noncontractual relationships and other agreements. We assess the recoverability of our goodwill annually, or more frequently whenever events or substantive changes in circumstances indicate that the carrying amount of a reporting unit may exceed its fair value. We test goodwill for impairment at the reporting unit level. To determine our reporting units, we evaluate the components one level below the segment level and we aggregate the components if they have similar economic characteristics. As a result of this assessment, our reporting units are the same as our
five
reportable segments. We evaluate the determination of our reporting units used to test for impairment periodically or whenever events or substantive changes in circumstances occur. The assessment of recoverability may first consider qualitative factors to determine whether the existence of events or circumstances leads to a determination that it is more likely than not that the fair value of a reporting unit is less than its carrying amount. A quantitative assessment is performed if the qualitative assessment results in a more-likely-than-not determination or if a qualitative assessment is not performed. The quantitative assessment considers whether the carrying amount of a reporting unit exceeds its fair value, in which case an impairment charge is recorded to the extent the carrying amount of the reporting unit’s goodwill exceeds its implied fair value. Unless presented separately, the impairment charge is included as a component of amortization expense.
We did not recognize any impairment charges in any of the periods presented.
|
78
|
Comcast 2017 Annual Report on Form 10-K
|
|
Comcast Corporation
|
Intangible Assets
|
|||||||||||||
|
|
|
2017
|
2016
|
||||||||||
|
December 31 (in millions)
|
Weighted-Average
Original Useful Life
as of December 31, 2017
|
Gross
Carrying
Amount
|
|
Accumulated
Amortization
|
|
Gross
Carrying
Amount
|
|
Accumulated
Amortization
|
|
||||
|
Indefinite-Lived Intangible Assets:
|
|||||||||||||
|
Franchise rights
|
N/A
|
$
|
59,364
|
|
$
|
59,364
|
|
||||||
|
Trade names
|
N/A
|
2,981
|
|
2,981
|
|
||||||||
|
FCC licenses
(a)
|
N/A
|
2,238
|
|
651
|
|
||||||||
|
Finite-Lived Intangible Assets:
|
|||||||||||||
|
Customer relationships
|
19 years
|
13,612
|
|
$
|
(5,819
|
)
|
13,478
|
|
$
|
(5,110
|
)
|
||
|
Software
|
4 years
|
8,258
|
|
(4,846
|
)
|
7,017
|
|
(3,997
|
)
|
||||
|
Cable franchise renewal costs and contractual operating rights
|
9 years
|
1,492
|
|
(834
|
)
|
1,460
|
|
(800
|
)
|
||||
|
Patents and other technology rights
|
7 years
|
259
|
|
(221
|
)
|
257
|
|
(208
|
)
|
||||
|
Other agreements and rights
|
16 years
|
2,724
|
|
(1,065
|
)
|
2,443
|
|
(898
|
)
|
||||
|
Total
|
|
$
|
90,928
|
|
$
|
(12,785
|
)
|
$
|
87,651
|
|
$
|
(11,013
|
)
|
|
(a)
|
In 2017, we acquired the rights to spectrum in the FCC Spectrum auction (see Note 5 for additional information).
|
Indefinite-Lived Intangible Assets
Indefinite-lived intangible assets consist primarily of our cable franchise rights. Our cable franchise rights represent the values we attributed to agreements with state and local authorities that allow access to homes and businesses in cable service areas acquired in business combinations. We do not amortize our cable franchise rights because we have determined that they meet the definition of indefinite-lived intangible assets since there are no legal, regulatory, contractual, competitive, economic or other factors which limit the period over which these rights will contribute to our cash flows. We reassess this determination periodically or whenever events or substantive changes in circumstances occur. Costs we incur in negotiating and renewing cable franchise agreements are included in other intangible assets and are generally amortized on a straight-line basis over the term of the franchise agreement.
We assess the recoverability of our cable franchise rights and other indefinite-lived intangible assets annually, or more frequently whenever events or substantive changes in circumstances indicate that the assets might be impaired. Our
three
Cable Communications divisions represent the unit of account we use to test for impairment of our cable franchise rights. We evaluate the unit of account used to test for impairment of our cable franchise rights and other
indefinite-lived intangible assets periodically or whenever events or substantive changes in circumstances occur to ensure impairment testing is performed at an appropriate level. The assessment of recoverability may first consider qualitative factors to determine whether it is more likely than not that the fair value of an indefinite-lived intangible asset is less than its carrying amount. A quantitative assessment is performed if the qualitative assessment results in a more-likely-than-not determination or if a qualitative assessment is not performed. When performing a quantitative assessment, we estimate the fair value of our
cable franchise rights and other
indefinite-lived intangible assets primarily based on a discounted cash flow analysis that involves significant judgment. When analyzing the fair values indicated under the discounted cash flow models, we also consider multiples of Adjusted EBITDA generated by the underlying assets, current market transactions, and profitability information. If the fair value of our
cable franchise rights or other
indefinite-lived intangible assets were less than the carrying amount, we would recognize an impairment charge for the difference between the estimated fair value and the carrying value of the assets. Unless presented separately, the impairment charge is included as a component of amortization expense. We did not recognize any material impairment charges in any of the periods presented.
Finite-Lived Intangible Assets
|
Estimated Amortization Expense of Finite-Lived Intangible Assets
|
|||
|
(in millions)
|
|
||
|
2018
|
$
|
2,283
|
|
|
2019
|
$
|
1,952
|
|
|
2020
|
$
|
1,629
|
|
|
2021
|
$
|
1,225
|
|
|
2022
|
$
|
905
|
|
Finite-lived intangible assets are subject to amortization and consist primarily of customer relationships acquired in business combinations, software, cable franchise renewal costs, contractual operating rights and intellectual property rights.
Our finite-
|
Comcast 2017 Annual Report on Form 10-K
|
79
|
|
Comcast Corporation
lived intangible assets are amortized primarily on a straight-line basis over their estimated useful life or the term of the associated agreement.
We capitalize direct development costs associated with internal-use software, including external direct costs of material and services and payroll costs for employees devoting time to these software projects. We also capitalize costs associated with the purchase of software licenses. We
generally amortize them on a straight-line basis over a period not to exceed
five years
.
We expense maintenance and training costs, as well as costs incurred during the preliminary stage of a project, as they are incurred. We capitalize initial operating system software costs and amortize them over the life of the associated hardware.
We evaluate the recoverability of our finite-lived intangible assets whenever events or substantive changes in circumstances indicate that the carrying amount may not be recoverable. The evaluation is based on the cash flows generated by the underlying asset groups, including estimated future operating results, trends or other determinants of fair value. If the total of the expected future undiscounted cash flows were less than the carrying amount of the asset group, we would recognize an impairment charge to the extent the carrying amount of the asset group exceeded its estimated fair value. Unless presented separately, the impairment charge is included as a component of amortization expense.
|
|
|
Long-Term Debt Outstanding
|
||||||||||
|
December 31 (in millions)
|
Weighted-Average
Interest Rate as of December 31, 2017 |
|
2017
|
|
2016
|
|
||||
|
Commercial paper
|
1.84
|
%
|
$
|
903
|
|
$
|
2,781
|
|
||
|
Term loans
(a)
|
0.82
|
%
|
3,880
|
|
3,262
|
|
||||
|
Senior notes with maturities of 5 years or less, at face value
|
4.18
|
%
|
15,680
|
|
13,850
|
|
||||
|
Senior notes with maturities between 5 and 10 years, at face value
|
3.31
|
%
|
13,277
|
|
12,049
|
|
||||
|
Senior notes with maturities greater than 10 years, at face value
(b)
|
4.74
|
%
|
31,838
|
|
28,587
|
|
||||
|
Other, including capital lease obligations
|
—
|
|
921
|
|
842
|
|
||||
|
Debt issuance costs, premiums, discounts and fair value adjustments for hedged positions, net
(c)
|
—
|
|
(1,943
|
)
|
(325
|
)
|
||||
|
Total debt
|
4.04
|
%
|
(d)
|
64,556
|
|
61,046
|
|
|||
|
Less: Current portion
|
5,134
|
|
5,480
|
|
||||||
|
Long-term debt
|
|
$
|
59,422
|
|
$
|
55,566
|
|
|||
|
(a)
|
The
December 31, 2017
and
2016
amounts primarily consist of
¥435 billion
and
¥382 billion
, respectively, of Universal Studios Japan term loans translated using the exchange rates as of these dates. In May 2017, Universal Studios Japan entered into
¥450 billion
of new term loans with a final maturity of March 2022. We used the proceeds from these borrowings to repay in full Universal Studios Japan’s existing yen-denominated term loans and a portion of amounts outstanding under our commercial paper program.
|
|
(b)
|
The
December 31, 2017
and
2016
amounts include
£625 million
of
5.50%
notes due 2029, which translated to
$845 million
and
$771 million
, respectively, using the exchange rates as of these dates.
|
|
(c)
|
The December 31, 2017 amount includes the difference between the principal amount of the new senior notes and the carrying amount of the exchanged senior notes at the time of the senior notes exchange. See below under the heading “Senior Notes Exchange” for additional information on this transaction.
|
|
(d)
|
Includes the effects of our derivative financial instruments.
|
As of
December 31, 2017
and
2016
, our debt had an estimated fair value of
$71.7 billion
and
$66.3 billion
, respectively.
The estimated fair value of our publicly traded debt was primarily based on Level 1 inputs that use quoted market values for the debt. The estimated fair value of debt for which there are no quoted market prices was based on Level 2 inputs that use interest rates available to us for debt with similar terms and remaining maturities.
See Note 19 for additional information on our cross-guarantee structure.
|
80
|
Comcast 2017 Annual Report on Form 10-K
|
|
Comcast Corporation
|
Principal Maturities of Debt
|
|||
|
(in millions)
|
|
||
|
2018
|
$
|
5,127
|
|
|
2019
|
$
|
2,367
|
|
|
2020
|
$
|
3,688
|
|
|
2021
|
$
|
3,884
|
|
|
2022
|
$
|
5,879
|
|
|
Thereafter
|
$
|
45,554
|
|
|
2017 Debt Borrowings
|
|||
|
Year ended December 31, 2017 (in millions)
|
|
||
|
Universal Studios Japan term loans maturing 2022
|
$
|
3,948
|
|
|
Comcast 3.15% senior notes due 2028
|
1,650
|
|
|
|
NBCUniversal Enterprise floating rate notes due 2021
|
1,500
|
|
|
|
Comcast 3.00% senior notes due 2024
|
1,250
|
|
|
|
Comcast 3.30% senior notes due 2027
|
1,250
|
|
|
|
Comcast 4.45% senior notes due 2047
|
1,005
|
|
|
|
Comcast 4.00% senior notes due 2047
|
850
|
|
|
|
Other
|
13
|
|
|
|
Total
|
$
|
11,466
|
|
|
2017 Debt Redemptions and Repayments
|
|||
|
Year ended December 31, 2017 (in millions)
|
|
||
|
Universal Studios Japan term loans maturing 2020
|
$
|
3,347
|
|
|
Comcast 6.30% senior notes due 2017
|
1,000
|
|
|
|
Comcast 6.50% senior notes due 2017
|
1,000
|
|
|
|
Comcast 8.875% senior notes due 2017
|
550
|
|
|
|
Comcast 5.00% senior notes due 2061
|
288
|
|
|
|
Other
|
179
|
|
|
|
Total
|
$
|
6,364
|
|
Senior Notes Exchange
In October 2017, we and NBCUniversal completed a debt exchange transaction. We issued
$5.5 billion
aggregate principal amount of new senior notes in exchange for
$3.9 billion
aggregate principal amount of certain series of outstanding senior notes that had been issued by us and NBCUniversal, as detailed in the table below.
|
(in millions)
|
Principal Amount
Exchanged
|
|
Principal Amount
Issued in Exchange
|
|
||
|
Comcast 6.95% senior notes due 2037
|
$
|
1,212
|
|
|||
|
Comcast 6.45% senior notes due 2037
|
946
|
|
||||
|
Comcast 6.40% senior notes due 2040
|
518
|
|
||||
|
NBCUniversal 6.40% senior notes due 2040
|
442
|
|
||||
|
Comcast 6.40% senior notes due 2038
|
428
|
|
||||
|
Comcast 6.55% senior notes due 2039
|
386
|
|
||||
|
Comcast 3.97% senior notes due 2047
|
$
|
2,000
|
|
|||
|
Comcast 4.00% senior notes due 2049
|
2,000
|
|
||||
|
Comcast 4.05% senior notes due 2052
|
1,500
|
|
||||
|
Total
|
$
|
3,932
|
|
$
|
5,500
|
|
The new senior notes are unsecured, rank equally in right of payment with all of our unsecured and unsubordinated indebtedness, and are fully and unconditionally guaranteed by Comcast Cable Communications, LLC and NBCUniversal. The debt exchange transaction was accounted for as a debt modification, and therefore following the exchange, the book value of our debt was unchanged and the difference between the principal amount of the new senior notes and the carrying amount of the exchanged senior notes will accrue through interest expense over the period to maturity of the new senior notes.
|
Comcast 2017 Annual Report on Form 10-K
|
81
|
|
Comcast Corporation
Debt Instruments
Revolving Bank Credit Facilities
As of December 31, 2017 and 2016, we had a
$7 billion
revolving credit facility due 2021 with a syndicate of banks (“Comcast revolving credit facility”) that may be used for general corporate purposes. We may increase the commitment under the Comcast revolving credit facility up to a total of
$10 billion
, as well as extend the expiration date to a date no later than 2023, subject to approval of the lenders. In addition, as of December 31, 2017 and 2016, NBCUniversal Enterprise had a
$1.5 billion
revolving credit facility due 2021 with a syndicate of banks (“NBCUniversal Enterprise revolving credit facility”) that may be used for general corporate purposes. We may increase the commitment under the NBCUniversal Enterprise revolving credit facility up to a total of
$2 billion
, as well as extend the expiration date to a date no later than 2023, subject to approval of the lenders. The interest rates on the revolving credit facilities consist of a base rate plus a borrowing margin that is determined based on Comcast’s credit rating. As of December 31, 2017, the borrowing margin for borrowings based on the London Interbank Offered Rate was
1.00%
. Each of the revolving credit facilities requires that we maintain certain financial ratios based on the respective debt and EBITDA of each entity, as defined in the credit facility. We were in compliance with all financial covenants for all periods presented.
There were no amounts outstanding under the Comcast or NBCUniversal Enterprise revolving credit facility as of December 31, 2017 or 2016. As of
December 31, 2017
,
amounts available under our consolidated revolving credit facilities, net of amounts outstanding under our commercial paper programs and outstanding letters of credit, totaled
$7.4 billion
, which included
$1.5 billion
available under the NBCUniversal Enterprise revolving credit facility.
Commercial Paper Programs
Our commercial paper programs provide a lower-cost source of borrowing to fund our short-term working capital requirements. In June 2017, we increased the Comcast and NBCUniversal Enterprise commercial paper programs to
$7.0 billion
and
$1.5 billion
, respectively, to coincide with the borrowing capacities under the Comcast and NBCUniversal Enterprise revolving credit facilities.
Letters of Credit
As of
December 31, 2017
, we and certain of our subsidiaries had undrawn irrevocable standby letters of credit totaling
$439 million
to cover potential fundings under various agreements.
|
Note 11: Employee Benefit Plans
|
Deferred Compensation Plans
|
Year ended December 31 (in millions)
|
2017
|
|
2016
|
|
2015
|
|
|||
|
Benefit obligation
|
$
|
2,539
|
|
$
|
2,164
|
|
$
|
2,038
|
|
|
Interest expense
|
$
|
209
|
|
$
|
178
|
|
$
|
171
|
|
We maintain unfunded, nonqualified deferred compensation plans for certain members of management and nonemployee directors. The amount of compensation deferred by each participant is based on participant elections. Participant accounts, except for those in the NBCUniversal plan, are credited with income primarily based on a fixed annual rate. Participants in the NBCUniversal plan designate one or more valuation funds, independently established funds or indices that are used to determine the amount of investment gain or loss in the participant’s account. Participants are eligible to receive distributions from their account based on elected deferral periods that are consistent with the plans and applicable tax law.
We have purchased life insurance policies to recover a portion of the future payments related to our deferred compensation plans. As of
December 31, 2017
and
2016
, the cash surrender value of these policies, which is recorded to other noncurrent assets, was
$820 million
and
$709 million
, respectively.
Postretirement Benefit Plan
|
Year ended December 31 (in millions)
|
2017
|
|
2016
|
|
||
|
Benefit obligation
|
$
|
425
|
|
$
|
538
|
|
|
Amounts in accumulated other comprehensive income not yet recognized in benefits expense
|
$
|
(458
|
)
|
$
|
(372
|
)
|
We sponsor a retiree health and welfare benefit plan that provides postretirement benefits to eligible employees. The plan provides to eligible employees who retire from Comcast or its subsidiaries, an annual stipend for reimbursement of certain eligible healthcare costs. The amount of the stipend for an eligible retiree is fixed at a predetermined amount based on the retiree’s years of service and whether the retiree is eligible for Medicare. In December 2016, the plan was amended primarily to reduce the stipend benefits of active employees of Comcast and subsidiaries other than NBCUniversal who retire after December 31, 2017, and in 2017
|
82
|
Comcast 2017 Annual Report on Form 10-K
|
|
Comcast Corporation
additional amendments were made to reduce the benefits of NBCUniversal employees who retire after December 31, 2017. The plan amendments reduced our benefit obligation by
$361 million
and
$146 million
in 2016 and 2017, respectively. Additionally, under the plan, a small number of employees are also eligible to participate in legacy plan benefits that were previously sponsored by acquired companies.
The plan is unfunded and substantially all of our postretirement benefit obligations are recorded to noncurrent liabilities. The expense we recognize for the plan is determined using certain assumptions, including the discount rate. The benefits expense we recognized for the plan was not material in any of the periods presented.
Pension Plans
NBCUniversal sponsors
various nonqualified defined benefit pension plans for domestic employees. Since the future benefits have been frozen since the beginning of 2013, we did not recognize service costs related to
the pension plans for any period presented. The benefits expense we recognized for our defined benefit plans was not material in any of the periods presented. In addition to the defined benefit plans it sponsors, NBCUniversal is also obligated to reimburse The General Electric Company (“GE”) for future benefit payments to those participants who were vested in the supplemental pension plan sponsored by GE at the time of the NBCUniversal transaction in 2011. These pension plans are currently unfunded and we recorded a benefit obligation of
$338 million
and
$314 million
as of
December 31, 2017
and
2016
, respectively, which consists primarily of our obligations to reimburse GE.
Retirement Investment Plans
We sponsor several 401(k) defined contribution retirement plans that allow eligible employees to contribute a portion of their compensation through payroll deductions in accordance with specified plan guidelines. We make contributions to the plans that include matching a percentage of the employees’ contributions up to certain limits. In
2017
,
2016
and
2015
, expenses related to these plans totaled
$458 million
,
$446 million
and
$416 million
, respectively.
Multiemployer Benefit Plans
We participate in various multiemployer benefit plans, including pension and postretirement benefit plans, that cover some of our employees and temporary employees who are represented by labor unions. We also participate in other multiemployer benefit plans that provide health and welfare and retirement savings benefits to active and retired participants. We make periodic contributions to these plans in accordance with the terms of applicable collective bargaining agreements and laws but do not sponsor or administer these plans. We do not participate in any multiemployer benefit plans for which we consider our contributions to be individually significant.
In
2017
,
2016
and
2015
, the total contributions we made to multiemployer pension plans were
$97 million
,
$84 million
and
$77 million
, respectively. In
2017
,
2016
and
2015
, the total contributions we made to multiemployer postretirement and other benefit plans were
$152 million
,
$136 million
and
$119 million
, respectively.
If we cease to be obligated to make contributions or were to otherwise withdraw from participation in any of these plans, applicable law would require us to fund our allocable share of the unfunded vested benefits, which is known as a withdrawal liability. In addition, actions taken by other participating employers may lead to adverse changes in the financial condition of one of these plans, which could result in an increase in our withdrawal liability.
Severance Benefits
We provide severance benefits to certain former employees. A liability is recorded when payment is probable, the amount is reasonably estimable, and the obligation relates to rights that have vested or accumulated. In
2017
,
2016
and
2015
, we recorded severance costs of
$203 million
,
$315 million
and
$181 million
, respectively. Severance costs in 2016 included
$61 million
of severance costs associated with the acquisition of DreamWorks Animation.
|
|
Common Stock
In the aggregate, holders of our Class A common stock have
66
2
/
3
%
of the voting power of our common stock and holders of our Class B common stock have
33
1
/
3
%
of the voting power of our common stock, which percentage is generally non-dilutable under the terms of our articles of incorporation. Each share of our Class B common stock is entitled to
15
votes. The number of votes held by each share of our Class A common stock depends on the number of shares of Class A and Class B common stock outstanding at any given time. The
33
1
/
3
%
aggregate voting power of our Class B common stock cannot be diluted by additional issuances of any other class of common stock. Our Class B common stock is convertible, share for share, into Class A common stock, subject to certain restrictions. See Note 1 for additional information regarding the stock split that occurred in 2017.
|
Comcast 2017 Annual Report on Form 10-K
|
83
|
|
Comcast Corporation
Class A Special Common Stock Reclassification
In December 2015, our shareholders approved a proposal to amend and restate our Amended and Restated Certificate of Incorporation in order to reclassify each issued share of our Class A Special common stock into one share of our Class A common stock. This reclassification became effective as of the close of business on December 11, 2015, at which time our Class A Special common stock was no longer outstanding and ceased trading on the NASDAQ under the symbol CMCSK and instead became listed on the NASDAQ under the symbol CMCSA. There was no impact on basic and diluted EPS or the carrying value of total common stock as presented in our consolidated balance sheet because it was a
one
-for-one stock exchange.
|
Shares of Common Stock Outstanding
|
||||||||
|
(in millions)
|
A
|
|
A Special
|
|
B
|
|
||
|
Balance, December 31, 2014
|
4,272
|
|
801
|
|
9
|
|
||
|
Stock compensation plans
|
25
|
|
—
|
|
—
|
|
||
|
Repurchases and retirements of common stock
|
(125
|
)
|
(107
|
)
|
—
|
|
||
|
Employee stock purchase plans
|
5
|
|
—
|
|
—
|
|
||
|
Reclassification of Class A Special common stock
|
694
|
|
(694
|
)
|
—
|
|
||
|
Other
|
4
|
|
—
|
|
—
|
|
||
|
Balance, December 31, 2015
|
4,875
|
|
—
|
|
9
|
|
||
|
Stock compensation plans
|
23
|
|
—
|
|
—
|
|
||
|
Repurchases and retirements of common stock
|
(161
|
)
|
—
|
|
—
|
|
||
|
Employee stock purchase plans
|
5
|
|
—
|
|
—
|
|
||
|
Balance, December 31, 2016
|
4,742
|
|
—
|
|
9
|
|
||
|
Stock compensation plans
|
19
|
|
—
|
|
—
|
|
||
|
Repurchases and retirements of common stock
|
(131
|
)
|
—
|
|
—
|
|
||
|
Employee stock purchase plans
|
5
|
|
—
|
|
—
|
|
||
|
Balance, December 31, 2017
|
4,635
|
|
—
|
|
9
|
|
||
Share Repurchases
Effective January 1, 2017, our Board of Directors increased our share repurchase program authorization to a total of
$12 billion
,
which does not have an expiration date. As of December 31, 2017, $7 billion remained under this authorization. Under the authorization, we may repurchase shares in the open market or in private transactions.
|
Share Repurchases Under Share Repurchase Program Authorization
|
|||||||||||
|
Year ended December 31 (in millions)
|
2017
|
|
2016
|
|
2015
|
|
|||||
|
Cash consideration
|
$
|
5,000
|
|
$
|
5,000
|
|
$
|
6,750
|
|
||
|
Shares repurchased
|
131
|
|
161
|
|
232
|
|
|||||
|
Accumulated Other Comprehensive Income (Loss)
|
|||||||
|
December 31 (in millions)
|
2017
|
|
2016
|
|
|||
|
Unrealized gains (losses) on marketable securities
|
$
|
(43
|
)
|
$
|
—
|
|
|
|
Deferred gains (losses) on cash flow hedges
|
9
|
|
(14
|
)
|
|||
|
Unrecognized gains (losses) on employee benefit obligations
|
260
|
|
219
|
|
|||
|
Cumulative translation adjustments
|
153
|
|
(107
|
)
|
|||
|
Accumulated other comprehensive income (loss), net of deferred taxes
|
$
|
379
|
|
$
|
98
|
|
|
|
|
The tables below provide information on our share-based compensation.
|
Recognized Share-Based Compensation Expense
|
|
|
|
|
|
|
|||||
|
Year ended December 31 (in millions)
|
2017
|
|
2016
|
|
2015
|
|
|||||
|
Restricted share units
|
$
|
349
|
|
$
|
306
|
|
$
|
273
|
|
||
|
Stock options
|
205
|
|
173
|
|
157
|
|
|||||
|
Employee stock purchase plans
|
32
|
|
28
|
|
25
|
|
|||||
|
Total
|
$
|
586
|
|
$
|
507
|
|
$
|
455
|
|
||
|
84
|
Comcast 2017 Annual Report on Form 10-K
|
|
Comcast Corporation
Our share-based compensation plans consist primarily of awards of RSUs and stock options to certain employees and directors as part of our approach to long-term incentive compensation. Awards generally vest over a period of
5
years and in the case of stock options, have a
10
year term. Additionally, through our employee stock purchase plans, employees are able to purchase shares of our common stock at a discount through payroll deductions. As of
December 31, 2017
, all of our stock options outstanding were net settled stock options. Net settled stock options, as opposed to stock options exercised with a cash payment, result in fewer shares being issued and no cash proceeds being received by us when the options are exercised.
|
Stock Options and Restricted Share Units
|
|||||||
|
As of December 31, 2017, unless otherwise stated (in millions, except per share data)
|
Stock
Options
|
|
RSUs
|
|
|||
|
Awards granted during 2017
|
39
|
|
15
|
|
|||
|
Weighted-average exercise price of awards granted during 2017
|
$
|
37.47
|
|
|
|||
|
Stock options outstanding and nonvested RSUs
|
191
|
|
42
|
|
|||
|
Weighted-average exercise price of stock options outstanding
|
$
|
24.98
|
|
||||
|
Weighted-average fair value at grant date of nonvested RSUs
|
|
$
|
30.93
|
|
|||
The cost associated with our share-based compensation is based on an award’s estimated fair value at the date of grant and is recognized over the period in which any related services are provided. RSUs are valued based on the closing price of our common stock on the date of grant and are discounted for the lack of dividends, if any, during the vesting period. We use the Black-Scholes option pricing model to estimate the fair value of stock option awards.
The table below presents the weighted-average fair value on the date of grant of RSUs and stock options awarded under our various plans and the related weighted-average valuation assumptions.
|
Year ended December 31
|
2017
|
|
2016
|
|
2015
|
|
|||||
|
RSUs fair value
|
$
|
37.77
|
|
$
|
30.02
|
|
$
|
29.41
|
|
||
|
Stock options fair value
|
$
|
7.01
|
|
$
|
5.78
|
|
$
|
5.89
|
|
||
|
Stock Option Valuation Assumptions:
|
|||||||||||
|
Dividend yield
|
1.7
|
%
|
1.8
|
%
|
1.7
|
%
|
|||||
|
Expected volatility
|
20.1
|
%
|
23.0
|
%
|
23.0
|
%
|
|||||
|
Risk-free interest rate
|
2.2
|
%
|
1.5
|
%
|
1.6
|
%
|
|||||
|
Expected option life (in years)
|
6.1
|
|
6.1
|
|
6.0
|
|
|||||
As of
December 31, 2017
, we had unrecognized pretax compensation expense of
$806 million
related to nonvested RSUs and unrecognized pretax compensation expense of
$404 million
related to nonvested stock options that will each be recognized over a weighted-average period of approximately
1.7
years. In
2016
and
2015
, we recorded increases to additional paid-in capital of
$233 million
and
$311 million
, respectively, which were the result of excess tax benefits associated with our share-based compensation plans. As a result of the adoption of new accounting guidance related to share-based compensation in
2017
, these tax benefits are now recorded as a reduction to income tax expense (see Note 3).
|
|
|
Components of Income Tax Expense (Benefit)
|
|||||||||||
|
Year ended December 31 (in millions)
|
2017
|
|
2016
|
|
2015
|
|
|||||
|
Current Expense (Benefit):
|
|||||||||||
|
Federal
|
$
|
2,411
|
|
$
|
3,190
|
|
$
|
3,210
|
|
||
|
State
|
277
|
|
480
|
|
570
|
|
|||||
|
Foreign
|
389
|
|
194
|
|
221
|
|
|||||
|
|
3,077
|
|
3,864
|
|
4,001
|
|
|||||
|
Deferred Expense (Benefit):
|
|||||||||||
|
Federal
|
(10,659
|
)
|
1,192
|
|
890
|
|
|||||
|
State
|
10
|
|
154
|
|
66
|
|
|||||
|
Foreign
|
(6
|
)
|
98
|
|
2
|
|
|||||
|
|
(10,655
|
)
|
1,444
|
|
958
|
|
|||||
|
Income tax expense (benefit)
|
$
|
(7,578
|
)
|
$
|
5,308
|
|
$
|
4,959
|
|
||
|
Comcast 2017 Annual Report on Form 10-K
|
85
|
|
Comcast Corporation
Our income tax expense (benefit) differs from the federal statutory amount because of the effect of the items detailed in the table below.
|
Year ended December 31 (in millions)
|
2017
|
|
2016
|
|
2015
|
|
|||||
|
Federal tax at statutory rate
|
$
|
5,363
|
|
$
|
5,024
|
|
$
|
4,680
|
|
||
|
State income taxes, net of federal benefit
|
298
|
|
373
|
|
326
|
|
|||||
|
Foreign income taxes, net of federal credit
|
70
|
|
65
|
|
13
|
|
|||||
|
Nontaxable income attributable to noncontrolling interests
|
(45
|
)
|
(128
|
)
|
(69
|
)
|
|||||
|
Adjustments to uncertain and effectively settled tax positions, net
|
(62
|
)
|
24
|
|
15
|
|
|||||
|
Accrued interest on uncertain and effectively settled tax positions, net
|
3
|
|
17
|
|
73
|
|
|||||
|
Excess tax benefits recognized on share-based compensation
|
(297
|
)
|
—
|
|
—
|
|
|||||
|
2017 federal tax reform enactment
|
(12,679
|
)
|
—
|
|
—
|
|
|||||
|
Other
|
(229
|
)
|
(67
|
)
|
(79
|
)
|
|||||
|
Income tax expense (benefit)
|
$
|
(7,578
|
)
|
$
|
5,308
|
|
$
|
4,959
|
|
||
We
base our provision for income taxes on our current period income, changes in our deferred income tax assets and liabilities, income tax rates, changes in estimates of our uncertain tax positions, and tax planning opportunities available in the jurisdictions in which we operate. We recognize deferred tax assets and liabilities when there are temporary differences between the financial reporting basis and tax basis of our assets and liabilities and for the expected benefits of using net operating loss carryforwards. When a change in the tax rate or tax law has an impact on deferred taxes, we apply the change based on the years in which the temporary differences are expected to reverse. We record the change in our consolidated financial statements in the period of enactment.
The determination of the income tax consequences of a business combination includes identifying the tax basis of assets and liabilities acquired and any contingencies associated with uncertain tax positions assumed or resulting from the business combination. Deferred tax assets and liabilities related to temporary differences of an acquired entity are recorded as of the date of the business combination and are based on our estimate of the ultimate tax basis that will be accepted by the various tax authorities. We record liabilities for contingencies associated with prior tax returns filed by the acquired entity based on criteria set forth in the appropriate accounting guidance. We adjust the deferred tax accounts and the liabilities periodically to reflect any revised estimated tax basis and any estimated settlements with the various tax authorities. The effects of these adjustments are recorded to income tax expense (benefit).
From time to time, we engage in transactions in which the tax consequences may be subject to uncertainty. In these cases, we evaluate our tax position using the recognition threshold and the measurement attribute in accordance with the accounting guidance related to uncertain tax positions. Examples of these transactions include business acquisitions and dispositions, including consideration paid or received in connection with these transactions, certain financing transactions, and the allocation of income among state and local tax jurisdictions. Significant judgment is required in assessing and estimating the tax consequences of these transactions. We determine whether it is more likely than not that a tax position will be sustained on examination, including the resolution of any related appeals or litigation processes, based on the technical merits of the position. A tax position that meets the more-likely-than-not recognition threshold is measured to determine the amount of benefit to be recognized in our consolidated financial statements. We classify interest and penalties, if any, associated with our uncertain tax positions as a component of income tax expense (benefit).
Current and deferred foreign income taxes are incurred primarily by NBCUniversal’s foreign subsidiaries. In
2017
,
2016
and
2015
, NBCUniversal had foreign income before taxes of
$1.0 billion
,
$871 million
and
$704 million
, respectively, on which foreign income tax expense (benefit) was recorded. We generally record U.S. income tax expense (benefit) on our allocable share of our subsidiaries’ income before domestic and foreign taxes, which is reduced by a U.S. tax credit equal to our allocable share of our subsidiaries’ foreign income tax expense (benefit).
Federal Tax Reform
On December 22, 2017, new federal tax reform legislation was enacted in the United States, resulting in significant changes from previous tax law. The 2017 Tax Act reduces the federal corporate income tax rate to
21%
from
35%
effective January 1, 2018. The rate change, along with certain immaterial changes in tax basis resulting from the 2017 Tax Act, resulted in a reduction of our net deferred tax liabilities of
$12.4 billion
and a corresponding deferred income tax benefit in 2017. Our federal income tax expense for periods beginning in 2018 will be based on the new rate.
The 2017 Tax Act also changes the taxation of foreign earnings, and companies generally will not be subject to United States federal income taxes upon the receipt of dividends from foreign subsidiaries and will not be permitted foreign tax credits related
|
86
|
Comcast 2017 Annual Report on Form 10-K
|
|
Comcast Corporation
to such dividends. Beginning in 2018, we will no longer record United States federal income tax on our share of the income of our foreign subsidiaries, nor will we record a benefit for foreign tax credits related to that income. Accordingly, we reversed
$382 million
of net deferred tax liabilities related to our cumulative undistributed foreign earnings and deferred tax assets for related foreign tax credits, resulting in a corresponding net tax benefit in 2017. Additionally, upon enactment, there is a one-time deemed repatriation tax on undistributed foreign earnings and profits (the “transition tax”). We recognized tax expense of
$101 million
related to the transition tax in 2017.
The 2017 Tax Act also provides for immediate deduction of 100% of the costs of qualified property, including significant portions of our capital expenditures and film and television production costs, that are incurred and the property placed in service during the period from September 27, 2017 to December 31, 2022. This provision will begin to phase down by 20% per year beginning January 1, 2023 and will be completely phased out as of January 1, 2027.
The adjustments to deferred tax assets and liabilities and the liability related to the transition tax are provisional amounts estimated based on information available as of December 31, 2017. These amounts are subject to change as we obtain information necessary to complete the calculations. We will recognize any changes to the provisional amounts as we refine our estimates of our cumulative temporary differences, including those related to the immediate deduction for qualified property, and our interpretations of the application of the 2017 Tax Act. We expect to complete our analysis of the provisional items during the second half of 2018. The effects of other provisions of the 2017 Tax Act are not expected to have a material impact on our consolidated financial statements.
|
Components of Net Deferred Tax Liability
|
|||||||
|
December 31 (in millions)
|
2017
|
|
2016
(a)
|
|
|||
|
Deferred Tax Assets:
|
|||||||
|
Net operating loss carryforwards
|
$
|
481
|
|
$
|
544
|
|
|
|
Nondeductible accruals and other
|
2,026
|
|
3,797
|
|
|||
|
Less: Valuation allowance
|
377
|
|
266
|
|
|||
|
|
2,130
|
|
4,075
|
|
|||
|
Deferred Tax Liabilities:
|
|||||||
|
Differences between book and tax basis of property and equipment and intangible assets
|
25,154
|
|
36,957
|
|
|||
|
Differences between book and tax basis of investments
|
466
|
|
498
|
|
|||
|
Differences between book and tax basis of long-term debt
|
673
|
|
571
|
|
|||
|
Differences between book and tax basis of foreign subsidiaries and undistributed foreign earnings
|
39
|
|
862
|
|
|||
|
|
26,332
|
|
38,888
|
|
|||
|
Net deferred tax liability
|
$
|
24,202
|
|
$
|
34,813
|
|
|
(a) Prior year amounts in the table above have been adjusted to appropriately classify certain deferred tax items. These adjustments had no impact on the net deferred tax liability recorded in our consolidated balance sheet.
Changes in our net deferred tax liability in
2017
that were not recorded as deferred income tax benefit (expense) are primarily related to an increase of
$108 million
associated with items included in other comprehensive income (loss), an increase of
$51 million
related to acquisitions and a decrease of
$112 million
associated with our purchase of a noncontrolling interest. Our net deferred tax liability includes
$15 billion
related to cable franchise rights that will remain unchanged unless we recognize an impairment or dispose of a cable franchise or there is a change in the tax law.
As of
December 31, 2017
, we had federal net operating loss carryforwards of
$348 million
, and various state net operating loss carryforwards that expire in periods through 2037. As of
December 31, 2017
, we also had foreign net operating loss carryforwards of
$387 million
that are related to the foreign operations of NBCUniversal, the majority of which expire in periods through 2027. The determination of the realization of the state and foreign net operating loss carryforwards is dependent on our subsidiaries’ taxable income or loss, apportionment percentages, redetermination from taxing authorities, and state and foreign laws that can change from year to year and impact the amount of such carryforwards. We recognize a valuation allowance if we determine it is more likely than not that some portion, or all, of a deferred tax asset will not be realized. As of
December 31, 2017
and
2016
, our valuation allowance was primarily related to state and foreign net operating loss carryforwards.
Uncertain Tax Positions
Our liability for uncertain tax positions as of
December 31, 2017
totaled
$809 million
, which excludes the federal benefits on state tax positions that were recorded as deferred income taxes. Included in our liability for uncertain tax positions was
$162 million
related to tax positions of NBCUniversal and NBCUniversal Enterprise for which we have been indemnified by GE. We are indemnified by GE for any income tax liability attributable to the NBCUniversal contributed businesses for periods prior to the
|
Comcast 2017 Annual Report on Form 10-K
|
87
|
|
Comcast Corporation
close of the NBCUniversal transaction in January 2011 and also for any income tax liability attributable to NBCUniversal Enterprise for periods prior to the date of the NBCUniversal redemption transaction in March 2013.
|
Reconciliation of Unrecognized Tax Benefits
|
|||||||||||
|
(in millions)
|
2017
|
|
2016
(a)
|
|
2015
(a)
|
|
|||||
|
Gross unrecognized tax benefits, January 1
|
$
|
1,443
|
|
$
|
1,441
|
|
$
|
1,455
|
|
||
|
Additions based on tax positions related to the current year
|
121
|
|
74
|
|
67
|
|
|||||
|
Additions based on tax positions related to prior years
|
319
|
|
72
|
|
98
|
|
|||||
|
Additions from acquired subsidiaries
|
—
|
|
13
|
|
—
|
|
|||||
|
Reductions for tax positions of prior years
|
(251
|
)
|
(66
|
)
|
(101
|
)
|
|||||
|
Reductions due to expiration of statutes of limitations
|
(70
|
)
|
(44
|
)
|
(41
|
)
|
|||||
|
Settlements with tax authorities
|
(65
|
)
|
(47
|
)
|
(37
|
)
|
|||||
|
Gross unrecognized tax benefits, December 31
|
1,497
|
|
1,443
|
|
1,441
|
|
|||||
|
Positions paid
|
(688
|
)
|
(340
|
)
|
(305
|
)
|
|||||
|
Liability for uncertain tax positions
|
$
|
809
|
|
$
|
1,103
|
|
$
|
1,136
|
|
||
(a) We have updated the presentation of the table above to include amounts related to positions previously paid and have updated prior year amounts to conform.
Our liability for uncertain tax positions represents the amounts recorded for potential payment obligations. Our gross unrecognized tax benefits also include amounts related to positions for which tax has been assessed and paid. If we were to recognize our gross unrecognized tax benefits in the future, $
1.2 billion
, which includes amounts indemnified by GE, would impact our effective tax rate and the remaining amount would increase our deferred income tax liability. The amount and timing of the recognition of any such tax benefit is dependent on the completion of examinations of our tax filings by the various tax authorities and the expiration of statutes of limitations.
It is reasonably possible that certain tax contests could be resolved within the next
12
months that may result in a decrease in our effective tax rate.
As of
December 31, 2017
and
2016
, our accrued interest associated with our liability for uncertain tax positions was
$173 million
and
$483 million
, respectively. As of
December 31, 2017
and
2016
,
$43 million
and
$39 million
, respectively, of these amounts were related to tax positions of NBCUniversal and NBCUniversal Enterprise for which we have been indemnified by GE.
The IRS has completed its examination of our income tax returns for all years through 2014. Various states are examining our state tax returns and the tax years of those tax returns currently under examination vary by state, with most of the periods relating to tax years 2000 and forward.
|
|
|
Receivables
|
||||||
|
December 31 (in millions)
|
2017
|
|
2016
|
|
||
|
Receivables, gross
|
$
|
9,253
|
|
$
|
8,622
|
|
|
Less: Allowance for returns and customer incentives
|
419
|
|
417
|
|
||
|
Less: Allowance for doubtful accounts
|
288
|
|
250
|
|
||
|
Receivables, net
|
$
|
8,546
|
|
$
|
7,955
|
|
In addition to the amounts in the table above, as of
December 31, 2017
and
2016
, net noncurrent receivables of
$1.3 billion
and
$939 million
,
respectively, are included in other noncurrent assets, net that primarily relate to the licensing of our television and film productions to third parties
and sales of wireless devices.
|
Cash Payments for Interest and Income Taxes
|
|||||||||
|
Year ended December 31 (in millions)
|
2017
|
|
2016
|
|
2015
|
|
|||
|
Interest
|
$
|
2,820
|
|
$
|
2,565
|
|
$
|
2,443
|
|
|
Income taxes
|
$
|
4,057
|
|
$
|
3,693
|
|
$
|
3,726
|
|
Noncash Investing and Financing Activities
During
2017
:
|
•
|
we acquired
$1.2 billion
of property and equipment and intangible assets that were accrued but unpaid
|
|
•
|
we recorded a liability of
$732 million
for a quarterly cash dividend of
$0.1575
per common share paid in January 2018
|
|
88
|
Comcast 2017 Annual Report on Form 10-K
|
|
Comcast Corporation
|
•
|
we completed a senior notes exchange in the fourth quarter of 2017 (see Note 10 for additional information)
|
During
2016
:
|
•
|
we acquired
$1.3 billion
of property and equipment and intangible assets that were accrued but unpaid
|
|
•
|
we recorded a liability of
$653 million
for a quarterly cash dividend of
$0.1375
per common share paid in January 2017
|
|
•
|
we recorded a liability of
$447 million
for capital contributions to Atairos that were accrued in December and paid in January 2017 (see Note 7 for additional information)
|
During
2015
:
|
•
|
we acquired
$1.1 billion
of property and equipment and intangible assets that were accrued but unpaid
|
|
•
|
we recorded a liability of
$612 million
for a quarterly cash dividend of
$0.125
per common share paid in January 2016
|
|
•
|
we assumed liabilities related to the Universal Studios Japan transaction (see Note 5 for additional information)
|
|
•
|
we used
$517 million
of equity securities to settle a portion of our obligations under prepaid forward sale agreements
|
|
|
Commitments
NBCUniversal enters into long-term commitments with third parties in the ordinary course of its business, including commitments to acquire film and television programming, obligations under various creative talent agreements, and various other television-related commitments. Some of NBCUniversal’s employees, including writers, directors, actors, technical and production personnel, and others, as well as some of its on-air and creative talent, are covered by collective bargaining agreements or works councils. As of
December 31, 2017
, the total number of NBCUniversal employees covered by collective bargaining agreements was
9,500
full-time equivalent employees. Approximately
63%
of these full-time equivalent employees were covered by collective bargaining agreements that have expired or are scheduled to expire during
2018
.
We, through Comcast Spectacor, have employment agreements with both players and coaches of the Philadelphia Flyers. Certain of these employment agreements, which provide for payments that are guaranteed regardless of employee injury or termination, are covered by disability insurance if certain conditions are met.
The table below summarizes our minimum annual programming and talent commitments and our minimum annual rental commitments under operating leases for office space, equipment and transponder service agreements. Programming and talent commitments include acquired film and television programming, including U.S. broadcast rights to the Olympic Games through 2032,
Sunday Night Football
through the 2022-23 season
,
certain NASCAR events through 2024
and other programming commitments, as well as various contracts with creative talent.
|
As of December 31, 2017 (in millions)
|
Programming and
Talent Commitments
|
|
Operating
Leases
|
|
||
|
2018
|
$
|
6,350
|
|
$
|
559
|
|
|
2019
|
$
|
3,895
|
|
$
|
512
|
|
|
2020
|
$
|
4,812
|
|
$
|
457
|
|
|
2021
|
$
|
3,301
|
|
$
|
391
|
|
|
2022
|
$
|
3,732
|
|
$
|
326
|
|
|
Thereafter
|
$
|
17,416
|
|
$
|
1,829
|
|
The table below presents our rental expense charged to operations.
|
Year ended December 31 (in millions)
|
2017
|
|
2016
|
|
2015
|
|
|||
|
Rental expense
|
$
|
839
|
|
$
|
744
|
|
$
|
608
|
|
Contractual Obligation
We are party to a contractual obligation that involves an interest held by a third party in the revenue of certain theme parks. The arrangement provides the counterparty with the right to periodic payments associated with current period revenue which are recorded as an operating expense, and beginning in June 2017, the option to require NBCUniversal to purchase the interest for cash in an amount based on a contractual formula. The contractual formula is based on an average of specified historical theme park revenue at the time of exercise, which amount could be significantly higher than our carrying value.
As of
December 31,
|
Comcast 2017 Annual Report on Form 10-K
|
89
|
|
Comcast Corporation
2017
, our carrying value was
$1.1 billion
, and the estimated value of the contractual obligation was
$1.5 billion
based on inputs to the contractual formula as of that date.
Contingent Consideration
In June 2015, we settled a contingent consideration liability related to the acquisition of NBCUniversal, which was based upon future net tax benefits realized by us that would affect future payments to GE, for a payment of
$450 million
, which was included as a financing activity in our consolidated statement of cash flows. The settlement resulted in a gain of
$240 million
, which was recorded to other income (expense), net in our consolidated statement of income.
Redeemable Subsidiary Preferred Stock
NBCUniversal Enterprise is a holding company that we control and consolidate whose principal assets are its interests in NBCUniversal Holdings. The holders of the Series A cumulative preferred stock of NBCUniversal Enterprise have the right to cause NBCUniversal Enterprise to redeem their shares at a price equal to the
$725 million
aggregate liquidation preference plus accrued but unpaid dividends for a
30
day period beginning on March 19, 2020 and thereafter on every third anniversary of such date (each such date, a “put date”). The NBCUniversal Enterprise preferred stock pays dividends at a fixed rate of
5.25%
per year. Shares of preferred stock can be called for redemption by NBCUniversal Enterprise at a price equal to the liquidation preference plus accrued but unpaid dividends
one year
following the put date applicable to such shares. Because certain of these redemption provisions are outside of our control, the NBCUniversal Enterprise preferred stock is presented outside of equity under the caption “redeemable noncontrolling interests and redeemable subsidiary preferred stock” in our consolidated balance sheet. Its initial value was based on the liquidation preference of the preferred stock and is adjusted for accrued but unpaid dividends. As of
December 31, 2017
and
2016
, the fair value of the NBCUniversal Enterprise redeemable subsidiary preferred stock was
$748 million
and
$741 million
, respectively. The estimated fair values are based on Level 2 inputs that use pricing models whose inputs are derived primarily from or corroborated by observable market data through correlation or other means for substantially the full term of the financial instrument.
Contingencies
We were a defendant in a lawsuit filed in December 2011 by Sprint Communications Company L.P. (“Sprint”) in the United States District Court for the District of Kansas. Sprint’s initial complaint alleged that Comcast Digital Voice and Xfinity Voice infringe 12 Sprint patents covering various aspects of a telecommunications system. In March 2015, Sprint withdrew its allegations of infringement for two of the patents. In December 2016, the Court granted summary judgment for us with respect to non-infringement on one of the patents and granted summary judgment for Sprint on one of the patents as to infringement with respect to some but not all of our accused telecommunications systems but not as to the patent’s validity. In January 2017, the Court entered judgment in favor of us on Sprint’s claims for infringement of two of the patents. In March 2017, Sprint indicated that it would not proceed to trial on three of the patents. Trial with respect to the four remaining patents, including the patent for which the Court granted partial summary judgment to Sprint, was set to begin on October 23, 2017. On October 16, 2017, the parties entered into a settlement agreement which dismisses all claims and resolves the parties’ disputes asserted in the matters described above, as well as in all other outstanding patent litigation matters between the parties, for a payment to Sprint and certain contractual rights. In connection therewith, we recorded a charge of
$250 million
in 2017.
We also are a defendant in several unrelated lawsuits claiming infringement of various patents relating to various aspects of our businesses. In certain of these cases other industry participants are also defendants, and also in certain of these cases we expect that any potential liability would be in part or in whole the responsibility of our equipment and technology vendors under applicable contractual indemnification provisions. In addition, we are subject to other legal proceedings and claims that arise in the ordinary course of our business. While the amount of ultimate liability with respect to such actions is not expected to materially affect our results of operations, cash flows or financial position, any litigation resulting from any such legal proceedings or claims could be time-consuming and injure our reputation.
|
|
We present our operations in
one
reportable business segment for Cable Communications and
four
reportable business segments for NBCUniversal. The Cable Networks, Broadcast Television, Filmed Entertainment and Theme Parks segments comprise the NBCUniversal businesses and are collectively referred to as the NBCUniversal segments. We use Adjusted EBITDA to evaluate the profitability of our operating segments, and the components of net income attributable to Comcast Corporation excluded from Adjusted EBITDA are not separately evaluated. Our financial data by business segment is presented in the tables below.
We do not present a measure of total assets for our reportable business segments as this information is not used by management to allocate resources and capital.
|
90
|
Comcast 2017 Annual Report on Form 10-K
|
|
Comcast Corporation
|
(in millions)
|
Revenue
(f)
|
|
Adjusted
EBITDA (g) |
|
Depreciation and
Amortization |
|
Capital
Expenditures |
|
Cash Paid for
Intangible Assets |
|
|||||
|
2017
|
|||||||||||||||
|
Cable Communications
(a)
|
$
|
52,519
|
|
$
|
21,170
|
|
$
|
8,143
|
|
$
|
7,952
|
|
$
|
1,382
|
|
|
NBCUniversal
|
|||||||||||||||
|
Cable Networks
|
10,631
|
|
4,076
|
|
755
|
|
33
|
|
19
|
|
|||||
|
Broadcast Television
|
9,546
|
|
1,253
|
|
133
|
|
180
|
|
22
|
|
|||||
|
Filmed Entertainment
|
7,658
|
|
1,277
|
|
109
|
|
58
|
|
23
|
|
|||||
|
Theme Parks
|
5,443
|
|
2,384
|
|
648
|
|
960
|
|
78
|
|
|||||
|
Headquarters and Other
(b)
|
45
|
|
(741
|
)
|
396
|
|
271
|
|
153
|
|
|||||
|
Eliminations
(c)
|
(326
|
)
|
(4
|
)
|
—
|
|
—
|
|
—
|
|
|||||
|
NBCUniversal
|
32,997
|
|
8,245
|
|
2,041
|
|
1,502
|
|
295
|
|
|||||
|
Corporate and Other
(d)
|
1,060
|
|
(1,394
|
)
|
83
|
|
96
|
|
70
|
|
|||||
|
Eliminations
(c)
|
(2,050
|
)
|
41
|
|
—
|
|
—
|
|
—
|
|
|||||
|
Comcast Consolidated
|
$
|
84,526
|
|
$
|
28,062
|
|
$
|
10,267
|
|
$
|
9,550
|
|
$
|
1,747
|
|
|
(in millions)
|
Revenue
(f)
|
|
Adjusted
EBITDA (g) |
|
Depreciation and
Amortization |
|
Capital
Expenditures |
|
Cash Paid for
Intangible Assets |
|
|||||
|
2016
|
|||||||||||||||
|
Cable Communications
(a)
|
$
|
50,048
|
|
$
|
20,109
|
|
$
|
7,670
|
|
$
|
7,596
|
|
$
|
1,377
|
|
|
NBCUniversal
|
|||||||||||||||
|
Cable Networks
(e)
|
10,464
|
|
3,709
|
|
745
|
|
32
|
|
20
|
|
|||||
|
Broadcast Television
(e)
|
10,147
|
|
1,320
|
|
125
|
|
153
|
|
19
|
|
|||||
|
Filmed Entertainment
|
6,360
|
|
697
|
|
47
|
|
33
|
|
16
|
|
|||||
|
Theme Parks
|
4,946
|
|
2,190
|
|
512
|
|
922
|
|
72
|
|
|||||
|
Headquarters and Other
(b)
|
20
|
|
(699
|
)
|
376
|
|
312
|
|
156
|
|
|||||
|
Eliminations
(c)
|
(344
|
)
|
10
|
|
—
|
|
—
|
|
—
|
|
|||||
|
NBCUniversal
|
31,593
|
|
7,227
|
|
1,805
|
|
1,452
|
|
283
|
|
|||||
|
Corporate and Other
(d)
|
750
|
|
(874
|
)
|
83
|
|
87
|
|
26
|
|
|||||
|
Eliminations
(c)
|
(1,988
|
)
|
(45
|
)
|
—
|
|
—
|
|
—
|
|
|||||
|
Comcast Consolidated
|
$
|
80,403
|
|
$
|
26,417
|
|
$
|
9,558
|
|
$
|
9,135
|
|
$
|
1,686
|
|
|
(in millions)
|
Revenue
(f)
|
|
Adjusted
EBITDA (g) |
|
Depreciation and
Amortization |
|
Capital
Expenditures |
|
Cash Paid for
Intangible Assets |
|
|||||
|
2015
|
|||||||||||||||
|
Cable Communications
(a)
|
$
|
46,928
|
|
$
|
19,037
|
|
$
|
7,051
|
|
$
|
7,040
|
|
$
|
1,151
|
|
|
NBCUniversal
|
|||||||||||||||
|
Cable Networks
|
9,628
|
|
3,499
|
|
784
|
|
44
|
|
22
|
|
|||||
|
Broadcast Television
(e)
|
8,530
|
|
780
|
|
111
|
|
117
|
|
17
|
|
|||||
|
Filmed Entertainment
|
7,287
|
|
1,234
|
|
26
|
|
14
|
|
20
|
|
|||||
|
Theme Parks
|
3,339
|
|
1,464
|
|
292
|
|
833
|
|
54
|
|
|||||
|
Headquarters and Other
(b)
|
14
|
|
(625
|
)
|
326
|
|
378
|
|
98
|
|
|||||
|
Eliminations
(c)
|
(336
|
)
|
—
|
|
—
|
|
—
|
|
—
|
|
|||||
|
NBCUniversal
|
28,462
|
|
6,352
|
|
1,539
|
|
1,386
|
|
211
|
|
|||||
|
Corporate and Other
(d)
|
713
|
|
(815
|
)
|
90
|
|
73
|
|
8
|
|
|||||
|
Eliminations
(c)
|
(1,593
|
)
|
104
|
|
—
|
|
—
|
|
—
|
|
|||||
|
Comcast Consolidated
|
$
|
74,510
|
|
$
|
24,678
|
|
$
|
8,680
|
|
$
|
8,499
|
|
$
|
1,370
|
|
|
Comcast 2017 Annual Report on Form 10-K
|
91
|
|
Comcast Corporation
|
(a)
|
For the years ended
December 31, 2017
,
2016
and
2015
, Cable Communications segment revenue was derived from the following sources:
|
|
2017
|
|
2016
|
|
2015
|
|
|
|
Residential:
|
||||||
|
Video
|
44.0
|
%
|
44.7
|
%
|
45.9
|
%
|
|
High-speed Internet
|
28.1
|
%
|
27.0
|
%
|
26.6
|
%
|
|
Voice
|
6.5
|
%
|
7.1
|
%
|
7.7
|
%
|
|
Business services
|
11.8
|
%
|
11.0
|
%
|
10.1
|
%
|
|
Advertising
|
4.3
|
%
|
4.9
|
%
|
4.7
|
%
|
|
Other
|
5.3
|
%
|
5.3
|
%
|
5.0
|
%
|
|
Total
|
100.0
|
%
|
100.0
|
%
|
100.0
|
%
|
Subscription revenue received from residential customers who purchase bundled services at a discounted rate is allocated proportionally to each cable service based on the individual service’s price on a stand-alone basis.
For
2017
,
2.7%
of Cable Communications revenue was derived from franchise and other regulatory fees. For both
2016
and
2015
,
2.8%
of Cable Communications revenue was derived from franchise and other regulatory fees.
|
(b)
|
NBCUniversal
Headquarters and Other activities include costs associated with overhead, allocations, personnel costs and headquarter initiatives.
|
|
(c)
|
Included in Eliminations are transactions that our segments enter into with one another. The most common types of transactions are the following:
|
|
•
|
our Cable Networks segment generates revenue by selling programming to our Cable Communications segment, which represents a substantial majority of the revenue elimination amount
|
|
•
|
our Broadcast Television segment generates revenue from the fees received under retransmission consent agreements with our Cable Communications segment
|
|
•
|
our Cable Communications segment generates revenue by selling advertising and by selling the use of satellite feeds to our Cable Networks segment
|
|
•
|
our Filmed Entertainment and Broadcast Television segments generate revenue by licensing content to our Cable Networks segment; for segment reporting, this revenue is recognized as the programming rights asset for the licensed content is amortized based on third party revenue
|
|
(d)
|
Corporate and Other activities include costs associated with overhead and personnel, revenue and expenses associated with other business development initiatives, including our new wireless phone service, and the operations of Comcast Spectacor, which owns the Philadelphia Flyers and the Wells Fargo Center arena in Philadelphia, Pennsylvania and operates arena management-related businesses.
|
|
(e)
|
The revenue and operating costs and expenses associated with our broadcast of the 2016 Rio Olympics were reported in our Cable Networks and Broadcast Television segments. The revenue and operating costs and expenses associated with our broadcast of the 2015 Super Bowl were reported in our Broadcast Television segment.
|
|
(f)
|
Revenue from customers located outside of the United States, primarily in Europe and Asia, in
2017
,
2016
and
2015
was
$7.8 billion
,
$6.5 billion
and
$5.8 billion
, respectively.
No single customer accounted for a significant amount of revenue in any of the periods presented.
|
|
(g)
|
We use Adjusted EBITDA as the measure of profit or loss for our operating segments. Adjusted EBITDA is defined as net income attributable to Comcast Corporation before net (income) loss attributable to noncontrolling interests and redeemable subsidiary preferred stock, income tax benefit (expense), total other income (expense), depreciation and amortization expense, and other operating gains, and excluding impairment charges related to fixed and intangible assets and gains or losses on the sale of long-lived assets, if any. From time to time we may exclude from Adjusted EBITDA the impact of events, gains, losses or other charges (such as significant legal settlements) that affect the period-to-period comparability of our operating performance. This measure eliminates the significant level of noncash depreciation and amortization expense that results from the capital-intensive nature of certain of our businesses and from intangible assets recognized in business combinations. Additionally, it is unaffected by our capital and tax structures and by our investment activities. We use this measure to evaluate the operating performance of our operating segments and to allocate resources and capital to our operating segments. It is also a significant performance measure in our annual incentive compensation programs. We believe that this measure is useful to investors because it is one of the bases for comparing our operating performance with that of other companies in our industries, although our measure may not be directly comparable to similar measures used by other companies. This measure should not be considered a substitute for operating income (loss), net income (loss), net income (loss) attributable to Comcast Corporation, net cash provided by operating activities, or other measures we have reported in accordance with GAAP. Our reconciliation of the aggregate amount of Adjusted EBITDA for our reportable segments to consolidated income before income taxes is presented in the table below.
|
|
Year ended December 31 (in millions)
|
2017
|
|
2016
|
|
2015
|
|
|||
|
Adjusted EBITDA
|
$
|
28,062
|
|
$
|
26,417
|
|
$
|
24,678
|
|
|
Adjustment for legal settlement
|
(250
|
)
|
—
|
|
—
|
|
|||
|
Depreciation
|
(7,914
|
)
|
(7,464
|
)
|
(6,781
|
)
|
|||
|
Amortization
|
(2,353
|
)
|
(2,094
|
)
|
(1,899
|
)
|
|||
|
Other operating gains
|
442
|
|
—
|
|
—
|
|
|||
|
Total other income (expense)
|
(2,665
|
)
|
(2,506
|
)
|
(2,626
|
)
|
|||
|
Income before income taxes
|
$
|
15,322
|
|
$
|
14,353
|
|
$
|
13,372
|
|
|
92
|
Comcast 2017 Annual Report on Form 10-K
|
|
Comcast Corporation
|
|
|
(in millions, except per share data)
|
First
Quarter |
|
Second
Quarter |
|
Third
Quarter |
|
Fourth
Quarter |
|
Total
Year |
|
|||||
|
2017
|
|||||||||||||||
|
Revenue
|
$
|
20,463
|
|
$
|
21,165
|
|
$
|
20,983
|
|
$
|
21,915
|
|
$
|
84,526
|
|
|
Operating income
|
$
|
4,530
|
|
$
|
4,558
|
|
$
|
4,792
|
|
$
|
4,107
|
|
$
|
17,987
|
|
|
Net income attributable to Comcast Corporation
(a)
|
$
|
2,566
|
|
$
|
2,513
|
|
$
|
2,650
|
|
$
|
14,985
|
|
$
|
22,714
|
|
|
Basic earnings per common share attributable to Comcast Corporation shareholders
|
$
|
0.54
|
|
$
|
0.53
|
|
$
|
0.56
|
|
$
|
3.22
|
|
$
|
4.82
|
|
|
Diluted earnings per common share attributable to Comcast Corporation shareholders
|
$
|
0.53
|
|
$
|
0.52
|
|
$
|
0.55
|
|
$
|
3.17
|
|
$
|
4.75
|
|
|
Dividends declared per common share
|
$
|
0.1575
|
|
$
|
0.1575
|
|
$
|
0.1575
|
|
$
|
0.1575
|
|
$
|
0.63
|
|
|
2016
|
|||||||||||||||
|
Revenue
|
$
|
18,790
|
|
$
|
19,269
|
|
$
|
21,319
|
|
$
|
21,025
|
|
$
|
80,403
|
|
|
Operating income
|
$
|
4,089
|
|
$
|
4,066
|
|
$
|
4,440
|
|
$
|
4,264
|
|
$
|
16,859
|
|
|
Net income attributable to Comcast Corporation
(b)
|
$
|
2,134
|
|
$
|
2,028
|
|
$
|
2,237
|
|
$
|
2,296
|
|
$
|
8,695
|
|
|
Basic earnings per common share attributable to Comcast Corporation shareholders
|
$
|
0.44
|
|
$
|
0.42
|
|
$
|
0.47
|
|
$
|
0.48
|
|
$
|
1.80
|
|
|
Diluted earnings per common share attributable to Comcast Corporation shareholders
|
$
|
0.43
|
|
$
|
0.41
|
|
$
|
0.46
|
|
$
|
0.48
|
|
$
|
1.78
|
|
|
Dividends declared per common share
|
$
|
0.1375
|
|
$
|
0.1375
|
|
$
|
0.1375
|
|
$
|
0.1375
|
|
$
|
0.55
|
|
Minor differences may exist due to rounding.
|
(a)
|
In the fourth quarter of 2017, net income attributable to Comcast Corporation included a
$12.7 billion
net income tax benefit as a result of the impacts of the 2017 tax reform legislation. See Note 14 for additional information.
|
|
(b)
|
In the fourth quarter of 2016, net income attributable to Comcast Corporation included
$225 million
,
$143 million
net of tax, recognized in connection with the settlement of amounts owed to us under an agency agreement that had provided for, among other things, Verizon Wireless’ sale of our cable services.
|
|
|
Comcast (“Comcast Parent”), Comcast Cable Communications, LLC (“CCCL Parent”) and NBCUniversal (“NBCUniversal Media Parent”) have fully and unconditionally guaranteed each other’s debt securities, including the Comcast revolving credit facility. The principal amount of debt securities within the guarantee structure totals
$56.9 billion
, of which
$11.8 billion
will mature within the next
five years
.
Comcast Parent and CCCL Parent also fully and unconditionally guarantee NBCUniversal Enterprise’s
$4.8 billion
aggregate principal amount of senior notes,
$1.5 billion
revolving credit facility and commercial paper program. NBCUniversal Media Parent does not guarantee the NBCUniversal Enterprise senior notes, revolving credit facility or commercial paper program.
Comcast Parent provides a full and unconditional guarantee of the Universal Studios Japan yen-dominated
¥435 billion
term loans with a final maturity of March 2022. Comcast Parent also provides a full and unconditional subordinated guarantee of the
$185 million
principal amount currently outstanding of Comcast Holdings’ ZONES due
October 2029
. Neither CCCL Parent nor NBCUniversal Media Parent guarantee the Comcast Holdings’ ZONES due October 2029. None of Comcast Parent, CCCL Parent nor NBCUniversal Media Parent guarantee the
$62 million
principal amount currently outstanding of Comcast Holdings’ ZONES due
November 2029
.
|
Comcast 2017 Annual Report on Form 10-K
|
93
|
|
Comcast Corporation
Condensed Consolidating Balance Sheet
|
December 31, 2017 (in millions)
|
Comcast
Parent |
|
Comcast
Holdings |
|
CCCL
Parent |
|
NBCUniversal
Media Parent |
|
Non-
Guarantor Subsidiaries |
|
Elimination
and Consolidation Adjustments |
|
Consolidated
Comcast Corporation |
|
|||||||
|
Assets
|
|||||||||||||||||||||
|
Cash and cash equivalents
|
$
|
—
|
|
$
|
—
|
|
$
|
—
|
|
$
|
496
|
|
$
|
2,932
|
|
$
|
—
|
|
$
|
3,428
|
|
|
Receivables, net
|
—
|
|
—
|
|
—
|
|
—
|
|
8,546
|
|
—
|
|
8,546
|
|
|||||||
|
Programming rights
|
—
|
|
—
|
|
—
|
|
—
|
|
1,613
|
|
—
|
|
1,613
|
|
|||||||
|
Deposits
|
—
|
|
—
|
|
—
|
|
—
|
|
9
|
|
—
|
|
9
|
|
|||||||
|
Other current assets
|
60
|
|
—
|
|
7
|
|
25
|
|
2,372
|
|
—
|
|
2,464
|
|
|||||||
|
Total current assets
|
60
|
|
—
|
|
7
|
|
521
|
|
15,472
|
|
—
|
|
16,060
|
|
|||||||
|
Film and television costs
|
—
|
|
—
|
|
—
|
|
—
|
|
7,076
|
|
—
|
|
7,076
|
|
|||||||
|
Investments
|
146
|
|
21
|
|
108
|
|
693
|
|
5,963
|
|
—
|
|
6,931
|
|
|||||||
|
Investments in and amounts due from subsidiaries eliminated upon consolidation
|
117,154
|
|
142,412
|
|
139,364
|
|
50,249
|
|
113,479
|
|
(562,658
|
)
|
—
|
|
|||||||
|
Property and equipment, net
|
551
|
|
—
|
|
—
|
|
—
|
|
37,919
|
|
—
|
|
38,470
|
|
|||||||
|
Franchise rights
|
—
|
|
—
|
|
—
|
|
—
|
|
59,364
|
|
—
|
|
59,364
|
|
|||||||
|
Goodwill
|
—
|
|
—
|
|
—
|
|
—
|
|
36,780
|
|
—
|
|
36,780
|
|
|||||||
|
Other intangible assets, net
|
12
|
|
—
|
|
—
|
|
—
|
|
18,767
|
|
—
|
|
18,779
|
|
|||||||
|
Other noncurrent assets, net
|
435
|
|
708
|
|
—
|
|
88
|
|
2,572
|
|
(314
|
)
|
3,489
|
|
|||||||
|
Total assets
|
$
|
118,358
|
|
$
|
143,141
|
|
$
|
139,479
|
|
$
|
51,551
|
|
$
|
297,392
|
|
$
|
(562,972
|
)
|
$
|
186,949
|
|
|
Liabilities and Equity
|
|||||||||||||||||||||
|
Accounts payable and accrued expenses related to trade creditors
|
$
|
16
|
|
$
|
—
|
|
$
|
—
|
|
$
|
—
|
|
$
|
6,910
|
|
$
|
—
|
|
$
|
6,926
|
|
|
Accrued participations and residuals
|
—
|
|
—
|
|
—
|
|
—
|
|
1,683
|
|
—
|
|
1,683
|
|
|||||||
|
Deferred revenue
|
—
|
|
—
|
|
—
|
|
—
|
|
1,552
|
|
—
|
|
1,552
|
|
|||||||
|
Accrued expenses and other current liabilities
|
1,888
|
|
92
|
|
333
|
|
326
|
|
3,627
|
|
—
|
|
6,266
|
|
|||||||
|
Current portion of long-term debt
|
2,810
|
|
—
|
|
—
|
|
4
|
|
2,320
|
|
—
|
|
5,134
|
|
|||||||
|
Total current liabilities
|
4,714
|
|
92
|
|
333
|
|
330
|
|
16,092
|
|
—
|
|
21,561
|
|
|||||||
|
Long-term debt, less current portion
|
42,428
|
|
140
|
|
2,100
|
|
7,751
|
|
7,003
|
|
—
|
|
59,422
|
|
|||||||
|
Deferred income taxes
|
—
|
|
285
|
|
—
|
|
67
|
|
24,247
|
|
(343
|
)
|
24,256
|
|
|||||||
|
Other noncurrent liabilities
|
2,610
|
|
—
|
|
—
|
|
1,128
|
|
7,137
|
|
29
|
|
10,904
|
|
|||||||
|
Redeemable noncontrolling interests and redeemable subsidiary preferred stock
|
—
|
|
—
|
|
—
|
|
—
|
|
1,357
|
|
—
|
|
1,357
|
|
|||||||
|
Equity:
|
|||||||||||||||||||||
|
Common stock
|
55
|
|
—
|
|
—
|
|
—
|
|
—
|
|
—
|
|
55
|
|
|||||||
|
Other shareholders’ equity
|
68,551
|
|
142,624
|
|
137,046
|
|
42,275
|
|
240,713
|
|
(562,658
|
)
|
68,551
|
|
|||||||
|
Total Comcast Corporation shareholders’ equity
|
68,606
|
|
142,624
|
|
137,046
|
|
42,275
|
|
240,713
|
|
(562,658
|
)
|
68,606
|
|
|||||||
|
Noncontrolling interests
|
—
|
|
—
|
|
—
|
|
—
|
|
843
|
|
—
|
|
843
|
|
|||||||
|
Total equity
|
68,606
|
|
142,624
|
|
137,046
|
|
42,275
|
|
241,556
|
|
(562,658
|
)
|
69,449
|
|
|||||||
|
Total liabilities and equity
|
$
|
118,358
|
|
$
|
143,141
|
|
$
|
139,479
|
|
$
|
51,551
|
|
$
|
297,392
|
|
$
|
(562,972
|
)
|
$
|
186,949
|
|
|
94
|
Comcast 2017 Annual Report on Form 10-K
|
|
Comcast Corporation
Condensed Consolidating Balance Sheet
|
December 31, 2016 (in millions)
|
Comcast
Parent |
|
Comcast
Holdings |
|
CCCL
Parent |
|
NBCUniversal
Media Parent |
|
Non-
Guarantor Subsidiaries |
|
Elimination
and Consolidation Adjustments |
|
Consolidated
Comcast Corporation |
|
|||||||
|
Assets
|
|||||||||||||||||||||
|
Cash and cash equivalents
|
$
|
—
|
|
$
|
—
|
|
$
|
—
|
|
$
|
482
|
|
$
|
2,819
|
|
$
|
—
|
|
$
|
3,301
|
|
|
Receivables, net
|
—
|
|
—
|
|
—
|
|
—
|
|
7,955
|
|
—
|
|
7,955
|
|
|||||||
|
Programming rights
|
—
|
|
—
|
|
—
|
|
—
|
|
1,250
|
|
—
|
|
1,250
|
|
|||||||
|
Deposits
|
—
|
|
—
|
|
—
|
|
—
|
|
1,772
|
|
—
|
|
1,772
|
|
|||||||
|
Other current assets
|
151
|
|
—
|
|
—
|
|
36
|
|
1,896
|
|
—
|
|
2,083
|
|
|||||||
|
Total current assets
|
151
|
|
—
|
|
—
|
|
518
|
|
15,692
|
|
—
|
|
16,361
|
|
|||||||
|
Film and television costs
|
—
|
|
—
|
|
—
|
|
—
|
|
7,252
|
|
—
|
|
7,252
|
|
|||||||
|
Investments
|
75
|
|
—
|
|
—
|
|
651
|
|
4,521
|
|
—
|
|
5,247
|
|
|||||||
|
Investments in and amounts due from subsidiaries eliminated upon consolidation
|
98,350
|
|
120,071
|
|
117,696
|
|
47,393
|
|
97,704
|
|
(481,214
|
)
|
—
|
|
|||||||
|
Property and equipment, net
|
298
|
|
—
|
|
—
|
|
—
|
|
35,955
|
|
—
|
|
36,253
|
|
|||||||
|
Franchise rights
|
—
|
|
—
|
|
—
|
|
—
|
|
59,364
|
|
—
|
|
59,364
|
|
|||||||
|
Goodwill
|
—
|
|
—
|
|
—
|
|
—
|
|
35,980
|
|
—
|
|
35,980
|
|
|||||||
|
Other intangible assets, net
|
13
|
|
—
|
|
—
|
|
—
|
|
17,261
|
|
—
|
|
17,274
|
|
|||||||
|
Other noncurrent assets, net
|
1,138
|
|
638
|
|
—
|
|
89
|
|
1,921
|
|
(1,017
|
)
|
2,769
|
|
|||||||
|
Total assets
|
$
|
100,025
|
|
$
|
120,709
|
|
$
|
117,696
|
|
$
|
48,651
|
|
$
|
275,650
|
|
$
|
(482,231
|
)
|
$
|
180,500
|
|
|
Liabilities and Equity
|
|||||||||||||||||||||
|
Accounts payable and accrued expenses related to trade creditors
|
$
|
23
|
|
$
|
—
|
|
$
|
—
|
|
$
|
—
|
|
$
|
6,892
|
|
$
|
—
|
|
$
|
6,915
|
|
|
Accrued participations and residuals
|
—
|
|
—
|
|
—
|
|
—
|
|
1,726
|
|
—
|
|
1,726
|
|
|||||||
|
Deferred revenue
|
—
|
|
—
|
|
—
|
|
—
|
|
1,132
|
|
—
|
|
1,132
|
|
|||||||
|
Accrued expenses and other current liabilities
|
1,726
|
|
—
|
|
341
|
|
302
|
|
3,913
|
|
—
|
|
6,282
|
|
|||||||
|
Current portion of long-term debt
|
3,739
|
|
—
|
|
550
|
|
4
|
|
1,187
|
|
—
|
|
5,480
|
|
|||||||
|
Total current liabilities
|
5,488
|
|
—
|
|
891
|
|
306
|
|
14,850
|
|
—
|
|
21,535
|
|
|||||||
|
Long-term debt, less current portion
|
38,123
|
|
141
|
|
2,100
|
|
8,208
|
|
6,994
|
|
—
|
|
55,566
|
|
|||||||
|
Deferred income taxes
|
—
|
|
542
|
|
—
|
|
70
|
|
35,259
|
|
(1,017
|
)
|
34,854
|
|
|||||||
|
Other noncurrent liabilities
|
2,471
|
|
—
|
|
—
|
|
1,166
|
|
7,288
|
|
—
|
|
10,925
|
|
|||||||
|
Redeemable noncontrolling interests and redeemable subsidiary preferred stock
|
—
|
|
—
|
|
—
|
|
—
|
|
1,446
|
|
—
|
|
1,446
|
|
|||||||
|
Equity:
|
|||||||||||||||||||||
|
Common stock
|
56
|
|
—
|
|
—
|
|
—
|
|
—
|
|
—
|
|
56
|
|
|||||||
|
Other shareholders’ equity
|
53,887
|
|
120,026
|
|
114,705
|
|
38,901
|
|
207,582
|
|
(481,214
|
)
|
53,887
|
|
|||||||
|
Total Comcast Corporation shareholders’ equity
|
53,943
|
|
120,026
|
|
114,705
|
|
38,901
|
|
207,582
|
|
(481,214
|
)
|
53,943
|
|
|||||||
|
Noncontrolling interests
|
—
|
|
—
|
|
—
|
|
—
|
|
2,231
|
|
—
|
|
2,231
|
|
|||||||
|
Total equity
|
53,943
|
|
120,026
|
|
114,705
|
|
38,901
|
|
209,813
|
|
(481,214
|
)
|
56,174
|
|
|||||||
|
Total liabilities and equity
|
$
|
100,025
|
|
$
|
120,709
|
|
$
|
117,696
|
|
$
|
48,651
|
|
$
|
275,650
|
|
$
|
(482,231
|
)
|
$
|
180,500
|
|
|
Comcast 2017 Annual Report on Form 10-K
|
95
|
|
Comcast Corporation
Condensed Consolidating Statement of Income
|
For the Year Ended December 31, 2017 (in millions)
|
Comcast
Parent |
|
Comcast
Holdings |
|
CCCL
Parent |
|
NBCUniversal
Media Parent |
|
Non-
Guarantor Subsidiaries |
|
Elimination
and Consolidation Adjustments |
|
Consolidated
Comcast Corporation |
|
|||||||
|
Revenue:
|
|||||||||||||||||||||
|
Service revenue
|
$
|
—
|
|
$
|
—
|
|
$
|
—
|
|
$
|
—
|
|
$
|
84,526
|
|
$
|
—
|
|
$
|
84,526
|
|
|
Management fee revenue
|
1,128
|
|
—
|
|
1,109
|
|
—
|
|
—
|
|
(2,237
|
)
|
—
|
|
|||||||
|
Total revenue
|
1,128
|
|
—
|
|
1,109
|
|
—
|
|
84,526
|
|
(2,237
|
)
|
84,526
|
|
|||||||
|
Costs and Expenses:
|
|||||||||||||||||||||
|
Programming and production
|
—
|
|
—
|
|
—
|
|
—
|
|
25,384
|
|
—
|
|
25,384
|
|
|||||||
|
Other operating and administrative
|
766
|
|
—
|
|
1,109
|
|
1,044
|
|
24,331
|
|
(2,237
|
)
|
25,013
|
|
|||||||
|
Advertising, marketing and promotion
|
—
|
|
—
|
|
—
|
|
—
|
|
6,317
|
|
—
|
|
6,317
|
|
|||||||
|
Depreciation
|
31
|
|
—
|
|
—
|
|
—
|
|
7,883
|
|
—
|
|
7,914
|
|
|||||||
|
Amortization
|
6
|
|
—
|
|
—
|
|
—
|
|
2,347
|
|
—
|
|
2,353
|
|
|||||||
|
Other operating gains
|
—
|
|
—
|
|
—
|
|
—
|
|
(442
|
)
|
—
|
|
(442
|
)
|
|||||||
|
Total costs and expenses
|
803
|
|
—
|
|
1,109
|
|
1,044
|
|
65,820
|
|
(2,237
|
)
|
66,539
|
|
|||||||
|
Operating income (loss)
|
325
|
|
—
|
|
—
|
|
(1,044
|
)
|
18,706
|
|
—
|
|
17,987
|
|
|||||||
|
Other Income (Expense):
|
|||||||||||||||||||||
|
Interest expense
|
(2,172
|
)
|
(12
|
)
|
(207
|
)
|
(456
|
)
|
(239
|
)
|
—
|
|
(3,086
|
)
|
|||||||
|
Investment income (loss), net
|
(1
|
)
|
109
|
|
—
|
|
(197
|
)
|
342
|
|
—
|
|
253
|
|
|||||||
|
Equity in net income (losses) of investees, net
|
24,056
|
|
21,622
|
|
19,570
|
|
6,740
|
|
5,191
|
|
(77,072
|
)
|
107
|
|
|||||||
|
Other income (expense), net
|
—
|
|
—
|
|
—
|
|
45
|
|
16
|
|
—
|
|
61
|
|
|||||||
|
Total other income (expense)
|
21,883
|
|
21,719
|
|
19,363
|
|
6,132
|
|
5,310
|
|
(77,072
|
)
|
(2,665
|
)
|
|||||||
|
Income (loss) before income taxes
|
22,208
|
|
21,719
|
|
19,363
|
|
5,088
|
|
24,016
|
|
(77,072
|
)
|
15,322
|
|
|||||||
|
Income tax (expense) benefit
|
506
|
|
156
|
|
71
|
|
(4
|
)
|
6,849
|
|
—
|
|
7,578
|
|
|||||||
|
Net income (loss)
|
22,714
|
|
21,875
|
|
19,434
|
|
5,084
|
|
30,865
|
|
(77,072
|
)
|
22,900
|
|
|||||||
|
Net (income) loss attributable to noncontrolling interests and redeemable subsidiary preferred stock
|
—
|
|
—
|
|
—
|
|
—
|
|
(186
|
)
|
—
|
|
(186
|
)
|
|||||||
|
Net income (loss) attributable to Comcast Corporation
|
$
|
22,714
|
|
$
|
21,875
|
|
$
|
19,434
|
|
$
|
5,084
|
|
$
|
30,679
|
|
$
|
(77,072
|
)
|
$
|
22,714
|
|
|
Comprehensive income (loss) attributable to Comcast Corporation
|
$
|
22,801
|
|
$
|
21,873
|
|
$
|
19,437
|
|
$
|
5,058
|
|
$
|
30,541
|
|
$
|
(76,909
|
)
|
$
|
22,801
|
|
|
96
|
Comcast 2017 Annual Report on Form 10-K
|
|
Comcast Corporation
Condensed Consolidating Statement of Income
|
For the Year Ended December 31, 2016 (in millions)
|
Comcast
Parent |
|
Comcast
Holdings |
|
CCCL
Parent |
|
NBCUniversal
Media Parent |
|
Non-
Guarantor Subsidiaries |
|
Elimination
and Consolidation Adjustments |
|
Consolidated
Comcast Corporation |
|
|||||||
|
Revenue:
|
|||||||||||||||||||||
|
Service revenue
|
$
|
—
|
|
$
|
—
|
|
$
|
—
|
|
$
|
—
|
|
$
|
80,403
|
|
$
|
—
|
|
$
|
80,403
|
|
|
Management fee revenue
|
1,067
|
|
—
|
|
1,049
|
|
—
|
|
—
|
|
(2,116
|
)
|
—
|
|
|||||||
|
Total revenue
|
1,067
|
|
—
|
|
1,049
|
|
—
|
|
80,403
|
|
(2,116
|
)
|
80,403
|
|
|||||||
|
Costs and Expenses:
|
|||||||||||||||||||||
|
Programming and production
|
—
|
|
—
|
|
—
|
|
—
|
|
24,463
|
|
—
|
|
24,463
|
|
|||||||
|
Other operating and administrative
|
813
|
|
—
|
|
1,049
|
|
932
|
|
22,738
|
|
(2,116
|
)
|
23,416
|
|
|||||||
|
Advertising, marketing and promotion
|
—
|
|
—
|
|
—
|
|
—
|
|
6,107
|
|
—
|
|
6,107
|
|
|||||||
|
Depreciation
|
28
|
|
—
|
|
—
|
|
—
|
|
7,436
|
|
—
|
|
7,464
|
|
|||||||
|
Amortization
|
6
|
|
—
|
|
—
|
|
—
|
|
2,088
|
|
—
|
|
2,094
|
|
|||||||
|
Other operating gains
|
—
|
|
—
|
|
—
|
|
—
|
|
—
|
|
—
|
|
—
|
|
|||||||
|
Total costs and expenses
|
847
|
|
—
|
|
1,049
|
|
932
|
|
62,832
|
|
(2,116
|
)
|
63,544
|
|
|||||||
|
Operating income (loss)
|
220
|
|
—
|
|
—
|
|
(932
|
)
|
17,571
|
|
—
|
|
16,859
|
|
|||||||
|
Other Income (Expense):
|
|||||||||||||||||||||
|
Interest expense
|
(1,941
|
)
|
(12
|
)
|
(239
|
)
|
(456
|
)
|
(294
|
)
|
—
|
|
(2,942
|
)
|
|||||||
|
Investment income (loss), net
|
7
|
|
(5
|
)
|
—
|
|
(25
|
)
|
236
|
|
—
|
|
213
|
|
|||||||
|
Equity in net income (losses) of investees, net
|
9,809
|
|
9,286
|
|
8,679
|
|
5,545
|
|
4,131
|
|
(37,554
|
)
|
(104
|
)
|
|||||||
|
Other income (expense), net
|
—
|
|
—
|
|
—
|
|
116
|
|
211
|
|
—
|
|
327
|
|
|||||||
|
Total other income (expense)
|
7,875
|
|
9,269
|
|
8,440
|
|
5,180
|
|
4,284
|
|
(37,554
|
)
|
(2,506
|
)
|
|||||||
|
Income (loss) before income taxes
|
8,095
|
|
9,269
|
|
8,440
|
|
4,248
|
|
21,855
|
|
(37,554
|
)
|
14,353
|
|
|||||||
|
Income tax (expense) benefit
|
600
|
|
6
|
|
84
|
|
(13
|
)
|
(5,985
|
)
|
—
|
|
(5,308
|
)
|
|||||||
|
Net income (loss)
|
8,695
|
|
9,275
|
|
8,524
|
|
4,235
|
|
15,870
|
|
(37,554
|
)
|
9,045
|
|
|||||||
|
Net (income) loss attributable to noncontrolling interests and redeemable subsidiary preferred stock
|
—
|
|
—
|
|
—
|
|
—
|
|
(350
|
)
|
—
|
|
(350
|
)
|
|||||||
|
Net income (loss) attributable to Comcast Corporation
|
$
|
8,695
|
|
$
|
9,275
|
|
$
|
8,524
|
|
$
|
4,235
|
|
$
|
15,520
|
|
$
|
(37,554
|
)
|
$
|
8,695
|
|
|
Comprehensive income (loss) attributable to Comcast Corporation
|
$
|
8,967
|
|
$
|
9,317
|
|
$
|
8,530
|
|
$
|
4,312
|
|
$
|
15,610
|
|
$
|
(37,769
|
)
|
$
|
8,967
|
|
|
Comcast 2017 Annual Report on Form 10-K
|
97
|
|
Comcast Corporation
Condensed Consolidating Statement of Income
|
For the Year Ended December 31, 2015 (in millions)
|
Comcast
Parent |
|
Comcast
Holdings |
|
CCCL
Parent |
|
NBCUniversal
Media Parent |
|
Non-
Guarantor Subsidiaries |
|
Elimination
and Consolidation Adjustments |
|
Consolidated
Comcast Corporation |
|
|||||||
|
Revenue:
|
|||||||||||||||||||||
|
Service revenue
|
$
|
—
|
|
$
|
—
|
|
$
|
—
|
|
$
|
—
|
|
$
|
74,510
|
|
$
|
—
|
|
$
|
74,510
|
|
|
Management fee revenue
|
1,005
|
|
—
|
|
977
|
|
—
|
|
—
|
|
(1,982
|
)
|
—
|
|
|||||||
|
Total revenue
|
1,005
|
|
—
|
|
977
|
|
—
|
|
74,510
|
|
(1,982
|
)
|
74,510
|
|
|||||||
|
Costs and Expenses:
|
|||||||||||||||||||||
|
Programming and production
|
—
|
|
—
|
|
—
|
|
—
|
|
22,550
|
|
—
|
|
22,550
|
|
|||||||
|
Other operating and administrative
|
760
|
|
—
|
|
977
|
|
922
|
|
20,648
|
|
(1,982
|
)
|
21,325
|
|
|||||||
|
Advertising, marketing and promotion
|
—
|
|
—
|
|
—
|
|
—
|
|
5,957
|
|
—
|
|
5,957
|
|
|||||||
|
Depreciation
|
31
|
|
—
|
|
—
|
|
—
|
|
6,750
|
|
—
|
|
6,781
|
|
|||||||
|
Amortization
|
6
|
|
—
|
|
—
|
|
—
|
|
1,893
|
|
—
|
|
1,899
|
|
|||||||
|
Other operating gains
|
—
|
|
—
|
|
—
|
|
—
|
|
—
|
|
—
|
|
—
|
|
|||||||
|
Total costs and expenses
|
797
|
|
—
|
|
977
|
|
922
|
|
57,798
|
|
(1,982
|
)
|
58,512
|
|
|||||||
|
Operating income (loss)
|
208
|
|
—
|
|
—
|
|
(922
|
)
|
16,712
|
|
—
|
|
15,998
|
|
|||||||
|
Other Income (Expense):
|
|||||||||||||||||||||
|
Interest expense
|
(1,744
|
)
|
(12
|
)
|
(270
|
)
|
(462
|
)
|
(214
|
)
|
—
|
|
(2,702
|
)
|
|||||||
|
Investment income (loss), net
|
6
|
|
(1
|
)
|
—
|
|
(19
|
)
|
95
|
|
—
|
|
81
|
|
|||||||
|
Equity in net income (losses) of investees, net
|
9,159
|
|
8,651
|
|
8,040
|
|
4,852
|
|
3,089
|
|
(34,116
|
)
|
(325
|
)
|
|||||||
|
Other income (expense), net
|
(3
|
)
|
—
|
|
—
|
|
(31
|
)
|
354
|
|
—
|
|
320
|
|
|||||||
|
Total other income (expense)
|
7,418
|
|
8,638
|
|
7,770
|
|
4,340
|
|
3,324
|
|
(34,116
|
)
|
(2,626
|
)
|
|||||||
|
Income (loss) before income taxes
|
7,626
|
|
8,638
|
|
7,770
|
|
3,418
|
|
20,036
|
|
(34,116
|
)
|
13,372
|
|
|||||||
|
Income tax (expense) benefit
|
537
|
|
4
|
|
94
|
|
(4
|
)
|
(5,590
|
)
|
—
|
|
(4,959
|
)
|
|||||||
|
Net income (loss)
|
8,163
|
|
8,642
|
|
7,864
|
|
3,414
|
|
14,446
|
|
(34,116
|
)
|
8,413
|
|
|||||||
|
Net (income) loss attributable to noncontrolling interests and redeemable subsidiary preferred stock
|
—
|
|
—
|
|
—
|
|
—
|
|
(250
|
)
|
—
|
|
(250
|
)
|
|||||||
|
Net income (loss) attributable to Comcast Corporation
|
$
|
8,163
|
|
$
|
8,642
|
|
$
|
7,864
|
|
$
|
3,414
|
|
$
|
14,196
|
|
$
|
(34,116
|
)
|
$
|
8,163
|
|
|
Comprehensive income (loss) attributable to Comcast Corporation
|
$
|
8,135
|
|
$
|
8,625
|
|
$
|
7,864
|
|
$
|
3,361
|
|
$
|
14,192
|
|
$
|
(34,042
|
)
|
$
|
8,135
|
|
|
98
|
Comcast 2017 Annual Report on Form 10-K
|
|
Comcast Corporation
Condensed Consolidating Statement of Cash Flows
|
For the Year Ended December 31, 2017 (in millions)
|
Comcast
Parent |
|
Comcast
Holdings |
|
CCCL
Parent |
|
NBCUniversal
Media Parent |
|
Non-
Guarantor Subsidiaries |
|
Elimination
and Consolidation Adjustments |
|
Consolidated
Comcast Corporation |
|
|||||||
|
Net cash provided by (used in) operating activities
|
$
|
151
|
|
$
|
15
|
|
$
|
(147
|
)
|
$
|
(1,439
|
)
|
$
|
22,823
|
|
$
|
—
|
|
$
|
21,403
|
|
|
Investing Activities:
|
|||||||||||||||||||||
|
Net transactions with affiliates
|
5,578
|
|
(5
|
)
|
757
|
|
1,447
|
|
(7,777
|
)
|
—
|
|
—
|
|
|||||||
|
Capital expenditures
|
(12
|
)
|
—
|
|
—
|
|
—
|
|
(9,538
|
)
|
—
|
|
(9,550
|
)
|
|||||||
|
Cash paid for intangible assets
|
(4
|
)
|
—
|
|
—
|
|
—
|
|
(1,743
|
)
|
—
|
|
(1,747
|
)
|
|||||||
|
Acquisitions and construction of real estate properties
|
(267
|
)
|
—
|
|
—
|
|
—
|
|
(151
|
)
|
—
|
|
(418
|
)
|
|||||||
|
Acquisitions, net of cash acquired
|
—
|
|
—
|
|
—
|
|
—
|
|
(532
|
)
|
—
|
|
(532
|
)
|
|||||||
|
Proceeds from sales of businesses and investments
|
—
|
|
—
|
|
—
|
|
14
|
|
136
|
|
—
|
|
150
|
|
|||||||
|
Purchases of investments
|
(70
|
)
|
(10
|
)
|
(60
|
)
|
(62
|
)
|
(2,090
|
)
|
—
|
|
(2,292
|
)
|
|||||||
|
Deposits
|
—
|
|
—
|
|
—
|
|
—
|
|
—
|
|
—
|
|
—
|
|
|||||||
|
Other
|
101
|
|
—
|
|
—
|
|
58
|
|
526
|
|
—
|
|
685
|
|
|||||||
|
Net cash provided by (used in) investing activities
|
5,326
|
|
(15
|
)
|
697
|
|
1,457
|
|
(21,169
|
)
|
—
|
|
(13,704
|
)
|
|||||||
|
Financing Activities:
|
|||||||||||||||||||||
|
Proceeds from (repayments of) short-term borrowings, net
|
(837
|
)
|
—
|
|
—
|
|
—
|
|
(1,068
|
)
|
—
|
|
(1,905
|
)
|
|||||||
|
Proceeds from borrowings
|
5,997
|
|
—
|
|
—
|
|
—
|
|
5,469
|
|
—
|
|
11,466
|
|
|||||||
|
Repurchases and repayments of debt
|
(2,288
|
)
|
—
|
|
(550
|
)
|
(4
|
)
|
(3,522
|
)
|
—
|
|
(6,364
|
)
|
|||||||
|
Repurchases of common stock under repurchase program and employee plans
|
(5,435
|
)
|
—
|
|
—
|
|
—
|
|
—
|
|
—
|
|
(5,435
|
)
|
|||||||
|
Dividends paid
|
(2,883
|
)
|
—
|
|
—
|
|
—
|
|
—
|
|
—
|
|
(2,883
|
)
|
|||||||
|
Purchase of Universal Studios Japan noncontrolling interests
|
—
|
|
—
|
|
—
|
|
—
|
|
(2,299
|
)
|
—
|
|
(2,299
|
)
|
|||||||
|
Issuances of common stock
|
—
|
|
—
|
|
—
|
|
—
|
|
—
|
|
—
|
|
—
|
|
|||||||
|
Distributions to noncontrolling interests and dividends for redeemable subsidiary preferred stock
|
—
|
|
—
|
|
—
|
|
—
|
|
(252
|
)
|
—
|
|
(252
|
)
|
|||||||
|
Other
|
(31
|
)
|
—
|
|
—
|
|
—
|
|
131
|
|
—
|
|
100
|
|
|||||||
|
Net cash provided by (used in) financing activities
|
(5,477
|
)
|
—
|
|
(550
|
)
|
(4
|
)
|
(1,541
|
)
|
—
|
|
(7,572
|
)
|
|||||||
|
Increase (decrease) in cash and cash equivalents
|
—
|
|
—
|
|
—
|
|
14
|
|
113
|
|
—
|
|
127
|
|
|||||||
|
Cash and cash equivalents, beginning of year
|
—
|
|
—
|
|
—
|
|
482
|
|
2,819
|
|
—
|
|
3,301
|
|
|||||||
|
Cash and cash equivalents, end of year
|
$
|
—
|
|
$
|
—
|
|
$
|
—
|
|
$
|
496
|
|
$
|
2,932
|
|
$
|
—
|
|
$
|
3,428
|
|
|
Comcast 2017 Annual Report on Form 10-K
|
99
|
|
Comcast Corporation
Condensed Consolidating Statement of Cash Flows
|
For the Year Ended December 31, 2016 (in millions)
|
Comcast
Parent |
|
Comcast
Holdings |
|
CCCL
Parent |
|
NBCUniversal
Media Parent |
|
Non-
Guarantor Subsidiaries |
|
Elimination
and Consolidation Adjustments |
|
Consolidated
Comcast Corporation |
|
|||||||
|
Net cash provided by (used in) operating activities
|
$
|
(747
|
)
|
$
|
(189
|
)
|
$
|
(100
|
)
|
$
|
(1,453
|
)
|
$
|
22,314
|
|
$
|
—
|
|
$
|
19,825
|
|
|
Investing Activities:
|
|||||||||||||||||||||
|
Net transactions with affiliates
|
(860
|
)
|
189
|
|
100
|
|
2,642
|
|
(2,071
|
)
|
—
|
|
—
|
|
|||||||
|
Capital expenditures
|
(13
|
)
|
—
|
|
—
|
|
—
|
|
(9,122
|
)
|
—
|
|
(9,135
|
)
|
|||||||
|
Cash paid for intangible assets
|
(9
|
)
|
—
|
|
—
|
|
—
|
|
(1,677
|
)
|
—
|
|
(1,686
|
)
|
|||||||
|
Acquisitions and construction of real estate properties
|
(35
|
)
|
—
|
|
—
|
|
—
|
|
(393
|
)
|
—
|
|
(428
|
)
|
|||||||
|
Acquisitions, net of cash acquired
|
—
|
|
—
|
|
—
|
|
—
|
|
(3,929
|
)
|
—
|
|
(3,929
|
)
|
|||||||
|
Proceeds from sales of businesses and investments
|
—
|
|
—
|
|
—
|
|
104
|
|
114
|
|
—
|
|
218
|
|
|||||||
|
Purchases of investments
|
(40
|
)
|
—
|
|
—
|
|
(210
|
)
|
(1,447
|
)
|
—
|
|
(1,697
|
)
|
|||||||
|
Deposits
|
—
|
|
—
|
|
—
|
|
—
|
|
(1,749
|
)
|
—
|
|
(1,749
|
)
|
|||||||
|
Other
|
(108
|
)
|
—
|
|
—
|
|
(35
|
)
|
164
|
|
—
|
|
21
|
|
|||||||
|
Net cash provided by (used in) investing activities
|
(1,065
|
)
|
189
|
|
100
|
|
2,501
|
|
(20,110
|
)
|
—
|
|
(18,385
|
)
|
|||||||
|
Financing Activities:
|
|||||||||||||||||||||
|
Proceeds from (repayments of) short-term borrowings, net
|
1,339
|
|
—
|
|
—
|
|
—
|
|
451
|
|
—
|
|
1,790
|
|
|||||||
|
Proceeds from borrowings
|
9,231
|
|
—
|
|
—
|
|
—
|
|
—
|
|
—
|
|
9,231
|
|
|||||||
|
Repurchases and repayments of debt
|
(750
|
)
|
—
|
|
—
|
|
(1,005
|
)
|
(1,297
|
)
|
—
|
|
(3,052
|
)
|
|||||||
|
Repurchases of common stock under repurchase program and employee plans
|
(5,352
|
)
|
—
|
|
—
|
|
—
|
|
—
|
|
—
|
|
(5,352
|
)
|
|||||||
|
Dividends paid
|
(2,601
|
)
|
—
|
|
—
|
|
—
|
|
—
|
|
—
|
|
(2,601
|
)
|
|||||||
|
Issuances of common stock
|
23
|
|
—
|
|
—
|
|
—
|
|
—
|
|
—
|
|
23
|
|
|||||||
|
Distributions to noncontrolling interests and dividends for redeemable subsidiary preferred stock
|
—
|
|
—
|
|
—
|
|
—
|
|
(253
|
)
|
—
|
|
(253
|
)
|
|||||||
|
Other
|
(78
|
)
|
—
|
|
—
|
|
25
|
|
(167
|
)
|
—
|
|
(220
|
)
|
|||||||
|
Net cash provided by (used in) financing activities
|
1,812
|
|
—
|
|
—
|
|
(980
|
)
|
(1,266
|
)
|
—
|
|
(434
|
)
|
|||||||
|
Increase (decrease) in cash and cash equivalents
|
—
|
|
—
|
|
—
|
|
68
|
|
938
|
|
—
|
|
1,006
|
|
|||||||
|
Cash and cash equivalents, beginning of year
|
—
|
|
—
|
|
—
|
|
414
|
|
1,881
|
|
—
|
|
2,295
|
|
|||||||
|
Cash and cash equivalents, end of year
|
$
|
—
|
|
$
|
—
|
|
$
|
—
|
|
$
|
482
|
|
$
|
2,819
|
|
$
|
—
|
|
$
|
3,301
|
|
|
100
|
Comcast 2017 Annual Report on Form 10-K
|
|
Comcast Corporation
Condensed Consolidating Statement of Cash Flows
|
For the Year Ended December 31, 2015 (in millions)
|
Comcast
Parent |
|
Comcast
Holdings |
|
CCCL
Parent |
|
NBCUniversal
Media Parent |
|
Non-
Guarantor Subsidiaries |
|
Elimination
and Consolidation Adjustments |
|
Consolidated
Comcast Corporation |
|
|||||||
|
Net cash provided by (used in) operating activities
|
$
|
(85
|
)
|
$
|
48
|
|
$
|
(167
|
)
|
$
|
(1,398
|
)
|
$
|
21,087
|
|
$
|
—
|
|
$
|
19,485
|
|
|
Investing Activities:
|
|||||||||||||||||||||
|
Net transactions with affiliates
|
6,559
|
|
(48
|
)
|
840
|
|
2,839
|
|
(10,190
|
)
|
—
|
|
—
|
|
|||||||
|
Capital expenditures
|
(27
|
)
|
—
|
|
—
|
|
—
|
|
(8,472
|
)
|
—
|
|
(8,499
|
)
|
|||||||
|
Cash paid for intangible assets
|
(6
|
)
|
—
|
|
—
|
|
—
|
|
(1,364
|
)
|
—
|
|
(1,370
|
)
|
|||||||
|
Acquisitions and construction of real estate properties
|
—
|
|
—
|
|
—
|
|
—
|
|
(178
|
)
|
—
|
|
(178
|
)
|
|||||||
|
Acquisitions, net of cash acquired
|
—
|
|
—
|
|
—
|
|
—
|
|
(1,786
|
)
|
—
|
|
(1,786
|
)
|
|||||||
|
Proceeds from sales of businesses and investments
|
—
|
|
—
|
|
—
|
|
4
|
|
429
|
|
—
|
|
433
|
|
|||||||
|
Purchases of investments
|
(7
|
)
|
—
|
|
—
|
|
(407
|
)
|
(370
|
)
|
—
|
|
(784
|
)
|
|||||||
|
Deposits
|
—
|
|
—
|
|
—
|
|
—
|
|
(18
|
)
|
—
|
|
(18
|
)
|
|||||||
|
Other
|
7
|
|
—
|
|
—
|
|
(5
|
)
|
236
|
|
—
|
|
238
|
|
|||||||
|
Net cash provided by (used in) investing activities
|
6,526
|
|
(48
|
)
|
840
|
|
2,431
|
|
(21,713
|
)
|
—
|
|
(11,964
|
)
|
|||||||
|
Financing Activities:
|
|||||||||||||||||||||
|
Proceeds from (repayments of) short-term borrowings, net
|
400
|
|
—
|
|
—
|
|
—
|
|
(265
|
)
|
—
|
|
135
|
|
|||||||
|
Proceeds from borrowings
|
5,486
|
|
—
|
|
—
|
|
—
|
|
—
|
|
—
|
|
5,486
|
|
|||||||
|
Repurchases and repayments of debt
|
(2,650
|
)
|
—
|
|
(673
|
)
|
(1,004
|
)
|
(51
|
)
|
—
|
|
(4,378
|
)
|
|||||||
|
Repurchases of common stock under repurchase program and employee plans
|
(7,175
|
)
|
—
|
|
—
|
|
—
|
|
—
|
|
—
|
|
(7,175
|
)
|
|||||||
|
Dividends paid
|
(2,437
|
)
|
—
|
|
—
|
|
—
|
|
—
|
|
—
|
|
(2,437
|
)
|
|||||||
|
Issuances of common stock
|
36
|
|
—
|
|
—
|
|
—
|
|
—
|
|
—
|
|
36
|
|
|||||||
|
Distributions to noncontrolling interests and dividends for redeemable subsidiary preferred stock
|
—
|
|
—
|
|
—
|
|
—
|
|
(232
|
)
|
—
|
|
(232
|
)
|
|||||||
|
Other
|
(101
|
)
|
—
|
|
—
|
|
—
|
|
(470
|
)
|
—
|
|
(571
|
)
|
|||||||
|
Net cash provided by (used in) financing activities
|
(6,441
|
)
|
—
|
|
(673
|
)
|
(1,004
|
)
|
(1,018
|
)
|
—
|
|
(9,136
|
)
|
|||||||
|
Increase (decrease) in cash and cash equivalents
|
—
|
|
—
|
|
—
|
|
29
|
|
(1,644
|
)
|
—
|
|
(1,615
|
)
|
|||||||
|
Cash and cash equivalents, beginning of year
|
—
|
|
—
|
|
—
|
|
385
|
|
3,525
|
|
—
|
|
3,910
|
|
|||||||
|
Cash and cash equivalents, end of year
|
$
|
—
|
|
$
|
—
|
|
$
|
—
|
|
$
|
414
|
|
$
|
1,881
|
|
$
|
—
|
|
$
|
2,295
|
|
|
Comcast 2017 Annual Report on Form 10-K
|
101
|
|
None.
|
Comcast Corporation
|
Conclusions regarding disclosure controls and procedures
Our principal executive and principal financial officers, after evaluating the effectiveness of
Comcast’s
disclosure controls and procedures (as defined in Exchange Act Rules 13a-15(e) and 15d-15(e)) as of the end of the period covered by this report, have concluded that, based on the evaluation of these controls and procedures required by paragraph (b) of Exchange Act Rules 13a-15 or 15d-15,
Comcast’s
disclosure controls and procedures were effective.
Management’s annual report on internal control over financial reporting
Refer to Management’s Report on Comcast’s Internal Control Over Financial Reporting on page 60.
Attestation report of the registered public accounting firm
Refer to Report of Independent Registered Public Accounting Firm on page 61.
Changes in internal control over financial reporting
There were no changes in
Comcast’s
internal control over financial reporting identified in connection with the evaluation required by paragraph (d) of Exchange Act Rules 13a-15 or 15d-15 that occurred during our last fiscal quarter that have materially affected, or are reasonably likely to materially affect,
Comcast’s
internal control over financial reporting.
|
NBCUniversal Media, LLC
|
Conclusions regarding disclosure controls and procedures
Our principal executive and principal financial officers, after evaluating the effectiveness of
NBCUniversal’s
disclosure controls and procedures (as defined in Exchange Act Rules 13a-15(e) and 15d-15(e)) as of the end of the period covered by this report, have concluded that, based on the evaluation of these controls and procedures required by paragraph (b) of Exchange Act Rules 13a-15 or 15d-15,
NBCUniversal’s
disclosure controls and procedures were effective.
Management’s annual report on internal control over financial reporting
Our management is responsible for establishing and maintaining an adequate system of internal control over financial reporting. Our system of internal control over financial reporting is designed to provide reasonable assurance regarding the reliability of financial reporting and the preparation of financial statements for external purposes in accordance with accounting principles generally accepted in the United States.
Our internal control over financial reporting includes those policies and procedures that:
|
•
|
pertain to the maintenance of records that, in reasonable detail, accurately and fairly reflect our transactions and dispositions of our assets
|
|
•
|
provide reasonable assurance that our transactions are recorded as necessary to permit preparation of our financial statements in accordance with accounting principles generally accepted in the United States, and that our receipts and expenditures are being made only in accordance with authorizations of our management and our directors
|
|
•
|
provide reasonable assurance regarding prevention or timely detection of unauthorized acquisition, use or disposition of our assets that could have a material effect on the financial statements
|
Because of its inherent limitations, a system of internal control over financial reporting can provide only reasonable assurance and may not prevent or detect misstatements. Further, because of changes in conditions, effectiveness of internal control over financial reporting may vary over time. Our system contains self-monitoring mechanisms, and actions are taken to correct deficiencies as they are identified.
Our management conducted an evaluation of the effectiveness of the system of internal control over financial reporting based on the framework in
Internal Control — Integrated Framework
(2013)
issued by the Committee of Sponsoring Organizations of the
|
102
|
Comcast 2017 Annual Report on Form 10-K
|
|
Treadway Commission. Based on this evaluation, our management concluded that NBCUniversal’s system of internal control over financial reporting was effective as of
December 31, 2017
.
Changes in internal control over financial reporting
There were no changes in NBCUniversal’s
internal control over financial reporting identified in connection with the evaluation required by paragraph (d) of Exchange Act Rules 13a-15 or 15d-15 that occurred during our last fiscal quarter that have materially affected, or are reasonably likely to materially affect,
NBCUniversal’s
internal control over financial reporting.
Iran Threat Reduction and Syria Human Rights Act Disclosure
Pursuant to Section 219 of the Iran Threat Reduction and Syria Human Rights Act of 2012, companies are required, among other things, to disclose certain activities, transactions or dealings with the Government of Iran or entities controlled directly or indirectly by the Government of Iran. Disclosure is generally required even where the activities, transactions or dealings are conducted in compliance with applicable laws and regulations and are
de minimis
. As of the date of this report, we are not aware of any activity, transaction or dealing during the year ended
December 31, 2017
that requires disclosure under the Act, except with respect to a January 2016 licensing agreement by a non-U.S. subsidiary of DreamWorks Animation prior to our August 2016 DreamWorks Animation acquisition. The agreement licensed a prior season of a children’s animated television series for a three-year, non-cancelable term and for a one-time fee of $5,200 to a broadcasting company that is owned and controlled by the Government of Iran. The broadcasting company paid the license fee in the first quarter of 2016. We believe that DreamWorks Animation conducted its licensing activity in compliance with applicable laws and that the license is for the permissible exportation of informational materials pursuant to certain statutory and regulatory exemptions from U.S. sanctions.
|
Comcast 2017 Annual Report on Form 10-K
|
103
|
|
|
Comcast
|
Except for the information regarding executive officers required by Item 401 of Regulation S-K, we incorporate the information required by this item by reference to our definitive proxy statement for our annual meeting of shareholders presently scheduled to be held in June 2018. We refer to this proxy statement as the 2018 Proxy Statement.
The term of office of each of our executive officers continues until his successor is selected and qualified or until his earlier death, resignation or removal. The following table sets forth information concerning our executive officers, including their ages, positions and tenure, as of the date of this Annual Report on Form 10-K.
|
Name
|
Age
|
Officer Since
|
Position with Comcast
|
|
Brian L. Roberts
|
58
|
1986
|
Chairman and Chief Executive Officer; President
|
|
Michael J. Cavanagh
|
52
|
2015
|
Senior Executive Vice President; Chief Financial Officer
|
|
Stephen B. Burke
|
59
|
1998
|
Senior Executive Vice President; President and Chief Executive Officer, NBCUniversal Holdings and NBCUniversal
|
|
David L. Cohen
|
62
|
2002
|
Senior Executive Vice President
|
|
David N. Watson
|
58
|
2017
|
Senior Executive Vice President; President and Chief Executive Officer, Comcast Cable
|
|
Arthur R. Block
|
63
|
1993
|
Executive Vice President; General Counsel; Secretary
|
|
Daniel C. Murdock
|
44
|
2017
|
Senior Vice President; Chief Accounting Officer and Controller
|
Brian L. Roberts
has served as a director and as our President, Chief Executive Officer and Chairman of the Board for more than five years. As of
December 31, 2017
, Mr. Roberts had sole voting power over approximately
33
1
/
3
%
of the combined voting power of our two classes of common stock. He is a son of our late founder, Mr. Ralph J. Roberts. Mr. Roberts is also a director of the National Cable and Telecommunications Association.
Michael J. Cavanagh
has served as the Chief Financial Officer of Comcast Corporation since July 2015. Prior to joining our company, Mr. Cavanagh had been Co-President and Co-Chief Operating Officer for The Carlyle Group, a global investment firm, since 2014. Prior to that, Mr. Cavanagh was the Co-Chief Executive Officer of the Corporate & Investment Bank of JPMorgan Chase & Co. from 2012 until 2014; the Chief Executive Officer of JPMorgan Chase & Co.’s Treasury & Securities Services business from 2010 to 2012; and the Chief Financial Officer of JPMorgan Chase & Co. from 2004 to 2010. Mr. Cavanagh is also a director of Yum Brands, Incorporated.
Stephen B. Burke
has served as a Senior Executive Vice President since March 2015 and previously had served as an Executive Vice President for more than five years. In January 2011, Mr. Burke became the President and Chief Executive Officer of NBCUniversal Holdings and NBCUniversal and resigned from his position as our Chief Operating Officer. Mr. Burke also had been the President of Comcast Cable until March 2010. Mr. Burke is also a director of JPMorgan Chase & Co. and Berkshire Hathaway, Incorporated.
David L. Cohen
has served as a Senior Executive Vice President since March 2015 and previously had served as an Executive Vice President for more than five years. Mr. Cohen is also a director of the FS Global Credit Opportunities Funds, the FS Global Credit Opportunities Fund A and the FS Global Credit Opportunities Fund D.
David N. Watson
has served as a Senior Executive Vice President, Comcast Corporation and President and Chief Executive Officer, Comcast Cable since April 2017 and previously had served as Chief Operating Officer, Comcast Cable for more than five years
.
Arthur R. Block
has served as an Executive Vice President since March 2015 and previously had served as a Senior Vice President for more than five years. He has been our General Counsel and Secretary for more than five years.
Daniel C. Murdock
has served as a Senior Vice President and our Chief Accounting Officer and Controller since March 2017. He has been our Controller since July 2015. Prior to joining our company, Mr. Murdock had been with the U.S. Securities and Exchange Commission where he served as the Deputy Chief Accountant in the agency’s Office of the Chief Accountant since 2013. Prior to that, he was Deloitte & Touche’s Audit/Industry Professional Practice Director for media and entertainment.
|
104
|
Comcast 2017 Annual Report on Form 10-K
|
|
|
NBCUniversal
|
Certain information under this Item 10 has been omitted pursuant to General Instruction I(2)(c) to Form 10-K.
The table below sets forth certain information with respect to each of NBCUniversal’s executive officers as of
December 31, 2017
, each of whom has served as such since the close of the NBCUniversal transaction in January 2011, except for Michael J. Cavanagh, who has served since July 2015 and Daniel C. Murdock, who has served since March 2017. The table also sets forth NBCUniversal Holdings’ directors as of
December 31, 2017
.
|
Name
|
Title
|
|
Brian L. Roberts
|
Principal Executive Officer
|
|
Michael J. Cavanagh
|
Principal Financial Officer; Director of NBCUniversal Holdings
|
|
Stephen B. Burke
|
Chief Executive Officer and President
|
|
David L. Cohen
|
Senior Executive Vice President; Director of NBCUniversal Holdings
|
|
Arthur R. Block
|
Executive Vice President; Director of NBCUniversal Holdings
|
|
Daniel C. Murdock
|
Senior Vice President; Principal Accounting Officer
|
For the year ended
December 31, 2017
, NBCUniversal reimbursed Comcast
$49 million
for direct services provided by our executive officers.
Comcast incorporates the information required by this item by reference to its
2018
Proxy Statement.
This information is omitted for NBCUniversal pursuant to General Instruction I(2)(c) to Form 10-K.
Comcast incorporates the information required by this item by reference to its
2018
Proxy Statement.
This information is omitted for NBCUniversal pursuant to General Instruction I(2)(c) to Form 10-K.
Comcast incorporates the information required by this item by reference to its
2018
Proxy Statement.
This information is omitted for NBCUniversal pursuant to General Instruction I(2)(c) to Form 10-K.
Comcast incorporates the information required by this item by reference to its
2018
Proxy Statement.
|
NBCUniversal
|
The Audit Committee of Comcast’s Board of Directors appointed Deloitte & Touche LLP as NBCUniversal’s independent registered public accounting firm for the years ended
December 31, 2017
and
2016
. Set forth below are the fees paid or accrued for the services of Deloitte & Touche LLP, the member firms of Deloitte Touche Tohmatsu and their respective affiliates in
2017
and
2016
.
|
(in millions)
|
2017
|
|
2016
|
|
||
|
Audit fees
|
|
$13.2
|
|
|
$11.0
|
|
|
Audit-related fees
|
0.8
|
|
1.0
|
|
||
|
Tax fees
|
0.3
|
|
0.2
|
|
||
|
All other fees
|
0.1
|
|
—
|
|
||
|
|
|
$14.4
|
|
|
$12.2
|
|
|
Comcast 2017 Annual Report on Form 10-K
|
105
|
|
Audit fees in
2017
and
2016
consisted of fees paid or accrued for services rendered to NBCUniversal and its subsidiaries for the audits of its annual financial statements, reviews of its quarterly financial statements and audit services provided in connection with other statutory or regulatory filings.
Audit-related fees in
2017
and
2016
consisted primarily of fees paid or accrued for audits associated with employee benefit plans, due diligence services and attestation services related to contractual and regulatory compliance.
Tax fees in
2017
and
2016
consisted of fees paid or accrued for domestic and foreign tax compliance services.
All other fees in
2017
primarily consisted of fees paid or accrued for subscription services.
Preapproval Policy of Audit Committee of Services Performed by Independent Auditors
As a consolidated subsidiary of Comcast, NBCUniversal is subject to the policies of Comcast’s Audit Committee regarding the preapproval of services provided by the independent auditors. This policy requires that the Audit Committee preapprove all audit and non-audit services performed by the independent auditors to assure that the services do not impair the auditors’ independence. Unless a type of service has received general preapproval, it requires separate preapproval by the Audit Committee. Even if a service has received general preapproval, if the fee associated with the service exceeds $250,000 in a single engagement or series of related engagements or relates to tax planning, it requires separate preapproval. The Audit Committee has delegated its preapproval authority to its Chair.
|
106
|
Comcast 2017 Annual Report on Form 10-K
|
|
|
Comcast
|
(a) Comcast’s consolidated financial statements are filed as a part of this report on Form 10-K in Item 8, Financial Statements and Supplementary Data, and a list of Comcast’s consolidated financial statements are found on page 59 of this report. Schedule II, Valuation and Qualifying Accounts, is found on page
142
of this report; all other financial statement schedules are omitted because the required information is not applicable, or because the information required is included in the consolidated financial statements and notes thereto.
(b) Exhibits required to be filed by Item 601 of Regulation S-K (all of which are under Commission File No. 001-32871, except as otherwise noted):
|
|
Amended and Restated Articles of Incorporation of Comcast Corporation (incorporated by reference to Exhibit 3.1 to Comcast’s Current Report on Form 8-K filed on December 15, 2015).
|
|
|
|
Amended and Restated By-Laws of Comcast Corporation (incorporated by reference to Exhibit 3.1 to Comcast’s Current Report on Form 8-K filed on May 12, 2017).
|
|
|
|
Specimen Class A Common Stock Certificate (incorporated by reference to Exhibit 4.1 to Comcast’s Annual Report on Form 10-K for the year ended December 31, 2002).
|
|
|
|
Indenture, dated January 7, 2003, between Comcast Corporation, the subsidiary guarantor party thereto, and The Bank of New York Mellon (f/k/a The Bank of New York), as trustee (incorporated by reference to Exhibit 4.4 to Comcast’s Annual Report on Form 10-K for the year ended December 31, 2008).
|
|
|
First Supplemental Indenture, dated March 25, 2003, to the Indenture between Comcast Corporation, the subsidiary guarantors party thereto, and The Bank of New York Mellon (f/k/a The Bank of New York), as trustee, dated January 7, 2003 (incorporated by reference to Exhibit 4.5 to Comcast’s Annual Report on Form 10-K for the year ended December 31, 2008).
|
||
|
|
Second Supplemental Indenture, dated August 31, 2009, to the Indenture between Comcast Corporation, the subsidiary guarantors party thereto, and The Bank of New York Mellon, as Trustee, dated January 7, 2003, as supplemented by a First Supplemental Indenture dated March 25, 2003 (incorporated by reference to Exhibit 4.1 to Comcast’s Current Report on Form 8-K filed on September 2, 2009).
|
|
|
|
Third Supplemental Indenture, dated March 27, 2013, to the Indenture between Comcast Corporation, the subsidiary guarantors party thereto, and The Bank of New York Mellon (f/k/a The Bank of New York), as trustee, dated January 7, 2003, as supplemented by a First Supplemental Indenture dated March 25, 2003 and a second Supplemental Indenture dated August 31, 2009 (incorporated by reference to Exhibit 4.4 to Comcast’s Quarterly Report on Form 10-Q for the quarter ended March 31, 2013).
|
|
|
|
Fourth Supplemental Indenture, dated October 1, 2015, to the Indenture dated January 7, 2003 between Comcast Corporation, the subsidiary guarantors party thereto, and The Bank of New York Mellon (f/k/a The Bank of New York), as trustee, as supplemented by a First Supplemental Indenture dated March 25, 2003, a second Supplemental Indenture dated August 31, 2009 and a third Supplemental Indenture dated March 27, 2013 (incorporated by reference to Exhibit 4.1 to Comcast’s Quarterly Report on Form 10-Q for the quarter ended September 30, 2015).
|
|
|
|
Senior Indenture dated September 18, 2013, among Comcast Corporation, the guarantors party thereto and The Bank of New York Mellon, as trustee (incorporated by reference to Exhibit 4.3 to Comcast’s Registration Statement on Form S-3 filed September 18, 2013).
|
|
|
|
First Supplemental Indenture dated as of November 17, 2015, to the Senior Indenture dated September 18, 2013, among Comcast Corporation, the guarantors party thereto, and The Bank of New York Mellon, as trustee (incorporated by reference to Exhibit 4.4 to Post Effective Amendment No. 2 to Comcast’s Registration Statement on Form S-3 filed November 23, 2015).
|
|
|
|
Indenture, dated as of April 30, 2010, between NBC Universal, Inc. (n/k/a NBCUniversal Media, LLC) and The Bank of New York Mellon, as trustee (incorporated by reference to Exhibit 4 to the Registration Statement on Form S-4 of NBCUniversal Media, LLC (Commission File No. 333-174175) filed on May 13, 2011).
|
|
|
|
First Supplemental Indenture, dated March 27, 2013, to the Indenture between NBCUniversal Media, LLC (f/k/a NBC Universal, Inc.) and The Bank of New York Mellon, as trustee, dated April 30, 2010 (incorporated by reference to Exhibit 4.3 to Comcast’s Quarterly Report on Form 10-Q for the quarter ended March 31, 2013).
|
|
|
Comcast 2017 Annual Report on Form 10-K
|
107
|
|
|
|
Second Supplemental Indenture, dated October 1, 2015, to the Indenture dated April 30, 2010 between NBC Universal, Inc. (n/k/a NBCUniversal Media, LLC) and The Bank of New York Mellon, as trustee, as supplemented by a First Supplemental Indenture dated March 27, 2013 (incorporated by reference to Exhibit 4.2 to Comcast’s Quarterly Report on Form 10-Q for the quarter ended September 30, 2015).
|
|
|
|
Indenture, dated March 19, 2013, among NBCUniversal Enterprise, Inc. (f/k/a Navy Holdings, Inc.), Comcast Corporation, the Cable Guarantors party thereto, and The Bank of New York Mellon, as trustee (incorporated by reference to Exhibit 4.1 to Comcast’s Quarterly Report on Form 10-Q for the quarter ended March 31, 2013).
|
|
|
|
Certain instruments defining the rights of holders of long-term obligation of the registrant and certain of its subsidiaries (the total amount of securities authorized under each of which does not exceed ten percent of the total assets of the registrant and its subsidiaries on a consolidated basis), are omitted pursuant to Item 601(b)(4)(iii)(A) of Regulation S-K. We agree to furnish copies of any such instruments to the SEC upon request.
|
|
|
|
Credit Agreement dated as of May 26, 2016, among Comcast Corporation, the financial institutions party thereto, JPMorgan Chase Bank, N.A., as administrative agent, Citibank, N.A., as syndication agent, Morgan Stanley MUFG Partners, LLC, Wells Fargo Bank, National Association and Mizuho Bank, Ltd., as co-documentation agents (incorporated by reference to exhibit 10.1 to Comcast’s Current Report on Form 8-K filed on May 31, 2016).
|
|
|
|
Second Amended and Restated Certificate of Incorporation of NBCUniversal Enterprise, Inc. (f/k/a/ Navy Holdings, Inc.), dated March 19, 2013 (incorporated by reference to Exhibit 10.3 to Comcast’s Quarterly Report on Form 10-Q for the quarter ended March 31, 2013).
|
|
|
|
Certificate of Designations for Series A Cumulative Preferred Stock of NBCUniversal Enterprise, Inc. (f/k/a/ Navy Holdings, Inc.), dated March 19, 2013 (incorporated by reference to Exhibit 10.4 to Comcast’s Quarterly Report on Form 10-Q for the quarter ended March 31, 2013).
|
|
|
|
Amendment to Certificate of Designations for Series A Cumulative Preferred Stock of NBCUniversal Enterprise, Inc. dated March 19, 2013 (incorporated by reference to Exhibit 10.5 to Comcast’s Quarterly Report on Form 10-Q for the quarter ended March 31, 2013).
|
|
|
|
Comcast Corporation 2003 Stock Option Plan, as amended and restated December 5, 2017.
|
|
|
|
Comcast Corporation 2002 Deferred Compensation Plan, as amended and restated effective February 10, 2009 (incorporated by reference to Exhibit 10.5 to Comcast’s Annual Report on Form 10-K for the year ended December 31, 2009).
|
|
|
|
Comcast Corporation 2005 Deferred Compensation Plan, as amended and restated effective May 20, 2015 (incorporated by reference to Exhibit 10.5 to Comcast’s Quarterly Report on Form 10-Q for the quarter ended June 30, 2015).
|
|
|
|
Comcast Corporation 2002 Restricted Stock Plan, as amended and restated effective December 5, 2017.
|
|
|
|
Comcast Corporation 2006 Cash Bonus Plan, as amended and restated effective February 18, 2015 (incorporated by reference to Exhibit 10.11 to Comcast’s Annual Report on Form 10-K for the year ended December 31, 2015).
|
|
|
|
Comcast Corporation Retirement-Investment Plan, as amended and restated effective January 1, 2016 (incorporated by reference to Exhibit 10.12 to Comcast’s Annual Report on Form 10-K for the year ended December 31, 2015).
|
|
|
|
Comcast Corporation 2002 Non-Employee Director Compensation Plan, as amended and restated effective December 5, 2017.
|
|
|
|
Comcast Corporation 2002 Employee Stock Purchase Plan, as amended and restated effective February 22, 2016 (incorporated by reference to Appendix C to our Definitive Proxy Statement on Schedule 14A filed on April 8, 2016).
|
|
|
|
Comcast-NBCUniversal 2011 Employee Stock Purchase Plan, as amended and restated effective February 22, 2016 (incorporated by reference to Appendix D to our Definitive Proxy Statement on Schedule 14A filed on April 8, 2016).
|
|
|
|
Employment Agreement between Comcast Corporation and Brian L. Roberts, dated as of June 1, 2005 (incorporated by reference to Exhibit 99.1 to Comcast’s Current Report on Form 8-K filed on August 5, 2005).
|
|
|
|
Amendment to Employment Agreement between Comcast Corporation and Brian L. Roberts, dated as of February 13, 2009 (incorporated by reference to Exhibit 99.1 to Comcast’s Current Report on Form 8-K filed on February 13, 2009).
|
|
|
|
Amendment No. 2 to Employment Agreement between Comcast Corporation and Brian L. Roberts, dated as of December 31, 2009 (incorporated by reference to Exhibit 10.23 to Comcast’s Annual Report on Form 10-K for the year ended December 31, 2009).
|
|
|
108
|
Comcast 2017 Annual Report on Form 10-K
|
|
|
|
Amendment No. 3 to Employment Agreement between Comcast Corporation and Brian L. Roberts, dated as of June 30, 2010 (incorporated by reference to Exhibit 99.1 to Comcast’s Current Report on Form 8-K filed on July 7, 2010).
|
|
|
|
Amendment No. 4 to Employment Agreement between Comcast Corporation and Brian L. Roberts, dated as of December 31, 2010 (incorporated by reference to Exhibit 10.25 to Comcast’s Annual Report on Form 10-K for the year ended December 31, 2010).
|
|
|
|
Amendment No. 5 to Employment Agreement between Comcast Corporation and Brian L. Roberts, dated as of June 30, 2011 (incorporated by reference to Exhibit 99.1 to Comcast’s Current Report on Form 8-K filed on July 1, 2011).
|
|
|
|
Amendment No. 6 to Employment Agreement between Comcast Corporation and Brian L. Roberts, dated as of December 15, 2011 (incorporated by reference to Exhibit 10.21 to Comcast’s Annual Report on Form 10-K for the year ended December 31, 2011).
|
|
|
|
Amendment No. 7 to Employment Agreement between Comcast Corporation and Brian L. Roberts, effective as of June 30, 2012 (incorporated by reference to Exhibit 99.1 to Comcast’s Current Report on Form 8-K filed on September 14, 2012).
|
|
|
|
Amendment No. 8 to Employment Agreement between Comcast Corporation and Brian L. Roberts, dated as of December 14, 2012 (incorporated by reference to Exhibit 10.23 to Comcast’s Annual Report on Form 10-K for the year ended December 31, 2012).
|
|
|
|
Amendment No. 10 to Employment Agreement with Brian L. Roberts, effective as of June 30, 2013 (incorporated by reference to Exhibit 99.1 to Comcast’s Current Report on Form 8-K filed on July 24, 2013).
|
|
|
|
Amendment No. 11 to Employment Agreement with Brian L. Roberts, effective as of December 18, 2013 (incorporated by reference to Exhibit 10.29 to Comcast’s Annual Report on Form 10-K filed on February 12, 2014).
|
|
|
|
Amendment No. 12 to Employment Agreement with Brian L. Roberts, effective as of June 30, 2014 (incorporated by reference to Exhibit 99.1 to Comcast’s Current Report on Form 8-K filed on July 1, 2014).
|
|
|
|
Amendment No. 13 to Employment Agreement with Brian L. Roberts, effective as of December 9, 2014 (incorporated by reference to Exhibit 10.30 to Comcast’s Annual Report on Form 10-K for the year ended December 31, 2014).
|
|
|
|
Amendment No. 14 to Employment Agreement with Brian L. Roberts, dated June 30, 2015 (incorporated by reference to Exhibit 99.1 to Comcast’s Current Report on Form 8-K filed on July 7, 2015).
|
|
|
|
Amendment No. 15 to Employment Agreement with Brian L. Roberts, dated December 17, 2015 (incorporated by reference to Exhibit 10.31 to Comcast’s Annual Report on Form 10-K for the year ended December 31, 2015).
|
|
|
|
Amendment No. 16 to Employment Agreement with Brian L. Roberts, dated June 30, 2016 (incorporated by reference to Exhibit 99.1 to Comcast’s Current Report on Form 8-K filed on July 1, 2016).
|
|
|
|
Amendment No. 17 to Employment Agreement with Brian L. Roberts, dated December 12, 2016 (incorporated by reference to Exhibit 10.30 to Comcast’s Annual Report on Form 10-K for the year ended December 31, 2016).
|
|
|
Amendment No. 18 to Employment Agreement with Brian L. Roberts, dated June 30, 2017 (incorporated by reference to Exhibit 10.1 to Comcast’s Quarterly Report on Form 10-Q for the quarter ended June 30, 2017).
|
||
|
Employment Agreement with Brian L. Roberts, dated July 26, 2017 (incorporated by reference to Exhibit 10.2 to Comcast’s Quarterly Report on Form 10-Q for the quarter ended June 30, 2017).
|
||
|
|
Employment Agreement between Comcast Corporation and Stephen B. Burke, dated as of December 16, 2009 (incorporated by reference to Exhibit 99.1 to Comcast’s Current Report on Form 8-K filed on December 22, 2009).
|
|
|
|
Amendment No. 2 to Employment Agreement with Stephen B. Burke, dated as of August 16, 2013 (incorporated by reference to Exhibit 99.1 to Comcast’s Current Report on Form 8-K filed on August 16, 2013).
|
|
|
|
Amendment No. 3 to Employment Agreement with Stephen B. Burke dated as of July 25, 2016 (incorporated by reference to Exhibit 99.1 to Comcast’s Current Report on Form 8-K filed on July 28, 2016).
|
|
|
|
Employment Agreement between Comcast Corporation and David L. Cohen, dated as of October 23, 2015 (incorporated by reference to Exhibit 10.1 to Comcast’s Quarterly Report on Form 10-Q for the quarter ended September 30, 2015).
|
|
|
|
Employment Agreement between Comcast Corporation and Neil Smit, dated as of December 22, 2014 (incorporated by reference to Exhibit 99.1 to Comcast’s Current Report on Form 8-K filed on December 23, 2014).
|
|
|
Comcast 2017 Annual Report on Form 10-K
|
109
|
|
|
Employment Agreement between Comcast Corporation and Neil Smit, dated as of April 25, 2017 (incorporated by reference to Exhibit 10.1 to Comcast’s Quarterly Report on Form 10-Q for the quarter ended March 31, 2017).
|
||
|
|
Form of Amendment, dated as of December 16, 2008, to the Employment Agreement with Brian L. Roberts (incorporated by reference to Exhibit 10.38 to Comcast’s Annual Report on Form 10-K for the year ended December 31, 2008).
|
|
|
|
Form of Amendment, dated as of December 14, 2012, to the Employment Agreements with Brian L. Roberts and Stephen B. Burke (incorporated by reference to Exhibit 10.41 to Comcast’s Annual Report on Form 10-K for the year ended December 31, 2012).
|
|
|
|
Employment Agreement dated May 10, 2015 between Comcast Corporation and Michael J. Cavanagh (incorporated by reference to Exhibit 99.1 to Comcast’s Current Report on Form 8-K filed on May 11, 2015).
|
|
|
|
Form of Non-Qualified Stock Option under the Comcast Corporation 2003 Stock Option Plan (incorporated by reference to Exhibit 10.40 to Comcast’s Annual Report on Form 10-K for the year ended December 31, 2008).
|
|
|
|
Form of Non-Qualified Stock Option under the Comcast Corporation 2003 Stock Option Plan (incorporated by reference to Exhibit 10.2 to Comcast’s Quarterly Report on Form 10-Q for the quarter ended March 31, 2016).
|
|
|
|
Form of Non-Qualified Stock Option under the Comcast Corporation 2003 Stock Option Plan (incorporated by reference to Exhibit 10.42 to Comcast’s Annual Report on Form 10-K for the year ended December 31, 2016).
|
|
|
|
Form of Restricted Stock Unit Award under the Comcast Corporation 2002 Restricted Stock Plan (incorporated by reference to Exhibit 10.1 to Comcast’s Quarterly Report on Form 10-Q for the quarter ended March 31, 2012).
|
|
|
|
Form of Restricted Stock Unit Award under the Comcast Corporation 2002 Restricted Stock Plan (incorporated by reference to Exhibit 10.6 to Comcast’s Quarterly Report on Form 10-Q for the quarter ended March 31, 2013).
|
|
|
|
Form of Restricted Stock Unit Award under the Comcast Corporation 2002 Restricted Stock Plan (incorporated by reference to Exhibit 10.1 to Comcast’s Quarterly Report on Form 10-Q for the quarter ended March 31, 2016).
|
|
|
|
Form of Restricted Stock Unit Award and Long-Term Incentive Awards Summary Schedule under the Comcast Corporation 2002 Restricted Stock Plan (incorporated by reference to Exhibit 10.2 to Comcast’s Quarterly Report on Form 10-Q for the quarter ended September 30, 2015).
|
|
|
Form of Restricted Stock Unit Award and Long-Term Incentive Awards Summary Schedule under the Comcast Corporation 2002 Restricted Stock Plan (incorporated by reference to Exhibit 10.2 to Comcast’s Quarterly Report on Form 10-Q for the quarter ended March 31, 2017).
|
||
|
|
Form of Airplane Time Sharing Agreement (incorporated by reference to Exhibit 10.60 to Comcast’s Annual Report on Form 10-K for the year ended December 31, 2014).
|
|
|
|
Form of Director Indemnification Agreement (incorporated by reference to Exhibit 10.3 to Comcast’s Quarterly Report on Form 10-Q for the quarter ended June 30, 2009).
|
|
|
|
Shareholders Agreement, effective as of January 1, 2016, among Atairos Group, Inc., Comcast AG Holdings, LLC, Atairos Partners, L.P., Atairos Management, L.P., and Comcast Corporation (incorporated by reference to Exhibit 10.66 to Comcast’s Annual Report on Form 10-K for the year ended December 31, 2015).
|
|
|
|
Wireless Operational Cooperation Agreement dated as of May 5, 2017 between Comcast Corporation and Charter Communications, Inc. (incorporated by reference to Exhibit 10.1 to the Current Report on Form 8-K filed on May 8, 2017).
|
|
|
|
Consultant Agreement, dated as of January 20, 1987, between Steven Spielberg and Universal City Florida Partners (incorporated by reference to Exhibit 10.49 to the Registration Statement on Form S-4 of Universal City Development Partners, Ltd. and UCDP Finance, Inc. filed on January 20, 2010 (File No. 333-164431)).
|
|
|
|
Amendment dated February 5, 2001 to the Consultant Agreement dated as of January 20, 1987, between the Consultant and Universal City Florida Partners (incorporated by reference to Exhibit 10.50 to the Registration Statement on Form S-4 of Universal City Development Partners, Ltd. and UCDP Finance, Inc. filed on January 20, 2010 (File No. 333-164431)).
|
|
|
|
Amendment to the Consultant Agreement, dated as of October 18, 2009, between Steven Spielberg, Diamond Lane Productions, Inc. and Universal City Development Partners, Ltd. (incorporated by reference to Exhibit 10.52 to the Registration Statement on Form S-4 of Universal City Development Partners, Ltd. and UCDP Finance, Inc. filed on January 20, 2010 (File No. 333-164431)).
|
|
|
110
|
Comcast 2017 Annual Report on Form 10-K
|
|
|
|
Letter Agreement dated July 15, 2003, among Diamond Lane Productions, Vivendi Universal Entertainment LLLP and Universal City Development Partners, Ltd. (incorporated by reference to Exhibit 10.51 to the Registration Statement on Form S-4 of Universal City Development Partners, Ltd. and UCDP Finance, Inc. filed on January 20, 2010 (File No. 333-164431)).
|
|
|
|
Statement of Earnings to Fixed Charges and Earnings to Combined Fixed Charges and Preferred Dividends.
|
|
|
|
List of subsidiaries.
|
|
|
|
Consent of Deloitte & Touche LLP.
|
|
|
|
Certification of Chief Executive Officer and Chief Financial Officer pursuant to Section 302 of the Sarbanes-Oxley Act of 2002.
|
|
|
Certification of Chief Executive Officer and Chief Financial Officer pursuant to Section 906 of the Sarbanes-Oxley Act of 2002.
|
||
|
101
|
The following financial statements from Comcast Corporation’s Annual Report on Form 10-K for the year ended December 31, 2017, filed with the Securities and Exchange Commission on January 31, 2018, formatted in XBRL (eXtensible Business Reporting Language): (1) the Consolidated Balance Sheet; (2) the Consolidated Statement of Income; (3) the Consolidated Statement of Comprehensive Income; (4) the Consolidated Statement of Cash Flows; (5) the Consolidated Statement of Changes in Equity; and (6) the Notes to Consolidated Financial Statements.
|
|
|
*
|
Constitutes a management contract or compensatory plan or arrangement.
|
|
|
Comcast 2017 Annual Report on Form 10-K
|
111
|
|
|
NBCUniversal
|
(a) NBCUniversal’s consolidated financial statements are filed as a part of this report on Form 10-K and a list of the consolidated financial statements are found on page 116 of this report. Schedule II - Valuation and Qualifying Accounts is found on page
142
of this report; all other financial statement schedules are omitted because the required information is not applicable, or because the information required is included in the consolidated financial statements and notes thereto.
(b) Exhibits required to be filed by Item 601 of Regulation S-K:
|
|
Certificate of Formation of NBCUniversal Media, LLC (incorporated by reference to Exhibit 3.1 to NBCUniversal’s Registration Statement on Form S-4 filed on May 13, 2011).
|
|
|
|
Certificate of Amendment to Certificate of Formation of NBCUniversal Media, LLC (incorporated by reference to Exhibit 3.2 to NBCUniversal’s Registration Statement on Form S-4 filed on August 25, 2011).
|
|
|
|
Limited Liability Company Agreement of NBCUniversal Media, LLC (incorporated by reference to Exhibit 3.2 to Amendment No. 2 to NBCUniversal’s Registration Statement on Form S-4 filed on July 12, 2011).
|
|
|
|
Indenture, dated as of April 30, 2010 between NBC Universal, Inc. (n/k/a NBCUniversal Media, LLC) and The Bank of New York Mellon, as Trustee (incorporated by reference to Exhibit 4 to NBCUniversal’s Registration Statement on Form S-4 filed on May 13, 2011).
|
|
|
|
First Supplemental Indenture, dated March 27, 2013, to the Indenture between NBCUniversal Media, LLC (f/k/a NBC Universal, Inc.) and The Bank of New York Mellon, as trustee, dated April 30, 2010 (incorporated by reference to Exhibit 4.3 of the Quarterly Report on Form 10-Q of Comcast Corporation for the quarter ended March 31, 2013).
|
|
|
|
Second Supplemental Indenture, dated October 1, 2015, to the Indenture dated April 30, 2010 between NBC Universal, Inc. (n/k/a NBCUniversal Media, LLC) and The Bank of New York Mellon, as trustee, as supplemented by a First Supplemental Indenture dated March 27, 2013 (incorporated by reference to Exhibit 4.2 of the Quarterly Report on Form 10-Q of Comcast Corporation for the quarter ended September 30, 2015).
|
|
|
|
Indenture, dated January 7, 2003, between Comcast Corporation, the subsidiary guarantor party thereto, and The Bank of New York Mellon (f/k/a The Bank of New York), as trustee (incorporated by reference to Exhibit 4.4 to the Annual Report on Form 10-K of Comcast Corporation for the year ended December 31, 2008).
|
|
|
|
First Supplemental Indenture, dated March 25, 2003, to the Indenture between Comcast Corporation, the subsidiary guarantors party thereto, and The Bank of New York Mellon (f/k/a The Bank of New York), as trustee, dated January 7, 2003 (incorporated by reference to Exhibit 4.5 to the Annual Report on Form 10-K of Comcast Corporation for the year ended December 31, 2008).
|
|
|
|
Second Supplemental Indenture, dated August 31, 2009, to the Indenture between Comcast Corporation, the subsidiary guarantors party thereto, and The Bank of New York Mellon, as Trustee, dated January 7, 2003, as supplemented by a First Supplemental Indenture dated March 25, 2003 (incorporated by reference to Exhibit 4.1 to the Current Report on Form 8-K of Comcast Corporation filed on September 2, 2009).
|
|
|
|
Third Supplemental Indenture, dated March 27, 2013, to the Indenture between Comcast Corporation, the subsidiary guarantors party thereto, and The Bank of New York Mellon (f/k/a The Bank of New York), as trustee, dated January 7, 2003, as supplemented by a First Supplemental Indenture dated March 25, 2003 and a Second Supplemental Indenture dated August 31, 2009 (incorporated by reference to Exhibit 4.4 of the Quarterly Report on Form 10-Q of Comcast Corporation for the quarter ended March 31, 2013).
|
|
|
|
Fourth Supplemental Indenture, dated October 1, 2015, to the Indenture dated January 7, 2003 between Comcast Corporation, the subsidiary guarantors party thereto, and The Bank of New York Mellon (f/k/a The Bank of New York), as trustee, as supplemented by a First Supplemental Indenture dated March 25, 2003, a second Supplemental Indenture dated August 31, 2009 and a third Supplemental Indenture dated March 27, 2013 (incorporated by reference to Exhibit 4.1 of the Quarterly Report on Form 10-Q of Comcast Corporation for the quarter ended September 30, 2015).
|
|
|
|
Senior Indenture dated September 18, 2013, among Comcast Corporation, the guarantors party thereto and The Bank of New York Mellon, as trustee (incorporated by reference to Exhibit 4.3 to Comcast’s Registration Statement on Form S-3 filed September 18, 2013).
|
|
|
|
First Supplemental Indenture dated as of November 17, 2015, to the Senior Indenture dated September 18, 2013, among Comcast Corporation, the guarantors party thereto, and The Bank of New York Mellon, as trustee (incorporated by reference to Exhibit 4.4 to Post Effective Amendment No. 2 to Comcast’s Registration Statement on Form S-3 filed November 23, 2015).
|
|
|
112
|
Comcast 2017 Annual Report on Form 10-K
|
|
|
|
Second Amended and Restated Limited Liability Company Agreement of NBCUniversal, LLC, dated March 19, 2013 (incorporated by reference to Exhibit 10.2 of the Quarterly Report on Form 10-Q of Comcast Corporation for the quarter ended March 31, 2013).
|
|
|
|
Credit Agreement dated as of May 26, 2016, among Comcast Corporation, the financial institutions party thereto, JPMorgan Chase Bank, N.A., as administrative agent, Citibank, N.A., as syndication agent, Morgan Stanley MUFG Partners, LLC, Wells Fargo Bank, National Association and Mizuho Bank, Ltd., as co-documentation agents (incorporated by reference to exhibit 10.1 to Comcast’s Current Report on Form 8-K filed on May 31, 2016.
|
|
|
|
Consultant Agreement, dated as of January 20, 1987, between Steven Spielberg and Universal City Florida Partners (incorporated by reference to Exhibit 10.49 to the Registration Statement on Form S-4 of Universal City Development Partners, Ltd. and UCDP Finance, Inc. filed on January 20, 2010 (File No. 333-164431)).
|
|
|
|
Amendment dated February 5, 2001 to the Consultant Agreement dated as of January 20, 1987, between the Consultant and Universal City Florida Partners (incorporated by reference to Exhibit 10.50 to the Registration Statement on Form S-4 of Universal City Development Partners, Ltd. and UCDP Finance, Inc. filed on January 20, 2010 (File No. 333-164431)).
|
|
|
|
Amendment to the Consultant Agreement, dated as of October 18, 2009, between Steven Spielberg, Diamond Lane Productions, Inc. and Universal City Development Partners, Ltd. (incorporated by reference to Exhibit 10.52 to the Registration Statement on Form S-4 of Universal City Development Partners, Ltd. and UCDP Finance, Inc. filed on January 20, 2010 (File No. 333-164431)).
|
|
|
|
Letter Agreement dated July 15, 2003, among Diamond Lane Productions, Vivendi Universal Entertainment LLLP and Universal City Development Partners, Ltd. (incorporated by reference to Exhibit 10.51 to the Registration Statement on Form S-4 of Universal City Development Partners, Ltd. and UCDP Finance, Inc. filed on January 20, 2010 (File No. 333-164431)).
|
|
|
Loan Agreement dated as of May 1, 2017, among USJ Co., Ltd., the financial institutions party thereto (the “lenders”) and Sumitomo Mitusi Banking Corporation, as agent (incorporated by reference to Exhibit 10.1 to NBCUniversal’s Current Report on Form 8-K filed on May 3, 2017).
|
||
|
|
Consent of Deloitte & Touche LLP.
|
|
|
|
Certification of Principal Executive Officer and Principal Financial Officer pursuant to Section 302 of the Sarbanes-Oxley Act of 2002.
|
|
|
|
Certification of Principal Executive Officer and Principal Financial Officer pursuant to Section 906 of the Sarbanes-Oxley Act of 2002.
|
|
|
101
|
|
The following financial statements from NBCUniversal Media, LLC’s Annual Report on Form 10-K for the year ended December 31, 2017, filed with the Securities and Exchange Commission on January 31, 2018, formatted in XBRL (eXtensible Business Reporting Language): (1) the Consolidated Balance Sheet; (2) the Consolidated Statement of Income; (3) the Consolidated Statement of Comprehensive Income; (4) the Consolidated Statement of Cash Flows; (5) the Consolidated Statement of Changes in Equity; and (6) the Notes to Consolidated Financial Statements.
|
None.
|
Comcast 2017 Annual Report on Form 10-K
|
113
|
|
Signatures
Comcast
Pursuant to the requirements of Section 13 or 15(d) of the Securities Exchange Act of 1934, the Registrant has duly caused this report to be signed on its behalf by the undersigned, thereunto duly authorized in Philadelphia, Pennsylvania on
January 31, 2018
.
|
By:
|
|
/s/ BRIAN L. ROBERTS
|
|
|
|
Brian L. Roberts
|
||
|
|
Chairman and CEO
|
||
Pursuant to the requirements of the Securities Exchange Act of 1934, this report has been signed below by the following persons on behalf of the Registrant and in the capacities and on the dates indicated.
|
Signature
|
|
Title
|
|
Date
|
|
/s/ BRIAN L. ROBERTS
|
|
Chairman and CEO; Director
(Principal Executive Officer)
|
|
January 31, 2018
|
|
Brian L. Roberts
|
||||
|
/s/ MICHAEL J. CAVANAGH
|
|
Senior Executive Vice President and CFO
(Principal Financial Officer)
|
|
January 31, 2018
|
|
Michael J. Cavanagh
|
||||
|
/s/ DANIEL C. MURDOCK
|
|
Senior Vice President and
Chief Accounting Officer
(Principal Accounting Officer)
|
|
January 31, 2018
|
|
Daniel C. Murdock
|
||||
|
/s/ KENNETH J. BACON
|
|
Director
|
|
January 31, 2018
|
|
Kenneth J. Bacon
|
||||
|
/s/ MADELINE S. BELL
|
|
Director
|
|
January 31, 2018
|
|
Madeline S. Bell
|
||||
|
/s/ SHELDON M. BONOVITZ
|
|
Director
|
|
January 31, 2018
|
|
Sheldon M. Bonovitz
|
||||
|
/s/ EDWARD D. BREEN
|
|
Director
|
|
January 31, 2018
|
|
Edward D. Breen
|
||||
|
/s/ GERALD L. HASSELL
|
|
Director
|
|
January 31, 2018
|
|
Gerald L. Hassell
|
||||
|
/s/ JEFFREY A. HONICKMAN
|
|
Director
|
|
January 31, 2018
|
|
Jeffrey A. Honickman
|
||||
|
/s/ ASUKA NAKAHARA
|
|
Director
|
|
January 31, 2018
|
|
Asuka Nakahara
|
||||
|
/s/ DAVID C. NOVAK
|
Director
|
January 31, 2018
|
||
|
David C. Novak
|
||||
|
/s/ JOHNATHAN A. RODGERS
|
|
Director
|
|
January 31, 2018
|
|
Johnathan A. Rodgers
|
||||
|
114
|
Comcast 2017 Annual Report on Form 10-K
|
|
NBCUniversal
Pursuant to the requirements of Section 13 or 15(d) of the Securities Exchange Act of 1934, the Registrant has duly caused this report to be signed on its behalf by the undersigned, thereunto duly authorized in Philadelphia, Pennsylvania on
January 31, 2018
.
|
NBCUNIVERSAL MEDIA, LLC
|
|||||
|
By: NBCUNIVERSAL, LLC, its sole member
|
|||||
|
By:
|
|
/s/ STEPHEN B. BURKE
|
|||
|
Stephen B. Burke
|
|||||
|
|
Chief Executive Officer
|
||||
Pursuant to the requirements of the Securities Exchange Act of 1934, this report has been signed below by the following persons on behalf of the Registrant and in the capacities and on the dates indicated.
|
Signature
|
|
Title
|
|
Date
|
|
/s/ BRIAN L. ROBERTS
|
|
Principal Executive Officer
of NBCUniversal Media, LLC
|
|
January 31, 2018
|
|
Brian L. Roberts
|
||||
|
/s/ MICHAEL J. CAVANAGH
|
|
Principal Financial Officer
of NBCUniversal Media, LLC;
Director of NBCUniversal, LLC
|
|
January 31, 2018
|
|
Michael J. Cavanagh
|
||||
|
/s/ ARTHUR R. BLOCK
|
|
Director of NBCUniversal, LLC
|
|
January 31, 2018
|
|
Arthur R. Block
|
||||
|
/s/ DAVID L. COHEN
|
|
Director of NBCUniversal, LLC
|
|
January 31, 2018
|
|
David L. Cohen
|
||||
|
/s/ DANIEL C. MURDOCK
|
|
Principal Accounting Officer
of NBCUniversal Media, LLC
|
|
January 31, 2018
|
|
Daniel C. Murdock
|
||||
|
Comcast 2017 Annual Report on Form 10-K
|
115
|
|
NBCUniversal Media, LLC Financial Statements and Supplementary Data
|
Index
|
Page
|
|
116
|
Comcast 2017 Annual Report on Form 10-K
|
|
To the Member of NBCUniversal Media, LLC
New York, New York
Opinion on the Consolidated Financial Statements
We have audited the accompanying consolidated balance sheets of NBCUniversal Media, LLC and subsidiaries (the “Company”) as of
December 31, 2017
and
2016
, the related consolidated statements of income, comprehensive income, cash flows and changes in equity for each of the three years in the period ended
December 31, 2017
, and the related notes (collectively referred to as the “financial statements”). In our opinion, the financial statements present fairly, in all material respects, the financial position of the Company as of
December 31, 2017
and
2016
, and the results of its operations and its cash flows for each of the three years in the period ended
December 31, 2017
, in conformity with accounting principles generally accepted in the United States of America.
Basis for Opinion
These financial statements are the responsibility of the Company’s management. Our responsibility is to express an opinion on the Company’s financial statements based on our audits. We are a public accounting firm registered with the Public Company Accounting Oversight Board (United States) (PCAOB) and are required to be independent with respect to the Company in accordance with the U.S. federal securities laws and the applicable rules and regulations of the Securities and Exchange Commission and the PCAOB.
We conducted our audits in accordance with the standards of the PCAOB. Those standards require that we plan and perform the audit to obtain reasonable assurance about whether the financial statements are free of material misstatement, whether due to error or fraud. The Company is not required to have, nor were we engaged to perform, an audit of its internal control over financial reporting. As part of our audits, we are required to obtain an understanding of internal control over financial reporting but not for the purpose of expressing an opinion on the effectiveness of the Company’s internal control over financial reporting. Accordingly, we express no such opinion.
Our audits included performing procedures to assess the risks of material misstatement of the financial statements, whether due to error or fraud, and performing procedures that respond to those risks. Such procedures included examining, on a test basis, evidence regarding the amounts and disclosures in the financial statements. Our audits also included evaluating the accounting principles used and significant estimates made by management, as well as evaluating the overall presentation of the financial statements. We believe that our audits provide a reasonable basis for our opinion.
/s/ Deloitte & Touche LLP
New York, New York
January 31, 2018
We have served as the Company’s auditor since 2011.
|
Comcast 2017 Annual Report on Form 10-K
|
117
|
|
|
December 31 (in millions)
|
2017
|
|
2016
|
|
|||
|
Assets
|
|||||||
|
Current Assets:
|
|||||||
|
Cash and cash equivalents
|
$
|
2,347
|
|
$
|
1,966
|
|
|
|
Receivables, net
|
6,682
|
|
6,302
|
|
|||
|
Programming rights
|
1,606
|
|
1,241
|
|
|||
|
Other current assets
|
1,038
|
|
938
|
|
|||
|
Total current assets
|
11,673
|
|
10,447
|
|
|||
|
Film and television costs
|
7,071
|
|
7,245
|
|
|||
|
Investments
|
1,816
|
|
1,263
|
|
|||
|
Property and equipment, net
|
11,346
|
|
10,511
|
|
|||
|
Goodwill
|
23,989
|
|
23,323
|
|
|||
|
Intangible assets, net
|
13,306
|
|
13,777
|
|
|||
|
Other noncurrent assets, net
|
1,872
|
|
1,688
|
|
|||
|
Total assets
|
$
|
71,073
|
|
$
|
68,254
|
|
|
|
Liabilities and Equity
|
|||||||
|
Current Liabilities:
|
|||||||
|
Accounts payable and accrued expenses related to trade creditors
|
$
|
1,663
|
|
$
|
1,647
|
|
|
|
Accrued participations and residuals
|
1,683
|
|
1,726
|
|
|||
|
Program obligations
|
745
|
|
807
|
|
|||
|
Deferred revenue
|
1,438
|
|
1,016
|
|
|||
|
Accrued expenses and other current liabilities
|
2,044
|
|
1,888
|
|
|||
|
Note payable to Comcast
|
1,831
|
|
2,703
|
|
|||
|
Current portion of long-term debt
|
198
|
|
127
|
|
|||
|
Total current liabilities
|
9,602
|
|
9,914
|
|
|||
|
Long-term debt, less current portion
|
12,275
|
|
11,461
|
|
|||
|
Accrued participations, residuals and program obligations
|
1,490
|
|
1,202
|
|
|||
|
Other noncurrent liabilities
|
4,109
|
|
4,130
|
|
|||
|
Commitments and contingencies (Note 14)
|
|
|
|||||
|
Redeemable noncontrolling interests
|
409
|
|
530
|
|
|||
|
Equity:
|
|||||||
|
Member’s capital
|
42,295
|
|
39,036
|
|
|||
|
Accumulated other comprehensive income (loss)
|
(20
|
)
|
(135
|
)
|
|||
|
Total NBCUniversal member’s equity
|
42,275
|
|
38,901
|
|
|||
|
Noncontrolling interests
|
913
|
|
2,116
|
|
|||
|
Total equity
|
43,188
|
|
41,017
|
|
|||
|
Total liabilities and equity
|
$
|
71,073
|
|
$
|
68,254
|
|
|
See accompanying notes to consolidated financial statements.
|
118
|
Comcast 2017 Annual Report on Form 10-K
|
|
|
Year ended December 31 (in millions)
|
2017
|
|
2016
|
|
2015
|
|
|||||
|
Revenue
|
$
|
32,997
|
|
$
|
31,593
|
|
$
|
28,462
|
|
||
|
Costs and Expenses:
|
|||||||||||
|
Programming and production
|
14,304
|
|
14,540
|
|
13,418
|
|
|||||
|
Other operating and administrative
|
7,709
|
|
7,059
|
|
5,891
|
|
|||||
|
Advertising, marketing and promotion
|
2,799
|
|
2,767
|
|
2,795
|
|
|||||
|
Depreciation
|
994
|
|
861
|
|
669
|
|
|||||
|
Amortization
|
1,047
|
|
944
|
|
870
|
|
|||||
|
Other operating gains
|
(337
|
)
|
—
|
|
—
|
|
|||||
|
Total costs and expenses
|
26,516
|
|
26,171
|
|
23,643
|
|
|||||
|
Operating income
|
6,481
|
|
5,422
|
|
4,819
|
|
|||||
|
Other Income (Expense):
|
|||||||||||
|
Interest expense
|
(727
|
)
|
(595
|
)
|
(495
|
)
|
|||||
|
Investment income (loss), net
|
46
|
|
30
|
|
5
|
|
|||||
|
Equity in net income (losses) of investees, net
|
(201
|
)
|
(99
|
)
|
(376
|
)
|
|||||
|
Other income (expense), net
|
11
|
|
93
|
|
(102
|
)
|
|||||
|
Total other income (expense)
|
(871
|
)
|
|
(571
|
)
|
(968
|
)
|
||||
|
Income before income taxes
|
5,610
|
|
4,851
|
|
3,851
|
|
|||||
|
Income tax expense
|
(392
|
)
|
(305
|
)
|
(227
|
)
|
|||||
|
Net income
|
5,218
|
|
|
4,546
|
|
3,624
|
|
||||
|
Net (income) loss attributable to noncontrolling interests
|
(134
|
)
|
(311
|
)
|
(210
|
)
|
|||||
|
Net income attributable to NBCUniversal
|
$
|
5,084
|
|
$
|
4,235
|
|
$
|
3,414
|
|
||
See accompanying notes to consolidated financial statements.
|
Comcast 2017 Annual Report on Form 10-K
|
119
|
|
|
Year ended December 31 (in millions)
|
2017
|
|
2016
|
|
2015
|
|
|||||
|
Net income
|
$
|
5,218
|
|
$
|
4,546
|
|
$
|
3,624
|
|
||
|
Unrealized gains (losses) on marketable securities, net
|
(233
|
)
|
—
|
|
—
|
|
|||||
|
Deferred gains (losses) on cash flow hedges, net
|
(13
|
)
|
24
|
|
(21
|
)
|
|||||
|
Employee benefit obligations, net
|
112
|
|
15
|
|
60
|
|
|||||
|
Currency translation adjustments, net
|
189
|
|
112
|
|
(121
|
)
|
|||||
|
Comprehensive income
|
5,273
|
|
4,697
|
|
3,542
|
|
|||||
|
Net (income) loss attributable to noncontrolling interests
|
(134
|
)
|
(311
|
)
|
(210
|
)
|
|||||
|
Other comprehensive (income) loss attributable to noncontrolling interests
|
(81
|
)
|
(74
|
)
|
29
|
|
|||||
|
Comprehensive income attributable to NBCUniversal
|
$
|
5,058
|
|
$
|
4,312
|
|
$
|
3,361
|
|
||
See accompanying notes to consolidated financial statements.
|
120
|
Comcast 2017 Annual Report on Form 10-K
|
|
|
Year ended December 31 (in millions)
|
2017
|
|
2016
|
|
2015
|
|
|||||
|
Operating Activities
|
|||||||||||
|
Net income
|
$
|
5,218
|
|
$
|
4,546
|
|
$
|
3,624
|
|
||
|
Adjustments to reconcile net income to net cash provided by
|
|||||||||||
|
operating activities:
|
|||||||||||
|
Depreciation, amortization and other operating gains
|
1,704
|
|
1,805
|
|
1,539
|
|
|||||
|
Equity in net (income) losses of investees, net
|
201
|
|
99
|
|
376
|
|
|||||
|
Cash received from investees
|
85
|
|
68
|
|
60
|
|
|||||
|
Net (gain) loss on investment activity and other
|
142
|
|
(80
|
)
|
56
|
|
|||||
|
Deferred income taxes
|
2
|
|
89
|
|
(11
|
)
|
|||||
|
Changes in operating assets and liabilities, net of effects of acquisitions and divestitures:
|
|||||||||||
|
Current and noncurrent receivables, net
|
(615
|
)
|
(635
|
)
|
(718
|
)
|
|||||
|
Film and television costs, net
|
(199
|
)
|
(502
|
)
|
(304
|
)
|
|||||
|
Accounts payable and accrued expenses related to trade creditors
|
(43
|
)
|
51
|
|
97
|
|
|||||
|
Other operating assets and liabilities
|
581
|
|
(544
|
)
|
585
|
|
|||||
|
Net cash provided by operating activities
|
7,076
|
|
4,897
|
|
5,304
|
|
|||||
|
Investing Activities
|
|||||||||||
|
Capital expenditures
|
(1,502
|
)
|
(1,452
|
)
|
(1,386
|
)
|
|||||
|
Cash paid for intangible assets
|
(295
|
)
|
(283
|
)
|
(211
|
)
|
|||||
|
Acquisitions, net of cash acquired
|
(140
|
)
|
(205
|
)
|
(1,522
|
)
|
|||||
|
Proceeds from sales of businesses and investments
|
45
|
|
109
|
|
218
|
|
|||||
|
Purchases of investments
|
(490
|
)
|
(290
|
)
|
(649
|
)
|
|||||
|
Other
|
506
|
|
(123
|
)
|
150
|
|
|||||
|
Net cash provided by (used in) investing activities
|
(1,876
|
)
|
(2,244
|
)
|
(3,400
|
)
|
|||||
|
Financing Activities
|
|||||||||||
|
Proceeds from borrowings
|
3,948
|
|
—
|
|
—
|
|
|||||
|
Repurchases and repayments of debt
|
(3,498
|
)
|
(1,565
|
)
|
(1,022
|
)
|
|||||
|
Proceeds from (repayments of) borrowings from Comcast, net
|
(872
|
)
|
928
|
|
854
|
|
|||||
|
Distributions to member
|
(1,968
|
)
|
(1,606
|
)
|
(1,385
|
)
|
|||||
|
Distributions to noncontrolling interests
|
(209
|
)
|
(210
|
)
|
(189
|
)
|
|||||
|
Purchase of Universal Studios Japan noncontrolling interests
|
(2,299
|
)
|
—
|
|
—
|
|
|||||
|
Other
|
79
|
|
356
|
|
—
|
|
|||||
|
Net cash provided by (used in) financing activities
|
(4,819
|
)
|
(2,097
|
)
|
(1,742
|
)
|
|||||
|
Increase (decrease) in cash and cash equivalents
|
381
|
|
556
|
|
162
|
|
|||||
|
Cash and cash equivalents, beginning of year
|
1,966
|
|
1,410
|
|
1,248
|
|
|||||
|
Cash and cash equivalents, end of year
|
$
|
2,347
|
|
$
|
1,966
|
|
$
|
1,410
|
|
||
See accompanying notes to consolidated financial statements.
|
Comcast 2017 Annual Report on Form 10-K
|
121
|
|
|
(in millions)
|
Redeemable
Noncontrolling Interests |
|
Member’s
Capital |
|
Accumulated
Other Comprehensive Income (Loss) |
|
Non-
controlling Interests |
|
Total
Equity |
|
|||||
|
Balance, December 31, 2014
|
$
|
330
|
|
$
|
30,529
|
|
$
|
(159
|
)
|
$
|
267
|
|
$
|
30,637
|
|
|
Distributions to member
|
(1,385
|
)
|
(1,385
|
)
|
|||||||||||
|
Contributions from (distributions to) noncontrolling interests, net
|
(30
|
)
|
|
|
(159
|
)
|
(159
|
)
|
|||||||
|
Contribution from member
|
|
252
|
|
252
|
|
||||||||||
|
Other comprehensive income (loss)
|
|
|
(53
|
)
|
(29
|
)
|
(82
|
)
|
|||||||
|
Acquisition of Universal Studios Japan
|
(11
|
)
|
|
|
1,440
|
|
1,429
|
|
|||||||
|
Other
|
28
|
|
35
|
|
(4
|
)
|
31
|
|
|||||||
|
Net income (loss)
|
44
|
|
3,414
|
|
166
|
|
3,580
|
|
|||||||
|
Balance, December 31, 2015
|
372
|
|
32,834
|
|
(212
|
)
|
1,681
|
|
34,303
|
|
|||||
|
Distributions to member
|
|
|
(1,606
|
)
|
|
|
(1,606
|
)
|
|||||||
|
Contributions from (distributions to) noncontrolling interests, net
|
(59
|
)
|
|
|
(148
|
)
|
(148
|
)
|
|||||||
|
DreamWorks Animation contributions
|
3,566
|
|
|
|
89
|
|
3,655
|
|
|||||||
|
Other comprehensive income (loss)
|
|
|
77
|
|
74
|
|
151
|
|
|||||||
|
Other
|
168
|
|
7
|
|
158
|
|
165
|
|
|||||||
|
Net income (loss)
|
49
|
|
4,235
|
|
262
|
|
4,497
|
|
|||||||
|
Balance, December 31, 2016
|
530
|
|
39,036
|
|
(135
|
)
|
2,116
|
|
41,017
|
|
|||||
|
Distributions to member
|
(1,968
|
)
|
(1,968
|
)
|
|||||||||||
|
Contributions from (distributions to) noncontrolling interests, net
|
(65
|
)
|
(120
|
)
|
(120
|
)
|
|||||||||
|
Contribution from member
|
662
|
|
662
|
|
|||||||||||
|
Other comprehensive income (loss)
|
(26
|
)
|
81
|
|
55
|
|
|||||||||
|
Purchase of Universal Studios Japan noncontrolling interests
|
(704
|
)
|
141
|
|
(1,736
|
)
|
(2,299
|
)
|
|||||||
|
Other
|
(84
|
)
|
185
|
|
466
|
|
651
|
|
|||||||
|
Net income (loss)
|
28
|
|
5,084
|
|
106
|
|
5,190
|
|
|||||||
|
Balance, December 31, 2017
|
$
|
409
|
|
$
|
42,295
|
|
$
|
(20
|
)
|
$
|
913
|
|
$
|
43,188
|
|
See accompanying notes to consolidated financial statements.
|
122
|
Comcast 2017 Annual Report on Form 10-K
|
|
|
|
Unless indicated otherwise, throughout these notes to the consolidated financial statements, we refer to NBCUniversal and its consolidated subsidiaries as “we,” “us” and “our.” We are one of the world’s leading media and entertainment companies that develops, produces and distributes entertainment, news and information, sports, and other content for global audiences, and owns and operates theme parks worldwide.
We present our operations as the following
four
reportable business segments: Cable Networks, Broadcast Television, Filmed Entertainment and Theme Parks. See Note 15 for additional information on our reportable business segments.
Our Cable Networks segment consists primarily of a diversified portfolio of cable television networks. Our cable networks are comprised of our national cable networks that provide a variety of entertainment, news and information, and sports content; our regional sports and news networks; our international cable networks; our cable television studio production operations; and our various digital properties.
Our Broadcast Television segment consists primarily of the NBC and Telemundo broadcast networks, our NBC and Telemundo owned local broadcast television stations, the NBC Universo national cable network, our broadcast television studio production operations; and our various digital properties.
Our Filmed Entertainment segment primarily produces, acquires, markets and distributes filmed entertainment worldwide. Our films are produced primarily under the Universal Pictures, Illumination, DreamWorks Animation and Focus Features
names.
See Note 4 for additional information on the DreamWorks Animation acquisition.
Our Theme Parks segment consists primarily of our Universal theme parks in Orlando, Florida; Hollywood, California; and Osaka, Japan. See Note 4 for additional information on the Universal Studios Japan transactions.
Basis of Presentation
The accompanying consolidated financial statements include all entities in which we have a controlling voting interest and variable interest entities (“VIEs”) required to be consolidated in accordance with generally accepted accounting principles in the United States (“GAAP”).
Transactions between NBCUniversal and both Comcast and Comcast’s consolidated subsidiaries are reflected in these consolidated financial statements and disclosed as related party transactions when material.
We translate assets and liabilities of our foreign operations where the functional currency is the local currency, primarily the Japanese yen, euro and British pound, into U.S. dollars at the exchange rate as of the balance sheet date and translate revenue and expenses using average monthly exchange rates. The related translation adjustments are recorded as a component of accumulated other comprehensive income (loss) in our consolidated balance sheet. Any foreign currency transaction gains or losses are included in our consolidated statement of income.
|
|
Our consolidated financial statements are prepared in accordance with GAAP, which require us to select accounting policies, including in certain cases industry-specific policies, and make estimates that affect the reported amount of assets, liabilities, revenue and expenses, and the related disclosure of contingent assets and contingent liabilities. Actual results could differ from these estimates. We believe that the judgments and related estimates for the following items are critical in the preparation of our consolidated financial statements:
|
•
|
revenue recognition (see below)
|
|
•
|
film and television costs (see Note 6)
|
|
•
|
goodwill and intangible assets (see Note 9)
|
In addition, the following accounting policy is specific to the industries in which we operate:
|
•
|
capitalization and amortization of film and television costs (see Note 6)
|
Information on other accounting policies and methods that we use in the preparation of our consolidated financial statements are included, where applicable, in their respective footnotes that follow. Below is a discussion of accounting policies and methods used in our consolidated financial statements that are not presented within other footnotes.
|
Comcast 2017 Annual Report on Form 10-K
|
123
|
|
NBCUniversal Media, LLC
Revenue Recognition
Cable Networks and Broadcast Television Segments
Our Cable Networks segment generates revenue primarily from the distribution of our cable network programming to traditional and virtual multichannel video providers; from the sale of advertising on our cable networks and digital properties; from the licensing of our owned programming, including programming from our cable television studio production operations, to cable and broadcast networks and subscription video on demand services; and from the sale of our owned programming on standard-definition digital video discs and Blu-ray discs (together, “DVDs”) and through digital distribution services such as iTunes. Our Broadcast Television segment generates revenue primarily from the sale of advertising on our broadcast networks, owned local broadcast television stations and digital properties; from the licensing of our owned programming by our broadcast television studio production operations to various distribution platforms, including to cable and broadcast networks as well as to subscription video on demand services; from the fees received under retransmission consent agreements and associated fees received from NBC-affiliated local broadcast television stations; and from the sale of our owned programming on DVDs and through digital distribution services.
We recognize revenue from distributors as programming is provided, generally under multiyear distribution agreements. From time to time, the distribution agreements expire while programming continues to be provided to the distributor based on interim arrangements while the parties negotiate new contract terms. Revenue recognition is generally limited to current payments being made by the distributor, typically under the prior contract terms, until a new contract is negotiated, sometimes with effective dates that affect prior periods. Differences between actual amounts determined upon resolution of negotiations and amounts recorded during these interim arrangements are recorded in the period of resolution. Advertising revenue for our Cable Networks and Broadcast Television segments is recognized in the period in which the advertising is aired or viewed. In some instances, we guarantee audience ratings for the advertising. To the extent there is a shortfall in the ratings that were guaranteed, a portion of the revenue is deferred until the shortfall is settled, primarily by providing additional advertising units. We recognize revenue from the licensing of our owned programming, including programming produced by our studios for third parties, when the content is made available for use by the licensee and when certain other conditions are met. When license fees include advertising time, we recognize the component of revenue associated with the advertisements when they are aired or viewed.
Filmed Entertainment Segment
Our Filmed Entertainment segment generates revenue primarily from the worldwide distribution of our produced and acquired films for exhibition in movie theaters, from the licensing of produced and acquired films through various distribution platforms, and from the sale of produced and acquired films on DVDs and through digital distribution services. Our Filmed Entertainment segment also generates revenue from Fandango, our movie ticketing and entertainment business, the sale of consumer products, the production and licensing of live stage plays, and the distribution of filmed entertainment produced by third parties. We recognize revenue from the distribution of films to movie theaters when the films are exhibited. We recognize revenue from the licensing of a film when the film is made available for use by the licensee, and when certain other conditions are met. We recognize revenue from the sale of DVDs, net of estimated returns and customer incentives, on the date that the DVDs are delivered to and made available for sale by retailers.
Theme Parks Segment
Our Theme Parks segment generates revenue primarily from ticket sales and guest spending at our Universal theme parks. We recognize revenue from advance theme park ticket sales when the tickets are used. For annual passes, we recognize revenue on a straight-line basis over the period following the activation date.
Advertising Expenses
Advertising costs are expensed as incurred.
Cash Equivalents
The carrying amounts of our cash equivalents approximate their fair values. Our cash equivalents consist primarily of money market funds and U.S. government obligations, as well as commercial paper and certificates of deposit with maturities of three months or less when purchased.
Derivative Financial Instruments
We use derivative financial instruments to manage our exposure to the risks associated with fluctuations in foreign exchange rates and interest rates. Our objective is to manage the financial and operational exposure arising from these risks by offsetting gains and losses on the underlying exposures with gains and losses on the derivatives used to economically hedge them.
Our derivative financial instruments are recorded in our consolidated balance sheet at fair value. The impact of our derivative financial instruments on our consolidated financial statements was not material in any of the periods presented.
|
124
|
Comcast 2017 Annual Report on Form 10-K
|
|
NBCUniversal Media, LLC
Fair Value Measurements
The accounting guidance related to fair value measurements establishes a hierarchy based on the types of inputs used for the various valuation techniques (market approach, income approach and cost approach). The levels of the hierarchy are described below.
|
•
|
Level 1: Values are determined using quoted market prices for identical financial instruments in an active market
|
|
•
|
Level 2: Values are determined using quoted prices for similar financial instruments and valuation models whose inputs are observable
|
|
•
|
Level 3: Values are determined using pricing models that use significant inputs that are primarily unobservable, discounted cash flow methodologies or similar techniques, as well as instruments for which the determination of fair value requires significant management judgment or estimation
|
We use these levels of hierarchy to measure the fair value of certain financial instruments on a recurring basis, such as for investments; on a non-recurring basis, such as for acquisitions and impairment testing; for disclosure purposes, such as long-term debt; and for other applications, as discussed in their respective footnotes. Our assessment of the significance of a particular input to the fair value measurement requires judgment and may affect the valuation and classification within the fair value hierarchy.
|
|
Revenue Recognition
In May 2014, the Financial Accounting Standards Board (“FASB”) updated the accounting guidance related to revenue recognition. The updated accounting guidance provides a single, contract-based revenue recognition model to help improve financial reporting by providing clearer guidance on when an entity should recognize revenue and by reducing the number of standards to which an entity has to refer. The updated guidance also requires additional disclosures regarding the nature, timing and uncertainty of our revenue transactions. We will adopt the updated accounting guidance in the first quarter of 2018 using the full retrospective method, which requires the adjustment of all prior periods presented to reflect the impacts of the updated guidance.
The adoption of the new standard will not have a material impact to our consolidated financial position or results of operations. However, we do expect that the new standard will impact the timing of the recognition of content licensing revenue associated with renewals or extensions of existing program licensing agreements in our Cable Networks, Broadcast Television and Filmed Entertainment segments, which will be recognized as revenue when the licensed content becomes available under the renewal or extension. These renewals or extensions were previously recognized as revenue when the agreement was executed.
Financial Assets and Financial Liabilities
In January 2016, the FASB updated the accounting guidance related to the recognition and measurement of financial assets and financial liabilities. The updated accounting guidance, among other things, requires that all nonconsolidated equity investments, except those accounted for under the equity method, be measured at fair value and that the changes in fair value be recognized in net income. The updated guidance is effective for us as of January 1, 2018. With certain exceptions, the updated accounting guidance requires a cumulative effect adjustment to beginning retained earnings in the year the guidance is adopted.
If we had adopted the provisions of the updated guidance as of January 1, 2017 for our equity investments classified as available-for-sale securities, primarily our investment in Snap Inc. (see Note 7), net income attributable to NBCUniversal would have decreased by
$233 million
in 2017. If we had adopted the provisions of the updated guidance as of January 1, 2017 for our cost method investments, the impact on our net income attributable to NBCUniversal would not have been material.
Leases
In February 2016, the FASB updated the accounting guidance related to leases. The updated accounting guidance requires lessees to recognize a right-of-use asset and a lease liability on the balance sheet for all leases with the exception of short-term leases. The asset and liability are initially measured based on the present value of committed lease payments. For a lessee, the recognition, measurement and presentation of expenses and cash flows arising from a lease do not significantly change from previous guidance. For a lessor, the accounting applied is also largely unchanged from previous guidance. The updated guidance is effective for us as of January 1, 2019 and early adoption is permitted. The updated accounting guidance must be adopted using a modified retrospective approach for leases that exist or are entered into after the beginning of the earliest comparative period in the financial statements. We are currently in the process of determining the impact that the updated accounting guidance will have on our consolidated financial statements.
See Note 14 for a summary of our undiscounted minimum rental commitments under operating leases as of December 31, 2017.
|
Comcast 2017 Annual Report on Form 10-K
|
125
|
|
NBCUniversal Media, LLC
|
|
2017
FCC Spectrum Auction
On April 13, 2017, the Federal Communications Commission announced the results of its spectrum auction. In the auction, we relinquished our spectrum rights in the New York, Philadelphia and Chicago designated market areas (“DMAs”) where NBC and Telemundo had overlapping spectrum. We received proceeds of $
482 million
in July 2017, which were recorded in other investing activities in our consolidated statement of cash flows. We recognized a pretax gain of
$337 million
in other operating gains in 2017. NBC and Telemundo stations will share broadcast signals in these DMAs.
Universal Studios Japan
On April 6, 2017, we acquired the remaining interests in Universal Studios Japan that we did not already own for $
2.3 billion
. The acquisition was funded through borrowings under our revolving credit agreement with Comcast. Because we maintained control of Universal Studios Japan, the difference between the consideration transferred and the recorded value of the noncontrolling interests, as well as the related accumulated other comprehensive income impacts, were recorded to additional paid-in capital.
2016
DreamWorks Animation
On August 22, 2016, Comcast acquired all of the outstanding stock of DreamWorks Animation for $
3.8 billion
. DreamWorks Animation’s stockholders received $
41
in cash for each share of DreamWorks Animation common stock. DreamWorks Animation creates animated feature films, television series and specials, live entertainment, and related consumer products.
Following the acquisition, Comcast converted DreamWorks Animation to a limited liability company and contributed its equity to us as a capital contribution. The net assets contributed to us excluded deferred income taxes and other tax-related items recorded by Comcast. The results of operations for DreamWorks Animation are reported in our Filmed Entertainment segment following the acquisition date and are presented as if the initial equity contribution occurred on the date of Comcast’s acquisition.
Allocation of Purchase Price
The transaction was accounted for under the acquisition method of accounting and, accordingly, the assets and liabilities are to be recorded at their fair market values as of the acquisition date. We recorded the acquired assets and liabilities of DreamWorks Animation at their estimated fair values based on valuation analyses. In valuing acquired assets and liabilities, fair value estimates were primarily based on Level 3 inputs including future expected cash flows, market rate assumptions and discount rates. The fair value of the assumed debt was primarily based on quoted market values. The fair value of the liability related to a tax receivable agreement that DreamWorks Animation had previously entered into with one of its former stockholders (the “tax receivable agreement”) was based on the contractual settlement provisions in the agreement. In 2017, we updated the allocation of purchase price for DreamWorks Animation based on final valuation analyses, which primarily resulted in increases to noncontrolling interests, intangible assets and goodwill, and a decrease to working capital. The changes did not have a material impact on our consolidated financial statements.
The table below presents the allocation of the purchase price to the assets and liabilities of DreamWorks Animation.
|
Allocation of Purchase Price
|
|||
|
(in millions)
|
|||
|
Film and television costs
|
$
|
838
|
|
|
Intangible assets
|
396
|
|
|
|
Working capital
|
156
|
|
|
|
Debt
|
(381
|
)
|
|
|
Tax receivable agreement
(a)
|
(146
|
)
|
|
|
Other noncurrent assets (liabilities) and other
(b)
|
461
|
|
|
|
Identifiable net assets (liabilities) acquired
|
1,324
|
|
|
|
Noncontrolling interests
|
(337
|
)
|
|
|
Goodwill (see Note 9)
|
2,786
|
|
|
|
Cash consideration transferred by Comcast
|
$
|
3,773
|
|
|
(a)
|
The tax receivable agreement was settled immediately following the acquisition and the payment was recorded as an operating activity in our consolidated statement of cash flows in 2016. Comcast made a separate cash capital contribution of
$146 million
to fund the settlement, which was recorded as a financing activity in our consolidated statement of cash flows.
|
|
126
|
Comcast 2017 Annual Report on Form 10-K
|
|
NBCUniversal Media, LLC
|
(b)
|
Other included
$279 million
recorded to member’s capital that represented deferred income tax assets and other tax-related items recorded by Comcast but excluded from the net assets contributed to us.
|
Revenue and net income attributable to the acquisition of DreamWorks Animation were not material for 2017 or 2016.
2015
Universal Studios Japan
On November 13, 2015, we acquired a
51%
economic interest in Universal Studios Japan for
$1.5 billion
. Universal Studios Japan is a consolidated subsidiary and its operations are reported in our Theme Parks segment. The acquisition was funded through cash on hand and borrowings under our commercial paper program. In our allocation of purchase price for this acquisition, we recorded goodwill of
$5.1 billion
, long-term debt of
$3.3 billion
and noncontrolling interests of
$1.4 billion
.
|
|
In the ordinary course of our business, we enter into transactions with Comcast.
We generate revenue from Comcast primarily from the distribution of our cable network programming, the fees received under retransmission consent agreements in our Broadcast Television segment and, to a lesser extent, the sale of advertising and our owned programming, and we incur expenses primarily related to advertising and various support services provided by Comcast to us.
In September 2016, as part of the Comcast cash management process, we and Comcast amended and restated our revolving credit agreements to increase the amount that we can borrow from Comcast and that Comcast can borrow from us from
$3 billion
to
$5 billion
and to extend the maturity date to 2026. Depending on the receivable or payable position, amounts owed by us to Comcast or to us by Comcast under the revolving credit agreements are presented under the captions “note payable to Comcast” and “note receivable from Comcast,” respectively, in our consolidated balance sheet and are presented as current since the amounts include daily borrowings and repayments throughout the year based on our working capital needs. The revolving credit agreements bear interest at floating rates equal to the interest rate calculation under Comcast’s revolving credit facility. The interest rate on Comcast’s revolving credit facility consists of a base rate plus a borrowing margin that is determined based on Comcast’s credit rating. As of
December 31, 2017
, the borrowing margin for London Interbank Offered Rate-based borrowings was
1.00%
.
Comcast is also the counterparty to one of our contractual obligations. As of both
December 31, 2017
and
2016
, the carrying value of the liability associated with this contractual obligation was
$383 million
.
The following tables present transactions with Comcast and its consolidated subsidiaries that are included in our consolidated financial statements.
|
Consolidated Balance Sheet
|
||||||
|
December 31 (in millions)
|
2017
|
|
2016
|
|
||
|
Transactions with Comcast and Consolidated Subsidiaries
|
||||||
|
Receivables, net
|
$
|
326
|
|
$
|
285
|
|
|
Accounts payable and accrued expenses related to trade creditors
|
$
|
54
|
|
$
|
55
|
|
|
Accrued expenses and other current liabilities
|
$
|
50
|
|
$
|
4
|
|
|
Note payable to Comcast
|
$
|
1,831
|
|
$
|
2,703
|
|
|
Long-term debt (see Note 10)
|
$
|
610
|
|
$
|
—
|
|
|
Other noncurrent liabilities
|
$
|
389
|
|
$
|
389
|
|
|
Consolidated Statement of Income
|
|||||||||
|
Year ended December 31 (in millions)
|
2017
|
|
2016
|
|
2015
|
|
|||
|
Transactions with Comcast and Consolidated Subsidiaries
|
|||||||||
|
Revenue
|
$
|
1,837
|
|
$
|
1,742
|
|
$
|
1,349
|
|
|
Total costs and expenses
|
$
|
(214
|
)
|
$
|
(220
|
)
|
$
|
(246
|
)
|
|
Other income (expense)
|
$
|
(250
|
)
|
$
|
(69
|
)
|
$
|
(37
|
)
|
|
Comcast 2017 Annual Report on Form 10-K
|
127
|
|
NBCUniversal Media, LLC
Distributions to NBCUniversal Holdings
In addition to the transaction amounts presented in the table above, we make distributions to NBCUniversal Holdings on a periodic basis to enable its owners to meet their obligations to pay taxes on taxable income generated by our businesses. We also make quarterly distributions to NBCUniversal Holdings to enable it to make its required quarterly payments to NBCUniversal Enterprise at an initial annual rate of
8.25%
on the
$9.4 billion
aggregate liquidation preference of its preferred units. On March 1, 2018, and thereafter on every fifth anniversary of such date, this rate will reset to
7.44%
plus the yield on actively traded United States Treasury securities having a 5 year maturity. These distributions are presented under the caption “distributions to member” in our consolidated statement of cash flows.
Share-Based Compensation
Comcast maintains share-based compensation plans that consist primarily of awards of restricted share units (“RSUs”) and stock options to certain employees and directors as part of its approach to long-term incentive compensation. Additionally, through its employee stock purchase plans, employees are able to purchase shares of Comcast common stock at a discount through payroll deductions. The cost associated with Comcast’s share-based compensation is based on an award’s estimated fair value at the date of grant and is recognized over the period in which any related services are provided. RSUs are valued based on the closing price of Comcast common stock on the date of grant and are discounted for the lack of dividends, if any, during the vesting period. Stock options are valued using the Black-Scholes option pricing model. Certain of our employees participate in these plans and the expense associated with their participation is settled in cash with Comcast. In 2017, 2016 and 2015, we recognized share-based compensation expense of $
133
million, $
99
million, and $
94
million, respectively. As of December 31, 2017, we had unrecognized pretax compensation expense of $
245
million related to nonvested Comcast RSUs and unrecognized pretax compensation expense of $
32
million related to nonvested Comcast stock options that will be recognized over a weighted-average period of approximately
1.8
years and
1.4
years, respectively.
|
|
|
December 31 (in millions)
|
2017
|
|
2016
|
|
||
|
Film Costs:
|
||||||
|
Released, less amortization
|
$
|
1,724
|
|
$
|
1,750
|
|
|
Completed, not released
|
50
|
|
50
|
|
||
|
In production and in development
|
1,149
|
|
1,310
|
|
||
|
2,923
|
|
3,110
|
|
|||
|
Television Costs:
|
||||||
|
Released, less amortization
|
2,259
|
|
1,953
|
|
||
|
In production and in development
|
818
|
|
853
|
|
||
|
3,077
|
|
2,806
|
|
|||
|
Programming rights, less amortization
|
2,677
|
|
2,570
|
|
||
|
8,677
|
|
8,486
|
|
|||
|
Less: Current portion of programming rights
|
1,606
|
|
1,241
|
|
||
|
Film and television costs
|
$
|
7,071
|
|
$
|
7,245
|
|
Based on our current estimates of the total remaining revenue from all sources (“ultimate revenue”), in
2018
we expect to amortize approximately
$1.7 billion
of film and television costs associated with our original film and television productions that have been released, or are completed and have not been released. Through 2020, we expect to amortize approximately
86%
of unamortized film and television costs for our released productions, excluding amounts allocated to acquired libraries.
As of
December 31, 2017
, acquired film and television libraries, which are included within the “released, less amortization” captions in the table above, had remaining unamortized costs of
$475 million
. These costs are generally amortized over a period not to exceed
20
years, and approximately
44%
of these costs are expected to be amortized through 2020.
|
128
|
Comcast 2017 Annual Report on Form 10-K
|
|
NBCUniversal Media, LLC
Capitalization of Film and Television Costs
We capitalize film and television production costs, including direct costs, production overhead, print costs, development costs and interest. We amortize capitalized film and television production costs, including acquired libraries, and accrue costs associated with participation and residual payments to programming and production expenses. We generally record the amortization and the accrued costs using the individual film forecast computation method, which amortizes the costs in the same ratio as the associated ultimate revenue. Estimates of ultimate revenue and total costs are based on anticipated release patterns, public acceptance and historical results for similar productions. Unamortized film and television production costs, including acquired libraries, are stated at the lower of unamortized cost or fair value. We do not capitalize costs related to the distribution of a film in movie theaters or the licensing or sale of a film or television production, which primarily include costs associated with marketing and distribution.
In determining the method of amortization and estimated life of an acquired film or television library, we generally use the method and the life that most closely follow the undiscounted cash flows over the estimated life of the asset.
When an event or a change in circumstance occurs that was known or knowable as of the balance sheet date and that indicates the fair value of a film is less than its unamortized costs, we determine the fair value of the film and record an impairment charge for the amount by which the unamortized capitalized costs exceed the film’s fair value. The estimated fair value of a production is based on Level 3 inputs that primarily use an analysis of future expected cash flows.
Adjustments to capitalized film production costs were not material in any of the periods presented.
We may enter into cofinancing arrangements with third parties to jointly finance or distribute certain of our film productions. Cofinancing arrangements can take various forms, but in most cases involve the grant of an economic interest in a film to an investor. The number of investors and the terms of these arrangements can vary, although investors generally assume the full risks and rewards for the portion of the film acquired in these arrangements. We account for the proceeds received from a third-party investor under these arrangements as a reduction to our capitalized film costs. Under these arrangements, the investor owns an undivided copyright interest in the film, and therefore in each period we record either a charge or a benefit to programming and production expenses to reflect the estimate of the third-party investor’s interest in the profit or loss of the film. The estimate of the third-party investor’s interest in the profit or loss of a film is determined using the ratio of actual revenue earned to date to the ultimate revenue expected to be recognized over the film’s useful life.
We capitalize the costs of programming content that we license but do not own, including rights to multiyear, live-event sports programming, at the earlier of when payments are made for the programming or when the license period begins and the content is made available for use. We amortize capitalized programming costs as the associated programs are broadcast. We generally amortize multiyear, live-event sports programming rights using the ratio of the current period revenue to the estimated ultimate revenue or under the terms of the contract.
Programming costs are recorded at the lower of unamortized cost or net realizable value on a program by program, package, channel or daypart basis. A daypart is an aggregation of programs broadcast during a particular time of day or programs of a similar type. Programming acquired by our Cable Networks segment is primarily tested on a channel basis for impairment, whereas programming acquired by our Broadcast Television segment is tested on a daypart basis. If we determine that the estimates of future cash flows are insufficient or if there is no plan to broadcast certain programming, we recognize an impairment charge to programming and production expenses.
|
Comcast 2017 Annual Report on Form 10-K
|
129
|
|
NBCUniversal Media, LLC
|
|
|
December 31 (in millions)
|
2017
|
|
2016
|
|
||
|
Fair Value Method:
|
||||||
|
Snap
|
$
|
430
|
|
$
|
—
|
|
|
Other
|
—
|
|
6
|
|
||
|
430
|
|
6
|
|
|||
|
Equity Method:
|
||||||
|
Hulu
|
249
|
|
225
|
|
||
|
Other
|
441
|
|
336
|
|
||
|
690
|
|
561
|
|
|||
|
Cost Method:
|
||||||
|
BuzzFeed
|
400
|
|
400
|
|
||
|
Other
|
296
|
|
296
|
|
||
|
|
696
|
|
696
|
|
||
|
Total investments
|
$
|
1,816
|
|
$
|
1,263
|
|
Fair Value Method
We classify publicly traded investments that are not accounted for under the equity method as available-for-sale (“AFS”) or trading securities. The estimated fair value of our publicly traded investments was primarily based on Level 1 inputs that use quoted market values. For other fair value method investments, the estimated fair value was based on Level 2 inputs that use pricing models whose inputs are derived primarily from or corroborated by observable market data through correlation or other means. For AFS securities, we record unrealized gains or losses resulting from changes in fair value between measurement dates as a component of other comprehensive income (loss), except when we consider declines in value to be other than temporary. For trading securities, we record unrealized gains or losses resulting from changes in fair value between measurement dates as a component of investment income (loss), net. We recognize realized gains and losses associated with our fair value method investments using the specific identification method. We classify the cash flows related to purchases of and proceeds from the sale of trading securities based on the nature of the securities and the purpose for which they were acquired.
Snap
In March 2017, Comcast acquired an interest in Snap Inc. as part of its initial public offering. On March 31, 2017, Comcast contributed its investment in Snap to us as an equity contribution of
$662 million
, which was recorded in our consolidated statement of equity based on the fair value of the investment as of March 31, 2017. We have classified our investment as an available-for-sale security. Snap is a camera company whose primary product is Snapchat, a camera app that was created to help people communicate through short videos and images.
Equity Method
We use the equity method to account for investments in which we have the ability to exercise significant influence over the investee’s operating and financial policies or in which we hold a significant partnership or limited liability company interest. Equity method investments are recorded at cost and are adjusted to recognize (1) our proportionate share of the investee’s net income or loss after the date of investment, (2) amortization of the recorded investment that exceeds our share of the book value of the investee’s net assets, (3) additional contributions made and dividends received, and (4) impairments resulting from other-than-temporary declines in fair value. For some investments, we record our share of the investee’s net income or loss one quarter in arrears due to the timing of our receipt of such information. Gains or losses on the sale of equity method investments are recorded to other income (expense), net. If an equity method investee were to issue additional securities that would change our proportionate share of the entity, we would recognize the change, if any, as a gain or loss to other income (expense), net.
Hulu
In 2017, 2016 and 2015, we made cash capital contributions totaling
$300 million
,
$50 million
and
$123 million
, respectively, to Hulu. In 2017, 2016 and 2015, we recognized our proportionate share of Hulu’s losses of
$276 million
,
$168 million
and
$106 million
, respectively.
In August 2016, Time Warner Inc. acquired a
10%
interest in Hulu, LLC, which diluted our interest in Hulu from
33%
to
30%
.
For a period not to exceed
3 years
, Time Warner may put its shares to Hulu or Hulu may call Time Warner’s shares under certain limited circumstances arising from regulatory review. Given the contingent nature of the put and call options, we recorded a deferred gain of
$159 million
and a corresponding increase to our investment in Hulu as a result of the dilution. The deferred gain will be recognized in other income (expense), net if and when the options expire unexercised.
|
130
|
Comcast 2017 Annual Report on Form 10-K
|
|
NBCUniversal Media, LLC
The Weather Channel
In January 2016, following a legal restructuring at The Weather Channel, we and the other investors sold the entity holding The Weather Channel’s product and technology businesses to IBM. Following the close of the transaction, we continue to hold an investment in The Weather Channel cable network through a new holding company. As a result of the sale of our investment, we recognized a pretax gain of
$108 million
in other income (expense), net.
In June and December 2015, The Weather Channel recorded impairment charges related to goodwill. In 2015, we recorded expenses of
$333 million
that represented our proportionate share of these impairment charges in equity in net income (losses) of investees, net.
Summarized Financial Information
The tables below present the summarized combined financial information of our equity method investments.
|
December 31 (in millions)
|
2017
|
|
2016
|
|
||
|
Current assets
|
$
|
2,612
|
|
$
|
2,105
|
|
|
Noncurrent assets
|
$
|
3,690
|
|
$
|
2,724
|
|
|
Current liabilities
|
$
|
2,205
|
|
$
|
1,921
|
|
|
Noncurrent liabilities
|
$
|
3,969
|
|
$
|
2,853
|
|
|
Year ended December 31 (in millions)
|
2017
|
|
2016
|
|
2015
|
|
|||
|
Revenue
|
$
|
4,234
|
|
$
|
4,285
|
|
$
|
3,944
|
|
|
Operating income (loss)
|
$
|
(465
|
)
|
$
|
(182
|
)
|
$
|
(1,609
|
)
|
|
Net income (loss)
|
$
|
(656
|
)
|
$
|
(313
|
)
|
$
|
(1,820
|
)
|
Cost Method
We use the cost method to account for investments not accounted for under the fair value method or the equity method.
In September 2015,
we
acquired an interest in BuzzFeed, Inc. and made an additional investment in Vox Media, Inc. for
$200 million
each in cash. In November 2016, we made an additional investment of
$200 million
in Buzzfeed.
Impairment Testing of Investments
We review our investment portfolio each reporting period to determine whether there are identified events or circumstances that would indicate there is a decline in the fair value that would be considered other than temporary. For our nonpublic investments, if there are no identified events or circumstances that would have a significant adverse effect on the fair value of the investment, then the fair value is not estimated. If an investment is deemed to have experienced an other-than-temporary decline below its cost basis, we reduce the carrying amount of the investment to its quoted or estimated fair value, as applicable, and establish a new cost basis for the investment. For our
AFS
securities and our cost method investments, we record the impairment to investment income (loss), net. For our equity method investments, we record the impairment to other income (expense), net.
|
|
|
December 31 (in millions)
|
Weighted-Average
Original Useful Life as of December 31, 2017 |
2017
|
|
2016
|
|
||
|
Buildings and leasehold improvements
|
31 years
|
$
|
8,124
|
|
$
|
7,543
|
|
|
Furniture, fixtures and equipment
|
11 years
|
4,843
|
|
4,158
|
|
||
|
Construction in process
|
N/A
|
1,506
|
|
1,176
|
|
||
|
Land
|
N/A
|
1,039
|
|
984
|
|
||
|
Property and equipment, at cost
|
15,512
|
|
13,861
|
|
|||
|
Less: Accumulated depreciation
|
|
4,166
|
|
3,350
|
|
||
|
Property and equipment, net
|
|
$
|
11,346
|
|
$
|
10,511
|
|
Property and equipment are stated at cost. We capitalize improvements that extend asset lives and expense repairs and maintenance costs as incurred. We record depreciation using the straight-line method over the asset’s estimated useful life. For assets that are
|
Comcast 2017 Annual Report on Form 10-K
|
131
|
|
NBCUniversal Media, LLC
sold or retired, we remove the applicable cost and accumulated depreciation and, unless the gain or loss on disposition is presented separately, we recognize it as a component of depreciation expense.
We evaluate the recoverability of our property and equipment whenever events or substantive changes in circumstances indicate that the carrying amount may not be recoverable. The evaluation is based on the cash flows generated by the underlying asset groups, including estimated future operating results, trends or other determinants of fair value. If the total of the expected future undiscounted cash flows were less than the carrying amount of the asset group, we would recognize an impairment charge to the extent the carrying amount of the asset group exceeded its estimated fair value. Unless presented separately, the impairment charge is included as a component of depreciation expense.
|
|
|
Goodwill
|
|
|
|
|
|
|
|
|
|
|
|||||
|
(in millions)
|
Cable
Networks |
|
Broadcast
Television |
|
Filmed
Entertainment |
|
Theme
Parks |
|
Total
|
|
|||||
|
Balance, December 31, 2015
|
$
|
12,947
|
|
$
|
806
|
|
$
|
267
|
|
$
|
6,344
|
|
$
|
20,364
|
|
|
Acquisitions
(a)
|
232
|
|
—
|
|
2,717
|
|
—
|
|
2,949
|
|
|||||
|
Adjustments
(b)
|
—
|
|
—
|
|
—
|
|
(250
|
)
|
(250
|
)
|
|||||
|
Foreign currency translation
|
4
|
|
—
|
|
9
|
|
247
|
|
260
|
|
|||||
|
Balance, December 31, 2016
|
13,183
|
|
806
|
|
2,993
|
|
6,341
|
|
23,323
|
|
|||||
|
Acquisitions
|
241
|
|
—
|
|
32
|
|
—
|
|
273
|
|
|||||
|
Adjustments
(c)
|
1
|
|
—
|
|
185
|
|
—
|
|
186
|
|
|||||
|
Foreign currency translation
|
2
|
|
—
|
|
2
|
|
203
|
|
207
|
|
|||||
|
Balance, December 31, 2017
|
$
|
13,427
|
|
$
|
806
|
|
$
|
3,212
|
|
$
|
6,544
|
|
$
|
23,989
|
|
|
(a)
|
Acquisitions in 2016 in our Filmed Entertainment segment primarily included the DreamWorks Animation acquisition
(see Note 4 for additional information).
|
|
(b)
|
Adjustments in 2016 included the updated allocation of the purchase price for Universal Studios Japan in our Theme Parks segment.
|
|
(c)
|
Adjustments in 2017 primarily included the updated allocation of the purchase price for DreamWorks Animation (see Note 4 for additional information).
|
Goodwill is calculated as the excess of the consideration transferred over the identifiable net assets acquired in a business combination and represents the future economic benefits expected to arise from anticipated synergies and intangible assets acquired that do not qualify for separate recognition, including assembled workforce, noncontractual relationships and other agreements. We assess the recoverability of our goodwill annually, or more frequently whenever events or substantive changes in circumstances indicate that the carrying amount of a reporting unit may exceed its fair value. We test goodwill for impairment at the reporting unit level. To determine our reporting units, we evaluate the components one level below the segment level and we aggregate the components if they have similar economic characteristics. As a result of this assessment, our reporting units are the same as our
four
reportable segments. We evaluate the determination of our reporting units used to test for impairment periodically or whenever events or substantive changes in circumstances occur. The assessment of recoverability may first consider qualitative factors to determine whether the existence of events or circumstances leads to a determination that it is more likely than not that the fair value of a reporting unit is less than its carrying amount. A quantitative assessment is performed if the qualitative assessment results in a more-likely-than-not determination or if a qualitative assessment is not performed. The quantitative assessment considers whether the carrying amount of a reporting unit exceeds its fair value, in which case an impairment charge is recorded to the extent the carrying amount of the reporting unit’s goodwill exceeds its implied fair value. Unless presented separately, the impairment charge is included as a component of amortization expense. We did not recognize any impairment charges in any of the periods presented.
|
132
|
Comcast 2017 Annual Report on Form 10-K
|
|
NBCUniversal Media, LLC
|
Intangible Assets
|
|||||||||||||
|
|
|
2017
|
2016
|
||||||||||
|
December 31 (in millions)
|
Weighted-Average
Original Useful Life as of December 31, 2017 |
Gross
Carrying Amount |
|
Accumulated
Amortization |
|
Gross
Carrying Amount |
|
Accumulated
Amortization |
|
||||
|
Finite-Lived Intangible Assets:
|
|||||||||||||
|
Customer relationships
|
19 years
|
$
|
13,301
|
|
$
|
(5,643
|
)
|
$
|
13,173
|
|
$
|
(4,952
|
)
|
|
Software
|
5 years
|
1,516
|
|
(737
|
)
|
1,195
|
|
(563
|
)
|
||||
|
Other
|
16 years
|
2,580
|
|
(1,205
|
)
|
2,345
|
|
(1,053
|
)
|
||||
|
Indefinite-Lived Intangible Assets:
|
|||||||||||||
|
Trade names
|
N/A
|
2,981
|
|
2,981
|
|
||||||||
|
FCC licenses
|
N/A
|
513
|
|
|
651
|
|
|
||||||
|
Total
|
|
$
|
20,891
|
|
$
|
(7,585
|
)
|
$
|
20,345
|
|
$
|
(6,568
|
)
|
Indefinite-Lived Intangible Assets
Indefinite-lived intangible assets consist of trade names and FCC licenses. We assess the recoverability of our indefinite-lived intangible assets annually, or more frequently whenever events or substantive changes in circumstances indicate that the assets might be impaired. We evaluate the unit of account used to test for impairment of our
indefinite-lived intangible assets periodically or whenever events or substantive changes in circumstances occur to ensure impairment testing is performed at an appropriate level. The assessment of recoverability may first consider qualitative factors to determine whether it is more likely than not that the fair value of an indefinite-lived intangible asset is less than its carrying amount. A quantitative assessment is performed if the qualitative assessment results in a more-likely-than-not determination or if a qualitative assessment is not performed. When performing a quantitative assessment, we estimate the fair value of our
indefinite-lived intangible assets primarily based on a discounted cash flow analysis that involves significant judgment. When analyzing the fair values indicated under the discounted cash flow models, we also consider multiples of Adjusted EBITDA generated by the underlying assets, current market transactions, and profitability information. If the fair value of our
indefinite-lived intangible assets were less than the carrying amount, we would recognize an impairment charge for the difference between the estimated fair value and the carrying value of the assets. Unless presented separately, the impairment charge is included as a component of amortization expense. We did not recognize any material impairment charges in any of the periods presented.
Finite-Lived Intangible Assets
|
Estimated Amortization Expense of Finite-Lived Intangible Assets
|
|||
|
(in millions)
|
|
||
|
2018
|
$
|
1,018
|
|
|
2019
|
$
|
1,010
|
|
|
2020
|
$
|
968
|
|
|
2021
|
$
|
866
|
|
|
2022
|
$
|
786
|
|
Finite-lived intangible assets are subject to amortization and consist primarily of customer relationships acquired in business combinations, intellectual property rights and software.
Our finite-lived intangible assets are amortized primarily on a straight-line basis over their estimated useful life or the term of the associated agreement.
We capitalize direct development costs associated with internal-use software, including external direct costs of material and services and payroll costs for employees devoting time to these software projects. We also capitalize costs associated with the purchase of software licenses. We
generally amortize them on a straight-line basis over a period not to exceed
five years
.
We expense maintenance and training costs, as well as costs incurred during the preliminary stage of a project, as they are incurred. We capitalize initial operating system software costs and amortize them over the life of the associated hardware.
We evaluate the recoverability of our finite-lived intangible assets whenever events or substantive changes in circumstances indicate that the carrying amount may not be recoverable. The evaluation is based on the cash flows generated by the underlying asset groups, including estimated future operating results, trends or other determinants of fair value. If the total of the expected future undiscounted cash flows were less than the carrying amount of the asset group, we would recognize an impairment charge to the extent the carrying amount of the asset group exceeded its estimated fair value. Unless presented separately, the impairment charge is included as a component of amortization expense.
|
Comcast 2017 Annual Report on Form 10-K
|
133
|
|
NBCUniversal Media, LLC
|
|
|
Long-Term Debt Outstanding
|
|||||||||
|
December 31 (in millions)
|
Weighted-Average
Interest Rate as of December 31, 2017 |
|
2017
|
|
2016
|
|
|||
|
Term loans
(a)
|
0.79
|
%
|
$
|
3,860
|
|
$
|
3,262
|
|
|
|
Senior notes with maturities of 5 years or less, at face value
|
4.76
|
%
|
4,000
|
|
4,000
|
|
|||
|
Senior notes with maturities between 5 and 10 years, at face value
|
2.88
|
%
|
1,000
|
|
1,000
|
|
|||
|
Senior notes with maturities greater than 10 years, at face value
|
5.50
|
%
|
2,759
|
|
3,200
|
|
|||
|
Notes due 2049 to Comcast
|
4.00
|
%
|
610
|
|
—
|
|
|||
|
Other, including capital lease obligations
|
—
|
|
276
|
|
138
|
|
|||
|
Debt issuance costs, premiums, discounts and fair value adjustments for hedged positions, net
|
—
|
|
(32
|
)
|
(12
|
)
|
|||
|
Total debt
|
3.49
|
%
|
12,473
|
|
11,588
|
|
|||
|
Less: Current portion
|
198
|
|
127
|
|
|||||
|
Long-term debt
|
$
|
12,275
|
|
$
|
11,461
|
|
|||
|
(a)
|
The December 31, 2017 and 2016 amounts consist of
¥435 billion
and
¥382 billion
, respectively, of Universal Studios Japan term loans translated using the exchange rates as of these dates. In May 2017, Universal Studios Japan entered into
¥450 billion
of new term loans with a final maturity of March 2022. We used the proceeds from these borrowings to repay in full Universal Studios Japan’s existing yen-denominated term loans and a portion of amounts outstanding under our revolving credit agreement with Comcast.
|
As of
December 31, 2017
and
2016
, our debt, excluding our revolving credit agreement with Comcast, had an estimated fair value of
$13.5 billion
and
$12.6 billion
, respectively.
The estimated fair value of our publicly traded debt was primarily based on Level 1 inputs that use quoted market values for the debt. The estimated fair value of debt for which there are no quoted market prices was based on Level 2 inputs that use interest rates available to us for debt with similar terms and remaining maturities.
|
Principal Maturities of Debt
|
|||
|
(in millions)
|
|
||
|
2018
|
$
|
200
|
|
|
2019
|
$
|
147
|
|
|
2020
|
$
|
2,268
|
|
|
2021
|
$
|
2,349
|
|
|
2022
|
$
|
2,981
|
|
|
Thereafter
|
$
|
4,560
|
|
Cross-Guarantee Structure
We, Comcast and a
100%
owned cable holding company subsidiary of Comcast (“CCCL Parent”) fully and unconditionally guarantee each other’s debt securities, including the
$7 billion
Comcast revolving credit facility due 2021. As of
December 31, 2017
, outstanding debt securities of
$49.1 billion
of Comcast and CCCL Parent were subject to the cross-guarantee structure.
We do not, however, guarantee the obligations of NBCUniversal Enterprise with respect to its
$4.8 billion
aggregate principal amount of senior notes,
$1.5 billion
revolving credit facility, commercial paper program, or
$725 million
liquidation preference of Series A cumulative preferred stock.
The Universal Studios Japan term loans are not subject to the cross-guarantee structure, however they have a separate guarantee from Comcast.
Senior Notes Exchange
In October 2017, we and Comcast completed a debt exchange transaction. Comcast issued
$2.0 billion
aggregate principal amount of new
3.97%
senior notes due 2047,
$2.0 billion
aggregate principal amount of new
4.00%
senior notes due 2049, and
$1.5 billion
aggregate principal amount of new
4.05%
senior notes due 2052 in exchange for
$3.9 billion
aggregate principal amount of certain series of outstanding senior notes issued by Comcast and us, including
$442 million
of our
6.40%
senior notes due 2040. The new notes are fully and unconditionally guaranteed by us and CCCL Parent. In connection with the exchange transaction, we issued
$610 million
of
4.00%
notes due 2049 to Comcast. The debt exchange transaction was accounted for as a debt extinguishment, and therefore we recorded a charge of
$157 million
to interest expense upon retirement of the old notes.
|
134
|
Comcast 2017 Annual Report on Form 10-K
|
|
NBCUniversal Media, LLC
|
|
Deferred Compensation Plans
|
Year ended December 31 (in millions)
|
2017
|
|
2016
|
|
2015
|
|
|||
|
Benefit obligation
|
$
|
621
|
|
$
|
494
|
|
$
|
417
|
|
|
Interest expense
|
$
|
64
|
|
$
|
48
|
|
$
|
28
|
|
Certain members of management participate in Comcast’s unfunded, nonqualified deferred compensation plan. The amount of compensation deferred by each participant is based on participant elections. Participant accounts are credited with income primarily based on a fixed annual rate.
Additionally, we maintain unfunded, nonqualified deferred compensation plans for certain members of management. The amount of compensation deferred by each participant is based on participant elections. Participants designate one or more valuation funds, independently established funds or indices that are used to determine the amount of investment gain or loss in the participant’s account.
Deferred compensation plan participants are eligible to receive distributions from their account based on elected deferral periods that are consistent with the plans and applicable tax law.
Postretirement Benefit Plan
|
Year ended December 31 (in millions)
|
2017
|
|
2016
|
|
||
|
Benefit obligation
|
$
|
51
|
|
$
|
192
|
|
|
Amounts in accumulated other comprehensive income not yet recognized in benefits expense
|
$
|
(177
|
)
|
$
|
(42
|
)
|
We provide postretirement benefits to eligible employees through a retiree health and welfare benefits plan. The plan provides credit to employees for length of service provided before Comcast’s acquisition of NBCUniversal.
The plan provides eligible employees who retire from NBCUniversal with an annual stipend for reimbursement of certain eligible healthcare costs. The amount of the stipend for an eligible retiree is fixed at a predetermined amount based on the retiree’s years of service and whether the retiree is eligible for Medicare. In 2017, the plan was amended primarily to reduce the benefits of active employees who retire after December 31, 2017. The plan amendment reduced the benefit obligation by
$146 million
in 2017.
The plan is unfunded and substantially all of our postretirement benefit obligations are recorded to noncurrent liabilities. The expense we recognize for the plan is determined using certain assumptions, including the discount rate. The benefits expense we recognized for the plan was not material in any of the periods presented.
Pension Plans
We sponsor
various nonqualified defined benefit pension plans for domestic employees. Since the future benefits have been frozen since the beginning of 2013, we did not recognize service costs related to
our pension plans in any of the periods presented. The benefits expense we recognized for our defined benefit plans was not material for any period presented. In addition to the defined benefit plans we sponsor, we are
also obligated to reimburse The General Electric Company (“GE”) for future benefit payments to those participants who were vested in the supplemental pension plan sponsored by GE at the time of
Comcast’s acquisition of NBCUniversal. These pension plans are currently unfunded and we recorded a benefit obligation of
$338 million
and
$314 million
as of
December 31, 2017
and
2016
, respectively, which consists primarily of our obligations to reimburse GE.
Retirement Investment Plans
We sponsor several defined contribution retirement plans, including 401(k) plans, that allow eligible employees to contribute a portion of their compensation through payroll deductions in accordance with specified plan guidelines. We make contributions to the plans that include matching a percentage of the employees’ contributions up to certain limits. In
2017
,
2016
and
2015
, expenses related to these plans totaled
$201 million
,
$185 million
and
$174 million
, respectively.
Multiemployer Benefit Plans
We participate in various multiemployer benefit plans, including pension and postretirement benefit plans, that cover some of our employees and temporary employees who are represented by labor unions. We also participate in other multiemployer benefit plans that provide health and welfare and retirement savings benefits to active and retired participants. We make periodic contributions to these plans in accordance with the terms of applicable collective bargaining agreements and laws but do not sponsor or administer these plans. We do not participate in any multiemployer benefit plans for which we consider our contributions to be individually significant.
|
Comcast 2017 Annual Report on Form 10-K
|
135
|
|
NBCUniversal Media, LLC
In
2017
,
2016
and
2015
, the total contributions we made to multiemployer pension plans were
$97 million
,
$84 million
and
$77 million
, respectively. In
2017
,
2016
and
2015
, the total contributions we made to multiemployer postretirement and other benefit plans were
$152 million
,
$136 million
and
$119 million
, respectively.
If we cease to be obligated to make contributions or were to otherwise withdraw from participation in any of these plans, applicable law would require us to fund our allocable share of the unfunded vested benefits, which is known as a withdrawal liability. In addition, actions taken by other participating employers may lead to adverse changes in the financial condition of one of these plans, which could result in an increase in our withdrawal liability.
Severance Benefits
We provide severance benefits to certain former employees. A liability is recorded when payment is probable, the amount is reasonably estimable, and the obligation relates to rights that have vested or accumulated. In
2017
,
2016
and
2015
, we recorded severance costs of
$108 million
,
$165 million
and
$113 million
, respectively. Severance costs in 2016 included
$61 million
of severance costs associated with the acquisition of DreamWorks Animation.
|
|
|
Components of Income Tax Expense
|
|||||||||
|
Year ended December 31 (in millions)
|
2017
|
|
2016
|
|
2015
|
|
|||
|
Foreign
|
|||||||||
|
Current income tax expense
|
$
|
201
|
|
$
|
38
|
|
$
|
81
|
|
|
Deferred income tax expense
|
(7
|
)
|
96
|
|
2
|
|
|||
|
Withholding tax expense
|
187
|
|
158
|
|
139
|
|
|||
|
U.S. domestic tax expense
|
11
|
|
13
|
|
5
|
|
|||
|
Income tax expense
|
$
|
392
|
|
$
|
305
|
|
$
|
227
|
|
We are a limited liability company, and our company is disregarded for U.S. federal income tax purposes as an entity separate from NBCUniversal Holdings, a tax partnership. For U.S federal and state income tax purposes, our income is included in tax returns filed by Comcast and its subsidiaries, and therefore we are not expected to incur any significant current or deferred U.S. domestic income taxes and do not expect any significant impacts from the 2017 federal tax reform legislation. Our tax liability is comprised primarily of withholding tax on foreign licensing activity and income taxes on foreign earnings. As a result of our tax status, the deferred tax assets and liabilities included in our consolidated balance sheet at
December 31, 2017
and
2016
were not material.
In jurisdictions in which we are subject to income taxes, we
base our provision for income taxes on our current period income, changes in our deferred income tax assets and liabilities, income tax rates, changes in estimates of our uncertain tax positions, and tax planning opportunities available in the jurisdictions in which we operate. We recognize deferred tax assets and liabilities when there are temporary differences between the financial reporting basis and tax basis of our assets and liabilities and for the expected benefits of using net operating loss carryforwards. When a change in the tax rate or tax law has an impact on deferred taxes, we apply the change based on the years in which the temporary differences are expected to reverse. We record the change in our consolidated financial statements in the period of enactment.
We classify interest and penalties, if any, associated with our uncertain tax positions as a component of income tax expense.
Uncertain Tax Positions
We retain liabilities for uncertain tax positions where we are the tax filer of record. GE and Comcast have indemnified NBCUniversal Holdings and us with respect to our income tax obligations attributable to periods prior to Comcast’s acquisition of NBCUniversal, including indemnification of uncertain tax positions for these periods. The liabilities for uncertain tax positions included in our consolidated balance sheet were not material as of
December 31, 2017
and
2016
.
Various domestic and foreign tax authorities are examining our tax returns through tax year 2016. The majority of the periods under examination relate to tax years 2009 and forward.
|
136
|
Comcast 2017 Annual Report on Form 10-K
|
|
NBCUniversal Media, LLC
|
|
|
Receivables
|
||||||
|
December 31 (in millions)
|
2017
|
|
2016
|
|
||
|
Receivables, gross
|
$
|
7,184
|
|
$
|
6,799
|
|
|
Less: Allowance for returns and customer incentives
|
414
|
|
413
|
|
||
|
Less: Allowance for doubtful accounts
|
88
|
|
84
|
|
||
|
Receivables, net
|
$
|
6,682
|
|
$
|
6,302
|
|
In addition to the amounts in the table above, as of
December 31, 2017
and
2016
, noncurrent receivables of
$1.2 billion
and
$939 million
,
respectively, are included in other noncurrent assets, net that primarily relate to the licensing of our television and film productions to third parties
.
|
Accumulated Other Comprehensive Income (Loss)
|
||||||
|
December 31 (in millions)
|
2017
|
|
2016
|
|
||
|
Unrealized gains (losses) on marketable securities
|
$
|
(233
|
)
|
$
|
—
|
|
|
Deferred gains (losses) on cash flow hedges
|
10
|
|
23
|
|
||
|
Unrecognized gains (losses) on employee benefit obligations
|
126
|
|
14
|
|
||
|
Cumulative translation adjustments
|
77
|
|
(172
|
)
|
||
|
Accumulated other comprehensive income (loss)
|
$
|
(20
|
)
|
$
|
(135
|
)
|
|
Cash Payments for Interest and Income Taxes
|
|||||||||
|
Year ended December 31 (in millions)
|
2017
|
|
2016
|
|
2015
|
|
|||
|
Interest
|
$
|
517
|
|
$
|
548
|
|
$
|
456
|
|
|
Income taxes
|
$
|
282
|
|
$
|
208
|
|
$
|
182
|
|
Noncash Investing and Financing Activities
During
2017
:
|
•
|
we acquired
$325 million
of property and equipment and intangible assets that were accrued but unpaid
|
|
•
|
Comcast contributed its investment in Snap to us at its fair value, which was a noncash transaction (see Note 7 for additional information)
|
|
•
|
we and Comcast completed a senior notes exchange in the fourth quarter of 2017 (see Note 10 for additional information)
|
During
2016
:
|
•
|
we acquired
$189 million
of property and equipment and intangible assets that were accrued but unpaid
|
|
•
|
Comcast contributed the net assets of DreamWorks Animation to us, which was primarily a noncash transaction (see Note 4 for additional information)
|
During
2015
:
|
•
|
we acquired
$287 million
of property and equipment and intangible assets that were accrued but unpaid
|
|
•
|
Comcast contributed the net assets of
$252 million
related to an acquired business, which was a noncash transaction
|
|
•
|
we assumed liabilities related to the Universal Studios Japan transaction
|
|
|
Commitments
We enter into long-term commitments with third parties in the ordinary course of our business, including commitments to acquire film and television programming, obligations under various creative talent agreements, and various other television-related commitments. Some of our employees, including writers, directors, actors, technical and production personnel, and others, as well as some of our on-air and creative talent, are covered by collective bargaining agreements or works councils. As of
December 31, 2017
, the total number of employees covered by collective bargaining agreements was
9,500
full-time equivalent employees.
|
Comcast 2017 Annual Report on Form 10-K
|
137
|
|
NBCUniversal Media, LLC
Approximately
63%
of these full-time equivalent employees were covered by collective bargaining agreements that have expired or are scheduled to expire during
2018
.
The table below summarizes our minimum annual programming and talent commitments and our minimum annual rental commitments under operating leases for office space and equipment. Programming and talent commitments include acquired film and television programming, including U.S. broadcast rights to the Olympic Games through 2032,
Sunday Night Football
through the 2022-23 season
,
certain NASCAR events through 2024
and other programming commitments, as well as various contracts with creative talent.
|
As of December 31, 2017 (in millions)
|
Programming and
Talent Commitments
|
|
Operating
Leases
|
|
||
|
2018
|
$
|
6,343
|
|
$
|
209
|
|
|
2019
|
$
|
3,893
|
|
$
|
195
|
|
|
2020
|
$
|
4,812
|
|
$
|
182
|
|
|
2021
|
$
|
3,301
|
|
$
|
163
|
|
|
2022
|
$
|
3,732
|
|
$
|
139
|
|
|
Thereafter
|
$
|
17,416
|
|
$
|
1,223
|
|
The table below presents our rental expense charged to operations.
|
Year ended December 31 (in millions)
|
2017
|
|
2016
|
|
2015
|
|
|||
|
Rental expense
|
$
|
274
|
|
$
|
259
|
|
$
|
213
|
|
Contractual Obligation
We are party to a contractual obligation that involves an interest held by a third party in the revenue of certain theme parks. The arrangement provides the counterparty with the right to periodic payments associated with current period revenue which are recorded as an operating expense, and beginning in June 2017, the option to require NBCUniversal to purchase the interest for cash in an amount based on a contractual formula. The contractual formula is based on an average of specified historical theme park revenue at the time of exercise, which amount could be significantly higher than our carrying value.
As of
December 31, 2017
, our carrying value was
$1.1 billion
, and the estimated value of the contractual obligation was
$1.5 billion
based on inputs to the contractual formula as of that date.
|
|
We present our operations in
four
reportable business segments: Cable Networks, Broadcast Television, Filmed Entertainment and Theme Parks. We use Adjusted EBITDA to evaluate the profitability of our operating segments, and the components of net income attributable to NBCUniversal excluded from Adjusted EBITDA are not separately evaluated. Our financial data by business segment is presented in the tables below.
We do not present a measure of total assets for our reportable business segments as this information is not used by management to allocate resources and capital.
|
(in millions)
|
Revenue
(d)
|
|
Adjusted
EBITDA (e) |
|
Depreciation and
Amortization |
|
Capital
Expenditures |
|
Cash Paid for
Intangible Assets |
|
|||||
|
2017
|
|||||||||||||||
|
Cable Networks
|
$
|
10,631
|
|
$
|
4,076
|
|
$
|
755
|
|
$
|
33
|
|
$
|
19
|
|
|
Broadcast Television
|
9,546
|
|
1,253
|
|
133
|
|
180
|
|
22
|
|
|||||
|
Filmed Entertainment
|
7,658
|
|
1,277
|
|
109
|
|
58
|
|
23
|
|
|||||
|
Theme Parks
|
5,443
|
|
2,384
|
|
648
|
|
960
|
|
78
|
|
|||||
|
Headquarters and Other
(a)
|
45
|
|
(801
|
)
|
396
|
|
271
|
|
153
|
|
|||||
|
Eliminations
(b)
|
(326
|
)
|
(4
|
)
|
—
|
|
—
|
|
—
|
|
|||||
|
Total
|
$
|
32,997
|
|
$
|
8,185
|
|
$
|
2,041
|
|
$
|
1,502
|
|
$
|
295
|
|
|
138
|
Comcast 2017 Annual Report on Form 10-K
|
|
NBCUniversal Media, LLC
|
(in millions)
|
Revenue
(d)
|
|
Adjusted
EBITDA (e) |
|
Depreciation and
Amortization |
|
Capital
Expenditures |
|
Cash Paid for
Intangible Assets |
|
|||||
|
2016
|
|||||||||||||||
|
Cable Networks
(c)
|
$
|
10,464
|
|
$
|
3,709
|
|
$
|
745
|
|
$
|
32
|
|
$
|
20
|
|
|
Broadcast Television
(c)
|
10,147
|
|
1,320
|
|
125
|
|
153
|
|
19
|
|
|||||
|
Filmed Entertainment
|
6,360
|
|
697
|
|
47
|
|
33
|
|
16
|
|
|||||
|
Theme Parks
|
4,946
|
|
2,190
|
|
512
|
|
922
|
|
72
|
|
|||||
|
Headquarters and Other
(a)
|
20
|
|
(699
|
)
|
376
|
|
312
|
|
156
|
|
|||||
|
Eliminations
(b)
|
(344
|
)
|
10
|
|
—
|
|
—
|
|
—
|
|
|||||
|
Total
|
$
|
31,593
|
|
$
|
7,227
|
|
$
|
1,805
|
|
$
|
1,452
|
|
$
|
283
|
|
|
(in millions)
|
Revenue
(d)
|
|
Adjusted
EBITDA (e) |
|
Depreciation and
Amortization |
|
Capital
Expenditures |
|
Cash Paid for
Intangible Assets |
|
|||||
|
2015
|
|||||||||||||||
|
Cable Networks
|
$
|
9,628
|
|
$
|
3,499
|
|
$
|
784
|
|
$
|
44
|
|
$
|
22
|
|
|
Broadcast Television
(c)
|
8,530
|
|
780
|
|
111
|
|
117
|
|
17
|
|
|||||
|
Filmed Entertainment
|
7,287
|
|
1,234
|
|
26
|
|
14
|
|
20
|
|
|||||
|
Theme Parks
|
3,339
|
|
1,464
|
|
292
|
|
833
|
|
54
|
|
|||||
|
Headquarters and Other
(a)
|
14
|
|
(625
|
)
|
326
|
|
378
|
|
98
|
|
|||||
|
Eliminations
(b)
|
(336
|
)
|
6
|
|
—
|
|
—
|
|
—
|
|
|||||
|
Total
|
$
|
28,462
|
|
$
|
6,358
|
|
$
|
1,539
|
|
$
|
1,386
|
|
$
|
211
|
|
|
(a)
|
Headquarters and Other activities include costs associated with overhead, allocations, personnel costs and headquarter initiatives.
|
|
(b)
|
Eliminations are transactions that our segments enter into with one another, which consisted primarily of the licensing of film and television content from our Filmed Entertainment and Broadcast Television segments to our Cable Networks segment; for segment reporting, revenue is recognized as the programming rights asset for the licensed content is amortized based on third party revenue.
|
|
(c)
|
The revenue and operating costs and expenses associated with our broadcast of the 2016 Rio Olympics were reported in our Cable Networks and Broadcast Television segments. The revenue and operating costs and expenses associated with our broadcast of the 2015 Super Bowl were reported in our Broadcast Television segment.
|
|
(d)
|
We operate primarily in the United States, but also in select international markets primarily in Europe and Asia. The table below summarizes revenue by geographic location.
No single customer accounted for a significant amount of revenue in any of the periods presented.
|
|
Year ended December 31 (in millions)
|
2017
|
|
2016
|
|
2015
|
|
|||
|
Revenue:
|
|||||||||
|
United States
|
$
|
25,345
|
|
$
|
25,076
|
|
$
|
22,663
|
|
|
Foreign
|
$
|
7,652
|
|
$
|
6,517
|
|
$
|
5,799
|
|
|
(e)
|
We use Adjusted EBITDA as the measure of profit or loss for our operating segments. Adjusted EBITDA is defined as net income attributable to NBCUniversal before net (income) loss attributable to noncontrolling interests, income tax expense, total other income (expense), depreciation and amortization expense, and other operating gains, and excluding impairment charges related to fixed and intangible assets and gains or losses on the sale of long-lived assets, if any. From time to time we may exclude from Adjusted EBITDA the impact of events, gains, losses or other charges (such as significant legal settlements) that affect the period-to-period comparability of our operating performance. This measure eliminates the significant level of noncash amortization expense that results from intangible assets recognized in business combinations. Additionally, it is unaffected by our capital and tax structures and by our investment activities. We use this measure to evaluate the operating performance of our operating segments and to allocate resources and capital to our operating segments. It is also a significant performance measure in our annual incentive compensation programs. We believe that this measure is useful to investors because it is one of the bases for comparing our operating performance with that of other companies in our industries, although our measure may not be directly comparable to similar measures used by other companies. This measure should not be considered a substitute for operating income (loss), net income (loss), net income (loss) attributable to NBCUniversal, net cash provided by operating activities, or other measures we have reported in accordance with GAAP. Our reconciliation of the aggregate amount of Adjusted EBITDA for our reportable segments to consolidated income before income taxes is presented in the table below.
|
|
Year ended December 31 (in millions)
|
2017
|
|
2016
|
|
2015
|
|
|||
|
Adjusted EBITDA
|
$
|
8,185
|
|
$
|
7,227
|
|
$
|
6,358
|
|
|
Depreciation
|
(994
|
)
|
(861
|
)
|
(669
|
)
|
|||
|
Amortization
|
(1,047
|
)
|
(944
|
)
|
(870
|
)
|
|||
|
Other operating gains
|
337
|
|
—
|
|
—
|
|
|||
|
Total other income (expense)
|
(871
|
)
|
(571
|
)
|
(968
|
)
|
|||
|
Income before income taxes
|
$
|
5,610
|
|
$
|
4,851
|
|
$
|
3,851
|
|
|
Comcast 2017 Annual Report on Form 10-K
|
139
|
|
To the Board of Directors and Stockholders of
Comcast Corporation
Philadelphia, Pennsylvania
Opinion on the Consolidated Financial Statement Schedule
We have audited the consolidated financial statements of Comcast Corporation and subsidiaries (the “Company”) as of
December 31, 2017
and
2016
, and for each of the three years in the period ended
December 31, 2017
, and the Company’s internal control over financial reporting as of
December 31, 2017
, and have issued our report thereon dated
January 31, 2018
; such consolidated financial statements and reports are included elsewhere in this Form 10-K. Our audits also included the consolidated financial statement schedule of the Company listed in the Index at Item 15. This consolidated financial statement schedule is the responsibility of the Company’s management. Our responsibility is to express an opinion on the Company’s consolidated financial statement schedule based on our audits. In our opinion, such consolidated financial statement schedule, when considered in relation to the consolidated financial statements taken as a whole, presents fairly, in all material respects, the information set forth therein.
/s/ Deloitte & Touche LLP
Philadelphia, Pennsylvania
January 31, 2018
|
140
|
Comcast 2017 Annual Report on Form 10-K
|
|
To the Member of NBCUniversal Media, LLC
New York, New York
Opinion on the Consolidated Financial Statement Schedule
We have audited the consolidated financial statements of NBCUniversal Media, LLC and subsidiaries (the “Company”) as of
December 31, 2017
and
2016
, and for each of the three years in the period ended
December 31, 2017
, and have issued our report thereon dated
January 31, 2018
; such consolidated financial statements and report are included elsewhere in this Form 10-K. Our audits also included the consolidated financial statement schedule of the Company listed in the Index at Item 15. This consolidated financial statement schedule is the responsibility of the Company’s management. Our responsibility is to express an opinion on the Company’s consolidated financial statement schedule based on our audits. In our opinion, such consolidated financial statement schedule, when considered in relation to the consolidated financial statements taken as a whole, presents fairly, in all material respects, the information set forth therein.
/s/ Deloitte & Touche LLP
New York, New York
January 31, 2018
|
Comcast 2017 Annual Report on Form 10-K
|
141
|
|
Comcast Corporation and Subsidiaries
Schedule II – Valuation and Qualifying Accounts
Year ended
December 31, 2017
,
2016
and
2015
|
Year Ended December 31 (in millions)
|
Balance at Beginning
of Year |
|
Additions Charged to
Costs and Expenses(a) |
|
Deductions from
Reserves(a) |
|
Balance at End
of Year |
|
||||
|
2017
|
||||||||||||
|
Allowance for doubtful accounts
|
$
|
250
|
|
$
|
72
|
|
$
|
34
|
|
$
|
288
|
|
|
Allowance for returns and customer incentives
|
417
|
|
974
|
|
972
|
|
419
|
|
||||
|
Valuation allowance on deferred tax assets
|
266
|
|
111
|
|
—
|
|
377
|
|
||||
|
2016
|
||||||||||||
|
Allowance for doubtful accounts
|
$
|
226
|
|
$
|
86
|
|
$
|
62
|
|
$
|
250
|
|
|
Allowance for returns and customer incentives
|
473
|
|
1,041
|
|
1,097
|
|
417
|
|
||||
|
Valuation allowance on deferred tax assets
|
342
|
|
23
|
|
99
|
|
266
|
|
||||
|
2015
|
||||||||||||
|
Allowance for doubtful accounts
|
$
|
205
|
|
$
|
166
|
|
$
|
145
|
|
$
|
226
|
|
|
Allowance for returns and customer incentives
|
359
|
|
1,236
|
|
1,122
|
|
473
|
|
||||
|
Valuation allowance on deferred tax assets
|
375
|
|
4
|
|
37
|
|
342
|
|
||||
NBCUniversal Media, LLC
Schedule II – Valuation and Qualifying Accounts
Year ended
December 31, 2017
,
2016
and
2015
|
Year Ended December 31 (in millions)
|
Balance at Beginning
of Year |
|
Additions Charged to
Costs and Expenses(a) |
|
Deductions from
Reserves(a) |
|
Balance at End
of Year |
|
||||
|
2017
|
||||||||||||
|
Allowance for doubtful accounts
|
$
|
84
|
|
$
|
23
|
|
$
|
19
|
|
$
|
88
|
|
|
Allowance for returns and customer incentives
|
413
|
|
955
|
|
954
|
|
414
|
|
||||
|
Valuation allowance on deferred tax assets
|
72
|
|
15
|
|
—
|
|
87
|
|
||||
|
2016
|
||||||||||||
|
Allowance for doubtful accounts
|
$
|
69
|
|
$
|
26
|
|
$
|
11
|
|
$
|
84
|
|
|
Allowance for returns and customer incentives
|
469
|
|
1,040
|
|
1,096
|
|
413
|
|
||||
|
Valuation allowance on deferred tax assets
|
71
|
|
23
|
|
22
|
|
72
|
|
||||
|
2015
|
||||||||||||
|
Allowance for doubtful accounts
|
$
|
60
|
|
$
|
27
|
|
$
|
18
|
|
$
|
69
|
|
|
Allowance for returns and customer incentives
|
356
|
|
1,233
|
|
1,120
|
|
469
|
|
||||
|
Valuation allowance on deferred tax assets
|
87
|
|
4
|
|
20
|
|
71
|
|
||||
|
(a)
|
Additions and deductions related to allowance for returns and customer incentives include amounts for distribution on behalf of third parties.
|
|
142
|
Comcast 2017 Annual Report on Form 10-K
|
|
TABLE OF CONTENTS
Part IItem 1: BusinessItem 1A: Risk FactorsItem 1B: Unresolved Staff CommentsItem 2: PropertiesItem 3: Legal ProceedingsItem 4: Mine Safety DisclosuresPart IIItem 5: Market For Registrant S Common Equity, Related Stockholder Matters and Issuer Purchases Of Equity SecuritiesItem 6: Selected Financial DataItem 7: Management S Discussion and Analysis Of Financial Condition and Results Of OperationsItem 7A: Quantitative and Qualitative Disclosures About Market RiskItem 8: Comcast Corporation Financial Statements and Supplementary DataNote 1: Business and Basis Of PresentationNote 2: Accounting PoliciesNote 3: Recent Accounting PronouncementsNote 4: Earnings Per ShareNote 5: Significant TransactionsNote 6: Film and Television CostsNote 7: InvestmentsNote 8: Property and EquipmentNote 9: Goodwill and Intangible AssetsNote 10: Long-term DebtNote 11: Employee Benefit PlansNote 12: EquityNote 13: Share-based CompensationNote 14: Income TaxesNote 15: Supplemental Financial InformationNote 16: Commitments and ContingenciesNote 17: Financial Data By Business SegmentNote 18: Quarterly Financial Information (unaudited)Note 19: Condensed Consolidating Financial InformationItem 9: Changes in and Disagreements with Accountants on Accounting and Financial DisclosureItem 9A: Controls and ProceduresItem 9B: Other InformationPart IIIItem 10: Directors, Executive Officers and Corporate GovernanceItem 11: Executive CompensationItem 12: Security Ownership Of Certain Beneficial Owners and Management and Related Stockholder MattersItem 13: Certain Relationships and Related Transactions, and Director IndependenceItem 14: Principal Accountant Fees and ServicesPart IVItem 15: Exhibits and Financial Statement SchedulesItem 16: Form 10-k SummaryNote 4: Significant TransactionsNote 5: Related Party TransactionsNote 12: Income TaxesNote 13: Supplemental Financial InformationNote 14: Commitments and ContingenciesNote 15: Financial Data By Business Segment