CME GROUP INC.
10-Ks and 10-Qs
|
|
|
|
|
|
|
|
|
|
|
|
|
|
|
|
|
|
|
|
|
|
|
|
|
|
|
|
|
|
|
|
|
|
|
|
|
|
|
|
|
|
|
|
|
|
|
|
|
|
|
|
|
|
|
|
UNITED STATES
SECURITIES AND EXCHANGE COMMISSION
WASHINGTON, D.C. 20549
_________________________________________________________
FORM 10-K
_________________________________________________________
(Mark One)
|
ý
|
ANNUAL REPORT PURSUANT TO SECTION 13 OR 15(d) OF THE SECURITIES EXCHANGE ACT OF 1934
|
For the Fiscal Year Ended
December 31, 2017
OR
|
¨
|
TRANSITION REPORT PURSUANT TO SECTION 13 OR 15(d) OF THE SECURITIES EXCHANGE ACT OF 1934
|
Commission File Number 001-31553
CME GROUP INC.
(Exact name of registrant as specified in its charter)
|
Delaware
|
|
36-4459170
|
|
(State or Other Jurisdiction of
Incorporation or Organization)
|
|
(IRS Employer
Identification No.)
|
|
20 South Wacker Drive, Chicago, Illinois
|
|
60606
|
|
(Address of Principal Executive Offices)
|
|
(Zip Code)
|
Registrant’s telephone number, including area code: (312) 930-1000
Securities registered pursuant to Section 12(b) of the Act:
|
Title Of Each Class
|
|
Name Of Each Exchange On Which Registered
|
|
Class A Common Stock $0.01 par value
|
|
NASDAQ GLOBAL SELECT MARKET
|
_________________________________________________________
Securities registered pursuant to Section 12(g) of the Act: Class B common stock, Class B-1, $0.01 par value; Class B common stock, Class B-2, $0.01 par value; Class B common stock, Class B-3, $0.01 par value; and Class B common stock, Class B-4, $0.01 par value.
Indicate by check mark if the registrant is a well-known seasoned issuer, as defined in Rule 405 of the Securities Act. Yes
ý
No
¨
Indicate by check mark if the registrant is not required to file reports pursuant to Section 13 or Section 15(d) of the Act. Yes
¨
No
ý
Indicate by check mark whether the registrant: (1) has filed all reports required to be filed by Section 13 or 15(d) of the Securities Exchange Act of 1934 during the preceding 12 months (or for such shorter period that the registrant was required to file such reports), and (2) has been subject to such filing requirements for the past 90 days. Yes
ý
No
¨
Indicate by check mark whether the registrant has submitted electronically and posted on its corporate website, if any, every Interactive Data File required to be submitted and posted pursuant to Rule 405 of Regulation S-T (§232.405 of this chapter) during the preceding 12 months (or for such shorter period that the registrant was required to submit and post such files). Yes
ý
No
¨
Indicate by check mark if disclosure of delinquent filers pursuant to Item 405 of Regulation S-K (§229.405 of this chapter) is not contained herein, and will not be contained, to the best of registrant’s knowledge, in definitive proxy or information statements incorporated by reference in Part III of this Form 10-K or any amendment to this Form 10-K.
¨
Indicate by check mark whether the registrant is a large accelerated filer, an accelerated filer, a non-accelerated filer, a smaller reporting company, or emerging growth company. See definitions of "large accelerated filer," "accelerated filer," "smaller reporting company," and "emerging growth company" in Rule 12b-2 of the Exchange Act.
|
Large accelerated filer
x
|
Accelerated filer
o
|
|
|
Non-accelerated filer
o
|
(Do not check if a smaller reporting company)
|
Smaller reporting company
o
Emerging growth company
o
|
If an emerging growth company, indicate by check mark if the registrant has elected not to use the extended transition period for complying with any new or revised financial accounting standards provided pursuant to Section 13(a) of the Exchange Act.
¨
Indicate by check mark whether the registrant is a shell company (as defined in Rule 12b-2 of the Exchange Act). Yes
¨
No
ý
The aggregate market value of the voting stock held by non-affiliates of the registrant as of June 30, 2017, was approximately
$42.2 billion
(based on the closing price per share of CME Group Inc. Class A common stock on the NASDAQ Global Select Market (NASDAQ) on such date). The number of shares outstanding of each of the registrant’s classes of common stock as of February 7, 2018 was as follows:
340,382,147
shares of Class A common stock, $0.01 par value; 625 shares of Class B common stock, Class B-1, $0.01 par value; 813 shares of Class B common stock, Class B-2, $0.01 par value; 1,287 shares of Class B common stock, Class B-3, $0.01 par value; and 413 shares of Class B common stock, Class B-4, $0.01 par value.
DOCUMENTS INCORPORATED BY REFERENCE:
|
Documents
|
|
Form 10-K Reference
|
|
Portions of the CME Group Inc.’s Proxy Statement for the 2018 Annual Meeting of Shareholders
|
|
Part III
|
CME GROUP INC.
ANNUAL REPORT ON FORM 10-K
INDEX
|
|
|
Page
|
|
Item 1.
|
||
|
Item 1A.
|
||
|
Item 1B.
|
||
|
Item 2.
|
||
|
Item 3.
|
||
|
Item 4.
|
||
|
Item 5.
|
||
|
Item 6.
|
||
|
Item 7.
|
||
|
Item 7A.
|
||
|
Item 8.
|
||
|
Item 9.
|
||
|
Item 9A.
|
||
|
Item 9B.
|
||
|
Item 10.
|
||
|
Item 11.
|
||
|
Item 12.
|
||
|
Item 13.
|
||
|
Item 14.
|
||
|
Item 15.
|
||
|
Item 16.
|
||
2
Certain Terms
All references to "options" or "options contracts" in the text of this document refer to options on futures contracts.
Unless otherwise indicated, references to CME Group Inc. (CME Group or the company) products include references to products listed on one of its regulated exchanges: Chicago Mercantile Exchange Inc. (CME), Board of Trade of the City of Chicago, Inc. (CBOT), New York Mercantile Exchange, Inc. (NYMEX) and Commodity Exchange, Inc. (COMEX). Products listed on these exchanges are subject to the rules and regulations of the particular exchange and the applicable rulebook should be consulted. Unless otherwise indicated, references to NYMEX include its subsidiary, COMEX.
Further information about CME Group and its products can be found at http://www.cmegroup.com. Information made available on our website does not constitute a part of this Annual Report on Form 10-K.
Information about Contract Volume and Average Rate per Contract
All amounts regarding contract volume and average rate per contract exclude our interest rate swaps and credit default swaps unless otherwise noted. In September 2017, we announced we will exit the credit default swaps business by mid-2018.
Trademark Information
CME Group, the Globe logo, CME, Chicago Mercantile Exchange, Globex and E-mini are trademarks of Chicago Mercantile Exchange Inc. CBOT, Chicago Board of Trade, KCBT and Kansas City Board of Trade are trademarks of Board of Trade of the City of Chicago, Inc. NYMEX, New York Mercantile Exchange and ClearPort are trademarks of New York Mercantile Exchange, Inc. COMEX is a trademark of Commodity Exchange, Inc. Dow Jones, Dow Jones Industrial Average, S&P 500 and S&P are service and/or trademarks of Dow Jones Trademark Holdings LLC, Standard & Poor's Financial Services LLC and S&P/Dow Jones Indices LLC, as the case may be, and have been licensed for use by Chicago Mercantile Exchange Inc. All other trademarks are the property of their respective owners.
FORWARD-LOOKING STATEMENTS
From time to time, in this Annual Report on Form 10-K as well as in other written reports and verbal statements, we discuss our expectations regarding future performance. These forward-looking statements are identified by their use of terms and phrases such as "believe," "anticipate," "could," "estimate," "intend," "may," "plan," "expect" and similar expressions, including references to assumptions. These forward-looking statements are based on currently available competitive, financial and economic data, current expectations, estimates, forecasts and projections about the industries in which we operate and management's beliefs and assumptions. These statements are not guarantees of future performance and involve risks, uncertainties and assumptions that are difficult to predict. Therefore, actual outcomes and results may differ materially from what is expressed or implied in any forward-looking statements. We want to caution you not to place undue reliance on any forward-looking statements. We undertake no obligation to publicly update any forward-looking statements, whether as a result of new information, future events or otherwise. Among the factors that might affect our performance are:
|
•
|
increasing competition by foreign and domestic entities, including increased competition from new entrants into our markets and consolidation of existing entities;
|
|
•
|
our ability to keep pace with rapid technological developments, including our ability to complete the development, implementation and maintenance of the enhanced functionality required by our customers while maintaining reliability and ensuring that such technology is not vulnerable to security risks;
|
|
•
|
our ability to continue introducing competitive new products and services on a timely, cost-effective basis, including through our electronic trading capabilities, and our ability to maintain the competitiveness of our existing products and services, including our ability to provide effective services to the swaps market;
|
|
•
|
our ability to adjust our fixed costs and expenses if our revenues decline;
|
|
•
|
our ability to maintain existing customers, develop strategic relationships and attract new customers;
|
|
•
|
our ability to expand and offer our products outside the United States;
|
|
•
|
changes in regulations, including the impact of any changes in laws or government policy with respect to our industry, such as any changes to regulations and policies that require increased financial and operational resources from us or our customers;
|
|
•
|
the costs associated with protecting our intellectual property rights and our ability to operate our business without violating the intellectual property rights of others;
|
|
•
|
decreases in revenue from our market data as a result of decreased demand;
|
3
|
•
|
changes in our rate per contract due to shifts in the mix of the products traded, the trading venue and the mix of customers (whether the customer receives member or non-member fees or participates in one of our various incentive programs) and the impact of our tiered pricing structure;
|
|
•
|
the ability of our financial safeguards package to adequately protect us from the credit risks of clearing members;
|
|
•
|
the ability of our compliance and risk management methods to effectively monitor and manage our risks, including our ability to prevent errors and misconduct and protect our infrastructure against security breaches and misappropriation of our intellectual property assets;
|
|
•
|
changes in price levels and volatility in the derivatives markets and in underlying equity, foreign exchange, interest rate and commodities markets;
|
|
•
|
economic, political and market conditions, including the volatility of the capital and credit markets and the impact of economic conditions on the trading activity of our current and potential customers;
|
|
•
|
our ability to accommodate increases in contract volume and order transaction traffic and to implement enhancements without failure or degradation of the performance of our trading and clearing systems;
|
|
•
|
our ability to execute our growth strategy and maintain our growth effectively;
|
|
•
|
our ability to manage the risks and control the costs associated with our strategy for acquisitions, investments and alliances;
|
|
•
|
our ability to continue to generate funds and/or manage our indebtedness to allow us to continue to invest in our business;
|
|
•
|
industry and customer consolidation;
|
|
•
|
decreases in trading and clearing activity;
|
|
•
|
the imposition of a transaction tax or user fee on futures and options on futures transactions and/or repeal of the 60/40 tax treatment of such transactions;
|
|
•
|
the unfavorable resolution of material legal proceedings; and
|
|
•
|
the uncertainties of the ultimate impact of the Tax Cuts and Jobs Act (2017 Tax Act).
|
For a detailed discussion of these and other factors that might affect our performance, see Item 1A. of this Report beginning on page 14.
4
|
ITEM 1.
|
BUSINESS
|
GENERAL DEVELOPMENT OF BUSINESS
CME Group serves the risk management and investment needs of customers around the globe.
CME was founded in 1898 as a not-for-profit corporation. In 2000, CME demutualized and became a shareholder-owned corporation. As a consequence, we adopted a for-profit approach to our business, including strategic initiatives aimed at optimizing contract volume, efficiency and liquidity. In 2002, Chicago Mercantile Exchange Holdings Inc. (CME Holdings) completed its initial public offering of its Class A common stock, which is listed on the NASDAQ Global Select Market under the symbol "CME." In 2007, CME Holdings merged with CBOT Holdings, Inc. and was renamed CME Group. In connection with the merger, we acquired the CBOT exchange. CBOT is a leading marketplace for trading agricultural and U.S. Treasury futures as well as options on futures. In 2008, we merged with NYMEX Holdings, Inc. and acquired NYMEX and COMEX. On NYMEX, customers primarily trade energy futures and options contracts, including contracts for crude oil, natural gas, heating oil and gasoline. On COMEX, customers trade metal futures and options contracts, including contracts for gold, silver and copper. In 2012, we acquired The Board of Trade of Kansas City, Missouri, Inc. (KCBT) and its hard red winter wheat product line and effective December 2013, KCBT operations were transferred to CBOT. In April 2013, we purchased the non-controlling interest in CME Group Index Services from Dow Jones & Company (Dow Jones) resulting in an increase in our ownership to 27% of the S&P/Dow Jones Indices LLC (S&P/DJI) joint venture with S&P Global, Inc. (formerly known as McGraw-Hill), originally established in 2012. In 2013, we began offering repository services and now offer global trade repository services in the United States, United Kingdom, Canada and Australia. In April 2017, we announced the wind down of CME Clearing Europe Limited and CME Europe Limited, which has been completed. In September 2017, we also announced we will exit the credit default swaps business by mid-2018.
Our business has historically been subject to the extensive regulation of the U.S. Commodity Futures Trading Commission (CFTC). As a result of our global operations, we are also subject to the rules and regulations of the local jurisdictions in which we conduct business, including the European Securities and Markets Authority (ESMA) and the Financial Conduct Authority (FCA). Additionally, our U.S. clearing house has been designated as systemically important, which carries with it enhanced regulatory oversight of certain of our risk-management standards, clearing and settlement activities, including additional oversight by the Federal Reserve.
Our principal executive offices are located at 20 South Wacker Drive, Chicago, Illinois 60606, and our telephone number is 312-930-1000.
FINANCIAL INFORMATION ABOUT INDUSTRY SEGMENTS
The company reports the results of its operations as one reporting segment primarily comprised of the CME, CBOT, NYMEX and COMEX exchanges. The remaining operations do not meet the thresholds for reporting separate segment information. Financial information about our reporting segment is hereby incorporated by reference to "Item 6. Selected Financial Data" on page 27 and "Item 8. Financial Statements and Supplementary Data" on page 50.
NARRATIVE DESCRIPTION OF BUSINESS
CME Group is where the world comes to manage risk. Through its exchanges, CME Group offers the widest range of global benchmark products across all major asset classes, including futures and options based on interest rates, equity indexes, foreign exchange, energy, agricultural products and metals. CME Group provides electronic trading globally on its CME Globex platform. The company also offers clearing and settlement services across asset classes for exchange-traded and over-the-counter derivatives through its clearing house, CME Clearing. CME Group's products and services are designed to provide businesses around the world with the means to effectively manage risk. We also provide hosting, connectivity and customer support for electronic trading through our co-location services. Our CME Direct platform offers side-by-side trading of exchange-listed and privately negotiated markets. We provide clearing and settlement services for exchange-traded contracts, as well as for cleared swaps, and provide regulatory reporting solutions for market participants through our global repository services in the United States, United Kingdom, Canada and Australia. Finally, we offer a wide range of market data services — including live quotes, delayed quotes, market reports and a comprehensive historical data service.
Our Competitive Strengths
We provide innovative ways to manage risk and offer a number of key differentiating elements that set us apart from others in our industry, including:
Highly Liquid Markets
—
Our listed futures and options markets provide an effective forum for our customers to manage their risk and meet their investment needs relating to our markets. We believe our customers choose to trade on our centralized market due to its liquidity and price transparency. Market liquidity — or the ability of a market to absorb the execution of large purchases or sales quickly and efficiently, whereby the market recovers quickly following the execution of large orders — is key to attracting customers and contributing to a market's success.
5
Most Diverse Product Line
—
Our products provide a means for hedging, speculation and asset allocation relating to the risks associated with, among other things, interest rate sensitive instruments, equity ownership, changes in the value of foreign currency and changes in the prices of agricultural, energy and metal commodities. The estimated percentage of clearing and transaction fees revenue contributed by each product line is as follows:
|
Product Line
|
2017
|
2016
|
2015
|
||||||
|
Interest rate
|
33
|
%
|
32
|
%
|
31
|
%
|
|||
|
Equity
|
16
|
|
18
|
|
19
|
|
|||
|
Foreign exchange
|
6
|
|
6
|
|
7
|
|
|||
|
Agricultural commodity
|
14
|
|
15
|
|
15
|
|
|||
|
Energy
|
24
|
|
23
|
|
23
|
|
|||
|
Metal
|
7
|
|
6
|
|
5
|
|
|||
We believe the breadth and diversity of our product lines and the variety of their underlying contracts are beneficial to our overall performance. Our asset classes contain products designed to address differing risk management needs, and customers are able to achieve operational and capital efficiencies by accessing our diverse products through our platforms and our clearing house.
In 2017, we reached record average daily volume of 16.3 million contracts, up 4% from 2016, despite a lower volatility environment. Year-end open interest was up 5% from the end of 2016, and we reached an all-time high record open interest during the year of 129.1 million contracts on June 14, 2017.
Our products are traded primarily through CME Globex and other electronic trading platforms, by open outcry auction market in Chicago, and through privately negotiated transactions that we clear. The estimated percentage of clearing and transaction fees revenue contributed by each trading venue is as follows:
|
Trading Venue
|
2017
|
2016
|
2015
|
||||||
|
Electronic
|
83
|
%
|
82
|
%
|
81
|
%
|
|||
|
Open outcry
(1)
|
5
|
|
5
|
|
6
|
|
|||
|
Privately negotiated
(2)
|
12
|
|
13
|
|
13
|
|
|||
(1) In July 2015, we closed most of the futures pits in Chicago and New York. On December 31, 2016, we closed the remaining open outcry pits in New York. Most open outcry options markets remain open in Chicago.
(2) Privately negotiated average daily volume includes both traditional block trades, off-exchange trades, which were historically categorized as CME ClearPort (now executed as futures block trades), and Exchange for Related Positions (EFRP).
In addition, our cleared-only CME interest rate swap and CME credit default swap contracts contributed approximately 2% of total revenue in each of the last three years. In September 2017, we announced we will exit the credit default swap business by mid-2018.
Our products generate valuable information regarding prices and trading activity. Customers pay a subscription fee for real-time market data and have the choice of receiving their market data either directly from us or through a variety of third party quote vendors and data providers. We also offer customers detailed historical market data for use in their development and analysis of various trading strategies. The estimated contributions of our market data and information services products, excluding our index market data offerings, based on percentage of total revenue, were
11%
in both
2017
and
2016
and
12%
in
2015
.
Safety and Soundness of our Markets
—
We understand the importance of ensuring our customers are able to manage and contain their trading risks. As the markets and the economy have evolved, we have worked to adapt our clearing services to meet the needs of our customers. We apply robust risk management standards and enforce and facilitate applicable regulatory customer protection standards for exchange-traded products and cleared swaps. Clearing firms are continually monitored and examined to assess their outstanding risk, capital adequacy and compliance with customer protection rules and regulations. We utilize a combination of risk management capabilities to assess our clearing firms and their account exposure levels for all asset classes 24 hours a day throughout the trading week. Our clearing house, CME Clearing, is a division of CME. In April 2017, we announced the wind down of our European clearing house, which was completed in late 2017.
Our integrated clearing function is designed to ensure the safety and soundness of our markets by serving as the counterparty to every trade, becoming the buyer to each seller and the seller to each buyer, and limiting counterparty credit risk. The clearing house is responsible for settling trading accounts, clearing trades, collecting and maintaining performance bond funds, regulating delivery and reporting trading data. CME Clearing marks open positions to market at least twice a day, and requires
6
payment from clearing firms whose positions have lost value and makes payments to clearing firms whose positions have gained value. For select cleared-only markets, positions are marked-to-market daily, with the capacity to mark-to-market more frequently as market conditions warrant. The CME ClearPort front-end system provides access to our flexible clearing services for block transactions and swaps. See "Item 7A. Quantitative and Qualitative Disclosures About Market Risk," beginning on page 46 and "Item 1A. Risk Factors," beginning on page 14, for more information on our financial safeguards package and the associated credit risks related to our clearing services.
Superior Trading Technology and Distribution
—
We strive to provide the most flexible and scalable platforms to support the operational and capacity needs of the business along with the delivery of innovative technology solutions to the marketplace. Our CME Globex electronic platform is the trading engine for our central limit order book markets, and is available on a global basis nearly 24 hours a day throughout the trading week. The CME Globex platform is accessible through a wide variety of vendor-provided and custom-built trading systems that benefit from our open application programming interface approach. For privately negotiated markets, we offer brokers and customers the CME Direct platform for arranging, executing, recording and risk-managing trades. CME Direct includes CME One for mobile access, CME Messenger for instant-message capabilities and CME Straight-Through Processing. CME Straight-Through Processing enables direct connectivity for trade information directly with customer order management and risk management systems and is designed to reduce errors and improve efficiency. In 2017, 89% of our contract volume was conducted electronically.
Together, our platforms offer:
|
•
|
certainty of execution;
|
|
•
|
vast capabilities to facilitate complex and demanding trading;
|
|
•
|
direct market access;
|
|
•
|
fairness, price transparency and anonymity;
|
|
•
|
convenience and efficiency; and
|
|
•
|
global distribution, including connectivity through high-speed international telecommunications hubs in key financial centers or order routing to our global partner exchanges.
|
We also offer co-location services at a data center facility, which houses our trading match engines for all products traded on the CME Globex electronic trading platform. The service provides low latency connection for our customers. The offering is made available to all customers on equal terms.
Our Strategic Initiatives
The following is a description of our strategic initiatives:
Leading Core Business Innovation and Expanded Product Offerings
—
We continue to focus on cross-selling our products, expanding the strength of our existing benchmark products, launching new products and services and deepening open interest in our core futures and options on futures offerings. During this decade, our key product launches have included the Ultra U.S. Treasury Bond futures and options and most recently the Ultra 10 Year Treasury futures, numerous Eurodollar mid-curve options, end-of-month equity options, weekly options for various financial and commodity products, short-dated options across asset classes, new base metal products, expanded crude oil grades, S&P Dividend futures, E-mini Russell 1000 and 2000 futures, CME Bloomberg Spot Dollar Spot Index futures and a cash-settled bitcoin futures contract. In June 2017, we announced our intention to launch products on the new secured overnight financing rate. During 2017, we experienced multiple volume records across our core product portfolio, including interest rates, energy, agricultural commodities and metals. We also had record volume in overall options, with electronic options representing 62% of total options volume in 2017. We continued to deepen liquidity and add diverse participation as evidenced by the growth in large open interest holders with records achieved across several product lines in 2017.
Globalizing our Company and our Business
—
We continue to expand and diversify our customer base worldwide and offer customers around the world the most broadly diversified portfolio of benchmark products. We have expanded our international product suite with the launch of a number of regionally specific products, including European wheat and aluminum futures, Mexican peso futures and Brazilian real futures, which help us appeal to risk management needs unique to a particular geography. We believe we have significant opportunity to expand the participation of our non-U.S. customer base in our markets. We are focused on core growth in global markets because we believe that Australia, Asia, Latin America, and other emerging markets will experience significant growth and development of their financial markets. In addition, we continue to expand our presence in major global financial centers, grow our business outside the United States and penetrate emerging markets, such as China, South Korea, Brazil and Mexico. In 2017, approximately 26% of our electronic volume was transactions customers reported to us as from outside the United States and 50% of our market data revenue was derived from
7
outside the United States. We also achieved 34% growth in liquidity during European trading hours and 18% growth during Asian trading hours.
In order to accelerate our long-term integration in the global economy, CME Group has built out its international infrastructure and strategic relationships. In recent years, we have expanded our ability to support physical delivery of locally relevant products in both Europe and Asia.
Expanding our Customer Base and Enhancing Customer Participation in our Markets
—
We continue to grow our business by targeting cross-asset sales across client segments, driving international sales and generating new client participation across all regions. We have a long history of providing customer value and responsiveness and believe our products and services make us well positioned to help our customers adapt and comply with new regulations, while enabling them to efficiently manage their risks. We have a broad distribution network comprised of a combination of internal and external channels and front-end capabilities. With changing regulatory capital requirements for many of our customers and the need for greater efficiencies, we have added tools to enable customers to build and manage trading and clearing positions in our markets in an efficient manner.
Our customer-centric approach to sales and distribution has continued to deepen our liquidity and added diverse customer participation as evidenced by reaching record large open interest holders across several product lines during 2017.
With the ongoing implementation of regulatory reform in the United States and in Europe, we expect capital efficiencies and centralized clearing to continue to be important for our global client base.
We remain focused on expanding our sales and marketing capabilities and tools to broaden customer participation and to simplify and enrich the customer experience resulting in increased trading and a reduction in their regulatory burdens. Over the past decade, we have also expanded our education, sales, and customer support efforts, opening offices in Hong Kong, Seoul, Beijing, Bangalore and Sydney.
Extending our Risk Management and Post-Trade Offerings and Solutions
—
We provide a comprehensive multi-asset class clearing solution to the market for maximum operational ease and the capital efficiency that comes with connecting to our clearing house. Our clearing services offer the ability to optimize collateral and capital efficiencies across portfolios within the clearing house while meeting the heightened regulatory requirements on derivatives. We also offer clearing services for interest rate, foreign exchange and commodity swaps. In 2017, we launched clearing services for OTC FX options. We also added OTC interest rate clearing services for the Korean Won and Indian Rupee denominated contracts.
CME Group continues to introduce tools and services to assist customers with portfolio margining. As of December 31, 2017, 42 unique marketplace participants utilized CME Group’s portfolio margining services. In the past few years, we have introduced compression via coupon blending as well as CME CORE, an interactive margin calculator that enables clients to optimize their capital by providing insights on margin requirements prior to trading. We also introduced multilateral compression for our cleared swap customers through a partnership with TriOptima, a NEX Group business, and we have added trade reporting services in the United States, Europe, Canada and Australia.
Establishing Ourselves as the Leading Exchange Provider of Information Products and Index Services and Enhancing our Intellectual Property Portfolio
—
We offer a variety of market data services for the futures, equities and the cleared swaps markets. Our market data platform includes historical, real-time and derived data offerings. Our joint venture with S&P Global, Inc. combines the world class capabilities of S&P Indices and Dow Jones Indices. As part of the joint venture, we acquired a long-term, ownership-linked, exclusive license to list futures and options on futures based on the S&P 500 Index and certain other S&P indices. In 2015, CME obtained exclusive licensing rights to list contracts on FTSE Russell indexes beginning in mid-2017. In July 2017, CME launched both futures and options based on the Russell 2000 Index. In 2017, we also secured the rights to the TOPIX futures contract and renewed our existing licensing agreement with Platts. We also continue to expand our existing intellectual property portfolio for our technology, products and services offerings.
Patents, Trademarks and Licenses
We own the rights to a large number of trademarks, service marks, domain names and trade names in the United States, Europe and other parts of the world. We have registered many of our most important trademarks in the United States and other countries. We hold the rights to a number of patents and have made a number of patent applications. Our patents cover match engine, trader user interface, trading floor support, market data, general technology and clearing house functionalities. We also own the copyright to a variety of materials. Those copyrights, some of which are registered, include printed and on-line publications, websites, advertisements, educational material, graphic presentations and other literature, both textual and electronic. We attempt to protect our intellectual property rights by relying on trademarks, patents, copyrights, database rights, trade secrets, restrictions on disclosure and other methods.
We offer equity index futures and options on key benchmarks, including S&P, NASDAQ, Dow Jones and the FTSE Russell indexes. These products are listed by us subject to license agreements with the applicable owners of the indexes, some of which
8
are exclusive. In connection with our joint venture with S&P Global, Inc., we entered into a new license agreement (S&P License Agreement), which superseded our prior licensing arrangements and was assigned to the joint venture. CME’s license for the S&P 500 Index will be exclusive for futures and options on futures until one year prior to the termination of the S&P License Agreement, and non-exclusive for the last year. The license for the other S&P stock indexes is generally exclusive for futures and options on futures. The term of the S&P License Agreement will continue until the date that is one year after the date that CME Group ceases to own at least five percent (accounting for dilution) of the outstanding joint venture interests. Upon the occurrence of certain events, including certain terminations of the joint venture, the term may be extended up to an additional ten years. CBOT has an exclusive license agreement (Dow Jones License Agreement) with CME Group Index Services LLC (CME Indexes) for certain Dow Jones indexes, which has also been assigned to the joint venture. The initial term of the agreement is through June 30, 2026. Following the initial term, the Dow Jones License Agreement shall automatically renew for renewal terms of five years thereafter so long as there is open interest in any of CBOT’s or its affiliates’ products based on one or more of the Dow Jones licensed indexes. In the event there is no open interest in any such products, then CME Indexes has the ability to terminate the agreement. We also have an exclusive license agreement for certain NASDAQ indexes through 2019. In 2015, we entered into an exclusive license agreement with FTSE Russell and launched the E-mini Russell 2000 futures in 2017. Copies of our S&P, Dow Jones and NASDAQ license arrangements have been filed as material contracts. We pay the applicable third party per trade fees based on contract volume under the terms of these licensing agreements.
We also have a long-term, non-exclusive licensing arrangement with ICE Benchmark Administration for the use of LIBOR to settle several of our interest rate products, including our Eurodollar contract.
We cannot assure you that we will be able to maintain the exclusivity of our licensing agreements with S&P, Dow Jones, NASDAQ and FTSE Russell or be able to maintain our other existing licensing arrangements beyond the term of the current agreements. In addition, we cannot assure you that others will not succeed in creating stock index futures based on information similar to that which we have obtained by license, or that market participants will not increasingly use other instruments, including securities and options based on the S&P, Dow Jones, NASDAQ or Russell indexes, to manage or speculate on U.S. stock risks. Parties also may succeed in offering indexed products that are similar to our licensed products without being required to obtain a license, or in countries that are beyond our jurisdictional reach and/or our licensors.
Working Capital
We generally meet our funding requirements with internally generated funds supplemented from time to time with public debt and commercial paper offerings. For more information on our working capital needs, see "Management's Discussion and Analysis of Financial Condition and Results of Operations — Liquidity and Capital Resources," beginning on page 42, which section is incorporated herein by reference.
Customer Base
Our customer base includes professional traders, financial institutions, institutional and individual investors, major corporations, manufacturers, producers, governments and central banks. Our customers can connect to our electronic trading platforms from access points across the globe. Customers may be members of one or more of our CME, CBOT, NYMEX or COMEX exchanges. Rights to directly access our markets will depend upon the nature of the customer, such as whether the individual is a member of one of our exchanges or has executed an agreement with us for direct access.
U.S. trading rights and privileges are exchange-specific. Open outcry trading is conducted exclusively by our members. Membership on one of our futures exchanges also enables a customer to trade specific products at reduced rates and lower fees. Under the terms of the organizational documents of our exchanges, our members have certain rights that relate primarily to trading right protections, certain trading fee protections and certain membership benefit protections. In
2017
,
83%
of our contract volume was conducted by our members.
The majority of clearing and transaction fees received from clearing firms represents charges for trades executed and cleared on behalf of their customers. One firm represented
13%
and another firm represented
12%
of our clearing and transaction fees revenue for
2017
. In the event a clearing firm were to withdraw, our experience indicates that the customer portion of the firm's trading activity would likely transfer to another clearing firm of the exchange.
Competition
The industry in which we operate is highly competitive and we expect competition to continue to intensify and become more global, especially in light of changes in the financial services industry driven by regulatory reforms such as the Dodd-Frank Wall Street Reform and Consumer Protection Act (Dodd-Frank), European Market Infrastructure Regulation (EMIR), Markets in Financial Instruments Directive II (MiFID II), Capital Requirements Directive IV (CRD IV), Market Abuse Regulation, Benchmarks Regulation, Basel III, and various other laws and regulations.
9
Please also refer to the discussion below and in the “Risk Factors” section beginning on page 14 for a description of competitive risks and uncertainties.
Competition in our Derivatives Business
We believe competition in the derivatives and securities business is based on a number of factors, including, among others:
|
•
|
brand and reputation;
|
|
•
|
efficient and secure settlement, clearing and support services;
|
|
•
|
depth and liquidity of markets;
|
|
•
|
diversity of product offerings and rate and quality of new product development and innovative services;
|
|
•
|
ability to position and expand upon existing products to address changing market needs;
|
|
•
|
efficient and seamless customer experience;
|
|
•
|
transparency, reliability, anonymity and security in transaction processing;
|
|
•
|
regulatory environment;
|
|
•
|
connectivity, accessibility and distribution;
|
|
•
|
technological capability and innovation; and
|
|
•
|
overall transaction costs.
|
We believe that we compete favorably with respect to these factors. Our deep, liquid markets; diverse product offerings; rate and quality of new product development; and efficient, secure settlement, clearing and support services, distinguish us from others in the industry. We believe that in order to maintain our competitive position, we must continue to expand globally; develop new and innovative products; enhance our technology infrastructure, including its reliability and functionality; maintain liquidity and low transaction costs, and implement customer protections designed to ensure the integrity of our market and the confidence of our customers.
We compete in a large financial services trading, clearing and settlement marketplace globally. Our competitors include, among other entities, exchanges such as Intercontinental Exchange, Inc. (ICE), the Hong Kong Exchanges and Clearing Limited, and Deutsche Börse AG. Competition in our industry continues to be dynamic and recent developments and alliances may result in a growing number of well-capitalized trading service providers that compete with all or a portion of our business.
Competition in our Transaction Processing Business
In addition, we face a number of competitors in our transaction processing and other business services. In the past few years, there has been increased competition in the provision of clearing services and we expect competition to continue to increase in connection with compliance with Dodd-Frank, Basel III, MiFID II and other various laws and regulations.
Our competitors in the clearing services space include, among others, companies such as ICE, LCH.Clearnet Ltd., the Options Clearing Corporation, Depository Trust & Clearing Corporation and Deutsche Börse AG. In light of the implementation of regulatory requirements and other reforms of the financial services industry, we believe that other exchanges and infrastructure providers also may undertake to provide clearing and other related post-trade services.
We believe competition in transaction processing and business services is based on, among other things, the value of providing customers with capital and margin efficiencies; quality and reliability of the services; creditworthiness of the clearing house; timely delivery of the services; reputation; diversity of the service offerings; confidentiality of positions and information security protective measures, and the fees charged for the services provided.
Competition in our Market Data Business
Technology companies, market data and information vendors and front-end software vendors also represent actual and potential competitors because they have their own substantial market data distribution capabilities that could serve as alternative means for receiving open market data feeds instead of connecting directly to our exchange. Distributors and consumers of our market data may also use our market data as an input into a product that competes against one of our traded or cleared products. Although we may receive license fees for such products, such fees may not offset the impact of any loss in revenue from our comparable product.
10
Regulatory Matters
We are primarily subject to the jurisdiction of the regulatory agencies in the United States, the United Kingdom and the European Union. We also are subject to varying levels of regulation by foreign jurisdictions that permit our exchanges and other businesses to offer our products and services to their citizens.
Please also refer to the discussion below and in the “Risk Factors” section beginning on page 14 for a description of regulatory and legislative risks and uncertainties.
Regulation in the United States
Our operation of U.S. futures exchanges and our clearing house is subject to extensive regulation by the CFTC that requires our regulated subsidiaries to satisfy the requirements of certain core principles relating to the operation and oversight of our markets and our clearing house. The CFTC carries out the regulation of the futures and swaps markets and clearing houses in accordance with the provisions of the Commodity Exchange Act as amended by, among others, the Commodity Futures Modernization Act and Dodd-Frank. The CFTC is subject to reauthorization every five years. Following the enactment of Dodd-Frank, the CFTC has moved from a principles-based to a more prescriptive regulatory approach over most aspects of our trading and clearing operations.
Regulations implementing Dodd-Frank include rules relating to the implementation of mandatory clearing of certain over-the-counter derivatives, swap reporting, operation of a clearing house, anti-manipulation, large trader reporting, product definitions, the definition of an agricultural commodity and certain provisions of the rules applicable to designated contract markets, swap execution facilities and swap data repositories. We continue to believe these regulations provide opportunities for our business, which we continue to explore.
Our clearing house has been designated as a systemically important financial market utility and a systemically important derivatives clearing organization. These designations carry with them additional regulatory oversight of certain of our risk-management standards, clearing and settlement activities by the Federal Reserve Bank and the CFTC.
Our U.S. swap data repository service and swap execution facility are also subject to the requirements of the Commodity Exchange Act and the regulations of the CFTC.
In February 2017, President Trump signed an executive order calling for the current U.S. presidential administration to review U.S. financial laws and regulations to determine their consistency with a set of core principles identified in the order. Some areas identified as subject to potential change, amendment or repeal include the Dodd-Frank Act and the authorities of the Federal Reserve and the Financial Stability Oversight Council. We cannot predict, which, if any, of these or other actions will be taken or, if taken, their effect on our business.
U.S. income tax reform efforts could have a material impact on our business. On December 22, 2017, the 2017 Tax Act, was signed into law. The 2017 Tax Act enacts broad changes to the existing U.S. federal income tax code, including reducing the federal corporate income tax rate from 35% to 21%, amongst many other complex provisions. The ultimate impact of such tax reforms may differ from our current estimates due to changes in interpretations and assumptions made by us as well as the issuance of any further regulations or guidance that may alter the operation of the U.S. federal income tax code. Various uncertainties also exist in terms of how U.S. states and any foreign countries within which we operate will react to these U.S. federal income tax reforms, which could have additional impacts on our business.
Regulation in the United Kingdom and the European Union
In the United Kingdom, parts of our operations are subject to the oversight of ESMA and the FCA. Our clearing house is subject to certain conditions and reporting obligations as a result of its recognition by ESMA. Multiple directives and regulations, such as MiFID II and the Markets in Financial Instruments Regulation (MiFIR), the CRD IV, and the Market Abuse Regulation, have been implemented either in full or on a phased basis with provisions similar to those contained in Dodd-Frank. Further regulation, such as EMIR and the Benchmarks Regulation, or changes to such legislation, may impact our business and operations.
In June 2016, the United Kingdom held a referendum in which U.K. voters voted in favor of withdrawal from the European Union (Brexit). The ultimate impact of Brexit on the relevant law and scope of regulation applicable to our U.K. operations, including the recognition of our clearing house, is unclear and is contingent upon the terms of withdrawal and the ongoing relationship between the United Kingdom and the European Union.
11
Key Areas of Focus
We actively monitor and participate in the domestic and international rulemaking processes for our industry, including providing government testimony, commenting on proposed rulemakings and educating our regulators on potential impacts to the marketplace.
Our key areas of focus in the regulatory environment are:
|
•
|
The adoption and implementation of position limit rules, which could have a significant impact on our commodities business if comparable trading venues in foreign jurisdictions are not subject to equivalent limitations.
|
|
•
|
Rules respecting capital charges under Basel III with respect to clearing members of central counterparties. There is a risk that these new standards may impose overly burdensome capital requirements on our clearing members and customers. Additional risks could arise through inconsistent adoption of the Basel III capital charges globally, potentially leading to disparate impacts on our customers.
|
|
•
|
The potential impact of the E.U. equivalence and recognition regime on non-European Union clearing houses and exchanges with customers based in Europe, which could require us to allocate increased amounts of contributed capital to the default waterfall and make changes to our governance structure. A failure of our clearing house to retain its recognition may result in our clearing members and certain customers in Europe being subject to higher capital costs thus creating a disincentive to use our markets.
|
|
•
|
The potential for further regulation stemming from industry performance disruptions and residual concerns around electronic trading activity and, in particular, "high frequency trading."
|
|
•
|
The potential elimination of the 60/40 tax treatment of certain of our futures and options contracts, which would impose a significant increase in tax rates applicable to certain market participants and could result in a decrease in their trading activity.
|
|
•
|
The implementation of a transaction tax or user fee in the United States or European Union, which could discourage institutions and individuals from using our markets or products or encourage them to trade in another less costly jurisdiction. From time to time, the proposed Presidential budget has, including the currently proposed budget, included a proposal to impose a user fee to fund the CFTC.
|
|
•
|
Regulations implementing the core principles for designated contract markets, including any changes to the rules implementing the competitive execution requirements of Core Principle 9
.
Rules promulgated under this provision may require us to make modifications to the manner in which certain of our contracts trade and/or require that such products be de-listed as futures and re-listed as swaps after a specified compliance period.
|
|
•
|
The implementation of legislation in the European Union impacting how benchmark index prices are formed, including new requirements for price submitters, price aggregators and markets that list contracts that reference index prices.
|
|
•
|
Concerns that legislators will prohibit or restrict exclusive licenses for benchmark indexes, which might impact the profitability of several of our most popular contracts.
|
|
•
|
The implementation of rules resulting in negative treatment of the liquidity profile of U.S. Treasury securities, including as qualifying liquidity resources, or any potential limitation on the use of U.S. Treasury securities as collateral could result in increased costs to us and our clearing firms.
|
Employees
As of
December 31, 2017
, we had approximately
2,830
employees. We consider relations with our employees to be good.
Executive Officers
The following are CME Group's executive officers. Ages are as of February 10, 2018.
Terrence A. Duffy, 59.
Mr. Duffy has served as our Chairman and Chief Executive Officer since November 2016. Mr. Duffy previously served as our Executive Chairman and President since 2012 and as Executive Chairman from 2006. Mr. Duffy has been a member of our board of directors since 1995. He also served as President of TDA Trading, Inc. from 1981 to 2002 and has been a member of our CME exchange since 1981.
Kathleen M. Cronin, 54.
Ms. Cronin has served as our Senior Managing Director, General Counsel and Corporate Secretary since 2003. Prior to joining us, Ms. Cronin was a corporate attorney at Skadden, Arps, Slate, Meagher & Flom LLP from 1989 through 1995 and from 1997 through 2002. Ms. Cronin also serves as a director of Kemper Corporation.
12
Sunil Cutinho
,
46.
Mr.
Cutinho has served as President of CME Clearing since September 2014. He joined CME Group in 2002 and since then has held various positions of increasing responsibility within the organization and, most recently served as Managing Director, Deputy Head of CME Clearing from April 2014 through September 2014.
Bryan T. Durkin, 57.
Mr. Durkin has served as President since November 2016. Mr. Durkin previously served as Senior Managing Director, Chief Commercial Officer since 2014 and as our Chief Operating Officer since 2007, and also held the title of Managing Director, Products and Services from 2010 to July 2012. Mr. Durkin joined us in connection with the CBOT merger and he previously held a variety of leadership roles with CBOT from 1982 to 2007, most recently as Executive Vice President and Chief Operating Officer.
Julie Holzrichter, 49.
Ms. Holzrichter has served as our Senior Managing Director, Chief Operating Officer since September 2014. She previously served as our Senior Managing Director, Global Operations from 2007. Ms. Holzrichter rejoined us in 2006 as our Managing Director, CME Globex Services and Technology Integration. Ms. Holzrichter previously held positions of increasing responsibility in our organization from 1986 to 2003 in trading operations.
Kevin Kometer, 53.
Mr. Kometer has served as Senior Managing Director and Chief Information Officer since 2008. He previously served as Managing Director and Deputy Chief Information Officer from 2007 to 2008. Since joining the company most recently in 1998, he has held senior leadership positions in the Technology Division, including Managing Director, Trading Execution Systems and Director, Advanced Technology. Mr. Kometer was also with the company from 1994 to 1996.
Hilda Harris Piell, 50.
Ms. Piell has served as Senior Managing Director and Chief Human Resources Officer since 2007. Previously she served as Managing Director and Senior Associate General Counsel, as Director and Associate General Counsel and as Associate Director and Assistant General Counsel since joining us in 2000.
John W. Pietrowicz, 53.
Mr. Pietrowicz has served as our Chief Financial Officer since December 2014. Previously, Mr. Pietrowicz served as our Senior Managing Director, Business Development and Corporate Finance since 2010. Mr. Pietrowicz joined us in 2003 and since then has held various positions of increasing responsibility, including Managing Director and Deputy Chief Financial Officer from 2009 to 2010 and Managing Director, Corporate Finance and Treasury from 2006 to 2009. Mr. Pietrowicz also serves as a director of S&P/Dow Jones Indices LLC.
Derek Sammann, 49.
Mr. Sammann has served as our Senior Managing Director, Commodities and Options Products since September 2014. He previously served as our Senior Managing Director, Financial Products and Services since 2009 and Global Head of Foreign Exchange Products since joining us in 2006. Prior to joining us, Mr. Sammann served as Managing Director, Global Head of FX Options and Structured Products at Calyon Corporate and Investment Bank in London from 1997 to 2006.
Jack Tobin, 54.
Mr. Tobin has served as our Chief Accounting Officer since February 2015. Mr. Tobin most recently served as our Managing Director, Corporate Finance since 2007. Prior to our merger with CBOT Holdings, Mr. Tobin served as the Director, Corporate Finance for CBOT Holdings, Inc. and CBOT from 2002 to 2007. Prior to joining CBOT, Mr. Tobin served as a principal consultant with PricewaterhouseCoopers from 1997 to 2002. Mr. Tobin is a registered certified public accountant.
Sean Tully, 54.
Mr. Tully has served as Senior Managing Director, Financial and OTC Products of CME Group since September 2014. He previously served as Senior Managing Director, Interest Rates and OTC Products since February 2014. Previously, he served as Managing Director, Interest Rate and OTC Products since October 2013 and as our Managing Director, Interest Products since joining us in 2011. Before joining the company, Mr. Tully most recently served as Managing Director, Global Head of Fixed Income Trading at WestLB in London.
Julie Winkler, 43.
Ms. Winkler has served as our Senior Managing Director, Chief Commercial Officer since December 2016. She previously served as Senior Managing Director, Research and Product Development and Index Services of CME Group since 2014 and as Managing Director, Research and Product Development since 2007. Prior to our merger with CBOT Holdings, Ms. Winkler held positions of increasing responsibility for CBOT Holdings since 1996. Ms. Winkler also serves as a director of S&P/Dow Jones Indices LLC.
FINANCIAL INFORMATION ABOUT GEOGRAPHIC AREAS
We track trading volume based on the country of origin of the transaction as disclosed to us by the customer. During 2017, we estimate that approximately 26% of our electronic trading volume was reported to us as originating from outside the United States. This was an increase from 2016 and 2015, when we estimated approximately 24% of our electronic trading volume was reported to us as originating from outside the United States.
AVAILABLE INFORMATION
Our website is
www.cmegroup.com
. Information made available on our website does not constitute part of this document. We make available on our website our Annual Reports on Form 10-K, Quarterly Reports on Form 10-Q, Current Reports on Form 8-K and amendments to those reports as soon as reasonably practicable after we electronically file or furnish such materials to
13
the U.S. Securities and Exchange Commission (SEC). Our corporate governance materials, including our Corporate Governance Principles, Director Conflict of Interest Policy, Board of Directors Code of Ethics, Categorical Independence Standards, Employee Code of Conduct and the charters for all the standing committees of our board, also may be found on our website. Copies of these materials also are available to shareholders free of charge upon written request to Shareholder Relations, Attention Ms. Beth Hausoul, CME Group Inc., 20 South Wacker Drive, Chicago, Illinois 60606.
In addition to the other information contained in this Annual Report on Form 10-K, you should carefully consider the factors discussed below, which are the risks we believe are material at this time. These risks could materially and adversely affect our business, financial condition and results of operations. These risks and uncertainties are not the only ones facing us. Additional risks and uncertainties not presently known to us or that we currently believe to be immaterial may also adversely affect our business.
RISKS RELATING TO OUR INDUSTRY
Our business is subject to the impact of domestic and international market, economic and political conditions that are beyond our control and that could significantly reduce our contract volumes and make our financial results more volatile.
Our revenue is substantially dependent on the contract volume in our markets. Our contract volume is directly affected by domestic and international factors that are beyond our control, including:
|
•
|
economic, political and geopolitical market conditions;
|
|
•
|
legislative and regulatory changes, including any direct or indirect restrictions on or increased costs associated with trading in our markets;
|
|
•
|
broad trends in the industry and financial markets;
|
|
•
|
changes in price levels, contract volumes and volatility in the derivatives markets and in underlying equity, foreign exchange, interest rate and commodity markets;
|
|
•
|
shifts in global or regional demand or supply in commodities underlying our products;
|
|
•
|
competition;
|
|
•
|
changes in government monetary policies, especially central bank decisions related to quantitative easing;
|
|
•
|
availability of capital to our market participants and their appetite for risk-taking;
|
|
•
|
levels of assets under management;
|
|
•
|
volatile weather patterns, droughts, natural disasters and other catastrophes;
|
|
•
|
pandemics affecting our customer base or our ability to operate our markets; and
|
|
•
|
consolidation or expansion in our customer base and within our industry.
|
Any one or more of these factors may contribute to reduced activity in our markets. Historically, periods of heightened uncertainty have tended to increase our trading volume due to increased hedging activity and the increased need to manage the risks associated with, or speculate on, volatility in the U.S. equity markets, fluctuations in interest rates and price changes in the foreign exchange, commodity and other markets. However, as evidenced by our past performance, in the period after a material market disturbance, there may persist extreme uncertainties, which may lead to decreased volume due to factors such as reduced risk exposure, lower interest rates, central bank asset purchase programs and lack of available capital. The shifts in market trading patterns we experienced as a result of the financial disturbance of 2008 may or may not recur in the future, and our business will be affected by future economic uncertainties, which may result in decreased trading volume and a more difficult business environment for us. Material decreases in trading volume would have a material adverse effect on our financial condition and operating results.
We operate in a heavily regulated environment that imposes significant costs and competitive burdens on our business.
We are primarily subject to the jurisdiction of the regulatory agencies in the United States. As a result of our global operations, we are also subject to the rules and regulations of the local jurisdictions in which we conduct business, including ESMA and the FCA. We also have obtained certain licenses from foreign jurisdictions that permit our exchanges and clearing house to offer our products and services to their citizens.
Due to the global financial crisis that began in 2008, the United States and numerous other governments have undertaken reviews of the legal framework governing financial markets and have either passed new laws and regulations, or are in the process of debating or enacting new laws and regulations that will impact our business. Moreover, in February 2017, President
14
Trump signed an executive order calling for the current U.S. presidential administration to review U.S. financial laws and regulations to determine their consistency with a set of core principles identified in the order. Some areas identified as subject to potential change, amendment or repeal include the Dodd-Frank Act and the authorities of the Federal Reserve and Financial Stability Oversight Council. In December 2017, the 2017 Tax Act was signed into law and the ultimate impact to our business remains uncertain. While certain of these changes may have a positive impact on our business, some of these changes could adversely affect our business, including areas of regulatory focus discussed under "Item 1 – Business – Regulatory Matters" beginning on page 11. Compliance with regulations may require us and our customers to dedicate significant financial and operational resources that could result in some participants leaving our markets or decreasing their trading activity, which would negatively affect our profitability. We have incurred and expect to continue to incur significant additional costs to comply with the extensive regulations that apply to our business. To the extent the regulatory environment is less beneficial for us or our customers, our business, financial condition and operating results could be negatively affected.
If we fail to comply with applicable laws, rules or regulations, we may be subject to censure, fines, cease-and-desist orders, suspension of our business, removal of personnel or other sanctions, including revocation of our designations as a contract market and derivatives clearing organization.
We face intense competition from other companies, including some of our members. If we are not able to successfully compete,
our business, financial condition and operating results will be materially harmed.
The industry in which we operate is highly competitive and we expect competition to continue to intensify, especially in light of the implementation of Dodd-Frank and other reforms of the financial services industry. We believe portions of Dodd-Frank and the corresponding regulations with respect to mandatory clearing and organized trading provide opportunities for our business. However, other reforms could negatively impact our business and our ability to compete effectively. We encounter competition in all aspects of our business, including from entities having substantially greater capital and resources, offering a wide range of products and services and in some cases operating under a different and possibly less stringent regulatory regime. We face competition from other futures, securities and securities option exchanges; over-the-counter markets; clearing organizations; consortia formed by our members and large industry participants; swap execution facilities; alternative trade execution facilities; technology firms, including market data distributors and electronic trading system developers, and others. Many of our competitors and potential competitors have greater financial, marketing, technological and personnel resources than we do.
Our competitors may:
|
•
|
respond more quickly to competitive pressures, including responses based upon their corporate governance structures, which may be more flexible and efficient than our corporate governance structure;
|
|
•
|
develop products that are preferred by our customers;
|
|
•
|
develop risk transfer products that compete with our products;
|
|
•
|
price their products and services more competitively;
|
|
•
|
develop and expand their network infrastructure and service offerings more efficiently;
|
|
•
|
utilize better, more user-friendly and more reliable technology;
|
|
•
|
take greater advantage of acquisitions, alliances and other opportunities;
|
|
•
|
more effectively market, promote and sell their products and services;
|
|
•
|
better leverage existing relationships with customers and alliance partners or exploit better recognized brand names to market and sell their services; and
|
|
•
|
exploit regulatory disparities between traditional, regulated exchanges and alternative markets that benefit from a reduced regulatory burden and lower-cost business model.
|
If our products, markets and services are not competitive, our business, financial condition and operating results will be materially harmed. A decline in our fees or loss of customers could lower our revenues, which would adversely affect our profitability.
Please see "Item 1 – Business – Competition" beginning on page 9 for additional information on the competitive environment and its potential impact on our business.
Our contract volume, and consequently our revenues and profits, would be adversely affected if we are unable to retain our current customers or attract new customers.
The success of our business depends, in part, on our ability to maintain and increase our contract volume. To do so, we must maintain and expand our product offerings, our customer base and our trade execution and clearing facilities. Our success also
15
depends on our ability to offer competitive prices and services in an increasingly price-sensitive business. For example, some of our competitors have engaged in aggressive pricing strategies in the past, such as lowering the fees that they charge for taking liquidity and increasing liquidity payments or rebates. We cannot provide assurances that we will be able to continue to expand our product lines, that we will be able to retain our current customers or attract new customers or that we will not be required to modify our pricing structure to compete effectively. Changes in our pricing structure may result in a decrease in our profit margin. We bill a substantial portion of our clearing and transaction fees to our clearing firms. The majority of clearing and transaction fees received from clearing firms represent charges for trades executed and cleared on behalf of their customers. One firm represented
13%
and another firm represented
12%
of our clearing and transaction fees revenue for
2017
. Should a clearing firm withdraw, our experience indicates that the customer portion of the firm's trading activity would likely transfer to another clearing firm of the exchange. However, there is the possibility we would lose a portion of the customer business. Additionally, from time to time, certain customers may represent a significant portion of the open interest in our individual product lines or contracts. If we fail to maintain our contract volume; expand our product offerings or execution facilities; or lose a substantial number of our current customers, or a subset of customers representing a significant percentage of contract volume in a particular product line; or are unable to attract new customers, our business and revenues will be adversely affected. Furthermore, declines in contract volume due to loss of customers may negatively impact market liquidity, which could lead to further loss of contract volume.
Our role in the global marketplace places us at greater risk than other public companies for a cyber attack and other cyber security risks. Our technology, our people and those of our third-party service providers may be vulnerable to cyber security threats, which could result in wrongful use of our information or cause interruptions in our operations that cause us to lose customers and contract volume, and result in substantial liabilities. We also could be required to incur significant expense to protect our systems and/or investigate any alleged attack.
We regard the secure transmission of confidential information and the ability to continuously transact and clear on our electronic trading platforms as critical elements of our operations. Our technology, our people and those of our third-party service providers and our customers may be vulnerable to targeted attacks, unauthorized access, fraud, computer viruses, denial of service attacks, terrorism, "ransom" attacks, firewall or encryption failures and other security problems. Criminal groups, political activist groups and nation-state actors have targeted the financial services industry and our role in the global marketplace places us at greater risk than other public companies for a cyber attack and other information security threats. While the company has not experienced cyber incidents that are individually, or in the aggregate, material, the company has experienced cyber attacks of varying degrees in the past. The company has designed its cyber defense program to mitigate such attacks by preventative, detective, and responsive measures. Our usage of mobile and cloud technologies may increase our risk for a cyber attack. Our security measures may also be breached due to employee error, malfeasance, system errors or vulnerabilities. Additionally, outside parties may attempt to fraudulently induce employees, users, or customers to disclose sensitive information in order to gain access to our technology systems and data, or our customers’ data. Any such breach or unauthorized access could result in significant legal and financial exposure, damage to our reputation, and a loss of confidence in the services we provide that could potentially have an adverse effect on our business, while resulting in regulatory penalties or the imposition of burdensome obligations by regulators. In addition, as the regulatory environment related to information security, data collection and use, and privacy becomes increasingly rigorous, with new and constantly changing requirements applicable to our business, compliance with those requirements could also result in additional costs and may carry significant penalties for non-compliance.
Additionally, our role as a leading derivatives marketplace and the operation of our technology platforms may place us at greater risk for misappropriation of our intellectual property, and persons who circumvent security measures could wrongfully use or steal our information or cause interruptions or malfunctions in our operations. In the past, we have been the victim of trade secret theft by an employee.
As part of our global information security program, we employ resources to monitor and protect our technology infrastructure and employees against such cyber attacks, including the rapid response to zero-day vulnerabilities, and the potential misappropriation of our intellectual property assets. However, our security measures or those of our third-party providers, including any cloud-based technologies, may prove insufficient depending upon the attack or threat posed. Any security attack or breach could result in system failures and delays, loss of customers and lower contract volume, loss of competitive position, damage to our reputation, disruption of our business, legal liability or regulatory fines, significant costs, which in turn, may cause our revenues and earnings to decline. Though we have insurance against some cyber risks and attacks, we may be subject to litigation and financial losses that exceed our policy limits or are not covered under any of our current insurance policies.
As a financial services provider, we are subject to significant litigation risk and potential commodity and securities law liability.
Many aspects of our business involve substantial litigation risks. While we generally are protected by our rules limiting liability for system failures and certain forms of negligence and by statutory limits on the ability to bring private causes of actions in cases where we have not acted in bad faith, we could be exposed to substantial liability under federal and state laws
16
and court decisions, as well as rules and regulations promulgated and/or direct actions brought by the SEC and the CFTC. These risks include, among others, potential liability from disputes over terms of a trade, the claim that a system failure or delay caused monetary losses to a customer, that we entered into an unauthorized transaction, that we provided materially false or misleading statements in connection with a transaction or that we failed to effectively fulfill our regulatory oversight responsibilities. We may be subject to disputes regarding the quality of trade execution, the settlement of trades or other matters relating to our services. We may become subject to these claims as a result of failures or malfunctions of our systems and services we provide. We could incur significant legal expenses defending claims, even those without merit. In addition, an adverse resolution of any future lawsuit or claim against us could have a material adverse effect on our business and our reputation. To the extent we are found to have failed to fulfill our regulatory obligations, we could lose our authorizations or licenses or become subject to conditions that could make future operations more costly and impairing our profitability.
Some of our largest clearing firms have indicated their belief that clearing facilities should not be owned or controlled by exchanges and should be operated as utilities and not for profit. These clearing firms have sought, and may seek in the future, legislative or regulatory changes that would, if adopted, enable them to use alternative clearing services for positions established on our exchanges or to freely move open positions among clearing houses in order to take advantage of our liquidity. Even if they are not successful, these factors may cause them to limit the use of our markets.
Our clearing house seeks to offer customers, intermediaries and clearing firms universal access in order to maximize the efficient use of capital, exercise appropriate oversight of value at risk and maintain operating leverage from clearing activities. Our strategic business plan is to operate an efficient and transparent vertically integrated transaction execution, clearing and settlement business for our futures and options on futures business. Some of our clearing firms have expressed the view that clearing firms should control the governance of clearing houses or that clearing houses should be operated as utilities rather than as part of for-profit enterprises. Some of these firms, along with certain industry associations, have sought, and may seek in the future, legislative or regulatory changes to be adopted that would facilitate mechanisms or policies that allow market participants to transfer positions of futures or options on futures from an exchange-owned clearing house to a clearing house owned and controlled by clearing firms. If these legislative or regulatory changes are adopted, our revenues and profits could be adversely affected.
We may be at greater risk from terrorism than other companies.
We may be more likely than other companies to be a direct target of, or an indirect casualty of, attacks by terrorists or terrorist organizations. It is impossible to accurately predict the likelihood or impact of any terrorist attack on the derivatives industry generally or on our business. While we have implemented significant physical security protection measures
,
business continuity plans and established backup sites, in the event of an attack or a threat of an attack, these security measures and contingency plans may be inadequate to prevent significant disruptions in our business, technology or access to the infrastructure necessary to maintain our business. Such attack may result in the closure of our trading and clearing facilities or render our backup data and recovery systems inoperable. Damage to our facilities due to terrorist attacks may be significantly in excess of any amount of insurance received, or we may not be able to insure against such damage at a reasonable price or at all. The threat of terrorist attacks may also negatively affect our ability to attract and retain employees. Any of these events could have a material adverse effect on our business, financial condition and operating results.
RISKS RELATING TO OUR BUSINESS
Damage to our reputation could damage our business.
Maintaining our reputation and brand is critical to attracting and retaining customers and investors and for maintaining our relationships with our regulators. Negative publicity regarding our company or actual, alleged or perceived issues regarding our products or services could give rise to reputational risk which could significantly harm our business prospects. These issues may include, but are not limited to, any of the risks discussed in this Item 1A, including risks from trading disputes, system failures or intrusions, failures to meet our regulatory obligations, failures of a clearing firm, issues relating to our third party suppliers, misconduct and ineffective risk management.
The success of our markets depends on our ability to complete development of, successfully implement and maintain the electronic trading systems that have the functionality, performance, reliability and speed required by our customers.
The success of our business depends in large part on our ability to create interactive electronic marketplaces, in a wide range of derivatives products, that have the required functionality, performance, capacity, reliability and speed to attract and retain customers. In 2017, 89% of our overall volume was generated through electronic trading on our CME Globex electronic platform.
17
We must continue to enhance our electronic trading platform and other technology offerings to remain competitive. As a result, we will continue to be subject to risks, expenses and uncertainties encountered in the rapidly evolving market for electronic transaction services. These risks include our failure or inability to:
|
•
|
provide reliable and cost-effective services to our customers;
|
|
•
|
develop, in a timely manner, the required functionality to support electronic trading in our key products in a manner that is competitive with the functionality supported by other electronic markets;
|
|
•
|
maintain the competitiveness of our fee structure;
|
|
•
|
attract independent software vendors to write front-end software that will effectively access our electronic trading system and automated order routing system;
|
|
•
|
respond to technological developments or service offerings by competitors; and
|
|
•
|
generate sufficient revenue to justify the substantial capital investment we have made and will continue to make to enhance our electronic trading platform and other technology offerings.
|
If we do not successfully enhance our electronic trading systems and technology offerings, if we are unable to develop them to include other products and markets or if they do not have the required functionality, performance, capacity, reliability and speed desired by our customers, our ability to successfully compete and our revenues and profits will be adversely affected.
Additionally, we rely on our customers' ability to have the necessary back office functionality to support our new products and our trading and clearing functionality. To the extent our customers are not prepared and/or lack the resources or infrastructure, the success of our new initiatives may be compromised.
If we experience systems failures or capacity constraints, our ability to conduct our operations and execute our business strategy could be materially harmed and we could be subjected to significant costs and liabilities.
Our business is highly dependent on our ability to process and monitor, on a daily basis, a large number of transactions which occur at high volume and frequencies across multiple systems. We are heavily reliant on the capacity, reliability and security of the computer and communications systems and software supporting our operations. Our systems, or those of our third-party providers, including cloud providers, may fail or be shut down or, due to capacity constraints, may operate slowly, causing one or more of the following to occur:
|
•
|
unanticipated disruptions in service to our customers;
|
|
•
|
slower response times and delays in our customers' trade execution and processing;
|
|
•
|
failed settlement of trades;
|
|
•
|
incomplete or inaccurate accounting, recording or processing of trades;
|
|
•
|
financial losses;
|
|
•
|
security breaches;
|
|
•
|
litigation or other customer claims;
|
|
•
|
loss of customers; and
|
|
•
|
regulatory sanctions.
|
We cannot assure you that we will not experience systems failures from power or telecommunications failure, acts of God, war or terrorism, human error on our part or on the part of our vendors, natural disasters, fire, sabotage, hardware or software malfunctions or defects, computer viruses, cyber attacks, acts of vandalism or similar occurrences. If any of our systems or the systems of our third-party providers do not operate properly, are compromised or are disabled, including as a result of system failure, employee or customer error or misuse of our systems, we could suffer financial loss, liability to customers, regulatory intervention or reputational damage that could affect demand by current and potential users of our market.
From time to time, we have experienced system errors and failures that have resulted in some customers being unable to connect to our electronic trading platforms and technology offerings, or that resulted in erroneous reporting, such as transactions that were not authorized by any customer or reporting of filled orders as canceled. Such errors may result in CME Group being liable or in our voluntary assumption of financial liability. We cannot assure you that if we experience system errors or failures in the future that they will not have a material adverse impact on our business. Any such system failures that cause an interruption in service or decrease our responsiveness could impair our reputation, damage our brand or have a material adverse effect on our business, financial condition and operating results.
18
Our status as a CFTC registrant generally requires that our trade execution and communications systems be able to handle anticipated present and future peak contract volume. Heavy use of our computer systems during peak trading times or at times of unusual market volatility could cause our systems to operate slowly or even to fail for periods of time. We constantly monitor system loads and performance, and regularly implement system upgrades to handle estimated increases in contract volume. However, we cannot assure you that our estimates of future contract volume and order messaging traffic will be accurate or that our systems will always be able to accommodate actual contract volume and order messaging traffic without failure or degradation of performance. Increased CME Globex contract volume and order messaging traffic may result in connectivity problems or erroneous reports that may affect users of the platform. System failure or degradation could lead our customers to file formal complaints with industry regulatory organizations, to file lawsuits against us or to cease doing business with us, or could lead the CFTC or other regulators to initiate inquiries or proceedings for failure to comply with applicable laws and regulations.
We will need to continue to upgrade, expand and increase the capacity of our systems as our business grows and as we execute our business strategy. Although many of our systems are designed to accommodate additional volume and products and services without redesign or replacement, we will need to continue to make significant investments in additional hardware and software to accommodate the increases in volume of transactions and order transaction traffic and to provide processing services to third parties. If we cannot increase the capacity and capabilities of our systems to accommodate an increasing volume of transactions and to execute our business strategy, our ability to maintain or expand our businesses would be adversely affected.
We, as well as many of our customers, depend on third-party suppliers and service providers for a number of services that are important. An interruption or cessation of an important supply or service by any third party could have a material adverse effect on our business, including revenues derived from our customers' trading activity.
We depend on a number of suppliers, such as banking, clearing and settlement organizations, telephone companies, on-line service providers, data processors, cloud hosting providers, data center providers, and software and hardware vendors, for elements of our trading, clearing and other systems, as well as communications and networking equipment, computer hardware and software and related support and maintenance.
Many of our customers rely on third parties, such as independent software vendors, to provide them with front-end systems to access our CME Globex platform and other back office systems for their trade processing and risk management needs. While these service providers have undertaken to keep current with our enhancements and changes to our interfaces and functionality, we cannot guarantee that they will continue to make the necessary monetary and time investments to keep up with our changes.
To the extent any of our service providers or the organizations that provide services to our customers in connection with their trading activities cease to provide these services in an efficient, cost-effective manner or fail to adequately expand their services to meet our needs and the needs of our customers, we could experience decreased contract volume, lower revenues and higher costs.
Our clearing house operations expose us to substantial credit risk of our clearing firms and, consequently, a diminishment in their financial resources could adversely affect us.
Our clearing house operations expose us to counterparties with differing risk profiles. We routinely guarantee transactions submitted by our clearing firms with counterparties in the financial industry, including brokers and dealers, commercial banks, investment banks, mutual and hedge funds, and other institutional customers. We could be adversely impacted by the financial distress or failure of one or more of our clearing firms.
A substantial part of our working capital may be at risk if a clearing firm defaults on its obligations to the clearing house and its margin and guaranty fund deposits are insufficient to meet its obligations. Although we have policies and procedures to help ensure that our clearing firms can satisfy their obligations, these policies and procedures may not succeed in detecting problems or preventing defaults. We also have in place various measures intended to enable us to cure any default and maintain liquidity. However, we cannot assure you that these measures will be sufficient to protect market participants from a default or that we will not be adversely affected in the event of a significant default. In addition, we have established a fund (currently $98 million) to provide payments, up to certain maximum levels, to qualified family farmers, ranchers and other agricultural industry participants who use our products and who suffer losses to their segregated account balances if their clearing firm member becomes insolvent.
The required capital and posted collateral of our clearing firms may lose value given the volatility of the market.
To become a clearing member, a firm must meet certain minimum capital requirements and must deposit collateral to meet performance bond and guaranty fund requirements. We accept a variety of collateral to satisfy these requirements, including cash, regulated money market mutual funds, U.S. Treasury securities, U.S. Government Agency securities, letters of credit, gold, equities and select ETFs, foreign sovereign debt, Canadian Provincials and corporate bonds, and subject them to established haircuts based on the type of collateral and maturity. There is no guarantee the collateral will maintain its value. To
19
the extent a clearing firm is not compliant with capital, margin or guaranty fund requirements, it would be required to promptly come into compliance by adding capital or collateral, decreasing its proprietary trading activity and/or transferring customer accounts to another clearing firm. These actions could result in a decrease in trading activity in our products.
Intellectual property rights licensed from third-party price reporting agencies form the basis for many of our products from which we derive a significant portion of our volume and revenue. Regulatory scrutiny into such benchmarks could have a negative impact on our ability to offer such products.
We are significantly dependent on the contract volume of products which are based on intellectual property rights of indexes derived from third-party price reporting agencies. To comply with CFTC core principles, we must be able to demonstrate that our products may not be readily subject to manipulation. Our inability to offer products based on these indexes could have a negative impact on our contract volume and revenues.
Our market data revenues may be reduced by decreased demand, poor overall economic conditions or a significant change in how market participants trade and use market data.
We sell our market data to individuals, trading institutions and other organizations that use our information services to participate in our markets and/or monitor general economic conditions. Revenues from our market data and information services represented
11%
of our total revenues during both years ended December 31,
2017
and
2016
. A decrease in overall contract volume may lead to a decreased demand for our market data. For example, in both
2017
and
2016
, we experienced a decrease in the average number of market data devices due to continued economic uncertainty, high unemployment levels in the financial services sector and aggressive cost cutting initiatives at customer firms and the continued impact of legacy incentive programs tied to trading terminals.
We may have difficulty executing our growth strategy and maintaining our growth effectively.
We continue to focus on strategic initiatives to grow our business, including our efforts to serve the over-the-counter markets and to distribute our products and services on a global basis. There is no guarantee that our efforts will be successful. Continued growth will require additional investment in personnel, facilities, information technology infrastructure and financial and management systems and controls and may place a significant strain on our management and resources. For example, if we encounter limited resources, we may be required to increase our expenses to obtain the necessary resources, defer existing initiatives or not pursue certain opportunities. We may not be successful in implementing all of the processes that are necessary to support our growth organically or, as described below, through acquisitions, other investments or strategic alliances. Our growth strategy also may subject us to increased legal, compliance and regulatory obligations. Unless our growth results in an increase in our revenues that is proportionate to the increase in our costs associated with our growth, our future profitability could be adversely affected, and we may have to incur significant expenditures to address the additional operational and control requirements as a result of our growth.
We intend to continue to explore acquisitions, other investments and strategic alliances. We may not be successful in identifying opportunities or in integrating the acquired businesses. Any such transaction may not produce the results we anticipate, which could adversely affect our business and our stock price.
We intend to continue to explore and pursue acquisitions and other strategic opportunities to strengthen our business and grow our company. We may make acquisitions or investments or enter into strategic partnerships, joint ventures and other alliances. The market for such transactions is highly competitive, especially in light of historical merger and acquisition activity in our industry. As a result, we may be unable to identify strategic opportunities or we may be unable to negotiate or finance future transactions on terms favorable to us, which could impact our ability to identify growth opportunities. We may finance future transactions by issuing additional equity and/or debt. The issuance of additional equity in connection with any future transaction could be substantially dilutive to our existing shareholders. The issuance of additional debt could increase our leverage substantially. The process of integration also may produce unforeseen regulatory and operating difficulties and expenditures and may divert the attention of management from the ongoing operation of our business. To the extent we enter into joint ventures and alliances, we may experience difficulties in the development and expansion of the business of any newly formed ventures, in the exercise of influence over the activities of any ventures in which we do not have a controlling interest, as well as encounter potential conflicts with our joint venture or alliance partners. We may not realize the anticipated growth and other benefits from our growth initiatives and investments, which may have an adverse impact on our financial condition and operating results. We also may be required to take an impairment charge in our financial statements relating to our acquisitions and/or investments, which could negatively affect our stock price.
20
Expansion of our global operations involves special challenges that we may not be able to meet, which could adversely affect our financial results.
We plan to continue to expand our global operations. We face certain risks inherent in doing business in international markets, particularly in the regulated derivatives exchange business. These risks include:
|
•
|
becoming subject to extensive regulations and oversight;
|
|
•
|
difficulties in staffing and managing foreign operations;
|
|
•
|
general economic and political conditions in the countries from which our markets are accessed, which may have an adverse effect on our volume from those countries; and
|
|
•
|
potentially adverse tax consequences.
|
We cannot assure you that we will be successful in marketing our products and services in international markets. We also may experience difficulty in managing our international operations because of, among other things, competitive conditions overseas, management of foreign exchange risk, established domestic markets, language and cultural differences and economic or political instability. Any of these factors could have a material adverse effect on the success of our international operations and, consequently, on our business, financial condition and operating results.
The ultimate impact of Brexit on the relevant law and scope of regulation applicable to our U.K. operations and to our European expansion is unclear and is contingent upon the terms of withdrawal and the ongoing relationship between the United Kingdom and the European Union. Brexit may result in legal uncertainty and potentially divergent national laws and regulations as the withdrawal process progresses. This could increase legal, compliance and operational costs.
Our compliance and risk management programs might not be effective and may result in outcomes that could adversely affect our reputation, financial condition and operating results.
In the normal course of our business, we discuss matters with our regulators raised during regulatory examinations, or we may otherwise become subject to their inquiry and oversight. The CFTC has broad enforcement powers to censure, fine, issue cease-and-desist orders, prohibit us from engaging in some of our businesses or suspend or revoke our designation as a contract market or the registration of any of our officers or employees who violate applicable laws or regulations. Our ability to comply with applicable laws and rules is largely dependent on our establishment and maintenance of compliance, review and reporting systems, as well as our ability to attract and retain qualified compliance and other risk management personnel. We face the risk of significant intervention by regulatory authorities, including extensive examination and surveillance activity. In the case of alleged non-compliance with applicable laws or regulations, we could be subject to investigations and judicial or administrative proceedings that may result in substantial penalties or civil lawsuits, including by customers, for damages, which could be significant. Any of these outcomes may adversely affect our reputation, financial condition and operating results. In extreme cases, these outcomes could adversely affect our ability to conduct our business. In 2013, the CFTC filed suit against NYMEX and two former employees alleging disclosure of confidential customer information in violation of the Commodity Exchange Act. Based on our review of the allegations, we believe that we have strong factual and legal defenses to the claim.
Our policies and procedures to identify, monitor and manage our risks may not be fully effective. Some of our risk management methods depend upon evaluation of information regarding markets, customers or other matters that are publicly available or otherwise accessible by us. That information may not in all cases be accurate, complete, up-to-date or properly evaluated. Management of operational, financial, legal, regulatory and strategic risk requires, among other things, policies and procedures to record properly and verify a large number of transactions and events. We cannot assure you that our policies and procedures will always be effective or that we will always be successful in monitoring or evaluating the risks to which we are or may be exposed.
We could be harmed by misconduct or errors that are difficult to detect and deter.
There have been a number of highly publicized cases involving fraud or other misconduct by employees of financial services firms in the past. Misconduct by our employees and agents could include hiding unauthorized activities from us, improper or unauthorized activities on behalf of customers or improper use or unauthorized disclosure of confidential information. Misconduct could subject us to financial losses or regulatory sanctions and seriously harm our reputation. It is not always possible to deter misconduct, and the precautions we take to prevent and detect this activity may not be effective in all cases. Our employees and agents also may commit errors that could subject us to financial claims for negligence, as well as regulatory actions, or result in our voluntary assumption of financial liability.
We may not be able to protect our intellectual property rights, which may materially harm our business.
We own the rights to a large number of trademarks, service marks, domain names and trade names in the United States, Europe and other parts of the world. We have registered many of our most important trademarks in the United States and other
21
countries. We hold the rights to a number of patents and have made a number of patent applications. Our patents cover match engine, trader user interface, trading floor support, market data, general technology and clearing house functionalities. We attempt to protect our intellectual property rights by relying on trademarks, copyright, database rights, trade secrets, restrictions on disclosure and other methods. Notwithstanding the precautions we take to protect our intellectual property rights, it is possible that third parties may copy or otherwise obtain and use our proprietary technology without authorization or otherwise infringe on our rights. For example, one of our former employees pled guilty to theft of our trade secrets. In addition, in the future, we may have to rely on litigation to enforce our intellectual property rights, protect our trade secrets, determine the validity and scope of the proprietary rights of others or defend against claims of infringement or invalidity. Any such litigation, whether successful or unsuccessful, could result in substantial costs to us and diversions of our resources, either of which could adversely affect our business.
Any infringement by us on patent rights of others could result in litigation and adversely affect our ability to continue to provide, or increase the cost of providing, our products and services.
Patents of third parties may have an important bearing on our ability to offer certain products and services. Our competitors as well as other companies and individuals may obtain, and may be expected to obtain in the future, patents related to the types of products and services we offer or plan to offer. We cannot assure you that we are or will be aware of all patents containing claims that may pose a risk of infringement by our products and services. In addition, some patent applications in the United States are confidential until a patent is issued and, therefore, we cannot evaluate the extent to which our products and services may be covered or asserted to be covered by claims contained in pending patent applications. These claims of infringement are not uncommon in our industry.
In general, if one or more of our products or services were to infringe on patents held by others, we may be required to stop developing or marketing the products or services, to obtain licenses to develop and market the services from the holders of the patents or to redesign the products or services in such a way as to avoid infringing on the patent claims. We cannot assess the extent to which we may be required in the future to obtain licenses with respect to patents held by others, whether such licenses would be available or, if available, whether we would be able to obtain such licenses on commercially reasonable terms. If we were unable to obtain such licenses, we may not be able to redesign our products or services to avoid infringement, which could materially adversely affect our business, financial condition and operating results.
RISKS RELATING TO AN INVESTMENT IN OUR CLASS A COMMON STOCK
Our indebtedness could adversely affect our financial condition and operations and prevent us from fulfilling our debt service obligations. We might still be able to incur more debt, intensifying these risks.
As of December 31,
2017
, we had approximately
$2.2 billion
of total indebtedness and we had excess borrowing capacity for general corporate purposes under our existing facilities of approximately
$2.3 billion
.
Our indebtedness could have important consequences. For example, our indebtedness may:
|
•
|
require us to dedicate a significant portion of our cash flow from operations to payments on our debt, thereby reducing the availability of cash flows to fund capital expenditures, to pursue acquisitions or investments, to pay dividends and for general corporate purposes;
|
|
•
|
increase our vulnerability to general adverse economic conditions;
|
|
•
|
limit our flexibility in planning for, or reacting to, changes in or challenges relating to our business and industry; and
|
|
•
|
place us at a competitive disadvantage against any less leveraged competitors.
|
The occurrence of any one of these events could have a material adverse effect on our business, financial condition, results of operations, prospects and ability to satisfy our debt service obligations. In addition, the agreements governing our outstanding indebtedness do not significantly limit our ability to incur additional indebtedness, which could increase the risks described above to the extent that we incur additional debt. Our U.S. exchanges and clearing house also are required to maintain capital as defined by the CFTC.
Any reduction in our credit rating could increase the cost of our funding from the capital markets.
Our long-term debt is currently rated investment grade by two of the major rating agencies. These rating agencies regularly evaluate us. Their ratings of our long-term debt are based on a number of factors, including our financial strength as well as factors not entirely within our control, such as conditions affecting the financial services industry generally. In light of the difficulties in the financial services industry and the financial markets over the last few years, there can be no assurance that we will maintain our current ratings. In the past, we have experienced ratings downgrades. Our failure to maintain our ratings could adversely affect the cost and other terms upon which we are able to obtain funding, and increase our cost of capital. Additionally, if our ratings are downgraded below investment grade due to a change of control, we are required to make an offer to repurchase all of our fixed-rate notes at a price equal to
101%
of the principal amount, plus accrued and unpaid interest.
22
Our operations of, and investments in, businesses outside of the United States subject us to currency risk.
As a global company with operations outside of the United States, portions of our revenues and expenses are denominated in the local currency of the particular subsidiary. Because our consolidated financial statements are presented in U.S. dollars, we must translate non-U.S. dollar denominated revenues, income and expenses, as well as assets and liabilities, into U.S. dollars at exchange rates in effect during or at the end of each reporting period. Therefore, increases or decreases in the value of the U.S. dollar against the other currencies may affect our operating income and the value of balance sheet items denominated in foreign currencies.
Our average rate per contract is subject to fluctuation due to a number of factors. As a result, you may not be able to rely on our average rate per contract in any particular period as an indication of our future average rate per contract.
Our average rate per contract, which impacts our operating results, is subject to fluctuation due to shifts in the mix of products traded, the trading venue and the mix of customers (whether the customer receives member or non-member fees or participates in one of our various incentive programs) and the impact of our tiered pricing structure. In addition, our members and participants in our various incentive programs generally are charged lower fees than our non-member customers. Variation in each of these factors is difficult to predict and will have an impact on our average rate per contract in the particular period. Because of this fluctuation, you may not be able to rely on our average rate per contract in any particular period as an indication of our future average rate per contract. If we fail to meet securities analysts' expectations regarding our operating results, the price of our Class A common stock could decline substantially.
Our cost structure is largely fixed. If our revenues decline and we are unable to reduce our costs, our profitability will be adversely affected.
Our cost structure is largely fixed. If demand for our products and services and our resulting revenues decline, we may not be able to adjust our cost structure on a timely basis. In that event, our profitability would be adversely affected.
Twelve of our board members own trading rights or are officers or directors of firms that own trading rights on our exchanges. As members, these individuals may have interests that differ from or conflict with those of shareholders who are not also members. Our dependence on the trading and clearing activities of our members, combined with the CME members' rights to elect six directors, may enable them to exert substantial influence over the operation of our business.
Twelve of our directors own or are officers or directors of firms that own trading rights on our exchanges. We are dependent on the revenues from the trading and clearing activities of our members. In
2017
,
83%
of our contract volume was derived from our members. This dependence may give them substantial influence over how we operate our business.
Many of our members and clearing firms derive a substantial portion of their income from their trading or clearing activities on or through our exchanges. In addition, trading rights on our exchanges have substantial independent value. The amount of income that members derive from their trading, brokering and clearing activities and the value of their trading rights are, in part, dependent on the fees they are charged to trade, broker, clear and access our markets, and the rules and structure of our markets. As a result, members may not have the same economic interests as holders of our Class A common stock. In addition, our members may have differing interests among themselves depending on the roles they serve in our markets, their methods of trading and the products they trade. Consequently, members may advocate that we enhance and protect their clearing and trading opportunities and the value of their trading privileges over their investment in our Class A common stock, if any.
Our members have been granted special rights, which protect their trading privileges, require that we maintain open outcry for options products still meeting certain volume thresholds and, in the case of our Class B shareholders, provide them with special board representation.
Under the terms of the organizational documents of our exchanges, our members have certain rights that relate primarily to trading right protections, certain trading fee protections and certain membership benefit protections. Additionally, our Class B shareholders, who are members of our CME exchange, are entitled to elect six directors to our board even if their Class A share ownership interest is very small or non-existent. In connection with these rights, our ability to take certain actions that we may deem to be in the best interests of the company and its shareholders, including actions relating to certain pricing decisions, may be limited by the rights of our members.
Not applicable.
23
Our global headquarters are located in Chicago, Illinois, at 20 South Wacker Drive. The following is a description of our key locations and facilities.
|
Location
|
Primary Use
|
Owned/Leased
|
Lease Expiration
|
Approximate Size
(in square feet)
(1)
|
|
|
20 South Wacker Drive Chicago, Illinois
|
Global headquarters and office space
|
Leased
|
2032
(2)
|
512,000
|
|
|
141 West Jackson
Chicago, Illinois
|
Trading floor and office space
|
Leased
|
2027
(3)
|
150,000
|
|
|
333 S. LaSalle
Chicago, Illinois
|
Trading floor and office space
|
Owned
|
N/A
|
300,000
|
|
|
550 West Washington
Chicago, Illinois
|
Office space
|
Leased
|
2023
|
250,000
|
|
|
One North End
New York, New York
|
Trading floor and office space
|
Leased
|
2028
(4)
|
240,000
|
|
|
One New Change London
|
Office space
|
Leased
|
2026
|
58,000
|
|
|
Data Center 3
Chicagoland area
|
Business continuity and co-location
|
Leased
|
2031
(5)
|
83,000
|
|
|
Bagmane Tech Park Bangalore, India
|
Office space
|
Leased
|
2020
(6)
|
72,000
|
|
|
(1)
|
Size represents the amount of space leased or owned by us unless otherwise noted.
|
|
(2)
|
The initial lease expires in 2032 with two consecutive options to extend the term for five years each.
|
|
(3)
|
The initial lease expires in 2027 and contains options to extend the term and expand the premises.
|
|
(4)
|
The initial lease expires in 2028 and contains options to extend the term and expand the premises. In 2019, the premises will be reduced to 225,000 square feet.
|
|
(5)
|
In March 2016, the company sold its datacenter in the Chicago area for $130.0 million. At the time of the sale, the company leased back a portion of the property.
|
|
(6)
|
The initial lease expires in 2020 and contains an option to extend the term as well as an option to terminate early.
|
|
ITEM 3.
|
LEGAL PROCEEDINGS
|
See "Legal and Regulatory Matters" in note 12. Contingencies to the Consolidated Financial Statements beginning on page 75 for CME Group’s legal proceedings disclosure which is incorporated herein by reference.
|
ITEM 4.
|
MINE SAFETY DISCLOSURES
|
Not applicable.
|
ITEM 5.
|
MARKET FOR REGISTRANT’S COMMON EQUITY, RELATED STOCKHOLDER MATTERS AND ISSUER PURCHASES OF EQUITY SECURITIES
|
Class A Common Stock
Our Class A common stock is currently listed on NASDAQ under the ticker symbol "CME." As of February 7, 2018, there were approximately
2,715
holders of record of our Class A common stock.
The following table sets forth the high and low sales prices per share of our Class A common stock on a quarterly basis, as reported on NASDAQ.
|
2017
|
High
|
Low
|
2016
|
High
|
Low
|
|||||||||||||
|
First Quarter
|
$
|
127.00
|
|
$
|
114.40
|
|
First Quarter
|
$
|
96.71
|
|
$
|
81.99
|
|
|||||
|
Second Quarter
|
127.44
|
|
115.12
|
|
Second Quarter
|
98.61
|
|
89.09
|
|
|||||||||
|
Third Quarter
|
135.86
|
|
120.17
|
|
Third Quarter
|
109.76
|
|
96.33
|
|
|||||||||
|
Fourth Quarter
|
153.41
|
|
133.85
|
|
Fourth Quarter
|
123.43
|
|
99.64
|
|
|||||||||
24
Class B Common Stock
Our Class B common stock is not listed on a national securities exchange or traded in an organized over-the-counter market. Each class of our Class B common stock is associated with a membership in a specific division of our CME exchange. CME's rules provide exchange members with trading rights and the ability to use or lease these trading rights. Each share of our Class B common stock can be transferred only in connection with the transfer of the associated trading rights.
Class B shares and the associated trading rights are bought and sold or leased through our membership department. Although our Class B shareholders have special voting rights, because our Class B shares have the same equitable interest in our earnings and the same dividend payments as our Class A shares, we expect that the market price of our Class B common stock, if reported separately from the associated trading rights, would be primarily determined by the value of our Class A common stock
.
As of February 7, 2018, there were approximately
1,590
holders of record of our Class B common stock.
Dividends
The following table sets forth the dividends we declared on our Class A and Class B common stock in the last two years:
|
Record Date
|
Dividend per Share
|
Record Date
|
Dividend per Share
|
|||||||
|
March 10, 2017
|
$
|
0.66
|
|
March 10, 2016
|
$
|
0.60
|
|
|||
|
June 9, 2017
|
0.66
|
|
June 10, 2016
|
0.60
|
|
|||||
|
September 8, 2017
|
0.66
|
|
September 9, 2016
|
0.60
|
|
|||||
|
December 8, 2017
|
0.66
|
|
December 9, 2016
|
0.60
|
|
|||||
|
December 28, 2017
|
3.50
|
|
December 28, 2016
|
3.25
|
|
|||||
We intend to continue to pay a regular quarterly dividend to our shareholders according to our annual dividend policy, which is set at between 50% and 60% of the prior year's cash earnings. The decision to declare a dividend and the amount of the dividend, however, remains within the discretion of our board of directors and may be affected by various factors, including our future earnings, financial condition, capital requirements, levels of indebtedness and other considerations our board of directors deems relevant. On
February 7, 2018
, the board of directors declared a regular quarterly dividend of
$0.70
per share. The dividend will be payable on
March 26, 2018
, to shareholders of record on
March 9, 2018
. Assuming no changes in the number of shares outstanding, the total first quarter dividend payment will be approximately
$237.0 million
. The board of directors also declared an additional, annual variable dividend of $3.50 per share on December 6, 2017, paid on January 16, 2018, to the shareholders of record on December 28, 2017. In general, the amount of the annual variable dividend will be determined at the end of each year, and the level will increase or decrease from year to year based on operating results, capitalization expenditures, potential merger and acquisition activity, and other forms of capital return including regular dividends and share buybacks during the prior year.
The indentures governing our fixed rate notes, our 364-day clearing house credit facility for $7.0 billion and our $2.3 billion multi-currency revolving senior credit facility do not contain specific covenants that restrict the ability to pay dividends. These documents, however, do contain other customary financial and operating covenants that place restrictions on the operations of the company, which could indirectly affect the ability to pay dividends.
For example, under our senior credit facility, we are required to remain in compliance with a consolidated net worth test, defined as our consolidated shareholders’ equity as of September 30, 2017 after giving effect to actual share repurchases made and special dividends paid (including annual variable dividends), but only up to the amount of such repurchases and dividends publicly announced and made or paid after September 30, 2017 (and in no event greater than $2.0 billion in the aggregate for such repurchases and dividends during the term of the agreement), multiplied by 0.65. In addition, our 364-day clearing house credit facility contains a requirement that CME remain in compliance with a consolidated tangible net worth test, defined as consolidated shareholder’s equity less intangible assets (as defined in the agreement), of not less than $800.0 million.
CME Group, as a holding company, has no operations of its own. Instead, it relies on dividends declared and paid to it by its subsidiaries, including CME, in order to provide a portion of the funds which it uses to pay dividends to its shareholders.
CME Group and its subsidiaries are also required to comply with restrictions contained in the general corporation laws of their state of incorporation which could also limit its (or their) ability to declare and pay dividends.
25
PERFORMANCE GRAPH
The following graph and table compares the cumulative five-year total return provided to shareholders on our Class A common stock relative to the cumulative total returns of the S&P 500 index and our customized peer group. The peer group includes CBOE Holdings, Inc., IntercontinentalExchange Group, Inc. and Nasdaq, Inc. An investment of $100 (with reinvestment of all dividends) is assumed to have been made in our Class A common stock, in the peer group and the S&P 500 index on December 31, 2012, and its relative performance is tracked through December 31, 2017.
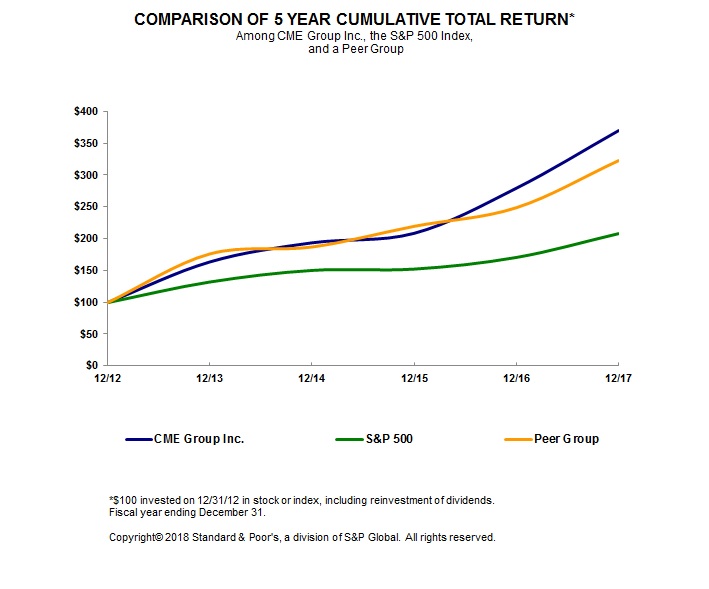
The stock price performance included in this graph is not necessarily indicative of future stock price performance.
|
2013
|
2014
|
2015
|
2016
|
2017
|
|||||||||||||||
|
CME Group Inc.
|
$
|
164.01
|
|
$
|
194.06
|
|
$
|
208.95
|
|
$
|
279.85
|
|
$
|
370.32
|
|
||||
|
S&P 500
|
132.39
|
|
150.51
|
|
152.59
|
|
170.84
|
|
208.14
|
|
|||||||||
|
Peer Group
|
176.61
|
|
187.48
|
|
219.99
|
|
249.31
|
|
323.23
|
|
|||||||||
Unregistered Sales of Equity Securities
During the past three years there have not been any unregistered sales by the company of equity securities.
26
Issuer Purchases of Equity Securities
|
Period
|
Total Number
of Shares (or Units)
Purchased
(1)
|
Average Price
Paid Per Share (or Unit)
|
Total Number of
Shares (or Units) Purchased as
Part of Publicly
Announced
Plans or Programs
|
Maximum Number (or Approximate Dollar Value)
of Shares (or Units) that May Yet Be Purchased Under
the Plans or Programs
(in millions)
|
||||||||||
|
October 1 to October 31
|
119
|
|
$
|
137.17
|
|
—
|
|
$
|
—
|
|
||||
|
November 1 to November 30
|
—
|
|
—
|
|
—
|
|
—
|
|
||||||
|
December 1 to December 31
|
5,764
|
|
146.98
|
|
—
|
|
—
|
|
||||||
|
Total
|
5,883
|
|
—
|
|
||||||||||
_______________
|
(1)
|
Shares purchased consist of an aggregate of
5,883
shares of Class A common stock surrendered to satisfy employee tax obligations upon the vesting of restricted stock.
|
|
ITEM 6.
|
SELECTED FINANCIAL DATA
|
|
|
Year Ended or At December 31
|
|||||||||||||||||||
|
(in millions, except per share data)
|
2017
|
2016
|
2015
|
2014
|
2013
|
|||||||||||||||
|
Income Statement Data:
|
||||||||||||||||||||
|
Total revenues
|
$
|
3,644.7
|
|
$
|
3,595.2
|
|
$
|
3,326.8
|
|
$
|
3,112.5
|
|
$
|
2,936.3
|
|
|||||
|
Operating income
|
2,312.0
|
|
2,202.7
|
|
1,988.7
|
|
1,768.4
|
|
1,637.0
|
|
||||||||||
|
Non-operating income (expense)
|
214.3
|
|
84.9
|
|
(31.9
|
)
|
3.0
|
|
(36.0
|
)
|
||||||||||
|
Income before income taxes
|
2,526.3
|
|
2,287.6
|
|
1,956.8
|
|
1,771.4
|
|
1,601.0
|
|
||||||||||
|
Net income attributable to CME Group
|
4,063.4
|
|
1,534.1
|
|
1,247.0
|
|
1,127.1
|
|
976.8
|
|
||||||||||
|
Earnings per common share attributable to CME Group:
|
||||||||||||||||||||
|
Basic
|
$
|
12.00
|
|
$
|
4.55
|
|
$
|
3.71
|
|
$
|
3.37
|
|
$
|
2.94
|
|
|||||
|
Diluted
|
11.94
|
|
4.53
|
|
3.69
|
|
3.35
|
|
2.92
|
|
||||||||||
|
Cash dividends per share
|
6.14
|
|
5.65
|
|
4.90
|
|
3.88
|
|
4.40
|
|
||||||||||
|
Balance Sheet Data:
|
||||||||||||||||||||
|
Total assets
|
$
|
75,791.2
|
|
$
|
69,369.4
|
|
$
|
67,359.4
|
|
$
|
72,228.6
|
|
$
|
54,263.8
|
|
|||||
|
Short-term debt
|
—
|
|
—
|
|
—
|
|
—
|
|
749.9
|
|
||||||||||
|
Long-term debt
|
2,233.1
|
|
2,231.2
|
|
2,229.3
|
|
2,095.0
|
|
2,093.2
|
|
||||||||||
|
CME Group shareholders’ equity
|
22,411.8
|
|
20,340.7
|
|
20,551.8
|
|
20,923.5
|
|
21,154.8
|
|
||||||||||
27
The following table presents key statistical information on the volume of contracts traded, expressed in round turn trades. All amounts exclude our interest rate swaps and credit default swaps contracts.
|
|
Year Ended or At December 31
|
||||||||||||||
|
(in thousands)
|
2017
|
2016
|
2015
|
2014
|
2013
|
||||||||||
|
Average Daily Volume:
|
|||||||||||||||
|
Product Lines:
|
|||||||||||||||
|
Interest rate
|
8,189
|
|
7,517
|
|
6,720
|
|
7,009
|
|
5,903
|
|
|||||
|
Equity
|
2,682
|
|
3,061
|
|
2,792
|
|
2,764
|
|
2,642
|
|
|||||
|
Foreign exchange
|
922
|
|
858
|
|
872
|
|
803
|
|
886
|
|
|||||
|
Agricultural commodity
|
1,353
|
|
1,321
|
|
1,265
|
|
1,120
|
|
1,053
|
|
|||||
|
Energy
|
2,578
|
|
2,432
|
|
1,970
|
|
1,630
|
|
1,676
|
|
|||||
|
Metal
|
568
|
|
460
|
|
344
|
|
337
|
|
386
|
|
|||||
|
Total Average Daily Volume
|
16,292
|
|
15,649
|
|
13,963
|
|
13,663
|
|
12,546
|
|
|||||
|
Method of Trade:
|
|||||||||||||||
|
Electronic
|
14,513
|
|
13,766
|
|
12,185
|
|
11,805
|
|
10,826
|
|
|||||
|
Open outcry
|
1,107
|
|
1,149
|
|
1,139
|
|
1,176
|
|
1,040
|
|
|||||
|
Privately negotiated
|
672
|
|
734
|
|
639
|
|
682
|
|
680
|
|
|||||
|
Total Average Daily Volume
|
16,292
|
|
15,649
|
|
13,963
|
|
13,663
|
|
12,546
|
|
|||||
|
Other Data:
|
|||||||||||||||
|
Total Contract Volume (round turn trades)
|
4,089,175
|
|
3,943,670
|
|
3,532,521
|
|
3,443,051
|
|
3,161,477
|
|
|||||
|
Open Interest at Year End (contracts)
|
108,043
|
|
102,930
|
|
91,369
|
|
93,664
|
|
83,726
|
|
|||||
28
|
ITEM 7.
|
MANAGEMENT’S DISCUSSION AND ANALYSIS OF FINANCIAL CONDITION AND RESULTS OF OPERATIONS
|
INTRODUCTION
Management’s Discussion and Analysis of Financial Condition and Results of Operations is organized as follows:
|
•
|
Executive Summary
: Includes an overview of our business; current economic, competitive and regulatory trends relevant to our business; our current business strategy; and our primary sources of operating and non-operating revenues and expenses.
|
|
•
|
Critical Accounting Policies
: Provides an explanation of accounting policies which may have a significant impact on our financial results and the estimates, assumptions and risks associated with those policies.
|
|
•
|
Recent Accounting Pronouncements
: Includes an evaluation of recent accounting pronouncements and the potential impact of their future adoption on our financial results.
|
|
•
|
Results of Operations
: Includes an analysis of our
2017
,
2016
and
2015
financial results and a discussion of any known events or trends which are likely to impact future results.
|
|
•
|
Liquidity and Capital Resources
: Includes a discussion of our future cash requirements, capital resources, significant planned expenditures and financing arrangements.
|
References in this discussion and analysis to “we” and “our” are to CME Group Inc. (CME Group) and its consolidated subsidiaries, collectively. References to “exchange” are to Chicago Mercantile Exchange Inc. (CME), the Board of Trade of the City of Chicago, Inc. (CBOT), New York Mercantile Exchange, Inc. (NYMEX), Commodity Exchange, Inc. (COMEX), collectively, unless otherwise noted.
EXECUTIVE SUMMARY
Business Overview
CME Group, a Delaware stock corporation, is the holding company for CME, CBOT, NYMEX, COMEX and their respective subsidiaries. The holding company structure is designed to provide strategic and operational flexibility. CME Group's Class A common stock is listed on the NASDAQ Global Select Market (NASDAQ) under the ticker symbol "CME."
Our exchange consists of designated contract markets for the trading of futures and options on futures contracts. We also clear futures, options on futures and swaps contracts through our clearing house. Futures contracts, options on futures contracts and swaps contracts provide investors with vehicles for protecting against, and potentially profiting from, price changes in financial instruments and physical commodities.
We are a global exchange with customer access available virtually all over the world. Our customers consist of professional traders, financial derivatives institutions, individual and institutional investors, major corporations, manufacturers, producers and governments. Customers include both members of the exchange and non-members.
We offer our customers the opportunity to trade futures contracts and options on futures contracts on a range of products including those based on interest rates, equities, foreign exchange, agricultural commodities, energy and metals. We also clear interest rate swaps and credit default swaps contracts. In September 2017, we announced we will exit the credit default swaps business by mid-2018.
Our products provide a means for hedging, speculating and allocating assets. We identify new products by monitoring economic trends and their impact on the risk management and speculative needs of our existing and prospective customers.
Most of our products are available for trading through our electronic trading platform. This execution facility offers our customers immediate trade execution and price transparency. In addition, trades can be executed through privately negotiated transactions that are cleared and settled through our clearing house.
Our clearing house clears, settles and guarantees futures and options contracts traded through our exchanges, in addition to cleared swaps products. Our clearing house's performance guarantee is an important function of our business. Because of this guarantee, our customers do not need to evaluate the credit of each potential counterparty or limit themselves to a selected set of counterparties. This flexibility increases the potential liquidity available for each trade. Additionally, the substitution of our clearing house as the counterparty to every transaction allows our customers to establish a position with one party and offset the position with another party. This contract offsetting process provides our customers with flexibility in establishing and adjusting positions and provides for collateral and margining efficiencies.
In addition, CME serves as a swap execution facility, which is a regulated platform for swap trading, and serves as a swap data repository, which provides public data on swap transactions and stores confidential swap data for regulatory purposes.
29
Business Trends
Economic Environment.
Our customers continue to use our markets as an effective and transparent means to manage risk and meet their investment needs despite economic uncertainty and volatility. Trading activity in our centralized markets has fluctuated due to the ongoing uncertainty in the financial markets caused by the United States and European credit crises, fluctuations in the availability of credit, variations in the amount of assets under management as well as the Federal Reserve Bank’s interest rate policy and quantitative easing. We continue to maintain high quality and diverse products as well as various clearing and market data services which support our customers in any economic environment.
Competitive Environment.
Our industry is competitive and we continue to encounter competition in all aspects of our business. We expect competition to continue to intensify, especially in light of ongoing regulatory reform in the financial services industry. Competition is influenced by our brand and reputation; the efficiency and security of our services; depth and liquidity of our markets; breadth of product offerings including rate and quality of new product development and innovative services; our ability to position and expand upon existing products; efficient and seamless customer experience; transparency, reliability and anonymity of transaction processing; the regulatory environment; efficient and innovative technology and connectivity, as well as transaction costs. We believe we are very well positioned with respect to these factors. Our asset classes contain products designed to address differing risk management needs, and customers are able to achieve operational and capital efficiencies by accessing our diverse products through our platforms and our clearing house. We now face competition from other futures, securities and securities option exchanges; clearing organizations; swap execution facilities; alternative trade execution facilities; technology firms, including market data distributors and electronic trading system developers; and others. As markets continue to evolve, we will continue to adapt our trading technology and clearing services to meet the needs of our customers.
Regulatory Environment.
Exchange-traded derivatives have historically been subject to extensive regulation. As a result of the widespread difficulties across the economy over the last several years, various domestic and foreign governments have undertaken reviews of the existing legal framework governing financial markets and have passed laws and regulations that apply to our business. Compliance with regulations may require us and our customers to dedicate significant financial and operational resources which could adversely affect our profitability.
Our U.S. futures exchanges and our clearing house are subject to extensive regulation by the U.S. Commodity Futures Trading Commission (CFTC), which carries out the regulation of the futures markets in accordance with the provisions of the Commodity Exchange Act, the Commodity Futures Modernization Act and the Dodd-Frank Wall Street Reform and Consumer Protection Act (Dodd-Frank). We believe that the regulations provide opportunities for our business. Our U.S. clearing house has been designated by the CFTC as a systemically important derivatives clearing organization, which imposes various procedural and substantive requirements. Our U.S. swap data repository service swap execution facility is also subject to the requirements of the Commodity Exchange Act and the regulations of the CFTC. We have incurred and expect to continue to incur significant additional costs to comply with the provisions of Dodd-Frank and any new regulations. In February 2017, President Trump signed an executive order calling for the current U.S. presidential administration to review U.S. financial laws and regulations to determine their consistency with a set of core principles identified in the order. Some areas identified as subject to potential change, amendment or repeal include the Dodd-Frank Act and the authorities of the Federal Reserve and the Financial Stability Oversight Council. We cannot predict, which, if any, of these or other actions will be taken or, if taken, their effect on our business.
As a global company with operations and locations around the world, we are also subject to laws and regulations in foreign locations where we do business. The financial services industry in Europe has recently undergone regulatory reform and a re-organization of its regulatory framework. Our European operations are overseen by several regulators, including the European Securities Market Authority (ESMA) and the Financial Conduct Authority (FCA). In June 2016, the United Kingdom held a referendum in which voters decided in favor of withdrawal from the European Union. The ultimate impact of this referendum in regards to the laws and regulations applicable to our European operations remains unclear and is contingent on the terms of the withdrawal and the ongoing relationship between the United Kingdom and the European Union. We have incurred and expect to continue to incur significant additional costs to comply with the new regulations in Europe as well as the effects of this referendum.
Business Strategy
Our strategy focuses on building upon our benchmark products, globalizing our company, expanding our customer base, extending our risk management and post trade offerings, and establishing ourselves as the leading exchange company provider of information products and index services as well as enhancing our intellectual property portfolio. We focus specifically on opportunities created by increased market awareness and acceptance of derivatives, increased price volatility, technological advances and the increasing need for counterparty risk mitigation and clearing services. This strategy allows us to continue to
30
develop into a more broadly diversified financial exchange that provides trading and clearing solutions across a wide range of products and asset classes. Our strategic initiatives are discussed in "Item 1. Business" on page 5.
Revenues
Clearing and transaction fees.
A majority of our revenue is derived from clearing and transaction fees, which include electronic trading fees, surcharges for privately negotiated transactions and other volume-related charges for exchange-traded and cleared swaps contracts. Because clearing and transaction fees are assessed on a per-contract or notional value basis, revenues and profitability fluctuate with changes in contract volume. In addition to the business trends noted earlier, our contract volume, and consequently our revenues, tend to increase during periods of economic and geopolitical uncertainty as our customers seek to manage their exposure to, or speculate on, the market volatility resulting from that uncertainty.
While volume has the most significant impact on our clearing and transaction fees revenue, there are four other factors that also influence this source of revenue:
|
•
|
rate structure;
|
|
•
|
product mix;
|
|
•
|
venue, and
|
|
•
|
the percentage of trades executed by customers who are members compared with non-member customers.
|
Rate structure.
Customers benefit from volume discounts and limits on fees as part of our effort to increase liquidity in certain products. We offer various incentive programs to promote trading and clearing in various products and geographic locations. We may periodically change fees, volume discounts, fee limits and member discounts, perhaps significantly, based on our review of operations and the business environment.
Product mix.
We offer exchange-traded futures and options on futures contracts as well as cleared-only interest rate and credit default swap contracts. Rates are varied by product in order to optimize revenue on existing products and to encourage contract volume upon introduction of new products.
Venue.
Our exchange is an international marketplace that brings together buyers and sellers mainly through our electronic trading as well as through open outcry trading and privately negotiated transactions. Any customer who is guaranteed by a clearing firm and who agrees to be bound by our exchange rules is able to obtain direct access to our electronic platforms. Open outcry trading is conducted exclusively by our members, who may execute trades on behalf of customers or for themselves.
Typically, customers submitting trades through our electronic platforms are charged fees for using the platforms in addition to the fees assessed on all transactions executed on our exchange. Customers entering into privately negotiated transactions also incur additional charges beyond the fees assessed on other transactions. Privately negotiated transactions include block trades, which are large transactions that are executed between selected parties off the public auction market on CME Globex or the trading floor. Privately negotiated transactions also include volume submitted through CME ClearPort and Exchange for Related Positions (EFRPs).
Member/non-member mix.
Generally, member customers are charged lower fees than our non-member customers. Holding all other factors constant, revenue decreases if the percentage of trades executed by members increases, and increases if the percentage of non-member trades increases.
Other sources.
Revenue is also derived from other sources including market data and information services, access and communication fees and other various services related to our exchange operations.
Market data and information services.
We receive market data and information services revenue from the dissemination of our market data to subscribers. Subscribers can obtain access to our market data services either directly or through third party distributors.
Our service offerings include access to real-time, delayed and end-of-day quotations, trade and summary market data for our products and other data sources. Users of our basic service receive real-time quotes and pay a flat monthly fee for each screen, or device, displaying our market data. Alternatively, customers can subscribe to market data provided on a limited group of products. The fee for this service is also a flat rate per month.
Pricing for our market data services is based on the value of the service provided and the price of comparable services offered by our competitors. Increases or decreases in our market data and information services revenue are influenced by changes in our price structure for existing market data offerings, introduction of new market data services and changes in the number of devices in use. General economic factors that affect the financial services industry, which constitutes our primary customer base, also influence revenue from our market data services.
31
Access and communication fees.
Access and communication fees are charges to members and clearing firms that utilize our various telecommunications networks and communications services. Our communication services include our co-location program as well as the connectivity charges to customers of the CME Globex platform. Access fee revenue varies depending on the type of connection provided to customers.
Other revenues.
Other revenues include fees for collateral management and fees for trade order routing through agreements from various strategic relationships as well as other services to members and clearing firms.
Expenses
The majority of our expenses do not vary directly with changes in our contract volume. However, licensing and other fee agreements can vary directly with certain equity, energy and swap volumes as well as the majority of our employee bonuses vary directly with overall contract volume.
Compensation and benefits.
Compensation and benefits expense is our most significant expense and includes employee wages, bonuses, stock-based compensation, benefits and employer taxes. Changes in this expense are driven by fluctuations in the number of employees, increases in wages as a result of inflation or labor market conditions, changes in rates for employer taxes and other cost increases affecting benefit plans. In addition, this expense is affected by the composition of our workforce. The expense associated with our bonus and stock-based compensation plans can also have a significant impact on this expense category.
The bonus component of our compensation and benefits expense is based on our financial performance. Under the performance criteria of our annual incentive plans, the bonus funded under the plans is based on achieving certain financial performance targets established by the compensation committee of our board of directors. The compensation committee has discretion to make equitable adjustments to the cash earnings performance calculation to reflect effects of unplanned operating results or capital expenditures to meet intermediate- to long-term growth opportunities.
Stock-based compensation is a non-cash expense related to restricted stock and performance share grants. Stock-based compensation varies depending on the quantity and fair value of awards granted. The fair value of restricted stock awards and other performance share grants is based on either the share price on the date of the grant or a model of expected future stock prices.
Professional fees and outside services.
This expense includes fees for consulting services received on strategic and technology initiatives; regulatory and other compliance matters; temporary labor as well as legal and accounting fees. This expense may fluctuate as a result of changes in services required to complete initiatives, handle legal proceedings and comply with regulatory and compliance requirements.
Depreciation and amortization.
Depreciation and amortization expense results from the depreciation of long-lived assets such as buildings, leasehold improvements, furniture, fixtures and equipment. This expense also includes the amortization of purchased and internally developed software.
Other expenses.
We incur amortization of intangible assets and additional ongoing expenses for communications, technology support services and various other activities necessary to support our operations.
|
•
|
Communications expense includes costs for network connections for our electronic platforms and some market data customers; telecommunications costs of our exchange, and fees paid for access to external market data. This expense may be impacted by growth in electronic contract volume, our capacity requirements and changes in the number of telecommunications hubs and connections which allow customers outside the United States to access our electronic platforms directly.
|
|
•
|
Technology support services expense consists of costs related to maintenance of the hardware and software required to support our technology. Our technology support services costs are driven by system capacity, functionality and redundancy requirements.
|
|
•
|
Amortization of purchased intangibles includes amortization of intangible assets obtained in our mergers with CBOT Holdings, Inc. and NYMEX Holdings, Inc. as well as other asset and business acquisitions. Intangible assets subject to amortization consist primarily of clearing firm, market data and other customer relationships.
|
|
•
|
Occupancy and building operations expense consists of costs related to leased property including rent, maintenance, real estate taxes, utilities and other related costs. We have significant operations located in Chicago, New York, India and the United Kingdom as well as other smaller offices located throughout the world.
|
|
•
|
Licensing and other fee agreements expense includes license fees paid as a result of contract volume in equity index products. This expense also includes royalty fees and broker rebates on energy and metals products as well as revenue sharing on cleared swaps contracts and some new product launches. This expense fluctuates with changes in contract volumes as well as changes in fee structures.
|
32
|
•
|
Other expenses include marketing and travel-related expenses as well as general and administrative costs. Marketing, advertising and public relations expense includes media, print and other advertising costs, as well as costs associated with our product promotion. Other expenses also include litigation and customer settlements, impairment charges on operating assets, gains and losses on disposals of operating assets, and foreign currency transaction gains and losses resulting from changes in exchange rates on certain foreign deposits.
|
Non-Operating Income and Expenses
Income and expenses incurred through activities outside of our core operations are considered non-operating. These activities include non-core investing and financing activities.
|
•
|
Investment income includes income from short-term investment of clearing firms' cash performance bonds and guaranty fund contributions as well as excess operating cash; interest income and realized gains and losses from our marketable securities; realized gains and losses as well as dividend income from our strategic equity investments, and gains and losses on trading securities in our non-qualified deferred compensation plans. Investment income is influenced by market interest rates, changes in the levels of cash performance bonds deposited by clearing firms, the amount of dividends distributed by our strategic investments and the availability of funds generated by operations.
|
|
•
|
Interest and other borrowing costs expense includes charges associated with various short-term and long-term funding facilities, including commitment fees on lines of credit agreements.
|
|
•
|
Equity in net earnings (losses) of unconsolidated subsidiaries includes income and losses from our investments in S&P/Dow Jones Indices LLC (S&P/DJI), Dubai Mercantile Exchange and Bursa Malaysia Derivatives Berhad.
|
|
•
|
Other income (expense) includes expenses related to the distribution of interest earned on performance bond collateral reinvestment to the clearing firms as well as other various income and expenses outside our core operations.
|
CRITICAL ACCOUNTING POLICIES
The notes to our consolidated financial statements include disclosure of our significant accounting policies. In establishing these policies within the framework of accounting principles generally accepted in the United States, management must make certain assessments, estimates and choices that will result in the application of these principles in a manner that appropriately reflects our financial condition and results of operations. Critical accounting policies are those policies that we believe present the most complex or subjective measurements and have the most potential to affect our financial position and operating results. While all decisions regarding accounting policies are important, there are certain accounting policies that we consider to be critical. These critical policies, which are presented in detail in the notes to our consolidated financial statements, relate to the valuation of financial instruments, goodwill and intangible assets, revenue recognition, income taxes and internal use software costs.
Valuation of financial instruments.
Fair value is defined as the price that would be received to sell an asset or paid to transfer a liability in an orderly transaction between market participants at the measurement date, or an exit price. We have categorized financial instruments measured at fair value into the following three-level fair value hierarchy based upon the level of judgment associated with the inputs used to measure the fair value:
|
•
|
Level 1—Inputs are unadjusted, quoted prices in active markets for identical assets or liabilities at the measurement date.
|
|
•
|
Level 2—Inputs are either directly or indirectly observable and corroborated by market data or are based on quoted prices in markets that are not active.
|
|
•
|
Level 3—Inputs are unobservable and reflect management’s best estimate of what market participants would use in pricing the asset or liability. Assets and liabilities carried at level 3 fair value generally include assets and liabilities with inputs that require management’s judgment.
|
For further discussion regarding the fair value of financial assets and liabilities, see note 17 of the notes to the consolidated financial statements.
Goodwill and intangible assets.
We review goodwill for impairment on a quarterly basis and whenever events or circumstances indicate that its carrying value may not be recoverable. Goodwill may be tested quantitatively for impairment by comparing the carrying value of a reporting unit to its estimated fair value. Estimating the fair value of a reporting unit involves the use of valuation techniques that rely on significant estimates and assumptions. These estimates and assumptions may include forecasted revenue growth rates; forecasted operating margins; risk-adjusted discount rates; forecasted economic and market conditions, and industry multiples. We base our fair value estimates on assumptions we believe to be reasonable given the information that is available to us at the time of our assessment; however, actual future results may differ significantly from those estimates. Under certain favorable circumstances, goodwill may be reviewed qualitatively for indications of impairment without utilizing valuation techniques to estimate fair value. The qualitative assessment of goodwill may rely on significant
33
assumptions about forecasts of revenue growth, operating margins and economic conditions as well as overall market and industry-specific trends.
We also review indefinite-lived intangible assets on a quarterly basis or more frequently when events and circumstances indicate that their carrying values may not be recoverable. Indefinite-lived intangible assets may be tested quantitatively for impairment by comparing their carrying values to their estimated fair values. Estimating the fair value of indefinite-lived intangible assets involves the use of valuation techniques that rely on significant estimates and assumptions. These estimates and assumptions may include forecasted revenue growth rates, forecasted allocations of expense and risk-adjusted discount rates. We base our fair value estimates on assumptions we believe to be reasonable given the information that is available to us at the time of our assessment; however, actual future results may differ significantly from those estimates. Similar to goodwill, under certain favorable circumstances, indefinite-lived intangible assets may be reviewed qualitatively for indications of impairment without utilizing valuation techniques to estimate fair value. The qualitative assessment of indefinite-lived intangible assets may rely on significant assumptions about forecasts of revenue growth, operating margins and economic conditions as well as overall market and industry-specific trends.
Intangible assets subject to amortization are also assessed for impairment on a quarterly basis or more frequently when indicated by a change in economic or operational circumstances. The impairment assessment of these assets requires management to first compare the book value of the amortizing asset to undiscounted cash flows. If the book value exceeds the undiscounted cash flows, management is then required to estimate the fair value of the assets and record an impairment loss for the excess of the carrying value over the fair value and annually challenge the useful lives.
Revenue recognition.
A significant portion of our revenue is derived from the clearing and transaction fees we assess on each contract executed through our trading venues and cleared through our clearing house. Clearing and transaction fees are recognized as revenue when a buy and sell order are matched and when the trade is cleared. On occasion, the customer's exchange trading privileges may not be properly entered by the clearing firm and incorrect fees are charged for the transactions in the affected accounts. When this information is corrected within the time period allowed by the exchange, a fee adjustment is provided to the clearing firm. An accrual is established for estimated fee adjustments to reflect corrections to customer exchange trading privileges. The accrual is based on the historical pattern of adjustments processed as well as specific adjustment requests.
Income taxes.
Calculation of the income tax provision includes an estimate of the income taxes that will be paid for the current year as well as an estimate of income tax liabilities or benefits deferred into future years. Deferred tax assets are reviewed to determine if they will be realized in future periods. To the extent it is determined that some deferred tax assets may not be fully realized, the assets are reduced to their realizable value by a valuation allowance. The calculation of our tax provision involves uncertainty in the application of complex tax regulations. We recognize potential liabilities for anticipated tax audit issues in the United States and other applicable foreign tax jurisdictions using a more-likely-than-not recognition threshold based on the technical merits of the tax position taken or expected to be taken. If the actual obligation of these amounts varies from our estimate, our income tax provision would be reduced or increased at the time that determination is made. This determination may not be known for several years. Past tax audits have not resulted in tax adjustments that resulted in a material change to the income tax provision in the year the audit was completed. The effective tax rate, defined as the income tax provision as a percentage of income before income taxes, will vary from year to year based on changes in tax jurisdictions, tax rates and regulations. In addition, the effective tax rate will vary with changes to income that are not subject to income tax and changes in expenses or losses that are not deductible, such as the utilization of foreign net operating losses.
Internal use software costs.
Certain internal and external costs that are incurred in connection with developing or obtaining computer software for internal use are capitalized. Software development costs incurred during the planning or maintenance stages of a software project are expensed as incurred, while costs incurred during the application development stage are capitalized and are amortized over the estimated useful life of the software, generally two to four years. Amortization of capitalized costs begins only when the software becomes ready for its intended use. We also enter into software hosting arrangements for software projects maintained in the cloud. The costs associated with these cloud-based hosting arrangements do not qualify for capitalization and are expensed as incurred.
RECENT ACCOUNTING PRONOUNCEMENTS
Refer to Note 2 in our notes to the consolidated financial statements for information on new and recently adopted accounting pronouncements that are applicable to us.
34
RESULTS OF OPERATIONS
Financial Highlights
The following summarizes significant changes in our financial performance for the years presented.
|
|
|
|
|
Year-over-Year Change
|
||||||||||||||
|
(dollars in millions, except per share data)
|
2017
|
2016
|
2015
|
2017-2016
|
2016-2015
|
|||||||||||||
|
Total revenues
|
$
|
3,644.7
|
|
$
|
3,595.2
|
|
$
|
3,326.8
|
|
1
|
%
|
8
|
%
|
|||||
|
Total expenses
|
1,332.7
|
|
1,392.5
|
|
1,338.1
|
|
(4
|
)
|
4
|
|
||||||||
|
Operating margin
|
63
|
%
|
61
|
%
|
60
|
%
|
||||||||||||
|
Non-operating income (expense)
|
$
|
214.3
|
|
$
|
84.9
|
|
$
|
(31.9
|
)
|
n.m.
|
|
n.m.
|
|
|||||
|
Effective tax expense (benefit) rate
|
(61
|
)%
|
33
|
%
|
36
|
%
|
||||||||||||
|
Net income
|
$
|
4,063.4
|
|
$
|
1,534.1
|
|
$
|
1,247.0
|
|
165
|
|
23
|
|
|||||
|
Diluted earnings per common share
|
11.94
|
|
4.53
|
|
3.69
|
|
164
|
|
23
|
|
||||||||
|
Cash flows from operating activities
|
1,840.4
|
|
1,742.8
|
|
1,532.5
|
|
6
|
|
14
|
|
||||||||
_______________
n.m. not meaningful
Revenues
|
|
|
|
|
Year-over-Year Change
|
||||||||||||||
|
(dollars in millions)
|
2017
|
2016
|
2015
|
2017-2016
|
2016-2015
|
|||||||||||||
|
Clearing and transaction fees
|
$
|
3,098.6
|
|
$
|
3,036.4
|
|
$
|
2,783.9
|
|
2
|
%
|
9
|
%
|
|||||
|
Market data and information services
|
391.8
|
|
406.5
|
|
399.4
|
|
(4
|
)
|
2
|
|
||||||||
|
Access and communication fees
|
100.8
|
|
91.4
|
|
86.1
|
|
10
|
|
6
|
|
||||||||
|
Other
|
53.5
|
|
60.9
|
|
57.4
|
|
(12
|
)
|
6
|
|
||||||||
|
Total Revenues
|
$
|
3,644.7
|
|
$
|
3,595.2
|
|
$
|
3,326.8
|
|
1
|
|
8
|
|
|||||
Clearing and Transaction Fees
The following table summarizes our total contract volume, revenue and average rate per contract for futures and options. Total contract volume includes contracts that are traded on our exchange and cleared through our clearing houses and certain cleared-only contracts. Volume is measured in round turns, which is considered a completed transaction that involves a purchase and an offsetting sale of a contract. Average rate per contract is determined by dividing total clearing and transaction fees by total contract volume. Contract volume and average rate per contract disclosures exclude credit default swaps and interest rate swaps.
|
|
|
|
|
Year-over-Year Change
|
|||||||||||||
|
|
2017
|
2016
|
2015
|
2017-2016
|
2016-2015
|
||||||||||||
|
Total contract volume (in millions)
|
4,089.2
|
|
3,943.7
|
|
3,532.5
|
|
4
|
%
|
12
|
%
|
|||||||
|
Clearing and transaction fees (in millions)
|
$
|
3,029.9
|
|
$
|
2,974.4
|
|
$
|
2,716.9
|
|
2
|
|
9
|
|
||||
|
Average rate per contract
|
0.741
|
|
0.754
|
|
0.769
|
|
(2
|
)
|
(2
|
)
|
|||||||
We estimate the following increases (decreases) in clearing and transaction fees based on changes in total contract volume and changes in average rate per contract during
2017
compared with
2016
, and during
2016
compared with
2015
.
|
|
Year-over-Year Change
|
|||||||
|
(in millions)
|
2017-2016
|
2016-2015
|
||||||
|
Increases due to change in total contract volume
|
$
|
109.8
|
|
$
|
316.2
|
|
||
|
Increase (decrease) due to change in average rate per contract
|
(54.3
|
)
|
(58.7
|
)
|
||||
|
Net increases in clearing and transaction fees
|
$
|
55.5
|
|
$
|
257.5
|
|
||
35
Average rate per contract is impacted by our rate structure, including volume-based incentives, product mix, trading venue and the percentage of volume executed by customers who are members compared with non-member customers. Due to the relationship between average rate per contract and contract volume, the change in clearing and transaction fees attributable to changes in each is only an approximation.
Contract Volume
The following table summarizes average daily contract volume. Contract volume can be influenced by many factors, including political and economic factors, the regulatory environment and market competition.
|
|
|
|
|
Year-over-Year Change
|
|||||||||||
|
(amounts in thousands)
|
2017
|
2016
|
2015
|
2017-2016
|
2016-2015
|
||||||||||
|
Average Daily Volume by Product Line:
|
|||||||||||||||
|
Interest rate
|
8,189
|
|
7,517
|
|
6,720
|
|
9
|
%
|
12
|
%
|
|||||
|
Equity
|
2,682
|
|
3,061
|
|
2,792
|
|
(12
|
)
|
10
|
|
|||||
|
Foreign exchange
|
922
|
|
858
|
|
872
|
|
7
|
|
(2
|
)
|
|||||
|
Agricultural commodity
|
1,353
|
|
1,321
|
|
1,265
|
|
2
|
|
4
|
|
|||||
|
Energy
|
2,578
|
|
2,432
|
|
1,970
|
|
6
|
|
23
|
|
|||||
|
Metal
|
568
|
|
460
|
|
344
|
|
23
|
|
34
|
|
|||||
|
Aggregate average daily volume
|
16,292
|
|
15,649
|
|
13,963
|
|
4
|
|
12
|
|
|||||
|
Average Daily Volume by Venue:
|
|||||||||||||||
|
Electronic
|
14,513
|
|
13,766
|
|
12,185
|
|
5
|
|
13
|
|
|||||
|
Open outcry
|
1,107
|
|
1,149
|
|
1,139
|
|
(4
|
)
|
1
|
|
|||||
|
Privately negotiated
|
672
|
|
734
|
|
639
|
|
(9
|
)
|
15
|
|
|||||
|
Aggregate average daily volume
|
16,292
|
|
15,649
|
|
13,963
|
|
4
|
|
12
|
|
|||||
|
Electronic Volume as a Percentage of Total Volume
|
89
|
%
|
88
|
%
|
87
|
%
|
|||||||||
Overall contract volume increased in 2017 when compared with 2016. Interest rate volatility remained high in 2017 as the markets continued to experience uncertainty surrounding the Federal Reserve's interest rate policy. In December, the Federal Open Markets Committee raised the federal funds rate for the third time in 2017 and also raised the expectation for additional rate increases in 2018. The equity markets experienced lower volatility in 2017 due to fewer market-moving geopolitical events, which resulted in lower equity contract volume. Crude oil volumes continued to grow throughout 2017 as crude oil market volatility remained high, which contributed to an increase in energy contract volume. There was a shift in crude oil supplies caused by an increase in United States crude oil production following the Organization of Petroleum Exporting Countries' (OPEC) decision to cut oil supplies in the fourth quarter of 2016.
In 2016 when compared with 2015, overall contract volume remained high throughout 2016 due to periods of high volatility. Throughout 2016, we believe that global market concerns, considerable uncertainty regarding the Federal Reserve's interest rate policy and the anticipation of the United Kingdom's European Union membership referendum contributed to considerable volatility. In the second half of 2016, volume across most of our products lines spiked as the U.S. presidential and congressional elections injected considerable uncertainty into the markets. The crude oil markets continued to show considerable uncertainty in early 2016 regarding the direction of future oil prices as global supplies continued to remain high, which resulted in an increase in energy contract volume.
36
Interest Rate Products
The following table summarizes average daily contract volume for our key interest rate products. Eurodollar front 8 contracts include contracts expiring within two years. Eurodollar back 32 contracts include contracts expiring within three to ten years.
|
|
|
|
|
Year-over-Year Change
|
||||||||
|
(amounts in thousands)
|
2017
|
2016
|
2015
|
2017-2016
|
2016-2015
|
|||||||
|
Eurodollar futures and options:
|
||||||||||||
|
Front 8 futures
|
1,745
|
1,828
|
1,580
|
(5
|
)%
|
16
|
%
|
|||||
|
Back 32 futures
|
769
|
729
|
724
|
5
|
|
1
|
|
|||||
|
Options
|
1,368
|
1,225
|
963
|
12
|
|
27
|
|
|||||
|
U.S. Treasury futures and options:
|
||||||||||||
|
10-Year
|
1,914
|
1,717
|
1,613
|
11
|
|
6
|
|
|||||
|
5-Year
|
1,003
|
886
|
830
|
13
|
|
7
|
|
|||||
|
2-Year
|
396
|
331
|
338
|
20
|
|
(2
|
)
|
|||||
|
Treasury bond
|
380
|
347
|
355
|
9
|
|
(2
|
)
|
|||||
|
Federal Funds futures and options
|
191
|
133
|
81
|
44
|
|
63
|
|
|||||
Overall interest rate contract volume from 2015 to 2017 increased due to volatility caused by continued uncertainty surrounding the Federal Reserve's interest rate policy, including volatility resulting from the Federal Open Markets Committee raising the federal funds rate three times during 2017. The increase in short-term interest rate contract volume was also due to the uncertainty surrounding other global events, including the 2017 elections throughout Europe and the U.S. presidential and congressional elections in the fourth quarter of 2016. In addition, we believe the increase in long-term interest rate contract volume was due to the volatility resulting from the uncertainty surrounding the policies of the political administration in the United States, concern regarding future rates of inflation, and potential for changes in fiscal policy.
Equity Products
The following table summarizes average daily contract volume for our key equity products.
|
|
|
|
|
Year-over-Year Change
|
||||||||
|
(amounts in thousands)
|
2017
|
2016
|
2015
|
2017-2016
|
2016-2015
|
|||||||
|
E-mini S&P 500 futures and options
|
2,062
|
2,449
|
2,200
|
(16
|
)%
|
11
|
%
|
|||||
|
E-mini NASDAQ 100 futures and options
|
289
|
271
|
272
|
6
|
|
—
|
|
|||||
The decrease in overall equity contract volume in 2017 when compared with 2016 resulted from periods of lower equity market volatility, as measured by the CBOE Volatility Index. The comparatively low volatility is believed to be caused by fewer market-moving geopolitical and macro-level events that impacted these indexes in 2017. During 2016, there were periods of higher volatility within the equity markets due to uncertainty regarding whether the Federal Open Markets Committee would begin to raise the federal funds rate in 2016, the deceleration of the Chinese economy, the results of the U.S. presidential and congressional elections, and declining global crude oil prices.
Overall equity contract volume increased in 2016 when compared with 2015 as the equity markets experienced periods of higher volatility due to the continued ambiguity surrounding the Federal Reserve's interest rate policy, uncertainty surrounding the United Kingdom's European Union membership referendum and declining global crude oil prices. The results of the U.S. presidential and congressional elections injected new uncertainty into the markets in the fourth quarter of 2016, which we believe led to additional volatility.
37
Foreign Exchange Products
The following table summarizes average daily contract volume for our key foreign exchange products.
|
|
|
|
|
Year-over-Year Change
|
||||||||
|
(amounts in thousands)
|
2017
|
2016
|
2015
|
2017-2016
|
2016-2015
|
|||||||
|
Euro
|
261
|
226
|
307
|
15
|
%
|
(26
|
)%
|
|||||
|
Japanese yen
|
181
|
159
|
154
|
14
|
|
3
|
|
|||||
|
British pound
|
137
|
125
|
106
|
10
|
|
18
|
|
|||||
|
Australian dollar
|
102
|
106
|
98
|
(4
|
)
|
8
|
|
|||||
|
Canadian dollar
|
84
|
80
|
74
|
5
|
|
9
|
|
|||||
Foreign exchange contract volume increased in 2017 when compared with 2016, primarily due to higher Euro contract volume due to uncertainty surrounding the European Central Bank policy. We believe the Japanese yen contract volume increased as market participants turned to the yen as a safe-haven currency as currency rates steadied.
In 2016 when compared with 2015, the overall foreign exchange contract volume remained relatively flat. The decline in Euro contract volume resulted from low volatility, which we believe was due to a lack of global macroeconomic drivers meaningfully affecting the Euro in 2016. The decline in Euro contract volume was partially offset by an increase in British pound contract volume, which we believe was caused by volatility resulting from the uncertainty surrounding the United Kingdom European Union membership referendum in mid-2016.
Agricultural Commodity Products
The following table summarizes average daily volume for our key agricultural commodity products.
|
|
|
|
|
Year-over-Year Change
|
||||||||
|
(amounts in thousands)
|
2017
|
2016
|
2015
|
2017-2016
|
2016-2015
|
|||||||
|
Corn
|
449
|
424
|
415
|
6
|
%
|
2
|
%
|
|||||
|
Soybean
|
283
|
323
|
284
|
(12
|
)
|
14
|
|
|||||
|
Wheat
|
217
|
191
|
183
|
14
|
|
4
|
|
|||||
|
Soybean Oil
|
129
|
126
|
123
|
2
|
|
3
|
|
|||||
Agricultural commodity contract volume increased in 2017 when compared with 2016 largely due to higher corn and wheat volumes resulting from greater uncertainty related to weather conditions in 2017. The increase was partially offset by lower soybean volume due to lower uncertainty related to crop production versus 2016.
In 2016 when compared with 2015, agricultural commodity contract volume increased due to higher price volatility in the first half of 2016, which we believe was caused by greater uncertainty related to weather conditions and crop production for the 2016 growing season.
Energy Products
The following table summarizes average daily volume for our key energy products.
|
|
|
|
|
Year-over-Year Change
|
||||||||
|
(amounts in thousands)
|
2017
|
2016
|
2015
|
2017-2016
|
2016-2015
|
|||||||
|
WTI crude oil
|
1,442
|
1,321
|
994
|
9
|
%
|
33
|
%
|
|||||
|
Natural gas
|
597
|
549
|
468
|
9
|
|
17
|
|
|||||
|
Refined products
|
392
|
363
|
328
|
8
|
|
11
|
|
|||||
|
Brent crude oil
|
94
|
98
|
108
|
(4
|
)
|
(10
|
)
|
|||||
In 2017 when compared with 2016, overall energy contract volume increased largely due to an increase in crude oil contract volume caused by higher volatility in 2017. We believe the increased volatility was caused by a shift in crude oil supplies as United States crude oil production rose along with the Organization of Petroleum Exporting Countries' decision to cut oil supplies in the fourth quarter of 2016. Natural gas and refined products contract volumes also increased in 2017 due to higher price volatility caused by shifts in supply and demand in the underlying markets.
Overall energy contract volume increased in 2016 when compared with 2015 largely due to an increase in WTI crude oil trading, which we believe resulted from continued price volatility caused by excess global crude oil supplies and the marketplace's increased weighting of WTI pricing as a global benchmark price for crude oil.
38
Metal Products
The following table summarizes average daily volume for our key metal products.
|
Year-over-Year Change
|
||||||||||||
|
(amounts in thousands)
|
2017
|
2016
|
2015
|
2017-2016
|
2016-2015
|
|||||||
|
Gold
|
335
|
273
|
197
|
23
|
%
|
38
|
%
|
|||||
|
Copper
|
108
|
86
|
67
|
26
|
|
27
|
|
|||||
|
Silver
|
98
|
78
|
58
|
25
|
|
34
|
|
|||||
The overall increase in metal contract volume from 2015 to 2017 was due to investors using gold and other precious metals as safe-haven alternative investments to other markets. The increase in metal contract volume was driven by consistent periods of high price volatility caused by the uncertainties surrounding the policies of the political administration in the United States and future rates of inflation.
Average Rate per Contract
The average rate per contract decreased in 2017 when compared with 2016 as interest rate, energy, and metal contract volumes collectively increased by 3 percentage points, as a percentage of total volume, while agricultural commodity and equity contract volumes collectively decreased by 3 percentage points. Agricultural commodity and equity contracts have a higher average rate per contract compared with interest rate contracts. The overall decreases in average rates per contract were partially offset by a rate increase that was effective in the first quarter of 2017.
In 2016 when compared with 2015, the average rate per contract decreased due to an increase in trades executed by members, as a percentage of total trading volume, as well as higher volume-based incentives. This decrease was partially offset by the impact from a rate increase in early 2016.
Concentration of Revenue
We bill a substantial portion of our clearing and transaction fees to our clearing firms. The majority of clearing and transaction fees received from clearing firms represent charges for trades executed and cleared on behalf of their customers. One firm represented
13%
and another firm represented
12%
of our clearing and transaction fees revenue in 2017. One firm represented
13%
and another firm represented 11% of our clearing and transaction fees revenue in
2016
, and one firm represented
13%
of our clearing and transaction fees revenue in
2015
. Should a clearing firm withdraw, we believe that the customer portion of the firm's trading activity would likely transfer to another clearing firm of the exchange. Therefore, we do not believe we are exposed to significant risk from an ongoing loss of revenue received from or through a particular clearing firm.
Other Sources of Revenue
Market data and information services.
Beginning in 2016, the partial fee waivers that existed in 2015 ended, contributing to an increase in market data and information services revenue in 2016 when compared with 2015. The increase was partially offset in 2016 and fully offset in 2017 due to declines in screen counts from cost-cutting initiatives at member firms and some rationalization as customer firms transitioned into full-priced offerings.
The two largest resellers of our market data represented, in aggregate,
45%
,
40%
and
43%
of our market data and information services revenue in
2017
,
2016
and
2015
, respectively. Despite this concentration, we consider exposure to significant risk of revenue loss to be minimal. In the event that one of these vendors no longer subscribes to our market data, we believe the majority of that vendor's customers would likely subscribe to our market data through another reseller. Additionally, several of our largest institutional customers that utilize services from our two largest resellers report usage and remit payment of their fees directly to us.
39
Expenses
|
|
|
|
|
Year-over-Year Change
|
||||||||||||||
|
(dollars in millions)
|
2017
|
2016
|
2015
|
2017-2016
|
2016-2015
|
|||||||||||||
|
Compensation and benefits
|
$
|
562.5
|
|
$
|
541.0
|
|
$
|
553.7
|
|
4
|
%
|
(2
|
)%
|
|||||
|
Communications
|
24.3
|
|
26.8
|
|
27.8
|
|
(9
|
)
|
(4
|
)
|
||||||||
|
Technology support services
|
77.3
|
|
70.8
|
|
64.5
|
|
9
|
|
10
|
|
||||||||
|
Professional fees and outside services
|
117.6
|
|
144.4
|
|
122.8
|
|
(19
|
)
|
18
|
|
||||||||
|
Amortization of purchased intangibles
|
95.5
|
|
96.1
|
|
99.4
|
|
(1
|
)
|
(3
|
)
|
||||||||
|
Depreciation and amortization
|
113.0
|
|
129.2
|
|
129.2
|
|
(13
|
)
|
—
|
|
||||||||
|
Occupancy and building operations
|
80.2
|
|
86.7
|
|
92.5
|
|
(8
|
)
|
(6
|
)
|
||||||||
|
Licensing and other fee agreements
|
146.3
|
|
135.8
|
|
123.8
|
|
8
|
|
10
|
|
||||||||
|
Other
|
116.0
|
|
161.7
|
|
124.4
|
|
(28
|
)
|
30
|
|
||||||||
|
Total Expenses
|
$
|
1,332.7
|
|
$
|
1,392.5
|
|
$
|
1,338.1
|
|
(4
|
)
|
4
|
|
|||||
2017 Compared With 2016
Operating expenses decreased by
$59.8 million
in 2017 when compared with 2016. The following table shows the estimated impact of key factors resulting in the net decrease in operating expenses.
|
(dollars in millions)
|
Year-
Over-Year
Change
|
Change as a
Percentage of
2016 Expenses
|
|||||
|
Foreign currency exchange rate fluctuation
|
$
|
(33.9
|
)
|
(2
|
)%
|
||
|
Loss on datacenter and related legal fees
|
(28.6
|
)
|
(2
|
)
|
|||
|
Professional fees and outside services
|
(26.8
|
)
|
(2
|
)
|
|||
|
Licensing and other fee agreements
|
10.5
|
|
1
|
|
|||
|
Salaries, benefits and employer taxes
|
19.6
|
|
1
|
|
|||
|
Other expenses, net
|
(0.6
|
)
|
—
|
|
|||
|
Total
|
$
|
(59.8
|
)
|
(4
|
)%
|
||
Decreases in operating expenses in 2017 when compared with 2016 were as follows:
|
•
|
In 2017, we recognized a net gain of $9.4 million due to a favorable change in exchange rates on foreign cash balances, compared with a net loss of $24.5 million in 2016. Gains and losses from exchange rate fluctuations result when subsidiaries with a U.S. dollar functional currency hold cash as well as certain other monetary assets and liabilities denominated in foreign currencies.
|
|
•
|
In the first quarter of 2016, we sold and leased back our datacenter in the Chicago area. The transaction was recognized under the financing method under generally accepted accounting principles. We recognized total losses and expenses of $28.6 million, including a net loss on write-down to fair value of the assets and certain other transaction fees of $27.1 million within other expenses and $1.5 million of legal and other fees.
|
|
•
|
Professional fees and outside services expense decreased in 2017 compared to 2016, largely due to higher legal and regulatory fees in 2016 related to our business activities and product offerings as well as higher professional fees related to a greater reliance on consultants for security and systems enhancement work.
|
The overall decrease in operating expenses in 2017 when compared with 2016 was partially offset by the following increases:
|
•
|
Licensing and other fee sharing agreements expense increased due to higher expense resulting from incentive payments made to facilitate the transition of the Russell contract open interest, as well as increased costs of revenue sharing agreements for certain licensed products. The overall increase in 2017 was partially offset by lower expense related to revenue sharing agreements for certain equity and energy contracts due to lower volume for these products compared to 2016.
|
|
•
|
Compensation and benefits expense increased as a result of higher average headcount primarily in our international locations as well as normal cost of living adjustments.
|
40
2016 Compared With 2015
Operating expenses increased by
$54.4 million
in 2016 when compared with 2015. The following table shows the estimated impact of key factors resulting in the net decrease in operating expenses.
|
(dollars in millions)
|
Year-
Over-Year Change |
Change as a
Percentage of 2015 Expenses |
|||||
|
Loss on datacenter and related legal fees
|
$
|
28.6
|
|
2
|
%
|
||
|
Professional fees and outside services
|
24.4
|
|
2
|
|
|||
|
Foreign currency exchange rate fluctuation
|
13.2
|
|
1
|
|
|||
|
Licensing and other fee agreements
|
12.0
|
|
1
|
|
|||
|
Reorganization, severance and retirement costs
|
(8.1
|
)
|
(1
|
)
|
|||
|
Real estate taxes and fees
|
(10.0
|
)
|
(1
|
)
|
|||
|
Other expenses, net
|
(5.7
|
)
|
—
|
|
|||
|
Total
|
$
|
54.4
|
|
4
|
%
|
||
Overal
l operating expenses increased in 2016 when compared with 2015 due to the following reasons:
|
•
|
In 2016, we recognized total losses and expenses of $28.6 million, including a net loss on write-down to fair value of the assets and certain other transaction fees of $27.1 million within other expenses and $1.5 million of legal and other fees as a result of our sale and leaseback of our datacenter.
|
|
•
|
Professional fees and outside services expense increased in 2016 largely due to an increase in legal and regulatory efforts related to our business activities and product offerings as well as an increase in professional fees related to a greater reliance on consultants for security and systems enhancement work.
|
|
•
|
In 2016, we recognized a net loss of $24.5 million due to an unfavorable change in exchange rates on foreign cash balances, compared with a net loss of $11.3 million in 2015.
|
|
•
|
Licensing and other fee sharing agreements expense increased due to higher expense related to revenue sharing agreements for certain equity and energy contracts due to both higher volume and an increase in license rates for certain equity and energy products.
|
The increase in overall operating expenses in 2016 when compared with 2015 was partially offset by the following decreases:
|
•
|
Severance and other costs related to the reorganization announced in October 2014 and the reduction of our trading floors in mid-2015 were recognized in the first quarter of 2015, in addition to costs related to a reorganization in the third quarter of 2015. At the end of 2016, our CEO announced his retirement, leading to additional compensation and stock-based compensation expense in 2016. We also recognized additional severance and other costs related to the reduction of our New York trading floors in 2016. These factors resulted in a net decrease in compensation and benefits expense in 2016 when compared with the same period in 2015.
|
|
•
|
In 2015, we recognized additional real estate taxes and fees related to the transfer of the ownership of the NYMEX building.
|
Non-Operating Income (Expense)
|
|
|
|
|
Year-over-Year Change
|
|||||||||||||
|
(dollars in millions)
|
2017
|
2016
|
2015
|
2017-2016
|
2016-2015
|
||||||||||||
|
Investment income
|
$
|
531.7
|
|
$
|
141.8
|
|
$
|
30.1
|
|
n.m.
|
|
n.m.
|
|||||
|
Gains (losses) on derivative investments
|
—
|
|
—
|
|
(1.8
|
)
|
—
|
|
n.m.
|
||||||||
|
Interest and other borrowing costs
|
(117.0
|
)
|
(123.5
|
)
|
(117.4
|
)
|
(5
|
)
|
5
|
||||||||
|
Equity in net earnings (losses) of unconsolidated subsidiaries
|
129.2
|
|
110.2
|
|
100.0
|
|
17
|
|
10
|
||||||||
|
Other income (expense)
|
(329.6
|
)
|
(43.6
|
)
|
(42.8
|
)
|
n.m.
|
|
2
|
||||||||
|
Total Non-Operating
|
$
|
214.3
|
|
$
|
84.9
|
|
$
|
(31.9
|
)
|
n.m.
|
|
n.m.
|
|||||
n.m. not meaningful
41
Investment income.
The increase in investment income from 2015 to 2017 was largely due to an increase in earnings from cash performance bond and guaranty fund contributions that are reinvested, which resulted primarily from higher average reinvestment balances and higher rates of interest earned in the cash account at the Federal Reserve Bank of Chicago. In addition, the increase in investment income from 2015 to 2017 was also due to higher net gains on sales of investments. In 2017, we sold our remaining ownership interest in BM&FBOVESPA S.A. (BM&FBOVESPA) and recognized a gain of
$86.5 million
, net of transaction costs. We also sold our 2% interest in Bolsa Mexicana de Valores, S.A.B. de C.V. and recognized a gain of
$2.3 million
, net of transaction costs. In 2016, we recognized a net gain of $48.4 million on sales of 28.0 million shares of our investment in BM&FBOVESPA compared with a net loss of $8.5 million on sales of 41.0 million shares of BM&FBOVESPA in 2015. The increases in investment income were partially offset by decreases in dividend income from 2015 to 2017.
Interest and other borrowing costs.
Interest and other borrowing costs were higher in 2016 when compared with 2015 and 2017 due to an increase in line of credit commitment fees in 2016.
Equity in net earnings (losses) of unconsolidated subsidiaries.
Higher income generated from our S&P/DJI business venture contributed to increases in equity in net earnings (losses) of unconsolidated subsidiaries from 2015 through 2017.
Other income (expense).
From 2015 to 2017, we recognized higher expenses related to the distribution of interest earned on performance bond collateral reinvestment to the clearing firms. These expenses are included in other non-operating income (expense).
In April 2015, we repurchased the $612.5 million 4.40% notes due 2018 and paid a call premium of $60.5 million. As a result of the transaction, we recognized debt prepayment costs of $61.8 million, including the call premium, as other non-operating income (expense). In the first quarter of 2015, we received a termination fee of $22.5 million, net of the portion paid to outside advisers, related to our proposed acquisition of GFI Group, which also was classified as other non-operating income (expense).
Income Tax Provision
The following table summarizes the effective tax rate for the periods presented:
|
|
2017
|
2016
|
2015
|
Year-over-Year Change
|
|||||||||
|
2017-2016
|
2016-2015
|
||||||||||||
|
Year ended December 31
|
(60.8
|
)%
|
32.9
|
%
|
36.3
|
%
|
n.m.
|
(3.4
|
)%
|
||||
_______________
n.m. not meaningful
The overall decrease in the effective tax rate in 2017 when compared with 2016 was primarily due to the remeasurement of the deferred tax liabilities as a result of the recent U.S. income tax reform. The decrease was partially offset by expense from a state and local tax law change recorded in the third quarter of 2017 as well as from reclassifying income tax expense from other comprehensive income for the sale of the remaining BM&FBOVESPA shares in the first quarter of 2017.
The overall decrease in the effective tax rate in 2016 when compared with 2015 was due to an implementation of strategies to realize additional income tax benefits from the investment in BM&FBOVESPA stock. The overall decrease in the effective tax rate was partially offset by additional tax expense recognized from the remeasurement of tax positions resulting from a state and local income tax law change in the second quarter of 2016.
LIQUIDITY AND CAPITAL RESOURCES
Cash Requirements
We have historically met our funding requirements with cash generated by our ongoing operations. While our cost structure is fixed in the short term, our sources of operating cash are largely dependent on contract trading volume levels. We believe that our existing cash, cash equivalents, marketable securities and cash generated from operations will be sufficient to cover our working capital needs, capital expenditures and other commitments. However, it is possible that we may need to raise additional funds to finance our activities through issuances of commercial paper, future public debt offerings or by direct borrowings from financial institutions through our committed revolving credit facilities.
42
Cash will also be required for operating leases and non-cancellable purchase obligations as well as other obligations reflected as long-term liabilities in our consolidated balance sheet at
December 31, 2017
. These were as follows:
_______________
|
(in millions)
|
Operating
Leases
|
Purchase
Obligations
|
Debt Obligations
|
Other
Long-Term
Liabilities
|
Total
(1)
|
|||||||||||||||
|
Year
|
||||||||||||||||||||
|
2018
|
$
|
64.3
|
|
$
|
23.8
|
|
$
|
84.8
|
|
$
|
36.2
|
|
$
|
209.1
|
|
|||||
|
2019-2020
|
125.4
|
|
23.7
|
|
169.5
|
|
—
|
|
318.6
|
|
||||||||||
|
2021-2022
|
113.3
|
|
15.3
|
|
169.5
|
|
—
|
|
298.1
|
|
||||||||||
|
Thereafter
|
435.2
|
|
5.4
|
|
3,141.0
|
|
—
|
|
3,581.6
|
|
||||||||||
|
Total
|
$
|
738.2
|
|
$
|
68.2
|
|
$
|
3,564.8
|
|
$
|
36.2
|
|
$
|
4,407.4
|
|
|||||
|
(1)
|
The liability for gross unrecognized income tax benefits, including interest and penalties, of
$342.8 million
for uncertain tax positions are not included in the table due to uncertainty about the date of their settlement.
|
Operating leases include rent payments for office space in Chicago, New York and other smaller offices in the United States and in various foreign countries. The operating lease for our headquarters in Chicago expires in 2032. Annual minimum rental payments under this lease range from
$12.5 million
to
$19.7 million
. We also maintain operating leases for additional office spaces and datacenter spaces in Chicago, which expire in November 2023, April 2027 and March 2031. Annual minimum rental payments under these leases range from
$5.7 million
to
$6.2 million
, $
3.4 million
to $
4.3 million
, and $16.8 million to $18.3 million, respectively. The operating lease for our office space in New York expires in December 2028. Annual minimum rental payments under this lease range from $13.1 million to $14.5 million.
Purchase obligations include minimum payments due under agreements to advertising, licensing, hardware, software and maintenance as well as telecommunication services. Debt obligations include repayment of principal and interest associated with the debt obligations. Other long-term liabilities include funding obligations for other post-retirement benefit plans.
Future capital expenditures for technology are anticipated as we continue to support our growth through increased system capacity, performance improvements as well as improvements to some of our office spaces. Each year, capital expenditures are incurred for improvements to and expansion of our offices, remote data centers, telecommunications network and other operating equipment. In
2018
, we expect capital expenditures to total approximately $90.0 million to $100.0 million. We continue to monitor our capital needs and may revise our forecasted expenditures as necessary in the future.
We intend to continue to pay a regular quarterly dividend to our shareholders, which is set at between 50% to 60% of the prior year's cash earnings. The decision to pay a dividend and the amount of the dividend; however, remains within the discretion of our board of directors and may be affected by various factors, including our earnings, financial condition, capital requirements, levels of indebtedness and other considerations our board of directors deems relevant. CME Group is also required to comply with restrictions contained in the general corporation laws of its state of incorporation, which could also limit its ability to declare and pay dividends. On
February 7, 2018
, the board of directors declared a regular quarterly dividend of
$0.70
per share. The dividend will be payable on
March 26, 2018
to shareholders of record on
March 9, 2018
. Assuming no changes in the number of shares outstanding, the first quarter dividend payment will total approximately
$237.0 million
. The board of directors also declared an additional, annual variable dividend of $3.50 per share on December 6, 2017 paid on January 16, 2018 to the shareholders of record on December 28, 2017. In general, the amount of the annual variable dividend will be determined by the end of each year, and the level will increase or decrease from year to year based on operating results, capitalization expenditures, potential merger and acquisition activity and other forms of capital return including regular dividends and share buybacks during the prior year.
43
Sources and Uses of Cash
The following is a summary of cash flows from operating, investing and financing activities.
|
|
|
|
|
Year-over-Year Change
|
||||||||||||||
|
(dollars in millions)
|
2017
|
2016
|
2015
|
2017-2016
|
2016-2015
|
|||||||||||||
|
Net cash provided by operating activities
|
$
|
1,840.4
|
|
$
|
1,742.8
|
|
$
|
1,532.5
|
|
6
|
%
|
14
|
%
|
|||||
|
Net cash provided by investing activities
|
179.9
|
|
53.7
|
|
17.9
|
|
n.m.
|
|
n.m.
|
|
||||||||
|
Net cash used in financing activities
|
(1,985.3
|
)
|
(1,620.5
|
)
|
(1,223.9
|
)
|
23
|
|
32
|
|
||||||||
_______________
n.m. not meaningful
Operating activities
The increase in net cash provided by operating activities in 2017 when compared with 2016 was largely attributable to higher investment income related to our reinvestment of cash performance bonds and guaranty fund collateral, net of the distribution of interest earned to the clearing firms, as well as an increase in trading volumes and the reduction of restricted cash related to the CME Clearing Europe Limited (CMECE) guaranty fund.
The increase in 2016 when compared with 2015 was attributable to higher clearing and transaction fees and market data revenue.
Investing activities
The increases in cash provided by investing activities from 2015 through 2017 were due to proceeds from the sale of BM&FBOVESPA shares as well as declines in purchases of property and equipment. The increase in 2017 when compared with 2016 was also attributable to the sale of the remaining Bolsa Mexicana de Valores, S.A.B. de C.V. shares.
Financing activities
The increases in cash used by financing activities from 2015 through 2017 were attributable to higher cash dividends declared in 2017 and 2016. The increase in 2016 was partially offset by proceeds from a finance lease obligation related to the sale leaseback of the datacenter in the first quarter of 2016.
The following table summarizes our debt outstanding as of
December 31, 2017
:
|
(in millions)
|
Par Value
|
||
|
Fixed rate notes due September 2022, stated rate of 3.00%
(1)
|
$
|
750.0
|
|
|
Fixed rate notes due March 2025, stated rate of 3.00%
(2)
|
750.0
|
|
|
|
Fixed rate notes due September 2043, stated rate of 5.30%
(3)
|
750.0
|
|
|
|
(1)
|
In August 2012, we entered into a forward-starting interest rate swap agreement that modified the interest obligation associated with these notes so that the interest payable on the notes effectively became fixed at a rate of 3.32%.
|
|
(2)
|
In December 2014, we entered into a forward-starting interest rate swap agreement that modified the interest obligation associated with these notes so that the interest payable on the notes effectively became fixed at a rate of 3.11%.
|
|
(3)
|
In August 2012, we entered into a forward-starting interest rate swap agreement that modified the interest obligation associated with these notes so that the interest payable effectively became fixed at a rate of 4.73%.
|
We maintain a $2.3 billion multi-currency revolving senior credit facility with various financial institutions, which matures in November 2022. The proceeds from this facility can be used for general corporate purposes, which includes providing liquidity for our clearing house in certain circumstances at CME Group's discretion and, if necessary, for maturities of commercial paper. As long as we are not in default under this facility, we have the option to increase it up to $3.0 billion with the consent of the agent and lenders providing the additional funds. This facility is voluntarily pre-payable from time to time without premium or penalty. Under this facility, we are required to remain in compliance with a consolidated net worth test, which is defined as our consolidated shareholders' equity at September 30, 2017, giving effect to share repurchases made and special dividends paid
44
during the term of the agreements (and in no event greater than $2.0 billion in aggregate), multiplied by 0.65. We currently do not have any borrowings outstanding under this facility.
We maintain a 364-day multi-currency revolving secured credit facility with a consortium of domestic and international banks to be used in certain situations by CME Clearing. The facility provides for borrowings of up to $7.0 billion. We may use the proceeds to provide temporary liquidity in the unlikely event of a clearing firm default, in the event of a liquidity constraint or default by a depositary (custodian for our collateral), or in the event of a temporary disruption with the domestic payments system that would delay payment of settlement variation between us and our clearing firms. Clearing firm guaranty fund contributions received in the form of cash or U.S. Treasury securities as well as the performance bond assets of a defaulting firm can be used to collateralize the facility. At
December 31, 2017
, guaranty funds available to collateralize the facility totaled $7.8 billion. We have the option to request an increase in the line from $7.0 billion to $10.0 billion. Our 364-day facility contains a requirement that CME remain in compliance with a consolidated tangible net worth test, defined as CME consolidated shareholder's equity less intangible assets (as defined in the agreement), of not less than $800.0 million. We currently do not have any borrowings outstanding under this facility.
The indentures governing our fixed rate notes, our $2.3 billion multi-currency revolving senior credit facility and our 364-day multi-currency revolving secured credit facility for $7.0 billion do not contain specific covenants that restrict the ability to pay dividends. These documents, however, do contain other customary financial and operating covenants that place restrictions on the operations of the company that could indirectly affect the ability to pay dividends.
In March 2016, we sold our datacenter in the Chicago area for $130.0 million. At the time of the sale, we leased back a portion of the property. Under generally accepted accounting principles, the transaction has been accounted for under the financing method instead of a sale leaseback arrangement because our participation in future revenues and development work constitute continuing involvement in the datacenter. Under the financing method, the assets remain on the consolidated balance sheet throughout the term of the lease and the proceeds of $130.0 million from the transaction are recognized as a finance lease obligation within other liabilities and other current liabilities in the consolidated balance sheet. A portion of the lease payments will be recognized as a reduction of the finance lease obligation and a portion will be recognized as interest expense based on an imputed interest rate.
At
December 31, 2017
, we have excess borrowing capacity for general corporate purposes of approximately $2.3 billion under our multi-currency revolving senior credit facilities.
At
December 31, 2017
, we were in compliance with the various covenant requirements of all our debt facilities.
CME Group, as a holding company, has no operations of its own. Instead, it relies on dividends declared and paid to it by its subsidiaries in order to provide a portion of the funds which it uses to pay dividends to its shareholders.
To satisfy our performance bond obligation with Singapore Exchange Limited, we may pledge CME-owned U.S. Treasury securities or U.S. dollars in lieu of, or in combination with, irrevocable letters of credit. At
December 31, 2017
, we had pledged letters of credit totaling
$285.0 million
.
The following table summarizes our credit ratings as of
December 31, 2017
:
|
Rating Agency
|
|
Short-Term
Debt Rating
|
|
Long-Term
Debt Rating
|
|
Outlook
|
|
Standard & Poor’s
|
|
A1+
|
|
AA-
|
|
Stable
|
|
Moody’s Investors Service
|
|
P1
|
|
Aa3
|
|
Stable
|
Given our cash flow generation, our ability to pay down debt levels and our ability to refinance existing debt facilities, if necessary, we expect to maintain an investment grade rating. If our ratings are downgraded below investment grade due to a change of control, we are required to make an offer to repurchase our fixed rate notes at a price equal to
101%
of the principal amount, plus accrued and unpaid interest.
Off-Balance Sheet Arrangements
As of
December 31, 2017
, we did not have any off-balance sheet arrangements as defined by Securities and Exchange Commission rules and regulations.
Liquidity and Cash Management
Cash and cash equivalents totaled
$1.9 billion
at both
December 31, 2017
and
2016
. The balance retained in cash and cash equivalents is a function of anticipated or possible short-term cash needs, prevailing interest rates, our investment policy and alternative investment choices. A majority of our cash and cash equivalents balance is invested in money market mutual funds that invest only in U.S. Treasury securities, U.S. government agency securities and U.S. Treasury security reverse repurchase agreements. Our exposure to credit and liquidity risk is minimal given the nature of the investments. Cash that is not available
45
for general corporate purposes because of regulatory requirements or other restrictions is classified as restricted cash and is included in other current assets or other assets in the consolidated balance sheets.
Our practice is to have our pension plan 100% funded at each year end on a projected benefit obligation basis, while also satisfying any minimum required contribution and obtaining the maximum tax deduction. Based on our actuarial projections, we estimate that no contribution will be necessary in
2018
as we have exceeded our funding goal by
$74.1 million
in 2017. However, the amount of the actual contribution is contingent on various factors, including the actual rate of return on our plan assets during
2018
and the
December 31, 2018
discount rate.
Regulatory Requirements
CME is regulated by the CFTC as U.S. Derivatives Clearing Organizations (DCO). DCOs are required to maintain capital, as defined by the CFTC, in an amount at least equal to one year of projected operating expenses as well as cash, liquid securities, or a line of credit at least equal to six months of projected operating expenses. CME was designated by the Financial Stability Oversight Council as a systemically important DCO under Title VIII of Dodd-Frank. As a result, CME must comply with the requirements for financial resources and liquidity resources. CME is in compliance with all DCO financial requirements.
CME, CBOT, NYMEX and COMEX are regulated by the CFTC as Designated Contract Markets (DCM). DCMs are required to maintain capital, as defined by the CFTC, in an amount at least equal to one year of projected operating expenses as well as cash, liquid securities or a line of credit at least equal to six months of projected operating expenses. Our DCMs are in compliance with all DCM financial requirements.
|
ITEM 7A.
|
QUANTITATIVE AND QUALITATIVE DISCLOSURES ABOUT MARKET RISK
|
We are subject to various market risks, including those caused by changes in interest rates, credit, foreign currency exchange rates and equity prices.
Interest Rate Risk
Debt outstanding at
December 31, 2017
consisted of fixed-rate borrowings of
$2.2 billion
. Changes in interest rates impact the fair values of fixed-rate debt, but do not impact earnings or cash flows. We did not have any variable-rate borrowings at
December 31, 2017
.
Credit Risk
Our clearing house acts as the counterparty to all trades consummated on our exchanges as well as through third party exchanges and swaps markets for which we provide clearing services. As a result, we are exposed to significant credit risk of third parties, including clearing firms. We are also exposed, indirectly, to the credit risk of customers of our clearing firms. These parties may default on their obligations due to bankruptcy, lack of liquidity, operational failure or other reasons.
In order to ensure performance, we establish and monitor financial requirements for our clearing firms. We set minimum performance bond requirements for exchange-traded and swaps products, including interest rate swaps and credit default swaps. For clearing firms, we establish performance bond requirements to cover at least 99% of expected price changes for a given product within a given historical period with further quantitative and qualitative considerations based on market risk. We establish haircuts applied to collateral deposited to meet performance bond requirements to cover at least 99% of expected price changes and foreign currency changes for a given asset within a given historical period with further quantitative and qualitative considerations. Haircuts vary depending on the type of collateral and maturity. We mark-to-market open positions of clearing firms at least once a day (twice a day for futures and options contracts) and require payment from clearing firms whose positions have lost value and make payments to clearing firms whose positions have gained value. We have the capability to mark-to-market more frequently as market conditions warrant. These practices allow our clearing house to quickly identify any clearing firms that may not be able to satisfy the financial obligations resulting from changes in the prices of their open positions before those financial obligations become exceptionally large and jeopardize the ability of our clearing house to ensure performance of their open positions.
Although we have policies and procedures to help ensure that our clearing firms can satisfy their obligations, these policies and procedures may not succeed in detecting problems or preventing defaults. We also have in place various measures intended to enable us to cover any default and maintain liquidity.
Despite our safeguards, we cannot assure you that these measures will be sufficient to protect us from a default or that we will not be materially and adversely affected in the event of a significant default.
46
We maintain three separate financial safeguard packages:
|
•
|
a financial safeguard package for all futures and options contracts other than cleared interest rate swap and credit default swap contracts (base package);
|
|
•
|
a financial safeguard package for cleared interest rate swap contracts; and
|
|
•
|
a financial safeguard package for cleared credit default swap contracts.
|
In the unlikely event of a payment default by a clearing firm, we would first apply assets of the defaulting clearing firm to satisfy its payment obligation. These assets include the defaulting firm's guaranty fund contributions, performance bonds and any other available assets, such as assets required for clearing membership and any associated trading rights. In addition, we would make a demand for payment pursuant to any applicable guarantee provided to us by the parent company of the clearing firm. Thereafter, if the payment default remains unsatisfied, we would use our corporate contributions designated for the respective financial safeguard package. We would then use guaranty fund contributions of other clearing firms within the respective financial safeguard package and funds collected through an assessment against solvent clearing firms within the respective financial safeguard package to satisfy the deficit.
We maintain a $7.0 billion 364-day multi-currency line of credit with a consortium of domestic and international banks to be used in certain situations by CME Clearing. We have the option to request an increase in the line from $7.0 billion to $10.0 billion. We may use the proceeds to provide temporary liquidity in the unlikely event of a clearing firm default, in the event of a liquidity constraint or default by a depositary (custodian of the collateral) or in the event of a temporary disruption with the payments systems that would delay payment of settlement variation between us and our clearing firms. The credit agreement requires us to pledge certain assets to the line of credit custodian prior to drawing on the line of credit. Pledged assets may include clearing firm guaranty fund deposits held by us in the form of cash or U.S. Treasury securities. Performance bond collateral of a defaulting clearing firm may also be used to secure a draw on the line. In addition to the 364-day multi-currency line of credit, we also have the option to use our $2.3 billion multi-currency revolving senior credit facility to provide liquidity for our clearing house in the unlikely event of default.
At December 31, 2017, aggregate performance bond deposits for clearing firms for all three financial safeguard packages was
$130.9 billion
, including
$41.8 billion
of cash performance bond deposits and
$2.3 billion
of letters of credit. A defaulting firm's performance bond deposits can be used in the event of default of that clearing firm.
The following shows the available assets at
December 31, 2017
in the event of a payment default by a clearing firm for the base financial safeguard package after first utilizing the defaulting firm's available assets:
|
(in millions)
|
CME Clearing
Available Assets
|
|||
|
Designated corporate contributions for futures and options
(1)
|
$
|
100.0
|
|
|
|
Guaranty fund contributions
(2)
|
4,635.8
|
|
||
|
Assessment powers
(3)
|
12,748.4
|
|
||
_______________
|
(1)
|
CME Clearing designates $100.0 million of corporate contributions to satisfy a clearing firm default in the event that the defaulting clearing firm's guaranty contributions and performance bonds do not satisfy the deficit.
|
|
(2)
|
Guaranty fund contributions of clearing firms include guaranty fund contributions required of clearing firms, but do not include any excess deposits held by us at the direction of clearing firms.
|
|
(3)
|
In the event of a clearing firm default, if a loss continues to exist after the utilization of the assets of the defaulted firm, our corporate contribution and the non-defaulting clearing firms' guaranty fund contributions, we would assess all non-defaulting clearing members as provided in the rules governing the guaranty fund. We could assess non-defaulting clearing members 275% of their existing guaranty fund requirements up to a maximum of 550% of their existing guaranty fund requirements as provided in the rules. Assessment powers are calculated to reflect the potential obligation that each clearing member could be called for in the event clearing member defaults exhaust the guaranty fund, however the total amount available would be reduced by the defaulted clearing members assessment obligations since they would no longer be able to satisfy their obligations.
|
47
The following shows the available assets for the interest rate swap financial safeguard package at
December 31, 2017
in the event of a payment default by a clearing firm that clears interest rate swap contracts, after first utilizing the defaulting firm's available assets:
|
(in millions)
|
CME Clearing
Available Assets
|
|||
|
Designated corporate contributions for interest rate swap contracts
(1)
|
$
|
150.0
|
|
|
|
Guaranty fund contributions
(2)
|
2,571.7
|
|
||
|
Assessment powers
(3)
|
1,292.1
|
|
||
_______________
|
(1)
|
CME Clearing designates $150.0 million of corporate contributions to satisfy a clearing firm default in the event that the defaulting clearing firm's guaranty contributions and performance bonds do not satisfy the deficit.
|
|
(2)
|
Guaranty fund contributions of clearing firms for interest rate swap contracts include guaranty fund contributions required of those clearing firms.
|
|
(3)
|
In the event of a clearing firm default, if a loss continues to exist after the utilization of the assets of the defaulted firm, our corporate contribution and the non-defaulting firms' guaranty fund contributions, we would assess non-defaulting clearing members as provided in the rules governing the interest rate swap guaranty fund.
|
The following shows the available assets for the credit default swap financial safeguard package at
December 31, 2017
in the event of a payment default by a clearing firm that clears credit default swap contracts, after first utilizing the defaulting firm's available assets:
|
(in millions)
|
CME Clearing
Available Assets
|
|||
|
Designated corporate contributions for credit default swap contracts
(1)
|
$
|
50.0
|
|
|
|
Guaranty fund contributions
(2)
|
600.0
|
|
||
|
Assessment powers
(3)
|
86.4
|
|
||
_______________
|
(1)
|
CME Clearing designates corporate contributions to satisfy a clearing firm default in the event that the defaulting clearing firm's guaranty contributions and performance bonds do not satisfy the deficit. The working capital contributed by us would be equal to the greater of $50.0 million and 5% of the credit default swap guaranty fund, up to a maximum of $100.0 million.
|
|
(2)
|
Guaranty fund contributions of clearing firms for credit default swap contracts include guaranty fund contributions required of those clearing firms.
|
|
(3)
|
In the event of a clearing firm default, if a loss continues to exist after the utilization of the assets of the defaulted firm, our corporate contribution and the non-defaulting firms' guaranty fund contributions, we would assess non-defaulting clearing members as provided in the rules governing the credit default swap guaranty fund.
|
In September 2017, we announced our plans to exit the credit default swap business by mid-2018.
Foreign Currency Exchange Rate Risk
Foreign Currency Transaction Risk
We have foreign currency transaction risk related to changes in exchange rates on British pound cash balances held at subsidiaries with a U.S. dollar functional currency. Gains and losses on foreign currency transactions result when subsidiaries with a U.S. dollar functional currency hold cash as well as certain other assets and liabilities denominated in foreign currencies. During 2017, the exchange rate between the British pound and the U.S. dollar fluctuated from a high of $1.36 per pound to a low of $1.20 per pound. Aggregate transaction gains (losses) for
2017
,
2016
and
2015
were $9.4 million, $(24.5) million and $(11.3) million, respectively. We expect the foreign currency gain/loss to continue to fluctuate as long as we continue to hold cash as well as certain assets and liabilities at those subsidiaries.
Foreign Currency Translation Risk
We have foreign currency translation risk related to the translation of our foreign subsidiaries' assets and liabilities from their respective functional currencies to the U.S. dollar at each reporting date. Fluctuations in exchange rates may impact the amount of assets and liabilities we report in our consolidated balance sheets. The financial statements of certain of our foreign subsidiaries are denominated in various currencies and are translated into U.S. dollars using a current exchange rate. Gains and losses resulting from this translation are recognized as a foreign currency translation adjustment within accumulated other comprehensive income, which is a component of shareholders' equity and comprehensive income. Aggregate translation gains (losses), net of tax, for
2017
,
2016
and
2015
were
$7.5 million
,
$(6.9) million
and
$(6.6) million
, respectively.
48
Foreign Currency Exchange Risk Related to Customer Collateral
A portion of performance bond deposits is denominated in foreign currency. We mark-to-market all deposits daily and require payment from clearing firms whose collateral has lost value due to changes in foreign currency rates and price. Therefore, our exposure to foreign currency risk related to performance bond deposits is considered minimal and is not expected to be material to our financial condition or operating results.
49
|
ITEM 8.
|
FINANCIAL STATEMENTS AND SUPPLEMENTARY DATA
|
CME GROUP INC. AND SUBSIDIARIES
(dollars in millions, except per share data; shares in thousands)
|
|
December 31,
|
||||||
|
|
2017
|
2016
|
|||||
|
Assets
|
|||||||
|
Current Assets:
|
|||||||
|
Cash and cash equivalents
|
$
|
1,903.6
|
|
$
|
1,868.6
|
|
|
|
Marketable securities
|
90.1
|
|
83.3
|
|
|||
|
Accounts receivable, net of allowance of $2.2 and $3.5
|
359.7
|
|
364.4
|
|
|||
|
Other current assets (includes $0 and $30.0 in restricted cash)
|
367.8
|
|
171.7
|
|
|||
|
Performance bonds and guaranty fund contributions
|
44,185.3
|
|
37,543.5
|
|
|||
|
Total current assets
|
46,906.5
|
|
40,031.5
|
|
|||
|
Property, net
|
399.7
|
|
425.2
|
|
|||
|
Intangible assets—trading products
|
17,175.3
|
|
17,175.3
|
|
|||
|
Intangible assets—other, net
|
2,346.3
|
|
2,441.8
|
|
|||
|
Goodwill
|
7,569.0
|
|
7,569.0
|
|
|||
|
Other assets (includes $2.4 and $61.7 in restricted cash)
|
1,394.4
|
|
1,726.6
|
|
|||
|
Total Assets
|
$
|
75,791.2
|
|
$
|
69,369.4
|
|
|
|
Liabilities and Equity
|
|||||||
|
Current Liabilities:
|
|||||||
|
Accounts payable
|
$
|
31.3
|
|
$
|
26.2
|
|
|
|
Other current liabilities
|
1,456.3
|
|
1,376.7
|
|
|||
|
Performance bonds and guaranty fund contributions
|
44,185.3
|
|
37,542.7
|
|
|||
|
Total current liabilities
|
45,672.9
|
|
38,945.6
|
|
|||
|
Long-term debt
|
2,233.1
|
|
2,231.2
|
|
|||
|
Deferred income tax liabilities, net
|
4,857.7
|
|
7,291.0
|
|
|||
|
Other liabilities
|
615.7
|
|
560.9
|
|
|||
|
Total Liabilities
|
53,379.4
|
|
49,028.7
|
|
|||
|
Shareholders’ Equity:
|
|||||||
|
Preferred stock, $0.01 par value, 10,000 shares authorized as of December 31, 2017 and 2016; none issued
|
—
|
|
—
|
|
|||
|
Class A common stock, $0.01 par value, 1,000,000 shares authorized as of December 31, 2017 and 2016, 339,235 and 338,240 shares issued and outstanding as of December 31, 2017 and 2016, respectively
|
3.4
|
|
3.4
|
|
|||
|
Class B common stock, $0.01 par value, 3 shares authorized, issued and outstanding as of December 31, 2017 and 2016
|
—
|
|
—
|
|
|||
|
Additional paid-in capital
|
17,896.9
|
|
17,826.9
|
|
|||
|
Retained earnings
|
4,497.2
|
|
2,524.5
|
|
|||
|
Accumulated other comprehensive income (loss)
|
14.3
|
|
(14.1
|
)
|
|||
|
Total shareholders’ equity
|
22,411.8
|
|
20,340.7
|
|
|||
|
Total Liabilities and Equity
|
$
|
75,791.2
|
|
$
|
69,369.4
|
|
|
See accompanying notes to consolidated financial statements.
50
CME GROUP INC. AND SUBSIDIARIES
(dollars in millions, except per share data; shares in thousands)
|
|
Year Ended December 31,
|
||||||||||
|
|
2017
|
2016
|
2015
|
||||||||
|
Revenues
|
|||||||||||
|
Clearing and transaction fees
|
$
|
3,098.6
|
|
$
|
3,036.4
|
|
$
|
2,783.9
|
|
||
|
Market data and information services
|
391.8
|
|
406.5
|
|
399.4
|
|
|||||
|
Access and communication fees
|
100.8
|
|
91.4
|
|
86.1
|
|
|||||
|
Other
|
53.5
|
|
60.9
|
|
57.4
|
|
|||||
|
Total Revenues
|
3,644.7
|
|
3,595.2
|
|
3,326.8
|
|
|||||
|
Expenses
|
|||||||||||
|
Compensation and benefits
|
562.5
|
|
541.0
|
|
553.7
|
|
|||||
|
Communications
|
24.3
|
|
26.8
|
|
27.8
|
|
|||||
|
Technology support services
|
77.3
|
|
70.8
|
|
64.5
|
|
|||||
|
Professional fees and outside services
|
117.6
|
|
144.4
|
|
122.8
|
|
|||||
|
Amortization of purchased intangibles
|
95.5
|
|
96.1
|
|
99.4
|
|
|||||
|
Depreciation and amortization
|
113.0
|
|
129.2
|
|
129.2
|
|
|||||
|
Occupancy and building operations
|
80.2
|
|
86.7
|
|
92.5
|
|
|||||
|
Licensing and other fee agreements
|
146.3
|
|
135.8
|
|
123.8
|
|
|||||
|
Other
|
116.0
|
|
161.7
|
|
124.4
|
|
|||||
|
Total Expenses
|
1,332.7
|
|
1,392.5
|
|
1,338.1
|
|
|||||
|
Operating Income
|
2,312.0
|
|
2,202.7
|
|
1,988.7
|
|
|||||
|
Non-Operating Income (Expense)
|
|||||||||||
|
Investment income
|
531.7
|
|
141.8
|
|
30.1
|
|
|||||
|
Gains (losses) on derivative investments
|
—
|
|
—
|
|
(1.8
|
)
|
|||||
|
Interest and other borrowing costs
|
(117.0
|
)
|
(123.5
|
)
|
(117.4
|
)
|
|||||
|
Equity in net earnings (losses) of unconsolidated subsidiaries
|
129.2
|
|
110.2
|
|
100.0
|
|
|||||
|
Other non-operating income (expense)
|
(329.6
|
)
|
(43.6
|
)
|
(42.8
|
)
|
|||||
|
Total Non-Operating Income (Expense)
|
214.3
|
|
84.9
|
|
(31.9
|
)
|
|||||
|
Income before Income Taxes
|
2,526.3
|
|
2,287.6
|
|
1,956.8
|
|
|||||
|
Income tax provision (benefit)
|
(1,537.1
|
)
|
753.5
|
|
709.8
|
|
|||||
|
Net Income
|
$
|
4,063.4
|
|
$
|
1,534.1
|
|
$
|
1,247.0
|
|
||
|
Earnings per Common Share:
|
|||||||||||
|
Basic
|
$
|
12.00
|
|
$
|
4.55
|
|
$
|
3.71
|
|
||
|
Diluted
|
11.94
|
|
4.53
|
|
3.69
|
|
|||||
|
Weighted Average Number of Common Shares:
|
|||||||||||
|
Basic
|
338,707
|
|
337,496
|
|
336,224
|
|
|||||
|
Diluted
|
340,226
|
|
338,966
|
|
337,894
|
|
|||||
See accompanying notes to consolidated financial statements.
51
CME GROUP INC. AND SUBSIDIARIES
CONSOLIDATED STATEMENTS OF COMPREHENSIVE INCOME
(in millions)
|
Year Ended December 31,
|
|||||||||||||
|
2017
|
2016
|
2015
|
|||||||||||
|
Net income
|
$
|
4,063.4
|
|
$
|
1,534.1
|
|
$
|
1,247.0
|
|
||||
|
Other comprehensive income, net of tax:
|
|||||||||||||
|
Investment securities:
|
|||||||||||||
|
Net unrealized holding gains (losses) arising during the period
|
30.2
|
|
170.0
|
|
(78.0
|
)
|
|||||||
|
Reclassification of gains (losses) on sale included in investment income
|
(89.5
|
)
|
(48.7
|
)
|
8.5
|
|
|||||||
|
Income tax benefit (expense)
|
79.4
|
|
(45.8
|
)
|
(2.6
|
)
|
|||||||
|
Investment securities, net
|
20.1
|
|
75.5
|
|
(72.1
|
)
|
|||||||
|
Defined benefit plans:
|
|||||||||||||
|
Net change in defined benefit plans arising during the period
|
0.3
|
|
(5.1
|
)
|
(11.2
|
)
|
|||||||
|
Amortization of net actuarial (gains) losses and prior service costs included in compensation and benefits expense
|
2.9
|
|
3.2
|
|
2.7
|
|
|||||||
|
Income tax benefit (expense)
|
(1.5
|
)
|
0.7
|
|
3.2
|
|
|||||||
|
Defined benefit plans, net
|
1.7
|
|
(1.2
|
)
|
(5.3
|
)
|
|||||||
|
Derivative investments:
|
|||||||||||||
|
Net unrealized holding gains (losses) arising during the period
|
—
|
|
—
|
|
(4.7
|
)
|
|||||||
|
Ineffectiveness on cash flow hedges
|
—
|
|
—
|
|
1.8
|
|
|||||||
|
Amortization of effective portion of net (gains) losses on cash flow hedges included in interest expense
|
(1.2
|
)
|
(1.2
|
)
|
(1.2
|
)
|
|||||||
|
Income tax benefit (expense)
|
0.3
|
|
0.5
|
|
1.1
|
|
|||||||
|
Derivative investments, net
|
(0.9
|
)
|
(0.7
|
)
|
(3.0
|
)
|
|||||||
|
Foreign currency translation:
|
|||||||||||||
|
Foreign currency translation adjustments
|
10.4
|
|
(8.2
|
)
|
(10.6
|
)
|
|||||||
|
Income tax benefit (expense)
|
(2.9
|
)
|
1.3
|
|
4.0
|
|
|||||||
|
Foreign currency translation, net
|
7.5
|
|
(6.9
|
)
|
(6.6
|
)
|
|||||||
|
Other comprehensive gain (loss), net of tax
|
28.4
|
|
66.7
|
|
(87.0
|
)
|
|||||||
|
Comprehensive Income
|
$
|
4,091.8
|
|
$
|
1,600.8
|
|
$
|
1,160.0
|
|
||||
See accompanying notes to consolidated financial statements.
52
CME GROUP INC. AND SUBSIDIARIES
CONSOLIDATED STATEMENTS OF EQUITY
(dollars in millions, except per share data; shares in thousands)
|
Class A
Common
Stock
(Shares)
|
Class B
Common
Stock
(Shares)
|
Common
Stock and
Additional
Paid-in
Capital
|
Retained
Earnings
|
Accumulated
Other
Comprehensive
Income (Loss)
|
Total Shareholders' Equity
|
||||||||||||||
|
Balance at December 31, 2014
|
335,452
|
3
|
$
|
17,600.0
|
|
$
|
3,317.3
|
|
$
|
6.2
|
|
$
|
20,923.5
|
|
|||||
|
Net income
|
1,247.0
|
|
1,247.0
|
|
|||||||||||||||
|
Other comprehensive income attributable to CME Group
|
(87.0
|
)
|
(87.0
|
)
|
|||||||||||||||
|
Dividends on common stock of $4.90 per share
|
(1,656.7
|
)
|
(1,656.7
|
)
|
|||||||||||||||
|
Tax effect and gain related to purchase of non-controlling interests
|
|
9.3
|
|
9.3
|
|
||||||||||||||
|
Exercise of stock options
|
984
|
64.0
|
|
64.0
|
|
||||||||||||||
|
Excess tax benefits from option exercises and restricted stock vesting
|
3.8
|
|
3.8
|
|
|||||||||||||||
|
Vesting of issued restricted Class A common stock
|
456
|
(17.2
|
)
|
(17.2
|
)
|
||||||||||||||
|
Shares issued to Board of Directors
|
26
|
2.4
|
|
2.4
|
|
||||||||||||||
|
Shares issued under Employee Stock Purchase Plan
|
20
|
1.9
|
|
1.9
|
|
||||||||||||||
|
Stock-based compensation
|
60.8
|
|
60.8
|
|
|||||||||||||||
|
Balance at December 31, 2015
|
336,938
|
3
|
$
|
17,725.0
|
|
$
|
2,907.6
|
|
$
|
(80.8
|
)
|
$
|
20,551.8
|
|
|||||
See accompanying notes to consolidated financial statements.
53
CME GROUP INC. AND SUBSIDIARIES
CONSOLIDATED STATEMENTS OF EQUITY
(continued)
(dollars in millions, except per share data; shares in thousands)
|
Class A
Common
Stock
(Shares)
|
Class B
Common
Stock
(Shares)
|
Common
Stock and
Additional
Paid-in
Capital
|
Retained
Earnings
|
Accumulated
Other
Comprehensive
Income (Loss)
|
Total Shareholders' Equity
|
||||||||||||||
|
Balance at December 31, 2015
|
336,938
|
3
|
$
|
17,725.0
|
|
$
|
2,907.6
|
|
$
|
(80.8
|
)
|
$
|
20,551.8
|
|
|||||
|
Net income
|
1,534.1
|
|
1,534.1
|
|
|||||||||||||||
|
Other comprehensive income attributable to CME Group
|
66.7
|
|
66.7
|
|
|||||||||||||||
|
Dividends on common stock of $5.65 per share
|
(1,917.2
|
)
|
(1,917.2
|
)
|
|||||||||||||||
|
Exercise of stock options
|
686
|
51.8
|
|
51.8
|
|
||||||||||||||
|
Excess tax benefits from option exercises and restricted stock vesting
|
9.5
|
|
9.5
|
|
|||||||||||||||
|
Vesting of issued restricted Class A common stock
|
570
|
(26.8
|
)
|
(26.8
|
)
|
||||||||||||||
|
Shares issued to Board of Directors
|
26
|
2.5
|
|
2.5
|
|
||||||||||||||
|
Shares issued under Employee Stock Purchase Plan
|
20
|
2.1
|
|
2.1
|
|
||||||||||||||
|
Stock-based compensation
|
66.2
|
|
66.2
|
|
|||||||||||||||
|
Balance at December 31, 2016
|
338,240
|
3
|
$
|
17,830.3
|
|
$
|
2,524.5
|
|
$
|
(14.1
|
)
|
$
|
20,340.7
|
|
|||||
See accompanying notes to consolidated financial statements.
54
CME GROUP INC. AND SUBSIDIARIES
CONSOLIDATED STATEMENTS OF EQUITY
(continued)
(dollars in millions, except per share data; shares in thousands)
|
Class A
Common
Stock
(Shares)
|
Class B
Common
Stock
(Shares)
|
Common
Stock and
Additional
Paid-in
Capital
|
Retained
Earnings
|
Accumulated
Other
Comprehensive
Income (Loss)
|
Total Shareholders' Equity
|
||||||||||||||
|
Balance at December 31, 2016
|
338,240
|
3
|
$
|
17,830.3
|
|
$
|
2,524.5
|
|
$
|
(14.1
|
)
|
$
|
20,340.7
|
|
|||||
|
Net income
|
4,063.4
|
|
4,063.4
|
|
|||||||||||||||
|
Other comprehensive income attributable to CME Group
|
28.4
|
|
28.4
|
|
|||||||||||||||
|
Dividends on common stock of $6.14 per share
|
(2,088.5
|
)
|
(2,088.5
|
)
|
|||||||||||||||
|
Impact of adoption of standards update on employee share-based payments, net of tax
|
1.4
|
|
(2.2
|
)
|
(0.8
|
)
|
|||||||||||||
|
Exercise of stock options
|
444
|
36.7
|
|
36.7
|
|
||||||||||||||
|
Vesting of issued restricted Class A common stock
|
511
|
(31.3
|
)
|
(31.3
|
)
|
||||||||||||||
|
Shares issued to Board of Directors
|
20
|
2.4
|
|
2.4
|
|
||||||||||||||
|
Shares issued under Employee Stock Purchase Plan
|
20
|
2.8
|
|
2.8
|
|
||||||||||||||
|
Stock-based compensation
|
58.0
|
|
58.0
|
|
|||||||||||||||
|
Balance at December 31, 2017
|
339,235
|
3
|
$
|
17,900.3
|
|
|
$
|
4,497.2
|
|
$
|
14.3
|
|
$
|
22,411.8
|
|
||||
See accompanying notes to consolidated financial statements.
55
CME GROUP INC. AND SUBSIDIARIES
(in millions)
|
|
Year Ended December 31,
|
||||||||||
|
|
2017
|
2016
|
2015
|
||||||||
|
Cash Flows from Operating Activities
|
|||||||||||
|
Net income
|
$
|
4,063.4
|
|
$
|
1,534.1
|
|
$
|
1,247.0
|
|
||
|
Adjustments to reconcile net income to net cash provided by operating activities:
|
|||||||||||
|
Stock-based compensation
|
58.0
|
|
66.2
|
|
60.8
|
|
|||||
|
Amortization of purchased intangibles
|
95.5
|
|
96.1
|
|
99.4
|
|
|||||
|
Depreciation and amortization
|
113.0
|
|
129.2
|
|
129.2
|
|
|||||
|
Loss on datacenter
|
—
|
|
27.1
|
|
—
|
|
|||||
|
(Gain) loss on sale of BM&FBOVESPA shares
|
(86.5
|
)
|
(48.4
|
)
|
8.5
|
|
|||||
|
Gain on sale of Bolsa Mexicana de Valores, S.A.B de C.V.
|
(2.3
|
)
|
—
|
|
—
|
|
|||||
|
Income tax expense reclassified from accumulated other comprehensive income upon final sale of BM&FBOVESPA shares
|
87.8
|
|
—
|
|
—
|
|
|||||
|
Debt prepayment costs
|
—
|
|
—
|
|
61.8
|
|
|||||
|
Undistributed earnings, net of losses, of unconsolidated subsidiaries
|
(26.8
|
)
|
(2.3
|
)
|
(5.1
|
)
|
|||||
|
Deferred income taxes
|
(2,445.6
|
)
|
(83.0
|
)
|
63.3
|
|
|||||
|
Change in:
|
|||||||||||
|
Accounts receivable
|
6.0
|
|
(8.1
|
)
|
(17.3
|
)
|
|||||
|
Other current assets
|
3.9
|
|
3.2
|
|
(12.7
|
)
|
|||||
|
Other assets
|
(17.8
|
)
|
5.4
|
|
(4.0
|
)
|
|||||
|
Accounts payable
|
5.1
|
|
(2.6
|
)
|
(8.2
|
)
|
|||||
|
Income taxes payable
|
3.5
|
|
60.5
|
|
(82.1
|
)
|
|||||
|
Other current liabilities
|
(8.9
|
)
|
(12.4
|
)
|
(3.9
|
)
|
|||||
|
Other liabilities
|
(8.5
|
)
|
(22.5
|
)
|
(9.8
|
)
|
|||||
|
Other
|
0.6
|
|
0.3
|
|
5.6
|
|
|||||
|
Net Cash Provided by Operating Activities
|
1,840.4
|
|
1,742.8
|
|
1,532.5
|
|
|||||
|
Cash Flows from Investing Activities
|
|||||||||||
|
Proceeds from maturities and sales of available-for-sale marketable securities
|
2.5
|
|
41.7
|
|
38.3
|
|
|||||
|
Purchases of available-for-sale marketable securities
|
(3.0
|
)
|
(45.9
|
)
|
(35.3
|
)
|
|||||
|
Purchases of property, net
|
(81.9
|
)
|
(91.8
|
)
|
(114.2
|
)
|
|||||
|
Investments in business ventures
|
(5.3
|
)
|
(9.1
|
)
|
(16.7
|
)
|
|||||
|
Proceeds from sale of business ventures
|
4.0
|
|
8.8
|
|
—
|
|
|||||
|
Proceeds from sale of BM&FBOVESPA shares
|
244.0
|
|
150.0
|
|
138.8
|
|
|||||
|
Proceeds from sale of Bolsa Mexicana de Valores, S.A.B de C.V.
|
19.6
|
|
—
|
|
—
|
|
|||||
|
Settlement of derivative related to debt issuance
|
—
|
|
—
|
|
7.0
|
|
|||||
|
Net Cash Provided by Investing Activities
|
179.9
|
|
53.7
|
|
17.9
|
|
|||||
See accompanying notes to consolidated financial statements.
56
CME GROUP INC. AND SUBSIDIARIES
CONSOLIDATED STATEMENTS OF CASH FLOWS
(continued)
(in millions)
|
|
Year Ended December 31,
|
||||||||||
|
|
2017
|
2016
|
2015
|
||||||||
|
Cash Flows from Financing Activities
|
|||||||||||
|
Proceeds from other borrowings, net of issuance costs
|
$
|
—
|
|
$
|
—
|
|
$
|
743.7
|
|
||
|
Repayment of other borrowings
|
—
|
|
—
|
|
(673.0
|
)
|
|||||
|
Cash dividends
|
(1,993.5
|
)
|
(1,787.2
|
)
|
(1,343.4
|
)
|
|||||
|
Proceeds from finance lease obligation
|
—
|
|
130.0
|
|
—
|
|
|||||
|
Proceeds from exercise of stock options
|
36.7
|
|
51.8
|
|
64.0
|
|
|||||
|
Excess tax benefits related to employee option exercises and restricted stock vesting
|
—
|
|
9.5
|
|
7.1
|
|
|||||
|
Employee taxes paid on restricted stock vesting
|
(31.3
|
)
|
(26.8
|
)
|
(17.2
|
)
|
|||||
|
Settlement of contingent consideration
|
—
|
|
—
|
|
(7.0
|
)
|
|||||
|
Other
|
2.8
|
|
2.2
|
|
1.9
|
|
|||||
|
Net Cash Used in Financing Activities
|
(1,985.3
|
)
|
(1,620.5
|
)
|
(1,223.9
|
)
|
|||||
|
Net change in cash and cash equivalents
|
35.0
|
|
176.0
|
|
326.5
|
|
|||||
|
Cash and cash equivalents, beginning of period
|
1,868.6
|
|
1,692.6
|
|
1,366.1
|
|
|||||
|
Cash and Cash Equivalents, End of Period
|
$
|
1,903.6
|
|
$
|
1,868.6
|
|
$
|
1,692.6
|
|
||
|
Supplemental Disclosure of Cash Flow Information
|
|||||||||||
|
Income taxes paid
|
$
|
762.8
|
|
$
|
706.7
|
|
$
|
716.6
|
|
||
|
Interest paid
|
84.8
|
|
84.8
|
|
89.1
|
|
|||||
|
Non-cash financing activities:
|
|||||||||||
|
Declaration of annual variable dividend, payable in January 2018, January 2017 and January 2016
|
1,187.3
|
|
1,099.3
|
|
977.1
|
|
|||||
See accompanying notes to consolidated financial statements.
57
CME GROUP INC. AND SUBSIDIARIES
NOTES TO CONSOLIDATED FINANCIAL STATEMENTS
1. ORGANIZATION AND BUSINESS
Chicago Mercantile Exchange Inc. (CME), the Board of Trade of the City of Chicago, Inc. (CBOT), New York Mercantile Exchange, Inc. (NYMEX) and Commodity Exchange, Inc. (COMEX), wholly-owned subsidiaries of CME Group Inc. (CME Group), are designated contract markets for the trading of futures and options on futures contracts. CME, CBOT, NYMEX, COMEX and their subsidiaries are referred to collectively as “the exchange” in the notes to the consolidated financial statements. CME Group and its subsidiaries are referred to collectively as “the company” in the notes to the consolidated financial statements.
CME Group offers a wide range of products for trading and/or clearing, including those based on interest rates, equity indexes, foreign exchange, energy, agricultural commodities and metals. Trades are executed through CME Group's electronic trading platforms, open outcry and privately negotiated transactions. Through its clearing house, CME Group offers clearing, settlement and guarantees for all products cleared through the exchange.
In April 2017, the company announced the wind down of CME Clearing Europe Limited (CMECE) and CME Europe Limited (CME Europe) which was completed by year end. In September 2017, the company also announced we will exit the credit default swaps business by mid-2018.
2. SUMMARY OF SIGNIFICANT ACCOUNTING POLICIES
Basis of Presentation.
The accompanying consolidated financial statements are prepared in accordance with accounting principles generally accepted in the United States and include the accounts of the company and its subsidiaries. All intercompany transactions and balances have been eliminated.
Use of Estimates.
The preparation of consolidated financial statements requires management to make estimates and assumptions that affect the reported amounts and the disclosure of contingent amounts in the consolidated financial statements and accompanying notes. Estimates are based on historical experience, where applicable, and assumptions management believes are reasonable under the circumstances. Due to the inherent uncertainty involved with estimates, actual results may differ.
Cash and Cash Equivalents.
Cash and cash equivalents consist of cash and highly liquid investments with a maturity of three months or less at the time of purchase.
Financial Investments.
The company maintains short-term and long-term investments, classified as available-for-sale or trading securities. Available-for-sale investments are carried at their fair value, with unrealized gains and losses, net of deferred income taxes, reported as a component of accumulated other comprehensive income. Trading securities held in connection with non-qualified deferred compensation plans are recorded at fair value, with net realized and unrealized gains and losses and dividend income reported as investment income. Also, the company maintains long-term investments accounted for under the cost method and equity method, depending upon the degree of influence over the investee as held by the company.
The company reviews its investments to determine whether a decline in fair value below the cost basis is other-than-temporary. If events and circumstances indicate that a decline in the value of the assets has occurred and is deemed to be other-than-temporary, the carrying value of the investments is reduced to its fair value and a corresponding impairment is charged to earnings.
Fair Value of Financial Instruments.
The company uses a three-level classification hierarchy of fair value measurements that establishes the quality of inputs used to measure fair value. The fair value of a financial instrument is the amount that would be received to sell an asset or paid to transfer a liability in an orderly transaction between market participants at the measurement date. The fair value of financial instruments is determined using various techniques that involve some level of estimation and judgment, the degree of which is dependent on the price transparency and the complexity of the instruments.
Derivative Investments.
The company uses derivative instruments, designated as cash flow hedges, to limit exposure to changes in interest rates. Derivatives are recorded at fair value in the consolidated balance sheets. The effective portion of the changes in the fair value of cash flow hedges is deferred in accumulated other comprehensive income. Any realized gains and losses from effective hedges are classified as interest expense in the consolidated statements of income, and any ineffective or excluded portion of a hedge is recognized in earnings immediately.
Accounts Receivable.
Accounts receivable are comprised of trade receivables and unbilled revenue. All accounts receivable are stated at cost. Exposure to losses on receivables for clearing and transaction fees and other amounts owed by clearing firms is dependent on each clearing firm's financial condition and the memberships that collateralize fees owed to the exchange. The
58
exchange retains the right to liquidate exchange memberships to satisfy a clearing firm's receivable. The allowance for doubtful accounts is calculated based on historical losses and management's assessment of probable future collections.
Performance Bonds and Guaranty Fund Contributions.
Performance bonds and guaranty fund contributions held for clearing firms may be in the form of cash, securities or other non-cash deposits.
Performance bonds and guaranty fund contributions received in the form of cash held by CME may be invested in U.S. government securities, U.S. government agency securities and certain foreign government securities acquired through and held by a bank or broker-dealer subsidiary of a bank, a cash account at the Federal Reserve Bank of Chicago, reverse repurchase agreements secured with highly rated government securities, money market funds or through CME's Interest Earning Facility (IEF) program. Any interest earned on CME investments accrues to CME and is included in investment income in the consolidated statements of income. CME may distribute any interest earned on its investments to the clearing firms at its discretion. Because CME has control of the cash collateral and the benefits and risks of ownership accrue to CME, cash performance bonds and guaranty fund contributions are reflected in the consolidated balance sheets. Performance bonds and guaranty fund contributions assets on the consolidated balance sheets can include reinvestments in U.S. Treasury and U.S. government agency securities with maturity dates of 90 days or less. U.S. Treasury and U.S. government agency securities can be purchased by CME, at its discretion, using cash collateral.
Securities and other non-cash deposits may include U.S. Treasury securities, U.S. government agency securities, Eurobonds, corporate bonds, other foreign government securities and gold bullion. Securities and other non-cash deposits are held in safekeeping by a custodian bank. Interest and gains or losses on securities deposited to satisfy performance bond and guaranty fund requirements accrue to the clearing firm. Because the benefits and risks of ownership accrue to the clearing firm, non-cash performance bonds and guaranty fund contributions are not reflected in the consolidated balance sheets.
Property, Equipment and Leasehold Improvements.
Property, equipment and leasehold improvements are stated at cost, less accumulated depreciation and amortization. Depreciation and amortization are calculated using the straight-line method, generally over
two
to
thirty-nine
years. Property and equipment are depreciated over their estimated useful lives. Leasehold improvements are amortized over the shorter of the remaining term of the respective lease to which they relate or the remaining useful life of the leasehold improvement. Land is reported at cost. Internal and external costs incurred in developing or obtaining computer software for internal use which meet the requirements for capitalization are amortized on a straight-line basis over the estimated useful life of the software, generally
two
to
four
years.
Operating Leases.
Most leases in which the company is the tenant are accounted for as operating leases. Landlord allowances are recorded as a reduction to rent expense on a straight-line basis over the term of the lease. For sale leaseback transactions, the company evaluates the sale and the lease arrangement based on the company's continuing involvement and recognizes the sale leaseback as either a sale leaseback transaction or under the financing method, which requires the asset to remain on the consolidated balance sheets throughout the term of the lease and the proceeds to be recognized as a finance lease obligation. A portion of the lease payments is recognized as a reduction of the finance lease obligation and a portion is recognized as interest expense based on an imputed interest rate.
Goodwill and Other Intangible Assets.
Goodwill represents the excess of the purchase price over the fair value of the net assets acquired in a business combination. The company reviews goodwill and indefinite-lived intangible assets for impairment at least quarterly and whenever events or circumstances indicate that their carrying values may not be recoverable. The company may test goodwill quantitatively for impairment by comparing the carrying value of a reporting unit to its estimated fair value. Estimating the fair value of a reporting unit involves significant judgments inherent in the analysis including estimating the amount and timing of future cash flows and the selection of appropriate discount rates and long-term growth rate assumptions. Changes in these estimates and assumptions could materially affect the determination of fair value for the reporting unit. If the carrying amount exceeds fair value, an impairment loss is recorded. In certain circumstances, goodwill may be reviewed qualitatively for indications of impairment without utilizing valuation techniques to estimate fair value.
The company evaluates the recoverability of indefinite-lived intangible assets at least quarterly by comparing the estimated fair value of the intangible asset to its carrying value. If the indefinite-lived intangible asset carrying value exceeds its fair value, an impairment loss is recognized in an amount equal to that excess. Estimating the fair value of indefinite-lived intangible assets involves the use of valuation techniques that rely on significant estimates and assumptions including forecasted revenue growth rates, forecasted allocations of expense and risk-adjusted discount rates. Changes in these estimates and assumptions could materially affect the determination of fair value for indefinite-lived intangible assets. In certain circumstances, indefinite-lived intangible assets may be reviewed qualitatively for indications of impairment without utilizing valuation techniques to estimate fair value.
Intangible assets subject to amortization are also assessed for impairment at least quarterly or when indicated by a change in economic or operational circumstances. The impairment assessment of these assets requires management to first compare the book value of the amortizing asset to undiscounted cash flows. If the book value exceeds the undiscounted cash flows,
59
management is then required to estimate the fair value of the assets and record an impairment loss for the excess of the carrying value over the fair value and annually challenge the useful lives.
Business Combinations.
The company accounts for business combinations using the acquisition method. The method requires the acquirer to recognize the assets acquired, liabilities assumed, and any non-controlling interest in the acquiree at the acquisition date, measured at their fair values as of that date. The company may use independent valuation services to assist in determining the estimated fair values.
Employee Benefit Plans.
The company recognizes the funded status of defined benefit postretirement plans in its consolidated balance sheets. Changes in that funded status are recognized in the year of change in other comprehensive income (loss). Plan assets and obligations are measured at year end. The company recognizes future changes in actuarial gains and losses and prior service costs in the year in which the changes occur through accumulated other comprehensive income (loss).
Foreign Currency Translation
. Foreign currency denominated assets and liabilities are re-measured into the functional currency using period-end exchange rates. Gains and losses from foreign currency transactions are included in other expense in the accompanying consolidated statements of income. When the functional currency differs from the reporting currency, revenues and expenses of foreign subsidiaries are translated from their functional currencies into U.S. dollars using weighted-average exchange rates while their assets and liabilities are translated into U.S. dollars using period-end exchange rates. Gains and losses resulting from foreign currency translations are included in accumulated other comprehensive income (loss) within shareholders' equity.
Revenue Recognition.
Revenue recognition policies for specific sources of revenue are discussed below.
Clearing and Transaction Fees.
Clearing and transaction fees include per-contract charges for trade execution, clearing, trading on the company's electronic trading platform and other fees. Fees are charged at various rates based on the product traded, the method of trade, the exchange trading privileges of the customer making the trade and the type of contract. Clearing and transaction fees are recognized as revenue when a buy and sell order are matched and the trade is cleared. Therefore, unfilled or canceled buy and sell orders have no impact on revenue. On occasion, the customer's exchange trading privileges may not be properly entered by the clearing firm and incorrect fees are charged for the transactions. When this information is corrected within the time period allowed by the exchange, a fee adjustment is provided to the clearing firm. A reserve is established for estimated fee adjustments to reflect corrections to customer exchange trading privileges. The reserve is based on the historical pattern of adjustments processed as well as specific adjustment requests. The company believes the allowances are adequate to cover estimated adjustments.
Market Data and Information Services.
Market data and information services represent revenue earned for the dissemination of market information. Revenues are accrued each month based on the number of devices reported by vendors. The exchange conducts periodic examinations of the number of devices reported and assesses additional fees as necessary. On occasion, customers will pay for services in a lump sum payment; however, revenue is recognized as services are provided.
Access and Communication Fees.
Access fees are the connectivity charges to customers of the company's electronic trading platform that are also used by market data vendors and customers. The fees include co-location fees, access fees for the electronic trading platform, line charges and hardware rental charges and can vary depending on the type of connection provided. An additional installation fee may be charged depending on the type of service requested and a disconnection fee may also be charged if certain conditions are met. Revenue is generally recognized monthly as the service is provided.
Communication fees consist of equipment rental and usage charges to customers and firms that utilize various telecommunications hubs located internationally as well as networks and services in the Chicago and New York City facilities. Revenue is billed and recognized on a monthly basis.
Other Revenues.
Other revenues include fees for collateral management and fees for trade order routing through agreements from various strategic relationships as well as other services to members and clearing firms. Revenue is recognized as services are provided.
Concentration of Revenue.
One firm represented
13%
and another firm represented
12%
of the company's clearing and transaction fees revenue in 2017. One firm represented
13%
and another firm represented
11%
of the company's clearing and transaction fees revenue in 2016. One firm represented
13%
of the company's clearing and transaction fees revenue in 2015. Should a clearing firm withdraw from the exchange, management believes that the customer portion of that firm's trading activity would likely transfer to another clearing firm. Therefore, management does not believe that the company is exposed to significant risk from the ongoing loss of revenue received from a particular clearing firm.
The two largest resellers of market data represented approximately
45%
of market data and information services revenue in
2017
,
40%
in
2016
, and
43%
in
2015
. Should one of these vendors no longer subscribe to the company's market data,
60
management believes that the majority of that firm's customers would likely subscribe to the market data through another reseller. Therefore, management does not believe that the company is exposed to significant risk from a loss of revenue received from any particular market data reseller.
Share-Based Payments.
The company accounts for share-based payments at fair value, which is based on the grant date price of the equity awards issued. The company recognizes expense relating to stock-based compensation on an accelerated basis. As a result, the expense associated with each vesting date within a stock grant is recognized over the period of time that each portion of that grant vests. Beginning in 2017, the company recognizes expense for forfeitures of stock grants as they occur.
Marketing Costs.
Marketing costs are incurred for the production and communication of advertising as well as other marketing activities. These costs are expensed when incurred, except for costs related to the production of broadcast advertising, which are expensed when the first broadcast occurs.
Income Taxes.
Deferred income taxes arise from temporary differences between the tax basis and book basis of assets and liabilities. A valuation allowance is recognized if it is anticipated that some or all of a deferred tax asset may not be realized. The company accounts for uncertainty in income taxes recognized in its consolidated financial statements by using a more-likely-than-not recognition threshold based on the technical merits of the tax position taken or expected to be taken. The company classifies interest and penalties related to uncertain tax positions in income tax expense.
Segment Reporting.
The company reports the results of its operations as one operating segment primarily comprised of CME, CBOT, NYMEX and COMEX. The remaining operations do not meet the thresholds for reporting separate segment information.
Newly Adopted and Recently Issued Accounting Pronouncements.
In March 2016, the Financial Accounting Standards Board (FASB) issued a standards update that changes certain aspects of accounting for share-based payments to employees. The guidance requires all income tax effects of awards to be recognized in the income statement when the awards vest or are settled. It also allows an employer to repurchase more of an employee’s shares for tax withholding purposes without triggering liability accounting and to make a policy election to account for forfeitures as they occur. The company implemented this standards update as of January 1, 2017 on a prospective basis. Starting in the first quarter of 2017, all income tax effects of awards are recognized in the income statement as part of income tax expense when the awards vest or are settled. For the year-ended 2017, the company recognized a net tax benefit of
$13.9 million
related to the income tax effects of awards as part of income tax expense. The company also adopted a policy to recognize forfeitures as compensation expense as the forfeitures occur. Previously, the company estimated the number of awards that would be forfeited and recognized the estimate as part of compensation expense. This policy change was adopted on a modified retrospective basis with a cumulative-effect adjustment to additional paid in capital and retained earnings as of January 1, 2017. The excess tax benefits are now reported as an operating activity within the change in income taxes payable instead of a financing activity on the statements of cash flows. Prior periods have not been adjusted for this change. The employee taxes paid by the company when the company withholds shares for tax-withholding purposes when restricted stock awards vest are now classified as a financing activity on the statements of cash flows. Prior periods have been adjusted for this change.
In May 2014, the FASB issued a new standard on revenue recognition that replaces numerous, industry-specific requirements and converges U.S. accounting standards with International Financial Reporting Standards. The new standard introduces a framework for recognizing revenue that focuses on the transfer of control rather than risks and rewards. The new standard also requires significant additional disclosures about the nature, amount, timing and uncertainty of revenue and cash flows arising from customer contracts, including significant judgments, changes in judgments and assets recognized from costs incurred to obtain or fulfill a contract. The application of the new standard becomes effective in the first annual period beginning after December 15, 2017, with early adoption permitted. This guidance may be adopted using one of two transition methods: retrospectively to each prior reporting period presented (full retrospective method) or retrospectively with the cumulative effect of initially applying the guidance recognized at the date of initial adoption (the modified retrospective approach). The company has completed the contract review and implementation phases and will adopt the standard as of January 1, 2018 using the modified retrospective approach. Management will recognize a
$8.7 million
reduction to the opening balance of retained earnings as of January 1, 2018 upon adoption of the standard, which it believes to be an immaterial impact to the consolidated financial statements. The adjustment to the opening balance of retained earnings primarily relates to a deferral of a portion of clearing and transaction fees revenue earned and recognized subsequent to the contract trade execution date. The on-going application of the new standard is not expected to have a material impact on the company's financial statements. The adoption of the guidance will also include expanded disclosures within the notes to the consolidated financial statements.
In January 2016, the FASB issued a standards update that will change how entities measure certain equity investments. It does not change the guidance for classifying and measuring investments in debt securities and loans. Under the new guidance, entities will have to measure many equity investments at fair value and recognize any changes in fair value in net income, unless the investments qualify for a practicability exception. Entities will no longer be able to recognize unrealized holding gains and losses on equity securities classified today as available for sale in other comprehensive income. The update is
61
effective for reporting periods beginning after December 15, 2017. Early adoption is permitted. The company does not believe that the adoption of this guidance in 2018 will have a material impact on the consolidated financial statements.
In February 2016, the FASB issued a standards update that requires lessees to recognize on the balance sheet the assets and liabilities associated with the rights and obligations created by those leases. The guidance for lessors is largely unchanged from current U.S. GAAP. Under the new guidance, a lessee will be required to recognize assets and liabilities for leases with lease terms of more than 12 months. Consistent with current U.S. GAAP, the recognition, measurement, and presentation of expenses and cash flows arising from a lease by a lessee primarily will depend on its classification as a finance or operating lease. The update is effective for reporting periods beginning after December 15, 2018. Early adoption is permitted. Adoption of the guidance in 2019 will result in the gross-up of our balance sheet to reflect the present value of the lease payments over the lease term and offsetting lease liability at the lease commencement date. Presentation of lease expense and the pattern of expense recognition in the income statement is expected to remain materially consistent with existing lease accounting guidance.
In June 2016, the FASB issued guidance that changes how credit losses are measured for most financial assets measured at amortized cost and certain other instruments. The standard requires an entity to estimate its lifetime expected credit loss and record an allowance, that when deducted from the amortized cost basis of the financial asset, presents the net amount expected to be collected on the financial asset. This forward-looking expected loss model generally will result in the earlier recognition of allowances for losses. The standard also amends the impairment model for available for sale debt securities and requires entities to determine whether all or a portion of the unrealized loss on an available for sale debt security is a credit loss. Severity and duration of the unrealized loss are no longer permissible factors in concluding whether a credit loss exists. Entities will recognize improvements to estimated credit losses on available for sale debt securities immediately in earnings rather than as interest income over time. The standard is effective for reporting periods beginning after December 15, 2019. The standard’s provisions must be applied as a cumulative-effect adjustment to retained earnings as of the beginning of the first reporting period in which the guidance is effective. Early adoption is permitted for reporting periods beginning in 2019. The company does not believe that the adoption of this guidance in 2020 will have a material impact on the consolidated financial statements.
In November 2016, the FASB issued a standards update aimed at promoting consistency in the classification and presentation of changes in restricted cash on the statement of cash flows. Previously, there was diversity in practice as to whether the change in restricted cash was included in the reconciliation of beginning-of-period and end-of-period total cash amounts shown on the statement of cash flows. The amendments require that a statement of cash flows explain the change during the period in the total of cash, cash equivalents, as well as amounts described as restricted cash on the balance sheet. This guidance is effective for fiscal years beginning after December 15, 2017 and interim periods within those fiscal years. Early adoption is permitted. The amendments must be applied using a retrospective transition method to each period presented. The adoption of this guidance in 2018 will not have a material impact on the consolidated financial statements.
In March 2017, the FASB issued a standards update that will change certain presentation and disclosure requirements for employers that sponsor defined benefit pension as well as other postretirement benefit plans. Under current accounting rules, defined benefit pension cost and postretirement benefit cost (net benefit cost) comprise several components that reflect different aspects of an employer’s financial arrangements as well as the cost of benefits provided to the employees. Those components are aggregated for reporting in the financial statements within compensation and benefits on the income statement. The amendments in the update require that the service cost component is reported in the same line as other compensation costs, whereas the other components of net benefit cost are required to be presented in the income statement separately from the service cost component. The amendments are effective for reporting periods beginning after December 15, 2017. Early adoption is permitted as of the beginning of an annual period for which financial statements have not been issued. The company will change the presentation of certain components of pension cost upon adoption of this guidance in 2018; however, this change will not have a material impact on the consolidated financial statements.
In August 2017, the FASB issued a standards update that amends the existing hedge accounting model to enable entities to better reflect their risk management activities in the financial statements. The amendments expand an entity’s ability to hedge nonfinancial and financial risk components and reduce complexity in fair value hedges of interest rate risk. The guidance eliminates the requirement to separately measure and report hedge ineffectiveness and generally requires the entire change in the fair value of a hedging instrument to be presented in the same income statement line as the hedged item. The guidance also eases certain documentation and assessment requirements and modifies the accounting for components excluded from the assessment of hedge effectiveness. The guidance is effective for fiscal years beginning after December 15, 2018. Early adoption is permitted. The company does not believe that the adoption of this standard will have a material impact on the consolidated financial statements.
In December 2017, the staff of the Securities and Exchange Commission (SEC) issued a staff accounting bulletin that addresses situations where the accounting is incomplete for certain income tax effects of the Tax Cuts and Jobs Act (2017 Tax Act) by the time an entity issues its financial statements for 2017. The guidance provides for a measurement period of up to one year after the enactment date to finalize the recording of the related tax impacts. Under existing accounting guidance, entities are required to adjust current and deferred tax liabilities and assets for the effects of changes in tax laws or rates at their date of
62
enactment. However, pursuant to the staff accounting bulletin, if an entity does not have the necessary information available, prepared, or analyzed for certain income tax effects of the 2017 Tax Act at the time an entity's financial statements are issued, an entity may include provisional amounts to reflect its accounting for the change in tax law. The measurement period ends when the company has obtained, prepared and analyzed the information necessary to finalize its accounting, but cannot extend beyond one year. Additional information regarding the adoption of this guidance is contained in note 9.
In February 2018, the FASB issued guidance that gives entities the option to reclassify to retained earnings the tax effects related to items in accumulated other comprehensive income (AOCI) that were previously stranded within AOCI as a result of applying the 2017 Tax Act. An entity that elects to reclassify these amounts must reclassify stranded tax effects related to the change in federal tax rate for all items accounted for within AOCI. Entities can also elect to reclassify other stranded tax effects that relate to the 2017 Tax Act but do not directly relate to the change in federal rate. Tax effects that are stranded in AOCI for other reasons may not be reclassified. These amendments should be applied either in the period of adoption as a cumulative adjustment to the opening balance of retained earnings or retrospectively to each period in which the effect of the 2017 Tax Act is recognized. This guidance is effective for entities with fiscal years beginning after December 15, 2018. Early adoption is permitted. The company is in the process of evaluating the impact of this guidance on the consolidated financial statements.
3. MARKETABLE SECURITIES
Available-for-Sale Securities.
Certain marketable securities have been classified as available-for-sale. The amortized cost and fair value of these securities at December 31 were as follows:
|
|
2017
|
2016
|
||||||||||||||
|
(in millions)
|
Amortized
Cost
|
Fair
Value
|
Amortized
Cost
|
Fair
Value
|
||||||||||||
|
Corporate debt securities
(1)
|
$
|
20.0
|
|
$
|
20.8
|
|
$
|
20.0
|
|
$
|
20.2
|
|
||||
|
Asset-backed security
|
0.6
|
|
0.3
|
|
0.6
|
|
0.3
|
|
||||||||
|
Equity securities
|
—
|
|
0.1
|
|
0.1
|
|
0.1
|
|
||||||||
|
Total
|
$
|
20.6
|
|
$
|
21.2
|
|
$
|
20.7
|
|
$
|
20.6
|
|
||||
(1) The corporate debt securities are maintained for a non-qualified retirement and benefit plan under the COMEX Members' Recognition and Retention Plan (MRRP) (note 10).
Net unrealized gains (losses) on marketable securities classified as available-for-sale are reported as a component of other comprehensive income (loss) and included in the accompanying consolidated statements of comprehensive income and consolidated statements of equity.
The fair value and gross unrealized losses of the asset-backed security were
$0.3 million
and
$0.3 million
, respectively, at
December 31, 2017
. The asset-backed security was in an unrealized loss position for more than 12 months at
December 31, 2017
and was deemed not to be other-than-temporarily impaired. The company does not intend to sell and is not required to sell this asset-backed security prior to maturity.
The amortized cost and fair value of the corporate debt securities and asset-backed security at
December 31, 2017
, by contractual maturity, were as follows:
|
(in millions)
|
Amortized
Cost
|
Fair
Value
|
||||||
|
Maturity of one year or less
|
$
|
1.5
|
|
$
|
1.5
|
|
||
|
Maturity between one and five years
|
7.8
|
|
7.8
|
|
||||
|
Maturity between five and ten years
|
4.2
|
|
4.3
|
|
||||
|
Maturity greater than ten years
|
7.1
|
|
7.5
|
|
||||
|
Total
|
$
|
20.6
|
|
$
|
21.1
|
|
||
Trading Securities.
The company maintains additional investments in a diverse portfolio of mutual funds related to its non-qualified deferred compensation plans (note 10). The fair value of these securities was
$68.9 million
and
$62.7 million
at
December 31, 2017
and
2016
, respectively.
4. PERFORMANCE BONDS AND GUARANTY FUND CONTRIBUTIONS
The clearing house clears and guarantees the settlement of contracts traded in its markets. In its guarantor role, the clearing house has precisely equal and offsetting claims to and from clearing firms on opposite sides of each contract, standing as an intermediary on every contract cleared. Clearing firm positions in the United States are held according to Commodity and
63
Futures Trading Commission (CFTC) regulatory account segregation standards. To the extent that funds are not otherwise available to satisfy an obligation under the applicable contract, the clearing house bears counterparty credit risk in the event that future market movements create conditions that could lead to clearing firms failing to meet their obligations to the clearing house. The clearing house reduces the exposure through risk management programs that include initial and ongoing financial standards for designation as a clearing firm, performance bond requirements, daily mark-to-market, mandatory guaranty fund contributions and intra-day monitoring.
Each clearing firm is required to deposit and maintain balances in the form of cash, U.S. government securities, certain foreign government securities, bank letters of credit or other approved investments to satisfy performance bond and guaranty fund requirements. All non-cash deposits are marked-to-market and haircut on a daily basis. Securities deposited by the clearing firms are not reflected in the consolidated financial statements and the clearing house does not earn any interest on these deposits. These balances may fluctuate significantly over time due to investment choices available to clearing firms and changes in the amount of contributions required.
In addition, the rules and regulations of CBOT require that collateral be provided for delivery of physical commodities, maintenance of capital requirements and deposits on pending arbitration matters. To satisfy these requirements, clearing firms that have accounts that trade certain CBOT products have deposited cash, U.S. Treasury securities or letters of credit.
The clearing house marks-to-market open positions at least once a day (twice a day for futures and options contracts), and require payment from clearing firms whose positions have lost value and make payments to clearing firms whose positions have gained value. The clearing house has the capability to mark-to-market more frequently as market conditions warrant.
Under the extremely unlikely scenario of simultaneous default by every clearing firm who has open positions with unrealized losses, the maximum exposure related to positions other than credit default and interest rate swap contracts would be one half day of changes in fair value of all open positions, before considering the clearing houses' ability to access defaulting clearing firms' collateral deposits. For cleared credit default swap and interest rate swap contracts, the maximum exposure related to CME's guarantee would be one full day of changes in fair value of all open positions, before considering CME's ability to access defaulting clearing firms' collateral. During
2017
, the clearing house transferred an average of approximately
$2.4 billion
a day through the clearing system for settlement from clearing firms whose positions had lost value to clearing firms whose positions had gained value. The clearing house reduces the guarantee exposure through initial and maintenance performance bond requirements and mandatory guaranty fund contributions. The company believes that the guarantee liability is immaterial and therefore has not recorded any liability at
December 31, 2017
.
At December 31, 2016, performance bond and guaranty fund contribution assets on the consolidated balance sheets included cash as well as U.S. Treasury and U.S. government agency securities with maturity dates of 90 days or less. The U.S. Treasury and U.S. government agency securities were purchased by CME, at its discretion, using cash collateral. The benefits, including interest earned, and risks of ownership accrue to CME. Interest earned is included in investment income on the consolidated statements of income. There were no U.S. Treasury and U.S. government agency securities held at
December 31, 2017
.
The amortized cost and fair value of these securities at December 31, 2016 were as follows:
|
|
2016
|
|||||||
|
(in millions)
|
Amortized
Cost |
Fair
Value |
||||||
|
U.S. Treasury securities
|
$
|
5,548.9
|
|
$
|
5,549.0
|
|
||
|
U.S. government agency securities
|
1,228.3
|
|
1,228.3
|
|
||||
CME has been designated as a systemically important financial market utility by the Financial Stability Oversight Council and maintains a cash account at the Federal Reserve Bank of Chicago. At
December 31, 2017
and December 31, 2016, CME maintained
$34.2 billion
and
$6.2 billion
, respectively, within the cash account at the Federal Reserve Bank of Chicago.
Clearing firms, at their option, may instruct CME to deposit the cash held by CME into one of the IEF programs. The total principal in the IEF programs was
$1.1 billion
at
December 31, 2017
and
$6.8 billion
at
December 31, 2016
.
CME and The Options Clearing Corporation (OCC) have a perpetual cross-margin arrangement, whereby a clearing firm may maintain a cross-margin account in which a clearing firm's positions in certain equity index futures and options are combined with certain positions cleared by OCC for purposes of calculating performance bond requirements. The performance bond deposits are held jointly by CME and OCC. Cross-margin cash, securities and letters of credit jointly held with OCC under the cross-margin agreement are reflected at
50%
of the total, or CME's proportionate share per that agreement. If a participating firm defaults, the gain or loss on the liquidation of the firm's open position and the proceeds from the liquidation of the cross-margin account would be allocated
50%
each to CME and OCC. The company believes that the guarantee liability is immaterial and therefore has not recorded any liability at
December 31, 2017
.
64
In addition, CME has perpetual cross-margin agreements with Fixed Income Clearing Corporation (FICC) whereby the clearing firms' offsetting positions with CME and FICC are subject to reduced performance bond requirements. Clearing firms maintain separate performance bond deposits with each clearing house, but depending on the net offsetting positions between CME and FICC, each clearing house may reduce that firm's performance bond requirements. In the event of a firm default, the total liquidation net gain or loss on the firm's offsetting open positions and the proceeds from the liquidation of the performance bond collateral held by each clearing house's supporting offsetting positions would be divided evenly between CME and FICC. Additionally, if, after liquidation of all the positions and collateral of the defaulting firm at each respective clearing organization, and taking into account any cross-margining loss sharing payments, any of the participating clearing organizations has a remaining liquidating surplus, and any other participating clearing organization has a remaining liquidating deficit, any additional surplus from the liquidation would be shared with the other clearing house to the extent that it has a remaining liquidating deficit. Any remaining surplus funds would be passed to the bankruptcy trustee. The company believes that the guarantee liability is immaterial and therefore has not recorded any liability at
December 31, 2017
.
Each CME clearing firm for futures and options is required to deposit and maintain specified guaranty fund contributions in the form of cash or approved securities. In the event that performance bonds, guaranty fund contributions and other assets required to support clearing membership of a defaulting CME clearing firm are inadequate to fulfill that clearing firm's outstanding financial obligation, the base guaranty fund for contracts other than credit default and interest rate swaps is available to cover potential losses after first utilizing
$100.0 million
of corporate contributions designated by CME to be used in the event of a default of a clearing firm for the base guaranty fund.
CME maintains separate guaranty funds to support the clearing firms that clear interest rate swap products and credit default swap products. The funds for interest rate and credit default swaps are independent of the base guaranty fund and are isolated to clearing firms for products in the respective asset class. Each clearing firm for cleared interest rate swaps and cleared credit default swaps is required to deposit and maintain specified guaranty fund contributions in the form of cash or approved securities. In the event that performance bonds, guaranty fund contributions and other assets required to support clearing membership of a defaulting clearing firm for cleared interest rate swap contracts are inadequate to fulfill that clearing firm's outstanding financial obligation, the interest rate swaps contracts guaranty fund is available to cover potential losses after first utilizing
$150.0 million
of corporate contributions designated by CME to be used in the event of a default of a cleared interest rate swap clearing firm. In the event that performance bonds, guaranty fund contributions and other assets required to support clearing membership of a defaulting clearing firm for cleared credit default swap contracts are inadequate to fulfill that clearing firm's outstanding financial obligation, the credit default swaps contracts guaranty fund is available to cover potential losses after first utilizing corporate contributions designated by CME to be used in the event of default of a cleared credit default swap clearing firm, which is equal to the greater of
$50.0 million
and
5%
of the credit default swap guaranty fund, up to a maximum of
$100.0 million
. In September 2017, the company announced its plan to exit the credit default business by mid-2018. The disposal of the credit default swap business does not represent a strategic shift that would have a major effect on the company's operations and financial results and therefore will not be classified as discontinued operations.
CME maintains a
364
-day multi-currency line of credit with a consortium of domestic and international banks to be used in certain situations by the clearing house. CME may use the proceeds to provide temporary liquidity in the unlikely event of a clearing firm default, in the event of a liquidity constraint or default by a depositary (custodian of the collateral), or in the event of a temporary disruption with the domestic payments system that would delay payment of settlement variation between CME and its clearing firms. Clearing firm guaranty fund contributions received in the form of cash or U.S. Treasury securities as well as the performance bond assets of a defaulting firm can be used to collateralize the facility. The line of credit provides for borrowings of up to
$7.0 billion
. At
December 31, 2017
, guaranty fund contributions available for CME clearing firms were
$7.8 billion
. CME has the option to request an increase in the line from
$7.0 billion
to
$10.0 billion
, subject to the approval of participating banks. In addition to the
364
-day fully secured, committed multi-currency line of credit, the company also has the option to use the
$2.3 billion
multi-currency revolving senior credit facility to provide liquidity for the clearing house in the unlikely event of default.
CME is required under the Commodity Exchange Act in the United States to segregate cash and securities deposited by clearing firms on behalf of its customers. In addition, CME requires segregation of all funds deposited by its clearing firms from operating funds.
65
Cash and non-cash deposits held as performance bonds and guaranty fund contributions at fair value at December 31 were as follows:
|
|
2017
|
2016
|
||||||||||||||
|
(in millions)
|
Cash
|
Non-Cash
Deposits
and
IEF Funds
|
Cash
|
Non-Cash
Deposits
and
IEF Funds
|
||||||||||||
|
Performance bonds
(1)
|
$
|
41,809.5
|
|
$
|
86,730.4
|
|
$
|
35,726.5
|
|
$
|
111,764.2
|
|
||||
|
Guaranty fund contributions
|
2,281.2
|
|
6,102.4
|
|
1,702.4
|
|
5,246.3
|
|
||||||||
|
Cross-margin arrangements
|
93.4
|
|
21.5
|
|
107.9
|
|
351.3
|
|
||||||||
|
Performance bond collateral for delivery
|
1.2
|
|
—
|
|
6.7
|
|
—
|
|
||||||||
|
Total
|
$
|
44,185.3
|
|
$
|
92,854.3
|
|
$
|
37,543.5
|
|
$
|
117,361.8
|
|
||||
(1) Cash performance bonds include cash collateral reinvested in U.S. Treasury securities and U.S. government agency securities at December 31, 2016.
Cross-margin arrangements include collateral for the cross-margin accounts with OCC and FICC. The performance bond collateral for delivery includes deposits to meet CBOT delivery requirements.
Cash performance bonds may include intraday settlement, if any, that is owed to the clearing firms and paid the following business day. The balance of intraday settlements was
$111.0 million
and
$131.7 million
at
December 31, 2017
and
2016
, respectively. Intraday settlements may be invested on an overnight basis and are offset by an equal liability owed to clearing firms.
In addition to cash, securities and other non-cash deposits, irrevocable letters of credit may be used as performance bond deposits for clearing firms. At December 31, these letters of credit, which are not included in the accompanying consolidated balance sheets, were as follows:
|
(in millions)
|
2017
|
2016
|
||||||
|
Performance bonds
|
$
|
2,348.4
|
|
$
|
2,273.7
|
|
||
|
Cross-margin arrangements
|
59.5
|
|
—
|
|
||||
|
Performance bond collateral for delivery
|
3,438.5
|
|
1,759.8
|
|
||||
|
Total Letters of Credit
|
$
|
5,846.4
|
|
$
|
4,033.5
|
|
||
All cash, securities and letters of credit posted as performance bonds are only available to meet the financial obligations of that clearing firm to the clearing house.
5. PROPERTY
A summary of the property accounts at December 31 is presented below:
|
(in millions)
|
2017
|
2016
|
Estimated Useful Life
|
|||||||
|
Land and land improvements
|
$
|
7.8
|
|
$
|
7.8
|
|
10 - 20 years
(1)
|
|||
|
Building and building improvements
|
173.8
|
|
179.4
|
|
3 - 39 years
|
|||||
|
Leasehold improvements
|
180.5
|
|
180.3
|
|
3 - 24 years
|
|||||
|
Furniture, fixtures and equipment
|
309.9
|
|
293.4
|
|
2 - 7 years
|
|||||
|
Software and software development costs
|
404.3
|
|
361.5
|
|
2 - 4 years
|
|||||
|
Total property
|
1,076.3
|
|
1,022.4
|
|
||||||
|
Less accumulated depreciation and amortization
|
(676.6
|
)
|
(597.2
|
)
|
||||||
|
Property, net
|
$
|
399.7
|
|
$
|
425.2
|
|
||||
(1) Estimated useful life applies only to land improvements.
66
6. INTANGIBLE ASSETS AND GOODWILL
Intangible assets consisted of the following at December 31:
|
|
2017
|
2016
|
||||||||||||||||||||||
|
(in millions)
|
Assigned Value
|
Accumulated
Amortization
|
Net Book
Value
|
Assigned Value
|
Accumulated
Amortization
|
Net Book
Value
|
||||||||||||||||||
|
Amortizable Intangible Assets:
|
||||||||||||||||||||||||
|
Clearing firm, market data and other customer relationships
|
$
|
2,838.8
|
|
$
|
(943.7
|
)
|
$
|
1,895.1
|
|
$
|
2,838.8
|
|
$
|
(849.2
|
)
|
$
|
1,989.6
|
|
||||||
|
Technology-related intellectual property
|
29.4
|
|
(29.4
|
)
|
—
|
|
29.4
|
|
(28.6
|
)
|
0.8
|
|
||||||||||||
|
Other
|
2.4
|
|
(1.2
|
)
|
1.2
|
|
2.4
|
|
(1.0
|
)
|
1.4
|
|
||||||||||||
|
Total Amortizable Intangible Assets
|
$
|
2,870.6
|
|
|
$
|
(974.3
|
)
|
1,896.3
|
|
$
|
2,870.6
|
|
$
|
(878.8
|
)
|
1,991.8
|
|
|||||||
|
Indefinite-Lived Intangible Assets:
|
||||||||||||||||||||||||
|
Trade names
|
450.0
|
|
450.0
|
|
||||||||||||||||||||
|
Total Intangible Assets—Other, Net
|
$
|
2,346.3
|
|
$
|
2,441.8
|
|
||||||||||||||||||
|
Trading products
(1)
|
$
|
17,175.3
|
|
$
|
17,175.3
|
|
||||||||||||||||||
_______________
|
(1)
|
Trading products represent futures and options products acquired in our business combinations with CBOT Holdings, Inc., NYMEX Holdings, Inc. and The Board of Trade of Kansas City, Missouri, Inc. Clearing and transaction fees are generated through the trading of these products. These trading products, most of which have traded for decades, require authorization from the CFTC. Product authorizations from the CFTC have no term limits.
|
The originally assigned useful lives for the amortizable intangible assets as of
December 31, 2017
are as follows:
|
Clearing firm, market data and other customer relationships
|
5 - 30 years
|
|
Technology-related intellectual property
|
5 years
|
|
Other
|
3 - 24.5 years
|
Total amortization expense for intangible assets was
$95.5 million
,
$96.1 million
and
$99.4 million
for the years ended
December 31, 2017
,
2016
and
2015
, respectively. As of
December 31, 2017
, the future estimated amortization expense related to amortizable intangible assets is expected to be as follows:
|
(in millions)
|
|
||
|
2018
|
$
|
94.7
|
|
|
2019
|
94.7
|
|
|
|
2020
|
94.7
|
|
|
|
2021
|
94.7
|
|
|
|
2022
|
94.7
|
|
|
|
Thereafter
|
1,422.8
|
|
|
There were no changes within goodwill during the years ended
December 31, 2017
and
2016
.
7. LONG-TERM INVESTMENTS
The company maintains various long-term investments as described below. The investments are recorded in other assets in the consolidated balance sheets.
BM&FBOVESPA S.A.
In 2017, the company sold its remaining
43.4 million
shares of BM&FBOVESPA S.A. (BM&FBOVESPA) and recognized a gain of
$86.5 million
, net of transaction costs, within investment income on the consolidated statements of income based on the average cost method. In conjunction with the final sale of shares, the company reclassified income tax expense of $87.8 million from accumulated other comprehensive income to the income tax provision. The company accounted for its investment in BM&FBOVESPA as an available-for-sale security. The fair value and cost basis of the investment were
$218.7 million
and
$157.0 million
, respectively, at
December 31, 2016
.
67
Bolsa Mexicana de Valores, S.A.B de C.V.
In 2017, the company sold its approximate
2%
interest in Bolsa Mexicana de Valores, S.A.B. de C.V. (Bolsa Mexicana), a financial exchange operator in Mexico, and recognized a gain of
$2.3 million
, net of transaction costs, within investment income on the consolidated statements of income. The company accounted for its investment in Bolsa Mexicana stock as an available-for-sale security. The fair value and cost basis of the investment in Bolsa Mexicana at
December 31, 2016
was
$15.4 million
and
$17.3 million
, respectively.
Bursa Malaysia Derivatives Berhad.
The company owns a
25%
interest in Bursa Malaysia Derivatives Berhad (Bursa Malaysia), and accounts for its investment in Bursa Malaysia using the equity method of accounting. The company's investment in Bursa Malaysia was
$27.1 million
at
December 31, 2017
. The company and Bursa Malaysia have entered into several agreements including agreements to provide licensing, order routing and trade matching services.
DME Holdings Limited.
The company owns an approximate
50%
interest in DME Holdings Limited (DME Holdings), and accounts for its investment in DME Holdings using the equity method of accounting. The company's investment in DME Holdings was
$16.9 million
at
December 31, 2017
. The company and DME Holdings maintain an agreement for Dubai Mercantile Exchange futures contracts to be exclusively traded on the CME Globex platform.
S&P/DJI Indices LLC.
The company owns a
27%
interest in S&P/Dow Jones Indices LLC (S&P/DJI) and accounts for its investment in S&P/DJI using the equity method of accounting. The company's investment in S&P/DJI was
$955.0 million
at December 31, 2017. The company has long-term exclusive licensing agreements with S&P/DJI to list products based on the Standard & Poor's Indices and Dow Jones Indices.
8. DEBT
Long-term debt outstanding consisted of the following at December 31:
|
(in millions)
|
2017
|
2016
|
||||||
|
$750.0 million fixed rate notes due September 2022, stated rate of 3.00%
(1)
|
$
|
746.0
|
|
$
|
745.2
|
|
||
|
$750.0 million fixed rate notes due March 2025, stated rate of 3.00%
(2)
|
744.9
|
|
744.2
|
|
||||
|
$750.0 million fixed rate notes due September 2043, stated rate of 5.30%
(3)
|
742.2
|
|
741.8
|
|
||||
|
Total long-term debt
|
$
|
2,233.1
|
|
$
|
2,231.2
|
|
||
|
(1)
|
In August 2012, the company entered into a forward-starting interest rate swap agreement that modified the interest obligation associated with these notes so that the interest payable on the notes effectively became fixed at a rate of
3.32%
.
|
|
(2)
|
In December 2014, the company entered into a forward-starting interest rate swap agreement that modified the interest obligation associated with these notes so that the interest payable on the notes effectively became fixed at a rate of
3.11%
.
|
|
(3)
|
In August 2012, the company entered into a forward-starting interest rate swap agreement that modified the interest obligation associated with these notes so that the interest payable on the notes effectively became fixed at a rate of
4.73%
.
|
Long-term debt maturities, at par value, were as follows as of
December 31, 2017
:
|
(in millions)
|
Par Value
|
||
|
2018
|
$
|
—
|
|
|
2019
|
—
|
|
|
|
2020
|
—
|
|
|
|
2021
|
—
|
|
|
|
2022
|
750.0
|
|
|
|
Thereafter
|
1,500.0
|
|
|
68
9. INCOME TAXES
The company is subject to regulation under a wide variety of U.S., federal, state and foreign tax laws and regulations. Income before income taxes and the income tax provision consisted of the following for the years ended December 31:
|
(in millions)
|
2017
|
2016
|
2015
|
|||||||||
|
Income before income taxes:
|
||||||||||||
|
Domestic
|
$
|
2,464.2
|
|
$
|
2,221.8
|
|
$
|
1,927.3
|
|
|||
|
Foreign
|
62.1
|
|
65.8
|
|
29.5
|
|
||||||
|
Total
|
$
|
2,526.3
|
|
$
|
2,287.6
|
|
$
|
1,956.8
|
|
|||
|
Income tax provision:
|
||||||||||||
|
Current:
|
||||||||||||
|
Federal
|
$
|
783.7
|
|
$
|
684.4
|
|
$
|
554.5
|
|
|||
|
State
|
85.7
|
|
118.6
|
|
81.0
|
|
||||||
|
Foreign
|
39.1
|
|
33.5
|
|
11.0
|
|
||||||
|
Total
|
908.5
|
|
836.5
|
|
646.5
|
|
||||||
|
Deferred:
|
||||||||||||
|
Federal
|
(2,576.3
|
)
|
(95.4
|
)
|
75.6
|
|
||||||
|
State
|
130.8
|
|
10.0
|
|
(12.0
|
)
|
||||||
|
Foreign
|
(0.1
|
)
|
2.4
|
|
(0.3
|
)
|
||||||
|
Total
|
(2,445.6
|
)
|
(83.0
|
)
|
63.3
|
|
||||||
|
Total Income Tax Provision (Benefit)
|
$
|
(1,537.1
|
)
|
$
|
753.5
|
|
$
|
709.8
|
|
|||
On December 22, 2017, the U.S. government enacted comprehensive tax legislation commonly referred to as the Tax Cuts and Jobs Act (the 2017 Tax Act). The 2017 Tax Act establishes new tax laws that will affect 2018 and after, including a reduction in the U.S. federal corporate income tax rate from
35%
to
21%
. The 2017 Tax Act makes broad and complex changes to the U.S. tax code including, but not limited to, the repeal of the IRC Section 199 domestic production activities deduction in 2018 and accelerated depreciation that allows for full expensing of qualified property beginning in the fourth quarter of 2017.
On December 22, 2017, the SEC staff issued a staff accounting bulletin that provides guidance on accounting for the tax effects of the 2017 Tax Act. The guidance provides a measurement period that should not extend beyond one year from the 2017 Tax Act enactment date for companies to complete the accounting for income taxes related to changes associated with the 2017 Tax Act. According to the staff accounting bulletin, entities must recognize the impact in the financial statements for the activities that they have completed the work to understand the impact as a result of the tax reform law. For those activities which have not completed, the company would include provisional amounts if a reasonable estimate is available.
As a result of the reduction of the federal corporate income tax rate, the company has revalued its net deferred tax liability, excluding after tax credits, as of December 31, 2017. Based on this revaluation and other impacts of the 2017 Tax Act, the company has recognized a net tax benefit of
$2.6 billion
, which was recorded as a reduction to income tax expense for the year ended December 31, 2017. The company has recognized provisional adjustments but management has not completed its accounting for income tax effects for certain elements of the 2017 Tax Act, principally due to the accelerated depreciation that will allow for full expensing of qualified property.
Reconciliation of the statutory U.S. federal income tax rate to the effective tax rate is as follows:
|
2017
|
2016
|
2015
|
|||||||
|
Statutory U.S. federal tax rate
|
35.0
|
%
|
35.0
|
%
|
35.0
|
%
|
|||
|
State taxes, net of federal benefit
|
2.1
|
|
3.7
|
|
3.0
|
|
|||
|
Domestic production activities deduction
|
(1.0
|
)
|
(1.3
|
)
|
(1.3
|
)
|
|||
|
Increase (decrease) in domestic valuation allowance
|
(0.1
|
)
|
(4.7
|
)
|
0.1
|
|
|||
|
Impact of revised state and local apportionment estimates
|
3.1
|
|
0.5
|
|
(0.7
|
)
|
|||
|
Reclassification of accumulated other comprehensive income
|
3.5
|
|
—
|
|
—
|
|
|||
|
Impact of 2017 Tax Act
|
(101.6
|
)
|
—
|
|
—
|
|
|||
|
Other, net
|
(1.8
|
)
|
(0.3
|
)
|
0.2
|
|
|||
|
Effective Tax Expense (Benefit) Rate
|
(60.8
|
)%
|
32.9
|
%
|
36.3
|
%
|
|||
69
In 2017, the effective rate was lower than the statutory tax rate due to the remeasurement of the deferred tax liabilities as a result of the 2017 Tax Act. This decrease was partially offset by an increase in the state apportionment impact of the Illinois income tax rate change on deferred tax liabilities as well as the reclassification of income tax expense from accumulated other comprehensive income related to the disposal of BM&FBOVESPA shares.
In 2016, the effective rate was lower than the statutory tax rate largely due to the release of the valuation allowances related to the sale of BM&FBOVESPA shares. The decrease was partially offset by an increase in state tax expense and the state apportionment impact on deferred tax liabilities.
In 2015, the effective rate was higher than the statutory tax rate primarily due to the impact of state and local income taxes. The effective rate was primarily reduced by the Section 199 Domestic Productions Activities Deduction (Section 199 deduction) and the impact of state and local apportionment factors in deferred tax expense. The Section 199 deduction is related to certain activities performed by the company's electronic platform.
At December 31, deferred income tax assets (liabilities) consisted of the following:
|
(in millions)
|
2017
|
2016
|
||||||
|
Deferred Income Tax Assets:
|
||||||||
|
Net operating losses
|
$
|
13.0
|
|
$
|
18.8
|
|
||
|
Property
|
5.5
|
|
31.4
|
|
||||
|
Accrued expenses, compensation and other
|
37.2
|
|
119.0
|
|
||||
|
Subtotal
|
55.7
|
|
169.2
|
|
||||
|
Valuation allowance
|
(11.2
|
)
|
(14.9
|
)
|
||||
|
Total deferred income tax assets
|
44.5
|
|
154.3
|
|
||||
|
Deferred Income Tax Liabilities:
|
||||||||
|
Purchased intangible assets
|
(4,902.2
|
)
|
(7,445.3
|
)
|
||||
|
Total deferred income tax liabilities
|
(4,902.2
|
)
|
(7,445.3
|
)
|
||||
|
Net Deferred Income Tax Liabilities
|
$
|
(4,857.7
|
)
|
$
|
(7,291.0
|
)
|
||
A valuation allowance is recorded when it is more-likely-than-not that some portion or all of the deferred income tax assets may not be realized. The ultimate realization of the deferred income tax assets depends on the ability to generate sufficient taxable income of the appropriate character in the future and in the appropriate taxing jurisdictions.
At December 31, 2017 and 2016, the company had domestic and foreign income tax loss carry forwards of
$73.3 million
and
$96.8 million
, respectively. These amounts primarily related to losses from the acquisition of Swapstream Limited and its affiliates, the acquisition of Pivot, Inc., losses incurred in the operation of various foreign entities and capital losses from the sales of securities. At December 31, 2016, the company also had a net built-in, unrealized capital gain of
$19.3 million
. At December 31, 2017 and 2016, the company determined that it was not more-likely-than-not that deferred income tax assets related to the acquisition of Swapstream Limited and its affiliates and other deferred income tax assets created from the start-up of various foreign operations will be fully realized. As a result, valuation allowances of
$11.2 million
and
$14.9 million
were recorded at December 31, 2017 and 2016, respectively.
The following is a summary of the company’s unrecognized tax benefits:
|
(in millions)
|
2017
|
2016
|
2015
|
|||||||||
|
Gross unrecognized tax benefits
|
$
|
308.8
|
|
$
|
252.1
|
|
$
|
206.9
|
|
|||
|
Unrecognized tax benefits, net of tax impacts in other jurisdictions
|
276.0
|
|
216.1
|
|
179.6
|
|
||||||
|
Unrecognized interest and penalties related to uncertain tax positions
|
34.0
|
|
32.7
|
|
19.5
|
|
||||||
|
Interest and penalties recognized in the consolidated statements of income
|
1.3
|
|
13.2
|
|
8.6
|
|
||||||
The company does not believe it is reasonably possible that within the next twelve months, unrecognized tax benefits will change by a significant amount.
70
A reconciliation of the beginning and ending amounts of unrecognized tax benefits is as follows:
|
(in millions)
|
2017
|
2016
|
2015
|
|||||||||
|
Balance at January 1
|
$
|
252.1
|
|
$
|
206.9
|
|
$
|
187.6
|
|
|||
|
Additions based on tax positions related to the current year
|
41.8
|
|
29.6
|
|
20.4
|
|
||||||
|
Additions for tax positions of prior years
|
47.7
|
|
18.5
|
|
2.7
|
|
||||||
|
Reductions for tax positions of prior years
|
(8.7
|
)
|
(2.8
|
)
|
(3.8
|
)
|
||||||
|
Reductions resulting from the lapse of statutes of limitations
|
(2.1
|
)
|
(0.1
|
)
|
—
|
|
||||||
|
Settlements with taxing authorities
|
(22.0
|
)
|
—
|
|
—
|
|
||||||
|
Balance at December 31
|
$
|
308.8
|
|
$
|
252.1
|
|
$
|
206.9
|
|
|||
The company is subject to U.S. federal income tax as well as income taxes in Illinois and multiple other state, local and foreign jurisdictions. As of
December 31, 2017
, substantially all federal and state income tax matters had been concluded through 2007 and 2006, respectively.
10. EMPLOYEE BENEFIT PLANS
Pension Plans.
CME maintains a non-contributory defined benefit cash balance pension plan for eligible employees. CME's plan provides for a pay-based credit added to the cash balance account based on age and earnings and includes salary and cash bonuses in the definition of earnings. Employees who have completed a continuous 12-month period of employment and have reached the age of
21
are eligible to participate. Participant cash balance accounts receive an interest credit equal to the greater of the one-year constant maturity yield for U.S. Treasury notes or
4.0%
. Participants become vested in their accounts after
three
years of service. The measurement date used for the plan is December 31.
The following is a summary of the change in projected benefit obligation:
|
(in millions)
|
2017
|
2016
|
||||||
|
Balance at January 1
|
$
|
239.9
|
|
$
|
217.3
|
|
||
|
Service cost
|
18.7
|
|
16.7
|
|
||||
|
Interest cost
|
10.8
|
|
10.3
|
|
||||
|
Actuarial (gain) loss
|
15.1
|
|
5.3
|
|
||||
|
Benefits paid
|
(10.6
|
)
|
(9.7
|
)
|
||||
|
Balance at December 31
|
$
|
273.9
|
|
$
|
239.9
|
|
||
The aggregate accumulated benefit obligation was
$245.4 million
and
$211.4 million
at
December 31, 2017
and
2016
, respectively.
The following is a summary of the change in fair value of plan assets:
|
(in millions)
|
2017
|
2016
|
2015
|
|||||||||
|
Balance at January 1
|
$
|
238.8
|
|
$
|
217.5
|
|
$
|
225.1
|
|
|||
|
Actual return on plan assets
|
29.8
|
|
16.0
|
|
(7.2
|
)
|
||||||
|
Employer contributions
|
90.0
|
|
15.0
|
|
22.6
|
|
||||||
|
Benefits paid
|
(10.6
|
)
|
(9.7
|
)
|
(23.0
|
)
|
||||||
|
Balance at December 31
|
$
|
348.0
|
|
$
|
238.8
|
|
$
|
217.5
|
|
|||
71
The plan assets are classified into a fair value hierarchy in their entirety based on the lowest level of input that is significant to each asset or liability’s fair value measurement. Valuation techniques for level 2 assets use significant observable inputs such as quoted prices for similar assets, quoted market prices in inactive markets and other inputs that are observable or can be supported by observable market data. The fair value of each major category of plan assets as of December 31 is indicated below.
|
(in millions)
|
2017
|
2016
|
||||||
|
Level 2:
|
||||||||
|
Money market funds
|
$
|
95.8
|
|
$
|
31.5
|
|
||
|
Mutual funds:
|
||||||||
|
Fixed income
|
109.7
|
|
68.6
|
|
||||
|
U.S. equity
|
83.6
|
|
63.9
|
|
||||
|
Foreign equity
|
58.9
|
|
64.5
|
|
||||
|
Commodity
|
—
|
|
10.3
|
|
||||
|
Total
|
$
|
348.0
|
|
$
|
238.8
|
|
||
At
December 31, 2017
, the fair value of pension plan assets exceeded the projected benefit obligation by
$74.1 million
and the excess was recorded as a non-current pension asset in other assets. At
December 31, 2016
, the projected benefit obligation exceeded the fair value of pension plan asset by
$1.1 million
and the excess was recorded as a non-current pension liability in other liabilities.
CME's funding goal is to have its pension plan
100%
funded at each year-end on a projected benefit obligation basis, while also satisfying any minimum required contribution and obtaining the maximum tax deduction. In 2017, the company contributed $90.0 million to the plan, which resulted in plan assets exceeding the projected benefit obligation by
$74.1 million
. Year-end
2017
assumptions have been used to project the assets and liabilities from
December 31, 2017
to
December 31, 2018
. The result of this projection is that estimated liabilities would not exceed the fair value of the plan assets at
December 31, 2018
. Accordingly, the company anticipates based on this projection that no additional contribution in
2018
will be necessary for it to meet its funding goal. However, the amount of the actual contribution is contingent on various factors, including the actual rate of return on the plan assets during
2018
and the
December 31, 2018
discount rate.
The components of net pension expense and the assumptions used to determine the end-of-year projected benefit obligation and net pension expense in aggregate are indicated below:
|
(in millions)
|
2017
|
2016
|
2015
|
|||||||||
|
Components of Net Pension Expense:
|
||||||||||||
|
Service cost
|
$
|
18.7
|
|
$
|
16.7
|
|
$
|
18.4
|
|
|||
|
Interest cost
|
10.8
|
|
10.3
|
|
9.8
|
|
||||||
|
Expected return on plan assets
|
(15.1
|
)
|
(15.7
|
)
|
(16.3
|
)
|
||||||
|
Recognized net actuarial loss
|
2.9
|
|
3.2
|
|
2.7
|
|
||||||
|
Net Pension Expense
|
$
|
17.3
|
|
$
|
14.5
|
|
$
|
14.6
|
|
|||
|
Assumptions Used to Determine End-of-Year Benefit Obligation:
|
||||||||||||
|
Discount rate
|
3.70
|
%
|
4.30
|
%
|
4.60
|
%
|
||||||
|
Rate of compensation increase
|
5.00
|
|
5.00
|
|
5.00
|
|
||||||
|
Cash balance interest crediting rate
|
4.00
|
|
4.00
|
|
4.00
|
|
||||||
|
Assumptions Used to Determine Net Pension Expense:
|
||||||||||||
|
Discount rate
|
4.30
|
%
|
4.60
|
%
|
4.20
|
%
|
||||||
|
Rate of compensation increase
|
5.00
|
|
5.00
|
|
5.00
|
|
||||||
|
Expected return on plan assets
|
6.50
|
|
7.50
|
|
7.50
|
|
||||||
|
Interest crediting rate
|
4.00
|
|
4.00
|
|
4.00
|
|
||||||
The discount rate for the plan was determined based on the market value of a theoretical settlement bond portfolio. This portfolio consisted of U.S. dollar denominated Aa-rated corporate bonds across the full maturity spectrum. A single equivalent discount rate was determined to align the present value of the required cash flow with that settlement value. The resulting discount rate was reflective of both the current interest rate environment and the plan's distinct liability characteristics.
The basis for determining the expected rate of return on plan assets for the plan is comprised of three components: historical returns, industry peers and forecasted return. The plan's total return is expected to equal the composite performance of the
72
security markets over the long term. The security markets are represented by the returns on various domestic and international stock, bond and commodity indexes. These returns are weighted according to the allocation of plan assets to each market and measured individually.
The overall objective of the plan is to achieve required long-term rates of return in order to meet future benefit payments. The component of the investment policy for the plan that has the most significant impact on returns is the asset mix. The asset mix has a minimum and maximum range depending on asset class. The plan assets are diversified to minimize the risk of large losses by any one or more individual assets. Such diversification is accomplished, in part, through the selection of asset mix and investment management. The asset allocation for the plan, by asset category, at December 31 was as follows:
|
2017
|
2016
|
||||
|
Fixed income
|
31.6
|
%
|
28.8
|
%
|
|
|
Money market funds
|
27.5
|
|
13.2
|
|
|
|
U.S. equity
|
24.0
|
|
26.7
|
|
|
|
Foreign equity
|
16.9
|
|
27.0
|
|
|
|
Commodity
|
—
|
|
4.3
|
|
|
The range of target allocation percentages for
2018
is as follows:
|
Minimum
|
Maximum
|
||||
|
U.S. large-cap equity
|
20.0
|
%
|
80.0
|
%
|
|
|
U.S. mid-cap equity
|
10.0
|
|
25.0
|
|
|
|
U.S. small-cap equity
|
10.0
|
|
20.0
|
|
|
|
Foreign developed equity
|
—
|
|
40.0
|
|
|
|
Foreign small-cap equity
|
—
|
|
10.0
|
|
|
|
Emerging markets equity
|
—
|
|
10.0
|
|
|
At times, the company may determine that it is necessary to place some assets in cash equivalent investments in order to pay expected plan liabilities. Given this, the actual asset allocation for the plan may not fall within the target allocation ranges from time to time.
According to the plan's investment policy, the plan is not allowed to invest in securities that compromise independence, short sales of securities directly owned by the plan, securities purchased on margin or other uses of borrowed funds, derivatives not used for hedging purposes, restricted stock or illiquid securities or any other transaction prohibited by employment laws. If the plan directly invests in short-term and long-term debt obligations, the investments are limited to obligations rated at the highest rating category by Standard & Poor's or Moody's.
The pre-tax balance and activity of actuarial losses for the pension plan, which are included in other comprehensive income (loss), for
2017
are as follows:
|
(in millions)
|
Actuarial
Loss
|
|||
|
Balance at January 1
|
$
|
62.8
|
|
|
|
Unrecognized net loss
|
0.3
|
|
||
|
Recognized as a component of net pension expense
|
(2.9
|
)
|
||
|
Balance at December 31
|
$
|
60.2
|
|
|
The company expects to amortize
$2.9 million
of actuarial loss and prior service costs from accumulated other comprehensive income (loss) into net periodic benefit costs in
2018
.
73
At
December 31, 2017
, anticipated benefit payments from the plan in future years are as follows:
|
(in millions)
|
||||
|
2018
|
$
|
16.6
|
|
|
|
2019
|
18.3
|
|
||
|
2020
|
18.6
|
|
||
|
2021
|
20.0
|
|
||
|
2022
|
20.3
|
|
||
|
2023-2027
|
112.4
|
|
||
Savings Plans.
CME maintains a defined contribution savings plan pursuant to Section 401(k) of the Internal Revenue Code, whereby all U.S. employees are participants and have the option to contribute to this plan. CME matches employee contributions up to
3%
of the employee's base salary and may make additional discretionary contributions.
In addition to the plan for U.S. employees, the company maintains defined contribution savings plans for employees in international locations.
Aggregate expense for all of the defined contribution savings plans amounted to
$11.8 million
,
$11.3 million
and
$11.7 million
in
2017
,
2016
and
2015
, respectively.
CME Non-Qualified Plans.
CME maintains non-qualified plans, under which participants may make assumed investment choices with respect to amounts contributed on their behalf. Although not required to do so, CME invests such contributions in assets that mirror the assumed investment choices. The balances in these plans are subject to the claims of general creditors of the exchange and totaled
$68.9 million
and
$62.7 million
at
December 31, 2017
and
2016
respectively. Although the value of the plans is recorded as an asset in marketable securities in the consolidated balance sheets, there is an equal and offsetting liability. The investment results of these plans have no impact on net income as the investment results are recorded in equal amounts to both investment income and compensation and benefits expense.
Supplemental Savings Plan.
CME maintains a supplemental plan to provide benefits for employees who have been impacted by statutory limits under the provisions of the qualified pension and savings plan. Employees in this plan are subject to the vesting requirements of the underlying qualified plans.
Deferred Compensation Plan.
A deferred compensation plan is maintained by CME, under which eligible employees and members of the board of directors may contribute a percentage of their compensation and defer income taxes thereon until the time of distribution.
COMEX Members' Retirement Plan and Benefits.
COMEX maintains a non-qualified retirement and benefit plan under the COMEX MRRP. This plan provides benefits to certain members of the COMEX division based on long-term membership, and participation is limited to individuals who were COMEX division members prior to NYMEX's acquisition of COMEX in 1994. No new participants were permitted into the plan after the date of this acquisition. All benefits to be paid under the MRRP are based on reasonable actuarial assumptions which are based upon the amounts that are available and are expected to be available to pay benefits. There were no contributions to the plan in 2017. Total contributions to the plan were
$3.0 million
in 2016 and
$2.0 million
in 2015. At
December 31, 2017
and
2016
, the obligation for the MRRP totaled
$18.6 million
and
$19.4 million
, respectively. Assets with a fair value of
$21.6 million
and
$22.0 million
have been allocated to this plan at
December 31, 2017
and
2016
, respectively, and are included in marketable securities and cash and cash equivalents in the consolidated balance sheets. The balances in this plan are subject to the claims of general creditors of COMEX.
11. COMMITMENTS
Operating Leases.
CME Group has entered into various non-cancellable operating lease agreements, with the most significant being as follows:
|
•
|
In March 2016, the company sold its datacenter and leased back a portion of the property. The sale leaseback transaction was recognized under the financing method and not as a sale leaseback arrangement. The operating lease, which has an initial lease term ending in March 2031, contains
two
consecutive renewal options for
five
years.
|
|
•
|
In November 2013, the company sold a building in New York and leased back a portion of the property. The operating lease, which has an initial lease term ending on December 31, 2028, contains
two
consecutive renewal options for
five
years.
|
74
|
•
|
In April 2012, the company sold two buildings in Chicago at 141 W. Jackson and leased back a portion of the property. The operating lease, which has an initial lease term ending on April 30, 2027, contains
four
consecutive renewal options for
five
years.
|
|
•
|
In January 2011, the company entered into an operating lease for office space in London. The initial lease term terminates on March 24, 2026, with an option to terminate without penalty in January 2021.
|
|
•
|
The company maintains an operating lease for its headquarters at 20 South Wacker Drive in Chicago. In January 2018, the company signed a lease extension. The new lease expires in 2032 and contains
two
consecutive renewal options for
five
years each.
|
|
•
|
In August 2006, the company entered into an operating lease for additional office space in Chicago. The initial lease term ends on November 30, 2023. The lease contains
two
5
-year renewal options beginning in 2023.
|
At
December 31, 2017
, future minimum payments under non-cancellable operating leases were payable as follows (in millions):
|
Year
|
|
||
|
2018
|
$
|
64.3
|
|
|
2019
|
63.8
|
|
|
|
2020
|
61.6
|
|
|
|
2021
|
56.8
|
|
|
|
2022
|
56.5
|
|
|
|
Thereafter
|
435.2
|
|
|
|
Total
|
$
|
738.2
|
|
Total rental expense, including equipment rental, was
$41.7 million
in
2017
,
$47.9 million
in
2016
and
$54.8 million
in
2015
.
Other Commitments.
Commitments include material contractual purchase obligations that are non-cancellable. Purchase obligations relate to advertising, licensing, hardware, software and maintenance as well as telecommunication services. At
December 31, 2017
, future minimum payments due under purchase obligations were payable as follows (in millions):
|
Year
|
|
||
|
2018
|
$
|
23.8
|
|
|
2019
|
12.7
|
|
|
|
2020
|
11.0
|
|
|
|
2021
|
8.8
|
|
|
|
2022
|
6.5
|
|
|
|
Thereafter
|
5.4
|
|
|
|
Total
|
$
|
68.2
|
|
12. CONTINGENCIES
Legal and Regulatory Matters.
In 2013, the CFTC filed suit against NYMEX and two former employees alleging disclosure of confidential customer information in violation of the Commodity Exchange Act. NYMEX’s motion to dismiss was denied in 2014. Based on its investigation to date and advice from legal counsel, the company believes that it has strong factual and legal defenses to the claim.
In 2003, the U.S. Futures Exchange, L.L.C. (Eurex U.S.) and U.S. Exchange Holdings, Inc. filed suit in federal court alleging that CBOT and CME violated the antitrust laws and tortuously interfered with the business relationship and contract between Eurex U.S. and The Clearing Corporation. While the complaint requests treble damages, given the uncertainty of factors which may potentially impact the resolution of the matter, at this time the company is unable to estimate the reasonably possible loss or range of reasonably possible losses in the unlikely event it were found to be liable at trial in the matter. A trial date is set for June 4, 2018. Based on its investigation to date and advice from legal counsel, the company believes that it has strong factual and legal defenses to the claim.
75
In the normal course of business, the company discusses matters with its regulators raised during regulatory examinations or otherwise subject to their inquiry and oversight. These matters could result in censures, fines, penalties or other sanctions. Management believes the outcome of any resulting actions will not have a material impact on its consolidated financial position or results of operations. However, the company is unable to predict the outcome or the timing of the ultimate resolution of these matters, or the potential fines, penalties or injunctive or other equitable relief, if any, that may result from these matters.
In addition, the company is a defendant in, and has potential for, various other legal proceedings arising from its regular business activities. While the ultimate results of such proceedings against the company cannot be predicted with certainty, the company believes that the resolution of any of these matters on an individual or aggregate basis will not have a material impact on its consolidated financial position or results of operations.
No accrual was required for legal and regulatory matters that were probable and estimable as of December 31, 2017 and 2016.
Intellectual Property Indemnifications.
Certain agreements with customers and other third parties related to accessing the CME platforms, utilizing market data services and licensing CME SPAN software may contain indemnifications from intellectual property claims that may be made against them as a result of their use of the applicable products and/or services. The potential future claims relating to these indemnifications cannot be estimated and therefore no liability has been recorded.
13. GUARANTEES
Mutual Offset Agreement.
CME and Singapore Exchange Limited (SGX) have a mutual offset agreement with a current term through October 2018. This agreement enables market participants to open a futures position on one exchange and liquidate it on the other. The term of the agreement will automatically renew for a one-year period unless either party provides advance notice of its intent to terminate. CME can maintain collateral in the form of U.S. Treasury securities or irrevocable, standby letters of credit. At
December 31, 2017
, CME was contingently liable to SGX on irrevocable letters of credit totaling
$285.0 million
. Regardless of the collateral, CME guarantees all cleared transactions submitted through SGX and would initiate procedures designed to satisfy these financial obligations in the event of a default, such as the use of performance bonds and guaranty fund contributions of the defaulting clearing firm. The company believes that its guarantee liability is immaterial and therefore has not recorded any liability at
December 31, 2017
.
Family Farmer and Rancher Protection Fund.
In 2012, the company established the Family Farmer and Rancher Protection Fund (the Fund). The Fund is designed to provide payments, up to certain maximum levels, to family farmers, ranchers and other agricultural industry participants who use the company's agricultural products and who suffer losses to their segregated account balances due to their CME clearing member becoming insolvent. Under the terms of the Fund, farmers and ranchers are eligible for up to
$25,000
per participant. Farming and ranching cooperatives are eligible for up to
$100,000
per cooperative. The Fund has an aggregate maximum payment amount of
$100.0 million
. Since its establishment, the Fund has made payments of approximately
$2.0 million
, which leaves
$98.0 million
available for future claims. If payments to participants were to exceed this amount, payments would be pro-rated. Clearing members and customers must register in advance with the company and provide certain documentation in order to substantiate their eligibility. The company believes that its guarantee liability is immaterial and therefore has not recorded any liability at
December 31, 2017
.
14. CAPITAL STOCK
Shares Outstanding.
The following table presents information regarding capital stock:
|
|
December 31,
|
|||
|
(in thousands)
|
2017
|
2016
|
||
|
Class A common stock authorized
|
1,000,000
|
1,000,000
|
||
|
Class A common stock issued and outstanding
|
339,235
|
338,240
|
||
|
Class B-1 common stock authorized, issued and outstanding
|
0.6
|
0.6
|
||
|
Class B-2 common stock authorized, issued and outstanding
|
0.8
|
0.8
|
||
|
Class B-3 common stock authorized, issued and outstanding
|
1.3
|
1.3
|
||
|
Class B-4 common stock authorized, issued and outstanding
|
0.4
|
0.4
|
||
CME Group has no shares of preferred stock issued and outstanding.
Associated Trading Rights.
Members of CME, CBOT, NYMEX and COMEX own or lease trading rights which entitle them to access open outcry trading, discounts on trading fees and the right to vote on certain exchange matters as provided for by the rules of the particular exchange and CME Group's or the subsidiaries' organizational documents. Each class of CME Group Class B common stock is associated with a membership in a specific division for trading at CME. A CME trading right is a separate asset that is not part of or evidenced by the associated share of Class B common stock of CME Group. The Class B common stock of CME Group is intended only to ensure that the Class B shareholders of CME Group retain rights with respect to representation on the board of directors and approval rights with respect to the core rights described below.
76
Trading rights at CBOT are evidenced by Class B memberships in CBOT, at NYMEX by Class A memberships in NYMEX and at COMEX by COMEX Division Memberships. Members of CBOT, NYMEX and COMEX do not have any rights to elect members of the board of directors and are not entitled to receive dividends or other distributions on their memberships or trading permits.
Core Rights.
Holders of CME Group Class B common shares have the right to approve changes in specified rights relating to the trading privileges at CME associated with those shares. These core rights relate primarily to trading right protections, certain trading fee protections and certain membership benefit protections. Votes on changes to these core rights are weighted by class. Each class of Class B common stock has the following number of votes on matters relating to core rights: Class B-1,
six
votes per share; Class B-2,
two
votes per share; Class B-3,
one
vote per share; and Class B-4,
1/6
th of one vote per share. The approval of a majority of the votes cast by the holders of shares of Class B common stock is required in order to approve any changes to core rights. Holders of shares of Class A common stock do not have the right to vote on changes to core rights.
Voting Rights.
With the exception of the matters reserved to holders of CME Group Class B common stock, holders of CME Group common stock vote together on all matters for which a vote of common shareholders is required. In these votes, each holder of shares of Class A or Class B common stock of CME Group has
one
vote per share.
Transfer Restrictions.
Each class of CME Group Class B common stock is subject to transfer restrictions contained in the Certificate of Incorporation of CME Group. These transfer restrictions prohibit the sale or transfer of any shares of Class B common stock separate from the sale of the associated trading rights.
Election of Directors.
The CME Group Board of Directors is currently comprised of
20
members. Holders of Class B-1, Class B-2 and Class B-3 common stock have the right to elect
six
directors, of which
three
are elected by Class B-1 shareholders,
two
are elected by Class B-2 shareholders and
one
is elected by Class B-3 shareholders. The remaining directors are elected by the Class A and Class B shareholders voting as a single class.
Dividends.
Holders of Class A and Class B common stock of CME Group are entitled to receive proportionately such dividends, if any, as may be declared by the CME Group board of directors.
CME Group Omnibus Stock Plan.
CME Group has adopted an Omnibus Stock Plan under which stock-based awards may be made to employees. A total of
40.2 million
Class A common stock shares have been reserved for awards under the plan. Awards totaling
24.0 million
shares have been granted and are outstanding or have been exercised under this plan at
December 31, 2017
(note 15).
Director Stock Plan.
CME Group has adopted a Director Stock Plan under which awards are made to non-executive directors as part of their annual compensation. A total of
625,000
Class A shares have been reserved under this plan, and approximately
366,000
shares have been awarded through
December 31, 2017
.
Employee Stock Purchase Plan.
CME Group has adopted an Employee Stock Purchase Plan (ESPP) under which employees may purchase Class A shares at
90%
of the market value of the shares using after-tax payroll deductions. A total of
500,000
Class A shares have been reserved under this plan, of which approximately
260,000
shares have been purchased through
December 31, 2017
(note 15).
15. STOCK-BASED PAYMENTS
CME Group adopted an Omnibus Stock Plan under which stock-based awards may be made to employees. A total of
40.2 million
Class A shares have been reserved for awards under the plan. Awards totaling
24.0 million
shares have been granted and are outstanding or have been exercised under the plan as of
December 31, 2017
. Awards granted generally vest over a
four
-year period, with
25%
vesting one year after the grant date and on that same date in each of the following three years.
Total compensation expense for stock-based payments and total income tax benefit recognized in the consolidated statements of income for stock-based awards were as follows:
|
(in millions)
|
2017
|
2016
|
2015
|
|||||||||
|
Compensation expense
|
$
|
58.3
|
|
$
|
66.4
|
|
$
|
61.0
|
|
|||
|
Income tax benefit recognized
|
42.6
|
|
38.6
|
|
32.4
|
|
||||||
At
December 31, 2017
, there was
$106.6 million
of total unrecognized compensation expense related to employee stock-based compensation arrangements that had not yet vested. This expense is expected to be recognized over a weighted average period of
2.2
years.
77
Stock options have not been granted since 2012. The following table summarizes stock option activity for
2017
. Aggregate intrinsic value is in millions.
|
Number of Shares
|
Weighted
Average
Exercise
Price
|
Weighted Average Remaining Contractual Life (in years)
|
Aggregate Intrinsic Value
|
||||||||||
|
Outstanding at December 31, 2016
|
1,021,537
|
|
$
|
69
|
|
2.9
|
$
|
47.4
|
|
||||
|
Exercised
|
(443,911
|
)
|
83
|
|
|||||||||
|
Cancelled
|
(4,650
|
)
|
74
|
|
|||||||||
|
Outstanding at December 31, 2017
|
572,976
|
|
58
|
|
2.7
|
50.3
|
|
||||||
|
Exercisable at December 31, 2017
|
572,976
|
|
58
|
|
2.7
|
50.3
|
|
||||||
The total intrinsic value of options exercised during
2017
,
2016
and
2015
was
$20.4 million
,
$19.9 million
and
$29.5 million
, respectively.
In
2017
, the company granted
440,076
shares of restricted Class A common stock and
7,568
shares of restricted stock units. Restricted common stock and restricted stock units generally have a vesting period of
two
to
four
years. The fair value related to these grants was
$58.7 million
, which is recognized as compensation expense on an accelerated basis over the vesting period. Dividends are accrued on restricted Class A common stock and restricted stock units and are paid once the restricted stock vests. In
2017
, the company also granted
203,298
performance shares. The fair value related to these grants was
$25.3 million
, which is recognized as compensation expense on an accelerated and straight-lined basis over the vesting period. The vesting of these shares is contingent on meeting stated performance or market conditions.
The following table summarizes restricted stock, restricted stock units, and performance shares activity for
2017
:
|
Number of Shares
|
Weighted
Average
Grant Date
Fair Value
|
|||||
|
Outstanding at December 31, 2016
|
1,820,578
|
|
$
|
98
|
|
|
|
Granted
|
650,942
|
|
129
|
|
||
|
Vested
|
(510,590
|
)
|
87
|
|
||
|
Cancelled
|
(401,699
|
)
|
95
|
|
||
|
Outstanding at December 31, 2017
|
1,559,231
|
|
116
|
|
||
The total fair value of restricted stock, restricted stock units, and performance shares that vested during
2017
,
2016
and
2015
was
$66.0 million
,
$59.8 million
and
$43.3 million
, respectively.
Under the ESPP, eligible employees may acquire shares of Class A common stock using after-tax payroll deductions made during consecutive offering periods of approximately six months in duration. Shares are purchased at the end of each offering period at a price of
90%
of the closing price of the Class A common stock as reported on the NASDAQ Global Select Market. Compensation expense is recognized on the dates of purchase for the discount from the closing price. In
2017
,
2016
and
2015
, a total of
19,936
,
19,858
and
19,756
shares, respectively, of Class A common stock were issued to participating employees. These shares are subject to a six-month holding period. Annual expense of
$0.3 million
for the purchase discount was recognized in
2017
, and $0.2 million was recognized in both
2016
and
2015
.
Non-executive directors receive an annual award of Class A common stock with a value equal to
$100,000
. Non-executive directors may also elect to receive some or all of the cash portion of their annual stipend, up to
$60,000
, in shares of stock based on the closing price at the date of distribution. As a result,
19,736
shares,
26,439
shares and
25,853
shares of Class A common stock were issued to non-executive directors during
2017
,
2016
and
2015
, respectively. These shares are not subject to any vesting restrictions. Expense of
$2.5 million
,
$2.4 million
and
$2.5 million
related to these stock-based payments was recognized for the years ended
December 31, 2017
,
2016
and
2015
, respectively.
78
16. ACCUMULATED OTHER COMPREHENSIVE INCOME (LOSS)
The following tables present changes in the accumulated balances for each component of other comprehensive income (loss), including current period other comprehensive income and reclassifications out of accumulated other comprehensive income (loss):
|
(in millions)
|
Investment Securities
|
Defined Benefit Plans
|
Derivative Investments
|
Foreign Currency Translation
|
Total
|
||||||||||||||
|
Balance at December 31, 2016
|
$
|
(19.5
|
)
|
$
|
(37.8
|
)
|
$
|
58.9
|
|
$
|
(15.7
|
)
|
$
|
(14.1
|
)
|
||||
|
Other comprehensive income before reclassifications and income tax benefit (expense)
|
30.2
|
|
0.3
|
|
—
|
|
10.4
|
|
40.9
|
|
|||||||||
|
Amounts reclassified from accumulated other comprehensive income
|
(89.5
|
)
|
2.9
|
|
(1.2
|
)
|
—
|
|
(87.8
|
)
|
|||||||||
|
Income tax benefit (expense)
|
79.4
|
|
(1.5
|
)
|
0.3
|
|
(2.9
|
)
|
75.3
|
|
|||||||||
|
Net current period other comprehensive income
|
20.1
|
|
1.7
|
|
(0.9
|
)
|
7.5
|
|
28.4
|
|
|||||||||
|
Balance at December 31, 2017
|
$
|
0.6
|
|
$
|
(36.1
|
)
|
$
|
58.0
|
|
$
|
(8.2
|
)
|
$
|
14.3
|
|
||||
|
(in millions)
|
Investment Securities
|
Defined Benefit Plans
|
Derivative Investments
|
Foreign Currency Translation
|
Total
|
||||||||||||||
|
Balance at December 31, 2015
|
$
|
(95.0
|
)
|
$
|
(36.6
|
)
|
$
|
59.6
|
|
$
|
(8.8
|
)
|
$
|
(80.8
|
)
|
||||
|
Other comprehensive income before reclassifications and income tax benefit (expense)
|
170.0
|
|
(5.1
|
)
|
—
|
|
(8.2
|
)
|
156.7
|
|
|||||||||
|
Amounts reclassified from accumulated other comprehensive income
|
(48.7
|
)
|
3.2
|
|
(1.2
|
)
|
—
|
|
(46.7
|
)
|
|||||||||
|
Income tax benefit (expense)
|
(45.8
|
)
|
0.7
|
|
0.5
|
|
1.3
|
|
(43.3
|
)
|
|||||||||
|
Net current period other comprehensive income
|
75.5
|
|
(1.2
|
)
|
(0.7
|
)
|
(6.9
|
)
|
66.7
|
|
|||||||||
|
Balance at December 31, 2016
|
$
|
(19.5
|
)
|
$
|
(37.8
|
)
|
$
|
58.9
|
|
$
|
(15.7
|
)
|
$
|
(14.1
|
)
|
||||
|
(in millions)
|
Investment Securities
|
Defined Benefit Plans
|
Derivative Investments
|
Foreign Currency Translation
|
Total
|
||||||||||||||
|
Balance at December 31, 2014
|
$
|
(22.9
|
)
|
$
|
(31.3
|
)
|
$
|
62.6
|
|
$
|
(2.2
|
)
|
$
|
6.2
|
|
||||
|
Other comprehensive income before reclassifications and income tax benefit (expense)
|
(78.0
|
)
|
(11.2
|
)
|
(4.7
|
)
|
(10.6
|
)
|
(104.5
|
)
|
|||||||||
|
Amounts reclassified from accumulated other comprehensive income
|
8.5
|
|
2.7
|
|
0.6
|
|
—
|
|
11.8
|
|
|||||||||
|
Income tax benefit (expense)
|
(2.6
|
)
|
3.2
|
|
1.1
|
|
4.0
|
|
5.7
|
|
|||||||||
|
Net current period other comprehensive income
|
(72.1
|
)
|
(5.3
|
)
|
(3.0
|
)
|
(6.6
|
)
|
(87.0
|
)
|
|||||||||
|
Balance at December 31, 2015
|
$
|
(95.0
|
)
|
$
|
(36.6
|
)
|
$
|
59.6
|
|
$
|
(8.8
|
)
|
$
|
(80.8
|
)
|
||||
17. FAIR VALUE MEASUREMENTS
The company uses a three-level classification hierarchy of fair value measurements for disclosure purposes.
|
•
|
Level 1 inputs, which are considered the most reliable evidence of fair value, consist of quoted prices (unadjusted) for identical assets or liabilities in active markets.
|
|
•
|
Level 2 inputs consist of observable market data, other than level 1 inputs, such as quoted prices for similar assets and liabilities in active markets or inputs other than quoted prices that are directly observable.
|
|
•
|
Level 3 inputs consist of unobservable inputs which are derived and cannot be corroborated by market data or other entity-specific inputs.
|
79
Level 1 assets generally include U.S. Treasury securities, U.S. government agency securities, investments in publicly traded mutual funds, equity securities and corporate debt securities with quoted market prices. In general, the company uses quoted prices in active markets for identical assets to determine the fair value of marketable securities and equity investments. If quoted prices are not available to determine fair value, the company uses other inputs that are directly observable.
Assets included in level 2 generally consist of asset-backed securities. Asset-backed securities were measured at fair value based on matrix pricing using prices of similar securities with similar inputs such as maturity dates, interest rates and credit ratings.
Financial assets and liabilities recorded at fair value in the consolidated balance sheets as of
December 31, 2017
and
2016
were classified in their entirety based on the lowest level of input that was significant to each asset or liability's fair value measurement.
Financial Instruments Measured at Fair Value on a Recurring Basis:
|
|
December 31, 2017
|
|||||||||||||||
|
(in millions)
|
Level 1
|
Level 2
|
Level 3
|
Total
|
||||||||||||
|
Assets at Fair Value:
|
||||||||||||||||
|
Marketable securities:
|
||||||||||||||||
|
Corporate debt securities
|
$
|
20.8
|
|
$
|
—
|
|
$
|
—
|
|
$
|
20.8
|
|
||||
|
Mutual funds
|
68.9
|
|
—
|
|
—
|
|
68.9
|
|
||||||||
|
Equity securities
|
0.1
|
|
—
|
|
—
|
|
0.1
|
|
||||||||
|
Asset-backed securities
|
—
|
|
0.3
|
|
—
|
|
0.3
|
|
||||||||
|
Total Marketable Securities
|
89.8
|
|
0.3
|
|
—
|
|
90.1
|
|
||||||||
|
Total Assets at Fair Value
|
$
|
89.8
|
|
$
|
0.3
|
|
$
|
—
|
|
$
|
90.1
|
|
||||
|
|
December 31, 2016
|
|||||||||||||||
|
(in millions)
|
Level 1
|
Level 2
|
Level 3
|
Total
|
||||||||||||
|
Assets at Fair Value:
|
||||||||||||||||
|
Marketable securities:
|
||||||||||||||||
|
Corporate debt securities
|
$
|
20.2
|
|
$
|
—
|
|
$
|
—
|
|
$
|
20.2
|
|
||||
|
Mutual funds
|
62.7
|
|
—
|
|
—
|
|
62.7
|
|
||||||||
|
Equity securities
|
0.1
|
|
—
|
|
—
|
|
0.1
|
|
||||||||
|
Asset-backed securities
|
—
|
|
0.3
|
|
—
|
|
0.3
|
|
||||||||
|
Total Marketable Securities
|
83.0
|
|
0.3
|
|
—
|
|
83.3
|
|
||||||||
|
Performance bonds and guaranty fund contributions
(1)
:
|
||||||||||||||||
|
U.S. Treasury securities
|
5,549.0
|
|
—
|
|
—
|
|
5,549.0
|
|
||||||||
|
U.S. government agencies securities
|
1,228.3
|
|
—
|
|
—
|
|
1,228.3
|
|
||||||||
|
Equity investments
|
234.1
|
|
—
|
|
—
|
|
234.1
|
|
||||||||
|
Total Assets at Fair Value
|
$
|
7,094.4
|
|
$
|
0.3
|
|
$
|
—
|
|
$
|
7,094.7
|
|
||||
(1) Performance bonds and guaranty fund contributions on the consolidated balance sheet at December 31, 2016 include cash collateral that has been invested in U.S. Treasury securities and U.S. government agencies securities.
There were no transfers of assets between level 1, level 2 and level 3 during
2017
and
2016
. There were no level 3 assets or liabilities valued at fair value on a recurring basis during
2017
and
2016
.
80
The following is a reconciliation of level 3 liabilities valued at fair value on a recurring basis during
2017
and
2016
.
|
(in millions)
|
Contingent Consideration
|
||
|
Fair Value of Liability at December 31, 2015
|
$
|
0.3
|
|
|
Realized and unrealized gains (losses):
|
|||
|
Included in other expense
|
(0.3
|
)
|
|
|
Fair Value of Liability at December 31, 2016
|
—
|
|
|
|
Realized and unrealized gains (losses):
|
|||
|
Included in other expense
|
—
|
|
|
|
Fair Value of Liability at December 31, 2017
|
$
|
—
|
|
In the first quarter of 2016, the company sold a datacenter and leased back a portion of the property. Under generally accepted accounting principles, the transaction has been recognized under the financing method instead of recognized as a sale leaseback arrangement. As a result, the property and equipment legally sold will continue to be recognized on the consolidated balance sheets and was written down to a fair value of
$130.0 million
at March 31, 2016. During 2016, the company also recorded impairment charges totaling
$5.5 million
on one of its strategic investments. The fair value of the investment was estimated to be
zero
at September 30, 2016. Both assessments were based on qualitative indications of impairment and a quantitative analysis of undiscounted cash flows. The fair values of the datacenter and strategic investment are considered level 3 and nonrecurring. There were no other level 3 assets or liabilities valued at fair value on a nonrecurring basis during 2017 and 2016.
The following presents the estimated fair values of long-term debt notes, which are carried at amortized cost on the consolidated balance sheets. The fair values, which are classified as level 2 under the fair value hierarchy, were estimated using quoted market prices. At
December 31, 2017
, the fair values were as follows:
|
(in millions)
|
Fair Value
|
|||
|
$750.0 million fixed rate notes due September 2022, stated rate of 3.00%
|
$
|
764.9
|
|
|
|
$750.0 million fixed rate notes due March 2025, stated rate of 3.00%
|
758.2
|
|
||
|
$750.0 million fixed rates notes due September 2043, stated rate of 5.30%
|
960.0
|
|
||
18. EARNINGS PER SHARE
Basic earnings per share is computed by dividing net income by the weighted average number of shares of all classes of common stock outstanding for each reporting period. Diluted earnings per share reflects the increase in shares using the treasury stock method to reflect the impact of an equivalent number of shares of common stock if stock options were exercised and restricted stock awards were converted into common stock. Anti-dilutive stock options and stock awards were as follows for the years presented:
|
(in thousands)
|
2017
|
2016
|
2015
|
|||||
|
Stock options
|
—
|
|
171
|
|
420
|
|
||
|
Stock awards
|
104
|
|
138
|
|
115
|
|
||
|
Total
|
104
|
|
309
|
|
|
535
|
|
|
The following table presents the earnings per share calculation for the years presented:
|
2017
|
2016
|
2015
|
|||||||||
|
Net Income (in millions)
|
$
|
4,063.4
|
|
$
|
1,534.1
|
|
$
|
1,247.0
|
|
||
|
Weighted Average Common Shares Outstanding (in thousands):
|
|||||||||||
|
Basic
|
338,707
|
|
337,496
|
|
336,224
|
|
|||||
|
Effect of stock options and stock awards
|
1,519
|
|
1,470
|
|
1,670
|
|
|||||
|
Diluted
|
340,226
|
|
338,966
|
|
337,894
|
|
|||||
|
Earnings per Common Share:
|
|||||||||||
|
Basic
|
$
|
12.00
|
|
$
|
4.55
|
|
$
|
3.71
|
|
||
|
Diluted
|
11.94
|
|
4.53
|
|
3.69
|
|
|||||
81
19. QUARTERLY INFORMATION (UNAUDITED)
|
(in millions, except per share data)
|
First
Quarter
|
Second
Quarter
|
Third
Quarter
|
Fourth
Quarter
|
Year to Date
|
|||||||||||||||
|
Year Ended December 31, 2017
|
||||||||||||||||||||
|
Total revenues
|
$
|
929.3
|
|
$
|
924.6
|
|
$
|
890.8
|
|
$
|
900.0
|
|
$
|
3,644.7
|
|
|||||
|
Operating income
|
601.2
|
|
605.6
|
|
567.9
|
|
537.3
|
|
2,312.0
|
|
||||||||||
|
Non-operating income (expense)
|
105.8
|
|
31.7
|
|
39.4
|
|
37.4
|
|
214.3
|
|
||||||||||
|
Income before income taxes
|
707.0
|
|
637.3
|
|
607.3
|
|
574.7
|
|
2,526.3
|
|
||||||||||
|
Net income
|
399.8
|
|
415.8
|
|
308.6
|
|
2,939.2
|
|
4,063.4
|
|
||||||||||
|
Earnings per common share:
|
||||||||||||||||||||
|
Basic
|
$
|
1.18
|
|
$
|
1.23
|
|
$
|
0.91
|
|
$
|
8.67
|
|
$
|
12.00
|
|
|||||
|
Diluted
|
1.18
|
|
1.22
|
|
0.91
|
|
8.63
|
|
11.94
|
|
||||||||||
|
Year Ended December 31, 2016
|
||||||||||||||||||||
|
Total revenues
|
$
|
934.2
|
|
$
|
906.4
|
|
$
|
841.7
|
|
$
|
912.9
|
|
$
|
3,595.2
|
|
|||||
|
Operating income
|
573.9
|
|
563.3
|
|
525.3
|
|
540.2
|
|
2,202.7
|
|
||||||||||
|
Non-operating income (expense)
|
4.6
|
|
2.8
|
|
23.5
|
|
54.0
|
|
84.9
|
|
||||||||||
|
Income before income taxes
|
578.5
|
|
566.1
|
|
548.8
|
|
594.2
|
|
2,287.6
|
|
||||||||||
|
Net income
|
367.8
|
|
320.1
|
|
472.8
|
|
373.4
|
|
1,534.1
|
|
||||||||||
|
Earnings per common share:
|
||||||||||||||||||||
|
Basic
|
$
|
1.09
|
|
$
|
0.95
|
|
$
|
1.40
|
|
$
|
1.10
|
|
$
|
4.55
|
|
|||||
|
Diluted
|
1.09
|
|
0.95
|
|
1.39
|
|
1.10
|
|
4.53
|
|
||||||||||
20. SUBSEQUENT EVENTS
The company has evaluated subsequent events through the date the financial statements were issued. The company has determined that there were no subsequent events that require disclosure.
82
|
ITEM 9.
|
CHANGES IN AND DISAGREEMENTS WITH ACCOUNTANTS ON ACCOUNTING AND FINANCIAL DISCLOSURE
|
Not applicable.
|
ITEM 9A.
|
CONTROLS AND PROCEDURES
|
Evaluation of Disclosure Controls and Procedures
Our management, with the participation of our Chief Executive Officer and Chief Financial Officer, has evaluated the effectiveness of our disclosure controls and procedures (as such term is defined in Rules 13a-15(e) and 15d-15(e) under the Securities Exchange Act of 1934, as amended (Exchange Act)) as of the end of the period covered by this Annual Report on Form 10-K. Based on such evaluation, our Chief Executive Officer and Chief Financial Officer have concluded that, as of the end of such period, our disclosure controls and procedures are effective.
Changes in Internal Control over Financial Reporting
As required by Rule 13a-15(d) under the Exchange Act, the company's management, including the company's Chief Executive Officer and Chief Financial Officer, have evaluated the company's internal control over financial reporting (as such term is defined in Rules 13a-15(f) and 15d-15(f) under the Exchange Act) to determine whether any changes occurred during the fourth quarter of 2017 that have materially affected, or are reasonably likely to materially affect, the company's internal control over financial reporting. During 2017, we completed the implementation of our new enterprise resource planning (ERP) system. The company has evaluated the impact of the system on its internal control over financial reporting and where appropriate, made changes to these controls to address related system functionality and potential gaps. There were no other changes in the company’s internal control over financial reporting which occurred during 2017, that have materially affected, or are reasonably likely to materially affect, the company’s internal control over financial reporting.
Management’s Annual Report on Internal Control over Financial Reporting
Management is responsible for establishing and maintaining adequate internal control over financial reporting. Our internal control system has been designed to provide reasonable assurance to management and the board of directors regarding the preparation and fair presentation of published financial statements.
Management assessed the effectiveness of the Company’s internal control over financial reporting as of
December 31, 2017
. Management based its assessment on criteria for effective internal control over financial reporting described in Internal Control-Integrated Framework issued by the Committee of Sponsoring Organizations of the Treadway Commission (2013 framework). Management’s assessment included evaluating the design of our internal control over financial reporting and testing the operational effectiveness of our internal control over financial reporting. The results of its assessment were reviewed with the audit committee of the board of directors.
Based on this assessment, management believes that, as of
December 31, 2017
, our internal control over financial reporting is effective. The effectiveness of our internal control over financial reporting as of
December 31, 2017
has been audited by Ernst & Young LLP, an independent registered public accounting firm, as stated in the report on page 84.
83
REPORT OF INDEPENDENT REGISTERED PUBLIC ACCOUNTING FIRM
To the Shareholders and the Board of Directors of CME Group Inc. and Subsidiaries
Opinion on the Financial Statements
We have audited the accompanying consolidated balance sheets of CME Group Inc. and subsidiaries (the Company) as of December 31, 2017 and 2016, the related consolidated statements of income, comprehensive income, equity and cash flows for each of the three years in the period ended December 31, 2017, and the related notes and financial statement schedule listed in the Index at Item 15(a) (collectively referred to as the “consolidated financial statements”). In our opinion, the consolidated financial statements present fairly, in all material respects, the financial position of the Company at December 31, 2017 and 2016, and the results of its operations and its cash flows for each of the three years in the period ended December 31, 2017, in conformity with U.S. generally accepted accounting principles.
We also have audited, in accordance with the standards of the Public Company Accounting Oversight Board (United States) (PCAOB), the Company’s internal control over financial reporting as of December 31, 2017, based on criteria established in Internal Control-Integrated Framework issued by the Committee of Sponsoring Organizations of the Treadway Commission (2013 framework
)
and our report dated February 28, 2018 expressed an unqualified opinion thereon.
Basis for Opinion
These financial statements are the responsibility of the Company’s management. Our responsibility is to express an opinion on the Company’s financial statements based on our audits. We are a public accounting firm registered with the PCAOB and are required to be independent with respect to the Company in accordance with the U.S. federal securities laws and the applicable rules and regulations of the Securities and Exchange Commission and the PCAOB.
We conducted our audits in accordance with the standards of the PCAOB. Those standards require that we plan and perform the audit to obtain reasonable assurance about whether the financial statements are free of material misstatement, whether due to error or fraud. Our audits included performing procedures to assess the risks of material misstatement of the financial statements, whether due to error or fraud, and performing procedures that respond to those risks. Such procedures included examining, on a test basis, evidence regarding the amounts and disclosures in the financial statements. Our audits also included evaluating the accounting principles used and significant estimates made by management, as well as evaluating the overall presentation of the financial statements. We believe that our audits provide a reasonable basis for our opinion.
/s/ Ernst & Young LLP
We have served as the Company’s auditor since 2002.
Chicago, Illinois
February 28, 2018
84
REPORT OF INDEPENDENT REGISTERED PUBLIC ACCOUNTING FIRM
To the Shareholders and the Board of Directors of CME Group Inc. and Subsidiaries
Opinion on Internal Control over Financial Reporting
We have audited CME Group Inc. and subsidiaries’ internal control over financial reporting as of December 31, 2017, based on criteria established in Internal Control-Integrated Framework issued by the Committee of Sponsoring Organizations of the Treadway Commission (2013 framework) (the COSO criteria). In our opinion, CME Group Inc. and subsidiaries (the Company) maintained, in all material respects, effective internal control over financial reporting as December 31, 2017, based on the COSO criteria.
We also have audited, in accordance with the standards of the Public Company Accounting Oversight Board (United States) (PCAOB), the consolidated balance sheets of CME Group Inc. and subsidiaries as of December 31, 2017 and 2016, the related consolidated statements of income, comprehensive income, equity, and cash flows for each of the three years in the period ended December 31, 2017, and the related notes and financial statement schedule listed in the Index at Item 15(a) and our report dated February 28, 2018 expressed an unqualified opinion thereon.
Basis for Opinion
The Company’s management is responsible for maintaining effective internal control over financial reporting and for its assessment of the effectiveness of internal control over financial reporting included in the accompanying Management’s Annual Report on Internal Control over Financial Reporting. Our responsibility is to express an opinion on the Company’s internal control over financial reporting based on our audit. We are a public accounting firm registered with the PCAOB and are required to be independent with respect to the Company in accordance with the U.S. federal securities laws and the applicable rules and regulations of the Securities and Exchange Commission and the PCAOB.
We conducted our audit in accordance with the standards of the PCAOB. Those standards require that we plan and perform the audit to obtain reasonable assurance about whether effective internal control over financial reporting was maintained in all material respects.
Our audit included obtaining an understanding of internal control over financial reporting, assessing the risk that a material weakness exists, testing and evaluating the design and operating effectiveness of internal control based on the assessed risk, and performing such other procedures as we considered necessary in the circumstances. We believe that our audit provides a reasonable basis for our opinion.
Definition and Limitations of Internal Control Over Financial Reporting
A company’s internal control over financial reporting is a process designed to provide reasonable assurance regarding the reliability of financial reporting and the preparation of financial statements for external purposes in accordance with generally accepted accounting principles. A company’s internal control over financial reporting includes those policies and procedures that (1) pertain to the maintenance of records that, in reasonable detail, accurately and fairly reflect the transactions and dispositions of the assets of the company; (2) provide reasonable assurance that transactions are recorded as necessary to permit preparation of financial statements in accordance with generally accepted accounting principles, and that receipts and expenditures of the company are being made only in accordance with authorizations of management and directors of the company; and (3) provide reasonable assurance regarding prevention or timely detection of unauthorized acquisition, use, or disposition of the company’s assets that could have a material effect on the financial statements.
Because of its inherent limitations, internal control over financial reporting may not prevent or detect misstatements. Also, projections of any evaluation of effectiveness to future periods are subject to the risk that controls may become inadequate because of changes in conditions, or that the degree of compliance with the policies or procedures may deteriorate.
/s/ Ernst & Young LLP
Chicago, Illinois
February 28, 2018
85
|
ITEM 9B.
|
OTHER INFORMATION
|
Not applicable.
|
ITEM 10.
|
DIRECTORS, EXECUTIVE OFFICERS AND CORPORATE GOVERNANCE
|
We have adopted a written code of conduct applicable to all of our employees, including our Chairman and Chief Executive Officer, President, Chief Financial Officer, Chief Accounting Officer and other senior financial officers. In accordance with SEC rules and regulations, our Code of Conduct is available on our website at
www.cmegroup.com
under the "Investor Relations — Corporate Governance" link. We intend to disclose promptly on our Web site any substantive amendments to our Code of Conduct and, in accordance with the listing requirements of the NASDAQ, any waivers granted to our executive officers or Board members will be promptly disclosed on a Current Report on Form 8-K. In addition, we have adopted Corporate Governance Principles which govern the practices of our board of directors. You may also obtain a copy of our Code of Conduct and our Corporate Governance Principles by following the instructions in the section of this Annual Report on Form 10-K entitled "Item 1. Business — Available Information."
Certain of the information called for by this item is hereby incorporated herein by reference to the relevant portions of CME Group’s definitive proxy statement for the Annual Meeting of Shareholders to be held on May 9, 2018, to be filed by CME Group with the SEC pursuant to Regulation 14A within 120 days after December 31, 2017 (Proxy Statement). Additional information called for by this item is contained in Item 1 of this Annual Report on Form 10-K under the caption "Employees — Executive Officers."
|
ITEM 11.
|
EXECUTIVE COMPENSATION
|
Certain of the information called for by this item is hereby incorporated herein by reference to the relevant portions of the Proxy Statement.
|
ITEM 12.
|
SECURITY OWNERSHIP OF CERTAIN BENEFICIAL OWNERS AND MANAGEMENT AND RELATED SHAREHOLDER MATTERS
|
Certain of the information called for by this item relating to the security ownership of certain beneficial owners and management is hereby incorporated herein by reference to the relevant portions of the Proxy Statement.
EQUITY COMPENSATION PLAN INFORMATION
We currently maintain the following equity compensation plans: CME Group Inc. Amended and Restated Omnibus Stock Plan, CME Group Inc. Director Stock Plan and CME Group Inc. Amended and Restated Employee Stock Purchase Plan. We do not maintain any equity compensation plans not approved by shareholders. A description of each of these plans and the number of shares authorized and available for future awards is included in note 15 of the notes to consolidated financial statements. The numbers in the following table are as of December 31, 2017.
|
Plan Category
|
Number of Securities
to be Issued Upon
Exercise of Outstanding Options (a)
|
Weighted-Average Exercise Price of Outstanding Options
|
Number of Securities Remaining Available for Future Issuance Under Equity Compensation Plans (excluding securities reflected in column (a))
|
||||
|
Equity compensation plans approved by security holders
|
572,976
|
|
$
|
58.20
|
|
16,776,402
|
|
|
Equity compensation plans not approved by security holders
|
—
|
|
—
|
|
—
|
|
|
|
Total
|
572,976
|
|
16,776,402
|
|
|||
|
ITEM 13.
|
CERTAIN RELATIONSHIPS, RELATED TRANSACTIONS AND DIRECTOR INDEPENDENCE
|
Certain of the information called for by this item is hereby incorporated herein by reference to the relevant portions of the Proxy Statement.
|
ITEM 14.
|
PRINCIPAL ACCOUNTANT FEES AND SERVICES
|
Certain of the information called for by this item is hereby incorporated herein by reference to the relevant portions of the Proxy Statement.
86
|
ITEM 15.
|
EXHIBITS AND FINANCIAL STATEMENT SCHEDULES
|
(a) Financial Statements, Financial Statement Schedules and Exhibits
(1) Financial Statements
The following Consolidated Financial Statements and related Notes included within Item 8, together with the Reports of Independent Registered Public Accounting Firm with respect thereto and included within Item 9A, are hereby incorporated by reference:
Reports of Independent Registered Public Accounting Firm
Consolidated Balance Sheets at December 31,
2017
and
2016
Consolidated Statements of Income for the Years Ended December 31,
2017
,
2016
and
2015
Consolidated Statements of Comprehensive Income for the Years Ended December 31,
2017
,
2016
and
2015
Consolidated Statements of Equity for the Years Ended December 31,
2017
,
2016
and
2015
Consolidated Statements of Cash Flows for the Years Ended December 31,
2017
,
2016
and
2015
Notes to Consolidated Financial Statements
(2) Financial Statement Schedules
The following Financial Statement Schedule is filed as part of this Annual Report on Form 10-K:
CME Group Inc. and Subsidiaries
Schedule II—Valuation and Qualifying Accounts
For the Years Ended December 31,
2017
,
2016
and
2015
(dollars in millions)
|
Balance at
beginning
of year
|
Charged
(credited) to
costs and
expenses
|
Other
(1)
|
Balance
at end
of year
|
||||||||||||
|
Year Ended December 31, 2017
|
|||||||||||||||
|
Allowance for doubtful accounts
|
$
|
3.5
|
|
$
|
0.6
|
|
$
|
(1.9
|
)
|
$
|
2.2
|
|
|||
|
Allowance for deferred tax assets
|
14.9
|
|
(3.7
|
)
|
—
|
|
11.2
|
|
|||||||
|
Year Ended December 31, 2016
|
|||||||||||||||
|
Allowance for doubtful accounts
|
$
|
1.9
|
|
$
|
2.4
|
|
$
|
(0.8
|
)
|
$
|
3.5
|
|
|||
|
Allowance for deferred tax assets
|
122.3
|
|
(107.4
|
)
|
—
|
|
14.9
|
|
|||||||
|
Year Ended December 31, 2015
|
|||||||||||||||
|
Allowance for doubtful accounts
|
$
|
1.2
|
|
$
|
1.1
|
|
$
|
(0.4
|
)
|
$
|
1.9
|
|
|||
|
Allowance for deferred tax assets
|
99.2
|
|
(2.4
|
)
|
25.5
|
|
122.3
|
|
|||||||
_______________
|
(1)
|
Includes write-offs of doubtful accounts and additions to allowance for deferred tax assets through accumulated other comprehensive income (loss).
|
All other schedules have been omitted because the information required to be set forth in those schedules is not applicable or is shown in the consolidated financial statements or notes thereto.
|
(3)
|
Exhibits
|
See (b) Exhibits below
87
(b) Exhibits
|
Exhibit
Number
|
Description of Exhibit
|
|
|
3.
|
Articles of Incorporation and Bylaws
|
|
|
3.1
|
||
|
3.2
|
||
|
4.
|
Instruments Defining the Rights of Security Holders
|
|
|
4.1
|
||
|
4.2
|
||
|
4.3
|
||
|
4.4
|
||
|
4.5
|
||
|
4.6
|
||
|
4.7
|
||
|
4.8
|
||
|
10.
|
Material Contracts
|
|
|
10.1(1)
|
||
|
10.2(1)*
|
||
|
10.3(1)*
|
||
|
10.4(1)
|
||
|
10.5(1)*
|
||
|
10.6(1)
|
CME Group Inc.'s Amended and Restated Employee Stock Purchase Plan, amended and restated as of May 23, 2012 (incorporated by reference to Exhibit 10.2 to CME Group Inc.'s Form 8-K, filed with the SEC on May 29, 2012
;
First Amendment to the Amended and Restated Employee Stock Purchase Plan, effective as of December 5, 2012 (incorporated by reference to Exhibit 10.7 to CME Group Inc.'s Form 10-K, filed with the SEC on February 28, 2013).
|
|
88
89
_______________
|
*
|
Filed herewith.
|
|
(1)
|
Management contract or compensatory plan or arrangement.
|
|
(2)
|
Confidential treatment pursuant to Rule 406 of the Securities Act has been previously granted by the SEC for portions of this exhibit.
|
90
None.
91
SIGNATURES
Pursuant to the requirements of Section 13 or 15(d) of the Securities Exchange Act of 1934, the registrant has duly caused this report to be signed on its behalf by the undersigned, thereunto duly authorized, in the City of Chicago and State of Illinois on the
28th
day of
February, 2018
.
|
CME Group Inc.
|
|||
|
By:
|
|
/
S
/ J
OHN
W. P
IETROWICZ
|
|
|
|
John W. Pietrowicz
Senior Managing Director and Chief Financial Officer
|
||
|
Signature
|
|
Title
|
|
/
S
/ TERRENCE A. DUFFY
|
|
Chairman of the Board, Director and Chief Executive Officer
|
|
Terrence A. Duffy
|
||
|
/
S
/ JOHN W. PIETROWICZ
|
|
Senior Managing Director and Chief Financial Officer
|
|
John W. Pietrowicz
|
||
|
/
S
/ JACK TOBIN
|
|
Managing Director and Chief Accounting Officer
|
|
Jack Tobin
|
||
|
/
S
/ LEO MELAMED
|
|
Chairman Emeritus and Director
|
|
Leo Melamed
|
||
|
/
S
/ JEFFREY M. BERNACCHI
|
|
Director
|
|
Jeffrey M. Bernacchi
|
||
|
/
S
/ TIMOTHY S. BITSBERGER
|
|
Director
|
|
Timothy S. Bitsberger
|
||
|
/
S
/ CHARLES P. CAREY
|
Director
|
|
|
Charles P. Carey
|
||
|
/
S
/ DENNIS H. CHOOKASZIAN
|
|
Director
|
|
Dennis H. Chookaszian
|
||
|
/s/ ANA DUTRA
|
Director
|
|
|
Ana Dutra
|
||
|
/
S
/ MARTIN J. GEPSMAN
|
|
Director
|
|
Martin J. Gepsman
|
||
|
/
S
/ LARRY G. GERDES
|
|
Lead Director
|
|
Larry G. Gerdes
|
||
|
/
S
/ DANIEL R. GLICKMAN
|
|
Director
|
|
Daniel R. Glickman
|
||
|
/s/ GEDON HERTSHTEN
|
Director
|
|
|
Gedon Hertshten
|
||
|
/
S
/ RONALD A. PANKAU
|
|
Director
|
|
Ronald A. Pankau
|
||
|
/s/ ALEX J. POLLOCK
|
|
Director
|
|
Alex J. Pollock
|
||
92
|
/
S
/ JOHN F. SANDNER
|
|
Director
|
|
John F. Sandner
|
||
|
/S/ TERRY L. SAVAGE
|
Director
|
|
|
Terry L. Savage
|
||
|
/
S
/ WILLIAM R. SHEPARD
|
|
Director
|
|
William R. Shepard
|
||
|
/
S
/ HOWARD J. SIEGEL
|
Director
|
|
|
Howard J. Siegel
|
||
|
/
S
/ DENNIS A. SUSKIND
|
|
Director
|
|
Dennis A. Suskind
|
||
|
/
S
/ DAVID J. WESCOTT
|
|
Director
|
|
David J. Wescott
|
||
93
TABLE OF CONTENTS
Part IItem 1. BusinessItem 1A. Risk FactorsItem 1B. Unresolved Staff CommentsItem 2. PropertiesItem 3. Legal ProceedingsItem 4. Mine Safety DisclosuresPart IIItem 5. Market For Registrant S Common Equity, Related Stockholder Matters and Issuer Purchases Of Equity SecuritiesItem 6. Selected Financial DataItem 7. Management S Discussion and Analysis Of Financial Condition and Results Of OperationsItem 7A. Quantitative and Qualitative Disclosures About Market RiskItem 8. Financial Statements and Supplementary DataItem 9. Changes in and Disagreements with Accountants on Accounting and Financial DisclosureItem 9A. Controls and ProceduresItem 9B. Other InformationPart IIIItem 10. Directors, Executive Officers and Corporate GovernanceItem 11. Executive CompensationItem 12. Security Ownership Of Certain Beneficial Owners and Management and Related Shareholder MattersItem 13. Certain Relationships, Related Transactions and Director IndependenceItem 14. Principal Accountant Fees and ServicesPart IVItem 15. Exhibits and Financial Statement SchedulesItem 16. Form 10-k Summary