CUMULUS MEDIA INC
10-Ks and 10-Qs
|
|
|
|
|
|
|
|
|
|
|
|
|
|
|
|
|
|
|
|
|
|
|
|
|
|
|
|
|
|
|
|
|
|
|
|
|
|
|
|
|
|
|
|
|
|
|
|
|
|
|
|
|
|
|
|
UNITED STATES
SECURITIES AND EXCHANGE COMMISSION
Washington, D.C. 20549
Form 10-K
|
þ
|
ANNUAL REPORT PURSUANT TO SECTION 13 OR 15(d) OF THE SECURITIES EXCHANGE ACT OF 1934
|
For the fiscal year ended
December 31, 2018
|
¨
|
TRANSITION REPORT PURSUANT TO SECTION 13 OR 15(d) OF THE SECURITIES EXCHANGE ACT OF 1934
|
For the transition period from to
Commission file number 00-24525
Cumulus Media Inc.
(Exact Name of Registrant as Specified in Its Charter)
|
Delaware
|
|
82-5134717
|
|
(State of Incorporation)
|
|
(I.R.S. Employer Identification No.)
|
3280 Peachtree Road, N.W.
Suite 2200
Atlanta, GA 30305
(404) 949-0700
(Address, including zip code, and telephone number, including area code, of registrant’s principal offices)
Securities Registered Pursuant to Section 12(b) of the Act:
None
Securities Registered Pursuant to Section 12(g) of the Act:
Class A Common Stock, par value $.0000001 per share
Indicate by check mark if the registrant is a well-known seasoned issuer, as defined in Rule 405 of the Securities Act. Yes
¨
No
þ
Indicate by check mark if the registrant is not required to file reports pursuant to Section 13 or Section 15(d) of the Act. Yes
¨
No
þ
Indicate by check mark whether the registrant: (1) has filed all reports required to be filed by Section 13 or 15(d) of the Securities Exchange Act of 1934 during the preceding 12 months (or for such shorter period that the registrant was required to file such reports), and (2) has been subject to such filing requirements for the past 90 days. Yes
þ
No
¨
Indicate by check mark whether the registrant has submitted electronically every Interactive Data File required to be submitted pursuant to Rule 405 of Regulation S-T (§232.405 of this chapter) during the preceding 12 months (or for such shorter period that the registrant was required to submit such files). Yes
þ
No
¨
Indicate by check mark if disclosure of delinquent filers pursuant to Item 405 of Regulation S-K (§229.405 of this chapter) is not contained herein, and will not be contained, to the best of registrant’s knowledge, in definitive proxy or information statements incorporated by reference in Part III of this Form 10-K or any amendment to this Form 10-K.
¨
Indicate by check mark whether the registrant is a large accelerated filer, an accelerated filer, a non-accelerated filer, a smaller reporting company, or an emerging growth company. See the definitions of “large accelerated filer”, “accelerated filer,” “smaller reporting company,” and "emerging growth company" in Rule 12b-2 of the Exchange Act:
|
Large accelerated filer
|
|
¨
|
|
Accelerated filer
|
|
þ
|
|
Non-accelerated filer
|
|
¨
|
|
Smaller reporting company
|
þ
|
|
|
Emerging growth company
|
|
¨
|
||||
If an emerging company, indicate by check mark if the registrant has elected not to use the extended transition period for complying with any new or revised financial accounting standards provided pursuant to Section 13(a) of the Exchange Act.
¨
Indicate by check mark whether the registrant is a shell company (as defined in Rule 12b-2 of the Exchange Act). Yes
¨
No
þ
Indicate by check mark whether the registrant has filed all documents and reports required to be filed by Section 12, 13 or 15(d) of the Securities Exchange Act of 1934 subsequent to the distribution of securities under a plan confirmed by a court. Yes
¨
No
¨
The aggregate market value of the registrant’s outstanding voting and non-voting common stock held by non-affiliates of the registrant (assuming, solely for the purposes hereof, that all officers and directors (and their respective affiliates), and 10% or greater stockholders of the registrant are affiliates of the registrant, some of whom may not be deemed to be affiliates upon judicial determination) as of June 30, 2018, the last business day of the registrant’s most recently completed second fiscal quarter, was approximately
$239.3 million
.
As of
March 11, 2019
, the registrant had outstanding 16,648,590 shares of common stock consisting of (i)
13,092,968
shares of Class A common stock; and (ii)
3,555,622
shares of Class B common stock in addition to
2,903,248
Series 1 warrants and
476,534
Series 2 warrants.
DOCUMENTS INCORPORATED BY REFERENCE
None
CUMULUS MEDIA INC.
ANNUAL REPORT ON FORM 10-K
For the Fiscal Year Ended
December 31, 2018
|
Item
Number
|
|
Page
Number
|
|
1
|
||
|
1A.
|
||
|
1B.
|
||
|
2
|
||
|
3
|
||
|
4
|
||
|
5
|
||
|
6
|
||
|
7
|
||
|
7A.
|
||
|
8
|
||
|
9
|
||
|
9A.
|
||
|
9B.
|
||
|
10
|
||
|
11
|
||
|
12
|
||
|
13
|
||
|
14
|
||
|
15
|
||
|
16
|
||
2
PART I
|
Item 1.
|
Business
|
Description of Certain Definitions and Data
In this Annual Report on Form 10-K (this “Form 10-K” or this “Report”) the terms “Company,” “Cumulus,” “we,” “us,” and “our” refer to Cumulus Media Inc. and its consolidated subsidiaries.
We use the term “local marketing agreement” (“LMA”) in this Report. In a typical LMA, the licensee of a radio station makes available, for a fee and reimbursement of its expenses, airtime on its station to a party which supplies programming to be broadcast during that airtime, and collects revenues from advertising aired during such programming.
Unless otherwise indicated, as disclosed herein we:
|
•
|
obtained total radio industry listener and revenue levels from the Radio Advertising Bureau;
|
|
•
|
derived historical market revenue statistics and market revenue share percentages from data published by Miller Kaplan, Arase LLP, a public accounting firm that specializes in serving the broadcasting industry and BIA/Kelsey (“BIA”), a media and telecommunications advisory services firm; and
|
|
•
|
derived all audience share data and audience rankings, including ranking by population, from surveys of people ages 12 and over, listening Monday through Sunday, 6 a.m. to 12 midnight, as reported in the Nielsen Audio Market Report.
|
Emergence from Chapter 11
As previously disclosed, on November 29, 2017 (the “Petition Date”), CM Wind Down Topco Inc. (formerly known as Cumulus Media Inc.), a Delaware corporation (“Old Cumulus”) and certain of its direct and indirect subsidiaries (collectively, the “Debtors”) filed voluntary petitions for relief (the “Bankruptcy Petitions”) under Chapter 11 of Title 11 of the United States Code (the “Bankruptcy Code”) in the United States Bankruptcy Court for the Southern District of New York (the “Bankruptcy Court”). The Debtors’ chapter 11 cases (the "Chapter 11 Cases") were jointly administered under the caption
In re Cumulus Media Inc., et al, Case No. 17-13381.
On May 10, 2018, the Bankruptcy Court entered the
Findings of Fact, Conclusions of Law and Order Confirming the Debtors’ First Amended Joint Chapter 11 Plan of Reorganization
[Docket No. 769] (the “Confirmation Order”), which confirmed the
First Amended Joint Plan of Reorganization of Cumulus Media Inc. and its Debtor Affiliates Pursuant to Chapter 11 of the Bankruptcy Code
[Docket No. 446] (the “Plan”), as modified by the Confirmation Order. On June 4, 2018 (the “Effective Date”), Old Cumulus satisfied the conditions to effectiveness set forth in the Confirmation Order and in the Plan, the Plan was substantially consummated, and Old Cumulus and the other Debtors emerged from Chapter 11. On June 29, 2018, the Bankruptcy Court entered an order closing the Chapter 11 Cases of all of the Debtors other than Old Cumulus, whose case will remain open until its estate has been fully administered including resolving outstanding claims and the Bankruptcy Court enters an order closing its case.
Cancellation of Certain Prepetition Obligations
In connection with the effectiveness of and pursuant to the terms of the Plan, on the Effective Date, the obligations of Old Cumulus and its subsidiaries under the following agreements were satisfied and discharged:
|
•
|
Amended and Restated Credit Agreement, dated as of December 23, 2013, by and among Cumulus Media Inc., Cumulus Media Holdings Inc., as borrower, certain lenders, JPMorgan Chase Bank, N.A., as lender and Administrative Agent, Royal Bank of Canada and Macquarie Capital (USA) Inc., as co-syndication agents, and Credit Suisse AG, Cayman Islands Branch, Fifth Third Bank, Goldman Sachs Bank USA and ING Capital LLC, as co-documentation agents (“the Canceled Credit Agreement”), pursuant to which Old Cumulus had outstanding term loans in the amount of
$1.7 billion
(the “Predecessor Term Loan”);
|
|
•
|
Indenture, dated as of May 13, 2011, among Cumulus Media Inc., the Guarantors named therein and U.S. Bank National Association, as Trustee, as supplemented, and pursuant to which Old Cumulus had outstanding senior notes with a face value of
$610.0 million
(“
7.75%
Senior Notes”); and
|
|
•
|
Rights Agreement, dated as of June 5, 2017, between Cumulus Media Inc. and Computershare Trust Company, N.A., as Rights Agent (the “Rights Agreement”).
|
Additional Matters Contemplated by the Plan
|
•
|
In accordance with the Plan, on the Effective Date each share of Old Cumulus’s Class A common stock, par value
$0.01
per share (the “old Class A common stock”), Class B common stock, par value
$0.01
per share (the “old
|
3
Class B common stock”), and Class C common stock, par value
$0.01
per share (the "old Class C common stock” and together with the old Class A common stock and the old Class B common stock, the “old common stock”) outstanding immediately prior to the Effective Date, including all stock options, warrants or other rights, including rights issued under the Rights Agreement, to purchase such old common stock, were extinguished, canceled and discharged, and each such share, option or warrant has no further force or effect. Furthermore, all of Old Cumulus’s equity award agreements under prior incentive plans, and the awards granted pursuant thereto, were extinguished, canceled and discharged and have no further force or effect;
|
•
|
On the Effective Date, our certificate of incorporation was amended and restated to authorize the issuance of up to
100,000,000
shares of Class A common stock, par value
$0.0000001
per share (“new Class A common stock”),
100,000,000
shares of Class B common stock, par value
$0.0000001
per share (“new Class B common stock” and, together with the new Class A common stock, the “new common stock”) and
100,000,000
shares of preferred stock (see Note 11, “Stockholders’ Equity”);
|
|
•
|
On the Effective Date, we issued
11,052,211
shares of new Class A common stock and
5,218,209
shares of new Class B common stock;
|
|
•
|
On the Effective Date, we issued
3,016,853
Series 1 warrants to purchase shares of new common stock;
|
|
•
|
After the Effective Date, we also issued or will issue
712,736
Series 2 warrants (the “Series 2 warrants” and, together with the Series 1 warrants, the “Warrants”) to purchase shares of new common stock;
|
|
•
|
We entered into a
$1.3 billion
credit agreement (the “Credit Agreement” or “Term Loan”) with Wilmington Trust, N.A., as administrative agent (the “Agent”) and the lenders named therein (see Note 9, “Long-Term Debt”);
|
|
•
|
The holders of claims with respect to the Predecessor Term Loan received the following in full and complete satisfaction of their respective claims thereunder: (i) a pro rata share of the Term Loan and (ii) a pro rata share of
83.5%
of the new common stock and warrants issued, subject to dilution by certain issuances under the Long-Term Incentive Plan (the “Incentive Plan”) (see Note 11, “Stockholders’ Equity”);
|
|
•
|
The holders of unsecured claims against Old Cumulus, including claims arising from the
7.75%
Senior Notes received, in the aggregate,
16.5%
of the new common stock and warrants issued, subject to dilution by certain issuances under the Incentive Plan;
|
|
•
|
Our board of directors was
reconstituted to consist of our President and Chief Executive Officer and
six
independent directors selected by the holders of the Predecessor Term Loan; and
|
|
•
|
Intercompany Claims and Interests (as defined in the Plan) were canceled without any distribution on account of such Intercompany Claims and Interests.
|
The foregoing description of certain of the matters effected pursuant to the Plan and the transactions related to and contemplated thereunder, is not intended to be a complete description of, or a substitute for, a full and complete reading of the Plan.
In connection with its emergence, Old Cumulus implemented a series of internal reorganization transactions authorized by the Plan pursuant to which it transferred substantially all of its remaining assets to an indirectly wholly owned subsidiary of reorganized Cumulus Media Inc. (formerly known as CM Emergence Newco Inc.), a Delaware corporation (“CUMULUS MEDIA” or the “Company”), prior to winding down its business. References to “Successor” or “Successor Company” relate to the balance sheet and results of operations of CUMULUS MEDIA on and subsequent to June 4, 2018. References to “Predecessor”, “Predecessor Company” or “Old Cumulus” refer to the balance sheet and results of operations of Old Cumulus prior to June 4, 2018.
Company Overview
A leader in the radio broadcasting industry, CUMULUS MEDIA combines high-quality local programming with iconic, nationally syndicated media, sports and entertainment brands to deliver premium content choices to the
245 million
people reached each week through its
433
owned-and-operated stations broadcasting in
88
U.S. media markets (including eight of the top 10), approximately
8,000
broadcast radio stations affiliated with its Westwood One network and numerous digital channels. Together, the Cumulus/Westwood One platforms make Cumulus one of the few media companies that can provide advertisers with national reach and local impact. Cumulus/Westwood One is the exclusive radio broadcast partner to some of the largest brands in sports, entertainment, news, and talk, including the NFL, the NCAA, the Masters, the Olympics, the GRAMMYs, the Academy of Country Music Awards, the American Music Awards, the Billboard Music Awards, and more. Additionally, it is the nation's leading provider of country music and lifestyle content through its NASH brand, which serves country fans nationwide through radio programming, exclusive digital content, and live events.
We are a Delaware corporation, organized in 2018, and a successor to a Delaware corporation with the same name that was organized in 2002.
4
Strategic Overview
We are focused on building our competitive position in the expanding audio landscape by achieving leadership positions in the markets in which we operate and leveraging those positions in conjunction with our network platform, national scale, and local advertiser relationships to build value for all our stakeholders. The Company seeks to achieve our objective through the execution of three specific strategies:
•
enhancing operating performance to drive cash flow generation, through the execution of a range of initiatives across both our radio station and network platforms to maintain or grow market share, reduce costs and improve efficiency;
•
expanding high growth digital businesses in local marketing services and new audio formats such as podcasting and streaming;
•
optimizing our asset portfolio by taking advantage of opportunities to strengthen our position in markets where we are, or can become, leaders and to exit markets or dispose of assets that are not supportive of our objectives if we can do so accretively.
Competitive Strengths
We believe our success is, and future performance will be, directly related to the following combination of characteristics that will facilitate the implementation of our strategies:
Leadership in the radio broadcasting industry and new audio formats
Currently, we offer advertisers access to a broad portfolio of
433
owned and operated stations, operating in 16 large and 73 small and mid-sized media markets and 8,000 network affiliates with an aggregate weekly reach of 245 million listeners. Our stations and affiliates cover a wide variety of programming formats, geographic regions and audience demographics and we engage with audiences through over-the-air, digital (including streaming and podcasting) and live interactions. This scale and diversity allow us to offer advertisers the ability to customize advertising campaigns on a national, regional and local basis through broadcast, digital and mobile mediums, as well as through live events, enabling us to compete effectively with other media and engage listeners whenever they want and wherever they are.
National reach
As one of the largest radio advertising and content providers in the United States we provide a national platform which allows us to more effectively and efficiently compete for national advertising dollars. In addition, this national network platform provides targeted access and more diverse demographics and age groups to better meet our customers’ needs and allow for more focused marketing. Our sales team has the ability to aggregate advertising inventory time across our owned-and-operated and/or affiliate networks, and divide it into packages focused on specific demographics that can be sold to national advertisers looking to reach specific national or regional audiences.
Endorsement value of our talent
Our on-air and podcast talent often provide personal endorsements of advertisers’ products via live or recorded reads. To the extent our talent has won the trust of their audiences, such endorsements can be well-received by listeners and, as such, valuable to advertisers who are eager to capture the favorable attention of new and existing customers for their products.
Broadening relationships with local advertisers
The multiple contacts our local sales people have with their clients over the course of a year often give them a degree of familiarity with their clients’ needs and the ability to tailor campaigns to help them achieve success. Over the last several years, those interactions have allowed us to expand our support of new and existing clients’ business objectives by offering them additional products, most importantly digital marketing services, which generally supplement their radio buys.
Diversified customer base and geographic mix
We generate substantially all of our revenue from the sale of advertising time to a broad and diverse customer base including local advertisers based in our 89 cities or "markets" as well as advertisers based outside those markets seeking to obtain the regional or national exposure we can provide in radio or digital formats. We sell our advertising time both nationally and locally through an integrated sales approach that ranges from traditional radio spots to non-traditional sales programs, including on-line couponing and various on-air and digital integrated marketing programs.
5
Our advertising exposure is highly diversified across a broad range of industries, which lessens the impact of the economic conditions applicable to any one specific industry or customer group. Our top industry segments by advertising volume include automotive, restaurants, entertainment, financial, and communications. We derive additional revenue from political candidates, political parties, and special interest groups particularly in even-numbered years in advance of various elections. We have a broad distribution of advertisers across all of our stations and Westwood One.
Focus on corporate
culture
We believe maintaining a corporate culture that supports employee engagement has been, and will continue to be important to our continued success. Through a rigorous and systematic cultural values framework, FORCE (Focused, Responsible, Collaborative, and Empowered), we believe we have created a motivated employee base that is invested in both their jobs and the Company’s progress and a culture that serves as a critical catalyst to driving higher performance.
Ability to leverage content across platforms
Our various content platforms, including local stations, the Westwood One Network and our growing podcast and streaming businesses, provide diversified content to build relationships with listeners as well as access to a broader base of talent across those platforms. We have had recent success in extending content from one platform to another (such as from local radio to network syndication and from podcasting to broadcast radio) to build audiences and monetization opportunities and expect to continue to do so increasingly in the future.
Industry Overview
The primary source of revenues for radio broadcasting companies is the sale of advertising time to local, regional, national spot and network advertisers.
Generally, radio is considered an efficient, cost-effective means of reaching specifically identified demographic groups with advertising. Stations are typically classified by their on-air format, such as country, rock, adult contemporary, oldies and news/talk. A station’s format and style of presentation enables it to target specific segments of listeners sharing certain demographic qualities. Advertisers and stations use data published by audience measurement services, such as Nielsen Audio, to estimate how many people within particular geographical markets and demographics listen to specific stations. By capturing a specific share of a market’s radio listening audience with particular concentration in a targeted demographic, a station is able to market its broadcasting time to advertisers seeking to reach a specific audience.
The number of advertisements that can be broadcast by a station without jeopardizing listening levels and the resulting ratings is generally dictated in part by the format of a particular station and the local competitive environment. Although the number of advertisements broadcast during a given time period may vary, the total number of advertisements broadcast on a particular station generally does not vary significantly from year to year.
A station’s local sales staff generates the majority of its local and regional advertising sales through direct solicitations of local advertising agencies and businesses. To generate national advertising sales, a station usually will engage a firm that specializes in soliciting radio-advertising sales on a national level. Stations also may engage directly with an internal national sales team that supports the efforts of third-party representatives. National sales representatives obtain advertising principally from advertising agencies located outside the station’s market and receive commissions based on the revenue from the advertising they obtain.
Our stations compete for advertising revenue with other broadcast radio stations in their particular market as well as other media, including newspapers, broadcast television, cable television, magazines, direct mail, and outdoor advertising as well as search engine, e-commerce and other websites and satellite-based digital radio and music services. We cannot predict how existing or new sources of competition will affect our performance and results of operations.
Advertising Sales
The majority of our revenue is generated from the sale of local, regional, and national advertising for broadcast on our radio stations. In addition, we generate revenue from the sale of commercial air time our network receives from its radio station affiliates (and aggregates for sale to national advertisers) in exchange for programming and services. To a lesser extent, we also purchase commercial inventory to sell by our network and occasionally also receive cash from affiliates for network programming and services. Our major advertiser categories are:
6
|
Automotive
|
|
Food products
|
|
Retail
|
|
Entertainment
|
|
Home products
|
|
Restaurants
|
|
Financial
|
|
Professional services
|
|
Telecommunications/Media
|
In addition, in advance of various elections, we derive revenue from political candidates, political parties, and special interest groups, particularly in even-numbered years.
Each station’s local sales staff solicits advertising either directly from a local advertiser or indirectly through an advertising agency. We use a tiered commission structure to focus our sales staff on new business development. We believe that we can outperform our competitors by (1) expanding our base of advertisers, (2) properly training sales people and (3) providing a higher level of service to our existing customer base.
National sales for our radio stations are made by a firm specializing in radio advertising sales on the national level, in exchange for a commission that is based on the gross revenue from the advertising generated. Regional sales, which we define as sales in regions surrounding our markets to buyers that advertise in our markets, are generally made by our local sales staff and market managers. While we seek to grow our local sales through more customer-focused sales staffs, we seek to grow our national and regional sales by offering key national and regional advertisers access to groups of stations within specific markets and regions that make us a more attractive platform.
Each of our stations has a certain amount of on-air inventory, or advertising slots, in which to place advertising spots. This target level of advertising inventory may vary at different times of the day but tends to remain stable over time. Our stations strive to maximize revenue by managing their on-air advertising inventory and adjusting prices up or down based on supply and demand. We seek to broaden our advertiser base in each market by providing a wide array of audience demographic groups across each cluster of stations, thereby providing potential advertisers with an effective means to reach a targeted demographic group. Our sales volume and pricing is based on demand for our radio stations’ on-air inventory. Most changes in revenue are explained by a combination of demand-driven pricing changes and changes in inventory utilization rather than by changes in available inventory. Advertising rates charged by radio stations, which are generally highest during morning and afternoon commuting hours, are based primarily on:
|
•
|
a station’s share of audiences and the demographic groups targeted by advertisers (as measured by ratings surveys);
|
|
•
|
the supply and demand for radio advertising time and for time targeted at particular demographic groups; and
|
|
•
|
certain additional qualitative factors, such as the brand loyalty of listeners to a specific station.
|
A station’s listenership is reflected in ratings surveys that estimate the number of listeners tuned in to the station, and the time they spend listening. Each station’s ratings are used by its advertisers and advertising representatives to consider advertising with the station and are used by Cumulus to chart changes in audience, set advertising rates and adjust programming.
Competition
The radio broadcasting industry is very competitive. Our stations compete for listeners and advertising revenues directly with other radio stations within their respective markets, as well as with other advertising media. Additionally, we compete with various digital platforms and services including streaming music and other entertainment services for both listeners and advertisers.
Factors that affect a radio station’s competitive position include station brand identity and loyalty, the attractiveness of the stations programming content to audiences, the station’s local audience rank in its market, transmitter power and location, assigned frequency, audience characteristics, local program acceptance and the number and characteristics of other radio stations and other advertising media in the market area. We attempt to improve our competitive position in each market through research, seeking to improve our stations’ programming, implementing targeted advertising campaigns aimed at the demographic groups for which our stations program and managing our sales efforts to attract a larger share of advertising dollars for each station individually. We also seek to improve our competitive position by focusing on building a strong brand identity with a targeted listener base consisting of specific demographic groups in each of our markets, which we believe will allow us to better attract advertisers seeking to reach those listeners.
The success of each of our stations depends largely upon rates it can charge for its advertising, which in turn is affected by the number of local advertising competitors, the overall demand for advertising within individual markets and the station’s listener base. These conditions may fluctuate and are highly susceptible to changes in both local markets and general macroeconomic conditions. Specifically, a radio station’s competitive position can be enhanced or negatively impacted by a
7
variety of factors, including the changing of, or another station changing, its format to compete directly for a certain demographic of listeners and advertisers or an upgrade of the station’s authorized power through the relocation or upgrade of transmission equipment. Another station’s decision to convert to a similar format to that of one of our radio stations in the same geographic area, to improve its signal reach through equipment changes or upgrades, or to launch an aggressive promotional campaign may result in lower ratings and advertising revenue for our station. Any adverse change affecting advertising expenditures in a particular market or in the relative market share of our stations located in a particular market could have a material adverse effect on the results of our radio stations located in that market or, possibly, the Company as a whole. There can be no assurance that any one or all of our stations will be able to maintain or increase advertising revenue market share.
Under federal laws and Federal Communications Commission (the “FCC”) rules, a single party can own and operate multiple stations in a local market, subject to certain limitations described below. We believe that companies that form groups of commonly owned stations or joint arrangements, such as LMAs, in a particular market may, in certain circumstances, have lower operating costs and may be able to offer advertisers in those markets more attractive rates and services. Although we currently operate multiple stations in most of our markets and may pursue the creation of additional multiple station groups in particular markets, our competitors in certain markets include other parties that own and operate as many or more stations as we do.
Some of these regulations, however, can serve to protect the competitive position of existing radio stations to some extent by creating certain regulatory barriers to new entrants. The ownership of a radio broadcast station requires an FCC license, and the number of radio stations that an entity can own in a given market is limited under certain FCC rules. The number of radio stations that a party can own in a particular market is dictated largely by whether the station is in a defined “Nielsen Audio Metro" (a designation designed by a private party for use in advertising matters), and, if so, the number of stations included in that Nielsen Audio Metro. In those markets that are not in a Nielsen Audio Metro, the number of stations a party can own in the particular market is dictated by the number of AM and FM signals that overlap. These FCC ownership rules may, in some instances, limit the number of stations we or our competitors can own or operate, or may limit potential new market entrants. However, FCC ownership rules may change in the future to reduce any protections they currently provide. We also cannot predict what other matters might be considered in the future by the FCC or Congress, nor can we assess in advance what impact, if any, the implementation of any of these proposals or changes might have on our business. For a discussion of FCC regulation (including recent changes), see “- Federal Regulation of Radio Broadcasting.”
Employees
At
December 31, 2018
, we employed 5,135 people, 3,449 of whom were employed full time. Of these employees, approximately 224 employees were covered by collective bargaining agreements. We have not experienced any material work stoppages by our employees covered by collective bargaining agreements, and overall, we consider our relations with our employees to be positive.
On occasion, we enter into contracts with various on-air personalities with large loyal audiences in their respective markets to protect our interests in those relationships that we believe to be valuable. The loss of one of these personalities could result in a short-term loss of audience share, but we do not believe that any such loss would have a material adverse effect on our financial condition or results of operations, taken as a whole.
Seasonality and Cyclicality
Our advertising revenues vary by quarter throughout the year. As is typical with advertising revenue supported businesses, our first calendar quarter typically produces the lowest revenues of any quarter during the year, as advertising generally declines following the winter holidays. The second and fourth calendar quarters typically produce the highest revenues for the year. In addition, our revenues tend to fluctuate between years, consistent with, among other things, increased advertising expenditures in even-numbered years by political candidates, political parties and special interest groups. This political spending typically is heaviest during the fourth quarter.
Inflation
To date, inflation has not had a material effect on our revenues, expenses, or results of operations, although no assurances can be provided that inflation in the future would not materially adversely affect us.
8
Federal Regulation of Radio Broadcasting
The ownership, operation and sale of radio broadcast stations, including those licensed to us, are subject to the jurisdiction of the FCC, which acts under authority of the Communications Act of 1934, as amended (the “Communications Act”). Among its other regulatory responsibilities, the FCC issues permits and licenses to construct and operate radio stations; assigns broadcast frequencies; determines whether to approve changes in ownership or control of station licenses; regulates transmission equipment, operating power, and other technical parameters of stations; adopts and implements regulations and policies that directly or indirectly affect the ownership, operation and employment practices of stations; regulates the content of some forms of radio broadcast programming; and has the authority under the Communications Act to impose penalties for violations of its rules.
The following is a brief summary of certain provisions of the Communications Act, and related FCC rules and policies (collectively, the “Communications Laws”). This description does not purport to be comprehensive, and reference should be made to the Communications Laws, public notices, and decisions issued by the FCC for further information concerning the nature and extent of federal regulation of radio broadcast stations. Failure to observe the provisions of the Communications Laws can result in the imposition of various sanctions, including monetary forfeitures and the grant of a “short-term” (less than the maximum term) license renewal. For particularly egregious violations, the FCC may deny a station’s license renewal application, revoke a station’s license, or deny applications in which an applicant seeks to acquire additional broadcast properties.
License Grant and Renewal
Radio broadcast licenses are generally granted and renewed for terms of up to eight years at a time. Licenses are renewed by filing an application with the FCC, which is subject to review and approval. The Communications Act expressly provides that a radio station is authorized to continue to operate after the expiration date of its existing license until the FCC acts on a pending renewal application. Petitions to deny license renewal applications may be filed by interested parties, including members of the public. While we are not currently aware of any facts that would prevent the renewal of our licenses to operate our radio stations, there can be no assurance that all of our licenses will be renewed in the future for a full term, or at all. Our inability to renew a significant portion of our radio broadcast licenses could result in a material adverse effect on our results of operations and financial condition.
Service Areas
The area served by an AM station is determined by a combination of frequency, transmitter power, antenna orientation, and soil conductivity. To determine the effective service area of an AM station, the station’s power, operating frequency, antenna patterns and its day/night operating modes are evaluated. The area served by an FM station is determined by a combination of effective radiated power (“ERP”), antenna height and terrain, with stations divided into eight classes according to these technical parameters.
Each class of FM radio station has the right to broadcast with a certain amount of ERP from an antenna located at a certain height above average terrain. The most powerful FM radio stations, which are generally those with the largest geographic reach, are Class C FM stations, which operate with up to the equivalent of 100 kilowatts (“kW”) of ERP at an antenna height of 1,968 feet above average terrain. These stations typically provide service to a large area that covers one or more counties (which may or may not be in the same state). There are also Class C0, C1, C2 and C3 FM radio stations which operate with progressively less power and/or antenna height above average terrain and, thus, less geographic reach. In addition, Class B FM stations operate with the equivalent of up to 50 kW ERP at an antenna height of 492 feet above average terrain. Class B stations can serve large metropolitan areas and their outer suburban areas. Class B1 stations can operate with up to the equivalent of 25 kW ERP at an antenna height of 328 feet above average terrain. Class A FM stations operate with up to the equivalent of 6 kW ERP at an antenna height of 328 feet above average terrain, and often serve smaller cities or suburbs of larger cities.
9
The following table sets forth, as of
March 11, 2019
, the number of stations by market of all our owned and/or operated stations, including stations operated under an LMA, whether or not pending acquisition, and all other announced pending station acquisitions, if any.
|
Market
|
Stations
|
|||
|
Abilene, TX
|
4
|
|||
|
Albany, GA
|
6
|
|||
|
Albuquerque, NM
|
8
|
|||
|
Allentown, PA
|
2
|
|||
|
Amarillo, TX
|
6
|
|||
|
Ann Arbor, MI
|
4
|
|||
|
Appleton, WI
|
4
|
|||
|
Atlanta, GA
|
4
|
|||
|
Baton Rouge, LA
|
5
|
|||
|
Beaumont, TX
|
5
|
|||
|
Birmingham, AL
|
6
|
|||
|
Bloomington, IL
|
5
|
|||
|
Boise, ID
|
6
|
|||
|
Bridgeport, CT
|
2
|
|||
|
Buffalo, NY
|
5
|
|||
|
Charleston, SC
|
5
|
|||
|
Chattanooga, TN
|
4
|
|||
|
Chicago, IL
|
3
|
|||
|
Cincinnati, OH
|
5
|
|||
|
Colorado Springs, CO
|
6
|
|||
|
Columbia, MO
|
7
|
|||
|
Columbia, SC
|
5
|
|||
|
Columbus-Starkville, MS
|
5
|
|||
|
Dallas, TX
|
8
|
|||
|
Des Moines, IA
|
5
|
|||
|
Detroit, MI
|
3
|
|||
|
Erie, PA
|
4
|
|||
|
Eugene, OR
|
5
|
|||
|
Fayetteville, AR
|
7
|
|||
|
Fayetteville, NC
|
4
|
|||
|
Flint, MI
|
5
|
|||
|
Florence, SC
|
8
|
|||
|
Fort Smith, AR
|
3
|
|||
|
Fort Walton Beach, FL
|
5
|
|||
|
Fresno, CA
|
5
|
|||
|
Grand Rapids, MI
|
5
|
|||
|
Green Bay, WI
|
6
|
|||
|
Harrisburg, PA
|
5
|
|||
|
Houston, TX
|
1
|
|||
|
Huntsville, AL
|
6
|
|||
|
Indianapolis, IN
|
6
|
|||
|
Johnson City, TN
|
5
|
|||
|
Kansas City, MO
|
6
|
|||
|
Knoxville, TN
|
4
|
|||
|
Kokomo, IN
|
1
|
|||
10
|
Market
|
Stations
|
|||
|
Lafayette, LA
|
5
|
|||
|
Lake Charles, LA
|
6
|
|||
|
Lancaster, PA
|
2
|
|||
|
Lexington, KY
|
6
|
|||
|
Little Rock, AR
|
7
|
|||
|
Los Angeles, CA
|
2
|
|||
|
Macon, GA
|
6
|
|||
|
Melbourne, FL
|
4
|
|||
|
Memphis, TN
|
4
|
|||
|
Minneapolis, MN
|
5
|
|||
|
Mobile, AL
|
5
|
|||
|
Modesto, CA
|
6
|
|||
|
Montgomery, AL
|
6
|
|||
|
Muncie, IN
|
2
|
|||
|
Muskegon, MI
|
5
|
|||
|
Myrtle Beach, SC
|
5
|
|||
|
Nashville, TN
|
5
|
|||
|
New London, CT
|
3
|
|||
|
New Orleans, LA
|
4
|
|||
|
New York, NY
|
4
|
|||
|
Oklahoma City, OK
|
7
|
|||
|
Oxnard-Ventura, CA
|
4
|
|||
|
Pensacola, FL
|
5
|
|||
|
Peoria, IL
|
5
|
|||
|
Providence, RI
|
6
|
|||
|
Reno, NV
|
4
|
|||
|
Saginaw, MI
|
4
|
|||
|
Salt Lake City, UT
|
6
|
|||
|
San Francisco, CA
|
7
|
|||
|
Santa Barbara, CA
|
1
|
|||
|
Savannah, GA
|
7
|
|||
|
Shreveport, LA
|
5
|
|||
|
Springfield, MA
|
2
|
|||
|
Stockton, CA
|
2
|
|||
|
Syracuse, NY
|
4
|
|||
|
Tallahassee, FL
|
5
|
|||
|
Toledo, OH
|
6
|
|||
|
Topeka, KS
|
7
|
|||
|
Tucson, AZ
|
5
|
|||
|
Washington, DC
|
3
|
|||
|
Westchester, NY
|
1
|
|||
|
Wichita Falls, TX
|
4
|
|||
|
Wilkes-Barre, PA
|
6
|
|||
|
Wilmington, NC
|
5
|
|||
|
Worcester, MA
|
3
|
|||
|
York, PA
|
4
|
|||
|
Youngstown, OH
|
8
|
|||
Regulatory Approvals
The Communications Laws prohibit the assignment or transfer of control of a broadcast license without the prior approval of the FCC. In determining whether to grant an application for assignment or transfer of control of a broadcast license, the Communications Act requires the FCC to find that the assignment or transfer would serve the public interest. The FCC considers a number of factors in making this determination, including (1) compliance with various rules limiting common ownership or control of media properties, (2) the financial and “character” qualifications of the assignee or transferee (including
11
those parties holding an “attributable” interest in the assignee or transferee), (3) compliance with the Communications Act’s foreign ownership restrictions, and (4) compliance with other Communications Laws, including those related to programming and filing requirements. As discussed in greater detail below, the FCC may also review the effect of proposed assignments and transfers of broadcast licenses on economic competition and diversity. See “- Antitrust and Market Concentration Considerations.”
In connection with our 2011 acquisition of Citadel Broadcasting Corporation, and our emergence from Chapter 11 in June 2018, we were required to place certain stations into two divestiture trusts in compliance with the FCC rules. The trust agreements stipulated that we must fund any operating shortfalls from the activities of the stations in the trusts, and any excess cash flow generated by such stations will be distributed to us until the stations are sold. As of March 11, 2019, there are five stations remaining in those trusts.
Ownership Matters
The Communications Act restricts us from having more than 25% of our capital stock owned or voted by non-U.S. persons, foreign governments or non-U.S. corporations. We are required to take steps to monitor the citizenship of our stockholders based principally on our review of ownership information that is known or reasonably should be known to us to establish a reasonable basis for certifying compliance with the foreign ownership restrictions of the Communications Act. In November 2013, the FCC issued a declaratory ruling in which it stated that it would review requests for companies to exceed the 25% alien ownership threshold in the Communications Act on a case-by-case basis. Since that time, the FCC acted on several petitions for declaratory ruling which requested that various entities be permitted to exceed the 25% foreign equity and voting limitations. In those cases, the FCC permitted foreign ownership of as much as 100% by both specifically-identified foreign persons and generally, subject to various conditions. These rulings were based upon the specific facts relating to the respective cases, and it is uncertain how the FCC would treat any request which might be made to increase alien ownership of our stock in excess of the current threshold. We filed a petition for declaratory ruling with the FCC in July, 2018, requesting that we be permitted to have 100% foreign ownership generally. That petition remains pending before the FCC and we cannot predict how the FCC will act on it or when such action may be taken.
In September 2016, the FCC issued new policies governing how broadcast companies calculate the amount of their stock which is foreign held. These new policies permit a public company, which takes adequate steps to determine the extent to which its stock is foreign-owned or voted, to presume that shares as to which it lacks knowledge of foreign ownership or voting control do not raise a foreign ownership issue. Under previous FCC policies, stock which could not specifically be identified as owned and voted by U.S. citizens was presumed to be foreign held. Under the new rules, the FCC in certain instances has permitted specific foreign investors to increase their non-controlling ownership in a broadcast company to 49.99%, and certain other investors to increase their controlling ownership to 100%, without further FCC approval.
The Communications Laws also generally restrict the number of radio stations one person or entity may own, operate or control in a local market. The Communications Laws formerly restricted (1) the common ownership, operation or control of radio broadcast stations and television broadcast stations serving the same local market, and (2) the common ownership, operation or control of a radio broadcast station and a daily newspaper serving the same local market, but those “cross ownership” rules were lifted by the FCC effective in February 2018. However, the FCC’s action in lifting the cross-ownership rules is currently the subject of a petition for review filed by several public interest organizations. In December 2018, the FCC released a Notice of Proposed Rulemaking to launch its 2018 quadrennial review of multiple ownership rules. The Notice of Proposed Rulemaking does not make any specific proposals but seeks comment regarding whether its local radio ownership rule limits should be modified. We cannot predict whether the FCC will adopt changes to the local radio ownership rule or what impact any such changes would have on our holdings.
To our knowledge, these multiple ownership rules do not require any change in our current ownership of radio broadcast stations. The Communications Laws limit the number of additional stations that we may acquire in the future in our existing markets as well as any new markets.
Because of these multiple ownership rules, a purchaser of our voting stock who acquires an “attributable” interest in Cumulus (as discussed below) may violate the Communications Laws if such purchaser also has an attributable interest in other radio stations, depending on the number and location of those radio stations. Such a purchaser also may be restricted in the companies in which it may invest to the extent that those investments give rise to an attributable interest. If one of our stockholders with an attributable interest violates any of these ownership rules, we may be unable to obtain from the FCC one or more authorizations needed to conduct our radio station business and may be unable to obtain FCC consents for certain future acquisitions.
12
The FCC generally applies its broadcast multiple ownership rules by considering the “attributable” interests held by a person or entity. With some exceptions, a person or entity will be deemed to hold an attributable interest in a radio station if the person or entity serves as an officer, director, partner, stockholder, member, or, in certain cases, a debt holder of a company that owns that station. If an interest is attributable, the FCC treats the person or entity that holds that interest as the “owner” of the radio station in question, and that interest thus is attributed to the person in determining compliance with the FCC’s ownership rules.
With respect to a corporation, officers, directors and persons or entities that directly or indirectly hold 5% or more of the corporation’s voting stock (20% or more of such stock in the case of insurance companies, investment companies, bank trust departments and certain other “passive investors” that hold such stock for investment purposes only) generally are attributed with ownership of the radio stations owned by the corporation. As discussed below, participation in an LMA or a joint sales agreement (“JSA”) also may result in an attributable interest. See “- Local Marketing Agreements” and "-Joint Sales Agreements."
With respect to a partnership (or limited liability company), the interest of a general partner (or managing member) is attributable. The following interests generally are not attributable: (1) debt instruments, non-voting stock, options and warrants for voting stock, partnership interests, or membership interests that have not yet been exercised; (2) limited partnership or limited liability company membership interests where (a) the limited partner or member is not “materially involved” in the media-related activities of the partnership or limited liability company, and (b) the limited partnership agreement or limited liability company agreement expressly “insulates” the limited partner or member from such material involvement by inclusion of provisions specified in FCC rules; and (3) holdings of less than 5% of an entity’s voting stock, non-voting equity and debt interests (unless stock or other equity holdings, whether voting or non-voting and whether insulated or not, and/or debt interests collectively constitute more than 33% of a station’s “enterprise value," which consists of the total equity and debt capitalization, and the non-voting stockholder or equity-holder/debt holder has an attributable interest in another radio station in the same market or supplies more than 15% of the programming of the station owned by the entity in which such holder holds such stock, equity or debt interests).
Programming and Operation
The Communications Act requires broadcasters to serve the “public interest.” To satisfy that obligation broadcasters are required by FCC rules and policies to present programming that is responsive to community problems, needs and interests and to maintain certain records demonstrating such responsiveness. FCC rules require that each radio broadcaster place a list in its public inspection file at the end of each quarter which identifies important community issues and the programs the radio broadcaster used in the prior quarter to address those issues. The FCC requires that certain portions of a radio station’s public inspection file be uploaded to the FCC’s online data base.
Complaints from listeners concerning a station’s programming may be filed at any time and will be considered by the FCC both at the time they are filed and in connection with a licensee’s renewal application. FCC rules also require broadcasters to provide equal employment opportunities (“EEO”) in the hiring of personnel, to abide by certain procedures in advertising employment opportunities, to make information available on employment opportunities on their website (if they have one), and maintain certain records concerning their compliance with EEO rules. The FCC will entertain individual complaints concerning a broadcast licensee’s failure to abide by the EEO rules and also conducts random audits on broadcast licensees’ compliance with EEO rules. We have been subject to numerous EEO audits. To date, none of those audits has disclosed any major violation that would have a material adverse effect on our cash flows, financial condition or operations. Stations also must follow provisions in the Communications Laws that regulate a variety of other activities, including political advertising, the broadcast of obscene or indecent programming, sponsorship identification, the broadcast of contests and lotteries, and technical operations (including limits on radio frequency radiation). In September 2015, the FCC adopted an order revising its rules that require a radio station to broadcast the material terms and conditions of any on-air contest. Under these, stations may satisfy that disclosure obligation by posting the material terms and conditions of an on-air contest on the station’s web site or on another publicly-available Internet site instead of broadcasting them over the air.
In October 2015, the FCC made changes to certain technical rules regarding the AM radio service, and also adopted procedures designed to make it easier for owners of AM stations to use FM translators to rebroadcast their AM stations’ signals. We cannot predict at this time the extent, if any, to which those rule changes and procedures will affect our operations.
We are and have been subject to listener complaints from time to time on a variety of matters, and, while none of them has had a material adverse effect on our cash flows, financial condition or operations as a whole to date, we cannot predict whether any future complaint might have a material adverse effect on our future financial condition or results of operations.
13
Local Marketing Agreements
A number of radio stations, including certain of our stations, have entered into LMAs. In a typical LMA, the licensee of a station makes available, for a fee and reimbursement of its expenses, airtime on its station to a party which supplies programming to be broadcast during that airtime, and collects revenues from advertising aired during such programming. LMAs are subject to compliance with the antitrust laws and the Communications Laws, including the requirement that the licensee must maintain independent control over the station and, in particular, its personnel, programming, and finances.
A station that brokers more than 15% of the weekly programming hours on another station in its market will be considered to have an attributable ownership interest in the brokered station for purposes of the FCC’s ownership rules. As a result, a radio station may not enter into an LMA that allows it to program more than 15% of the weekly programming hours of another station in the same market that it could not own under the FCC’s multiple ownership rules.
Joint Sales Agreements
From time to time, radio stations enter into a Joint Sales Agreement ("JSA"). A typical JSA authorizes one party or station to sell another station’s advertising time and retain the revenue from the sale of that airtime in exchange for a periodic payment to the station whose airtime is being sold (which may include a share of the revenue collected from the sale of airtime). Like LMAs, JSAs are subject to compliance with antitrust laws and the Communications Laws, including the requirement that the licensee must maintain independent control over the station and, in particular, its personnel, programming, and finances.
Under the FCC’s ownership rules, a radio station that sells more than 15% of the weekly advertising time of another radio station in the same market will be attributed with the ownership of that other station. For that reason, a radio station cannot have a JSA with another radio station in the same market if the FCC’s ownership rules would otherwise prohibit that common ownership.
Content, Licenses and Royalties
We must pay royalties to song composers and publishers whenever we broadcast musical compositions. Such copyright owners of musical compositions most often rely on intermediaries known as performing rights organizations (“PROs”) to negotiate licenses with copyright users for the public performance of their compositions, collect royalties under such licenses and distribute them to copyright owners. We have obtained public performance licenses from, and pay license fees to, the three major PROs in the United States, which are the American Society of Composers, Authors and Publishers (“ASCAP”), Broadcast Music, Inc. (“BMI”) and SESAC, Inc. (“SESAC”). There is no guarantee that a given songwriter or publisher will remain associated with ASCAP, BMI or SESAC or that additional PROs will not emerge. In 2013, a new PRO was formed named Global Music Rights (“GMR”). GMR has secured the rights to certain copyrights and is seeking to negotiate individual licensing agreements with radio stations for songs in its repertoire. GMR and the Radio Music License Committee, Inc. (‘RMLC’), which negotiates music licensing fees with PROs on behalf of many U.S. radio stations, have instituted antitrust litigation against one another. The litigation is ongoing. The withdrawal of a significant number of musical composition copyright owners from the three established PROs; the emergence of one or more additional PROs; and the outcome of the GMR/RMLC litigation could impact, and in some circumstances increase, our royalty rates and negotiation costs.
Antitrust and Market Concentration Considerations
From time to time Congress and the FCC have considered, and may in the future consider and adopt, new laws, regulations and policies regarding a wide variety of matters that could, directly or indirectly, affect the operation, ownership or profitability of our radio stations, result in the loss of audience share and advertising revenues for our radio stations, or affect our ability to acquire additional radio stations or finance such acquisitions.
Pending and potential future acquisitions, to the extent they meet specified size thresholds, will be subject to applicable waiting periods and possible review under the Hart-Scott-Rodino Act (“HSR Act”), by the Department of Justice (the "DOJ”) or the Federal Trade Commission (the “FTC”), either of which can be required to, or can otherwise decide to, evaluate a transaction to determine whether that transaction should be challenged under the federal antitrust laws. Transactions generally are subject to the HSR Act if the acquisition price or fair market value of the stations to be acquired is $90 million or more (such threshold effective April 3, 2019). Acquisitions that are not required to be reported under the HSR Act may still be investigated by the DOJ or the FTC under the antitrust laws before or after consummation. At any time before or after the consummation of a proposed acquisition, the DOJ or the FTC could take such action under the antitrust laws as it deems necessary, including seeking to enjoin the acquisition or seeking divestiture of the business acquired or certain of our other assets. The DOJ has reviewed numerous potential radio station acquisitions where an operator proposed to acquire additional stations in its existing markets or multiple stations in new markets, and has challenged a number of such transactions. Some of
14
these challenges have resulted in consent decrees requiring the sale of certain stations, the termination of LMAs or other relief. In general, the DOJ has more closely scrutinized radio mergers and acquisitions resulting in local market shares in excess of 35% of local radio advertising revenues, depending on format, signal strength and other factors. There is no precise numerical rule, however, and certain transactions resulting in more than 35% revenue shares have not been challenged, while certain other transactions may be challenged based on other criteria such as audience shares in one or more demographic groups as well as the percentage of revenue share. We estimate that we have more than a 35% share of radio advertising revenues in many of our markets.
We are aware that the DOJ commenced, and subsequently discontinued, investigations of several of our prior acquisitions. The DOJ can be expected to continue to enforce the antitrust laws in this manner, and there can be no assurance that future acquisitions will not be the subject of an investigation or enforcement action by the DOJ or the FTC. Similarly, there can be no assurance that the DOJ, the FTC or the FCC will not prohibit such acquisitions, require that they be restructured, or in appropriate cases, require that we divest stations we already own in a particular market or divest specific lines of business. In addition, private parties may under certain circumstances bring legal action to challenge an acquisition under the antitrust laws.
As part of its review of certain radio station acquisitions, the DOJ has stated publicly that it believes that commencement of operations under LMAs, JSAs and other similar agreements customarily entered into in connection with radio station ownership assignments and transfers prior to the expiration of the waiting period under the HSR Act could violate the HSR Act. In connection with acquisitions subject to the waiting period under the HSR Act, we will not commence operation of any affected station to be acquired under an LMA, a JSA, or similar agreement until the waiting period has expired or been terminated.
No assurances can be provided that actual, threatened or possible future DOJ or FTC action in connection with potential transactions would not have a material adverse effect on our ability to enter into or consummate various transactions, or operate any acquired stations at any time in the future.
Executive Officers of the Company
The following table sets forth certain information with respect to our executive officers as of
March 11, 2019
:
|
Name
|
Age
|
Position(s)
|
||
|
Mary G. Berner
|
59
|
President and Chief Executive Officer
|
||
|
John Abbot
|
56
|
Executive Vice President, Treasurer and Chief Financial Officer
|
||
|
Richard S. Denning
|
52
|
Executive Vice President, Secretary and General Counsel
|
||
|
Suzanne M. Grimes
|
60
|
Executive Vice President of Corporate Marketing and President of Westwood One
|
||
Mary G. Berner
is our President and Chief Executive Officer. Ms. Berner was initially elected to the Board of Directors at our 2015 annual meeting of stockholders. Prior to being appointed as Chief Executive Officer in October 2015, Ms. Berner served as President and Chief Executive Officer of MPA - The Association of Magazine Media since September 2012. From 2007 to 2011, she served as Chief Executive Officer of Reader's Digest Association. Before that, from November 1999 until January 2006, she led Fairchild Publications, Inc., first as President and Chief Executive Officer and then as President of Fairchild and as an officer of Condé Nast. She has also held leadership roles at Glamour and TV Guide. Ms. Berner serves and has served on a variety of industry and not-for-profit boards. Ms. Berner received her Bachelor of Arts from the College of the Holy Cross.
John Abbot
is
our Executive Vice President, Treasurer, and Chief Financial Officer. Mr. Abbot joined Cumulus Media in July 2016. Prior to joining the Company, Mr. Abbot served as Executive Vice President and Chief Financial Officer of Telx Holdings Inc., a leading provider of connectivity, co-location and cloud services in the data center industry, from 2014 through 2015. Prior to Telx, which was sold to Digital Realty Trust in October 2015, Mr. Abbot served as Chief Financial Officer of Insight Communications Company, Inc., a cable television business, for eight years. During the prior nine years, he worked in the Global Media and Communications Group of the Investment Banking Division at Morgan Stanley, where he ultimately was a Managing Director. Mr. Abbot began his financial career as an associate at Goldman, Sachs & Co., and prior to that served as a Surface Warfare Officer in the U.S. Navy for six years. He received a bachelor’s degree in Systems Engineering from the U.S. Naval Academy, an ME in Industrial Engineering from The Pennsylvania State University, and an MBA from Harvard Business School.
Richard S. Denning
is our Executive Vice President, Secretary and General Counsel. Prior to joining the Company in February, 2002, Mr. Denning was an attorney with Dow, Lohnes & Albertson, PLLC (“DL&A”) within DL&A’s corporate
15
practice group in Atlanta, advising a number of media and communications companies on a variety of corporate and transactional matters. Mr. Denning also spent four years in DL&A’s Washington, D.C. office and has extensive experience in regulatory proceedings before the FCC. Mr. Denning has been a member of the Pennsylvania Bar since 1991, the District of Columbia Bar since 1993, and the Georgia Bar since 2000. He is a graduate of The National Law Center, George Washington University.
Suzanne M. Grimes
is our Executive Vice President of Corporate Marketing and President of Westwood One. Prior to joining our Company in January 2016, Ms. Grimes served as Founder and Chief Executive Officer of Jott LLC, a consultancy for media and technology start-ups, since January 2015. From December 2012 to September 2014, Ms. Grimes served as President and Chief Operating Officer of Clear Channel Outdoor North America. Prior to that, Ms. Grimes held leadership roles at News Corp, Condé Nast and Reader’s Digest and previously served on the Board of the Outdoor Advertising Association of America and MPA - The Association of Magazine Media. She currently serves on the board of the Radio Advertising Bureau.
Ms. Grimes earned a Bachelor of Science degree in Business Administration from Georgetown University.
Available Information
The Company files annual, quarterly and current reports, proxy statements and other information with the SEC. The SEC maintains an Internet site that contains reports, proxy and information statements, and other information regarding issuers that file electronically with the SEC at http://www.sec.gov. Our Internet site address is
www.cumulus.com.
The information on our website is not incorporated by reference or part of this or any report we file with or furnish to the SEC. On our site we make available, free of charge, our most recent Annual Report on Form 10-K, subsequent quarterly reports, our proxy statements and other information we file with the SEC, as soon as reasonably practicable after such documents are filed.
|
Item 1A.
|
Risk Factors
|
Many statements contained or incorporated by reference in this Report are forward-looking in nature. These statements are based on our current plans, intentions or expectations, and actual results could differ materially as we cannot guarantee that we will achieve these plans, intentions or expectations. See “— Cautionary Statement Regarding Forward-Looking Statements.” Forward-looking statements are subject to numerous risks and uncertainties, including those specifically identified below. The Company cautions you not to place undue reliance on forward-looking statements, which speak only as of the date hereof. Additional factors not presently known to the Company, or that the Company does not currently believe to be material, may also cause actual results to differ materially from expectations. Except as may be required by law, the Company undertakes no obligation to update or alter these forward-looking statements, whether as a result of new information, future events, or otherwise.
We must continue to respond to the rapid changes in technology, services and standards that characterize our industry in order to remain competitive. Our failure to timely or appropriately respond to any such changes could materially adversely affect our business and results of operations.
The radio broadcasting industry is subject to technological change, evolving industry standards and the emergence of other media technologies and services with which we compete for listeners and advertising dollars. We may not have the resources to acquire and deploy other technologies or to create or introduce new services that could effectively compete with these other technologies. Competition arising from other technologies or regulatory change may have a material adverse effect on us, and on the radio broadcasting industry as a whole. Various other audio technologies and services have been developed which compete for listeners and advertising dollars traditionally spent on radio advertising including:
|
•
|
personal digital audio and video devices (e.g. smart phones, tablets);
|
|
•
|
satellite delivered digital radio services that offer numerous programming channels such as Sirius Satellite Radio;
|
|
•
|
audio programming by internet content providers, internet radio stations such as Pandora, cable systems, direct broadcast satellite systems and other digital audio broadcast formats;
|
|
•
|
low power FM radio stations, which are non-commercial FM radio broadcast outlets that serve small, localized areas;
|
|
•
|
applications that permit users to listen to programming on a time-delayed basis and to fast-forward through programming and/or advertisements (e.g. podcasts); and
|
|
•
|
search engine and e-commerce websites where a significant portion of their revenues are derived from advertising dollars such as Google and Yelp.
|
These or other new technologies have the potential to change the means by which advertisers can reach target audiences most effectively. We cannot predict the effect, if any, that competition arising from these or other technologies or regulatory change may have on the radio broadcasting industry as a whole.
16
We operate in a very competitive business environment and a decrease in our ratings or market share would adversely affect our revenues.
The radio broadcasting industry is very competitive. The success of each of our stations depends largely upon rates it can charge for its advertising which, in turn, depends on, among other things, the number of local advertising competitors and the overall demand for advertising within individual markets. These conditions are subject to change and highly susceptible to both micro- and macro-economic conditions.
Audience ratings and market shares fluctuate, and any adverse change in a particular market could have a material adverse effect on ratings and, consequently, the revenue of stations located in that market. While we already compete with other stations with comparable programming formats in many of our markets, any one of our stations could suffer a reduction in ratings or revenue and could require increased promotion and other expenses, and, consequently, could experience reduced operating results, if:
|
•
|
another radio station in the market were to convert its programming format to a format similar to our station or launch aggressive promotional campaigns;
|
|
•
|
a new station were to adopt a competitive format;
|
|
•
|
we experience increased competition from non-radio sources;
|
|
•
|
there is a shift in population, demographics, audience tastes or other factors beyond our control;
|
|
•
|
an existing competitor were to strengthen its operations; or
|
|
•
|
any one or all of our stations were unable to maintain or increase advertising revenue or market share for any other reasons.
|
The Telecommunications Act of 1996 (“Telecom Act”) opened up markets to competition by removing regulatory barriers to entry. The Telecom Act may allow for the further consolidation of ownership of radio broadcasting stations in markets in which we operate or may operate in the future, which could further increase competition in these markets. In addition, some competing owners may be larger and have substantially more financial and other resources than we do, which could provide them with certain advantages in competing against us. The lifting of cross ownership rules by the FCC in 2018 further removed barriers to competition from local media companies who might purchase radio station in our markets. As a result of all the foregoing, there can be no assurance that the competitive environment will not affect us, and that any one or all of our stations will be able to maintain or increase advertising revenue market share.
The success of our business is dependent upon advertising revenues, which are seasonal and cyclical, and also fluctuate as a result of a number of factors, some of which are beyond our control.
Our main source of revenue is the sale of advertising. Our ability to sell advertising depends on, among other things:
|
•
|
economic conditions in the areas where our stations are located and in the nation as a whole;
|
|
•
|
national and local demand for radio advertising;
|
|
•
|
the popularity of the programming offered by our stations;
|
|
•
|
changes in the population demographics in the areas where our stations are located;
|
|
•
|
local and national advertising price fluctuations, which can be affected by the availability of programming, the popularity of programming, and the relative supply of and demand for commercial advertising;
|
|
•
|
the capability and effectiveness of our sales organization;
|
|
•
|
our competitors’ activities, including increased competition from other advertising-based mediums;
|
|
•
|
decisions by advertisers to withdraw or delay planned advertising expenditures for any reason; and
|
|
•
|
other factors beyond our control.
|
Our operations and revenues also tend to be seasonal in nature, with generally lower revenue generated in the first quarter of the year and generally higher revenue generated in the second and fourth quarters of the year. The seasonality of our business reflects the adult orientation of our formats and relationship between advertising purchases on these formats and the retail cycle. This seasonality causes and will likely continue to cause a variation in our quarterly operating results. Such variations could have a material effect on the timing of our cash flows. In addition, our revenues tend to fluctuate between years, consistent with, among other things, increased advertising expenditures in even-numbered years by political candidates, political parties and special interest groups.
17
The loss of affiliation agreements by our radio networks could materially adversely affect our financial condition and results of operations.
We have approximately
8,000
broadcast radio stations affiliated with our Westwood One network. Westwood One receives advertising inventory from its affiliated stations, either in the form of stand-alone advertising time within a specified time period or commercials inserted by its radio networks into their programming. In addition, primarily with respect to satellite radio providers, we receive a fee for providing such programming. The loss of network affiliation agreements by Westwood One could adversely affect our results of operations by reducing the audience available for our network programming and, therefore, its attractiveness to advertisers. Renewals of such agreements on less favorable terms may also adversely affect our results of operations through reductions of advertising revenue or increases expenses.
The Term Loan Agreement contains certain restrictions and limitations that could significantly affect Cumulus’s ability to operate its business, as well as significantly affect its liquidity.
The Term Loan Agreement contains a number of significant covenants that could adversely affect Cumulus’s ability to operate its businesses, as well as significantly affect its liquidity, and therefore could adversely affect Cumulus’s results of operations. These covenants restrict (subject to certain exceptions) Cumulus’s ability to: incur additional indebtedness; grant liens; consummate mergers, acquisitions, consolidations, liquidations and dissolutions; sell assets; make investments, loans and advances; make payments and modifications to subordinated and other material debt instruments; enter into transactions with affiliates; consummate sale-leaseback transactions; change its fiscal year; enter into hedging arrangements; allow third parties to manage its stations, and sell substantially all of the stations’ programming or advertising; transfer or assign FCC licenses to third parties; and change its lines of business.
The breach of any covenants or obligations in the Term Loan, not otherwise waived or amended, could result in a default under the Term Loan Agreement and could trigger acceleration of those obligations. Any default under the Term Loan could adversely affect Cumulus’s growth, financial condition, results of operations and ability to make payments on debt.
Disruptions or security breaches of our information technology infrastructure could interfere with our operations, compromise client information and expose us to liability, possibly causing our business and reputation to suffer.
Any internal technology error or failure impacting systems hosted internally or externally, or any large scale external interruption in technology infrastructure we depend on, such as power, telecommunications or the Internet, may disrupt our technology network. Any individual, sustained or repeated failure of technology could negatively impact our operations and customer service and result in increased costs or reduced revenues. Our technology systems and related data also may be vulnerable to a variety of sources of interruption as a result of events beyond our control, including natural disasters, terrorist attacks, telecommunications failures, computer viruses, hackers and other security issues. While we have in place, and continue to invest in, technology security initiatives and disaster recovery plans, these measures may not be adequate or implemented properly to prevent a business disruption and its adverse financial impact and consequences to our business's reputation.
In addition, as a part of our ordinary business operations, we may collect and store sensitive data, including personal information of our clients, listeners and employees. The secure operation of the networks and systems on which this type of information is stored, processed and maintained is critical to our business operations and strategy. Any compromise of our technology systems resulting from attacks by hackers or breaches as a result of employee error or malfeasance could result in the loss, disclosure, misappropriation of or access to clients’, listeners’, employees’ or business partners’ information. Any such loss, disclosure, misappropriation or access could result in legal claims or proceedings, significant liability or regulatory penalties under laws protecting the privacy of personal information, disrupt operations and damage our reputation, any or all of which could have a material adverse affect our business.
18
We have written off, and could in the future be required to write off a significant portion of the fair value of our FCC licenses, which may adversely affect our financial condition and results of operations.
As of
December 31, 2018
, our (Successor Company) FCC licenses comprised 52.6% of our assets. Each year, and more frequently on an interim basis if appropriate, we are required by Accounting Standards Codification (“ASC”) Topic 350,
Intangibles — Goodwill and Other (
“
ASC350
”
)
, to assess the fair value of our FCC broadcast licenses to determine whether the carrying value of those assets is impaired. Significant judgments are required to estimate the fair value of reporting units including estimating future cash flows, near-term and long-term revenue growth, and determining appropriate discount rates, among other assumptions. During the year ended December 31, 2017, we (Predecessor Company) recorded an impairment charge of $335.9 million on our FCC licenses. During the year ended December 31, 2016, we (Predecessor Company) recorded an impairment charge of $603.1 million on our goodwill and FCC licenses. Future impairment reviews could result in additional impairment charges. Any such impairment charges could materially adversely affect our financial results for the periods in which they are recorded.
The public market for our Class A Common Stock may be volatile.
The market price for our Class A common stock could be subject to wide fluctuations as a result of such factors as:
• the total number of shares of Class A common stock available to trade and the low trading volume of the stock;
• the total amount of our indebtedness and our ability to service that debt;
• conditions and trends in the radio broadcasting industry;
• actual or anticipated variations in our operating results, including audience share ratings and financial results;
• estimates of our future performance and/or operations;
• changes in financial estimates by securities analysts;
• technological innovations;
• competitive developments;
• adoption of new accounting standards affecting companies in general or affecting companies in the radio broadcasting industry in particular; and
• general market conditions and other factors.
Further, the stock markets, and in particular the NASDAQ Global Market, the market on which our Class A common
stock is listed, from time to time have experienced extreme price and volume fluctuations that were not necessarily related or
proportionate to the operating performance of the affected companies. In addition, general economic, political and market
conditions such as recessions, interest rate movements or international currency fluctuations, may adversely affect the market
price of our Class A common stock.
We are exposed to credit risk on our accounts receivable. This risk is heightened during periods of uncertain economic conditions.
Our outstanding accounts receivable are not covered by collateral or credit insurance. While we have procedures to monitor and limit exposure to credit risk on our receivables, which risk is heightened during periods of uncertain economic conditions, there can be no assurance such procedures will effectively limit our credit risk and enable us to avoid losses, which could have a material adverse effect on our financial condition and operating results. We also maintain reserves to cover the uncollectibilty of a portion of our accounts receivable. There can be no assurance that such bad debt reserves will be sufficient.
We are dependent on key personnel.
Our business is and is expected to continue to be managed by a small number of key management and operating personnel, and the loss of one or more of these individuals could have a material adverse effect on our business. We believe that our future success will depend in large part on our ability to attract and retain highly skilled and qualified personnel and to effectively train and manage our employee base. Although we have entered into employment and other retention agreements with some of our key management personnel that include provisions restricting their ability to compete with us under specified circumstances, we cannot be assured that all of those restrictions would be enforced if challenged in court.
We also from time to time enter into agreements with on-air personalities with large loyal audiences in their individual markets to protect our interests in those relationships that we believe to be valuable. The loss of one or more of these
19
personalities could result in losses of audience share in that particular market which, in turn, could adversely affect revenues in that particular market.
The broadcasting industry is subject to extensive and changing federal regulation.
The radio broadcasting industry is subject to extensive regulation by the FCC under the Communications Act. We are required to obtain licenses from the FCC to operate our stations. Licenses are normally granted for a term of eight years and are renewable. Although the vast majority of FCC radio station licenses are routinely renewed, we cannot assure you that the FCC will grant our existing or future renewal applications or that the renewals will not include conditions out of the ordinary course. The non-renewal, or renewal with conditions, of one or more of our licenses could have a material adverse effect on us.
We must also comply with the extensive FCC regulations and policies on the ownership and operation of our radio stations. FCC regulations limit the number of radio stations that a licensee can own in a market, which could restrict our ability to acquire radio stations that could be material to our overall financial performance or our financial performance in a particular market.
The FCC also requires radio stations to comply with certain technical requirements to limit interference between two or more radio stations. Despite those limitations, a dispute could arise whether another station is improperly interfering with the operation of one of our stations or another radio licensee could complain to the FCC that one our stations is improperly interfering with that licensee’s station. There can be no assurance as to how the FCC might resolve such a dispute. These FCC regulations and others may change over time, and we cannot assure you that those changes would not have a material adverse effect on our business and results of operations.
Legislation and regulation of digital media businesses, including privacy and data protection regimes, could create unexpected costs, subject us to enforcement actions for compliance failures, or cause us to change our digital media technology platform or business model.
U.S. and foreign governments have enacted, considered or are currently considering legislation or regulations that relate to digital advertising, including, for example, regulations related to the online collection and use of anonymous user data and unique device identifiers, such as Internet Protocol addresses (“IP address”), unique mobile device identifiers or geo-location data and other privacy and data protection regulation. Such legislation or regulations could affect the costs of doing business online, and could reduce the demand for our digital solutions or otherwise harm our digital operations. For example, a wide variety of state, national and international laws and regulations apply to the collection, use, retention, protection, disclosure, transfer and other processing of personal data. While we take measures to protect the security of information that we collect, use and disclose in the operation of our business, such measures may not always be effective. Data protection and privacy-related laws and regulations are evolving and could result in ever-increasing regulatory and public scrutiny and escalating levels of enforcement and sanctions. In addition, it is possible that these laws and regulations may be interpreted and applied in a manner that is inconsistent from one jurisdiction to another and may conflict with other rules or our business practices. Any failure, or perceived failure, by us to comply with U.S. federal, state, or international laws, including laws and regulations governing privacy, data security or consumer protection, could result in proceedings against us by governmental entities, consumers or others. Any such proceedings could force us to spend significant amounts in defense of these proceedings, distract our management, result in fines or require us to pay significant monetary damages, damage our reputation, adversely affect the demand for our services, increase our costs of doing business or otherwise cause us to change our business practices or limit or inhibit our ability to operate or expand our digital operations
The FCC has been vigorous in its enforcement of its rules and regulations, including its indecency, sponsorship identification and EAS rules, violations of which could have a material adverse effect on our business.
The Company is subject to many rules and regulations that govern the operations of its radio stations. The FCC has previously imposed, or sought to impose, fines on the Company, such as a $540,000 penalty imposed on us in early 2016 for sponsorship identification violations occurring in 2011, nearly all of which occurred prior to the Company’s ownership of the station and continued for approximately one month thereafter. The FCC also has shortened the license renewal terms for certain of our radio stations in response to rule violations. It also is not uncommon for a radio station and the FCC to seek to settle alleged rule violations prior to the issuance of an order that would impose fines and other penalties, but such settlements or consent decrees usually result in the station owner paying money to the FCC. Notwithstanding the efforts by the Company to prevent violations of FCC rules and regulations, however, it is likely that the Company will continue to be subject to such penalties (whether through the issuance of orders by the FCC or the execution of settlement agreements) given the number of radio stations owned and/or operated by the Company, and those penalties could be substantial.
20
FCC’s regulations prohibit the broadcast of “obscene” material at any time, and “indecent” material between the hours of 6:00 a.m. and 10:00 p.m. The FCC has historically enforced licensee compliance in this area through the assessment of monetary forfeitures. Such forfeitures may include: (i) imposition of the maximum authorized fine for egregious cases ($397,251 for a single violation, up to a maximum of $3,666,930 for a continuing violation); and (ii) imposition of fines on a per utterance basis instead of a single fine for an entire program. While we have no knowledge of any pending complaints before the FCC alleging that obscene or indecent material has been broadcast on any of our stations, such complaints may have been, or in the future may be, filed against our stations.
The FCC has recently increased its enforcement of regulations requiring a radio station to include an on-air announcement which identifies the sponsor of all advertisements and other matter broadcast by any radio station for which any money, service or other valuable consideration is received. Fines for such violations can be substantial as they are dependent on the number of times a particular advertisement is broadcast. Similarly, the FCC has recently sought to impose substantial fines on broadcasters who transmit Emergency Alert System (“EAS”) codes, or simulations thereof, in the absence of an actual emergency or authorized test of the EAS. In 2014, for instance, the FCC imposed a fine of $1.9 million on three media companies, and last year imposed a fine of $1 million on a radio broadcaster, in each case based on a determined misuse of EAS tones.
The Company is currently subject to, and may become subject to new, FCC inquiries or proceedings related to our stations’ broadcasts or operations. We cannot predict the outcome of such inquiries and proceedings, but to the extent that such inquiries or proceedings result in the imposition of fines (alone or in the aggregate), a settlement with the FCC, revocation of any of our station licenses or denials of license renewal applications, our results of operation and business could be materially adversely affected.
Legislation could require radio broadcasters to pay additional royalties, including to additional parties such as record labels or recording artists.
We currently pay royalties to song composers and publishers through BMI, ASCAP, SESAC and GMR but not to record labels or recording artists for exhibition or use of over the air broadcasts of music. From time to time, Congress considers legislation which could change the copyright fees and the procedures by which the fees are determined. The legislation historically has been the subject of considerable debate and activity by the broadcast industry and other parties affected by the proposed legislation. It cannot be predicted whether any proposed future legislation will become law or what impact it would have on our results from operations, cash flows or financial position.
We are a holding company with no material independent assets or operations and we depend on our subsidiaries for cash.
We are a holding company with no material independent assets or operations, other than our investments in our subsidiaries. Because we are a holding company, we are dependent upon the payment of dividends, distributions, loans or advances to us by our subsidiaries to fund our obligations. These payments could be or become subject to restrictions under applicable laws in the jurisdictions in which our subsidiaries operate. Payments by our subsidiaries are also contingent upon the subsidiaries’ earnings. If we are unable to obtain sufficient funds from our subsidiaries to fund our obligations, our financial condition and ability to meet our obligations may be adversely affected.
Cautionary Statement Regarding Forward-Looking Statements
This Form 10-K contains and incorporates by reference “forward-looking statements” within the meaning of Section 27A of the Securities Act of 1933 (the “Securities Act”) and Section 21E of the Securities Exchange Act of 1934 (the “Exchange Act”). For purposes of federal and state securities laws, forward-looking statements are all statements other than those of historical fact and are typically identified by the words “believes,”, "contemplates", “expects,” “anticipates,” “continues,” “intends,” “likely,” “may,” “plans,” “potential,” “should,” “will” and similar expressions, whether in the negative or the affirmative. These statements include statements regarding the intent, belief or current expectations of Cumulus and its directors and officers with respect to, among other things, future events, financial results and financial trends expected to impact Cumulus.
21
Such forward-looking statements are and will be, as the case may be, subject to change and subject to many risks, uncertainties and other factors relating to our operations and business environment, which may cause our actual results to be materially different from any future results, expressed or implied, by such forward-looking statements. Factors that could cause actual results to differ materially from these forward-looking statements include, but are not limited to, the following:
|
•
|
our achievement of certain expected revenue results, including as a result of factors or events that are unexpected or otherwise outside of our control;
|
|
•
|
our ability to generate sufficient cash flows to service our debt and other obligations and our ability to access capital, including debt or equity;
|
|
•
|
general economic or business conditions affecting the radio broadcasting industry which may be less favorable than expected, decreasing spending by advertisers;
|
|
•
|
changes in market conditions which could impair our intangible assets and the effects of any material impairment of our intangible assets;
|
|
•
|
our ability to execute our business plan and strategy;
|
|
•
|
our ability to attract, motivate and/or retain key executives and associates;
|
|
•
|
increased competition in the radio broadcasting industry and our ability to respond to changes in technology in order to remain competitive;
|
|
•
|
disruptions or security breaches of our information technology infrastructure;
|
|
•
|
the impact of current, pending or future legislation and regulations, antitrust considerations, and pending or future litigation or claims;
|
|
•
|
changes in regulatory or legislative policies or actions or in regulatory bodies;
|
|
•
|
changes in uncertain tax positions and tax rates;
|
|
•
|
changes in the financial markets;
|
|
•
|
changes in capital expenditure requirements;
|
|
•
|
changes in interest rates;
|
|
•
|
the possibility that we may be unable to achieve any expected cost-saving or operational synergies in connection with any acquisitions or business improvement initiatives, or achieve them within the expected time periods;
and
|
|
•
|
other risks and uncertainties referenced from time to time in this Form 10-K and other filings of ours with the SEC or not currently known to us or that we do not currently deem to be material.
|
Many of these factors are beyond our control or are difficult to predict, and their ultimate impact could be material. We caution you not to place undue reliance on any forward-looking statements, which speak only as of the date of this Form 10-K. Except as may be required by law, we do not undertake any obligation to update or alter any forward-looking statements, whether as a result of new information, future events or otherwise.
|
Item 1B.
|
Unresolved Staff Comments
|
Not applicable.
|
Item 2.
|
Properties
|
The types of properties required to support each of our radio stations include studios, sales offices, and tower sites. A station’s studios are generally housed with its offices in a business district within the station’s community of license or largest nearby community. The tower sites are generally located in an area to provide maximum market coverage.
We own properties throughout our markets and also lease additional studio, office facilities, and tower sites in support of our business operations. We also lease corporate office space in Atlanta, Georgia, and office space in New York, New York; Dallas, Texas; Denver, Colorado and Los Angeles, California for the production and distribution of our radio network. We do not anticipate any difficulties in renewing any facility leases or in leasing alternative or additional space, if required. We own substantially all of our equipment used in operating our stations and network, consisting principally of transmitting antennae, transmitters, studio equipment, and general office equipment.
No single property is material to our operations. We believe that our properties are generally in good condition and suitable for our operations; however, our studios, office space and transmission facilities require periodic maintenance and refurbishment.
|
Item 3.
|
Legal Proceedings
|
In August 2015, the Company was named as a defendant in two separate putative class action lawsuits relating to its use and public performance of certain sound recordings fixed prior to February 15, 1972 (the "Pre-1972 Recordings"). The first suit, ABS Entertainment, Inc., et. al. v, Cumulus Media Inc., was filed in the United States District Court for the Central District
22
of California and alleged, among other things, copyright infringement under California state law, common law conversion, misappropriation and unfair business practices. On December 11, 2015, this suit was dismissed without prejudice. The second suit, ABS Entertainment, Inc., v. Cumulus Media Inc., was filed in the United States District Court for the Southern District of New York and claimed, among other things, common law copyright infringement and unfair competition. The New York lawsuit was stayed pending an appeal before the Second Circuit involving unrelated third parties over whether the owner of a Pre-1972 Recording holds an exclusive right to publicly perform that recording under New York common law. On December 20, 2016, the New York Court of Appeals held that New York common law does not recognize a right of public performance for owners of pre-1972 Recordings. As a result of that case (to which Cumulus Media Inc. was not a party) the New York case against Cumulus Media Inc., was voluntarily dismissed by the plaintiffs on April 3, 2017. On October 11, 2018, President Trump signed the Orrin G. Hatch-Bob Goodlatte Music Modernization Act into law, which, among other things, provides new federal rights going forward for owners of pre-1972 Recordings. The question of whether public performance rights existed for Pre-1972 recordings under state law prior to the enactment of the new Music Modernization Act is still being litigated in the Ninth Circuit as a result of a case filed in California. Cumulus is not a party to that case, and the Company is not yet able to determine what effect that proceeding will have, if any, on its financial position, results of operations or cash flows.
The Company currently is, and expects that from time to time in the future it will be, party to, or a defendant in, various other claims or lawsuits that are generally incidental to its business. The Company expects that it will vigorously contest any such claims or lawsuits and believes that the ultimate resolution of any such known claim or lawsuit will not have amaterial adverse effect on the Company’s consolidated financial position, results of operations or cash flows.
|
Item 4.
|
Mine Safety Disclosures
|
Not applicable.
23
PART II
|
Item 5.
|
Market for Registrant's Common Equity, Related Stockholder Matters and Issuer Purchases of Equity Securities
|
Market Information For Common Stock
Shares of our Class A common stock, par value $0.01 per share, were delisted from the National Association of Securities Dealers Automated Quotations (the "NASDAQ") Capital Market as of November 22, 2017, because the Company was not compliant with Nasdaq Listing Rules 5550(a)(2) and 5550(b)(1). On November 29, 2017, the Company's stock began trading on the OTC Markets. After our emergence from Chapter 11, we applied for relisting on the NASDAQ Global Market and on July 27, 2018, we received notification from NASDAQ that our application was approved. Our Class A common stock began
trading on the NASDAQ Global Market at the open of business on August 1, 2018.
Holders
As of
March 11, 2019
, there were approximately
289
holders of record of our Class A common stock and
72
holders of record of our Class B common stock. The number of holders of our Class A common stock does not include any estimate of the number of beneficial holders whose shares may be held of record by brokerage firms or clearing agencies.
Dividends
We have not declared or paid any cash dividends on our common stock since our inception and do not currently anticipate paying any cash dividends on our common stock in the foreseeable future. We intend to retain future earnings for use in our business. We are currently subject to certain restrictions under the terms of the Term Loan with respect to the payment of dividends. For a more detailed discussion of the restrictions in our Credit Agreement, see Note 9, “Long-Term Debt” in the consolidated financial statements included elsewhere in this Form 10-K.
Stock Performance Graph
The following graph compares the total stockholder return on our Class A common stock for the period from July 31, 2018, the month our stock began trading, through
December 31, 2018
with that of (1) the Standard & Poor’s 500 Stock Index (“S&P 500”); (2) NASDAQ; and (3) an index (the “Radio Index”) comprised of radio broadcast and media companies (see note (1) below). The total return calculation set forth below assumes $100 invested on July 31, 2018 with reinvestment of dividends into additional shares of the same class of securities at the frequency with, and in the amounts on, which dividends were paid on such securities through
December 31, 2018
. The stock price performance shown in the graph below should not be considered indicative of expected future stock price performance.
24
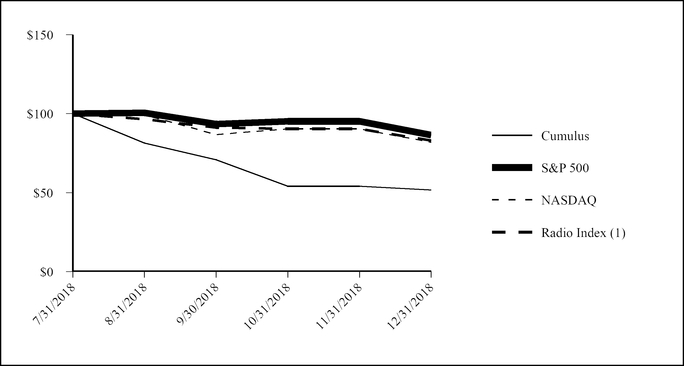
CUMULATIVE TOTAL RETURN
|
7/31/2018
|
8/31/2018
|
9/30/2018
|
10/31/2018
|
11/30/2018
|
12/31/2018
|
||||||||||||||||||
|
Cumulus (1)
|
$
|
100.00
|
|
$
|
81.44
|
|
$
|
70.86
|
|
$
|
54.07
|
|
$
|
54.07
|
|
$
|
51.67
|
|
|||||
|
S&P 500 Index
|
100.00
|
|
100.43
|
|
93.46
|
|
95.13
|
|
95.13
|
|
86.39
|
|
|||||||||||
|
NASDAQ Index
|
100.00
|
|
99.22
|
|
86.76
|
|
90.39
|
|
90.39
|
|
81.82
|
|
|||||||||||
|
Radio Index (2)
|
100.00
|
|
96.44
|
|
91.24
|
|
90.34
|
|
90.34
|
|
83.01
|
|
|||||||||||
|
(1)
|
As discussed in further detail above, the Company's common stock was delisted from the NASDAQ as of November 22, 2017 and relisted on August 1, 2018, therefore, the Company's stock price performance was calculated starting after that date.
|
|
(2)
|
The Radio Index consists of the following companies: Beasley Broadcast Group, Inc., iHeartMedia, Inc. (formerly Clear Channel Holdings, Inc.), Emmis Communications Corp., Entercom Communications Corp., Urban One, Inc. (formerly Radio One, Inc.), and Saga Communications, Inc.
|
Pursuant to SEC rules, this “Stock Performance Graph” section of this Form 10-K is not deemed “filed” with the SEC and shall not be deemed incorporated by reference in any filing under the Securities Act of 1933 or the Securities Exchange Act of 1934.
|
Item 6.
|
Selected Financial Data
|
Set forth below is selected historical consolidated financial information as of
December 31, 2018
for the Successor Company, and as of December 31,
2017
,
2016
,
2015
and
2014
for the Predecessor Company and for the Successor Company period June 4, 2018 through December 31, 2018, the Predecessor Company period January 1, 2018 through June 3, 2018 and the Predecessor Company years ended December 31, 2017, 2016, 2015 and 2014 (dollars in thousands, except per share data). The selected historical consolidated financial information as of
December 31, 2018
for the Successor Company and December 31,
2017
for the Predecessor Company, and for the Successor Company period June 4, 2018 through December 31, 2018, the Predecessor Company period January 1, 2018 through June 3, 2018 and the Predecessor Company years ended December 31,
2017
and
2016
, has been derived from our consolidated financial statements and related notes beginning on page F-2 of this Form 10-K. The selected historical consolidated financial information for the Predecessor Company as of December 31,
2016
,
2015
and
2014
, and for the years ended December 31,
2015
and
2014
, has been derived from our consolidated financial statements, and related notes previously filed with the SEC but not included or incorporated by reference herein.
25
The selected historical consolidated financial information, which has been adjusted to reflect our October 12, 2016 one-for-eight (1:8) reverse stock split, presented below does not contain all of the information you should consider when evaluating Cumulus and should be read in conjunction with “Management’s Discussion and Analysis of Financial Condition and Results of Operations” and our consolidated financial statements, and notes thereto, beginning on page F-2 of this Form 10-K. Various factors are expected to have an effect on our financial condition and results of operations in the future. You should also read this selected historical consolidated financial information in conjunction with the information under “Risk Factors” included elsewhere in this Annual Report on Form 10-K.
|
|
Successor Company
|
Predecessor Company
|
|||||||||||||||||||||
|
|
Period from June 4, 2018 through December 31, 2018
|
Period from January 1, 2018 through June 3, 2018
|
Year Ended December 31, 2017
|
Year Ended December 31, 2016
|
Year Ended December 31, 2015
|
Year Ended December 31, 2014
|
|||||||||||||||||
|
STATEMENT OF OPERATIONS DATA:
|
|||||||||||||||||||||||
|
Net revenue
|
$
|
686,436
|
|
$
|
453,924
|
|
$
|
1,135,662
|
|
$
|
1,141,400
|
|
$
|
1,168,679
|
|
$
|
1,263,423
|
|
|||||
|
Content costs
|
238,888
|
|
163,885
|
|
409,213
|
|
432,077
|
|
396,426
|
|
433,596
|
|
|||||||||||
|
Selling, general & administrative expenses
|
276,551
|
|
195,278
|
|
471,300
|
|
468,603
|
|
477,327
|
|
470,441
|
|
|||||||||||
|
Depreciation and amortization
|
34,060
|
|
22,046
|
|
62,239
|
|
87,267
|
|
102,105
|
|
115,275
|
|
|||||||||||
|
LMA fees
|
2,471
|
|
1,809
|
|
10,884
|
|
12,824
|
|
10,129
|
|
7,195
|
|
|||||||||||
|
Corporate expenses (including non-cash stock-based compensation expense)
|
31,714
|
|
17,169
|
|
59,062
|
|
40,148
|
|
73,403
|
|
76,428
|
|
|||||||||||
|
Loss (gain) on sale of assets or stations
|
103
|
|
158
|
|
(2,499
|
)
|
(95,695
|
)
|
2,856
|
|
(1,342
|
)
|
|||||||||||
|
Impairment of intangible assets and goodwill (1)
|
—
|
|
—
|
|
335,909
|
|
604,965
|
|
565,584
|
|
—
|
|
|||||||||||
|
Impairment charges - equity interest in Pulser Media Inc.
|
—
|
|
—
|
|
—
|
|
—
|
|
19,364
|
|
—
|
|
|||||||||||
|
Operating income (loss)
|
102,649
|
|
53,579
|
|
(210,446
|
)
|
(408,789
|
)
|
(478,515
|
)
|
161,830
|
|
|||||||||||
|
Reorganization items, net (2)
|
—
|
|
466,201
|
|
(31,603
|
)
|
—
|
|
—
|
|
—
|
|
|||||||||||
|
Interest expense
|
(50,718
|
)
|
(260
|
)
|
(126,952
|
)
|
(138,634
|
)
|
(141,679
|
)
|
(145,533
|
)
|
|||||||||||
|
Interest income
|
36
|
|
50
|
|
136
|
|
493
|
|
433
|
|
1,388
|
|
|||||||||||
|
Gain (loss) on early extinguishment of debt
|
201
|
|
—
|
|
(1,063
|
)
|
8,017
|
|
13,222
|
|
—
|
|
|||||||||||
|
Other (expense) income, net
|
(3,096
|
)
|
(273
|
)
|
(363
|
)
|
2,039
|
|
14,205
|
|
4,338
|
|
|||||||||||
|
Income (loss) from continuing operations before income taxes
|
49,072
|
|
519,297
|
|
(370,291
|
)
|
(536,874
|
)
|
(592,334
|
)
|
22,023
|
|
|||||||||||
|
Income tax benefit (expense)
|
12,353
|
|
176,859
|
|
163,726
|
|
26,154
|
|
45,840
|
|
(10,254
|
)
|
|||||||||||
|
Net income (loss)
|
$
|
61,425
|
|
$
|
696,156
|
|
$
|
(206,565
|
)
|
$
|
(510,720
|
)
|
$
|
(546,494
|
)
|
$
|
11,769
|
|
|||||
|
Income (loss) attributable to common shareholders
|
$
|
61,425
|
|
$
|
696,156
|
|
$
|
(206,565
|
)
|
$
|
(510,720
|
)
|
$
|
(546,494
|
)
|
$
|
11,769
|
|
|||||
|
Basic (loss) income per common share
|
$
|
3.07
|
|
$
|
23.73
|
|
$
|
(7.05
|
)
|
$
|
(17.45
|
)
|
$
|
(18.72
|
)
|
$
|
0.40
|
|
|||||
|
Diluted (loss) income per common share
|
$
|
3.05
|
|
$
|
23.73
|
|
$
|
(7.05
|
)
|
$
|
(17.45
|
)
|
$
|
(18.72
|
)
|
$
|
0.40
|
|
|||||
26
|
Successor Company
|
Predecessor Company
|
||||||||||||||||||||||
|
Period from June 4, 2018 through December 31,
|
Period from January 1, 2018 through June 3,
|
Year Ended December 31,
|
Year Ended December 31,
|
Year Ended December 31,
|
Year Ended December 31,
|
||||||||||||||||||
|
2018
|
2018
|
2017
|
2016
|
2015
|
2014
|
||||||||||||||||||
|
OTHER DATA:
|
|||||||||||||||||||||||
|
Cash flows related to:
|
|||||||||||||||||||||||
|
Operating activities
|
$
|
32,398
|
|
$
|
29,132
|
|
$
|
86,596
|
|
$
|
35,745
|
|
$
|
90,413
|
|
$
|
136,796
|
|
|||||
|
Investing activities
|
$
|
(33,098
|
)
|
$
|
(14,019
|
)
|
$
|
(25,842
|
)
|
$
|
83,898
|
|
$
|
(7,961
|
)
|
$
|
(15,572
|
)
|
|||||
|
Financing activities
|
$
|
(57,613
|
)
|
$
|
(38,652
|
)
|
$
|
(88,148
|
)
|
$
|
(19,997
|
)
|
$
|
(50,085
|
)
|
$
|
(146,745
|
)
|
|||||
|
Capital expenditures
|
$
|
(15,684
|
)
|
$
|
(14,019
|
)
|
$
|
(31,932
|
)
|
$
|
(23,037
|
)
|
$
|
(19,236
|
)
|
$
|
(19,006
|
)
|
|||||
|
Successor Company
|
Predecessor Company
|
||||||||||||||||||||||
|
December 31, 2018
|
December 31, 2017
|
December 31, 2016
|
December 31, 2015
|
December 31, 2014
|
|||||||||||||||||||
|
BALANCE SHEET DATA:
|
|||||||||||||||||||||||
|
Total assets
|
$
|
1,775,152
|
|
$
|
2,027,319
|
|
$
|
2,412,691
|
|
$
|
3,002,388
|
|
$
|
3,717,572
|
|
||||||||
|
Long-term debt (including current portion) (3)
|
$
|
1,243,299
|
|
$
|
2,332,209
|
|
$
|
2,384,157
|
|
$
|
2,402,901
|
|
$
|
2,457,258
|
|
||||||||
|
Total stockholders’ equity
(deficit)
|
$
|
389,829
|
|
$
|
(696,115
|
)
|
$
|
(491,738
|
)
|
$
|
16,032
|
|
$
|
541,580
|
|
||||||||
|
(1)
|
Impairment charges in 2017, 2016 and 2015 were recorded in connection with our interim and annual impairment testing under ASC 350. See Note 7, “Intangible Assets and Goodwill,” in the consolidated financial statements included elsewhere in this Form 10-K for further discussion.
|
|
(2)
|
Reorganization items recorded in connection with our chapter 11 cases. See Note 3, “Fresh Start Accounting,” in the consolidated financial statements included elsewhere in this Form 10-K for further discussion.
|
|
(3)
|
Long-term debt was classified in the Company's liabilities subject to compromise as of December 31, 2017.
|
|
Item 7.
|
Management's Discussion and Analysis of Financial Condition and Results of Operations
|
General Overview
The following discussion of our financial condition and results of operations should be read in conjunction with the other information contained in this Form 10-K, including our consolidated financial statements and notes thereto beginning on page F-2 in this Form 10-K, as well as the information set forth in Item 1A "Risk Factors." This discussion, as well as various other sections of this Annual Report, contains and refers to statements that constitute “forward-looking statements” within the meaning of the Private Securities Litigation Reform Act of 1995 and other federal securities laws. Such statements are any statements other than those of historical fact and relate to our intent, belief or current expectations primarily with respect to our future operating, financial and strategic performance. Any such forward-looking statements are not guarantees of future performance and may involve risks and uncertainties. Actual results may differ from those contained in or implied by the forward-looking statements as a result of various factors. For more information, see "Cautionary Statements Regarding Forward-Looking Statements."
For additional information about certain of the matters discussed and described in the following Management's Discussion and Analysis of Financial Condition and Results of Operations, including certain defined terms used herein, see the notes to the accompanying audited consolidated financial statements included elsewhere in this Annual Report.
27
Our Business and Operating Overview
A leader in the radio broadcasting industry, CUMULUS MEDIA combines high-quality local programming with iconic, nationally syndicated media, sports and entertainment brands to deliver premium content choices to the
245 million
people reached each week through our
433
owned-and-operated stations broadcasting in
88
US media markets (including eight of the top 10), approximately
8,000
broadcast radio stations affiliated with our Westwood One network and numerous digital channels. Together, the Cumulus/Westwood One platforms make Cumulus one of the few media companies that can provide advertisers with national reach and local impact. Cumulus/Westwood One is the exclusive radio broadcast partner to some of the largest brands in sports, entertainment, news, and talk, including the NFL, the NCAA, the Masters, the Olympics, the GRAMMYs, the Academy of Country Music Awards, the American Music Awards, the Billboard Music Awards, Westwood One News, and more. Additionally we are the nation's leading provider of country music and lifestyle content through our NASH brand, which serves country fans nationwide through radio programming, exclusive digital content, and live events.
We generate revenue through monetization of our programming content and other sources across the following four major revenue streams:
Broadcast advertising revenue.
Most of our revenue is generated through the sale of terrestrial, broadcast radio advertising time to local, regional, and national clients. Local spot and regional spot advertising is sold by Cumulus employed sales personnel. National spot advertising for our owned-and-operated stations is marketed and sold by both Katz Media in an outsourced arrangement as well as our own internal national sales team, which collectively market to advertisers under the sales brand of Westwood One Media Sales. Network advertising airing across our owned, operated and affiliated stations is sold by our internal sales team located across the United States under the Westwood One brand to predominantly national and regional advertisers.
Digital advertising and marketing services revenue.
We generate digital advertising revenue from the sale of advertising and promotional opportunities across our streaming audio network, digital commerce platform, websites and mobile applications. We operate one of the largest streaming audio advertising networks in the United States, including owned and operated internet radio simulcast stations. We also sell advertising adjacent to, or embedded in, podcasts through our network of owned and third party podcasts. In addition, we sell an array of digital marketing services such as, email marketing, geo-targeting, website building and hosting, reputation management and search engine optimization within our Cumulus C-Suite digital marketing solutions portfolio to existing and new clients of our radio stations. Additionally, our digital commerce platform utilizes couponing and discounted daily deals to create promotional opportunities for local, regional and national clients under our Sweet Deals and Incentrev brands. We also sell banner and other display ads across more than 400 local radio station websites, mobile applications, and ancillary custom client microsites.
Political advertising revenue.
Political advertising revenue is generated across all of our broadcast and digital assets, but we highlight it as a separate category to distinguish its highly cyclical nature versus our core advertising revenue. Political advertising is generally strongest during even-numbered years, especially in the fourth quarter of such years, when most national and state elections are conducted. In addition to candidate advertising revenue, we also receive advertising revenue from special interest and advocacy groups.
License fees & other
. All other non-advertising based revenue types in which the Company participates are aggregated in our License fees & other revenue category. This includes fees we receive for content licensing, subleases and rents (predominantly for owned towers), proprietary software licensing, and all other revenue.
Seasonality and Cyclicality
Our advertising revenues vary by quarter throughout the year. As is typical with advertising revenue supported businesses, our first calendar quarter typically produces the lowest revenues of any quarter during the year, as advertising generally declines following the winter holidays. The second and fourth calendar quarters typically produce the highest revenues for the year. In addition, our revenues tend to fluctuate between years, consistent with, among other things, increased advertising expenditures in even-numbered years by political candidates, political parties and special interest groups. This political spending typically is heaviest during the fourth quarter.
28
Emergence from Chapter 11
For information about our emergence from Chapter 11 see Item 1 "Business - Emergence from Chapter 11" and the notes to the accompanying audited consolidated financial statements included elsewhere in this Annual Report.
29
Advertising Revenue
Our primary source of revenue is the sale of advertising time. Our sales of advertising time are primarily affected by the demand from local, regional and national advertisers, which also impacts the advertising rates we charge. Advertising demand and rates are based primarily on the ability to attract audiences in the demographic groups targeted by such advertisers, as measured principally by various ratings agencies on a periodic basis. We endeavor to provide compelling programming and form connections between our on-air talent and listeners in order to develop strong listener loyalty, and we believe that the diversification of our formats and programs, including non-music formats and proprietary content, helps to insulate us from the effects of changes in the musical tastes of the public with respect to any particular format.
We strive to maximize revenue by managing our on-air inventory of advertising time and adjusting prices based on supply and demand. The optimal number of advertisements available for sale depends on the programming format of a particular radio program. Each program has a general target level of on-air inventory available for advertising. This target level of advertising inventory may vary at different times of the day but tends to remain stable over time. We seek to broaden our base of advertisers in each of our markets by providing a wide array of audience demographic segments across each cluster of stations, thereby providing potential advertisers with an effective means to reach a targeted demographic group. Our advertising contracts are generally short-term. We generate most of our revenue from local and regional advertising, which is sold primarily by a station’s sales staff.
In addition to local and regional advertising revenues, we monetize our available inventory in both national spot and network sales marketplaces using our national platform. To effectively deliver network advertising for our customers, we distribute content and programming through third party affiliates in order to reach a broader national audience. Typically, in exchange for the right to broadcast radio network programming, third party affiliates remit a portion of their advertising time to us, which is then aggregated into packages focused on specific demographic groups and sold by us to our advertiser clients that want to reach those demographic groups on a national basis.
In the broadcasting industry, we sometimes utilize trade or barter agreements that exchange advertising time for goods or services such as travel or lodging, instead of for cash. Trade revenue totaled $26.5 million, $18.9 million, $40.1 million and $37.7 million for the Successor Company from period June 4, 2018 through December 31, 2018, the Predecessor Company period from January 1, 2018 through June 3, 2018 and the Predecessor Company years ended December 31, 2017 and 2016, respectively.
We continually evaluate opportunities to increase revenues through new platforms, including technology-based initiatives. As a result of those revenue increasing opportunities, our operating results in any period may be affected by the incurrence of advertising and promotion expenses that typically do not have an effect on revenue generation until future periods, if at all. In addition, as part of this evaluation we also from time to time reorganize and discontinue certain redundant and/or unprofitable content vehicles across our platform which we expect will impact our broadcast revenues in the future. To date inflation has not had a material effect on our revenues or results of operations, although no assurances can be provided that material inflation in the future would not materially adversely affect us.
Non-GAAP Financial Measure
From time to time we utilize certain financial measures that are not prepared or calculated in accordance with GAAP to assess our financial performance and profitability. Consolidated adjusted earnings before interest, taxes, depreciation, and amortization (“Adjusted EBITDA”) and segment Adjusted EBITDA are the financial metrics by which management and the chief operating decision maker allocate resources of the Company and analyze the performance of the Company as a whole and each of our reportable segments, respectively. Management also uses this measure to determine the contribution of our core operations to the funding of our corporate resources utilized to manage our operations and our non-operating expenses including debt service and acquisitions. In addition, consolidated Adjusted EBITDA is a key metric for purposes of calculating and determining our compliance with certain covenants contained in our Credit Agreement.
In determining Adjusted EBITDA, we exclude from net income items not related to core operations and those that are non-cash including: interest, taxes, depreciation, amortization, stock-based compensation expense, gain or loss on the exchange, sale, or disposal of any assets or stations, early extinguishment of debt, local marketing agreement fees, expenses relating to acquisitions, divestitures, restructuring costs, reorganization items and non-cash impairments of assets, if any.
30
Management believes that Adjusted EBITDA, although not a measure that is calculated in accordance with GAAP, is commonly employed by the investment community as a measure for determining the market value of a media company and comparing the operational and financial performance among media companies. Management has also observed that Adjusted EBITDA is routinely utilized to evaluate and negotiate the potential purchase price for media companies. Given the relevance to our overall value, management believes that investors consider the metric to be extremely useful.
Adjusted EBITDA should not be considered in isolation or as a substitute for net income (loss), operating income, cash flows from operating activities or any other measure for determining our operating performance or liquidity that is calculated in accordance with GAAP. In addition, Adjusted EBITDA may be defined or calculated differently by other companies, and comparability may be limited.
31
Consolidated Results of Operations
Analysis of Consolidated Statements of Operations
For the purposes of the analysis of the results presented herein, the Company is presenting the combined results of operations for the period June 4, 2018 to December 31, 2018 of the Successor Company with the period January 1, 2018 to June 3, 2018 of the Predecessor Company. Although this presentation is not in accordance with accounting principles generally accepted in the United States, the Company believes presenting and analyzing the combined results allows for a more meaningful comparison of results for the twelve-month period ended December 31, 2018 to the twelve months ended December 31, 2017. The following selected data from our audited consolidated statements of operations and other supplementary data should be referred to while reading the results of operations discussion that follows (dollars in thousands):
|
Successor Company
|
Predecessor Company
|
Predecessor Company
|
Non- GAAP
|
|||||||||||||||||||||||||||||
|
|
Period from June 4, 2018 through December 31,
|
Period from January 1, 2018 through June 3,
|
Non-GAAP Combined Period Year Ended December 31,
|
Year ended December 31,
|
Year ended December 31,
|
2018 vs 2017 Change
|
2017 vs 2016 Change
|
|||||||||||||||||||||||||
|
|
2018
|
2018
|
2018
|
2017
|
2016
|
$
|
%
|
$
|
%
|
|||||||||||||||||||||||
|
STATEMENT OF OPERATIONS DATA:
|
||||||||||||||||||||||||||||||||
|
Net revenue
|
$
|
686,436
|
|
$
|
453,924
|
|
$
|
1,140,360
|
|
$
|
1,135,662
|
|
$
|
1,141,400
|
|
$
|
4,698
|
|
0.4
|
%
|
$
|
(5,738
|
)
|
-0.5
|
%
|
|||||||
|
Content costs
|
238,888
|
|
163,885
|
|
402,773
|
|
409,213
|
|
432,077
|
|
(6,440
|
)
|
-1.6
|
%
|
(22,864
|
)
|
-5.3
|
%
|
||||||||||||||
|
Selling, general & administrative expenses
|
276,551
|
|
195,278
|
|
471,829
|
|
471,300
|
|
468,603
|
|
529
|
|
0.1
|
%
|
2,697
|
|
0.6
|
%
|
||||||||||||||
|
Depreciation and amortization
|
34,060
|
|
22,046
|
|
56,106
|
|
62,239
|
|
87,267
|
|
(6,133
|
)
|
-9.9
|
%
|
(25,028
|
)
|
-28.7
|
%
|
||||||||||||||
|
Local marketing agreement fees
|
2,471
|
|
1,809
|
|
4,280
|
|
10,884
|
|
12,824
|
|
(6,604
|
)
|
-60.7
|
%
|
(1,940
|
)
|
-15.1
|
%
|
||||||||||||||
|
Corporate expenses (including stock-based compensation expense)
|
31,714
|
|
17,169
|
|
48,883
|
|
59,062
|
|
40,148
|
|
(10,179
|
)
|
-17.2
|
%
|
18,914
|
|
47.1
|
%
|
||||||||||||||
|
Loss (gain) on sale of assets or stations
|
103
|
|
158
|
|
261
|
|
(2,499
|
)
|
(95,695
|
)
|
2,760
|
|
**
|
|
93,196
|
|
**
|
|
||||||||||||||
|
Impairment of intangible assets and goodwill
|
—
|
|
—
|
|
—
|
|
335,909
|
|
604,965
|
|
(335,909
|
)
|
**
|
|
(269,056
|
)
|
**
|
|
||||||||||||||
|
Operating income (loss)
|
102,649
|
|
53,579
|
|
156,228
|
|
(210,446
|
)
|
(408,789
|
)
|
366,674
|
|
**
|
|
198,343
|
|
-48.5
|
%
|
||||||||||||||
|
Reorganization items, net
|
—
|
|
466,201
|
|
466,201
|
|
(31,603
|
)
|
—
|
|
**
|
|
**
|
|
**
|
|
**
|
|
||||||||||||||
|
Interest expense
|
(50,718
|
)
|
(260
|
)
|
(50,978
|
)
|
(126,952
|
)
|
(138,634
|
)
|
75,974
|
|
-59.8
|
%
|
11,682
|
|
-8.4
|
%
|
||||||||||||||
|
Interest income
|
36
|
|
50
|
|
86
|
|
136
|
|
493
|
|
(50
|
)
|
-36.8
|
%
|
(357
|
)
|
-72.4
|
%
|
||||||||||||||
|
Gain (loss) on early extinguishment of debt
|
201
|
|
—
|
|
201
|
|
(1,063
|
)
|
8,017
|
|
1,264
|
|
**
|
|
(9,080
|
)
|
**
|
|
||||||||||||||
|
Other (expense) income, net
|
(3,096
|
)
|
(273
|
)
|
(3,369
|
)
|
(363
|
)
|
2,039
|
|
(3,006
|
)
|
**
|
|
(2,402
|
)
|
**
|
|
||||||||||||||
|
Income (loss) from continuing operations before income taxes
|
49,072
|
|
519,297
|
|
568,369
|
|
(370,291
|
)
|
(536,874
|
)
|
938,660
|
|
**
|
|
166,583
|
|
**
|
|
||||||||||||||
|
Income tax benefit
|
12,353
|
|
176,859
|
|
189,212
|
|
163,726
|
|
26,154
|
|
25,486
|
|
15.6
|
%
|
137,572
|
|
**
|
|
||||||||||||||
|
Net income (loss)
|
$
|
61,425
|
|
$
|
696,156
|
|
$
|
757,581
|
|
$
|
(206,565
|
)
|
$
|
(510,720
|
)
|
$
|
964,146
|
|
**
|
|
$
|
304,155
|
|
-59.6
|
%
|
|||||||
|
OTHER DATA:
|
|
|
|
|||||||||||||||||||||||||||||
|
Adjusted EBITDA
|
$
|
153,835
|
|
|
$
|
80,512
|
|
$
|
234,347
|
|
$
|
217,751
|
|
$
|
205,867
|
|
$
|
16,596
|
|
7.6
|
%
|
$
|
11,884
|
|
5.8
|
%
|
||||||
|
**
|
Calculation is not meaningful.
|
32
Fresh Start Accounting Adjustments
The Company's operating results and key operating performance measures were not materially impacted by our emergence from Chapter 11. We believe that certain of our consolidated operating results for the period from January 1, 2018 through June 3, 2018 (“2018 Predecessor Period”), when combined with our consolidated operating results for the period from June 4, 2018 through December 31, 2018 (“Successor Period”) are comparable to certain operating results from the comparable prior year’s periods. Accordingly, we believe that discussing the combined results of operations and cash flows of the Predecessor Company and the Successor Company for the year ended December 31, 2018 is useful when analyzing certain financial performance measures. For items that are not comparable, we have included additional analysis to supplement the discussion.
2018 Successor Company Period June 4, 2018 through December 31, 2018 and Predecessor Company period January 1, 2018 through June 3, 2018 ("Successor and Predecessor Company year ended December 31, 2018") compared to Predecessor Company Year Ended
December 31, 2017
Net Revenue
Net revenue for the Successor and Predecessor
Company year ended December 31, 2018 compared to net revenue for the Predecessor Company year ended December 31, 2017 increased because of increases in national advertising revenue, digital advertising revenue and cyclical political revenue, partially offset by a decline in local broadcast advertising revenue within our radio markets and the loss of approximately $2.4 million in revenue from United States Traffic Networks (“USTN”). For a discussion of net revenue by segment and a comparison by segment of the Successor and Predecessor Company year ended December 31, 2018 and the Predecessor Company year ended December 31, 2017, see the discussion under “Segment Results of Operations”.
Content Costs
Content costs consist of all costs related to the licensing, acquisition and development of our programming. Content costs for the Successor and Predecessor
Company year ended December 31, 2018 compared to the Predecessor Company year ended December 31, 2017 decreased primarily as a result of the termination or renegotiation of certain contractual agreements, in some cases in connection with the filing of the Chapter 11 Cases and a decrease in employee costs partially offset by an increase in digital costs associated with higher digital revenue during 2018.
Selling, General & Administrative Expenses
Selling, general and administrative expenses consist of expenses related to our sales efforts and distribution of our content across our platform and overhead in our markets. Selling, general and administrative expenses for the Successor and Predecessor
Company year ended December 31, 2018 compared to the Predecessor Company year ended December 31, 2017 was essentially flat primarily as a result of lower sales commissions associated with lower broadcast revenue and the impact of our implementation of ASC 606 as well lower salary expense, ratings service fees and legal fees. These decreases were offset by a $4.1 million bad debt expense related to receivables from USTN.
Depreciation and Amortization
Depreciation and amortization for the Successor and Predecessor Company year ended December 31, 2018 are not directly comparable to depreciation and amortization for the Predecessor Company year ended December 31, 2017. During the Successor and Predecessor Company year ended December 31, 2018, depreciation and amortization expense decreased because of our application of fresh start accounting where the fair value of our fixed assets and intangible assets decreased.
Local Marketing Agreement Fees
Local marketing agreements are those agreements under which we program a radio station on behalf of another party. During the quarter ended March 31, 2018, the Company and Merlin Media, LLC (“Merlin”) amended their local marketing agreement under which the Company programmed two FM radio stations owned by Merlin. The Company ceased programming one of the stations (“WLUP”) on March 9, 2018. On June 15, 2018, the Company purchased the other station (“WKQX”) and certain intellectual property for $18.0 million in cash.
Corporate Expenses, Including Stock-based Compensation Expense and Acquisition-related and Restructuring Costs
Corporate expenses consist primarily of compensation and related costs for our executive, accounting, finance, human resources, information technology and legal personnel, and fees for professional services. Professional services are principally comprised of audit, consulting and outside legal services. Corporate expenses also include restructuring expenses and stock-
33
based compensation expense. Corporate expenses for the Successor and Predecessor Company year ended December 31, 2018 compared to the Predecessor Company year ended December 31, 2017 decreased primarily as a result of a decrease in professional fees and corporate employee costs.
Reorganization Items, Net
During the Predecessor Company period from January 1, 2018 through June 3, 2018, we recorded costs related to our Chapter 11 Cases. Reorganization items incurred as a result of the Chapter 11 Cases are presented separately in the accompanying Consolidated Statements of Operations and were as follows (dollars in thousands):
|
Predecessor Company
|
||||
|
|
Period from January 1, 2018 through June 3, 2018
|
|||
|
Gain on settlement of Liabilities subject to compromise (a)
|
$
|
726,831
|
|
|
|
Fresh start adjustments (b)
|
(179,291
|
)
|
||
|
Professional fees (c)
|
(54,386
|
)
|
||
|
Non-cash claims adjustments (d)
|
(15,364
|
)
|
||
|
Rejected executory contracts (e)
|
(5,976
|
)
|
||
|
Other (f)
|
(5,613
|
)
|
||
|
Reorganization items, net
|
$
|
466,201
|
|
|
(a) Liabilities subject to compromise have been, or will be settled in accordance with the Plan.
(b) Revaluation of certain assets and liabilities upon the adoption of fresh start accounting.
(c) Legal, financial advisory and other professional costs directly associated with the reorganization process.
(d) The carrying value of certain claims were adjusted to the estimated value of the claim that will be allowed by the Bankruptcy Court.
(e) Non-cash expenses to record estimated allowed claim amounts related to rejected executory contracts.
(f) Federal Communications Commission filing and United States Trustee fees directly associated with the reorganization process and the write-off of Predecessor director and officer insurance policies.
Interest Expense
Total interest expense for the Successor and Predecessor Company year ended December 31, 2018 is not comparable to that of the Predecessor Company year ended December 31, 2017 as we did not pay certain interest expenses during the Predecessor Company period from January 1, 2018 through June 3, 2018. During that period we made adequate protection payments on the Predecessor Term Loan in lieu of interest payments. In accordance with ASC 852, we recognized the adequate protection payments as reductions in the principal balance of the Predecessor Term Loan. We did not make any interest payments on the 7.75% Senior Notes.
During the Successor Company period from June 4, 2018 through December 31, 2018, we recorded interest expense of approximately $50.0 million on $1.3 billion in outstanding debt at an average interest rate of approximately 6.7%. During the Predecessor Company year ended December 31, 2017, we recorded and paid interest expense in accordance with the provisions of the then outstanding debt agreements prior to the Petition Date.
34
|
Successor Company
|
Predecessor Company
|
Non- GAAP Combined
|
2018 vs 2017
|
|||||||||||||||||||
|
Period from June 4, 2018 through December 31, 2018
|
Period from January 1, 2018 through June 3, 2018
|
Year Ended December 31, 2018
|
Year Ended December 31, 2017
|
$ Change
|
% Change
|
|||||||||||||||||
|
Bank borrowings – Term Loan
|
$
|
50,028
|
|
$
|
—
|
|
$
|
50,028
|
|
$
|
—
|
|
$
|
50,028
|
|
**
|
||||||
|
7.75% Senior Notes
|
—
|
|
—
|
|
—
|
|
43,335
|
|
(43,335
|
)
|
**
|
|||||||||||
|
Bank borrowings – Predecessor Term Loan
|
—
|
|
—
|
|
—
|
|
72,362
|
|
(72,362
|
)
|
**
|
|||||||||||
|
Other, including debt issue cost amortization
|
690
|
|
260
|
|
950
|
|
11,255
|
|
(10,305
|
)
|
**
|
|||||||||||
|
Interest expense
|
$
|
50,718
|
|
$
|
260
|
|
$
|
50,978
|
|
$
|
126,952
|
|
$
|
(75,974
|
)
|
**
|
||||||
|
**
|
Calculation is not meaningful.
|
Other (Expense) Income, net
During the Successor and Predecessor Company year ended December 31, 2018, we recorded a non-cash charge of $3.2 million to write off our investment in NextRadio. There were no similar charges for the Predecessor Company year ended December 31, 2017.
Income Tax Benefit
We recorded an income tax benefit on continuing operations of $12.4 million for the Successor Company period from June 4, 2018 through December 31, 2018 and income tax benefit of $176.9 million for the Predecessor Company period from January 1, 2018 through June 3, 2018 as compared to a $163.7 million benefit during the Predecessor Company year ended December 31, 2017. The tax benefits recorded in the Successor and Predecessor Company year ended December 31, 2018 were primarily the result of the bankruptcy emergence, reorganization charges and related tax elections, while the tax benefit recorded in the Predecessor Company year ended December 31, 2017 was primarily the result of pre-tax losses, the effect of a corporate tax rate change pursuant to tax reform, and the establishment of a valuation allowance related to our net operating loss deferred tax assets.
Adjusted EBITDA
As a result of the factors described above, Adjusted EBITDA for the Successor and Predecessor Company year ended December 31, 2018 compared to the Predecessor Company year ended December 31, 2017 increased. For a discussion of Adjusted EBITDA by segment and a comparison by segment of the Successor and Predecessor Company year ended December 31, 2018 to the Predecessor Company year ended December 31, 2017, see the discussion under "Segment Results of Operations."
35
Reconciliation of Non-GAAP Financial Measure
The following table reconciles Adjusted EBITDA to net income (loss) (the most directly comparable financial measure calculated and presented in accordance with GAAP) as presented in the accompanying consolidated statements of operations (dollars in thousands):
|
Successor Company
|
Predecessor Company
|
Non- GAAP Combined
|
||||||||||||||||
|
Period from June 4, 2018 through December 31, 2018
|
Period from January 1, 2018 through June 3, 2018
|
Year Ended December 31, 2018
|
Year Ended December 31, 2017
|
2018 vs 2017 % Change
|
||||||||||||||
|
GAAP net income (loss)
|
$
|
61,425
|
|
$
|
696,156
|
|
$
|
757,581
|
|
$
|
(206,565
|
)
|
**
|
|
||||
|
Income tax benefit
|
(12,353
|
)
|
(176,859
|
)
|
(189,212
|
)
|
(163,726
|
)
|
15.6
|
%
|
||||||||
|
Non-operating expenses, including net interest expense
|
53,777
|
|
483
|
|
54,260
|
|
127,179
|
|
(57.3
|
)%
|
||||||||
|
Local marketing agreement fees
|
2,471
|
|
1,809
|
|
4,280
|
|
10,884
|
|
(60.7
|
)%
|
||||||||
|
Depreciation and amortization
|
34,060
|
|
22,046
|
|
56,106
|
|
62,239
|
|
(9.9
|
)%
|
||||||||
|
Stock-based compensation expense
|
3,404
|
|
231
|
|
3,635
|
|
1,614
|
|
125.2
|
%
|
||||||||
|
Loss (gain) on sale of assets or stations
|
103
|
|
158
|
|
261
|
|
(2,499
|
)
|
**
|
|
||||||||
|
Impairment of intangible assets and goodwill
|
—
|
|
—
|
|
—
|
|
335,909
|
|
**
|
|
||||||||
|
Reorganization items, net
|
—
|
|
(466,201
|
)
|
(466,201
|
)
|
31,603
|
|
**
|
|
||||||||
|
Acquisition-related and restructuring costs
|
11,194
|
|
2,455
|
|
13,649
|
|
19,492
|
|
**
|
|
||||||||
|
Franchise and state taxes
|
(45
|
)
|
234
|
|
189
|
|
558
|
|
(66.1
|
)%
|
||||||||
|
(Gain) loss on early extinguishment of debt
|
(201
|
)
|
—
|
|
(201
|
)
|
1,063
|
|
**
|
|
||||||||
|
Adjusted EBITDA
|
$
|
153,835
|
|
$
|
80,512
|
|
$
|
234,347
|
|
$
|
217,751
|
|
7.6
|
%
|
||||
|
**
|
Calculation is not meaningful.
|
Intangible Assets (including Goodwill), net.
Intangible assets, net of amortization, were
$1,129.2 million
and
$1,422.0 million
as of
December 31, 2018
and
2017
, respectively. These intangible asset balances primarily consist of broadcast licenses and goodwill. Intangible assets, net, decreased from the prior year because our application of fresh start accounting where we recorded our assets at fair value and eliminated goodwill as of the Effective Date.
Predecessor Company Year Ended
December 31, 2017
compared to Predecessor Company Year Ended
December 31, 2016
Net Revenue
Net revenue for the year ended
December 31, 2017
decreased
$5.7 million
, or 0.5%, to
$1,135.7 million
compared to
$1,141.4 million
for the year ended
December 31, 2016
. The decrease resulted from decreases of $12.1 million and $0.9 million in political advertising and broadcast advertising, respectively, partially offset by increases of $4.6 million and $2.7 million in digital advertising and license fees and other revenue, respectively. For a discussion of net revenue by segment and a comparison between the year ended December 31, 2017 to the year ended December 31, 2016, see the discussion under "Segment Results of Operations."
Content Costs
Content costs for the year ended
December 31, 2017
decreased $22.9 million or 5.3%, to
$409.2 million
compared to
$432.1 million
for the year ended
December 31, 2016
. The decrease was primarily driven by the impact of an expense of $14.4 million at Westwood One incurred during the third quarter of 2016, related to payments to CBS to resolve previously disputed syndicated programming and network inventory expenses, and lower content costs at the Station Group, partially offset by higher content costs at Westwood One associated with increased revenue.
36
Selling, General & Administrative Expenses
Selling, general & administrative expenses for the year ended
December 31, 2017
increased $2.7 million, or 0.6%, to
$471.3 million
compared to
$468.6 million
for the year ended
December 31, 2016
. The increase resulted primarily from an increase of $4.7 million in bad debt expense.
Depreciation and Amortization
Depreciation and amortization for the year ended
December 31, 2017
decreased $25.0 million, or 28.7%, to
$62.2 million
compared to
$87.3 million
for the year ended
December 31, 2016
. This decrease was primarily caused by a decrease in amortization expense on our definite-lived intangible assets, which resulted from the accelerated amortization methodology we have applied since acquisition of these assets that is based on the expected pattern in which the underlying assets' economic benefits are being consumed.
Local Marketing Agreement Fees
Local marketing agreement fees for the year ended
December 31, 2017
decreased $1.9 million, or 15.1%, to
$10.9 million
compared to
$12.8 million
for the year ended
December 31, 2016
. This decrease was primarily related to an expense of $2.7 million for a termination of a LMA in the San Francisco market in 2016.
Corporate Expenses, Including Stock-based Compensation Expense and Acquisition-related and Restructuring Costs
Corporate expenses, including stock-based compensation expense and acquisition-related and restructuring costs for the year ended
December 31, 2017
, increased $18.9 million or 47.1%, to
$59.1 million
compared to
$40.1 million
for the year ended
December 31, 2016
. This increase was primarily the result of increased professional fees related to the Company's debt restructuring efforts, partially offset by decreases in professional services and stock-based compensation expenses.
Impairment of Intangible Assets and Goodwill
During the year ended December 31, 2017, we recorded impairment charges related to our FCC license intangible assets of $335.9 million. During the year ended December 31, 2016, we recorded impairment charges related to goodwill and intangible assets, including FCC licenses, of $568.1 million and $36.9 million, respectively. For additional information on these charges, see Note 7, Intangible Assets and Goodwill in the consolidated financial statements included elsewhere in this Form 10-K.
(Gain) Loss on Sale of Assets or Stations
During the year ended December 31, 2017, we recorded a gain on sale of assets or stations of $2.5 million primarily related to the sale of land in Salt Lake City, Utah. During the year ended December 31, 2016, we recorded a gain on sale of assets or stations of $95.7 million, primarily related to the sale of real property in Los Angeles, California.
Reorganization Items, Net
During the year ended
December 31, 2017
, we recorded costs related to our chapter 11 cases of
$31.6 million
.
Interest Expense
Interest expense for the year ended
December 31, 2017
decreased $11.7 million to
$127.0 million
compared to
$138.6 million
for the year ended
December 31, 2016
as we did not pay certain interest expenses after the Petition Date. The following summary details the components of our interest expense (dollars in thousands):
|
Predecessor Company
|
||||||||||||||
|
|
Year Ended December 31,
|
2017 vs 2016
|
||||||||||||
|
|
2017
|
2016
|
$ Change
|
% Change
|
||||||||||
|
7.75% Senior Notes
|
$
|
43,335
|
|
$
|
47,275
|
|
$
|
(3,940
|
)
|
(8.3
|
)%
|
|||
|
Bank borrowings — term loans and revolving credit facilities
|
72,362
|
|
79,451
|
|
(7,089
|
)
|
(8.9
|
)%
|
||||||
|
Other, including debt issue cost amortization
|
11,255
|
|
11,908
|
|
(653
|
)
|
(5.5
|
)%
|
||||||
|
Interest expense
|
$
|
126,952
|
|
$
|
138,634
|
|
$
|
(11,682
|
)
|
(8.4
|
)%
|
|||
37
The decrease in interest expense related to the 7.75% Senior Notes was a result of forgoing interest payments in connection with the bankruptcy petitions. As a result, the Company's interest expense for the year ended December 31, 2017 was approximately $3.9 million lower than it would have been absent the filing of the voluntary petitions for reorganization.
In addition, during the pendency of our Chapter 11 cases, we made adequate protection payments on the Predecessor Term Loan in lieu of interest payments. In accordance with ASC 852, we recognized the adequate protection payments as reductions in the principal balance of the Predecessor Term Loan.
Income Tax Benefit
We recorded an income tax benefit from operations of
$163.7 million
in
2017
as compared to an income tax benefit of
$26.2 million
during the prior year. The tax benefits recorded in both periods were primarily the result of the pre-tax losses on operations net of the amount of intangible assets impairment and, in 2017, the effect of tax reform and the establishment of a valuation allowance related to our net operating loss deferred tax assets. The Tax Cuts and Jobs Act (“the Act”) was enacted on December 22, 2017. The Act, among other changes, reduces the US federal corporate tax rate from 35% to 21% for tax years after 2017. At December 31, 2017, the Company had not completed its accounting for the tax effects of enactment of the Act; however, in certain cases, it made a reasonable estimate of the effects on its existing deferred tax balances. As described in Note 13 "Income Taxes", the Company completed its accounting for the Act during 2018.
Adjusted EBITDA
As a result of the factors described above, Adjusted EBITDA for the year ended
December 31, 2017
increased $11.9 million, or 5.8%, to
$217.8 million
compared to
$205.9 million
for the year ended
December 31, 2016
.
Reconciliation of Non-GAAP Financial Measure
The following table reconciles Adjusted EBITDA to net loss (the most directly comparable financial measure calculated and presented in accordance with GAAP) as presented in the accompanying consolidated statements of operations (dollars in thousands):
|
Predecessor Company
|
|||||||||||
|
|
Year Ended December 31,
|
||||||||||
|
|
2017
|
2016
|
% Change
|
||||||||
|
GAAP net loss
|
$
|
(206,565
|
)
|
$
|
(510,720
|
)
|
59.6
|
%
|
|||
|
Income tax benefit
|
(163,726
|
)
|
(26,154
|
)
|
**
|
||||||
|
Non-operating expenses, including net interest expense
|
127,179
|
|
136,102
|
|
(6.6
|
)%
|
|||||
|
Local marketing agreement fees
|
10,884
|
|
12,824
|
|
(15.1
|
)%
|
|||||
|
Depreciation and amortization
|
62,239
|
|
87,267
|
|
(28.7
|
)%
|
|||||
|
Stock-based compensation expense
|
1,614
|
|
2,948
|
|
(45.3
|
)%
|
|||||
|
(Gain) loss on sale of assets or stations
|
(2,499
|
)
|
(95,695
|
)
|
(97.4
|
)%
|
|||||
|
Impairment of intangible assets and goodwill
|
335,909
|
|
604,965
|
|
(44.5
|
)%
|
|||||
|
Reorganizations items, net
|
31,603
|
|
—
|
|
**
|
||||||
|
Acquisition-related and restructuring costs
|
19,492
|
|
1,817
|
|
**
|
||||||
|
Franchise and state taxes
|
558
|
|
530
|
|
5.3
|
%
|
|||||
|
Gain on early extinguishment of debt
|
1,063
|
|
(8,017
|
)
|
**
|
||||||
|
Adjusted EBITDA
|
$
|
217,751
|
|
$
|
205,867
|
|
5.8
|
%
|
|||
|
** Calculation is not meaningful
|
|||||||||||
Intangible Assets (including Goodwill), net.
Intangible assets, net of amortization, were
$1,422.0 million
and $1,791.9 as of
December 31, 2017
and
2016
, respectively. These intangible asset balances primarily consist of broadcast licenses and goodwill. Intangible assets, net, decreased from the prior year primarily as a result of impairment charges related to goodwill and indefinite-lived intangible assets and amortization recognized on definite-lived intangible assets.
Segment Results of Operations
38
The Company operates in
two
reportable segments, for which there is discrete financial information available and whose operating results are reviewed by the chief operating decision maker, the Cumulus Radio Station Group and Westwood One. Cumulus Radio Station Group revenue is derived primarily from the sale of broadcasting time to local, regional, and national advertisers. Westwood One revenue is generated primarily through network advertising. Corporate and Other includes overall executive, administrative and support functions for both of our reportable segments, including programming, finance, legal, human resources and information technology functions.
As described above, Adjusted EBITDA is a non-GAAP financial metric utilized by management to analyze the performance of each of our reportable segments. The reconciliation of segment Adjusted EBITDA to net loss is presented in Note 18, "Segment Data" of the notes to the consolidated financial statements.
The Company’s financial data by segment is presented in the tables below:
|
|
|
Period from June 4, 2018 through December 31, 2018 (Successor Company)
|
||||||||||||||
|
|
|
Cumulus Radio Station Group
|
|
Westwood One
|
|
Corporate and Other
|
|
Consolidated
|
||||||||
|
Net revenue
|
|
$
|
477,118
|
|
|
$
|
207,702
|
|
|
$
|
1,616
|
|
|
$
|
686,436
|
|
|
% of total revenue
|
69.5
|
%
|
30.3
|
%
|
0.2
|
%
|
100.0
|
%
|
||||||||
|
|
|
Period from January 1, 2018 through June 3, 2018 (Predecessor Company)
|
||||||||||||||
|
|
|
Cumulus Radio Station Group
|
|
Westwood One
|
|
Corporate and Other
|
|
Consolidated
|
||||||||
|
Net revenue
|
|
$
|
303,317
|
|
|
$
|
149,715
|
|
|
$
|
892
|
|
|
$
|
453,924
|
|
|
% of total revenue
|
66.8
|
%
|
33.0
|
%
|
0.2
|
%
|
100.0
|
%
|
||||||||
|
Year Ended December 31, 2017 (Predecessor Company)
|
||||||||||||||||
|
|
Cumulus Radio Station Group
|
Westwood One
|
Corporate and Other
|
Consolidated
|
||||||||||||
|
Net revenue
|
$
|
786,963
|
|
$
|
346,165
|
|
$
|
2,534
|
|
$
|
1,135,662
|
|
||||
|
% of total revenue
|
69.3
|
%
|
30.5
|
%
|
0.2
|
%
|
100.0
|
%
|
||||||||
Net revenue for the Successor and Predecessor
Company year ended
December 31, 2018
compared to the Predecessor Company year ended December 31, 2017 increased. The increase resulted from an increase in revenue at Westwood One, partially offset by a decrease at the Cumulus Radio Station Group, while Corporate and Other revenue was essentially flat. The decrease in revenue at the Cumulus Radio Station Group was primarily driven by decreases in local advertising revenue and the loss of revenue from WLUP. The increase in revenue at Westwood One was primarily driven by increases in broadcast and digital revenue partially offset by the loss of approximately $2.4 million in revenue from USTN.
|
|
|
Period from June 4, 2018 through December 31, 2018 (Successor Company)
|
||||||||||||||
|
|
|
Cumulus Radio Station Group
|
|
Westwood One
|
|
Corporate and Other
|
|
Consolidated
|
||||||||
|
Adjusted EBITDA
|
|
$
|
131,509
|
|
|
$
|
39,743
|
|
|
$
|
(17,417
|
)
|
|
$
|
153,835
|
|
|
|
|
Period from January 1, 2018 through June 3, 2018 (Predecessor Company)
|
||||||||||||||
|
|
|
Cumulus Radio Station Group
|
|
Westwood One
|
|
Corporate and Other
|
|
Consolidated
|
||||||||
|
Adjusted EBITDA
|
|
$
|
76,009
|
|
|
$
|
19,210
|
|
|
$
|
(14,707
|
)
|
|
$
|
80,512
|
|
39
|
Year Ended December 31, 2017 (Predecessor Company)
|
||||||||||||||||
|
Cumulus Radio Station Group
|
Westwood One
|
Corporate and Other
|
Consolidated
|
|||||||||||||
|
Adjusted EBITDA
|
$
|
197,775
|
|
$
|
54,260
|
|
$
|
(34,284
|
)
|
$
|
217,751
|
|
||||
Adjusted EBITDA for the Successor and Predecessor
Company year ended
December 31, 2018
compared to the Predecessor Company year ended December 31, 2017 increased as a result of adjusted EBITDA increases at each segment. Adjusted EBITDA at the Cumulus Radio Station Group increased as a result of lower costs, the increase at Westwood One was a result of increased revenues and certain lower content expenses, partially offset by the $4.1 million in bad debt expense and $2.4 million in lost revenue related to USTN and increases in expenses related to higher revenue. Adjusted EBITDA at Corporate and Other increased as a result of a decline in expenses.
|
Year Ended December 31, 2017 (Predecessor Company)
|
||||||||||||||||
|
|
Cumulus Radio Station Group
|
Westwood One
|
Corporate and Other
|
Consolidated
|
||||||||||||
|
Net revenue
|
$
|
786,963
|
|
$
|
346,165
|
|
$
|
2,534
|
|
$
|
1,135,662
|
|
||||
|
% of total revenue
|
69.3
|
%
|
30.5
|
%
|
0.2
|
%
|
100.0
|
%
|
||||||||
|
$ Change from year ended December 31, 2016
|
$
|
(15,433
|
)
|
$
|
9,555
|
|
$
|
140
|
|
$
|
(5,738
|
)
|
||||
|
% Change from year ended December 31, 2016
|
(1.9
|
)%
|
2.8
|
%
|
5.8
|
%
|
(0.5
|
)%
|
||||||||
|
Year Ended December 31, 2016 (Predecessor Company)
|
||||||||||||||||
|
|
Cumulus Radio Station Group
|
Westwood One
|
Corporate and Other
|
Consolidated
|
||||||||||||
|
Net revenue
|
$
|
802,396
|
|
$
|
336,610
|
|
$
|
2,394
|
|
$
|
1,141,400
|
|
||||
|
% of total revenue
|
70.3
|
%
|
29.5
|
%
|
0.2
|
%
|
100.0
|
%
|
||||||||
Net revenue for the Predecessor
Company year ended
December 31, 2017
decreased $5.7 million, or
0.5%
, to
$1,135.7 million
, compared to
$1,141.4 million
for the Predecessor
Company year ended
December 31, 2016
. The decrease resulted from decreases of $15.4 million in the Cumulus Radio Station Group, partially offset by an increase of $9.6 million and $0.1 million in Westwood Once and Corporate and Other revenue, respectively. The decrease in revenue at Cumulus Radio Station Group was primarily driven by decreases local advertising revenue and political advertising revenue. The increase in revenue at Westwood One was primarily driven by increases in broadcast revenue.
|
Year Ended December 31, 2017 (Predecessor Company)
|
||||||||||||||||
|
Cumulus Radio Station Group
|
Westwood One
|
Corporate and Other
|
Consolidated
|
|||||||||||||
|
Adjusted EBITDA
|
$
|
197,775
|
|
$
|
54,260
|
|
$
|
(34,284
|
)
|
$
|
217,751
|
|
||||
|
$ change from year ended December 31, 2016
|
$
|
(13,569
|
)
|
$
|
28,897
|
|
$
|
(3,444
|
)
|
$
|
11,884
|
|
||||
|
% change from year ended December 31, 2016
|
(6.4
|
)%
|
113.9
|
%
|
11.2
|
%
|
5.8
|
%
|
||||||||
|
Year Ended December 31, 2016 (Predecessor Company)
|
||||||||||||||||
|
Cumulus Radio Station Group
|
Westwood One
|
Corporate and Other
|
Consolidated
|
|||||||||||||
|
Adjusted EBITDA
|
$
|
211,344
|
|
$
|
25,363
|
|
$
|
(30,840
|
)
|
$
|
205,867
|
|
||||
40
Adjusted EBITDA for the Predecessor
Company year ended
December 31, 2017
increased
$11.9 million
, or
5.8%
, to
$217.8 million
from
$205.9 million
for the Predecessor
Company year ended
December 31, 2016
. The increase resulted from an Adjusted EBITDA increase of
$28.9 million
at Westwood One, partially offset by decreases of $13.6 million and
$3.4 million
in the Cumulus Radio Station Group and Corporate and Other, respectively. Adjusted EBITDA at Westwood One increased as a result of $9.6 million of increased revenues and a $14.4 million decrease in expenses at Westwood One related to payments to CBS during 2016, to resolve previously disputed syndicated programming and network inventory expenses, partially offset by increases in expenses related to the higher revenue. Adjusted EBITDA at Radio Station Group decreased as a result of a $15.4 million decline in revenue which was partially offset by lower expenses, which included a $3.2 million expense in 2016 related to a one-time correction to music licensing fees and a decrease in content and personnel expenses.
The following tables reconcile segment net income (loss), the most directly comparable financial measure calculated and presented in accordance with GAAP, to segment Adjusted EBITDA for the periods presented above (dollars in thousands):
|
Period from June 4, 2018 through December 31, 2018 (Successor Company)
|
||||||||||||||||
|
|
Cumulus Radio Station Group
|
Westwood One
|
Corporate and Other
|
Consolidated
|
||||||||||||
|
GAAP net income (loss)
|
$
|
112,385
|
|
$
|
24,713
|
|
$
|
(75,673
|
)
|
$
|
61,425
|
|
||||
|
Income tax benefit
|
—
|
|
—
|
|
(12,353
|
)
|
(12,353
|
)
|
||||||||
|
Non-operating (income) expense, including net interest expense
|
(6
|
)
|
500
|
|
53,283
|
|
53,777
|
|
||||||||
|
Local marketing agreement fees
|
2,402
|
|
—
|
|
69
|
|
2,471
|
|
||||||||
|
Depreciation and amortization
|
16,619
|
|
14,595
|
|
2,846
|
|
34,060
|
|
||||||||
|
Stock-based compensation expense
|
—
|
|
—
|
|
3,404
|
|
3,404
|
|
||||||||
|
Loss (gain) on sale of assets or stations
|
104
|
|
(1
|
)
|
—
|
|
103
|
|
||||||||
|
Loss on early extinguishment of debt
|
—
|
|
—
|
|
(201
|
)
|
(201
|
)
|
||||||||
|
Acquisition-related and restructuring costs
|
5
|
|
(64
|
)
|
11,253
|
|
11,194
|
|
||||||||
|
Franchise and state taxes
|
—
|
|
—
|
|
(45
|
)
|
(45
|
)
|
||||||||
|
Adjusted EBITDA
|
$
|
131,509
|
|
$
|
39,743
|
|
$
|
(17,417
|
)
|
$
|
153,835
|
|
||||
|
Period from January 1, 2018 through June 3, 2018 (Predecessor Company)
|
||||||||||||||||
|
|
Cumulus Radio Station Group
|
Westwood One
|
Corporate and Other
|
Consolidated
|
||||||||||||
|
GAAP net (loss) income
|
$
|
(477,966
|
)
|
$
|
259,441
|
|
$
|
914,681
|
|
$
|
696,156
|
|
||||
|
Income tax benefit
|
—
|
|
—
|
|
(176,859
|
)
|
(176,859
|
)
|
||||||||
|
Non-operating (income) expense, including net interest expense
|
(2
|
)
|
204
|
|
281
|
|
483
|
|
||||||||
|
Local marketing agreement fees
|
1,809
|
|
—
|
|
—
|
|
1,809
|
|
||||||||
|
Depreciation and amortization
|
10,251
|
|
9,965
|
|
1,830
|
|
22,046
|
|
||||||||
|
Stock-based compensation expense
|
—
|
|
—
|
|
231
|
|
231
|
|
||||||||
|
Loss on sale of assets or stations
|
14
|
|
—
|
|
144
|
|
158
|
|
||||||||
|
Reorganization items, net
|
541,903
|
|
(251,487
|
)
|
(756,617
|
)
|
(466,201
|
)
|
||||||||
|
Acquisition-related and restructuring costs
|
—
|
|
1,087
|
|
1,368
|
|
2,455
|
|
||||||||
|
Franchise and state taxes
|
—
|
|
—
|
|
234
|
|
234
|
|
||||||||
|
Adjusted EBITDA
|
$
|
76,009
|
|
$
|
19,210
|
|
$
|
(14,707
|
)
|
$
|
80,512
|
|
||||
41
|
Year Ended December 31, 2017 (Predecessor Company)
|
||||||||||||||||
|
|
Cumulus Radio Station Group
|
Westwood One
|
Corporate and Other
|
Consolidated
|
||||||||||||
|
GAAP net (loss) income
|
$
|
(185,223
|
)
|
$
|
28,861
|
|
$
|
(50,203
|
)
|
$
|
(206,565
|
)
|
||||
|
Income tax benefit
|
—
|
|
—
|
|
(163,726
|
)
|
(163,726
|
)
|
||||||||
|
Non-operating expense, including net interest expense
|
(6
|
)
|
537
|
|
126,648
|
|
127,179
|
|
||||||||
|
Local marketing agreement fees
|
10,884
|
|
—
|
|
—
|
|
10,884
|
|
||||||||
|
Depreciation and amortization
|
38,734
|
|
21,836
|
|
1,669
|
|
62,239
|
|
||||||||
|
Stock-based compensation expense
|
—
|
|
—
|
|
1,614
|
|
1,614
|
|
||||||||
|
(Gain) loss on sale of assets or stations
|
(2,523
|
)
|
—
|
|
24
|
|
(2,499
|
)
|
||||||||
|
Reorganization Cost
|
—
|
|
—
|
|
31,603
|
|
31,603
|
|
||||||||
|
Impairment of intangible assets and goodwill
|
335,909
|
|
—
|
|
—
|
|
335,909
|
|
||||||||
|
Acquisition-related and restructuring costs
|
—
|
|
3,026
|
|
16,466
|
|
19,492
|
|
||||||||
|
Franchise and state taxes
|
—
|
|
—
|
|
558
|
|
558
|
|
||||||||
|
Loss on early extinguishment of debt
|
—
|
|
—
|
|
1,063
|
|
1,063
|
|
||||||||
|
Adjusted EBITDA
|
$
|
197,775
|
|
$
|
54,260
|
|
$
|
(34,284
|
)
|
$
|
217,751
|
|
||||
|
Year Ended December 31, 2016 (Predecessor Company)
|
||||||||||||||||
|
|
Cumulus Radio Station Group
|
Westwood One
|
Corporate and Other
|
Consolidated
|
||||||||||||
|
GAAP net loss
|
$
|
(363,046
|
)
|
$
|
(8,692
|
)
|
$
|
(138,982
|
)
|
$
|
(510,720
|
)
|
||||
|
Income tax benefit
|
—
|
|
—
|
|
(26,154
|
)
|
(26,154
|
)
|
||||||||
|
Non-operating expense, including net interest expense
|
13
|
|
122
|
|
135,967
|
|
136,102
|
|
||||||||
|
Local marketing agreement fees
|
12,824
|
|
—
|
|
—
|
|
12,824
|
|
||||||||
|
Depreciation and amortization
|
54,071
|
|
31,178
|
|
2,018
|
|
87,267
|
|
||||||||
|
Stock-based compensation expense
|
—
|
|
—
|
|
2,948
|
|
2,948
|
|
||||||||
|
Gain on sale of assets or stations
|
(95,667
|
)
|
—
|
|
(28
|
)
|
(95,695
|
)
|
||||||||
|
Impairment of intangible assets and goodwill
|
603,149
|
|
1,816
|
|
—
|
|
604,965
|
|
||||||||
|
Acquisition-related and restructuring costs
|
—
|
|
939
|
|
878
|
|
1,817
|
|
||||||||
|
Franchise and state taxes
|
—
|
|
—
|
|
530
|
|
530
|
|
||||||||
|
Gain on early extinguishment of debt
|
—
|
|
—
|
|
(8,017
|
)
|
(8,017
|
)
|
||||||||
|
Adjusted EBITDA
|
$
|
211,344
|
|
$
|
25,363
|
|
$
|
(30,840
|
)
|
$
|
205,867
|
|
||||
42
Liquidity and Capital Resources
As of December 31, 2018, we had
$30.0 million
of cash and cash equivalents including restricted cash. We generated cash from operating activities of
$32.4 million
for the period June 4, 2018 through December 31, 2018. The Predecessor Company generated cash from operating activities of $29.1 million,
$86.6 million
and
$35.7 million
for the from period January 1, 2018 through June 3, 2018, the year ended December 31, 2017 and the year ended December 31, 2016 respectively.
Historically, our principal sources of funds primarily have been cash flow from operations and borrowings under credit
facilities in existence from time to time. Our cash flow from operations remains subject to factors such as fluctuations in advertising media preferences and changes in demand caused by shifts in population, station listenership, demographics and audience tastes. In addition, our cash flows may be affected if customers are not able to pay, or delay payment of, accounts receivable that are owed to us, which risks may be exacerbated in challenging or otherwise uncertain economic periods. In recent periods, the Company has experienced reductions in revenue and profitability from prior historical periods because of continuing market revenue pressures and cost escalations built into certain contracts. Notwithstanding this, we believe that our national platform and extensive station portfolio representing a broad diversity in format, listener base, geography, and advertiser base helps us maintain a more stable revenue stream by reducing our dependence on any single demographic, region or industry. Future reductions in revenue or profitability are possible and could have a material adverse effect on the Company’s results of operations, financial condition or liquidity.
From time to time we have evaluated, and expect that we will continue to evaluate, opportunities to obtain additional capital from the divestiture of radio stations or other assets where the net value accretion realized in a sale exceeds the value that management believes could be realized over time by continuing to operate the assets, or that are not consistent with, or do not complement, our strategic objectives, subject to market and other conditions in existence at that time.
As previously disclosed, based on the results of required annual or interim impairment testing in certain recent historical periods, the Predecessor Company incurred a non-cash impairment charge against FCC licenses of $335.9 million for the year ended December 31, 2017 and non-cash impairment charges totaling $603.1 million against goodwill and FCC licenses for the year ended December 31, 2016. Such non-cash charges reduced the Predecessor Company’s reported operating results in those periods; however, as these charges did not require a cash outlay, they had no effect on liquidity. Any future impairment charges could materially adversely affect our financial results in the period in which they are recorded.
Credit Agreement
As described in Item 1 "Business - Emergence from Chapter 11" and the notes to the accompanying audited consolidated financial statements, on the Effective Date, the Company and certain of its subsidiaries entered into the Credit Agreement. Pursuant to the Credit Agreement, the lenders party thereto were deemed to have provided the Company with a $1.3 billion senior secured Term Loan.
Amounts outstanding under the Credit Agreement bear interest at a per annum rate equal to (i) the London Inter-bank Offered Rate (“LIBOR”) plus an applicable margin of 4.50%, subject to a LIBOR floor of 1.00%, or (ii) the Alternative Base Rate (as defined below) plus an applicable margin of 3.50%, subject to an Alternative Base Rate floor of 2.00%. The Alternative Base Rate is defined, for any day, as the per annum rate equal to the highest of (i) the Federal Funds Rate, as published by the Federal Reserve Bank of New York, plus 1/2 of 1.0%, (ii) the rate identified as the “Prime Rate” and normally published in the Money Rates section of the Wall Street Journal, and (iii) one-month LIBOR plus 1.0%. At December 31, 2018, the Term Loan bore interest at 7.03% per annum.
Amounts outstanding under the Term Loan amortize in equal quarterly installments of 0.25% of the original principal amount of the Term Loan with the balance payable on the maturity date. The maturity date of the Credit Agreement is May 15, 2022.
The Credit Agreement contains representations, covenants and events of default that are customary for financing transactions of this nature. Events of default in the Credit Agreement include, among others: (a) the failure to pay when due the obligations owing thereunder; (b) the failure to perform (and not timely remedy, if applicable) certain covenants; (c) certain defaults and accelerations under other indebtedness; (d) the occurrence of bankruptcy or insolvency events; (e) certain judgments against Holdings or any of its subsidiaries; (f) the loss, revocation or suspension of, or any material impairment in the ability to use, any one or more of, any material FCC licenses; (g) any representation or warranty made, or report, certificate or financial statement delivered, to the lenders subsequently proven to have been incorrect in any material respect; and (h) the
43
occurrence of a Change in Control (as defined in Credit Agreement). Upon the occurrence of an event of default, the Agent may, with the consent of, or upon the request of, the required lenders, accelerate the Term Loan and exercise any of its rights as a secured party under the Credit Agreement and the ancillary loan documents provided, that in the case of certain bankruptcy or insolvency events with respect to a borrower, the Term Loan will automatically accelerate.
The Credit Agreement does not contain any financial maintenance covenants.
The borrowers may elect, at their option, to prepay amounts outstanding under the Credit Agreement without premium or penalty. The borrowers may be required to make mandatory prepayments of the Term Loan upon the occurrence of specified events as set forth in the Credit Agreement, including upon the sale of certain assets and from Excess Cash Flow (as defined in the Credit Agreement). On October 11, 2018, the Company purchased $50.2 million of face value of the Term Loan for $50.0 million, a discount to par value of 0.40%. On March 18, 2019, the Company purchased $25.4 million of face value of the Term Loan for $25.0 million, a discount to par value of 1.50%. These transactions were funded with cash from operations. Other than for outstanding letters of credit, the $50.0 Revolving Credit Agreement (defined below) remained undrawn.
Amounts outstanding under the Credit Agreement are guaranteed by Cumulus Media Intermediate Inc. (“Intermediate
Holdings”), which is a subsidiary of the Company, and the present and future wholly-owned subsidiaries of Cumulus Media New Holdings Inc. (“Holdings”) that are not borrowers thereunder, subject to certain exceptions as set forth in the Credit Agreement (the “Guarantors”) and secured by a security interest in substantially all of the assets of Holdings, the subsidiaries of Holdings party to the Credit Agreement as borrowers, and the Guarantors. As of December 31, 2018, we were in compliance with all required covenants under the Credit Agreement.
Revolving Credit Agreement
On August 17, 2018, Holdings entered into a $50.0 million revolving credit facility (the “Revolving Credit Facility”) pursuant to a credit agreement (the “Revolving Credit Agreement”), dated as of August 17, 2018, with certain subsidiaries of Holdings as borrowers, Intermediate Holdings as a guarantor, certain lenders, and Deutsche Bank AG New York Branch as a lender and Administrative Agent.
The Revolving Credit Facility matures on August 17, 2023. Availability under the Revolving Credit Facility is tied to a borrowing base formula that is based on 85% of the accounts receivable of the borrowers and the guarantors, subject to customary reserves and eligibility criteria. Under the Revolving Credit Facility, up to $10.0 million of availability may be drawn in the form of letters of credit.
Borrowings under the Revolving Credit Facility bear interest, at the option of Holdings, based on (i) LIBOR plus a percentage spread (ranging from 1.25% to 1.75%) based on the average daily excess availability under the Revolving Credit Facility or (ii) the Alternative Base Rate (as defined below) plus a percentage spread (ranging from 0.25% to 0.75%) based on the average daily excess availability under the Revolving Credit Facility. The Alternative Base Rate is defined, for any day, as the per annum rate equal to the highest of (i) the federal funds rate plus 1/2 of 1.0%, (ii) the rate identified as the “Prime Rate” and normally published in the Money Rates section of the Wall Street Journal, and (iii) one-month LIBOR plus 1.0%. In addition, the unused portion of the Revolving Credit Facility will be subject to a commitment fee ranging from 0.250% to 0.375% based on the utilization of the facility.
The Revolving Credit Agreement contains representations, covenants and events of default that are customary for financing transactions of this nature. Events of default in the Revolving Credit Agreement include, among others: (a) the failure to pay when due the obligations owing thereunder; (b) the failure to perform (and not timely remedy, if applicable) certain covenants; (c) certain defaults and accelerations under other indebtedness; (d) the occurrence of bankruptcy or insolvency events; (e) certain judgments against Holdings or any of its subsidiaries; (f) the loss, revocation or suspension of, or any material impairment in the ability to use, any one or more of, any material Federal Communications Commission licenses; (g) any representation or warranty made, or report, certificate or financial statement delivered, to the lenders subsequently proven to have been incorrect in any material respect; and (h) the occurrence of a Change in Control (as defined in Credit Agreement). Upon the occurrence of an event of default, the lenders may terminate the loan commitments, accelerate all loans and exercise any of their rights under the Revolving Credit Agreement and the ancillary loan documents as a secured party.
The Revolving Credit Agreement does not contain any financial maintenance covenants with which the Company must comply. However, if average excess availability under the Revolving Credit Facility is less than the greater of (a) 12.50% of the
44
total commitments thereunder or (b) $5.0 million, the Company must comply with a fixed charge coverage ratio of not less than 1.0:1.0.
Amounts outstanding under the Revolving Credit Agreement are guaranteed by Intermediate Holdings and the present and future wholly-owned subsidiaries of Holdings that are not borrowers thereunder, subject to certain exceptions as set forth in the Revolving Credit Agreement (the “Revolver Guarantors”) and secured by a security interest in substantially all of the assets of Holdings, the subsidiaries of Holdings party to the Credit Agreement as borrowers, and the Revolver Guarantors.
As of December 31, 2018, $2.8 million was outstanding in the form of a letter of credit under the Revolving Credit Facility. As of December 31, 2018, we were in compliance with all required covenants under the Revolving Credit Agreement.
Listing of Our Class A Common Stock
On November 22, 2017, as a result of our previously disclosed non-compliance with certain NASDAQ Stock Market LLC ("NASDAQ") listing rules, trading in our Class A common stock was suspended effective at the open of business on November 22, 2017. After our emergence from Chapter 11, we applied for relisting on the NASDAQ Global Market and on July 27, 2018, we received notification from NASDAQ that our application was approved. Our Class A common stock began trading on the NASDAQ Global Market at the open of business on August 1, 2018.
Going Concern
In accordance with the requirements of Accounting Standards Update (“ASU”) 2014-15, Presentation of Financial Statements Going Concern (Subtopic 205-40), and ASC 205-40, we have the responsibility to evaluate at each reporting period, including interim periods, whether conditions and/or events raise substantial doubt about the Company's ability to meet its future financial obligations. In its evaluation for this report, management considered the Company’s current financial condition and liquidity sources, including current funds available, forecasted future cash flows and the Company’s conditional and unconditional obligations due within one year following the date of issuance of this Annual Report on Form 10-K.
During the pendency of the Chapter 11 Cases, Old Cumulus’s ability to continue as a going concern was contingent upon a variety of factors, including the Bankruptcy Court’s approval of the Plan and the Company’s ability to successfully implement the Plan. As a result of the effectiveness of the Plan and the expectation that it will continue to generate positive cash flows from operating activities, the Company believes it has the ability to meet its obligations for at least one year from the date of issuance of this Form 10-K.
Significant Cash Payments
The following table summarizes our significant non-operating cash payments made for the Successor Company period June 4, 2018 through December 31, 2018, the Predecessor Company period January 1, 2018 through June 3, 2018 and the Predecessor Company years ended December 31, 2017 and 2016 respectively (dollars in thousands):
|
Successor Company
|
Predecessor Company
|
||||||||||||||
|
Period from June 4, 2018 through December 31, 2018
|
Period from January 1, 2018 through June 3, 2018
|
2017
|
2016
|
||||||||||||
|
Repayments of borrowings under term loans and revolving credit facilities and adequate protection payments
|
$
|
56,500
|
|
$
|
37,802
|
|
$
|
81,652
|
|
$
|
20,000
|
|
|||
|
Interest payments
|
$
|
49,785
|
|
$
|
—
|
|
$
|
96,225
|
|
$
|
126,515
|
|
|||
|
Capital expenditures
|
$
|
15,684
|
|
$
|
14,019
|
|
$
|
31,932
|
|
$
|
23,037
|
|
|||
45
Net Cash Provided by Operating Activities
|
Successor Company
|
Predecessor Company
|
||||||||||||||
|
Period from June 4, 2018 through December 31, 2018
|
Period from January 1, 2018 through June 3, 2018
|
Year Ended December 31, 2017
|
Year Ended December 31, 2016
|
||||||||||||
|
Net cash provided by operating activities
|
$
|
32,398
|
|
$
|
29,132
|
|
$
|
86,596
|
|
$
|
35,745
|
|
|||
Net cash provided by operating activities in the Successor and Predecessor
Company year ended December 31, 2018 compared to the Predecessor Company year ended December 31, 2017 decreased primarily as a result of a decrease in cash collections and an increase in payments of accounts payable and accrued expenses.
For the year ended
December 31, 2017
, net cash provided by operating activities increased by $50.9 million over the prior year. The increase was primarily a result of a decrease in payments of accounts payable and accrued expenses in connection with the Predecessor Company's Chapter 11 cases.
Net Cash (Used in) Provided by Investing Activities
|
Successor Company
|
Predecessor Company
|
||||||||||||||
|
Period from June 4, 2018 through December 31, 2018
|
Period from January 1, 2018 through June 3, 2018
|
|
Year Ended December 31, 2017
|
Year Ended December 31, 2016
|
|||||||||||
|
Net cash (used in) provided by investing activities
|
$
|
(33,098
|
)
|
$
|
(14,019
|
)
|
$
|
(25,842
|
)
|
$
|
83,898
|
|
|||
During the Successor and Predecessor
Company year ended December 31, 2018, net cash used in investing activities consisted of cash used to complete the Company’s $18.0 million acquisition of WKQX from Merlin, in addition to approximately $29.7 million in capital expenditures. For additional detail about the acquisition of WKQX from Merlin, see Note 16, "Commitments and Contingencies" of the notes to the accompanying Consolidated Financial Statements.
For the year ended December 31, 2017 capital expenditures totaled $31.9 million primarily related to expenditures on equipment for transmission, facilities, studios, vehicles and other routine expenditures, which amounts were offset partially by approximately $6.1 million of proceeds from the sale of land in Salt Lake City, Utah.
Net Cash Used in Financing Activities
|
Successor Company
|
Predecessor Company
|
||||||||||||||
|
Period from June 4, 2018 through December 31, 2018
|
Period from January 1, 2018 through June 3, 2018
|
Year Ended December 31, 2017
|
Year ended December 31, 2016
|
||||||||||||
|
Net cash used in financing activities
|
$
|
(57,613
|
)
|
$
|
(38,652
|
)
|
$
|
(88,148
|
)
|
$
|
(19,997
|
)
|
|||
During the 2018 Successor and Predecessor
Company year ended December 31, 2018, the Company made $37.8 million in adequate protection payments on the Predecessor Term Loan in lieu of interest payments and recorded these payments as a reduction to the principal balance of the Predecessor Term Loan and also made $56.5 million in repayments on borrowings on our Term Loan.
For the year ended December 31, 2017 net cash used in financing activities included $81.7 million in repayments on borrowings on our Predecessor Term Loan. For the year ended December 31, 2017, net cash used in financing activities increased $68.2 million as compared to the year ended December 31, 2016. The increase was primarily the result of a $61.7 million increase in net repayments on borrowings on our Predecessor Term Loan.
46
Critical Accounting Policies
Fresh Start Accounting
In connection with our emergence from Chapter 11 on the Effective Date, we qualified for fresh start accounting under ASC 852 because (i) the holders of voting shares of the Predecessor Company received less than 50% of the voting shares of the Successor Company and (ii) the reorganization value of our assets immediately prior to confirmation of the Plan was less than the pre-petition liabilities and allowed claims. ASC 852 requires that fresh start accounting be applied when the Bankruptcy Court enters the confirmation order confirming a plan of reorganization, or as of a later date when all material conditions precedent to the effectiveness of a plan of reorganization are resolved, which for CUMULUS MEDIA was the Effective Date.
Upon the application of fresh start accounting, CUMULUS MEDIA allocated the reorganization value to its individual assets based on their estimated fair values in conformity with ASC 805, Business Combinations ("ASC 805"). Reorganization value represents the fair value of the Successor Company’s assets before considering liabilities. Liabilities existing as of the Effective Date, other than deferred taxes, were recorded at the present value of amounts expected to be paid using appropriate risk adjusted interest rates. Deferred taxes were determined in conformity with applicable accounting standards. Predecessor Company accumulated depreciation, accumulated amortization, and accumulated deficit were eliminated. As a result of the application of fresh start accounting and the effects of the implementation of the Plan, our consolidated financial statements after June 3, 2018 will not be comparable to our consolidated financial statements as of or prior to that date.
Use of Estimates
The preparation of financial statements in conformity with GAAP requires management to make estimates and judgments that affect the reported amounts of assets, liabilities, revenues and expenses, and related disclosures of contingent assets and liabilities. On an on-going basis, the Company evaluates its estimates, including significant estimates related to revenue recognition, bad debts, intangible assets, income taxes, stock-based compensation, contingencies, litigation, valuation assumptions for impairment analysis, certain expense accruals and, if applicable, purchase price allocation. The Company bases its estimates on historical experience and on various assumptions that are believed to be reasonable under the circumstances, and which form the basis for making judgments about the carrying values of assets and liabilities that are not readily apparent from other sources. Actual amounts and results may differ materially from these estimates.
Revenue Recognition
Revenue is derived primarily from the sale of commercial airtime to local and national advertisers. On January 1, 2018 the Company adopted ASC 606 using the modified retrospective method. Results for reporting periods beginning after January 1, 2018 are presented in accordance with ASC 606, while prior period amounts have not been adjusted and continue to be reported in accordance with the Company's historic accounting under
ASC 605 - Revenue Recognition ("ASC 605")
. Under current and prior revenue guidance, revenues are recognized when control of the promised goods or services are transferred to the customer, in an amount that reflects the consideration to which the Company expects to be entitled in exchange for those good or services.
Broadcasting advertising revenue is recognized as commercials are broadcast. In those instances in which the Company functions as the principal in the transaction, the revenue and associated operating costs are presented on a gross basis. In those instances where the Company functions as an agent or sales representative, the effective commission is presented as revenue with no corresponding operating expenses.
Accounts Receivable, Allowance for Doubtful Accounts and Concentration of Credit Risk
Accounts receivable are recorded at the invoiced amount and do not bear interest. The allowance for doubtful accounts is the Company’s best estimate of the amount of probable credit losses in the Company’s existing accounts receivable. The Company determined the allowance based on several factors, including the length of time receivables are past due, trends and current economic factors. All balances are reviewed and evaluated quarterly on a consolidated basis. Account balances are charged off against the allowance after all means of collection have been exhausted and the potential for recovery is considered remote. The Company does not have any off-balance-sheet credit exposure related to its customers.
In the opinion of management, credit risk with respect to accounts receivable is limited as a result of the large number of customers and the geographic diversification of the Company’s customer base. The Company performs credit evaluations of its customers as needed and believes that adequate allowances for any uncollectible accounts receivable are maintained.
47
Intangible Assets
We have significant intangible assets recorded in our accounts. These intangible assets are comprised primarily of FCC licenses. We are required to review the carrying value of certain intangible assets annually for impairment, and more frequently if circumstances warrant, and record any impairment to results of operations in the periods in which the recorded value of those assets is more than their fair value. As of December 31, 2018, we had approximately
$1,129.2 million
in intangible assets which represented approximately
63.6%
of our total assets.
We perform our annual impairment tests for FCC licenses as of December 31, 2018. The impairment tests require us to make certain assumptions in determining fair value, including assumptions about the cash flow growth rates of our businesses. Additionally, the fair values are significantly impacted by macroeconomic factors outside of our control. More specifically, the following factors, among others, could adversely impact the current carrying value of our FCC licenses: (a) a decline in our forecasted operating profit margins or expected cash flow growth rates, (b) a decline in our forecasted industry operating profit margins, (c) a continued decline in advertising market revenues within the markets where we operate stations, or (d) the sustained decline in the selling prices of radio stations, which is generally determined as a multiple of EBITDA and (e) increase in interest rates/discount rate. The calculation of the fair value is prepared using an income approach and discounted cash flow methodology.
Prior to the application of fresh start accounting, goodwill represented the excess of the amount paid to acquire businesses over the fair value of their net assets at the date of the acquisition. The Company eliminated goodwill upon application of fresh start accounting.
In performing the Company's 2016 annual impairment testing of goodwill, the Company recorded a non-cash impairment charge of $568.1 million, reducing the goodwill in the Cumulus Radio Station Group to $0.0 million at December 31, 2016. The Company eliminated the remaining goodwill at Westwood One upon application of fresh start accounting.
Annual Impairment Test - FCC Licenses
As part of the annual impairment testing of indefinite-lived intangibles the Company tests its FCC licenses for impairment during the fourth quarter of each year and on an interim basis if events or circumstances indicate that the asset may be impaired. As part of the overall planning associated with the test, the Company determined that its geographic markets are the appropriate unit of accounting for FCC license impairment testing and therefore the Company has combined its FCC licenses within each geographic market cluster into a single unit of accounting for impairment testing purposes.
For the impairment test, we utilized the income approach, specifically the Greenfield Method. This approach values a license by calculating the value of a hypothetical start-up company that initially has no assets except the asset to be valued (the license). The value of the asset under consideration (the license) can be considered as equal to the value of this hypothetical start-up company. In completing the appraisals, we considered if there were any other factors that might affect the carrying value of the asset.
The estimated fair values of our FCC licenses represent the price that would be received to sell an asset or paid to transfer a liability in an orderly transaction between the Company and willing market participants at the measurement date. The estimated fair value also assumes the highest and best use of the asset by market participants, considering a use of the asset that is physically possible, legally permissible and financially feasible.
A basic assumption in our valuation of these FCC licenses was that these radio stations were new radio stations, signing on the air as of the date of the valuation. We assumed the competitive situation that existed in those markets as of that date, except that these stations were just beginning operations.
In estimating the value of the licenses, we began with market revenue projections. Next, we estimated the percentage of the market’s total revenue, or market share, that market participants could reasonably expect an average start-up station to attain, as well as the duration (in years) required to reach the average market share. The estimated average market share was computed based on market share data, by station type (i.e., AM and FM) and signal strength.
After market revenue and market shares were estimated, operating expenses, including depreciation based on assumed investments in fixed assets and future capital expenditures of a start-up station or operation are similarly estimated based on industry-average cost data. Appropriate estimated income taxes were then subtracted, estimated depreciation added back, estimated capital expenditures subtracted, and estimated working capital adjustments were made to calculate estimated free cash flow during the build-up period until a steady state or mature “normalized” operation is achieved.
48
The analysis included overall future market revenue rates of decline for the residual years after the projection period of (0.75%) and a weighted average cost of capital of 9.0%. The residual year value and cashflow growth rates were estimated based on a perpetual nominal market growth rate, which was based on long-term industry projections obtained from third party sources. The weighted average cost of capital was based on (i) the cost of equity, which included estimates of the risk-free return, stock risk premiums and industry beta; (ii) the cost of debt, which included estimates for corporate borrowing rates; and (iii) estimated average percentages of equity and debt in other radio broadcasters' capital structures.
In order to estimate what listening audience share could be expected to be achieved for each station by market, we analyzed the average local commercial share garnered by similar AM and FM stations competing in those radio markets. We may make adjustments to the listening share and revenue share based on a station's signal coverage within the market and the surrounding area population as compared to the other stations in the market. Based on our knowledge of the industry and familiarity with similar markets, we determined that approximately three years would be required for the stations to reach maturity. We also incorporated the following additional assumptions into the discounted cash flow valuation model:
|
•
|
projected operating revenues and expenses over a five-year period;
|
|
•
|
the estimation of initial and on-going capital expenditures (based on market size);
|
|
•
|
depreciation on initial and on-going capital expenditures (we calculated depreciation using accelerated double declining balance guidelines over five years for the value of the tangible assets necessary for a radio station to go on the air);
|
|
•
|
the estimation of working capital requirements (based on working capital requirements for comparable companies); and
|
|
•
|
amortization of the intangible asset — the FCC license.
|
As a result of the impairment test, there was no impairment as of December 31, 2018. Sensitivity tests show if the discount rate been 100 basis points higher than management estimates, we would have recognized an $11.9 million impairment charge.
As of December 31, 2018, the carrying value of our FCC licenses was
$935.7 million
and the FCC license fair value of seven of the Company's 89 geographical markets exceeded carrying values by less than 10 percent. The aggregated carrying value of the licenses relating to these markets was $120.7 million.
As a result of the impairment test of our FCC licenses, conducted as of December 31, 2017, we recorded a non-cash
impairment charge of $335.9 million. Sensitivity tests show that if the discount rate had been 100 basis points lower than
management estimates, we would have recognized a $129.1 million less impairment charge. Had the discount rate been 100
basis points higher than management estimates, we would have recognized an additional $126.6 million impairment charge.
As of December 31, 2017, the carrying value of our FCC licenses was $1,203.8 million and the FCC license fair value of one of the Company's 89 geographical markets exceeded carrying values by less than 10 percent. The aggregated carrying value of the licenses relating to these markets were $24.8 million.
As a result of the impairment test conducted as of December 31, 2016 the Company recorded a non-cash impairment charge of $35.0 million.
If the macroeconomic conditions of the radio industry or the underlying material assumptions are less favorable than those projected by the Company or if a triggering event occurs or circumstance change that would more likely than not reduce the fair value of FCC licenses below the amounts reflected in the Consolidated Balance Sheet, the Company may be required to recognize additional impairment charges in future periods.
49
Stock-based Compensation Expense
Stock-based compensation expense recognized under ASC Topic 718,
Compensation — Share-Based Payment
(“ASC 718”), for the Successor Company period June 4, 2018 through December 31, 2018, the Predecessor Company period January 1, 2018 through June 3, 2018, the Predecessor Company year ended December 31, 2017 and the Predecessor Company year ended December 31, 2016, was $3.4 million,
$0.2 million
,
$1.6 million
, and
$2.9 million
, respectively. Upon adopting ASU 2016-09,
Compensation—Stock compensation (Topic 718): Improvements to employee share-based payment accounting,
an election was made to recognize stock-based compensation expense on a straight-line basis over the requisite service period for the entire award. In addition, the Successor Company made an accounting policy election to recognize forfeitures of share-based awards as they occur in the period of forfeiture rather than estimating the number of awards expected to be forfeited at the grant date and subsequently adjusting the estimate when awards are actually forfeited. For stock options with service conditions only, we utilize the Black-Scholes option pricing model to estimate the fair value of options issued. The fair value of stock options is determined by the Company’s stock price, historical stock price volatility, the expected term of the awards, risk-free interest rates and expected dividends. If other assumptions are used, the results could differ. For restricted stock awards with service conditions only, we utilize the intrinsic value method. For restricted stock awards with performance conditions, we evaluate the probability of vesting of the awards in each reporting period and adjust compensation cost based on this assessment.
Income Taxes
We use the liability method of accounting for deferred income taxes. Except for goodwill, deferred income taxes are recognized for all temporary differences between the tax and financial reporting bases of our assets and liabilities based on enacted tax laws and statutory tax rates applicable to the periods in which the differences are expected to affect taxable income. The Tax Cuts and Jobs Act (“the Act”) was enacted on December 22, 2017. The Act, among other changes, reduced the US federal corporate tax rate from 35% to 21% effective January 1, 2018. During the fourth quarter of 2018, the Company completed its accounting for the tax effects of enactment of the Act and recorded an adjustment to deferred tax benefit of approximately
$0.9 million
during 2018 related to the remeasurement of deferred tax assets and liabilities. See Note 13. "Income Taxes", for disclosure.
The Company records valuation allowances to reduce its deferred tax assets to amounts that are more likely than not to be realized. We continually review the adequacy of our valuation allowance, if any, on our deferred tax assets and recognize the benefits of deferred tax assets only as the reassessment indicates that it is more likely than not that the deferred tax assets will be recognized in accordance with ASC Topic 740, Income Taxes ("ASC 740"). In assessing the need for a valuation allowance, the Company considers both positive and negative evidence related to the likelihood of realization of the deferred tax assets. The weight given to the positive and negative evidence is commensurate with the extent to which the evidence may be objectively verified. As such, it is generally difficult for positive evidence regarding projected future taxable income exclusive of reversing taxable temporary differences to outweigh objective negative evidence of recent financial reporting losses. This assessment, which is completed on a taxing jurisdiction basis, takes into account a number of types of evidence, including the following:
|
l
|
Nature, frequency, and severity of current and cumulative financial reporting losses. A pattern of objectively-measured recent financial reporting losses is heavily weighted as a source of negative evidence. Three year cumulative pre-tax losses generally are considered to be significant negative evidence regarding future profitability. Also, the strength and trend of the Company's earnings, as well as other relevant factors, are considered. In certain circumstances, historical information may not be as relevant because of changes in the business operations;
|
|||
|
l
|
Sources of future taxable income. Future reversals of existing temporary differences are heavily-weighted sources of objectively verifiable positive evidence. Projections of future taxable income exclusive of reversing temporary differences and carryforwards are a source of positive evidence only when the projections are combined with a history of recent profits and can be reasonably estimated. Otherwise, these projections are considered inherently subjective and generally will not be sufficient to overcome negative evidence that includes relevant cumulative losses in recent years, particularly if the projected future taxable income is dependent on an anticipated turnaround to profitability that has not yet been achieved. In such cases, we generally give these projections of future taxable income limited weight for the purposes of our valuation allowance assessment pursuant to GAAP;
|
|||
|
l
|
Taxable income in prior carryback year(s), if carryback is permitted under the tax law, would be considered significant positive evidence, depending on availability, when evaluating current period losses; and
|
|||
|
l
|
Tax planning strategies. If necessary and available, tax planning strategies would be implemented to accelerate taxable amounts to utilize expiring carry forwards. These strategies would be a source of additional positive evidence and, depending on their nature, could be heavily weighted.
|
|||
50
If the Company were to determine that it would be able to realize deferred tax assets in the future in excess of the Company's net recorded amount, an adjustment to the net deferred tax asset would increase income in the period that such determination was made. Likewise, should the Company determine that it would not be able to realize all or part of its net deferred tax assets in the future, an adjustment to the net deferred tax asset would decrease income in the period such determination was made. The Company regularly evaluates the need for valuation allowances against its deferred tax assets. As of December 31, 2018 the Company has recorded no valuation allowance against its deferred tax assets.
Legal Proceedings
We are currently and expect from time to time in the future we will be party to, or a defendant in, various claims or lawsuits that are generally incidental to our business. We expect that we will vigorously contest any such claims or lawsuits and believe that the ultimate resolution of any known claim or lawsuit will not have a material adverse effect on our consolidated financial position, results of operations or cash flows. For more information, see "Item 3. Legal Proceedings" contained elsewhere in this Form 10-K.
Trade Transactions
We provide commercial airtime in exchange for goods and services used principally for promotional, sales, programming and other business activities. An asset and liability is recorded at the fair value of the goods or services received. Trade revenue is recorded and the liability is relieved when commercials are broadcast and trade expense is recorded and the asset relieved when goods or services are consumed. Trade valuation is based upon management’s estimate of the fair value of the products, supplies and services received. For the Successor Company period June 4, 2018 through December 31, 2018, the Predecessor Company period January 1, 2018 through June 3, 2018, the Predecessor Company year ended December 31, 2017 and the Predecessor Company year ended December 31, 2016, amounts reflected under trade transactions were: (1) trade revenues of $26.5 million, $19.0 million, $40.1 million and $37.7 million respectively; and (2) trade expenses of $27.1 million, $18.0 million, $38.6 million and, $36.2 million respectively.
51
Summary Disclosures about Contractual Obligations and Commercial Commitments
The following table reflects a summary of our contractual cash obligations and other commercial commitments as of
December 31, 2018
(dollars in thousands):
Payments Due By Period
|
Contractual Cash Obligations
|
Total
|
Less Than 1
Year
|
1 to 3 Years
|
3 to 5 years
|
After 5 Years
|
||||||||||||||
|
Long-term debt (1)
|
$
|
1,243,299
|
|
$
|
13,000
|
|
$
|
26,000
|
|
$
|
1,204,299
|
|
$
|
—
|
|
||||
|
Lease Commitments (2)
|
174,757
|
|
33,830
|
|
53,400
|
|
39,516
|
|
48,011
|
|
|||||||||
|
Other contractual obligations (3)
|
712,323
|
|
244,489
|
|
341,342
|
|
113,221
|
|
13,271
|
|
|||||||||
|
Total contractual cash obligations
|
$
|
2,130,379
|
|
$
|
291,319
|
|
$
|
420,742
|
|
$
|
1,357,036
|
|
$
|
61,282
|
|
||||
|
(1)
|
Based on amounts outstanding, interest rates and required repayments as of
December 31, 2018
. Assumes that outstanding indebtedness will not be refinanced prior to scheduled maturity.
|
|
(2)
|
Net of future minimum sublease income.
|
|
(3)
|
Consists of contractual obligations for goods or services including broadcast rights that are enforceable and legally binding obligations that include all significant terms.
|
52
Off-Balance Sheet Arrangements
We did not have any off-balance sheet arrangements as of
December 31, 2018
.
New Accounting Standards
Refer to Note 1 "Description of Business, Basis of Presentation and Summary of Significant Accounting Policies" to our audited consolidated financial statements included elsewhere in this Annual Report on Form 10-K.
53
|
Item 7A.
|
Quantitative and Qualitative Disclosures about Market Risk
|
Interest Rate Risk
As of
December 31, 2018
, all $1.243 billion of our long-term debt bore interest at variable rates. Accordingly, our earnings and after-tax cash flow are subject to change based on changes in interest rates and could be materially affected, depending on the timing and amount of any interest rate changes. Assuming the current level of borrowings outstanding at December 31, 2018 at variable interest rates and assuming a one percentage point increase (decrease) in the current rate, it is estimated on an annual basis interest expense would increase (decrease) and pre-tax net income would decrease (increase) by $12.4 million.
Foreign Currency Risk
None of our operations are measured in foreign currencies. As a result, our financial results are not subject to factors such as changes in foreign currency exchange rates or weak economic conditions in foreign markets.
|
Item 8.
|
Financial Statements and Supplementary Data
|
The information in response to this item is included in our consolidated financial statements, together with the report thereon of PricewaterhouseCoopers LLP, beginning on page F-2 of this Annual Report on Form 10-K, which follows the signature page hereto.
|
Item 9.
|
Changes in and Disagreements with Accountants on Accounting and Financial Disclosure
|
Not applicable.
|
Item 9A.
|
Controls and Procedures
|
(a) Evaluation of Disclosure Controls and Procedures
We maintain a set of disclosure controls and procedures (as defined in Rules 13a-15(e) and 15d-15(e) of the Securities Exchange Act of 1934, the “Exchange Act”) designed to ensure that information we are required to disclose in reports that we file or submit under the Exchange Act is recorded, processed, summarized and reported within the time periods specified in Securities and Exchange Commission rules and forms. Such disclosure controls and procedures are designed to ensure that information required to be disclosed in reports we file or submit under the Exchange Act is accumulated and communicated to our management, including, our President and Chief Executive Officer (“CEO”) and Executive Vice President and Chief Financial Officer (“CFO”) the principal executive and principal financial officers, respectively, as appropriate, to allow timely decisions regarding required disclosure. At the end of the period covered by this report, an evaluation was carried out under the supervision and with the participation of our management, including our CEO and CFO, of the effectiveness of the design and operation of our disclosure controls and procedures. Based on this evaluation, the CEO and CFO have concluded that our disclosure controls and procedures were effective at the reasonable assurance level as of
December 31, 2018
.
Management necessarily applies its judgment in assessing the costs and benefits of such controls and procedures, which, by their nature, can provide only reasonable assurance regarding management’s control objectives. The Company’s management, including the CEO and the CFO, does not expect that our disclosure controls and procedures can prevent all possible errors or fraud. A control system, no matter how well conceived and operated, can provide only reasonable, not absolute, assurance that misstatements as a result of error or fraud will not occur or that all control issues and instances of fraud, if any, within the company have been detected. Judgments in decision-making can be faulty and breakdowns can occur because of simple errors or mistakes. Additionally, controls can be circumvented by the individual acts of one or more persons. The design of any system of controls is based in part upon certain assumptions about the likelihood of future events, and while our disclosure controls and procedures are designed to be effective under circumstances where they should reasonably be expected to operate effectively, there can be no assurance that any design will succeed in achieving its stated goals under all potential future conditions. Because of the inherent limitations in any control system, misstatements because of possible errors or fraud may occur and not be detected.
54
(b) Management’s Report on Internal Control over Financial Reporting
Management is responsible for establishing and maintaining adequate internal control over financial reporting (as defined in Rules 13a-15(f) and 15d-15(f) under the Exchange Act). The Company’s management assessed the effectiveness of its internal control over financial reporting as of
December 31, 2018
. In making this assessment, management used the criteria set forth by the Committee of Sponsoring Organizations of the Treadway Commission (“COSO”) in Internal Control-Integrated Framework (2013). Based on this assessment, management has concluded that, as of
December 31, 2018
, the Company’s internal control over financial reporting was effective.
The effectiveness of our internal control over financial reporting as of
December 31, 2018
has been audited by PricewaterhouseCoopers LLP, an Independent Registered Public Accounting Firm, as stated in their report which appears herein.
|
/s/ Mary G. Berner
|
/s/ John Abbot
|
|
President, Chief Executive Officer and Director
|
Executive Vice President, Treasurer and Chief Financial Officer
|
(c) Changes in Internal Control over Financial Reporting
There were no changes to our internal control over financial reporting during the fourth quarter of
2018
that materially affected, or are reasonably likely to materially affect, our internal control over financial reporting.
|
Item 9B.
|
Other Information
|
None.
55
PART III
|
Item 10.
|
Directors and Executive Officers and Corporate Governance
|
In accordance with General Instruction G.(3) to Form 10-K, the information required by this item with respect to our directors, is incorporated by reference to the information to be set forth in our definitive proxy statement for the 2019 Annual Meeting of Stockholders, expected to be filed not later than 120 days after the end of the fiscal year covered by this Form 10-K.
|
Item 11.
|
Executive Compensation
|
In accordance with General Instruction G.(3) to Form 10-K, the information required by this item is incorporated by reference to the information to be set forth under the caption “Executive Compensation” in our 2019 Proxy Statement.
|
Item 12.
|
Security Ownership of Certain Beneficial Owners and Management and Related Stockholder Matters
|
In accordance with General Instruction G.(3) to Form 10-K, the information required by this item with respect to the security ownership of our management and certain beneficial owners is incorporated by reference to the information set forth under the caption “Security Ownership of Certain Beneficial Owners and Management” in our 2019 Proxy Statement.
Securities Authorized For Issuance Under Equity Incentive Plans
The following table sets forth, as of
December 31, 2018
, the number of securities outstanding under our equity compensation plans, the weighted average exercise price of such securities and the number of securities available for grant under these plans:
|
Plan Category
|
To be Issued
Upon Exercise of
Outstanding Options
Warrants and Rights (a)
|
Weighted-Average
Exercise Price of
Outstanding Options
Warrants and Rights
|
Number of Securities Remaining Available for Future Issuance under Equity Compensation Plans (excluding securities reflected in column (a))
|
||||||
|
Equity Compensation Plans Approved by Stockholders
|
581,124
|
|
$
|
25.47
|
|
1,041,068
|
|
||
|
Equity Compensation Plans Not Approved by Stockholders
|
—
|
|
—
|
|
—
|
|
|||
|
Total
|
581,124
|
|
$
|
25.47
|
|
1,041,068
|
|
||
56
|
Item 13.
|
Certain Relationships and Related Transactions, and Director Independence
|
In accordance with General Instruction G.(3) to Form 10-K, the Company intends to file with the Securities and Exchange Commission the information required by this Item not later than 120 days after the end of the fiscal year covered by this Form 10-K.
|
Item 14.
|
Principal Accountant Fees and Services
|
In accordance with General Instruction G.(3) to Form 10-K, the Company intends to file with the Securities and Exchange Commission the information required by this Item not later than 120 days after the end of the fiscal year covered by this Form 10-K.
57
PART IV
|
Item 15.
|
Exhibits, Financial Statement Schedules
|
(a) (1)-(2)
Financial Statements.
The financial statements and financial statement schedule listed in the Index to Consolidated Financial Statements appearing on page F-1 of this Annual Report on Form 10-K are filed as a part of this report. All other schedules for which provision is made in the applicable accounting regulations of the Securities and Exchange Commission have been omitted either because they are not required under the related instructions or because they are not applicable.
(3)
Exhibits
58
EXHIBIT INDEX
|
First Amended Joint Plan of Reorganization of Cumulus Media Inc. and its Debtor Affiliates Pursuant to Chapter 11 of the Bankruptcy Code (incorporated by reference to Exhibit 2.1 to Cumulus Media Inc.'s Current Report on Form 8-K filed with the SEC on June 4, 2018)
|
||
|
Amended and Restated Certificate of Incorporation of Cumulus Media Inc. (incorporated by reference to Exhibit 3.1 to Cumulus Media Inc.'s Current Report on Form 8-K filed with the SEC on June 4, 2018)
|
||
|
Amended and Restated Bylaws of Cumulus Media Inc. (incorporated by reference to Exhibit 3.2 to Cumulus Media Inc.'s Current Report on Form 8-K filed with the SEC on June 4, 2018)
|
||
|
Form of Global Warrant Certificate (incorporated by reference to Exhibit 4.1 to Cumulus Media Inc.’s Current Report on Form 8-K filed with the SEC on June 4, 2018)
|
||
|
Form of Class A common stock certificate (incorporated by reference to Exhibit 4.3 to Cumulus Media Inc.’s Registration Statement on Form S-8 filed with the SEC on June 4, 2018)
|
||
|
Form of Credit Agreement dated as of June 4, 2018, among Holdings, as borrower, the subsidiaries of Holdings party thereto as borrowers, Intermediate Holdings as guarantor, Wilmington Trust, National Association, as Administrative Agent, and the other lenders party thereto (incorporated by reference to Exhibit 10.1 to Cumulus Media Inc.’s Current Report on Form 8-K filed with the SEC on June 4, 2018)
|
||
|
Warrant Agreement, dated as of June 4, 2018, among the Company, Computershare Inc. and Computershare Trust Company, N.A. (incorporated by reference to Exhibit 10.2 to Cumulus Media Inc.’s Current Report on Form 8-K filed with the SEC on June 4, 2018)
|
||
|
10.3
*
|
Form of Indemnification Agreement (incorporated by reference to Exhibit 10.3 to Cumulus Media Inc.’s Current Report on Form 8-K filed with the SEC on June 4, 2018)
|
|
|
10.4
*
|
Cumulus Media Inc. Long-Term Incentive Plan (incorporated by reference to Exhibit 10.4 to Cumulus Media Inc.’s Current Report on Form 8-K filed with the SEC on June 4, 2018)
|
|
|
10.5
*
|
Form of Restricted Stock Unit Agreement (Non-Senior Executive) (incorporated by reference to Exhibit 10.5 to Cumulus Media Inc.’s Current Report on Form 8-K filed with the SEC on June 4, 2018)
|
|
|
10.6
*
|
Form of Restricted Stock Unit Agreement (Senior Executive) (incorporated by reference to Exhibit 10.6 to Cumulus Media Inc.’s Current Report on Form 8-K filed with the SEC on June 4, 2018)
|
|
|
10.7
*
|
Form of Restricted Stock Unit Agreement (Director) (incorporated by reference to Exhibit 10.7 to Cumulus Media Inc.’s Current Report on Form 8-K filed with the SEC on June 4, 2018)
|
|
|
10.8
*
|
Form of Stock Option Agreement (Non-Senior Executive) (incorporated by reference to Exhibit 10.8 to Cumulus Media Inc.’s Current Report on Form 8-K filed with the SEC on June 4, 2018)
|
|
59
|
10.9
*
|
Form of Stock Option Agreement (Senior Executive) (incorporated by reference to Exhibit 10.9 to Cumulus Media Inc.’s Current Report on Form 8-K filed with the SEC on June 4, 2018)
|
|
|
10.10
*
|
Form of Stock Option Agreement (Director) (incorporated by reference to Exhibit 10.10 to Cumulus Media Inc.’s Current Report on Form 8-K filed with the SEC on June 4, 2018)
|
|
|
Credit Agreement, dated as of August 17, 2018, among certain subsidiaries of Cumulus Media New Holdings Inc., as borrowers, certain lenders, Cumulus Media Intermediate Inc., as a guarantor, and Deutsche Bank AG New York Branch, as a lender and Administrative Agent (incorporated by reference to Exhibit 10.11 to Cumulus Media Inc.’s Quarterly Report on Form 10-Q filed with the SEC on August 20, 2018)
|
||
|
10.12
*
|
Form of Employment Agreement, dated September 29, 2015, by and between the Company and Mary G. Berner (incorporated by reference to Exhibit 10.1 to the Company’s Current Report on Form 8-K, filed with the SEC on September 30, 2015)
|
|
|
10.13
*
|
First Amendment to Employment Agreement, dated March 30, 2016, by and between Cumulus Media Inc. and Richard S. Denning (incorporated by reference to Exhibit 10.2 to Cumulus Media Inc.’s Current Report on Form 8-K filed with the SEC on March 31, 2016)
|
|
|
10.14
*
|
Second Amendment to Employment Agreement, dated August 26, 2016, by and between Cumulus Media Inc. and Richard S. Denning (incorporated by reference to Exhibit 10.1 to Cumulus Media Inc.’s Quarterly Report on Form 10-Q filed with the SEC on November 8, 2016)
|
|
|
10.15
*
|
Third Amendment to Employment Agreement, dated October 25, 2017, by and between Cumulus Media Inc. and Richard S. Denning (incorporated by reference to Exhibit 10.18 to Cumulus Media Inc.’s Annual Report on Form 10-K filed with the SEC on March 29, 2018)
|
|
|
10.16
*
|
Employment Agreement, dated July 1, 2016, by and between Cumulus Media Inc. and John Abbot (incorporated by reference to Exhibit 10.18 to Cumulus Media Inc.’s Annual Report on Form 10-K filed with the SEC on March 16, 2017)
|
|
|
10.17
*
|
Amended and Restated Employment Agreement, dated October 25, 2017, by and between Cumulus Media Inc. and John Abbot (incorporated by reference to Exhibit 10.20 to Cumulus Media Inc.’s Annual Report on Form 10-K filed with the SEC on March 29, 2018)
|
|
|
10.18
*
|
Employment Agreement, dated as of December 13, 2015, by and between Cumulus Media Inc. and Suzanne Grimes (incorporated by reference to Exhibit 10.3 to Cumulus Media Inc.’s Current Report on Form 8-K filed with the SEC on March 31, 2016)
|
|
|
10.19
*
|
First Amendment to Employment Agreement, dated March 30, 2016, by and between Cumulus Media Inc. and Suzanne Grimes (incorporated by reference to Exhibit 10.4 to Cumulus Media Inc.’s Current Report on Form 8-K filed with the SEC on March 31, 2016)
|
|
|
10.20
*
|
Second Amendment to Employment Agreement, dated January 26, 2018, by and between Cumulus Media Inc. and Suzanne Grimes (incorporated by reference to Exhibit 10.1 to Cumulus Media Inc.’s Current Report on Form 8-K filed with the SEC on February 1, 2018)
|
|
|
10.21
*
|
First Amendment to Employment Agreement, dated March 30, 2016, by and between Cumulus Media Inc. and Mary G. Berner (incorporated by reference to Exhibit 10.5 to Cumulus Media Inc.’s Current Report on Form 8-K filed with the SEC on March 31, 2016)
|
|
|
10.22
*
|
Second Amendment to Employment Agreement, dated October 26, 2017, by and between Cumulus Media Inc. and Mary Berner (incorporated by reference to Exhibit 10.25 to Cumulus Media Inc.’s Annual Report on Form 10-K filed with the SEC on March 29, 2018)
|
|
60
|
21.1
**
|
Subsidiaries.
|
|
|
23.1
**
|
Consents of PricewaterhouseCoopers LLP. ( Successor and Predecessor Company)
|
|
|
31.1
**
|
Certification of the Principal Executive Officer pursuant to Section 302 of the Sarbanes-Oxley Act of 2002.
|
|
|
31.2
**
|
Certification of the Principal Financial Officer pursuant to Section 302 of the Sarbanes-Oxley Act of 2002.
|
|
|
32.1
**
|
Officer Certification pursuant to Section 906 of the Sarbanes-Oxley Act of 2002.
|
|
|
101.INS
|
INS XBRL Instance Document.
|
|
|
101.SCH
|
SCH XBRL Taxonomy Extension Schema Document.
|
|
|
101.CAL
|
CAL XBRL Taxonomy Extension Calculation Linkbase Document.
|
|
|
101.DEF
|
DEF XBRL Taxonomy Extension Definition Linkbase Document.
|
|
|
101.LAB
|
LAB XBRL Taxonomy Extension Labels Linkbase Document.
|
|
|
101.PRE
|
PRE XBRL Taxonomy Extension Presentation Linkbase Document.
|
|
|
*
|
Management contract or compensatory plan or arrangement.
|
|
|
**
|
Filed or furnished herewith.
|
|
|
(b)
|
Exhibits. See Exhibits above.
|
|
(c)
|
Financial Statement Schedules. Schedule II – Valuation and Qualifying Accounts.
|
|
Item 16.
|
Form 10-K Summary
|
None.
SIGNATURES
Pursuant to the requirements of Section 13 or 15(d) of the Securities Exchange Act of 1934, the registrant has duly caused this Annual Report on Form 10-K to be signed on its behalf by the undersigned, thereunto duly authorized, on the 18
th
day of March 2019.
|
CUMULUS MEDIA INC.
|
|||
|
By
|
|
/s/ John Abbot
|
|
|
|
John Abbot
Executive Vice President, Treasurer
and Chief Financial Officer
|
||
Pursuant to the requirements of the Securities Exchange Act of 1934, this Annual Report on Form 10-K has been signed below by the following persons on behalf of the registrant and in the capacities and on the dates indicated.
61
|
Signature
|
Title
|
Date
|
||
|
/s/ Mary G. Berner
|
President, Chief Executive Officer and
|
March 18, 2019
|
||
|
Mary G. Berner
|
Director
|
|||
|
/s/ John Abbot
|
Executive Vice President, Treasurer and
|
March 18, 2019
|
||
|
John Abbot
|
Chief Financial Officer
(Principal Financial and Accounting Officer)
|
|||
|
/s/ Andrew W. Hobson
|
Director
|
March 18, 2019
|
||
|
Andy W. Hobson
|
||||
|
/s/ David M. Baum
|
Director
|
March 18, 2019
|
||
|
David M. Baum
|
||||
|
/s/ Matthew C. Blank
|
Director
|
March 18, 2019
|
||
|
Matthew C. Blank
|
||||
|
/s/ Thomas H. Castro
|
Director
|
March 18, 2019
|
||
|
Thomas H. Castro
|
||||
|
/s/ Joan Hogan Gillman
|
Director
|
March 18, 2019
|
||
|
Joan Hogan Gillman
|
||||
|
/s/ Brian G. Kushner
|
Director
|
March 18, 2019
|
||
|
Brian G. Kushner
|
||||
62
INDEX TO CONSOLIDATED FINANCIAL STATEMENTS
The following Consolidated Financial Statements of Cumulus Media Inc. are included in Item 8:
|
Page
|
||
|
(1)
|
Financial Statements
|
|
|
|
||
|
|
||
|
|
||
|
(2)
|
Financial Statement Schedule
|
|
F-1
Report of Independent Registered Public Accounting Firm
To the
Board of Directors and Stockholders of Cumulus Media Inc.
Opinions on the Financial Statements and Internal Control over Financial Reporting
We have audited the accompanying consolidated balance sheet of Cumulus Media Inc. and its subsidiaries (Successor) (the “Company”) as of December 31, 2018, and the related consolidated statements of operations, of stockholders’ equity (deficit) and of cash flows for the period from June 4, 2018 through December 31, 2018, including the related notes and financial statement schedule of valuation and qualifying accounts for the period from June 4, 2018 through December 31, 2018 listed in the accompanying index (collectively referred to as the “consolidated financial statements”). We also have audited the Company's internal control over financial reporting as of December 31, 2018, based on criteria established in Internal Control - Integrated Framework (2013) issued by the Committee of Sponsoring Organizations of the Treadway Commission (COSO).
In our opinion, the consolidated financial statements referred to above present fairly, in all material respects, the financial position of the Company as of December 31, 2018, and the results of its operations and its cash flows for the period from June 4, 2018 through December 31, 2018 in conformity with accounting principles generally accepted in the United States of America. Also in our opinion, the Company maintained, in all material respects, effective internal control over financial reporting as of December 31, 2018, based on criteria established in Internal Control - Integrated Framework (2013) issued by the COSO.
Basis of Accounting
As discussed in Note 1 to the consolidated financial statements, the United States Bankruptcy Court for the Southern District of New York confirmed the Company’s
First Amended Joint Plan of Reorganization of Cumulus Media Inc. and its Debtor Affiliates Pursuant to Chapter 11 of the Bankruptcy Code
(the "Plan") on May 10, 2018. Confirmation of the plan resulted in the discharge of certain claims against the Company that arose before November 29, 2017 and terminates all rights and interests of equity security holders as provided for in the Plan. The Plan was substantially consummated on June 4, 2018 and the Company emerged from bankruptcy. In connection with its emergence from bankruptcy, the Company adopted fresh start accounting as of June 4, 2018.
Basis for Opinions
The Company's management is responsible for these consolidated financial statements, for maintaining effective internal control over financial reporting, and for its assessment of the effectiveness of internal control over financial reporting, included in Management's Report on Internal Control over Financial Reporting appearing under Item 9A. Our responsibility is to express opinions on the Company’s consolidated financial statements and on the Company's internal control over financial reporting based on our audits. We are a public accounting firm registered with the Public Company Accounting Oversight Board (United States) (PCAOB) and are required to be independent with respect to the Company in accordance with the U.S. federal securities laws and the applicable rules and regulations of the Securities and Exchange Commission and the PCAOB.
We conducted our audits in accordance with the standards of the PCAOB. Those standards require that we plan and perform the audits to obtain reasonable assurance about whether the consolidated financial statements are free of material misstatement, whether due to error or fraud, and whether effective internal control over financial reporting was maintained in all material respects.
Our audits of the consolidated financial statements included performing procedures to assess the risks of material misstatement of the consolidated financial statements, whether due to error or fraud, and performing procedures that respond to those risks. Such procedures included examining, on a test basis, evidence regarding the amounts and disclosures in the consolidated financial statements. Our audits also included evaluating the accounting principles used and significant estimates made by management, as well as evaluating the overall presentation of the consolidated financial statements. Our audit of internal control over financial reporting included obtaining an understanding of internal control over financial reporting, assessing the risk that a material weakness exists, and testing and evaluating the design and operating effectiveness of internal control based on the assessed risk. Our audits also included performing such other procedures as we considered necessary in the circumstances. We believe that our audits provide a reasonable basis for our opinions.
F-2
Definition and Limitations of Internal Control over Financial Reporting
A company’s internal control over financial reporting is a process designed to provide reasonable assurance regarding the reliability of financial reporting and the preparation of financial statements for external purposes in accordance with generally accepted accounting principles. A company’s internal control over financial reporting includes those policies and procedures that (i) pertain to the maintenance of records that, in reasonable detail, accurately and fairly reflect the transactions and dispositions of the assets of the company; (ii) provide reasonable assurance that transactions are recorded as necessary to permit preparation of financial statements in accordance with generally accepted accounting principles, and that receipts and expenditures of the company are being made only in accordance with authorizations of management and directors of the company; and (iii) provide reasonable assurance regarding prevention or timely detection of unauthorized acquisition, use, or disposition of the company’s assets that could have a material effect on the financial statements.
Because of its inherent limitations, internal control over financial reporting may not prevent or detect misstatements. Also, projections of any evaluation of effectiveness to future periods are subject to the risk that controls may become inadequate because of changes in conditions, or that the degree of compliance with the policies or procedures may deteriorate.
/s/ PricewaterhouseCoopers LLP
Atlanta, Georgia
March 18, 2019
We have served as the Company’s auditor since 2008.
F-3
Report of Independent Registered Public Accounting Firm
To the
Board of Directors and Stockholders of Cumulus Media Inc.
Opinion on the Financial Statements
We have audited the accompanying consolidated balance sheet of Cumulus Media Inc. and its subsidiaries (Predecessor) (the “Company”) as of December 31, 2017 and the related consolidated statements of operations, of stockholders’ equity (deficit) and of cash flows for the period from January 1, 2018 through June 3, 2018, and for each of the two years in the period ended December 31, 2017, including the related notes and financial statement schedule of valuation and qualifying accounts for the period from January 1, 2018 through June 3, 2018, and for each of the two years in the period ended December 31, 2017 listed in the accompanying index (collectively referred to as the “consolidated financial statements”). In our opinion, the consolidated financial statements present fairly, in all material respects, the financial position of the Company as of December 31, 2017, and the results of its operations and its cash flows for the period from January 1, 2018 through June 3, 2018, and for each of the two years in the period ended December 31, 2017 in conformity with accounting principles generally accepted in the United States of America.
Basis of Accounting
As discussed in Note 1 to the consolidated financial statements, the Company filed a petition on November 29, 2017 with the United States Bankruptcy Court for the Southern District of New York for reorganization under the provisions of Chapter 11 of the Bankruptcy Code. The Company’s
First Amended Joint Plan of Reorganization of Cumulus Media Inc. and its Debtor Affiliates Pursuant to Chapter 11 of the Bankruptcy Code
was substantially consummated on June 4, 2018 and the Company emerged from bankruptcy. In connection with its emergence from bankruptcy, the Company adopted fresh start accounting.
Change in Accounting Principle
As discussed in Note 1 to the consolidated financial statements, the Company changed the manner in which it accounts for revenues from contracts with customers in 2018.
Basis for Opinion
These consolidated financial statements are the responsibility of the Company's management. Our responsibility is to express an opinion on the Company’s consolidated financial statements based on our audits. We are a public accounting firm registered with the Public Company Accounting Oversight Board (United States) (PCAOB) and are required to be independent with respect to the Company in accordance with the U.S. federal securities laws and the applicable rules and regulations of the Securities and Exchange Commission and the PCAOB.
We conducted our audits of these consolidated financial statements in accordance with the standards of the PCAOB. Those standards require that we plan and perform the audit to obtain reasonable assurance about whether the consolidated financial statements are free of material misstatement, whether due to error or fraud.
Our audits included performing procedures to assess the risks of material misstatement of the consolidated financial statements, whether due to error or fraud, and performing procedures that respond to those risks. Such procedures included examining, on a test basis, evidence regarding the amounts and disclosures in the consolidated
financial statements. Our audits also included evaluating the accounting principles used and significant estimates made by management, as well as evaluating the overall presentation of the consolidated financial statements. We believe that our audits provide a reasonable basis for our opinion.
/s/PricewaterhouseCoopers LLP
Atlanta, Georgia
March 18, 2019
We have served as the Company’s auditor since 2008.
F-4
CUMULUS MEDIA INC.
CONSOLIDATED BALANCE SHEETS
(Dollars in thousands, except for share data)
|
Successor Company
|
Predecessor Company
|
|||||||
|
December 31, 2018
|
December 31, 2017
|
|||||||
|
Assets
|
||||||||
|
Current assets:
|
||||||||
|
Cash and cash equivalents
|
$
|
27,584
|
|
$
|
102,891
|
|
||
|
Restricted cash
|
2,454
|
|
8,999
|
|
||||
|
Accounts receivable, less allowance for doubtful accounts of $5,483 and $4,322 in 2018 and 2017, respectively
|
250,111
|
|
235,247
|
|
||||
|
Trade receivable
|
3,390
|
|
4,224
|
|
||||
|
Assets held for sale
|
80,000
|
|
—
|
|
||||
|
Prepaid expenses and other current assets
|
31,452
|
|
42,259
|
|
||||
|
Total current assets
|
394,991
|
|
393,620
|
|
||||
|
Property and equipment, net
|
235,898
|
|
191,604
|
|
||||
|
Broadcast licenses
|
935,652
|
|
1,203,809
|
|
||||
|
Other intangible assets, net
|
193,535
|
|
82,994
|
|
||||
|
Goodwill
|
—
|
|
135,214
|
|
||||
|
Other assets
|
15,076
|
|
20,078
|
|
||||
|
Total assets
|
$
|
1,775,152
|
|
$
|
2,027,319
|
|
||
|
Liabilities and Stockholders’ Equity (Deficit)
|
||||||||
|
Current liabilities:
|
||||||||
|
Accounts payable and accrued expenses
|
$
|
101,320
|
|
$
|
36,157
|
|
||
|
Trade payable
|
2,578
|
|
—
|
|
||||
|
Current portion of long-term debt
|
13,000
|
|
—
|
|
||||
|
Total current liabilities
|
116,898
|
|
36,157
|
|
||||
|
Term loan
|
1,230,299
|
|
—
|
|
||||
|
Other liabilities
|
25,742
|
|
54
|
|
||||
|
Deferred income taxes
|
12,384
|
|
—
|
|
||||
|
Total liabilities not subject to compromise
|
1,385,323
|
|
36,211
|
|
||||
|
Liabilities subject to compromise
|
—
|
|
2,687,223
|
|
||||
|
Total liabilities
|
1,385,323
|
|
2,723,434
|
|
||||
|
Commitments and Contingencies (Note 16)
|
|
|
||||||
|
Stockholders’ equity (deficit):
|
||||||||
|
Predecessor Class A common stock, par value $0.01 per share; 93,750,000 shares authorized; 32,031,054 shares issued, and 29,225,765 shares outstanding at December 31, 2017
|
—
|
|
320
|
|
||||
|
Predecessor Class C common stock, par value $0.01 per share; 80,609 shares authorized issued and outstanding at December 31, 2017
|
—
|
|
1
|
|
||||
|
Predecessor treasury stock, at cost, 2,806,187 shares at December 31, 2017
|
—
|
|
(229,310
|
)
|
||||
|
Predecessor additional paid-in-capital
|
—
|
|
1,626,428
|
|
||||
|
Predecessor accumulated deficit
|
—
|
|
(2,093,554
|
)
|
||||
|
Successor Class A common stock, par value $0.0000001 per share; 100,000,000 shares authorized; 12,995,080 shares issued and outstanding at December 31, 2018
|
—
|
|
—
|
|
||||
|
Successor Class B common stock, par value $0.0000001 per share; 100,000,000 shares authorized; 3,560,604 shares issued and outstanding at December 31, 2018
|
—
|
|
—
|
|
||||
|
Successor additional paid-in-capital
|
328,404
|
|
—
|
|
||||
|
Successor retained earnings
|
61,425
|
|
—
|
|
||||
|
Total stockholders’ equity (deficit)
|
389,829
|
|
(696,115
|
)
|
||||
|
Total liabilities and stockholders’ equity (deficit)
|
$
|
1,775,152
|
|
$
|
2,027,319
|
|
||
See accompanying notes to the consolidated financial statements.
F-5
CUMULUS MEDIA INC.
CONSOLIDATED STATEMENTS OF OPERATIONS
(Dollars in thousands, except for share and per share data)
|
Successor Company
|
Predecessor Company
|
|||||||||||||||
|
Period from June 4, 2018 through December 31, 2018
|
Period from January 1, 2018 through June 3, 2018
|
Year Ended December 31, 2017
|
Year Ended December 31, 2016
|
|||||||||||||
|
Net revenue
|
$
|
686,436
|
|
|
$
|
453,924
|
|
$
|
1,135,662
|
|
$
|
1,141,400
|
|
|||
|
Operating expenses:
|
|
|
|
|||||||||||||
|
Content costs
|
238,888
|
|
|
163,885
|
|
409,213
|
|
432,077
|
|
|||||||
|
Selling, general & administrative expenses
|
276,551
|
|
|
195,278
|
|
471,300
|
|
468,603
|
|
|||||||
|
Depreciation and amortization
|
34,060
|
|
|
22,046
|
|
62,239
|
|
87,267
|
|
|||||||
|
LMA fees
|
2,471
|
|
|
1,809
|
|
10,884
|
|
12,824
|
|
|||||||
|
Corporate expenses (including stock-based compensation expense of $3,404, $231, $1,614, and $2,948, respectively)
|
31,714
|
|
|
17,169
|
|
59,062
|
|
40,148
|
|
|||||||
|
Loss (gain) on sale of assets or stations
|
103
|
|
|
158
|
|
(2,499
|
)
|
(95,695
|
)
|
|||||||
|
Impairment of intangible assets and goodwill
|
—
|
|
|
—
|
|
335,909
|
|
604,965
|
|
|||||||
|
Total operating expenses
|
583,787
|
|
|
400,345
|
|
1,346,108
|
|
1,550,189
|
|
|||||||
|
Operating income (loss)
|
102,649
|
|
|
53,579
|
|
(210,446
|
)
|
(408,789
|
)
|
|||||||
|
Non-operating (expense) income:
|
|
|
|
|||||||||||||
|
Reorganization items, net
|
—
|
|
466,201
|
|
(31,603
|
)
|
—
|
|
||||||||
|
Interest expense
|
(50,718
|
)
|
|
(260
|
)
|
(126,952
|
)
|
(138,634
|
)
|
|||||||
|
Interest income
|
36
|
|
|
50
|
|
136
|
|
493
|
|
|||||||
|
Gain (loss) on early extinguishment of debt
|
201
|
|
|
—
|
|
(1,063
|
)
|
8,017
|
|
|||||||
|
Other (expense) income, net
|
(3,096
|
)
|
|
(273
|
)
|
(363
|
)
|
2,039
|
|
|||||||
|
Total non-operating (expense) income, net
|
(53,577
|
)
|
|
465,718
|
|
(159,845
|
)
|
(128,085
|
)
|
|||||||
|
Income (loss) before income taxes
|
49,072
|
|
|
519,297
|
|
(370,291
|
)
|
(536,874
|
)
|
|||||||
|
Income tax benefit
|
12,353
|
|
|
176,859
|
|
163,726
|
|
26,154
|
|
|||||||
|
Net income (loss)
|
$
|
61,425
|
|
|
$
|
696,156
|
|
$
|
(206,565
|
)
|
$
|
(510,720
|
)
|
|||
|
Basic and diluted earnings (loss) per common share
(see Note 14, “Earnings (loss) Per Share”):
|
|
|
|
|||||||||||||
|
Basic: Income (loss) per share
|
$
|
3.07
|
|
|
$
|
23.73
|
|
$
|
(7.05
|
)
|
$
|
(17.45
|
)
|
|||
|
Diluted: Income (loss) per share
|
$
|
3.05
|
|
|
$
|
23.73
|
|
$
|
(7.05
|
)
|
$
|
(17.45
|
)
|
|||
|
Weighted average basic common shares outstanding
|
20,028,227
|
|
|
29,338,329
|
|
29,306,374
|
|
29,270,455
|
|
|||||||
|
Weighted average diluted common shares outstanding
|
20,164,638
|
|
|
29,338,329
|
|
29,306,374
|
|
29,270,455
|
|
|||||||
See accompanying notes to the consolidated financial statements.
F-6
CUMULUS MEDIA INC.
CONSOLIDATED STATEMENTS OF STOCKHOLDERS’ EQUITY (DEFICIT)
For the Periods Ended
December 31, 2018
(Successor), June 3, 2018 (Predecessor), and the Years Ended
2017
and
2016
(Predecessor)
(Dollars in thousands)
|
|
Class A
Common Stock
|
|
Class B Common Stock
|
Class C
Common Stock
|
|
Treasury
Stock
|
|
|
|
|
|
|
|||||||||||||||||||||||||||||
|
|
Number of
Shares
|
Par
Value
|
|
Number of
Shares |
Par
Value |
Number of
Shares
|
|
Par
Value
|
|
Number of
Shares
|
|
Value
|
|
Additional
Paid-In Capital |
|
(Accumulated
Deficit) Retained Earnings |
|
Total
|
|||||||||||||||||||||||
|
Balance at December 31, 2015 (Predecessor)
|
31,987,862
|
|
$
|
320
|
|
80,609
|
|
$
|
1
|
|
2,805,743
|
|
$
|
(229,310
|
)
|
$
|
1,621,865
|
|
$
|
(1,376,844
|
)
|
$
|
16,032
|
|
|||||||||||||||||
|
Net loss
|
—
|
|
|
|
|
|
|
|
(510,720
|
)
|
(510,720
|
)
|
|||||||||||||||||||||||||||||
|
Conversion of equity upon exercise of warrants
|
43,192
|
|
—
|
|
—
|
|
—
|
|
—
|
|
—
|
|
—
|
|
—
|
|
2
|
|
—
|
|
2
|
|
|||||||||||||||||||
|
Stock based compensation expense
|
—
|
|
—
|
|
—
|
|
—
|
|
—
|
|
—
|
|
—
|
|
—
|
|
2,948
|
|
—
|
|
2,948
|
|
|||||||||||||||||||
|
Other
|
—
|
|
—
|
|
—
|
|
—
|
|
—
|
|
—
|
|
444
|
|
—
|
|
—
|
|
—
|
|
—
|
|
|||||||||||||||||||
|
Balance at December 31, 2016 (Predecessor)
|
32,031,054
|
|
$
|
320
|
|
—
|
|
$
|
—
|
|
80,609
|
|
$
|
1
|
|
2,806,187
|
|
$
|
(229,310
|
)
|
$
|
1,624,815
|
|
$
|
(1,887,564
|
)
|
$
|
(491,738
|
)
|
||||||||||||
|
Net loss
|
—
|
|
—
|
|
—
|
|
—
|
|
|
|
|
|
|
(206,565
|
)
|
(206,565
|
)
|
||||||||||||||||||||||||
|
Stock based compensation expense
|
—
|
|
—
|
|
—
|
|
—
|
|
—
|
|
—
|
|
—
|
|
—
|
|
1,614
|
|
—
|
|
1,614
|
|
|||||||||||||||||||
|
Other
|
—
|
|
—
|
|
—
|
|
—
|
|
—
|
|
—
|
|
—
|
|
—
|
|
(1
|
)
|
575
|
|
574
|
|
|||||||||||||||||||
|
Balance at December 31, 2017 (Predecessor)
|
32,031,054
|
|
$
|
320
|
|
—
|
|
$
|
—
|
|
80,609
|
|
$
|
1
|
|
2,806,187
|
|
$
|
(229,310
|
)
|
$
|
1,626,428
|
|
$
|
(2,093,554
|
)
|
$
|
(696,115
|
)
|
||||||||||||
|
Net loss
|
—
|
|
—
|
|
—
|
|
—
|
|
—
|
|
—
|
|
—
|
|
—
|
|
—
|
|
(44,000
|
)
|
(44,000
|
)
|
|||||||||||||||||||
|
Other
|
—
|
|
—
|
|
—
|
|
—
|
|
—
|
|
—
|
|
—
|
|
—
|
|
247
|
|
—
|
|
247
|
|
|||||||||||||||||||
|
Stock-based compensation expense
|
—
|
|
—
|
|
—
|
|
—
|
|
—
|
|
—
|
|
—
|
|
—
|
|
231
|
|
—
|
|
231
|
|
|||||||||||||||||||
|
Balance at June 3, 2018 (Predecessor)
|
32,031,054
|
|
$
|
320
|
|
—
|
|
$
|
—
|
|
80,609
|
|
$
|
1
|
|
2,806,187
|
|
$
|
(229,310
|
)
|
$
|
1,626,906
|
|
$
|
(2,137,554
|
)
|
$
|
(739,637
|
)
|
||||||||||||
|
Implementation of Plan and Application of Fresh Start Accounting:
|
|
|
|
|
|
|
|
|
|
|
|
|
|
||||||||||||||||||||||||||||
|
Cancellation of Predecessor equity
|
(32,031,054
|
)
|
(320
|
)
|
—
|
|
—
|
|
(80,609
|
)
|
(1
|
)
|
(2,806,187
|
)
|
229,310
|
|
(1,626,906
|
)
|
—
|
|
(1,397,917
|
)
|
|||||||||||||||||||
|
Elimination of accumulated deficit
|
—
|
|
—
|
|
—
|
|
—
|
|
—
|
|
—
|
|
—
|
|
—
|
|
—
|
|
2,137,554
|
|
2,137,554
|
|
|||||||||||||||||||
|
Issuance of Successor common stock
|
11,052,211
|
|
—
|
|
5,218,209
|
|
—
|
|
—
|
|
—
|
|
—
|
|
—
|
|
264,394
|
|
—
|
|
264,394
|
|
|||||||||||||||||||
|
Issuance of Successor warrants
|
—
|
|
—
|
|
—
|
|
—
|
|
—
|
|
—
|
|
—
|
|
—
|
|
60,606
|
|
—
|
|
60,606
|
|
|||||||||||||||||||
|
Balance at June 4, 2018 (Successor)
|
11,052,211
|
|
$
|
—
|
|
5,218,209
|
|
$
|
—
|
|
—
|
|
$
|
—
|
|
—
|
|
$
|
—
|
|
$
|
325,000
|
|
$
|
—
|
|
$
|
325,000
|
|
||||||||||||
|
Net income
|
|
|
|
|
|
|
|
61,425
|
|
61,425
|
|
||||||||||||||||||||||||||||||
|
Conversion of Class B common stock
|
1,692,849
|
|
—
|
|
(1,692,849
|
)
|
—
|
|
—
|
|
—
|
|
—
|
|
—
|
|
—
|
|
—
|
|
—
|
|
|||||||||||||||||||
|
Exercise of warrants
|
221,657
|
|
—
|
|
35,244
|
|
—
|
|
—
|
|
—
|
|
—
|
|
—
|
|
—
|
|
—
|
|
—
|
|
—
|
|
—
|
|
|||||||||||||||
|
Issuance of Successor common stock
|
28,363
|
|
—
|
|
—
|
|
—
|
|
—
|
|
—
|
|
—
|
|
—
|
|
—
|
|
—
|
|
—
|
|
|||||||||||||||||||
|
Stock-based compensation expense
|
—
|
|
—
|
|
—
|
|
—
|
|
—
|
|
—
|
|
—
|
|
—
|
|
—
|
|
—
|
|
3,404
|
|
—
|
|
3,404
|
|
|||||||||||||||
|
Balance at December 31, 2018 (Successor)
|
12,995,080
|
|
$
|
—
|
|
3,560,604
|
|
$
|
—
|
|
—
|
|
$
|
—
|
|
—
|
|
$
|
—
|
|
$
|
328,404
|
|
$
|
61,425
|
|
$
|
389,829
|
|
||||||||||||
See accompanying notes to the consolidated financial statements.
F-7
CUMULUS MEDIA INC.
CONSOLIDATED STATEMENTS OF CASH FLOWS
(Dollars in thousands)
|
Successor Company
|
Predecessor Company
|
|||||||||||||||
|
Period from June 4, 2018 through December 31, 2018
|
Period from January 1, 2018 through June 3, 2018
|
Year Ended December 31, 2017
|
Year Ended December 31, 2016
|
|||||||||||||
|
Cash flows from operating activities:
|
||||||||||||||||
|
Net income (loss)
|
$
|
61,425
|
|
$
|
696,156
|
|
$
|
(206,565
|
)
|
$
|
(510,720
|
)
|
||||
|
Adjustments to reconcile net income (loss) to net cash provided by operating activities:
|
||||||||||||||||
|
Depreciation and amortization
|
34,060
|
|
22,046
|
|
62,239
|
|
87,267
|
|
||||||||
|
Amortization of debt issuance costs/discounts
|
71
|
|
—
|
|
9,394
|
|
9,961
|
|
||||||||
|
Provision for doubtful accounts
|
5,313
|
|
5,993
|
|
5,807
|
|
1,103
|
|
||||||||
|
Loss (gain) on sale of assets or stations
|
103
|
|
158
|
|
(2,499
|
)
|
(95,695
|
)
|
||||||||
|
Non-cash reorganization items, net
|
—
|
|
(523,651
|
)
|
25,921
|
|
—
|
|
||||||||
|
Impairment of intangible assets and goodwill
|
—
|
|
—
|
|
335,909
|
|
604,965
|
|
||||||||
|
Impairment charges -- equity interest in Next Radio and Pulser Media
|
3,170
|
|
—
|
|
—
|
|
—
|
|
||||||||
|
Deferred income taxes
|
(27,411
|
)
|
(179,455
|
)
|
(168,226
|
)
|
(27,831
|
)
|
||||||||
|
Stock-based compensation expense
|
3,404
|
|
231
|
|
1,614
|
|
2,948
|
|
||||||||
|
(Gain) loss on early extinguishment of debt
|
(201
|
)
|
—
|
|
1,063
|
|
(8,017
|
)
|
||||||||
|
Other
|
153
|
|
—
|
|
—
|
|
—
|
|
||||||||
|
Changes in assets and liabilities (excluding acquisitions and dispositions):
|
||||||||||||||||
|
Accounts receivable
|
(39,699
|
)
|
12,697
|
|
(9,469
|
)
|
10,740
|
|
||||||||
|
Trade receivable
|
1,831
|
|
(997
|
)
|
761
|
|
(839
|
)
|
||||||||
|
Prepaid expenses and other current assets
|
(4,700
|
)
|
(5,831
|
)
|
(7,655
|
)
|
(7,017
|
)
|
||||||||
|
Other assets
|
3,981
|
|
(436
|
)
|
(1,451
|
)
|
(1,106
|
)
|
||||||||
|
Accounts payable and accrued expenses
|
(10,077
|
)
|
7,777
|
|
46,587
|
|
(16,816
|
)
|
||||||||
|
Trade payable
|
(676
|
)
|
190
|
|
(1,486
|
)
|
176
|
|
||||||||
|
Other liabilities
|
1,651
|
|
(5,746
|
)
|
(5,348
|
)
|
(13,374
|
)
|
||||||||
|
Net cash provided by operating activities
|
32,398
|
|
29,132
|
|
86,596
|
|
35,745
|
|
||||||||
|
Cash flows from investing activities:
|
||||||||||||||||
|
Proceeds from sale of assets or stations
|
586
|
|
—
|
|
6,090
|
|
106,935
|
|
||||||||
|
Acquisition
|
(18,000
|
)
|
—
|
|
—
|
|
—
|
|
||||||||
|
Capital expenditures
|
(15,684
|
)
|
(14,019
|
)
|
(31,932
|
)
|
(23,037
|
)
|
||||||||
|
Net cash (used in) provided by investing activities
|
(33,098
|
)
|
(14,019
|
)
|
(25,842
|
)
|
83,898
|
|
||||||||
|
Cash flows from financing activities:
|
||||||||||||||||
|
Repayment of borrowings under term loan and revolving credit facilities
|
(56,500
|
)
|
—
|
|
(81,652
|
)
|
(20,000
|
)
|
||||||||
|
Adequate protection payments on term loan
|
—
|
|
(37,802
|
)
|
(6,405
|
)
|
—
|
|
||||||||
|
Proceeds from exercise of warrants
|
—
|
|
—
|
|
—
|
|
3
|
|
||||||||
|
Financing costs
|
(1,113
|
)
|
(850
|
)
|
(91
|
)
|
—
|
|
||||||||
|
Net cash used in financing activities
|
(57,613
|
)
|
(38,652
|
)
|
(88,148
|
)
|
(19,997
|
)
|
||||||||
|
(Decrease) increase in cash and cash equivalents
|
(58,313
|
)
|
(23,539
|
)
|
(27,394
|
)
|
99,646
|
|
||||||||
|
Cash, cash equivalents and restricted cash at beginning of period
|
88,351
|
|
111,890
|
|
139,284
|
|
39,638
|
|
||||||||
|
Cash, cash equivalents and restricted cash at end of period
|
$
|
30,038
|
|
$
|
88,351
|
|
$
|
111,890
|
|
$
|
139,284
|
|
||||
See accompanying notes to the consolidated financial statements
.
F-8
NOTES TO CONSOLIDATED FINANCIAL STATEMENTS
1. Nature of Business, Basis of Presentation and Summary of Significant Accounting Policies
Cumulus Media Inc. (and its consolidated subsidiaries, except as the context may otherwise require, “CUMULUS MEDIA,” “we,” “us,” “our,” or the “Company”) is a Delaware corporation, organized in 2018, and successor to a Delaware corporation with the same name that was organized in 2002.
Nature of Business
A leader in the radio broadcasting industry, CUMULUS MEDIA combines high-quality local programming with iconic, nationally syndicated media, sports and entertainment brands to deliver premium content choices to the
245 million
people reached each week through its
433
owned-and-operated stations broadcasting in
88
U.S. media markets (including
eight
of the top
10
), approximately
8,000
broadcast radio stations affiliated with its Westwood One network and numerous digital channels. Together, the Cumulus Radio Station Group and Westwood One platforms make CUMULUS MEDIA one of the few media companies that can provide advertisers with national reach and local impact. The Cumulus Radio Station Group and Westwood One are the exclusive radio broadcast partners to some of the largest brands in sports, entertainment, news, and talk, including the NFL, the NCAA, the Masters, the Olympics, the GRAMMYs, the Academy of Country Music Awards, the American Music Awards, the Billboard Music Awards, and more. Additionally, the Company is the nation's leading provider of country music and lifestyle content through its NASH brand, which serves country fans nationwide through radio programming, exclusive digital content, and live events.
Basis of Presentation
As previously disclosed, on November 29, 2017 (the “Petition Date”), CM Wind Down Topco Inc. (formerly known as
Cumulus Media Inc.), a Delaware corporation (“Old Cumulus”) and certain of its direct and indirect subsidiaries (collectively, the “Debtors”) filed voluntary petitions for relief (the “Bankruptcy Petitions”) under Chapter 11 of Title 11 of the United States Code (the “Bankruptcy Code”) in the United States Bankruptcy Court for the Southern District of New York (the “Bankruptcy Court”). The Debtors’ chapter 11 cases (the "Chapter 11 Cases") were jointly administered under the caption In
re Cumulus Media Inc., et al, Case No. 17-13381
. On May 10, 2018, the Bankruptcy Court entered the
Findings of Fact, Conclusions of Law and Order Confirming the Debtors’ First Amended Joint Chapter 11 Plan of Reorganization
[Docket No. 769] (the “Confirmation Order”), which confirmed the
First Amended Joint Plan of Reorganization of Cumulus Media Inc. and its Debtor Affiliates Pursuant to Chapter 11 of the Bankruptcy Code
[Docket No. 446] (the “Plan”), as modified by the Confirmation Order. On June 4, 2018 (the “Effective Date”), Old Cumulus satisfied the conditions to effectiveness set forth in the Confirmation Order and in the Plan, the Plan was substantially consummated, and Old Cumulus and the other Debtors emerged from Chapter 11. On June 29, 2018, the Bankruptcy Court entered an order closing the Chapter 11 Cases of all of the Debtors other than Old Cumulus, whose case will remain open until its estate has been fully administered including resolving outstanding claims and the Bankruptcy Court enters an order closing its case.
In connection with its emergence, Old Cumulus implemented a series of internal reorganization transactions authorized by the Plan pursuant to which it transferred substantially all of its remaining assets to an indirectly wholly owned subsidiary of reorganized Cumulus Media Inc. (formerly known as CM Emergence Newco Inc.), a Delaware corporation (“CUMULUS MEDIA” or the “Company”), prior to winding down its business. References to “Successor” or “Successor Company” relate to the balance sheet and results of operations of CUMULUS MEDIA on and subsequent to June 4, 2018. References to “Predecessor”, “Predecessor Company” or “Old Cumulus” refer to the balance sheet and results of operations of Old Cumulus prior to June 4, 2018.
Upon filing for bankruptcy and up through and including the emergence from Chapter 11 on the Effective Date, the Company applied Accounting Standards Codification (“ASC”) 852 - Reorganizations (“ASC 852”) in preparing its consolidated financial statements (see Note 2, “Emergence from Chapter 11” and Note 3 “Fresh Start Accounting”). As a result of the application of fresh start accounting and the effects of the implementation of the Plan, a new entity for financial reporting purposes was created, and consequently the consolidated financial statements on and after June 4, 2018 are not comparable to the consolidated financial statements prior to that date. Refer to Note 3, “Fresh Start Accounting” for additional information.
F-9
The accompanying consolidated financial statements include the accounts of the Company and its wholly owned subsidiaries. All intercompany balances and transactions have been eliminated in consolidation.
Revision of Previously Issued Financial Statements
During the third quarter of 2018, the Company determined that it had an error in the classification of certain content related costs in the Condensed Consolidated Statements of Operations in previous periods. The Company should have presented the amounts within content costs rather than within selling, general and administrative costs. In the accompanying Consolidated Statements of Operations, the previous periods have been revised to correct this misclassification. This reclassification resulted in an increase in Content costs of
$4.2 million
for the Predecessor Company Period from January 1, 2018 through June 3, 2018. For the Predecessor Company years ended December 31, 2017 and 2016, the reclassification was
$6.2 million
and
$4.3 million
, respectively. The correction was not material to the Predecessor or Successor results.
Reverse Stock Split
On October 12, 2016, the Predecessor Company effected a one-for-eight (1:8) reverse stock split (the "Reverse Stock Split"). As a result of the Reverse Stock Split, every
eight
shares of each class of the Predecessor Company's outstanding common stock were combined into one share of the same class of common stock and the authorized shares of each class of the Predecessor Company's common stock were reduced by the same ratio. No fractional shares were issued in connection with the Reverse Stock Split. The number and exercise price of the Predecessor Company's outstanding stock options and warrants were adjusted proportionally, as appropriate. The par value of the Predecessor Company's common stock was not adjusted as a result of the Reverse Stock Split. All authorized, issued and outstanding stock and per share amounts for the Predecessor Company contained within the accompanying consolidated financial statements and these footnotes have been adjusted to reflect this Reverse Stock Split for all periods presented.
Reportable Segments
The Company operates in
two
reportable segments, for which there is discrete financial information available and whose operating results are reviewed by the chief operating decision maker, the Cumulus Radio Station Group and Westwood One.
Use of Estimates
The preparation of financial statements in conformity with GAAP requires management to make estimates and judgments that affect the reported amounts of assets, liabilities, revenues and expenses, and related disclosures of contingent assets and liabilities. On an on-going basis, the Company evaluates its estimates, including significant estimates related to revenue recognition, bad debts, intangible assets, income taxes, stock-based compensation, contingencies, litigation, valuation assumptions for impairment analysis, certain expense accruals and, if applicable, purchase price allocation. The Company bases its estimates on historical experience and on various assumptions that are believed to be reasonable under the circumstances, and which form the basis for making judgments about the carrying values of assets and liabilities that are not readily apparent from other sources. Actual amounts and results may differ materially from these estimates.
Comprehensive Income (Loss)
Comprehensive income (loss) includes net income (loss) and certain items that are excluded from net income (loss) and recorded as a separate component of stockholders' equity (deficit). During the years ended December 31, 2018 and 2017, the Company had no items of other comprehensive income (loss) and, therefore, comprehensive income (loss) does not differ from reported net income (loss).
Going Concern Considerations
In accordance with the requirements of Accounting Standards Update (“ASU”), 2014-15, Presentation of Financial Statements Going Concern (Subtopic 205-40), or Accounting Standards Codification ("ASC") 205-40, the Company has the responsibility to evaluate at each reporting period, including interim periods, whether conditions and/or events raise substantial doubt about the Company's ability to meet its future financial obligations. In its evaluation for this report, management considered the Company’s current financial condition and liquidity sources, including current funds available, forecasted future cash flows and the Company’s conditional and unconditional obligations due for
12
months following the date of issuance of this Annual Report on Form 10-K.
F-10
During the pendency of the Chapter 11 Cases, the Company’s ability to continue as a going concern was contingent upon a variety of factors, including the Bankruptcy Court’s approval of the Plan and the Company’s ability to successfully implement the Plan. As a result of the effectiveness of the Plan and the expectation that it will continue to generate positive cash flows from operating activities, the Company believes it has the ability to meet its obligations for at least
one
year from the date of issuance of this Form 10-K.
Cash and Cash Equivalents
The Company considered all highly liquid investments with original maturities of
three
months or less to be cash equivalents.
Accounts Receivable, Allowance for Doubtful Accounts and Concentration of Credit Risk
Accounts receivable are recorded at the invoiced amount and do not bear interest. The allowance for doubtful accounts is the Company’s best estimate of the amount of probable credit losses in the Company’s existing accounts receivable. The Company determined the allowance based on several factors, including the length of time receivables are past due, trends and current economic factors. All balances are reviewed and evaluated quarterly on a consolidated basis. Account balances are charged off against the allowance after all means of collection have been exhausted and the potential for recovery is considered remote. The Company does not have any off-balance-sheet credit exposure related to its customers.
In the opinion of management, credit risk with respect to accounts receivable is limited as a result of the large number of customers and the geographic diversification of the Company’s customer base. The Company performs credit evaluations of its customers as needed and believes that adequate allowances for any uncollectible accounts receivable are maintained.
Assets Held for Sale
During the year ended December 31, 2015, the Company entered into an agreement to sell certain land in the Company's Washington, DC market to a third party. The asset was classified as held for sale in the Consolidated Balance Sheet at December 31, 2016. At December 31, 2017, the sale of this asset was subject to Bankruptcy Court approval, and consequently, the asset no longer met the definition of held for sale and was classified on the Consolidated Balance Sheet as Property and Equipment, net. As a result of the Company's emergence from Chapter 11 and as of December 31, 2018, the asset again met the criteria to be classified as held for sale at fair value less estimated selling costs in the Consolidated Balance Sheet. The closing of the transaction is subject to various conditions and approvals which remain pending.
Dispositions
On August 30, 2016, the Company completed the sale of certain land and buildings in Los Angeles for
$110.6 million
in cash. In conjunction with this sale, the Company recorded a net gain of
$94.0 million
, which is included in (gain) loss on sale of assets or stations in the accompanying Consolidated Statements of Operations for the year ended December 31, 2016.
Property and Equipment
Property and equipment are stated at cost. Property and equipment acquired in business combinations accounted for under the purchase method of accounting are recorded at their estimated fair values on the date of acquisition. Equipment held under capital leases is stated at the present value of minimum future lease payments.
Depreciation of property and equipment is computed using the straight-line method over the estimated useful lives of the assets. Equipment held under capital leases and leasehold improvements are amortized using the straight-line method over the shorter of the estimated useful life of the asset or the remaining term of the lease. Depreciation of construction in progress is not recorded until the assets are placed into service.
Impairment of Long-Lived Assets
Long-lived assets, such as property and equipment and purchased intangibles subject to amortization, are reviewed for impairment whenever events or changes in circumstances indicate that the carrying amount of an asset may not be recoverable. Recoverability of assets to be held and used is measured by a comparison of the carrying amount of an asset to estimated undiscounted future cash flows expected to be generated by the asset. If the carrying amount of an asset exceeds its estimated future cash flows, an impairment charge is recognized in the amount by which the carrying amount of the asset exceeds the fair value of the asset.
F-11
Intangible Assets
As of December 31, 2018, the Company’s intangible assets are comprised of broadcast licenses and certain other intangible assets. Intangible assets acquired in a business combination which are determined to have an indefinite useful life, including the Company’s broadcast licenses, are not amortized, but instead tested for impairment at least annually, or if a triggering event occurs. Intangible assets with definite useful lives are amortized over their respective estimated useful lives to their estimated residual values, and reviewed for impairment whenever events or changes in circumstances indicate that the carrying amount of the assets may not be recoverable.
In determining that the Company’s broadcast licenses qualified as indefinite lived intangibles, management considered a variety of factors including the Federal Communications Commission’s (“FCC”) historical record of renewing broadcast licenses, the cost to the Company of renewing such licenses, the relative stability and predictability of the radio industry and the relatively low level of capital investment required to maintain the physical plant of a radio station. The Company's evaluation of the recoverability of its indefinite-lived assets, which include FCC licenses and goodwill, is based on certain judgments and estimates. Future events may impact these judgments and estimates. If events or changes in circumstances were to indicate that an asset’s carrying value is not recoverable, a write-down of the asset would be recorded through a charge to operations.
Debt Issuance Costs
The costs related to the issuance of debt are capitalized and amortized to interest expense over the life of the related debt using the effective interest method. In April 2015, the Financial Accounting Standards Board ("FASB") issued Accounting Standards Update ("ASU") 2015-03. The amendments in ASU 2015-03 require that debt issuance costs be presented in the Consolidated Balance Sheet as a direct deduction from the carrying amount of long-term debt, consistent with debt discounts or premiums. As a result of the Company’s chapter 11 cases, the Company expensed the entire balance of
$25.9 million
of deferred financing costs and debt discount during the fourth quarter of 2017 to reorganization items, net, in the Consolidated Statements of Operations.
Revenue Recognition
Revenue is derived primarily from the sale of commercial airtime to local and national advertisers. On January 1, 2018 the Company adopted Accounting Standards Update No. 2014-09, Revenue From Contracts with Customers ("ASC 606") using the modified retrospective method. Results for reporting periods beginning after January 1, 2018 are presented in accordance with ASC 606, while prior period amounts have not been adjusted and continue to be reported in accordance with the Company's historic accounting under
ASC 605 - Revenue Recognition ("ASC 605")
. Under current and prior revenue guidance, revenues are recognized when control of the promised goods or services are transferred to the customer, in an amount that reflects the consideration to which the Company expects to be entitled in exchange for those good or services.
Broadcast advertising revenue is recognized as commercials are broadcast. In those instances in which the Company functions as the principal in the transaction, the revenue and associated operating costs are presented on a gross basis. In those instances where the Company functions as an agent or sales representative, the effective commission is presented as revenue with no corresponding operating expenses.
Local Marketing Agreements
A number of radio stations, including certain of our stations, have entered into Local Marketing Agreements (“LMAs”). In a typical LMA, the licensee of a station makes available, for a fee and reimbursement of its expenses, airtime on its station to a party which supplies programming to be broadcast during that airtime, and collects revenues from advertising aired during such programming. LMAs are subject to compliance with the antitrust laws and the Communications Laws, including the requirement that the licensee must maintain independent control over the station and, in particular, its personnel, programming, and finances.
As of
December 31, 2018
and
2017
, the Company operated
two
and
four
radio stations under LMAs, respectively. The stations operated under LMAs contributed
$3.5 million
,
$2.6 million
,
$23.9 million
, and
$23.2 million
for the Successor Company period June 4, 2018 through December 31, 2018, the Predecessor Company period January 1, 2018 through June 3, 2018, the Predecessor Company year ended December 31, 2017 and the Predecessor Company year ended December 31, 2016, respectively, to the consolidated net revenue of the Company.
Stock-based Compensation Expense
Stock-based compensation expense recognized for the Successor Company period June 4, 2018 through December 31, 2018, the Predecessor Company period January 1, 2018 through June 3, 2018, the Predecessor Company year ended December 31, 2017 and the Predecessor Company year ended December 31, 2016, was
$3.4 million
,
$0.2 million
,
$1.6 million
, and
$2.9
F-12
million
, respectively. For awards with service conditions, stock-based compensation expense is recognized on a straight-line basis over the requisite service period for the entire award. In addition, the Successor Company made an accounting policy election to recognize forfeitures of share-based awards as they occur in the period of forfeiture rather than estimating the number of awards expected to be forfeited at the grant date and subsequently adjusting the estimate when awards are actually forfeited. For stock options with service conditions only, the Company utilizes the Black-Scholes option pricing model to estimate the fair value of options issued. The fair value of stock options is determined by the Company’s stock price, historical stock price volatility, the expected term of the award, risk-free interest rates and expected dividends. If other assumptions are used, the results could differ. For restricted stock awards with service conditions only, the Company utilizes the intrinsic value method. For restricted stock awards with performance conditions, the Company evaluates the probability of vesting of the awards in each reporting period and calculates stock-based compensation expense based on this assessment.
Trade Transactions
The Company provides commercial airtime in exchange for goods and services used principally for promotional, sales, programming and other business activities. An asset and liability is recorded at the fair value of the goods or services received. Trade revenue is recorded and the liability is relieved when commercials are broadcast and trade expense is recorded and the asset relieved when goods or services are consumed. Trade valuation is based upon management’s estimate of the fair value of the products, supplies and services received. For the Successor Company period June 4, 2018 through December 31, 2018, the Predecessor Company period January 1, 2018 through June 3, 2018, the Predecessor Company year ended December 31, 2017 and the Predecessor Company year ended December 31, 2016, amounts reflected under trade transactions were: (1) trade revenues of
$26.5 million
,
$19.0 million
,
$40.1 million
and
$37.7 million
, respectively; and (2) trade expenses of
$27.1 million
,
$18.0 million
,
$38.6 million
and
$36.2 million
, respectively.
Income Taxes
The Company uses the liability method of accounting for deferred income taxes. Except for goodwill, deferred income taxes are recognized for all temporary differences between the tax and financial reporting bases of our assets and liabilities based on enacted tax laws and statutory tax rates applicable to the periods in which the differences are expected to affect taxable income. The Tax Cuts and Jobs Act (“the Act”) was enacted on December 22, 2017. The Act, among other changes, reduced the US federal corporate tax rate from
35%
to
21%
effective January 1, 2018. During the fourth quarter of 2018, the Company completed its accounting for the tax effects of enactment of the Act and recorded an adjustment to deferred tax benefit of approximately
$0.9 million
during 2018 related to the remeasurement of deferred tax assets and liabilities. See Note 13, “Income Taxes” for further discussion. A valuation allowance is recorded against a deferred tax asset to measure its net realizable value when it is not more likely than not that the benefits of its recovery will be recognized. The Company continually reviews the adequacy of our valuation allowance, if any, on our deferred tax assets and recognizes the benefits of deferred tax assets only as the reassessment indicates that it is more likely than not that the deferred tax assets will be recognized in accordance with ASC Topic 740,
Income Taxes
("ASC 740"). See Note 13, “Income Taxes” for further discussion.
Earnings Per Share
Basic income (loss) per share is computed on the basis of the weighted average number of common shares outstanding. The Company allocates undistributed net income (loss) from continuing operations between each class of common stock on an equal basis after any allocations for preferred stock dividends in accordance with the terms of the Company’s third amended and restated certificate of incorporation, as amended (the “amended and restated certificate of incorporation (the "Charter”)).
Non-vested restricted shares of Class A common stock and Company Warrants (defined below) are considered participating securities for purposes of calculating basic weighted average common shares outstanding in periods in which the Company recorded net income. Diluted earnings per share is computed in the same manner as basic earnings per share after assuming the issuance of common stock for all potentially dilutive equivalent shares, which includes stock options and certain other outstanding warrants to purchase common stock. Antidilutive instruments are not considered in this calculation. Under the
two
-class method, net income is allocated to common stock and participating securities to the extent that each security may share in earnings, as if all of the earnings for the period had been distributed. Earnings are allocated to each participating security and common share equally, after deducting dividends declared or accreted on preferred stock.
Fair Values of Financial Instruments
The carrying values of cash equivalents, restricted cash, accounts receivables, accounts payable, trade payables and receivables and accrued expenses approximate fair value because of the short term to maturity of these instruments (See Note 10, "Fair Value Measurements").
F-13
Accounting for National Advertising Agency Contract
The Company has engaged Katz Media Group, Inc. (“Katz”) as its national advertising sales agent. The Company’s contract with Katz has several economic elements that principally reduce the overall expected commission rate below the stated base rate. The Company estimates the overall expected commission rate over the entire contract period and applies that rate to commissionable revenue throughout the contract period with the goal of estimating and recording a stable commission rate over the life of the contract.
The potential commission adjustments are estimated and combined in the Consolidated Balance Sheets with the contractual termination liability. That liability is accreted to commission expense to effectuate the stable commission rate over the term of the contract. Over the term of the contract with Katz, management updates its assessment of the effective commission expense attributable to national sales in an effort to record a consistent commission rate in each period.
The Company’s accounting for and calculation of commission expense to be realized over the life of the Katz contract requires management to make estimates and judgments that affect reported amounts of commission expense in each period. Actual results may differ from management’s estimates.
Variable Interest Entities
The Company accounted for entities qualifying as variable interest entities (“VIEs”) in accordance with ASC Topic 810,
Consolidation
(“ASC 810”). VIEs are required to be consolidated by the primary beneficiary. The primary beneficiary is the entity that holds the majority of the beneficial interests in the VIE. A VIE is an entity for which the primary beneficiary’s interest in the entity can change with changes in factors other than the amount of investment in the entity. From time to time, the Company enters into an LMA in connection with pending acquisitions or dispositions of radio stations and the requirements of ASC 810 may apply, depending on the facts and circumstances related to each transaction.
Supplemental Cash Flow Information
The following summarizes supplemental cash flow information to be read in conjunction with the Consolidated Statements of Cash Flows for the Successor Company period from June 4, 2018 through December 31, 2018, the Predecessor Company period from January 1, 2018 through June 3, 2018, the Predecessor Company year ended December 31, 2017 and the Predecessor Company year ended December 31, 2016:
F-14
|
Successor Company
|
Predecessor Company
|
||||||||||||||
|
|
Period from June 4, 2018 through December 31,
|
Period from January 1, 2018 through June 3,
|
Year Ended December 31,
|
Year Ended December 31,
|
|||||||||||
|
|
2018
|
2018
|
2017
|
2016
|
|||||||||||
|
Supplemental disclosures of cash flow information:
|
|||||||||||||||
|
Interest paid
|
$
|
49,785
|
|
$
|
—
|
|
$
|
96,225
|
|
$
|
126,515
|
|
|||
|
Income taxes paid
|
7,266
|
|
1,992
|
|
3,781
|
|
4,451
|
|
|||||||
|
Supplemental disclosures of non-cash flow information:
|
|||||||||||||||
|
Trade revenue
|
$
|
26,516
|
|
$
|
18,973
|
|
$
|
40,080
|
|
$
|
37,691
|
|
|||
|
Trade expense
|
27,098
|
|
17,964
|
|
38,633
|
|
36,158
|
|
|||||||
|
Transfer of deposit from escrow - WKQX acquisition
|
4,750
|
|
—
|
|
—
|
|
—
|
|
|||||||
|
Transfer of deposit from escrow - Los Angeles land and building sale
|
—
|
|
—
|
|
—
|
|
6,000
|
|
|||||||
|
Transfer of property and equipment from assets held for sale
|
—
|
|
—
|
|
30,150
|
|
—
|
|
|||||||
|
Supplemental disclosures of non-cash reorganization items impact on changes in assets and liabilities:
|
|||||||||||||||
|
Accounts receivable
|
$
|
—
|
|
$
|
(11
|
)
|
$
|
—
|
|
$
|
—
|
|
|||
|
Prepaid expenses and other current assets
|
—
|
|
21,077
|
|
—
|
|
—
|
|
|||||||
|
Property and equipment
|
—
|
|
(121,732
|
)
|
—
|
|
—
|
|
|||||||
|
Other intangible assets, goodwill and other assets
|
—
|
|
283,217
|
|
—
|
|
—
|
|
|||||||
|
Accounts payable, accrued expenses and other liabilities
|
—
|
|
(36,415
|
)
|
—
|
|
—
|
|
|||||||
|
Cancellation of 7.75% Senior Notes
|
—
|
|
(610,000
|
)
|
—
|
|
—
|
|
|||||||
|
Cancellation of Predecessor Company Term Loan
|
—
|
|
(1,684,407
|
)
|
—
|
|
—
|
|
|||||||
|
Issuance of Successor Company Term Loan
|
—
|
|
1,300,000
|
|
—
|
|
—
|
|
|||||||
|
Cancellation of Predecessor Company stockholders' equity
|
—
|
|
649,620
|
|
—
|
|
—
|
|
|||||||
|
Issuance of Successor Company stockholders' equity
|
—
|
|
(325,000
|
)
|
—
|
|
—
|
|
|||||||
|
Reconciliation of cash and cash equivalents and restricted cash to the Consolidated Balance Sheet:
|
|||||||||||||||
|
Cash and cash equivalents
|
$
|
27,584
|
|
$
|
50,046
|
|
$
|
102,891
|
|
$
|
131,259
|
|
|||
|
Restricted cash
|
2,454
|
|
38,305
|
|
8,999
|
|
8,025
|
|
|||||||
|
Total cash and cash equivalents and restricted cash
|
$
|
30,038
|
|
$
|
88,351
|
|
$
|
111,890
|
|
$
|
139,284
|
|
|||
Adoption of New Accounting Standards
ASU 2014-09 and related updates - Revenue from Contracts with Customers
(“ASU 2014-09”) or (“ASC 606”). On January 1, 2018, the Company adopted ASC 606, which is a comprehensive new revenue recognition model that requires revenue to be recognized in a manner to depict the transfer of goods or services and satisfaction of performance obligations to a customer at an amount that reflects the consideration expected to be received in exchange for those goods or services. The Company applied the modified retrospective method to contracts that were not completed as of January 1, 2018. Results for reporting periods beginning after January 1, 2018, are presented under ASC 606, while prior period amounts have not been adjusted and continue to be reported under the previous accounting standards. There was not a material impact to revenues as a result of the recognition of revenue in accordance with ASC 606 for the year ended December 31, 2018, and there have not been significant changes to the Company's business processes, systems, or internal controls as a result of implementing the standard. As of December 31, 2018, the Company recorded an asset of approximately
$6.5 million
related to the unamortized portion of commission expense on new local direct revenue. See Note 4, “Revenues” for further details.
ASU 2016-01 - Recognition and Measurement of Financial Assets and Financial Liabilities
(“ASU 2016-01”). In January 2016, the FASB issued ASU 2016-01 which enhances the reporting model for financial instruments including aspects of recognition, measurement, presentation and disclosure. This ASU revises the accounting requirements related to the classification and measurement of investments in equity securities and the presentation of certain fair value changes for
F-15
financial liabilities measured at fair value. This ASU also changes certain disclosure requirements associated with the fair value of financial instruments. These changes require an entity to measure, at fair value, investments in equity securities and other ownership interests in an entity - including investments in partnerships, unincorporated joint ventures and limited liability companies that do not result in consolidation and are not accounted for under the equity method - and recognize the changes in fair value within net income. ASU 2016-01 is effective for fiscal years beginning after December 15, 2017, and interim periods thereafter. In February 2018, the FASB issued ASU 2018-03 - Recognition and Measurement of Financial Assets and Financial Liabilities (“ASU 2018-03”) which provides an option for a company to “un-elect” the measurement alternative and elect to account for the changes in the fair value of investments through current earnings for certain equity investments that do not have readily determinable fair values as well. However, once a company makes this election for a particular investment, it must apply the fair value through current earnings model to all identical investments and/or similar investments from the same issuer. Further, a company cannot elect the measurement alternative for future purchases of identical or similar investments of the same issuer. However, the Company had no financial assets and/or liabilities that fell within the requirements of this update during the 2018 fiscal year, therefore there was no impact to the Consolidated Financial Statements. The Company will adopt ASU 2018-03 on a prospective basis and un-elect the measurement alternative if applicable.
ASU 2016-15 - Classification of Certain Cash Receipts and Cash Payments
(“ASU 2016-15”). In August 2016, the FASB issued ASU 2016-15 which provides guidance for several new and/or revised disclosures pertaining to the classification of certain cash receipts and cash payments on the statement of cash flows, including contingent consideration payments made after a business acquisition. ASU 2016-15 is effective for fiscal years beginning after December 15, 2017, and interim periods thereafter. The Company adopted ASU 2016-15 as of January 1, 2018 and there was no impact to the Consolidated Financial Statements.
ASU 2016-18 - Restricted Cash
(“ASU 2016-18”). In November 2016, the FASB issued ASU 2016-18 which provides guidance for the accounting for the disclosure of restricted cash on the statement of cash flows. ASU 2016-18 is effective for fiscal years beginning after December 15, 2017, and interim periods thereafter. The Company adopted ASU 2016-18 as of January 1, 2018. Upon adoption of ASU 2016-18 on January 1, 2018, the Company included restricted cash balances along with cash and cash equivalents as of the end of the period and beginning of the period, respectively, in its Consolidated Cash Flows for all periods presented. Additionally, separate line items showing changes in restricted cash balances have been eliminated from the Consolidated Statement of Cash Flows. The Predecessor Company held
$9 million
and
$8 million
in restricted cash as of December 31, 2017 and December 31, 2016, respectively.
ASU 2017-01 - Clarifying the Definition of a Business
(“ASU 2017-01”). In January 2017, the FASB issued guidance that clarifies the definition of a business with the objective of adding guidance to assist entities with evaluating whether transactions should be accounted for as acquisitions or disposals of assets or businesses. The definition of a business affects many areas of accounting including acquisitions, disposals, goodwill, and consolidation. The new standard is effective for fiscal years, and interim periods within fiscal years, beginning after December 15, 2017. The Company adopted ASU 2017-01 as of January 1, 2018 on a prospective basis and there was no material impact to the Consolidated Financial Statements.
ASU 2017-09 - Scope of Modification Accounting
(“ASU 2017-09”). In May 2017, the FASB issued an update to guidance on Topic 718, Compensation—Stock Compensation that clarifies when changes to the terms or conditions of a share-based award must be accounted for as a modification. Under the new guidance, modification accounting is required only if the fair value, the vesting conditions, or the classification of the award, as equity or liability, changes as a result of the change in terms or conditions. ASU 2017- 09 is effective for annual periods, and interim periods within annual periods, beginning after December 15, 2017. The Company adopted ASU 2017-09 as of January 1, 2018 on a prospective basis and there was no material impact to the Consolidated Financial Statements.
ASU 2018-02 - Reporting Comprehensive Income: Reclassification of Certain Tax Effects from Accumulated Other
Comprehensive Income
(“ASU 2018-02”). In February 2018, the FASB issued ASU 2018-02 which provides the option to reclassify stranded tax effects related to the U.S. Tax Cuts and Jobs Act of 2017 (“Tax Act”) in accumulated other comprehensive income to retained earnings. The adjustment relates to the change in the U.S. corporate income tax rate. The adoption of this ASU did not impact the Company's Consolidated Financial Statements.
Recent Accounting Standards Updates
ASU 2016-13 - Financial Instruments - Credit Losses (Topic 326)
(“ASU 2016-13”). In June 2016, the FASB issued ASU 2016-13 which requires entities to estimate loss of financial assets measured at amortized cost, including trade receivables, debt securities and loans, using an expected credit loss model. The expected credit loss differs from the previous incurred losses model primarily in that the loss recognition threshold of “probable” has been eliminated and that expected loss
F-16
should consider reasonable and supportable forecasts in addition to the previously considered past events and current conditions. Additionally, the guidance requires additional disclosures related to the further disaggregation of information related to the credit quality of financial assets by year of the asset’s origination for as many as
five
years. Entities must apply the standard provision as a cumulative-effect adjustment to retained earnings as of the beginning of the first reporting period in which the guidance is effective. The standard is effective for fiscal years beginning after December 15, 2019, and interim periods within those fiscal years. Early adoption is permitted for annual periods beginning after December 15, 2018, and interim periods within those fiscal years. The Company is currently evaluating the impact of adopting ASU 2016-13 on its Consolidated Financial Statements.
ASU 2016-02 - Leases
(“ASU 2016-02”). In February 2016, the Financial Accounting Standards Board (“FASB”) issued ASU 2016-02, which provides updated guidance for the accounting for leases. This update requires lessees to recognize assets and liabilities for the rights and obligations created by leases with a term longer than one year. Leases will be classified as either financing or operating, thereby impacting the pattern of expense recognition in the statement of operations. In July 2018, the FASB issued ASU 2018-10 - Codification Improvements to Topic 842, Leases (“ASU 2018-10”) and ASU 2018-11 - Targeted Improvements (“ASU 2018-11”), which provides technical corrections and clarification to ASU 2016-02. ASU 2016-02 and amendments ASU 2018-10 and ASU 2018-11 will be effective for fiscal years beginning after December 15, 2018, and interim periods thereafter. Early adoption is permitted. The standard permits two approaches, one requiring retrospective application of the new guidance with restatement of prior years, and one requiring prospective application of the new guidance. The Company anticipates adopting this standard on January 1, 2019 using a modified retrospective approach and electing the practical expedients allowed under the standard. The Company is in the process of aggregating and evaluating lease arrangements, implementing new controls and processes, and implementing a lease accounting system. Based on a preliminary assessment, the Company expects most of its operating lease commitments will be subject to the new guidance and recognized as operating lease liabilities and right-of-use assets upon adoption. The impact to the Company’s balance sheet is estimated to result in a
7%
to
11%
and
9%
to
13%
increase in assets and liabilities respectively. The impact on the Company's results of operations and cash flows is not expected to be material.
ASU 2018-07 - Compensation - Stock Compensation (Topic 718): Improvements to Non-employee Share-Based Payment Accounting
(“ASU 2018-07”). The standard aligns the accounting for share-based payment awards issued to employees and non- employees. Changes to the accounting for non-employee awards include: (1) equity-classified share-based payment awards issued to non-employees will now be measured on the grant date, instead of the previous requirement to re-measure the awards through the performance completion date; (2) for performance conditions, compensation cost associated with the award will be recognized when achievement of the performance condition is probable, rather than upon achievement of the performance condition; and (3) the current requirement to reassess the classification (equity or liability) for nonemployee awards upon vesting will be eliminated, except for awards in the form of convertible instruments. The guidance should be applied to all new awards granted after the date of adoption. In addition, the modified retrospective approach should be used on all liability-classified awards that have not been settled and equity- classified awards for which a measurement date has not been established by the adoption date by re-measurement at fair value as of the adoption date with a cumulative effect adjustment to opening retained earnings in the fiscal year of adoption. The standard is effective for fiscal years beginning after December 15, 2018, and interim periods within those fiscal years. Early adoption is permitted, but no earlier than an entity’s adoption of ASC 606. The Company is currently evaluating the impact of adopting ASU 2018-07 on its Consolidated Financial Statements.
ASU 2018-13 - Fair Value Measurement (Topic 820): Disclosure Framework
- Changes to the Disclosure Requirements for Fair Value Measurement (“ASU 2018-13”). In August 2018, the FASB issued ASU 2018-13, which eliminates, adds and modifies certain disclosure requirements for fair value measurements. The update eliminates the following disclosure requirements for all entities: the amount of and reasons for transfers between Level 1 and Level 2 of the fair value hierarchy, the entity’s policy for the timing of transfers between levels of the fair value hierarchy, and the entity’s valuation processes for Level 3 fair value measurements. ASU 2018-13 adds the following disclosure requirements: the changes in unrealized gains and losses for the period included in other comprehensive income for recurring Level 3 fair value measurements of instruments held at the end of the reporting period and for recurring and nonrecurring Level 3 fair value measurements, the range and weighted average used to develop significant unobservable inputs and how the weighted average was calculated. ASU 2018-13 will be effective for fiscal years beginning after December 15, 2019, and interim periods thereafter. Early adoption is permitted for any removed or modified disclosures. The Company is currently evaluating the impact of adopting ASU 2016-13 on its Consolidated Financial Statements.
F-17
2. Emergence from Chapter 11
On May 10, 2018, the Bankruptcy Court entered the Confirmation Order confirming the Plan. On the Effective Date, June 4, 2018, the Plan became effective and the Debtors emerged from Chapter 11.
Plan of Reorganization
A plan of reorganization determines the rights and satisfaction of claims of various creditors and security holders, but the ultimate settlement of certain claims is subject to the uncertain outcome of various litigation, negotiations and bankruptcy court decisions for a period of time after a plan of reorganization is confirmed.
Cancellation of Certain Prepetition Obligations
In connection with the effectiveness of and pursuant to the terms of the Plan, on the Effective Date, the obligations of Old Cumulus and its subsidiaries under the following agreements were satisfied and discharged:
|
•
|
Amended and Restated Credit Agreement, dated as of December 23, 2013, by and among Cumulus Media Inc., Cumulus Media Holdings Inc., as borrower, certain lenders, JPMorgan Chase Bank, N.A., as lender and Administrative Agent, Royal Bank of Canada and Macquarie Capital (USA) Inc., as co-syndication agents, and Credit Suisse AG, Cayman Islands Branch, Fifth Third Bank, Goldman Sachs Bank USA and ING Capital LLC, as co-documentation agents (“the Canceled Credit Agreement”), pursuant to which Old Cumulus had outstanding term loans in the amount of
$1.7 billion
(the “Predecessor Term Loan”);
|
|
•
|
Indenture, dated as of May 13, 2011, among Cumulus Media Inc., the Guarantors named therein and U.S. Bank National Association, as Trustee, as supplemented, and pursuant to which Old Cumulus had outstanding senior notes with a face value of
$610.0 million
(“
7.75%
Senior Notes”); and
|
|
•
|
Rights Agreement, dated as of June 5, 2017, between Cumulus Media Inc. and Computershare Trust Company, N.A., as Rights Agent (the “Rights Agreement”).
|
Additional Matters Contemplated by the Plan
|
•
|
In accordance with the Plan, on the Effective Date each share of Old Cumulus’s Class A common stock, par value
$0.01
per share (the “old Class A common stock”), Class B common stock, par value
$0.01
per share (the “old Class B common stock”), and Class C common stock, par value
$0.01
per share (the "old Class C common stock" and together with the old Class A common stock and the old Class B common stock, the “old common stock”) outstanding immediately prior to the Effective Date, including all stock options, warrants or other rights, including rights issued under the Rights Agreement, to purchase such old common stock, were extinguished, canceled and discharged, and each such share, option or warrant has no further force or effect. Furthermore, all of Old Cumulus’s equity award agreements under prior incentive plans, and the awards granted pursuant thereto, were extinguished, canceled and discharged and have no further force or effect;
|
|
•
|
On the Effective Date, the Company’s certificate of incorporation was amended and restated to authorize the issuance of up to
100,000,000
shares of Class A common stock, par value
$0.0000001
per share (“new Class A common stock”),
100,000,000
shares of Class B common stock, par value
$0.0000001
per share (“new Class B common stock” and, together with the new Class A common stock, the “new common stock”) and
100,000,000
shares of preferred stock (see Note 11, “Stockholders’ Equity”);
|
|
•
|
On the Effective Date, the Company issued
11,052,211
shares of new Class A common stock and
5,218,209
shares of new Class B common stock;
|
|
•
|
On the Effective Date, the Company issued
3,016,853
Series 1 warrants to purchase shares of new common stock;
|
|
•
|
After the Effective Date, the Company also issued or will issue
712,736
Series 2 warrants (the “Series 2 warrants” and, together with the Series 1 warrants, the “Warrants”) to purchase shares of new common stock;
|
|
•
|
The Company entered into a
$1.3 billion
credit agreement (the “Credit Agreement” or “Term Loan”) with Wilmington Trust, N.A., as administrative agent (the “Agent”) and the lenders named therein (see Note 9, “Long-Term Debt”);
|
|
•
|
The holders of claims with respect to the Predecessor Term Loan received the following in full and complete satisfaction of their respective claims thereunder: (i) a pro rata share of the Term Loan and (ii) a pro rata share of
83.5%
of the new common stock and warrants issued, subject to dilution by certain issuances under the Long-Term Incentive Plan (the “Incentive Plan”) (see Note 11, “Stockholders’ Equity”);
|
|
•
|
The holders of unsecured claims against Old Cumulus including claims arising from the
7.75%
Senior Notes received, in the aggregate,
16.5%
of the new common stock and warrants issued, subject to dilution by certain issuances under the Incentive Plan;
|
F-18
|
•
|
The Company’s board of directors was reconstituted to consist of the Company’s President and Chief Executive Officer and
six
independent directors selected by the holders of the Predecessor Term Loan; and
|
|
•
|
Intercompany Claims and Interests (as defined in the Plan) were canceled without any distribution on account of such Intercompany Claims and Interests.
|
The foregoing description of certain matters effected pursuant to the Plan and the transactions related to and contemplated thereunder, is not intended to be a complete description of, or a substitute for, a full and complete reading of the Plan.
F-19
3. Fresh Start Accounting
Upon filing for bankruptcy and up through and including the emergence from Chapter 11 on the Effective Date, the Company qualified for fresh start accounting under ASC 852 because (i) the holders of voting shares of the Predecessor Company received less than
50%
of the voting shares of the Successor Company and (ii) the reorganization value of the Company’s assets immediately prior to confirmation of the Plan was less than the post-petition liabilities and allowed claims. ASC 852 requires that fresh start accounting be applied when the Bankruptcy Court enters a confirmation order confirming a plan of reorganization, or as of a later date when all material conditions precedent to the effectiveness of a plan of reorganization are resolved, which for CUMULUS MEDIA was the Effective Date.
Upon the application of fresh start accounting, CUMULUS MEDIA allocated the reorganization value to its individual assets based on their estimated fair values in conformity with ASC 805, Business Combinations (“ASC 805”). Reorganization value represents the fair value of the Successor Company’s assets before considering liabilities. Liabilities existing as of the Effective Date, other than deferred taxes, were recorded at the present value of amounts expected to be paid using appropriate risk adjusted discount rates. Deferred taxes were determined in conformity with applicable accounting standards. Predecessor Company accumulated depreciation, accumulated amortization, and accumulated deficit were eliminated. As a result of the application of fresh start accounting and the effects of the implementation of the Plan, the Company’s consolidated financial statements after June 3, 2018 are not comparable to the Company’s consolidated financial statements as of or prior to that date.
Reorganization Value
As set forth in the Plan, the enterprise value of the Successor Company was estimated to be between
$1.5 billion
and
$1.7 billion
. Based on the estimates and assumptions discussed below, CUMULUS MEDIA estimated the enterprise value to be
$1.675 billion
, which was confirmed by the Bankruptcy Court.
Management estimated the enterprise value of the Successor Company utilizing the guideline public company method and discounted cash flow method (“DCF”). The use of each approach provides corroboration for the other approach. To estimate enterprise value utilizing the guideline public company method, management applied valuation multiples, derived from the operating data of publicly-traded benchmark companies, to the same operating data of CUMULUS MEDIA. The guideline public company analysis identified a group of comparable companies giving consideration to lines of business and markets served, size and geography. The valuation multiples were derived based on projected financial measures of revenue and earnings before interest, taxes, depreciation and amortization and applied to projected operating data of CUMULUS MEDIA.
To estimate enterprise value utilizing the discounted cash flow method, management established an estimate of future cash flows for the period 2018 to 2024 with a terminal value and discounted the estimated future cash flows to present value. The expected cash flows for the period 2018 to 2024 with a terminal value were based upon certain financial projections and assumptions provided to the Bankruptcy Court. The expected cash flows for the period 2018 to 2024 were derived from
earnings forecasts and assumptions regarding revenue growth and margin projections, as applicable. A terminal value was included, calculated using the constant growth method, based on the cash flows of the final year of the forecast period.
The Company’s enterprise value represents the fair value of its interest-bearing debt and equity capital, while the reorganization value is derived from the enterprise value by adding back non-interest-bearing liabilities. The following table reconciles the enterprise value to the estimated reorganization value as of the Effective Date (dollars in thousands):
|
Enterprise Value
|
$
|
1,675,000
|
|
|
Less: Cash balance difference (1)
|
(20,000
|
)
|
|
|
Less: Effect of deferred tax liability (2)
|
(30,000
|
)
|
|
|
Plus: Fair value of non-debt current liabilities
|
114,573
|
|
|
|
Plus: Fair value of non-debt long term liabilities
|
63,921
|
|
|
|
Reorganization value
|
$
|
1,803,494
|
|
(1) Difference in the estimated cash balance in the reorganization value versus the actual cash on hand as of June 3, 2018.
(2) Difference in the assumed effect of deferred taxes in the reorganization value versus the actual deferred taxes as of June 3, 2018.
F-20
Condensed Consolidated Balance Sheet
The adjustments set forth in the following Condensed Consolidated Balance Sheet reflect the consummation of the
transactions contemplated by the Plan (reflected in the column “Reorganization Adjustments”) as well as fair value adjustments as a result of the adoption of fresh start accounting (reflected in the column “Fresh Start Adjustments”). The explanatory notes highlight methods used to determine fair values or other amounts of the assets and liabilities as well as significant assumptions or inputs (dollars in thousands).
|
Predecessor Company As of June 3, 2018
|
Reorganization Adjustments
|
Fresh Start Adjustments
|
Successor Company As of June 4, 2018
|
||||||||||||
|
Assets
|
|||||||||||||||
|
Current assets:
|
|||||||||||||||
|
Cash and cash equivalents
|
$
|
108,480
|
|
$
|
(58,434
|
)
|
(1)
|
$
|
—
|
|
$
|
50,046
|
|
||
|
Restricted cash
|
13,720
|
|
24,585
|
|
(2)
|
—
|
|
38,305
|
|
||||||
|
Accounts receivable
|
215,724
|
|
—
|
|
—
|
|
215,724
|
|
|||||||
|
Trade receivable
|
5,221
|
|
—
|
|
—
|
|
5,221
|
|
|||||||
|
Prepaid expenses and other current assets
|
49,912
|
|
(19,990
|
)
|
(3)
|
—
|
|
29,922
|
|
||||||
|
Total current assets
|
393,057
|
|
(53,839
|
)
|
—
|
|
339,218
|
|
|||||||
|
Property and equipment, net
|
193,574
|
|
—
|
|
121,732
|
|
(12)
|
315,306
|
|
||||||
|
Broadcast licenses
|
1,203,809
|
|
—
|
|
(285,309
|
)
|
(13)
|
918,500
|
|
||||||
|
Other intangible assets, net
|
75,056
|
|
—
|
|
137,402
|
|
(13)
|
212,458
|
|
||||||
|
Goodwill
|
135,214
|
|
—
|
|
(135,214
|
)
|
(14)
|
—
|
|
||||||
|
Other assets
|
18,012
|
|
—
|
|
—
|
|
18,012
|
|
|||||||
|
Total assets
|
$
|
2,018,722
|
|
$
|
(53,839
|
)
|
$
|
(161,389
|
)
|
$
|
1,803,494
|
|
|||
|
Liabilities and Stockholders’ Equity (Deficit)
|
|||||||||||||||
|
Current liabilities:
|
|||||||||||||||
|
Accounts payable and accrued expenses
|
$
|
108,448
|
|
$
|
6,253
|
|
(4)
|
$
|
(128
|
)
|
(15)
|
$
|
114,573
|
|
|
|
Current portion of Term Loan
|
—
|
|
13,000
|
|
(5)
|
—
|
|
13,000
|
|
||||||
|
Total current liabilities
|
108,448
|
|
19,253
|
|
(128
|
)
|
127,573
|
|
|||||||
|
Term loan
|
—
|
|
1,268,983
|
|
(5)
|
18,017
|
|
(16)
|
1,287,000
|
|
|||||
|
Other liabilities
|
2,801
|
|
21,312
|
|
(6)
|
13
|
|
(17)
|
24,126
|
|
|||||
|
Deferred income taxes
|
—
|
|
50,437
|
|
(7)
|
(10,642
|
)
|
(18)
|
39,795
|
|
|||||
|
Total non-current liabilities
|
2,801
|
|
1,340,732
|
|
7,388
|
|
1,350,921
|
|
|||||||
|
Liabilities subject to compromise
|
2,647,110
|
|
(2,647,110
|
)
|
(8)
|
—
|
|
—
|
|
||||||
|
Total liabilities
|
2,758,359
|
|
(1,287,125
|
)
|
7,260
|
|
1,478,494
|
|
|||||||
|
Stockholders’ (deficit) equity:
|
|||||||||||||||
|
Predecessor Class A common stock
|
320
|
|
(320
|
)
|
(9)
|
—
|
|
—
|
|
||||||
|
Predecessor Class C common stock
|
1
|
|
(1
|
)
|
(9)
|
—
|
|
—
|
|
||||||
|
Predecessor treasury stock
|
(229,310
|
)
|
229,310
|
|
(9)
|
—
|
|
—
|
|
||||||
|
Predecessor additional paid-in-capital
|
1,626,906
|
|
(1,626,906
|
)
|
(9)
|
—
|
|
—
|
|
||||||
|
Successor Class A common stock
|
—
|
|
—
|
|
—
|
|
—
|
|
|||||||
|
Successor Class B common stock
|
—
|
|
—
|
|
—
|
|
—
|
|
|||||||
|
Successor additional-paid-in-capital
|
—
|
|
325,000
|
|
(10)
|
—
|
|
325,000
|
|
||||||
|
(Accumulated deficit) retained earnings
|
(2,137,554
|
)
|
2,306,203
|
|
(11)
|
(168,649
|
)
|
(19)
|
—
|
|
|||||
|
Total stockholders’ (deficit) equity
|
(739,637
|
)
|
1,233,286
|
|
(168,649
|
)
|
325,000
|
|
|||||||
|
Total liabilities and stockholders’ (deficit)
|
$
|
2,018,722
|
|
$
|
(53,839
|
)
|
$
|
(161,389
|
)
|
$
|
1,803,494
|
|
|||
F-21
Reorganization adjustments
1.
Reflects cash payments and the funding of professional fee escrow account from the implementation of the Plan as follows (dollars in thousands):
|
Payment of professional fees
|
$
|
3,118
|
|
||
|
Adequate protection payment
|
1,326
|
||||
|
Payment of contract cure claims
|
20,341
|
||||
|
Funding of professional fee escrow amount
|
32,517
|
||||
|
Other fees and expenses
|
1,132
|
||||
|
Net cash payments
|
$
|
58,434
|
|
||
|
2.
|
Reflects net additions to restricted cash giving effect to the funding of professional fee escrow account for professional fees accrued and the payment of restructuring fees (dollars in thousands):
|
|
Funding of professional fee escrow account
|
$
|
32,517
|
|
|||
|
Payment of restructuring fees
|
(7,932
|
)
|
||||
|
Net changes to restricted cash
|
$
|
24,585
|
||||
3.
Reflects the reclassification of
$17.8 million
debt issuance costs from prepaid expense to offset the Term Loan as well as the write-off of
$2.2 million
of certain assets which do not benefit the Successor Company.
4.
Represents the reinstatement of certain accounts payable and accrued expenses that were previously classified as Liabilities subject to compromise as well as accrued state income taxes.
5.
Represents the current and non-current portion, net of debt issuance costs of
$18.0 million
, of the Term Loan.
6.
Represents the reinstatement of tax liabilities, lease liabilities and long-term deposits from Liabilities subject to compromise.
7.
Represents the partial reinstatement of the deferred tax liability of
$50.4 million
of the original
$237.2 million
that was included in Liabilities subject to compromise.
8.
Liabilities subject to compromise immediately prior to the Effective Date consisted of the following (dollars in thousands):
|
Accounts payable and accrued expenses
|
$
|
66,515
|
|
|||
|
Other liabilities
|
21,364
|
|||||
|
Deferred tax liability
|
237,247
|
|||||
|
Accounts payable, accrued expenses and other liabilities
|
325,126
|
|||||
|
Predecessor
Term Loan
|
1,684,407
|
|||||
|
7.75% Senior Notes
|
610,000
|
|||||
|
Accrued interest
|
27,577
|
|||||
|
Long-term debt and accrued interest
|
2,321,984
|
|||||
|
Total Liabilities subject to compromise
|
$
|
2,647,110
|
|
|||
F-22
Liabilities subject to compromise have been, or will be settled as follows in accordance with the Plan (dollars in thousands):
|
Liabilities subject to compromise
|
$
|
2,647,110
|
|
||||||
|
Cash payments at the Effective Date
|
(33,657
|
)
|
|||||||
|
Liabilities reinstated at the Effective Date:
|
|||||||||
|
Accounts payable
|
(3,215
|
)
|
|||||||
|
Other liabilities
|
(21,160
|
)
|
|||||||
|
Deferred tax liability
|
(50,437
|
)
|
|||||||
|
Total liabilities reinstated at the Effective Date
|
(74,812
|
)
|
|||||||
|
Adjustment for deferred tax liability impact
|
(186,810
|
)
|
|||||||
|
Fair value of common stock issued to Predecessor Term Loan holders,
7.75% Senior Notes holders and unsecured creditors
|
(264,394
|
)
|
|||||||
|
Fair value of warrants issued to Predecessor Term Loan
holders, 7.75% Senior Notes holders and unsecured creditors
|
(60,606
|
)
|
|||||||
|
Fair value of Term Loan provided by Predecessor Term Loan holders
|
(1,300,000
|
)
|
|||||||
|
Gain on settlement of Liabilities subject to compromise
|
$
|
726,831
|
|
||||||
Refer to Note 11, “Stockholders’ Equity” for the determination of fair value of equity issued to unsecured creditors.
|
9.
|
Pursuant to the Plan, all equity interests of the Predecessor that were issuable or issued and outstanding immediately prior to the Effective Date were canceled. The elimination of the carrying value of the canceled equity interests was recorded as an offset to retained earnings (accumulated deficit).
|
|
10.
|
In settlement of the Predecessor Term Loan,
7.75%
Senior Notes, and other general unsecured claims, the Company issued new common stock and Successor warrants.
|
|
11.
|
Adjustment made to accumulated deficit consisted of the following (dollars in thousands):
|
|
Cancellation of Predecessor equity
|
$
|
1,397,917
|
|
|||
|
Gain on settlement of Liabilities subject to compromise
|
726,831
|
|||||
|
Income tax benefit
|
184,005
|
|||||
|
Other items
|
(2,550
|
)
|
||||
|
Total adjustment to retained earnings
|
$
|
2,306,203
|
|
|||
Fresh Start adjustments
12.
Reflects the increase in net book value of property and equipment to the estimated fair value as of the Effective Date. The following table summarizes the components of property and equipment, net as of June 4, 2018, and the fair value as of the Effective Date (dollars in thousands):
|
Estimated Useful Life
|
Successor Company
|
Predecessor Company
|
||||||||||
|
Land
|
N/A
|
$
|
159,464
|
|
$
|
86,287
|
|
|||||
|
Broadcasting and other equipment
|
3 to 30 years
|
58,369
|
248,607
|
|||||||||
|
Computer and capitalized software costs
|
1 to 3 years
|
11,791
|
34,924
|
|||||||||
|
Furniture and fixtures
|
5 years
|
4,432
|
15,571
|
|||||||||
|
Leasehold improvements
|
5 years
|
24,089
|
46,471
|
|||||||||
|
Buildings
|
9 to 20 years
|
26,964
|
51,994
|
|||||||||
|
Construction in progress
|
N/A
|
30,197
|
30,197
|
|||||||||
|
315,306
|
514,051
|
|||||||||||
|
Less: accumulated depreciation
|
—
|
(320,477
|
)
|
|||||||||
|
Property and equipment, net
|
$
|
315,306
|
|
$
|
193,574
|
|
||||||
F-23
To estimate the fair value of personal property such as broadcasting and other equipment, the Company utilized a combination of the cost approach and market approach. The Company recognized the contributory value associated with the necessary installation, engineering, and set-up costs related to the installed component of equipment by using the cost approach. The market approach was used for assets where a viable, transparent secondary market existed, such as motor vehicle assets.
To estimate the fair value of real property, the Company considered the cost approach and sales comparison approach. Buildings were primarily valued using the cost approach, under which the Company developed a replacement cost new for the improvements and applied deductions for physical depreciation based on the age of the assets. Land was valued under the sales comparison approach, whereby the Company researched transactions involving comparable parcels to provide an indication of the fair value of the various subject parcels.
13.
The Company recorded an adjustment to intangible assets of
$147.9 million
as follows (dollars in thousands):
|
Successor Company
|
Predecessor Company
|
Difference
|
|||||||||||||||
|
Broadcast licenses
|
$
|
918,500
|
|
$
|
1,203,809
|
|
$
|
(285,309
|
)
|
||||||||
|
Other intangible assets
|
212,458
|
75,056
|
137,402
|
||||||||||||||
|
$
|
1,130,958
|
|
$
|
1,278,865
|
|
$
|
(147,907
|
)
|
|||||||||
The fair values of broadcasting licenses and other intangible assets were determined as follows:
|
a.
|
Broadcast licenses (
$918.5 million
as of June 4, 2018): The fair value of broadcast licenses was determined using the Greenfield approach, a derivation of the income approach that isolates the income that is properly attributable to the license alone. It is based upon modeling a hypothetical “Greenfield” build-up to a normalized enterprise that, by design, lacks inherent goodwill and has other assets that have essentially been paid for or added as part of the build-up process.
|
|
b.
|
Other intangible assets (
$212.5 million
as of June 4, 2018):
|
|
i.
|
Broadcasting, affiliate and producer relationships (
$162.0 million
as of June 4, 2018): The customer relationship intangibles including broadcasting and affiliate and producer relationships were valued utilizing the excess earning method, a derivation of the income approach that considers cash flows related to the customers after accounting for a fair return to the other supporting assets of the business.
|
|
ii.
|
Trademarks and trade names (
$21.2 million
as of June 4, 2018): In estimating the fair value of trademarks and trade names, management used the relief from royalty method, a derivation of the income approach, for analyzing the trade names.
|
|
iii.
|
Tower income contracts (
$15.1 million
as of June 4, 2018): The fair value of these were determined utilizing a discounted cash flow analysis.
|
|
iv.
|
Advertiser backlog (
$12.0 million
as of June 4, 2018): The fair value of advertiser backlog was analyzed using the multi-period excess earning method. Estimated duration of advertiser backlog as of the Effective Date was used as a point of recognition for net sales attributable to that backlog.
|
|
v.
|
Leasehold intangible asset, net (
$2.2 million
as of June 4, 2018): The fair value of leasehold interests was determined utilizing a discounted cash flow analysis, wherein leases for real property were assessed for favorable or unfavorable contract rental rates.
|
14.
Reflects the elimination of the Predecessor goodwill balance of
$135.2 million
.
15.
Reflects the elimination of the carrying value of short-term deferred rent to adjust accounts payable and accrued expenses to estimated fair value.
16.
Represents the fair value adjustment of the Term Loan including the elimination of debt issuance costs of
$18.0 million
incurred prior to and upon emergence from bankruptcy. The fair value of debt is comprised of
$13.0 million
of short-term debt and
$1,287.0 million
of long-term debt. The fair value of the Term Loan was determined based on a market approach utilizing market yields and was estimated to be
100%
of par value.
17.
Represents the increase of a liability related to a failed sale leaseback transaction and elimination of the carrying value of long-term deferred rent in accordance with fresh start reporting to adjust net book value to estimated fair value.
18.
Reflects the impact of fresh start adjustments on deferred taxes.
19.
Reflects the cumulative impact of the fresh start accounting adjustments discussed above on accumulated deficit as follows (dollars in thousands):
F-24
|
Property and equipment fair value adjustment
|
$
|
121,732
|
|
||
|
Intangible assets fair value adjustment
|
(147,907
|
)
|
|||
|
Goodwill adjustment
|
(135,214
|
)
|
|||
|
Term Loan fair value adjustment
|
(18,017
|
)
|
|||
|
Other assets and liabilities fair value adjustments
|
115
|
||||
|
Net loss on fresh start adjustments
|
$
|
(179,291
|
)
|
||
|
Tax impact on fresh start adjustments
|
10,642
|
||||
|
Net impact on retained earnings
|
$
|
(168,649
|
)
|
||
Reorganization Items, Net
Reorganization items incurred as a result of the Chapter 11 Cases are presented separately in the accompanying Consolidated Statement of Operations as follows (dollars in thousands):
|
Predecessor Company
|
||||
|
|
Period from January 1, 2018 through June 3, 2018
|
|||
|
Gain on settlement of Liabilities subject to compromise (a)
|
$
|
726,831
|
|
|
|
Fresh start adjustments (b)
|
(179,291
|
)
|
||
|
Professional fees (c)
|
(54,386
|
)
|
||
|
Non-cash claims adjustments (d)
|
(15,364
|
)
|
||
|
Rejected executory contracts (e)
|
(5,976
|
)
|
||
|
Other (f)
|
(5,613
|
)
|
||
|
Reorganization items, net
|
$
|
466,201
|
|
|
(a) Liabilities subject to compromise have been, or will be settled in accordance with the Plan.
(b) Revaluation of certain assets and liabilities upon the adoption of fresh start accounting.
(c) Legal, financial advisory and other professional costs directly associated with the reorganization process.
(d) The carrying value of certain claims were adjusted to the estimated value of the claim that will be allowed by the Bankruptcy Court.
(e) Non-cash expenses to record estimated allowed claim amounts related to rejected executory contracts.
(f) Federal Communications Commission filing and United States Trustee fees directly associated with the reorganization process and the write-off of Predecessor director and officer insurance policies.
As of December 31, 2018, total cash paid by the Predecessor Company related to Reorganization Items, net was
$57.8 million
.
F-25
4. Revenues
Adoption of ASC Topic 606 - Revenue from Contracts with Customers
On January 1, 2018, the Company adopted ASC 606 using the modified retrospective method. Results for reporting periods
beginning after January 1, 2018 are presented in accordance with ASC 606, while prior period amounts have not been adjusted and continue to be reported in accordance with the Company's historic accounting under ASC 605 - Revenue Recognition (“ASC 605”).
Revenue Recognition
Under current and prior revenue guidance, revenues are recognized when control of the promised goods or services are
transferred to the customer, in an amount that reflects the consideration to which the Company expects to be entitled in exchange for those goods or services.
The following table presents revenues disaggregated by revenue source (dollars in thousands):
|
Successor Company
|
Predecessor Company
|
||||||||||||||||||||
|
Period from June 4, 2018 through December 31, 2018
|
Period from January 1, 2018 through June 3, 2018
|
Year ended December 31, 2017
|
Year ended December 31, 2016
|
||||||||||||||||||
|
Cumulus Radio Station Group
|
|||||||||||||||||||||
|
Advertising revenues (broadcast, digital, non-traditional revenue (“NTR”) and trade)
|
$
|
474,157
|
|
$
|
301,804
|
|
$
|
783,034
|
|
$
|
798,587
|
|
|||||||||
|
Non-advertising revenues (tower rental and other)
|
2,961
|
1,513
|
3,929
|
3,809
|
|
||||||||||||||||
|
Total Cumulus Radio Station Group revenue
|
$
|
477,118
|
|
$
|
303,317
|
|
$
|
786,963
|
|
$
|
802,396
|
|
|||||||||
|
Westwood One
|
|||||||||||||||||||||
|
Advertising revenues (broadcast, digital and trade)
|
$
|
199,912
|
|
$
|
143,215
|
|
$
|
326,901
|
|
$
|
320,001
|
|
|||||||||
|
Non-advertising revenues (license fees and other)
|
7,790
|
6,500
|
19,264
|
16,609
|
|
||||||||||||||||
|
Total Westwood One revenue
|
$
|
207,702
|
|
$
|
149,715
|
|
$
|
346,165
|
|
$
|
336,610
|
|
|||||||||
|
Other (1)
|
$
|
1,616
|
|
$
|
892
|
|
$
|
2,534
|
|
$
|
2,394
|
|
|||||||||
|
Total Revenue
|
$
|
686,436
|
|
$
|
453,924
|
|
$
|
1,135,662
|
|
$
|
1,141,400
|
|
|||||||||
|
(1)
|
Other is comprised of revenue from certain digital commerce and broadcast software sales and services.
|
Advertising Revenues
Substantially all of the Company’s revenues are from advertising, primarily generated through (i) the sale of broadcast radio
advertising time and advertising and promotional opportunities across digital audio networks to local, regional, and national advertisers and (ii) remote/event revenue. The Company considers each advertising element a separate contract, and thus a separate performance obligation, as a result of both the customer’s and the Cumulus Radio Station Group or Westwood One’s respective ability to stop transferring promised goods or services during the contract term without notice or penalty. Thus, revenue associated with these contracts is recognized at the time advertising or other services, for example hosting an event, is delivered.
The Company’s payment terms vary by the type and location of customer and the products or services offered. The term
between invoicing and when payment is due is not significant. There are no further obligations for returns, refunds or similar
obligations related to the contracts. The Company records deferred revenues when cash payments are received in advance of
performance, including amounts which are refundable.
F-26
Non-Advertising Revenues
Non-advertising revenue does not constitute a material portion of the Company’s revenue and primarily consists of licensing
content and tower rental agreements, and to a lesser degree, sublease income, and satellite rental income. Rental agreements typically range from
one
to
five
years with renewal clauses. Such agreements typically contain a stated recurring monthly amount due, which is recognized upon delivery of services or passage of time. These agreements contain a single performance obligation.
Trade and Barter Transactions
The Company provides advertising time in exchange for goods or services such as products, supplies, or services. Trade
revenue totaled
$26.5 million
,
$19.0 million
,
$40.1 million
and
$37.7 million
for the period June 4, 2018 through December 31, 2018 (Successor Company), the period January 1, 2018 through June 3, 2018 (Predecessor Company), the year ended December 31, 2017 (Predecessor Company) and the year ended December 31, 2016 (Predecessor Company), respectively.
Programming barter revenue is derived from an exchange of programming content, to be broadcast on the Company’s
airwaves, for commercial inventory, usually in the form of commercial placements inside of the show exchanged. The revenue is recognized as the commercial spots are aired, in the same pattern as the Company’s normal cash spot revenue is recognized. Trade and barter value is based upon management’s estimate of the fair value of the products, supplies or services received.
Variable Consideration
Certain customers may receive cash-based incentives or credits, which are accounted for as variable consideration. The Company estimates these amounts based on the expected amount to be provided to customers and reduces revenue recognized accordingly. The Company has not had, nor does it believe that there will be, significant changes to its estimates of variable
consideration. In addition, variable consideration has not historically been material to the Company’s financial statements.
Customer Options that Provide a Material Right
ASC 606 requires the allocation of a portion of a transaction price of a contract to additional goods or services transferred to a customer that are considered to be a separate performance obligation and provide a material right to the customer.
To satisfy the requirement of accounting for the material right, the Company considers both the transaction price associated
with each spot as well as the timing of revenue recognition for the spots. Customers are often provided bonus spots, which are radio advertising spots, free of charge, explicitly within the contract terms or implicitly agreed upon with the customer consistent with industry standard practices. The Company typically runs these bonus spots concurrent with paid spots. As the delivery and revenue recognition for both paid and bonus spots generally occur within the same period, the time of delivery and recognition of revenue is insignificant.
Principal versus Agent Considerations
In those instances in which the Company functions as the principal in the transaction, the revenue and associated operating
costs are presented on a gross basis. In those instances where the Company functions solely as an agent or sales representative, the Company’s effective commission is presented as revenue on a net basis with no corresponding operating expenses.
Westwood One maintains revenue sharing agreements and inventory representation agreements with various radio companies. For all revenue sharing and inventory representation agreements, the Company performs an analysis in accordance with ASC 606 to determine if the amounts should be recorded on a gross or net basis. Consistent with the prior revenue recognition guidance, Westwood One continues to record all revenue sharing agreements on a gross basis with the shared revenue amount recorded within Content costs in the Consolidated Statements of Operations and inventory representation agreements on a net basis.
Practical Expedients
The Company applied the completed contract practical expedient guidance under ASC 606 to contracts that were not
considered completed as of January 1, 2018.
The Company capitalizes certain incremental costs of obtaining contracts with customers which it expects to recover.
For contracts with a client whose customer life covers a year or less, companies may use a practical expedient that allows the option to expense commissions as they are incurred. For contracts where the new and renewal commission rates are commensurate,
F-27
management used the contract life for the amortization period. As such, the Company will continue to expense commissions as incurred for the revenue streams where the new and renewal commission rates are commensurate and the contract life is less than one year. These costs are recorded within Sales, General and Administrative expense in our Consolidated Statements of Operations. The Company does not apply the practical expedient option to new local direct contracts, as the commission rates for new and renewal contracts is not commensurate and the customer life is typically in excess of one year. As of December 31, 2018, the Company recorded an asset of approximately
$6.5 million
related to the unamortized portion of commission expense on new local direct revenue. Under the previous guidance of ASC 605, commission expense on new local direct revenue would have been expensed as incurred.
Under certain practical expedients elected, the Company did not disclose the amount of consideration allocated to the remaining performance obligations or an explanation of when the Company expects to recognize that amount as revenue for reporting periods presented before January 1, 2018.
The Company has elected to apply the practical expedient which allows it to not disclose information about remaining
performance obligations that have original expected durations of
one
year or less. The Company has contracts with customers which the Company believes will produce revenue beyond one year. From these contracts, the Company estimates it will recognize approximately
$6.0 million
of revenue in 2019.
5. Restricted Cash
As of
December 31, 2018
and
2017
, the Company’s Consolidated Balance Sheets included approximately
$2.5 million
and
$9.0 million
, respectively, in restricted cash. Restricted cash is used primarily to collateralize standby letters of credit for certain leases and insurance policies.
6. Property and Equipment
Property and equipment consisted of the following as of
December 31, 2018
and
2017
(dollars in thousands):
|
Successor Company
|
Predecessor Company
|
||||||||
|
Estimated Useful Life
|
As of December 31, 2018
|
As of December 31, 2017
|
|||||||
|
Land
|
N/A
|
$
|
79,670
|
|
$
|
86,308
|
|
||
|
Broadcasting and other equipment
|
3 to 30 years
|
77,812
|
|
240,740
|
|
||||
|
Computer and capitalized software costs
|
1 to 3 years
|
17,681
|
|
29,793
|
|
||||
|
Furniture and fixtures
|
5 years
|
5,269
|
|
15,278
|
|
||||
|
Leasehold improvements
|
5 years
|
25,812
|
|
42,504
|
|
||||
|
Buildings
|
9 to 20 years
|
28,689
|
|
51,549
|
|
||||
|
Construction in progress
|
N/A
|
15,946
|
|
32,463
|
|
||||
|
250,879
|
|
498,635
|
|
||||||
|
Less: accumulated depreciation
|
(14,981
|
)
|
(307,031
|
)
|
|||||
|
$
|
235,898
|
|
$
|
191,604
|
|
||||
Depreciation expense for the Successor Company period June 4, 2018 through December 31, 2018, the Predecessor Company period January 1, 2018 through June 3, 2018, the Predecessor Company year ended December 31, 2017 and the Predecessor Company year ended December 31, 2016 was
$15.2 million
,
$14.2 million
,
$28.7 million
, and
$31.1 million
, respectively.
In connection with the application of fresh start accounting on June 3, 2018, the Company recorded fair value adjustments disclosed in Note 3, “Fresh Start Accounting.” Accumulated depreciation was therefore eliminated as of that date.
The Company capitalizes certain costs related to software developed or obtained for internal use in accordance with ASC 350-40,
Intangibles-Goodwill and Other-Internal Use Software
. The Company evaluates these long-lived assets for impairment whenever circumstances arise that indicate the carrying amount of an asset may not be recoverable.
F-28
As a result of the annual impairment assessment, there was no impairment to capitalized costs related to our internally developed software as of December 31, 2018. The Company is currently evaluating alternatives related to capitalized software associated with certain internally developed systems and will assess the recoverability of those costs whenever events or changes in circumstances indicate that the carrying amount of the assets may not be recoverable.
The table presented above does not reflect certain assets in the Company's Washington, DC market which
has been classified as held for sale in the accompanying Consolidated Balance Sheet at December 31, 2018 as disclosed in Note 1, "Nature of Business, Basis of Presentation and Summary of Significant Accounting Policies."
7. Intangible Assets and Goodwill
The carrying value of goodwill by reportable segments is as follows (dollars in thousands):
|
Cumulus Radio Station Group
|
Westwood One
|
Consolidated
|
|||||||||||||||
|
Balance as of January 1, 2018 (Predecessor Company)
|
|||||||||||||||||
|
Goodwill
|
$
|
1,278,526
|
|
$
|
304,280
|
|
$
|
1,582,806
|
|
||||||||
|
Accumulated impairment losses
|
(1,278,526
|
)
|
(169,066
|
)
|
(1,447,592
|
)
|
|||||||||||
|
Balance as of January 1, 2018 (Predecessor Company)
|
$
|
—
|
|
$
|
135,214
|
|
$
|
135,214
|
|
||||||||
|
Balance as of June 3, 2018 (Predecessor Company)
|
|||||||||||||||||
|
Goodwill
|
$
|
1,278,526
|
|
$
|
304,280
|
|
$
|
1,582,806
|
|
||||||||
|
Accumulated impairment losses
|
(1,278,526
|
)
|
(169,066
|
)
|
(1,447,592
|
)
|
|||||||||||
|
Balance as of June 3, 2018 (Predecessor Company)
|
$
|
—
|
|
$
|
135,214
|
|
$
|
135,214
|
|
||||||||
|
Impact of fresh start accounting
|
—
|
|
(135,214
|
)
|
(135,214
|
)
|
|||||||||||
|
Balance as of June 4, 2018 (Successor Company)
|
$
|
—
|
|
$
|
—
|
|
$
|
—
|
|
||||||||
Prior to the application of fresh start accounting, goodwill represented the excess of the amount paid to acquire businesses over the fair value of their net assets at the date of the acquisition. The Company eliminated goodwill upon application of fresh start accounting (see Note 3, “Fresh Start Accounting”). The Successor Company had no goodwill as of December 31, 2018.
In performing the Company's 2016 annual impairment testing of goodwill, the Company recorded a non-cash impairment charge of
$568.1 million
, reducing the goodwill in the Cumulus Radio Station Group to
$0.0 million
at December 31, 2016. The Company did not incur any impairment charges related to goodwill during the year ended December 31, 2017.
F-29
Intangible Assets
In connection with the Company’s adoption of fresh start accounting on the Effective Date, intangible assets and related accumulated amortization of the Predecessor Company were eliminated. Intangible assets of the Successor Company were identified and valued at their fair value, as determined management with the assistance of valuation specialists. The Company’s intangible assets are as follows (dollars in thousands):
|
Intangible Assets:
|
Indefinite-Lived
|
Definite-Lived
|
Total
|
||||||||||||||
|
Balance as of January 1, 2018 (Predecessor Company)
|
$
|
1,203,809
|
|
$
|
82,994
|
|
$
|
1,286,803
|
|
||||||||
|
Dispositions
|
—
|
—
|
—
|
||||||||||||||
|
Amortization
|
—
|
(7,938
|
)
|
(7,938
|
)
|
||||||||||||
|
Balance as of June 3, 2018 (Predecessor Company)
|
$
|
1,203,809
|
|
$
|
75,056
|
|
$
|
1,278,865
|
|
||||||||
|
Impact of fresh start accounting
|
(264,109
|
)
|
116,202
|
(147,907
|
)
|
||||||||||||
|
Balance as of June 4, 2018 (Successor Company)
|
$
|
939,700
|
|
$
|
191,258
|
|
$
|
1,130,958
|
|
||||||||
|
Disposals
|
(340
|
)
|
(22
|
)
|
(362
|
)
|
|||||||||||
|
Amortization
|
—
|
(18,885
|
)
|
(18,885
|
)
|
||||||||||||
|
Acquisitions
|
17,476
|
—
|
17,476
|
||||||||||||||
|
Balance as of December 31, 2018 (Successor Company)
|
$
|
956,836
|
|
$
|
172,351
|
|
$
|
1,129,187
|
|
||||||||
As part of fresh start accounting, the Company removed existing intangibles and accumulated amortization and recorded an adjustment of
$147.9 million
to reflect the fair value of intangibles. (See Note 3, “Fresh Start Accounting").
The Company's definite-lived intangible assets primarily consist of broadcast advertising and affiliate relationships, while the Company's indefinite-lived assets consist of broadcasting license and trademarks. Total amortization expense related to the Company’s definite-lived intangible assets was
$18.9 million
,
$7.9 million
,
$33.5 million
and
$56.2 million
for the Successor Company period June 4, 2018 through December 31, 2018, the Predecessor Company period January 1, 2018 through June 3, 2018, the Predecessor Company year ended December 31, 2017 and the Predecessor Company year ended December 31, 2016, respectively. As of
December 31, 2018
, future amortization expense related to the Company's definite-lived intangible assets was estimated as follows (dollars in thousands):
|
2019
|
$
|
25,307
|
|
|
2020
|
20,312
|
|
|
|
2021
|
20,211
|
|
|
|
2022
|
20,111
|
|
|
|
2023
|
16,377
|
|
|
|
Thereafter
|
70,033
|
|
|
|
Total other intangibles, net
|
$
|
172,351
|
|
The Company performs annual impairment testing of its Federal Communications Commission ("FCC") licenses and goodwill as of December 31 of each year and on an interim basis if events or circumstances indicate that FCC licenses or goodwill may be impaired. The Company reviews the carrying value of its definite-lived intangible assets, primarily broadcast advertising and affiliate relationships, for recoverability prior to its annual impairment test of goodwill and whenever events or changes in circumstances indicate that the carrying amount of the assets may not be recoverable.
Impairment Test - Definite-Lived Intangibles
The Company tests definite-lived intangible assets for recoverability by comparing the net carrying value of an asset group to its undiscounted cash flows. As of
December 31, 2018
, based on the results of the recoverability test, the Company determined that the future undiscounted cash flows expected to result from the continued use of the assets and their eventual disposition continued to exceed the carrying value of the applicable asset groups and were therefore recoverable. The Company did not recognize any impairment charges for its definite-lived intangible assets in
2018
as a result of this analysis.
F-30
During the second quarter of 2016, the Company recorded an impairment charge to its definite-lived intangible assets of
$1.8 million
at the Westwood One segment for all customer lists and trademark definite-lived intangible assets related to the print publication of NASH Country Weekly as the Company re-positioned the print publication to a digital only medium. There were no similar impairments in 2017 or 2018.
Annual Impairment Test - FCC Licenses
As part of the annual impairment testing of indefinite-lived intangibles the Company tests its FCC licenses for impairment during the fourth quarter of each year and on an interim basis if events or circumstances indicate that the asset may be impaired. As part of the overall planning associated with the test, the Company determined that its geographic markets are the appropriate unit of accounting for FCC license impairment testing and therefore the Company has combined its FCC licenses within each geographic market cluster into a single unit of accounting for impairment testing purposes.
For the impairment test, we utilized the income approach, specifically the Greenfield Method. This approach values a license by calculating the value of a hypothetical start-up company that initially has no assets except the asset to be valued (the license). The value of the asset under consideration (the license) can be considered as equal to the value of this hypothetical start-up company. In completing the appraisals, we considered if there were any other factors that might affect the carrying value of the asset.
The estimated fair values of our FCC licenses represent the price that would be received to sell an asset or paid to transfer a liability in an orderly transaction between the Company and willing market participants at the measurement date. The estimated fair value also assumes the highest and best use of the asset by market participants, considering a use of the asset that is physically possible, legally permissible and financially feasible.
A basic assumption in our valuation of these FCC licenses was that these radio stations were new radio stations, signing on the air as of the date of the valuation. We assumed the competitive situation that existed in those markets as of that date, except that these stations were just beginning operations.
In estimating the value of the licenses, we began with market revenue projections. Next, we estimated the percentage of the market’s total revenue, or market share, that market participants could reasonably expect an average start-up station to attain, as well as the duration (in years) required to reach the average market share. The estimated average market share was computed based on market share data, by station type (i.e., AM and FM) and signal strength.
After market revenue and market shares were estimated, operating expenses, including depreciation based on assumed investments in fixed assets and future capital expenditures of a start-up station or operation are similarly estimated based on industry-average cost data. Appropriate estimated income taxes were then subtracted, estimated depreciation added back, estimated capital expenditures subtracted, and estimated working capital adjustments were made to calculate estimated free cash flow during the build-up period until a steady state or mature “normalized” operation is achieved.
The analysis included overall future market revenue rates of decline for the residual years after the projection period of
(0.75)%
and a weighted average cost of capital of
9.0%
. The residual year value and cash flow growth rates were estimated based on a perpetual nominal market growth rate, which was based on long-term industry projections obtained from third party sources. The weighted average cost of capital was based on (i) the cost of equity, which included estimates of the risk-free return, stock risk premiums and industry beta; (ii) the cost of debt, which included estimates for corporate borrowing rates; and (iii) estimated average percentages of equity and debt in other radio broadcasters capital structures.
In order to estimate what listening audience share could be expected to be achieved for each station by market, we analyzed the average local commercial share garnered by similar AM and FM stations competing in those radio markets. We may make adjustments to the listening share and revenue share based on a station's signal coverage within the market and the surrounding area population as compared to the other stations in the market. Based on our knowledge of the industry and familiarity with similar markets, we determined that approximately three years would be required for the stations to reach maturity. We also incorporated the following additional assumptions into the discounted cash flow valuation model:
|
•
|
projected operating revenues and expenses over a
five
-year period;
|
|
•
|
the estimation of initial and on-going capital expenditures (based on market size);
|
|
•
|
depreciation on initial and on-going capital expenditures (the Company calculated depreciation using accelerated double declining balance guidelines over five years for the value of the tangible assets necessary for a radio station to go on the air);
|
F-31
|
•
|
the estimation of working capital requirements (based on working capital requirements for comparable companies); and
|
|
•
|
amortization of the intangible asset — the FCC license.
|
As a result of the impairment test, there was no impairment as of December 31, 2018. As of December 31, 2017, the Company recorded a non-cash impairment charge of
$335.9 million
. As of December 31, 2016 the Company recorded a non-cash impairment charge of
$35.0 million
.
If the macroeconomic conditions of the radio industry or the underlying material assumptions are less favorable than those projected by the Company or if a triggering event occurs or circumstance change that would more likely than not reduce the fair value of FCC licenses below the amounts reflected in the Consolidated Balance Sheet, the Company may be required to recognize additional impairment charges in future periods.
8. Accounts Payable and Accrued Expenses
Accounts payable and accrued expenses consisted of the following as of
December 31, 2018
and
2017
(dollars in thousands):
|
Successor Company
|
Predecessor Company
|
|||||||
|
December 31, 2018
|
December 31, 2017
|
|||||||
|
Accrued employee costs
|
$
|
23,599
|
|
$
|
9,528
|
|
||
|
Accrued third party content costs
|
28,963
|
|
5,205
|
|
||||
|
Accounts payable
|
11,695
|
|
1,928
|
|
||||
|
Accrued other
|
37,063
|
|
19,496
|
|
||||
|
Total accounts payable and accrued expenses
|
$
|
101,320
|
|
$
|
36,157
|
|
||
In connection with the filing of the Bankruptcy Petitions,
$108.2 million
of accounts payable and accrued expenses
outstanding under the Predecessor Company, were reclassified to Liabilities subject to compromise in the Consolidated Balance Sheet as of December 31, 2017.
9. Long-Term Debt
The Company’s long-term debt consisted of the following at
December 31, 2018
and
2017
(dollars in thousands):
|
Successor Company
|
Predecessor Company
|
|||||||
|
|
December 31, 2018
|
|
December 31, 2017
|
|||||
|
Predecessor Term Loan
|
$
|
—
|
|
|
$
|
1,722,209
|
|
|
|
7.75% Senior Notes
|
—
|
|
|
610,000
|
|
|||
|
Long-term debt, net subject to compromise
|
$
|
—
|
|
|
$
|
2,332,209
|
|
|
|
Less: Amounts reclassified to liabilities subject to compromise
|
—
|
|
(2,332,209
|
)
|
||||
|
Term Loan
|
$
|
1,230,299
|
|
$
|
—
|
|
||
|
Plus: Current portion
|
13,000
|
|
—
|
|
||||
|
Total long-term debt
|
$
|
1,243,299
|
|
$
|
—
|
|
||
In connection with the filing of the Bankruptcy Petitions, all amounts outstanding under the Predecessor Term Loan and the
7.75%
Senior Notes had been reclassified to Liabilities subject to compromise in the Consolidated Balance
Sheet as of December 31, 2017.
F-32
Future maturities of the Term Loan (dollars in thousands):
|
2019
|
$
|
13,000
|
|
|
2020
|
13,000
|
|
|
|
2021
|
13,000
|
|
|
|
2022
|
1,204,299
|
|
|
|
$
|
1,243,299
|
|
|
Credit Agreement
On the Effective Date, Cumulus Media New Holdings Inc., a Delaware corporation (“Holdings”) and an indirectly wholly-owned subsidiary of the Company, and certain of the Company’s other subsidiaries, entered into the Credit Agreement with the holders of claims with respect to the Predecessor Term Loan under the Canceled Credit Agreement, as term loan lenders. Pursuant to the Credit Agreement, the lenders party thereto were deemed to have provided Holdings and its subsidiaries that are party thereto as co- borrowers with a
$1.3 billion
senior secured Term Loan.
Amounts outstanding under the Credit Agreement bear interest at a per annum rate equal to (i) the London Inter-bank Offered Rate (“LIBOR”) plus an applicable margin of
4.50%
, subject to a LIBOR floor of
1.00%
, or (ii) the Alternative Base Rate (as defined below) plus an applicable margin of
3.50%
, subject to an Alternative Base Rate floor of
2.00%
. The Alternative Base Rate is defined, for any day, as the per annum rate equal to the highest of (i) the Federal Funds Rate, as published by the Federal Reserve Bank of New York, plus 1/2 of
1.0%
, (ii) the rate identified as the “Prime Rate” and normally published in the Money Rates section of the Wall Street Journal, and (iii) one-month LIBOR plus
1.0%
. At December 31, 2018, the Term Loan bore interest at
7.03%
per annum.
Amounts outstanding under the Term Loan amortize in equal quarterly installments of
0.25%
of the original principal amount of the Term Loan with the balance payable on the maturity date. The maturity date of the Term Loan is May 15, 2022.
The Credit Agreement contains representations, covenants and events of default that are customary for financing transactions of this nature. Events of default in the Credit Agreement include, among others: (a) the failure to pay when due the obligations owing thereunder; (b) the failure to perform (and not timely remedy, if applicable) certain covenants; (c) certain defaults and accelerations under other indebtedness; (d) the occurrence of bankruptcy or insolvency events; (e) certain judgments against Holdings or any of its subsidiaries; (f) the loss, revocation or suspension of, or any material impairment in the ability to use, any one or more of, any material FCC licenses; (g) any representation or warranty made, or report, certificate or financial statement delivered, to the lenders subsequently proven to have been incorrect in any material respect; and (h) the occurrence of a Change in Control (as defined in Credit Agreement). Upon the occurrence of an event of default, the Agent may, with the consent of, or upon the request of, the required lenders, accelerate the Term Loan and exercise any of its rights as a secured party under the Credit Agreement and the ancillary loan documents provided, that in the case of certain bankruptcy or insolvency events with respect to a borrower, the Term Loan will automatically accelerate.
The Credit Agreement does not contain any financial maintenance covenants. The Credit Agreement provides that Holdings will be permitted to enter into either a revolving credit facility or receivables facility providing commitments of up to
$50.0 million
, subject to certain conditions.
The borrowers may elect, at their option, to prepay amounts outstanding under the Credit Agreement without premium or penalty (except that any prepayment during the period of six months following the closing of the Credit Agreement would require a premium equal to
1.00%
of the prepaid principal amount). The borrowers may be required to make mandatory prepayments of the Term Loan upon the occurrence of specified events as set forth in the Credit Agreement, including upon the sale of certain assets and from Excess Cash Flow (as defined in the Credit Agreement). On October 11, 2018, the Company purchased
$50.2 million
of face value of the Term Loan for
$50.0 million
, a discount to par value of
0.40%
. On March 18, 2019, the Company purchased
$25.4 million
of face value of the Term Loan for
$25.0 million
, a discount to par value of
1.50%
.
Amounts outstanding under the Credit Agreement are guaranteed by Cumulus Media Intermediate Inc. (“Intermediate
Holdings”), which is a subsidiary of the Company, and the present and future wholly-owned subsidiaries of Holdings that are not borrowers thereunder, subject to certain exceptions as set forth in the Credit Agreement (the “Guarantors”) and secured by a security interest in substantially all of the assets of Holdings, the subsidiaries of Holdings party to the Credit Agreement as
F-33
borrowers, and the Guarantors. As of December 31, 2018, the Company was compliance with all required covenants under the Credit Agreement.
Revolving Credit Agreement
On August 17, 2018, Holdings entered into a
$50.0 million
revolving credit facility (the “Revolving Credit Facility”) pursuant to a credit agreement (the “Revolving Credit Agreement”), dated as of August 17, 2018, with certain subsidiaries of Holdings as borrowers, Intermediate Holdings as a guarantor, certain lenders, and Deutsche Bank AG New York Branch as a lender and Administrative Agent.
The Revolving Credit Facility matures on August 17, 2023. Availability under the Revolving Credit Facility is tied to a borrowing base formula that is based on
85%
of the accounts receivable of the borrowers and the guarantors, subject to customary reserves and eligibility criteria. Under the Revolving Credit Facility, up to
$10.0 million
of availability may be drawn in the form of letters of credit.
Borrowings under the Revolving Credit Facility bear interest, at the option of Holdings, based on (i) LIBOR plus a percentage spread (ranging from
1.25%
to
1.75%
) based on the average daily excess availability under the Revolving Credit Facility or (ii) the Alternative Base Rate (as defined below) plus a percentage spread (ranging from
0.25%
to
0.75%
) based on the average daily excess availability under the Revolving Credit Facility. The Alternative Base Rate is defined, for any day, as the per annum rate equal to the highest of (i) the federal funds rate plus 1/2 of
1.0%
, (ii) the rate identified as the “Prime Rate” and normally published in the Money Rates section of the Wall Street Journal, and (iii) one-month LIBOR plus
1.0%
. In addition, the unused portion of the Revolving Credit Facility will be subject to a commitment fee ranging from
0.250%
to
0.375%
based on the utilization of the facility.
The Revolving Credit Agreement contains representations, covenants and events of default that are customary for financing transactions of this nature. Events of default in the Revolving Credit Agreement include, among others: (a) the failure to pay when due the obligations owing thereunder; (b) the failure to perform (and not timely remedy, if applicable) certain covenants; (c) certain defaults and accelerations under other indebtedness; (d) the occurrence of bankruptcy or insolvency events; (e) certain judgments against Holdings or any of its subsidiaries; (f) the loss, revocation or suspension of, or any material impairment in the ability to use, any one or more of, any material FCC licenses; (g) any representation or warranty made, or report, certificate or financial statement delivered, to the lenders subsequently proven to have been incorrect in any material respect; and (h) the occurrence of a Change in Control (as defined in Credit Agreement). Upon the occurrence of an event of default, the lenders may terminate the loan commitments, accelerate all loans and exercise any of their rights under the Revolving Credit Agreement and the ancillary loan documents as a secured party.
The Revolving Credit Agreement does not contain any financial maintenance covenants with which the Company must comply. However, if average excess availability under the Revolving Credit Facility is less than the greater of (a)
12.50%
of the total commitments thereunder or (b)
$5.0 million
, the Company must comply with a fixed charge coverage ratio of not less than
1.0
:1.0.
Amounts outstanding under the Revolving Credit Agreement are guaranteed by Intermediate Holdings and the present and future wholly-owned subsidiaries of Holdings that are not borrowers thereunder, subject to certain exceptions as set forth in the Revolving Credit Agreement (the “Revolver Guarantors”) and secured by a security interest in substantially all of the assets of Holdings, the subsidiaries of Holdings party to the Credit Agreement as borrowers, and the Revolver Guarantors.
As of December 31, 2018,
$2.8 million
was outstanding in the form of a letter of credit under the Revolving Credit Facility. As of December 31, 2018, the Company was in compliance with all required covenants under the Revolving Credit Agreement.
Canceled Credit Agreement
The Canceled Credit Agreement consisted of a term loan with a stated maturity date in December 2020. At December 31, 2017, there was
$1.7 billion
outstanding under the Predecessor Term Loan.
Amounts outstanding under the Predecessor Term Loan amortized at a rate of
1.0%
per annum of the original principal amount of the Predecessor Term Loan, payable quarterly, with the balance payable on the maturity date. Borrowings under the Predecessor Term Loan bore interest based on the Base Rate (as defined below) or LIBOR, plus
3.25%
on LIBOR-based borrowings and
2.25%
on Base Rate-based borrowings. LIBOR-based borrowings were subject to a LIBOR floor of
1.0%
. Base
F-34
Rate-based borrowings were subject to a Base Rate floor of
2.0%
. Base Rate was defined, for any day, as the rate per annum equal to the highest of (i) the Federal Funds Rate, as published by the Federal Reserve Bank of New York, plus
0.5%
, (ii) the prime commercial lending rate of JPMorgan Chase Bank, N.A., as established from time to time, and (iii) 30 day LIBOR plus
1.0%
.
As a result of the filing of the Bankruptcy Petitions, Old Cumulus was required to make adequate protection payments on the Predecessor Term Loan. The amounts of these payments were calculated under the same terms as the interest and at the rates described above. During the pendency of Bankruptcy Petitions, ASC 852 required Old Cumulus to recognize the adequate protection payments as reductions in the principal balance of the Predecessor Term Loan. As a result, Old Cumulus applied adequate protection payments of approximately
$37.8 million
to the principal balance of the Predecessor Term Loan for the period from January 1, 2018 through June 3, 2018, which in turn, caused interest expense in 2018 to be lower by approximately
$37.1 million
than it would have been absent the filing of the Bankruptcy Petitions.
On the Effective Date, the Predecessor Term Loan was canceled and all liabilities thereunder were discharged.
7.75% Senior Notes
On May 13, 2011, Old Cumulus issued the
7.75%
Senior Notes. On September 16, 2011, Old Cumulus and one of its subsidiaries entered into a supplemental indenture with the trustee under the indenture governing the
7.75%
Senior Notes which provided for, among other things, the (i) assumption by such subsidiary of all obligations of Old Cumulus related to the
7.75%
Senior Notes; (ii) substitution of that subsidiary for Old Cumulus as issuer; (iii) release of Old Cumulus from all obligations as original issuer; and (iv) guarantee by Old Cumulus of all of the subsidiary issuer's obligations, in each case under the indenture and the
7.75%
Senior Notes.
Interest on the
7.75%
Senior Notes was payable May 1 and November 1 of each year. The
7.75%
Senior Notes were scheduled to mature on May 1, 2019. While under bankruptcy protection, Old Cumulus did not make interest payments or recognize interest expense on the
7.75%
Senior Notes. As a result, Old Cumulus's interest expense for the period from January 1, 2018 through June 3, 2018, was approximately
$22.1 million
lower than it would have been absent the filing of the voluntary petitions for reorganization.
On the Effective Date, the
7.75%
Senior Notes were canceled and all liabilities thereunder were discharged.
F-35
10. Fair Value Measurements
The
three
levels of the fair value hierarchy to be applied when determining fair value of financial instruments are described below:
Level 1 — Valuations based on quoted prices in active markets for identical assets or liabilities that the entity has the ability to access;
Level 2 — Valuations based on quoted prices for similar assets or liabilities, quoted prices in markets that are not active, or other inputs that are observable or can be corroborated by observable data for substantially the full term of the assets or liabilities; and
Level 3 — Valuations based on inputs that are supported by little or no market activity and that are significant to the fair value of the assets or liabilities.
The following table shows the gross amount and fair value of the Term Loan, the Predecessor Term Loan and the
7.75%
Senior Notes (dollars in thousands):
|
Successor Company
|
Predecessor Company
|
|||||||||
|
December 31, 2018
|
December 31, 2017
|
|||||||||
|
Term Loan:
|
||||||||||
|
Gross value
|
$
|
1,243,299
|
|
$
|
—
|
|
||||
|
Fair value - Level 2
|
$
|
1,182,688
|
|
$
|
—
|
|
||||
|
Predecessor Term Loan:
|
||||||||||
|
Gross value
|
$
|
—
|
|
$
|
1,722,209
|
|
||||
|
Fair value - Level 2
|
$
|
—
|
|
$
|
1,481,100
|
|
||||
|
7.75% Senior Notes:
|
||||||||||
|
Gross value
|
$
|
—
|
|
$
|
610,000
|
|
||||
|
Fair value - Level 2
|
$
|
—
|
|
$
|
105,988
|
|
||||
As of
December 31, 2018
, the Company obtained trading prices from a third party of
95.13%
to calculate the fair value of the Term Loan.
As of
December 31, 2017
, Old Cumulus obtained trading prices from a third party of
86.0%
to calculate the fair value of the Predecessor Term Loan, and
17.4%
to calculate the fair value of the
7.75%
Senior Notes.
11. Stockholders’ Equity
Successor Common Stock
Pursuant to the Company’s amended and restated certificate of incorporation (the “Charter”), the Company is authorized to issue an aggregate of
300,000,000
shares of stock divided into
three
classes consisting of: (i)
100,000,000
shares of new Class A common stock; (ii)
100,000,000
shares of new Class B common stock; and (iii)
100,000,000
shares of preferred stock.
Each share of new Class A common stock is entitled to
one
vote per share on each matter submitted to a vote of the
Company’s stockholders. Except as provided below and as otherwise required by the Charter, the Company’s bylaws or by applicable law, the holders of new Class A common stock shall vote together as
one
class on all matters submitted to a vote of stockholders generally (or if any holders of shares of preferred stock are entitled to vote together with the holders of common stock, as a single class with such holders of shares of preferred stock).
Holders of new Class B common stock are generally not entitled to vote such shares on matters submitted to a vote of the Company’s stockholders. Notwithstanding the foregoing, holders of new Class B common stock are entitled to
one
vote per share of new Class B common stock, voting as a separate class, on any proposed amendment or modification of any specific rights or obligations that affect holders of new Class B common stock and that do not similarly affect the rights or obligations of the holders of new Class A common stock. In addition, holders of new Class B common stock are entitled to
one
vote per share of new Class B common stock, voting together with the holders of new Class A common stock, on each of the following
matters, if and only if any such matter is submitted to a vote of the stockholders (provided that the Company may take action on any of the following without a vote of the stockholders to the extent permitted by law):
|
a.
|
the retention or dismissal of outside auditors by the Company;
|
|
b.
|
any dividends or distributions to the stockholders of the Company;
|
|
c.
|
any material sale of assets, recapitalization, merger, business combination, consolidation, exchange of stock or other similar reorganization involving the Company or any of its subsidiaries;
|
|
d.
|
the adoption of any new or amended charter;
|
|
e.
|
other than in connection with any management equity or similar plan adopted by the Board, any authorization or issuance of equity interests, or any security or instrument convertible into or exchangeable for equity interests, in the Company or any of its subsidiaries; and
|
|
f.
|
the liquidation of the Company or any of its subsidiaries.
|
The Charter and bylaws do not provide for cumulative voting. The holders of a plurality of the shares of new common stock entitled to vote and present in person or represented by proxy at any meeting at which a quorum is present and which is called for the purpose of electing directors will be entitled to elect the directors of the Company. The holders of a majority of the shares of new common stock issued and outstanding and entitled to vote, and present in person or represented by proxy, will constitute a quorum for the transaction of business at all meetings of the stockholders.
Subject to the preferences applicable to any preferred stock outstanding at any time, if any, the holders of shares of new common stock shall be entitled to receive such dividends and other distributions in cash, property or shares of stock as may be declared thereon by the Board from time to time out of the assets or funds legally available; except that in the case of dividends or other distributions payable on the new Class A common stock or new Class B common stock in shares of such stock, including distributions pursuant to stock splits or dividends, only new Class A common stock will be distributed with respect to new Class A common stock and only new Class B common stock will be distributed with respect to new Class B common stock. In no event will any of the new Class A common stock or new Class B common stock be split, divided or combined unless each other class is proportionately split, divided or combined.
As of the date hereof, no shares of preferred stock are outstanding. The Charter provides that the Board may, by resolution, establish
one
or more classes or series of preferred stock having the number of shares and relative voting rights, designations and other rights, preferences, and limitations as may be fixed by them without further stockholder approval. The holders of any such preferred stock may be entitled to preferences over holders of common stock with respect to dividends, or upon a liquidation, dissolution, or the Company’s winding up, in such amounts as are established by the resolutions of the Board approving the issuance of such shares.
The new Class B common stock is convertible at any time, or from time to time, at the option of the holders (provided that the prior consent of any governmental authority required to make such conversion lawful shall have been obtained and a determination by the Company has been made that the applicable holder does not have an attributable interest in another entity that would cause the Company to violate applicable law) into new Class A common stock on a share-for-share basis.
No holder of new common stock has any preemptive right to subscribe for any shares of the Company’s capital stock issuable in the future.
If the Company is liquidated (either partially or completely), dissolved or wound up, whether voluntarily or involuntarily, the holders of new common stock shall be entitled to share ratably in the Company’s net assets remaining after payment of all liquidation preferences, if any, applicable to any outstanding preferred stock.
In connection with the Company’s emergence from Chapter 11 and in reliance on the exemption from registration
requirements of the Securities Act of 1933, as amended (the “Securities Act”) provided by Section 1145 of the Bankruptcy Code, the Company issued a total of
11,052,211
shares of new Class A common stock,
5,218,209
shares of new Class B common stock,
3,016,853
Series 1 warrants and issued or will issue
712,736
Series 2 warrants to holders of certain claims against the Predecessor Company. The holders of claims with respect to the Predecessor Term Loan received
83.5%
of the new common stock and warrants issued. The holders of unsecured claims, including claims arising from the
7.75%
Senior Notes, received, or will receive in the aggregate,
16.5%
of the new common stock and warrants issued. During the period from June 4, 2018 to December 31, 2018, certain holders of new Class B common stock elected to exchange
1,692,849
shares of new Class B common stock for an equal number of shares of new Class A common stock.
As of December 31, 2018, the Successor Company had
16,555,404
aggregate issued and outstanding shares of new common stock consisting of:
F-36
|
i.
|
12,995,080
shares designated as Class A common stock;
|
|
ii.
|
3,560,604
shares designated as Class B common stock
|
Successor Stock Purchase Warrants
On the Effective Date, the Company entered into a warrant agreement (the “Warrant Agreement”) with Computershare Inc., a Delaware corporation, and its wholly-owned subsidiary, Computershare Trust Company, N.A., a federally chartered trust company, as warrant agent. In accordance with the Plan and pursuant to the Warrant Agreement, on the Effective Date, the Company (i) issued
3,016,853
Series 1 warrants to purchase shares of new Class A common stock or new Class B common stock, on a
one
-for-one basis with an exercise price of
$0.0000001
per share, to certain claimants with claims against the Predecessor Company and (ii) issued or will issue
712,736
Series 2 warrants to purchase shares of new Class A common stock or new Class B common stock on a
one
-for- one basis with an exercise price of
$0.0000001
per share, to other claimants. The Warrants expire on June 4, 2038.
The number of shares of new common stock for which a Warrant is exercisable is subject to adjustment from time to time upon the occurrence of specified events, including: (1) the subdivision or combination of the new common stock into a greater or lesser number of shares (2) upon a reclassification or recapitalization of the Company in which holders of new common stock are entitled to receive cash, stock or securities in exchange for new common stock and (3) a Change of Control (as defined in the Warrant Agreement).
The Communications Act of 1934, as amended (the “Communications Act”) restricts the Company from having more than
25%
of its capital stock owned or voted by non-U.S. persons, foreign governments or non-U.S. corporations. The Company applied for a declaratory ruling from the FCC to increase the level of foreign ownership of the Company greater than that permitted under the Communications Act. Pursuant to the Warrant Agreement, upon receipt of the declaratory ruling from the FCC, the Company is required to exchange new common stock for outstanding Warrants to the extent permitted by the declaratory ruling, subject to proration among the holders of Warrants as set forth therein. If the declaratory ruling will not allow the Company to exchange for new common stock for all of the outstanding Warrants, then, in addition to proration among holders, all remaining Series 2 warrants will be mandatorily exchanged for Series 1 warrants.
Predecessor Common Stock
The Predecessor Company was authorized to issue an aggregate of
268,830,609
shares of stock divided into
four
classes consisting of:
|
i.
|
93,750,000
shares designated as Class A common stock;
|
|
ii.
|
75,000,000
shares designated as Class B common stock;
|
|
iii.
|
80,609
shares designated as Class C common stock, and
|
|
iv.
|
100,000,000
shares of preferred stock.
|
In accordance with the Plan, each share of old common stock outstanding prior to the Effective Date, including all options, warrants or other rights, including rights issued under the Rights Agreement, to purchase such old common stock, were extinguished, canceled and discharged, and each such share, option or warrant has no further force or effect. Furthermore, all of Old Cumulus’s equity award agreements under prior incentive plans, and the awards granted pursuant thereto, were extinguished, canceled and discharged and have no further force or effect.
Predecessor Warrants
2009 Warrants
In June 2009, in connection with the execution of an amendment to Old Cumulus's then-existing credit agreement, the
Predecessor Company issued warrants to the lenders thereunder that allowed them to acquire up to
156,250
shares of old Class A common stock at an exercise price of
$1.17
per share (the “2009 Warrants”).
None
of the 2009 warrants were converted during the period from December 31, 2017 to June 3, 2018, and as of such date there were
40,057
of the 2009 Warrants outstanding. The Predecessor 2009 Warrants were canceled in their entirety as of the Effective Date.
Citadel Warrants
As a component of Old Cumulus’s September 16, 2011 acquisition of Citadel Broadcasting Corporation (the “Citadel Merger”) and the related financing transactions, the Predecessor Company issued warrants to purchase an aggregate of
9.0
F-37
million
shares of old Class A common stock (the “Citadel Warrants”) under a warrant agreement dated September 16, 2011. The Citadel Warrants were exercisable at any time prior to June 3, 2030 at an exercise price of
$0.01
per share with each Citadel warrant providing the right to purchase
one
share. As of June 3, 2018,
31,955
Citadel Warrants remained outstanding. The Citadel Warrants were canceled in their entirety as of the Effective Date.
Crestview Warrants
Also on September 16, 2011, but pursuant to a separate warrant agreement, Old Cumulus issued warrants to purchase
1.0 million
shares of Class A common stock with an exercise price, as adjusted, of
$34.56
per share (the “Crestview Warrants”). As of June 3, 2018, all
1.0 million
Crestview Warrants remained outstanding. The Crestview Warrants were canceled in their entirety as of the Effective Date.
12. Stock-Based Compensation Expense
Successor Share-Based Compensation
In accordance with the Plan and the approval of the Board, the Long-Term Incentive Plan (the “Incentive Plan”) became effective as of the Effective Date. The Incentive Plan is intended to, among other things, help attract, motivate and retain key employees and directors and to reward them for making major contributions to the success of the Company. The Incentive Plan permits awards to be made to employees, directors, or consultants of the Company or an affiliate of the Company.
Unless otherwise determined by the Board, the Board’s compensation committee will administer the Incentive Plan. The
Incentive Plan generally provides for the following types of awards:
|
•
|
stock options (including incentive options and nonstatutory options);
|
|
•
|
restricted stock;
|
|
•
|
stock appreciation rights;
|
|
•
|
dividend equivalents;
|
|
•
|
other stock-based awards;
|
|
•
|
performance awards; and
|
|
•
|
cash awards.
|
The aggregate number of shares of new Class A common stock reserved for issuance pursuant to the Incentive Plan is
2,222,223
on a fully diluted basis. Awards can be made under the Incentive Plan for a period of
ten
years from June 4, 2018, subject to the right of the stockholders and the Board to terminate the Incentive Plan at any time.
On or about the Effective Date and pursuant to the Plan, the Company granted
562,217
restricted stock units (“RSUs”) and
562,217
stock options (“Options”) under the Incentive Plan and the terms of the relevant restricted stock unit agreements (the
“Restricted Stock Unit Agreements”) and stock option agreements (the “Option Agreements”), as applicable, to certain employees,
including its executive officers (collectively, “Management”), representing an aggregate of
1,124,434
shares of new Class A common
stock (collectively, the “Management Emergence Awards”).
Fifty percent (
50%
) of the RSUs granted to Management vest ratably on each of December 31, 2018, 2019 and 2020, subject to certain performance-based criteria. Of the remaining fifty percent (
50%
) of the RSUs and one hundred percent (
100%
) of the Options granted to Management,
30%
will vest on or about each of the first
two
anniversaries of the issuance date, and
20%
will vest on or about each of the third and fourth anniversaries of the issuance date. The vesting of each of the Management Emergence Awards is also subject to, among other things, each such employee’s continued employment with the Company.
If an employee’s employment is terminated by the Company or its subsidiaries without Cause, by the employee for Good Reason (each, as defined in the award agreement) or by reason of death or Disability (as defined in the award agreement), such employee will become vested in an additional tranche of the unvested Management Emergence Awards as if the employee’s employment continued for
one
(1) additional year following the qualifying termination date; provided, that with respect to the Chief Executive Officer and Chief Financial Officer, (i) an amount equal to
50%
of the unvested components of the Management Emergence Awards will accelerate and vest (
75%
if such termination occurs on or before the first (1st) anniversary of the Effective Date) and (ii) vested Options will remain outstanding until the expiration date of such Option. If an employee’s employment is terminated by the Company or its subsidiaries without Cause or by the employee for Good Reason, in either instance at any time within the
three
month period immediately preceding, or the
twelve
month period immediately following, a Change in Control (as defined in the award agreement), such employee will become vested in all unvested Management Emergence Awards.
F-38
In addition, on or about the Effective Date and pursuant to the Plan, the Company granted each non-employee director certain RSUs and Options under the Incentive Plan and the terms of the relevant Restricted Stock Unit Agreements and Option Agreements, as applicable, representing an aggregate of
56,721
shares of new Class A common stock (the “Director Emergence Awards”). The RSUs and Options granted to each non-employee director vest in
four
equal installments on the last day of each calendar quarter, commencing on June 30, 2018. The vesting of each of the Director Emergence Awards is also subject to, among other things, each such non-employee director’s continued role as a director with the Company. Upon a Change in Control, all unvested Director Emergence Awards will fully vest.
For stock options with service conditions only, we utilize the Black-Scholes option pricing model to estimate the fair value of options issued. The fair value of stock options is determined by the Company’s stock price, historical stock price volatility, the expected term of the awards, risk-free interest rates and expected dividends. If other assumptions are used, the results could differ. For restricted stock awards with service conditions only, we utilize the intrinsic value method. For restricted stock awards with performance conditions, we evaluate the probability of vesting of the awards in each reporting period and adjust compensation cost based on this assessment.
The total grants awarded during the period from June 4, 2018 through December 31, 2018 are presented in the table below:
|
Successor Company
|
|||||||||||
|
Period from June 4, 2018 through December 31, 2018
|
|||||||||||
|
Grants
|
Weighted Average Exercise Price
|
Weighted Average Remaining Contractual Term (in years)
|
Weighted Average
Grant Date Fair Value
|
||||||||
|
Stock option grants
|
581,124
|
|
$
|
25.47
|
|
4.4
|
$
|
7.60
|
|
||
|
Restricted stock unit grants
|
600,031
|
|
Not Applicable
|
4.4
|
$
|
15.00
|
|
||||
|
Total grants in the successor period
|
1,181,155
|
|
|||||||||
There were
no
exercises, forfeitures or cancellations of Successor Company stock options during the period from June 4, 2018 through December 31, 2018. As of December 31, 2018,
14,180
of the Successor Company stock options were vested and
28,363
restricted stock units were exercised. As of December 31, 2018, the total fair value of vested options was
$121,241
and fair value of restricted stock exercised was
$425,445
.
The total share-based compensation expense included in “Corporate expenses” in the accompanying Consolidated Statements of Operations for the period from June 4, 2018 through December 31, 2018 was as follows (in thousands):
|
Successor Company
|
|||||
|
Period from June 4, 2018 through December 31, 2018
|
|||||
|
Stock option grants
|
$
|
853
|
|
||
|
Restricted stock unit grants
|
2,551
|
||||
|
Total expense
|
$
|
3,404
|
|
||
As of December 31, 2018, there was
$12.9 million
of unrecognized compensation cost related to unvested stock-based compensation arrangements.
Predecessor Share-Based Compensation
Upon adopting ASC 718 for awards with service conditions, the Predecessor Company made an election to recognize stock-based compensation expense on a straight-line basis over the requisite service period for the entire award. In addition, the Predecessor Company made an accounting policy election to recognize forfeitures of share-based awards as they occur in the period of forfeiture rather than estimating the number of awards expected to be forfeited at the grant date and subsequently adjusting the estimate when awards are actually forfeited. For stock options with service conditions only, the Company utilized the Black-Scholes option pricing model to estimate the fair value of options issued. The fair value of stock options was determined by the Company’s
F-39
stock price, historical stock price volatility, the expected term of the awards, risk-free interest rates and expected dividends. If other assumptions were used, the resulting fair value could have differed. For restricted stock awards the Company utilized the intrinsic value method.
The total grants awarded during the Period from January 1, 2018 through June 4, 2018 period, and the year ended December 31, 2017 are presented in the table below:
|
Predecessor Company
|
||||||||||
|
Period from January 1, 2018 through June 3, 2018
|
Year Ended December 31, 2017
|
Year Ended December 31, 2016
|
||||||||
|
Stock option grants *
|
—
|
|
76,250
|
|
389,938
|
|
||||
* Upon emergence from Chapter 11, these stock option grants were extinguished.
There were
no
exercises, forfeitures or cancellations of Predecessor Company stock options during the period from January 1, 2018 through June 3, 2018.
On May 18, 2017 the Predecessor Company adopted the 2017 Supplemental Incentive Plan (the "2017 SIP"), which provided participating executives of the Company with the opportunity to earn cash payments in ratable installments over the last
three
quarters of 2017, based on the Company's year-to-date performance at the end of each respective period, commencing with the second quarter of 2017. In order to be eligible to participate in the 2017 SIP, each participant therein had to agree to the cancellation of all of such participant's respective outstanding equity incentive awards. During the year ended December 31, 2017, the participants forfeited an aggregate of
963,493
options. There were
no
exercises of Predecessor Company stock options for the year ended December 31, 2017.
The total share-based compensation expense included in “Corporate expenses” in the accompanying Consolidated Statements of Operations for the period from January 1, 2018 through June 3, 2018 and the years ended December 31, 2017 and 2016 was as follows (in thousands):
|
Predecessor Company
|
|||||||||||||||||
|
Period from January 1, 2018 through June 3, 2018
|
Year Ended December 31, 2017
|
Year Ended December 31, 2016
|
|||||||||||||||
|
Stock option grants
|
$
|
231
|
|
$
|
1,614
|
|
$
|
2,948
|
|
||||||||
As described in Note 11 “Stockholders' Equity”, all of Old Cumulus’s equity award agreements under prior incentive plans, and the awards granted pursuant thereto, were extinguished, canceled and discharged and have no further force or effect.
13. Income Taxes
Under the Plan of reorganization, a substantial portion of the Predecessor Company’s prepetition debt securities and other obligations were extinguished and the Company recognized cancellation of debt income (“CODI”). The Internal Revenue Code of 1986, as amended (“IRC”), provides that a debtor in a bankruptcy case may exclude CODI from taxable income but must reduce certain of its tax attributes by the amount of any CODI realized by the debtor company as a result of the consummation of a plan of reorganization. Substantially all of the Company’s unutilized tax attributes have been eliminated as a result of the statutory reduction that occurs on the first day of the Company’s tax year subsequent to the date of emergence.
In conjunction with the Plan, the Company implemented a series of internal reorganization transactions through which it transferred the assets of Old Cumulus to an indirect wholly-owned subsidiary of the Successor Company. The transfer of assets for income tax purposes results in a taxable sale of assets, whereby the Company receives a step up in the tax basis of the underlying assets transferred, resulting in a future tax benefit. The application of fresh start accounting on the Effective Date of June 4, 2018
F-40
resulted in the re-measurement of deferred income taxes associated with the revaluation of the Company’s assets and liabilities. As a result, net deferred income tax liabilities decreased
$10.6 million
.
Income tax benefit for the Successor Company period June 4, 2018 through December 31, 2018, the Predecessor Company period January 1, 2018 through June 3, 2018, the Predecessor Company year ended December 31, 2017 and the Predecessor Company year ended December 31, 2016 consisted of the following (dollars in thousands):
|
Successor Company
|
Predecessor Company
|
|||||||||||||||||
|
Period from June 4, 2018 through December 31, 2018
|
Period from January 1, 2018 through June 3, 2018
|
Year Ended December 31, 2017
|
Year Ended December 31, 2016
|
|||||||||||||||
|
Current income tax expense (benefit)
|
||||||||||||||||||
|
Federal
|
$
|
6,170
|
|
$
|
(1,430
|
)
|
$
|
—
|
|
$
|
—
|
|
||||||
|
State and local
|
8,888
|
|
4,026
|
|
4,504
|
|
1,678
|
|
||||||||||
|
Total current income tax
|
$
|
15,058
|
|
$
|
2,596
|
|
$
|
4,504
|
|
$
|
1,678
|
|
||||||
|
Deferred tax benefit
|
||||||||||||||||||
|
Federal
|
$
|
(20,641
|
)
|
$
|
(138,311
|
)
|
$
|
(157,277
|
)
|
$
|
(19,496
|
)
|
||||||
|
State and local
|
(6,770
|
)
|
(41,144
|
)
|
(10,953
|
)
|
(8,336
|
)
|
||||||||||
|
Total deferred tax
|
(27,411
|
)
|
(179,455
|
)
|
(168,230
|
)
|
(27,832
|
)
|
||||||||||
|
Total income tax benefit
|
$
|
(12,353
|
)
|
$
|
(176,859
|
)
|
$
|
(163,726
|
)
|
$
|
(26,154
|
)
|
||||||
Total income tax benefit differed from the amount computed by applying the federal statutory tax rate of
21.0%
for the Successor Company period June 4, 2018 through December 31, 2018 and the Predecessor Company period January 1, 2018 through June 3, 2018 and
35.0%
for the Predecessor Company years ended December 31, 2017 and 2016 as a result of the following (dollars in thousands):
F-41
|
Successor Company
|
Predecessor Company
|
|||||||||||||||||
|
Period from June 4, 2018 through December 31, 2018
|
Period from January 1, 2018 through June 3, 2018
|
Year Ended December 31, 2017
|
Year Ended December 31, 2016
|
|||||||||||||||
|
Pretax income (loss) at federal statutory rate
|
$
|
10,284
|
|
$
|
109,052
|
|
$
|
(129,602
|
)
|
$
|
(187,906
|
)
|
||||||
|
State income tax, net of federal tax
|
7,493
|
|
(25,288
|
)
|
(11,729
|
)
|
(1,812
|
)
|
||||||||||
|
Meals and entertainment
|
154
|
|
107
|
|
350
|
|
429
|
|
||||||||||
|
Bankruptcy costs
|
(19,088
|
)
|
12,286
|
|
5,478
|
|
—
|
|
||||||||||
|
Change in state tax rates
|
(819
|
)
|
78
|
|
255
|
|
(1,618
|
)
|
||||||||||
|
Section 162 disallowance
|
472
|
|
187
|
|
1,867
|
|
538
|
|
||||||||||
|
Change in federal tax rate
|
—
|
|
—
|
|
(91,384
|
)
|
—
|
|
||||||||||
|
Charges to goodwill with no tax basis
|
—
|
|
—
|
|
—
|
|
163,630
|
|
||||||||||
|
(Decrease) increase in valuation allowance
|
(104,629
|
)
|
29,188
|
|
58,254
|
|
32
|
|
||||||||||
|
Worthless stock loss
|
(115,439
|
)
|
—
|
|
—
|
|
||||||||||||
|
Tax effect of sale of assets
|
72,797
|
|
(73,205
|
)
|
—
|
|
—
|
|
||||||||||
|
Cancellation of debt income
|
22,087
|
|
(152,099
|
)
|
—
|
|
—
|
|
||||||||||
|
Other reorganization charges
|
35,331
|
|
—
|
|
—
|
|
||||||||||||
|
Change in uncertain tax positions
|
(2,733
|
)
|
—
|
|
—
|
|
—
|
|
||||||||||
|
Provision to return
|
1,244
|
|
—
|
|
(72
|
)
|
336
|
|
||||||||||
|
Other adjustments
|
385
|
|
2,943
|
|
2,857
|
|
217
|
|
||||||||||
|
Net income tax benefit
|
$
|
(12,353
|
)
|
$
|
(176,859
|
)
|
$
|
(163,726
|
)
|
$
|
(26,154
|
)
|
||||||
The Tax Cuts and Jobs Act (“the Act”) was enacted on December 22, 2017. The Act, among other changes, reduced the US federal corporate tax rate from
35%
to
21%
effective January 1, 2018. At December 31, 2017, the Company had not completed its accounting for the tax effects of enactment of the Act; however, it recorded provisional estimates related to the remeasurement of deferred tax assets and liabilities based on the federal rate reduction. In accordance with Staff Accounting Bulletin No.118,
Income Tax Accounting Implications of the Tax Cuts and Jobs Act
(“SAB 118”), changes to these provisional amounts were required to be finalized within
12
months of the date of enactment and recorded in the period in which the analysis was completed. As of December 31, 2018, the Company finalized its accounting for the Act and recorded an adjustment to deferred tax benefit of approximately
$0.9 million
during 2018 related to the remeasurement of deferred tax assets and liabilities.
F-42
The tax effects of temporary differences that give rise to significant portions of the deferred tax assets and liabilities at December 31, 2018 and 2017 are presented below (dollars in thousands):
|
Successor Company
|
Predecessor Company
|
||||||||
|
2018
|
2017
|
||||||||
|
Noncurrent deferred tax assets:
|
|||||||||
|
Accounts receivable
|
$
|
962
|
|
$
|
948
|
|
|||
|
Advertising relationships
|
—
|
|
954
|
|
|||||
|
Other liabilities
|
7,076
|
|
20,486
|
|
|||||
|
Debt costs
|
—
|
|
6,987
|
|
|||||
|
Interest limitation
|
1,335
|
|
—
|
|
|||||
|
Tax credits
|
41
|
|
2,249
|
|
|||||
|
Net operating loss
|
8,304
|
|
75,832
|
|
|||||
|
Noncurrent deferred tax assets
|
17,718
|
|
107,456
|
|
|||||
|
Less: valuation allowance
|
—
|
|
(75,460
|
)
|
|||||
|
Net noncurrent deferred tax assets
|
$
|
17,718
|
|
$
|
31,996
|
|
|||
|
Noncurrent deferred tax liabilities:
|
|||||||||
|
Intangible assets
|
$
|
6,610
|
|
$
|
242,822
|
|
|||
|
Property and equipment
|
23,492
|
|
8,417
|
|
|||||
|
Other
|
—
|
|
7
|
|
|||||
|
Noncurrent deferred tax liabilities
|
30,102
|
|
251,246
|
|
|||||
|
Net noncurrent deferred tax liabilities
|
12,384
|
|
219,250
|
|
|||||
|
Net deferred tax liabilities
|
$
|
12,384
|
|
$
|
219,250
|
|
|||
Deferred tax assets and liabilities are computed by applying the federal and state income tax rates in effect to the gross amounts of temporary differences between the tax and financial reporting bases of our assets and liabilities and other tax attributes, such as net operating loss carryforwards. In assessing if the deferred tax assets will be realized, the Company considers whether it is more likely than not that some or all of these deferred tax assets will be realized. The ultimate realization of deferred tax assets is dependent upon the generation of future taxable income during the period in which these deductible temporary differences reverse.
At December 31, 2018, the Successor Company had recorded no valuation allowance, because of the net deferred tax liability position of the successor entity and expected future taxable income. At December 31, 2017 the Predecessor Company recorded a valuation allowance of
$75.5 million
. The Predecessor Company valuation allowance related to the impact of the Company's Bankruptcy Petition and corresponding changes in judgment regarding the Company's ability to recover its federal and state net operating loss carryforwards and certain other tax attributes. As a result, the Predecessor Company maintained a full valuation on federal loss carryforwards and state net operating loss carryforwards.
At December 31, 2018, Company had federal net operating loss carryforwards, which are available to offset future taxable income, of approximately
$37.8 million
and have an indefinite carryforward period. At December 31, 2018, the Company had state net operating loss carryforwards available to offset future income of approximately
$41.1 million
which, if not utilized, will expire between 2023 and 2039. All tax attribute carryovers attributable to the Predecessor periods were utilized during 2018 to offset the taxable sale of assets or reduced at the end of 2018 because of attribute reduction resulting from cancellation of debt income.
The Company records interest and penalties related to unrecognized tax benefits in income tax expense. For interest and penalties, the Company recorded income tax benefit of
$0.3 million
for the Successor Company period from June 4, 2018 through December 31, 2018, income tax expense of
$0.1 million
for the Predecessor Company period from January 1, 2018 through June 3, 2018, and income tax benefit of
$1.8 million
for the Predecessor Company year ended December 31, 2017. The total interest and penalties accrued was
$0.1 million
,
$0.4 million
, and
$0.3 million
as of the Successor Company period ended December 31, 2018 and Predecessor Company periods ended June 3, 2018 and for the year ended December 31, 2017, respectively.
The total unrecognized tax benefits and accrued interest and penalties at December 31, 2018 was
$5.8 million
. The
$5.8 million
represents the unrecognized tax benefits and accrued interest and penalties that, if recognized, would favorably affect the effective income tax rate in future periods. Of the
$5.8 million
total unrecognized tax benefits and accrued interest and penalties,
$0.3 million
relates to items which are expected to change significantly within the next
12
months. Substantially all federal, state, and local income tax returns have been closed for the tax years through 2014.
F-43
The following table reconciles unrecognized tax benefits during the relevant years (in thousands):
|
Successor Company
|
Predecessor Company
|
||||||||||||
|
Period from June 4, 2018 through December 31, 2018
|
Period from January 1, 2018 through June 3, 2018
|
Year Ended December 31, 2017
|
|||||||||||
|
Balance at beginning of period
|
$
|
8,466
|
|
$
|
8,587
|
|
$
|
11,890
|
|
||||
|
Increase for prior year positions
|
—
|
|
176
|
|
447
|
|
|||||||
|
Decrease for prior year positions
|
(834
|
)
|
(297
|
)
|
(3,316
|
)
|
|||||||
|
Settlements
|
(73
|
)
|
—
|
|
—
|
|
|||||||
|
Lapse of statute of limitations
|
(1,772
|
)
|
—
|
|
(434
|
)
|
|||||||
|
Balance at end of period
|
$
|
5,787
|
|
$
|
8,466
|
|
$
|
8,587
|
|
||||
14. Earnings (Loss) Per Share
As discussed in Note 2, "Emergence from Chapter 11", on the Effective Date, the old common stock awards and warrants then outstanding under the Company’s prior equity compensation plans were extinguished without recovery.
The Company calculates basic earnings (loss) per share by dividing net income (loss) by the weighted average number of
common shares outstanding, excluding restricted shares. The Company calculates diluted earnings (loss) per share by dividing net income (loss) by the weighted average number of common shares outstanding plus the dilutive effect of outstanding share-based awards, including stock options and restricted stock awards. Warrants generally are included in basic and diluted shares outstanding if there is little or no consideration paid upon exercise of the Warrants. Antidilutive instruments are not considered in this calculation. The Company applies the two-class method to calculate earnings per share. Because both classes share the same rights in dividends and earnings, earnings per share (basic and diluted) are the same for both classes.
The following table presents the reconciliation of basic to diluted weighted average common shares (in thousands):
F-44
|
Successor Company
|
Predecessor Company
|
||||||||||||||||||||||||||
|
Period from June 4, 2018 through December 31, 2018
|
Period from January 1, 2018 through June 3, 2018
|
Year ended December 31, 2017
|
Year ended December 31, 2016
|
||||||||||||||||||||||||
|
Basic Earnings (Loss) Per Share
|
|||||||||||||||||||||||||||
|
Numerator:
|
|||||||||||||||||||||||||||
|
Undistributed net income (loss) from operations
|
$
|
61,425
|
|
$
|
696,156
|
|
$
|
(206,565
|
)
|
$
|
(510,720
|
)
|
|||||||||||||||
|
Basic net income (loss) attributable to common shares
|
$
|
61,425
|
|
$
|
696,156
|
|
$
|
(206,565
|
)
|
$
|
(510,720
|
)
|
|||||||||||||||
|
Denominator:
|
|||||||||||||||||||||||||||
|
Basic weighted average shares outstanding
|
20,028
|
29,338
|
29,306
|
|
29,270
|
|
|||||||||||||||||||||
|
Basic undistributed net income (loss) per share attributable to common shares
|
$
|
3.07
|
|
$
|
23.73
|
|
$
|
(7.05
|
)
|
$
|
(17.45
|
)
|
|||||||||||||||
|
Diluted Earnings (Loss) Per Share
|
|||||||||||||||||||||||||||
|
Numerator:
|
|||||||||||||||||||||||||||
|
Undistributed net income (loss) from operations
|
$
|
61,425
|
|
$
|
696,156
|
|
$
|
(206,565
|
)
|
$
|
(510,720
|
)
|
|||||||||||||||
|
Diluted net income (loss) attributable to common shares
|
$
|
61,425
|
|
$
|
696,156
|
|
$
|
(206,565
|
)
|
$
|
(510,720
|
)
|
|||||||||||||||
|
Denominator:
|
|||||||||||||||||||||||||||
|
Basic weighted average shares outstanding
|
20,028
|
29,338
|
29,306
|
29,270
|
|||||||||||||||||||||||
|
Effect of dilutive options and restricted stock units
|
136
|
—
|
—
|
—
|
|||||||||||||||||||||||
|
Diluted weighted average shares outstanding
|
20,164
|
29,338
|
29,306
|
29,270
|
|||||||||||||||||||||||
|
Diluted undistributed net income (loss) per share attributable to common shares
|
$
|
3.05
|
$
|
23.73
|
$
|
(7.05
|
)
|
$
|
(17.45
|
)
|
|||||||||||||||||
15. Leases
The Company has non-cancelable operating leases, primarily for land, tower space, office-space, certain office equipment and vehicles. The operating leases generally contain renewal options for periods ranging from
one
to
ten
years and require the Company to pay all executory costs such as maintenance and insurance. Rental expense for operating leases was approximately
$14.8 million
,
$21.6 million
,
$23.6 million
, and
$25.2 million
for the Predecessor Company period January 1, 2018 through June 3, 2018, Successor Company period June 4, 2018 through December 31, 2018, the Predecessor Company year ended December 31, 2017 and the Predecessor Company year ended 2016, respectively.
F-45
Future minimum payments under non-cancelable operating leases (with initial or remaining lease terms in excess of one year), future minimum sublease income to be received and a lease commitment under a failed sale leaseback agreement as of December 31, 2018 are as follows (in thousands):
|
Year Ending December 31:
|
Future Minimum Rent Under Operating Leases
|
Future Minimum Sublease Income
|
Future Minimum Commitments Under Failed Sale Leaseback Agreement
|
Net Commitments
|
||||||||||||
|
2019
|
$
|
34,356
|
|
$
|
(1,719
|
)
|
$
|
1,193
|
|
$
|
33,830
|
|
||||
|
2020
|
29,242
|
|
(1,719
|
)
|
1,557
|
|
29,080
|
|
||||||||
|
2021
|
22,717
|
|
1,603
|
|
24,320
|
|
||||||||||
|
2022
|
19,885
|
|
1,650
|
|
21,535
|
|
||||||||||
|
2023
|
16,280
|
|
1,701
|
|
17,981
|
|
||||||||||
|
Thereafter
|
45,959
|
|
2,052
|
|
48,011
|
|
||||||||||
|
$
|
168,439
|
|
$
|
(3,438
|
)
|
$
|
9,756
|
|
$
|
174,757
|
|
|||||
16. Commitments and Contingencies
Future Commitments
The radio broadcast industry’s principal ratings service is Nielsen Audio (“Nielsen”), which publishes surveys for domestic radio markets. Certain of the Company’s subsidiaries have agreements with Nielsen under which they receive programming ratings information. The remaining aggregate obligation under the agreements with Nielsen is approximately
$151.2 million
, as of December 31, 2018, and is expected to be paid in accordance with the agreements through December 2021.
The Company engages Katz Media Group, Inc. (“Katz”) as its national advertising sales agent. The national advertising agency contract with Katz contains termination provisions that, if exercised by the Company during the term of the contract, would obligate the Company to pay a termination fee to Katz, based upon a formula set forth in the contract.
The Company is committed under various contractual agreements to pay for broadcast rights that include sports and news services and to pay for talent, executives, research, weather information and other services.
The Company from time to time enters into radio network contractual obligations to guarantee a minimum amount of revenue share to contractual counterparties on certain programming in future years. As of December 31, 2018, the Company believes that it will meet all such material minimum obligations.
On February 1, 2018 and March 9, 2018, respectively, the Company and Merlin Media, LLC (“Merlin”) amended their LMA under which the Company programmed two FM radio stations owned by Merlin. The Company ceased programming one of the stations (“WLUP”) on March 9, 2018, but continued to program the other FM station (“WKQX”) under the amended LMA. On April 3, 2018, the Company entered into an asset purchase agreement with Merlin, pursuant to which it agreed to purchase WKQX and certain intellectual property for
$18.0 million
in cash. On April 10, 2018, the Court approved the purchase and the Company made a payment in escrow of
$4.75 million
. On June 15, 2018, the Company closed on the purchase of WKQX. The table below summarizes the purchase price allocation among the tangible and intangible assets acquired in the WKQX purchase (dollars in thousands):
|
Allocation
|
Amount
|
||||
|
Broadcast licenses
|
$
|
17,476
|
|
||
|
Property and equipment
|
524
|
||||
|
Total purchase price
|
$
|
18,000
|
|
||
Legal Proceedings
In August 2015, the Company was named as a defendant in two separate putative class action lawsuits relating to its use and
public performance of certain sound recordings fixed prior to February 15, 1972 (the "Pre-1972 Recordings"). The first suit, ABS
Entertainment, Inc., et. al. v, Cumulus Media Inc., was filed in the United States District Court for the Central District of California and alleged, among other things, copyright infringement under California state law, common law conversion, misappropriation and
F-46
unfair business practices. On December 11, 2015, this suit was dismissed without prejudice. The second suit, ABS Entertainment, Inc., v. Cumulus Media Inc., was filed in the United States District Court for the Southern District of New York and claimed, among other
things, common law copyright infringement and unfair competition. The New York lawsuit was stayed pending an appeal before the
Second Circuit involving unrelated third parties over whether the owner of a Pre-1972 Recording holds an exclusive right to publicly
perform that recording under New York common law. On December 20, 2016, the New York Court of Appeals held that New York
common law does not recognize a right of public performance for owners of pre-1972 Recordings. As a result of that case (to which
Cumulus Media Inc. was not a party) the New York case against Cumulus Media Inc., was voluntarily dismissed by the plaintiffs on
April 3, 2017. On October 11, 2018, President Trump signed the Orrin G. Hatch-Bob Goodlatte Music Modernization Act into law,
which, among other things, provides new federal rights going forward for owners of pre-1972 Recordings. The question of whether
public performance rights existed for Pre-1972 recordings under state law prior to the enactment of the new Music Modernization Act
is still being litigated in the Ninth Circuit as a result of a case filed in California. Cumulus is not a party to that case, and the Company
is not yet able to determine what effect that proceeding will have, if any, on its financial position, results of operations or cash flows.
The Company currently is, and expects that from time to time in the future it will be, party to, or a defendant in, various other
claims or lawsuits that are generally incidental to its business. The Company expects that it will vigorously contest any such claims or
lawsuits and believes that the ultimate resolution of any such known claim or lawsuit will not have a material adverse effect on the
Company’s consolidated financial position, results of operations or cash flows.
F-47
17. Quarterly Results (Unaudited)
The following table presents the Company’s selected unaudited quarterly results for each of the periods and quarters during
2018
and
2017
(dollars in thousands, except per share data):
|
Predecessor Company
|
Successor Company
|
||||||||||||||||||
|
Three Months Ended March 31, 2018
|
Period April 1, 2018 through June 3, 2018
|
Period June 4, 2018 through June 30, 2018
|
Three Months Ended September 30, 2018
|
Three Months Ended December 31, 2018
|
|||||||||||||||
|
FOR THE YEAR ENDED DECEMBER 31, 2018
|
|||||||||||||||||||
|
Net revenue
|
$
|
263,679
|
|
$
|
190,245
|
|
$
|
95,004
|
|
$
|
282,254
|
|
$
|
309,178
|
|
||||
|
Operating income (loss)
|
$
|
25,144
|
|
$
|
28,435
|
|
$
|
13,738
|
|
$
|
43,355
|
|
$
|
45,562
|
|
||||
|
(Loss) income before income taxes
|
$
|
(5,119
|
)
|
$
|
524,416
|
|
$
|
7,586
|
|
$
|
17,791
|
|
$
|
23,695
|
|
||||
|
Net (loss) income
|
$
|
(5,001
|
)
|
$
|
701,157
|
|
$
|
4,980
|
|
$
|
12,713
|
|
$
|
43,732
|
|
||||
|
Basic:
|
|||||||||||||||||||
|
(Loss) income per share
|
$
|
(0.17
|
)
|
$
|
23.90
|
|
$
|
0.25
|
|
$
|
0.64
|
|
$
|
2.19
|
|
||||
|
Diluted:
|
|||||||||||||||||||
|
(Loss) income per share
|
$
|
(0.17
|
)
|
$
|
23.90
|
|
$
|
0.25
|
|
$
|
0.63
|
|
$
|
2.18
|
|
||||
|
Predecessor Company
|
|||||||||||||||||||
|
Three Months Ended March 31, 2017
|
Three Months Ended June 30, 2017
|
Three Months Ended September 30, 2017
|
Three Months Ended December 31, 2017
|
||||||||||||||||
|
FOR THE YEAR ENDED DECEMBER 31, 2017
|
|||||||||||||||||||
|
Net revenue
|
$
|
264,030
|
|
$
|
290,531
|
|
$
|
287,240
|
|
$
|
293,861
|
|
|||||||
|
Operating income (loss)
|
$
|
20,522
|
|
$
|
47,326
|
|
$
|
42,931
|
|
$
|
(321,225
|
)
|
|||||||
|
(Loss) income before income taxes
|
$
|
(13,421
|
)
|
$
|
12,906
|
|
$
|
6,531
|
|
$
|
(376,307
|
)
|
|||||||
|
Net (loss) income
|
$
|
(7,395
|
)
|
$
|
5,672
|
|
$
|
1,274
|
|
$
|
(206,116
|
)
|
|||||||
|
Basic:
|
|||||||||||||||||||
|
(Loss) income per share
|
$
|
(0.25
|
)
|
$
|
0.19
|
|
$
|
0.04
|
|
$
|
(7.03
|
)
|
|||||||
|
Diluted:
|
|||||||||||||||||||
|
(Loss) income per share
|
$
|
(0.25
|
)
|
$
|
0.19
|
|
$
|
0.04
|
|
$
|
(7.03
|
)
|
|||||||
F-48
18. Segment Data
The Company operates in
two
reportable segments for which there is discrete financial information available and whose
operating results are reviewed by the chief operating decision maker, the Cumulus Radio Station Group and Westwood One. Cumulus Radio Station Group revenue is derived primarily from the sale of broadcasting time on our owned or operated stations to local, regional, and national advertisers. Westwood One revenue is generated primarily through network advertising on our owned or operated stations and on its approximately
8,000
affiliate stations. The Company also reports information for Corporate and Other. Corporate includes overall executive, administrative and support functions for both of the Company’s reportable segments, including accounting, finance, legal, human resources, information technology and programming functions.
In 2018, we changed the allocation of certain segment employee costs to align with the management reporting structure. For comparability, we have reclassified prior year segment financial results to reflect these changes. These reclassifications only affect our segment reporting and do not impact our consolidated financial results.
The Company presents segment adjusted EBITDA (“Adjusted EBITDA”) as this is the financial metric by which management and the chief operating decision maker allocate resources of the Company and analyze the performance of the Company’s reportable segments. Management also uses this measure to determine the contribution of the Company's core operations to the funding of its corporate resources utilized to manage operations and non-operating expenses including debt service and acquisitions. In addition, Adjusted EBITDA is a key metric for purposes of calculating and determining compliance with certain covenants contained in the Company’s Credit Agreement.
In determining Adjusted EBITDA, the Company excludes from net income items not related to core operations and those that are non-cash including: interest, taxes, depreciation, amortization, stock-based compensation expense, gain or loss on the exchange, sale, or disposal of any assets or stations, early extinguishment of debt, local marketing agreement fees, expenses relating to acquisitions or divestitures, restructuring costs, reorganization items and non-cash impairments of assets, if any.
Management believes that Adjusted EBITDA, although not a measure that is calculated in accordance with GAAP, is commonly employed by the investment community as a measure for determining the market value of a media company and comparing the operational and financial performance among media companies. Management has also observed that Adjusted EBITDA is routinely utilized to evaluate and negotiate the potential purchase price for media companies. Given the relevance to our overall value, management believes that investors consider the metric to be extremely useful.
Adjusted EBITDA should not be considered in isolation or as a substitute for net income (loss), operating income, cash flows from operating activities or any other measure for determining the Company’s operating performance or liquidity that is calculated in accordance with GAAP. In addition, Adjusted EBITDA may be defined or calculated differently by other companies, and comparability may be limited.
The Company’s financial data by segment is presented in the tables below (in thousands):
|
Period from January 1, 2018 through June 3, 2018 (Predecessor Company)
|
||||||||||||||||||||||||
|
Cumulus Radio Station Group
|
Westwood One
|
Corporate and Other
|
Consolidated
|
|||||||||||||||||||||
|
Net revenue
|
$
|
303,317
|
|
$
|
149,715
|
|
$
|
892
|
|
$
|
453,924
|
|
||||||||||||
|
Period from June 4, 2018 through December 31, 2018 (Successor Company)
|
||||||||||||||||||||||||
|
Cumulus Radio Station Group
|
Westwood One
|
Corporate and Other
|
Consolidated
|
|||||||||||||||||||||
|
Net revenue
|
$
|
477,118
|
|
$
|
207,702
|
|
$
|
1,616
|
|
$
|
686,436
|
|
||||||||||||
F-49
|
Year Ended December 31, 2017 (Predecessor Company)
|
||||||||||||||||
|
Cumulus Radio Station Group
|
Westwood One
|
Corporate and Other
|
Consolidated
|
|||||||||||||
|
Net revenue
|
$
|
786,963
|
|
$
|
346,165
|
|
$
|
2,534
|
|
$
|
1,135,662
|
|
||||
|
Year Ended December 31, 2016 (Predecessor Company)
|
||||||||||||||||
|
Cumulus Radio Station Group
|
Westwood One
|
Corporate and Other
|
Consolidated
|
|||||||||||||
|
Net revenue
|
$
|
802,396
|
|
$
|
336,610
|
|
$
|
2,394
|
|
$
|
1,141,400
|
|
||||
|
Successor Company
|
Predecessor Company
|
||||||||||||||||||||||
|
Period from June 4, 2018 through December 31,
|
Period from January 1, 2018 through June 3,
|
December 31,
|
December 31,
|
||||||||||||||||||||
|
2018
|
2018
|
2017
|
2016
|
||||||||||||||||||||
|
Adjusted EBITDA by segment
|
|||||||||||||||||||||||
|
Cumulus Radio Station Group
|
$
|
131,509
|
|
$
|
76,009
|
|
$
|
197,775
|
|
$
|
211,344
|
|
|||||||||||
|
Westwood One
|
39,743
|
19,210
|
54,260
|
25,363
|
|
||||||||||||||||||
|
Segment Adjusted EBITDA
|
171,252
|
95,219
|
252,035
|
236,707
|
|||||||||||||||||||
|
Adjustments to reconcile to GAAP measure
|
|||||||||||||||||||||||
|
Corporate and other expense
|
(17,417
|
)
|
(14,707
|
)
|
(34,284
|
)
|
(30,840
|
)
|
|||||||||||||||
|
Income tax benefit
|
12,353
|
176,859
|
163,726
|
26,154
|
|
||||||||||||||||||
|
Non-operating expense, including net interest expense
|
(53,777
|
)
|
(483
|
)
|
(127,179
|
)
|
(136,102
|
)
|
|||||||||||||||
|
Local marketing agreement fees
|
(2,471
|
)
|
(1,809
|
)
|
(10,884
|
)
|
(12,824
|
)
|
|||||||||||||||
|
Depreciation and amortization
|
(34,060
|
)
|
(22,046
|
)
|
(62,239
|
)
|
(87,267
|
)
|
|||||||||||||||
|
Stock-based compensation expense
|
(3,404
|
)
|
(231
|
)
|
(1,614
|
)
|
(2,948
|
)
|
|||||||||||||||
|
(Loss) gain on sale or disposal of assets or stations
|
(103
|
)
|
(158
|
)
|
2,499
|
95,695
|
|
||||||||||||||||
|
Reorganization items, net
|
—
|
466,201
|
(31,603
|
)
|
—
|
|
|||||||||||||||||
|
Impairment of intangible assets
|
—
|
—
|
(335,909
|
)
|
(604,965
|
)
|
|||||||||||||||||
|
Loss on early extinguishment of debt
|
201
|
—
|
(1,063
|
)
|
8,017
|
|
|||||||||||||||||
|
Acquisition-related and restructuring costs
|
(11,194
|
)
|
(2,455
|
)
|
(19,492
|
)
|
(1,817
|
)
|
|||||||||||||||
|
Franchise and state taxes
|
45
|
(234
|
)
|
(558
|
)
|
(530
|
)
|
||||||||||||||||
|
Consolidated GAAP net income (loss)
|
$
|
61,425
|
|
$
|
696,156
|
|
$
|
(206,565
|
)
|
$
|
(510,720
|
)
|
|||||||||||
F-50
19. Subsequent Events
On February 13, 2019, the Company announced that it had entered into an agreement to sell
six
radio stations to Educational Media Foundation (“EMF”) for
$103.5 million
in cash. On the same day the Company also announced that it had entered into a swap agreement with Entercom Communications Corp. (“Entercom”) under which the Company will obtain
three
stations in Indianapolis in exchange for three Cumulus stations in
two
markets.
Under the terms of the agreement with EMF
,
EMF will acquire WYAY-FM (Atlanta, GA), WPLJ-FM (New York, NY), KFFG-FM (San Francisco, CA), WZAT-FM (Savannah, GA), WXTL-FM (Syracuse, NY), and WRQX-FM (Washington, DC) from the Company for a gross purchase price of
$103.5 million
.
Under the terms of the swap agreement with Entercom, the Company will receive WNTR-FM, WXNT- AM, and WZPL-FM in Indianapolis and Entercom will receive WNSH-FM (New York, NY) and WMAS-FM and WHLL-AM (both in Springfield, MA). In connection with the swap agreement, each party will commence a local marketing agreement to program the other party’s stations beginning on March 1, 2019.
The transactions are subject to customary closing conditions, including regulatory approval. The Company expects to complete both transactions during the second quarter of 2019.
F-51
SCHEDULE II
CUMULUS MEDIA INC.
FINANCIAL STATEMENT SCHEDULE
VALUATION AND QUALIFYING ACCOUNTS
|
Fiscal Year
|
Balance at
Beginning
of Period
|
Charged to Costs and Expenses
|
Additions/(Deductions)
|
Balance
at End
of Period
|
||||||||||||
|
Allowance for doubtful accounts
|
||||||||||||||||
|
2018 Successor Company (Period from June 4, 2018 through December 31, 2018)
|
$
|
—
|
|
$
|
5,313
|
|
$
|
—
|
|
$
|
5,313
|
|
||||
|
2018 Predecessor Company (Period from Jan 1, 2018 through June 3, 2018)
|
$
|
4,322
|
|
$
|
5,993
|
|
$
|
(10,315
|
)
|
$
|
—
|
|
||||
|
2017 Predecessor Company
|
$
|
4,691
|
|
$
|
5,808
|
|
$
|
(6,177
|
)
|
$
|
4,322
|
|
||||
|
2016 Predecessor Company
|
$
|
4,923
|
|
$
|
1,103
|
|
$
|
(1,335
|
)
|
$
|
4,691
|
|
||||
|
Valuation allowance on deferred taxes
|
||||||||||||||||
|
2018 Successor Company (Period from June 4, 2018 through December 31, 2018)
|
$
|
104,629
|
|
$
|
—
|
|
$
|
(104,629
|
)
|
$
|
—
|
|
||||
|
2018 Predecessor Company(Period from Jan 1, 2018 through June 3, 2018)
|
$
|
75,460
|
|
$
|
29,169
|
|
$
|
—
|
|
$
|
104,629
|
|
||||
|
2017 Predecessor Company
|
$
|
17,205
|
|
$
|
58,255
|
|
$
|
—
|
|
$
|
75,460
|
|
||||
|
2016 Predecessor Company
|
$
|
17,173
|
|
$
|
32
|
|
$
|
—
|
|
$
|
17,205
|
|
||||
S-1
TABLE OF CONTENTS
Part IItem 1. BusinessItem 1A. Risk FactorsItem 1B. Unresolved Staff CommentsItem 2. PropertiesItem 3. Legal ProceedingsItem 4. Mine Safety DisclosuresPart IIItem 5. Market For Registrant's Common Equity, Related Stockholder Matters and Issuer Purchases Of Equity SecuritiesItem 6. Selected Financial DataItem 7. Management's Discussion and Analysis Of Financial Condition and Results Of OperationsItem 7A. Quantitative and Qualitative Disclosures About Market RiskItem 8. Financial Statements and Supplementary DataItem 9. Changes in and Disagreements with Accountants on Accounting and Financial DisclosureItem 9A. Controls and ProceduresItem 9B. Other InformationPart IIIItem 10. Directors and Executive Officers and Corporate GovernanceItem 11. Executive CompensationItem 12. Security Ownership Of Certain Beneficial Owners and Management and Related Stockholder MattersItem 13. Certain Relationships and Related Transactions, and Director IndependenceItem 14. Principal Accountant Fees and ServicesPart IVItem 15. Exhibits, Financial Statement SchedulesItem 16. Form 10-k Summary